Embed Size (px)
Citation preview

i
EVALUATION OF OVERCURRENT PROTECTION
PERFORMANCE AND APPLICATION ON THE ESKOM
SHUNT CAPACITORS DURING SYSTEM
DISTURBANCES
Revana Boodhraj
In partial fulfilment of the Masters Degree in Electrical Engineering, Faculty of Engineering,
University of KwaZulu-Natal As the candidates Co-Supervisor, I agree/ do not agree to the submission of this thesis.
Signed: Adam Bartylak .
Professor NM Ijumba .
.
Supervisors: Professor N.M Ijumba & Adam Bartylak
Date of submission: 24 November 2009
ii
DECLARATION
I, Revana Boodhraj, declare that
(i) The research reported in this thesis, except where otherwise indicated, is my
original work.
(ii) This thesis has not been submitted for any degree or examination at any other
university.
(iii) This thesis does not contain other persons’ data, pictures, graphs or other
information, unless specifically acknowledged as being sourced from other
persons.
(iv) This thesis does not contain other persons’ writing, unless specifically
acknowledged as being sourced from other researchers. Where other written
sources have been quoted, then:
a) their words have been re-written but the general information attributed
to them has been referenced;
b) where their exact words have been used, their writing has been placed
inside quotation marks, and referenced.
(v) Where I have reproduced a publication of which I am an author, co-author or
editor, I have indicated in detail which part of the publication was actually
written by myself alone and have fully referenced such publications.
(vi) This thesis does not contain text, graphics or tables copied and pasted from the
Internet, unless specifically acknowledged, and the source being detailed in the
thesis and in the References sections. [50]
Signed:………………………………

iii
ACKNOWLEDGEMENTS
This dissertation would not be possible without the blessings of the supreme Lord:
Om Ganeshaya Namah.
I would like to express my most sincere gratitude to my dissertation supervisors, Professor N
Ijumba and industrial supervisor, Adam Bartylak for their guidance and support.
Thank you to ESKOM management for the opportunity to study further and pursue a dream. A
special note of appreciation goes to ESKOM staff, most especially Anura Perera and Paul Keller
for their kind assistance with the DigSILENT and MatLAB simulations respectively.
Last, but not least, I wish to thank my parents, my husband Dinesh and my wonderful family
and friends. I have always appreciated your patience, love and support. Thank you!
For my mum and dad.

iv
ABSTRACT
This dissertation report began as an investigation into an overcurrent relay protection operation
on a shunt capacitor bank (SCB) at ESKOM’s Westgate substation.
Westgate substation has two SCBs, both of which were in service at the time of the 2007
incident. However, only the overcurrent protection scheme applied on SCB No.2 operated due
to an external feeder fault on the Eltro feeder at Westgate substation.
In 2004, SCB No.2 had tripped also on an overcurrent relay protection operation for an external
fault. The difference identified in the otherwise identical SCBs was the relay technology
employed by the overcurrent protection schemes i.e. electromechanical and electronic
overcurrent relays were utilised. Therefore an investigation was initiated to determine any
difference in the performance and reliability of overcurrent relay technologies in the SCB
environment.
The purpose of this work is to present the performance of the different technologies of
overcurrent relays (electromechanical, electronic and digital) as applied to an ESKOM SCB
during system disturbances and to compare their operation and behaviour.
MatLAB and DigSILENT simulation packages were used to conduct preliminary fault studies
to determine overcurrent relay performance, for a definite time overcurrent setting. These
simulation results indicated that the simple electromechanical and electronic overcurrent relay
could operate incorrectly in the SCB environment, during system disturbances.
Practical laboratory tests were also conducted. This comprised of injecting DigSILENT
simulations, comprising of system switching events and external faults, into three technologies
of overcurrent relays. These Omicron injection tests found that the Westgate electronic relay
would operate incorrectly for certain fault events in the SCB environment.
Due to the results observed, further frequency response tests were conducted. These results
suggested that the electronic and electromechanical overcurrent relays were susceptible to
harmonics i.e. harmonics impact both the pick-up current setting and operating time of
electronic and electromechanical overcurrent relays. The digital relay did not exhibit this
vulnerability.
Finally, recommendations were made to address the incorrect operation of the Westgate
electronic relay in its SCB application. These recommendations could be applied in other
ESKOM SCB overcurrent protection schemes, to prevent incorrect operation for system
disturbances.

v
INDEX
ACKNOWLEDGEMENTS ......................................................................................... iii ABSTRACT ................................................................................................................ iv INDEX ......................................................................................................................... v TABLE INDEX ......................................................................................................... viii DIAGRAM INDEX ..................................................................................................... ix GLOSSARY ................................................................................................................ xi 1. INTRODUCTION .................................................................................................... 1
1.1. Background .................................................................................................... 1 1.2. Problem statement .......................................................................................... 2 1.3. The objective of this work .............................................................................. 2 1.4. Approach and method .................................................................................... 3 1.5. Dissertation outline ........................................................................................ 4
2. LITERATURE REVIEW .......................................................................................... 6 2.1. Shunt capacitor bank construction .................................................................. 6 2.1.1. SCB configurations ..................................................................................... 7 2.1.2. Application of shunt capacitor banks ........................................................... 8 2.2. Protection relays ............................................................................................. 9 2.2.1. Overcurrent relay function ........................................................................... 9 2.2.1.1. Overcurrent relay characteristic curves ................................................... 10 2.3. SCB protection schemes ............................................................................... 11 2.3.1. Overcurrent protection ............................................................................... 11 2.3.2. Overvoltage protection .............................................................................. 12 2.3.3. Earth fault protection ................................................................................. 12 2.3.3.1 Earthed SCB ............................................................................................ 12 2.3.3.2 Unearthed SCB........................................................................................ 13 2.4. Electromechanical relays .............................................................................. 13 2.4.1. Attracted armature type relay ..................................................................... 14 2.4.2. Induction disc type relay ............................................................................ 15 2.5. Electronic relay ............................................................................................ 17 2.6. Digital relay ................................................................................................. 19 2.7. Current and frequency calculations ............................................................... 21 2.7.1. Single SCB switching ................................................................................ 22 2.7.2. Back-to-back SCB switching calculations ................................................. 23 2.7.3. Outrush current and frequency calculations ............................................... 25 2.8. Factors that influence SCB discharge current ............................................... 26 2.8.1. Source impedance ..................................................................................... 26 2.8.2. Point on wave of fault occurrence .............................................................. 27 2.8.3. Application of a CLR ................................................................................ 28 2.9. Summary of factors affecting SCB discharge current .................................... 28 2.10. Previous research on relay performance ...................................................... 29 2.11. Summary .................................................................................................... 30
3. MATLAB RMS SIMULATIONS ........................................................................... 32 3.1. Westgate substation layout ........................................................................... 32 3.2. Overcurrent protection scheme and settings .................................................. 33 3.2.1. Time delay current pick-up setting calculation ........................................... 33 3.2.2. Instantaneous current pick-up setting calculation ....................................... 34 3.3. MatLAB simulations .................................................................................... 34 3.4. MatLAB simulation findings ........................................................................ 36

vi
3.4.1. A three phase fault on the Eltro Feeder as seen by SCB No.2 .................... 36 3.4.2. A three phase fault on the Eltro Feeder as seen by SCB No.1 .................... 37 3.4.3. Faults on the 132kV Eltro Feeder .............................................................. 38 3.4.3.1 Single-phase earth fault ........................................................................... 38 3.4.3.2. Double line-to-ground fault .................................................................... 39 3.5. Summary ...................................................................................................... 39
4. DIGSILENT EMT SIMULATIONS ....................................................................... 41 4.1. DigSILENT relay models ............................................................................. 41 4.2. DigSILENT simulations ............................................................................... 44 4.3. Correlation of MatLAB and DigSILENT results ........................................... 46 4.4. Summary ...................................................................................................... 46
5. PRACTICAL TEST RESULTS .............................................................................. 48 5.1. ESKOM SCB configurations ........................................................................ 48 5.2. DigSilent simulation description ................................................................... 48 5.2.1. Fault type and location detail ..................................................................... 48 5.3. Practical injection tests ................................................................................. 50 5.3.1. Proof of correct overcurrent relay operation ............................................... 51 5.3.1.1. Unearthed SCB ....................................................................................... 52 5.3.1.2. Earthed SCB ........................................................................................... 53 5.4. Unearthed SCB Omicron injection results .................................................... 54 5.4.1. Faults on the Eltro Feeder .......................................................................... 54 5.4.2 Faults on the adjacent busbars .................................................................... 55 5.4.3. Back-to-back switching of unearthed SCB ................................................. 55 5.4.4 Result analysis of unearthed SCBs ............................................................. 56 5.5. Earthed SCB Omicron injection results ........................................................ 56 5.5.1 Faults on the Eltro Feeder ........................................................................... 56 5.5.2 Faults on the adjacent busbars .................................................................... 57 5.5.3 Back-to-back switching of earthed SCB ..................................................... 57 5.5.4 Result analysis of earthed SCBs ................................................................. 58 5.6. Summary ...................................................................................................... 58
6. RELAY FREQUENCY RESPONSE ...................................................................... 59 6.1. Relay settings ............................................................................................... 59 6.2. Relay pick-up current ................................................................................... 60 6.3. Relay operation time .................................................................................... 61 6.4. Possible application in ESKOM’s transmission network ............................... 62 6.5. Summary ...................................................................................................... 63
7. RECOMMENDATIONS ........................................................................................ 64 7.1. Recommendations to address MCGG operation............................................ 64 7.1.1. Do nothing option...................................................................................... 64 7.1.2. Pick-up current setting ............................................................................... 64 7.1.3. Definite time setting .................................................................................. 65 7.1.4. Replacement of the MCGG relay ............................................................... 65 7.1.5. IDMT curve application ............................................................................ 66 7.2. Summary ...................................................................................................... 66
8. CONCLUSIONS .................................................................................................... 67 8.1. Westgate incident findings ........................................................................... 67 8.2. Discussion of possible problem areas ........................................................... 68 8.3. Philosophy and guidelines for overcurrent relays on SCBs ........................... 68 8.4. Summary of report findings .......................................................................... 69 8.5. Further research study prospect .................................................................... 69

vii
REFERENCES ........................................................................................................... 70 APPENDIX ................................................................................................................ 73

viii
TABLE INDEX
Table 2-1: IDMT tripping time formulas…………………………..…………………….……..11
Table 2-2: Pick-up values of ITOCR at different modes…………………………………….…29
Table 2-3: Operating time of ITOCR at different modes..……………………………….….….29
Table 3-1: Westgate Overcurrent Protection settings….………………..…………………..….33
Table 5-1: Unearthed SCB: Relay operation for faults on the Eltro feeder……………….…....54
Table 5-2: Unearthed SCB: Relay operation for faults on adjacent busbars…..…….……….…55
Table 5-3: Earthed SCB: Relay operation for faults on the Eltro feeder…………….…………56
Table 5-4: Earthed SCB: Relay operation for faults on adjacent busbars………..………….…57
Table 6-1: Overcurrent protection settings………………………………………………….….59

ix
DIAGRAM INDEX
Figure 2-1. Construction of a capacitor unit………………………………………………..…....7
Figure 2-2. Common SCB configurations …………………….………………………………...7
Figure 2-3. Shunt capacitor bank with current limiting reactor ……………………………....…8
Figure 2-4. IDMT tripping curves…………………………………………………...……….…10
Figure 2-5. Electromechanical CAG39 overcurrent relay………………………………………14
Figure 2-6. Typical electromechanical attracted armature relay……………………………..…14
Figure 2-7. Electromechanical CDG16earth fault relay………………………………………...15
Figure 2-8. Typical induction disc type overcurrent relay………………………………...……15
Figure 2-9. MCGG63 Electronic Relay…………………………………………………………17
Figure 2-10. Possible circuit configurations of a solid-state overcurrent relay.……….………..18
Figure 2-11. Output waveforms of a solid-state overcurrent relay...…...………………………18
Figure 2-12. Digital SEL387 Relay..……………………………………………………………19
Figure 2-13. Components of a typical digital relay..……………………………………..……..20
Figure 2-14. Simplified system diagram………………………………………………………..22
Figure 2-15. Circuit representation to illustrate SCB transients………………………….……..22
Figure 2-16. Single SCB switching circuit……………………………………………….……..22
Figure 2-17. Back-to-back SCB switching circuit……………………………………….……..24
Figure 2-18. External fault in SCB vicinity………………………………..………….………..25
Figure 2-19. Fault at voltage zero…………………………………………………….………..27
Figure 2-20. Fault occurrence at voltage peak……………………………………..….………..27
Figure 2-21. Fault occurrence at voltage peak with CLR……………………..………………..28
Figure 2-22. ITOCR Operating time vs. RMS current for various modes..……………….……30
Figure 3-1. Westgate substation layout in DigSILENT....………..……………………….……32
Figure 3-2. Equivalent Westgate substation layout in MatLAB………..………………………35
Figure 3-3. SCB No.2: 3P fault, 700ms fault duration 1km from Westgate…………….…...…36
Figure 3-4. SCB No.2: 3P fault, 100ms fault duration 1km from Westgate…………….…...…37
Figure 3-5. SCB No.1: 3P fault, 700ms fault duration at 1km from Westgate……….……...…37
Figure 3-6. SCB No.1: 3P fault, 100ms fault duration 1km from Westgate…………..……..…38
Figure 3-7. SCB No.2: SLG fault; 100ms fault duration at 1km from Westgate………...…..…38
Figure 3-8. SCB No.2: A DLG fault, 700ms fault duration at 1km from Westgate……………39
Figure 4-1. DigSILENT MCGG63 Overcurrent Relay Logic Diagram...………..…………..…44
Figure 4-2. DigSILENT CAG Overcurrent Relay Logic Diagram ...…………….…………….42
Figure 4-3. Figure 4-3. MCGG RelMeasure output…………………………...…..………..…42
Figure 4-4. DigSILENT CAG and MCGG relay output indications ...…….……………….….43
Figure 4-5. 3P fault at 1% from Westgate 132kV busbar.………..…………………….…...…44

x
Figure 4-6. L-L fault at 1% from Westgate 132kV busbar....………………………………….45
Figure 4-7. DLG fault at 1% from Westgate 132kV busbar …………………………......……45
Figure 4-8. SLG fault at 1% from Westgate 132kV busbar ………………………….......……45
Figure 5-1. ESKOM’s SCB configurations…………………..………………………….……..48
Figure 5-2. Indication of fault locations on earthed SCB simulations……….…………..……..49
Figure 5-3. Relay input connections for the practical testing…………………..……...………..50
Figure 5-4. Relay output connections for the practical testing…………………..….…………..51
Figure 5-5. Unearthed SCB: Internal fault overcurrent relay output indications………...……..52
Figure 5-6. Earthed SCB: Internal fault overcurrent relay output indications……………...…..53
Figure 5-7. Back-to-back switching of an unearthed SCB…..……..……………………….…..55
Figure 5-8. Back-to-back switching of an earthed SCB…………………..…………...………..57
Figure 6-1: Frequency response of overcurrent relays…………………..………………….…..60
Figure 6-2. Relay operation trip time vs. Frequency of injected current…….……..…….….....61
Figure 6-3: Relay technologies applied in ESKOM’s Transmission network……..…………...62
xi
GLOSSARY
Overcurrent: This describes fault conditions where the current is above normal current, and is
unrelated to load conditions.
Overcurrent protection: The intention of this protection is to prevent thermal damage. An
overcurrent relay setting should take into consideration normal and transient load conditions to
prevent incorrect relay operation.
Overvoltage: This describes a condition where the voltage is above normal system voltage. An
undervoltage state describes the opposite condition.
Protection operation: This is the protection relay initiating a disconnection of a part of an
electrical installation. It refers to the relay signal issued to open/ trip its associated circuit
breaker.
Protection relay: The protection relay is to issue an alarm and/or trip its associated circuit
breaker, under certain fault or abnormal conditions.
Protected zone: This describes the portion of the network protected by a given protection
system.
Pick-up: A relay is said to detect or “pick-up” when it changes from an un-energised to an
energised state.
Settings: These are the calculated and predetermined energising quantities implemented into a
protection relay and for which, under certain conditions, the protection relay is to issue an alarm
and/or trip its associated circuit breaker.
Grading/ grades: This describes the time delay or grading margin between relays in a network,
to allow the relay closest to the fault to operate first.

1
1. INTRODUCTION
This chapter provides the background and objectives for this dissertation report. It also includes
the research methodology applied and a breakdown of the chapters contained herein.
1.1. Background
This dissertation report began as an investigation into a protection operation at Westgate
Substation, which occurred on the 10th October 2007. This entailed an overcurrent relay
protection operation on a shunt capacitor bank (SCB) for an external feeder fault on the 132kV
Eltro feeder at Westgate Substation. [41]
Westgate substation has two 132kV 72Mvar SCB’s, both of which were in service at the time of
incident. With both the SCB’s in service, only SCB No.2 tripped on overcurrent protection
indication for this external feeder fault. [41]
A previous incorrect protection operation occurred on the 13th October 2004 on the SCB No. 2.
This was again attributed to an overcurrent indication for an external feeder fault. In this
instance the 275kV Hera-Westgate No.1 feeder had tripped and auto-reclosed (ARC) due to a
white-to-blue phase impedance earth fault. [41]
ESKOM’s Transmission Incident Protection Performance System (TIPPS) database, [41],
indicated that an investigation was conducted to determine the cause of the initial overcurrent
tripping of SCB No.2 for the 2004 Westgate incident. The investigation feedback comments as
per TIPPS were that the overcurrent relay was tested and found to be within acceptable limits.
In addition, the root cause could not be established for this overcurrent protection operation.
[41]
The TIPPS investigation records for the 2007 incident indicated that each SCB, their associated
overcurrent relay and the protection trip indications were tested and found to be correct.
Protection personnel indicated that this trip was due to a close-in three phase (3P) fault on the
132kV Eltro feeder. This fault was not cleared by the Eltro feeder protection scheme, which
then lead to a long fault duration of 700 milliseconds (ms). The weather was reported as a clear
day at Westgate Substation and the loading during the day was approximately 250MVA. [41]
The repeat incident in 2007 highlighted a necessity to investigate further as to why only one of
the two parallel SCB’s tripped incorrectly for external feeder faults on an overcurrent
indication, with both overcurrent relays having identical and appropriate protection settings.

2
The difference identified in the otherwise identical Westinghouse SCB’s was the technology
employed by the overcurrent protection scheme. At Westgate substation SCB No.1 employs a
GEC CAG39 electromechanical overcurrent relay and SCB No.2 employs a GEC MCGG63
electronic overcurrent relay. [35]
1.2. Problem statement
The research question is to determine whether all overcurrent relay technologies are equally
suitable in the difficult fault environment in which SCB’s operate, for external system
disturbances and fault events.
The findings of this research could impact current SCB performance by removing hidden
failures i.e. a root cause that was not previously identified for previous protection operations
and possibly enhance future SCB overcurrent protection setting philosophy.
1.3. The objective of this work
The purpose of this work is to observe the performance of the different technologies
(electromechanical, electronic and digital) of overcurrent relays as applied to an ESKOM SCB
during system disturbances and external faults, and to compare their operation and behaviour
for a definite time overcurrent protection setting.
The investigation of the problem statement requires the following tasks:
a) review technical literature on SCB’s and the overcurrent relay;
b) review existing setting information of overcurrent relays applied in the SCB
environment;
c) review literature on overcurrent relay technologies and their method of operation;
d) conduct preliminary fault simulations using MatLAB and DigSILENT simulation
packages to determine if the Westgate protection operations were warranted;
e) correlate MatLAB and DigSILENT findings;
f) conduct fault simulations using the DigSILENT simulation package;
g) inject these fault simulations into the chosen electromechanical, electronic and digital
overcurrent relays; and to
h) draw conclusions based on the simulation and practical studies conducted.

3
1.4. Approach and method
The starting point of this research is to understand the function of the overcurrent relay as
applied to the SCB and to understand the principles of operation for the three different types of
protection relay technologies.
The literature review will also include a study of published literature on the performance of
overcurrent relays in the SCB environment or similar, depending on availability.
Preliminary fault studies will be undertaken to identify the performance of different relay
technology under identical external fault conditions, in the SCB environment. MatLAB and
DigSILENT software were identified as the most suitable simulation packages for these studies.
The first phase of the practical study employs MatLAB software to conduct a preliminary
assessment of the 2007 incident mentioned above. This is done to observe the current output, as
seen by the overcurrent relay for an external feeder fault, using a simplified model of Westgate
Substation.
These preliminary simulation results could determine whether the overcurrent relay should in
fact detect an external fault, and whether this external fault condition could result in the
possibility of an overcurrent protection operation or trip.
The second phase of the practical study will be to conduct Electromagnetic Transient (EMT)
studies using DigSILENT software to duplicate the studies carried out in MatLAB. These
simulations will employ the existing Westgate substation model and the existing DigSILENT
CAG and MCGG overcurrent relay models, which are available in the ESKOM Transmission
DigSILENT case file [19]. The 2007 incident mentioned above will then be simulated to
compare the DigSILENT CAG and MCGG overcurrent relay model operation and performance.
While this appears as an unnecessary duplication of work, the results could determine if the
MatLAB and DigSILENT findings are similar, and if the DigSILENT overcurrent relay models
perform as they did for the incidents mentioned above. This could be useful information to the
ESKOM Transmission Power System Operations Performance (PSOP) Investigation
Department where all ESKOM transmission power system incidents are investigated.

4
The next phase of the research was to use DigSILENT software and the ESKOM Westgate
substation model to create a number of fault simulations scenarios i.e. various fault types
simulated at numerous locations at Westgate substation. This will be repeated on the common
SCB configurations as applied in the ESKOM transmission network to determine if this has an
impact on protection performance, as suggested in [58].
In accordance with the IEEE Standard C37.111 Standard Common Format for Transient Data
(COMTRADE) files, derived from the DigSILENT fault simulations, will then be injected or
‘played back’ via an Omicron Test Universe set to the chosen electromechanical, electronic and
digital overcurrent relays. The overcurrent relay output trip indications, for each simulation
injection, will be captured in an Omicron report format.
These Omicron simulation injection reports will be collated and the findings will be presented.
This will provide insight to the problem statement of establishing if all overcurrent relay
technologies are equally suitable for the ESKOM SCB environment.
These findings could possibly be used to explain previous incidents where SCBs have tripped,
on an overcurrent protection indication, for an external fault.
In addition, possible recommendations to enhance SCB overcurrent protection setting
philosophies may be made, which could be implemented in the ESKOM transmission network.
1.5. Dissertation outline
This report consists of eight chapters. Each chapter is briefly described below.
Chapter 1: This chapter provides an introduction and outline to this investigation report and
states the background and objectives of this research. It also provides the approach and method
to be applied.
Chapter 2: This chapter contains the literature review on SCBs and their application in the
power system network. The protection schemes employed by the SCB are also discussed,
including the application and settings of overcurrent relays in the SCB environment.
The methods of operation of the three different relay technologies are presented. Also included
are calculations for SCB switching events and external fault conditions to determine any impact
on the current and frequency of SCB discharge currents.

5
The various factors affecting the discharge current are also stated. It also presents the findings
of previous studies on overcurrent relay performance in harmonic environments.
Chapter 3: Preliminary MatLAB simulation findings are presented in this chapter. This was
done to determine if the overcurrent relay protection operation was warranted for the 2007
Westgate incident.
Chapter 4: Preliminary DigSILENT simulation findings are presented in this chapter. The
results obtained from both the simulation packages are compared to determine if the findings
are similar.
Chapter 5: This chapter contains the Omicron fault injection results for the three technologies of
overcurrent relays. The performance of these overcurrent relays are analysed and presented.
Chapter 6: Frequency response test were conducted on the three technologies of relays. The
findings of these tests are presented here.
Chapter 7: Recommendations to prevent the operation of the electronic MCGG relay are
suggested here. These could be implemented to prevent the relay operation for external fault
occurrences.
Chapter 8: The conclusions based on the research findings are discussed here. Possible
application of the findings to the ESKOM transmission network and further research is
provided.

6
2. LITERATURE REVIEW
This chapter provides the literature review and gives the reader a brief overview of a SCB and
overcurrent relays.
The SCB topics covered include a description of a SCB, their configurations and application in
the power system. It also covers the protection schemes employed in the SCB environment.
The introduction of the overcurrent relay begins with a brief history of protection relays as
applied in the power system network. The function of an overcurrent relay and its application in
the SCB environment is presented.
This chapter also presents the method of operation of the three relay technologies used in the
practical injection tests. The methods of operation of the electromechanical, electronic and
digital overcurrent relays are discussed.
Also included are calculations for system switching events and external fault conditions of the
SCB, to determine the possible impact on the overcurrent relay’s performance. This was done
by means of current and frequency calculations. The external SCB environment was also
evaluated to determine various factors that could influence the SCB discharge current and
frequency.
Finally, this chapter also includes extracts from previous research on overcurrent relay
performance.
2.1. Shunt capacitor bank construction
A capacitor element consists of two electrodes separated by a dielectric. These elements are
grouped together in both series and/or parallel combinations to construct a capacitor unit [6].
The capacitor unit construction is shown below in Figure 2-1.

7
b)
d) c)
a)
Figure 2-1. a) Construction of a capacitor unit [2] and b) capacitor units of different sizes [40]
A SCB comprises of two or more capacitor units to achieve the capacitance and voltage ratings
required [6]. The SCB can be assembled in configurations described in Section 2.1.1. below.
2.1.1. SCB configurations
A SCB can be connected in various configurations on the ESKOM power system network. The
SCB configurations used are as follows [2, 6]:
Single star unearthed seen in Figure 2-2(a);
Double star unearthed seen in Figure 2-2(b);
Single star earthed seen in Figure 2-2(c);
Double star earthed seen in Figure 2-2(d);
H Configuration (earthed and unearthed)
C-Filter configuration and delta connected
Figure 2-2. Common SCB configurations [2, 10] The ESKOM Transmission SCB configurations shown in Figure 2-2 above are the most prevalent configurations at the 132kV level. ESKOM Transmission SCB configuration details are presented in Section 5.1.

8
2.1.2. Application of shunt capacitor banks
Figure 2-3. Shunt Capacitor Bank with current limiting reactor [30]
The SCB provides for the efficiency of the power system by controlling the voltage and
providing power factor correction. Voltage control results in reduced line losses and power
factor correction results in lower reactive power transmission costs and line losses. [2, 6, 7]
Due to its affordability, a SCB provides an economical solution to improve quality of the
electrical supply and can be installed in substations and close to customer loads. [2]
The major shortcoming of SCB is that its reactive power output is proportional to the square of
the voltage. The reactive power output of the SCB is calculated by the following equation as per
[11]:
Mvar(output) = Mvar(rated) x [V(actual)/V(rated)]2 (2-1)
Where Mvar(output) is the reactive power output of the SCB
Mvar(rated) is the reactive power rating of the SCB
V(rated) is the voltage rating of the SCB
V(actual) is the voltage of the busbar
According to Equation 2-1, when the SCB is most required i.e. when the system/ busbar voltage
is low, they are the least efficient. [2]

9
2.2. Protection relays
The function of a protection relay is to determine when a fault or an abnormal condition occurs.
Once a fault condition is detected the relay will generally issue an alarm or a trip signal to the
appropriate circuit breaker to remove the fault and thereby protect its associated equipment and
personnel in the vicinity. This is achieved by constantly measuring the appropriate parameters,
with current and voltage being the most common parameters used. [3]
Fundamental to each relay is that it should operate only for root means square (RMS) current or
voltage values, and for a country specific frequency i.e. either 50Hz or 60 Hz. [32]
The simplest relay operating principle is that when a fault occurs, current magnitudes increase
and voltage magnitudes decrease. The current and voltage range under normal operation
conditions can be calculated and then applied as a setting to a relay. A relay is now capable of
determining a fault condition as soon as it measures current or voltage values outside this setting
range. [1]
Electromechanical relays were the first relay technology used 80-90 years ago and by late 1950
progressed to electronic or solid state relays [1]. Digital relays are the most recent technology
applied in protection relaying.
A relay can have one or more functions i.e. overcurrent, earth fault etc. Each of these functions
is called a relay element. [3]
2.2.1. Overcurrent relay function
An overcurrent relay is used to detect currents above a preset current value that is called a pick-
up setting. Once the relay has detected the overcurrent condition, it can either issue a protection
trip signal instantaneously or after a predetermined time delay [1].
In the SCB environment, the instantaneous overcurrent relay is expected to be stable for feeder
faults, transient switching conditions and circuit breaker opening [6].
The characteristics of an overcurrent relay is chosen taking into consideration the other
protection relays in the protected zone. The time taken for the overcurrent relay to issue a trip
would also be time graded with these other protection devices (such as fuses) so that when a
fault does occur, only the relevant relays in the faulted zone initiate a tripping operation [4].
10
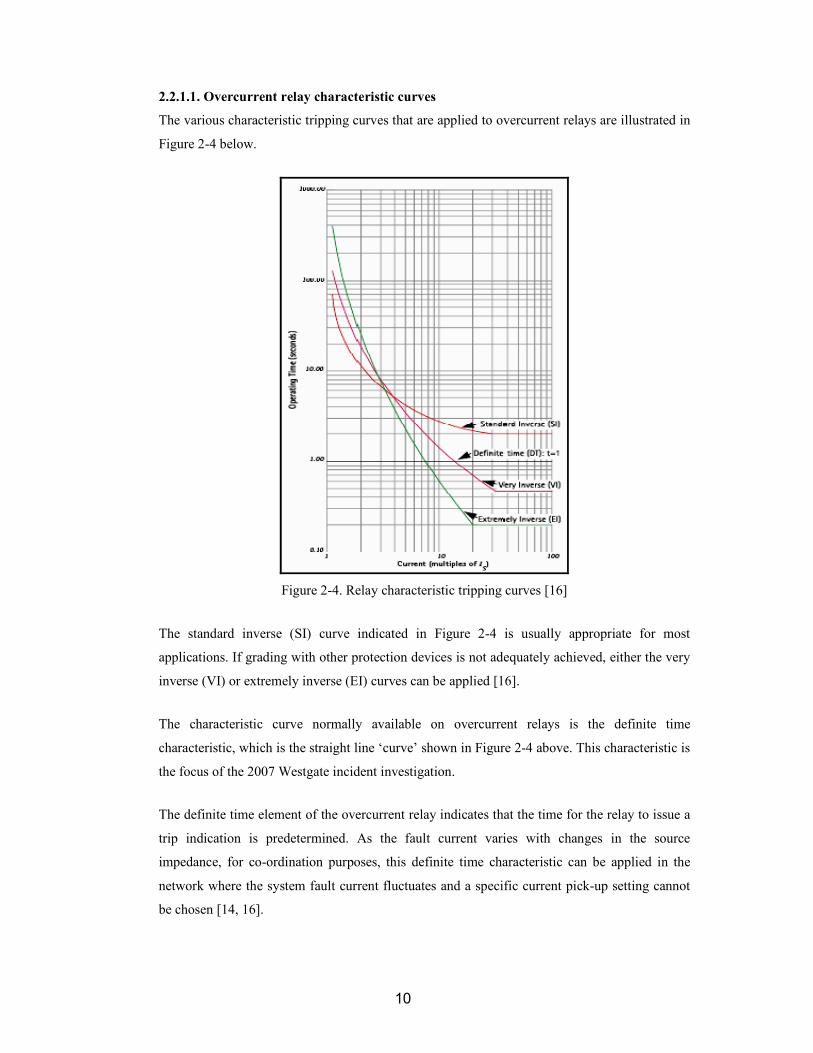
2.2.1.1. Overcurrent relay characteristic curves
The various characteristic tripping curves that are applied to overcurrent relays are illustrated in
Figure 2-4 below.
Figure 2-4. Relay characteristic tripping curves [16]
The standard inverse (SI) curve indicated in Figure 2-4 is usually appropriate for most
applications. If grading with other protection devices is not adequately achieved, either the very
inverse (VI) or extremely inverse (EI) curves can be applied [16].
The characteristic curve normally available on overcurrent relays is the definite time
characteristic, which is the straight line ‘curve’ shown in Figure 2-4 above. This characteristic is
the focus of the 2007 Westgate incident investigation.
The definite time element of the overcurrent relay indicates that the time for the relay to issue a
trip indication is predetermined. As the fault current varies with changes in the source
impedance, for co-ordination purposes, this definite time characteristic can be applied in the
network where the system fault current fluctuates and a specific current pick-up setting cannot
be chosen [14, 16].

11
When compared to the SI, VI and EI characteristic curves, the definite time characteristic
operates faster in the lower current value range, which can be seen in Figure 2-4 [16].
Characteristic curves other than these mentioned above may be provided, including a custom
made curve, when a digital relay is applied in a protection scheme [14, 17].
The characteristic curves applied to an overcurrent relay, with the exception of the definite time
curve, uses a formula to calculate the relay operation time. This is shown in the Table 2-1
below.
Table 2-1: IDMT tripping time formulas [16]
Relay Characteristic Curve Equation as per IEC 60255
Standard Inverse (SI) T = TMS x 0.14/(Ir 0.02 –1)
Very Inverse (VI) T = TMS x 13.5/(Ir –1)
Extremely Inverse (EI) T = TMS x 80/(Ir 2 –1)
Long time standard earth fault T = TMS x 120/(Ir –1)
2.3. SCB protection schemes
This research considers the external system disturbance and fault environment of the SCB.
Therefore a brief description of the protection scheme applied to SCB’s for external fault
protection is listed below as per ESKOM’s Distribution Standard [6], Technology Reference for
Power Capacitor Application and Protection [7], and Protection Setting Philosophy for
Transmission and Sub-Transmission Grids [10].
2.3.1. Overcurrent protection
The overcurrent relay is used to detect internal short circuits and external faults. The relay
should have a minimum current pick-up level of above 135% of the load [6, 10].
The overcurrent relay has two time settings that it could be set to. This is as per [6, 10]:
• Low-set definite time setting:
This is set to 1.5 times full load current, with a 200 millisecond (ms) time delay setting
to prevent operation of the relay for transient conditions.
• High-set instantaneous setting:
This is set to 3 times full load current if there is only one SCB on the busbar. If two or
more SCB’s are on the busbar, this is increased to 4 times full load current. Hi-set
instantaneous setting has no intentional time delay and is intended for the fast clearance
of faults.

12
2.3.2. Overvoltage protection
Overvoltage protection is required to ensure that the SCB would be removed from the system
when the system voltage value exceeds 110% of the manufacturer’s continuous voltage rating of
the SCB [10, 15]. This is important as overvoltage events severely ages the SCB, especially if
the frequency and duration of these overvoltage events are excessive. [7, 10]
To prevent any operation for transient overvoltage conditions and to co-ordinate with
overvoltage protection of the system and/or feeder, the overvoltage protection on SCB’s is set in
definite time mode with a minimum time delay of 200ms. [7, 10]
When a few SCBs are in the same vicinity of the power system, all SCBs cannot be removed
simultaneously for overvoltage conditions as this could then cause an under voltage condition.
To cater for the cascade tripping that would be required, the first stage is set to 120% of rated
voltage with a 200ms time delay. The second stage would have a time delay increased to
500ms. [10]
2.3.3. Earth fault protection
An overcurrent relay is used on each phase element and frequently an additional current element
or relay is used for earth fault protection. This current element or relay measures the neutral
current [6, 16].
The pick-up setting value for the earth fault relay is usually between 20%-40% of the full load
current or is set to the minimum earth-fault current of the protected zone [14, 35].
The time grading of the earth fault relay is similar to that of the overcurrent phase relays i.e. this
relay is co-ordinated with other earth fault devices in the network [14].
The earth fault relay as applied to earthed and unearthed SCB’s is described below.
2.3.3.1 Earthed SCB
The earthed SCB’s earth fault relay is set as fast as possible, however still graded with the other
protection schemes on the bus. This co-ordination would prevent the earth fault relay from
operating for external system faults. [10]
The low set earth fault pick-up current value is 20% of the current rating of the SCB. [10]

13
The high set instantaneous setting should be 3 times the current rating of the SCB if there is
only one SCB on the busbar. This is increased to 4 times the SCB current rating if two or more
SCBs are on the busbar. This setting has no intentional time delay and is intended for the fast
clearance of faults. This is identical to the overcurrent high-set settings so as to cater for high
switching currents and back-to-back switching of the SCB’s. [10]
2.3.3.2 Unearthed SCB
The residually connected earth fault element, which is derived from the three phase current
measuring elements, should be insensitive to harmonics and inrush conditions. [6]
The low-set earth fault pick-up current setting is 20% of the current rating of the SCB. As the
setting is measured from the star point, this setting detects earth fault currents higher than 1,2
p.u. on each SCB leg. This setting has an associated definite time mode setting of 200ms. This
time delay allows for current transformer (CT) transient behaviour on energisation of the SCB.
[10]
The high-set current setting, if available on the relay, should be set 3 to 4 times the low-set
setting described above. This amounts to 60% to 80% of rated current of the SCB. Grading with
other earth fault protection schemes is not required in the unearthed SCB environment, as the
SCB is not connected to earth. [10]
2.4. Electromechanical relays
Electromechanical relays are so named due to the mechanical force it generates from the current
flow in one or more windings of a magnetic core/s. This mechanical force is used to then
operate a contact. [14]
The different classifications of electromechanical relays are thermal, motor operated,
mechanical, moving coil, attracted armature and the induction disc type. [14]
The construction and principles of operation of the two types of electromechanical overcurrent
relays used in the practical injection tests i.e. the attracted armature and the induction disc type
relays are described below.
Of the electromechanical relays used in the practical injections, the CAG is of an attracted
armature type and CDG is of an induction disc type. The difference in operation is as explained
below.

14
2.4.1. Attracted armature type relay
A General Electrical Company (GEC) overcurrent relay was used for the practical portion of
this research. A photograph of the CAG39 relay used in the injection tests is shown below.
Figure 2-5. CAG39 Electromechanical overcurrent relay
The CAG39 electromechanical relay is of the attracted armature classification type with a
typical construction shown in figure below. [43]
Figure 2-6. Typical electromechanical attracted armature relay [13]
The figure above illustrates a simple solenoid. The CT transforms the input current into a safe
levels for the relay. When the input coil exceeds the certain threshold or setting value of the
relay, the force induced in the solenoid attracts the armature and its associated moving contact,
closing the circuit. [22]
The speed of the relay depends on the magnitude of the input current. However, with no
intentional delay, this relay is often referred to as an instantaneous relay. [22]

15
2.4.2. Induction disc type relay
A GEC earth fault relay was used for the practical portion of this research. A photograph of the
CDG16 relay used in the injection tests is shown below.
Figure 2-7. CDG16 Electromechanical earth fault relay
The electromechanical CDG16 relay is of the induction disc classification, with the typical
construction shown below. [42]
Figure 2-8. Typical induction disc type overcurrent relay: (a) top view; (b) side view [13]

16
A phase current from a CT is injected into the main coil input via a plug bridge also commonly
called the plug setting multiplier (PSM). The PSM varies the number of turns on the main coil
and can be adjusted according to the current setting of the relay. [13, 17, 22]
This current sets up a magnetic flux in the electromagnet and consequently induces a current on
the lag coil, found on same core. This results in a magnetic flux around each coil, which is out
of phase. The magnetic fields established by the coils subsequently induce eddy currents in the
disc. [17, 22]
Once the input current into the relay is greater than the spring torque pressure on spindle and the
damping magnet, this will now be sufficient to generate a torque that causes the disc to rotate.
[17, 22, 34]
The basic current/torque equation as per [34]:
τ = K. Im1 . Im2 . Sinθ (2-2)
Where K is a constant;
Im1 and Im2 are the currents in each coil; and
θ is the phase angle between the currents.
Since the lag coil carries a current that is proportional to the input current, Equation 2-2 can be
further simplified as per [34]:
τ = K1. I2 (2-3)
Where K1 includes the term sin θ, which is a constant for the relay [34].
The disc rotates in the direction of the torque, which is from the coil with leading current to the
coil with lagging current. It takes with it the movable contact until it closes onto the fixed
contact, subsequently issuing a trip indication. The time taken for the contacts to make is
dependent on the position of the spindle stop contact, also known as the time multiplier (TM).
[17, 22, 34]
The speed of the disc is calculated as per [17]:
Speed = Distance/ Time = 1/ I2 (2-4)
Equation 2-4 indicates that the speed of relay operation is inversely proportional to the current
i.e. for high currents the relay disc would rotate faster and therefore issue a trip signal faster
than at low currents [17]. This also explains the characteristic tripping curves seen in Figure 2-4.

17
In summary, the PSM setting therefore determines the current setting for which the relay disc
begins to rotate and the TM setting determines the time in which the relay issues a trip signal.
Once the relay has started to rotate, if the input current should decrease to below the pick-up
setting, or drop off altogether, the disc would reverse into its start position due to the pressure of
the spring on the spindle [17].
However, there is the possibility that the disc does not reverse direction immediately, due to
stored kinetic energy in the disc, possibly causing the electromechanical relay to overshoot and
issue an incorrect trip indication [16].
2.5. Electronic relay
A GEC overcurrent relay was used for the practical portion of this research. A photograph of the
MCGG63 relay used in the injection tests is shown below.
Figure 2-9. MCGG63 electronic Relay
For the purpose of this work, an electronic relay is defined as a relatively simple analogue-to-
digital static or solid-state relay.
The relay response is determined by the use of electronic circuits comprising of elements such
as diodes, transistors, transformers, resistors, capacitors, inductors, operational amplifiers and
comparators, etc. [17, 22, 23].
A circuit configuration of a solid-state overcurrent relay can be seen in Figure 2-10 below.

18
Figure 2-10. Possible circuit configurations of a solid-state overcurrent relay [34]
For this type of relay, the input alternating current (AC) is sometimes converted into an isolated
and smaller AC value via a transformer [1, 22]. In the case of Figure 2-10, a shunt resistor is
used to reduce the input current [34].
The voltage across the resistor is then converted, via a full-wave bridge rectifier, into a direct
current (DC) value proportional to that of the AC input. This output waveform of the relay can
be identified as e1 in Figure 2-11 below. [1, 22, 34]
Figure 2-11. Output waveforms of a solid-state overcurrent relay [34]
A filter circuit is then incorporated to eliminate all frequencies except the fundamental
frequency that the relay has been designed to operate for i.e. 50Hz or 60Hz. This filter circuit
contains a resistor and capacitor [1, 22, 34].

19
The integral of the filtered and rectified waveform, represented as e2 in Figure 2-11, is then
compared to the relay reference or threshold settings (er). If e2 remains above the er value for a
predetermined and user defined time delay (τ), the relay would issue a trip indication. [1, 22. 34]
The major advantages of static relays are the increased speed and reliability due to the absence
of mechanical parts as found in electromechanical relays [17]. They also have a lower burden,
lower maintenance requirements and are more compact in size [22].
Due to their components however, electronic relays are designed to operate in controlled
temperature and humidity environments to prevent mal-operations. They also require
independent power supplies. [17,22]
2.6. Digital relay
A Schweitzer Engineering Laboratories (SEL) relay was used for this research. A photograph of
the relay used in the injection tests is shown below.
Figure 2-12. SEL387 Digital relay For the purposes of this work, a digital relay is defined as relay that uses a microprocessor with
software based protection algorithms (series of instructions and calculations) for the detection of
power system faults. Certain manufacturers and resources refer to the digital relay as a numeric
relay. [1, 17]
Similar to the electronic relay, the digital relay uses a CT to transform the AC current input into
an isolated AC value. The input voltages are also reduced to a safe level by surge filters to
protect the internal components of the relay [1, 17, 22].
This relay is very compact and can have more than one protection function or element [1, 22].
The architecture of a typical digital relay is indicated in the image below [24].

20
Figure 2-13. Components of a typical digital relay [24]
The input sine wave is also filtered via anti-aliasing filters. This is to remove all unwanted high
frequency components for which the relay is not designed to operate. [1, 3, 17, 22]
The filtered signal is fed to an analogue to digital converter. The relay then samples the data.
This sampling frequency takes into consideration the Nyquist criterion. [1, 3, 17]
The Nyquist criterion as per [3, 14]:
fs = 2 . fh (2-5)
Where fs is the sampling rate; and
fh is the highest frequency to be sampled.
The relay algorithms then process the sampled data into digital outputs. In the memory
component storing the relay algorithms, the relay can use Fourier Transforms or Discrete
Fourier Transforms to calculate the RMS magnitudes and phase angles of the input signal. [1, 3,
17]
As with all protection relays, the digital relay can compare the measured (and calculated) values
to a predefined parameter of the relay settings to determine whether a trip operation is
warranted. The digital relay goes a step further in that the relay logic can be used to identify the
fault type. [1, 3, 22]
Under normal, balanced power system conditions only positive sequence currents and voltages
exist. The relay continually measures the new positive sequence values and compares these to
the normal condition (in its sample-and-hold circuits) to determine if a fault exists. Negative
phase sequence currents occur when system conditions are unbalanced and therefore can be
used for more sensitive, faster and improved fault clearance. [1, 3, 26]

21
As the digital relay logic can be used to identify the fault type, once the fault type is determined,
it can operate appropriately. [2 3, 26]
One advantage of the digital relay is that its logic can be user-defined by means of a
configuration file. This can be transferred to the relay via a personal computer (PC). [1]
Another major advantage is the fault event recording capability. This fault record, usually in an
oscillograph format, includes input/output changes and the progression of key logic decisions.
The record can be downloaded via PC or remote access and is beneficial for fault analysis. [1,
22]
The digital relay also has a self-diagnostic functionality built-in, with warning indications of
impending or possible malfunctioning [1, 17]. It also contains advanced metering and
communication protocol ports, allowing the relay to be incorporated into the Supervisory
Control and Data Acquisition (SCADA) system as per IEC Standard 61850 [24].
The digital SEL relay used in the practical injection tests has one instantaneous, one definite-
time and one IDMT element for each phase. It also incorporates negative-sequence, and residual
ground currents for measuring purposes [25].
More in depth information regarding the computer relaying algorithms, which does not form
part of this work, can be found in [22], [23] and [26].
2.7. Current and frequency calculations
In the literature review of SCB’s it was suggested that the normal switching operations of a
SCB, and a fault occurrence in the vicinity of the SCB, would cause inrush, discharge and
outrush transient conditions consisting of high currents with harmonic content [12, 47, 53].
This phenomenon was investigated to determine its possible effects on an overcurrent relay.
A simplified system illustrated below is used to explain SCB normal switching operations and
fault events. This has been adapted from references [8] and [18].

22
Figure 2-14. Simplified system diagram [8, 18]
The simplified system diagram in Figure 2-14 is further simplified to the circuit representation
below. [18]
Figure 2-15. Circuit representation to illustrate SCB transients
2.7.1. Single SCB switching
The first transient condition investigated is the switching event of the first SCB, C1. In Figure 2-
16 switch S1 is closed to determine the inrush current as seen by C1.
Figure 2-16. Single SCB switching circuit

23
The inrush current for a single SCB switching operation is calculated below, with equations as
per [21]:
Ipk = √2 √(ISC . I1) (2-6)
Where Ipk is the peak inrush current in amperes
ISC is the three-phase fault current in amperes
I1 is the SCB current in amperes
The Ipk current of the capacitor bank to be energised is calculated using the following:
I1 = 315A as calculated by Equation 2-1; and
ISC = 16,83kA, as determined by EMT fault study on DigSILENT
Ipk = √2 √(ISC . I1)
= √2 √(16,83 . 103 . 315)
= 3256A
It can be seen that for a single SCB switching event, the inrush current into the bank being
energised would exceed the definite time overcurrent pick-up setting of 472A and the
instantaneous overcurrent pick-up setting of 1260A.
The frequency of this inrush current can be calculated as per [21]:
f (hertz) = fs . √(ISC/ I1) (2-7)
= 50 . √(16,83. 103 / 315)
= 365,5 Hz
Where fs is the power system frequency of 50Hz is used.
It can be seen that for a single SCB switching event produces a high frequency inrush current of
the seventh harmonic order.
2.7.2. Back-to-back SCB switching calculations
The term back-to-back switching as applied to SCBs refers to the switching in of a second SCB
when an existing SCB is already energised [21].
This event is depicted in Figure 2-17 where switch S1 is already closed and C1 has achieved
steady state operation conditions. Switch S2 is to be closed to energise C2.

24
Figure 2-17. Back-to-back SCB switching circuit
The calculations for the inrush current and frequency for a back-to-back SCB switching
operation is presented below, with equations as per [21]:
Ipk = 13500 √ [VLL . (I2.I1) / (fs . Leq (I1 + I2))] (2-8)
Where Ipk is the peak inrush current, in amperes
VLL is the maximum line-to-line voltage, in kV
I1 is the current in SCB being switched, in A
I2 is the current of the SCB already energised, in A
Leq is the total equivalent inductance per phase between SCB’s, in µH
Equation 2-8 can be simplified further when the SCB to be switched is equal to that of SCB
already energised, as per [21]:
Ipk = 9545 √ [VLL . I1) / (fs . Leq )] (2-9)
The Ipk current of the capacitor bank to be energised is calculated using Equation 2-9:
Ipk = 9545 √ [132 . 315) / (50 . 200)]
= 19, 46 kA
Where Leq = 200µH (assuming a 200m cable between the SBC’s); and 1µH/m [21].
It can be seen that for a switching event of a second SCB, with C1 already energised, causes an
extreme inrush current into the second bank. This is a more onerous scenario than the single
SCB switching event. Again, this would exceed a definite time overcurrent pick-up setting of
472A and the instantaneous overcurrent pick-up setting of 1260A.
The frequency of the transient inrush current is calculated in kHz, with an equation as per [21]:
ft = 13,5 . √ [fs .VLL / (Leq.I1)] (2-10)
= 13,5 . √ [50 .132 / (100. 315)]
= 6 200 Hz
Again it is noted that the back-to-back SCB switching event produces a high frequency inrush
current of a high harmonic order.
25
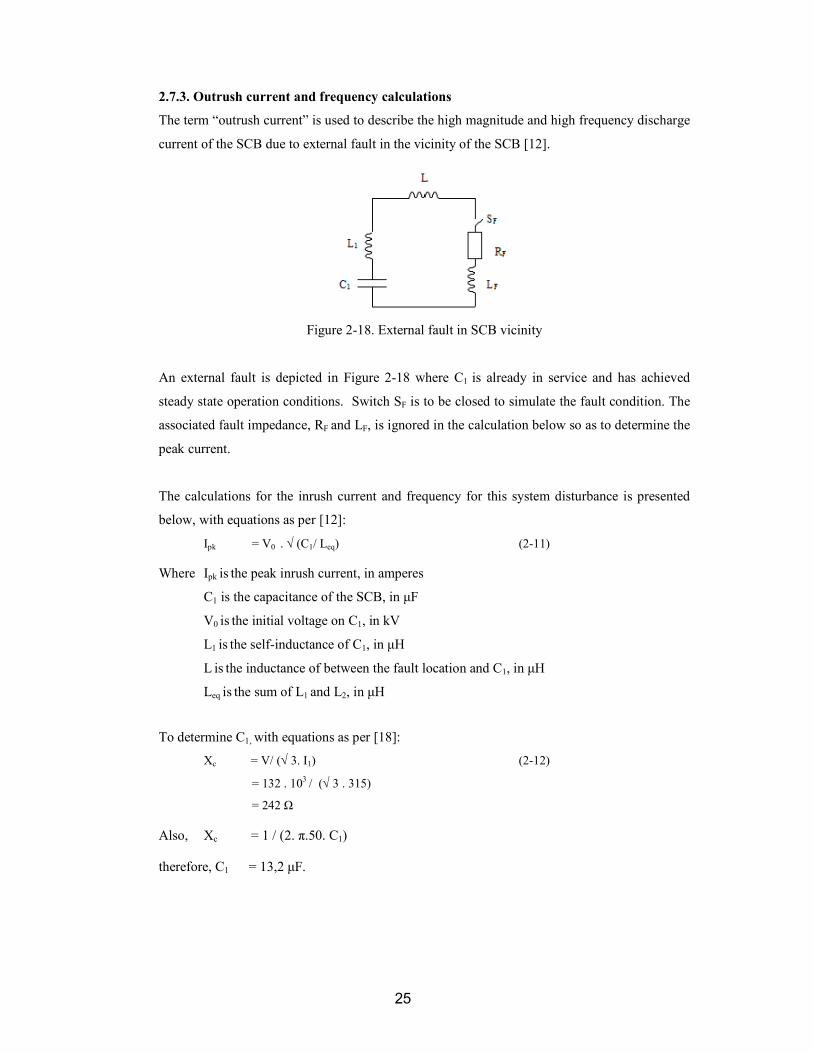
2.7.3. Outrush current and frequency calculations
The term “outrush current” is used to describe the high magnitude and high frequency discharge
current of the SCB due to external fault in the vicinity of the SCB [12].
Figure 2-18. External fault in SCB vicinity
An external fault is depicted in Figure 2-18 where C1 is already in service and has achieved
steady state operation conditions. Switch SF is to be closed to simulate the fault condition. The
associated fault impedance, RF and LF, is ignored in the calculation below so as to determine the
peak current.
The calculations for the inrush current and frequency for this system disturbance is presented
below, with equations as per [12]:
Ipk = V0 . √ (C1/ Leq) (2-11)
Where Ipk is the peak inrush current, in amperes
C1 is the capacitance of the SCB, in µF
V0 is the initial voltage on C1, in kV
L1 is the self-inductance of C1, in µH
L is the inductance of between the fault location and C1, in µH
Leq is the sum of L1 and L2, in µH
To determine C1, with equations as per [18]:
Xc = V/ (√ 3. I1) (2-12)
= 132 . 103 / (√ 3 . 315)
= 242 Ω
Also, Xc = 1 / (2. π.50. C1)
therefore, C1 = 13,2 µF.

26
The peak inrush current can now be calculated by substituting the above into Equation 2-11:
Ipk = 132. 103 . √ (13,2 . 10-6 / 300 . 10-6)
= 27,69 kA
Where Leq = 300µH (assuming a 300m distance between the SBCs and the fault location); and
1µH/m [18].
It is noted that the peak outrush current is determined by the SCB voltage at the instance of
circuit breaker opening, the SCB capacitance and self inductance, and the inductance between
the SCB and the fault location [48].
Transient discharge current frequency is calculated assuming a distance of 300m to the fault,
with equations as per [21]:
ft = 1/ [2π √(Leq.C1)] (2-13)
= 1/ [2π √(13,2 . 10-6 . 300 . 10-6)]
= 2529 Hz
The calculation for an external fault event in the SCB environment indicates a high frequency
inrush current. It is noted that the frequency is significantly affected by the inductance between
the SCB/s and the fault location.
Therefore, for an unearthed SCB, a close-in 3P bolted fault would be worst-case scenario to
generate a high discharge current. For an earthed SCB, the worst-case scenarios could be a 3P-
to-earth or a SLG fault. [21]
2.8. Factors that influence SCB discharge current
2.8.1. Source impedance
In the case of a single SCB switching operation, the source impedance plays a crucial role in
determining the inrush current and inrush current frequency. This is as the source impedance is
greater than the SCB inductance. [21]
The affect of the source impedance is less significant on the back-to back switching events and
on the external fault occurrences, where the impedance of the discharge loop is lower than that
of the source impedance [18, 54]. These discharge loops can be seen in Figure 2-17 and Figure
2-18.

27
2.8.2. Point on wave of fault occurrence
A simulation of a fault occurrence at system voltage zero, extracted from [38], is presented
below. No harmonics can be seen on the current waveform.
Figure 2-19. Fault at voltage zero [38]
As most faults occur when the system voltage is at the peak of the sinusoidal waveform or near
a voltage peak [49], the above is usually unlikely.
A simulation of a fault occurrence at a system peak voltage, extracted from [38], is presented
below.
Figure 2-20. Fault occurrence at voltage peak [38]
Harmonics can be seen on the current waveform at the instance of the fault occurrence. The
current can be seen exceeding the maximum 20kA allowed by ANSI/ IEEE Standards C37.012.
As the high current decreases within a half cycle, the current would still be within the associated
circuit breakers peak current capability [38].
However in practice, a current limiting reactor (CLR) would need to be installed to limit the
current [38].

28
2.8.3. Application of a CLR
This section of research was conducted to determine if the discharge current of a SCB changed
significantly with the use of a CLR.
A simulation conducted in [38] for a fault occurrence at a voltage peak without a CLR was
shown in Figure 2-20. It indicates harmonics and an extreme peak in the current waveform [38].
This simulation was repeated with a CLR to limit the discharge current. The current limiting
effect of the CLR can be seen in Figure 2-21.
Figure 2-21. Fault occurrence at voltage peak with CLR [38]
This figure suggests that there is no extreme peak current and confirms the current limiting
effect of the CLR when compared to Figure 2-20. However, harmonics are still present for a
number of cycles [38].
2.9. Summary of factors affecting SCB discharge current
In summary, as per [21, 38, 48 and 57], the peak current and the frequency of this transient
current are determined by the following factors:
• source impedance;
• the point on wave of the voltage waveform at which the fault occurs;
• the charge of the capacitor bank at the instance of switching;
• the inductance, capacitance and damping resistance of the circuit for the specific
switching event or system fault; and the
• vicinity to distribution loads that contribute to harmonics.
These factors highlight that EMT simulations studies would be the most appropriate method to
determine the transient current for new and existing SCBs. These simulations would have to be
injected into the overcurrent relays to determine their performance in the SCB environment.

29
2.10. Previous research on relay performance
The literature review conducted to attain information for the exact topic of overcurrent relay
performance, or a comparison of overcurrent relay technologies, as applied to the specific
environment of SCB’s was not readily available.
The scope for the literature review was therefore increased to find a comparison of overcurrent
relay technology and their performance in a harmonic environment. In the SCB environment
these harmonics are due to the switching inrush currents and the discharge currents for external
fault occurrences [8, 28, 31].
The following inverse time overcurrent relays (ITOCR) performance was extracted from [9]
where an ITOCR was injected with a current containing harmonics.
Each numbered mode in the tables below reflects a change in the harmonics of the inject
current. The corresponding total harmonic distortion (THD) is also shown for each current
injection.
Table 2-2: Pick-up values of ITOCR at different modes [9]
It can be seen from Table 2-2 above that the RMS pick-up current of the ITOCR increases for
each mode or current injection with increased THD.
Table 2-3: Operating time of ITOCR at different modes [9]
It can be seen from Table 2-3 above that the operating time of the ITOCR increases for each
mode (current injection of increased THD).

30
These research results are incorporated in Figure 2-22 below.
Figure 2-22. ITOCR Operating time vs. RMS current for various modes [9]
These curves show that the electromechanical ITOCR were susceptible to current harmonics in
practical studies undertaken by Dalci et al [9]. This experiment concluded that both “the pick-up
current and the operating time of the ITOCR increase proportionally to the THD value of the
non-sinusoidal current”. [9]
Yumurtaci et al [27] conducted a similar study on electromechanical instantaneous overcurrent
relays and this again showed that the pick-up current would increase as the harmonics in the
injected current increased. [27]
Another research paper conducted by Wichita State University, [32], investigated how
harmonics affected relays. This research showed that 30% of the relays tested would fail to meet
manufacturer specifications when injected with a 20% distortion in current. This practical
research was carried out in 1994 on 29 relays widely used in the Kansas Electric Utility and
included all relay types. [32]
It should be noted however that the technology applied to the digital relay technology has
improved greatly since 1994, and most digital relay designs can calculate the 50Hz fundamental
waveform from the input waveform. [1, 13]
2.11. Summary
This chapter provided a brief overview of a SCB, its construction and the reasons for their
application in the power system network. The protection schemes used to protect SCBs were
identified, including the function of an overcurrent and earth fault relay, which were also
explained.

31
The basic measuring principles of the different technology of relays applied in the ESKOM
SCB environment were presented. Modern digital relays have advanced sampling and filtering
circuits while electronic relays have simple filter circuits comprising of capacitors and resistors.
Electromechanical relays have no special filtering circuits. It is therefore concluded that the
technology of the overcurrent relay determines it’s vulnerability to harmonics.
Also presented were current and frequency calculations showing the impact of normal switching
events of a single SCB, back-to-back switching and external system fault occurrences. These
calculations showed transient currents with high peak values and containing high frequencies.
The literature review indicated that electromechanical and some electronic overcurrent relays
were vulnerable in a harmonic environment. This suggests that the application of these
overcurrent relays in the SCB environment could lead to incorrect and unreliable protection
operations.
In addition, the various factors affecting the SCB discharge transient currents were presented
above. These factors highlight that EMT simulations studies would be the most appropriate
method to determine the transient current for new and existing SCBs.
Finally, the findings from previous research on the performance of different relay technologies,
including the overcurrent relay technology, were presented. From this literature survey it is
concluded that the electromechanical and the electronic (pre 1994) overcurrent relays were
susceptible to harmonics.
32
3. MATLAB RMS SIMULATIONS
This chapter presents the MatLAB preliminary fault study for the Westgate SCB No.2 that
tripped on 10th October 2007. It also presents the overcurrent relay settings as applied at
Westgate substation.
The objective of presenting the MatLAB simulations to determine if the overcurrent relay
operation for the 2007 incident at Westgate substation was warranted, when compared to the
definite time overcurrent relay settings. Further simulations were conducted to identify possible
protection operations of the overcurrent relay, due to a definite time overcurrent protection
settings.
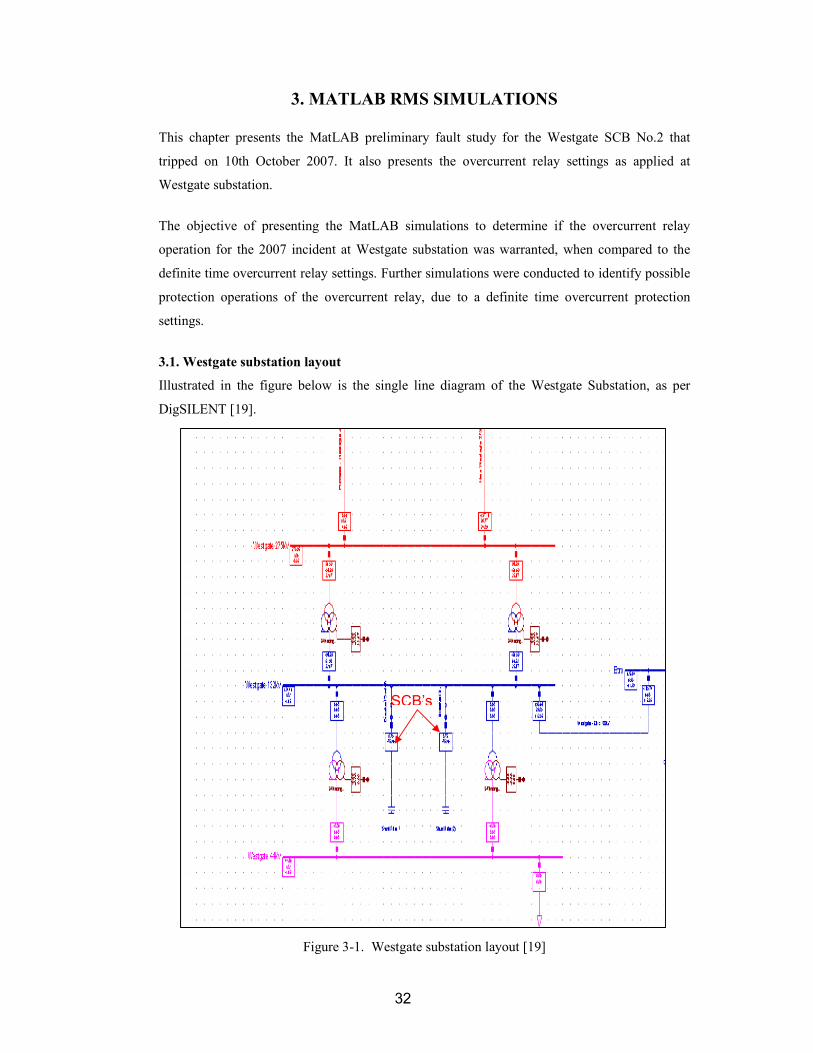
3.1. Westgate substation layout
Illustrated in the figure below is the single line diagram of the Westgate Substation, as per
DigSILENT [19].
Figure 3-1. Westgate substation layout [19]
SCB’s

33
The SCB’s can be seen in the Westgate Substation layout above on the 132kV busbar.
Westinghouse was the manufacturer of each SCB, with a nameplate rating of 72Mvars.
The capacitor banks are externally fused and consist of 4 stacks in series, with 9 capacitor units
per stack [41]. Further SCB details were obtained from TIPPS [41] and are provided in
Appendix A-9.
The simulation results show the current as seen by the overcurrent relay CT’s of SCB No.1 and
SCB No.2.
3.2. Overcurrent protection scheme and settings
The overcurrent settings for the Westgate SCB’s are presented below in Table 3-1.
Table 3-1: Westgate Overcurrent Protection settings [35] SCB Protection
Description
Relay Type Current
Pick-up Setting
Time Setting
1 Overcurrent
(Definite Time) GEC CAG39 1.2A
0.2 Sec (via
external timer)
2 Overcurrent
(Definite Time) GEC MCGG63 1.2A 0.2 Sec
2 Overcurrent
Instantaneous GEC MCGG63 4A Instantaneous
It is noted that the CAG39 overcurrent relay is of the instantaneous type. However, at Westgate
substation this relay is applied in series with an external overcurrent timer RXKT 22. The timer
is set in definite time configuration with a time delay of 200ms. [35]
3.2.1. Time delay current pick-up setting calculation
The current pick-up settings as per the Transmission Protection settings database are identical
for both the Westgate SCB’s [35].
The rated current of the SCB is calculated below:
IRated = Mvar/ (√3.kV) = 72/ (√3.132kV) (2-1)
= 314,92 A
Where the Mvar rating of the SCB bank is 72Mvar and the voltage level is 132kV.
The maximum primary current permitted is 150% of the rated current and is calculated below:
IPrim = 1,5 . IRated (2-2)
= 1,5 . 314,92
= 472 A

34
This 472A is the pick-up current setting for the time delay element of the overcurrent relay, as
seen on the primary side of each phase CT.
3.2.2. Instantaneous current pick-up setting calculation
The instantaneous current pick-up setting is calculated as per the Transmission Protection
settings database [35]. This states that the maximum overcurrent permitted when two banks are
in parallel is 400% of the rated load current.
IPrim = 4 . IRated (2-3)
= 4. 314,92
= 1259,68A
This is the value of current, as seen by the CT primary, for the instantaneous element setting of
the overcurrent relay.
3.3. MatLAB simulations
In MatLAB, a simplified model of Westgate Substation comprising of two unearthed 72Mvar
SCB’s with a three phase source and the 132kV Eltro Feeder was created. The Westgate
Substation is illustrated below is as modelled in MatLAB [45].
Westgate SCB No.1 is indicated by a yellow oval on Figure 3-2. On the same figure, the three
phase fault applied on the 132kV Eltro feeder is indicated by the blue oval. This replicates the
2007 Westgate incident.
The oscilloscope associated with SCB No.1, Scope 3, is used to view the root mean square
(RMS) values of all three phase primary currents, as seen by the overcurrent relay CT’s. The
purple oval on Figure 3-2 highlights Scope 3.
Similarly, the RMS current waveforms of the SCB No.2 can be viewed using Scope 4 for the
different fault scenarios indicated below.

35
Figure 3-2. Equivalent Westgate substation layout in MatLAB
(This drawing is shown in a larger print in Appendix A-1 and A-2)
pow
ergui
Discrete,
Ts =
0.0005 s.
Voltage M
easurement2
v+ -
Voltage M
easurement1
v+ -
Voltage M
easurement
v+ -
To W
orkspace1
Capbank
To W
orkspace
CapBank
Three-Phase Source
A B C
Three-Phase Fault
A
B
C
A
B
C
Three-Phase
Parallel RLC Load
A B C
Three-Phase
PI Section LineA B C
A B C
Scope5
Scope4
Scope3
Scope2
Scope1
Scope
RMS8
signal
rms
RMS7
signal
rms
RMS6
signal
rms
RMS5
signalrms
RMS4
signalrms
RMS3
signalrms
RMS2
signal
rmsRMS1
signal
rmsRMS
signal
rms
Parallel RLC Branch
5Parallel RLC Branch
4Parallel RLC Branch
3Parallel RLC Branch
2Parallel RLC Branch
1Parallel RLC Branch
Current Measurement8
i+
-
Current Measurement7
i+
-
Current Measurement6
i+
-
Current Measurement5
i+-
Current Measurement4
i+-
Current Measurement3
i+-
Current Measurement2
i+-
Current Measurement1
i+-
Current Measurement
i+-

36
3.4. MatLAB simulation findings
3.4.1. A three phase fault on the Eltro Feeder as seen by SCB No.2
This simulation recreates the 2007 incident of a close-in three phase (3P) fault at Westgate
substation.
The graph below shows the RMS phase currents for a 3P fault at 1km from Westgate substation,
on the 132kV Eltro feeder. A fault duration of 700ms was used for this simulation as the Eltro
feeder protection failed to operate and clear the feeder fault as expected.
Figure 3-3. SCB No.2: 3P fault, 700ms fault duration 1km from Westgate
The yellow bar indicated on the graph is an approximation of the overcurrent relay pick-up level
of 472A and a time of 200ms to correspond to the overcurrent relay’s definite time delay
setting.
The simulation shows that the overcurrent relay’s definite time element would detect the current
above 472A and would issue a protection operation after the 200ms time delay. This can be seen
for both the red and blue phases.
The instantaneous element of the overcurrent relay was not relevant in this simulation as a
primary current level of 1260A was not reached. This indicates that the instantaneous element
of the relay would not issue a protection operation. A protection operation is commonly referred
to as a trip operation.
This simulation provides some confirmation that an operation of definite time delay element of
the overcurrent relay would be possible i.e. it operated according to the definite time
overcurrent settings for a close-in three phase fault with a 700ms fault duration.
0 100 200 300 400 500 600 700 800 900 10000
100 200 300 400 500 600 700 800 900 1000
Current (A)
Time (ms)
Red phase current White phase current Blue phase current

37
The simulation above was repeated with a 100ms fault duration. This is to show a comparison
of SCB input current in the event that the Eltro feeder protection had operated within 100ms and
cleared the feeder fault as expected. This simulation is shown below in Figure 3-4.
Figure 3-4. SCB No.2: 3P fault, 100ms fault duration 1km from Westgate This simulation indicates that the overcurrent relay would detect the currents above 472A but
would not issue a trip output for a short duration fault and/or if the Eltro feeder protection
cleared the fault in time.
3.4.2. A three phase fault on the Eltro Feeder as seen by SCB No.1
The graph shows the RMS phase currents for a close-in 3P fault on the 132kV Eltro feeder, with
the 700ms fault duration. The current seen by SCB No. 1, seen in Figure 3-5 below, is identical
to the currents as seen by SCB No. 2 in Figure 3-3.
Figure 3-5. SCB No.1: 3P fault, 700ms fault duration at 1km from Westgate
The RMS currents in Figure 3-3 and Figure 3-5 indicate that an overcurrent relay would detect
the current above 472A and would issue a trip after 200ms. This simulation indicates that the
0 100 200 300 400 500 600 700 800 900 10000
100
200
300
400
500
600
700
800
900
1000
Current (A)
Time (ms)
Red phase current White phase current Blue phase current
0 50 100 150 200 250 300 350 400 4500
100
200
300
400
500
600
700
800
900
1000
Time (ms)
Current (A)
Red phase current White phase current Blue phase current

38
overcurrent relay would operate according to the overcurrent protection settings. However, the
GEC CAG39 overcurrent relay utilised by SCB No. 2 did not issue a trip output for the 2007
fault incident at Westgate substation.
The RMS phase current for a close-in 3P fault on the 132kV Eltro feeder, with fault duration of
100ms, is shown above in Figure 3-6.
Figure 3-6. SCB No.1: 3P fault, 100ms fault duration 1km from Westgate This is identical to Figure 3-4 as seen by SCB No.2 and the same findings would apply.
3.4.3. Faults on the 132kV Eltro Feeder
3.4.3.1 Single-phase earth fault
The graph below shows the RMS phase currents for a close-in single-phase earth fault (SLG) on
the 132kV Eltro feeder. A fault duration of 100ms was used as the 700ms fault duration had no
impact on this simulation.
Figure 3-7. SLG fault; 100ms fault duration at 1km from Westgate
0 100 200 300 400 500 6000
100
200
300
400
500
600
700
800
900
1000
Current (A)
Time (ms)
Red phase current White phase current Blue phase current
0 100 200 300 400 500 6000
50
100
150
200
250
300
350
Current
Time (ms)
Red phase current White phase current Blue phase current
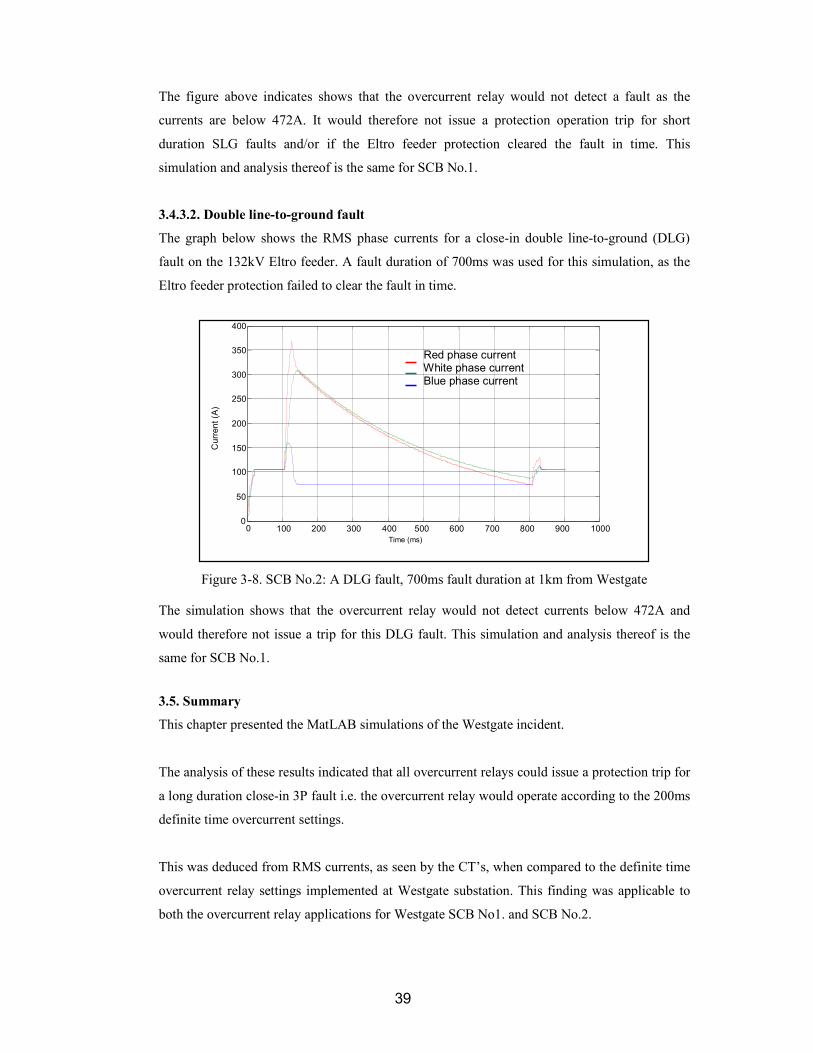
39
The figure above indicates shows that the overcurrent relay would not detect a fault as the
currents are below 472A. It would therefore not issue a protection operation trip for short
duration SLG faults and/or if the Eltro feeder protection cleared the fault in time. This
simulation and analysis thereof is the same for SCB No.1.
3.4.3.2. Double line-to-ground fault
The graph below shows the RMS phase currents for a close-in double line-to-ground (DLG)
fault on the 132kV Eltro feeder. A fault duration of 700ms was used for this simulation, as the
Eltro feeder protection failed to clear the fault in time.
Figure 3-8. SCB No.2: A DLG fault, 700ms fault duration at 1km from Westgate
The simulation shows that the overcurrent relay would not detect currents below 472A and
would therefore not issue a trip for this DLG fault. This simulation and analysis thereof is the
same for SCB No.1.
3.5. Summary
This chapter presented the MatLAB simulations of the Westgate incident.
The analysis of these results indicated that all overcurrent relays could issue a protection trip for
a long duration close-in 3P fault i.e. the overcurrent relay would operate according to the 200ms
definite time overcurrent settings.
This was deduced from RMS currents, as seen by the CT’s, when compared to the definite time
overcurrent relay settings implemented at Westgate substation. This finding was applicable to
both the overcurrent relay applications for Westgate SCB No1. and SCB No.2.
Red phase current White phase current Blue phase current
0 100 200 300 400 500 600 700 800 900 1000 0
50
100
150
200
250
300
350
400
Current (A)
Time (ms)

40
The short duration fault simulations of a close-in 3P fault indicated that the overcurrent relay
would not operate or issue a protection trip signal. This finding was again applicable to both
SCB overcurrent relay applications.
Further MatLAB simulations indicated that no other overcurrent protection operations where
likely for other fault types or locations.
DigSILENT EMT simulations where conducted to compare with the MatLAB results and are
presented in Chapter 4.
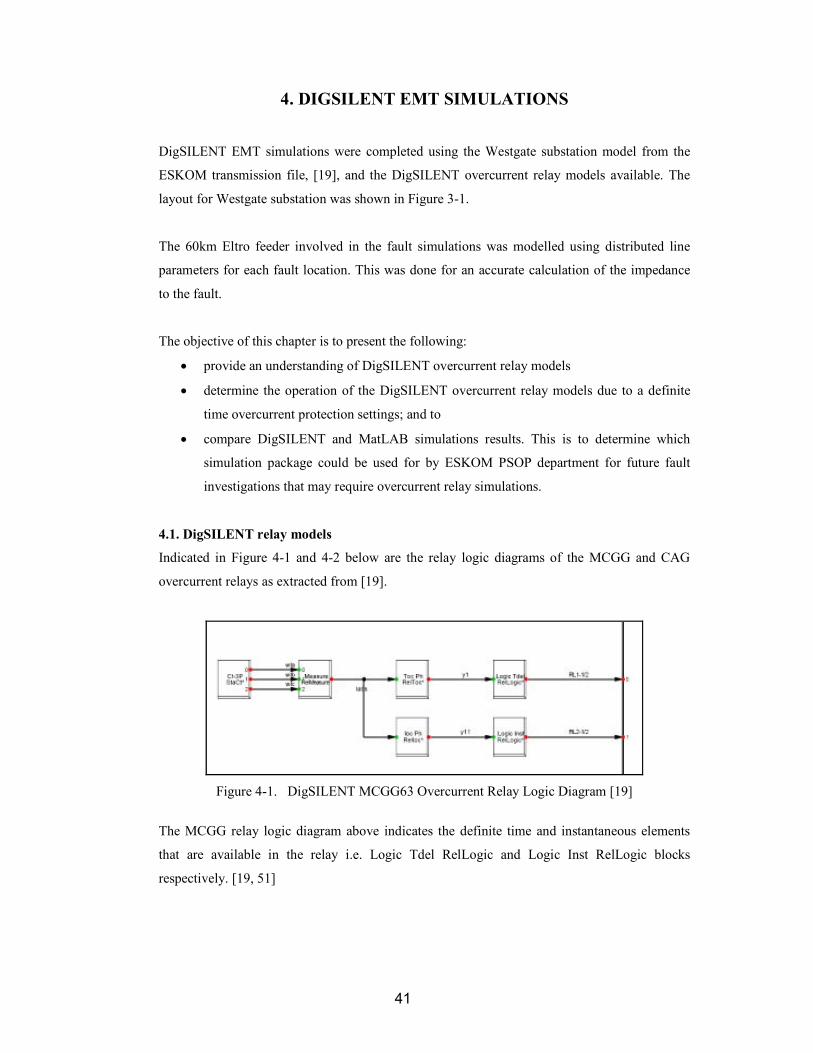
41
4. DIGSILENT EMT SIMULATIONS
DigSILENT EMT simulations were completed using the Westgate substation model from the
ESKOM transmission file, [19], and the DigSILENT overcurrent relay models available. The
layout for Westgate substation was shown in Figure 3-1.
The 60km Eltro feeder involved in the fault simulations was modelled using distributed line
parameters for each fault location. This was done for an accurate calculation of the impedance
to the fault.
The objective of this chapter is to present the following:
• provide an understanding of DigSILENT overcurrent relay models
• determine the operation of the DigSILENT overcurrent relay models due to a definite
time overcurrent protection settings; and to
• compare DigSILENT and MatLAB simulations results. This is to determine which
simulation package could be used for by ESKOM PSOP department for future fault
investigations that may require overcurrent relay simulations.
4.1. DigSILENT relay models
Indicated in Figure 4-1 and 4-2 below are the relay logic diagrams of the MCGG and CAG
overcurrent relays as extracted from [19].
Figure 4-1. DigSILENT MCGG63 Overcurrent Relay Logic Diagram [19]
The MCGG relay logic diagram above indicates the definite time and instantaneous elements
that are available in the relay i.e. Logic Tdel RelLogic and Logic Inst RelLogic blocks
respectively. [19, 51]

42
Figure 4-2. DigSILENT CAG Overcurrent Relay Logic Diagram [19] The CAG relay logic diagram indicates it has an instantaneous element and as such, the
DigSILENT relay model has no time delay setting. [19, 51]
The characteristic curves indicate that the CAG relay model has only an instantaneous setting as
per manufacturer’s manual [19, 43]. The DigSILENT CAG relay model therefore does not have
an associated time delay setting [19].
The DigSILENT MCGG relay model has an instantaneous and a definite time setting, also as
per manufacturer’s manual [19, 23]. However, the definite time delay can only be set up to a
maximum of 100ms [56].
It is also noted, from the CAG and MCGG relay logic diagrams, that these models employ the
same RelMeasure block to measure the input current. This measurement block does not contain
any digital filtering functions. [51]
The output from the RelMeasure block is shown in the figure below.
Figure 4-3. MCGG RelMeasure output [19]

43
This output of the RelMeasure block is identical for both the CAG and MCGG overcurrent relay
models. This suggests that in DigSILENT simulations these relays would measure the input
current in an identical manner. [51, 56]
Therefore, in DigSILENT EMT studies, these relays should operate identically and any
difference in the operation is as a consequence of the definite time delay setting. This is
confirmed below in Figure 4-4 where there is no time delay setting on the MCGG relay model.
This was done so as to compare the MCGG relay model to the instantaneous CAG relay model.
Figure 4-4. DigSILENT CAG and MCGG relay output indications [19]
Figure 4-4 indicates that the CAG and MCGG overcurrent relays trip approximately at the same
time for a 3P fault on the Eltro feeder i.e. 30ms and 35ms respectively. This confirms that the
DigSILENT MCGG and CAG relay models operate identically. [56]
As the DigSILENT relay models could not be set as they were in the Westgate SCB application,
further testing of the DigSILENT relay models was discontinued. The reasons for this were as
follows:
• the DigSILENT CAG relay was modelled as an instantaneous relay as opposed to the
definite time application (with an external timer) at Westgate;
• MCGG relay models has a maximum definite time delay of 100ms, as opposed to the
200ms definite time application at Westgate substation;
• amending the standard DigSILENT relay models, for the detailed analysis of relay
operations and to reflect all differences more precisely, was outside the scope of this
research.

44
4.2. DigSILENT simulations
RMS waveforms obtained from the DigSILENT EMT fault simulations were analysed to
determine if a definite time overcurrent trip operation is likely. This will also be compared to
the RMS waveforms obtained from MatLAB.
Figure 4-5. 3P fault at 1% from Westgate 132kV Busbar (100ms fault duration)
The figure above shows that during a fault application, the SCB discharges itself into the fault.
After this discharge condition, the SCB current stabilises at a lower current level due to the
depressed voltage created by the fault. Once the fault is cleared, the voltage increases to the
nominal busbar voltage and the SCB would recharge back to this voltage.
The above simulation establishes that the fault itself was not the only phenomenon to be
considered when identifying the possibility of an overcurrent relay protection operation in the
SCB environment.
A protection operation could occur in the recharge condition of the SCB. The current can be
seen rising above the 472A pick-up value of the overcurrent relay after the feeder fault has
cleared i.e. in the recharge condition of the SCB.
The fault portion of this simulation, indicated in blue area on the diagram above, can be
compared to the MatLAB simulation indicated in Figure 3-4. The MatLAB simulation,
however, does not indicate the recharge condition of the SCB.
Shunt/Filter 1:m:I:bus1:A A Shunt/Filter 1:m:I:bus1:B B Shunt/Filter 1:m:I:bus1:C C
t/s-0.05 -0.00 0.05 0.10 0.15 0.20 0.25 0.30 0.35
I/kA
0.0
0.5
1.0
Recharge condition Fault application & SCB discharge

45
Shunt/Filter 1:m:I:bus1:A A Shunt/Filter 1:m:I:bus1:B B Shunt/Filter 1:m:I:bus1:C C
t/s-0.05 -0.00 0.05 0.10 0.15 0.20 0.25 0.30 0.35
I/kA
0.0
0.5
1.0
Figure 4-6. L-L fault at 1% from Westgate 132kV busbar
Figure 4-6 above indicates the RMS phase currents for a L-L fault. Again, a protection
operation is very likely as the current exceeds the 472A pick-up setting, in the discharge
condition of the SCB, for the required 200ms definite time delay setting.
Shunt/Filter 1:m:I:bus1:A A Shunt/Filter 1:m:I:bus1:B B Shunt/Filter 1:m:I:bus1:C C
t/s0.00 0.10 0.20 0.30 0.40
I/kA
0.00
0.25
0.50
0.75
1.00
Figure 4-7. DLG fault at 1% from Westgate 132kV busbar
Figure 4-7 above indicates that the overcurrent relay would detect the DLG fault. However, a
trip operation is unlikely as the current does not exceed the 472A pick-up current for the
required 200ms definite time delay setting.
Figure 4-8. SLG fault, 100ms fault duration, 1% from Westgate
Figure 4-8 above indicates that the overcurrent relay would detect the SLG fault. A trip
operation is possible as the current exceeds the 472A pick-up setting for the required 200ms
definite time delay setting.
RED WHITE BLUE
t/s -0.05 -0.00 0.05 0.10 0.15 0.20 0.25 0.30 0.35
I/kA
0.0
0.5
1.0
Time (seconds)

46
The DigSILENT simulations provide an indication that a close-in fault condition (either SLG,
L-L and 3P) can lead to an overcurrent relay operation. This is based on pure RMS current, with
no filtering techniques applied.
4.3. Correlation of MatLAB and DigSILENT results
MatLAB and DigSILENT simulation packages indicated that an overcurrent relay operation
was possible for a close-in 3P fault condition.
Further MatLAB simulations indicated that no other fault condition would result in an
overcurrent relay protection operation. This may be due to the difference between the MatLab
and DigSILENT simulations i.e. MatLab simulations did not indicate the recharge condition of
the SCB.
The DigSILENT simulations, however, did not exclude this possibility in the recharge condition
of the SCB following a SLG, L-L and 3P fault condition.
These finding were deduced from the RMS current, as seen by the phase CT’s, when compared
to the overcurrent relay definite time settings at Westgate substation.
4.4. Summary
This chapter presented the DigSILENT simulations of the 2007 Westgate incident.
As the DigSILENT relay models could not be set as the actual overcurrent relays applied at
Westgate substation, the results obtained from the DigSILENT relay models could not replicate
the actual overcurrent relay’s performance. Adjustments to the standard overcurrent
relay models would be required for the detailed analysis of relay operation, to reflect all
differences in operation more precisely. The DigSILENT overcurrent relay models were
therefore disabled for the external fault simulations.
When compared to the definite time overcurrent relay settings, these DigSILENT simulations
indicated that a relay operation was possible for a close-in 3P fault condition. This would
correlate with the 2007 Westgate incident.
Further DigSILENT simulations indicated that additional overcurrent relay operations were
possible, in the recharge condition of the SCB, following a SLG, L-L and 3P fault condition.

47
To observe the performance of the actual overcurrent relays, DigSILENT fault simulations were
conducted for external fault conditions i.e. various fault types and locations on the Westgate
substation model. The CT inputs to the overcurrent relays, as obtained from these simulations,
were injected into the overcurrent relays applied in ESKOM SCB protection schemes.
The practical injection test findings are presented in Chapter 5.

48
5. PRACTICAL TEST RESULTS
DigSILENT simulations were conducted on the Westgate substation model as available on the
ESKOM Transmission case file [19]. This was repeated on the most common SCB
configurations in the ESKOM transmission network, to determine any difference this could
have as suggested in [58].
These simulations were then injected into the three technologies of overcurrent relays
commonly applied in the ESKOM SCB environment. The injection tests identified protection
operations of the overcurrent relays due to a definite time overcurrent protection settings. This
chapter presents these results from the practical laboratory injection tests.
5.1. ESKOM SCB configurations
The ESKOM transmission network has SCB configurations as indicated in Figure 5-1.
Figure 5-1. ESKOM SCB configurations [44] It is noted that the most prevalent 132kV SCB configurations are of the earthed and unearthed
double star configuration. The simulations produced in DigSILENT were therefore repeated on
these two SCB configurations in the ESKOM environment.
5.2. DigSilent simulation description
5.2.1. Fault type and location detail
Simulations were conducted using DigSilent EMT software. These were injected into
overcurrent relays to assess their performance for external faults and system disturbances in the
SCB environment.

49
The diagram below illustrates the Westgate Substation and indicates the various locations where
the external fault simulations were conducted.
Figure 5-2. Indication of fault locations on earthed SCB simulations [19]
The simulations entailed varying the following:
• fault type i.e. SLG, L-L, DLG and 3P faults;
• fault location on the Eltro feeder, as a percentage of feeder length; and
• faults on the adjacent 275kV, 132kV and 44kV busbars.
Prior to any simulation injections, each relay used was tested to confirm it’s correct operation
and is discussed further in Section 5.3.1.
All of the simulations were repeated for earthed and unearthed SCB configurations.
An Omicron Test Universe set was used to inject the DigSILENT simulations into the
electromechanical, electronic and digital overcurrent relays. This was to determine if all
generations of relays are equally suitable for SCB overcurrent protection.
Westgate- Eltro Feeder (Varying Fault
type & Fault location)
Varying of Fault type & Fault location

50
Each simulation has a pre-fault condition, with the fault occurring at 100ms from the start of the
simulation. The fault is cleared after a further 100ms.
It should also be noted that in the Westgate SCB No.1. overcurrent application, the CAG
instantaneous relay is used together with an external timer providing a 200ms time delay. For
the purposes of the experiment, if the CAG relay ‘pick-up’ output signal was evident for less
than 200ms, it was concluded that the external timer would prevent any trip signal to the SCB
No.1 circuit breaker for this switching event. This is a valid deduction, as the CAG39 relay
would always be used in a definite time configuration in SCB protection applications.
5.3. Practical injection tests
Below are the connection diagrams for the injection testing of the overcurrent and earth fault
relays.
Figure 5-3. Relay input connections for the practical testing
An amplifier was used to accommodate the high SLG and L-L fault currents (on only the red
and white phase) as observed in the DigSilent simulations.
Below is the connection diagram for the overcurrent relay output indications. This was used to
determine the overcurrent relays’ response to the injection testing.

51
Figure 5-4. Relay output connections for the practical testing
Each simulation injection test has an individual test report and comprises of the current
waveform injected and the associated relay output indications. This was saved into a report
format using Omicron Test Universe. Each simulation report can be seen in Appendix B.
5.3.1. Proof of correct overcurrent relay operation
Prior to any simulation injections, each overcurrent relay used was tested to confirm it’s correct
operation i.e. the relay issued a protection trip signal at its pick-up setting value, after the
definite time delay.
An internal fault on the SCB was simulated to test for correct relay operation. The results for
earthed and unearthed SCB configurations are presented in below.

52
5.3.1.1. Unearthed SCB
The overcurrent relay output indications for an internal fault condition on an unearthed SCB is
shown below in Figure 5-5.
Breaker/Switch:m:I:bus1:A A
Breaker/Switch:m:I:bus1:B B
Breaker/Switch:m:I:bus1:C C
t/s0.05 0.10 0.15 0.20 0.25 0.30 0.35 0.40 0.45
I/A
-10.0
-7.5
-5.0
-2.5
0.0
2.5
5.0
7.5
10.0
t/s0.05 0.10 0.15 0.20 0.25 0.30 0.35 0.40 0.45
CDG EF IDMTMCGG PHS INSTMCGG PHS TDCAG Inst PHS
SEL PHSSEL EF
Key Relay Element Description
SEL EF SEL Earth Fault element
SEL PHS SEL Phase element
CAG Inst PHS CAG Instantaneous Phase element
MCGG PHS TD MCGG Phase Time Delay element
MCGG PHS INST MCGG Phase Instantaneous element
CDG E/F IDMT CDG Earth Fault Inverse Definite Mean Time element
Figure 5-5. Unearthed SCB: Internal fault overcurrent relay output indications
For this simulation, the fault occurs at 100ms (0.1s on Figure 5-5). The SEL earth fault element,
the CAG phase instantaneous element (with 200ms external definite time delay) and the MCGG
phase element would issue a correct protection trip signal to the circuit breaker after the 200ms
time delay. This corresponds to their definite time setting.
The SEL phase element, MCGG instantaneous phase element and CDG earth fault element each
issued a correct protection trip indication within 50ms of the fault occurrence.
Figure 5-5. therefore indicates that all overcurrent relays operate as expected, for an internal
fault condition on an unearthed SCB.

53
5.3.1.2. Earthed SCB
The configuration of the bank was changed to an earthed bank and the internal fault simulation
was repeated to confirm the correct operation of the relays. The results are shown in Figure 5-6.
Breaker/Switch:m:I:bus1:A A
Breaker/Switch:m:I:bus1:B B
Breaker/Switch:m:I:bus1:C C
t/s0.05 0.10 0.15 0.20 0.25 0.30 0.35 0.40 0.45
I/A
-10.0
-7.5
-5.0
-2.5
0.0
2.5
5.0
7.5
t/s
0.05 0.10 0.15 0.20 0.25 0.30 0.35 0.40 0.45
CDG EF IDMTMCGG PHS INSTMCGG PHS TDCAG Inst PHS
SEL PHSSEL EF
Key Relay Element Description
SEL EF SEL Earth Fault element
SEL PHS SEL Phase element
CAG Inst PHS CAG Instantaneous Phase element
MCGG PHS TD MCGG Phase Time Delay element
MCGG PHS INST MCGG Phase Instantaneous element
CDG E/F IDMT CDG Earth Fault Inverse Definite Mean Time element
Figure 5-6. Earthed SCB: Internal fault overcurrent relay output indications
For this simulation, the fault occurs at 100ms. The SEL earth fault element, the CAG phase
instantaneous element (with 200ms external definite time delay) and the MCGG phase element
issued a correct protection trip signal to the circuit breaker after the 200ms time delay. This also
corresponds to their definite time setting.
The SEL phase element, the MCGG phase instantaneous and the CDG earth fault element
issued a trip indication within 50ms of the fault occurrence. The overcurrent relay output
indications illustrate that all relays operate as expected.

54
5.4. Unearthed SCB Omicron injection results
The external fault simulations for the unearthed SCB configuration included the following fault
scenarios:
• SLG, L-L, DLG and 3P faults;
• varying the fault location on the Eltro feeder, as a percentage of feeder length;
• placing faults on the adjacent 275kV, 132kV and 44kV Westgate busbars; and
• switching in of a second SCB.
The simulation findings were analysed and are presented below.
5.4.1. Faults on the Eltro Feeder
The table below indicates the overcurrent relay operations for external faults, repeated at various
lengths of the Eltro feeder. The fault location is indicated as a percentage of the feeder length.
Table 5-1. Unearthed SCB: Relay operation for faults on the Eltro feeder
Key: Description
D MCGG Phase (Time Delay)
- No relay operation
For the SCB No.2 overcurrent relay scheme application at Westgate, the MCGG relay operates
for various fault occurrences in the unearthed SCB environment. This relay would issue a trip
signal to its associated circuit breaker for the external faults on feeder as indicated in Table 5-1.
The most onerous fault conditions for the electronic MCGG relay were the close-in 3P fault
simulations. The MCGG relay operates for the 3P external feeder faults up to 20% of the feeder
length away from the Westgate busbar.
The MCGG relay operation in the practical injection tests confirms the 2007 Westgate incident
where this relay tripped for the external 3P fault on the Eltro feeder. The operation of this relay
can be explained due to its sensitivity to the transient current of an external fault in the SCB
vicinity. This discharge current and its frequency were calculated in Section 2.7. and Chapter 2
indicated that the electronic relay would not filter the input current adequately.
Unearthed SCB
Fault type with duration of fault
SLG 100ms
L-L 100ms
DLG 100ms
3P 100ms
Fault location (%
of
feeder)
1% D D - D
10% - D D D
20% - - - D
50% - - - -
98% - - - -
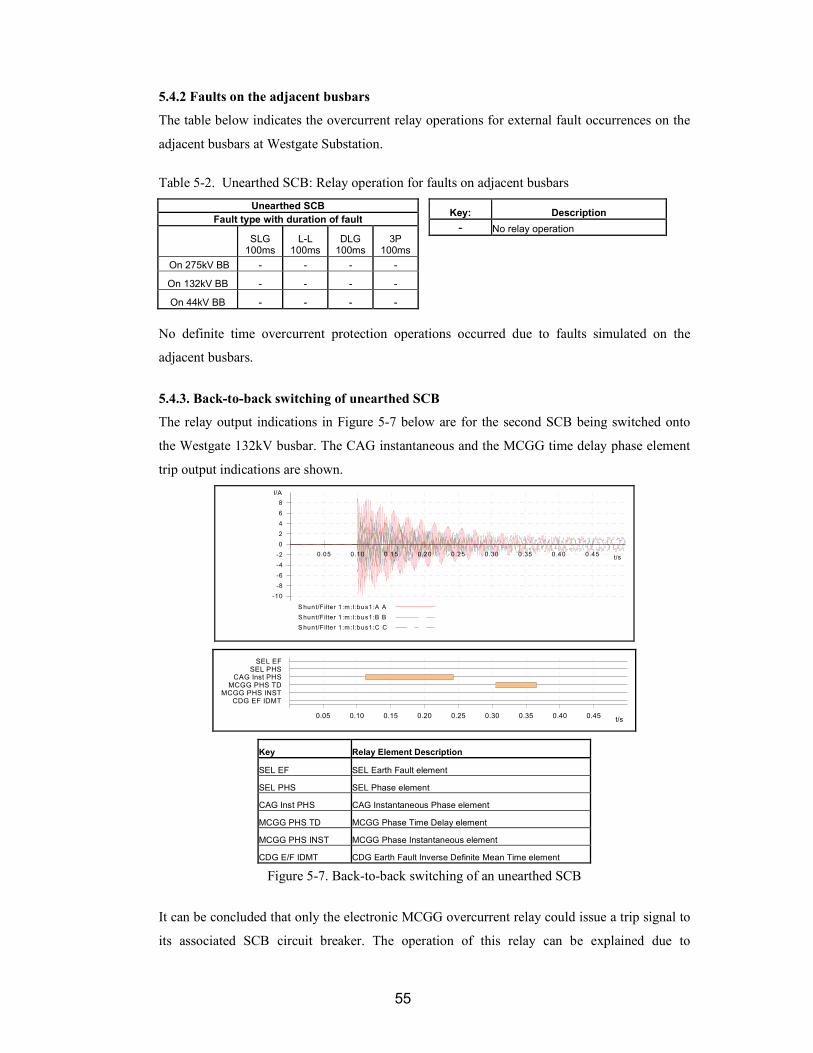
55
5.4.2 Faults on the adjacent busbars
The table below indicates the overcurrent relay operations for external fault occurrences on the
adjacent busbars at Westgate Substation.
Table 5-2. Unearthed SCB: Relay operation for faults on adjacent busbars
Key: Description
- No relay operation
No definite time overcurrent protection operations occurred due to faults simulated on the
adjacent busbars.
5.4.3. Back-to-back switching of unearthed SCB
The relay output indications in Figure 5-7 below are for the second SCB being switched onto
the Westgate 132kV busbar. The CAG instantaneous and the MCGG time delay phase element
trip output indications are shown.
Shunt/Filter 1:m :I:bus1:A A
Shunt/Filter 1:m :I:bus1:B B
Shunt/Filter 1:m :I:bus1:C C
t/s0.05 0.10 0.15 0.20 0.25 0.30 0.35 0.40 0.45
I/A
-10
-8
-6
-4
-2
0
2
4
6
8
t/s0.05 0.10 0.15 0.20 0.25 0.30 0.35 0.40 0.45
CDG EF IDMTMCGG PHS INSTMCGG PHS TDCAG Inst PHS
SEL PHSSEL EF
Key Relay Element Description
SEL EF SEL Earth Fault element
SEL PHS SEL Phase element
CAG Inst PHS CAG Instantaneous Phase element
MCGG PHS TD MCGG Phase Time Delay element
MCGG PHS INST MCGG Phase Instantaneous element
CDG E/F IDMT CDG Earth Fault Inverse Definite Mean Time element
Figure 5-7. Back-to-back switching of an unearthed SCB
It can be concluded that only the electronic MCGG overcurrent relay could issue a trip signal to
its associated SCB circuit breaker. The operation of this relay can be explained due to
Unearthed SCB
Fault type with duration of fault
SLG 100ms
L-L 100ms
DLG 100ms
3P 100ms
On 275kV BB - - - -
On 132kV BB - - - -
On 44kV BB - - - -

56
sensitivity to the transient current of a back-to-back switching event, for its definite time
overcurrent protection settings. The operation of the CAG relay is prevented by its external
timer.
5.4.4 Result analysis of unearthed SCBs
Protection operations were observed from the MCGG electronic relay in the unearthed SCB
environment including a protection operation that corresponds to the 2007 Westgate incident.
This electronic overcurrent relay could provide incorrect tripping output signals for both feeder
faults and for the normal switching event of a second SCB energisation.
The most onerous fault for the unearth SCB is a 3P fault, which can occur up to 20% of the
feeder length away from the SCB.
5.5. Earthed SCB Omicron injection results
The external fault simulations for the earthed SCB configuration include the following fault
scenarios:
• SLG, L-L, DLG and 3P faults;
• varying the fault location on the Eltro feeder, as a percentage of feeder length;
• placing faults on the adjacent 275kV, 132kV and 44kV Westgate busbars; and
• switching in of a second SCB.
The results from these simulations were analysed and are presented below.
5.5.1 Faults on the Eltro Feeder
The table below is a summary of the overcurrent relay operations for fault simulations in the
external fault environment of earthed SCBs.
Table 5-3. Earthed SCB: Relay operation for faults on the Eltro feeder
Key Description
- No relay operation
There were no definite time overcurrent protection operations due to external Eltro feeder faults,
on the earthed SCB configuration.
Earthed SCB
Feeder Faults (Fault type with duration of fault)
SLG
100ms L-L
100ms DLG
100ms 3P
100ms
Fault location
(% o
f fe
eder)
1% - - - -
10% - - - -
20% - - - -
50% - - - -
98% - - - -

57
5.5.2 Faults on the adjacent busbars
The table below is a summary of the overcurrent relay protection operations for fault
occurrences on the adjacent busbars at Westgate Substation.
Table 5-4. Earthed SCB: Relay operation for faults on adjacent busbars
Key Description
D MCGG Phase (Definite Time)
- No relay operation
The above indicates that the definite time element of the MCGG relay would operate for
external fault occurrences on adjacent busbars in the earthed SCB environment, for external
DLG fault on the 275kV busbar at Westgate Substation. This result indicates that the MCGG63
overcurrent relay would be unreliable in the earthed SCB environment for this fault occurrence.
5.5.3 Back-to-back switching of earthed SCB
The back-to-back switching simulation output (shown using Omicron TransView) could not be
injected into the relays due to the high peak value (>20kA) of the transient current as shown in
the figure below.
Shunt/Filter 1:m:I:bus1:A A Shunt/Filter 1:m:I:bus1:B B Shunt/Filter 1:m:I:bus1:C C
t/s-0.04 -0.03 -0.02 -0.01 0.00 0.01 0.02 0.03
I/kA
-20
-10
0
Sh un t/Filter 1:m:I :bus1 :A A Shunt/Fil ter 1 :m: I:bus1:B B Shunt /F ilte r 1:m :I:bus1:C C
t/s-0.04 -0.03 -0.02 -0.01 0.00 0.01 0.02 0.03
I/kA
0.0
1.0
2.0
Figure 5-8. Back-to-back switching of earthed SCB a) Instantaneous currents b) RMS currents
It can be deduced from the RMS current waveforms that the possibility of a definite time
overcurrent relay element issuing a protection operation is low. This is due to the current values
not exceeding 472A for the 200ms required. This setting value was calculated in Section 3.2.1.
Fault type with duration of fault
SLG 100ms
L-L 100ms
DLG 100ms
3P 100ms
On 275kV BB - - D -
On 132kV BB - - - -
On 44kV BB - - - -
a)
b)

58
5.5.4 Result analysis of earthed SCBs
Protection operations were observed from the electronic MCGG overcurrent relay in the earthed
SCB environment. Most alarming is the indication that this overcurrent relay would operate for
a busbar fault on an adjacent 275kV busbar.
5.6. Summary
The injection test results indicated that electronic overcurrent relays operate incorrectly in the
SCB environment for faults on an adjoining feeder and on adjacent busbars.
These practical injection test results also correlated with the 2007 Westgate substation incident.
This incorrect operation of electronic overcurrent relay is seen on the two most common SCB
configurations used in ESKOM i.e. double star unearthed and double star earthed SCBs.
However, the electronic MCGG relay operates for significantly less fault scenarios in the
earthed SCB configuration than for the unearthed SCB configuration.
The CAG relay was also seen to operate for certain fault conditions but it is assumed that no trip
indication would be sent to the associated circuit breaker. This could be attributed to the
external timer and/ or the increased operating time due to harmonics, as suggested in the
literature review. The phenomenon of harmonic susceptibly is investigated further in Chapter 6,
to determine a root cause.

59
6. RELAY FREQUENCY RESPONSE
This chapter presents the frequency response of the relays tested in the practical injection
investigations.
A possible finding of harmonic susceptibility was introduced in the literature review presented
in Section 2.4. Due to incorrect and unexpected relay operation in the practical studies, and the
literature review findings, all the relays were injected to establish their frequency response.
6.1. Relay settings
To produce the frequency harmonic response curves, the relays were tested independently.
The instantaneous pick-up current setting for a single SCB application is 3A. Due the CAG
relay being an instantaneous relay [43], this relay’s settings were changed from its 1.2A definite
time setting to a 3A instantaneous setting. This was done to show a comparison of an
electromechanical instantaneous relay to the electronic relay’s instantaneous element.
Table 6-1: Overcurrent Protection settings Relay type Protection
Description
Relay
Type
Pick-up
Setting
Time Setting
Electromechanical Overcurrent
Instantaneous
GEC
CAG39 3A Instantaneous
Electronic Overcurrent
Instantaneous
GEC
MCGG63 3A Instantaneous
Electronic Overcurrent
Definite Time
GEC
MCGG63 1.2A
0.2 Sec
Digital Overcurrent
Definite Time SEL 1.2A
0.2 Sec
Electromechanical Earth fault GEC
CDG16 0.2A 0.2 Sec
Digital Earth fault SEL 0.2A 0.2 Sec

60
6.2. Relay pick-up current
To produce the graph below, the current injected into the overcurrent relays was increased from
0.1A to the overcurrent relay pick-up setting value. This was done in 0.1A increments in get the
overcurrent relay to issue a protection trip indication. This was repeated at various frequencies
of the injected current.
The maximum current required for the relays to issue a trip was recorded from the Omicron test
Universe and plotted against the frequency of the injected current.
As this test is independent of the Westgate substation model, Figure 6-1 is purely an indication
of the relay’s frequency response i.e. response of the relay to the harmonics at which current is
being injected.
Frequency response of relay
00.51
1.52
2.53
3.5
44.5
0 50 100 150 200 250 300 350 400 450 500 550
Frequency (Hz)
Curr
en
t (A
)
MCGG Ph DT
MCGG Inst
CAG
CDG
SEL Ph
SEL E/F
Figure 6-1: Frequency response of overcurrent relays
The CDG electromechanical relay and the MCGG electronic relay (both phase and earth fault
elements) indicate a general trend of increased pick-up current, as the frequency increases. The
other electromechanical relay, the CAG relay, shows a small decrease in pick-up current for the
increase in frequency.
The results suggest that for input currents that contain harmonics, the CDG and MCGG relay
would trip at a higher current value than its predetermined pick-up current, and the CAG relay
(used as an instantaneous overcurrent relay) would trip for a lower predetermined pick-up
current setting. Both these responses indicate these electronic and electromechanical relays
would be unreliable in a harmonic environment.

61
As the pick-up setting is calculated and should be fixed for each application, this is an
undesirable effect.
The digital SEL overcurrent and earth fault elements both operate only for the 50Hz and 60Hz
current injections. This would be due to the relays dual frequency application around the world.
This relay exhibits no vulnerability to harmonic content of the injected current. This is due to
the anti-aliasing filtering circuits and advanced relay algorithms as described in Section 2.6.
6.3. Relay operation time
To produce the Figure 6-2, the injected current was increased from 0.1A to the overcurrent relay
pick-up setting. This was done in 0.1A increments in so as to get the overcurrent relay to issue a
protection trip indication. This was repeated at various frequencies.
The time for the relay to issue a trip indication was recorded from Omicron test Universe and
plotted against the frequency of the current injected.
Relay operation time (msec) vs. Frequency (Hz)
0
0.1
0.2
0.3
0.4
0.5
0.6
0.7
0.8
0.9
1
0 50 100 150 200 250 300 350 400 450 500 550
Frequency (Hz)
Tim
s (m
s)
MCGG Ph DT time
MCGG Inst time
CAG time
CDG time
SEL Ph time
SEL E/F
Figure 6-2. Relay operation trip time vs. Frequency of injected current
Figure 6-2 is an indication of the influence harmonic content of the injected current has on the
relay operation time i.e. time taken for the relay to issue a trip indication.
The digital SEL relay (both overcurrent and earth fault elements) only issues a trip indication
for the 50Hz and 60Hz current injection simulations. The operation times for the SEL relay to
trip are fairly consistent and therefore this relay exhibits no vulnerability in this harmonic
environment.

62
As the frequency increases, the electromechanical relays (both CDG16 and CAG39) and the
MCGG63 electronic relay all indicate erratic changes in the time taken to issue a protection trip
indication. The general trend seen in Figure 6-2 is that the operation time for these relays
increases.
An increase in operation time indicates the relay would be slow to issue a trip output indication.
This would cause the high frequency fault current to flow for a longer time than necessary and
could cause harm to the relay itself and the SCB it protects.
This further indicates that the electromechanical and electronic relays would be unsuitable in the
SCB external fault environment due their susceptibility to harmonics of the input current.
6.4. Possible application in ESKOM’s transmission network
The composition of electronic, electromechanical and digital relays as applied to the ESKOM
transmission network is extracted from [37] and indicated in Figure 6-3 below.
Figure 6-3: Relay technologies applied in ESKOM Transmission [37]
The MCGG63 electronic relay and electromechanical relays (CAG39 and CDG16) were found
to be susceptible to harmonics. The technology of these relays is widely applied in the ESKOM
transmission network. [37]
Previous incidents where these protection relays have operated incorrectly might be due to the
phenomenon of harmonic susceptibility.

63
6.5. Summary
The frequency response tests indicate that the electronic and electromechanical relays are
susceptible to harmonics of the injected current.
Harmonic frequencies impact both the pick-up current and relay operating time of electronic
and electromechanical overcurrent relays. This indicates that these relays would operate
regardless of the predetermined settings for which these relays have been set. This effect makes
the electronic and electromechanical relays unreliable in a harmonic environment.
It is therefore concluded that the CAG relay did not issue a trip signal to the SCB No.1 circuit
breaker due to the application of the external timer. This would explain its non-operation and
correlates with actual 2007 Westgate incident.
The digital SEL relay (both phase overcurrent and earth fault elements) did not trip for
frequencies outside its dual frequency operation range of 50-60 Hz. This is attributed to it being
insensitive to harmonics with the assistance of advanced filtering circuits.
The SEL digital relay would therefore be the most suitable preference in a SCB harmonic
environment for overcurrent protection purposes.

64
7. RECOMMENDATIONS
The Westgate electronic MCGG relay operated correctly due to its definite time overcurrent
settings i.e. the operation is correct according to its calculated and implemented settings.
However, an overcurrent relay applied in the SCB protection scheme should operate only for an
internal fault [10]. Therefore the setting, and possibly the application, of this electronic
overcurrent relay is not appropriate in the SCB environment.
7.1. Recommendations to address MCGG operation
Recommendations to address the incorrect operation of the electronic MGCC overcurrent for
the Westgate SCB application are presented below.
7.1.1. Do nothing option
As the ESKOM transmission network is designed for N-1 contingencies, the tripping of a single
SCB should not be detrimental to system integrity. Moreover, after such trip event, ESKOM’s
National Control personnel can re-energise the SCB, via supervisory control, once the fault has
been removed from the system and the SCB has sufficiently discharged. The risk, therefore,
may be accepted until refurbishment of protection scheme can be prioritised. [59]
For this option, the Westgate electronic MCGG relay would continue to operate in the external
fault environment of the SCB. Therefore this substation and SCB would need to be included in
ESKOM’s System Operation Guideline (SOG). The SOG identifies known protection issues
and highlights the possibility of sympathy trips to ESKOM personnel. However, this would
apply only if the relay settings can not be adjusted appropriately. [59]
7.1.2. Pick-up current setting
SCBs are designed to carry 130-135% rated load current, at 100% system voltage [12, 55].
When a maximum system voltage of 110% is considered, this SCB rated current would increase
to 143%-148%. [2, 55]
According to [6], the total RMS current of the SCB (including fundamental and harmonic
overvoltage up to and including the maximum system voltage) shall not exceed 180%.
Moreover, IEC 60871-1 indicates that thermal and electrodynamics stresses occur in SCB
transient conditions [55].

65
The Westgate MCGG relay had a pick-up setting of 150% of the rated load, which would meet
the above recommendation [19]. Due to the many factor affecting transients currents, shown in
Section 2.9, the 150% setting should not be increased to prevent unwanted damage to the SCB.
7.1.3. Definite time setting
A 200ms definite time setting is usually applied to overcurrent relays in the SCB application to
prevent relay operation during transient conditions [6, 10].
The simulations and injection tests indicated that this existing 200ms definite time delay would
not prevent the operation of the Westgate electronic MCGG relay. The operation of the relay is
due to the 472A pick-up value being present for the 200ms definite time delay, in the SCB
recharge condition, which occurs after an external fault is removed.
Most alarming was the operation of this relay for a feeder fault, with a fault duration of 100ms.
This would indicate that the relay would operate even though the feeder protection scheme
operates correctly and removes this fault within its allotted timeframe.
These findings indicate that if this electronic overcurrent relay is to be applied correctly in the
SCB environment, the definite time of this relay would have to be increased. This could prevent
this relay operation for external fault occurrences, and the transients of the SCB recharge
condition when these faults are removed. These fault occurrences were identified in Chapter 4
and Chapter 5.
From the simulations conducted, the minimum definite time delay required to prevent the
Westgate MCGG relay operation was identified as 300ms. This was seen for a SLG fault
occurrence in Section 4.2, Figure 4-8. However, this would need to be confirmed by injection
testing for this fault simulation. Also, any definite time setting change should also take into
account the SCB manufacturers’ recommendations regarding their thermal withstand limits.
7.1.4. Replacement of the MCGG relay
If the settings of the Westgate electronic MCGG relay remain as is, this relay could continue to
operate in the external fault environment of the SCB, especially for close-in 3P and short
duration fault occurrences.

66
If the relay settings cannot be appropriately amended for the SCB environment, this relay
should be replaced with a digital overcurrent relay, as is currently implemented in the ESKOM
transmission network [58].
7.1.5. IDMT curve application
ESKOM philosophy for SCB overcurrent protection has historically applied the overcurrent
relay with a definite time setting [6, 10].
However, overcurrent settings for SCB applications in Australian utilities use a standard IDMT
curve with a 1.5 PS and a 0.1-0.2 TM, which prevents the operation of the overcurrent relay for
transient conditions [60].
As the MCGG63 relay has IDMT functionality, [23], this could be explored to determine if this
could prevent the incorrect operation of this relay. However, this would need to be confirmed in
practical injection tests of the Westgate MCGG relay.
7.2. Summary
The Westgate electronic MCGG relay operated incorrectly for an external fault in the SCB
environment, due to its definite time overcurrent settings. Therefore the setting, and possibly the
application, of this electronic overcurrent relay are not appropriate in the SCB environment.
Recommendations to address the incorrect operation of the Westgate electronic MGCC
overcurrent relay were presented, including amending the definite time setting of the relay.
However this would need to be confirmed in practical studies, and take into account the SCB
manufacturers’ recommendations regarding its thermal withstand limits.
If the Westgate electronic MCGG overcurrent relay settings cannot be appropriately amended
for the SCB environment, this relay should be replaced with a digital overcurrent relay, as is
currently implemented in the ESKOM transmission network.

67
8. CONCLUSIONS
8.1. Westgate incident findings
MatLAB simulations for the 2007 incident indicated that all technologies of overcurrent relays
could operate for a close-in 3P fault on the Eltro feeder. Further MatLAB simulations conducted
indicated that no other overcurrent relay operations were possible, when compared to the
overcurrent relay definite time settings.
The DigSILENT simulation for a close-in 3P fault condition also indicated that an overcurrent
relay operation was possible. Further simulations, however, indicated that overcurrent relay
operations were possible in the recharge condition of the SCB following a SLG, L-L and 3P
fault condition.
A further difference between the MatLAB and DigSILENT simulations were that the MatLAB
simulation results did not indicate the recharge condition of the SCB when faults were cleared.
The use of the DigSILENT relay models to predict, or repeat, the Westgate relay operation was
not successful. This is because the DigSILENT relay models could not be set as the actual
overcurrent relays applied at Westgate substation. The standard DigSILENT relay models
would have to be amended in detail to replicate the actual overcurrent relay’s performance.
Practical injection tests confirmed the 2007 Westgate incident on SCB No.2, which was due to
the MCGG electronic relay operation for the 3P external fault on the Eltro feeder. It also
indicated that the MCGG relay operates for 3P external feeder faults up to 20% of the feeder
length away from the Westgate busbar. These tests also indicated that electronic MCGG
overcurrent relays operate incorrectly in the SCB environment for short duration external faults.
These incorrect operations were observed on the two most common SCB configurations, though
these are significantly less in the earthed SCB configuration.
The operation of this MCGG electronic relay, under the external fault conditions tested, makes
the MCGG electronic relay unsuitable for application in the SCB environment.
An increase in the definite time settings could prevent the operation of this relay, but requires
confirmation from injection tests. If the setting change does not prevent the incorrect operation
for external and short duration faults, these relays should be replaced, preferably with digital
relays.

68
The electromechanical CAG relay did not send a trip signal to the SCB No.1 circuit breaker due
to the definite time application of an external timer. This would explain its non-operation and
correlates with the actual 2007 Westgate incident.
The digital SEL and electromechanical CAG overcurrent relays did not operate incorrectly in
the practical injection tests and therefore indicate they are reliable in the SCB environment.
8.2. Discussion of possible problem areas
Due to the literature review findings, frequency response tests were conducted. These
demonstrated that the electronic GEC MCGG63 and electromechanical GEC CAG39
overcurrent relays were susceptible to harmonics.
Harmonic frequencies impact both the pick-up current and relay operating time of electronic
and electromechanical overcurrent relays. This indicates that these relays would operate,
regardless of the predetermined settings for which these relays have been set. Therefore the
application of simple electronic and electromechanical overcurrent relays in a harmonic
environment is problematic due to frequency susceptibility.
The digital SEL relay (phase overcurrent and earth fault elements) did not trip for frequencies
outside its dual frequency operation range of 50-60 Hz. This is attributed to it being insensitive
to harmonics with the assistance of advanced filtering circuits.
It is concluded that the solution to prevent mal-operations due to harmonics in the SCB
environment, and possibly the larger ESKOM power system network, is to apply overcurrent
relays that have suitable filtering to remove the transient harmonics from the input waveform.
Therefore digital relays would be the most suitable in the SCB environment for overcurrent
protection applications.
8.3. Philosophy and guidelines for overcurrent relays on SCBs
The application of advanced, harmonic restrained digital overcurrent relays would be the most
appropriate for ESKOM’s transmission SCB environment.
Newly commissioned overcurrent protection schemes on SCBs should be immune to the fault
scenarios highlighted in this report, due to digital technology presently being applied in
ESKOM. It would be the older SCB overcurrent protection schemes, with electronic overcurrent
relays, that could be at risk of incorrect operations.

69
Recommendations were made in order to prevent the operation of the electronic MCGG relay
operation for external faults in the SCB environment. The setting changes recommended for the
MCGG relay would have to be confirmed in practical tests, and take into consideration the SCB
and relay thermal withstand levels. This relay could also be replaced with a digital relay to
prevent incorrect operation.
8.4. Summary of report findings
The report findings can be summarised as follows:
• DigSilent EMT studies would be the most appropriate to determine transient behaviour;
• The practical injection tests confirmed the electronic MCGG relay operation for the
2007 Westgate incident;
• The CAG relay (with the external timer providing a definite time setting) and the digital
SEL relay proved to be reliable in the SCB environment;
• DigSILENT relay models for the electronic MCGG and electromechanical CAG relay
could not be set as they were applied at Westgate substation;
• Modern digital relays have advanced sampling and filtering circuits while electronic
relays have simple filter circuits. Electromechanical relays have no special filtering
circuits. It is therefore concluded that the technology of the overcurrent relay
determines its vulnerability to harmonics.
• The switching events of a single SCB, back-to-back switching events and external faults
in the SCB vicinity gives rise to harmonics. These switching and fault events could
cause incorrect protection operations in harmonic susceptible overcurrent relays applied
in SCB applications;
• Electronic and electromechanical overcurrent relays in harmonic environments could
operate incorrectly due to frequency susceptibility; and
• The MCGG relay could be replaced with a digital relay, or an appropriate overcurrent
setting could be determined in practical testing.
8.5. Further research study prospect
A further research prospect would be to verify the harmonic response of all electronic
overcurrent protection relays currently employed in the ESKOM transmission SCB
environment.
This further research could include an investigation into the various overcurrent relay
manufacturers and the year of manufacture. This is to determine if the manufacturer, or the age
of the relay, plays any role in the operation of these overcurrent relays. The harmonic sensitive
relays identified in this further research should be earmarked for replacement, preferably with
digital relays.

70
REFERENCES
[1] Horowitz SH and Phadke AG: “Power System Relaying”, 2nd Edition, Research
Studies Press Ltd., England, 1995
[2] Brunello G, Kasztenny B and Wester C: “Shunt Capacitor Bank Fundamentals and
Protection”, 2003 Conference for Protection Relay Engineers, Texas, April 2003
[3] “Protective Relays Application Guide”, 3rd Edition, ALSTOM T&D Protection and
Control, 1987
[4] “Network Protection & Automation Guide”, Chapter 3, ALSTOM T&D Protection and
Control, 2003
[5] Mason CR: “The Art & Science of Protective Relaying”, Chapter 1, obtained via
http://www.gedigitalenergy.com/multilin/notes/artsci/index.htm
[6] “Protection Philosophy: Shunt Capacitor Banks”, ESKOM Distribution Standard,
February 1998
[7] ‘Technology Reference for Power Capacitor Applications and Protection”, ESKOM
Transmission Guideline, September 1994
[8] Gopakumar G, et al: “Shunt Capacitor Bank Switching Transients: A Tutorial and Case
Study”, Michigan Technological University, USA
[9] Dalci KB, Yumurtaci R, Bozkurt A: “Harmonic Effects on Electromechanical
Overcurrent Relays” Yildiz Technical University, Turkey, 2005
[10] “Protection Settings Philosophy for Transmission and Sub-Transmission Grids”,
ESKOM Transmission Operation Philosophy, February 2006
[11] “EPRI Power System Dynamics Tutorial”, 1001983, EPRI, Palo Alto, CA, 2002
[12] “IEEE Guide for Application of Shunt Power Capacitors”, IEEE, USA, 1993
[13] Blackburn JL, Domin TJ: “Protective Relaying Principles and Application”, 3rd Edition,
CRC Press, 2006
[14] “Network Protection & Automation Guide”, Chapter 7, ALSTOM T&D Protection and
Control, 2003
[15] IEC 871-3 ‘Shunt Capacitors for AC Power Systems having a rated voltage above
1000V, Part 3: Protection of Shunt capacitors and Shunt capacitor banks”; 1996
[16] “Network Protection & Automation Guide”, Chapter 9, ALSTOM T&D Protection and
Control, 2003
[17] Hewitson LG, Brown M and Balakrishnan R: “Practical Power System Protection”,
Chapter 9, Newnes, 2004
[18] Greenwood A: “Electrical Transients in Power Systems”, 2nd Edition, Chapter 3 & 4;
John Wiley & Sons, New York, 1991

71
[19] ESKOM Transmission DigSILENT file: TX Master Project 2008_10_20.dz (Available
using DigSILENT software)
[20] Mason CR: “The Art and Science of Protective relaying”, Chapter 2, obtained via
http://www.gedigitalenergy.com/multilin/notes/artsci/index.htm
[21] CIGRE 305: “Guide For Application of IEC 62271-100 and IEC 62271-1”, Part 2,
Page 79-117, October 2006
[22] Anderson, PM: “Power System Protection”, Chapter 3 and 4, IEEE Press, New York,
1999
[23] MCGG Relay manual
[24] IEEE WGI10 Power System Relaying Committee: “Understanding Microprocessor-
based Technology Applied to Relaying”, IEEE, 2004
[25] http://www.selinc.com/SEL-387/ accessed October 2008
[26] Schweitzer EO, Kumm JJ, Feltis MW: “Negative Sequence Overcurrent Element
Application and Coordination in Distribution Protection”, IEEE, 1992
[27] Yumurtaci R, Gulez K, Bozkurt A, Kocatepe C & Uzunoglu M: “Analysis of Harmonic
Effects on Electromechanical Instantaneous Overcurrent Relays with Different Neural
Network Models” Yildiz Technical University, Turkey, 2005
[28] Srivastava D: “Switching Studies for the Islington Substation Capacitor Bank with
Surge Arrestors’, New Zealand, 2006
[29] http://www.shreemcapacitors.com accessed November 2008
[30] http://www.ece.mtu.edu.com accessed November 2008
[31] Irizarry MF, Vélez TE: “Mitigation of Back-to-Back Capacitor Switching Transients on
Distribution Circuits”, PREPA, Puerto Rico
[32] “Harmonic Testing of Protective Relays”, Wichita State University Power Quality Lab,
USA, 1994
[33] “Fundamental Relay Operating Principles and Characteristics”, Chapter 2,
[34] Horowitz SH and Phadke AG: “Power System Relaying”, 3rd Edition, Chapter 2,
Research Studies Press Ltd., England, 2008
[35] ESKOM’s Power System Operations Protection Settings database
[36] SEL Relay manual
[37] Bartylak A: “Evaluation of Weak Infeed Tripping Technique on the ESKOM
Transmission Network”; CIGRE Committee B5 Colloquium, September 2005
[38] Rostron J: Outrush Reactors of Capacitor Banks, Georgia USA
[39] Peelo DF: “Current Interrupting Capability of Air Break Disconnect Switches”, IEEE
Transactions on Power Delivery, vol. PWRD-1, No. 1, January 1986.
[40] www.abb.com accessed May 2009

72
[41] ESKOM’s Transmission Incident Protection Performance System (TIPPS) database,
November 2008
[42] CDG Relay manual
[43] CAG Relay manual
[44] Personal email from Neels van Staden (ESKOM Capacitor Technology Consultant)
containing SCB (shunt capacitor bank) information regarding configurations applied in
ESKOM, Transmission, October 2008
[45] MatLab software
[46] www.cooperpower.com accessed January 2009
[47] www.nepsi.com accessed January 2009
[48] Kulas SJ: “Capacitor Switching Techniques”, ICREPQ, Spain, 2009
[49] “Improved Reliability of Switched Capacitor Banks and Capacitor Technology”, EPRI
Technical Report, Palo Alto, CA, 2004, 1002154
[50] Declaration as per “Essential requirements for the preparations of Dissertations and
Theses”, November 2009
[51] “Digital measurement block”, DigSILENT Technical Documentation, Germany, 2009
[52] “Measurement block”, DigSILENT Technical Documentation, Germany, 2009
[54] “Power Quality and Utilisation Guide - Voltage Disturbances”, Clause 6, Leonardo
ENERGY, June 2007
[55] IEC 60871-1 “Shunt Capacitors for AC Power Systems having a rated voltage of above
1000V”, Third edition, 2005
[56] Personal email from Alberto Borgnino (DigSILENT protection specialist) regarding the
operation of DigSILENT relay models, November 2009
[57] Grebe TE: “Application of Distribution System Capacitor Banks and Their Impact on
Power Quality”, IEEE Transactions on Industry Applications, Vol 32, No.3, May/June
1996
[58] Constable RM, van Staden N: “Improvements in the Performance of HV Shunt
Capacitor Banks”, 2008/9
[59] Personal email from Adam Bartylak, ESKOM Corporate Protection Consultant,
regarding the recommendations made, November 2009
[60] Moor B: “Fundamental Principles of Power System Protection”, September 2009

73
APPENDIX
Appendix Item Page
Appendix Table 73
MatLAB model layout for simulations A-1 and A-2
DigSILENT Westgate substation layout A-3
Input connections for the overcurrent relays in the practical
injection testing A-4
Output connections for the overcurrent relays in the
practical injection testing A-5
DigSILENT relay logic diagrams [51, 52] A-6
ESKOM Shunt capacitor bank information [44] A-7 and A-8
Shunt capacitor bank information extracted from TIPPS
database [41] A-9
Simulation listing B
Omicron reports for simulation injection tests B1-B67
List of equipment B68

A-1
Westgate Models used for Simulations on MatLAB Model includes unearthed capacitor banks with a source and oscilloscopes to view RMS and instantaneous current waveforms.
Blue Oval (Top right): Fault on Eltro feeder (10 October 2007 Incident); Green Oval (Bottom left): RMS values of currents seen by CTs of all 3 phases
powergui
Discrete,Ts = 0.0005 s.
Voltage Measurement 2
v+-
Voltage Measurement 1
v+-
Voltage Measurement
v+-
To Workspace1Capbank
To WorkspaceCapBank
Three -Phase Source
A
B
C
Three -Phase Fault
A B CA B C
Three -PhaseParallel RLC Load
A
B
C
Three -PhasePI Section Line
A
B
C
A
B
C
Scope 5
Scope 4
Scope 3
Scope 2
Scope 1Scope
RMS8
signalrms
RMS7
signalrms
RMS6
signalrms
RMS 5
signal rms
RMS 4
signal rms
RMS 3
signal rms
RMS 2
signalrms
RMS 1
signalrms
RMS
signalrms Parallel RLC Branch 5Parallel RLC Branch 4Parallel RLC Branch 3Parallel RLC Branch 2Parallel RLC Branch 1Parallel RLC Branch
Current Measurement 8
i+ -
Current Measurement 7
i+ -
Current Measurement 6
i+ -
Current Measurement 5
i+
-
Current Measurement 4
i+
-
Current Measurement 3
i+
-
Current Measurement 2
i+
-
Current Measurement 1
i+
-
Current Measurement
i+
-

A-2
Simulations on MatLAB: Model of Westgate Substation with Hera- Westgate feeder incident
Blue Oval (Top right): Fault on Eltro feeder (10 October 2007 Incident) Pink Oval (Top left): Fault on Hera-Westgate feeder (13 October 2004 Incident) Green Oval (Bottom left): RMS values of currents seen by CTs of all 3 phases
powergui
Discrete,Ts = 0.0005 s.
Voltage Measurement 2
v+-
Voltage Measurement 1
v+-
Voltage Measurement
v+-
To Workspace1CapBank
Three -Phase Source 3
A B C
Three -Phase Source 2
A
B
C
Three -Phase Source 1
A
B
C
Three -Phase Fault 1
A B CA B C
Three -Phase Fault
A B CA B C
Three -PhaseTransformer
(Three Windings )1
A
B
C
a2
b2
c2
a3
b3
c3
Three -PhaseTransformer
(Three Windings )
A
B
C
a2
b2
c2
a3
b3
c3
Three -PhaseParallel RLC Load 1
A B C
Three -PhasePI Section Line 3
A
B
C
A
B
C
Three -PhasePI Section Line 2
A
B
C
A
B
C
Three -PhasePI Section Line 1
A
B
C
A
B
C
Three -PhasePI Section Line
A
B
C
A
B
C
Scope 5
Scope 4
Scope 3
Scope 2
Scope 1Scope
RMS8
signalrms
RMS7
signalrms
RMS6
signalrms
RMS 5
signal rms
RMS 4
signal rms
RMS 3
signal rms
RMS2
signalrms
RMS1
signalrms
RMS
signalrms Parallel RLC Branch 5Parallel RLC Branch 4Parallel RLC Branch 3Parallel RLC Branch 2Parallel RLC Branch 1Parallel RLC Branch
Current Measurement 8
i+ -
Current Measurement 7
i+ -
Current Measurement 6
i+ -
Current Measurement 5
i+
-
Current Measurement 4
i+
-
Current Measurement 3
i+
-
Current Measurement 2
i+
-
Current Measurement 1
i+
-
Current Measurement
i+
-

TRANSMISSION INCIDENT PROTECTION PERFORMANCE DATABASE Download 01/05/2008
Westgate Capacitor Bank No. 1 Station: Westgate Busbar voltage: 132 Bay: Cap 1
MVA rating 72 MVar VTRATIO:- 132 /110 Trfr VCR Voltage Setting 132
Capacitor unit type:- Westing Corp Externally Fused Cap. elements in II P= 1 Arrangement in Can Cap. element rows r =1 Arrangement in Can Num. of Cap. units in II per stack c = 9 Num. of stacks in series 4 Capacitor unit ratings: In = 17.48 Cn = 3.06 Un = 19.053 On = 333 Dr = 1.9 Ce =
Maximum Fault Current = 20584.5
Westgate Capacitor Bank No.2 Station: Westgate Scheme No: 2CB0200 Busbar voltage: 132 kV Drawing No: 0.18/17276
Bay: Capacitor Bank 2 Double Star
MVar rating 72 MVar VT RATIO:- 132000/ 110 VTR = 1200 Trfr VCR Voltage Setting 134 kV Capacitor unit type:- Westing Corp Externally Fused Cap. elements in II P= 1 Cap. element rows r =1 Num. of Cap. units in II per stack c =' 9 Num. of stacks in series 4 Capacitor unit ratings: In = 17.42 Amp. Cn = 2.9 micro farad Un = 19.053 On = 333 KVAr Dr = 1.9 Meg. ohm Ce =
Maximum Fault Current: 15585.0 Amp
A-3

j:. I
~
Red Phase
White Phase
Btue Phase
Neutral
DC
+ -······1·········· ......... . · . · . · . ·
13 : ,14 0
b1 22 t--t:' 2Il2
I
r 23 24 ID3" 104
Is 6. I
7 B
19 ~ 10 • I ~ ~ E ZD6
CAG39 MCGG63 SEl387
AmpllOer R
;1 N
Iw I I
I ,8
-Omicron
:::c I'D -= ~ t')
0 Positive = = Negative
I'D t') .... .... 0
= ~
Q.. .... = (JC ., = a QI ., .... =-I'D
"0 ., = t')
~ t')
CDG16 = -s· .... I'D t') .... .... 0
= .... I'D ~ .... .... = ~ ..... = "0
= lal>toP
.... t')
0
= roigSilent Simulations
= I'D t') .... .... 0
= ~

Relay connections diagram for the practical injection testing: Output connections
~
;- t: ... 0 ~ a. l": • ~ 0::
c ~ 0 ~ ... ~ ........ .., -Q ... E u _0
-,..... ~ fB
,.... to") 0 ~ ~
~ LoU -::J <5 (/) 0_ .,
T . .i..
" U ~
M
~ ~ ("'\I
"'i't u ~ Rl~
....,. "q"
1 r I r - ;-
:
~L-=! I - - -
A-5
C 0 ... ~ -E 0

DigSILENT MCGG63 Overcurrent Relay Logic Diagram Extracted from [19, 51]
o~----'.:.j'"
~~ 't-----7.:j!o+,.,;;::.:;~~-___1~___+ J:r:'. ~--,-Y-,-' ----I'" ~1·112
~_....:..Y_l1 --l ... ~~L~~:);-__ ..;,.:fU.::...I/2""--_ ....
DigSILENT CAG Overcurrent Relay Logic Diagram Extracted from [19, 51]
3 loc Ph:
A-6

Capacitor Manufacturer Voltaae Nominal Output Confiauration Aae Neutral Apollo Filter 1 ABBJWestingcorp 275 300 Single Star 0 Yes Apollo Filter 2 ABBIWestingcorp 275 300 Single Star 0 Yes
Apollo 1A Westingcorp 275 150 Double Star 11 Yes Apollo 1B Nokia 275 134 Double Star 33 Yes Apollo 2A HTSA 275 150 Double Star 6 Yes Apollo 2B Nokia 275 134 Double Star 33 Yes Acacia 1 ABB 132 72 H 12 Yes Acacia 2 ABB 132 72 H 12 Yes Acacia 3 ABB 132 72 H 12 Yes Ararat 1 ASEA 88 48 Double Star 20 No Ararat 2 ASEA 88 48 Double Star 18 No
Ararat 11 ASEA 275 144 Double Star 25 No Ariadne 1 HVT 132 72 Double Star 1 Yes Ariadne 2 HVT 132 72 Double Star 1 Yes
Athene Filter 1 Westingcorp 132 94 Double Star 13 Yes Athene Filter 2 Westingcorp 132 94 Double Star 13 Yes Athene Filter 3 Westingcorp 132 94 Double Star 13 Yes Athene Filter 11 HVT 400 100 H 0 Yes
Aurora 1 HVT 132 72 Double Star 0 Yes Bacchus 1 HVY 132 72 Double Star 0 Yes Bacchus 2 HVY 132 72 Double Star 0 Yes Aurora 2 HVT 132 72 Double Star 0 Yes Bernina 1 ASEA 132 72 Double Star 27 No Beta 11 HVT 400 100 Single Star 1 Yes Beta 12 HVT 400 100 Single Star 1 Yes
Bighorn 1 Westingcorp 275 142 Single Star 6 Yes Buffalo 1 ASEA 132 36 Double Star 23 No Carmel 1 Westingcorp 132 72 Double Star 27 No Eiger 1 ASEA 88 48 Double Star 25 No Eiger 2 ASEA 88 48 Double Star 25 No
Esselen 11 HVT 275 150 H 0 Yes Everest 1 Westingcorp 132 72 Double Star 29 No Everest 2 Westingcorp 132 72 Double Star 29 No Foskor1 ASEA 132 72 Double Star 26 No Foskor 2 ASEA 132 72 Double Star 26 No
Georgedale 1 ASEA 132 66 Double Star 20 No Grassridge 1 ASEA 132 36 Double Star 24 No Grassridge 2 Westingcorp 132 36 Double Star 19 No Grassridge 3 Westingcorp 132 72 Double Star 11 Yes Grassridge 4 Westingcorp 132 72 Double Star 11 Yes
Hector 2 Westingcorp 275 150 Single Star 11 Yes Hector 4 Westingcorp 275 150 Single Star 11 Yes
Hermes 11 Westingcorp 88 , 48 Double Star 20 No Hermes 2 Westingcorp 132 72 Double Star 20 No Hermes 3 Westingcorp 132 72 Double Star 20 No Hydra 11 HVT 400 100 Single Star 1 Yes Hydra 12 HVT 400 100 Non-PCB 1 Yes lIIovo 1 ASEA 132 66 Double Star 19 No IIlovo 2 ABB 275 100 H 13 Yes
Impala 1 Westingcorp 132 80 Double Star 13 Yes Impala 2 Westingcorp 132 80 Double Star 13 Yes Impala 3 Westingcorp 132 80 Double Star 13 Yes Impala 4 ABB 275 100 H 13 Yes Jupiter 1 Westingcorp 88 48 Double Star 20 No Jupiter 2 Westingcorp 88 48 Double Star 20 No Jupiter 3 Westingcorp 275 150 Single Star 13 Yes Jupiter 4 Westingcorp 275 150 Single Star 13 Yes
A-7

Komatipoort 1 Westingcorp 132 33 Single Star 23 Yes Leander 2 ASEA 132 36 Double Star 23 No Leseding 1 Westingcorp 132 72 Double Star 2 Yes Leseding2 Westingcorp 132 72 Double Star 2 Yes Marang 1 Westingcorp 88 48 Double Star 2 Yes Marang 2 Westingcorp 88 48 Double Star 2 Yes Merapi 1 Westingcorp 132 36 (72) Double Star 16 Yes
Merensky 1 HTSA 132 63 Double Star 7 Yes Mercury 1 ASEA 132 72 Double Star 17 No Mercury 2 ASEA 132 72 Double Star 17 No
Mercury 11 HVT 275 150 Single Star 0 Yes Mercury 12 HVT 275 150 Single Star 0 Yes Mersey 1 HVT 275 150 Single Star 0 Yes Mersey 2 HVT 275 150 Single Star 1 Yes Midas 2 Westingcorp 132 72 Double Star 20 No
Minerva 1A ASEA 275 131 Double Star 28 No Minerva 1B ASEA 275 146 Double Star 28 No Minerva 2A Westingcorp 275 150 Single Star 2 Yes Minerva 2B Westingcorp 275 150 Single Star 2 Yes
Muldersvlei 1 ABB 132 72 H 12 Yes Muldersvlei 2 ABB 132 72 H 12 Yes Muldersvlei 3 ABB 132 72 H 12 Yes Muldersvlei 4 HVT 132 72 Double Star 0 Yes Muldersvlei 5 Westingcorp 400 100 Single Star 12 Yes Normandie 1 HVT 88 48 Double Star 1 Yes
Oranjemond 2 Nokia 66 15 H 33 No Pembroke 1 ASEA 132 36 Double Star 24 No Pembroke 2 ASEA 132 36 Double Star 24 No Perseus 2 HVT 400 100 Single Star 1 Yes Perseus 4 HVT 400 100 Single Star 1 Yes
Pieterboth 1 ASEA 88 48 Double Star 25 No Pluto 1A ASEA 275 144 Double Star 28 No Pluto 1B ASEA 275 156 Double Star 28 No
Princess 1 ASEA 88 48 Double Star 25 No Proteus 1 HVT 132 72 Double Star 0 Yes
Rigi 1 ASEA 88 48 Double Star 23 No Rigi 2 ASEA 88 48 Double Star 23 No
Stikland 1 Westingcorp 132 72 Double Star 18 Yes Stikland 2 Westingcorp 132 72 Double Star 18 Yes Stikland 3 Westingcorp 132 72 Double Star 18 Yes Spitskop 1 ASEA 88 48 Double Star 27 No Spitskop 2 ASEA 88 48 Double Star 17 No Spitskop 3 Westingcorp 132 36 Double Star 17 No Taunus 1 Westingcorp 132 72 Double Star 20 No Theseus 1 Westingcorp 132 72 Double Star 18 No Trident 1 ASEA 88 48 Double Star 25 No Trident 2 ASEA 88 48 Double Star 17 No
Umfolozi 1 HVT 88 48 Double Star 1 Yes Venus 1 ABB 275 150 H 0 Yes Vulcan 1 Westingcorp 132 72 Double Star 18 No Vulcan 2 ASEA 132 72 Double Star 22 No
Watershed 1 ASEA 88 48 Double Star 21 No Westgate 1 Westingcorp 132 72 Double Star 21 No Westgate 2 Westingcorp 132 72 Double Star 19 No
Witkop 1 ASEA 132 36 Double Star 25 No Witkop 2 HTSA 132 72 Double Star 4 Yes
A-a
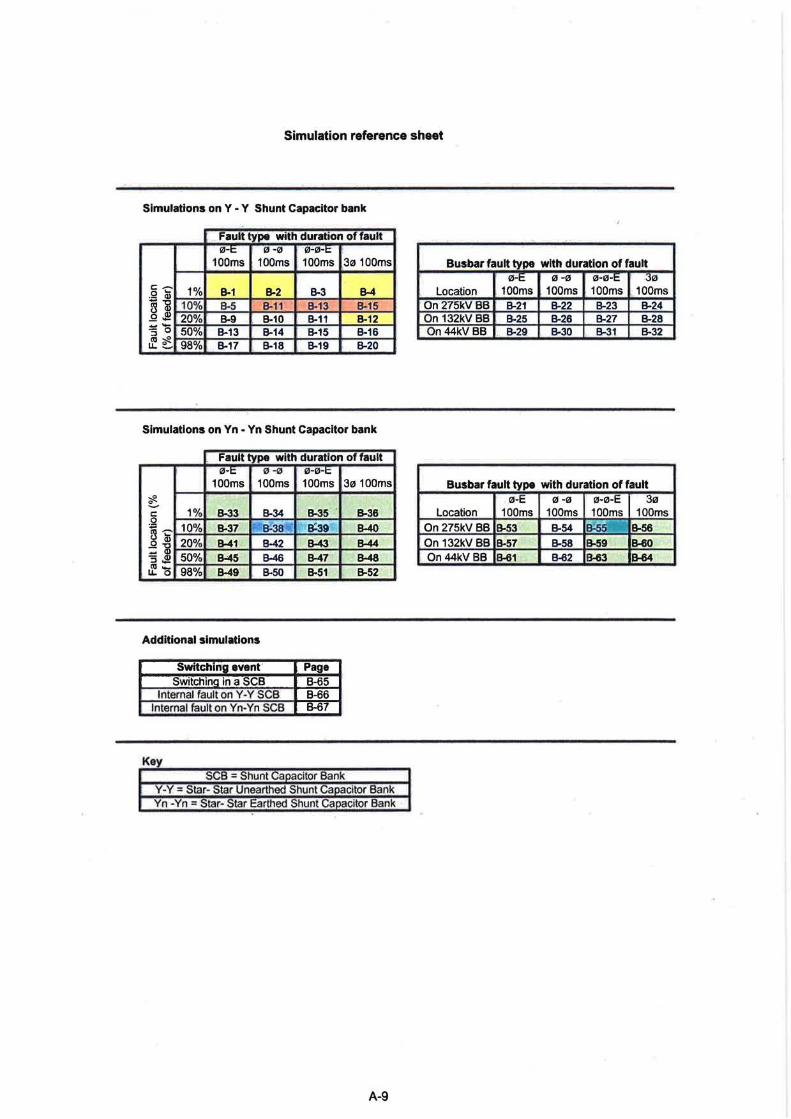
Simulation reference sheet
Simulations on Y - Y Shunt Capacitor bank
Fault typtt with duration offault 1Il-t: 121 -121 I/i-l/i-t:
100ms 100ms 100ms 30100ms Busbar fault type with duration of fault 12I-t: 121 -121 0-12I-t: 3121
c: ~ 1% 8-1 8-2 8-3 8-4 o ...
• - Q)
~a! 10% 8-5 8-11 8-13 8!15 .Q.2! 20% 8-9 8-10 8-11 8-12
Location 100ms 100ms 100ms 100ms On 275kVBB 8-21 8-22 8-23 8-24 On 132.kV BB 8-25 8-26 8-27 8-28
3'0 50% 8-13 8-14 8-15 8-16 afc 98% 8-17 8-18 8-19 8-20 On 44kVBB 6-29 8-30 8-31 8-32
Simulations on Yn - Yn Shunt Capacitor bank
Fault type with duration of fault 0-t:. 0-0 0-0-t:
100ms 100ms 100ms 30100ms Busbar fault type with duration of fault ;,g ~
8-35 ' c: 1% 8-33 8-34 8-36 :8 10% 8-37 I;' \lJ!3~t"'J ~a:39- B-4O ~~ o Q) 20% 8-41 8-42 B-43 B-44 =a! 50% 8-45 B-46 8-47 B-48 3.2! (11_
98% 8-49 8-50 8-51 8-52 ~ 0
(;J-E I'/J -0 IIH!l-E 3121 Location 100ms 100ms 100ms 100ms
On 275kV BB 8-53 8-54 D' '''~ 8-56 On 132kV BB 8-57 8-58 8-59 8-60 On 44kV BB 8-61 8-62 8-63 B-64
Additional simulations
5witchlngevent· Page Switching in a SCB B-65
Internal fault on V· V SCB 8-66 Internal fault on Yn-Vn SCB 6-67
Key SCB = Shunt Capacitor 8ank
V-y - Star- star Unearthed Shunt Capacitor Bank Yn -Yo = Star- Star Earthed Shunt Capacitor 8ank
A-9

revana.tra
Data source: Path: D:\DOCUMENTS AND SETTINGS\STANDBy\MY DOCUMENTS\REVANA\WESTGATESIMS\ File: 1%OFLlNE1P.CFG
Info: DlgSILENT PowerFactory
Time Signal: Measurement no.:
If A
5 4 3 2
o -I-'l1"4"'tfTIlrrl+r.\:mAAf'T -1 -2
-3 -4 -5
SELEF SELPHS
CAG Inst PHS
ShuntJFilter 1:m:l:bus1:A A
ShuntJFilter 1:m:l:bus1:B B --
ShuntJFilter 1:m:l:bus1:C C - - - -
MCGGPHSTD ~ MCGG PHS INST
COG EF IDMT i
0.05 0.10 0.15 0.20 0.25 0.30 0.35 0.40 0.45 tis

revana.tra
Data source: Path: D:\DOCUMENTS AND SETTINGS\STANDBy\MY DOCUMENTS\REVANA\WESTGATESIMS\ File: 1%OFLlNE2P _SOHMS.CFG Info: DlgSILENT PowerFactory
Time Signal: Measurement no.:
I/A
10.0 7.5 5.0
2.5
, I I.
0.0 -If\:!-fJ.;'MWmWrlQ.~r""k*¥~~""* -2.S
-5.0 -7.5
-10.0 -12.5 -15.0
SELEF SEL PHS
CAG Inst PHS
Shunt/Filter 1 :m:l:bus1:A A
Shunt/Filter 1:m:l:bus1:B B ---
Shunt/Filter 1:m:l:bus1:C C - - - -
MCGGPHSTD ~ MCGG PHS INST
CDG EF IDMT i 0.05 0.10 0.15 0.20 0.25 0.30 0.35 0.40 0.45 t/s

revana.tra
Data source: Path: D:\DOCUMENTS AND SETIINGS\STANDBy\MY DOCUMENTS\REVANA\WESTGATESIMS\ File: 1 %OFLlNE2PE_20HMS.CFG Info: DlgSILENT PowerFactory
Tim. Signal: Measurement no.:
ItA
10
-10
-15
SELEF SELPHS
CAG InstPHS MCGGPHSTD
MCGG PHS INST COG EFIDMT
Shunt/Filter 1:m:l:bus1:A A
Shunt/Filter 1:m:l:bus1:B B ---
Shunt/Filter 1:m:l:bus1:C C - - - -
0.05 0.10 0.15 0.20 0.25 0.30 0.35 0.40 0.45 t/s

revana.tra
Data source: Path: D:\DOCUMENTS AND SETIINGS\STANDBy\MY DOCUMENTS\REVANA\WESTGATESIMS\
File: 1%OFLlNE3P _50HMS.CFG
Info: DlgSILENT PowerFactory
Time Signal: Measurement no.:
If A
5.0
2.5
0.0 -Air..Ar.I-N\f;A,i7-I'rA/--'~+rtJt,Aj.jIt-A-'W,M4
-2.5
-5.0
-7.5
-10.0
-12.5
SELEF SEL PHS
CAG InstPHS
Shunt/Filter 1 :m:l:bus1:A A
Shunt/Filter 1:m:l:bus1:B B -
Shunt/Filter 1 :m:l:bus1:C C - - - -
MCGG PHS TO c=::::::J1-----MCGG PHS INST
COG EF IDMT
0.05 0.10 0.15 0.20 0.25 0.30 0.35 0.40 0.45 tis
B- 4
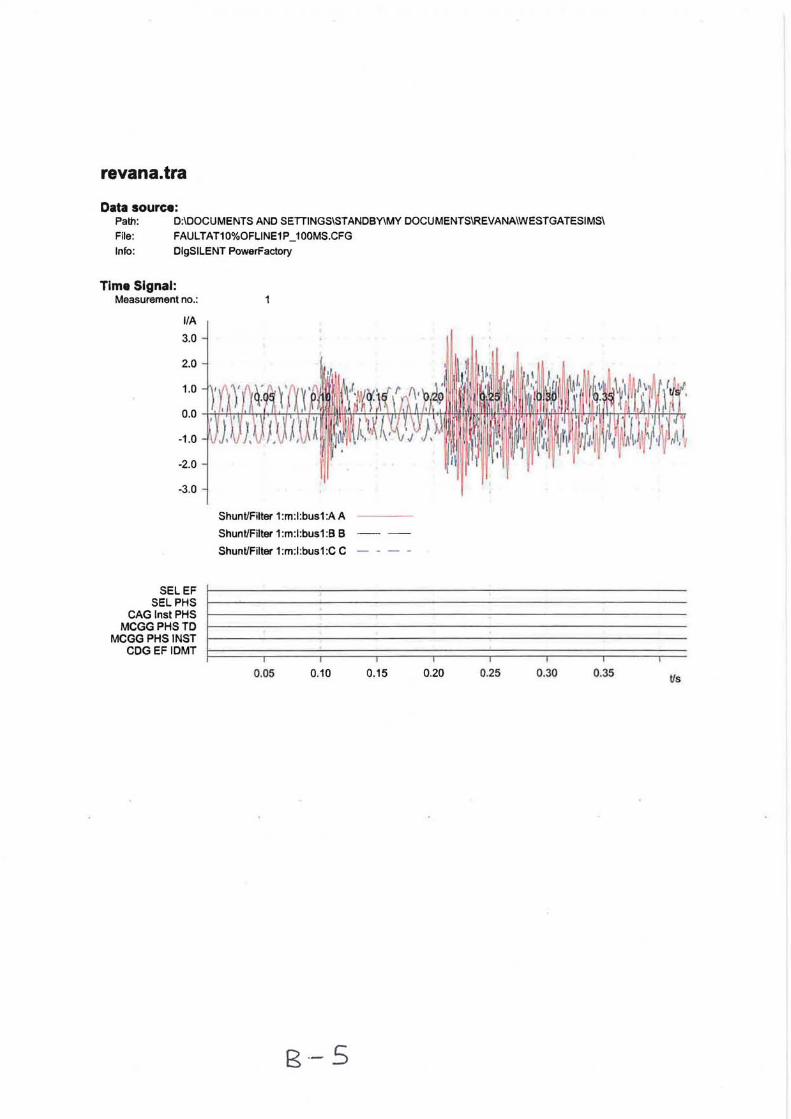
revana.tra
Data source: Path: D:IDOCUMENTS AND SETIINGSISTANDBy\MY DOCUMENTSIREVANAIWESTGATESIMSI File: FAULTAT10%OFLINE1P _100MS.CFG Info: DlgSILENT PowerFactory
Time Signal: Measurement no.:
SELEF SELPHS
CAG Inst PHS MCGGPHSTD
MCGG PHS INST CDGEF IDMT
Shunt/Filter 1 :m:l:bus1:A A
Shunt/Filter 1 :m:l:bus1:B B
Shunt/Filter 1 :m:l:bus1:C C
0.05 0.10
B-- 5
0.15 0.20 0.25 0.30 0.35 t/s
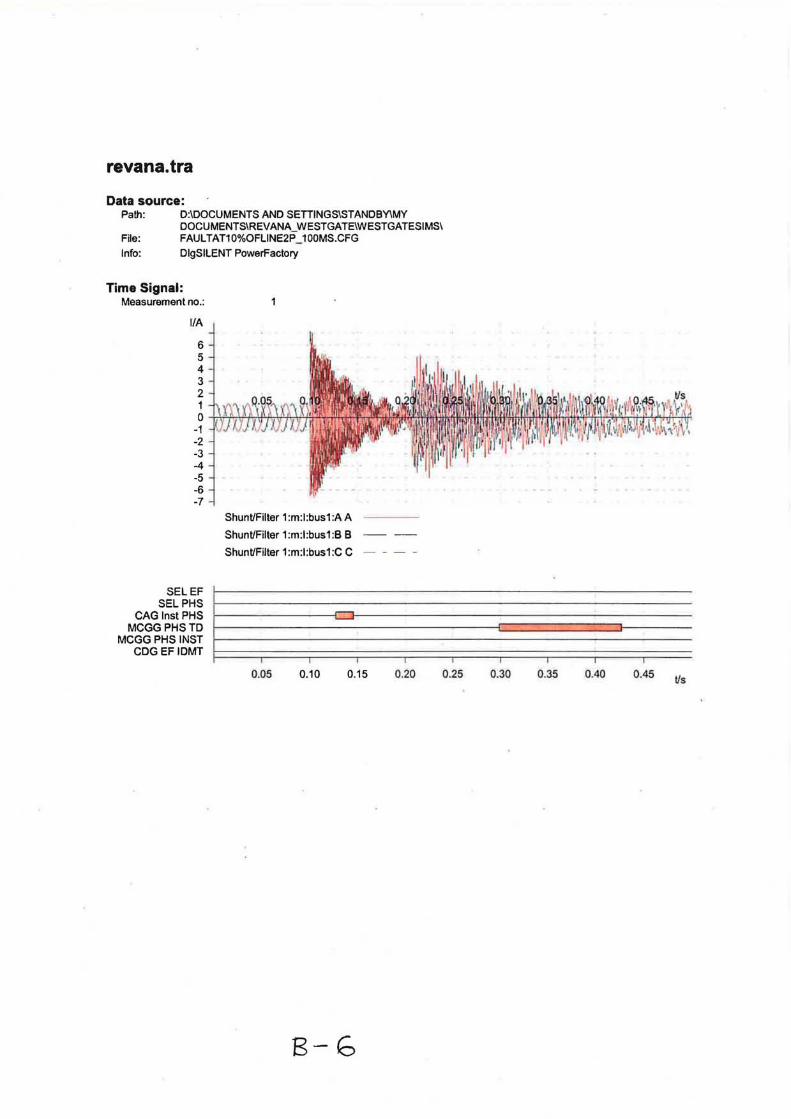
revana.tra
Data source: Path: D:\DOCUMENTS AND SETIINGS\STANDBy\MY
DOCUMENTS\REVANA_WESTGATE\WESTGATESIMS\ File: FAULTAT10%OFLINE2P _100MS.CFG Info: DlgSILENT PowerFactory
Time Signal: Measurement no.:
If A
6 5 4 3 2 1 O -+.'t;i-'-/+;''tf'+..-\I4WMf'+&lDf-;JJl-ri
-1 -2 -3 -4 -5 -6 -7
Shunt/Filter 1 :m:l:bus1:A A
Shunt/Filter 1:m:l:bus1:B B ---
Shunt/Filter 1:m:l:bus1:C C - - - -
SELEF SEL PHS
CAG Inst PHS MCGGPHSTD
MCGG PHS INST CDGEFIDMT
r_----------1~r_-----------------------------
0.05 0.10 0.15 0.20 0.25 0.30 0.35 0.40 0.45 lis
B-b

revana.tra
Data source: Path: D:\DOCUMENTS AND SETIINGS\STANDBy\MY
DOCUMENTS\REVANA WESTGATE\WESTGATESIMS\ File: FAUL TA T1 0%OFLlNE2PE_1 OOMS.CFG Info: DlgSILENT PowerFactory
Time Signal: Measurement no.:
If A
6 5 4 3 2 1 O +.\i¥r.J~,Jd!-fW.p"J;j~Jl1.i.:.WI-nf
-1 -2 -3 -4 -5 -6 -7
ShuntlFilter 1 :m:l :bus1 :A A
Shunt/Filter 1:m:l:bus1:B B ---
Shunt/Filter 1:m:l:bus1:C C - - - -
SELEF SELPHS
CAG Inst PHS MCGGPHSTO
MCGG PHS INST COG EFIOMT
0.05
c:J
0.10 0.15 0.20
8-7
0.25 I~
0.30 0.35 0.40 0.45 tis

revana.tra
Data source: Path: D:IDOCUMENTS AND SETIINGSISTANDBy\MY
DOCUMENTSIREVANA_WESTGATEIWESTGATESIMSI File: FAULTAT10%OFLlNE3P _100MS.CFG Info: DlgSILENT PowerFactory
Time Signal: Measurement no.:
IIA
6
4
2
o -I-r\,r'tN\N\-'\P"rr-hu\-\JP+!Jf
-2
-4
·6
-8
Shunt/Filter 1:m:l:bus1:A A
Shunt/Filter 1:m:l:bus1:B B
Shunt/Filter 1:m:l:bus1:C C
SELEF SEL PHS
CAG Inst PHS MCGGPHSTD
MCGG PHS INST COG EFIOMT
~-----------------=------~==~~
0.05 0.10 0.15 0.20 0.25 0.30 0.35 0.40 0.45 tis
8 .- ~
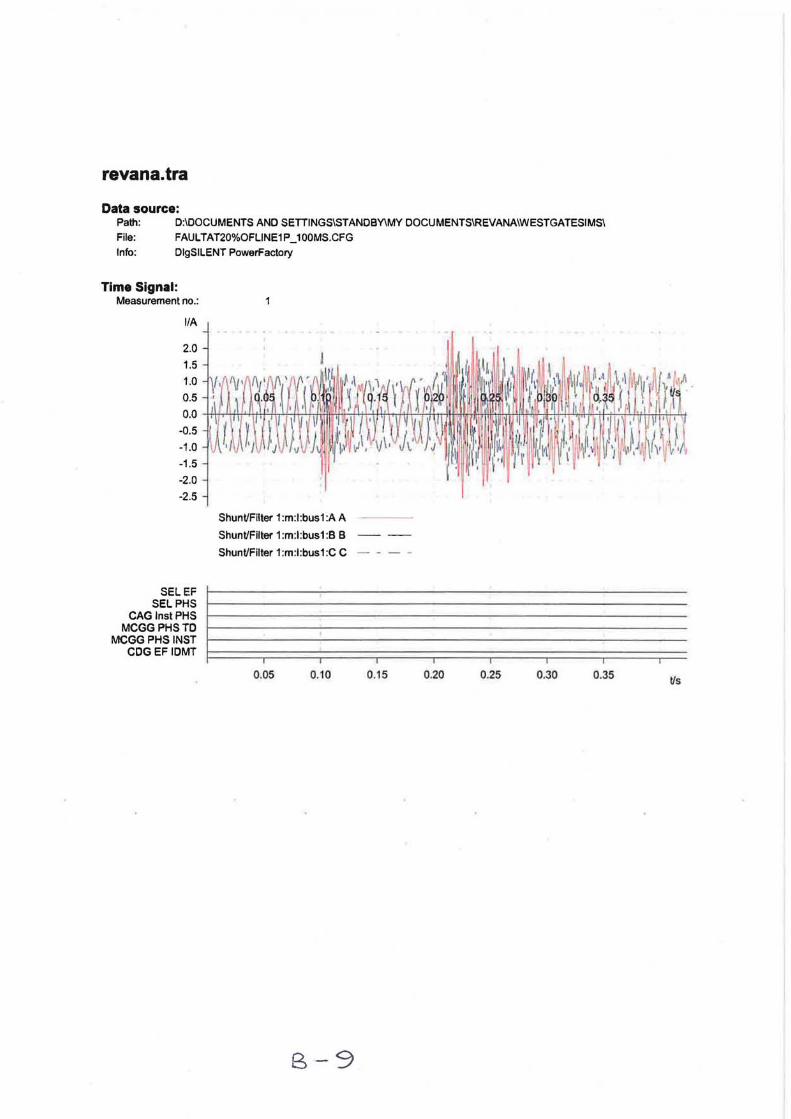
revana.tra
Data source: Path: D:\DOCUMENTS AND SETIINGS\STANDBy\MY DOCUMENTS\REVANA\WESTGATESIMS\ File: FAULTAT20%OFLlNE1P _100MS.CFG Info: DlgSILENT PowerFactory
Time Signal: Measurement no.:
If A
2.0
1.5
1.0
0.5
O.O ~~~~~~Tm~**~~~rTfm~~~~~~H+~~~~~~~
-0.5
-1 .0
-1.5
-2.0
-2.5
SELEF SELPHS
CAG InstPHS MCGGPHSTO
MCGG PHS INST COG EF IOMT
ShuntlFilter 1:m:l:bus1 :A A
ShuntlFilter 1:m:l:bus1:B B -
ShuntlFilter 1:m:l:bus1:C C - - - -
0.05 0.10 0.15
B-9
0.20 0.25 0.30 0.35 tis

revana.tra
Data source: Path: D:IDOCUMENTS AND SETTINGSISTANDBYIMY DOCUMENTSIREVANAIWESTGATESIMSI File: FAULTAT20%OFLlNE2P _100MS.CFG Info: DlgSILENT PowerFactory
Time Signal: Measurement no.:
If A
4
3
2
-1
-2
-3
-4
-5
SELEF SEL PHS
CAG Inst PHS MCGG PHSTD
MCGG PHS INST COG EFIDMT
Shunt/Filter 1 :m:l:bus1:A A
Shunt/Filter 1 :m:l:bus1:B B
Shunt/Filter 1 :m:l:bus1:C C
0.05 0.10
B -10
0.15 0.20 0.25 0.30 0.35 tis
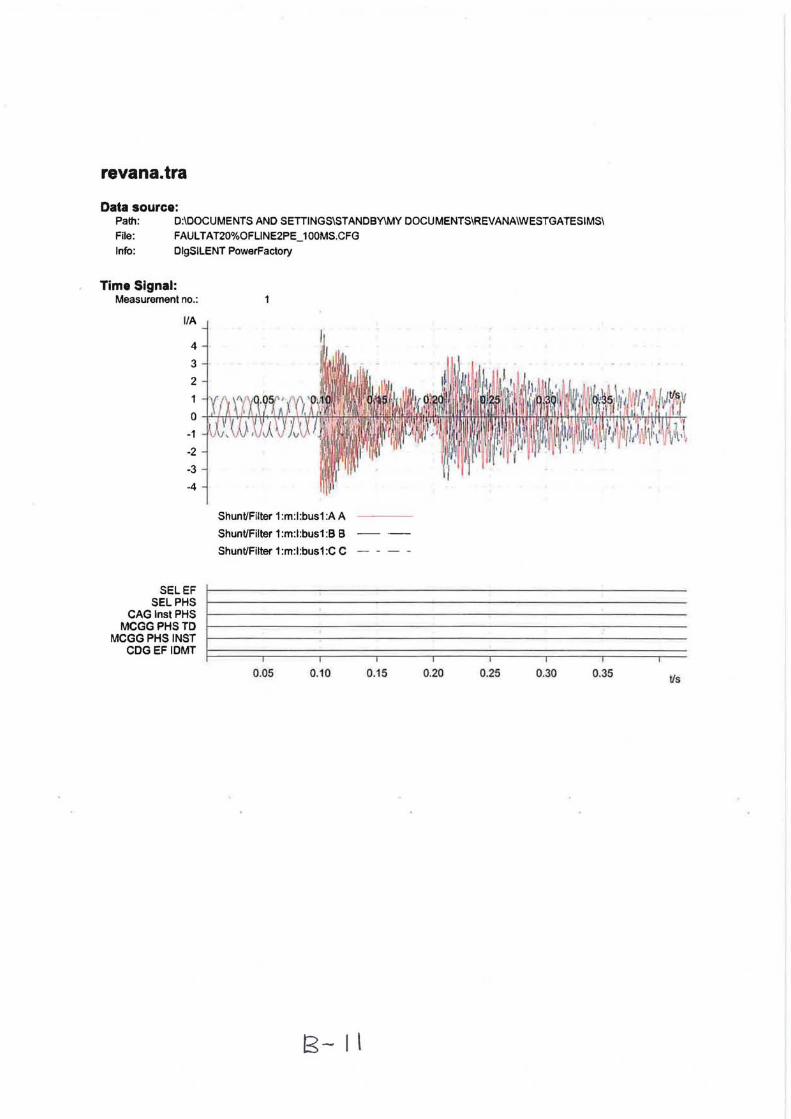
revana.tra
Data source: Path: D:IDOCUMENTS AND SETTINGSISTANDBy\MY DOCUMENTSIREVANAIWESTGATESIMS\ File: FAUL TAT20%OFLlNE2PE_100MS.CFG Info: DlgSILENT PowerFactory
Time Signal: Measurement no.:
ItA
4
3
2
O -+"ntl-:-l+-+I+\f+.'Jrf+f-rI-'I-f\+
-1
-2
-3
-4
Shunt/Filter 1 :m:l:bus1 :A A
Shunt/Filter 1:m:l:bus1:B B ---
Shunt/Filter 1:m:l:bus1:C C - - - -
SELEF SELPHS
CAG Inst PHS MCGGPHSTD
MCGG PHS INST CDGEF IDMT
0.05 0.10 0.15
B- 1\
0.20 0.25 0.30 0.35 t/s

revana.tra
Data source: Path: D:\DOCUMENTS AND SETTINGS\STANDBy\MY
DOCUMENTS\REVANA WESTGATE\WESTGATESIMS\ File: FAUL TAT20%OFLlNE3P_1 OOMS.CFG Info: DlgSILENT PowerFactory
Time Signal: Measurement no.:
itA
4
3
2
o ...p.Hl:f'ri-T\:-r/i1'T:4T'"'H'oM':l1
-1
-2
-3
-4
-5
Shunt/Filter 1 :m:l:bus1:A A
Shunt/Filter 1:m:l:bus1:B B
Shunt/Filter 1:m:l:bus1:C C
SELEF SELPHS
CAG Inst PHS MCGGPHSTD
MCGG PHS INST CDGEF IDMT
r-------------------------------------------------~~r-----
0.05 0.10 0.15 0.20 0.25 0.30 0.35 0040 0045 t/s
B-Il

revana.tra
Data source: Path: D:\DOCUMENTS AND SETTINGS\STANDBy\MY DOCUMENTS\REVANA\WESTGATESIMS\ File: FAULTAT500/00FLlNE1P_ 100MS.CFG Info: DlgSILENT PowerFactory
Time Signal: Measurement no.:
ItA
1.5
1.0
0.5
0.0 -h-f~M*-:frI+-+.fl-+.-f+ft:tL~-:-H+f~!-lI+r+!-f.t.!+ftH-H-4l!lRJW4.!H-!.f+H!I41-1-j.,.!.hJJ.!..r+!.,.f.!.4..j..,!..L,.H+I.&.i~+
-0.5
-1.5
SELEF SEL PHS
CAG InstPHS MCGGPHSTO
MCGG PHS INST
Shunt/Filter 1 :m:l:bus1:A A
Shunt/Filter 1:m:l:bus1:B B -
Shunt/Filter 1:m:l:bus1:C C - - - -
COG EF IOMT I====::::::=;;::::====;:====:=;::::====::::;::::====:::;::::::====::::;:=====::;:::::=====:;;:=:=:. 0.05 0.10 0.15 0.20 0.25 0.30 0.35 t/s
13·-13

revana.tra
Data source: Path: D:\DOCUMENTS AND SETIINGS\STANDBy\MY DOCUMENTS\REVANA\WESTGATESIMS\ File: FAULTAT50%OFLlNE2P _100MS.CFG Info: OlgSILENT PowerFactory
Time Signal: Measurement no.:
SELEF SELPHS
CAG Inst PHS MCGGPHSTD
MCGG PHS INST COG EFIDMT
Shunt/Filter 1 :m:l:bus1:A A
Shunt/Filter 1:m:l:bus1:B B ---
Shunt/Filter 1:m:l:bus1:C C - - - -
0.05 0.10 0.15
B-ILt
0.20 0.25 0.30 0.35 t/s

revana.tra
Data source: Path: D:\DOCUMENTS AND SETIINGS\STANDBy\MY DOCUMENTS\REVANA\WESTGATESIMS\ File: FAUL TAT500/00FLINE2PE_1 OOMS.CFG Info: DlgSILENT PowerFactory
Time Signal: Measurement no.:
SELEF SELPHS
CAG Inst PHS MCGGPHSTD
MCGG PHS INST CDGEF IDMT
Shunt/Filter 1 :m:l:bus1:A A
Shunt/Filter 1 :m:l:bus1:B B
Shunt/Filter 1 :m:l:bus1:C C
0.05 0.10 0.15
8-- \5
0.20 0.25 0.30 0.35 t/s

revana.tra
Data source: Path: O:\OOCUMENTS AND SETTINGS\STANOBy\MY OOCUMENTS\REVANA\WESTGATESIMS\ File: FAULTAT50%OFLlNE3P _100MS.CFG Info: OlgSILENT PowerFactory
Time Signal: Measurement no.:
SELEF SEL PHS
CAG Inst PHS MCGGPHSTD
MCGG PHS INST COG EF IOMT
Shunt/Filter 1:m:l:bus1:A A
Shunt/Filter 1:m:l:bus1:B B - --
Shunt/Filter 1:m:l:bus1:C C - - - -
0.05 0.10 0.15 0.20 0.25 0.30 0.35 tJs

revana.tra
Data source: Path: D:\DOCUMENTS AND SETIINGS\STANDBy\MY DOCUMENTS\REVANA\WESTGATESIMS\ File: FAULTAT98%OFLlNE1P _100MS.CFG Info: DlgSILENT PowerFactory
Time Signa': Measurement no.:
Shunt/Filter 1:m:l:bus1:A A
Shunt/Filter 1:m: l:bus1:B B -
Shunt/Filter 1 :m:l:bus1:C C - - - -
SELPHS t-----------------------SEL EF I CAG Inst PHS 1----:-----,------------------
MCGG PHSTD 1----------------------MCGGPHS INST 1-----------------------
COG EF IDMT ~: ====::;:::::====;:====::::;:=====;::===::::::;::====::;::::::===:::;:====::::;== 0.05 0.10 0.15 0.20 0.25 0.30 0.35 tIs
B-1,

revana.tra
Data source: "Path: D:\DOCUMENTS AND SETIINGS\STANDBy\MY DOCUMENTS\REVANA\WESTGATESIMS\ File: FAULTAT98%OFLlNE2P _100MS.CFG Info: DlgSILENT PowerFactory
Time Signal: Measurement no.:
If A
2.0
1.5
1.0
0.5
0.0 -tttt:ftL;l!+ftLIt+'h..l..JW,-;tt:-:-ffuH~t.'I:mHii't.'"rfff'tiIt;';fif+lfffl~
-0.5
-1.0
-1.5
-2.0
-2.5
SELEF SELPHS
CAG Inst PHS MCGGPHSTD
MCGG PHS INST CDGEF IDMT
Shunt/Filter 1 :m:l:bus1:A A
Shunt/Filter 1:m:l:bus1:B B -
Shunt/Filter 1 :m:l:bus1:C C - - - -
0.05 0.10 0.15
8-15
0.20 0.25 0.30 0.35 t/s

revana.tra
Data source: Path: D:\DOCUMENTS AND SETTINGS\STANDBy\MY DOCUMENTS\REVANA\WESTGATESIMS\ File: FAUL TAT98%OFLlNE2PE_1 OOMS.CFG Info: DlgSILENT PowerFactory
Time Signal: Measurement no.:
IIA
2.0
1.5
1.0
0.5
O. 0 -+J.H.~H-\-n~!.IJ.r+l+H+li-iIJ.H.l!tYm!AA'!l.+!J!4i+.f1Tit!LI.J!LI+.I-IHfI:lilIff+rHI#IP:!+'H+.I.!rr.t-"*4f'#r+HH:+-+r,rrT-+l~+I+I+!+1
-0.5
-1.0
-1.5
-2.0
SELEF SELPHS
CAG Inst PHS MCGGPHSTD
MCGG PHS INST COG EF IDMT
Shunt/Filter 1 :m:l:bus1:A A
Shunt/Filter 1:m:l:bus1:B B -
Shunt/Filter 1:m:l:bus1 :C C - - - -
0.05 0.10 0.15
8- 1:7
0.20 0.25 0.30 0.35 t/s

revana.tra
Data source: Path: D:\DOCUMENTS AND SETTINGS\STANDBy\MY DOCUMENTS\REVANA\WESTGATESIMS\ File: FAULTAT98%OFLlNE3P _100MS.CFG Info: DlgSILENT PowerFactory
Time Signal: Measurement no.:
If A
2.0
1.5
1.0
0.5
0.0 -++++-'+h-'-+-rH-'--:+I-++-+T-i-HT'-Hf.!I/-\WiiIirnl!ti'':fi':!ln~".;m;+'ImiTm+~II'il!'M+T-:+I'TmI!'f-:llh-if-h--!+LI!-I'r!+!+'-''f+h-''l'+H-!.f+-H.I
-0.5
-1.0
-1.5
-2.0
-2.5
SELEF SEL PHS
CAG Inst PHS MCGGPHSTD
ShuntfFilter 1 :m:l:bus1:A A
ShuntfFilter 1:m:l:bus1:B B
ShuntfFilter 1 :m:l:bus1:C C
MCGG PHS INST 1-------------------------CDG EF IDMT l======;;::=====;======;====::::::;:====::::::;:====::::::;:====::::::;:=====;:::==
0.05 0.10 0.15 0.20 0.25 0.30 0.35 tis
8-20

revana.tra
Data source: Path: D:\DOCUMENTS AND SETTINGS\STANDBy\MY DOCUMENTS\REVANA\WESTGATESIMS\
File: FAUL TATWG275KVBB1 P _100MS.CFG
Info: DlgSILENT PowerFactory
Time Signal: Measurement no.:
itA
3
2
O --tr;t'+t-l-i+'~rhfl-n+'-f+I-*",,"
-1
-2
-3
-4
SELEF SELPHS
CAG InstPHS MCGGPHSTD
MCGG PHS INST CDGEF IOMT
Shunt/Filter 1 :m:l:bus1:A A
Shunt/Filter 1:m:l:bus1:B B
Shunt/Filter 1:ni:l:bus1:C C
0.05 0.10
B-21
0.15 0.20 0.25 0.30 0.35 t/s

revana.tra
Data source: Path: D:\DOCUMENTS AND SETIINGS\STANDBy\MY DOCUMENTS\REVANA\WESTGATESIMS\ File: FAULTATWG275KVBB2P _100MS.CFG Info: DlgSILENT PowerFactory
Time Signal: Measurement no.:
itA
5 4
3 2 1 O ~~4A~~4A~~~~~~~~~~ffir.~AnHftnh~~~~~~~~~
-1 -2 -3 -4 -5
SELEF SEL PHS
CAG InstPHS MCGGPHSTD
MCGG PHS INST CDGEFIDMT
Shunt/Filter 1:m:l:bus1:A A
Shunt/Filter 1:m:l:bus1:B B
Shunt/Filter 1:m:l:bus1 :C C
0.05 0.10 0.15
8-22
0.20 0.25 0.30 0.35 tis

revana.tra
Data source: Path: D:\DOCUMENTS AND SETTINGS\STANDBy\MY DOCUMENTs\REVANA\WESTGATESIMS\ File: FAULTATWG275KVBB2PE_100MS.CFG Info: DlgSILENT PowerFactory
Time Signal: Measurement no.:
IIA
5 4 3 2 1 o -H-~,.....f.,.~"rf'rt'rP-f:r-r'"""
-1 -2 -3 -4 -5 -6
SELEF SELPHS
CAG InstPHS MCGGPHSTD
MCGG PHS INST CDGEFIDMT
Shunt/Filter 1 :m:l:bus1:A A
Shunt/Filter 1:m:l:bus1:B B -
Shunt/Filter 1 :m:l:bus1:C C - - - -
0.05 0.10 0.15
£-23
0.20 0.25 0.30 0.35 tis

revana.tra
Data source: Path: D:\DOCUMENTS AND SETIINGS\STANDBy\MY DOCUMENTS\REVANA\WESTGATESIMS\ File: FAULTATWG275KVBB3P _100MS.CFG
Info: DlgSILENT PowerFactory
Time Signal: Measurement no.:
itA
6
4 ~ ! 2 - (i I' -h'
° in~yv~~~~mm~~~----~rn~~~~~~~~~Tf~~~ -2 b.~ -4
-6
-8
SELEF SEL PHS
CAG InstPHS MCGGPHSTD
MCGG PHS INST CDGEFIDMT
Shunt/Filter 1 :m:l:bus1:A A
Shunt/Filter 1 :m:l:bus1:B B
Shunt/Filter 1 :m:l:bus1:C C
0.05 0.10 0.15
8- 24
0.20 0.25 0.30 0.35 tis

revana.tra
Data source: Path: D:\DOCUMENTS AND SETTINGS\STANDBy\MY OOCUMENTS\REVANA\WESTGATESIMS\ File: 132KVBB_1 P _20HMS.CFG Info: DlgSILENT PowerFactory
Time Signal: Measurement no.:
itA
4 3 2 1 O ~~~t4~~~~n~~~~HT~~~f~~~~~7r~~r,4~~~~~
-1 -2 -3 -4 -5 -6
SELEF SELPHS
CAG InstPHS MCGGPHSTD
MCGG PHS INST COG EF IDMT
Shunt/Filter 1 :m:l:bus1 :A A
Shunt/Filter 1:m:I:.bus1:B B -
Shunt/Filter 1:m:l:bus1:C C - - - -
0.05 0.10 0.15
&-25
0.20 0.25 0.30 0.35 tis

revana.tra
Data source: Path: D:\DOCUMENTS AND SETIINGS\STANDBy\MY DOCUMENTS\REVANA\WESTGATESIMS\ File: 132KVBB_2P _100HMS.CFG Info: DlgSILENT PowerFactory
Time Signal: Measurement no.:
itA
3
2
O ~Mn~~h<HF~hffr.nnTInM~~~~Hrftffi~~r.rr~~~~~~Hrnrl~~
-1
·2
·3
-4
SELEF SEL PHS
CAG Inst PHS MCGG PHSTD
MCGG PHS INST COG EF IOMT
Shunt/Filter 1 :m:1 :bus 1:A A
Shunt/Filter 1:m:l:bus1:B B - - -
Shunt/Filter 1:m:l:bus1 :C C - - - -
0.05 0.10 0.15
B-2b
0.20 0.25 0.30 0.35 tis

revana.tra
Data source: Path: D:\DOCUMENTS AND SETIINGS\STANDBy\MY DOCUMENTS\REVANA\WESTGATESIMS\ File: 132KVBB_2PE_20HMS.CFG Info: DlgSILENT PowerFactory
Time Signal: Measurement no.:
ItA
3.0
2.0
1.0
O.O ;n~~~~r7~~~~~~~~~~~~~~~~~trrrrrm~rrH~~~
-1 .0
-2.0
-3.0
-4.0
SELEF SELPHS
CAG InstPHS MCGGPHSTD
MCGG PHS INST CDGEF IDMT
Shunt/Filter 1:m:l:bus1 :A A
Shunt/Filter 1:m:l:bus1:B B -
Shunt/Filter 1:m:l:bus1:C C - - - -
0.05 0.10 0.15
B-27
0.20 0.25 0.30 0.35 tis

revana.tra
Data source: Path: D:IDOCUMENTS AND SETTINGSISTANDBy\MY DOCUMENTSIREVANAIWESTGATESIMSI File: 132KVBB_3P _50HMS.CFG Info: DlgSILENT PowerFactory
Time Signal: Measurement no.:
itA
3
2
O ~~~~~~~~~~~~~~~~~WY~~~~~A4hW~~~~
-1
-2
-3
-4
-5
SELEF SELPHS
CAG Insl PHS MCGGPHSTD
MCGG PHS INST COG EFIDMT
Shunt/Filler 1 :m:l:bus1 :A A
Shunt/Filter 1:m:l:bus1:B B
Shunt/Filter 1 :m:l:bus1 :C C
0.05 0.10 0.15
B-28
0.20 0.25 0.30 0.35 t/s

revana.tra
Data source: Path: D:\DOCUMENTS AND SETTINGS\STANDBy\MY DOCUMENTS\REVANA\WESTGATESIMS\ File: FAULTAT44KVBB1P _100MS.CFG Info: DlgSILENT PowerFactory
Time Signal: Measurement no.:
If A
1.5
1.0
0.5
0.0 +-:tTlt'-:-iTtI--:trlt:-+.+i-:-+:1Hrn!-;;-';,tI-:'+ttt.:+'ffil-toHtH.tt:-:f'ti-'Trtt'-ri-'-h-'-rt'tIr-rt'-if+'TiJti-:-rl..Lfi-:-:tl-tt:-:fITtr:ftti-.
-0.5
-1.0
-1.5
-2.0
SELEF SELPHS
CAG InstPHS MCGGPHSTD
MCGG PHS INST CDGEFIDMT
Shunt/Filter 1 :m:l:busl:A A
Shunt/Filter l:m:l:busl:B B -
Shunt/Filter 1 :m:l:busl:C C - - - -
0.05 0.10 0.15
B-29
0.20 0.25 0.30 0.35 tis

revana.tra
Data source: Path: D:\DOCUMENTS AND SETTINGS\STANDBy\MY DOCUMENTS\REVANA\WESTGATESIMS\ File: FAULTAT44KVBB2P _100MS.CFG Info: DlgSILENT PowerFactory
Time Signal: Measurement no.:
itA
2.0
1.5
1.0
0.5
0.0 --l+H+ttI1fhtt'#-t+:-l+'*""f.:J+ftIi¥lJ.l~-n+-H~r:++-..r+I-r'lHr.lfHf'-j!,-\-f-l+\-f-tf+l1!-h+r4.!.lf:...+,-l-H+'#-H,..-HJ-l-Y.+*I,+t.Lt-J
-0.5
-1.0
-1.5
-2.0
SELEF SELPHS
CAG InstPHS MCGGPHSTD
MCGG PHS INST CDGEF IDMT
Shunt/Filter 1:m:l:bus1:A A
Shunt/Filter 1 :m:l:bus1:8 8 -
Shunt/Filter 1:m:l:bus1 :C C - - - -
0.05 0.10 0.15
8-30
0.20 0.25 0.30 0.35 tis

revana.tra
Data source: Path: D:\DOCUMENTS AND SETIINGS\STANDBy\MY DOCUMENTS\REVANA\WESTGATESIMS\ File: FAULTAT44KVBB2PE_100MS.CFG Info: DlgSILENT PowerFactory
Time Signal: Measurement no.:
itA
1.5
1.0
0.5
O.O ~~~Hr.~*"~~~~~~¥+~*T~~~~TI+~rrT.~THnrr.nnrn~
-0.5
-1.0
-1.5
-2.0
SELEF SELPHS
CAG Inst PHS MCGGPHSTD
MCGG PHS INST COG EF IOMT
Shunt/Filter 1:m:l:bus1:A A
Shunt/Filter 1:m:l:bus1:B B -
Shunt/Filter 1:m:l:bus1:C C - - - -
0.05 0.10 0.15
1$--31
0.20 0.25 0.30 0.35 t/s

revana.tra
Data source: Path: D:\DOCUMENTS AND SETIINGS\STANDBy\MY DOCUMENTS\REVANA\WESTGATESIMS\ File: FAULTAT44KVBB3P _100MS.CFG Info: QlgSILENT PowerFactory
Time Signal: Measurement no.:
If A
1.5
1.0
0.5
O.O ~~~~~~~~~~~mm~~~~Hr.~+-*~~~~~~~~~
-0.5
-1.0
-1.5
-2.0
SELEF SEL PHS
CAG InstPHS MCGGPHSTD
MCGG PHS INST CDGEFIDMT
Shunt/Filter 1 :m:l:bus1:A A
Shunt/Filter 1 :m:l:bus1:8 8 -
Shunt/Filter 1 :m:l:bus1:C C - - - -
0.05 0.10 0.15 0.20 0.25 0.30 0.35 t/s

revana.tra
Data source: Path: D:\DOCUMENTS AND SETIINGS\STANDBy\MY DOCUMENTS\REVANA\WESTGATESIMS\ File: YN_1%_1P.CFG Info: DlgSILENT PowerFactory
Time Signal: Measurement no.:
ItA
7.5
5.0
2.5
0.0 4A~~~~~~~~~~~~~~~~~~~~~~~~~~~~~~
-2.5
-5.0
-7.5
-10.0
-12.5
-15.0
SELEF SELPHS
CAG InstPHS MCGG PHS TO
MCGG PHS INST
Shunt/Filter 1:m:l:bus1 :A A
Shunt/Filter 1 :m:l:bus1:B B - - -
Shunt/Filter 1:m:l:bus1:C C - - - -
COG EF IDMT I~
0.05 0.10 0.15 0.20 0.25
8- 33
0.30 0.35 t/s

revana.tra
Data source: Path: D:\DOCUMENTS AND SETTINGS\STANDBy\MY DOCUMENTS\REVANA\WESTGATESIMS\ File: YN_1%_2P _50HMS.CFG Info: DlgSILENT PowerFactory
Time Signal: Measurement no.:
If A
10.0 7.5 5.0 2.5
0.0 ""'f-:I',"""'~d'7'W~W'W-~~~I-¥--5""'Hr--7'Imrtl!f.tlrilnlllt
-2.5 -5.0 -7.5
-10.0
-12.5 -15.0
SELEF SEL PHS
CAG Inst PHS MCGGPHSTD
MCGG PHS INST CDGEF IDMT
Shunt/Filter 1 :m:l:bus1:A A
Shunt/Filter 1:m:l:bus1:B B ---
Shunt/Filter 1:m:l:bus1:C C - - - -
0.05 0.10 0.15
8-34
0.20 0.25 0.30 0.35 t/s

revana.tra
Data source: Path: D:\DOCUMENTS AND SETIINGS\STANDBy\MY DOCUMENTS\REVANA\WESTGATESIMS\
File: YN_1%_2PE_50HMS.CFG
Info: DlgSILENT PowerFactory
Time Signal: Measurement no.:
IIA
4
2 0 4A~~44AAAr~~~~~~~~~~
-2
-4
-6
-8
-10
-12
Shunt/Filter 1:m:l:bus1:A A
Shunt/Filter 1:m:l:bus1:B B
Shunt/Filter 1:m:l:bus1:C C
SELEF SELPHS
CAG Insl PHS MCGG PHS TD
MCGG PHS INST COG EF IDMT ~i
0.05 0.10 0.15 0.20 0.25 0.30
~.- 35
0.35 tis

revana.tra
Data source: Path: D:\DOCUMENTS AND SETIINGS\STANDBy\MY DOCUMENTS\REVANA\WESTGATESIMS\ File: YN_1"Io_3P _SOHMS.CFG Info: DlgSILENT PowerFactory
Time Signal: Measurement no.:
ItA
S.O
2.5
0.0 -tAAA.,..L,~rAAAf'.~MWW~~I.A-..,AWLAAIH!I
-2.5
-5.0
-7.5
-10.0
-12.5
SELEF SEL PHS
CAG Inst PHS MCGGPHSTD
MCGG PHS INST CDGEFIDMT
Shunt/Filter 1 :m:l:bus1:A A
Shunt/Filter 1 :m:l:bus1:B B - - -
Shunt/Filter 1:m:l:bus1:C C - - - -
0.05 0.10 0.15
B-3b
0.20 (1<
0.25 0.30 0.35 t/s

revana.tra
Data source: Path: D:\DOCUMENTS AND SETTINGS\STANDBy\MY DOCUMENTS\REVANA\WESTGATESIMS\
File: YNCAP _FAULTAT100/01P _100MS.CFG
Info: DlgSILENT PowerFactory
Time Signal: Measurement no.:
IIA
3
2
1
0 1L~~~~~trW~~~~~
-1
-2
-3
-4
-5
SELEF SELPHS
CAG InstPHS MCGGPHSTD
MCGG PHS INST COGEF IOMT
Shunt/Filter 1 :m:l:bus1:A A
Shunt/Filter 1 :m:l:bus1:8 B
Shunt/Filter 1:m:l:bus1:C C
0.05 0.10
IS - 37
0.15 0.20 0.25 0.30
Hl--
0.35 tis

revana.tra
Data source: Path: D:\DOCUMENTS AND SETIINGS\STANDBy\MY DOCUMENTS\REVANA\WESTGATESIMS\ File: YNCAP _FAUL TA T10%2P _100MS.CFG Info: DlgSILENT PowerFactory
Time Signal: Measurement no.:
ItA
6 5 4 3 2 1 o -M,p...p,..,¥.-A-,J\f-fp.-f.,,-\-''+:r-fL'!'"
-1 -2 -3 -4 -5 -6 -7
SELEF SEL PHS
Shunt/Filter 1:m:l:bus1:A A
Shunt/Filler 1:m:l:bus1:B B ---
Shunt/Filter 1:m:l:bus1:C C - - - -
CAGlnstPHS CJ~-----------------------------------MCGG PHSTD
MCGG PHS INST CDGEFIDMT
0.05 0.10 0.15 0.20 0.25 0.30 0.35 tis
8-38

revana.tra
Data source: Path: D:\DOCUMENTS AND SETTINGS\STANDBy\MY DOCUMENTS\REVANA\WESTGATESIMS\ File: YNCAP _FAUL TA T10%2PE_100MS.CFG Info: DlgSILENT PowerFactory
Time Signal: Measurement no.:
If A
6
4
2
-2
-4
·6
SELEF SELPHS
CAG Inst PHS MCGGPHSTD
MCGG PHS INST CDGEFIDMT
Shunt/Filter 1:m:l:bus1:A A
Shunt/Filter 1:m:l:bus1:B B ---
Shunt/Filter 1:m:l:bus1:C C - - - -
0.05 0.10 0.15
8- 39
0.20 · 0.25 0.30 0.35 tJs
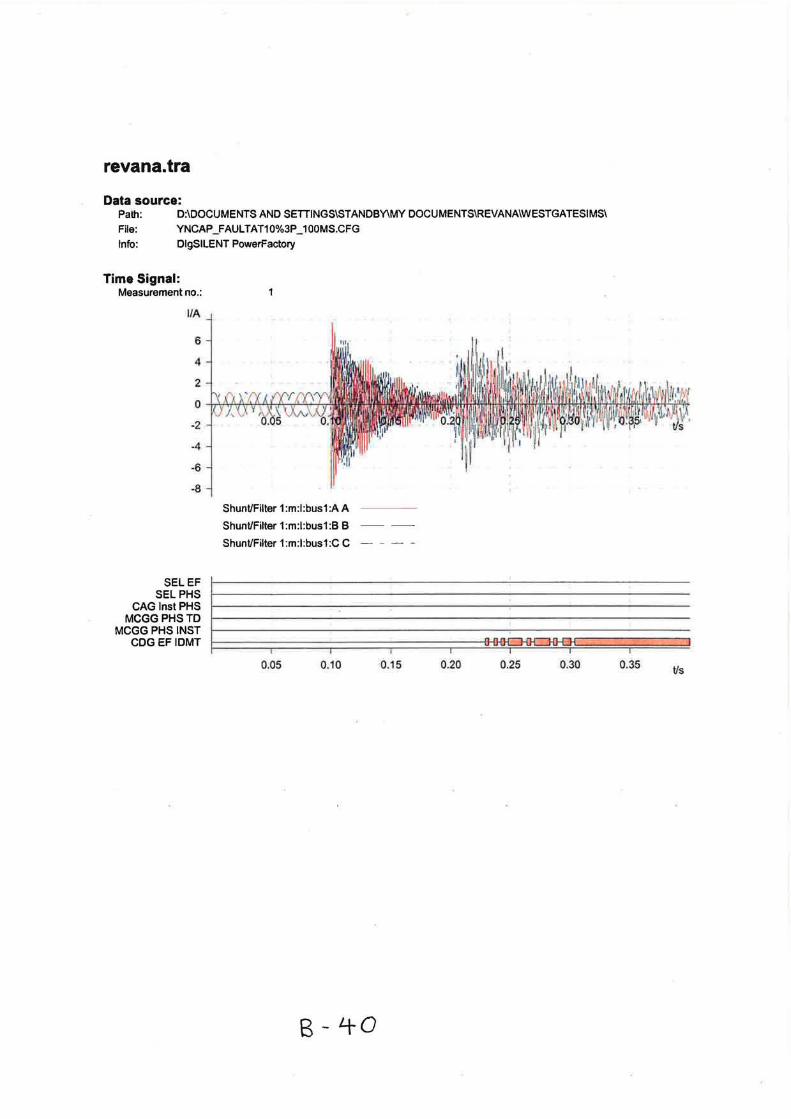
revana.tra
Data source: Path: D:\DOCUMENTS AND SETTINGS\STANDBy\MY DOCUMENTS\REVANA\WESTGATESIMS\ File: YNCAP ] AULTAT10%3P _100MS.CFG Info: DlgSILENT PowerFactory
Time Signal: Measurement no.:
I/A
6
4
2
o -+r>.~ri+f',rfJrlJl+.,f'T-r!-""""'+"-!IIM~5 -2
-4
-6
-8
SELEF SEL PHS
CAG InstPHS MCGGPHSTD
MCGG PHS INST CDGEFIDMT
ShuntlFilter 1 :m:l:bus1:A A
ShuntlFilter 1:m:l:bus1:B B
ShuntlFilter 1 :m:l:bus1:C C
0.05 0.10 0.15 0.20 0.25 0.30 0.35 tis

revana.tra
Data source: Path: D:\DOCUMENTS AND SETIINGS\STANDBy\MY DOCUMENTS\REVANA\WESTGATESIMS\ File: YNCAP _FAULTAT200/01P _100MS.CFG Info: DlgSILENT PowerFactory
Time Signal: Measurement no.:
SELEF SELPHS
CAG Inst PtiS MCGGPHSTD
MCGG PHS INST COG EF IDMT
Shunt/Filter 1 :m:l:bus1:A A
Shunt/Filter 1:m:l:bus1:B B ---
Shunt/Filter 1:m:l:bus1:C C - - - -
0.05 0.10 0.15
8- 4 \
0.20 0 . .25 0.30 0.35 tis

revana.tra
Data source: Path: D:\DOCUMENTS AND SETTINGS\STANDBy\MY DOCUMENTS\REVANA\WESTGATESIMS\ File: YNCAP _FAUL TAT20%2P _100MS.CFG Info: DlgSILENT PowerFactory
Time Signal: Measurement no.:
itA
4
3
2
1
0 -J..!!.!-t+'T.w-Jtft1!--r.-t''+P-f~-\-f¥
-1
-2
-3
-4
Shunt/Filter 1:m:l:bus1:A A
Shunt/Filter 1:m:l:bus1:B B ---
Shunt/Filter 1:m:l:bus1:C C - - - -
SELEF SEL PHS
CAG Inst PHS MCGGPHSTD
MCGG PHS INST CDGEFIDMT
0.05 0.10 0.15
8- 42
0.20 0.25 0.30 0.35 tis

revana.tra
Data source: Path: D:\OOCUMENTS AND SETIINGS\STANOBy\MY OOCUMENTS\REVANA\WESTGATESIMS\ File: YNCAP ]AUL TAT20%2PE_1 OOMS.CFG Info: OlgSILENT' PowerFactory
Tim. Signal: Measurement no.:
itA
4
3
2
1
o +Sh-flr"-H'M+I!.4+-I+'--''rJ-\f~
·1
·2
·3
-4
·5
SELEF SELPHS
CAG InstPHS MCGGPHSTO
MCGG PHS INST COG EF IDMT
ShuntlFilter 1:m:t:bus1 :AA
ShuntlFilter 1:m:l:bus1:B B -- -
Shunt/Filter 1:m:l:bus1:C C - - - -
0.05 0.10 0.15
E-43
0.20 0.25 0.30 0.35 tis
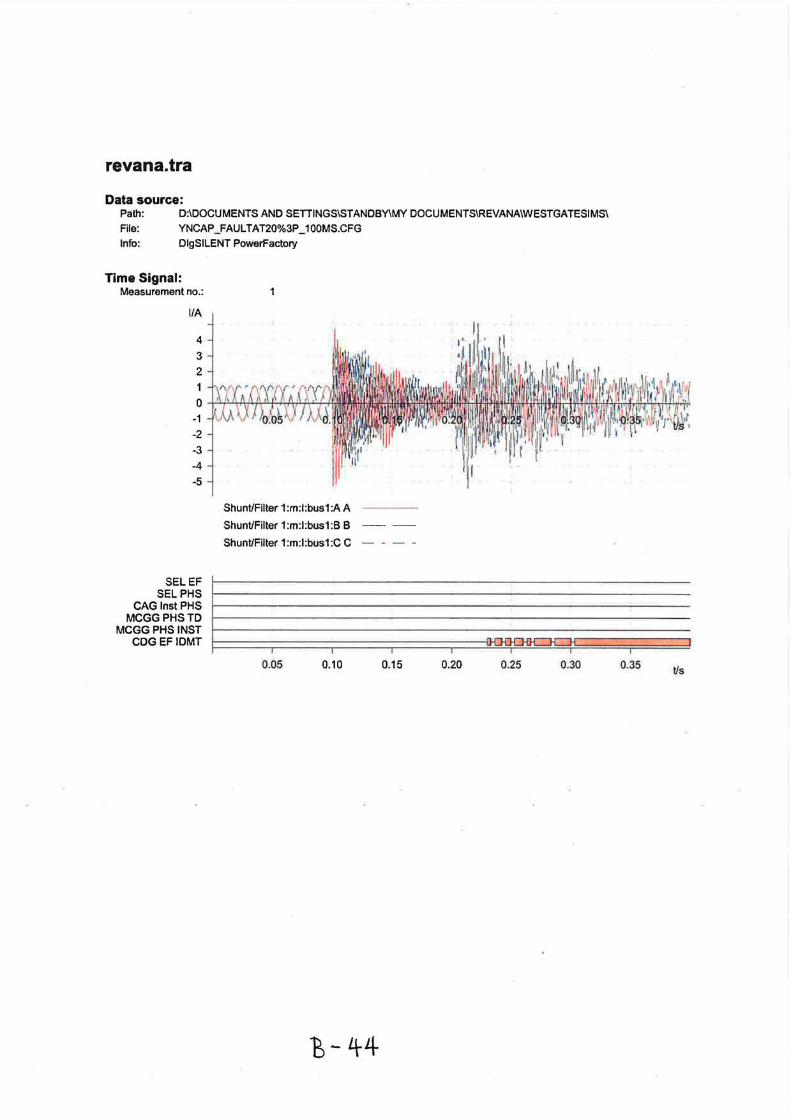
revana.tra
Data source: Path: D:\DOCUMENTS AND SETIINGS\STANDBy\MY DOCUMENTS\REVANA\WESTGATESIMS\
File: YNCAP _FAULTAT20%3P _100MS.CFG Info: DlgSILENT PowerFactory
Time Signal: Measurement no.:
If A
4
3 2
1 O -+"-f'-<+++Pr1+"-f'-I-'rf'rf'--f+"-+-!-f
-1
-2
-3
-4 -5
SELEF SEL PHS
CAG Inst PHS MCGGPHSTD
MCGG PHS INST CDGEFIDMT
Shunt/Filter 1 :m:l:bus1:A A
Shunt/Filter 1:m:l:bus1:B B
Shunt/Filter 1:m:l:bus1:C C
0.05 0.10 0.15 0.20 0.25 0.30 0.35 tis

revana.tra
Data source: Path: D:\DOCUMENTS AND SETIINGS\STANDBy\MY DOCUMENTS\REVANA\WESTGATESIMS\ File: YNCAP _FAULTAT500/01P _100MS.CFG Info: DlgSILENT PowerFactory
Tim. Signal: Measurement no.: 1
If A
1.5
1.0
0.5
o. 0 --tr'-t..-'i-rl+:itlftttfl7Tr'trtf.m:t~;T.ffi;j-'-f-\ftrlJiftri-'1rr.ttHlfIr.tMti:fu'"'i~:i':;ii';:'Ti":+ttr.ttiilt:--tt;;rlT;t'"'""++t....:..:,.r,-r
-0.5
-1 .0
-1 .5
SELEF SELPHS
CAG InstPHS
ShuntlFilter 1:m:l:bus1 :A A
ShuntlFilter 1:m:l:bus1:B B ---
ShuntlFilter 1:m:l:bus1:C C - - - -
MCGGPHSTD ~-----------------------------------------------MCGG PHS INST
COG EF IDMT ~====:;======;:::==:Q[H:Q!o-oc::::J.O-I~g:ru;;;;;~Ic:H!;;!f~~~~~~:;;;;ltc=J1!:!;;;;~~;;;;;;;;;! J- I i ~
0.05 0.10 0.15 0.20 0.25 0.30 0.35 tis
13 -4-5

revana.tra
Data source: Path: D:\DOCUMENTS AND SETTINGS\STANDBy\MY DOCUMENTS\REVANA\WESTGATESIMS\ File: YNCAP ]AUL TAT50%2P _1 OOMS.CFG Info: DlgSILENT PowerFactory
Time Signal: Measurement no.:
SELEF SEL PHS
CAG InstPHS MCGGPHSTD
MCGG PHS INST CDGEFIDMT
1
Shunt/Filter 1 :m:l:bus1:A A
Shunt/Filter 1:m:l:bus1 :B B ---
Shunt/Filter 1:m:l:bus1 :C C - - - -
0.05 0.10 0.15
E-4b
0.20 0.25 0.30 0.35 tis

revana.tra
Data source: Path: D:\DOCUMENTS AND SETTINGS\STANDBy\MY DOCUMENTS\REVANA\WESTGATESIMS\ File: YNCAP ]AUL TAT50%2PE_1 OOMS.CFG Info: DlgSILENT PowerFactory
Tima Signal: Measurement no.:
SELEF SELPHS
CAG Inst PHS MCGGPHSTD
MCGG PHS INST
Shunt/Filter 1 :m:l:bus1:A A
Shunt/Filter 1:m:l:bus1:B B -
Shunt/Filter 1 :m:l :bus1:C C - - - -
CDGEFIDMT ~ I
0.05 0.10 0.15 0.20 0.25 0.30 0.35
13- 4-7
tis

revana.tra
Data source: Path: D:\DOCUMENTS AND SETTINGS\STANDBy\MY DOCUMENTS\REVANA\WESTGATESIMS\ File: YNCAP _FAULTAT50%3P _100MS.CFG Info: DlgSILENT PowerFactory
Time Signal: Measurement no.:
IIA
2.0
1.0
0.0 +.-n7+.-"+I+'Af'-W.,Jc:..,.ttt+tfl
-1.0
-2.0
-3.0
-4.0
SELEF SELPHS
CAG Inst PHS MCGGPHSTD
MCGG PHS INST CDGEFIDMT
Shunt/Filter 1 :m:l:bus1:A A
Shunt/Filter 1:m:l:bus1:B B -
ShuntlFilter 1:m:l:bus1:C C - - - -
0.05 0.10 0.15
8-4-8
0.20 0.25 0.30
H
0.35 tis

revana.tra
Data source: Path: O:\OOCUMENTS AND SETTINGS\STANOBy\MY OOCUMENTS\REVANA\WESTGATESIMS\ File: YNCAP _FAUL TAT98% 1 P _1 OOMS.CFG Info: OlgSILENT PowerFactory
Time Signal: Measurement no.:
itA
1.5
1.0
0.5
-0.5
-1.0
-1.5
Shunt/Filter 1 :m:l:bus1:A A
Shunt/Filter 1 :m:l:bus1:B B -
Shunt/Filter 1:m:l:bus1:C C - - - -
SELEF ~-----------------------------------------------SELPHS ~----------------------------------------------
CAG Inst PHS 1------------------------------------------------MCGGPHSTO ~----------------------------------------------
MCGG PHS INST 1------------------------------------------------COG EF IOMT f====:::::::;;:====::::::;==:=:J~~;JQr;;;;;;;;;;;;;;;;;;;;;;;;;;~H1(!;:!;;;;;;;;;;;;;;;;;;~;;;;;;;;;;;;;;;;;;~;;;;;;;;;;;;;:;;;;;;;;;;;)
0.05 0.1 0 0.15 0.20 0.25 0.30 0.35 t/s

revana.tra
Data source: Path: D:\DOCUMENTS AND SETTINGS\STANDBy\MY DOCUMENTS\REVANA\WESTGATESIMS\ File: YNCAP ]AULTAT98%2P _100MS.CFG Info: DlgSILENT PowerFactory
Time Signal: Measurement no.:
ItA
2.0
1.5
1.0
0.5
0.0 -+t+fH+LH4+:+~.f!-,4.ttf.l+iij~~~fllh!f.~-H-l'--m~t-ii+rt.I-liii-\l-!~4-:rtl'-lf-l--+-:--rJl,.,-Hif~~
-0.5
-1.0
-1.5
-2.0
Shunt/Filter 1 :m:l:bus1:A A
Shunt/Filter 1:m:l:bus1:B B
Shunt/Filter 1:m: I :bus 1:C C
SELPHS f-----------------------SELEF 1-CAG InstPHS 1----------------------
MCGGPHSTD 1----------------------MCGG PHS INST 1-----------------------
CDG EF I DMT ~: ======:::::;:=======;::::::====::::::::;::=======;:::::======:::::;:=======;::::::====::::::::;::======= 0.05 0.10 0.15 0.20 0.25 0.30 0.35 tJs
8-50

revana.tra
Data source: Path: D:\DOCUMENTS AND SETIINGS\STANDBy\MY DOCUMENTS\REVANA\WESTGATESIMS\ File: YNCAP ]AULTAT98%2PE_100MS.CFG Info: DlgSILENT PowerFactory
Time Signal: Measurement no.:
If A
2.0
1.5
1.0
0.5
o. 0 --+H+tH-4-f-LH+,+-'h-,-+*4-l+:-f1iiflrnffiffi-~'ffi"1ff-ttrlll'ftt+"'*l'it:..l.frrl!l.,.-lftfL,*,",","I'l-c'if~"fl-:!I+-rh-~r'ttt7t:+tfJ
-0.5
-1.0
-1.5
-2.0
SELPHS CAG InstPHS
ShuntlFilter 1:m:l:bus1:A A
ShuntlFilter 1:m:l:bus1:B B
ShuntlFilter 1 :m:l:bus1:C C
SEL EF I MCGGPHSTD ~-------------------------------------------
MCGG PHS INST f--------------------------------------------COG EF IDMT l=: ====::::;:=====::::;::::====:;:::::::==:::::::;====::llo-rp~!J;;;;;;;;;;;;;;;;;;;;;;;;;;;;;;;;;;;;;;;;;;;;;;;;;;;;;;;~
0.05 0.10 0.15 0.20 0.25 0.30 0.35 tis
8-51

revana.tra
Data source: Path: D:\DOCUMENTS AND SETIINGS\STANDBy\MY DOCUMENTS\REVANA\WESTGATESIMS\ File: YNCAP _FAULTAT98%3P _100MS.CFG Info: DlgSILENT PowerFactory
Time Signal: Measurement no.:
If A
2.0
1.5
1.0
0.5 1~JUJ;~~~~.~~~~r~~~~ru~w.~~~ 0.0 -H -0.5
-1 .0
-1 .5
-2.0
-2.5
SELEF SEL PHS
CAG InstPHS MCGGPHSTD
Shunt/Filter 1 :m:l :bus1:A A
Shunt/Filter 1:m:l:bus1 :B B -
Shunt/Filter 1:m:l:bus1 :C C - - - -
MCGG PHS INST I;;:;;:;;;;:;;:;~;:;;;~;;;;~;:;;:;~~;;;~;;H;;;~;;;;;;~ COG EF IDMT 1= ~ IQ
0.05 0.10 0.15 0.20 0.25 0.30 0.35 tis
8-52.

revana.tra
Data source: Path: D:\DOCUMENTS AND SETTINGS\STANDBy\MY DOCUMENTS\REVANA\WESTGATESIMS\ File: YNCAP _FAULTATWG275KVBB1P _100MS.CFG
Info: DlgSILENT PowerFactory
Time Signal: Measurement no.:
If A
6
4
2
O -h-lrAArtt+ArtAAAAAAN
-2
-4
-6
-8
SELEF SELPHS
CAG Inst PHS MCGGPHSTD
MCGG PHS INST COG EF IDMT
Shunt/Filter 1 :m:l:bus1:A A
Shunt/Filter 1:m:l:bus1:B B ---
Shunt/Filter 1:m:l:bus1:C C - - - -
0.05 0.10 0.15
g-53
H
0.20 0.25 0.30 0.35 t/s

revana.tra
Data source: Path: D:\DOCUMENTS At-olD SETTINGS\STANDBy\MY DOCUMENTS\REVANA\WESTGATESIMS\ File: YNCAP _FAULTATWG275KVBB2P _100MS.CFG Info: DlgSILENT PowerFactory
Time Signal: Measurement no.:
I/A
5 .4 3 2 1 O -H""""":-"-f'-"r-rl-:+TPrf'rlTl"'tr+
-1 -2 -3 -4 -5 -6
SELEF SEL PHS
CAG Inst PHS MCGGPHSTD
MCGG PHS INST CDG EFIDMT
Shunt/Filter 1 :m:l:bus1:A A
Shunt/Filter 1:m:l:bus1:B B --
Shunt/Filter 1:m:l:bus1:C C - - - -
0.05 0.10 0.15
8-54
0.20 0.25 0.30 0.35 tis

revana.tra
Data source: Path: D:\DOCUMENTS AND SETTINGS\STANDBy\MY DOCUMENTS\REVANA\WESTGATESIMS\ File: YNCAP ]AUL TA TWG275KVBB2PE_1 DOMS.CFG Info: DlgSILENT PowerFactory
Time Signal: Measurement no.:
itA
6
4
2
O ~~~~~AAAA~~~~~~~~mrn
-2
-4
-6
-8
SELEF SELPHS
CAG InstPHS MCGGPHSTD
MCGG PHS INST CDGEFIDMT
Shunt/Filter 1 :m:l:bus1:A A
Shunt/Filter 1:m:l:bus1:B B
Shunt/Filter 1:m:l:bus1:C C
0.05 0.10 0.15
(3-55
0.20 0.25 0.30 0.35 t/s

revana.tra
Data source: Path: D:\DOCUMENTS AND SETTINGS\STANDBy\MY DOCUMENTS\REVANA\WESTGATESIMS\ File: YNCAP _FAUL TA TWG275KVBB3P _1 OOMS.CFG Info: DlgSILENT PowerFactory
Time Signal: Measurement no.:
itA
6
4
2
O +.-\,P..P,rAJWWW~"rf-d1
-2
-4
-6
-8
Shunt/Filter 1:m:l:bus1:A A
0.15
Shunt/Filter 1:m:l:bus1:B B ---
Shunt/Filter 1:m:l:bus1:C C - - - -
SELEF SELPHS
CAG Inst PHS MCGGPHSTD
MCGG PHS INST COG EF IOMT Il-Di
I
0.05 0.10 0.15 0.20 0.25
8-56
0.30 0.35 t/s

revana.tra
Data source: Path: D:IDOCUMENTS AND SETTINGSISTANDBy\MY DOCUMENTSIREVANAIWESTGATESIMSI
File: YN_132KVBB_1P _50HMS.CFG
Info: DlgSILENT PowerFactory
Time Signal: Measurement no.:
IIA
2
0 ~~~~~+8~~~~~~~~~~~~~~~~~~~~~~~
-1
-2
-3
-4
-5
SELEF SEL 'PHS
CAG InstPHS MCGGPHSTD
MCGG PHS INST CDGEF IDMT
Shunt/Filter 1 :m:l:bus 1:A A
Shunt/Filter 1:m:l:bus1:B B -
Shunt/Filter 1:m:l:bus1:C C - - - -
0.05 0.10 0.15
g-57
0.20 0.25 0.30 0.35 t/s
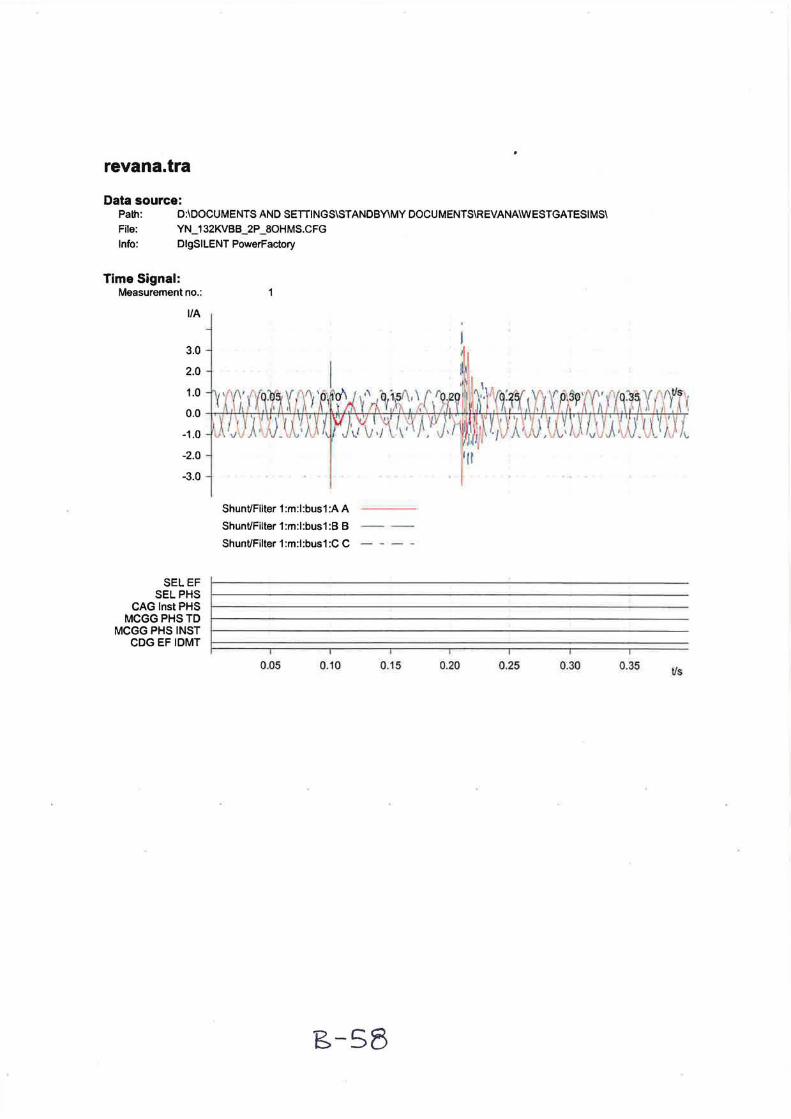
revana.tra
Data source: Path: D:IDOCUMENTS AND SETIINGSISTANDBYIMY DOCUMENTSIREVANAIWESTGATESIMSI File: YN_132KVBB_2P _80HMS.CFG Info: DlgSILENT PowerFactory
Time Signal: Measurement no.:
If A
3.0
2.0
1.0
O.O ~~4h~~~~rn~~+Pr+~~rl+~~~~~nr~nnnr~nAnr~~~
-1.0
-2.0
-3.0
SELEF SEL PHS
CAG Inst PHS MCGGPHSTD
MCGG PHS INST CDGEF IDMT
Shunt/Filter 1:m: I :bus 1 :A A
Shunt/Filter 1:m:l:bus1:B B -
Shunt/Filter 1 :m:l:bus1:C C - - - -
0.05 0.10 0.15
g-55
0.20 0.25 0.30 0.35 tis

revana.tra
Data source: Path: D:IDOCUMENTS AND SETIINGSISTANDBYIMY DOCUMENTSIREVANAIWESTGATESIMSI File: YN_132KVBB_2PE_50HMS.CFG Info: DlgSILENT PowerFactory
Time Signal: Measurement no.:
IIA
2
o ~~rnw.~~~~~~~~~~~~
·1
·2
·3
-4
·5
SELEF SEL PHS
CAG Inst PHS MCGGPHSTD
MCGG PHS INST COGEF IOMT
Shunt/Filter 1 :m:l:bus1:A A
Shunt/Filter 1:m:l:bus1:B B -
Shunt/Filter 1:m:l:bus1:C C - - - -
0.05 0.10 0.15 0.20 0.25 0.30 0.35 t/s

revana.tra
Data source: Path: D:\DOCUMENTS AND SETTINGS\STANDBy\MY DOCUMENTS\REVANA\WESTGATESIMS\ File: YN_132KVBB_3P _50HMS.CFG Info: DlgSILENT PowerFactory
Time Signal: Measurement no.:
itA
3
2
1
O ~nn~mr+.T~~~n-rr~U7rrrr~~vrr~~~ffir.~~nH~~~Tft~~~nr7
-1
-2
-3
-4
-5
SELEF SEL PHS
CAG Inst PHS MCGGPHSTD
MCGG PHS INST COG EF IDMT
Shunt/Filter 1 :m:l:bus1:A A
Shunt/Filter 1 :m:l:bus1:8 B
Shunt/Filter 1 :m:l:bus1:C C
0.05 0.10 0.15
B-bO
0.20 0.25 0.30 0.35 tis

revana.tra
Data source: Path: D:\DOCUMENTS AND SETTINGS\STANDBy\MY DOCUMENTS\REVANA\WESTGATESIMS\ File: YNCAP _FAUL TA TWG44KVBB1 P _100MS.CFG Info: DlgSILENT PowerFactory
Time Signal: Measurement no.:
If A
1.5
1.0
0.5
O. 0 -Hti'tftLtf't!frtf-,"'+o';f+ttfttrtr.+iH:IIit.........,.,..,.IfIt~tmr.-+.+rnI-'-;....,rn-tr+tt.+>:''ii-:r+'-tt-tttrI+'-ftr++YtrIf'fttHTm-'-IT'-'
-0.5
-1.0
-1.5
-2.0
SELEF SELPHS
CAG InstPHS MCGGPHSTD
MCGG PHS INST CDGEF IDMT
ShuntlFilter 1 :m:l:bus1:A A
ShuntlFilter 1:m:l:bus1:B B -
ShuntlFilter 1:m:l:bus1:C C - - - -
0.05 0.10 0.15
B-61
0.20 0.25 0.30 0.35 tis

revana.tra
Data source: Path: D:\DOCUMENTS AND SETIINGS\STANDBy\MY DOCUMENTS\REVANA\WESTGATESIMS\ File: YNCAP _FAULTATWG44KVBB2P _100MS.CFG Info: DlgSILENT PowerFaclory
Time Signal: Measurement no.:
itA
2.0
1.5
1.0
0.5
0.0 +t+;'Ht+thfrtrtr.hI+W.f:-LIiffitI;liTf1hf+lLf+'h-H+;-prI-:i+.~JtI+\ttl+h-I¥-\f:ffrtt.+l-'t1-7\-;..p...:.\Tl-Httl+hf\-!'I++
-0.5
-1.0
-1.5
-2.0
SELEF SELPHS
CAG Inst PHS MCGGPHSTD
MCGG PHS INST CDGEF IDMT
Shunt/Filler 1 :m:l:busl:A A
Shunt/Filler l:m:l:busl:B B
Shunt/Filter 1:m:l:bus1:C C
0.05 0.10 0.15
B-b2
0.20 0.25 0.30 0.35 tis

revana.tra
Data source: Path: D:\DOCUMENTS AND SETTINGS\STANDBy\MY DOCUMENTS\REVANA\WESTGATESIMS\ File: YNCAP _FAUL TATWG44KVBB2PE_100MS.CFG Info: DlgSILENT PowerFactory
Time Signal: Measurement no.:
If A
1.5
1.0
0.5
O.O ~rm~~7rr~rr~~tl*~~~~~~~~mnMff~~~~~~rlrn~
-0.5
-1.0
-1.5
-2.0
SELEF SELPHS
CAG Inst PHS MCGGPHSTO
MCGG PHS INST COGEF IOMT
Shunt/Filter 1 :m:l:bus1:A A
Shunt/Filler 1:m:l:bus1:B B
Shunt/Filler 1:m:l:bus1:C C
0.05 0.10 0.15
B-63
H H
0.20 0.25 0.30 0.35 tis

revana.tra
Data source: Path: D:\DOCUMENTS AND SETIINGS\STANDBy\MY DOCUMENTS\REVANA\WESTGATESIMS\ File: YNCAP JAULTATWG44KVBB3P _100MS.CFG Info: DlgSILENT PowerFactory
Time Signal: Measurement no.:
itA
1.5
1.0
0.5
0.0 -I-t+J+tl+J.t+H+l-f+tH+I'I-Hf+f+j-;im/Lfl-:-'-I-I-'-'r+l-'f'i-'ti-t-MhL.!.!ftIfnlrrt+.--'t-"-f-'l+T..-+rti+it'-ti-4;4-;t+.!.f.I-rJh-'+'-+.-'-fi+..:..p..:..
-0.5
-1.0
-1.5
-2.0
SELEF SELPHS
CAG Inst PHS MCGGPHSTD
MCGG PHS INST CDGEFIDMT
Shunt/Filter 1 :m:l:bus1:A A
Shunt/Filter 1 :m:l:bus1:8 B
Shunt/Filter 1 :m:l:bus1:C C
0.05 0.10 0.15
B-64
0.20 0.25 0.30 0.35 tis

revana.tra
Data source: Path: D:\DOCUMENTS AND SETIINGS\STANDBy\MY DOCUMENTS\REVANA\WESTGATESIMS\ File: SWITCHING IN BANK.CFG
Info: DlgSILENT PowerFactory
Time Signal: Measurement no.:
If A
8
6
4
2
o -f----I----l
-2 0.05
-4
-6
-8
-10
Shunt/Filter 1 :m:l:bus1:A A
SELEF SELPHS
CAG InstPHS MCGGPHSTO
MCGG PHS INST COG EF IDMT
Shunt/Filter 1:m:l:bus1:B B --
Shunt/Filter 1:m:l:bus1:C C - - - -
0.05 0.10 0.15 0.20
8-65
0.25 0.30 0.35 0.40 0.45 t/s

revana.tra
Data source: Path: D:\DOCUMENTS AND SETIINGS\STANDBy\MY DOCUMENTS\REVANA\WESTGATESIMS\ File: INTERNALFAUL T.CFG Info: DlgSILENT PowerFactory
Time Signal: Measurement no.:
I/A
10.0
7.5
5.0
2.5
0.0 --Ji'o'*"I'+!'~Vtf..,.-f1~i'-:1t-'iH'IilV-rr--¥/--;1rHfIrT+--'l'--f<l'7--;lI-v-:t--Tlltrt--;Trf-.rri''--+<-''Jr-T.-'tr--f--f..-'T-rim'-~+.-T
-2.5
-5.0
-7.5
-10.0
SELEF SEL PHS
CAG InstPHS MCGGPHSTD
MCGG PHS INST CDGEFIDMT
BreakerISwitch:m:l:bus1:A A
BreakerISwitch:m:l:bus1:B B -
BreakerISwitch:m:l:bus1:C C - - - -
0.05 0.10 0.15 0.20 0.25 0.30 0.35 0.40 0.45 Vs

revana.tra
Data source: Path: D:\DOCUMENTS AND SETTINGS\STANDBy\MY DOCUMENTS\REVANA\WESTGATESIMS\ File: YN_INTERNALFAUL T.CFG Info: DlgSILENT PowerFactory
Time Signal: Measurement no.:
itA
SELEF SELPHS
CAG InstPHS MCGGPHSTO
MCGG PHS INST COG EF IOMT
Breaker/Switch:m:l:bus1:A A
Breaker/Switch:m:l:bus1:B B -
Breaker/Switch:m:l:bus1:C C - - - -
0.05 0.10 0.15 0.20
B-b7
0.25 0.30 0.35 0.40 0.45 Vs

B-68
Equipment list
DigSILENT: TX Master Project 2008_10_20.dz File
The following can be located in the ESKOM Transmission Test Laboratory, Simmerpan GEC MCGG63 relay: Serial Number 621301C SEL387 GEC CDG16: Serial Number 4019332 GEC CAG39 Omicron injection test set : CMC 256-6 Amplifier: CMS 525 DC Power supply : Sorenson DCR