Embed Size (px)
Citation preview

i
EVALUATION OF OXYGEN BOMB METHODOLOGY FOR STUDYING FRYING
CHEMISTRY
by
Teng Peng
A thesis submitted to the
Graduate School-New Brunswick
Rutgers, The State University of New Jersey
in partial fulfillment of the requirements
for the degree of
Master of Science
Graduate Program in Food Science
written under the direction of
Professor Karen M. Schaich
and approved by
________________________
________________________
________________________
________________________
New Brunswick, New Jersey
[October, 2010]

ii
ABSTRACT OF THE THESIS
Evaluation of Using Oxygen Bomb Methodology for Studying Frying Chemistry
By Teng Peng
Thesis Director: Professor Karen M. Schaich
OxipresTM oxygen bomb instrumentation was evaluated for measuring oxygen
consumption in studying reactions of food oils at frying temperatures. High oleic
sunflower oil:corn oil blends (60:40 w/w) were heated in OxipresTM cells over a range
of temperatures from 100 to 180 °C under different gases and pressures. Effects of
sample size, temperature, pressure, pressurizing gas, heating time, mixing, and oil
characteristics were determined. Conjugated dienes, peroxide values, aldehydes, and
free fatty acids were measured to relate oxygen consumption curves to other chemical
changes during lipid oxidation.
At 150 °C and above, oxygen consumption exhibited no induction periods and
did not follow Arrhenius kinetics. Curves showed an initial pressure increase associated
with oil heating, followed by a period of rapid decline, then a slowing in pressure
decrease with continued heating. Limitations of oxygen diffusion may contribute to but
do not fully explain this decreasing reactivity.
Oxygen consumption rates and net uptake increased with headspace oxygen
concentration (2, 5, 20, and 100%) and pressure (0.5 to 5 bars). The system accurately
differentiated oxidation sensitivity of oils with different degrees of unsaturation with
high reproducibility (average variation 2.27%). Oxygen consumption correlated with
aldehyde oxidation products, particularly under high oxygen, but not conjugated dienes
or hydroperoxides. Patterns of volatile products collected by short path thermal
iii
desorption tubes connected to Oxipres cells showed a homologous series of C2-C12
alkanes, alkenes, fatty acids, and aldehydes. These products are more consistent with
thermal scission reactions than lipid autoxidation initiated by pre-formed
hydroperoxides.
Overall, the Oxipres system provides very stable, sensitive control of pressure
and temperature, but three modifications would improve its design. At frying
temperatures, headspace pressure reflects oxygen consumption balanced against
release of volatile products and oxygen produced in reactions. Replacing the current
pressure transducer with an oxygen-specific sensor would eliminate complications
from volatile products. The closed system with slow eddy currents in the oil is a useful
research tool but does not accurately model real-life frying. Addition of a stirring
mechanism would facilitate oxygen diffusion. Finally, a thermocouple to monitor the
actual oil temperature and rates of heating would be very useful.

iv
ACKNOWLEDGEMENTS
I would like to thank the following people, whose contributions were critical for
completion of this thesis:
Dr. Karen M. Schaich, my thesis advisor, for her support through the years. Her
kindness, generosity and patient tutoring helped me achieve this long sought-after
pursuit of higher education. I am grateful for the privilege of having known and
worked with her.
Dr. Thomas Hartman and Dr. Chi-Tang Ho for serving on my thesis committee. Their
comments and suggestions are gretly appreciated.
Dr. Thomas Hartman for providing GC-MS instrumentation and laboratory facilities
and assisting me with analyses to complete my experiments.
Mr. Yakov Uchitel for his technical assistance with computers.
Lili You, my wife, and my parents for their continual support from the first moment that
I decided to pursue higher education in the U.S. I couldn’t achieve all this without their
support and understanding.

v
TABLE OF CONTENTS
ABSTRACT OF THE THESIS ................................................................................................. ii
ACKNOWLEDGEMENTS ...................................................................................................... iv
TABLE OF CONTENTS ........................................................................................................... v
LIST OF TABLES ................................................................................................................... vii
LISTS OF FIGURES ................................................................................................................ xi
2. BACKGROUND ............................................................................................................... 1
2.1. Oil Oxidation ............................................................................................................. 1
2.1.1. Initiation ............................................................................................................. 4
2.1.2. Propagation ...................................................................................................... 11
2.1.3. Termination ...................................................................................................... 17
2.2. Thermal degradation of lipids .................................................................................. 19
2.2.1. Degradation reactions of lipids at high temperatures ....................................... 22
2.3. Methods for detecting and following kinetics of lipid degradation ......................... 28
2.3.1. Traditional chemical assays ............................................................................. 28
2.3.2. Instrumentation for analyzing lipid oxidation .................................................. 35
3. MATERIALS AND METHODS ..................................................................................... 45
3.1. Materials .................................................................................................................. 45
3.2. Experiment Procedures ............................................................................................ 46
3.2.1. Glassware cleaning .......................................................................................... 46
3.2.2. Oil handling and storage .................................................................................. 47
3.2.3. Oxygen bomb analyses .................................................................................... 49
3.2.4. Analyses of Lipid Oxidation Products ............................................................. 60
4. RESULTS AND DISCUSSION ...................................................................................... 66
4.1. Effects of sample size on oxygen consumption curves and oil degradation. ........... 66
4.2. Effects of heating time ............................................................................................. 70
4.3. Reproducibility of the oxygen bomb. ...................................................................... 72
4.4. Oxipres sensitivity to differences in oil unsaturation and structure ......................... 76
4.5. Effects of Pressure (oxygen or air) .......................................................................... 80

vi
4.6. Effects of temperature .............................................................................................. 90
4.7. What processes are being reflected in the Oxipres curves? ................................... 100
4.8. Effect of agitation on lipid degradation. ................................................................ 107
4.9. Correlation of oxygen consumption with chemical assays of lipid oxidation products
and volatile oxidation products .......................................................................................... 119
4.10. Thermal scission versus autoxidation. ................................................................... 125
5. Summary and Conclusion .............................................................................................. 127
6. Future work .................................................................................................................... 130
REFERENCES ...................................................................................................................... 131

vii
LIST OF TABLES
Table 1. Energy at various light wavelength compared to the bond dissociation energies
for typical chemical bonds (Schaich 2005). ........................................................... 8
Table 2. Activation energy of different radicals (Labuza 1971). ................................. 10
Table 3. Effect of alkene structure on preference for addition vs. abstraction by t-BuO•
radicals at 40°C (Kochi 1973). ............................................................................. 15
Table 4. Solvent effect on the rate of H abstraction and the rate of beta scission
(Schaich 2005). .................................................................................................... 16
Table 5. Calculations for headspace volumes and oxygen available with different oil
sample sizes. ........................................................................................................ 56
Table 6. Calculation of n moles O2 in headspace from PV=nRT as f(bomb pressure)
under standard run conditions (Headspace V=162 for standard 10g samples) .... 56
Table 7. Theoretical prediction of cell pressure according to ideal gas law ............... 57
Table 8. Converting factors for bars pressure to mols oxygen at different temperatures.
.............................................................................................................................. 58
Table 9. Effect of sample size on oxygen consumption parameters (180 °C, 5 bars O2).
.............................................................................................................................. 67
Table 10. Peak pressure, maximum oxygen consumption rate, and total oxygen
consumption of soybean oil heated at 180 °C for three hours under 5 bars oxygen.
.............................................................................................................................. 73
Table 11. Peak pressure, maximum oxygen consumption rate, and total oxygen

viii
consumption of Trisun oil heated at 180 °C for three hours under 5 bars oxygen.
.............................................................................................................................. 74
Table 12. Peak pressure, maximum oxygen consumption rate, and total oxygen
consumption of olive oil heated at 180 °C for three hours under 5 bars oxygen. 75
Table 13. Oxygen consumption and oxidation parameters Trisun, olive, and soybean
oils oxygen in Oxipres oxygen bombs. 10 g samples, 180 °C, 3 hours, 5 bars
oxygen .................................................................................................................. 77
Table 14. Oxygen consumption and oxidation parameters for 5 g samples of food oils
heated at 180 °C for 3 hour in Oxipres oxygen bombs ........................................ 78
Table 15. Effect of temperature on oxygen solubility in food oils (data based on
hardened lard and olive oil) (Gunstone 1997). .................................................... 80
Table 16. Effects of oxygen pressure on oxidation parameters of Blend oils heated at
180 °C for three hours under oxygen. .................................................................. 82
Table 17. Effects of air pressure on oxidation parameters of Blend oils heated at 180 °C
for three hours under air. ...................................................................................... 83
Table 18 . Effects of bomb and oxygen pressure on efficiency and proportionality of net
oxygen consumption by Blend oil heated at 180 °C for three hours in oxygen or in
air. ......................................................................................................................... 86
Table 19. Kinetic calculations for pressure effects on oxygen consumption rates and net
oxygen consumption in Blend oils heated at 180 °C for three hours under varying
pressures of oxygen or air. NOC = net oxygen consumption. ............................. 87

ix
Table 20. Oxidation parameters from Oxipres curves of Blend oil heated at various
temperatures for three hours under 5 bars O2. ..................................................... 96
Table 21. Oxidation parameters from Oxipres curves of Blend oil heated at various
temperatures for three hours under 2 bars air ...................................................... 97
Table 22. Oxidation parameters from Oxipres curves of Blend oil heated at various
temperatures for three hours under 5 bars air ...................................................... 97
Table 23. Oxidation parameters from Oxipres curves of Blend oil heated at various
temperatures for three hours under 2 bars O2 ...................................................... 98
Table 24. Q10 values for oxygen consumption by Blend oil heated for 3 hours at
temperatures ranging from 100 to 180 °C. Calculated for zero (k) and first (k’)
order reactions of oxygen. .................................................................................... 99
Table 25. Analysis of kinetic data – effects of temperature under 5 bar and 2 bar air
pressurization ....................................................................................................... 99
Table 26. Comparison of pressure changes in Oxipres cells to oxygen and nitrogen
solubilities in oils. Solubilities taken from Table 13. ......................................... 102
Table 27. Oxidation parameters for Blend oils pre-saturated with oxygen or argon
before heating 3 hours at 180 °C under 5 bars oxygen. ..................................... 106
Table 28. Calculation of swirling contributions to oxygen consumption. ................. 110
Table 29. Major oxidation product of Swirl test, Temperature test and Pressure test.
............................................................................................................................ 121
Table 30 Effect of swirling on volatile products released from oils heated at 180 °C for

x
three hours under 2 bars oxygen or air.
.............................................................. 124
xi
LISTS OF FIGURES
Figure 1. Sequence of free radical reactions in lipid oxidation described by classical
theory .................................................................................................................... 2
Figure 2. Integrated theory of lipid oxidation showing alternate reactions that compete
with hydrogen abstraction. . ................................................................................... 5
Figure 3. Thermal scission patterns observed in heated triacylglycerols . .................. 10
Figure 4. Propagating radicals and non-radical products formed from recombination of
peroxyl radicals during lipid oxidation. . ............................................................. 18
Figure 5. Products formed via recombination of various intermediate radicals in lipid
oxidation. ............................................................................................................. 18
Figure 6. Generalized scheme for oil degradation during frying . .............................. 21
Figure 7. Instrumental configuration of the Mikrolab OxiPresTM Oxygen Bomb. ... 41
Figure 8. Reaction cylinder of oxygen bomb and short path thermal desorption
trap for collection of volatiles when bomb is opened. ......................................... 42
Figure 9 Typical oxygen consumption curves acquired by oxygen bomb. These curves
were generated from food oils containing various levels of antioxidants ........... 43
Figure 10. Typical Oxipres oxygen consumption generated when oils are heated to
high temperatures (180 °C) under 5 bars oxygen pressure, showing parameters
measured for each run. ......................................................................................... 51
Figure 11. Oxipres curves for empty cells. Signal to noise and detection limits were
determined from data in boxed region. ................................................................ 59

xii
Figure 12. Oxygen consumption of different sample size under 5 bars oxygen pressure
and 180°C for 6 hours. ......................................................................................... 67
Figure 13. Change in initial oxygen consumption rates and net oxygen consumption as
a function of sample size for Blend oil heated in the Oxipres for six hours at 180
°C under 5 bars oxygen. ....................................................................................... 68
Figure 14. Browning due to the thermal degradation as a function of sample size after
heating at 180 °C for 3 (top) and 5 (bottom) hours. ............................................ 69
Figure 15. Excessive browning in Trisun oil heated at 180 °C for 24 hours. ............. 70
Figure 16. Effect of heating time on oxygen consumption by Trisun oil heated to 180
°C under 5 bars oxygen. ....................................................................................... 71
Figure 17. Reproducibility of oxygen consumption by soybean oil heated at 180 °C for
three hours under 5 bars oxygen. Note the expanded scale. ................................ 73
Figure 18. Reproducibility of oxygen consumption by Trisun oil heated at 180 °C for
three hours under 5 bars oxygen. Note the expanded scale. ................................ 74
Figure 19. Reproducibility of oxygen consumption by olive oil heated at 180 °C for
three hours under 5 bars oxygen. Note the expanded scale. ................................ 75
Figure 20. Comparison of oxygen consumption by mono-unsaturated Trisun (T) and
olive (O) oils with polyunsaturated soybean oil (SBO). Oils were heated at 180 °C
for three hours under 5 bars oxygen. ................................................................... 77
Figure 21. Comparison of oxygen consumption by mono-unsaturated Trisun (T) and
olive (O) oils with polyunsaturated soybean oil (SBO). Oils were heated at 180 °C

xiii
for eight hours under 5 bars oxygen. Sample weights were 20 and 45 g. ........... 78
Figure 22. Browning differences in mono-unsaturated Trisun oil and polyunsaturated
soybean and Enova oils heated at 180 °C for 24 hours under 5 bars oxygen. .... 79
Figure 23. Effects of oxygen pressure on total oxygen consumption and rates of Blend
oils heated at 180 °C for three hours. Top: full curves. Bottom: normalized to peak
pressure. ............................................................................................................... 81
Figure 24. Effects of pressure (air) on total oxygen consumption and rates Blend oils
heated at 180 °C for three hours. ........................................................................ 82
Figure 25. Effects of oxygen pressure on initial pressure drop for Blend oil samples
heated under oxygen (blue) or air (red) at 180 °C for three hours. Best fit
regression equations are shown ........................................................................... 83
Figure 26. Effects of oxygen pressure on net oxygen consumption for Blend oil samples
heated under oxygen (blue) or air (red) at 180 °C for three hours. Best fir
regression equations are shown. .......................................................................... 84
Figure 27. Oxygen pressure effects on rate of oxygen consumption increase in Blend
oils heated for three hours at 180 °C under air at various pressures. ................... 86
Figure 28. Oxygen consumption curves for Blend oil heated at temperatures ranging
from100 to 180 °C under 5 bars oxygen. Top: full curves showing initial increase
with heating (PV=nRT). Bottom: curves normalized to peak pressure to facilitate
comparison of rates. ............................................................................................. 92
Figure 29. Oxygen consumption curves for Blend oil heated at temperatures ranging

xiv
from100 to 180 °C under 2 bars oxygen. Top: full curves showing initial increase
with heating (PV=nRT). Bottom: curves normalized to peak pressure to facilitate
comparison of rates. ............................................................................................. 93
Figure 30. Peak-normalized Oxygen consumption curves for Blend oil heated at
temperatures ranging from100 to 180 °C under 2 bars oxygen. Top: full curves
showing initial increase with heating (PV=nRT). Bottom: curves normalized to
peak pressure to facilitate comparison of rates. ................................................... 93
Figure 31. Oxygen consumption curves for Blend oil heated at temperatures ranging
from100 to 180 °C under 5 bars air. Top: full curves showing initial increase with
heating (PV=nRT). Bottom: curves normalized to peak pressure to facilitate
comparison of rates. ............................................................................................. 94
Figure 32. Peak-normalized Oxygen consumption curves for Blend oil heated at
temperatures ranging from100 to 180 °C under 5 bars air. Top: full curves showing
initial increase with heating (PV=nRT). Bottom: curves normalized to peak
pressure to facilitate comparison of rates. ............................................................ 94
Figure 33. Oxygen consumption curves for Blend oil heated at temperatures ranging
from100 to 180 °C under 2 bars air. Top: full curves showing initial increase with
heating (PV=nRT). Bottom: curves normalized to peak pressure to facilitate
comparison of rates. ............................................................................................. 95
Figure 34. Peak-normalized Oxygen consumption curves for Blend oil heated at
temperatures ranging from100 to 180 °C under 2 bars air. Top: full curves showing

xv
initial increase with heating (PV=nRT). Bottom: curves normalized to peak
pressure to facilitate comparison of rates............................................................. 95
Figure 35. Lack of oxygen consumption in empty cells heated at 180 °C under standard
conditions, 5 bars oxygen. ................................................................................. 101
Figure 36 Oils heated in the Oxipres under nitrogen show no oxygen consumption.
............................................................................................................................ 102
Figure 37. Effect of pre-sparging Blend oils with argon vs oxygen before heating for 3
hours at 180 °C under 5 bars oxygen. Top: direct curves as recorded. Middle:
Curves normalized to peak pressure. Bottom: Curves normalized to final pressure
to show points of divergence between oxygen and argon. ................................ 105
Figure 38. Top: Oxygen consumption curves for 10 g samples of Blend heated at 180
°C under 2 bars air pressure with and without gentle laminar swirling when the
Oxipres cell was removed periodically from heater. Bottom: Change in pressure
drop with time out of heater. Best fit curves with swirling: y = 0.0035x2 + 0.0596x
- 0.092, R2 = 0.9906; without swirling: y = 0.0016x2 + 0.0719x - 0.1335, R2 =
0.9927. ................................................................................................................ 109
Figure 39. Effect of vigorous swirling on oxygen consumption curves of Blend oil
heated at 180 °C for three hours under 2 bars air pressure. ............................... 112
Figure 40. Oxygen consumption curves for 10 g oil samples heated at 180 °C under 2
bars oxygen pressure static or with swirling during periodic removal of the
Oxipres cell from the heating block for three minutes. Swirl times: 30 seconds

xvi
every 15 minutes. ............................................................................................... 113
Figure 41. Effects of swirling under 2 bars oxygen or air on distribution and quantities
of volatile products released from oil heated at 180 °C in the Oxipres system. Top
two curves, heating under oxygen without (control) and with swirling. Bottom two
curves, same but heating under air. Numbers shown at the right end of each
chromatogram are the total area under the curve. .............................................. 123

1
2. BACKGROUND
2.1. Oil Oxidation
For decades lipid oxidation has been notorious as the main chemical reaction
responsible for shortening the shelf life of food. The process requires initiators, but
once started is self-propagating and very difficult to stop. Lipid oxidation not only
produces off-flavors by generating aldehydes, alcohols and other oxidized products, but
many of these products are toxic to some extent (Claxson 1994; Eldin 1997; Moreno
1999) and almost all lipid oxidation products react with other food molecules to alter
the texture and other qualities of foods in both positive and negative ways.
For the past twenty to thirty years, the food industry has considered that
everything about lipid oxidation and how to prevent it in foods was known. Following
standard understanding, the common stabilization practice used in industry has been to
formulate with saturated or mono-unsaturated fats and add synthetic anti-oxidants.
However, with the new emphasis on the health, there is great pressure on industry to
replace saturated fats with poly-essential unsaturated fatty acids (PUFAs) and to use
natural anti-oxidants instead of synthetics. High PUFA oils oxidize much more readily,
and former standard approaches are inadequate for stabilizing them. It’s clear that a
new understanding of lipid oxidation in a wide range of systems is needed.
According to the classical theory of lipid oxidation, the process is divided into
three distinctive stages -- initiation, propagation and termination (Figure 1). These have
been reviewed in detail by Schaich (Schaich 2005). Lipid autoxidation is a free radical

2
CLASSICAL FREE RADICAL CHAIN REACTION OF LIPID OXIDATION
Figure 1. Sequence of free radical reactions in lipid oxidation described by classical theory (Schaich 2005)
Initiation (formation of ab initio lipid free radical) L1H L1
• Propagation
Free radical chain reaction established L1
• + O2 L1OO•
L1OO• + L2H L1OOH + L2•
L2OO• + L3H L2OOH + L3
• etc. LnOOH Free radical chain branching (initiation of new chains) LnOOH LnO•
+ OH– (reducing metals)
LnOOH LnOO• + H+ (oxidizing metals) LnOOH LnO•
+ •OH (heat and uv)
LnO•
LnOH
LnOO• + L4H LnOOH + L4•
HO• HOH
L1OO• + LnOOH L1OOH + LnOO• L1O• + LnOOH L1OH + LnOO• Termination (formation of non-radical products) Ln
• Ln•
LnO•
+ LnO•
polymers, non-radical monomer products
(ketones, ethers, alkanes, aldehydes, etc.) LnOO• LnOO•
LOO•
LO•
i - initiation; o-oxygenation; β- O2 scission; p-propagation; d-dissociation; t-termination; ts–termination/scission
non-radical products (aldehydes, ketones, alcohols, alkanes, etc.)
kp1
Radical recombinations
ki
kp1
kd1
kd2
kd3
kp2 kp1 kp3
kt1 kt2 kt3
kts1
kts2
ko kβ
kp4
kp5
Radical scissions

3
chain reaction that is not thermodynamically spontaneous, but requires initiators such
as metals, light, other free radicals, photosensitizers, heat, radiation, etc. In the
propagation stage, a free radical produced during initiation first reacts with oxygen to
form a peroxyl radical, which then abstracts a hydrogen atom from a nearby lipid
molecule to produce a hydroperoxide and a new acyl radical. This radical repeats
peroxyl radical formation and hydrogen abstraction to generate still another new free
radical and continue the chain. This cycle continues indefinitely, potentially producing
very high levels of hydroperoxides. However, hydroperoxides themselves are
decomposed by ultraviolet light, heat, and metals to produce alkoxyl radicals, which are
even more reactive than peroxyl radicals. They, too, abstract radicals to initiate new
chains and broaden the oxidation; this process is called branching. In the last stage --
termination -- radicals recombine with themselves to form a wide range of non-radical
monomer, dimers, and polymer products, and alkoxyl radicals undergo scission to
generate aldehydes, alkanes, and other oxidation fragments. The full process has been
shown to be much more complex than normally depicted, with multiple alternate
reaction pathways competing with hydrogen abstraction for each major intermediate
(Schaich, 2005; Figure 2). However, for the purpose of the current study, the simple
classical sequence is sufficient.
The following discussion presents additional details of the reactions in each of
the three stages of lipid oxidation.

4
2.1.1. Initiation
Based on quantum mechanics, oxygen in the air is in a triplet state and thus
cannot react with singlet state carbon-carbon double bonds, so direct addition of
oxygen to double bonds cannot occur(Schaich 2005). Nevertheless, common
observation shows lipid oxidation to be extremely easy to set off, so obviously,
something is connecting oxygen and lipid molecules to make the reaction much easier
than it should be thermodynamically. This connection is a variety of initiators which are
able to react directly with the double bond to form a species capable of initiating
oxidation free radical chains. As mentioned previously, metals, light, heat, preformed
radicals or hydroperoxides, and photosensitizer are all common initiators that trigger
the whole process on set. The discussion below shows briefly how each of these
catalysts work.
2.1.1.1. Metals
Transition metals are well-known catalysts of lipid oxidation and probably the
most active initiators in foods. The catalytic mechanism of metals can be divided into
two major categories: direct initiation through higher valence metals and indirect
initiation and propagation or chain branching (Schaich 1992).

5
Figure 2. Integrated theory of lipid oxidation showing alternate reactions that compete with hydrogen abstraction (Schaich 2005).
LO• + OH– + M(n+1)+HO• + •OL
+/- Electro
n
trans
fer
L•
LOO•
LOOH
LH
O2
Hydrogen abstraction from LH or RH
β -Scission of O2Isomerization
Cis → trans
Cyclization
LOO+ or LOO–
H+
Epoxides-•
Scissio
n
Cyc
lizat
ion
H abstraction
C=C
A
dditi
on
Mn+hν ∆
E, 1 e– oxidation
Epidioxides•, Endoperoxide
Dimers•
Polymers
Addition
Cycliza
tion
LOH + L•
Epoxides•
+ LO•
Epoxides(Hydroxy-, hydroperoxy- )
Polymers
Recombination
Peroxides, ketones
Scission
AldehydesAlkanes, Oxo cmpds.,
Scission radicals •
Secondary oxidations
Dimers
O2
O2
O2-CH=CH- addition
INTEGRATED SCHEME FOR LIPID OXIDATION

6
Direct initiation through higher valence metals.
Electron transfer from high valence metal to lipid molecules generates radicals
that then initiate radical abstraction chains. Electron transfer to –CH=CH– oxidizes one
bond from the double bond (Schaich 2005), forming a free radical on one carbon atom
and reducing the metal ion to its lower valence state. The carbon-centered free radical
adds oxygen and then is able to attack any lipid molecules nearby and start the chain
reaction:
RCH=CHR + M(n+1)+ RCH–CHR + Mn+ L• + RH (1)
Carbon-centered radicals are similarly formed when the electron is transferred to
carbon-hydrogen bonds; the radical thus generated also adds oxygen and abstracts
another hydrogen from adjacent lipids and start the chain reaction:
RH + M(n+1)+ R• + H+ + Mn+ L• + RH (2)
Higher valence ions can also affect the lipid oxidation during propagation by causing
chain branching. This reaction will be discussed under Propagation.
Initiation through lower valence metals. Lower valence metals such as Fe2+
reduce oxygen to form superoxide (O2−•) and hydroxyl (•OH) radicals that can react
directly with lipid molecules (Reactions 3 and 4).
Fe2+ + O2 Fe3+ + O2–•
HOO• L• + H2O2 (3)
Fe2+ + H2O2 Fe3+ + HO− + •OH L• + H2O (4)
Fe2+ can also reduce preformed hydroperoxides from lipids or other molecules.
For example, as shown in Reaction 5, Fe2+ reduces LOOH into alkoxyl radicals that can
LH
H+ LH
LH
• +
LH

7
propagate the chain reaction; at the same time, Fe2+ is oxidized to Fe3+, which is also a
strong catalyst for lipid oxidation (Reaction 1). Fe3+ also oxidizes hydroperoxides to
peroxyl radicals (Reaction 6). Thus, when both ferrous and ferric iron are present, the
catalytic effect is very much enhanced redox cycles continuously generate radicals and
recycle reactive iron forms..
Mn+ + LOOH Mn+1 + LO• + HO− LOH + L2• (5)
M(n+1)+ + LOOH Mn+ + LOO• + H+ LOOH + L2• (6)
2.1.1.2. Light
Light radiation impinges energy on bonds of lipid molecules to directly initiate
the chain reaction (Schaich 2005). However, initiation by this mechanism is
considerably less efficient than by metals or other methods. Bond scission to generate
carbon-centered radicals from carbon-carbon bonds (double or single) or from
carbon-hydrogen bonds, which are dominant chemical bonds one would expect in fresh
oil, requires tremendous energy. Only light in the lower wavelength range of UV light,
which is not very abundant in in-door lighting, has sufficient energy (Table 1), and even
when radicals do form, there is usually not enough energy to push them apart, so they
recombine and seldom start chain reactions (Schaich 2005).
Ultraviolet light is most active in scission of hydroperoxides where the O-O bond
energy is only 157 KJ/mol. This means that if the oils or lipids are oxidized before use
and even tiny amount hydroperoxides form, exposure of samples to light will
L2H

8
decompose any hydroperoxides present and initiate lipid oxidation chains:
Table 1. Energy at various light wavelength compared to the bond dissociation energies for typical chemical bonds (Schaich 2005).
ROOH RO• + •OH ROH + L• (7)
HOOH HO• + •OH H2O + L• (8)
LOOH LO• + •OH LOH + L2• (9)
Visible light does not have enough energy to break bonds, but in the presence of
photosensitizers that harvest and transform light energy to usable chemical energy, it
can still initiate lipid oxidation. As shown below, there are two types of
photosensitizations: free radical (Type 1) and singlet oxygen (Type 2) (Schaich 2005).
In Type 1 photosensitization, low energy light is collected by the sensitive molecules,
transformed to excited state chemical energy, and transferred directly to lipid molecules
uv
uv LH
uv LH
Type 1 – Redox/Free Radical
0S + AOO• LOOH
1S + 1O20S + LOOHLH
H+
1S + 1O2 LOOH
•SH + •L 0S + LOO• LOOH
(S–• + L+•) or (S+• + L–•) oS + LOOH
Type II – OxygenationA. Direct 3O2
LH
L-e–
O2
B. Indirect
H+
S-O2∗
O2 H+LH-H+
1S 3S*hν
3O2
Type 1 – Redox/Free Radical
0S + AOO• LOOH
1S + 1O20S + LOOHLH
H+
1S + 1O2 LOOH
•SH + •L 0S + LOO• LOOH
(S–• + L+•) or (S+• + L–•) oS + LOOH
Type II – OxygenationA. Direct 3O2
LH
L-e–
O2
B. Indirect
H+
S-O2∗
O2 H+LH-H+
1S 3S*hν
3O2
LH

9
to form free radicals. Except in kinetics, this is indistinguishable from normal
autoxidation. In contrast, in Type 2 reactions, the photosensitizer transfers the
excitation energy to oxygen, forming singlet oxygen which can now add directly to
double bonds (also in singlet state) to form hydroperoxides with no radicals involved:
Unlike autoxidation, singlet oxygen photosensitization has no induction period,
is independent of oxygen but dependent on concentration and type of photosensitizer(s),
and forms internal non-conjugated hydroperoxides as readily as external conjugated
products because the oxygen addition across bonds is non-selective for double bond
position in the acyl chain and hydroperoxide formation is non-selective for carbon
position in the double bond (Reaction 10).
(10)
2.1.1.3. Heat
Of the various reactions in the sequence of lipid oxidation, all have very low
activation energy except decomposition of the hydroperoxides. Thus, at moderately
elevated temperatures, the major effect of heat is to provide the energy to drive
decomposition of lipid hydroperoxides (Lundberg and Chipault 1947; Labuza 1971).
The alkoxyl radicals produced in the decomposition then abstract hydrogens to start
new chains, now at a much faster rate than early peroxyl radicals. The net effect is to
double the rate of oxidation for every 20 °C rise in temperature(Labuza 1971).
At high temperatures such as are used in frying, thermal energy provides enough energy
OO
H
R'
OO
R
H
R'
R

10
to break chemical bonds. According to extensive research by Nawar (Nawar 1985),
Table 2. Activation energy of different radicals (Labuza 1971).
Reaction
ko (L• + O2) 0 kcal/mole
Activation energy (Ea)
kp (LOO• + LH) ~5-15
kt (2 ROO•) ~4
kt (2 R•) 5
kt (R• + ROO•) 1
kd (monomolecular) (LOOH →) 31
kd (bimolecular) (2 LOOH →) 50 uncatalyzed system
C-C bonds alpha, beta and gamma to the carboxylic group in saturated fatty acids and to
double bonds for unsaturated fatty acids will preferentially undergo scission reactions
generating C• free radicals at an extremely rapid rate. A general summary of expected
thermal scission products in oils during high temperature frying are shown in Figure 3.
More details of thermal degradation reactions will be presented in Section 1.2.
Figure 3. Thermal scission patterns observed in heated triacylglycerols (Nawar 1985).

11
2.1.2. Propagation
In the propagation stage, two major intermediate products, peroxyl radicals
(LOO•) and alkoxyl radicals (LO•), transfer radicals to new lipid molecules, keeping
the chain reaction going (Schaich 2005). Each radical dominates at different stages.
Peroxyl radicals form at the very beginning of the chain reaction, and their relatively
slow, specific reactions dictate kinetics and pathways during early stages of oxidation.
Alkoxyl radicals are generated from decomposition of hydroperoxides, the product of
LOO• hydrogen abstraction reactions, so they become important later in the chain
reaction after peroxyl radicals and hydroperoxides have accumulated. Since LO•
reaction rates are several orders of magnitude higher than LOO•, these radicals are
responsible for the rapid rate period commonly observed in lipid oxidation. As will be
outlined below, both radicals undergo rearrangement/cyclization, addition, and scission
reactions in addition to hydrogen abstraction to keep the chain reaction going. Both
propagators are of importance when studying lipid oxidation.
2.1.2.1. Propagation by peroxyl radicals
The classical reaction by which peroxyl radicals propagate the radical chain is by
H-abstraction as shown in reaction 11 and 12.
L1OO• + L2H L1OOH + L2• (11)
L1OO• + L3OOH L1OOH + L3OO• (12)
Peroxyl radicals simply abstract hydrogen atoms from neighboring H sources, in this

12
case lipids, to form a hydroperoxide and another carbon centered radical which will
then react with oxygen to give a new peroxyl radical and start another oxidation cycle.
Theoretically, as long as there is no intervention and susceptible targets are available,
this process can repeat itself indefinitely. H abstraction can also occur from
hydroperoxides, which results in an overall slow-down of the oxidation.
It is important to note, however, that other reactions compete with and
supplement H abstraction for propagating the chain, and these alternate reactions
change both the kinetics and product mix of lipid oxidation. Peroxyl radicals undergo
internal rearrangement, reacting with a double bond within the same lipid molecule to
form epidioxides (internal cyclic peroxides). The prerequisite for this reaction is a
cis-double bond at the beta-position relative to LOO•, and the reaction proceeds by a
1,3-addition (Reaction 13). For fatty acid with four double bonds, e.g. EPA and DHA,
1.4-addition of the peroxyl radical to the gamma double bond forms a 6-oxo ring
(Reaction 14) (Schaich 2005).
(13)

13
(14)
A third alternate reaction occurs when allylic hydrogens are not readily available.
LOO• then preferentially adds to conjugated or terminal double bonds to form a dimer
and an acyl radical as shown in Reaction 15 (Schaich 2005). The LOO- then undergoes
beta scission to release epoxy alkyl and alkoxyl radicals that continue to propagate the
chain reaction (Reaction 16).
(15)
(16)
Other pathways that carry the radical chain include recombination of LOO• and
LOO• and beta scission of LOO•, which will release oxygen and more reactive alkoxyl
radicals. Reactions of these radicals will be discussed in the following section.
2.1.2.2. Propagation by alkoxyl radicals
After a period time of accumulation, hydroperoxides decompose to LO• and •OH
or OH− by metals, lights and heats or other mechanisms. LO• then becomes the main
radical chain carrier. LO• reactions are much faster that LOO•, but the pathway
alternatives are quite similar: 1, H abstraction, 2 Rearrangement, 3, Addition and 4,
alpha and beta scission.

14
When hydrogen sources are abundant and immediately available to alkoxyl
radicals (e.g. high lipid concentrations or lipid alignment as in membranes), H
abstraction leads the chain reaction (Reaction 17).
R1–CH–R2 + LH R1–CH–R2 + L• (17) O• OH
LO• abstracts both allylic (next to a double bond) and bis-allylic (between two double
bonds) hydrogens on lipid molecules, while LOO• can only be effective on the latter
ones (Schaich 2005). Therefore, the degree of unsaturation of the component free fatty
acid is crucial to the rate of abstraction.
-CH2-CH=CH-CH2-CH=CH-CH2-
As with peroxyl radicals, when H accessibility becomes more limited (e.g. low
lipid concentrations) or double bond targets become more accessible (chains aligned on
surfaces), other reaction pathways compete to propagate the chain reaction. Generally
speaking, when lipid concentration or oxygen pressure are low, or the system is at room
temperature, or lipid molecules are in high polarity solvents or aligned in monolayers,
the dominant reaction shifts to internal rearrangement or cyclization in which LO• add
to a beta double bond in 1,2 cyclization, forming epoxides and epoxyalkyl radicals
which then add oxygen and propagate the chain (Reaction 18):
(18)
Addition of LO• to double bonds on other lipid molecules is another alternative
Allylic hydrogens
Bis-allylic hydrogen

15
pathway, but very difficult to happen since alkoxyl radicals have such a strong
preference for allylic hydrogens (Reaction 19, Table 3). However, when allylic
hydrogens are limited in quantity or accessibility, addition reactions become more
favorable. LO• then adds to a cis double bond, forming a dimer adduct with a free
radical that adds oxygen and propagates the radical chain.
(19)
Table 3. Effect of alkene structure on preference for addition vs. abstraction by t-BuO• radicals at 40°C (Kochi 1973).
Alkene
R-CH=CH-R (trans) 95 3-4
Abstraction (%) Addition (%)
R-CH=CH-R (cis) 83 17
R-CH=CH2 97 3
R2-CH=CH2 83 17
Beta scission is the fourth alternative pathway for radical transfer. C-C bonds on
either side of the alkoxyl radical are cleaved, producing two radicals that transform to
aldehydes and new propagating peroxyl radicals (Reaction 20). This reaction is
particularly responsible for generation of off-flavors and odors when oils or fat-
containing foods become rancid.

16
(20)
Beta scission is favored by polar solvents that support formation of polar transition
states that facilitate transformation of non-polar alkoxyl radicals to polar aldehyde
products (Reaction 21).
(21)
Table 4 shows how solvent polarity increases relative rates of beta scission reactions
over H abstraction. Heat also promotes scission reactions since thermal energy offered
by heat helps the reaction to overcome the high Ea of disrupting bonds (Schaich 2005)
Table 4. Solvent effect on the rate of H abstraction and the rate of beta scission (Schaich 2005).

17
2.1.3. Termination
Lipid oxidation is a problem from the moment of harvest of plants or slaughter of
animals, where lipids are protected by their natural environments, through food
processing, to packaging and storage of finished food products. Theoretically, as long
as oxygen is available, the chain reaction will proceed indefinitely. In an open system
where oxygen from air is limitless, plus light energy and other possible catalysts, the
reaction will not stop until the lipids or oils are completely decomposed. From a
practical standpoint, however, this never occurs for two major reasons. First, in most
processed foods, vacuum or nitrogen-flushed headspaces limit the amount of available
oxygen, freezers and refrigerators keep thermodynamic energy low, and packaging
limits light, so oxidation can be tremendously slowed. In addition, as products
accumulate, self-reactions turn the chain off in the third stage: termination.
Termination is usually cited and shown as a series of radical recombinations.
Peroxyl radicals recombine in multiple processes that involve both non-radical and
radical termination (Figure 4). When non-radical termination happens, alcohols,
ketones, dimers, and peroxides are formed. Radical propagation is more complex since
resulting alkoxyl and peroxyl radicals recycle to propagate the chain. Interestingly,
when LOO• recombination occurs by either mechanism, oxygen is released back to the
headspace and becomes available to fuel additional oxidations. Oxygen release in
termination reactions complicates measurement of lipid oxidation kinetics by oxygen
consumption. This is also one of the major difficulties in our project when using

18
OxypresTM oxygen bomb instrumentation to measure the net oxygen consumption.
Figure 4. Propagating radicals and non-radical products formed from recombination of peroxyl radicals during lipid oxidation( Schaich 2005)
Figure 5. Products formed via recombination of various intermediate radicals in lipid oxidation(Schaich 2005).

19
2.2. Thermal degradation of lipids
Thermal degradation of lipids at high temperatures (e.g. frying) is an enormously
complex process complicated by the presence of two modes of degradation (thermal
scission and autoxidation), Arrhenius effects of heat on reaction kinetics, and the
presence of water (introduced with foods) that facilitates hydrolysis. Although frying
chemistry of oils has been studied extensively (Kamal-Eldin 1997; Shen, Fehr et al.
1997; Saguy 2003; Coni 2004; Frankhauser-Noti 2006), the detailed mechanisms of
thermal degradation remain poorly understood and highly controversial, with several
schools of thinking.
The global reaction scheme in Figure 6 shows the current general thinking about
what happens during frying(Schaich 2008). Because foods always introduce water into
oils, hydrolysis to free fatty acids has long been considered the first degradation at high
temperatures.
Free fatty acids are quite reactive and go on several possible ends.
1) They oxidize to a variety of small products, including aldehydes, methyl ketones,
and lactones that are characteristic flavor and aroma compounds((Kamal-Eldin 1997).
2) They polymerize to dimers, trimers, and higher polymers, with and without
oxygen bridges that increase viscosity of oils (Nawar 1985).
3) They react with any soft metals present to form soaps that contribute to foaming
and formation of off-flavors.
This scheme has been developed largely from observations in commercial frying

20
or in research settings that model commercial frying, where heating under abusive
conditions is common. However, it is clear that much remains to be learned about
reactions connecting the various intermediates and end products and how the reactions
involved differ from autoxidation.

21
R'-COCH
CH2OC-R'''
CH2OC-RO
O
RCOOHR'COOHR''COOH
heat
(H2O)
+
CHHC=O
CH2heat
(O2)
Triacylglycerols (oils)
Free fatty acids
Glycerol Acrolein
Heat Oxidation
Oxidation productslactones,methyl ketones,aldehydes, etc.
(Flavor and aroma)
Heat Oxidation
Heat
Free radicals
Dimers and polymers
rxn w Na, K, Ca, etc.
Soap formation(foaming)
Increased viscosity
Browning
Browning
(toxic)RCOOH
+RCOOHR'COOH
R'-COCHO
CH2OC-R'''
CH2OH
O
O HOCH
CH2OC-R'''
CH2OH
O HOCH
CH2OH
CH2OH
+
Diacylglycerols Monoacylglycerols
Figure 6. Generalized scheme for oil degradation during frying (Schaich 2008).

22
2.2.1. Degradation reactions of lipids at high temperatures
There is a large volume of data in the literature describing oil performance during
heating under a wide range of conditions and fry times. Review of this body of
literature is beyond the scope of this thesis, except to note that most studies have been
oriented towards use performance; very few studies have investigated degradation
mechanisms and kinetics in general, let alone in detail. This is not surprising
considering the rapid kinetics and complex product mixtures of thermal oxidation.
At room temperature, lipid oxidation requires an initiator such as metals,
radiation, or light to form the ab initio radical that starts the radical chain. Initiators are
required at high temperatures as well, and two are available:
a) Thermal energy preferentially cleaves C-C bonds alpha, beta and gamma to
the carboxylic acid group in saturated fatty acid and double bonds for unsaturated fatty
acids (Nawar 1985), although products from radical scissions all along the chain have
been observed (Yu 1997). A simplified schematic flow showing the possible thermal
scission products during high temperature frying was presented in Figure 3 (heat as
initiator section). Theoretically, thermal energy is able to cleavage any of the C-C
bonds in the acyl chain, and our GC-MS data of volatiles confirms this, as will be
discussed in more detail later. The radicals so formed generate a wide range of
non-characteristic scission and radical recombination products under inert atmospheres;
in air, thermal scission fragments add oxygen to form terminal peroxyl radicals that
initiate chains of autoxidation.

23
b) Preformed hydroperoxides in oils are decomposed to LO• + •OH (lipid
alkoxyl and hydroxyl) radicals that then drive the degradation strictly by hydrogen
abstraction as in normal autoxidation chains (Frankel 1987; Muik 2005). In
autoxidation, chain cleavage also occurs, but only as a secondary reaction and the
product mix is selective for specific positions on the acyl chain (Frankel 1987; Choe
2006). Therefore, in autoxidation, the secondary products are predictable according
known hydroperoxide formation and alkoxyl radical scission points. For example, with
oxidation of oleic acid, 9-oxo-nonanoic acid and 2-decenal are expected as final
products. These may or may not be formed by thermal pathways.
Whatever the mechanisms and reaction pathways, the kinetics of degradation
increase dramatically with temperature. At room temperature, initiation by trace
concentrations of metals, etc. and propagation by hydrogen abstraction are relatively
slow, so oxidation has a very long induction period and it usually takes days to weeks
for fast oxidation to develop. In thermal degradation, the first free radicals are
generated by thermal scission reactions, probably many occurring at the same time.
Each scission forms two free radicals that can add oxygen to form peroxyl radicals, or
perhaps add -O• to form aldehydes or epoxides directly. Thus, high radical
concentrations may be reached rapidly and maintained as long as heat is applied, as
reflected in loss of induction periods and much faster oxygen consumption as well as
faster formation and accumulation of all products.
There are several practical consequences of this rapid radical generation. First are

24
challenges in determining what products to analyze and how to detect products with
short lifetimes. High temperatures alter kinetics, reaction mechanisms, and products, in
particular shifting distributions and forming some products not present at lower
temperatures(Nawar 1985). It is well known that autoxidation is marked with high
yields of hydroperoxide which are very unstable and decompose readily; with the
addition of heats, the breakdown proceeds even faster. Kamal-Eldin (Kamal-Eldin 1997)
and coworkers found unusually high levels of methyl 8-oxooctanoate, 9-oxononanoate,
10 oxo-8-decenoate, 11-oxo-9-undecenoate, 12-dodecenoate formed from
hydroperoxide decomposition in used hydrogenated rapeseed/palm oil mixture,
conventional sunflower oil and high oleic sunflower oil. They also found small
fragments, supporting thermal scission at multiple sites on the acyl backbone.
During early stages of oxidation under heating conditions, carbonyl groups begin
forming as soon as 150 °C is reached (Moreno 1999) and they increase linearly with
heating time at 170 °C (Farhoosh 2008). Since, as mentioned above (Nawar’s data),
thermal scission occurs randomly at all positions of acyl chains, aldehydes of a greater
variety than in autoxidation, particularly short chain aldehydes, have been reported
(Gillat 2001). Pentane, acrolein, pentanal, hexanal, heptenal and octenal are commonly
reported, heptanes, octane, 2- decenal and 2-undecenal are reported as unique frying
products (Warner 2008)
High levels of epoxides are also typical in frying oils. Methyl
trans-9,10-epoxystearate and methyl cis-9,10-epoxystearate were observed in methyl

25
oleate while methyl trans-9,10-epoxyoleate, methyl cis-9,10-epoxyoleate,
trans-12,13-epoxyoleate and cis-12,13-epoxyoleate were also detected from methyl
linoleate (Frankhauser-Noti 2006; Marmeasat 2008). Under heating conditions, the
amount of epoxide formation was proportional to the heating time (Frankhauser-Noti
2006) .
Dimers and polymers also form during heating (Byrdwell 1999; Marmeasat 2008)
because the radical load can be extremely high and the radicals are too short lived to
migrate so they connect with whatever is nearby. Radical recombinations are also
facilitated by current industrial practice of carefully limiting oxygen by flushing oils
with nitrogen and providing water vapor blankets over fryers. Dimers and polymers
form from linear radical recombinations between molecules, but radical reactions
within molecules lead also to cyclic and bicylic products (Dobson 1997) in much higher
levels than present during autoxidation at lower temperatures.
Another consequence of high radical loads is rapid consumption and thus
decreased efficiency of antioxidants added to frying oils. Although diminished
antioxidant effectiveness has most often been attributed to decomposition of
antioxidants at high temperatures (Pellegrini 2001; Pokorny 2003), the very high
thermal radical load from scission and hydroperoxide decomposition also contributes to
“using up” antioxidant capacity rapidly (Reblova 2006). Differing balances between
these two factors probably account for the large number of conflicting research reports.
For example, Reblova (Reblova 2006) found that the antioxidative activity of

26
gamma tocopherol decreased as temperature increased from 80°C to 150°C, alpha
tocopherol activity remained constant from the temperature range of 80°C to 110°C,
and both tocopherols were totally ineffective at 150°C. Similar results were reported by
Tomaino (Tomaino 2005). De Maria (Maria 2000) found that while quercetin and
5-caffeoylquinic acid (5-CQA) were not effective in stabilizing soybean oil under
heating conditions, quercetin decreased oxidation significantly, and 5-CQA also
protected the oil but less effectively. With the addition of ferric palmitate, quercetin
showed a decrease in antioxidation activity while 5-CQA didn’t, demonstrating that a
major effect of quercetin was through metal binding rather than or in addition to radical
scavenging. Antioxidant volatility is another issue, which may explain why natural
antioxidants are more effective than synthetics at elevated temperatures (Gertz 2000)
In summary, the high energy available from heat makes thermal degradation of
oils and fats very different from autoxidation in initiation mechanism, the ways to
propagate free radicals, final products, and kinetics (Shahina Naz 2005). Thus, studying
thermal degradation requires different approaches than autoxidation at lower
temperatures, especially when it comes to the analysis of degradation products.
Because of the multiple pathways, altered product distributions, and high concentration
of volatile products which do not remain in the oil (Nawar 1985), using any single
product assay will very likely yield a totally inaccurate result. In addition, the rapid
kinetics make it extremely difficult to monitor degradation by sampling. Traditional
methods of frying research typically use long heating times (days to even weeks) in

27
open fryers with little or no control over headspace, while monitoring hydroperoxides,
total polars, and free fatty acids. Under these conditions, sorting out reaction pathways
and early versus late products is virtually impossible. Clearly new research approaches
are needed to more clearly elucidate the sequence and hierarchy of reactions in thermal
degradation of oils.
There currently is considerable controversy over the existence of thermal
scissions and the relative roles of thermal scission vs decomposition of preformed
hydroperoxides as the major initiators of lipid degradation at frying temperatures.
While this difference may seem to be of academic interest only, it becomes critically
important in light of current interest in replacing saturated and mono-unsaturated oils
with more healthy polyunsaturated (PUFA) oils for frying. PUFAs are already highly
sensitive to oxidation, and their degradation at high temperatures is rapid. Thus, it is
very important for the food industry to learn more details of the reactions and
mechanisms involved in thermal degradation of oils so improved stabilization
mechanisms can be developed.
28
2.3. Methods for detecting and following kinetics of lipid degradation
2.3.1. Traditional chemical assays
Based on knowledge of lipid degradation pathways, several classes of key
degradation products have traditionally been major targets for monitoring oil
degradation, namely, conjugated dienes, peroxide values, and aldehydes for oxidation,
and free fatty acids for hydrolysis (thermal, chemical, or enzymatic).
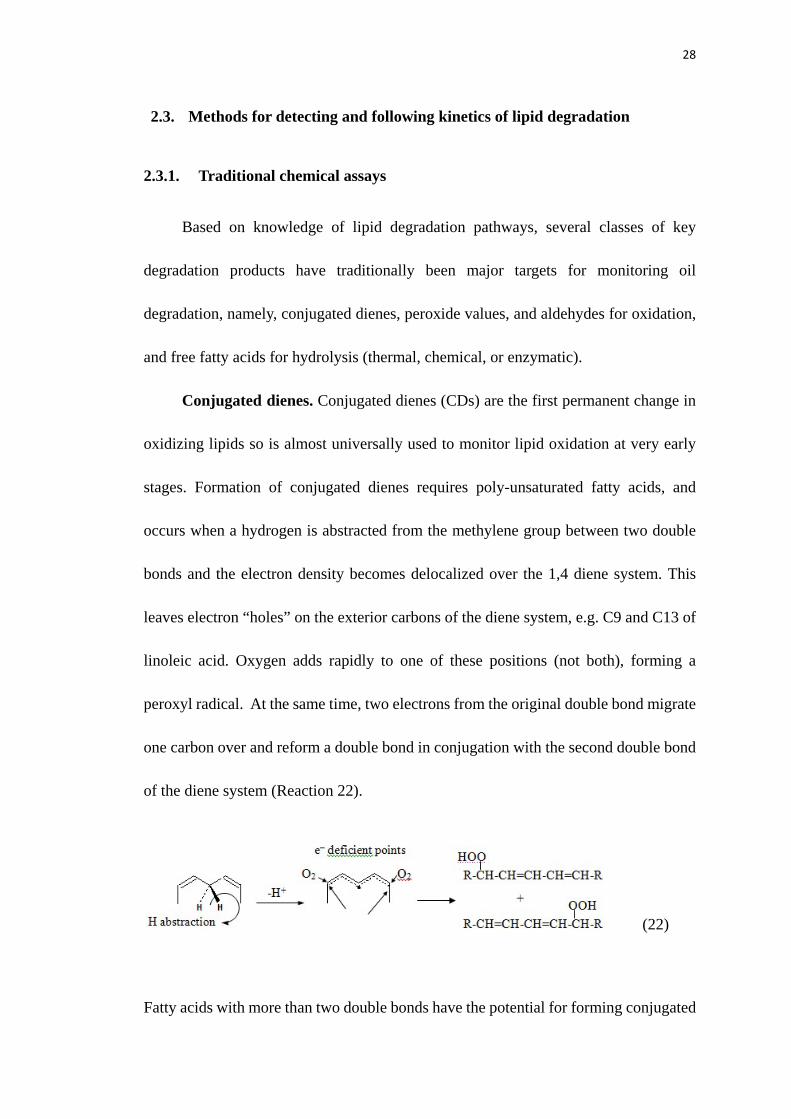
Conjugated dienes. Conjugated dienes (CDs) are the first permanent change in
oxidizing lipids so is almost universally used to monitor lipid oxidation at very early
stages. Formation of conjugated dienes requires poly-unsaturated fatty acids, and
occurs when a hydrogen is abstracted from the methylene group between two double
bonds and the electron density becomes delocalized over the 1,4 diene system. This
leaves electron “holes” on the exterior carbons of the diene system, e.g. C9 and C13 of
linoleic acid. Oxygen adds rapidly to one of these positions (not both), forming a
peroxyl radical. At the same time, two electrons from the original double bond migrate
one carbon over and reform a double bond in conjugation with the second double bond
of the diene system (Reaction 22).
(22)
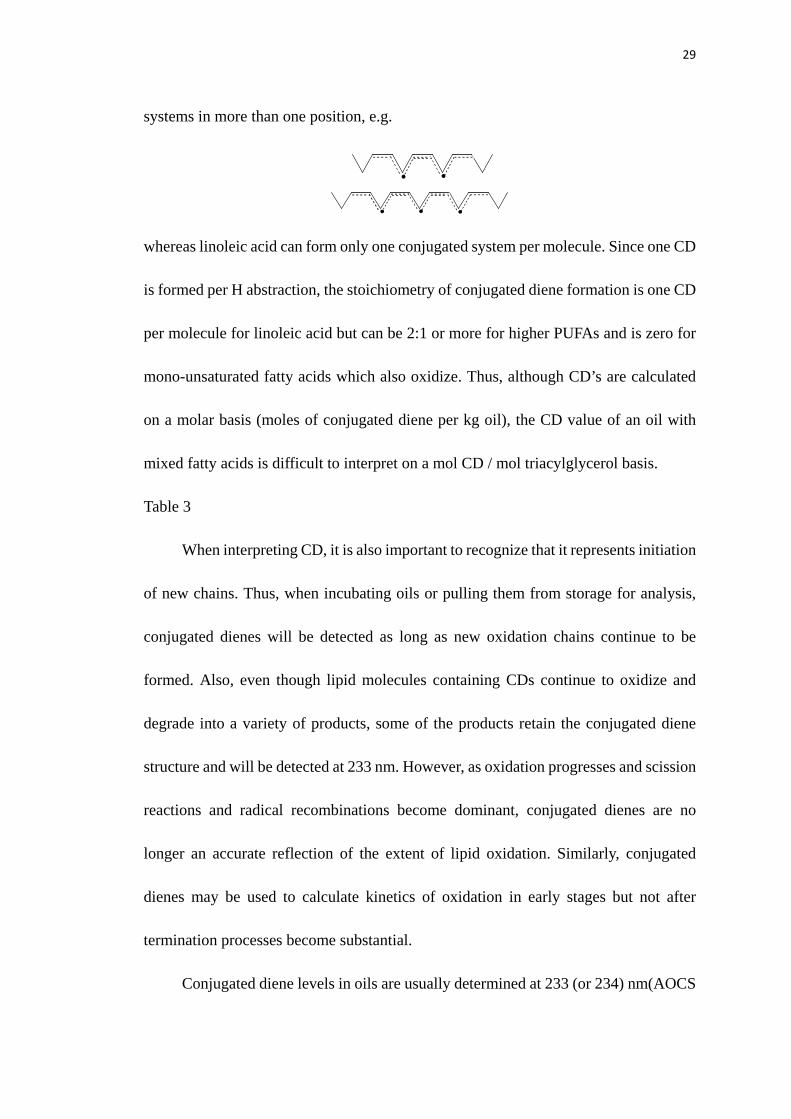
Fatty acids with more than two double bonds have the potential for forming conjugated
29
systems in more than one position, e.g.
..
. . .
whereas linoleic acid can form only one conjugated system per molecule. Since one CD
is formed per H abstraction, the stoichiometry of conjugated diene formation is one CD
per molecule for linoleic acid but can be 2:1 or more for higher PUFAs and is zero for
mono-unsaturated fatty acids which also oxidize. Thus, although CD’s are calculated
on a molar basis (moles of conjugated diene per kg oil), the CD value of an oil with
mixed fatty acids is difficult to interpret on a mol CD / mol triacylglycerol basis.
Table 3
When interpreting CD, it is also important to recognize that it represents initiation
of new chains. Thus, when incubating oils or pulling them from storage for analysis,
conjugated dienes will be detected as long as new oxidation chains continue to be
formed. Also, even though lipid molecules containing CDs continue to oxidize and
degrade into a variety of products, some of the products retain the conjugated diene
structure and will be detected at 233 nm. However, as oxidation progresses and scission
reactions and radical recombinations become dominant, conjugated dienes are no
longer an accurate reflection of the extent of lipid oxidation. Similarly, conjugated
dienes may be used to calculate kinetics of oxidation in early stages but not after
termination processes become substantial.
Conjugated diene levels in oils are usually determined at 233 (or 234) nm(AOCS

30
2003 ) where this unique structure of conjugated double bonds absorbs light. However,
this method is not accurate for food matrix systems because conjugated double bonds
are present in other molecules and are not specific for lipid oxidation, and it cannot be
used with oils that have significant level of carotenoids, which also contain long chains
of conjugated dienes (El-Agamey 2008).
Hydroperoxides (LOOH). Lipid hydroperoxides are the second major chemical
change and the first isolatable product in lipid oxidation so provide another measure of
early stages of reaction. Hydroperoxides form in the first step of propagation when a
peroxyl radical abstracts a hydrogen from another molecule:
(23)
Conjugated dienes and peroxides values are both early stage products, formed
approximately in parallel, and conjugated dienes usually contain hydroperoxide groups.
However, CDs and PVs are not equivalent or interchangeable except under limited
conditions in linoleic acid (McClements 2008). Hydroperoxides form wherever there is
a double bond but CDs are not formed in saturated and mono-unsaturated fatty acids
and, as noted above, they are not formed stoichiometrically in higher polyunsaturated
fatty acids. Furthermore, hydroperoxides can decompose to alkoxyl radicals without
losing the conjugated dienes. Nevertheless, divergence of the values can provide
insights into system chemistry, so the two products are commonly measured together in
oxidizing oils.
The standard method for determining Peroxide Values (PV) is an iodometric

31
titration (AOCS 1986) in which hydroperoxides first oxidize iodide ions to iodine, then
the released I2 is reacted with standardized thiosulfate to determine peroxide
equivalents:
(24)
(25)
Starch solution is added as a reaction indicator since starch binds I2 and forms a blue
complex. The peroxide value is defined as the milliequivalents of peroxide oxygen per
kilogram fat or oil.
Secondary products. It is well-documented that hydroperoxides are highly
unstable and can easily break down to secondary products, particularly aldehydes (Ellis
1966; Ellis 1968; Frankel 1982; Frankel 1987; Esterbauer 1989). Aldehydes therefore
are another class of major products measured when studying lipid oxidation (Claxson
1994; Eldin 1997; Moreno 1999; Muik 2005; Schaich 2005; Smith 2007; Guillen
2009), although the techniques are less well defined and more problematic.
Scission of alkoxyl radicals is one of the major reactions that form aldehydes.
Table 1 has already shown that the O-O bond in hydroperoxides has very low bond
energy (157 kJ/mol), so it readily decomposes to alkoxyl radicals when exposed to heat,
UV radiation, or reducing metals. The alkoxyl radicals then undergo either alpha or
beta scission reactions to form alkanes plus terminal alkoxyl radicals that transform to
aldehydes (Schaich 2005).

32
(26)
Aldehydes are determined by three reactions. 2-alkenals are detected by reactions
with anisidine, which is called p-anisidine value (AOCS 1989). The sample dissolved
in trimethylpentane is reacted with p-anisidine in glacial acetic acid to form a complex
that absorbs at 350 nm. The method is simple but not very sensitive and not fully
representative of oxidation extent since it measures only a single type of aldehyde
which is not formed by all fatty acids (Foo 2006; Osawa 2007).
The thiobarbituric acid or TBA (AOCS 1989) test is another widely used
chemical method for the detection of aldehydes. As with anisidine, it detects a single
product – malonaldehyde, a late-stage breakdown product of linolenic or higher PUFAs.
The reaction is based on the reaction between TBA and carbonyl group to form a red,
fluorescent complex under acidic conditions (Sinnhuber 1967).
Despite its common use, the TBA test is valid only in highly unsaturated lipids
since malonaldehyde is a scission product formed from the middle of a three double
bond segment. It is not accurate with most vegetable oils since they are dominantly
linoleic acid and have little or no linolenic or higher acids. It is used extensively with
meat products where arachidonic acid is a major component. However, the method is
plagued by side reactions with carbonyls in a wide range of non-lipid impurities,
including sugars and proteins, and it reacts with all lipid carbonyl compounds including,
ketones, carboxylic acid and the ones from other ingredient of foods (Rossell 1994).

33
Overall, the traditional chemical methods for determination of the major classes
of oxidation products do not require sophisticated instrumentation, but each has
specific problems and limitations. For measuring lipid oxidation, the major issue is that
monitoring a single product in a reaction with multiple products and pathways cannot
accurately represent the true rate or full extent of oxidation. In addition, the detection
limits of traditional chemical methods are relatively high, and the methods are highly
empirical – huge differences in results can be produced by small differences in handling.
From a practical standpoint, several of the methods are time-consuming, very difficult
to handle large number of samples, and most use lots of glassware as well as large
volumes of oils and solvents. Clearly, alternative approaches are needed to provide
accurate and sensitive analysis of lipid oxidation rates.
Commercial kits for detection of lipid oxidation.
To overcome some of the working limitations noted above for traditional chemical
analyses of lipid oxidation (e.g many reagents, much glassware) and to provide rapid,
reproducible analyses that are easy to handle in large numbers, several commercial kits
have been developed and brought into the market. The SaftestTM (MP Biomedical) and
DiaMed F.A.T.S (DiaMed) kits are two examples of kits developed for both research
and quality control (Gordon 2001; Gordon 2005)
These commercial kits analyze classes of lipid oxidation products, specifically,
peroxides, aldehydes, and free fatty acids. For each test kit, standardized reagents were
developed to react with a characteristic functional group of each product to form

34
colored compound that can be monitored optically and quantitated by extinction
coefficient or standard curves. The advantages of the commercial kits are 1) they use
standardized reagents which minimize variation in analyses, 2) the detection limits are
much lower than the traditional chemical methods (Foo 2006; Osawa 2007), and 3) the
methods are simple and easy to handle with large number of samples.
Despite these positive attributes, in practice, the correlation of ALK Safe is very
low with TBA test, it’s highly correlated with p-anisidine method though (Osawa 2007).
Osawa also reported in another paper that the presence of color in degummed and crude
oil interferes with the result gained from kit method (Osawa 2007). However, Foo
claims that AldeSafe is the most suitable Saftest assay, FaSafe test has a moderate
strong correlation with AOCS official method (Ca5a-40) (AOCS) and Peroxide Safe
has the poorest method. According to these reports, Saftest and other fast test methods
should have limited applications.

35
2.3.2. Instrumentation for analyzing lipid oxidation
As technology has advanced, sophisticated instrumentation methods with much
higher accuracy, precision, and selectivity have now become the mainstream of
studying lipid oxidation chemistry. Gas and liquid chromatography (GC andLC),
Fourier transfer spectrometry (FTIR), nuclear magnetic resonance (NMR) and mass
spectrometry (MS) are several major techniques that have been widely employed for
more detailed identification of lipid oxidation products.
Gas and Liquid Chromatography
GC and LC separate mixture of compounds into individual chemicals that are
then analyzed by a wide range of detectors. GC is used to separate and quantitate
compounds that are either volatile or can be made volatile by derivatization (Kinter
1995). In studies of lipid oxidation, GC has been used to detect hydroperoxides and
hydroxy lipids (Guido et al 1993) individual scission reaction products (Kamal-Eldin
1997) e.g. aldehydes, short chain carboxylic acids, alkanes alkenes, etc. GC has also
been used to measure oxygen consumption during oil storage (Jonsdottir 2005).
LC is the complement to GC in that it separates non-volatile products and cannot
detect any products that volatilize from oils before analysis. Since there are many ways
to manipulate separation parameters (polarity of the mobile phase and stationary phase,
oxidized lipid compounds, flow rate, etc.), separation methods vary a lot from paper to
paper. Both reverse phase and normal phase methods have been reported (Kaufmann

36
2001) (Uran 2001) (Palmer 1984). High performance size-exclusion chromatography is
widely used in the separation of polar and non-polar fractions from oils and fats
(Caponio 2006; Summo 2008). However, a major limitation of HPLC is detection since
lipids have no chromo except absorption of conjugated dienes at 234 nm.Thus,
conventional UV detector is not so feasible for determination of oxidation products of
fats and oils quantitatively without derivatizing functional group to them. Schulte
(Schulte 2002) reported a method by reacting carbonyl groups in aldehydes and ketone
with 2,4-dinitrophenylhydrazine(DNPH), then measure the concentration of
derivatized compound at 370nm. Electro-chemical detector, which discriminate
products by its redox potential, has also been employed for study of lipid(Toth 2004)
(Jin-Hyang 1993). Other detectors like evaporative light scattering detector (Makinen
1996) and mass spectrometer coupled with HPLC (Kerwin 1996; Schneider 1997;
Sjovall 1997) are also very widely used for detailed detection of lipid oxidation
products
Although tentative identification of products can be obtained for both GC and
HPLC by comparison to standards, coupling these technologies with mass
spectrometry greatly improves capabilities for providing details of molecular structures
(Byrdwell 1998; Oliw 1998; Spickett 1998). Chromatographic methods can provide
both class and very detailed product analyses, and detect products accurately at ppm to
ppb levels. However, chromatography usually involves complex sample pretreatment
such as extraction, derivitization, clean-up, condensation, etc (Yamada 1987; Mullertz

37
1990; Yang 1992; Walker 1996). Complex pretreatments may reduce recovery, increase
oxidation, and alter products, therefore complicating the results. In addition, the high
temperatures of GC can decompose hydroperoxides and cause rearrangements of
functional groups (Dobarganes 2002), also yielding inaccurate results.
Fourier Transfer Infrared Spectroscopy (FTIR).
FTIR is light spectroscopy that uses wavelengths in the range of infra-red to
induce vibration of covalent bonds. FTIR is a rapid, non-destructive testing method that
is increasing in popularity as instrumentation improves. Vibrations in different bonds
and functional groups occur with different energies, and this is reflected in the
wavelength of absorption, called the resonant frequency. By measuring how much light
is absorb by the chemical compound at each wavelength, quantitative analysis can be
done. Infrared lights are typically divided into 3 regions: far-infrared (1000-30um),
mid-infrared (30-2.5um) and near infrared (2.5-0.8um), in which, mid and near infrared
have been employed greatly in monitoring the stability and quality of fats and oils in
frying (Gonzaga 2006; Moros 2009). Near infrared absorption was also use for
classification and determination of the extent of oil oxidation (Moreno 1999). It has
been used to study formation of aldehyde, unsaturated aldehydes and conjugated
double bonds with cis-trans isomers (Muik 2005) and anti-oxidant stability (El-Abssy
2009)in oils after heating. Saturation level as an indication of quality of food oil was
also monitored by FTIR to measure the concentration of double bonds (Moros 2009).

38
Nuclear Magnetic Resonance (NMR)
NMR is an even more advanced technology that has been applied to research of
lipid oxidation. In NMR, magnetic nuclei have a magnetic field and applied
electromagnetic pulses that cause the nuclei to absorb energy from electromagnetic
pulses and radiate back. To cause the nuclei to absorb energy, a same frequency of
magnetic field should be applied. Based on this feature, NMR is also capable of
conducting very detailed products with extremely high precision. Secondary oxidation
products, e.g. alkenals, alkanals, dienals and their isomers have been detected by NMR
(Claxson 1994; Moreno 1998; Guillen 2009). Guillen also reported the detection of
aldehydes and epoxides and their isomers by using NMR.
However, this technology is not very frequently used for routine food analysis
due to high cost (so low availability) and sophisticated training needed for operation of
instrumentation and interpretation of spectra.
Oxygen Bombs
All the methods described above for studying lipid oxidation have a common
characteristic -- they measure some downstream oxidative product. However, as shown
in Figure 2, a critical limitation in this approach is that here are many more products
generated than measured in common assays. If the products monitored do not match the
active degradation pathway(s) or extent of oxidation in a sample, erroneous pictures of
lipid oxidation will be generated. Following single products may be acceptable for
quality control when only one class of products affects key quality characteristics such

39
as flavor or aroma. However, when determining kinetics and reaction mechanisms in
basic research, more accuracy is needed.
An alternative approach that avoids these issues is to bypass products, go to the
very beginning of the lipid oxidation chain reactions, and measure oxygen consumption.
Because oxygen addition to free radicals is diffusion controlled and essentially
instantaneous (k>109 L M-1sec-1) and one molecule of oxygen adds to each radical,
oxygen consumption is a sensitive and stoichiometric reflection of the rate of initiation
and also chain propagation. Oxygen consumption offers the additional advantage that
it occurs in the earliest stages of all pathways and is independent of downstream
products that form afterwards.
One method used to measure oxygen consumption is the oxygen bomb (not to be
confused with the oxygen bomb calorimeter), a technique that provides a closed
chamber for reactions to proceed under specific conditions of atmosphere and
temperature. In oxygen bomb analyses, high oxygen pressures are routinely applied to
accelerate autoxidation, and consumption is considered to reflect initiation rates which
provide radical sites for addition of oxygen. Three values are measured:
(1) Antioxidant capability: Determine induction period taking the point when the
O2 pressures begin to drop as the starting point of oxidation. The more delayed
the drop, the better the antioxidant capability
Oxidation rate: Determine linear regression on the part of the curve that is the most
close to linear. The slope is the oxidation rate.

40
(3) Net oxygen consumption: The total oxygen consumption is an indicator of
extent of oxidation.
Contemporary oxygen bombs all consist of four major components in various
configurations – heating block, pressurized sample cell, control unit, and recorder.
Examples of commercial instruments include the Parr calorimeter, Mikrolab
Oxidograph, and Mikrolab Oxipres. The configuration for the Mikrolab OxipresTM
used in this study is shown in Figure 7. The heart of the unit is the reaction cylinder
(Figure 8), a closed reaction chamber into which the oil or fat-containing sample is
placed. On the very top of the reaction cylinder, a pressure transducer sensor monitors
the total gas pressure in the headspace. The reaction cell is pressurized from a gas tank
via the valve on the middle of the rod. Depending on experimental requirements,
different gases can be pressurized into the cylinder. Pressurized reaction cylinders are
placed into heating blocks for reaction. This unit works together with the control unit
(situated underneath it) that provides precisely controlled temperatures for analyses.
The working temperature range is 25°C to 199.5°C. LCD screens on the control units
also allow researchers to monitor the actual gas pressure and working temperature
during the experiment. The heating block temperature and reaction cylinder pressure
are transmitted to a computer for recording and analysis.
Figure 9 shows a typical data curve generated by oxygen bombs. The flat part of
the curve, which is known as induction period, is used as the major indicator of stability
of oils and fat containing food. The slope of the curve after the induction period
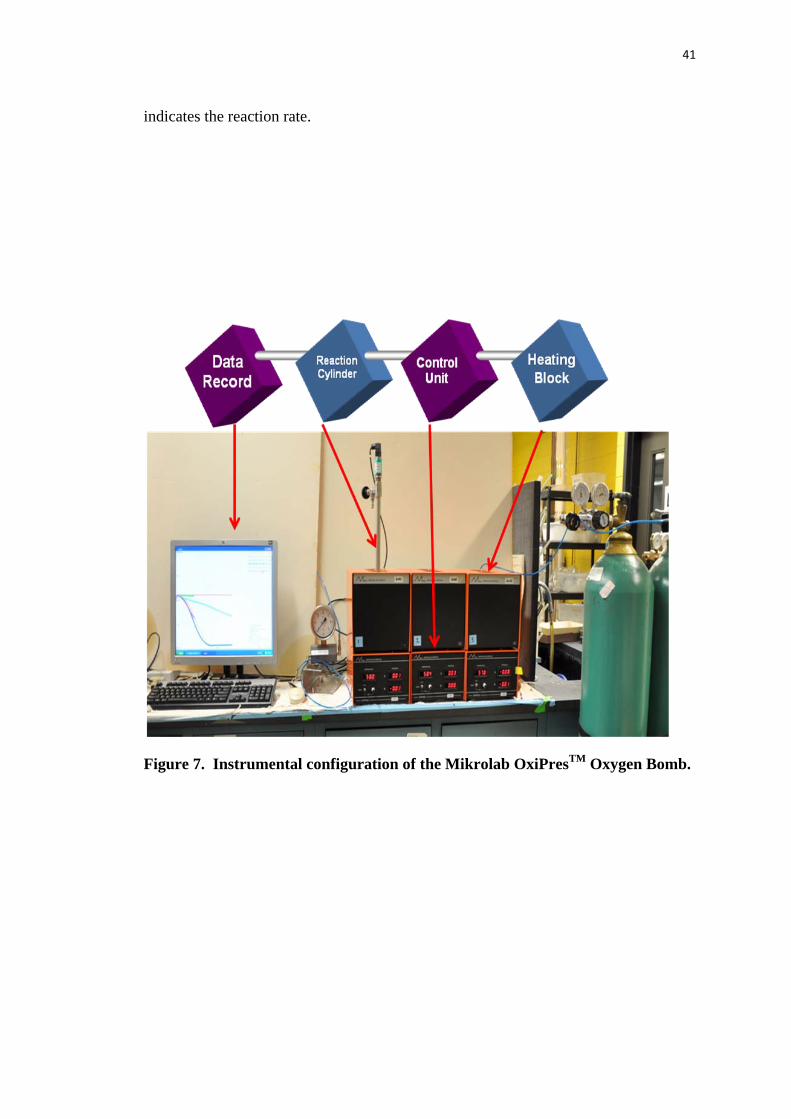
41
indicates the reaction rate.
Figure 7. Instrumental configuration of the Mikrolab OxiPresTM Oxygen Bomb.

42
Figure 8. Reaction cylinder of oxygen bomb and short path thermal desorption trap for collection of volatiles when bomb is opened.

43
Figure 9 Typical oxygen consumption curves acquired by oxygen bomb. These curves were generated from food oils containing various levels of antioxidants
This technology has been used extensively to test stability of machine oils, and
standardized protocols have been developed (Sheppard 1962); (Reiners 1972). For
example, 5 g samples at 99 °C and 88-110 psi (~6-8 bar) or higher pure oxygen are the
specified conditions for ASTM standard method D942 for oxidation of greases and
engine oils (ASTM 2007)
Oxygen bombs have seen more limited applications to food oils or foods even
though the methodology has been available for nearly fifty years (Stuckey 1958; Pohle
1962; Pohle 1963; Blankenship 1973; Cooper 1979; Drozdowsk 1987). Pokorny and
his co-workers used the oxygen bomb to study oil degradation at ambient temperatures

44
(Trojakova 2001) and antioxidant activity of tocopherols (Reblova 2006). Liang and
Schwarzer (1998) (Liang 1998) used this technique to study the stability of lard and
tallow and compare the effectiveness of it with other accelerated stability methods.
All the research reported previously with oxygen bombs were conducted are
temperatures less than 150°C. Under these conditions, the degree of the oil and fat
oxidation and the activity of antioxidants can be determined by measuring the length of
the induction period. There is no corresponding experience using this technology at
frying temperatures (150 to 180 °C). However, given current industry trends toward
increasing polyunsaturation of oils and extending shelf life of lipid-containing foods,
the oxygen bomb with its controlled environment and ability to monitor oxygen
consumption directly and continuously would seem to offer a very useful testing tool.
The main purpose of this project, therefore, was to evaluate the suitability of oxygen
bomb methodology for studying degradation kinetics in oil heated at frying
temperatures, and to provide new parameters other than induction period for
quantitation of changes.

45
3. MATERIALS AND METHODS
3.1. Materials
Oils. Initial testing of the instrumentation conditions was performed using
TriSun high oleic oil. Some experiments used also soybean oil, Enova diglyceride oil,
and olive oil purchased from local supermarkets. Systematic studies were conducted
using a blend of 40% NuSun oil and 60% corn oil in three forms: fresh, stripped, and
steady-state (partially degraded as used in actual frying). These oils were supplied by
FritoLay (Plano, TX).. This 60:40 blended oil will be referred to hereafter as Blend.
Analytical reagents. HPLC grade iso-octane and 2-propanol were purchased
from Fisher Scientific. Thermal desorption traps (Scientific Instrument Services,
Ringoes, NJ) were packed with Tenax (50mg) and carboxen (50mg) mixed in the
ratio1:1 get remaining details of GC and MS analyses. GC is purchased from
Varian(Sugar Land, Texas), model: Varian 3400. Finnigan MAT 8230 is purchased
from Finnigan(Cincinnati, OH). Short path thermal desorption TD-2 is purchased from
Scientific Instrument Services, Inc. All Saftest reagents, include PeroxysafeTM,
AlkalSafeTM and FaSafeTM were purchased from MP Biomedicals (Solon, OH). The
MicroChemTM II used to read optical absorbances of SafTest samples was purchased
from Source Scientific (Irvine, CA). Disposable culture tubes made of borosilicate
glass with the dimension of 10*75mm for the SafTests were purchased from VWR
(West Chester, PA).

46
3.2. Experiment Procedures
3.2.1. Glassware cleaning
All Oxipres flasks and tops are routinely washed using a three-step procedure:
a) Wash with Citranox detergent, rinse three times with tap water to remove detergent
residues, rinse three times with 18 MΩ resistivity high purity water (Milli-Q water
purification system).
Citranox is preferred over other standard lab detergents because it is phosphate free
and leaves no films. Composed of a blend of organic acids (including citric acid),
anionic and non-ionic surfactants and alkanolamines, it removes scale, metal oxides,
metal complexes, trace inorganics, milkstone, soil, grit, buffing compound, grime,
grease, fats, oils, particulates, deposits, chemical and solvents.
b) Transfer flasks and tops to denatured alcohol saturated with potassium hydroxide,
soak overnight to saponify any traces of lipid materials. Remove from alcohol bath and
repeat washing/rinsing as in Step a).
c) Transfer flasks and tops to 1 to 3 N HCl (high purity) to remove traces of metals from
glassware, soak overnight, remove from bath, rinse 3-6 times with Milli-Q water, and
dry.

47
3.2.2. Oil handling and storage
All oils (reagents and samples) were stored frozen (-20 °C) under argon
headspace after receipt from FLNA and between experiments. Reagent oils were stored
in the brown HDPE bottles shipped from FLNA. After heating, all samples were frozen
in glass flasks or vials under argon headspace until analysis (usually within 24 hours).
For Oxipres analyses, oils were removed from the freezer and allowed to come to
room temperature. Oil samples were then weighed into Oxipres flasks as rapidly as
possible under subdued light and transferred immediately to the Oxipres cells.
In some experiments, oils were sparged in the Oxipres cells to replace oxygen
with argon or nitrogen before heating. To accomplish this, a Pasteur pipette connected
to the inert gas line is placed in the flask, the flask opening was plugged loosely with
crushed KimWipes to limit air influx, and inert gas was bubbled through the oil for
15-30 minutes. The flasks were then transferred immediately to Oxipres cells, closed,
and pressurized for heating experiments. The same procedure was used to saturate oils
with oxygen before heating.
When heating experiments were completed, cells were removed from the heating
blocks, pressure valves were opened and the headspace was released directly into the
air (early experiments) or through a Tenax trap for volatiles analysis (current
procedures). Oil samples were then cooled to room temperature and transferred to 25
ml Erlenmeyer flasks, flushed with argon, sealed (stopper plus Parafilm wrap), and
stored frozen out of the light until analyzed for oxidation products. In current protocols,

48
oils were heated one day and the oxidation products were analyzed the next day.

49
3.2.3. Oxygen bomb analyses
General procedures. Oxygen consumption analyses were conducted using
OxipresTM oxygen bombs (Mikrolab, Aarhus, Denmark). Temperature in the heating
block for the bomb cells was set electronically and controlled to 0.1 °C. All heating
blocks were equilibrated at test temperatures before beginning experiments. Pressure
and temperature of each cell was monitored continually by computer and also shown on
LED panels on each unit. Heating times varied but in most cases were 3 hours. Heating
course and data recording was managed by computer using the Oxipres software. Asci
data files were transferred to Excel for analysis and graphing.
Oil samples to be tested were weighed into Oxipres flasks and transferred to the
Oxipres pressure cylinder, then the glass top was put into place. The cylinder top with
pressure transducer was screwed into place and hand tightened, then the cell was
pressurized with test gas to experimental pressure specified for each experiment.
Cylinders were held at room temperature on the lab bench until all samples were loaded,
then all cells were transferred to the heating blocks at the same time and data recording
was initiated.
Although most Oxipres methods allow 30 minutes for temperature equilibration
before recording oxygen pressure changes, reactions at the elevated temperatures used
in this study are so rapid that recording of pressure changes was initiated as soon as the
cells were placed in the heating block. Consequently, all pressure curves initially
increased with temperature, a peak was reached, and then rapid oxygen consumption

50
began. Time to peak pressure, peak pressure, initial oxygen consumption rate, and total
oxygen consumption were calculated for all runs (Figure 10).
All experiments were conducted at least in duplicate.

51
Figure 10. Typical Oxipres oxygen consumption generated when oils are heated to high temperatures (180 °C) under 5 bars oxygen pressure, showing parameters measured for each run.
3.2.3.1. Effects of sample size
Although the manufacturer recommends 5 g samples sizes for Oxipres analyses,
heating at frying temperatures (150-180 °C) is a new application of this instrumentation,
so effects of sample size were investigated to optimize sensitivity while preventing
oxygen limitation and excess degradation. Standard conditions as described above were
followed, using 3, 5, 10, 15, 20, 30, 40, and 50 g samples of Blend oil, heated at 180 °C
under 5 bars oxygen for 3 hours.
3.2.3.2. Effects of heating time
To test whether the Oxipres could be used as a model of actual frying conditions
which may continue for up to about eight hours (maximum turnover time) in industrial
continuous frying operations and for days to weeks in commercial batch frying

52
operations, 10 g samples of Blend oil were heated under 5 bars oxygen for 48, 24, 12, 6,
4.8, and 3 hours following standard procedures described above.
3.2.3.3. Effects of oil composition
To assess the sensitivity of the OxipresTM instrumentation in detecting differences
in degradation susceptibility between oils, 10 g samples of TriSun (high oleic), soybean
oil (polyunsaturated), olive oil (monounsaturated) with expected high antioxidant
content, and Enova diglyceride oil based on soybean oil were heated at 180 °C under 5
bars oxygen for 3 hours.
3.2.3.4. Reproducibility
Six replicates of 10 g samples each of TriSun, soybean, and olive oils were heated
at 180 °C under 5 bars oxygen for 3 hours. Averages, standard deviations, and
coefficients of variation were calculated.
3.2.3.5. Effects of oxygen pressure on oxygen consumption by NuSun:corn oil
Blends
The manufacturer recommends that 5 bars pure oxygen be used for all oxygen
bomb analyses to provide maximum detection by the pressure transducer and
maximum reaction to provide clear kinetics, and 5 bars or higher oxygen is standard for
oil and grease analyses (ASTM 2007; Migdal et al 2008). Again, since testing at frying
temperatures is a new application, and reactions under such conditions are much more
rapid than at standard 90 to 120 °C, effects of oxygen pressure were evaluated to
determine optimum conditions for high temperature studies. Twelve 10g samples of

53
fresh Blend oil were prepared as described above and heated at 180°C for 3 hours with
cells pressurized to 0.5, 1, 2, 3, 4 or 5 bars pure oxygen. This allowed duplicates for
each pressure.
The experiment was repeated pressurizing with air (oxygen concentrations 21%
that of the oxygen runs), and under inert gas (nitrogen or argon).
3.2.3.6. Effects of temperature on oxygen consumption by NuSun:corn oil
Blends
To test the response of the Oxipres system and determine changes in oxidation
kinetics as a function of temperature, 10 g samples of fresh Blend oil were pressurized
with 2 bars oxygen and then heated at 100, 120, 150, 160, 170 and 180°C for 3 hours,
with duplicates for each temperature. The same experiment is run under 2 bars air. The
data is recorded by Oxipres software.
3.2.3.7. Effects of pre-sparging oil with inert gas before heating
To test effects of pre-dissolved gases as well as oxygen diffusion into the oil
during heating, 10 g samples of oil were loaded into the Oxipres cells and gently
pre-sparged with argon for 15 minutes before heating. As controls, identical samples
were prepared without argon sparging. Samples were heated under standard conditions
(2 bars air, 180 °C, 3 hours).
3.2.3.8. Effects of periodic cell swirling on oxygen consumption
Questions arose regarding possible limitations in diffusion of oxygen into oils in
the Oxipres cells. To test the role of oxygen diffusion in measured decreases in cell

54
pressures, duplicate 10 g samples of fresh Blend oil were heated at 180°C, pressurized
with 2 bars air. The control group was heated constantly for 3 hours without disturbance.
For the swirling test, one group was removed and swirled gently or vigorously for
varying periods then returned to the heating block. In one test, samples were swirled for
varying lengths of time from seconds to minutes. This experiment showed that
sampling cooling during swirling was a complication, so in subsequent experiments,
samples were typically withdrawn every 15 minutes and swirled for 15 seconds before
returning to the heating block. To control for temperature effects, a parallel temperature
control group was withdrawn at the same time and left on the bench top for identical
periods without swirling.
3.2.3.9. Oxipres Oxygen Bomb Calculations
Total Volume of Oxipres Cells
Oxipres cells were filled with water with meniscus even with top. This volume
was transferred carefully to a tared beaker, water drops clinging to cell were shaken into
the beaker or taken up in a pipette and transferred to the beaker. The beaker was
weighed, and water weight was converted to volume (density of water = 1 g/ml).
Duplicate samples for each of six flasks were measured.
Average empty cell volume: 214.32 ± 0.24 g
Sample flask volume
Oxipres flasks and tops were submerged in 400 ml water in a graduated cylinder.
Flask + lid volumes were determined from the volume increase. Duplicate samples for

55
each of six flasks were measured.
Average glass volume (flask + lid): 41.4 ± 2.1 ml
Oil volume
Density of oil (60% NuSun:40% corn oil)
NuSun ρ(20 C) = 0.914 g/ml (Warner 2003)
Corn oil ρ(20 C) = 0.922 g/ml (Elert 2000)
Experimental oil blend ρ(20 C) =0.60(0.914) + 0.40(0.922) = 0.9172 g/ml
Combined gas law (PV=nRT) calculations for Oxipres cells
Combined gas law calculations are required to determine the number of oxygen
molecules available under various reaction conditions (i.e. oxygen limitation), the
pressures that should be attained at different pressures, and the conversion of bars
pressure to moles oxygen. Calculations used R=83.1447 (cm3*bars/K*mol), cell
loading T=298 K, 0.0113 mol TAG / 10 g sample based on average TAG mol wt of 885
(assuming ~50:50 oleic and linoleic acids).
Calculation of V (Gas headspace volume actually available under
experimental conditions
Gas headspace volume = cell volume − flask/lid volume − oil sample volume
Oil volume = oil wt / oil density = oil weight / 0.9172
n mmol O2 calculated from n = PV/RT
Results for various oil sample sizes are presented in Table 5.

56
Table 5. Calculations for headspace volumes and oxygen available with different oil sample sizes.
Available O2
2 bars air 5 bars O2
Sample mmol oil Flask Headspace
mmol/
mmol/
wt (g)
TAG (ml) (ml) (ml) mmol mol TAG mmol
mol TAG
3 3.39 3.3 41.4 169.6 2.88 0.85 34.24 10.1 5 5.65 5.5 41.4 167.5 2.84 0.5 33.8 5.98 10 11.3 10.9 41.4 162 2.75 0.24 32.69 2.89 15 16.95 16.4 41.4 156.6 2.65 0.16 31.59 1.86 20 22.6 21.8 41.4 151.1 2.56 0.11 30.49 1.35 30 33.9 32.7 41.4 140.2 2.38 0.07 28.29 0.83 40 45.2 43.6 41.4 129.3 2.19 0.05 26.09 0.58 50 56.5 54.5 41.4 118.4 2.01 0.04 23.89 0.42
Table 6. Calculation of n moles O2 in headspace from PV=nRT as f(bomb pressure) under standard run conditions (Headspace V=162 for standard 10g samples)
mol O2
gas P (bars) mols O2 mol O2/bar mol TAG O2 5 0.03269 0.00654 2.89
4 0.02615 0.00654 2.31
3 0.01961 0.00654 1.74
2 0.01308 0.00654 1.16
1 0.00654 0.00654 0.58
air 5 0.00687 0.00137 0.61
4 0.00549 0.00137 0.49
3 0.00412 0.00137 0.36
2 0.00275 0.00137 0.24
1 0.00137 0.00137 0.12

57
Dividing n mols O2 by bars P gives conversion factors for bars to mols O2 of
0.00654/bar for pure oxygen and 0.00137/bar for air at room temperature.
Calculation of cell pressures as f(T) and conversion
When the cell is pressurized at room temperature then heated, the peak P should
increase according to PV=nRT if the gas laws are followed. When the actual peak P
reached during heating is different from these values, other factors are contributing to
or detracting from the bomb pressure.
Table 7. Theoretical prediction of cell pressure according to ideal gas law
Temperature K ºC Cell Pressure (bars) expected
273 25 5 4 3 2 1 373 100 6.2584 5.0067 3.755 2.5034 1.2517 393 120 6.594 5.2752 3.9564 2.6376 1.3188 423 150 7.0973 5.6779 4.2584 2.8389 1.4195 433 160 7.2651 5.8121 4.3591 2.906 1.453 443 170 7.4329 5.9463 4.4597 2.9732 1.4866 453 180 7.6007 6.0805 4.5604 3.0403 1.5201
P here is the total bomb pressure. pO2 = P when the pressurizing gas is oxygen.
pO2 = P * 0.21 when air is the pressurizing gas.
Factors increasing peak P: volatiles released from oil
dissolved gases released from oil
Contribution of these factors increases at lower pO2.
Factors decreasing peak P: rapid oxidation that begins even before oil reaches full
temperature – contribution increases as pO2 increases.
Dividing n mols O2 at room temperature by expected bars P at each temperature gives

58
the conversion factors for bars to mols O2 (Table 8).
Table 8. Converting factors for bars pressure to mols oxygen at different temperatures.
T°C 100 120 150 160 170 180 Oxygen 0.0052 0.005 0.0046 0.0045 0.0044 0.0043
Air 0.0011 0.001 0.001 0.0009 0.0009 0.0009
Sensitivity of oxygen detection
The digital pressure transducer sensor for the Oxipres system registers data to an
infinite number of decimal places so the oxygen pressure change that it can detect is
infinitesimally small. To determine the practical detection limit as signal to noise,
empty cells were heated under the same conditions as oils (180 °C for 3 hours under 5
bars oxygen and 2 bars air). Curves were examined in the approximately constant
region shown in the box (Figure 11).
The sensitivity limit of the sensor is 0.002442 bars (minimum registered pressure
difference, i.e. successive data points in the noise differ by this value or multiples
thereof), which corresponds to 1.05x10⁻⁵ mol O2 under oxygen and 2.2 umol O2 under
air. Signal to noise for oxygen is ± 0.002442 bars, for air is ± 0.001221 bars.
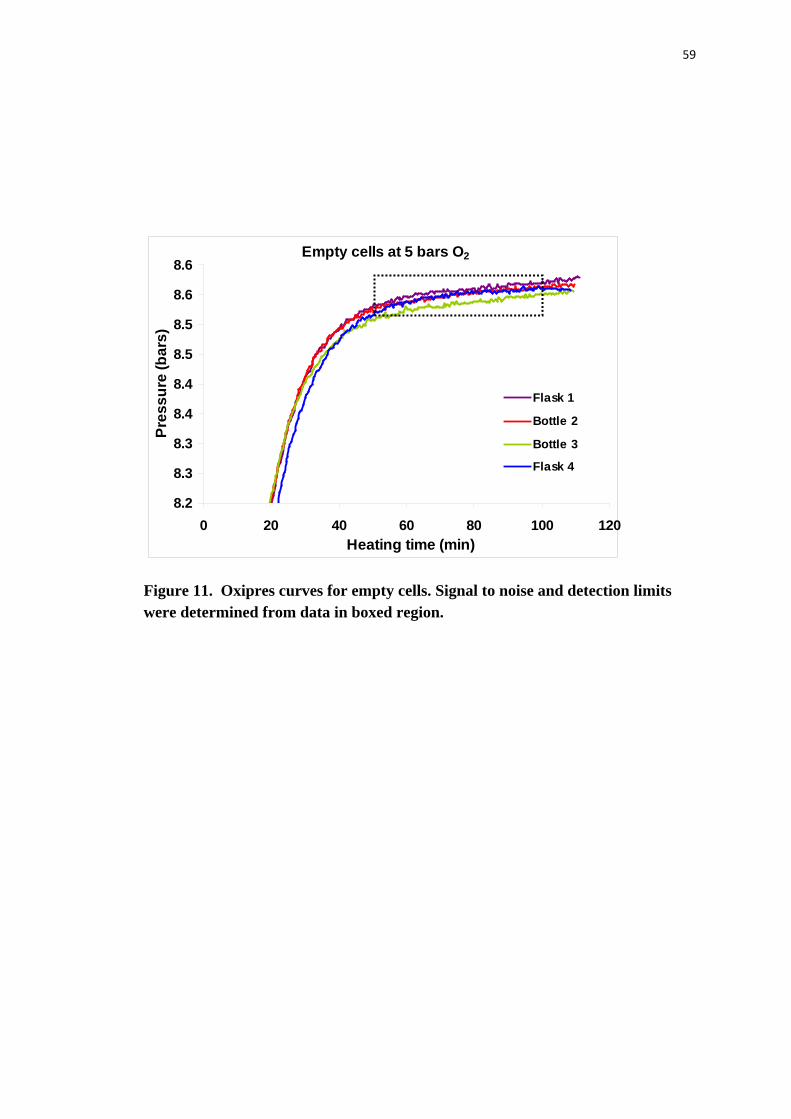
59
Figure 11. Oxipres curves for empty cells. Signal to noise and detection limits were determined from data in boxed region.
Empty cells at 5 bars O2
8.2
8.3
8.3
8.4
8.4
8.5
8.5
8.6
8.6
0 20 40 60 80 100 120Heating time (min)
Pres
sure
(bar
s)
Flask 1
Bottle 2
Bottle 3
Flask 4

60
3.2.4. Analyses of Lipid Oxidation Products
Oxygen consumption reports the rate of oxidation independent of product
pathways. However, in both research and industrial quality control, lipid oxidation is
understood and interpreted in terms of products. Thus, to provide information about
reactions and products underlying oxygen consumption, several standard lipid
oxidation and hydrolysis products were measured in oils at the end of each heating
period.
3.2.4.1. Conjugated dienes
Oil samples were first diluted with HPLC grade iso-octane, then optical
absorbance was read at 234 nm against a blank of pure iso-octane in a Cary 50 Bio
UV-Visble spectrophotometer. The concentration of the conjugated diene was
calculated by the equation below.
C=OD×DF/29.5/2.98
C: the concentration of the conjugated diene in oil sample in mmol/mol TAG
OD: absorbance at 234 nm
DF: dilution factor.
3.2.4.2. Peroxide Values
Before analysis, PeroxySafeTM reagents A,B and C and standard curve calibrators
were removed from the refrigerator and equilibrated to room temperature for at least 30
minutes. For standard curve preparation, 25 ul calibrator 1,2, 3, blank (distilled water)
and reagent blanks were pipetted into 10 mm test tubes, with 3 replicates for each

61
calibrator. 1ml PeroxySafeTM reagent A, 0.1ml PeroxySafeTM reagent B and 0.16 ml
PeroxySafeTM reagent C were added to each calibrator, blank and reagent blank in
sequence. Blank, reagent blank, and all calibrator samples were incubated at room
temperature for 15 minutes, then each tube was inserted in the compartment of
MicroChem II analyzer and optical absorbance at 550nm was measured. The
calibration curve data was recorded and stored by computer.
For sample tests, 25 ul oil sample and reagent blank were added to 10 mm test
tubes, 3 replicates for each. 1 ml PeroxySafeTM reagent A, 0.1 ml PeroxySafeTM reagent
B and 0.16 ml PeroxySafeTM reagent C were added to each sample and reagent blank,
and all tubes were vortexed for 30 seconds, react at room temperature for 15 minutes,
and optical absorbance at 550 nm was read and recorded for each tube using the
MicroChem II analyzer. The concentration of peroxides in each sample was determined
by comparison of sample absorbances to the calibration curve. When readings of oil
samples were out of range for the test (as determined by computer notations), oil
samples were diluted in HPLC grade 2-propanol until the concentration of the peroxide
fell in the range of the calibration curve. The final concentration in the PeroxySaf Test
was expressed as meq peroxide / kg oil. This was converted from meq/kg oil to
meq/mol TAG (Triacylglycerol) by using the equation C = c×DF/1.13
where C is the final peroxide concentration in meq/mol TAG,
c is the initial peroxide concentration in diluted oil in meq/kg oil, and
DF is the dilution factor

62
1.13 is moles TAG per kg oil
3.2.4.3. Aldehydes
Before analysis, AlkalSafeTM reagents A and B, Calibrators 1,2, 3, 4, and reagent
blanks were removed from the refrigerator and equilibrated to room temperature for at
least 30 minutes. For standard curve preparation, 75 ul calibrator 1,2, 3, 4, and blank
(distilled water) were pipetted into 10mm test tubes, with 3 replicates for each
calibrator. 1 ml AlkalSafeTM reagent A, 0.25 ml AlkalSafeTM reagent B were added to
each calibrator and blank in sequence, all tubes were incubated at room temperature for
20 minutes, then optical absorbance at 570 nm was read and recorded for each tube
using the MicroChem II analyzer. Data for the calibration curve were recorded and
stored by computer.
For sample tests, 75 ul oil sample and blank were added to 10 mm test tubes, with
3 replicates for each sample. 1 ml AlkalSafeTM reagent A and 0.25 ml AlkalSafeTM
reagent B were added to each sample and reagent black, all tubes were vortexed for 30
seconds, then incubated at room temperature for 20 minutes before reading optical
absorbance at 570 nm. The aldehyde concentration of each sample was determined by
comparison of sample readings to the calibration curve. When samples readings were
out of calibration range, samples were diluted in HPLC grade 2-propanol and
re-analyzed until the concentration of the aldehyde fell into the range of the calibration
curve. The final concentration of aldehydes were expressed as nmol/ml by the AlkalSaf

63
Test. This was converted to mmol aldehyde/mol TAG by using the equation
C=c×DF×1.32/3.5/885,
where C is the aldehyde concentration of original oil sample in mmol/mol TAG,
c is the aldehyde concentration of the diluted oil sample in nmol/ml,
DF is the dilution factor,
3.2.4.4. Free Fatty Acids
Before analysis, FASafeTM reagents A and B, Calibrators 1,2, 3,4, and the reagent
blank were removed from the refrigerator and allowed to equilibrate to room
temperature for at least 30 minutes. For standard curve preparation, 50 ul calibrator 1,2,
3, 4, and blank (distilled water) were pipetted into 10 mm test tubes, with 3 replicates
for each calibrator. 1 ml FASafeTM reagent A and 0.1 ml FASafeTM reagent B were
added to each calibrator, and blank in sequence, all tubes were incubated at room
temperature for 10 minutes, and optical absorbance at 570 nm for each tube was
measured using the MicroChem II analyzer. Data for the calibration curve was
recorded and stored by computer.
For analyses of free fatty acids in oil samples, 75ul oil and blank were added to 10
mm test tubes, 3 replicates for each sample. 1 ml FASafeTM reagent A and 0.1 ml
FASafeTM reagent B were added to each sample and reagent blank, all tubes were
vortexed for 30 seconds and incubated at room temperature for 10 minutes before
reading, the the optical absorbance for each tube was measured at 570 nm using the

64
MicroChem II analyzer. Free fatty acid concentrations in each sample were determined
by comparison of sample absorbances with the calibration curve. When oil sample
readings were out of the calibration range, samples were diluted in HPLC grade
2-propanol and re-analyzed until the free fatty acid concentration fell into the range of
the calibration curve. The free fatty acid concentration in the oil samples was calculated
using the equation C=c×DF,
where C is the % free fatty acid concentration in the original oil sample,
c is the % free fatty acid concentration of the diluted oil sample, and
DF is the dilution factor.
3.2.4.5. Total Volatiles
At normal temperatures, lipid oxidation rates are slow and release of volatile
products into the OxipresTM cell headspace is trivial relative to 5 bars oxygen pressure.
However, this study used lower oxygen pressures to prevent skewing product levels and
distributions. In addition, oil degradation at frying temperatures is rapid and complex,
and release of volatile products may be orders of magnitude higher than at 60 °C. Under
such conditions, volatile products released from the oil may contribute significantly to
headspace pressure (measured by a pressure transducer that does not differentiate
oxygen from other molecules in the headspace) and even counteract loss of oxygen in
reaction, resulting in decrease in the rate of oxygen consumption reported in the
Oxipres curves.

65
To test for this possibility, Oxipres cells were vented through thermal desorption
traps to collect headspace volatiles generated during heating. Thermal desorption traps
(Scientific Instrument Services, Ringoes, NJ) were packed with Tenax (50mg) and
carboxen (50mg) mixed in the ratio1:1 get remaining details of GC and MS analyses.

66
4. RESULTS AND DISCUSSION
Determining optimum experimental conditions
4.1. Effects of sample size on oxygen consumption curves and oil degradation.
A sample size of 5 g oil for standard analyses is recommended by the equipment
manufacturer Mikrolab to maximize the surface to volume ratio. This amount is
probably optimal for analyses at the 60 °C temperature commonly used and may be
acceptable even at more elevated temperatures, e.g. 100 °C. However, early tests
showed that at frying temperatures, 5 gram oil burns readily, even with short heating
times. On the other hand, large oil volumes oxidizing rapidly may consume too much
of the headspace oxygen, making the system oxygen limited with heating periods
shorter than desired for testing. Thus, sample size was investigated to determine the
optimum amount for high temperature operations.
A range of sample sizes from 3 to 50 g were tested with 3 and 6 hours heating at
180 °C. Absolute values of both initial oxygen consumption rate and net oxygen
consumption increased with sample size (Figure 12), as might be expected. However,
the increases were not linear, and when normalized to oxygen consumption per mole
TAG, oxidation actually decreased with sample size (Figure 13, Table 9). This lower
proportional oxidation probably occurs because the amount of oxygen available per
mole of TAG decreases with sample size (see Table 5), so although oxygen is not
strictly limiting and not all available oxygen is consumed, oxygen consumption per

67
mole TAG slows as diffusion of oxygen to radical sites becomes slower than other
Figure 12. Oxygen consumption of different sample size under 5 bars oxygen pressure and 180°C for 6 hours.
Table 9. Effect of sample size on oxygen consumption parameters (180 °C, 5 bars O2).
Oil wt. Initial oxid. Rate/min Net O2 consumption (6 hr) % O2 consumed
(g)
bars O2 mol O2 mol O2 avail.a barsb
mbar mmol O2 mmol O2 /mol TAG
/mol TAG
3 5.81 0.03 2.37 1.07 0.0049 0.43 13.4 14.2 5 9.66 0.04 3.93 1.58 0.0073 0.64 20.1 20.9 10 15.39 0.07 6.26 2.05 0.0094 0.84 27 27 15 20.27 0.09 8.25 2.74 0.0126 1.11 37.2 36 20 25.76 0.12 10.49 3.00 0.0138 1.22 42.3 39.5 30 29.55 0.14 12.03 3.50 0.0161 1.42 53.1 46 40 34.07 0.16 13.87 4.03 0.0185 1.64 66.4 53 50 35.53 0.16 14.46 4.31 0.0198 1.75 77.5 58.3
a mol O2 per mol TAG consumed / mol O2 available per mole TAG. basis b bars O2 consumed / peak bars O2 basis.
Effects of sample size
2
3
4
5
6
7
8
0 100 200 300 400Heating time (min)
Pres
sure
(bar
s)
10 g15 g20 g30 g
40 g50 g

68
Figure 13. Change in initial oxygen consumption rates and net oxygen consumption as a function of sample size for Blend oil heated in the Oxipres for six hours at 180 °C under 5 bars oxygen.
y = -0.0146x2 + 1.376x + 2.7626R2 = 0.9941
y = -0.0013x2 + 0.1314x + 0.8601R2 = 0.9885
0
5
10
15
20
25
30
35
40
0 10 20 30 40 50 60Sample wt (g)
Oxi
d ra
te (m
bar/m
in)
Net
O2 c
onsu
mpt
ion
(bar
s)
Initial oxidation rate
Net O2 consumed
y = 0.0003x2 - 0.0305x + 1.2127R2 = 0.9843
y = 0.3941x-0.5153
R2 = 0.9888
0.0
0.2
0.4
0.6
0.8
1.0
1.2
0 10 20 30 40 50 60Sample size (g)
mm
ol O
2/min
/mol
TA
Gm
ols
O2 /
mol
TA
G
Initial Oxidation Rate
Net O2 consumed

69
radical reactions. Another possible explanation is that oxygen diffusion into the oil
becomes more limiting for larger samples. The surface area and oxygen diffusivity
are constant for all samples, so if there are not currents to circulate oxygen into lower
layers of oil, only upper layers become oxygenated. Issues of diffusions, circulation,
and surface versus bulk oil as oxidation sites will be discussed further later.
Browning decreased with sample size due to lower surface to volume ratio
(Figure 14). Small volumes were especially prone to burning with long heating times
(see Figure 15, next section).
From the curves in Figure 13 and considering limitation in oxygen availability at
higher weights, 10 g was selected as the standard samples size to provide the maximum
surface to ratio rate without over burning the oils.
3 hours
6 hours
Figure 14. Browning due to the thermal degradation as a function of sample size after heating at 180 °C for 3 (top) and 5 (bottom) hours.

70
4.2. Effects of heating time
In commercial heating operations, oils are typically in continuous use for several
days. Thus, in initial testing 5 g oil samples were heated for 48 hours. These were
completely burned and oxidized into a sticky residue. Even with 24 hours heating and
larger samples (10 and 20 g), oils burned (Figure 15). Sample sizes were then increased
and oxygen consumption was followed over 24 hours to determine useful heating times.
Results are shown in Figure 15.
Figure 15. Excessive browning in Trisun oil heated at 180 °C for 24 hours.
The extensive browning makes it obvious that heating small oil volumes for long times
in the Oxipres (or indeed anywhere) results in extensive degradation of the oil far
beyond useful frying quality. Thus the heating time must be more limited. The curves in
Figure 16 show that the oils oxidize in two phases: an initial rapid phase and a slow
steady secondary phase. Though both phases are important to understand, the early
reactions are most important to understand for determining reaction mechanisms
and assessing oxidative stability of oils. This early phase is complete within three

71
Figure 16. Effect of heating time on oxygen consumption by Trisun oil heated to 180 °C under 5 bars oxygen.
hours. Figure 14 shows that there is still notable browning with small oil volumes with
6 hours,but discoloration after three hours heating is still at an acceptable level. Three
hours is also in the range of turnover times for industrial frying, so was selected as the
standard heating time for this study.
0
1
2
3
4
5
6
7
8
0 300 600 900 1200 1500 Heating time (min)
pO2 (
bar)
Sample wt (g)
3 5 10
20

72
4.3. Reproducibility of the oxygen bomb.
To verify the reproducibility of the oxygen bomb, commercial soybean oil, Trisun
oil and olive oil were used for the test. 10 g of six samples of each kind of oil were
heating under 180°C, 5 bars oxygen for 3 hours. Peak pressure, maximum oxygen
consumption rate, and total oxygen consumption were measured. Oxygen consumption
by the three different oils showed very high reproducibility (Figures 17-19). For
soybean oil the variation was 0.85, 2.79 and 1.89 % for the peak pressure, max rate and
total oxygen consumption, respectively (Table 10). The variation was 1.15, 2.79 and
1.89% respectively for Trisun oil (Table 11) and 0.48, 2.40 and 1.01 % for olive oil
(Table 12). That soybean oil exhibited higher oxygen consumption rate than both olive
oil and Trisun oil matches its polyunsaturation; in comparison, olive and Trisun oils are
monounsaturated. The max oxygen consumption rate of Trisun oil and olive oil were
similar, reflecting their composition high in oleic acid.

73
Soybean oil
4.0
4.5
5.0
5.5
6.0
6.5
7.0
7.5
0 50 100 150 200 Heating time (min)
Pres
sure
(bar
s)
1 2 3 4 5 6
Figure 17. Reproducibility of oxygen consumption by soybean oil heated at 180 °C for three hours under 5 bars oxygen. Note the expanded scale.
Table 10. Peak pressure, maximum oxygen consumption rate, and total oxygen consumption of soybean oil heated at 180 °C for three hours under 5 bars oxygen.
Sample replicate Peak pressure (bar) Max rate
(bars/min) Total O2 consumption
(bar) 1 7.1844 0.0386 2.9915 2 7.3285 0.0400 3.1477 3 7.3284 0.0391 3.1111 4 7.2943 0.0389 3.0232 5 7.3236 0.0400 3.0891 6 7.3602 0.0418 3.0940
Average 7.3032 0.0397 3.0761 ST. Dev. 0.0619 0.0011 0.0580 % Var. 0.85 2.79 1.89

74
Figure 18. Reproducibility of oxygen consumption by Trisun oil heated at 180 °C for three hours under 5 bars oxygen. Note the expanded scale.
Table 11. Peak pressure, maximum oxygen consumption rate, and total oxygen consumption of Trisun oil heated at 180 °C for three hours under 5 bars oxygen.
Sample replicate
Peak pressure (bar)
Max rate (bars/min)
Total O2 consumption
1 6.8596 0.0286 2.2637 2 6.7521 0.0293 2.2955 3 7.0037 0.0266 2.3761 4 6.8034 0.0276 2.2808 5 6.8498 0.0281 2.2369 6 6.8107 0.0276 2.2442
Average 6.8466 0.028 2.2829 ST. Dev. 0.0784 0.0009 0.0506 % Var. 1.15 3.3 2.2
Trisun
4.2
4.7
5.2
5.7
6.2
6.7
7.2
0 50 100 150 200 Heating time (min)
Pres
sure
(bar
s)
1 2 3
4 5 6

75
Figure 19. Reproducibility of oxygen consumption by olive oil heated at 180 °C for three hours under 5 bars oxygen. Note the expanded scale.
Table 12. Peak pressure, maximum oxygen consumption rate, and total oxygen consumption of olive oil heated at 180 °C for three hours under 5 bars oxygen.
Sample replicate Peak pressure (bar) Max rate
(bars/min) Total O2 consumption
(bar) 1 7.3797 0.0315 2.3810 2 7.3895 0.0313 2.3932 3 7.4701 0.0298 2.4225 4 7.4383 0.0298 2.4225 5 7.3748 0.0308 2.3614 6 7.3871 0.0310 2.4054
Average 7.4066 0.0307 2.3976 ST. Dev. 0.0352 0.0007 0.0241 % Var. 0.48 2.40 1.01
Olive oil
4.8
5.3
5.8
6.3
6.8
7.3
0 50 100 150 200 Heating time (min)
Pres
sure
(bar
s) 1 2 3
4 5 6

76
4.4. Oxipres sensitivity to differences in oil unsaturation and structure
To assess the ability of the Oxipres to distinguish oxidizability of oils with
different levels of unsaturation, 10 g of soybean oil Trisun oil, olive oil, and Enova
based on soybean oil were heated at 180 °C for three hours under five bars oxygen.
Results show that the Oxpres is capable of correctly distinguishing differences in
oxidizability of oils with varying fatty acid composition (Figures 20 and 21 and Tables
13 and 14).
It is interesting to note that although the oxygen consumption of Enova, a
diacylglycerol based on soybean oil, was comparable to its parent oil, this oil browned
to a much greater extent (Figure 22), so it must undergo different reactions during
heating.

77
Figure 20. Comparison of oxygen consumption by mono-unsaturated Trisun (T) and olive (O) oils with polyunsaturated soybean oil (SBO). Oils were heated at 180 °C for three hours under 5 bars oxygen.
Table 13. Oxygen consumption and oxidation parameters Trisun, olive, and soybean oils oxygen in Oxipres oxygen bombs. 10 g samples, 180 °C, 3 hours, 5 bars oxygen
Minutes
To peak Max P
Initial Rate Total O2 consumption
mbars/min bars
mol O2 mol/mol TAG
Trisun Oil ave. 20.480 6.847 28.000 2.275 0.02 1.81
Stdev. 2.970 0.086 0.900 0.022 --- ---
Soybean Oil ave. 18.910 7.283 39.600 3.056 0.03 2.43
Stdev. 3.280 0.071 1.200 0.064 --- ---
Olive Oil ave. 24.470 7.362 30.900 2.353 0.02 1.87
Stdev. 2.570 0.033 0.700 0.046 --- ---
0
1
2
3
4
5
6
7
8
0 40 80 120 160 Heating time (min.)
Pre
ssur
e (b
ars)
Mono - unsaturated
Di and tri - unsaturated
-
T O
SBO

78
Figure 21. Comparison of oxygen consumption by mono-unsaturated Trisun (T) and olive (O) oils with polyunsaturated soybean oil (SBO). Oils were heated at 180 °C for eight hours under 5 bars oxygen. Sample weights were 20 and 45 g.
Table 14. Oxygen consumption and oxidation parameters for 5 g samples of food oils heated at 180 °C for 3 hour in Oxipres oxygen bombs
Minutes
To peak
Max P
Initial Rate Total O2 consumption
mbars/min bars mol O2
mol/mol TAG
Trisun Oil ave. 25.240 7.475 9.000 0.877 0.004 0.334
Stdev. 0.270 0.204 0.686 0.010 --- ---
Soybean Oil ave. 21.390 7.656 19.300 1.317 0.006 0.501
Stdev. 0.180 0.010 0.002 0.036 --- ---
Olive Oil ave. 22.440 7.540 17.100 1.171 0.005 0.446
Stdev. 6.890 0.019 0.006 0.257 --- ---
0
1
2
3
4
5
6
7
8
9
0 100 200 300 400 500Time (sec)
Oxy
gen
pres
sure
(bar
)Enova 20Enova 45Trisun 20Trisun 45SBO 45
0
1
2
3
4
5
6
7
8
9
0 100 200 300 400 500Time (sec)
Oxy
gen
pres
sure
(bar
)Enova 20Enova 45Trisun 20Trisun 45SBO 45

79
Figure 22. Browning differences in mono-unsaturated Trisun oil and polyunsaturated soybean and Enova oils heated at 180 °C for 24 hours under 5 bars oxygen.

80
4.5. Effects of Pressure (oxygen or air)
Oxygen pressure is probably the most critical factor controlling lipid oxidation at
ambient temperature, and it should play an even greater role at elevated temperatures
because oxygen is necessary to form reactive peroxyl radicals by addition to any
radicals present and because oxygen solubility changes with temperature. For water,
oxygen solubility decreases with temperatures, but oils are the opposite – oxygen
solubility increases with temperature, possibly because the thermal energy disrupts
some of the van der Waals associations between lipid acyl chains. This solubility
increase is shown in table 15.
To test the response of the OxipresTM under different atmospheres and to
determine effects of oxygen pressure on thermal oxidation/degradation of Blend oils,
Table 15. Effect of temperature on oxygen solubility in food oils (data based on hardened lard and olive oil) (Gunstone 1997).
Solubility at 1 bar (mg/kg oil) Dissolved in oil sat'd w. air(mg/kg oil) Temp. °C O2 N2 O2 N2
0 170 80 25 180 85 38 66 50 185 90 75 190 95 100 200 105 125 --- 110 150 --- 115
10 g samples were heated at 180°C under 0.5, 1, 2, 3, 4 and 5 bars pure oxygen and air.
Oxygen consumption increased dramatically with oxygen concentration under oxygen
(Figure 23, Table 16) and to a lesser extent under air (Figure 24, Table 17), which is to

81
be expected. However, there are three notable differences.
First, the increase in both rate of initial pressure drop and (Figure 25) and total
oxygen consumption (Figure 26) was linear with pressure under oxygen, while in air
both effects were non-linear and appeared to saturate with increased pressure. The most
obvious explanation for this would be that the system is not limited under oxygen so
reactions can be proportional to the oxygen pressure. Oxygen limitation under air
which has only ~21% oxygen would explain non-linearity of reaction with oxygen
pressure, but the shape of the curve should be opposite what was observed – i.e. oxygen
limitation should be relieved as pressure increases.
Figure 23. Effects of oxygen pressure on total oxygen consumption and rates of Blend oils heated at 180 °C for three hours. Top: full curves. Bottom: normalized to peak pressure.
Effect of pO2 on oxygen consumption at 180 C
0
1
2
3
4
5
6
7
8
Heating time (min)
Pres
sure
(bar
s O
2)
Bars P 5
4
3 2 1 0.5
0 45 90 135 180
Pressure effects -- oxygen

82
Table 16. Effects of oxygen pressure on oxidation parameters of Blend oils heated at 180 °C for three hours under oxygen.
Time
to peak (min)
Initial rate/min Total oxygen consumed
Peak Pressure
mmol
mol O2
mol O2/ mol TAG Pressure mbars O2 bars
0.5 bar 32.8 1.0146 2.6 0.0112 0.278 0.0013 0.1131 1 bar 24.38 2.3199 5.9 0.0271 0.65 0.0030 0.2646 2 bar 27.58 3.293 9.6 0.0442 0.883 0.0041 0.3594 3 bar 18.8 4.4676 16.8 0.0773 1.46 0.0067 0.5943 4 bar 18.25 5.9524 20.5 0.0943 1.706 0.0079 0.6945 5 bar 18 7.4383 30.2 0.138 2.248 0.0103 0.9151
Pressure effects - air
0
1
2
3
4
5
6
7
8
0 45 90 135 180 Heating time (min)
Pres
sure
(ba
rs a
ir)
Figure 24. Effects of pressure (air) on total oxygen consumption and rates Blend oils heated at 180 °C for three hours.

83
Table 17. Effects of air pressure on oxidation parameters of Blend oils heated at 180 °C for three hours under air.
Time to
peak Peak Initial rate/min Total oxygen consumed
Pressure (min) Pressure mbars umol O2 bars
mmol O2
mmol O2/ mol TAG
0.11 55.75 1.1819 0.72 3.31 0.123 0.57 50.07 0.21 51.34 1.9731 1.28 5.89 0.149 0.69 60.65 0.42 37.87 3.3223 2.5 11.5 0.337 1.50 137.2 0.63 31.89 4.6239 4.01 18.5 0.46 2.12 187.3 1.05 36.33 7.5788 4.71 21.7 0.485 2.23 197.4
Figure 25. Effects of oxygen pressure on initial pressure drop for Blend oil samples heated under oxygen (blue) or air (red) at 180 °C for three hours. Best fit regression equations are shown
Initial oxidation rate
y = 2.2185x - 0.3023R2 = 0.9808
y = -0.3067x2 + 0.7066x - 0.0245R2 = 0.9867
0
2
4
6
8
10
12
0 1 2 3 4 5Oxygen pressure (bars)
mm
ol O
2 / m
in /
mol
TA
G

84
Figure 26. Effects of oxygen pressure on net oxygen consumption for Blend oil samples heated under oxygen (blue) or air (red) at 180 °C for three hours. Best fir regression equations are shown.
Second, against expectations, oxidation was not continuous with absolute oxygen
concentration moving from air to oxygen. Total oxygen consumption in air averaged
about 20% of the corresponding oxygen concentrations in pure oxygen (i.e. pO2 in 5
bars air with 20% oxygen ≈ 1 bar pure oxygen) even after accounting for the partial
pressure of oxygen in air (Table 18); initial oxygen consumption rates in air versus
oxygen are slightly lower, about 15% (Table 19). The reasons for this difference need to
be explored further.
To explore reasons for these behaviors more closely, actual oxygen consumption
was compared to the theoretical amount of oxygen that should be present. As shown in
Table 16, with oxygen pressurization the system is clearly not oxygen limited. Enough
Net oxygen consumption
y = 0.1585x + 0.0488R2 = 0.9863
y = -0.046x2 + 0.0865x - 0.0011R2 = 0.9751
0.0
0.1
0.2
0.3
0.4
0.5
0.6
0.7
0.8
0.9
0 1 2 3 4 5Oxygen pressure (bars)
mol
O2 c
onsu
med
/mol
TA
G

85
oxygen is present that even at 0.5 bars pressure more than 1/3 of the total oxygen
present was consumed. This % decreased with pressure, indicating that the reactions
were saturated. That both first (k) and second order (k’) rate constants are relatively
constant with pressure under oxygen further supports this saturation, i.e. the reaction
increases but the rate of increase does not change with pressure (Table 17). This means
that the overall reaction is independent of oxygen (zero order) and the rate controlling
factor is something else (e.g. thermal scissions to generate radicals).
In contrast, under air pressurization less than 10% of available oxygen was
consumed. Thus, even though enough oxygen is present to fuel at least initial stages of
oxidation and make the oil noticeably rancid (10% oxidized is considered quite rancid),
reactions under these conditions must be very inefficient. The % available oxygen
consumed increased with pressure, suggesting increased efficiency of contact and
this could result either from increased diffusion into the oil or surface contact with
increased O2 concentrations in the headspace. The greatest effects are at the lowest
concentrations, as shown in Table 17 and Figure 27. Adding a small amount of oxygen
at 1-2 bars air has a very large effect on both oxygen consumption rates and total
amount consumed because when too few oxygen molecules are available, diffusion of
oxygen to radical sites becomes the rate-limiting process. Oxygen consumption
increases with pressure because more oxygen molecules are present, but the impact of
higher pressure diminishes as pressure increases, saturating levels of oxygen are
reached, and initiation reactions (formation of R•) become rate controlling.

86
Table 18 . Effects of bomb and oxygen pressure on efficiency and proportionality of net oxygen consumption by Blend oil heated at 180 °C for three hours in oxygen or in air.
Theoratical O2 actually available
Bars Bars (Total
Pressure) (as PO2) mol/mol
TAG %
consumed % air vs
O2 O2
5 5 2.89 29.6 4 4 2.31 28.1 3 3 1.74 31.94 2 2 1.16 28.96 1 1 0.58 42.62 0.5 0.5 0.29 36.53 air
5 1.05 0.61 6.33 21.39 4 0.84 0.49 7.48 26.62 3 0.63 0.36 7.46 23.36 2 0.42 0.24 4.98 17.2 1 0.21 0.12 3.98 9.34
Figure 27. Oxygen pressure effects on rate of oxygen consumption increase in Blend oils heated for three hours at 180 °C under air at various pressures.
k and k' for Pressure
0
2
4
6
8
10
12
14
0 0.2 0.4 0.6 0.8 1 1.2pO2 bars
Rat
e ch
ange
rateNOCln rateln NOC
k
k’

87
Table 19. Kinetic calculations for pressure effects on oxygen consumption rates and net oxygen consumption in Blend oils heated at 180 °C for three hours under varying pressures of oxygen or air. NOC = net oxygen consumption.
Bars Bars Rate
absolute Increase rate of Incr(k)
(Total Pressure) (as PO2) mbar/min % air/O2 (n2-n1)/dPO2 (n2/n1)dPO2
O2 5 5 30.2
9.7 1.47
4 4 20.5
3.7 1.22 3 3 16.8
7.2 1.75
2 2 9.6
3.7 1.63 1 1 5.9
8.76 7.76
0.5 0.5 1.52 air
5 1.05 4.71 15.6 1.67 2.8 4 0.84 4.01 19.56 7.19 7.64 3 0.63 2.5 14.88 5.81 9.3 2 0.42 1.28 13.33 5.33 16.93 1 0.21 0.72 12.2
ave. 15.11 NOC
O2 5 5 2.25
0.542 1.32
4 4 1.71
0.246 1.17 3 3 1.46
0.577 1.65
2 2 0.88
0.233 1.36 1 1 0.65
0.5
1.52 air
5 1.05 0.48 21.56 0.06 2.51 4 0.63 0.46 26.98 0.59 6.5 3 0.42 0.34 23.08 0.9 10.77 2 0.21 0.15 17.2 0.24 11.51 1 0.105 0.12 9.34
ave. 19.58
88
Other studies also have reported larger rate increases at low oxygen, but the
critical oxygen level varies from paper to paper depending on experimental condition.
Andersson and Lingnert (Lingnert 1999) claim that when atmospheric oxygen is below
0.5% the influence of oxygen is greatly enhanced. Karel (Karel 1992) considers 4-5%
oxygen the cut-off line, and Fredriksson (Fredriksson 1968) reports that oxidation rate
increase much great from 1%-2% than the increase from 2%-21%.
These studies were all at ambient or moderately elevated temperatures where initiation
reactions are isolated in space and time and oxidation rates are considerably lower than
the frying temperatures used in this thesis. The 20%-30% oxygen showing higher
acceleration in this study may be required for reaction with the extra radical load
generated at high temperatures.
Overall, this pressure data suggests that in terms of linearity of response, it
appears to be desirable to operate in oxygen atmospheres. However, as will be shown
later, excess oxygenation under pure oxygen causes a shift in chemistry pathways and
product distributions. In addition, pure oxygen is a poor model for real commercial
frying operations that run under air or industrial frying operations that run under
reduced oxygen atmospheres. Thus, for practical applications of results it will be
desirable to run Oxipres experiments under air at the lowest pressure feasible. For such
operation of the Oxipres system, several questions need to be answered:
1) Is the pressure transducer response as sensitive and accurate under air and low
pressures as under pure oxygen at high pressures?

89
2) How does bomb pressure and concentration of oxygen in the headspace affect
diffusion into the oil?
3) What are the actual oxygen concentrations attained in the oil under different
oxygen pressures?
4) Where does oxygen consumption occur – at the oil surface, in the bulk oil, or
both – and what are the differences in rates?

90
4.6. Effects of temperature
That lipid oxidation usually has an induction period in which little or no
oxidation is detectable is well-documented in the literature, and induction periods are
commonly used to assess the stability of oil or fat-containing foods. The longer the
induction period, the more stable the food is. The OxipresTM system was actually
designed to determine induction periods, and calculations are included in its software.
Standard OxipresTM conditions are 60 °C, and most studies are conducted at this
“accelerated shelf life” temperature (Trojakava 2001, Pokorny 2003, Reblova, 2006);
few studies have used the OxipresTM at higher temperatures, and no others have used
this system at frying temperatures. If oil oxidation follows Arrhenius kinetics, the rate
should double for each ten degrees increase in temperature, and this may eliminate
induction periods under frying conditions.
To determine effects of high temperatures on induction periods and oxidation
rates, Blend oils were heated for three hours under two and five bars air and oxygen at
100, 120, 150, 160, 170 and 180 °C. Oxipres curves in Figures 28-34 and rate data in
Table 20 show very clearly that temperature has a tremendous effect on lipid
degradation. An induction period of 650 minutes was present at 100 °C, it decreased to
150 minutes at 120 °C, and disappeared at higher temperatures. At the same time, the
time to reach peak pressure decreased with temperature because oxidation began earlier,
even during heating, and proceeded faster so that oxygen consumption by reactions
counterbalanced pressure increase with temperature. This was particularly evident in

91
samples heated under 5 bars oxygen where the peak pressures were lower than expected
from the temperature. In contrast, at 100 and 120 °C the peak pressures were higher
than expected from PV=nRT with mere temperature rise. We hypothesize that volatile
oxidation products released from the oils as the bombs are heated contribute to this
increased pressure, and at low pressures these contribute a larger proportion of the
headspace; at high pressures, especially under oxygen, rapid reaction of oxygen with
radicals more than counterbalances this release.

92
Figure 28. Oxygen consumption curves for Blend oil heated at temperatures ranging from100 to 180 °C under 5 bars oxygen. Top: full curves showing initial increase with heating (PV=nRT). Bottom: curves normalized to peak pressure to facilitate comparison of rates.
5 bars oxygen
4.0
4.5
5.0
5.5
6.0
6.5
7.0
7.5
0 200 400 600 800 1000 1200 1400 1600 Heating time (min)
100 C 120 C 150 C 160 C 170 C 180 C
Bom
b pr
essu
re (b
ars)

93
Figure 29. Oxygen consumption curves for Blend oil heated at temperatures ranging from100 to 180 °C under 2 bars oxygen. Top: full curves showing initial increase with heating (PV=nRT). Bottom: curves normalized to peak pressure to facilitate comparison of rates.
Figure 30. Peak-normalized Oxygen consumption curves for Blend oil heated at temperatures ranging from100 to 180 °C under 2 bars oxygen. Top: full curves showing initial increase with heating (PV=nRT). Bottom: curves normalized to peak pressure to facilitate comparison of rates.
0
0.5
1
1.5
2
2.5
3
3.5
-20 0 20 40 60 80 100 120 140 160 180
100°C
120°C
150°C
160°C
170°C
180°C
pO2(
bar)
Heating time(min)

94
Figure 31. Oxygen consumption curves for Blend oil heated at temperatures ranging from100 to 180 °C under 5 bars air. Top: full curves showing initial increase with heating (PV=nRT). Bottom: curves normalized to peak pressure to facilitate comparison of rates.
Figure 32. Peak-normalized Oxygen consumption curves for Blend oil heated at temperatures ranging from100 to 180 °C under 5 bars air. Top: full curves showing initial increase with heating (PV=nRT). Bottom: curves normalized to peak pressure to facilitate comparison of rates.
0
1
2
3
4
5
6
7
8
9
0 50 100 150 200
100°C
120°C
150°C
160°C
170°C
180°C
pO2
(bar
)
Heating time (min)

95
Figure 33. Oxygen consumption curves for Blend oil heated at temperatures ranging from100 to 180 °C under 2 bars air. Top: full curves showing initial increase with heating (PV=nRT). Bottom: curves normalized to peak pressure to facilitate comparison of rates.
Figure 34. Peak-normalized Oxygen consumption curves for Blend oil heated at temperatures ranging from100 to 180 °C under 2 bars air. Top: full curves showing initial increase with heating (PV=nRT). Bottom: curves normalized to peak pressure to facilitate comparison of rates.
0
0.5
1
1.5
2
2.5
3
3.5
4
0 50 100 150 200
100°C
120°C
150°C
180°C
170°C
p(b
ar)
Heating time(min)
p(b
ar)
Heating time(min)
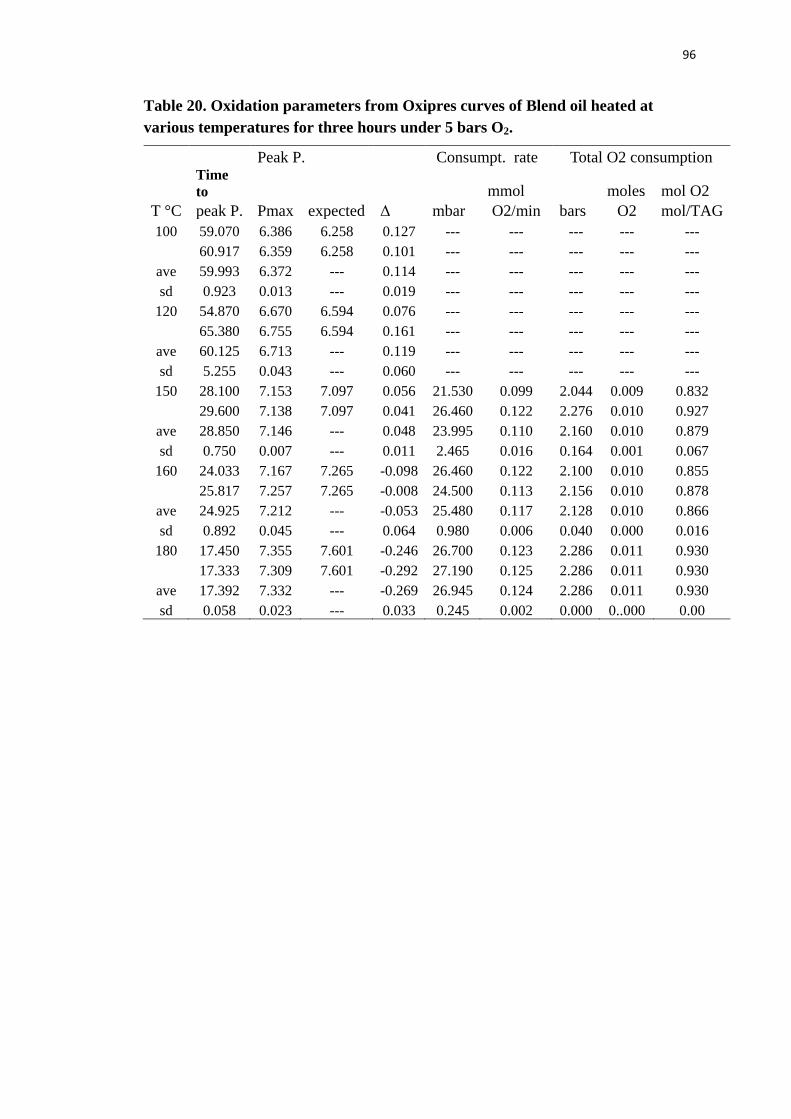
96
Table 20. Oxidation parameters from Oxipres curves of Blend oil heated at various temperatures for three hours under 5 bars O2.
Peak P. Consumpt. rate Total O2 consumption
Time to
mmol
moles mol O2
T °C peak P. Pmax expected Δ mbar O2/min bars O2 mol/TAG 100 59.070 6.386 6.258 0.127 --- --- --- --- ---
60.917 6.359 6.258 0.101 --- --- --- --- ---
ave 59.993 6.372 --- 0.114 --- --- --- --- --- sd 0.923 0.013 --- 0.019 --- --- --- --- ---
120 54.870 6.670 6.594 0.076 --- --- --- --- ---
65.380 6.755 6.594 0.161 --- --- --- --- ---
ave 60.125 6.713 --- 0.119 --- --- --- --- --- sd 5.255 0.043 --- 0.060 --- --- --- --- ---
150 28.100 7.153 7.097 0.056 21.530 0.099 2.044 0.009 0.832
29.600 7.138 7.097 0.041 26.460 0.122 2.276 0.010 0.927
ave 28.850 7.146 --- 0.048 23.995 0.110 2.160 0.010 0.879 sd 0.750 0.007 --- 0.011 2.465 0.016 0.164 0.001 0.067
160 24.033 7.167 7.265 -0.098 26.460 0.122 2.100 0.010 0.855
25.817 7.257 7.265 -0.008 24.500 0.113 2.156 0.010 0.878
ave 24.925 7.212 --- -0.053 25.480 0.117 2.128 0.010 0.866 sd 0.892 0.045 --- 0.064 0.980 0.006 0.040 0.000 0.016
180 17.450 7.355 7.601 -0.246 26.700 0.123 2.286 0.011 0.930
17.333 7.309 7.601 -0.292 27.190 0.125 2.286 0.011 0.930
ave 17.392 7.332 --- -0.269 26.945 0.124 2.286 0.011 0.930 sd 0.058 0.023 --- 0.033 0.245 0.002 0.000 0..000 0.00

97
Table 21. Oxidation parameters from Oxipres curves of Blend oil heated at various temperatures for three hours under 2 bars air
Time Peak P. Consumpt. rate Total O2 consumption
to
umol
mmoles mmol O2
T °C peak Pmax expected Δ mbar O2/min mbars O2 mol/TAG 100 100.18 2.70 6.26 0.13 --- --- --- --- --- 120 56.60 2.94 6.59 0.08 --- --- --- --- --- 150 47.70 3.17 7.10 0.06 1.47 1.31 156.3 0.14 0.0018 160 44.28 3.36 7.27 -0.10 2.20 1.98 275.9 0.25 0.0032 180 41.08 3.28 7.60 -0.25 2.32 2.08 236.9 0.21 0.0028
Table 22. Oxidation parameters from Oxipres curves of Blend oil heated at various temperatures for three hours under 5 bars air
Total O2 consumption
T Time
to Peak
P Pressure
Rate/min
mmoles mmol O2
(°C) peak (min)
bars expected ∆ mbar
umol O2 bar O2 mol/TAG
100 42.08 6.38 6.26 0.12 --- --- --- --- --- 120 55.32 6.75 6.59 0.16 --- --- --- --- --- 150 32.37 7.17 7.10 0.07 4.52 4.10 1.97 0.49 0.0055 160 40.45 7.33 7.27 0.07 4.20 3.80 2.12 0.43 0.0049 170 33.48 7.54 7.43 0.11 4.76 4.30 2.31 0.44 0.0049 180 32.97 7.64 7.60 0.04 4.27 3.80 2.22 0.42 0.0047

98
Table 23. Oxidation parameters from Oxipres curves of Blend oil heated at various temperatures for three hours under 2 bars O2
Time
Total O2 consumption
T to Peak P Pressure
Rate/min
mmoles mmol O2
(°C) peak (min) bars expected ∆ mbar
mmol O2
mbars O2 mol/TAG
100 54.05 2.71 2.50 0.21 --- --- --- --- --- 120 53.50 2.94 2.64 0.31 --- --- --- --- --- 150 31.60 3.09 2.84 0.25 8.79 0.040 929.60 4.28 378.4 160 25.58 3.17 2.91 0.27 7.77 0.036 1006.10 4.63 409.6 170 23.23 3.17 2.97 0.19 10.62 0.049 1050.00 4.83 427.4 180 19.15 3.20 3.04 0.16 10.62 0.049 1047.60 4.82 426.5
Surprisingly, after the large increase in rate between 120 and 150 °C, the variation in
oxidation rate and net oxygen consumption were very small for temperatures above 150
°C. A Q10 of essentially 1.0 calculated from the data (Table 24) suggests that above 150
°C, the reaction rate is nearly independent of temperature. This can be an indication that
when the working temperature is above some critical point, e.g. 150°C, some thermal
reaction(s) becomes the dominant oxidation initiator(s) and occurs at a relatively
constant rate that is the rate limiting step. Overall rates varied with oxygen pressure (5
or 2 bars oxygen vs 5 or 2 bars air), but the pattern of temperature effects was the same,
further supporting thermal reactions as the controlling factors.

99
Table 24. Q10 values for oxygen consumption by Blend oil heated for 3 hours at temperatures ranging from 100 to 180 °C. Calculated for zero (k) and first (k’) order reactions of oxygen.
Calculated by
(Kt-Ko) Calculated by [Ea/R/2.303]/[T0(T0-10)]b 2 bars air 5 bars air 2 bars air 5 bars air
T °C k k' k k' K k' k k' 100 --- --- --- --- --- --- --- --- 120 1.10 (a) 0.50 0.80 0.86 (a) 0.86 0.87 150 0.70 0.70 1.30 2.00 0.87 0.87 0.87 0.87 160 1.10 1.30 1.60 1.40 0.88 0.88 0.88 0.88 170 2.40 2.00 0.80 1.00 0.89 0.88 0.89 0.88 180 1.00 1.10 1.10 1.00 0.89 0.88 0.89 0.89
a k = (Ao – At)/ t; k’ = ln(Ao/At)/t. Running 20 minute slopes were determined and the maximum value was used for rate calculations. b Determined by plotting ln k or k’ vs 1/T (K); slope is Ea/R.
Table 25. Analysis of kinetic data – effects of temperature under 5 bar and 2 bar air pressurization
Temperature 5 bars air 2 bars air C K k k' k k'
100 373 0.80 0.000038 0.23 0 120 393 0.84 0.000057 0.49 0.000134 150 423 3.37 0.000346 0.98 0.000273 160 433 4.30 0.000495 1.10 0.000365 170 443 4.73 0.000494 2.66 0.000725 180 453 5.38 0.000519 2.78 0.000777

100
4.7. What processes are being reflected in the Oxipres curves?
Pressure decrease results from oxidation-specific reactions in the oils
We have a reference of unidentified source that criticizes the Oxipres approach
and claims that the decrease in headspace pressure during incubation is due exclusively
to oxygen diffusion into the oil and is totally unrelated to reactions in the oil. To counter
this claim, verify that the changes in pressure were directly and specifically related to
oxidation reactions in the oil, and learn more about the physical and chemical processes
that control sample behavior in the Oxipres, several control analyses were run.
a) Empty Oxipres cells heated under identical conditions as the oils showed pressure
increasing with temperature but no subsequent oxygen consumption (Figure 35). The
peak pressure reached was higher than with oil samples because the gas volume in the
cell was higher without oil. The same behavior was observed with and without the glass
containers present in the cells during heating.
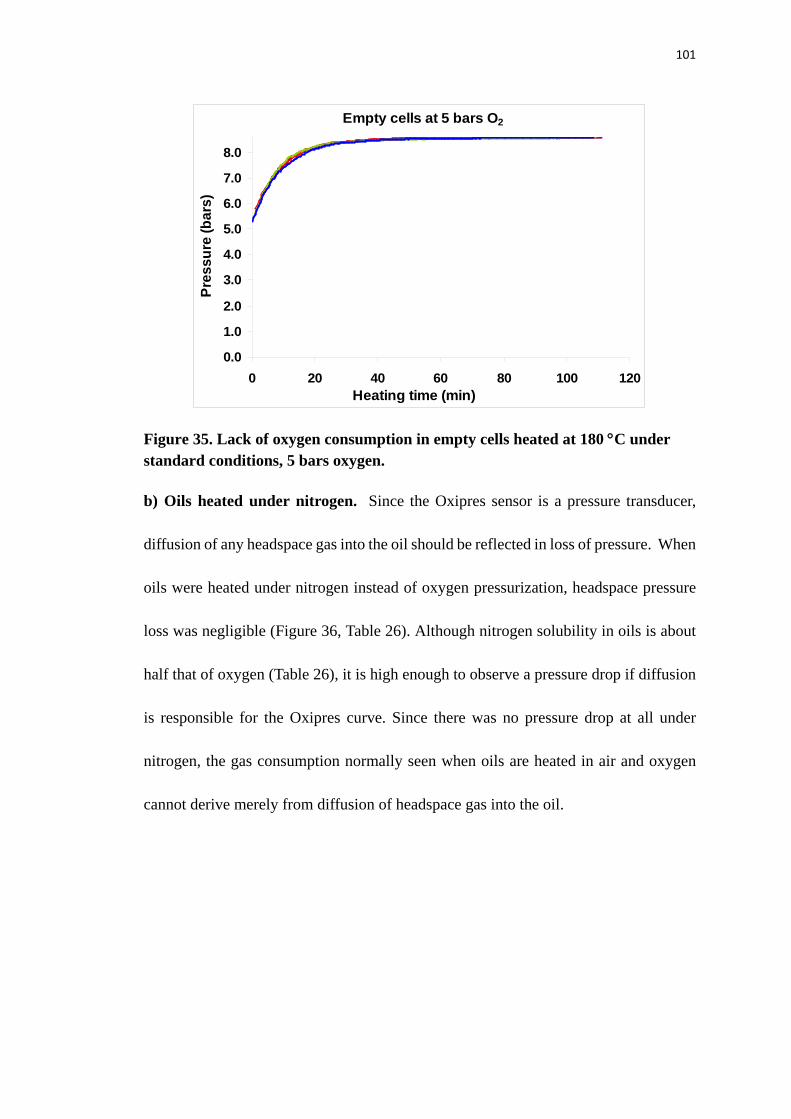
101
Figure 35. Lack of oxygen consumption in empty cells heated at 180 °C under standard conditions, 5 bars oxygen.
b) Oils heated under nitrogen. Since the Oxipres sensor is a pressure transducer,
diffusion of any headspace gas into the oil should be reflected in loss of pressure. When
oils were heated under nitrogen instead of oxygen pressurization, headspace pressure
loss was negligible (Figure 36, Table 26). Although nitrogen solubility in oils is about
half that of oxygen (Table 26), it is high enough to observe a pressure drop if diffusion
is responsible for the Oxipres curve. Since there was no pressure drop at all under
nitrogen, the gas consumption normally seen when oils are heated in air and oxygen
cannot derive merely from diffusion of headspace gas into the oil.
Empty cells at 5 bars O2
0.0
1.0
2.0
3.0
4.0
5.0
6.0
7.0
8.0
0 20 40 60 80 100 120Heating time (min)
Pres
sure
(bar
s)
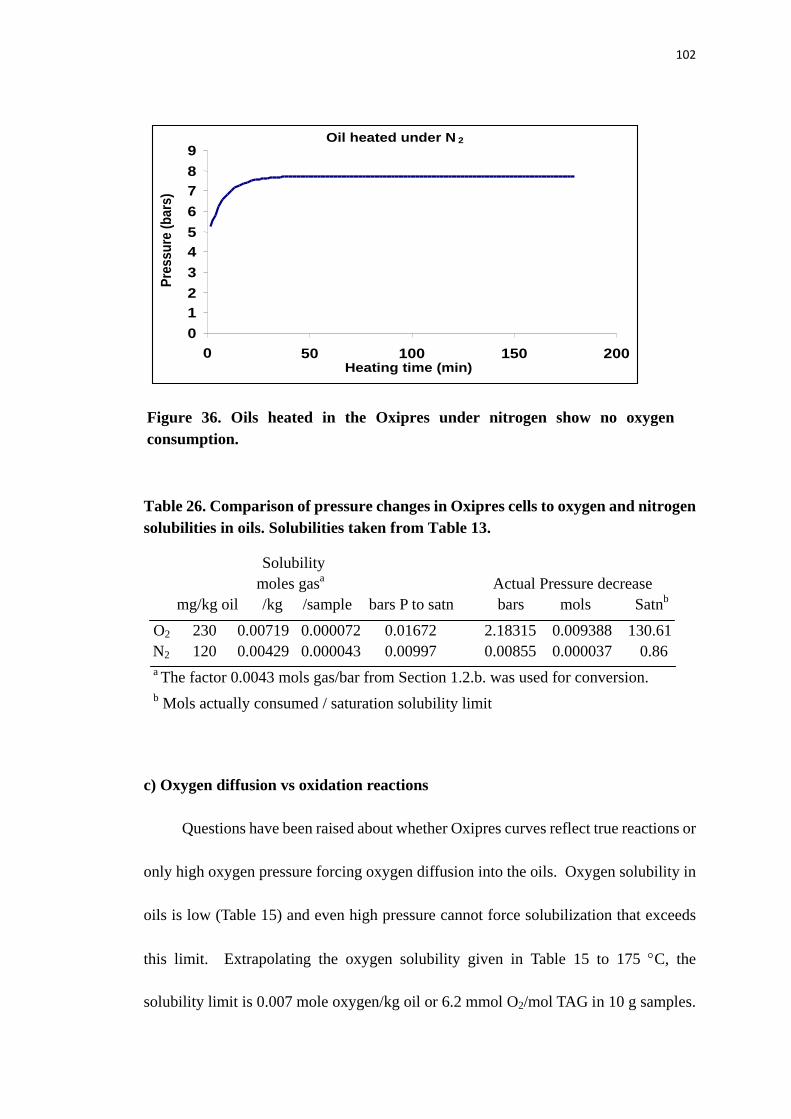
102
Table 26. Comparison of pressure changes in Oxipres cells to oxygen and nitrogen solubilities in oils. Solubilities taken from Table 13.
c) Oxygen diffusion vs oxidation reactions
Questions have been raised about whether Oxipres curves reflect true reactions or
only high oxygen pressure forcing oxygen diffusion into the oils. Oxygen solubility in
oils is low (Table 15) and even high pressure cannot force solubilization that exceeds
this limit. Extrapolating the oxygen solubility given in Table 15 to 175 °C, the
solubility limit is 0.007 mole oxygen/kg oil or 6.2 mmol O2/mol TAG in 10 g samples.
Solubility moles gasa Actual Pressure decrease mg/kg oil /kg /sample bars P to satn bars mols Satnb
O2 230 0.00719 0.000072 0.01672 2.18315 0.009388 130.61 N2 120 0.00429 0.000043 0.00997 0.00855 0.000037 0.86 a The factor 0.0043 mols gas/bar from Section 1.2.b. was used for conversion. b Mols actually consumed / saturation solubility limit
Figure 36. Oils heated in the Oxipres under nitrogen show no oxygen consumption.
Oil heated under N 2
0 1 2 3 4 5 6 7 8 9
0 50 100 150 200 Heating time (min)
Pre
ssur
e (b
ars)
103
There are nearly 3 moles oxygen in the headspace of the Oxipres cells at 5 bar oxygen,
so diffusion to oil saturation solubility would barely be detectable as a reduction of
bomb pressure. In contrast, total oxygen uptake in 3 hr heating (850 mmol O2/mol TAG,
Table 15), far exceeds mere oxygen solubility. In addition, as will be shown later, lipid
oxidation products (conjugated dienes, peroxides, and alkenals) are present at much
higher levels than the oxygen solubility limit of 0.62 mmol O2/mol TAG.. Thus,
oxygen must continually be replenished to the oil over the heating time, and the oxygen
consumption curves must reflect processes (e.g. reactions) other than oxygen diffusion
into the oil. However, whether the reactions occur in the bulk oil, at the oil-headspace
interface, or both remains an issue.
We have been unable to find an oxygen probe able to measure actual oxygen
levels in hot oil. To obtain an indirect indication of how fast oxygen can diffuse into the
oil from the headspace, samples of oils were pre-saturated with either argon or oxygen
before heating in the oxygen bomb under standard conditions (180 °C, 3 hours, O2). If
oxygen diffusion is a dominant factor, the oxygen-saturated oil should show faster
response because the oxygen solubility limit of the oil has already been reached.
Argon-saturated oil should show slower initial response since it will outgas during
heating, which will also yield a higher peak pressure; any argon remaining in the oil
should provide some antioxidant effect. This is indeed what was observed (Table 22,
Figure 35).
The oxygen-saturated oil reached equilibrium faster (16.6 minutes) because the

104
pre-gassing displaced other gases and left only oxygen which will not outgas against
high pO2; and it reached a lower peak pressure (7.15 bars) because it began oxidizing
faster and earlier, consuming oxygen even during heating (Figure 35, top graph).
Argon is heavier than oxygen and diffuses out of oil slowly, so it required more time to
reach pressure equilibrium during heating (18.9 minutes), and the amount outgassed
contributed to the higher peak equilibrium pressure (7.29 bars). Importantly, the rapid
initiation of oxidation suggests that oxygen diffusion into the oil is very fast -- at least
as fast as oil outgassing and heating to 180 °C, if not faster. This provides further
evidence that the drop in oxygen pressure after this equilibration point in Oxipres
curves is due to chemical reactions rather than oxygen diffusion into the oil.
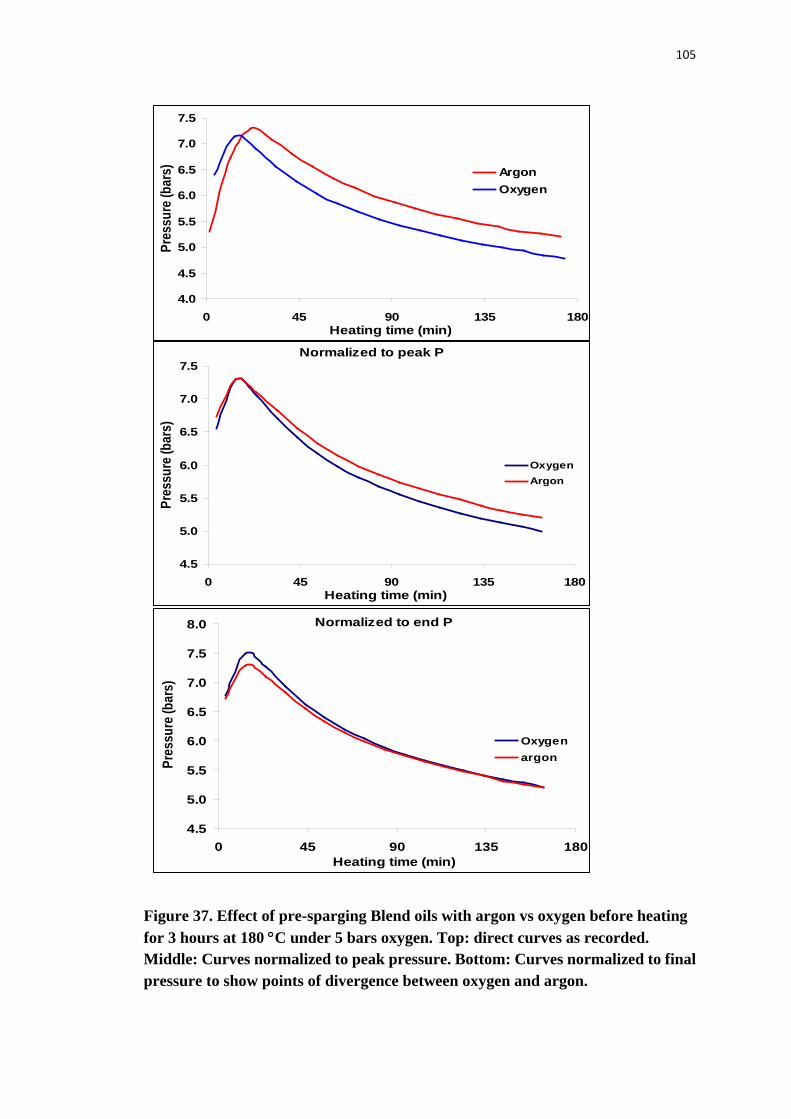
105
Figure 37. Effect of pre-sparging Blend oils with argon vs oxygen before heating for 3 hours at 180 °C under 5 bars oxygen. Top: direct curves as recorded. Middle: Curves normalized to peak pressure. Bottom: Curves normalized to final pressure to show points of divergence between oxygen and argon.
4.0
4.5
5.0
5.5
6.0
6.5
7.0
7.5
0 45 90 135 180Heating time (min)
Pres
sure
(bar
s) ArgonOxygen
Normalized to peak P
4.5
5.0
5.5
6.0
6.5
7.0
7.5
0 45 90 135 180Heating time (min)
Pres
sure
(bar
s)
OxygenArgon
Normalized to end P
4.5
5.0
5.5
6.0
6.5
7.0
7.5
8.0
0 45 90 135 180Heating time (min)
Pres
sure
(bar
s)
Oxygenargon

106
Table 27. Oxidation parameters for Blend oils pre-saturated with oxygen or argon before heating 3 hours at 180 °C under 5 bars oxygen.
Normalization of the curves to peak pressure and to final pressure provides
additional interesting information. The difference between the two sample curves is
greatest at the peak pressure where the oxygen-sparged oil oxidizes faster but much less
than might be expected (bottom graph, Figure 37), then it decreases from then until
about 90 minutes, when the oxygen consumption rates for the two oils become the same.
The difference in net oxygen consumption over the entire heating time is small – only
0.08 moles O2/mole TAG (middle graph, Figure 37). These results support rapid
oxygen diffusion into the oil, to almost complete saturation within 18 minutes, so that
the argon-sparged oil begins oxidizing only slightly behind the oxygen-saturated oil.
Another possible explanation is that most oxygen consumption by the oils occurs at the
oil surface were there is greatest contact with high oxygen. Thus, the argon-sparged
sample begins to oxidize at the surface even as the oil heats, while the bulk oil retains
some protection until the argon is dissipated. At the present time, we cannot distinguish
between these two processes, but it is likely that some combination of the two occurs.
Oxygen Argon Minutes to peak O2 16.64 18.94 Peak O2 (bars) 7.15 7.29 Initiation rate (mbar O2/min) 33.15 27.17 Total O2 consumed (bars) 2.36 2.11

107
4.8. Effect of agitation on lipid degradation.
The slow-down in oxygen consumption over time even while thermal stresses
initiating reactions remained constant raises questions about oxygen limitation in the
oils. It has already been shown that oxygen in the bomb chamber is sufficient to support
much more oxidation than is observed. One possible explanation for this is that there is
insufficient or no mixing in the oil by thermal currents, so oxygen diffuses into only a
surface layer of the oil and does not get mixed into lower layers.
Laminar swirling. To test the role of mixing in oxygen consumption, a simple
experiment was designed in which one group of samples were removed from the bomb
periodically and swirled to produce agitation, then replaced in the bomb. A second set
of samples were removed and held for the same time periods without swirling as
temperature controls. These two sets were compared with a third that was not removed
from the bombs.
Figure 38 (top) shows effects of gentle laminar swirling for different times from 2
minutes to 15 minutes. Pressures of the swirled group dropped notably with each
swirling, proportional to swirling time (Figure 38, bottom), then returned to control
levels. Pressures of the unswirled temperature controls, however, were nearly the same,
indicating that most of the pressure drop was due to decreased temperature, following
PV=nRT, rather than increased oxygen diffusion or access resulting from the swirling.
The small differences in the swirled samples (Table 28), corresponding to 0.02 to 0.14
µmol oxygen, were most likely due to slightly greater cooling induced by swirling. The

108
combined gas law predicts a drop of 0.0069 bars per degree drop in temperature under
the Oxipres conditions. Although the oil temperature could not be measured, the
amount of cooling predicted by PV=nRT for the observed pressure drops were
consistent with the rate of cooling when cells are removed from the bombs after
heating, i.e. the temperature predicted for 15 min swirling matches what is seen after 15
min of system cool down. After each time out of the block, the pressures of swirled and
unswirled samples both returned nearly to that of the control, and the overall curves
tracked control curves almost identically. This further supports cooling as a major
source of pressure drop.

109
∆
Figure 38. Top: Oxygen consumption curves for 10 g samples of Blend heated at 180 °C under 2 bars air pressure with and without gentle laminar swirling when the Oxipres cell was removed periodically from heater. Bottom: Change in pressure drop with time out of heater. Best fit curves with swirling: y = 0.0035x2 + 0.0596x - 0.092, R2 = 0.9906; without swirling: y = 0.0016x2 + 0.0719x - 0.1335, R2 = 0.9927.
P with time out of heater
0.00.10.10.20.20.30.30.40.40.5
0 3 6 9 12Time out of heater (min)
P
(mm
ols
O 2)
Without swirling
With swirling
Δp

110
Table 28. Calculation of swirling contributions to oxygen consumption.
These results can be interpreted in two ways:
a) Oxygen diffusion was not limiting in the oil samples as normally run in the
Oxipres and swirling the sample did not increase oxygen diffusion into the sample.
b) Oxygen solubility in the oil is extremely low, so measurable oxygen
consumption must occur at the oil surface. Swirling the sample under these lateral
laminar conditions does not change the surface area (surface not broken) so does not
increase access to oxygen, hence there is no increase in net oxygen consumption.
Turbulent swirling. To distinguish between these two possibilities, another test
was conducted in which cells were swirled with more force to create turbulence that can
break the oil surface; the time for swirling was adjusted to 30 seconds to limit cooling
effects (Figure 39, Table 29). In this experiment vigorous agitation initially increased
the oxidation rate; the effect continued for a short time after swirling was stopped, and
Sw t −∆P −∆P Theoret Actual (act−theoret) (min) wo swirl −∆T ° w swirling −∆T° ∆T(w-wo) ∆mbars ∆mbars mbars
2 0.021 14.93a 0.025 17.91 2.96 4.15b 4.18c 0.03d
5 0.038 27.47 0.048 34.63 7.11 9.95 10.03 0.08 7 0.070 50.33 0.079 58.85 8.45 11.83 11.93 0.10 10 0.075 53.74 0.082 56.12 2.36 3.31 3.34 0.03 12 0.080 57.22 0.098 69.66 12.34 17.27 17.41 0.14 15 0.086 61.70 0.106 75.63 13.82 19.35 19.50 0.15 Sw t = swirling time a −∆T° is the theoretical temperature change (calculated from the combined gas law) that would occur if all pressure change was due to cooling when Oxipres cells were removed from the heater. b Theoretical pressure change calculated from ∆T(w-wo) assuming all ∆P due to cooling c Pressure change actually measured d Pressure change due to swirling, not cooling.

111
then gradually returned toward control values. However, each successive swirling had
less effect on the oxidation rate, suggesting that some processes were becoming
saturated, and eventually, agitation had no effect on oxidation rate. Only with extremely
vigorous agitation did one sample exhibit sustained enhanced oxidation (swirl 2, Figure
39). In later stages of heating, agitation barely affected oxygen consumption and in the
last 60 minutes of heating, oxygen consumption slowed to a very slow rate. At the same
time, the static controls removed from the heating block without swirling showed a
constant small drop and recovery in the pressure curve with each swirling. The pressure
drops were comparable to most swirled sessions, showing that again a major
component of the pressure drop from swirling was from cooling. Finally, despite
different treatments -- vigorous swirling in one set, parallel cooling in the second set,
and neither in the third -- all three treatments ended with very close to the same total
oxygen consumption. Turbulent swirling under 2 bars oxygen. To investigate whether
the increased oxygen consumption induced by early swirling caused a rapid depletion
of the headspace oxygen, swirling experiments were repeated under 2 bars oxygen
instead of air. Three separate experiments were run; swirling times in each were 15 sec.
Similar patterns as in air were observed: the pressure drop increased with initial swirls,
decreased with subsequent swirls, and showed negligible effects in later curves (Figure
39). Under oxygen, the curves did not return to the control level during the normal three
hours of heating but after extended heating (five hours) the swirled sample curve
did return to the control level (bottom graph, Figure 40), indicating that the pattern was

112
the same, but just takes longer to consume the higher levels of oxygen.
Figure 39. Effect of vigorous swirling on oxygen consumption curves of Blend oil heated at 180 °C for three hours under 2 bars air pressure.
Swirl in air
2.9
3.0
3.1
3.2
3.3
3.4
0 45 90 135 180Heating time (min)
Bom
b pr
essu
re (b
ars)
Swirl 1 Swirl 2 Take out 1Take out 2 Control 1 control-2
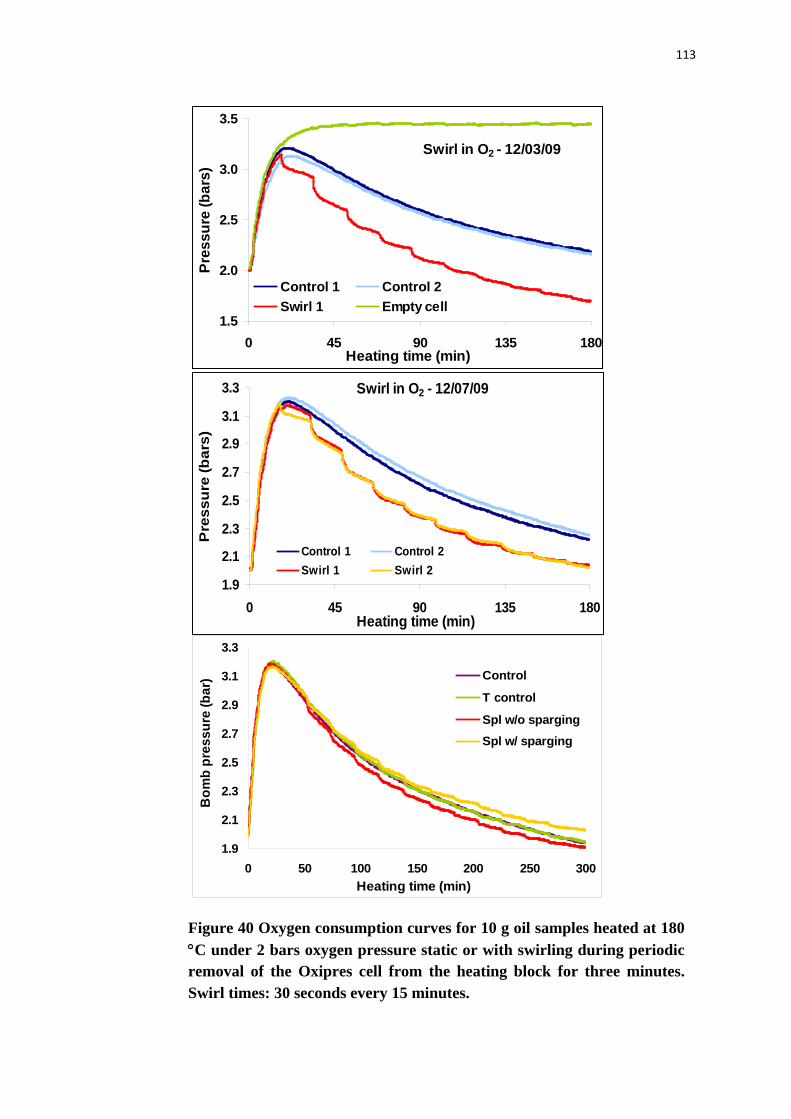
113
Swirl in O2 - 12/03/09
1.5
2.0
2.5
3.0
3.5
0 45 90 135 180Heating time (min)
Pres
sure
(bar
s)
Control 1 Control 2Swirl 1 Empty cell
Swirl in O2 - 12/07/09
1.9
2.1
2.3
2.5
2.7
2.9
3.1
3.3
0 45 90 135 180Heating time (min)
Pre
ssur
e (b
ars)
Control 1 Control 2Swirl 1 Swirl 2
Figure 40 Oxygen consumption curves for 10 g oil samples heated at 180 °C under 2 bars oxygen pressure static or with swirling during periodic removal of the Oxipres cell from the heating block for three minutes. Swirl times: 30 seconds every 15 minutes.
1.9
2.1
2.3
2.5
2.7
2.9
3.1
3.3
0 50 100 150 200 250 300Heating time (min)
Bom
b pr
essu
re (b
ar) Control
T control
Spl w/o spargingSpl w/ sparging
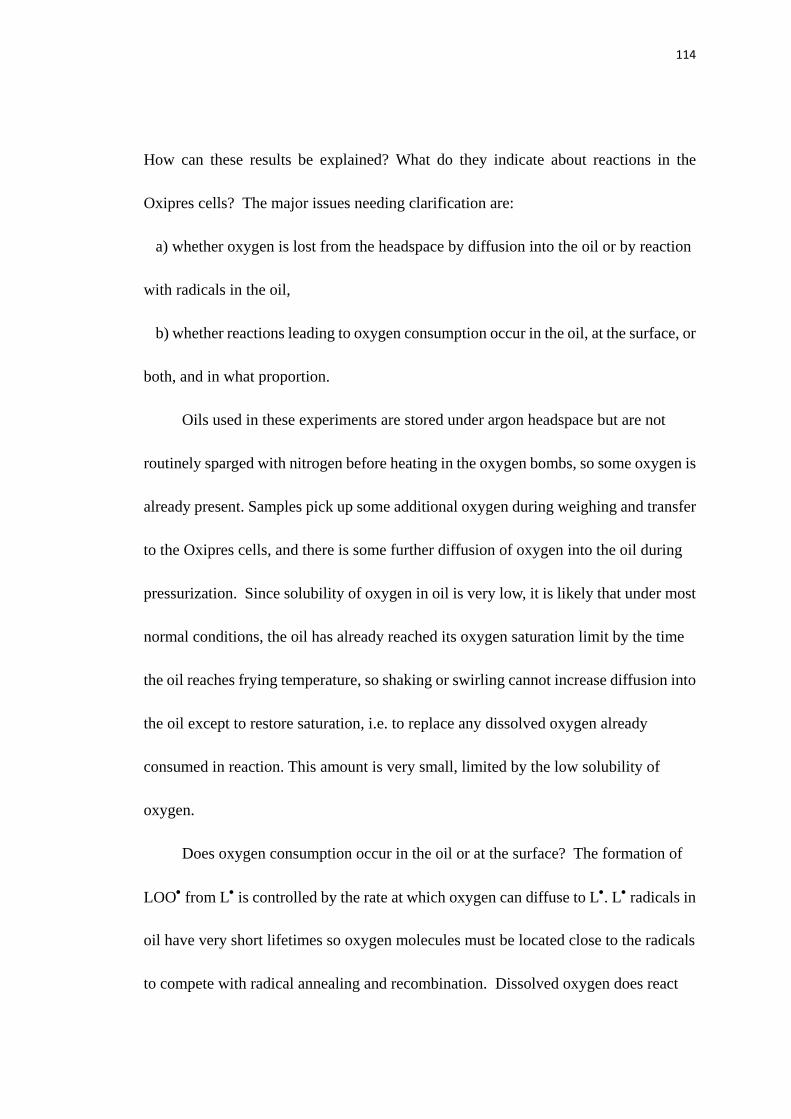
114
How can these results be explained? What do they indicate about reactions in the
Oxipres cells? The major issues needing clarification are:
a) whether oxygen is lost from the headspace by diffusion into the oil or by reaction
with radicals in the oil,
b) whether reactions leading to oxygen consumption occur in the oil, at the surface, or
both, and in what proportion.
Oils used in these experiments are stored under argon headspace but are not
routinely sparged with nitrogen before heating in the oxygen bombs, so some oxygen is
already present. Samples pick up some additional oxygen during weighing and transfer
to the Oxipres cells, and there is some further diffusion of oxygen into the oil during
pressurization. Since solubility of oxygen in oil is very low, it is likely that under most
normal conditions, the oil has already reached its oxygen saturation limit by the time
the oil reaches frying temperature, so shaking or swirling cannot increase diffusion into
the oil except to restore saturation, i.e. to replace any dissolved oxygen already
consumed in reaction. This amount is very small, limited by the low solubility of
oxygen.
Does oxygen consumption occur in the oil or at the surface? The formation of
LOO• from L• is controlled by the rate at which oxygen can diffuse to L•. L• radicals in
oil have very short lifetimes so oxygen molecules must be located close to the radicals
to compete with radical annealing and recombination. Dissolved oxygen does react

115
with radicals in the bulk oil but not efficiently because the oil viscosity is high. Oxygen
reacts with lipid radicals much faster at the oil surface where oxygen concentrations are
orders of magnitude greater and oxygen molecules have free movement.
Oils heated under the normal Oxipres conditions (10 g, 180 minutes) are not in
thermal equilibrium – there is enough temperature difference from top to bottom of the
cell to maintain slow circulation of the oil. The existence of thermal convection
microcurrents in the Oxipres system has been verified by computer simulation
(calculations by Dr. M. Karwe and students, Dept. of Food Science, Rutgers
University). This microcirculation brings new oil constantly to the surface for reaction
in a slow equilibrium process. When the oils are swirled gently in laminar flow, little
new surface is created and the real increase in oxidation rate (∆P not due to cooling) is
negligible. However, when the oil is agitated so as to create turbulence, new surface
area for reaction is increased and increased oxygen consumption is observed while the
agitation is maintained. When the agitation is stopped, the oil returns to equilibrium
conditions. Oxygen enhances the initial rate increase but not long term reactivity, again
indicating that the surface is the site of action.
How can agitation affect reaction rates if increased oxygen diffusion is not
involved? What is happening at the surface? We propose the following explanation.
Research of Nawar (Nawar 1969) has shown that heating oils at 180 °C induces
thermal scission reactions in the acyl chains of lipids. When thermal energy breaks
bonds in fatty acid chains, two C• scission radicals are generated:

116
-CH2-CH2-CH2-CH2- → -CH2-CH2
• + • CH2-CH2-
The radicals have several possible fates depending on the degree of agitation of
the oil and the concentration of oxygen molecules close to the radicals (angstroms).
a) reaction with O2 to form peroxyl radicals, ROO•, or with –O• formed at high
temperatures to generate alkoxyl radicals, RO•.
-CH2-CH2• + • CH2-CH2- → -CH2-CH2OO• + • OOCH2-CH2-
-CH2-CH2• + • CH2-CH2- → -CH2-CH2O• + • OCH2-CH2-
These are the reactions accounting for oxygen consumption. They are favored by
agitation which creates more surface area and constantly brings new oil to the surface,
and by high oxygen pressures which decrease diffusion distance and increase the
probability that an oxygen atom or molecule will be close enough to a scission radical
to compete with radical recombination reactions.
b) recombination to reform the original fatty acid
-CH2-CH2• + • CH2-CH2- → -CH2-CH2-CH2-CH2-
This is probably the dominant reaction in oils being heated with little swirling or
agitation because there is no force to move the radicals apart.
c) recombination with other fragments to form new dimer and polymer products,
particularly alkanes and ketones of various lengths
-CH2-CH2• + • CH2-CH2-CH2-CH2- → CH2-CH2-CH2-CH2-CH2-CH2-
Formation of mixed dimer products is favored as motion in the oil increases and
scission radicals are pushed out of their initial reaction cage; dimers are also enhanced
O•
O2
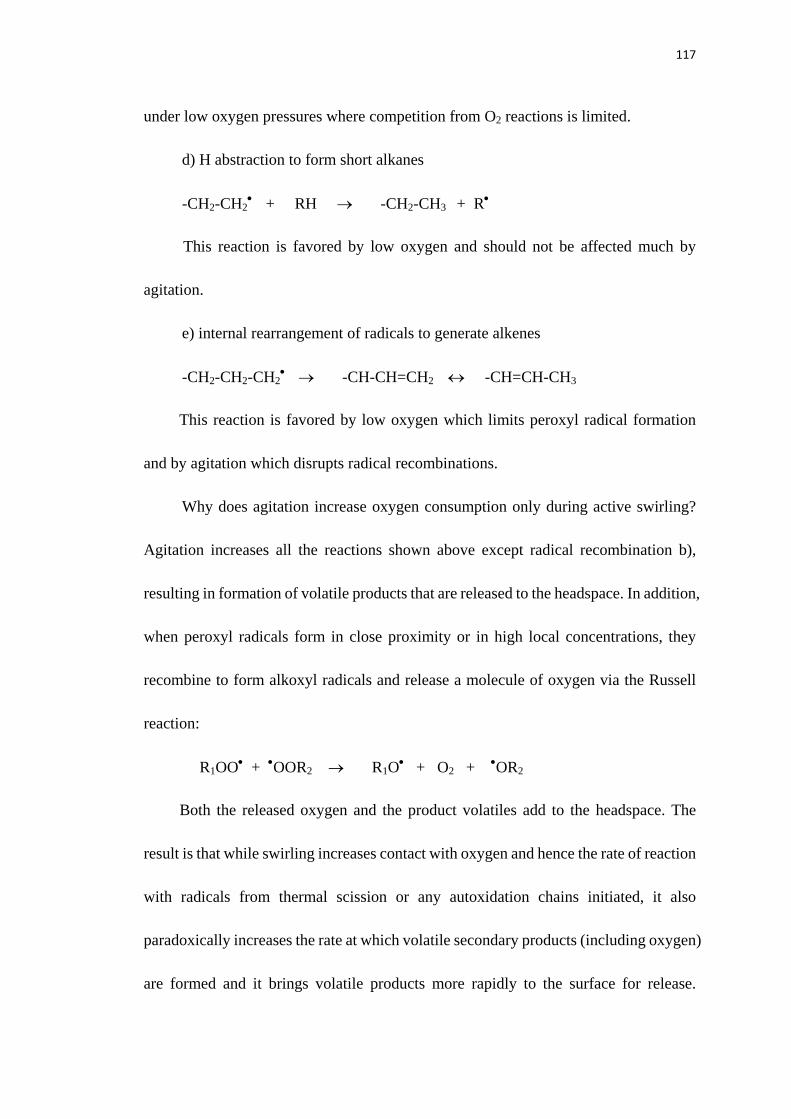
117
under low oxygen pressures where competition from O2 reactions is limited.
d) H abstraction to form short alkanes
-CH2-CH2• + RH → -CH2-CH3
+ R•
This reaction is favored by low oxygen and should not be affected much by
agitation.
e) internal rearrangement of radicals to generate alkenes
-CH2-CH2-CH2• → -CH-CH=CH2
↔ -CH=CH-CH3
This reaction is favored by low oxygen which limits peroxyl radical formation
and by agitation which disrupts radical recombinations.
Why does agitation increase oxygen consumption only during active swirling?
Agitation increases all the reactions shown above except radical recombination b),
resulting in formation of volatile products that are released to the headspace. In addition,
when peroxyl radicals form in close proximity or in high local concentrations, they
recombine to form alkoxyl radicals and release a molecule of oxygen via the Russell
reaction:
R1OO• + •OOR2 → R1O• + O2 + •OR2
Both the released oxygen and the product volatiles add to the headspace. The
result is that while swirling increases contact with oxygen and hence the rate of reaction
with radicals from thermal scission or any autoxidation chains initiated, it also
paradoxically increases the rate at which volatile secondary products (including oxygen)
are formed and it brings volatile products more rapidly to the surface for release.

118
Increased release of volatiles then counterbalances enhanced oxygen consumption.
In the oxygen bomb, thermal scissions are active initiators of radical reactions
that consume oxygen, and the balance between oxygen consumption, radical
recombinations, scission to short alkanes, and scission with oxidation to
hydroperoxides and aldehydes is controlled by rate of agitation and availability of
oxygen. Supporting this explanation are initial analyses of volatiles released when the
Oxipres cells were opened and trapped on thermal desorption traps, as will be discussed
in the next section.

119
4.9. Correlation of oxygen consumption with chemical assays of lipid oxidation
products and volatile oxidation products
While the oxygen bomb provides kinetic information about the oxidation process
and the oxidation curves tell researchers how far and how fast the reactions proceed,
when used alone it is a blind assay – it provides no information about underlying
reactions, products, or mechanisms. To demonstrate that the oxygen consumption
curves do indeed reflect frying chemistry accurately, and to better understand what
reactions are happening during elevated temperature frying, oils after heating were
analyzed for conjugated dienes, hydroperoxides, aldehydes, and free fatty acids, and
exploratory volatiles analyses were conducted
Products formed under various conditions are shown in Table 28. Several
interesting patterns were observed. At all high temperatures, very low levels of
hydroperoxides and conjugated dienes were detected Low concentrations of
hydroperoxides are expected since heat decomposes hydroperoxides. Low
concentrations of conjugated dienes indicates very low levels of autoxidation initiation,
supporting thermal scissions as major initiators in short-time heating at frying
temperatures. From table 30 it’s found, once the heating temperature is set, the
concentration of hydroperoxides has little connection with oxygen. Surprisingly,
extremely high concentrations of aldehydes were detected, all these points that thermal
scission reaction is the dominant reaction in high heat system. To test this, the
headspace gas was collected by short path thermal desorption trap by venting through it.

120
The volatiles were analyzed by GC-MS. From table 31, it’s shown that the GC-MS
analysis indicate that in the headspace, there are all kinds of small fraction of
degradation products, specifically, alkanes, alkenes, aldehydes, carboxylic acid,
alcohols, epoxides, free fatty acid and so forth, in all chain length from 2 carbons to 12
carbons.
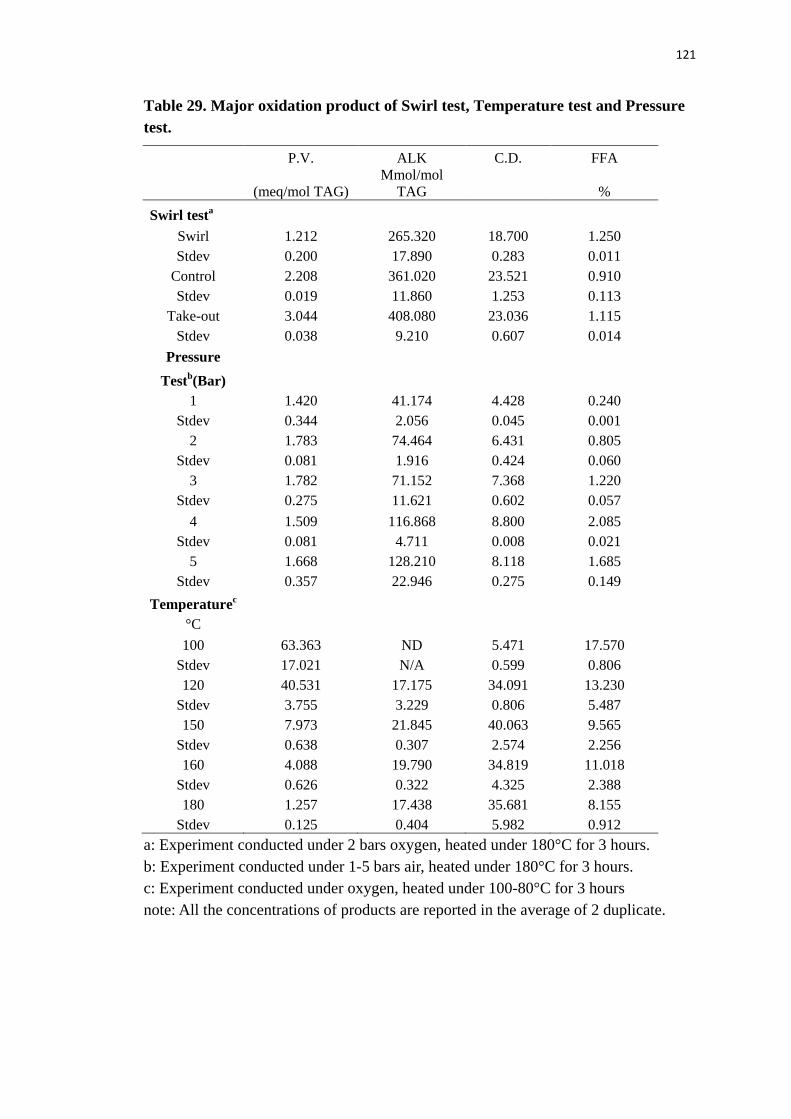
121
Table 29. Major oxidation product of Swirl test, Temperature test and Pressure test.
P.V. ALK C.D. FFA
(meq/mol TAG)
Mmol/mol TAG
%
Swirl testa Swirl 1.212 265.320 18.700 1.250
Stdev 0.200 17.890 0.283 0.011 Control 2.208 361.020 23.521 0.910 Stdev 0.019 11.860 1.253 0.113
Take-out 3.044 408.080 23.036 1.115 Stdev 0.038 9.210 0.607 0.014
Pressure Testb(Bar) 1 1.420 41.174 4.428 0.240
Stdev 0.344 2.056 0.045 0.001 2 1.783 74.464 6.431 0.805
Stdev 0.081 1.916 0.424 0.060 3 1.782 71.152 7.368 1.220
Stdev 0.275 11.621 0.602 0.057 4 1.509 116.868 8.800 2.085
Stdev 0.081 4.711 0.008 0.021 5 1.668 128.210 8.118 1.685
Stdev 0.357 22.946 0.275 0.149 Temperaturec
°C 100 63.363 ND 5.471 17.570
Stdev 17.021 N/A 0.599 0.806 120 40.531 17.175 34.091 13.230
Stdev 3.755 3.229 0.806 5.487 150 7.973 21.845 40.063 9.565
Stdev 0.638 0.307 2.574 2.256 160 4.088 19.790 34.819 11.018
Stdev 0.626 0.322 4.325 2.388 180 1.257 17.438 35.681 8.155
Stdev 0.125 0.404 5.982 0.912 a: Experiment conducted under 2 bars oxygen, heated under 180°C for 3 hours. b: Experiment conducted under 1-5 bars air, heated under 180°C for 3 hours. c: Experiment conducted under oxygen, heated under 100-80°C for 3 hours note: All the concentrations of products are reported in the average of 2 duplicate.

122
In further research on agitation, it’s found that not only can agitation consume
more oxygen by surface renewal; it also has positive effect on helping stabilize oil
during frying. The figure 41 shows GC-MS diagram of swirled and control samples.
Some peaks came out at the later stage of the GC-MS run in sample with swirling,
which means there’re some molecules with large molecular weight. However in the
control sample these peaks did not show up. From table 3, it’s also found that the total
volatiles released in swirled samples are significantly more than that of controls. For
test ran under 2 bars air, volatiles released from swirled sample are 4.7 time more than
that of control and over 20 times more for swirled test ran under 2 bar pure oxygen.
Oxygen concentration also played a role in competing with the thermal scission
reaction. When running under air, the total volatiles released are 1.6 times and 7.3 times
more than that run under pure oxygen, respectively. Combine the agitation research,
some suggestions can be made to industrial frying are that first, if the agitation can be
control during the early stage of frying, oil oxidation can be significantly reduced by
cutting the access of oil with oxygen. On another hand, in the later stage of the frying,
when the oil quites down, if artificial agitation can be made, for example, by flushing
nitrogen through the oil, formation of dimmers and other large molecular weight
compounds will greatly reduce, furthermore, by agitating the oil, release of volatiles
will be facilitated which otherwise will stick on the fried food products and affect the
safety and shelf life of the food products.These showing homologous series of alkanes,
alkenes, aldehydes, carboxylic acids, and alcohols.

123
Figure 41 Effects of swirling under 2 bars oxygen or air on distribution and quantities of volatile products released from oil heated at 180 °C in the Oxipres system. Top two curves, heating under oxygen without (control) and with swirling. Bottom two curves, same but heating under air. Numbers shown at the right end of each chromatogram are the total area under the curve.
1.68e6
3.3e5
2.51e6
1.68e5
air
air
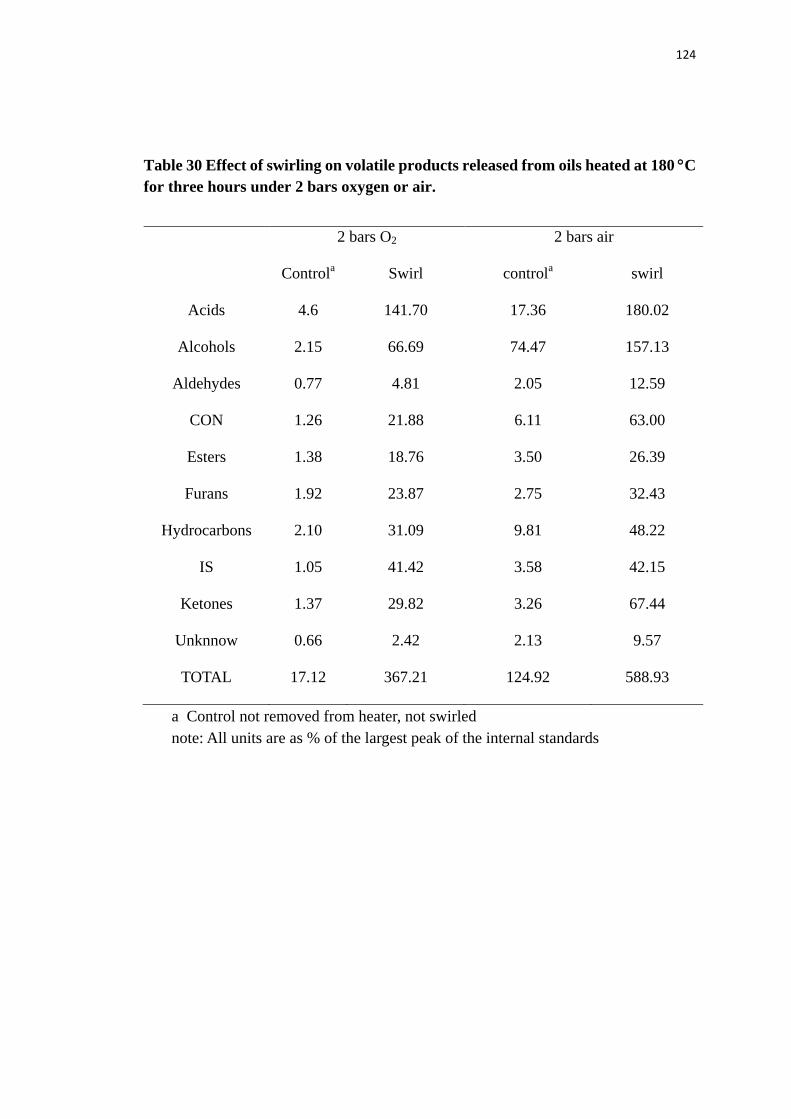
124
Table 30 Effect of swirling on volatile products released from oils heated at 180 °C for three hours under 2 bars oxygen or air.
2 bars O2 2 bars air
Controla Swirl controla swirl
Acids 4.6 141.70 17.36 180.02
Alcohols 2.15 66.69 74.47 157.13
Aldehydes 0.77 4.81 2.05 12.59
CON 1.26 21.88 6.11 63.00
Esters 1.38 18.76 3.50 26.39
Furans 1.92 23.87 2.75 32.43
Hydrocarbons 2.10 31.09 9.81 48.22
IS 1.05 41.42 3.58 42.15
Ketones 1.37 29.82 3.26 67.44
Unknnow 0.66 2.42 2.13 9.57
TOTAL 17.12 367.21 124.92 588.93
a Control not removed from heater, not swirled note: All units are as % of the largest peak of the internal standards

125
4.10. Thermal scission versus autoxidation.
From this project, it’s found that, oxygen bomb is an excellent alternative method for
study of frying chemistry in several ways. First, it provides a perfect closed system that
allows researchers to monitor the oxygen consumption without worrying about leakage,
also since it’s closed system, all the oxidative volatile products will stay in the cylinder
and can be easily collected and prepared for other analyses. Secondly, it provides
accurate and stable temperature and pressure control throughout the entire project..
Thirdly, data acquisition frequency can be set from 10-second, which is for short-term
experiment, to 600-second interval, which can be used for long term storage study.
Fourthly, it provides easy means to control and interpret how far and how fast the
reaction proceeds. However, during the project, several drawbacks were also found.
First, the pressure transducer sensor causes problems, since oxygen consumption is the
major concern and needs to be accurately monitored, but the pressure transducer picks
up the total pressure. In this case, when oil degrades volatiles released would obscure
the real total oxygen consumption, therefore, in order to detect only oxygen change
during the experiments, the pressure transducer sensor needs to be replaced with a
sensor that is only sensitive to oxygen. Secondly, the temperature detected by the
machine is from the heating block, since the oil or the fat containing sample is the main
concern for investigating oil frying chemistry, the temperature of the heating block may
not reflect the real situation of the oil, especially during the heating up stage, it’s
recommended that a thermometer should be embedded in the reaction cylinder,

126
therefore the real time temperature can be monitored completely and accurately.
Thirdly, it’s known that when frying, because of the water contained in most of the
foods, agitation happens at the early stage of the frying. During the agitation test, the
agitation is created by swirling manually, this cause a lot of labor to do this, furthermore,
manual handling of agitation may vary from people to people and batch to batch, even
agitation between two sample in the same batch by the same operator can vary. Thus,
it’s suggested that stirrer should be installed in the cylinder for better and easier control
of the agitation. Last but not least, data provided by oxygen bomb gives information of
how fast and how far the oil degradation proceeds, this is measured by the total oxygen
consumption and oxygen consumption rate when conducting at elevated temperature,
and induction period for experiment at ambient temperature. However, for mechanism
study, it’s hard to extract helpful information from it since products should be known to
map out all the possible reaction mechanisms.

127
5. Summary and Conclusion
The main purpose of this project was to evaluation the feasibility of using oxygen
bomb to study frying chemistry. Since this technology had been used for food oils and
fats only at ambient temperature where induction period can be used as the primary
parameters for the determination of the stability of oils and fats, for elevated
temperature, the shifted reaction mechanism requires new thinking and method to
interpret the data obtained.
This is further proved by the temperature study of this project. It’s found that
when working temperature is below 150°C, induction period still showed up, which
matches the result from other people’s work. Nevertheless, when temperature is above
that point, oxygen consumption started immediately after it reached the peak pressure
or even before that. In this case, oxidation rate, net oxygen consumption, the
comparison between observed peak pressure and theoretical peak pressure were
measured and used as the parameters for studying the chemistry. Oxidation rate of the
temperature test for sample run at temperature above 150°C did not show significant
variance, which indicates that once temperature is above the critical point (may vary
dependent on oil type, antioxidant proxidant and so fourth), enough thermal energy will
trigger the scission reaction proceed at a constant rate. Excess energy will not have
significant effect on the oxidation rate once the critical point is passed.
In the pressure test, the effect of oxygen was tested at the typical frying
temperature-180°C. First, it’s found that oxygen pressure affect the oxidation rate as it

128
would be expected, however, when under careful examination, result turns out that low
oxygen, specifically, from 0.5 to 1 bar oxygen the oxidation rate increase more
dramatically than that at relative high oxygen, namely from 1 bar to 5 bars. From the
literature, same phenomenon had also been reported, only the cut-off pressure varies
from work to work.
Furthermore, from the GC-MS data, it’s found that oxygen concentration also
played a role in competing with thermal scission reaction. 7.3 times more volatiles from
the air-control group were detected compare to oxygen control group, and 1.6 time
more volatile from the air-swirl groups compare to oxygen swirl group.
From the swirl test, it’s found that agitation, which is always happen during
practical frying, can either do good or bad to oils and therefore the food fried. First,
when oil is agitated, oxygen consumption, in another word, oxidation rate is significant
increased. Because, agitation will bring new oxygen into oils more effectively, and
meantime, it breaks the oil surface, which allows the new fresh oil gain access to
oxygen. This can cause the oil quality and safety go south much fast. Nevertheless,
from the result of GC-MS, it’s found that with agitation, it help to release much more
volatile out of the oil phase and generate less high molecular weight products, which
are possibly dimmers and polymers that can stick onto the fried foods. The benefit of
this is that, less oxidized oil products will stick to the fried products, therefore enhance
the quality, safety and shelf life. Furthermore, it’s also found from the swirl test that,
agitation initially had tremendous effect on the increase of oxidation rate, however less

129
and less effect was observe during the last few operations, more surprisingly, the
experimental group ended up with the same amount the total oxygen consumption with
the control group, which indicates that in the control group, slow convection still exists
that keep circulating the oil from bottom to top bringing new fresh oil to react.
In order to understand what is really happening in the cylinder during experiment,
products analyses was conducted by SaftestTM kits for the oil phase, and by GC-MS for
the volatile test. Four major oxidative products from oil phase was conducted, namely
hydroperoxide, aldehyde, conjugated diene and free fatty acid. From the result, very
little hydroperoxide and conjugated diene were detected, however, huge amount of
aldehyde was detected. This suggests thermal scission reaction is the dominant reaction
at elevated temperature. This suggestion was also further proved by the GC-MS data, in
which homologous series of short chain products, namely from 2 carbons to 12 carbons,
were detected.
In summary, oxygen bomb is a reliable and stable equipment that provides easy
means to control and interpret the data obtain. However, for more accurate
measurements, several modifications to the hardware design of the machine should be
made. Last but not least, since the oxygen bomb only provides information about
kinetics, for mechanism study, the data gain from it should be combined with products
analyses
130
6. Future work
First, because of the drawbacks of the equipment mentioned above are very
critical for accurate and precise quantitative analysis, suggestions will be made to the
manufacturer for modifications, including changing the pressure transducer to oxygen
sensor for real oxygen consumption analysis, and adding inert stirrer into the reaction
cylinder to provide circulation. Inserting a thermometer in the reaction cylinder to
monitor the temperature of the oil sample will be necessary to verify the heating time
for research and to determine appropriate monitoring times, but is probably not critical
for commercial design once reproducible patterns have been established.
Secondly, to data, single factors that affect oil oxidation has been done by using
this methodology, including, temperature, pressure, agitation, water, metal ions,
phospholipids and oxidized products. (The data of latter 5 factors are not shown here).
Considering the practical situation in which multiple proxidants exist in foods, the
synergistic effect of either two or three factor will be investigated in future.
Finally, since the current products analyses method, the SaftestTM kits are only
good for qualitative or semi quantitative determination, sophisticated analytical
methods are under developing. For oxidized products in oil phase, HPLC-ECD method
for detailed products determination will be developed. Since the current GC analysis
for volatiles was done by cooperating with other labs, GC method for determination of
volatiles by our own lab should be developed.
.

131
REFERENCES
Kaufmann, A, Suter, B (2001). "Comparison of different methods to determine polar compounds in frying oils." Eur. Food Res. Technol.
American Oil Chemistry Society. Free Fatty Acid. Ca 5a-40. 213: 377-380.
American Oil Chemistry Society Official method (1986). Peroxide Value. Cd 8-53. American Oil Chemistry Society Official method (1989). 2-Thiobarbituric Acid
Value. Direct MethodAmerican Oil Chemistry Society Official method (1989). p-Anisidine value. Cd 18-90.
. Cd 19-90.
American Oil Chemistry Society Official method (2003 ). Spectrophometric Determination of Conjugated Dienoic Acid. Ti 1a-64.
ASTM (2007). Standard test method for oxidation stability of lubricating grease by oxygen vessel method. D942-02.
Muik, B., Molina-Diaz, A., Ayora-Canada, M.. (2005). "Direct monitoring of lipid oxidation in edible oil by Fourier transform Raman spectroscopy." Chemistry and Physics of Lipids
Blankenship, R., Holaday, E., Barnes, J,. Pearson, L.. (1973). "Comparison of oxygen bomb method to other methods for measuring oxidative stability of peanuts and peanut products."
134: 173-182.
J. Amer. Oil Chem. Soc.Byrdwell, C., Neff, E. (1998). "Analysis of Hydroxy-containing seed oils using
atmospheric pressure chemical ionization mass spectrometry."
50(9): 377-380.
J. Liquid Chromatogr.
Byrdwell, C., Neff, E.. (1999). "Non-volatile products of triolein produced at frying temperatures characterized using liquid chromatography with online mass spectrometric detection."
21: 1485-1501.
J. Chromatography ASummo, C., Caponio, F.. (2008). "Assessment of the oxidative and hydrolytic
degradation of the lipid fraction of mortadella by means of HPSEC analyses of polar compounds."
852: 417-432.
Meat ScienceChoe, E., Min, D.. (2006). "Mechanisms and Factors for Edible Oil Oxidation
"
79: 722-726.
Comprehensive reviews in Food Science and Food SafetyClaxson, A., Hawkes, G., Richardson, D., Naughton, D., Haywood, R., Chander, C.,
Atherton, M., Lynch, E.. (1994). "Generation of lipid peroxidation products in culinary oils and fats during episodes of thermal stressing: a high field 1H NMR study."
5: 169-186.
Federation of European Biochemical SocietiesConi, E., Podesta, E., Catone, T.. (2004). "Oxidizability of different vegetables oils
evaluated by thermogravimetric analysis."
355: 81-90.
Thermochimica actaCooper, R., Matzinger, D. P., Furia. T. E.. (1979). "An improved apparatus for oxygen
bomb testing."
418: 11-15.
J. Amer. Oil Chem. Soc.Dobarganes, M. C., Velasco, J.. (2002). "Analysis of lipid hydroperoxides."
56(1): 1-5. Eur. J.
Lipid Sci. TechnolDobson, G., Christie, W. W., Sebedio, J. L.. (1997). "Saturated bicyclic fatty acids
formed in heated sunflower oils "
104: 420-428.
Chemistry and Physics of Lipids 87: 137-147.

132
Drozdowsk, B., Szukalska, E. (1987). "A rapid instrumental method for the evaluation of the stability of fats." J. A. Oil Chem. Soc.
Eldin, A. K. (1997). "Characterisation of aldehydic acid in used and unused frying oils "
64(7): 1008-1011.
J. Chromatography AEllis, R., Gaddis, A. M., Currie, G. T.. (1966). "Carbonyls in oxidizing fat. IX.
Aldehydes isolated from autoxidized methyl arachidonate."
776: 245-254.
J. Food Sci.
Ellis, R., Gaddis, A.M., Currie, G.T. & Powell. S.L.. (1968). "Carbonyls in oxidizing fat: XII. The isolation of free aldehydes from autoxidized triolein, trilinolein and trilinoleinin."
31(2): 191-195.
J. Amer. Oil Chem. Soc.Esterbauer, H., Zollner., H.. (1989). "Methods for determination of aldehydic lipid
peroxidation products."
45(8): 553-559.
Free Radical Biology & MedicineFarhoosh, R., Moosavi, R.. (2008). "Carbonyl value in monitoring of the quality of used
frying oils."
7: 197-203.
Analytical chimica ACTACaponio, F., Gomes, T., Pasqualone, A., Summo, C.. (2006). "Use of the high
performance size exclusion chromatography analysis for the measurement of the degree of hydrolytic and oxidative degradation of the lipid fraction of biscuits."
617: 18-21.
Food ChemistryFrankel, E. (1982). "Volatile lipid oxidation products."
102: 232-236. Prog. Lipids Res.
Frankel, E. (1987). "Secondary products of lipid oxidation " 22: 1-33.
Chem. Phys. Lipids
Frankel, E., Neff, W., Selke, E., Brooks, D. (1987). "Thermal and metal-catalyzed decomposition of methyl linolenate hydroperoxides "
44: 73-85.
LipidsFrankhauser-Noti, A., Fiselier, K., Biedermann-Brem, S., Grob, K.. (2006).
"Assessment of epoxidized soy bean oil (ESBO) migrating inito foods: Comparison with ESBO-like epoxy fatty acids in our normal diet."
22: 322-327.
Food Chemical Toxicology
Fredriksson, P., Marcuse, R. (1968). "Fat oxidation at low oxygen pressure.i. kinetic studies on the rate of fat oxidation in emulsion."
44: 1279-1286.
Journal of American Oil Chemistry Society.
Gertz, S. K. C., Kochhar, S. P.. (2000). "Testing and comparing oxidative stability of vegetable oils and fats at frying temperature."
45: 400-407.
European Journal of Lipid Science and Technology
Gillat, P. (2001). 102: 543-551.
Flavour and Aroma Development in Frying and Fried Foods
Gonzaga, F. B., Pasquini, C.. (2006). "A new method for determination of the oxidative stability of edible oils at frying temperatures using near infrared emission spectroscopy."
. Boca Raton, CRC Press.
Analytical Chimica ActaGordon, V. (2001). Food Testing System: Rapid and routine analysis of food quality
and stability.
570: 129-135.
AOAC. Gordon, V. (2005). "Rapid testing for fats and oils and food products." Food Technology
Guillen, M. D. (2009). "Oxidation of corn oil at room temperature: Primary and 19(9): 594-595.

133
secondary oxidation products and determination of their concentration in the oil liquid matrix from H nuclear magnetic resonance data." Food Chemistry
Gunstone, F. D. a. P., F. B.. (1997). Lipid Technologies and Application. New York, NY, Marcel Dekker: 181-182.
116: 183-192.
J. Pokorny, Parkanyiova, L., Reblova, Z., Trojakova, L., Sakurai, H., Miyahara, M., Yano, T.. (2003). "Changes on storage of peanut oils containing high levels of tocopherols and beta-carotene." Czech J. Food Sci.
Jin-Hyang, S., Cho-Ook, C., Terao, J., Ki, P. D.. (1993). "Electrochemical detection of triacylglycerol hydroperoxides by reversed phase high-performance liquid chromatography."
21: 19-27.
Biosci. Biotechnol. Biochem.Jonsdottir, R., Bragadottir, M. Arnarson, G.. (2005). "Oxidatively derived volatile
compounds in microencapsulated fish oil monitored by solid-phase microextraction (SPME)."
57: 479-480.
J. Food Sci.Kamal-Eldin, A., Marquez-Ruiz, J., Dobarganes, C., Appelqvist, A.. (1997).
"Characterisation of aldehydic acids in used and unused frying oils."
70: 433-440.
J. Chromatography A
Karel, M. (1992). 776: 245-254.
In Physical Chemistry of FoodsKerwin, J. L., Torvik, J. J.. (1996). "Identification of monohydroxy fatty acids by
electrospray mass spectrometry and tandem mass spectrometry."
. New York, Marcel Dekker.
Anal. Biochem.
Kinter, M. (1995). "Analytical technologies for lipid oxidation products analysis."
237: 56-64.
Journal of ChromatographyKochi, J. K. (1973).
671: 223-236. Free Radicals
Labuza, T. P. (1971). "Kinetics of lipid oxidation in foods." . New York, John Wiley.
CRC Crit. Rev. Food Sci. Nutr.
Liang, C. (1998). "Comparison of four accelerated stability methods for lard and tallow with and without antioxidants."
2(3): 355-405.
Journal of American Oil Chemistry Society
Lingnert, K. A. a. H. (1999). "Kinetic studies of oxygen dependence during initial lipid oxidation in rapeseed oil."
75(10): 1441-1443.
Journal of Food ScienceTrojakova, L. Reblova, Z., Pokorny, J.. (2001). "Determination of oxidative stability in
mixtures of edible oil with nonlipidic substances."
64(2): 262-266.
Czech Journal of Food Science.
Trojakova, L.,Reblova, Z., Thu, T., Pokorny, J.. (2001). "Antioxidant activity of rosemary and sage extracts in rapeseed oil."
19(1): 19-23.
J. Food Sci.Lundberg, W. O. and J. R. Chipault (1947). "The oxidation of methyl linoleate at
various temperatures."
8: 1-13.
Journal of American Chemistry SocietyMoreno, M., Olivares, D., Lopez, F., Martinez, V., Reig, F..(1999). "Study of the
formation of carbonyl compounds in edible oils and fats by H-NMR and FTIR."
69: 833-836.
Journal of Molecular Structure Makinen, M., Piironen, V., Hopia, A.. (1996). "Postcolumn chemiluminescence,
482-483: 557-561.

134
Ultraviolet and evaporative light-scattering detectors in high-performance liquid chromatography determination of triacylglycerol oxidation products." Journal of. Chromatography.
De Maria, C., Santos, M., Dias, U., Marana, M.. (2000). "Stabilization of soybean oil with heated quercetin and 5-caffeoylquinic acid in the presence of ferric ion."
734: 221-229.
J. Agric. Food Chem.
Marmeasat, S., Velasco, J., Dobarganes, M. C.. (2008). "Quantitative determination of epoxy acids, keto acids and hydroxy acids formed in fats and oils at frying temperatures."
48: 3935-3938.
J. Chromatography AMoreno, M.. (1998). "Study of the formation of carbonyl compounds in edible oils and
fats by H-NMR and FTIR."
. doi: 10.1016/j.chroma.2008.09.077
J. of Molecular StructureMoros, J., Roth, M., Garrigues, S., Guardia, M.. (2009). "Preliminary studies about
thermal degradation of edible oils through attenuated total refectance mid-infrared spectrometry."
.
Food ChemsitryMullertz, A., Schmedes, A., Holmer, G.. (1990). "Separation and detection of
phospholipid hydroperoxides in the low nano-molar range by a high performance liquid chromatography/ironthiocianate assay."
114: 1529-1536.
LipidsNawar, W. W. (1985).
25: 415-418. Food chemistry
Oliw, E. H., Su, C., Skogstrom, T., Benthin, G.. (1998). "Analysis of novel hydroperoxides and other metabolites of oleic, linoleic and linolenic acids by liquid chromatography-mass spectrometry with Ion trap MS."
. New York, Marcel Dekker, Inc.
Lipids
Osawa, C., Goncalves, L. A. G., Ragazzi, S.. (2007). "Correlation between free fatty acids of vegetable oils evaluated by rapid test and by the official method."
33: 843-852.
J. Food Composition Analysis
Osawa, C., Goncalves, L. A. G., Ragazzi, S.. (2007). "The use of fast methodologies (Kits) in evaluating deep-frying oils."
20: 523-528.
Journal of American Oil Chemistry. Society.
Palmer, D., Anderson, M., Jolly, R.. (1984). "Separation of some neutual lipids by normal-phase high-performance liquid chromatography on a cyanopropyl column: Ubiquinone, dolichol, and cholesterol levels in sheep liver."
DOI 10.1007/s11746-007-1124-7
Anal. Biochemitry
Pellegrini, N., Visioli, F., Buratti, S., and Brighenti, F.. (2001). "Direct analysis of total antioxidant activity of olive oil and studies on the influence of heaing "
140(2): 315-319.
J. Agric. Food Chem.
Pohle, W. D., Gregory, R. L., Taylor, J. R.. (1962). "A comparison of several analytical techniques for prediction of relative stability of fats and oils to oxidation."
40: 2532-2538.
J. Amer. Oil Chem. Soc.
Pohle, W. D., Gregory, R. L., Van Giessen, B.. (1963). "A rapid oxygen bomb method for evaluating the stability of fats and shortenings."
39(4): 226-229.
J. Amer Oil Chem. Soc.
Pokorny, J., Parkanyiova, L., Reblova, Z., Trojakova, L., Sakurai, H., Miyahara, T.,
40(11): 603-605.

135
Yano, T.. (2003). "Changes on storage of peanut oils containing high levels of tocopherols and beta-carotene." Czech J. Food Sci.
El-Abssy, R., Donfack, P., Materny, A.. (2009). "Assessment of conventional and microwave heating induced degradation of carotenoids in olive oil by VIS Raman spectroscopy and classical methods."
21: 19-27.
Food Research International
Reblova, Z. (2006). "The effect of temperature on the antioxidant activity of tocopherols "
, doi: 10.1016/foodres.2009.10.021
Eur. J. Lipid Sci. Technol.Reiners, W. A. (1972). "Comparison of oxygen-bomb combustion with standard
ignition techniques for determining total ash."
108: 858-853.
EcologyRossell, J. (1994).
53(1): 132-136. Measurement of Rancidity, in Rancidity in Foods.
Saguy, I. S., Dana, D.. (2003). "Integrated approach to deep fat frying: engineering, nutrition, health and consumer aspects."
London, Blackie Academic.
J. Food EngineeringSchaich, K. M. (1992). "Metals and lipid oxidation. Contemporary Issues."
56: 143-152. Lipids
Schaich, K. M. (2005). Lipid oxidation: Theoretical Aspects,
27(3): 209-218.
Bailey's Industrial Oil and Fat Products
Schaich, K. M. (2008). Culinology 101: Frying, Rutgers University Continuing Education Course. New Brunswick, NJ, U.S., Rutgers University.
. F. Shahidi, ed., John Wiley & Sons, NY: 269-310.
Schneider, C., Schreier, P., Herderich, M.. (1997). "Analysis of lipoxygenase-derived fatty acid hydroperoxides by electro-spray ionization tandem mass spectrometry." Lipids
Schulte, E. (2002). "Determination of higher carbonyl compounds in used frying fats by HPLC of DNPH derivatives."
32: 331-336.
Anal. Bioanal.Chem.Shahina Naz, R. S., Hina Sheikh, Syed Asad Sayeed (2005). "Deterioration of olive,
corn and soybean oil due to air, light, heat and deep-frying."
372: 644-648.
Food Research International
Shen, N., Fehr, W., White, P.. (1997). "Oxidative stabilities of soybean oils with elevated palmitate and reduced linolenate contents."
38(127-134).
J. Am. Oil Chem. Soc.
Sheppard, H.. (1962). "Determination of H3 and C14 in biological materials using oxygen bomb combustion."
74(3): 299-302.
Analytical BiochemistrySjovall, O., Kuksis, A., Marai, L., Muher, J. J.. (1997). "Elution factors of synthetic
oxotriacylglycerols as an aid in identification of peroxidized natural triacylglycerols by reverse-phase high performance liquid chromatography with electro-spray mass spectrometry."
4(3): 246.
LipidsSpickett, C. M., Pitt, A. R., Brown, A. J.. (1998). "Direct observation of lipid
hydroperoxides in phopholipid vesicles by electro-spray mass spectrometry."
32(1211-1218).
Free Radical Biology & MedicineStephanie A. Smith, R. E. K., David B. Min (2007). "Oxidative and thermal stabilities
of genetically modified high oleic sunflower oil "
25: 613-620.
Food Chemistry 102:

136
1208-1213. Stuckey, B. N., Sherwin, E. R., (1958). "Improved techniques for testing fats and oils
by the oxygen bomb method." Journal of American Oil Chemistry Society
Foo, S. Y., Cuppett, S., Schlegel, V.. (2006). "Evaluation of Saftest method for monitoring frying oil quality "
35(11): 581-584.
Journal of American Oil Chemistry Society
Tomaino, A., Cimino, F., Zimbalatti, V., Venuti, V., Sulfaro, V., De Pasquale, A., Saija, A.. (2005). "Influence of heating on antioxidant activity and the chemical compostion of some spice essential oils."
83: 15-20
Food ChemistryToth, K., Stulik, K., Kutner, W., Feher, Z., and Lindner, E.. (2004). "Electrochemical
detection in liquid flow analytical techniques: Characterization and Classification."
89: 549-554.
Pure Appl. Chem.Uran, S., Larsen, A., Jacobsen, P., and Skotland, T.. (2001). "Analysis of phospholipid
species in human blood using normal-phase liquid chromatography coupled with electrospray ionization ion-trap tandem mass spectrometry."
76(6): 1119-1138.
J. Chromatography B: Biomedical Sciences and Applications
Walker, M. D., Hughes, P.S., Simpson, W. J.. (1996). "Use of chemiluminescence HPLC for measurement of positional isomers of hydroperoxy fatty acids in malting and rest stage of mashing.
758(2): 265-275.
J. Sci. Food Agric.Warner, K. (2008).
70: 341-346. Food Lipids: Chemistry, Nutrition and Biotechnology
Warner, K., Vick, B. A., Kleingartner, L., Isaac, I., and Doroff, K.. (2003). "Composition of sunflower, Nusun (mid-oleic sunflower), and high oleic sunflower oils. In Proc. Sunflower ResearchWorkshop, Fargo, ND."
. Boca Raton, CRC Press.
Yamada, K., Brodsky, M. E., Baker, J. C., Ames, B. N.. (1987). "Detection and characterization of lipid hydroperoxides at picomole levels by high-performance liquid chromatography. ."
http://www.sunflowernsa.com/research/research-workshop/documents/107.pdf
Anal. Biochem.Yang, G. C. (1992). "Detection of lipid hydroperoxides by high performance liquid
chromatography coupled with post-column reaction."
160: 7-13.
Trends Food Sci. Technol.
Yu, J.(1997). "Thermal Decomposition of C10-C14 Normal Alkanes in Near-Critical and Supercritical Regions: Products Distribution and Reaction Mechanism."
3: 15-18.
Ind. Eng. Chem. Res.
36: 574-584.