Embed Size (px)
Citation preview
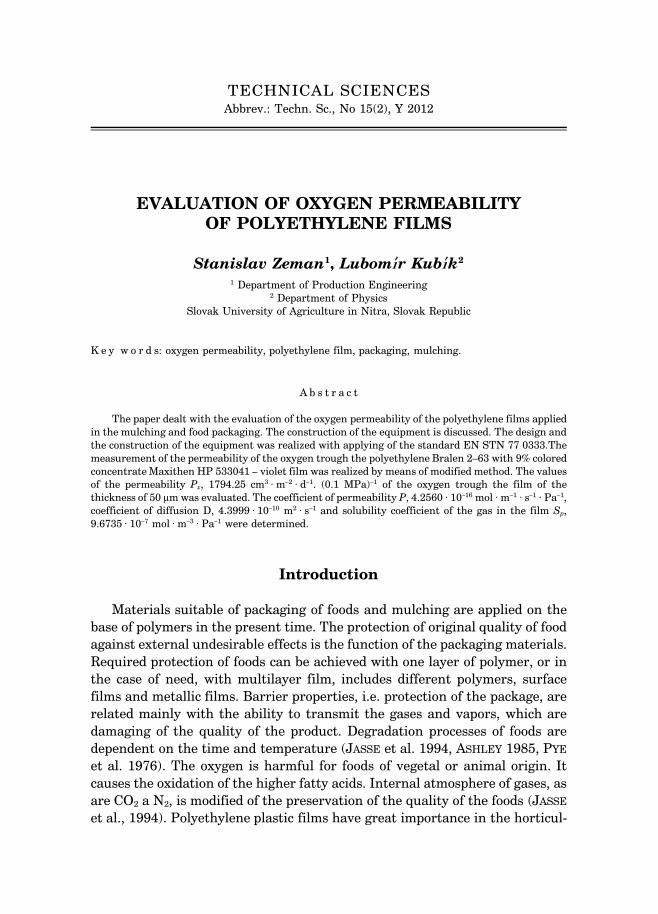
TECHNICAL SCIENCESAbbrev.: Techn. Sc., No 15(2), Y 2012
EVALUATION OF OXYGEN PERMEABILITYOF POLYETHYLENE FILMS
Stanislav Zeman1, Lubomı′r Kubı′k2
1 Department of Production Engineering2 Department of Physics
Slovak University of Agriculture in Nitra, Slovak Republic
K e y w o r d s: oxygen permeability, polyethylene film, packaging, mulching.
A b s t r a c t
The paper dealt with the evaluation of the oxygen permeability of the polyethylene films appliedin the mulching and food packaging. The construction of the equipment is discussed. The design andthe construction of the equipment was realized with applying of the standard EN STN 77 0333.Themeasurement of the permeability of the oxygen trough the polyethylene Bralen 2–63 with 9% coloredconcentrate Maxithen HP 533041 – violet film was realized by means of modified method. The valuesof the permeability Px, 1794.25 cm3 · m–2 · d–1. (0.1 MPa)–1 of the oxygen trough the film of thethickness of 50 μm was evaluated. The coefficient of permeability P, 4.2560 · 10–16 mol · m–1 · s–1 · Pa–1,coefficient of diffusion D, 4.3999 · 10–10 m2 · s–1 and solubility coefficient of the gas in the film Sp,9.6735 · 10–7 mol · m–3 · Pa–1 were determined.
Introduction
Materials suitable of packaging of foods and mulching are applied on thebase of polymers in the present time. The protection of original quality of foodagainst external undesirable effects is the function of the packaging materials.Required protection of foods can be achieved with one layer of polymer, or inthe case of need, with multilayer film, includes different polymers, surfacefilms and metallic films. Barrier properties, i.e. protection of the package, arerelated mainly with the ability to transmit the gases and vapors, which aredamaging of the quality of the product. Degradation processes of foods aredependent on the time and temperature (JASSE et al. 1994, ASHLEY 1985, PYE
et al. 1976). The oxygen is harmful for foods of vegetal or animal origin. Itcauses the oxidation of the higher fatty acids. Internal atmosphere of gases, asare CO2 a N2, is modified of the preservation of the quality of the foods (JASSE
et al., 1994). Polyethylene plastic films have great importance in the horticul-
ture. The plastic films applied as mulch, affect the radiation balance of theenvironment by means of absorption and reflection of the light by their surfaceand they change of the microclimate of the cultivated plants (TABER 2010).
WANG et al. (1998) studied oxygen and ethylene permeabilities which havebeen determined at 19oC for three kinds of polyethylene films (LDPE, LLDPEand HDPE) and in the temperature range 4–30oC for LDPE. At constanttemperature, ethylene and oxygen permeabilities decrease with increasingdensity. The temperature dependence of oxygen and ethylene permeabilitieswas found to be Arrhenius in the temperature range tested, with activationenergies of 47.7 and 44.1 kJ/mol for ethylene and oxygen respectively.
PAPIERNIK et al. (2002) describe an apparatus useful for obtaining permea-bility data. The model may be fitted to the data to determine mass transfercoefficients. The assembled equipment provides a sealed permeability cell,where a sample of the film to be tested is sandwiched between two statichalf-cells. Vapor is spiked to one side of the film and the concentrations in thespiked and receiving chamber are monitored until equilibrium. The permeabil-ity cells described here were gas-tight for >40 d. This approach producesreproducible measures of mass transfer coefficients that are not dependent onthe size of the experimental apparatus.
KAMAL et al. (1984) studied oxygen and water vapor permeability on binarypolyethylene/polyamide immiscible blends incorporating three polyethyleneresins (LDPE, LLDPE, and HDsPE), and three polyamide resins (PA-6,PA-6,6, and modified PA-6,6 m). It was found that the incorporation of PA intoPE reduces the oxygen permeability while water vapor permeability is in-creased. In the range of 0 to 30 weight percent of PA, the oxygen permeabilityof PE was reduced by a factor of 2.8 to 3.6. Maximum water vapor permeabili-ties increased: for HDPE by a factor of about 2.6 to 3.1 and for LDPE andLLDPE blends by about 1.6.
Material and Methods
Fundamental principles of the permeability
Sorption of gases and their transmission trough the polymer depends onthe permeability and the diffusion. Amount of gas Q (mol), which is transferthrough the membrane, is defined by the equation (JASSE et al. 1994):
Q =D · σ (p1 – p2) S · t
(1)h
Stanislav Zeman, Lubomı'r Kubı'k332
where:D – coefficient of diffusion, m2/s,p1 – external pressure, Pa,p2 – internal pressure, Pa,h – thickness of membrane, m,σ – Henry’s constant, mol · Pa/m3,
On the assumption of thermodynamic equilibrium, the coefficient of per-meability P is given by the equation:
P = D · σ (2)
Permeability is depended on solubility and diffusivity. These quantities arefunctions of optional volume, cohesive energy and polymer morphology. Thancoefficient of permeability is defined:
P =Qh
=Qh
(3)S(p1 – p2) t SΔpt
After applying equation of state for ideal gas pV = nRT we can obtainequation of coefficient of permeability P [mol · m–1 · s–1 · Pa–1] suitable ofexperimental measurement:
P =Qh
·pV
=pVh
(4)SΔ pt nRT tSΔpRT
where:P – coefficient of permeability P, mol · m–1 · s–1 · Pa–1,p – pressure, Pa,V – volume of gas, m3,R – universal gas constant, R = 8314 J · kmol–1 · K–1,T – temperature, K.
We can also obtain permeability of the membrane Px [m3 · m–2 · s–1 · Pa–1]from the equation:
Px = PV
(5)Qh
Fick’s second law of diffusion can be obtained by first calculating a conser-vation equation with respect to volume,
Evaluation of Oxygen Permeability... 333
∂ Ch = D (∂ 2Ch +1 ∂ S Ch) (6)
∂ t ∂ z2 S ∂ z ∂ z
where:Ch – molar concentration, mol · m–3,z – coordinate, m.
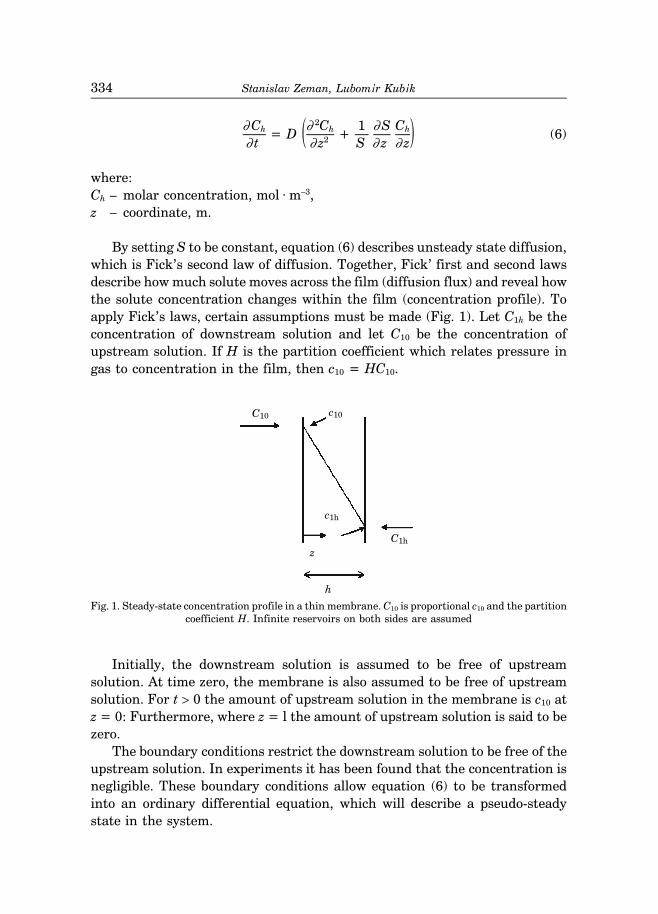
By setting S to be constant, equation (6) describes unsteady state diffusion,which is Fick’s second law of diffusion. Together, Fick’ first and second lawsdescribe how much solute moves across the film (diffusion flux) and reveal howthe solute concentration changes within the film (concentration profile). Toapply Fick’s laws, certain assumptions must be made (Fig. 1). Let C1h be theconcentration of downstream solution and let C10 be the concentration ofupstream solution. If H is the partition coefficient which relates pressure ingas to concentration in the film, then c10 = HC10.
Fig. 1. Steady-state concentration profile in a thin membrane. C10 is proportional c10 and the partitioncoefficient H. Infinite reservoirs on both sides are assumed
Initially, the downstream solution is assumed to be free of upstreamsolution. At time zero, the membrane is also assumed to be free of upstreamsolution. For t > 0 the amount of upstream solution in the membrane is c10 atz = 0: Furthermore, where z = l the amount of upstream solution is said to bezero.
The boundary conditions restrict the downstream solution to be free of theupstream solution. In experiments it has been found that the concentration isnegligible. These boundary conditions allow equation (6) to be transformedinto an ordinary differential equation, which will describe a pseudo-steadystate in the system.
Stanislav Zeman, Lubomı'r Kubı'k334
SIEGEL and CUSSLER (2004) describe the characteristic of lag time in thediffusion model. After using separation of variables on Fick’s second law andimposing the aforementioned conditions to obtain:
∞
ch = ch0 –ch0z
–2ch0 Σ sin (n π z) exp (– Dn2 π2 t) (7)
h π n=1 h h2
And after calculation the limit of the above equation at large times:
ch =SD (t –
h2 ) (8)ch0 Vh 6D
where V is the ratio of the volume in the air chamber to the area of the fabric.This limiting equation revealed that there is a lag time for the system to reachthe desired pseudo-steady state. Namely, the system can not be described by anordinary differential equation when
t <h2
(9)6D
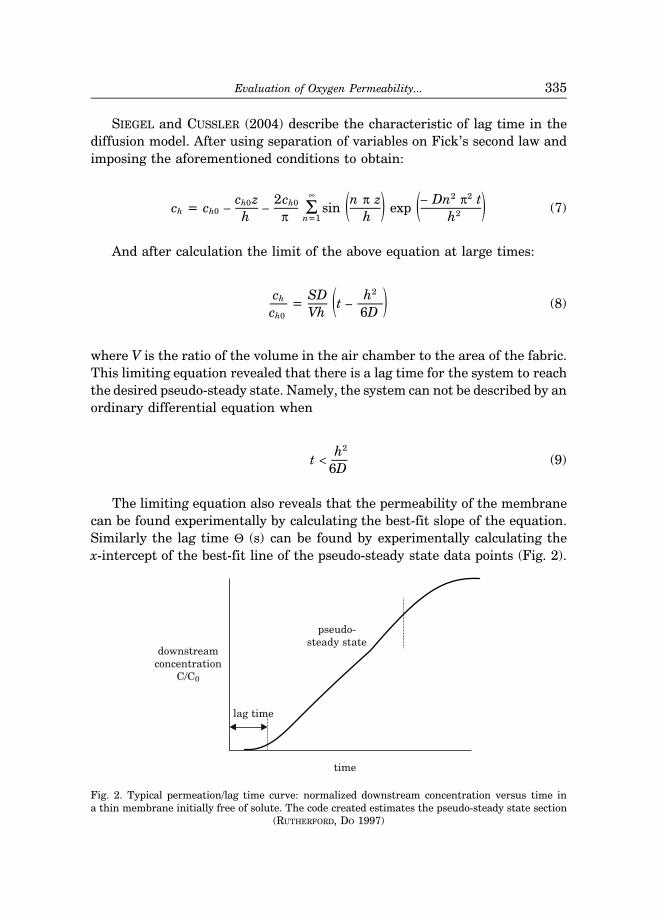
The limiting equation also reveals that the permeability of the membranecan be found experimentally by calculating the best-fit slope of the equation.Similarly the lag time Θ (s) can be found by experimentally calculating thex-intercept of the best-fit line of the pseudo-steady state data points (Fig. 2).
Fig. 2. Typical permeation/lag time curve: normalized downstream concentration versus time ina thin membrane initially free of solute. The code created estimates the pseudo-steady state section
(RUTHERFORD, DO 1997)
Evaluation of Oxygen Permeability... 335
Then we can obtain the coefficient of diffusion D [m2 · s–1] (PAULY 1999)from the equation (8):
D =h2
(10)6 Θ
where:
h – thickness of film, m,Θ – lag time, s.
The solubility coefficient Sp [mol · m–3 · Pa–1] can calculate from the equa-tion (BROZOVA 2008):
Sp =P
(11)D
where:P – coefficient of permeability P, mol · m–1 · s–1 · Pa–1,D – diffusion coefficient, m–2 · s–1.
The solubility coefficient Sp express the solubility of the oxygen in the film.Methods of determination of gas permeability are described in JASSE et al.(1994), PYE et al. (1976), KOROS et al. (1992), SOHAIL (1997). Polymer’smaterials present large scale structures and properties which depend on theirchemical structure, methods of preparation and conditions of processing.Significant participation of additives and application of polymer mixturesinfluence barrier properties of films trough CO2, O2, N2, or water vapors (LEE
1980).
Standard method
The nature of the test of the gas isobaric method is the interferometricdetermination of the concentration of the tested gas which penetrated troughtested sample from the chamber filled with the pure tested gas to the chamberwith the air. Total gas pressures on either side of the sample are equal and thediffusion of the gas trough the tested sample depends on the difference of thepartial pressure in the both chambers (EN STN 77 0333).
Instrument as well as standard procedures for measuring the oxygenpermeability are available but measurement of the concentration of the oxygenis proposed by means of optical interferometric method with the laboratory
Stanislav Zeman, Lubomı'r Kubı'k336
interferometer with two-part gas chambers of the length 100, 50, 25 and 10 cm.This method is difficult and the interferometer is not available in common. Thedigital oxygen meter Mesura which measured the relative concentration of theoxygen was used instead of interferometer and the absolute values of concen-tration had to be calculated from the tabulated values of the air and oxygen atthe real conditions. All others conditions of the standard were kept to theterms.
Design of measurement equipment
Methods of detection and measurement of parameters of permeability ofpackaging materials of gases are specified in the standard EN STN 77 0333.The method was modified for the conditions of our test. Permeability of gasesis determinated at the barrier tests of the materials as one of the specificparameter of the protective efficiency of the packaging. The design of measure-ment equipment was projected. The design is considered universal for the basicmeasurements. It represents sufficiently the principles of measurement andcorrespondents with the standard EN STN 77 0333.
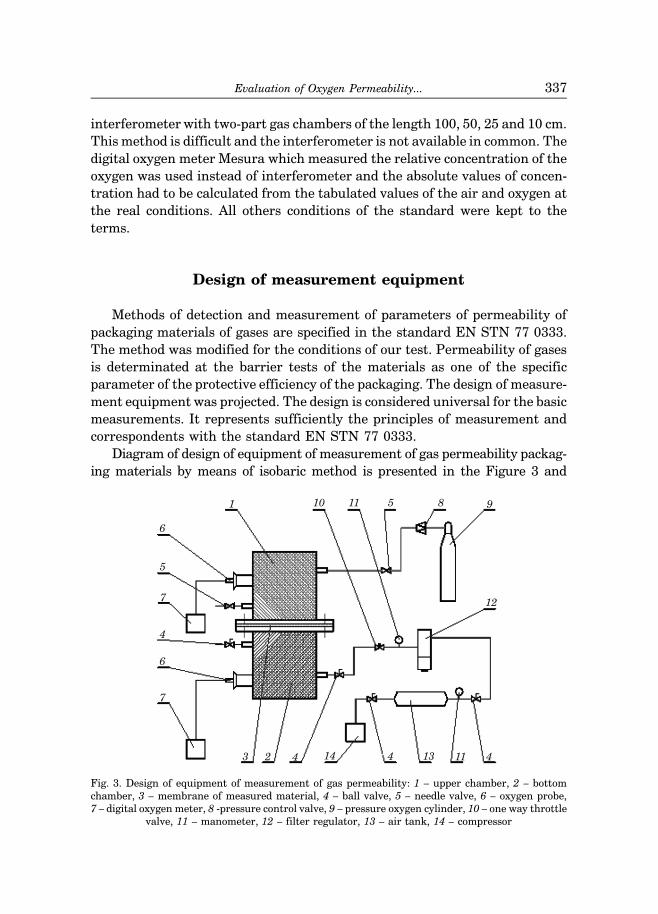
Diagram of design of equipment of measurement of gas permeability packag-ing materials by means of isobaric method is presented in the Figure 3 and
Fig. 3. Design of equipment of measurement of gas permeability: 1 – upper chamber, 2 – bottomchamber, 3 – membrane of measured material, 4 – ball valve, 5 – needle valve, 6 – oxygen probe,7 – digital oxygen meter, 8 -pressure control valve, 9 – pressure oxygen cylinder, 10 – one way throttle
valve, 11 – manometer, 12 – filter regulator, 13 – air tank, 14 – compressor
Evaluation of Oxygen Permeability... 337
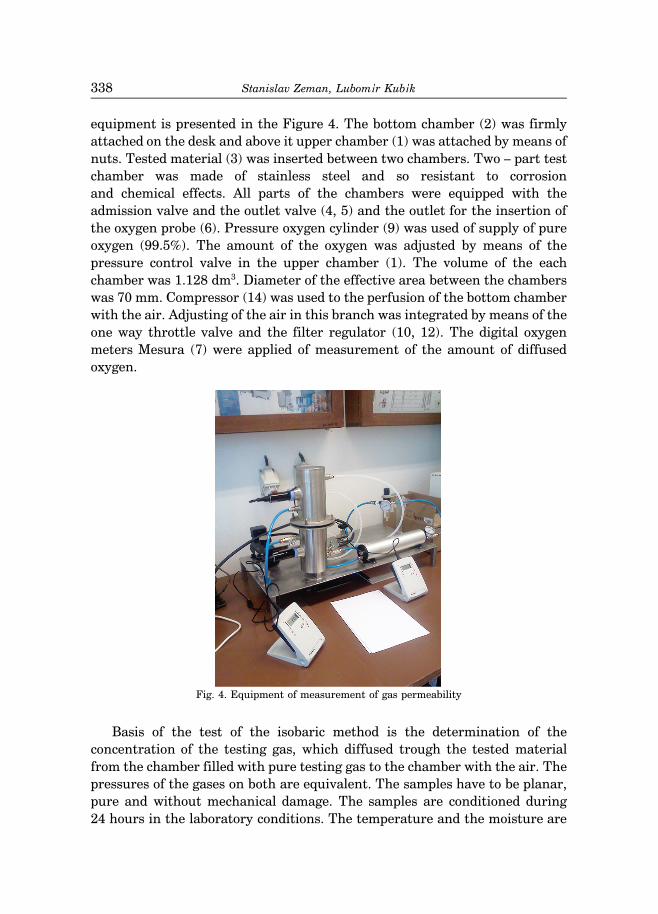
equipment is presented in the Figure 4. The bottom chamber (2) was firmlyattached on the desk and above it upper chamber (1) was attached by means ofnuts. Tested material (3) was inserted between two chambers. Two – part testchamber was made of stainless steel and so resistant to corrosionand chemical effects. All parts of the chambers were equipped with theadmission valve and the outlet valve (4, 5) and the outlet for the insertion ofthe oxygen probe (6). Pressure oxygen cylinder (9) was used of supply of pureoxygen (99.5%). The amount of the oxygen was adjusted by means of thepressure control valve in the upper chamber (1). The volume of the eachchamber was 1.128 dm3. Diameter of the effective area between the chamberswas 70 mm. Compressor (14) was used to the perfusion of the bottom chamberwith the air. Adjusting of the air in this branch was integrated by means of theone way throttle valve and the filter regulator (10, 12). The digital oxygenmeters Mesura (7) were applied of measurement of the amount of diffusedoxygen.
Fig. 4. Equipment of measurement of gas permeability
Basis of the test of the isobaric method is the determination of theconcentration of the testing gas, which diffused trough the tested materialfrom the chamber filled with pure testing gas to the chamber with the air. Thepressures of the gases on both are equivalent. The samples have to be planar,pure and without mechanical damage. The samples are conditioned during24 hours in the laboratory conditions. The temperature and the moisture are
Stanislav Zeman, Lubomı'r Kubı'k338
continually controlled. The dimensions of volumes V1, V2 and S are determinedbefore the test, where V1 is the volume of the upper chamber of the testingvessel measured in m3 with the precision of ± 5 %, V2 is the volume of bottomchamber of the testing vessel measured in m3 with the precision of ± 5% andS is the testing area of the sample measured in m2.
Procedure of the test
The upper chamber was perfused with the testing gas and the bottomchamber with the air before the measurement as long as the homogenousenvirons was reached in the each of the both chambers. The suitable flow of theboth gases is about 600 cm3 · min–1. The time of the perfusion has to be at least30 minutes and it is prolongs if the material is less permeable. The supply ofthe testing gas is stopped after the perfusion and all valves of the bothchambers are closed. The time of the permeation of the testing gas trough thesample is started in the moment. The diffusion of the gas between bothchambers is in the progress for a period of 24 hours.
The coefficient of permeability P is determined on the base of the equation(4) from the equation (BROZOVA 2008):
P =Δ pp Vh 1
(12)Δt Spi RT
where:pi – pressure of the gas in the initial volume V, Pa,V – calibrated volume, m3,h – thickness of the film, m,Δpp – increasing of the pressure of the gas transferred into calibrated volume
V, Pa,Δt – time of the duration of the diffusion, d,S – area of the film, m2,R – universal gas constant, R = 8314 J · kmol–1 · K–1,T – temperature, K.
The coefficient of permeability P was obtained from the increasing of theconcentration Δρp [kg · m–3] of the gas permeated trough the film to thecalibrated volume V in a time Δt because the oxygen probes measured therelative concentration of the oxygen and the absolute values of concentrationhad to calculated from the tabulated values of the air and oxygen at the realconditions. After applying equation of state for ideal gas the coefficient ofpermeability P can obtain from the equation:
Evaluation of Oxygen Permeability... 339
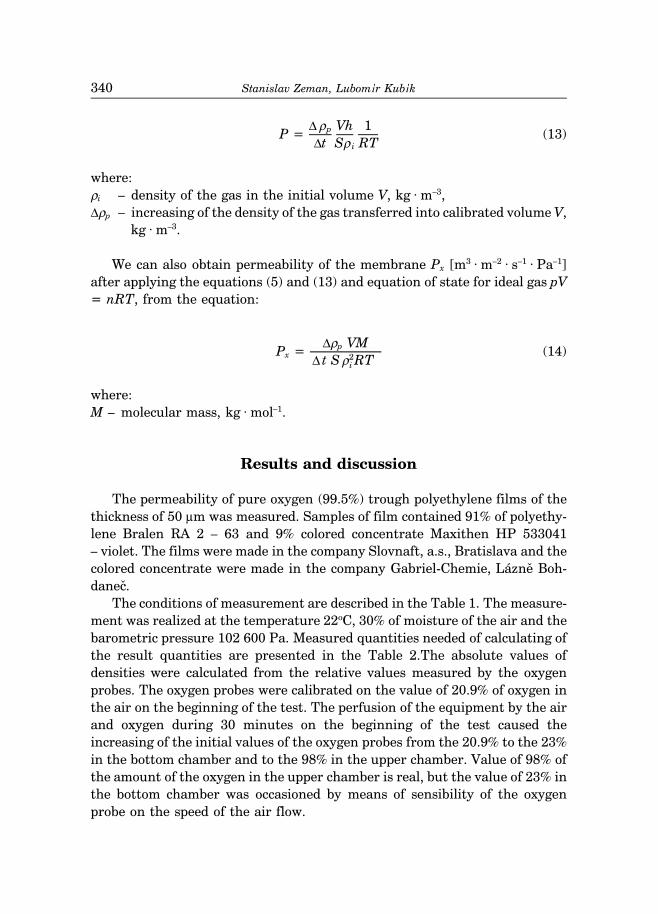
P =Δ ρp Vh 1
(13)Δt Sρ i RT
where:ρi – density of the gas in the initial volume V, kg · m–3,Δρp – increasing of the density of the gas transferred into calibrated volume V,
kg · m–3.
We can also obtain permeability of the membrane Px [m3 · m–2 · s–1 · Pa–1]after applying the equations (5) and (13) and equation of state for ideal gas pV= nRT, from the equation:
Px =Δρp VM
(14)Δ t S ρ2
i RT
where:M – molecular mass, kg · mol–1.
Results and discussion
The permeability of pure oxygen (99.5%) trough polyethylene films of thethickness of 50 μm was measured. Samples of film contained 91% of polyethy-lene Bralen RA 2 – 63 and 9% colored concentrate Maxithen HP 533041– violet. The films were made in the company Slovnaft, a.s., Bratislava and thecolored concentrate were made in the company Gabriel-Chemie, Lazne Boh-danec.
The conditions of measurement are described in the Table 1. The measure-ment was realized at the temperature 22oC, 30% of moisture of the air and thebarometric pressure 102 600 Pa. Measured quantities needed of calculating ofthe result quantities are presented in the Table 2.The absolute values ofdensities were calculated from the relative values measured by the oxygenprobes. The oxygen probes were calibrated on the value of 20.9% of oxygen inthe air on the beginning of the test. The perfusion of the equipment by the airand oxygen during 30 minutes on the beginning of the test caused theincreasing of the initial values of the oxygen probes from the 20.9% to the 23%in the bottom chamber and to the 98% in the upper chamber. Value of 98% ofthe amount of the oxygen in the upper chamber is real, but the value of 23% inthe bottom chamber was occasioned by means of sensibility of the oxygenprobe on the speed of the air flow.
Stanislav Zeman, Lubomı'r Kubı'k340
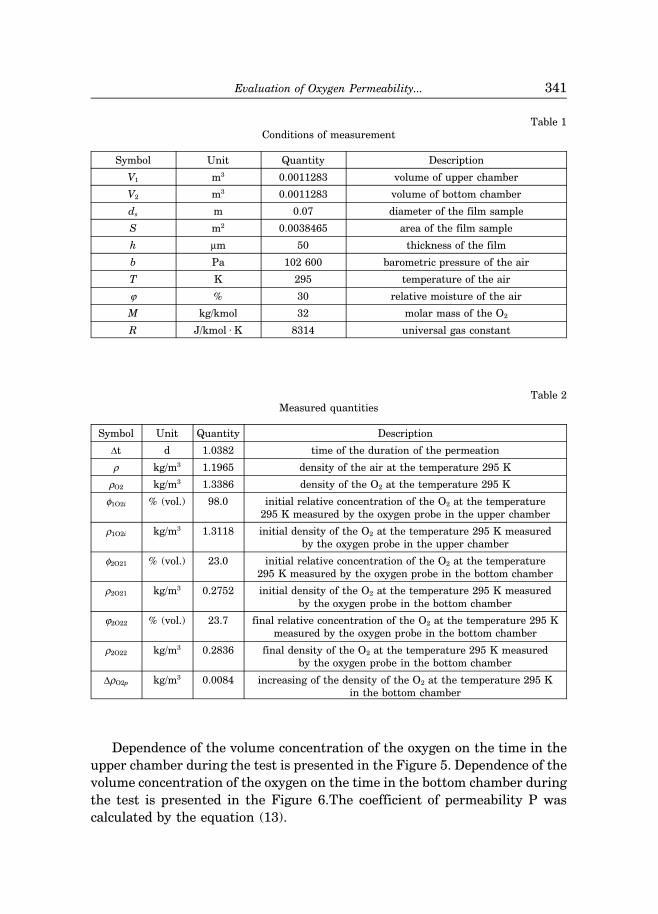
Table 1Conditions of measurement
Symbol Unit Quantity Description
V1 m3 0.0011283 volume of upper chamber
V2 m3 0.0011283 volume of bottom chamber
ds m 0.07 diameter of the film sample
S m2 0.0038465 area of the film sample
h μm 50 thickness of the film
b Pa 102 600 barometric pressure of the air
T K 295 temperature of the air
ϕ % 30 relative moisture of the air
M kg/kmol 32 molar mass of the O2
R J/kmol · K 8314 universal gas constant
Table 2Measured quantities
Symbol Unit Quantity Description
Δt d 1.0382 time of the duration of the permeation
ρ kg/m3 1.1965 density of the air at the temperature 295 K
ρO2 kg/m3 1.3386 density of the O2 at the temperature 295 K
φ1O2i % (vol.) 98.0 initial relative concentration of the O2 at the temperature295 K measured by the oxygen probe in the upper chamber
ρ1O2i kg/m3 1.3118 initial density of the O2 at the temperature 295 K measuredby the oxygen probe in the upper chamber
φ2O21 % (vol.) 23.0 initial relative concentration of the O2 at the temperature295 K measured by the oxygen probe in the bottom chamber
ρ2O21 kg/m3 0.2752 initial density of the O2 at the temperature 295 K measuredby the oxygen probe in the bottom chamber
ϕ2O22 % (vol.) 23.7 final relative concentration of the O2 at the temperature 295 Kmeasured by the oxygen probe in the bottom chamber
ρ2O22 kg/m3 0.2836 final density of the O2 at the temperature 295 K measuredby the oxygen probe in the bottom chamber
ΔρO2p kg/m3 0.0084 increasing of the density of the O2 at the temperature 295 Kin the bottom chamber
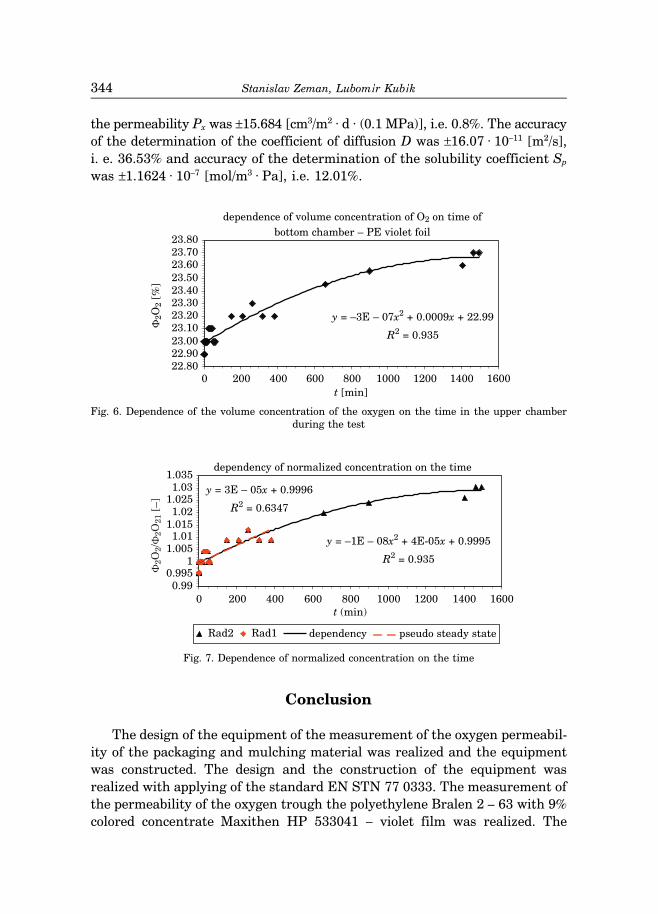
Dependence of the volume concentration of the oxygen on the time in theupper chamber during the test is presented in the Figure 5. Dependence of thevolume concentration of the oxygen on the time in the bottom chamber duringthe test is presented in the Figure 6.The coefficient of permeability P wascalculated by the equation (13).
Evaluation of Oxygen Permeability... 341
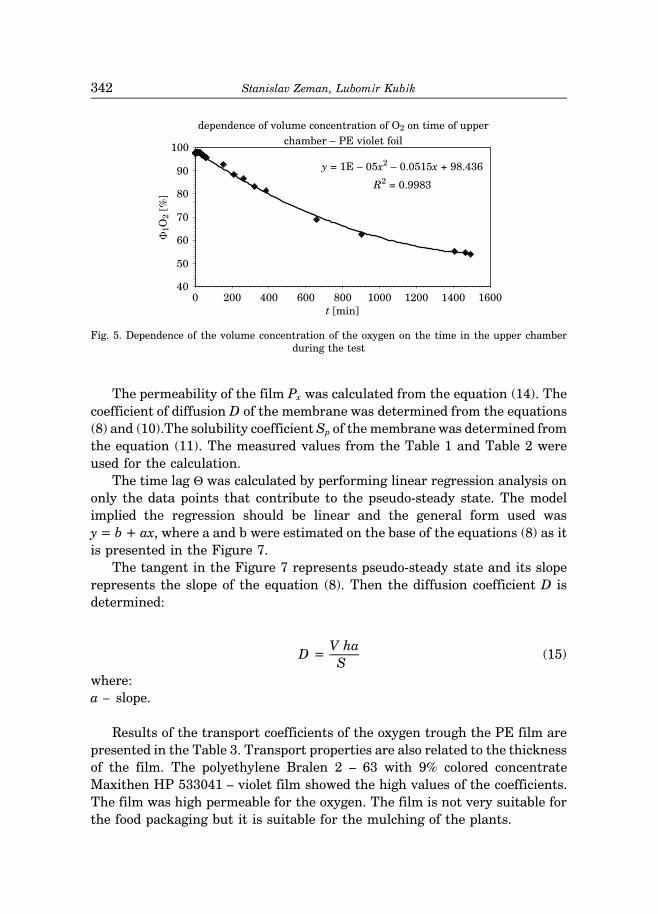
Fig. 5. Dependence of the volume concentration of the oxygen on the time in the upper chamberduring the test
The permeability of the film Px was calculated from the equation (14). Thecoefficient of diffusion D of the membrane was determined from the equations(8) and (10).The solubility coefficient Sp of the membrane was determined fromthe equation (11). The measured values from the Table 1 and Table 2 wereused for the calculation.
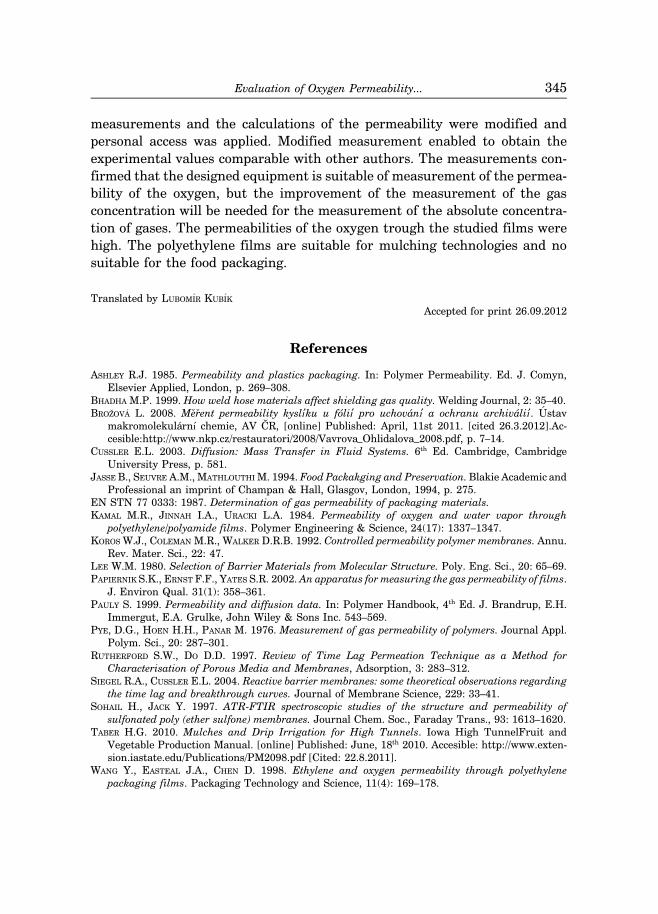
The time lag Θ was calculated by performing linear regression analysis ononly the data points that contribute to the pseudo-steady state. The modelimplied the regression should be linear and the general form used wasy = b + ax, where a and b were estimated on the base of the equations (8) as itis presented in the Figure 7.
The tangent in the Figure 7 represents pseudo-steady state and its sloperepresents the slope of the equation (8). Then the diffusion coefficient D isdetermined:
D =V ha
(15)S
where:a – slope.
Results of the transport coefficients of the oxygen trough the PE film arepresented in the Table 3. Transport properties are also related to the thicknessof the film. The polyethylene Bralen 2 – 63 with 9% colored concentrateMaxithen HP 533041 – violet film showed the high values of the coefficients.The film was high permeable for the oxygen. The film is not very suitable forthe food packaging but it is suitable for the mulching of the plants.
Stanislav Zeman, Lubomı'r Kubı'k342
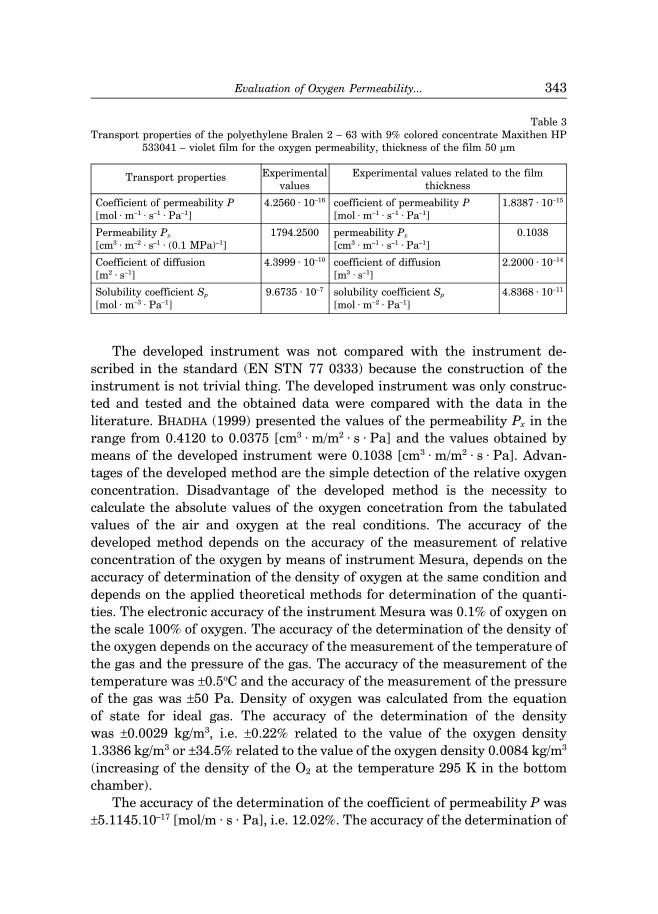
Table 3Transport properties of the polyethylene Bralen 2 – 63 with 9% colored concentrate Maxithen HP
533041 – violet film for the oxygen permeability, thickness of the film 50 μm
Experimental Experimental values related to the filmvalues thickness
Transport properties
Coefficient of permeability P[mol · m–1 · s–1 · Pa–1]
4.2560 · 10–16 coefficient of permeability P[mol · m–1 · s–1 · Pa–1]
1.8387 · 10–15
Permeability Px
[cm3 · m–2 · s–1 · (0.1 MPa)–1]1794.2500 permeability Px
[cm3 · m–1 · s–1 · Pa–1]0.1038
Coefficient of diffusion[m2 · s–1]
4.3999 · 10–10 coefficient of diffusion[m3 · s–1]
2.2000 · 10–14
Solubility coefficient Sp
[mol · m–3 · Pa–1]9.6735 · 10–7 solubility coefficient Sp
[mol · m–2 · Pa–1]4.8368 · 10–11
The developed instrument was not compared with the instrument de-scribed in the standard (EN STN 77 0333) because the construction of theinstrument is not trivial thing. The developed instrument was only construc-ted and tested and the obtained data were compared with the data in theliterature. BHADHA (1999) presented the values of the permeability Px in therange from 0.4120 to 0.0375 [cm3 · m/m2 · s · Pa] and the values obtained bymeans of the developed instrument were 0.1038 [cm3 · m/m2 · s · Pa]. Advan-tages of the developed method are the simple detection of the relative oxygenconcentration. Disadvantage of the developed method is the necessity tocalculate the absolute values of the oxygen concetration from the tabulatedvalues of the air and oxygen at the real conditions. The accuracy of thedeveloped method depends on the accuracy of the measurement of relativeconcentration of the oxygen by means of instrument Mesura, depends on theaccuracy of determination of the density of oxygen at the same condition anddepends on the applied theoretical methods for determination of the quanti-ties. The electronic accuracy of the instrument Mesura was 0.1% of oxygen onthe scale 100% of oxygen. The accuracy of the determination of the density ofthe oxygen depends on the accuracy of the measurement of the temperature ofthe gas and the pressure of the gas. The accuracy of the measurement of thetemperature was ±0.5oC and the accuracy of the measurement of the pressureof the gas was ±50 Pa. Density of oxygen was calculated from the equationof state for ideal gas. The accuracy of the determination of the densitywas ±0.0029 kg/m3, i.e. ±0.22% related to the value of the oxygen density1.3386 kg/m3 or ±34.5% related to the value of the oxygen density 0.0084 kg/m3
(increasing of the density of the O2 at the temperature 295 K in the bottomchamber).
The accuracy of the determination of the coefficient of permeability P was±5.1145.10–17 [mol/m · s · Pa], i.e. 12.02%. The accuracy of the determination of
Evaluation of Oxygen Permeability... 343
the permeability Px was ±15.684 [cm3/m2 · d · (0.1 MPa)], i.e. 0.8%. The accuracyof the determination of the coefficient of diffusion D was ±16.07 · 10–11 [m2/s],i. e. 36.53% and accuracy of the determination of the solubility coefficient Sp
was ±1.1624 · 10–7 [mol/m3 · Pa], i.e. 12.01%.
Fig. 6. Dependence of the volume concentration of the oxygen on the time in the upper chamberduring the test
Fig. 7. Dependence of normalized concentration on the time
Conclusion
The design of the equipment of the measurement of the oxygen permeabil-ity of the packaging and mulching material was realized and the equipmentwas constructed. The design and the construction of the equipment wasrealized with applying of the standard EN STN 77 0333. The measurement ofthe permeability of the oxygen trough the polyethylene Bralen 2 – 63 with 9%colored concentrate Maxithen HP 533041 – violet film was realized. The
Stanislav Zeman, Lubomı'r Kubı'k344
measurements and the calculations of the permeability were modified andpersonal access was applied. Modified measurement enabled to obtain theexperimental values comparable with other authors. The measurements con-firmed that the designed equipment is suitable of measurement of the permea-bility of the oxygen, but the improvement of the measurement of the gasconcentration will be needed for the measurement of the absolute concentra-tion of gases. The permeabilities of the oxygen trough the studied films werehigh. The polyethylene films are suitable for mulching technologies and nosuitable for the food packaging.
Translated by LUBOMIR KUBIK
Accepted for print 26.09.2012
References
ASHLEY R.J. 1985. Permeability and plastics packaging. In: Polymer Permeability. Ed. J. Comyn,Elsevier Applied, London, p. 269–308.
BHADHA M.P. 1999. How weld hose materials affect shielding gas quality. Welding Journal, 2: 35–40.BROZOVA L. 2008. Merent permeability kyslı′ku u fóliı′ pro uchovanı′ a ochranu archivaliı′. Ustav
makromolekularnı chemie, AV CR, [online] Published: April, 11st 2011. [cited 26.3.2012].Ac-cesible:http://www.nkp.cz/restauratori/2008/Vavrova–Ohlidalova–2008.pdf, p. 7–14.
CUSSLER E.L. 2003. Diffusion: Mass Transfer in Fluid Systems. 6th Ed. Cambridge, CambridgeUniversity Press, p. 581.
JASSE B., SEUVRE A.M., MATHLOUTHI M. 1994. Food Packakging and Preservation. Blakie Academic andProfessional an imprint of Champan & Hall, Glasgov, London, 1994, p. 275.
EN STN 77 0333: 1987. Determination of gas permeability of packaging materials.KAMAL M.R., JINNAH I.A., URACKI L.A. 1984. Permeability of oxygen and water vapor through
polyethylene/polyamide films. Polymer Engineering & Science, 24(17): 1337–1347.KOROS W.J., COLEMAN M.R., WALKER D.R.B. 1992. Controlled permeability polymer membranes. Annu.
Rev. Mater. Sci., 22: 47.LEE W.M. 1980. Selection of Barrier Materials from Molecular Structure. Poly. Eng. Sci., 20: 65–69.PAPIERNIK S.K., ERNST F.F., YATES S.R. 2002. An apparatus for measuring the gas permeability of films.
J. Environ Qual. 31(1): 358–361.PAULY S. 1999. Permeability and diffusion data. In: Polymer Handbook, 4th Ed. J. Brandrup, E.H.
Immergut, E.A. Grulke, John Wiley & Sons Inc. 543–569.PYE, D.G., HOEN H.H., PANAR M. 1976. Measurement of gas permeability of polymers. Journal Appl.
Polym. Sci., 20: 287–301.RUTHERFORD S.W., DO D.D. 1997. Review of Time Lag Permeation Technique as a Method for
Characterisation of Porous Media and Membranes, Adsorption, 3: 283–312.SIEGEL R.A., CUSSLER E.L. 2004. Reactive barrier membranes: some theoretical observations regarding
the time lag and breakthrough curves. Journal of Membrane Science, 229: 33–41.SOHAIL H., JACK Y. 1997. ATR-FTIR spectroscopic studies of the structure and permeability of
sulfonated poly (ether sulfone) membranes. Journal Chem. Soc., Faraday Trans., 93: 1613–1620.TABER H.G. 2010. Mulches and Drip Irrigation for High Tunnels. Iowa High TunnelFruit and
Vegetable Production Manual. [online] Published: June, 18th 2010. Accesible: http://www.exten-sion.iastate.edu/Publications/PM2098.pdf [Cited: 22.8.2011].
WANG Y., EASTEAL J.A., CHEN D. 1998. Ethylene and oxygen permeability through polyethylenepackaging films. Packaging Technology and Science, 11(4): 169–178.
Evaluation of Oxygen Permeability... 345