Embed Size (px)
Citation preview
EVALUATION OF PERFORMANCE OF SMALL RUMINANTS IN SMALLHOLDER
CLIMATE SMART VILLAGES OF LOWER NYANDO, KENYA
WINFRED SILA, BSc A THESIS SUBMITTED IN PARTIAL FULFILLMENT OF REQUIREMENTS
FOR MASTER OF SCIENCE DEGREE IN LIVESTOCK PRODUCTION
SYSTEMS OF THE UNIVERSITY OF NAIROBI
DEPARTMENT OF ANIMAL PRODUCTION
2020
i
DECLARATION
This thesis is my original work and has not been previously presented for the award of a
degree in this or any other university.
Winfred Sila (BSc)
J56/89096/2016
Signature…… ………… Date……09/12/2020……… This thesis has been submitted to Graduate School with our approval as academic supervisors Prof C. K. Gachuiri (BVM, MSc, Ph.D.)
Department of Animal production,
University of Nairobi
Signature…… ………Date…09-12-2020……… Dr. Julie M. K. Ojango, (BSc, MSc, Ph.D.)
Senior Scientist Livestock Genetics, Biosciences
International Livestock Research Institute.
Signature……… …………. Date……09/12/2020……

ii
DEDICATION
I dedicate this work to my beloved husband Dan Okello, son Arnold Kenga, daughter Jolene
Pendo, family members, and friends for their prayers, encouragement, and unwavering
support throughout this period.
iii
ACKNOWLEDGEMENT
Firstly, I thank the Almighty God for seeing me through this academic journey. I wish to
express my gratitude to my supervisors; Prof. Charles Gachuiri and Dr. Julie Ojango for their
guidance and timely feedback throughout the journey. I also acknowledge Dr. John Recha
from Climate Change Agriculture and Food Security (CCAFS) for his contribution to the
conceptualizing of this project work. This work would not have been complete without your
insights and feedback. God bless you.
I also wish to thank ILRI for giving me the opportunity and hosting me in an environment
conducive to research. Ultimately, I’m much grateful to the funders of my project, the
CGIAR Livestock Genetics flagship and Climate Change Agriculture and Food Security
(CCAFS) Programme for their support and facilitation in my project work. Very special
thanks to the CCAFS project field partners and farmers in Nyando for their cooperation
throughout the period of data collection. Many thanks to James Audho, a research assistant at
the Livestock Genetics Programme, for his guidance in data collection and analysis. I’m also
grateful to the Capacity Development Unit of International Livestock Research Institute for
the graduate fellowship. I will forever be grateful for your support.
iv
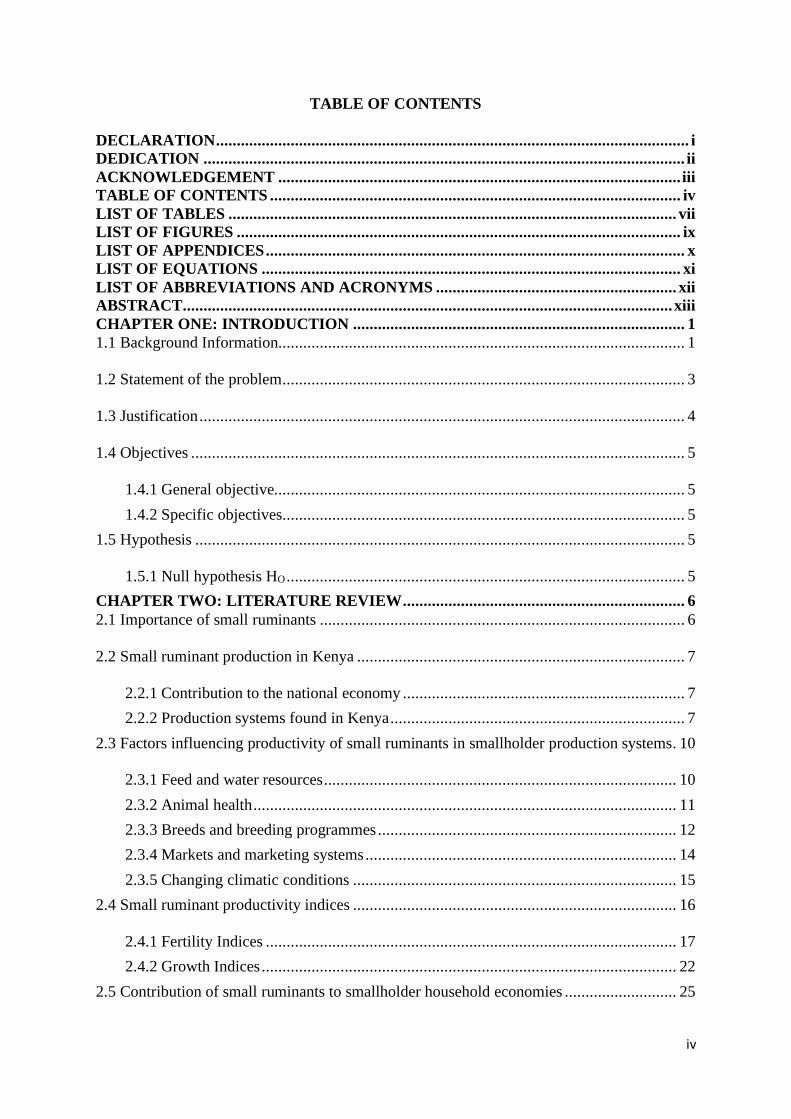
TABLE OF CONTENTS
DECLARATION .................................................................................................................. i DEDICATION .................................................................................................................... ii
ACKNOWLEDGEMENT ................................................................................................. iii TABLE OF CONTENTS ................................................................................................... iv
LIST OF TABLES ............................................................................................................ vii LIST OF FIGURES ........................................................................................................... ix
LIST OF APPENDICES ..................................................................................................... x LIST OF EQUATIONS ..................................................................................................... xi
LIST OF ABBREVIATIONS AND ACRONYMS .......................................................... xii ABSTRACT...................................................................................................................... xiii
CHAPTER ONE: INTRODUCTION ................................................................................ 1
1.1 Background Information.................................................................................................. 1
1.2 Statement of the problem ................................................................................................. 3
1.3 Justification ..................................................................................................................... 4
1.4 Objectives ....................................................................................................................... 5
1.4.1 General objective................................................................................................... 5
1.4.2 Specific objectives ................................................................................................. 5
1.5 Hypothesis ...................................................................................................................... 5
1.5.1 Null hypothesis HO ................................................................................................ 5
CHAPTER TWO: LITERATURE REVIEW .................................................................... 6
2.1 Importance of small ruminants ........................................................................................ 6
2.2 Small ruminant production in Kenya ............................................................................... 7
2.2.1 Contribution to the national economy .................................................................... 7
2.2.2 Production systems found in Kenya ....................................................................... 7
2.3 Factors influencing productivity of small ruminants in smallholder production systems. 10
2.3.1 Feed and water resources ..................................................................................... 10
2.3.2 Animal health ...................................................................................................... 11
2.3.3 Breeds and breeding programmes ........................................................................ 12
2.3.4 Markets and marketing systems ........................................................................... 14
2.3.5 Changing climatic conditions .............................................................................. 15
2.4 Small ruminant productivity indices .............................................................................. 16
2.4.1 Fertility Indices ................................................................................................... 17
2.4.2 Growth Indices .................................................................................................... 22
2.5 Contribution of small ruminants to smallholder household economies ........................... 25
v
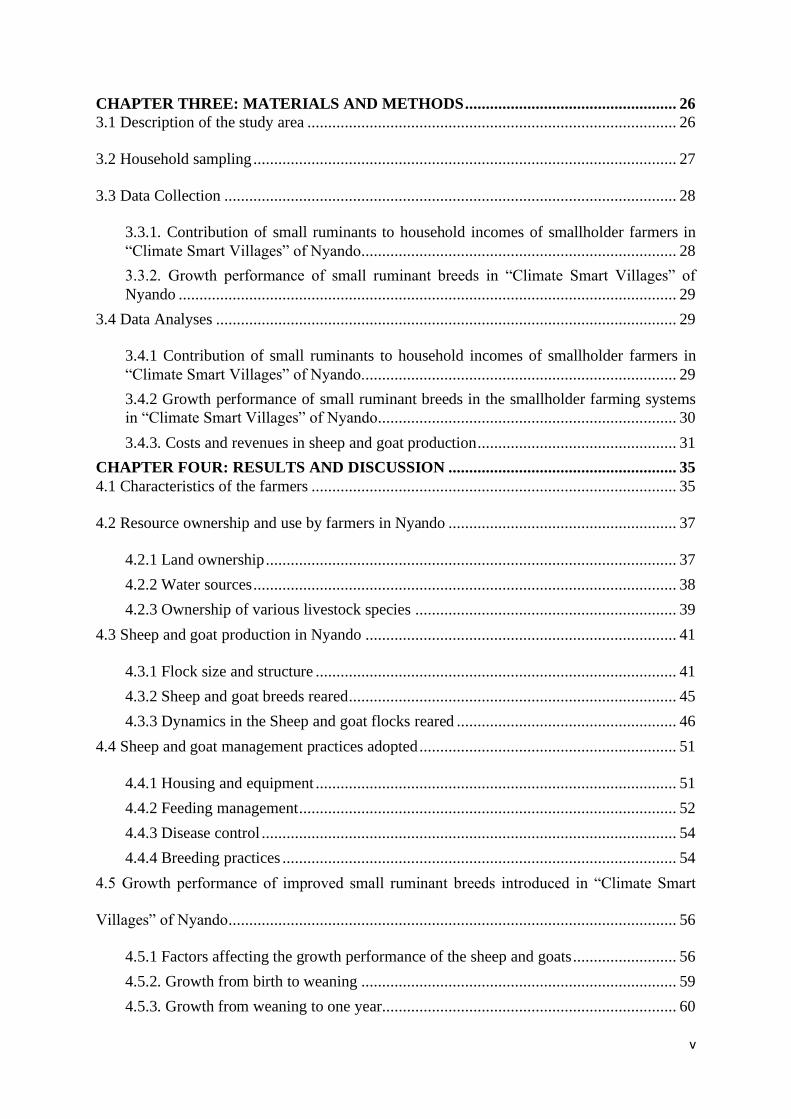
CHAPTER THREE: MATERIALS AND METHODS ................................................... 26
3.1 Description of the study area ......................................................................................... 26
3.2 Household sampling ...................................................................................................... 27
3.3 Data Collection ............................................................................................................. 28
3.3.1. Contribution of small ruminants to household incomes of smallholder farmers in
“Climate Smart Villages” of Nyando. ........................................................................... 28
3.3.2. Growth performance of small ruminant breeds in “Climate Smart Villages” of
Nyando ........................................................................................................................ 29
3.4 Data Analyses ............................................................................................................... 29
3.4.1 Contribution of small ruminants to household incomes of smallholder farmers in
“Climate Smart Villages” of Nyando. ........................................................................... 29
3.4.2 Growth performance of small ruminant breeds in the smallholder farming systems
in “Climate Smart Villages” of Nyando ........................................................................ 30
3.4.3. Costs and revenues in sheep and goat production ................................................ 31
CHAPTER FOUR: RESULTS AND DISCUSSION ....................................................... 35
4.1 Characteristics of the farmers ........................................................................................ 35
4.2 Resource ownership and use by farmers in Nyando ....................................................... 37
4.2.1 Land ownership ................................................................................................... 37
4.2.2 Water sources ...................................................................................................... 38
4.2.3 Ownership of various livestock species ............................................................... 39
4.3 Sheep and goat production in Nyando ........................................................................... 41
4.3.1 Flock size and structure ....................................................................................... 41
4.3.2 Sheep and goat breeds reared ............................................................................... 45
4.3.3 Dynamics in the Sheep and goat flocks reared ..................................................... 46
4.4 Sheep and goat management practices adopted .............................................................. 51
4.4.1 Housing and equipment ....................................................................................... 51
4.4.2 Feeding management ........................................................................................... 52
4.4.3 Disease control .................................................................................................... 54
4.4.4 Breeding practices ............................................................................................... 54
4.5 Growth performance of improved small ruminant breeds introduced in “Climate Smart
Villages” of Nyando ............................................................................................................ 56
4.5.1 Factors affecting the growth performance of the sheep and goats ......................... 56
4.5.2. Growth from birth to weaning ............................................................................ 59
4.5.3. Growth from weaning to one year....................................................................... 60
vi
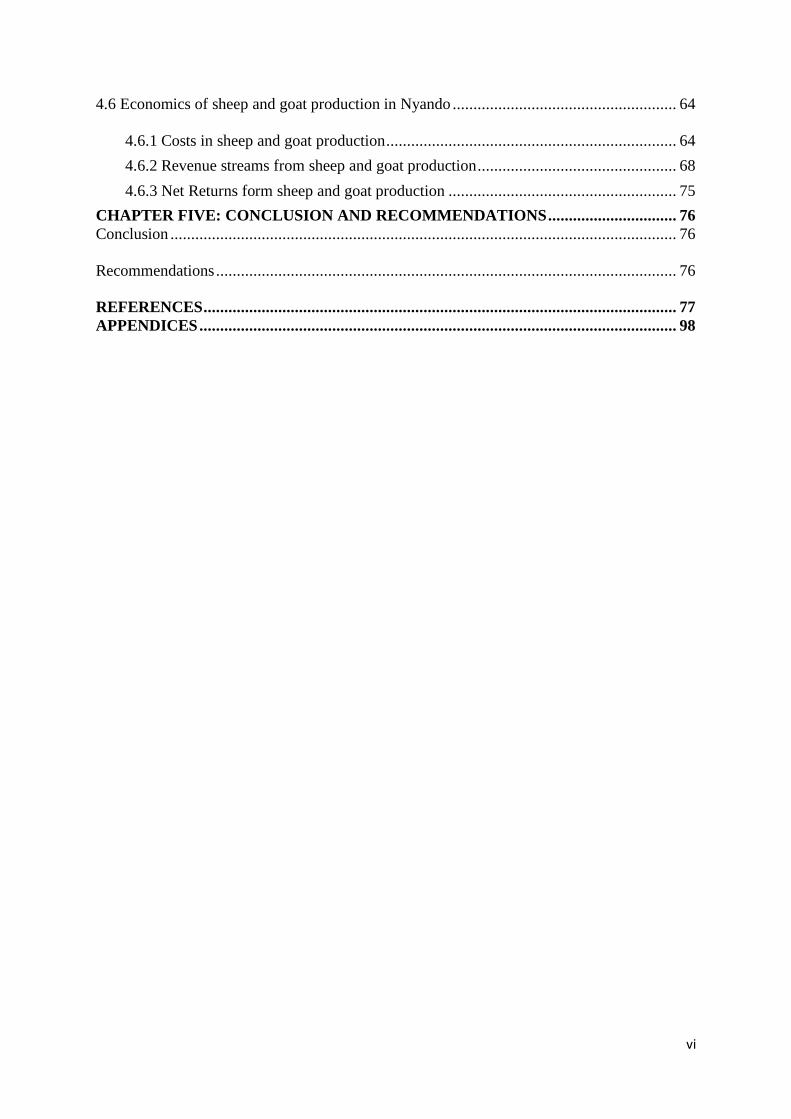
4.6 Economics of sheep and goat production in Nyando ...................................................... 64
4.6.1 Costs in sheep and goat production ...................................................................... 64
4.6.2 Revenue streams from sheep and goat production ................................................ 68
4.6.3 Net Returns form sheep and goat production ....................................................... 75
CHAPTER FIVE: CONCLUSION AND RECOMMENDATIONS ............................... 76
Conclusion .......................................................................................................................... 76
Recommendations ............................................................................................................... 76
REFERENCES .................................................................................................................. 77
APPENDICES ................................................................................................................... 98
vii
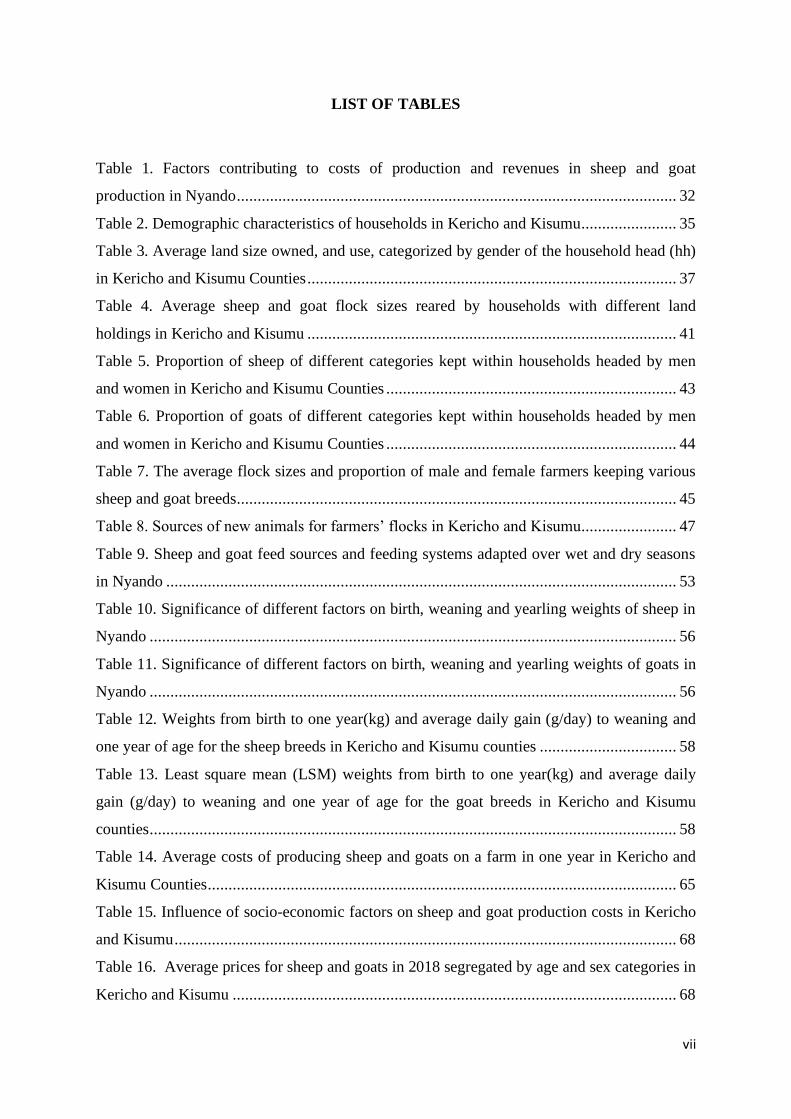
LIST OF TABLES
Table 1. Factors contributing to costs of production and revenues in sheep and goat
production in Nyando .......................................................................................................... 32
Table 2. Demographic characteristics of households in Kericho and Kisumu ....................... 35
Table 3. Average land size owned, and use, categorized by gender of the household head (hh)
in Kericho and Kisumu Counties ......................................................................................... 37
Table 4. Average sheep and goat flock sizes reared by households with different land
holdings in Kericho and Kisumu ......................................................................................... 41
Table 5. Proportion of sheep of different categories kept within households headed by men
and women in Kericho and Kisumu Counties ...................................................................... 43
Table 6. Proportion of goats of different categories kept within households headed by men
and women in Kericho and Kisumu Counties ...................................................................... 44
Table 7. The average flock sizes and proportion of male and female farmers keeping various
sheep and goat breeds .......................................................................................................... 45
Table 8. Sources of new animals for farmers’ flocks in Kericho and Kisumu....................... 47
Table 9. Sheep and goat feed sources and feeding systems adapted over wet and dry seasons
in Nyando ........................................................................................................................... 53
Table 10. Significance of different factors on birth, weaning and yearling weights of sheep in
Nyando ............................................................................................................................... 56
Table 11. Significance of different factors on birth, weaning and yearling weights of goats in
Nyando ............................................................................................................................... 56
Table 12. Weights from birth to one year(kg) and average daily gain (g/day) to weaning and
one year of age for the sheep breeds in Kericho and Kisumu counties ................................. 58
Table 13. Least square mean (LSM) weights from birth to one year(kg) and average daily
gain (g/day) to weaning and one year of age for the goat breeds in Kericho and Kisumu
counties ............................................................................................................................... 58
Table 14. Average costs of producing sheep and goats on a farm in one year in Kericho and
Kisumu Counties ................................................................................................................. 65
Table 15. Influence of socio-economic factors on sheep and goat production costs in Kericho
and Kisumu ......................................................................................................................... 68
Table 16. Average prices for sheep and goats in 2018 segregated by age and sex categories in
Kericho and Kisumu ........................................................................................................... 68
viii
Table 17. Source of revenue from sheep production and the average number of animals
contributing to income per household depending on the flock size owned in Kericho and
Kisumu in 2018 ................................................................................................................... 70
Table 18. Sources of revenues in goat production and the average number of animals
contributing to income per household depending on the flock size owned in Kericho and
Kisumu in 2018. .................................................................................................................. 71
Table 19. Revenues from the sales and the value of consumed goat milk in Kericho and
Kisumu Counties ................................................................................................................. 73
Table 20. Influence of socio-economic factors on farm revenues from small ruminants in
Kericho and Kisumu Counties ............................................................................................. 74
Table 21. Net returns from sheep and goat production in Kericho and Kisumu in 2018 ....... 75
ix
LIST OF FIGURES
Figure 1. Map of Nyando showing study sites ..................................................................... 27
Figure 2. Proportionate participation of household heads (HH) by gender groups in various
economic activities in Kericho and Kisumu Counties .......................................................... 37
Figure 3. The proportionate contribution of different sources of water to households in
Kericho and Kisumu ........................................................................................................... 39
Figure 4. Proportion of livestock of different species kept by households in Kericho and
Kisumu ............................................................................................................................... 40
Figure 5. Mating and lambing/kidding seasons for sheep and goats in Kericho and Kisumu 49
Figure 6. The proportional distribution of sheep and goats sold by farmers in Kericho and
Kisumu over 12 months in 2018 .......................................................................................... 49
Figure 7. Proportional mortality of sheep and goats in Kericho and Kisumu over 12 months in
2018 .................................................................................................................................... 50
Figure 8. Sources of breeding males in Kericho and Kisumu ............................................... 55
Figure 9. Growth performance of sheep breeds from birth to one year of age in Kericho and
Kisumu Counties ................................................................................................................. 62
Figure 10. Growth performance of goat breeds from birth to one year of age in Kericho and
Kisumu Counties ................................................................................................................. 63

x
LIST OF APPENDICES
Appendix 1: Revenues and Costs survey Questionnaire .................................................... .. 98
Appendix 2: Growth Performance Questionnaire .............................................................. 124
xi
LIST OF EQUATIONS
Equation 1. Average daily gain of sheep and goats .............................................................. 27
Equation 2. General linear model to evaluate variations in growth resulting from
environmental factors .......................................................................................................... 31
Equation 3. Net returns from sheep and goats segregated by land holdings, flock size and
structure…... ..................................................................................................................... ..33
Equation 4. Regression analysis of the costs and revenues of production of sheep and
goats………………………………………………………………………………………….37
xii
LIST OF ABBREVIATIONS AND ACRONYMS
ADG: Average Daily Gain
AGRA: Alliance for a Green Revolution in Africa
CC: Climate Change
CCAFS: Climate Change, Agriculture and Food Security
CCPP: Contagious Caprine Pleuropneumonia
CGIAR: Consultative Group for International Agriculture
CIAT: The International Center for Tropical Agriculture
CSA: Climate-Smart Agriculture
CSV: Climate Smart Villages
FAO: Food and Agriculture Organization
FGD: Focus Group Discussion
GDP: Gross Domestic Product
ILRI: International Livestock Research Institute
IPCC: Intergovernmental Panel on Climate Change
KNBS: Kenya National Bureau of statistics
KPH: Kenya Population and Housing Census
LSM: Least Square Mean
MT: Metric Tonnes
NICRA: National Imitative on Climate Resilient Agriculture
ODK: Open Data Kit
RELMA: Regional Land Management Unit
SE: Standard Error
SIDA: The Swedish International Development Cooperation Agency
SPSS: Statistical Package for the Social Sciences
SSA: Sub Saharan Africa
USA: United States of America
xiii
ABSTRACT
The productivity of small ruminants in developing countries remains low although the
animals play an integral role in the livelihoods of smallholder farmers. Current information
on their productive performance and contribution to the household incomes of smallholder
farmers in Eastern Africa is limited. This study was implemented as part of an on-going
small ruminant improvement project by the Climate Change Agriculture and Food Security
(CCAFS) and the International Livestock Research Institute (ILRI) in Kericho and Kisumu
Counties of the Lake Victoria basin of Kenya. The objective of this study was to evaluate
productive performance and contribution to the household incomes of introduced improved
small ruminants to the smallholder Climate Smart Villages of Lower Nyando. The
information will contribute to knowledge on the productivity and costs of producing small
ruminants and their roles in enhancing livelihoods of smallholder farmers grouped into
“Climate Smart Villages”(CSV). Data collated from 162 farms on growth performance of
improved indigenous small ruminants (Red Maasai and Red Maasai-Dorper cross sheep, and
Galla goat) introduced in the CSV from 2014-2019 was analyzed. Additionally, a cross
sectional survey and community focus group discussions were carried out to collate
information on the costs and revenues from small ruminants on the smallholder farms.
Results showed that land holdings and demographic characteristics of households in the CSV
have not changed since 2013, however, the number of improved sheep and goats reared by
the farmers had doubled. The introduced improved indigenous breeds and their crosses with
local breeds (non-descript Blackhead Persian sheep and Small East African goat) had
superior growth performance and were >15 Kg heavier at one year of age compared the local
breeds resulting in a three-fold increase in sale prices (from 2014 to 2018) for the animals.
The highest revenue was from the sale of both sheep and goats in Kericho and Kisumu
representing 82% and 75.1% of the income from the animals respectively. Farmers sold both
male and female animals depending on their availability, the anticipated sale price and the
existing need for cash in the household. Milk was only obtained from the goats, and this
contributed to 5.7% and 5% of the total revenue from the animals in Kericho and Kisumu
respectively. Households headed by farmers with non-formal education earned >55% of the
returns from their animals compared to those with formal education. In both counties, the net
returns from goats (KSH 91,675.90) contributed 70.5% of the total returns compared to that
of sheep (KSH 39,790.10). The introduced indigenous breeds had adapted well to the climatic
conditions of Nyando and were able to maintain their productivity despite the change in
xiv
location. Production of improved indigenous sheep and goats in the CSV of Nyando has
contributed to higher returns from small ruminant production and should be expanded within
the region.
Key words: Small ruminants, revenues, cost of production, climate change, growth
performance
1
CHAPTER ONE: INTRODUCTION
1.1 Background Information
Worldwide, sheep and goats, jointly referred to as small ruminants comprise more than 50%
of the domesticated ruminants and are an important source of livelihood to farmers,
especially those in developing countries (Wodajo et al., 2020). In Kenya, small ruminants
comprise a significant proportion of the livestock population, estimated at 19 million sheep
and 28 million goats (KNBS, 2019). These livestock are key resources to the keepers for their
role in the provision of food, socio-economic needs, and cultural activities (Herrero et al.,
2013; Alary et al., 2015; Fantahun et al., 2016). They also support income generation through
sales of live animals, and their products of meat, milk, and manure which is used to promote
crop production (Alilo et al., 2018). Small ruminants have unique attributes that attract
smallholder resource-constrained farmers, these include flexible feeding habits, high
reproduction rates, adaptability to extreme climatic conditions, and efficient utilization of low
agriculturally productive lands ( Kosgey et al., 2006; Monteiro et al., 2017).
In Kenya, small ruminants are kept under different production systems as outlined by Muigai
et al., (2017), namely, smallholder mixed crop-livestock systems, smallholder intensive
systems, extensive pastoral and transhumance systems, and, large scale ranching systems.
Management practices differ across the systems and within systems depending on the
resource endowment of the livestock keepers. In arid and semi-arid areas occupied by
pastoral livestock keepers, small ruminants are reared in large numbers, herded in the open
pasture alongside cattle, and at night confined in temporal structures or kept outside the
homestead.
In the mixed crop-livestock systems, the animals are either grazed or confined within
temporal structures depending on the available landholding but, in some instances, they may
2
graze on communal resources, crop residues, cultivated forages, or naturally grown bushes
and shrubs (Tadesse et al., 2014). Smallholder intensive systems and large scale ranching
systems are more commercially oriented, targetting the production of specific products of
good quality for the markets (Muigai et al., 2017).
Changing climatic conditions manifested by prolonged periods of dry weather and extreme
temperatures pose a major challenge to smallholder farmers compelling them to change their
farming practices to be more sustainable (IPCC, 2014). The Lower Nyando area in the Lake
Victoria basin of Kenya is one of the fifteen areas selected by Climate Change Agriculture
and Food Security (CCAFS) programme for the implementation of “Climate Smart
Agricultural practices” (Kinyangi et al., 2015). In this area, food security and agriculture
have been adversely affected by unfavorable climatic events of drought, floods, and
unpredictable rainfall patterns (Thorlakson & Neufeldt, 2011). Improving the small ruminant
production is one of the mitigation measures used owing to the role of the animals in
improving the livelihoods of farmers affected by climate change (Ojango et al., 2016).
Productivity is a crucial aspect of livestock production as it forms the basis for the survival of
stock populations as well as creation of income through sales of breeding animals (Lamy et
al., 2012). In non-wool and low milk producing small ruminant breeds, productivity is
measured by the number of lambs/kids per ewe/doe in a year (Bosman, 1995). Lamb/kid
production is also a key measure of farmers' income from the small ruminants, thus there is a
need to maximize reproduction if returns through sales of animals are to be optimized (Cloete
et al., 2000). The productivity of small ruminants in rural mixed crop-livestock systems has
been very low (Salem & Smith, 2008; Ayantunde, 2016). In these systems, farmers keep
indigenous breeds, although there have been some efforts to upgrade the existing breeds in
different regions (Mbuku et al., 2015; Haile, 2017; Haile et al., 2019). Despite their low
productivity, the indigenous small ruminants continue to be retained in moderate numbers.
3
Interventions for improving productivity within these systems include improved breeding
management practices, feeding, and disease control strategies (Kosgey et al., 2008; Salem,
2010; Mayberry et al., 2018; Haile et al., 2019). In order to determine the impact of
improving the productivity of small ruminants in targeted farming environments affected by
climate change, it is important to understand the contribution of the small ruminants to the
incomes and livelihoods of the livestock keepers.
1.2 Statement of the problem
Agriculture is the main means of livelihood for smallholder resource-constrained farmers in
developing countries (Chambwera & Stage, 2010; Harvey et al., 2014). However, climate
change has become a big threat to the sustainability of agricultural productivity (Nelson et al.,
2010; Williams et al., 2017; Fadairo et al., 2020). Small ruminants comprise an important
pathway for the establishment of constant and regular food and income for smallholder
farming families in the climate-challenged areas (CIAT, 2015). The productivity of small
ruminants especially in developing countries remains low although there is potential for
improvement (Ådnøy, 2014; Monteiro et al., 2017). Information on the current productivity
levels of sheep and goats in the changing production systems affected by adverse climates in
Eastern Africa is limited.
Information on the economic contribution of small ruminants to smallholder farmers'
livelihoods in climate constrained areas is also scarce. Studies undertaken on smallholder
farming systems have dealt with the more general economic contribution of rural
communities to the national economy (Kumar et al., 2010; Adams, 2015) and in pastoral
systems (Omondi, 2008). Gaps in information greatly impact the potential planning of
interventions for improvement of flock productivity and profitability. The paucity of
information on costs and returns results in undervaluation of small ruminants in comparison
with large ruminants such as cattle despite their enormous contribution to the livelihoods of
4
smallholder farmers (Panin, 2000). To better guide intervention options for improving small
ruminant productivity, there is need for information on the current productivity levels, costs
of achieving different productivity levels, and economic viability of the small ruminant
enterprises.
1.3 Justification
Farming systems and their ability to provide food and improve livelihoods in the tropics is
challenged by climate change stresses (Singh & Singh, 2017). There is, therefore, a need to
adopt farming practices suitable for the changing climatic conditions. Small ruminant
production in the smallholder systems support the socio-economic livelihoods of the
communities living in climate challenged areas and has been acknowledged as one of the
mitigation measures to climate change (Monteiro et al., 2017). Studies have focused on the
productivity of small ruminants especially those raised under smallholder farming systems in
resource-constrained environments (Chikagwa-Malunga & Banda, 2006; Tibbo, 2006; Ahuya
et al.,2009; Mhlanga et al., 2018). However, there is little documentation on the current
productivity levels of small ruminants in climate constrained environments. This gap in
information is restrictive to undertaking new initiatives to improve the livelihoods of
smallholder farmers using small ruminant improvement programs.
Adequate information on the current levels of productivity of small ruminants is key in
addressing the challenge of improving the livelihoods of smallholder farmers. Enhanced
small ruminant productivity translates to improved livelihoods through increased incomes
from the sale of products. Information on the economic returns to small ruminant production
under changing climatic conditions is also required. This study contributed to information on
the productivity and costs of producing small ruminants, and the role small ruminants play in
enhancing livelihoods of communities in the climatically challenged smallholder systems of
Nyando in the Lake Victoria basin of Kenya.
5
1.4 Objectives
1.4.1 General objective
To evaluate the productivity and contribution of small ruminants to household incomes in
smallholder farming systems under the “Climate Smart Villages” of Nyando.
1.4.2 Specific objectives
i. Investigate and document the contribution of small ruminants to household incomes
of smallholder farmers in “Climate Smart Villages” of Nyando.
ii. Evaluate the growth performance of improved small ruminant breeds introduced to
the smallholder farming systems in “Climate Smart Villages” of Nyando.
1.5 Hypothesis
1.5.1 Null hypothesis HO
i. Small ruminants do not contribute substantially to the household incomes of
smallholder farmers in the climatically challenged environments of Nyando.
ii. The growth performance of improved small ruminant breeds introduced to the
smallholder farmers in “Climate Smart Villages” is not different from that of existing
breeds.
6
CHAPTER TWO: LITERATURE REVIEW
2.1 Importance of small ruminants
Small ruminants form an integral part of nutritional, economic, and ecological niche in the
agricultural systems of rural communities in developing countries (Oluwatayo & Oluwatayo,
2012). They play a key role, especially to the smallholders, in the provision of products such
as milk, meat, wool, and skin which are important sources of food and income (Wodajo et al.,
2020). Small ruminants are valued livestock species due to their unique attributes including
short reproductive cycles, multiparous nature, feeding behavior, innate resistance in different
breeds to gastrointestinal parasites, and their ability to thrive in large numbers per unit area of
land compared to larger ruminants such as cattle ( Baker et al., 2001; Devendra, 2002). Some
small ruminant breeds are reported to be resistant to intestinal nematodes, thus reducing their
rearing costs (Baker et al., 2001; Baker & Gray, 2004).
Small ruminants have lower initial capital requirements making them less costly to rear and
manage when compared to the large ruminants (Pollot & Wilson, 2009). They have also been
shown to enable smallholder farmers recover and re-establish herds faster after challenging
periods due to their high rate of reproduction (Peacock, 2005). Their small bodies have
economic, managerial, and biological advantages making them the first-choice livestock
species to be sold for emergency household needs (Oluwatayo & Oluwatayo, 2012). For
instance, their small carcasses can be easily handled and consumed by a household without
spoiling (Alarcon et al., 2017). Moreover, in many households, during dry seasons, goats are
the sole milk providers as cattle tend to be severely hit by drought (Tulicha, 2013). Small
ruminants do not compete with human beings and other livestock for grain-based feeds as
they can exclusively thrive on natural pastures and shrubs (Duku et al., 2010; Salem, 2010).
Currently, small ruminants are widely distributed in pastoral and smallholder production
systems in Africa (Muigai et al., 2017).
7
2.2 Small ruminant production in Kenya
2.2.1 Contribution to the national economy
The livestock sub-sector plays a significant role in the Kenyan economy as it contributes
approximately 4.9% of the national GDP, 19.6% of agricultural GDP and employs 50% of
the total agricultural labor force (CSA, 2018). The total population of small ruminants in
Kenya is estimated to be 19 million sheep and 28 million goats, which supply about
84,074MT of the national meat (KNBS, 2019). According to FAO, (2016) worlds small
ruminant populations have been increasing and are projected to continue to rise in numbers
by 60% by 2050.
2.2.2 Production systems found in Kenya
In Kenya, small ruminants are produced under four main production systems- smallholder
mixed crop-livestock production systems, extensive pastoral and transhumance systems, large
scale ranching systems, and smallholder intensive systems (Legese & Fadiga, 2014; Muigai
et al., 2017). The grouping in production systems is influenced by the flock densities,
agroecological conditions, economic and resource endowment of producers, management
practices, and market options for the small ruminant products (AU-IBAR, 2019; Herrero et
al., 2014). Production systems are not static and change due to the effects of both internal and
external factors. In recent years, change is greatly influenced by the globally changing
climatic conditions (IPCC, 2019). Understanding the systems under which small ruminants
are produced is important to allow the designing and implementation of strategies to improve
productivity and marketing of small ruminant products, and in turn improving the livelihoods
of smallholder producers (Fernández-Rivera et al., 2004).
8
Smallholder Mixed Crop-Livestock Production Systems
Mixed crop-livestock production systems are mainly found in the humid/sub-humid zones of
Kenya, classified as Agro-ecological zones I to III (Jaetzold & Schmidt, 1983) covering areas
of the central highlands, Rift Valley, Western Kenya and a narrow strip along the Coastal
lowlands (Njarui et al., 2016). In the high potential areas of Kenya (Agro-ecological zones I-
II), small ruminants are raised in smaller numbers under either medium or smallholder mixed
crop-livestock production systems (Kosgey et al., 2008). In these systems, farmers practice
integration of crops with livestock farming where one enterprise supports the other (Gizaw et
al., 2015). The small ruminant production enables diversification in land use and provides an
additional source of income when crop production is negatively impacted by adverse climatic
effects (Oluwatayo & Oluwatayo, 2012). These areas are characterized by small land
holdings and high population densities leading to competition in land use (AU-IBAR, 2019).
The small ruminants are raised alongside other livestock species with minimal husbandry
practices and low use of inputs. A large proportion of the farmers practicing mixed crop-
livestock production keep small ruminants for subsistence rather than commercial purposes,
thus very little attention is given to profitability (Muigai et al., 2017). The farmers rear a
mixture of exotic breeds and their crosses with the indigenous (AU-IBAR, 2019). Crop
residues, cultivated forage, and naturally grown bushes and shrubs are the main feeds for the
small ruminants in these production systems, with some provision of supplements in the form
of industrial by-products such as molasses. During cropping seasons, the animals are
carefully herded or tethered in pastures far from the cultivated farms.
Extensive pastoral and transhumance systems
Extensive pastoral and transhumance systems are found in arid and semi-arid areas where
potential for crop farming is very low (Muigai et al., 2017). Arid and semi-arid areas
comprise 80% of Kenya’s land providing a livelihood to about 20 million people (Amwata et
9
al., 2015). In these systems, livestock comprise the essential livelihood asset for the
communities (Krätli et al., 2013; Nyariki & Amwata, 2019). Pastoralists practice communal
system of land ownership. Animals are grazed on the communally owned land and move
from one place to the other in search of pasture and water (AU-IBAR, 2019). Livestock
keepers in this system use mobility in search of water and grazing lands and keep large
numbers of a wide variety of livestock species for their survival. The large herds are an
assurance of subsistence and income, confer status on the owners, and provide food for
communities in periods of drought (Moritz et al., 2011; Manoli et al., 2014; Opiyo et al.,
2015). Pastoralists keep mixed herds comprising cattle, sheep, goats, and camels. Female
animals comprise a larger proportion of the herds relative to males, as male animals are
occasionally sold (Ayantunde et al., 2007). Castration of males is rarely practiced as farmers
believe that it slows growth. Moreover, there is uncontrolled mating leading to lambs/kids
being born throughout the year. The pastoralists generally keep indigenous breeds which take
a long time to attain market weight (Muigai et al., 2017). In the transhumance systems, the
livestock keepers are more sedentary and coexist with crop farmers in such a way that their
livestock graze on the crop fields after harvesting (Namgay et al., 2013; Tamou, 2017).
Constrains affecting productivity in this system include inadequate feed, diseases, parasites,
and environmental challenges of recurrent droughts and flooding (Tegegne et al., 2016).
Large scale commercial ranching systems
Large scale commercial ranching systems are owned by individuals, government, or private
organizations (Muigai et al., 2017). These systems are characterized by large parcels of land
and animals are kept under extensive, semi-intensive or intensive production systems. The
animals are fed on naturally growing pastures, planted fodder, and sometimes with
commercial supplements. Ranches keep locally adopted exotic breeds and their crossbreds
with the indigenous breeds, with some breeding initiatives aimed at improving the indigenous
10
breeds (AU-IBAR, 2019). The animals are kept for their products of milk, meat, and skin.
Animals are housed in open sheds but are allowed to graze freely. Generally, reproduction is
carefully monitored, and mating is well planned. Other management practices such as
docking, weighing before sale and, parasite, and disease control are also practiced (König et
al., 2017). An example of a large scale small ruminant commercial ranch is the Kapiti ranch
in Machakos County.
Smallholder intensive systems
Animals in these systems are kept in structures built on small land parcels in close proximity
to urban centres. Both intensive and semi-intensive management practices are adopted as the
animals are kept for both milk and meat production (AU-IBAR, 2019). The animals are fed
on natural pastures, planted fodder, and crop residues and commercial feeds. Farmers
generally keep exotic or improved indigenous breeds, and their crossbreds (Muigai et al.,
2017).
2.3 Factors influencing productivity of small ruminants in smallholder production
systems
Small ruminant production in smallholder farming systems is influenced by several factors
that are greatly dependent on the resource endowment of the livestock keepers (Salem, 2010;
Ayantunde, 2016). Key factors reported to influence productivity achievable include feed and
water resources, endemic disease and parasites, housing facilities provided, breed-types
available for rearing, and the market and marketing system for products (Salem & Smith,
2008; Joshi et al., 2018; Teklebrhan, 2018).
2.3.1 Feed and water resources
Unavailability of adequate feed all year round is a major constraint in small ruminant farming
(Salem & Smith, 2008). Overgrazing, environmental degradation, and overstocking have led
11
to overexploitation of fragile ecosystems especially in arid and semi-arid areas (Irshad et al.,
2007; Abdi et al., 2013). Leaving animals to graze in open fields without any inputs in
pasture production, and with no supplementation from other feed, sources results in slow
growth rates and stunting of animals (Kawas et al., 2010; Tedeschi et al., 2019). Studies on
small ruminant production under smallholder farming environments in Ethiopia, South
Sudan, and Ghana have reported feed scarcity attributed to recurrent droughts, land shortage
and failure to practice fodder conservation ( Timpong-Jones et al., 2014; Ochi et al., 2015;
Etalema & Abera, 2018). Seasonality in feed availability and availability of water resources
generally depend on the prevailing climatic factors of temperature, humidity, and
precipitation (Chukwuka et al., 2010). The globally changing climatic conditions experienced
in recent decades have negatively affected the quantity and quality of available feeds and
water for livestock that are dependent on natural resources (Rojas-Downing et al., 2017). The
increased ambient temperatures past the thermo comfort zone for many animals results in
inefficient feed intake and digestibility leading to poor nutrition and stress, which affects the
growth rate and survivability especially in young animals (Chukwuka et al., 2010).
Addressing water and feed challenges in small ruminant production is a critical element in
improving the offtake achievable from animals in smallholder systems (Omondi et al., 2008).
The smallholder farmers need to grow fodder in addition to crops. Introducing drought-
resistant fodder cultivars and supplementation of the small ruminants with agro-industrial by-
products and mineral salts especially during the dry seasons will enable more optimized
growth of the animals and reduce nutritional deficiency related mortalities (Salem, 2010).
2.3.2 Animal health
Diseases and parasites threaten small ruminants as they lead to losses due to poor growth
rates and mortality (Zvinorova et al., 2016; Muhammad et al., 2018). High mortality and
morbidity rates in small ruminants have been reported to result from disease conditions such
12
as Peste des petits ruminants and Pasteurellosis (Adama et al., 2011; Timpong-Jones et al.,
2014). Mortality mostly affects young animals that have lower immunity than more mature
animals. Up to 63% mortality has been reported among goats under one year of age in
Northern Ghana as a result of nutritional and health concerns (Amankwah et al., 2012).
Studies done in Kenya have reported diseases to be a key challenge in small ruminant
production (Kagira & Kanyari, 2001; Abdilatif et al., 2018). The main diseases affecting
small ruminants in central and northern Kenya were helminthosis, Contagious Caprine
pleuropneumonia, and tick-borne diseases. In central Kenya, pneumonia and coccidiosis were
reported to be the main causes of pre-weaning mortality in small ruminants contributing 31%
and 23% of mortality respectively (Kagira & Kanyari, 2001). Smallholders in rural areas
generally lack capital to purchase veterinary inputs, and even in the instances where capital is
available the veterinary inputs are not available in adequate quantities for existing flocks
(Belt et al., 2015; FAO, 2017). High costs of veterinary inputs have been reported in different
countries by several authors (Adama et al., 2011; Lado et al., 2015; Etalema & Abera, 2018).
Improved management practices with careful attention to animal hygiene would greatly
reduce the challenge of diseases in small ruminant production.
2.3.3 Breeds and breeding programmes
Most smallholder farmers rear indigenous breeds of small ruminants or crosses between the
indigenous and exotic breeds (Kosgey et al., 2006; Peacock et al., 2011; Manirakiza et al.,
2020; Monau et al., 2020). Breeding programmes for small ruminants in smallholder farming
systems are limited. However, there have been some interventions to enhance productivity by
projects such as The FARM Africa goat project, The small ruminant collaborative Dual
Purpose Goat project, community based breeding for genetic improvement of sheep and goats
(Peacock, 2005; Bett et al., 2007; Haile et al., 2019). The productivity of indigenous animals
has however remained low as targeted selection within indigenous breeds is limited (Nugroho
13
et al., 2019). In many flocks, female and male animals are left to run together with no control
of mating. This has resulted in high rates of inbreeding within flocks as it is not uncommon to
have one breeding male retained in a flock for as long as 5 years (Kosgey, 2004). Gradual
improvement in husbandry and breed improvement practices introduced through
interventions of extension programs is evident in a few areas (Peacock, 2005; Gebremedhin
et al., 2015). Community-based breeding programs have been successfully introduced in
some areas and need to be scaled to impact a larger population (Mueller et al., 2015; Haile et
al., 2019). Identifying and selecting for existing traits in indigenous breeds that are of value
to livestock keepers would greatly enhance productivity in smallholder farming systems
(Nugroho et al., 2019).
Smallholder small ruminant farmers have been reported to keep small-bodied local breeds
which take a very long period to attain maturity and attract very low returns when marketed
(Ojango et al., 2016). In larger-scale systems, breeding programmes have been implemented
to improve productive traits of small ruminants using breeds that are adaptive to specific
environments (Baker & Gray, 2003; Ojango et al., 2010). There are a wide variety of
indigenous strains of small ruminants that have evolved to adapt to prevailing environmental
conditions and traditional husbandry systems (Baker & Rege, 1994). Attempts to crossbreed
local indigenous strains with exotic germplasm though initially well planned, over time have
resulted in haphazard crossbreeding as most cross-breeding programs are only sustained for
the duration of support provided through external funding (Shrestha & Fahmy, 2007; Peacock
et al., 2011; Shrestha and Pokharel, 2012). Some efforts to improve productivity have led to
replacement with exotic germplasm which over time do not survive in the environments
(Baker & Gray, 2003). Smallholder farmers may adopt exotic germplasm for short term
benefits, but fail to sustain their productivity and resort to abandon small ruminant
productivity as a viable enterprise (Kiwuwa, 1992).
14
A good breeding programme should put into consideration the needs, views, and production
environment of the farmer (Shrestha & Pokharel, 2012; Haile et al., 2019). It’s also important
to introduce market-oriented improvement through breeding initiatives aimed at improving
the economic status of the farmer (Bett et al., 2009). To optimize gains from environmental
influences, the genetic parameters and attributes of the animals for economic traits should be
appraised regularly (Shrestha and Fahmy, 2005; Shrestha & Fahmy, 2007).
2.3.4 Markets and marketing systems
Markets and marketing systems for small ruminants tend to be quite diverse (Amankwah et
al., 2012; Mtimet et al., 2014; Wanyoike et al., 2015; Alarcon et al.,2017; Gemeda, 2017).
Several challenges have been noted to hinder marketing of small ruminants, including
unpredictable fluctuations in prices of animals, inadequate information on demand for small
ruminant products which provides an opportunity for the secondary traders to exploit
producers (Amankwah et al., 2012; Legese & Fadiga, 2014; Alemayehu, 2015; Etalema &
Abera, 2018). Lack of well-developed infrastructure leading to high transaction costs and
lack of clear policies on sheep and goat marketing are also a great challenge (AU-IBAR,
2019). Low prices offered to farmers for the sale of animals directly at their farm gates also
hinder additional investments in improving the productivity of the small ruminants. The
limited information on pricing that is based on subjective rather than objective measures on
animals is an additional hindrance to improving animal productivity (AU-IBAR, 2019;
Muigai et al., 2017).
The small-scale production of small ruminants often results in unavailability of their products
in informal markets (Ogola et al., 2010). A large number of intermediary market actors each
seeking to make an income from sales of animals results in very low producer prices (Mtimet
et al., 2014). In many areas, there is need for improvement of infrastructure such as roads and
water supply in markets to enhance their operability (Katiku et al., 2013). Livestock keepers
15
need a better understanding of the market demand and the strengths of marketing animals as
communities rather than individuals (Haile et al., 2019). Adoption of technologies such as
mobile phone messaging services could help in dissemination of marketing information for
farmers thereby limiting exploitation by middlemen (Krell et al., 2020).
Smallholder farmers in many regions have limited access to credit facilities hindering the
development of small ruminant enterprises (Anang et al., 2015). In most scenarios,
smallholders adopt low input and low return production options over technology intensive
ones as they are guaranteed greater stability (Kebebe, 2015; Oyinbo et al., 2019). As noted by
Omonona et al., (2010), access to credit enhances the production efficiency of small-scale
farmers thereby reducing rural poverty and food insecurity. Access to credit influences farm
productivity since credit-constrained farmers are more likely to use lower levels of inputs in
production compared to those who are well endowed. Improving access to credit, therefore,
has the capacity to facilitate optimal input use leading to a positive impact on productivity.
To enhance productivity and address constraints to production, there is a need for a
multidimensional approach incorporating technical and policy measures. Improvement in
productivity makes a valuable contribution to resource-poor farmers (Assan, 2015). The
integration of nutritional, breeding and appropriate management practices is important in
promoting small ruminant productivity (Deribe & Taye, 2013; Lado et al., 2015). Proper
linkage between market, workable regional and national policies, community breeding
programmes, and collaborative research work with government are key in minimizing
productivity constraints.
2.3.5 Changing climatic conditions
Changing climatic conditions resulting in significant fluctuations in the global temperature,
precipitation, and wind patterns over long periods have a significant effect on livestock
production (Nardone et al., 2010). The fluctuating climates adversely affect communities
16
that rely entirely on natural resources with limited development interventions (Sejian, 2013).
In addition to negatively affecting the available feed resources for livestock, climate change
affects animal growth, reproduction, and health of animals resulting in economic losses
(Marai et al., 2007; Craine et al., 2010;). Several studies have demonstrated the effect of
climate change on feed production and farming practices, leading to reduced quantities and
quality of feed available for livestock (Thornton & Herrero, 2010; Wheeler & Reynolds,
2012). Ruminant livestock on the other hand are said to contribute to a higher concentration
of greenhouse gasses which accelerate the negative impacts of climate change (Sejian et al.,
2012). Small ruminants are reported to contribute to an estimated 6.5% greenhouse gas
emissions globally (FAO, 2016). Improving the production efficiency of small ruminants
through better management and higher product output per unit of input could reduce their
green-house gas emissions (Marino et al., 2016). Small ruminants, notably goats are the most
versatile ruminant species with unique characteristics which enable them adapt to climate
change (Pragna et al., 2018). These include characteristics of thermotolerance, drought
tolerance, efficient utilization of poor quality pasture, and the ability to thrive in areas of feed
scarcity (Silanikove, 2000; Kosgey et al., 2008; Yami et al., 2008; Yadav et al., 2013).
2.4 Small ruminant productivity indices
The value of a species in livestock production increases in relation to its ability to make a
socio-economic contribution and its potential for improving productivity (Devendra, 1999).
Productivity can be measured by the animal’s reproduction, growth, and the quantity and
quality of products. The increasing human population coupled with changes in eating patterns
is likely to increase demand for livestock products that will be met through an increase in
productivity (Herrero & Thornton, 2013). There exists a gap in demand and supply of
livestock products that needs to be bridged (Kebebe, 2019). Livestock productivity is affected
17
by both genetic and environmental factors (Greyling, 2000). Several studies have proposed
the improvement of small ruminant productivity, especially in smallholder systems as a
means of safeguarding the livelihoods of communities facing environmental challenges
(Mwacharo & Drucker, 2005; Sahoo et al., 2013). Determining production indices in small
ruminant populations provides evidence for potential product output to meet the growing
demand. Fertility indices include the rate at which animals reproduce and how many survive
to reproduction age, while growth indices include rates at which animals gain weight at
different stages of life (Cloete et al., 2000).
2.4.1 Fertility Indices
Livestock production efficiency is to a large extent dependent on the reproductive
performance of the livestock populations (Chukwuka et al., 2010). Reproductive
performance in small ruminants entails parameters such as conception rate, litter size,
weaning rate, and mortality rate (Cloete et al., 2000; Song et al., 2006). It is a composite of
several processes that are influenced by environment, development, genetic and management
factors (Greyling, 2000). Reproductive traits such as age at first conception, age at first
lambing/kidding, and lambing/kidding interval vary greatly due to non-genetic or
environmental factors (Joshi et al., 2018).
Fertility, reflected by the number of ewes/does lambing/kidding per lambing/kidding
opportunity (Hunter, 2010) is influenced by among other factors good feeding which results
in increased egg shedding and a higher lambing/kidding percentage. The inherent genetic
potential of the animals also affects their fertility, as some animals may be naturally infertile
(Petrovic et al., 2012). The expression of the genetic potential in reproduction by female
animals is influenced by environmental factors such as climatic conditions, management,
18
health, nutrition, age and weight of the ewe/doe, and fertility and libido of the ram/buck
(Gardner et al., 2007; Shrestha et al., 2012; Joshi et al., 2018).
The reproduction rate in a population refers to the number of lambs/kids weaned per
ewe/does mated per annum. Flock reproductive rates affect the selection intensity and the rate
of genetic improvement in the selected traits (Abegaz et al., 2002). Despite the high
reproductive potential of many indigenous breeds of livestock, there is low productivity due
to reproduction wastage (Mukasa-Mugerwa et al.,1992). Increasing the reproduction rate
spreads the maintenance cost of breeding females, increases the availability of replacement
animals and animals available for sale (Abegaz et al., 2002; FAO, 2009; Holland &
McGowan, 2018).
Conception rate
Conception rate is defined as the number of pregnant ewes/does per ewe/does mated is
influenced by management and environmental factors which account for up to 96% of the
variation seen (Mufti et al., 2010). Environmental factors if not well managed result in
metabolic disorders, challenges in reproductive health, heat detection and insemination
practices (Kathy, 2004). Balanced feed rations have been shown to improve reproductive
efficiency as feed directly affects body mass which in turn affects conception rates and
overall lifetime productivity (Kolachhapati, 2005; Delgadillo & Martin, 2015;).
A study in Horro sheep showed that animals with very low weights had low conception rates,
however as body weight increased, conception rates tended to improve (Abegaz et al., 2002).
Animals also tend to have higher weights in the second to fourth parity, and as a result have a
higher rate of ovulation from the well-developed reproductive system (Khan et al., 2015;
Segura-Correa et al., 2017). This however declines as the dams grow older. Flock
management practices that enable producers retain a larger proportion of dams in the second
19
to fourth parity at mating should receive due consideration in order to improve conception
rates (Abegaz et al., 2002). Assisted technology such as oestrus synchronization and artificial
insemination can be adopted as options for improving conception. Seasonal breeding in small
ruminant flocks may increase conception rates as the dams are given more time to be in good
body condition prior to mating.
Age at first lambing
An early age at first lambing/kidding and short lambing/kidding interval translate to better
lifetime productivity (Shrestha & Pokharel, 2012). Small ruminants lambing/kidding early in
life are reported to have longer lactations and higher milk yields compared to those
lambing/kidding for the first time when they are older (Mioč et al., 2008). The availability of
sufficient feed for growing animals results in early sexual maturity and adult female animals
that are well fed cycle faster following lambing (Parajuli et al., 2015).
In Southern Ethiopia, different ages at first lambing have been reported for sheep in three
agro-ecological zones, whereby sheep in midland areas lambed at an earlier age (400.7±8.11
days) than in lowland and highland areas (412.3±3.05 and 411.4±4.23 days respectively)
(Hussein, 2018). Differences reported for goats in the study by Hussein (2018) reflected a
lower age at first kidding for animals in the lowland areas (385.6±4.31 days) relative to those
from midland areas (408.6±7.75 days). In extensive production systems found in Arid areas
of Northern Kenya, the average age at first kidding in goats was recorded to be 18 months
(540 days), but this varied depending on the climatic conditions. In dry years, does have a
later age at first kidding compared with those in wet areas which kid at an earlier age lower
than 18 months (Warui et al., 2007).
20
Average litter size and weaning rate
The number of lambs/kids born per ewe lambing/kidding (litter size) is highly influenced by
the breed of the animal and the weight at mating and age of the of the dam (Abegaz et al.,
2002). The average litter size increases with age and parity due to increased ovulation rate
and uterine capacity, traits that constitute the reproductive ability of the dam (Fahmy, 1990).
Like other reproductive traits, litter size in indigenous sheep breeds of Ethiopia is reported to
have a low heritability making genetic improvement for this trait through direct selection to
be very slow. The average litter size reported for local goats in extensive production systems
in the Arid areas of Northern Kenya is 1.02 kids per doe (Warui et al., 2007). In semi-Arid
environments of Kenya, the average litter size for exotic Toggenburg goats, indigenous Galla
goats, and their crosses is reported to be 1.00, 1.291±0.03, and 1.255±0.02 respectively
(Ndeke et al., 2015).
The number of lambs/kids weaned per lambs/kids born in a year (weaning rate) depends on
the average litter size and the mortality rate in a given flock. Small ruminant production in
the traditional extensive production systems is characterized by very low weaning rates
(Sebei et al., 2004). Weaning rate is affected by genetic, environmental, and management
practices (Peacock, 1996; Joshi, 2018).
High mortality among lambs/kids and slow growth among those that survive are the critical
constraints to small ruminant production (Sebei et al., 2004). High mortality has been
reported to be greatly influenced by the environment (Merkine et al., 2017). In Ghana,
Sahelian lambs born in the dry season have been reported to have higher mortality rates
(35%) compared to those born in the rainy season (25%). This is due to shortage and poor
quality of feed hindering the ability of ewes to produce adequate milk for lambs leading to
malnutrition, and stress (Turkson & Sualisu, 2005). Pre weaning mortality rates of 3.8% have
21
been reported in Gabra and Rendille goats raised under extensive production systems in
Northern Kenya (Warui et al., 2007). In Adamitulu Ethiopia, high mortalities for kids have
been reported in the first month of birth (Petros et al., 2014). A higher pre-weaning mortality
rate was reported for lambs/kids born from dams in parities later than the fifth due to reduced
milk yield from the old animals (Chowdhury et al., 2002; Zeleke, 2007). Dams with low
milk production may be unable to provide adequate nutrition especially in twin birth leading
to malnutrition and low immunity thus high chances of mortality. In environments where
little or no supplementation is provided for the animals, multiple born offspring struggle for
food since the mother has to suckle many offspring, while the single born animals get more
nourishment (Parajuli et al., 2015). Hailu et al., (2006) also reported lower survival rates for
Borana and Arsi-Bale kids born in the dry season (<20%) than those born in wet seasons
(42%) due to differences in feed availability.
Diseases such as pneumonia and nutritional disorders have also been reported to cause
mortality in lambs/kids (Donkin & Boyazoglu, 2004). In Gabra and Rendille goats in
Northern Kenya post weaning mortality rates of 27.8% and 16.7% have been reported (Warui
et al., 2007). These deaths were mainly associated with diseases and drought (Warui et al.,
2007). Lamb/kid mortality results in reduced economic returns from small ruminants, and
affects the genetic progress in populations (Petros et al., 2014). The survival of lambs/kids
ensures high productivity and greater economic returns. Other factors that affect the survival
of lambs/kids include their birth weight and the mothering ability of the dam (Mustafa et al.,
2014; Subramaniyan et al., 2016). Lambs/kids with very low weights at birth also tend to
have lower survival rates (Lehloenya et al., 2005).
22
2.4.2 Growth Indices
Growth, described as a change in volume, size, and shape over time is an important
characteristic in the production of meat sheep and goats (Lupi et al., 2015). Growth is an
important indicator of animal productivity (Belay & Taye, 2013; Thiruvenkadan et al., 2009).
In traditional production systems found in many countries of Africa, productivity in terms of
growth tends to be very low (Safari et al., 2005; Ojango et al., 2016; Mayberry et al., 2018)
leading to low meat supply. The gap between demand and supply of meat can be bridged by
improving the growth performance of animals ( Thornton, 2010; Sarma et al., 2019).
The growth performance of an animal is a function of its genetic merit and the environment
(Al-Shorepy et al., 2002; Alade et al., 2008). Environmental factors affecting growth impact
the ability of the animals to express their real genetic potential (El-Hassan et al., 2009).
Growth rate is affected by the breed of the animal, maternal traits such as age and size,
nutrition available, sex of the lamb/kid, the prevailing climatic conditions, and whether or not
the animal is born as a single animal or in a multiple litter (Murithi et al., 2002; Fasae et al.,
2012; Deribe & Taye, 2013). Information on animals' growth rate is important when selecting
for improved meat productivity (Lupi et al., 2015). Management of nutrition, prevention of
stressful environments, and ensuring good health of animals collectively favour optimal
growth rates and ultimately improvement in meat and carcass quality (Casey & Webb,
2010).
Growth traits of interest in small ruminant production are weights at birth, weaning and at
maturity, and the growth rates between the different ages (Kolachhapati et al., 2012). Galla
does have been reported to be 15% heavier than Small East African. The mature weights of
the two breeds have been reported to be 31Kg and 35kg respectively (Ruvuna et al., 1991).
Other studies have reported different average daily weight gains for Galla goats fed by
23
various feeds in 12 weeks duration with the highest gain being 45.21g/day (Ngila et al.,
2017). In Eastern Kenya mature weights of 25Kg, 45Kg and 65Kg were reported for Small
East African, Galla*Small East African cross and Galla breed respectively (Njoro, 2001).
Studies done in Mozambique and Kenya have reported the mature and yearling weight of
Blackhead Persian and Red Maasai breeds to be 15Kg and 36Kg respectively (Rocha et al.,
1990; König et al., 2017).
Weights at birth, weaning, and maturity
Birth weight is important in evaluating the breeding potential of livestock as it affects the
survival of the animal. The weight of an animal at birth is strongly correlated with growth
rate and adult size (Fasae et al., 2012). Environmental factors, notably the prevailing climatic
conditions tend to influence the weight of animals at birth. Lambs/kids born during wet
seasons are reported to have higher birth weights than those born in dry seasons as the
ewes/does get better nutrition in the last stage of pregnancy during wet seasons
(Soundararajan et al., 2006; Tibbo, 2006). The weight of the dam is also reported to affect the
weight of newborn. Lambs/kids born to heavier dams are heavier than those from light-
weight dams (Ahuya et al., 2009). Birth weights for small ruminants are reported to range
from 1.68 to 2.87 Kg in goats in West Africa (Fasae et al., 2012). In the South Omo zone of
Ethiopia, crosses between Boer and the local breed are reported to have birth weights of
2.89±0.38Kg (Girma, 2016).
Weaning weight is an important parameter in determining the production potential of small
ruminants as it has a high relative economic importance in defining the market value for
animals and in the selection of breeding stock (Nugroho et al., 2018). It is influenced by
genetic, physiological, and environmental factors (Mandal et al., 2006). Several studies have
24
reported weaning weights to be influenced by factors such as year of birth, sex of lambs/kids,
type of birth and breed ( Sebei et al., 2004; Browning & Browning, 2011; Oyebade et al.,
2012; Nugroho et al., 2018).
The weight of animals at maturity is important as it marks the weight at which the animals
can be sold. In small ruminants raised in tropical environments, maturity is achieved from 9
to 12 months of age (Smith et al., 2004; Kosgey, 2004). However, under extensive and semi
intensive production systems in developing countries, indigenous small ruminant breeds have
been reported to take a very long time (3 to 4 years) to attain market weight compared to the
improved breeds (Abraham et al., 2018; Nirajan et al., 2019).
Annual and seasonal differences in precipitation influence availability of pastures for
animals, which affects growth. Male animals also tend to grow faster than females of the
same age group, hence generally have higher weights at weaning and maturity (Nugroho et
al., 2018). Across different production systems, improved exotic breeds of small ruminants
and their crosses are reported to have higher weaning and yearling weights than the
indigenous breed (Murithi et al., 2002; Oyebade et al., 2012).
Growth rates at different stages
The average weight that an animal gains each day characterizes its growth rate (Pulina et al.,
2013). Growth rates differ depending on the stage of growth, hence, is generally measured
prior to weaning (pre weaning average daily gain) and from weaning to maturity (post
weaning average daily gain). As with the weights at specific ages, the average daily gain is
influenced by genetic, physiological, and environmental factors (Alemneh and Getabalew,
2019) including climatic conditions, breed, age of dam, sex of the animal, type of birth and
rearing and the nutritional status of the dam (Neopane & Pokharel, 2008; Zahraddeen et al.,
25
2008; Fasae et al., 2012; Sapkota et al., 2012; Bhattarai et al., 2016). The availability of
nutritious fodder ensures that the dam is well nourished and can provide adequate milk to the
young ones to enable good growth rates (Neopane & Pokharel, 2008). Male animals tend to
be more aggressive at suckling and feeding, and with their innate genetic potential for
growth, tend to gain more weight than the female animals especially pre-weaning (Sapkota et
al., 2012). Management practices that enable dams to be in good body condition prior to
lambing/kidding such as steaming up and provision of supplements help to boost growth rates
of young animals.
2.5 Contribution of small ruminants to smallholder household economies
Small ruminants contribute significantly to the livelihoods of smallholder farmers as they
improve food security through enabling farmers generate income from sale of livestock
products (Legesse et al., 2010; Bettencourt et al., 2015; Wodajo et al., 2020). Potentials of
small ruminants are however often undervalued (Kumar & Roy, 2013). Several studies reflect
the role of small ruminants in the provision of household incomes for smallholder farmers
(Peacock, 2005; De Vries, 2008; Kumar & Roy, 2013). Small ruminants have been reported
to contribute up to 63% of the household incomes for farmers in Egypt (Metawi, 2015) and
up to 39.7% of incomes for farmers in Ethiopia (Legesse et al., 2010). In Nigeria and
Tanzania they are used as a resource to meet household needs such as the purchase of food,
payment of school fees, and emergency needs such as hospital bills for up to 67.5% of
smallholder farmers (Chenyambuga et al., 2012; Oluwatayo & Oluwatayo, 2012).
Interventions to help improve the incomes from small ruminants should emphasize measures
that improve efficiency in productivity rather than keeping larger numbers of animals
(Muigai et al., 2017).
26
CHAPTER THREE: MATERIALS AND METHODS
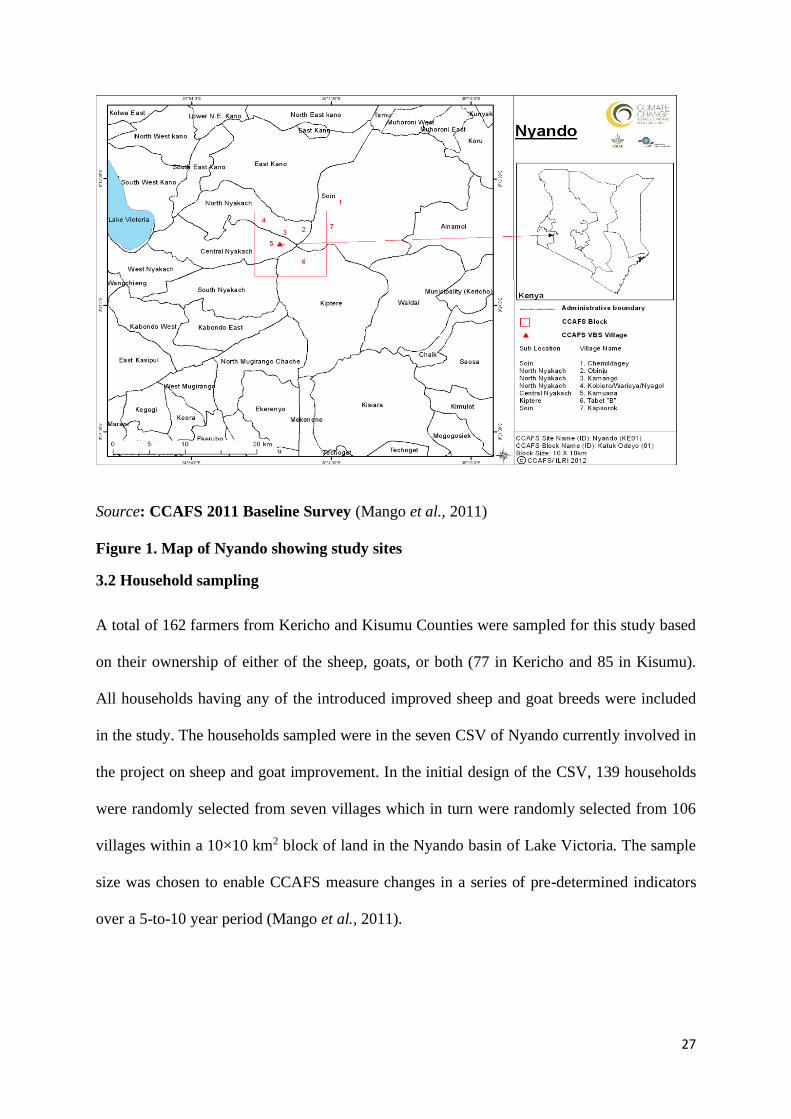
3.1 Description of the study area
The study was carried out in Kisumu and Kericho Counties of Lower Nyando (Figure 1)
located in the plains of Lake Victoria. The study site covered an area of 100km2 known as
Nyando block, with a population density of >400 persons/km2 being the highest populated
rural locality in East Africa (Recha et al., 2017). The area receives bimodal rainfall, with
annual mean rainfall ranging from 1100mm to 1600mm. The long rains occur between March
and May and short rains between September and November. The maximum and minimum
temperatures range from 19-27°C and 5-12°C respectively (Raburu & Kwena, 2012).
Seven villages namely Kamuana, Kamango, Kobiero, and Obinju in Kisumu County and
Chemildagey, Kapsorok, and Tabet “B” in Kericho County were selected for the study. The
study location was selected based on observation by CCAFS Program as a principal hotspot
for climate change mitigation and food insecurity in the East African highlands (Ericksen et
al., 2011). The project is part of an on-going program that seeks to improve the livelihoods of
smallholder farmers grouped in communities to implement improved agricultural practices
termed “Climate Smart Villages” (CSV).
27
Source: CCAFS 2011 Baseline Survey (Mango et al., 2011)
Figure 1. Map of Nyando showing study sites
3.2 Household sampling
A total of 162 farmers from Kericho and Kisumu Counties were sampled for this study based
on their ownership of either of the sheep, goats, or both (77 in Kericho and 85 in Kisumu).
All households having any of the introduced improved sheep and goat breeds were included
in the study. The households sampled were in the seven CSV of Nyando currently involved in
the project on sheep and goat improvement. In the initial design of the CSV, 139 households
were randomly selected from seven villages which in turn were randomly selected from 106
villages within a 10×10 km2 block of land in the Nyando basin of Lake Victoria. The sample
size was chosen to enable CCAFS measure changes in a series of pre-determined indicators
over a 5-to-10 year period (Mango et al., 2011).
28
3.3 Data Collection
3.3.1. Contribution of small ruminants to household incomes of smallholder farmers in
“Climate Smart Villages” of Nyando.
Data was collated using a cross-sectional survey that was conducted in the months of
November and December 2018. A detailed questionnaire was developed and used to obtain
information from farmers through enumerators engaged by the CCAFS project on sheep and
goat production. The questionnaire developed is presented in Appendix 1. The information
from the farmers was obtained using the “Open Data Kit” (ODK) information technology
platform (https://opendatakit.org/) for paperless data capture. This enabled direct entry of
information provided by each household in an electronic format to a central database.
Information was obtained from either the head of the household, spouse or a household
member above 18 years.
The questionnaire captured information on farmer demographic characteristics, total livestock
holdings, resource endowment, and key factors influencing costs and revenues in sheep and
goat production. Information collected included the number of animals sold in 2018, prices of
the animals by age and sex groups, distribution of sales over seasons comprising 2-3 month
periods in the year, and reasons for sale. The questionnaire developed was the third in a series
of structured questionnaires implemented in the CSV since 2014 that focused on sheep and
goat productivity in Nyando. Information obtained from the individual farmers was verified
at the community level through focus group discussions held with the community members in
2019. Farmers were grouped into the three community-based organizations (CBO) which are
based in the area. The farmers selected within themselves 30 farmers per CBO, then 5
farmers per group within the CBO.
29
3.3.2. Growth performance of small ruminant breeds in “Climate Smart Villages” of
Nyando
The sheep and goats reared in Nyando were housed in elevated wooden structures for the
night and left to graze in fields once crops were harvested or were tethered within the farmers
premises. Details on the differential management practices adopted by the farmers in Kisumu
and Kericho counties were obtained. The main goat breeds reared were indigenous Small
East African, introduced Galla, and crosses between the two breeds, while the sheep breeds
comprised local non-descript animals, indigenous Blackhead Persian, introduced Red Maasai
and Red Maasai Dorper crosses, and crossbreds among the various breeds. The introduced
sheep and goats with their offspring were identified using ear-tags. All kids/lambs born
within the flocks following the introduction of new breed-types were tagged and their growth
performance was monitored by weighing using a portable 100kg hanging scale at birth and
subsequently every 3 months until the age of one year. The weights were monitored from
2014 to 2019. The data were collated using a paperless data capture tool developed for ODK
(Appendix 2) and stored in a MySQL database.
3.4 Data Analyses
3.4.1 Contribution of small ruminants to household incomes of smallholder farmers in
“Climate Smart Villages” of Nyando.
Analysis to characterize the sheep and goat production systems was carried out using STATA
Version 15.1. STATA is a consistently structured and integrated statistical software ideal for
developing and advanced statistical procedures (Acock, 2005). The analyses entailed
generating descriptive statistics on farmer demographic characteristics and key resources
available for sheep and goat productivity; sheep and goat flock characteristics and the
dynamics in the flocks reared; management practices for sheep and goat production. Analysis
30
of information on sheep and goat flock characteristics took into consideration differences in
the gender of the household head as this has been shown to significantly influence
management decisions in the smallholder farming systems (Ojango et al., 2016). Variation in
practices were analyzed and tested for significance using either Chi-square (χ2) or t-tests. The
data generated from the description of the farming systems were then used together with
information on costs of different inputs and revenues from sales of sheep and goat products in
Kisumu and Kericho Counties to determine the cost of sheep and goat production in the
smallholder farming systems.
3.4.2 Growth performance of small ruminant breeds in the smallholder farming systems in
“Climate Smart Villages” of Nyando
The data collected on weights at different stages of growth on animals born for a period of
five years from 2015 to 2019 were analyzed using STATA Version 15.1. The growth rate of
the introduced breeds against that of existing indigenous animals at different stages of growth
was evaluated. This entailed evaluation of variation in weights at 3 months, 6 months, 9
months, and at one year of age. A total of 2231 records were available for analyses, 1,008 on
sheep, and 1223 on goats. Variations in live weight for the different sheep and goat breeds
within the Kericho and Kisumu Counties were analyzed and tested for significance using
either Chi-square (χ2) or f-statistic.
The average daily gain was calculated as;
ADGt1-t2=(Wt2-Wt1)/t2t1 Equation 1
Where; ADGt1-t2 is the average daily gain in weight at different times (t2 and t1, ti-n=
birth date, weaning date, 6-month date, 9-month date, and yearling date)
Wt1 is the weight at age t1
Wt2 is the weight at age t2,
31
t2t1 is the number of days between t1 and t2.
A general linear model was used to evaluate the variation in growth resulting from different
environmental factors (County, year of birth, sex, and breed). Growth at different stages and
the average daily gain were analyzed separately for the sheep and goats using the general
model:
Yijkl=µ+ Ci + Bj+ Sk + eijkl Equation 2
Where:
Yijkl=Trait of animal l (Traits were birth weight, weaning weight, 6-month weight, 9-month
weight, yearling weight and average daily gain from birth to yearling)
µ=Overall mean for a given trait
Ci= Fixed effects of County (i=Kericho, Kisumu)
Bj= Fixed effects of the breed of the animal (j= Sheep breeds: Indigenous, Red Maasai, Red
Maasai x Dorper, Red Maasai x Indigenous; Goat breeds: Small East African, Galla Pure,
Galla x Small East African)
Sk=Fixed effects of the sex of the animal (k=Male, Female)
eijkl = Residual variance
The resultant least square mean weights at different stages of growth for the different breed-
groups were used to plot growth curves for the different breeds of each species.
3.4.3. Costs and revenues in sheep and goat production
Costs of production and revenue streams for the farmers from sheep and goats over a 12
month period were determined from responses in the questionnaire (Appendix 1). Costs of
production were based on prices for inputs supporting sheep and goat production in 2018,
while revenues comprised income from the sales of sheep and goats and their products, and
home consumption in the same year. New born lambs and kids on the farms provided a
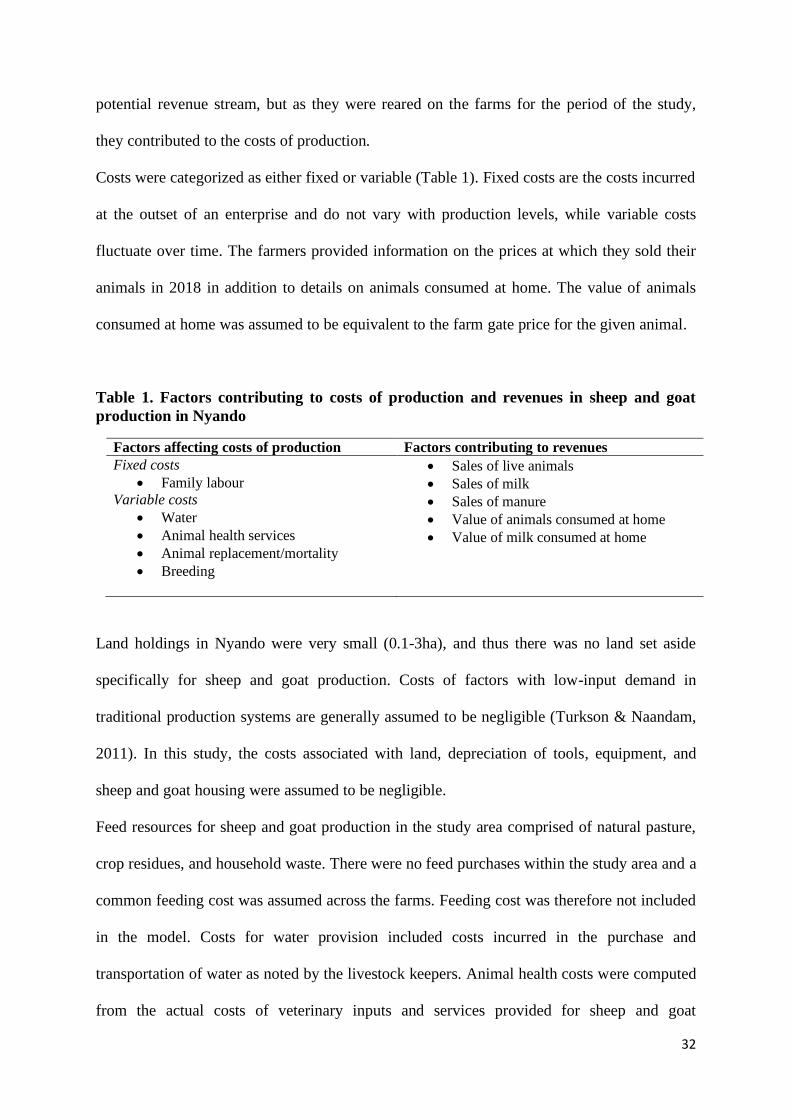
32
potential revenue stream, but as they were reared on the farms for the period of the study,
they contributed to the costs of production.
Costs were categorized as either fixed or variable (Table 1). Fixed costs are the costs incurred
at the outset of an enterprise and do not vary with production levels, while variable costs
fluctuate over time. The farmers provided information on the prices at which they sold their
animals in 2018 in addition to details on animals consumed at home. The value of animals
consumed at home was assumed to be equivalent to the farm gate price for the given animal.
Table 1. Factors contributing to costs of production and revenues in sheep and goat
production in Nyando
Factors affecting costs of production Factors contributing to revenues
Fixed costs
• Family labour
Variable costs
• Water
• Animal health services
• Animal replacement/mortality
• Breeding
• Sales of live animals
• Sales of milk
• Sales of manure
• Value of animals consumed at home
• Value of milk consumed at home
Land holdings in Nyando were very small (0.1-3ha), and thus there was no land set aside
specifically for sheep and goat production. Costs of factors with low-input demand in
traditional production systems are generally assumed to be negligible (Turkson & Naandam,
2011). In this study, the costs associated with land, depreciation of tools, equipment, and
sheep and goat housing were assumed to be negligible.
Feed resources for sheep and goat production in the study area comprised of natural pasture,
crop residues, and household waste. There were no feed purchases within the study area and a
common feeding cost was assumed across the farms. Feeding cost was therefore not included
in the model. Costs for water provision included costs incurred in the purchase and
transportation of water as noted by the livestock keepers. Animal health costs were computed
from the actual costs of veterinary inputs and services provided for sheep and goat
33
production. Animal replacement costs were derived from reported statistics on mortality
within the flocks (Ojango et al., 2016), and animals purchased purposely for flock
replacement within a year. Estimation of the value of dead animals was based on farm gate
prices depending on the age of an animal. Breeding costs entailed costs incurred in the
purchase and hiring of animals for mating.
Majority of the households (99%) did not have hired labour for the management of their
sheep and goats as these animals were mostly managed by family members. The costs related
to hired labour were therefore found to be negligibly and was therefore excluded from the
study. The opportunity cost of family labour was computed as a fixed cost. Family labour
costs for an adult family member was valued as half of the casual wage. This was based on
the assumption that the opportunity cost of family labour is below the wage rate since off-
farm employment was not constantly readily available (Staal et al., 2003; Legesse et al.,
2010). Labor by children was mainly for herding sheep and goats and was calculated as a
quarter of the waged labor as proposed in a study by Zegeye et al., (2000).
The milk produced by the goats was primarily for household consumption with small
quantities sold at the farm gate. All the milk produced was valued at the farm gate price.
Manure from the animals was mostly used on the farms with minimal sales. There was,
however, no specific price for a given quantity of manure, ranging from 0.05 to 0.25USD per
wheelbarrow. The income was therefore assumed to be negligible.
Net income from sheep and goats was segregated by land holdings, flock size, and flock
structure and was calculated as total gross revenues minus total costs;
Net sheep and goats’ returns= (Revenue) - (Total fixed Costs + Total variable costs)
Equation 3
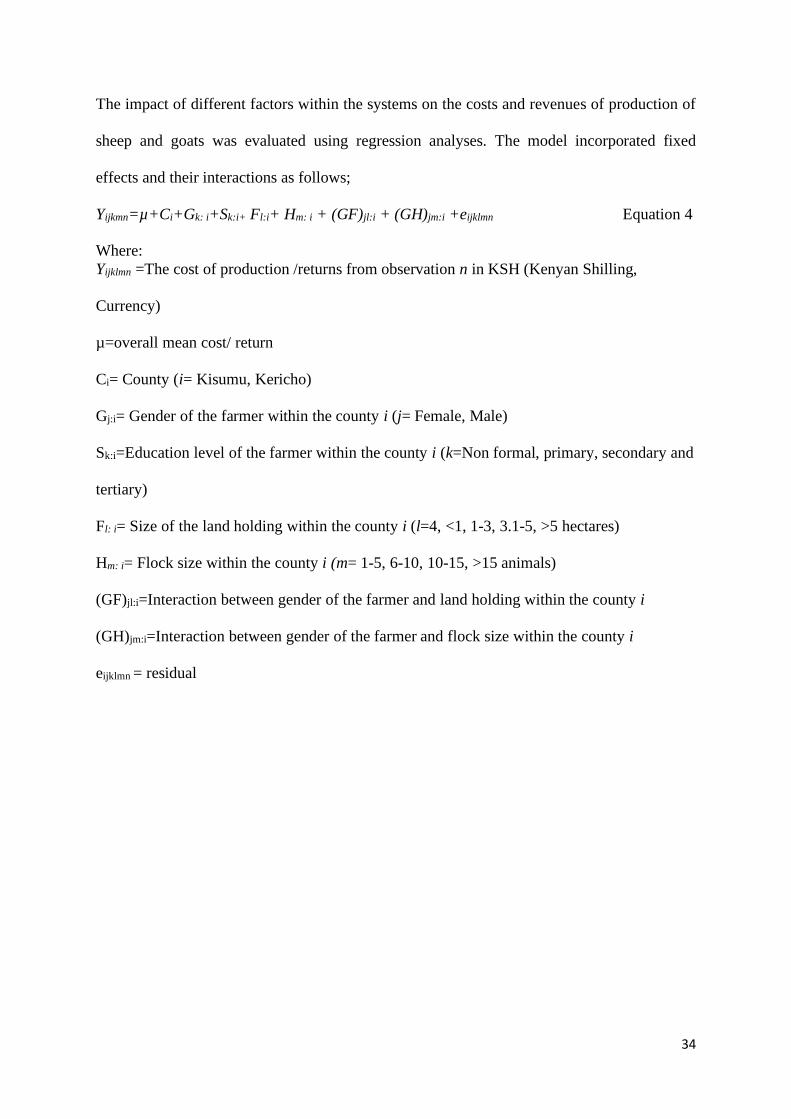
34
The impact of different factors within the systems on the costs and revenues of production of
sheep and goats was evaluated using regression analyses. The model incorporated fixed
effects and their interactions as follows;
Yijkmn=µ+Ci+Gk: i+Sk:i+ Fl:i+ Hm: i + (GF)jl:i + (GH)jm:i +eijklmn Equation 4
Where:
Yijklmn =The cost of production /returns from observation n in KSH (Kenyan Shilling,
Currency)
µ=overall mean cost/ return
Ci= County (i= Kisumu, Kericho)
Gj:i= Gender of the farmer within the county i (j= Female, Male)
Sk:i=Education level of the farmer within the county i (k=Non formal, primary, secondary and
tertiary)
Fl: i= Size of the land holding within the county i (l=4, <1, 1-3, 3.1-5, >5 hectares)
Hm: i= Flock size within the county i (m= 1-5, 6-10, 10-15, >15 animals)
(GF)jl:i=Interaction between gender of the farmer and land holding within the county i
(GH)jm:i=Interaction between gender of the farmer and flock size within the county i
eijklmn = residual
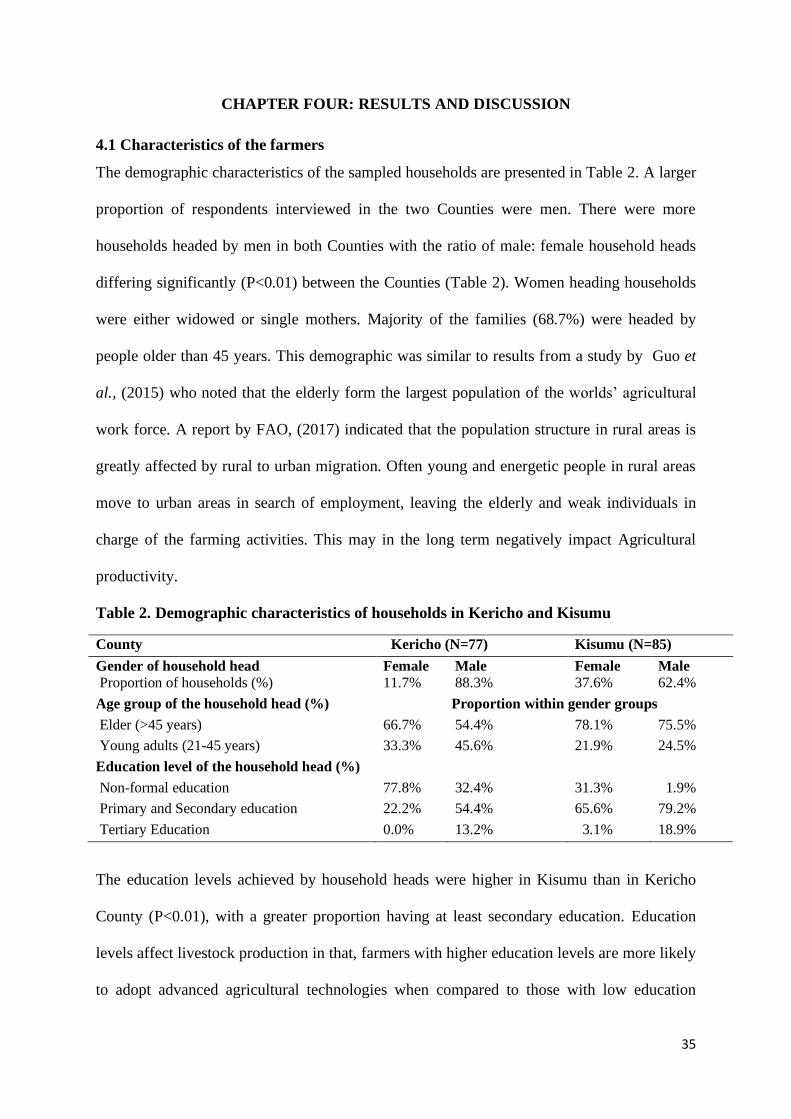
35
CHAPTER FOUR: RESULTS AND DISCUSSION
4.1 Characteristics of the farmers
The demographic characteristics of the sampled households are presented in Table 2. A larger
proportion of respondents interviewed in the two Counties were men. There were more
households headed by men in both Counties with the ratio of male: female household heads
differing significantly (P<0.01) between the Counties (Table 2). Women heading households
were either widowed or single mothers. Majority of the families (68.7%) were headed by
people older than 45 years. This demographic was similar to results from a study by Guo et
al., (2015) who noted that the elderly form the largest population of the worlds’ agricultural
work force. A report by FAO, (2017) indicated that the population structure in rural areas is
greatly affected by rural to urban migration. Often young and energetic people in rural areas
move to urban areas in search of employment, leaving the elderly and weak individuals in
charge of the farming activities. This may in the long term negatively impact Agricultural
productivity.
Table 2. Demographic characteristics of households in Kericho and Kisumu
County Kericho (N=77) Kisumu (N=85)
Gender of household head Female Male Female Male
Proportion of households (%) 11.7% 88.3% 37.6% 62.4%
Age group of the household head (%) Proportion within gender groups
Elder (>45 years) 66.7% 54.4% 78.1% 75.5%
Young adults (21-45 years) 33.3% 45.6% 21.9% 24.5%
Education level of the household head (%)
Non-formal education 77.8% 32.4% 31.3% 1.9%
Primary and Secondary education 22.2% 54.4% 65.6% 79.2%
Tertiary Education 0.0% 13.2% 3.1% 18.9%
The education levels achieved by household heads were higher in Kisumu than in Kericho
County (P<0.01), with a greater proportion having at least secondary education. Education
levels affect livestock production in that, farmers with higher education levels are more likely
to adopt advanced agricultural technologies when compared to those with low education
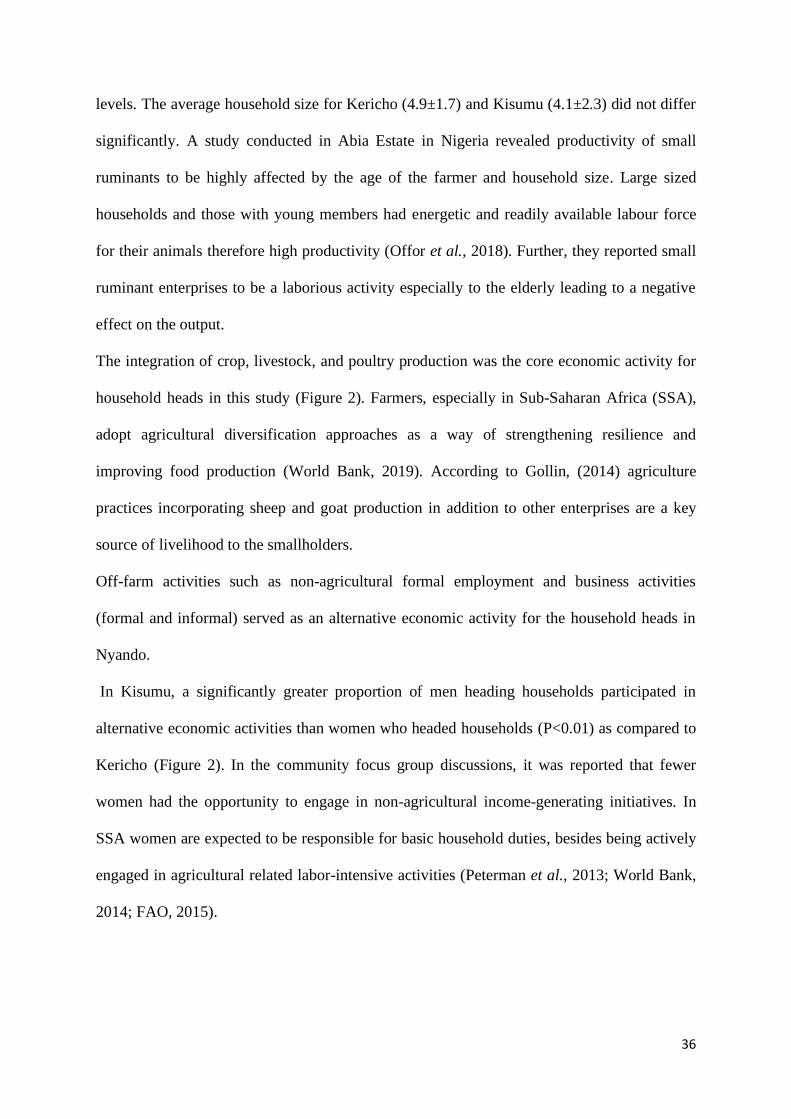
36
levels. The average household size for Kericho (4.9±1.7) and Kisumu (4.1±2.3) did not differ
significantly. A study conducted in Abia Estate in Nigeria revealed productivity of small
ruminants to be highly affected by the age of the farmer and household size. Large sized
households and those with young members had energetic and readily available labour force
for their animals therefore high productivity (Offor et al., 2018). Further, they reported small
ruminant enterprises to be a laborious activity especially to the elderly leading to a negative
effect on the output.
The integration of crop, livestock, and poultry production was the core economic activity for
household heads in this study (Figure 2). Farmers, especially in Sub-Saharan Africa (SSA),
adopt agricultural diversification approaches as a way of strengthening resilience and
improving food production (World Bank, 2019). According to Gollin, (2014) agriculture
practices incorporating sheep and goat production in addition to other enterprises are a key
source of livelihood to the smallholders.
Off-farm activities such as non-agricultural formal employment and business activities
(formal and informal) served as an alternative economic activity for the household heads in
Nyando.
In Kisumu, a significantly greater proportion of men heading households participated in
alternative economic activities than women who headed households (P<0.01) as compared to
Kericho (Figure 2). In the community focus group discussions, it was reported that fewer
women had the opportunity to engage in non-agricultural income-generating initiatives. In
SSA women are expected to be responsible for basic household duties, besides being actively
engaged in agricultural related labor-intensive activities (Peterman et al., 2013; World Bank,
2014; FAO, 2015).
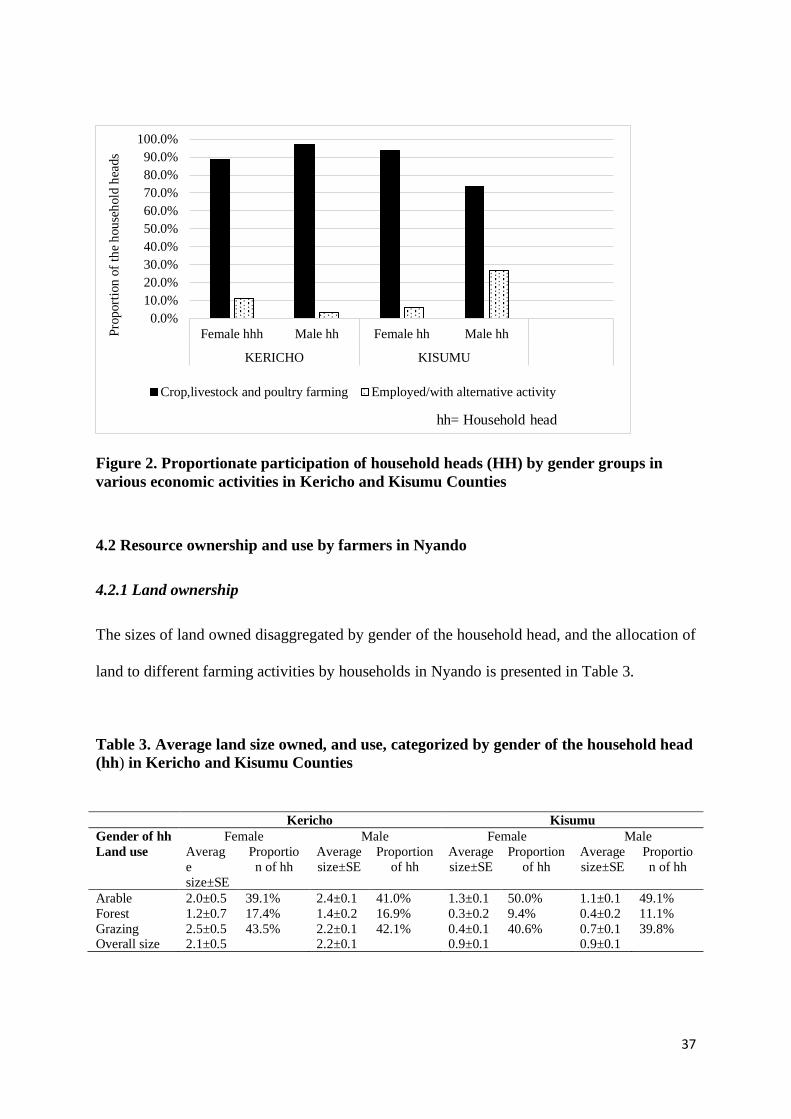
37
Figure 2. Proportionate participation of household heads (HH) by gender groups in
various economic activities in Kericho and Kisumu Counties
4.2 Resource ownership and use by farmers in Nyando
4.2.1 Land ownership
The sizes of land owned disaggregated by gender of the household head, and the allocation of
land to different farming activities by households in Nyando is presented in Table 3.
Table 3. Average land size owned, and use, categorized by gender of the household head
(hh) in Kericho and Kisumu Counties
Kericho Kisumu
Gender of hh Female Male Female Male
Land use Averag
e
size±SE
Proportio
n of hh
Average
size±SE
Proportion
of hh
Average
size±SE
Proportion
of hh
Average
size±SE
Proportio
n of hh
Arable 2.0±0.5 39.1% 2.4±0.1 41.0% 1.3±0.1 50.0% 1.1±0.1 49.1%
Forest 1.2±0.7 17.4% 1.4±0.2 16.9% 0.3±0.2 9.4% 0.4±0.2 11.1%
Grazing 2.5±0.5 43.5% 2.2±0.1 42.1% 0.4±0.1 40.6% 0.7±0.1 39.8% Overall size 2.1±0.5 2.2±0.1 0.9±0.1 0.9±0.1
0.0%
10.0%
20.0%
30.0%
40.0%
50.0%
60.0%
70.0%
80.0%
90.0%
100.0%
Female hhh Male hh Female hh Male hh
KERICHO KISUMU
Pro
port
ion
of
the
house
hold
hea
ds
Crop,livestock and poultry farming Employed/with alternative activity
hh= Household head
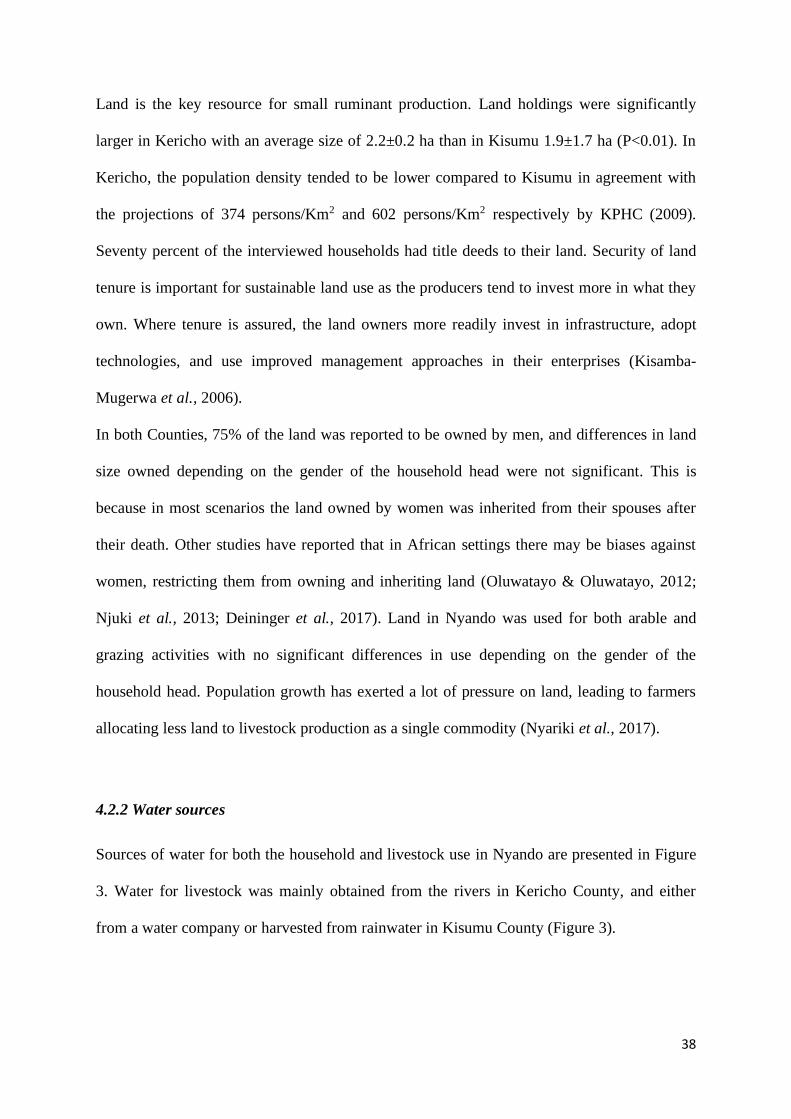
38
Land is the key resource for small ruminant production. Land holdings were significantly
larger in Kericho with an average size of 2.2±0.2 ha than in Kisumu 1.9±1.7 ha (P<0.01). In
Kericho, the population density tended to be lower compared to Kisumu in agreement with
the projections of 374 persons/Km2 and 602 persons/Km2 respectively by KPHC (2009).
Seventy percent of the interviewed households had title deeds to their land. Security of land
tenure is important for sustainable land use as the producers tend to invest more in what they
own. Where tenure is assured, the land owners more readily invest in infrastructure, adopt
technologies, and use improved management approaches in their enterprises (Kisamba-
Mugerwa et al., 2006).
In both Counties, 75% of the land was reported to be owned by men, and differences in land
size owned depending on the gender of the household head were not significant. This is
because in most scenarios the land owned by women was inherited from their spouses after
their death. Other studies have reported that in African settings there may be biases against
women, restricting them from owning and inheriting land (Oluwatayo & Oluwatayo, 2012;
Njuki et al., 2013; Deininger et al., 2017). Land in Nyando was used for both arable and
grazing activities with no significant differences in use depending on the gender of the
household head. Population growth has exerted a lot of pressure on land, leading to farmers
allocating less land to livestock production as a single commodity (Nyariki et al., 2017).
4.2.2 Water sources
Sources of water for both the household and livestock use in Nyando are presented in Figure
3. Water for livestock was mainly obtained from the rivers in Kericho County, and either
from a water company or harvested from rainwater in Kisumu County (Figure 3).
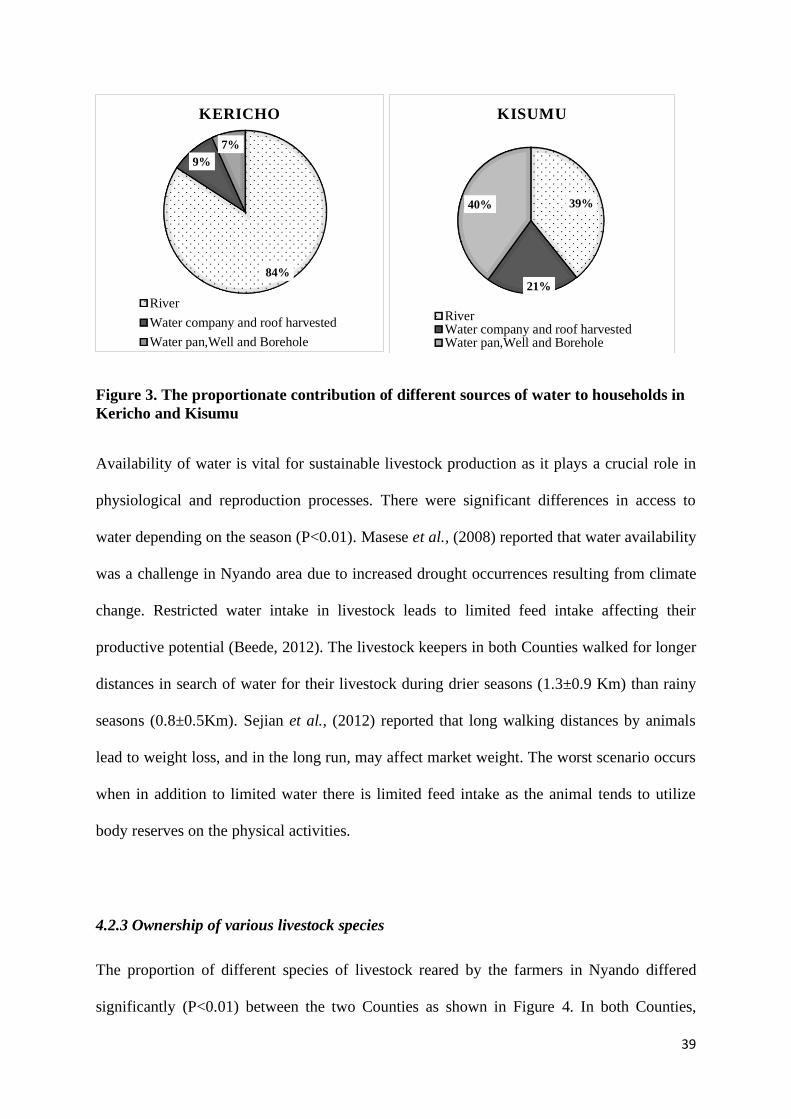
39
Figure 3. The proportionate contribution of different sources of water to households in
Kericho and Kisumu
Availability of water is vital for sustainable livestock production as it plays a crucial role in
physiological and reproduction processes. There were significant differences in access to
water depending on the season (P<0.01). Masese et al., (2008) reported that water availability
was a challenge in Nyando area due to increased drought occurrences resulting from climate
change. Restricted water intake in livestock leads to limited feed intake affecting their
productive potential (Beede, 2012). The livestock keepers in both Counties walked for longer
distances in search of water for their livestock during drier seasons (1.3±0.9 Km) than rainy
seasons (0.8±0.5Km). Sejian et al., (2012) reported that long walking distances by animals
lead to weight loss, and in the long run, may affect market weight. The worst scenario occurs
when in addition to limited water there is limited feed intake as the animal tends to utilize
body reserves on the physical activities.
4.2.3 Ownership of various livestock species
The proportion of different species of livestock reared by the farmers in Nyando differed
significantly (P<0.01) between the two Counties as shown in Figure 4. In both Counties,
84%
9%
7%
KERICHO
River
Water company and roof harvested
Water pan,Well and Borehole
39%
21%
40%
KISUMU
RiverWater company and roof harvestedWater pan,Well and Borehole
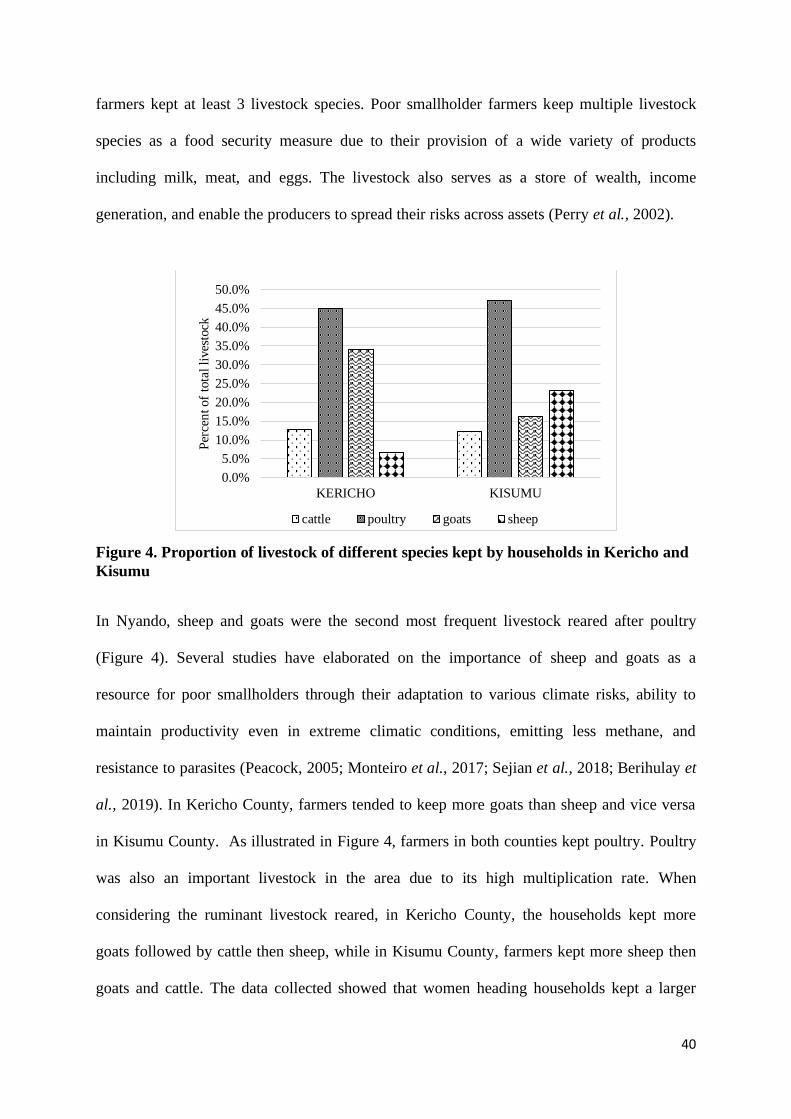
40
farmers kept at least 3 livestock species. Poor smallholder farmers keep multiple livestock
species as a food security measure due to their provision of a wide variety of products
including milk, meat, and eggs. The livestock also serves as a store of wealth, income
generation, and enable the producers to spread their risks across assets (Perry et al., 2002).
Figure 4. Proportion of livestock of different species kept by households in Kericho and
Kisumu
In Nyando, sheep and goats were the second most frequent livestock reared after poultry
(Figure 4). Several studies have elaborated on the importance of sheep and goats as a
resource for poor smallholders through their adaptation to various climate risks, ability to
maintain productivity even in extreme climatic conditions, emitting less methane, and
resistance to parasites (Peacock, 2005; Monteiro et al., 2017; Sejian et al., 2018; Berihulay et
al., 2019). In Kericho County, farmers tended to keep more goats than sheep and vice versa
in Kisumu County. As illustrated in Figure 4, farmers in both counties kept poultry. Poultry
was also an important livestock in the area due to its high multiplication rate. When
considering the ruminant livestock reared, in Kericho County, the households kept more
goats followed by cattle then sheep, while in Kisumu County, farmers kept more sheep then
goats and cattle. The data collected showed that women heading households kept a larger
0.0%
5.0%
10.0%
15.0%
20.0%
25.0%
30.0%
35.0%
40.0%
45.0%
50.0%
KERICHO KISUMU
Per
cen
t of
tota
l li
ves
tock
cattle poultry goats sheep
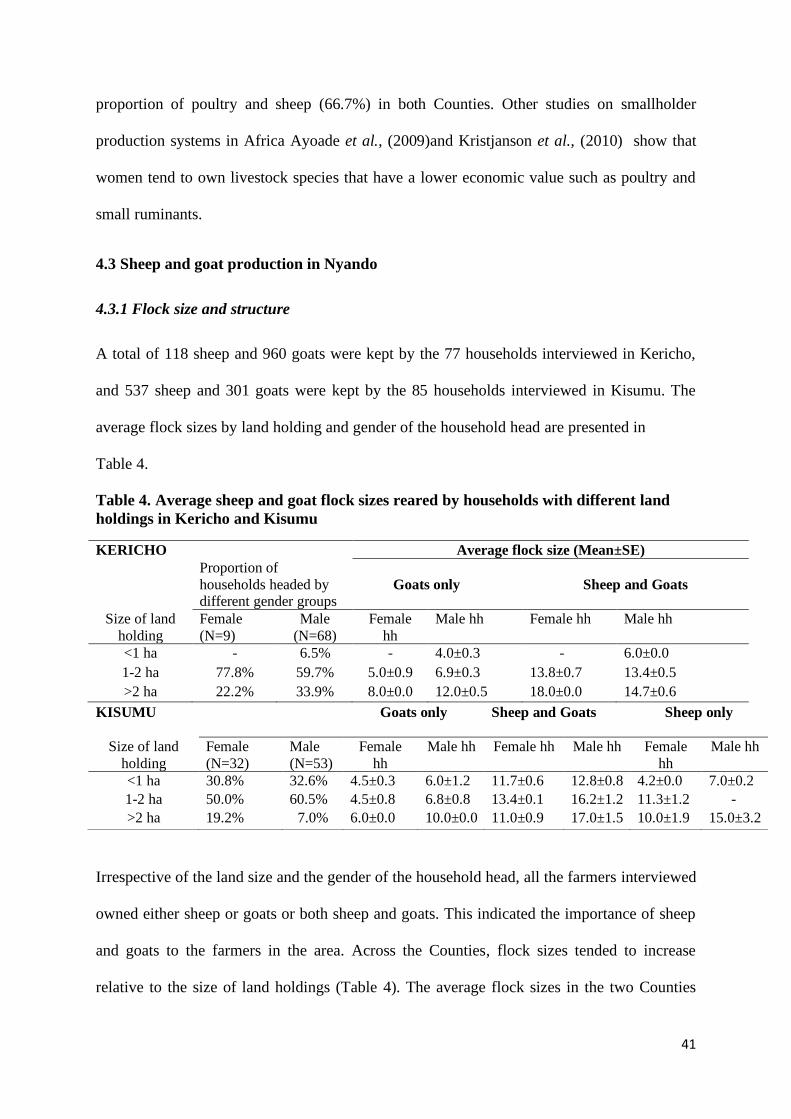
41
proportion of poultry and sheep (66.7%) in both Counties. Other studies on smallholder
production systems in Africa Ayoade et al., (2009)and Kristjanson et al., (2010) show that
women tend to own livestock species that have a lower economic value such as poultry and
small ruminants.
4.3 Sheep and goat production in Nyando
4.3.1 Flock size and structure
A total of 118 sheep and 960 goats were kept by the 77 households interviewed in Kericho,
and 537 sheep and 301 goats were kept by the 85 households interviewed in Kisumu. The
average flock sizes by land holding and gender of the household head are presented in
Table 4.
Table 4. Average sheep and goat flock sizes reared by households with different land
holdings in Kericho and Kisumu
KERICHO Average flock size (Mean±SE) Proportion of
households headed by different gender groups
Goats only
Sheep and Goats
Size of land
holding
Female
(N=9)
Male
(N=68)
Female
hh
Male hh Female hh Male hh
<1 ha - 6.5% - 4.0±0.3 - 6.0±0.0
1-2 ha 77.8% 59.7% 5.0±0.9 6.9±0.3 13.8±0.7 13.4±0.5
>2 ha 22.2% 33.9% 8.0±0.0 12.0±0.5 18.0±0.0 14.7±0.6
Irrespective of the land size and the gender of the household head, all the farmers interviewed
owned either sheep or goats or both sheep and goats. This indicated the importance of sheep
and goats to the farmers in the area. Across the Counties, flock sizes tended to increase
relative to the size of land holdings (Table 4). The average flock sizes in the two Counties
KISUMU
Goats only Sheep and Goats Sheep only
Size of land
holding
Female
(N=32)
Male
(N=53)
Female
hh
Male hh Female hh Male hh Female
hh
Male hh
<1 ha 30.8% 32.6% 4.5±0.3 6.0±1.2 11.7±0.6 12.8±0.8 4.2±0.0 7.0±0.2
1-2 ha 50.0% 60.5% 4.5±0.8 6.8±0.8 13.4±0.1 16.2±1.2 11.3±1.2 -
>2 ha 19.2% 7.0% 6.0±0.0 10.0±0.0 11.0±0.9 17.0±1.5 10.0±1.9 15.0±3.2
42
were 5.0±0.3 and 9.2±0.4 for sheep and 14.0±0.5 and 7.2±0.3 for goats in Kericho and
Kisumu respectively. These flock sizes were larger than those reported for the households in
2014 by Ojango et al., (2015), an indication of expansion of small ruminant production on
the farms. From the FGD farmers attested that sheep and goats were easy to manage
compared to cattle. In livestock keeping communities of Africa, the number of animals
reared tends to be associated with the quantity of land owned (Gizaw & Tegegne, 2010).
Studies on livestock ownership by gender indicate that women, especially those in rural areas
generally keep less livestock than men (FAO, 2009).
The small ruminant species kept by the households in Nyando differed significantly
depending on the gender of the household head. A larger proportion of male headed
households 87.2% and 65.6% in Kericho and Kisumu Counties respectively owned goats
relative to female headed households. Female headed households in Kericho also tended to
keep both sheep and goats rather than single species flock (p<0.01, Table 4). In Kisumu
County, differences in small ruminant species ownership by gender of the household head
were not significant. A greater proportion of the households in Kisumu County kept flocks of
a single species (either sheep or goats) compared to those in Kericho County.
The difference in species reared between the two Counties could be related to the diverse
vegetation cover where the greater shrub vegetation found in Kericho County favors goat
production, while the area with fewer shrubs and more grass vegetation of Kisumu County is
more favorable for sheep production. The grazing behavior of sheep and goats is such that
sheep tend to feed on grasses in a more controlled manner while goats are browsers and tend
to spread out in search of shrubs, thus roam over larger areas (Agrawal et al., 2014).
Different values were also attached to sheep and goats by the two communities. In Kisumu
County, the community has been reported to prefer sheep to goats (Ojango et al., 2016) as
part of their culture. However, farmers in Kisumu appreciate goats for their ability to control
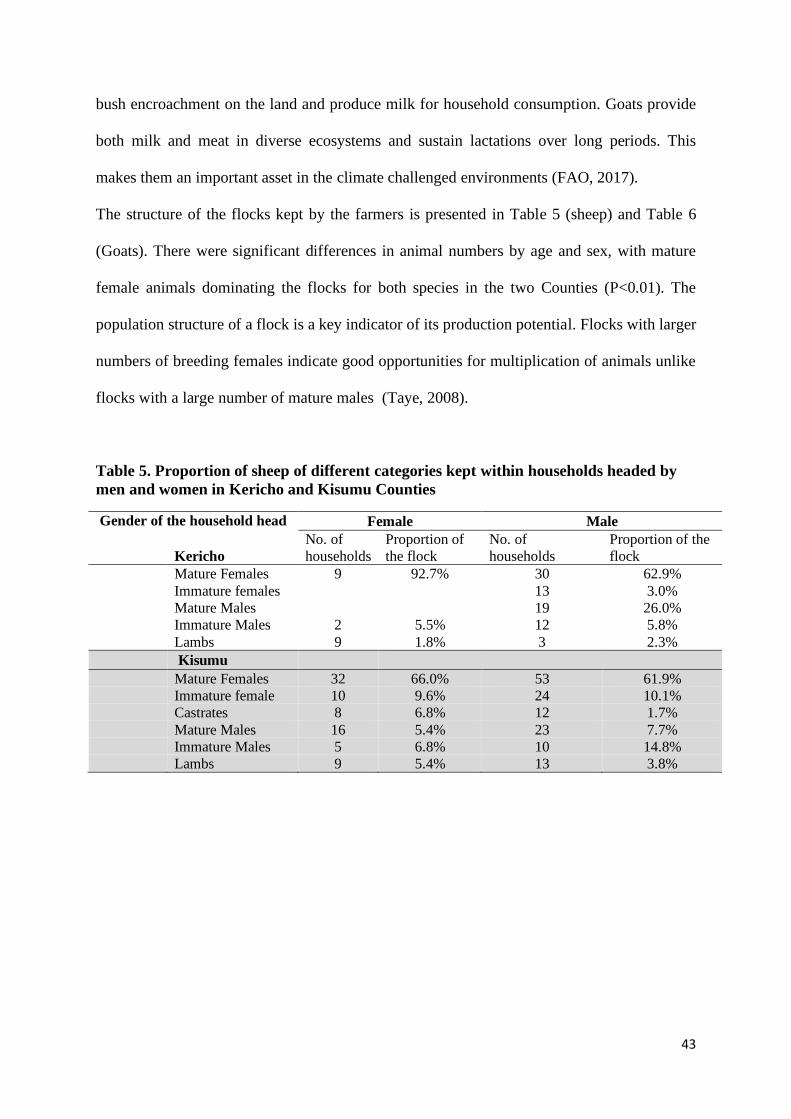
43
bush encroachment on the land and produce milk for household consumption. Goats provide
both milk and meat in diverse ecosystems and sustain lactations over long periods. This
makes them an important asset in the climate challenged environments (FAO, 2017).
The structure of the flocks kept by the farmers is presented in Table 5 (sheep) and Table 6
(Goats). There were significant differences in animal numbers by age and sex, with mature
female animals dominating the flocks for both species in the two Counties (P<0.01). The
population structure of a flock is a key indicator of its production potential. Flocks with larger
numbers of breeding females indicate good opportunities for multiplication of animals unlike
flocks with a large number of mature males (Taye, 2008).
Table 5. Proportion of sheep of different categories kept within households headed by
men and women in Kericho and Kisumu Counties
Gender of the household head Female Male Kericho
No. of
households Proportion of
the flock No. of
households Proportion of the
flock Mature Females 9 92.7% 30 62.9%
Immature females 13 3.0% Mature Males 19 26.0% Immature Males 2 5.5% 12 5.8% Lambs 9 1.8% 3 2.3%
Kisumu Mature Females 32 66.0% 53 61.9%
Immature female 10 9.6% 24 10.1% Castrates 8 6.8% 12 1.7%
Mature Males 16 5.4% 23 7.7% Immature Males 5 6.8% 10 14.8% Lambs 9 5.4% 13 3.8%
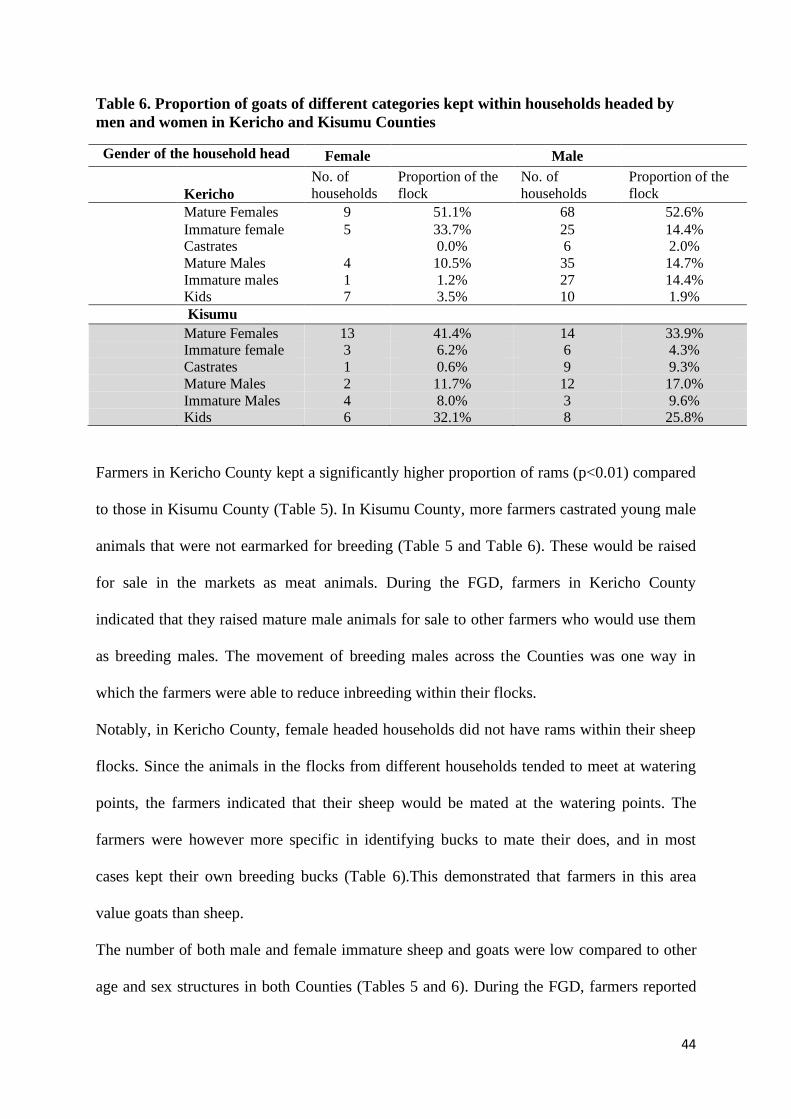
44
Table 6. Proportion of goats of different categories kept within households headed by
men and women in Kericho and Kisumu Counties
Gender of the household head Female Male
Kericho
No. of
households Proportion of the
flock No. of
households Proportion of the
flock Mature Females 9 51.1% 68 52.6% Immature female 5 33.7% 25 14.4% Castrates
0.0% 6 2.0%
Mature Males 4 10.5% 35 14.7% Immature males 1 1.2% 27 14.4% Kids 7 3.5% 10 1.9%
Kisumu
Mature Females 13 41.4% 14 33.9% Immature female 3 6.2% 6 4.3% Castrates 1 0.6% 9 9.3% Mature Males 2 11.7% 12 17.0% Immature Males 4 8.0% 3 9.6% Kids 6 32.1% 8 25.8%
Farmers in Kericho County kept a significantly higher proportion of rams (p<0.01) compared
to those in Kisumu County (Table 5). In Kisumu County, more farmers castrated young male
animals that were not earmarked for breeding (Table 5 and Table 6). These would be raised
for sale in the markets as meat animals. During the FGD, farmers in Kericho County
indicated that they raised mature male animals for sale to other farmers who would use them
as breeding males. The movement of breeding males across the Counties was one way in
which the farmers were able to reduce inbreeding within their flocks.
Notably, in Kericho County, female headed households did not have rams within their sheep
flocks. Since the animals in the flocks from different households tended to meet at watering
points, the farmers indicated that their sheep would be mated at the watering points. The
farmers were however more specific in identifying bucks to mate their does, and in most
cases kept their own breeding bucks (Table 6).This demonstrated that farmers in this area
value goats than sheep.
The number of both male and female immature sheep and goats were low compared to other
age and sex structures in both Counties (Tables 5 and 6). During the FGD, farmers reported
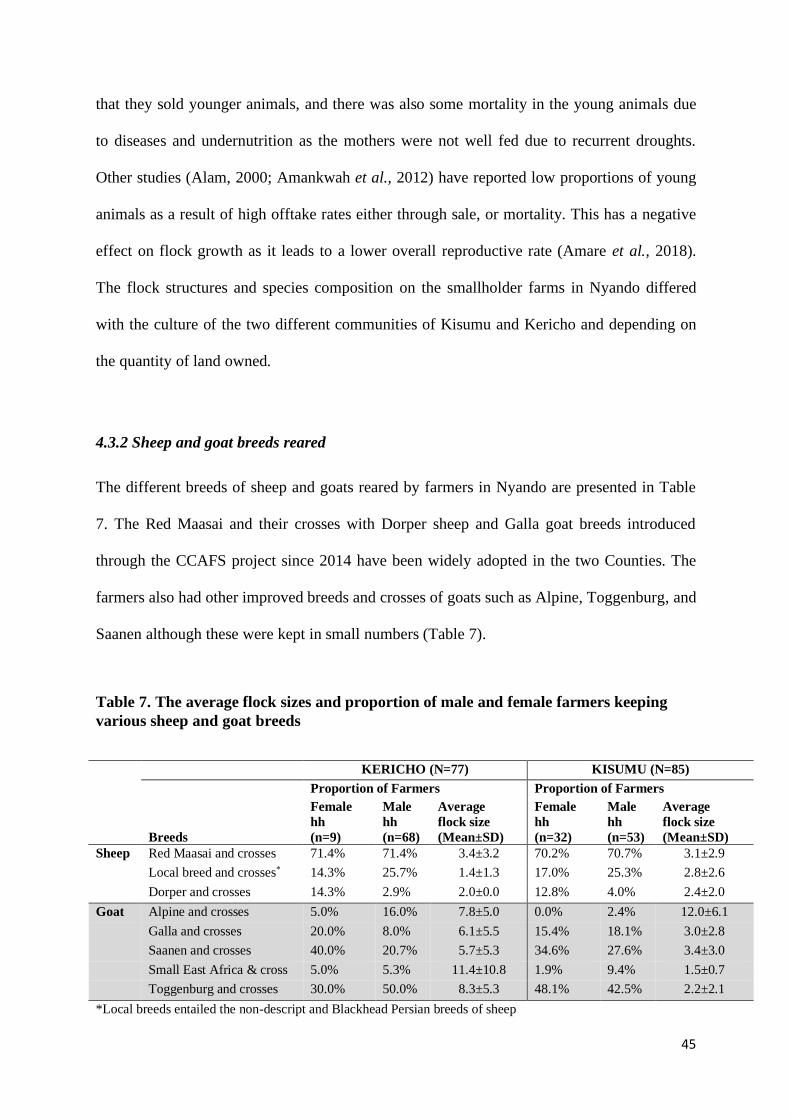
45
that they sold younger animals, and there was also some mortality in the young animals due
to diseases and undernutrition as the mothers were not well fed due to recurrent droughts.
Other studies (Alam, 2000; Amankwah et al., 2012) have reported low proportions of young
animals as a result of high offtake rates either through sale, or mortality. This has a negative
effect on flock growth as it leads to a lower overall reproductive rate (Amare et al., 2018).
The flock structures and species composition on the smallholder farms in Nyando differed
with the culture of the two different communities of Kisumu and Kericho and depending on
the quantity of land owned.
4.3.2 Sheep and goat breeds reared
The different breeds of sheep and goats reared by farmers in Nyando are presented in Table
7. The Red Maasai and their crosses with Dorper sheep and Galla goat breeds introduced
through the CCAFS project since 2014 have been widely adopted in the two Counties. The
farmers also had other improved breeds and crosses of goats such as Alpine, Toggenburg, and
Saanen although these were kept in small numbers (Table 7).
Table 7. The average flock sizes and proportion of male and female farmers keeping
various sheep and goat breeds
KERICHO (N=77) KISUMU (N=85)
Proportion of Farmers Proportion of Farmers
Breeds
Female
hh
(n=9)
Male
hh
(n=68)
Average
flock size
(Mean±SD)
Female
hh
(n=32)
Male
hh
(n=53)
Average
flock size
(Mean±SD)
Sheep Red Maasai and crosses 71.4% 71.4% 3.4±3.2 70.2% 70.7% 3.1±2.9
Local breed and crosses* 14.3% 25.7% 1.4±1.3 17.0% 25.3% 2.8±2.6
Dorper and crosses 14.3% 2.9% 2.0±0.0 12.8% 4.0% 2.4±2.0
Goat Alpine and crosses 5.0% 16.0% 7.8±5.0 0.0% 2.4% 12.0±6.1
Galla and crosses 20.0% 8.0% 6.1±5.5 15.4% 18.1% 3.0±2.8
Saanen and crosses 40.0% 20.7% 5.7±5.3 34.6% 27.6% 3.4±3.0
Small East Africa & cross 5.0% 5.3% 11.4±10.8 1.9% 9.4% 1.5±0.7
Toggenburg and crosses 30.0% 50.0% 8.3±5.3 48.1% 42.5% 2.2±2.1
*Local breeds entailed the non-descript and Blackhead Persian breeds of sheep
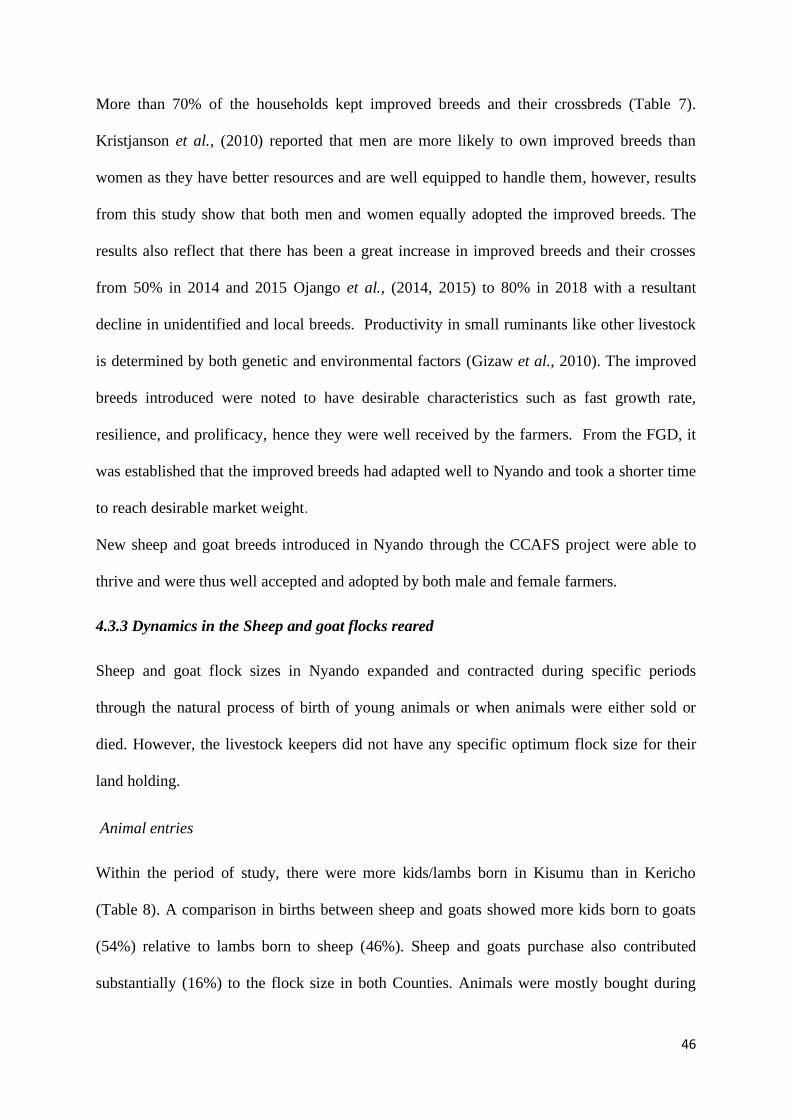
46
More than 70% of the households kept improved breeds and their crossbreds (Table 7).
Kristjanson et al., (2010) reported that men are more likely to own improved breeds than
women as they have better resources and are well equipped to handle them, however, results
from this study show that both men and women equally adopted the improved breeds. The
results also reflect that there has been a great increase in improved breeds and their crosses
from 50% in 2014 and 2015 Ojango et al., (2014, 2015) to 80% in 2018 with a resultant
decline in unidentified and local breeds. Productivity in small ruminants like other livestock
is determined by both genetic and environmental factors (Gizaw et al., 2010). The improved
breeds introduced were noted to have desirable characteristics such as fast growth rate,
resilience, and prolificacy, hence they were well received by the farmers. From the FGD, it
was established that the improved breeds had adapted well to Nyando and took a shorter time
to reach desirable market weight.
New sheep and goat breeds introduced in Nyando through the CCAFS project were able to
thrive and were thus well accepted and adopted by both male and female farmers.
4.3.3 Dynamics in the Sheep and goat flocks reared
Sheep and goat flock sizes in Nyando expanded and contracted during specific periods
through the natural process of birth of young animals or when animals were either sold or
died. However, the livestock keepers did not have any specific optimum flock size for their
land holding.
Animal entries
Within the period of study, there were more kids/lambs born in Kisumu than in Kericho
(Table 8). A comparison in births between sheep and goats showed more kids born to goats
(54%) relative to lambs born to sheep (46%). Sheep and goats purchase also contributed
substantially (16%) to the flock size in both Counties. Animals were mostly bought during
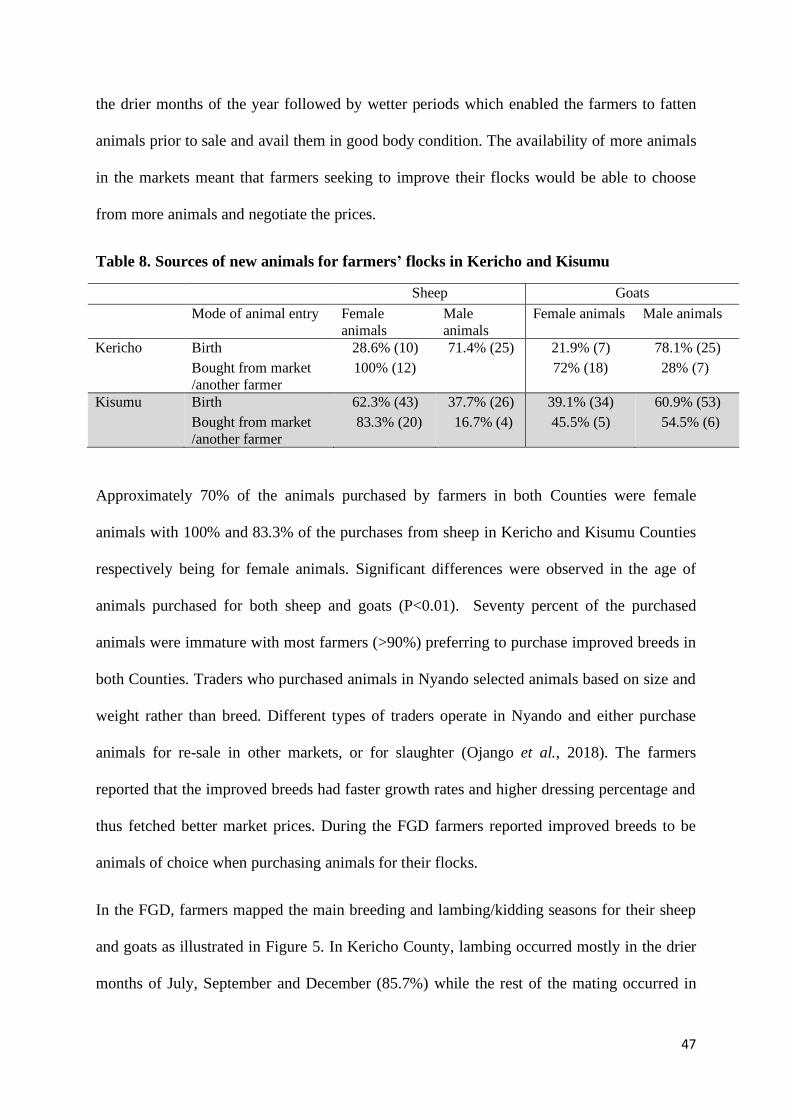
47
the drier months of the year followed by wetter periods which enabled the farmers to fatten
animals prior to sale and avail them in good body condition. The availability of more animals
in the markets meant that farmers seeking to improve their flocks would be able to choose
from more animals and negotiate the prices.
Table 8. Sources of new animals for farmers’ flocks in Kericho and Kisumu
Sheep Goats
Mode of animal entry Female
animals
Male
animals
Female animals Male animals
Kericho Birth 28.6% (10) 71.4% (25) 21.9% (7) 78.1% (25) Bought from market
/another farmer
100% (12)
72% (18) 28% (7)
Kisumu Birth 62.3% (43) 37.7% (26) 39.1% (34) 60.9% (53) Bought from market
/another farmer
83.3% (20) 16.7% (4) 45.5% (5) 54.5% (6)
Approximately 70% of the animals purchased by farmers in both Counties were female
animals with 100% and 83.3% of the purchases from sheep in Kericho and Kisumu Counties
respectively being for female animals. Significant differences were observed in the age of
animals purchased for both sheep and goats (P<0.01). Seventy percent of the purchased
animals were immature with most farmers (>90%) preferring to purchase improved breeds in
both Counties. Traders who purchased animals in Nyando selected animals based on size and
weight rather than breed. Different types of traders operate in Nyando and either purchase
animals for re-sale in other markets, or for slaughter (Ojango et al., 2018). The farmers
reported that the improved breeds had faster growth rates and higher dressing percentage and
thus fetched better market prices. During the FGD farmers reported improved breeds to be
animals of choice when purchasing animals for their flocks.
In the FGD, farmers mapped the main breeding and lambing/kidding seasons for their sheep
and goats as illustrated in Figure 5. In Kericho County, lambing occurred mostly in the drier
months of July, September and December (85.7%) while the rest of the mating occurred in
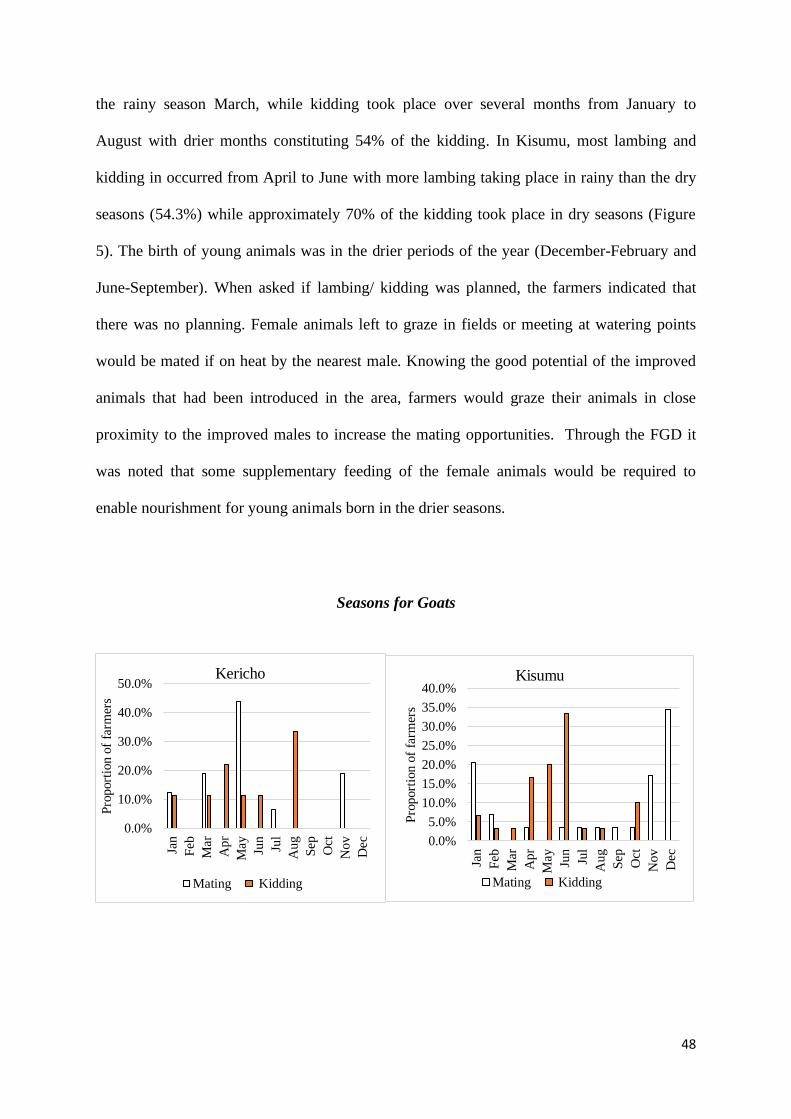
48
the rainy season March, while kidding took place over several months from January to
August with drier months constituting 54% of the kidding. In Kisumu, most lambing and
kidding in occurred from April to June with more lambing taking place in rainy than the dry
seasons (54.3%) while approximately 70% of the kidding took place in dry seasons (Figure
5). The birth of young animals was in the drier periods of the year (December-February and
June-September). When asked if lambing/ kidding was planned, the farmers indicated that
there was no planning. Female animals left to graze in fields or meeting at watering points
would be mated if on heat by the nearest male. Knowing the good potential of the improved
animals that had been introduced in the area, farmers would graze their animals in close
proximity to the improved males to increase the mating opportunities. Through the FGD it
was noted that some supplementary feeding of the female animals would be required to
enable nourishment for young animals born in the drier seasons.
Seasons for Goats
0.0%
10.0%
20.0%
30.0%
40.0%
50.0%
Jan
Feb
Mar
Apr
May Jun
Jul
Aug
Sep
Oct
Nov
Dec
Pro
port
ion
of
farm
ers
Kericho
Mating Kidding
0.0%
5.0%
10.0%
15.0%
20.0%
25.0%
30.0%
35.0%
40.0%
Jan
Feb
Mar
Apr
May Jun
Jul
Aug
Sep
Oct
Nov
Dec
Pro
port
ion
of
farm
ers
Kisumu
Mating Kidding
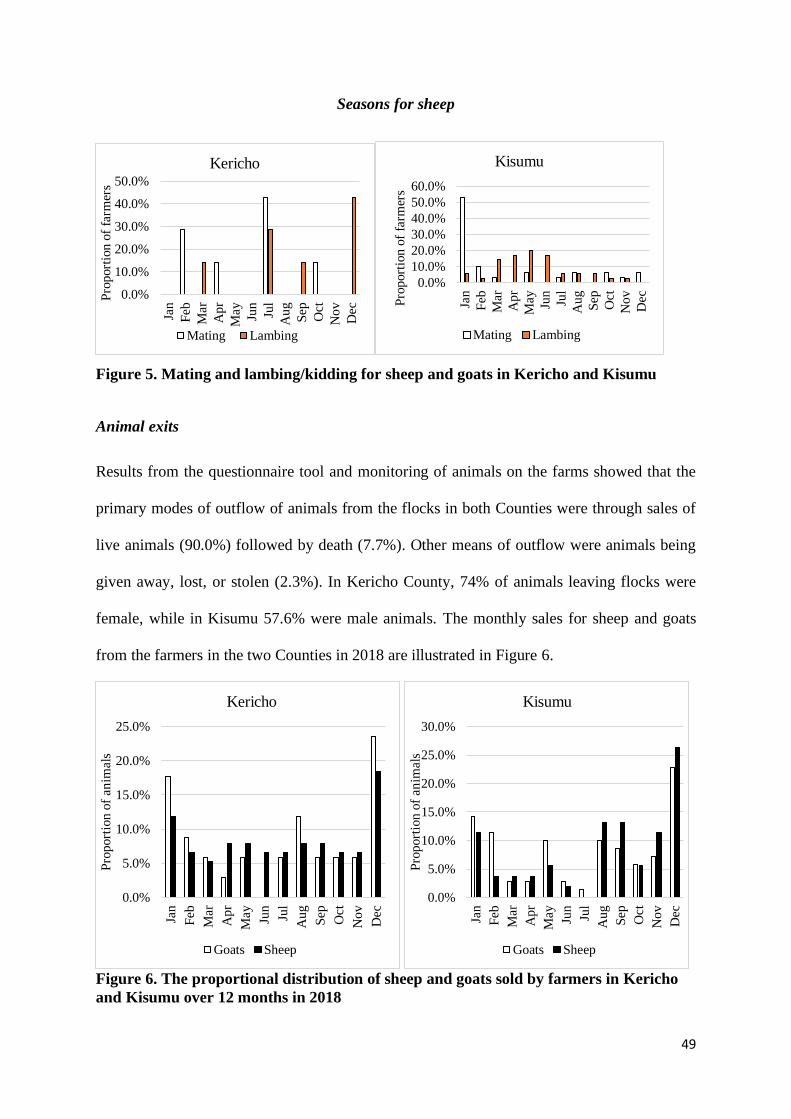
49
Seasons for sheep
Figure 5. Mating and lambing/kidding for sheep and goats in Kericho and Kisumu
Animal exits
Results from the questionnaire tool and monitoring of animals on the farms showed that the
primary modes of outflow of animals from the flocks in both Counties were through sales of
live animals (90.0%) followed by death (7.7%). Other means of outflow were animals being
given away, lost, or stolen (2.3%). In Kericho County, 74% of animals leaving flocks were
female, while in Kisumu 57.6% were male animals. The monthly sales for sheep and goats
from the farmers in the two Counties in 2018 are illustrated in Figure 6.
Figure 6. The proportional distribution of sheep and goats sold by farmers in Kericho
and Kisumu over 12 months in 2018
0.0%
10.0%
20.0%
30.0%
40.0%
50.0%Ja
n
Feb
Mar
Apr
May Jun
Jul
Au
g
Sep
Oct
Nov
Dec
Pro
port
ion
of
farm
ers
Kericho
Mating Lambing
0.0%
10.0%
20.0%
30.0%
40.0%
50.0%
60.0%
Jan
Feb
Mar
Apr
May Jun
Jul
Aug
Sep
Oct
Nov
DecPro
port
ion
of
farm
ers
Kisumu
Mating Lambing
0.0%
5.0%
10.0%
15.0%
20.0%
25.0%
Jan
Feb
Mar
Ap
r
May Jun
Jul
Au
g
Sep
Oct
No
v
Dec
Pro
port
ion
of
anim
als
Kericho
Goats Sheep
0.0%
5.0%
10.0%
15.0%
20.0%
25.0%
30.0%
Jan
Feb
Mar
Apr
May Jun
Jul
Aug
Sep
Oct
Nov
Dec
Pro
port
ion
of
anim
als
Kisumu
Goats Sheep
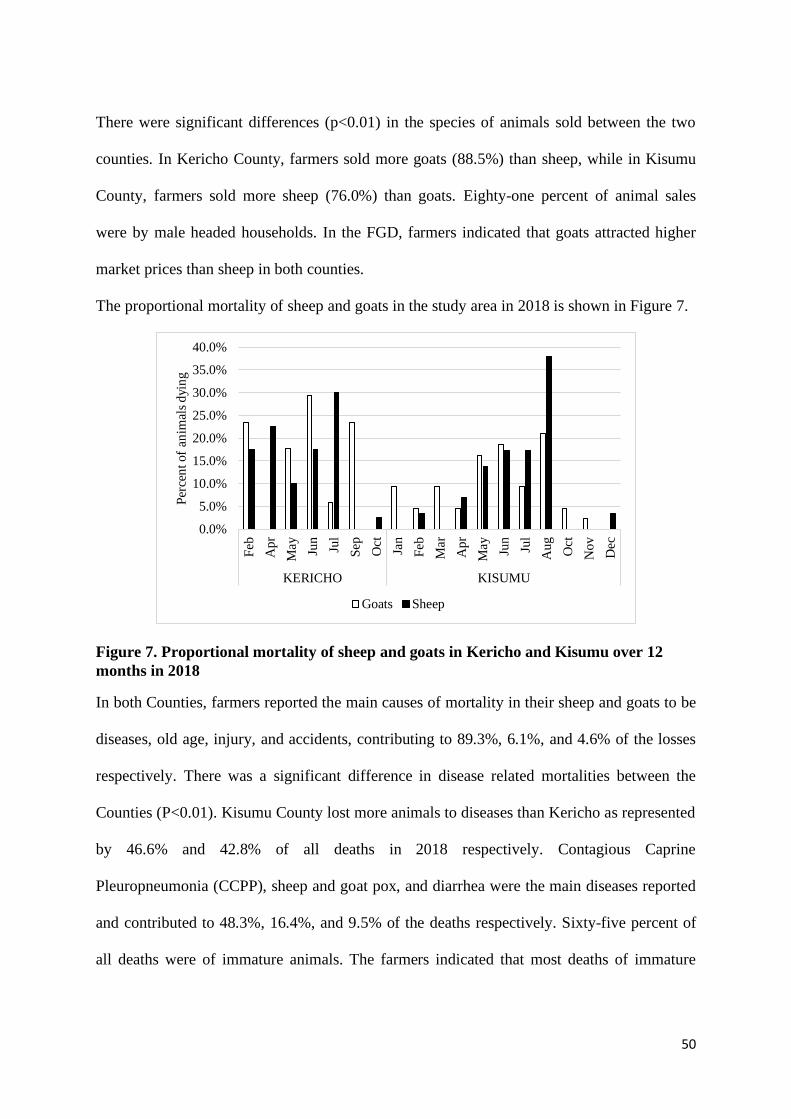
50
There were significant differences (p<0.01) in the species of animals sold between the two
counties. In Kericho County, farmers sold more goats (88.5%) than sheep, while in Kisumu
County, farmers sold more sheep (76.0%) than goats. Eighty-one percent of animal sales
were by male headed households. In the FGD, farmers indicated that goats attracted higher
market prices than sheep in both counties.
The proportional mortality of sheep and goats in the study area in 2018 is shown in Figure 7.
Figure 7. Proportional mortality of sheep and goats in Kericho and Kisumu over 12
months in 2018
In both Counties, farmers reported the main causes of mortality in their sheep and goats to be
diseases, old age, injury, and accidents, contributing to 89.3%, 6.1%, and 4.6% of the losses
respectively. There was a significant difference in disease related mortalities between the
Counties (P<0.01). Kisumu County lost more animals to diseases than Kericho as represented
by 46.6% and 42.8% of all deaths in 2018 respectively. Contagious Caprine
Pleuropneumonia (CCPP), sheep and goat pox, and diarrhea were the main diseases reported
and contributed to 48.3%, 16.4%, and 9.5% of the deaths respectively. Sixty-five percent of
all deaths were of immature animals. The farmers indicated that most deaths of immature
0.0%
5.0%
10.0%
15.0%
20.0%
25.0%
30.0%
35.0%
40.0%
Feb
Ap
r
May Jun
Jul
Sep
Oct
Jan
Feb
Mar
Ap
r
May Jun
Jul
Au
g
Oct
No
v
Dec
KERICHO KISUMU
Per
cen
t of
anim
als
dyi
ng
Goats Sheep
51
animals took place during or immediately after rains due to helminthiasis and
environmentally related diseases such as pneumonia which could be a challenge to manage.
In both Counties, mortality was reported to be significantly higher in sheep (60%) than in the
goats (40%). Studies from India and Ethiopia (Agrawal et al., 2014; Merkine et al., 2017)
associated higher mortality rates in sheep than goats to effects of climate change, respiratory
and gastrointestinal tract related diseases. These studies noted that sheep are more likely to
succumb to droughts and flooding compared to goats. When comparing results from the
current study on flocks in Nyando with a previous study in the area (Ojango et al., 2015),
there has been a 30% decline in mortality in the flocks and an increase in the proportion of
animals sold in Kisumu County by 18%.
4.4 Sheep and goat management practices adopted
4.4.1 Housing and equipment
Lower Nyando has poor drainage due to recurrent floods. The farmers built elevated housing
structures to contain their sheep and goats over the wet months of the year in order to prevent
environmental related diseases such as foot rot and pneumonia. The housing structures
comprise either fully or semi-enclosed sheds which are attached to or separated from the
main residential housing. The structures were mostly constructed of wooden floors with iron
sheet roofs, and sticks, wood or wire mesh on the walls. A substantial number (59.3%) of
households in both counties had structures purposefully for housing sheep and goats while
rest of the farmers housed the animals within their living premises. Lack of proper housing
facilities for sheep and goat production in smallholder systems has been reported to be a
major challenge (Dossa, 2007; Fikru & Omera, 2015). The proportion of farmers with
different housing structures differed significantly between the Counties (P<0.01). More
farmers had temporary housing structures in Kericho (52.5%) than Kisumu (47.5%) where
52
more farmers had semi-permanent and permanent housing structures. Through the FGD,
farmers in Kericho reported that it was costly to build the semi-permanent to permanent
structures for their flocks which were much larger than the flocks in Kisumu as presented in
Table 4.
Tools and equipment used in sheep and goat management comprised spraying pump,
burdizzo, ear tag applicators, hoof clippers, machete, hoe, and Scythe. Eighty-seven percent
of households in Kericho owned either a tool or equipment compared to Kisumu (73%).
Tools and equipment owned were used by the farmers to carry out routine management
activities such as hoof trimming, identification, and operations related to the production of
fodder for the animals.
4.4.2 Feeding management
The feed sources and feeding systems for sheep and goats in the study are presented in Table
9. The farmers reported feed to be a major challenge to livestock production in Nyando as the
small land holdings owned were used for both subsistence food crop farming and fodder
production. Crop residues and grasses growing alongside roads and in communally owned
areas were the principal sources of feed for the sheep and goats. Crop residues comprised
maize, sorghum and millet stover, and legume haulms. These feed resources have however
been reported to be of low nutritional value and result in slow growth of animals (Duku et al.,
2010).
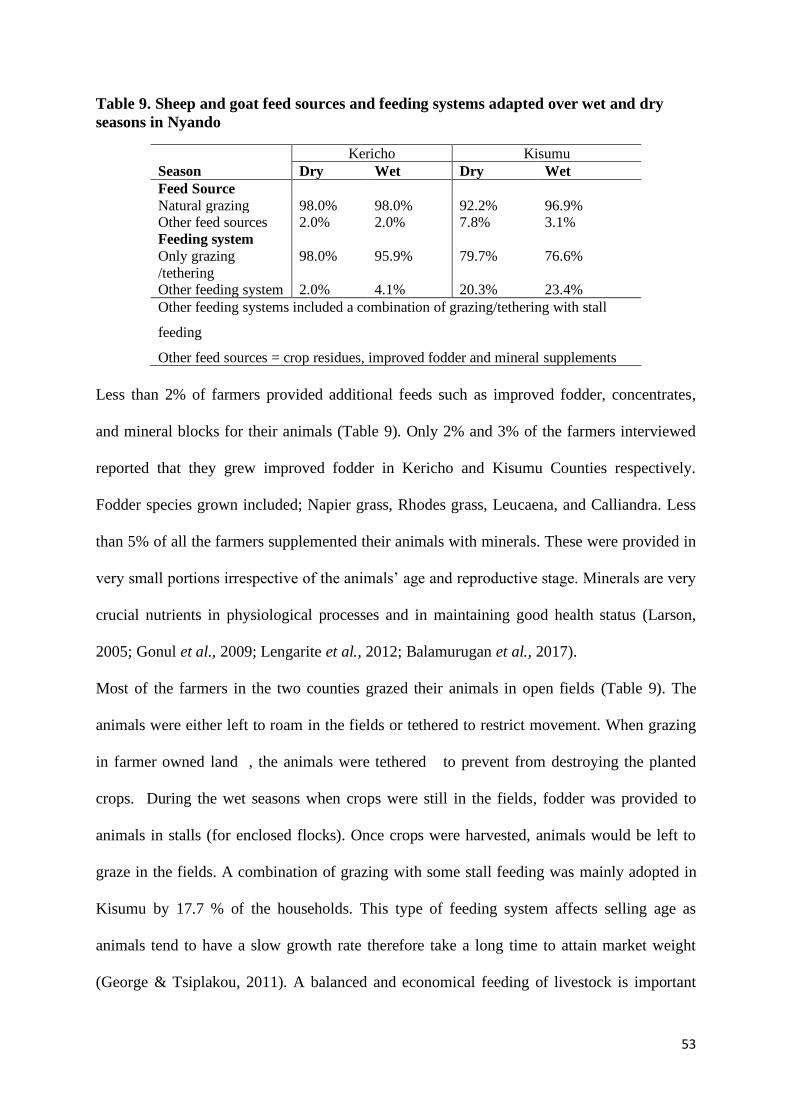
53
Table 9. Sheep and goat feed sources and feeding systems adapted over wet and dry
seasons in Nyando
Kericho Kisumu
Season Dry Wet Dry Wet
Feed Source
Natural grazing 98.0% 98.0% 92.2% 96.9% Other feed sources 2.0% 2.0% 7.8% 3.1%
Feeding system
Only grazing
/tethering
98.0% 95.9% 79.7% 76.6%
Other feeding system 2.0% 4.1% 20.3% 23.4%
Other feeding systems included a combination of grazing/tethering with stall
feeding
Other feed sources = crop residues, improved fodder and mineral supplements
Less than 2% of farmers provided additional feeds such as improved fodder, concentrates,
and mineral blocks for their animals (Table 9). Only 2% and 3% of the farmers interviewed
reported that they grew improved fodder in Kericho and Kisumu Counties respectively.
Fodder species grown included; Napier grass, Rhodes grass, Leucaena, and Calliandra. Less
than 5% of all the farmers supplemented their animals with minerals. These were provided in
very small portions irrespective of the animals’ age and reproductive stage. Minerals are very
crucial nutrients in physiological processes and in maintaining good health status (Larson,
2005; Gonul et al., 2009; Lengarite et al., 2012; Balamurugan et al., 2017).
Most of the farmers in the two counties grazed their animals in open fields (Table 9). The
animals were either left to roam in the fields or tethered to restrict movement. When grazing
in farmer owned land , the animals were tethered to prevent from destroying the planted
crops. During the wet seasons when crops were still in the fields, fodder was provided to
animals in stalls (for enclosed flocks). Once crops were harvested, animals would be left to
graze in the fields. A combination of grazing with some stall feeding was mainly adopted in
Kisumu by 17.7 % of the households. This type of feeding system affects selling age as
animals tend to have a slow growth rate therefore take a long time to attain market weight
(George & Tsiplakou, 2011). A balanced and economical feeding of livestock is important
54
for optimum productivity. Lower livestock productivity is often due to feed scarcity and
unbalanced feeding practices (Beigh et al., 2017). Young animals born under stall feeding
had higher growth rates and intramuscular fat (De Brito et al., 2017). Animals raised under
extensive production systems tend to have slower growth rate leading to low production
efficiency (Carrasco et al., 2009). There is, therefore, need for supplementation for optimal
growth and carcass production (Turner et al., 2014).
4.4.3 Disease control
Helminth and tick control were the main sheep and goat disease control interventions adopted
by 76.6% and 73.7% of the households in Kericho and Kisumu counties respectively. Control
of ticks and worms in sheep and goats was initiated in the farms through the CCAFS project
and supported by the livestock extension services. The farmers noted that the practices had
improved the health and body condition of their animals hence the high rate of adoption.
Diseases and parasites in livestock populations affect growth, result in mortality, and thus
reduce productivity and profitability (Charlier et al., 2014). Disease control is important in
livestock production due to its role in improving productivity through lowering mortality and
improving reproductive rates (Wolff et al., 2019; Robertson, 2020). In relation to other
diseases, the farmers indicated that they seek treatment for their animals when they fell ill.
4.4.4 Breeding practices
The sources of breeding males for the farmers in the study area are presented in Figure 8. The
main source of breeding males was their own bred ram/ buck as adopted by 46.3% of the
households (Figure 8).
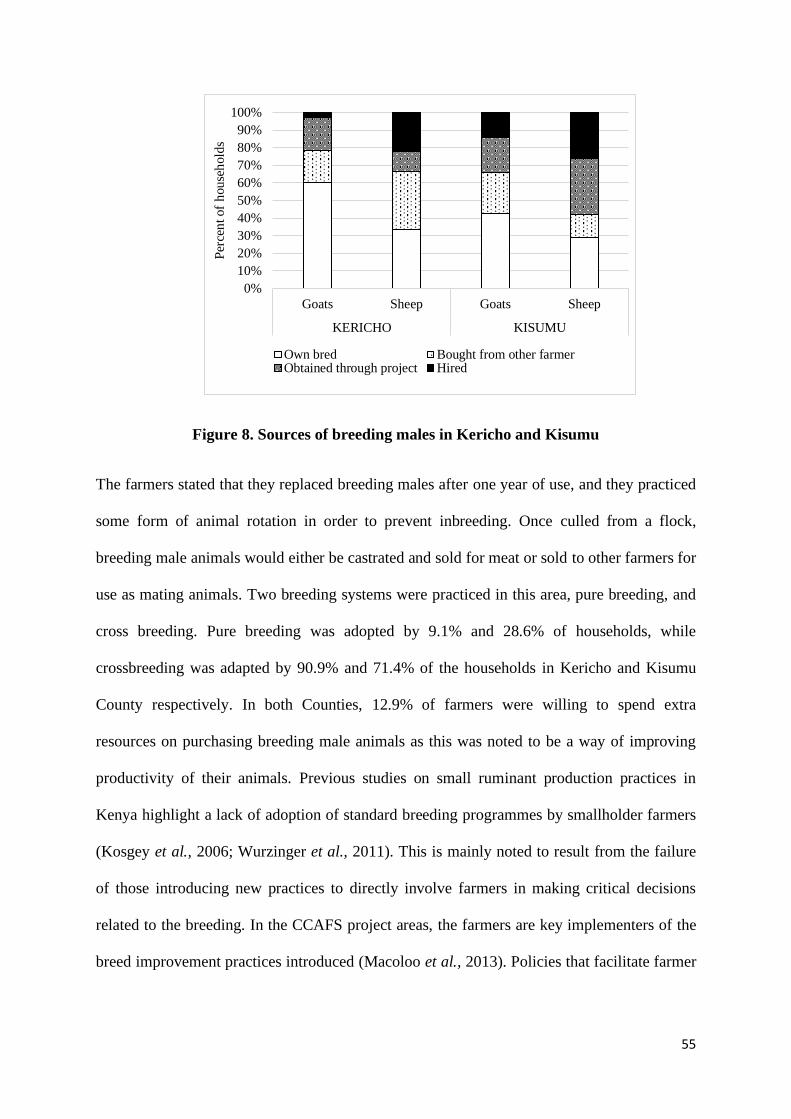
55
Figure 8. Sources of breeding males in Kericho and Kisumu
The farmers stated that they replaced breeding males after one year of use, and they practiced
some form of animal rotation in order to prevent inbreeding. Once culled from a flock,
breeding male animals would either be castrated and sold for meat or sold to other farmers for
use as mating animals. Two breeding systems were practiced in this area, pure breeding, and
cross breeding. Pure breeding was adopted by 9.1% and 28.6% of households, while
crossbreeding was adapted by 90.9% and 71.4% of the households in Kericho and Kisumu
County respectively. In both Counties, 12.9% of farmers were willing to spend extra
resources on purchasing breeding male animals as this was noted to be a way of improving
productivity of their animals. Previous studies on small ruminant production practices in
Kenya highlight a lack of adoption of standard breeding programmes by smallholder farmers
(Kosgey et al., 2006; Wurzinger et al., 2011). This is mainly noted to result from the failure
of those introducing new practices to directly involve farmers in making critical decisions
related to the breeding. In the CCAFS project areas, the farmers are key implementers of the
breed improvement practices introduced (Macoloo et al., 2013). Policies that facilitate farmer
0%
10%
20%
30%
40%
50%
60%
70%
80%
90%
100%
Goats Sheep Goats Sheep
KERICHO KISUMU
Per
cen
t of
house
hold
s
Own bred Bought from other farmerObtained through project Hired
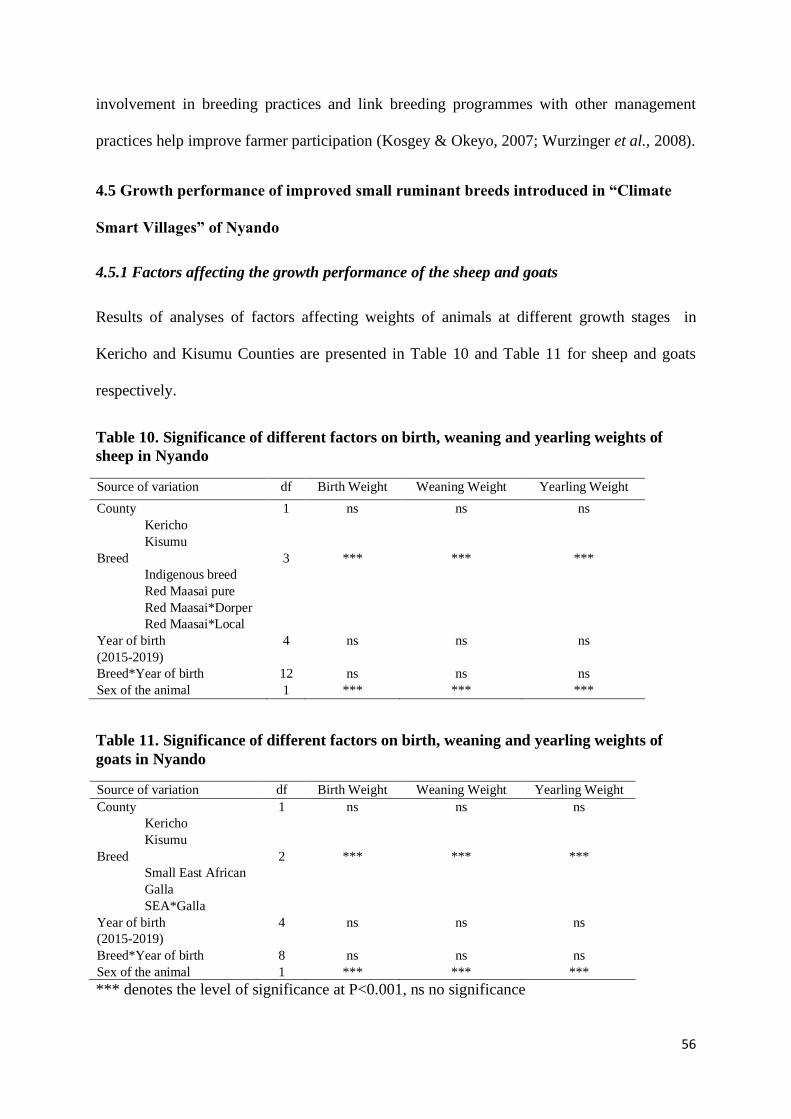
56
involvement in breeding practices and link breeding programmes with other management
practices help improve farmer participation (Kosgey & Okeyo, 2007; Wurzinger et al., 2008).
4.5 Growth performance of improved small ruminant breeds introduced in “Climate
Smart Villages” of Nyando
4.5.1 Factors affecting the growth performance of the sheep and goats
Results of analyses of factors affecting weights of animals at different growth stages in
Kericho and Kisumu Counties are presented in Table 10 and Table 11 for sheep and goats
respectively.
Table 10. Significance of different factors on birth, weaning and yearling weights of
sheep in Nyando
Source of variation df Birth Weight Weaning Weight Yearling Weight
County
Kericho
Kisumu
1 ns ns ns
Breed
Indigenous breed
Red Maasai pure
Red Maasai*Dorper
Red Maasai*Local
3 *** *** ***
Year of birth
(2015-2019)
4 ns ns ns
Breed*Year of birth 12 ns ns ns
Sex of the animal 1 *** *** ***
Table 11. Significance of different factors on birth, weaning and yearling weights of
goats in Nyando
Source of variation df Birth Weight Weaning Weight Yearling Weight
County
Kericho
Kisumu
1 ns ns ns
Breed
Small East African
Galla
SEA*Galla
2 *** *** ***
Year of birth
(2015-2019)
4 ns ns ns
Breed*Year of birth 8 ns ns ns
Sex of the animal 1 *** *** ***
*** denotes the level of significance at P<0.001, ns no significance
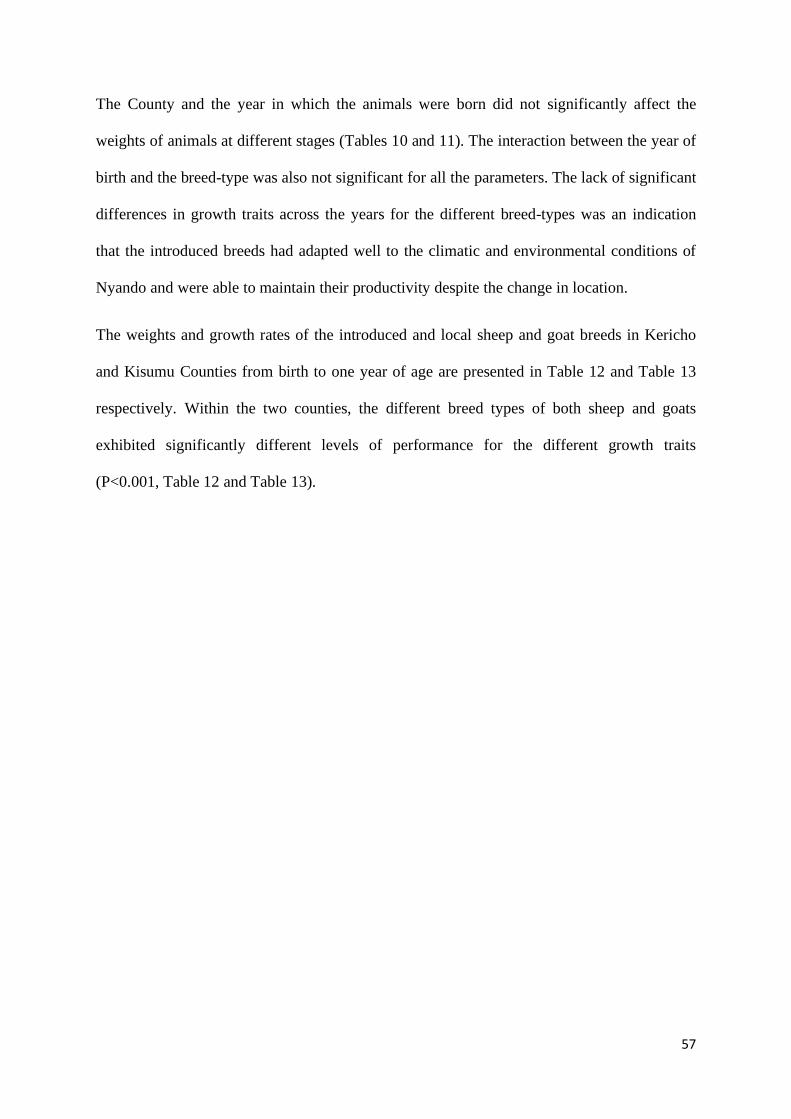
57
The County and the year in which the animals were born did not significantly affect the
weights of animals at different stages (Tables 10 and 11). The interaction between the year of
birth and the breed-type was also not significant for all the parameters. The lack of significant
differences in growth traits across the years for the different breed-types was an indication
that the introduced breeds had adapted well to the climatic and environmental conditions of
Nyando and were able to maintain their productivity despite the change in location.
The weights and growth rates of the introduced and local sheep and goat breeds in Kericho
and Kisumu Counties from birth to one year of age are presented in Table 12 and Table 13
respectively. Within the two counties, the different breed types of both sheep and goats
exhibited significantly different levels of performance for the different growth traits
(P<0.001, Table 12 and Table 13).
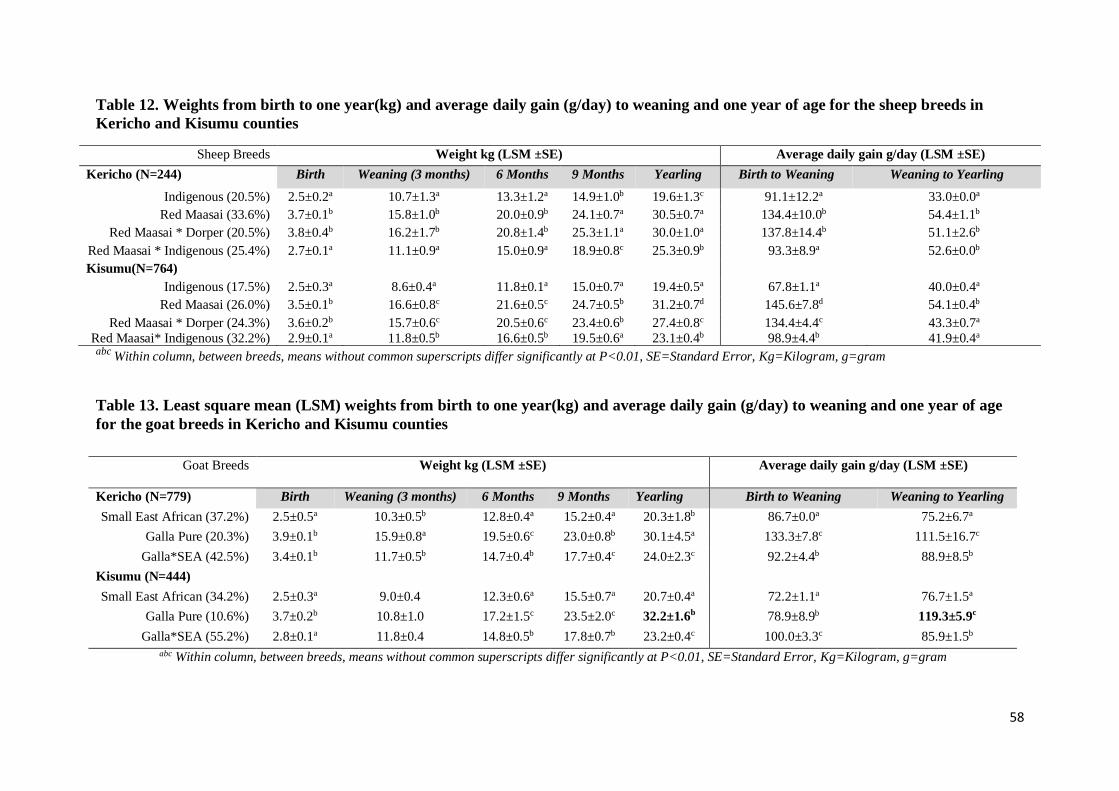
58
Table 12. Weights from birth to one year(kg) and average daily gain (g/day) to weaning and one year of age for the sheep breeds in
Kericho and Kisumu counties
Sheep Breeds Weight kg (LSM ±SE) Average daily gain g/day (LSM ±SE)
Kericho (N=244) Birth Weaning (3 months) 6 Months 9 Months Yearling Birth to Weaning Weaning to Yearling
Indigenous (20.5%) 2.5±0.2a 10.7±1.3a 13.3±1.2a 14.9±1.0b 19.6±1.3c 91.1±12.2a 33.0±0.0a
Red Maasai (33.6%) 3.7±0.1b 15.8±1.0b 20.0±0.9b 24.1±0.7a 30.5±0.7a 134.4±10.0b 54.4±1.1b
Red Maasai * Dorper (20.5%) 3.8±0.4b 16.2±1.7b 20.8±1.4b 25.3±1.1a 30.0±1.0a 137.8±14.4b 51.1±2.6b
Red Maasai * Indigenous (25.4%) 2.7±0.1a 11.1±0.9a 15.0±0.9a 18.9±0.8c 25.3±0.9b 93.3±8.9a 52.6±0.0b
Kisumu(N=764)
Indigenous (17.5%) 2.5±0.3a 8.6±0.4a 11.8±0.1a 15.0±0.7a 19.4±0.5a 67.8±1.1a 40.0±0.4a
Red Maasai (26.0%) 3.5±0.1b 16.6±0.8c 21.6±0.5c 24.7±0.5b 31.2±0.7d 145.6±7.8d 54.1±0.4b
Red Maasai * Dorper (24.3%) 3.6±0.2b 15.7±0.6c 20.5±0.6c 23.4±0.6b 27.4±0.8c 134.4±4.4c 43.3±0.7a
Red Maasai* Indigenous (32.2%) 2.9±0.1a 11.8±0.5b 16.6±0.5b 19.5±0.6a 23.1±0.4b 98.9±4.4b 41.9±0.4a
abc Within column, between breeds, means without common superscripts differ significantly at P<0.01, SE=Standard Error, Kg=Kilogram, g=gram
Table 13. Least square mean (LSM) weights from birth to one year(kg) and average daily gain (g/day) to weaning and one year of age
for the goat breeds in Kericho and Kisumu counties
Goat Breeds
Weight kg (LSM ±SE) Average daily gain g/day (LSM ±SE)
Kericho (N=779) Birth Weaning (3 months) 6 Months 9 Months Yearling Birth to Weaning Weaning to Yearling
Small East African (37.2%) 2.5±0.5a 10.3±0.5b 12.8±0.4a 15.2±0.4a 20.3±1.8b 86.7±0.0a 75.2±6.7a
Galla Pure (20.3%) 3.9±0.1b 15.9±0.8a 19.5±0.6c 23.0±0.8b 30.1±4.5a 133.3±7.8c 111.5±16.7c
Galla*SEA (42.5%) 3.4±0.1b 11.7±0.5b 14.7±0.4b 17.7±0.4c 24.0±2.3c 92.2±4.4b 88.9±8.5b
Kisumu (N=444)
Small East African (34.2%) 2.5±0.3a 9.0±0.4 12.3±0.6a 15.5±0.7a 20.7±0.4a 72.2±1.1a 76.7±1.5a
Galla Pure (10.6%) 3.7±0.2b 10.8±1.0 17.2±1.5c 23.5±2.0c 32.2±1.6b 78.9±8.9b 119.3±5.9c
Galla*SEA (55.2%) 2.8±0.1a 11.8±0.4 14.8±0.5b 17.8±0.7b 23.2±0.4c 100.0±3.3c 85.9±1.5b
abc Within column, between breeds, means without common superscripts differ significantly at P<0.01, SE=Standard Error, Kg=Kilogram, g=gram
59
4.5.2. Growth from birth to weaning
Birth weights of lambs ranged from 2.5 kg for the local indigenous sheep to 3.8 kg for the
introduced Red Maasai x Dorper animals (Table 12). Differences in lamb birth weights of were
not significant between counties. In both Counties, the kids from the indigenous Small East
African breed had the lowest birthweight while the introduced purebred Galla goats had the
highest (P<0.01). The average birth weights for goat breeds in Kericho and Kisumu were
3.3±0.2Kg and 3.0±0.2Kg respectively (Table 13).
Birth weight is strongly correlated with the mature size and weight of an animal (Fasae et al.,
2012). It also has a strong influence on the survival of animals, as animals with low birth weights
tend to have low survival rates in the early stages of their life compared to heavier ones (Morel et
al., 2008). Birth weights reported for lambs and kids from different sheep and goat breed types in
other countries of Africa are similar to those of this study. In Tanzania, local Pare white goats
are reported to have birth weights of 2.5 to 2.7 kg (Hyera et al., 2018). Lower birth weights have
been reported in South and West African Dwarf goat breeds (Fasae et al., 2012; Birteeb et al.,
2015). Boer goats and their crosses with indigenous breeds are reported to have moderate birth
weights when compared with pure indigenous breeds (Deribe et al., 2015). The improved breeds
had heavier newborns as weight at kidding/lambing have been reported to be highly correlated
with kids/lambs birth weight (Asmad et al., 2014; Paten et al., 2017).
The pre-weaning growth of animals is greatly dependent on the animal’s inherent genetic
potential and the mothering ability of its dam (Yiheyis et al., 2012). During growth from birth to
weaning at three months of age, animals have high nutritional requirements and are also highly
vulnerable to the infestation of external and internal parasites (Singh et al., 2017). It is therefore
important to ensure that the young animals are well-nourished. Among all the breeds of sheep in
60
Nyando, the indigenous animals had the lowest weight gain (P<0.01, Table 12). In Kericho, the
Red Maasai x Dorper cross and pure-bred Red Maasai sheep had the highest pre-weaning growth
rate, while in Kisumu, the Red Maasai x Dorper sheep had a significantly higher (P<0.01) pre-
weaning growth rate than the other breeds (Table 12).
In both Kericho and Kisumu, the introduced pure-bred Galla goats and their crosses with
indigenous breeds had significantly (P<0.01) higher growth rates from birth to weaning than the
indigenous Small East African goats. The improved breeds were selected based on their fast rate
of growth and early attainment of market weight (Ojango et al., 2018).
4.5.3. Growth from weaning to one year
In both Kisumu and Kericho Counties, the local indigenous sheep had significantly lower
weights at all stages of growth (P<0.01) compared to the introduced breeds and their crosses with
the local indigenous breeds (Table 12). Differences in weaning weights for the Red Maasai x
Dorper crosses and the pure Red Maasai breed were not significant. Among the goat breeds, the
indigenous Small East African had a significantly lower weaning weight (P<0.01) than the Galla
x Small East African crossbred and the purebred Galla (Table 13). In Kericho, the pure Galla
goats were significantly (P<0.01) heavier than all the other breeds at weaning. The weight of
animals at weaning is of high relative economic importance for livestock keepers as it indicates
the adaptability of the animals (Fasae et al., 2012). Both high and low weaning weights have
been reported for indigenous sheep breeds in Ethiopia, Nigeria, and Tanzania (Muhammad et al.,
2008; Mengistie et al., 2010; Lakew et al., 2014). In Ethiopia, indigenous Begait goat breeds
raised in semi intensive and extensive production systems were reported to have weights ranging
61
from 10.3 to 11.1Kg, and 20.6 to 24.1Kg at weaning and yearling stages respectively (Abraham
et al., 2018). Reports from studies on crossing indigenous goats in Tanzania, Uganda, and
Ethiopia with Boer goats from South Africa indicate that animals that have low weaning weights
also tend to have lower weights at one year of age (Ssewannyana et al., 2004; Hango et al.,
2007; Deribe et al., 2015; Girma, 2016).
It was notable that in both Kisumu and Kericho County, the pure-bred Red-Maasai sheep had the
highest rates of growth post-weaning, resulting in the animals having a significantly higher
(p<0.01) yearling weight than the Red-Maasai x Dorper animals in Kisumu county (Table 12).
The growth rates in Red Maasai and Red Maasai Dorper crosses was not different from that
reported for sheep raised under the semi-arid environments (König et al., 2017), an indication
that the breeds were adaptable to the Nyando environment.
The pure-bred Galla goats were heavier at weaning in Kericho County than in Kisumu County
(Table 13), however, the animals had good potential for growth resulting in larger animals at one
year of age. The pure-bred Galla goats were significantly (p<0.01) larger at one year of age in
Kisumu county than in Kericho county (Table 13).
Breed type and sex of an animal were the most important factors influencing yearling weights in
both sheep and goats. The sex of the animal had a significant effect on the yearling weight of
sheep and goats and male animals were heavier than the female animals. Several studies have
reported differences in the growth rate between male and female animals (Bela & Haile, 2009;
Tabreze, 2018; Ampong et al., 2019). The growth rate in indigenous Sokoto sheep breed in
Nigeria was also reported to be affected by the breed and sex of the animals (Muhammad et al.,
2008). The differences in growth rate between the male and female animals can be attributed to
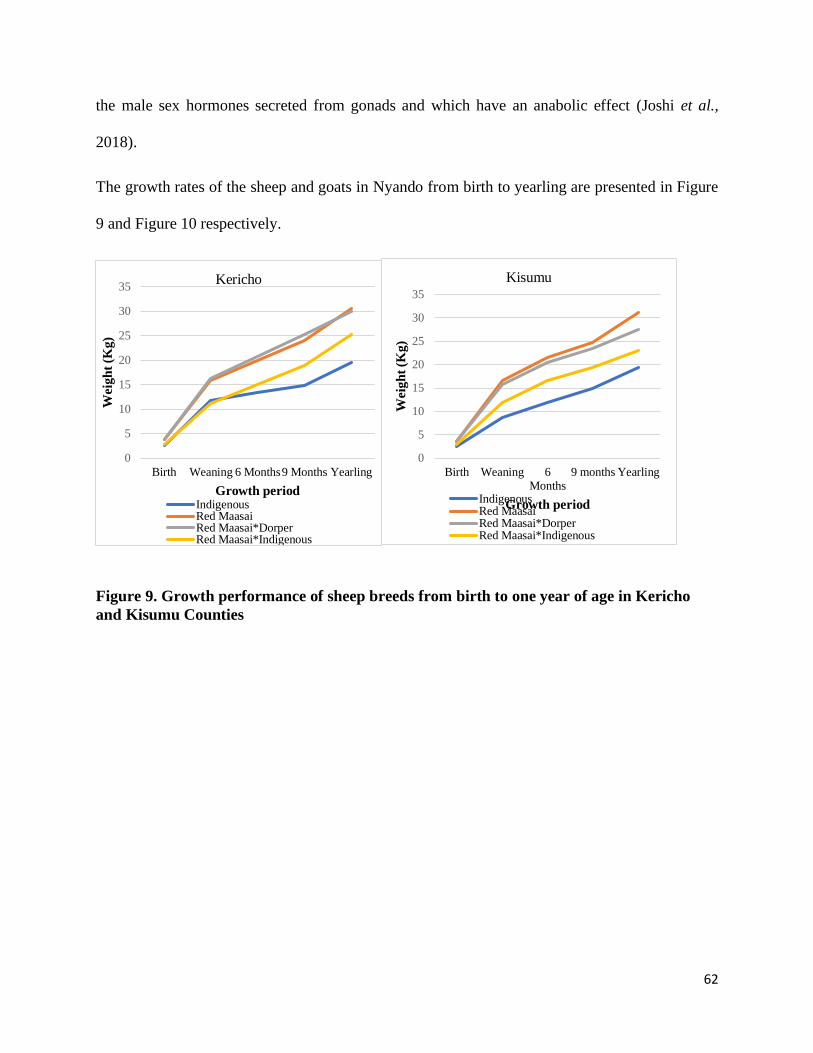
62
the male sex hormones secreted from gonads and which have an anabolic effect (Joshi et al.,
2018).
The growth rates of the sheep and goats in Nyando from birth to yearling are presented in Figure
9 and Figure 10 respectively.
Figure 9. Growth performance of sheep breeds from birth to one year of age in Kericho
and Kisumu Counties
0
5
10
15
20
25
30
35
Birth Weaning 6 Months9 Months Yearling
Weig
ht
(Kg)
Growth period
Kericho
IndigenousRed MaasaiRed Maasai*DorperRed Maasai*Indigenous
0
5
10
15
20
25
30
35
Birth Weaning 6Months
9 months Yearling
Weig
ht
(Kg
)
Growth period
Kisumu
IndigenousRed MaasaiRed Maasai*DorperRed Maasai*Indigenous
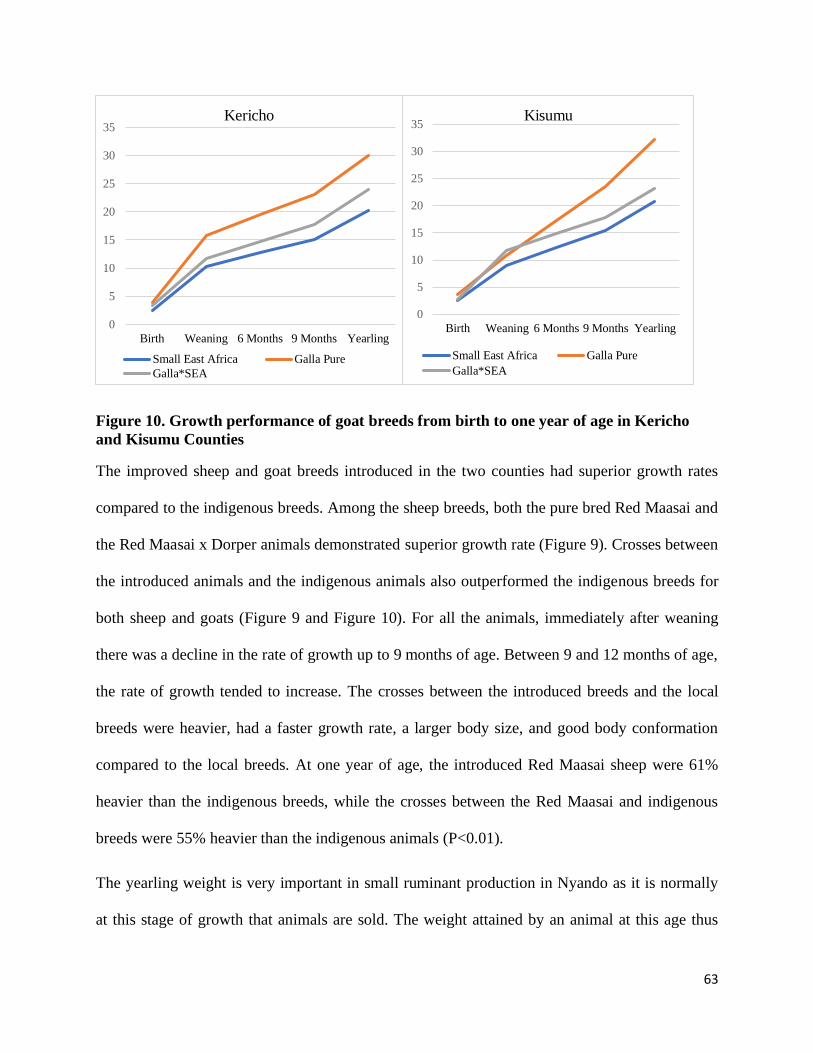
63
Figure 10. Growth performance of goat breeds from birth to one year of age in Kericho
and Kisumu Counties
The improved sheep and goat breeds introduced in the two counties had superior growth rates
compared to the indigenous breeds. Among the sheep breeds, both the pure bred Red Maasai and
the Red Maasai x Dorper animals demonstrated superior growth rate (Figure 9). Crosses between
the introduced animals and the indigenous animals also outperformed the indigenous breeds for
both sheep and goats (Figure 9 and Figure 10). For all the animals, immediately after weaning
there was a decline in the rate of growth up to 9 months of age. Between 9 and 12 months of age,
the rate of growth tended to increase. The crosses between the introduced breeds and the local
breeds were heavier, had a faster growth rate, a larger body size, and good body conformation
compared to the local breeds. At one year of age, the introduced Red Maasai sheep were 61%
heavier than the indigenous breeds, while the crosses between the Red Maasai and indigenous
breeds were 55% heavier than the indigenous animals (P<0.01).
The yearling weight is very important in small ruminant production in Nyando as it is normally
at this stage of growth that animals are sold. The weight attained by an animal at this age thus
0
5
10
15
20
25
30
35
Birth Weaning 6 Months 9 Months Yearling
Kericho
Small East Africa Galla Pure
Galla*SEA
0
5
10
15
20
25
30
35
Birth Weaning 6 Months 9 Months Yearling
Kisumu
Small East Africa Galla Pure
Galla*SEA
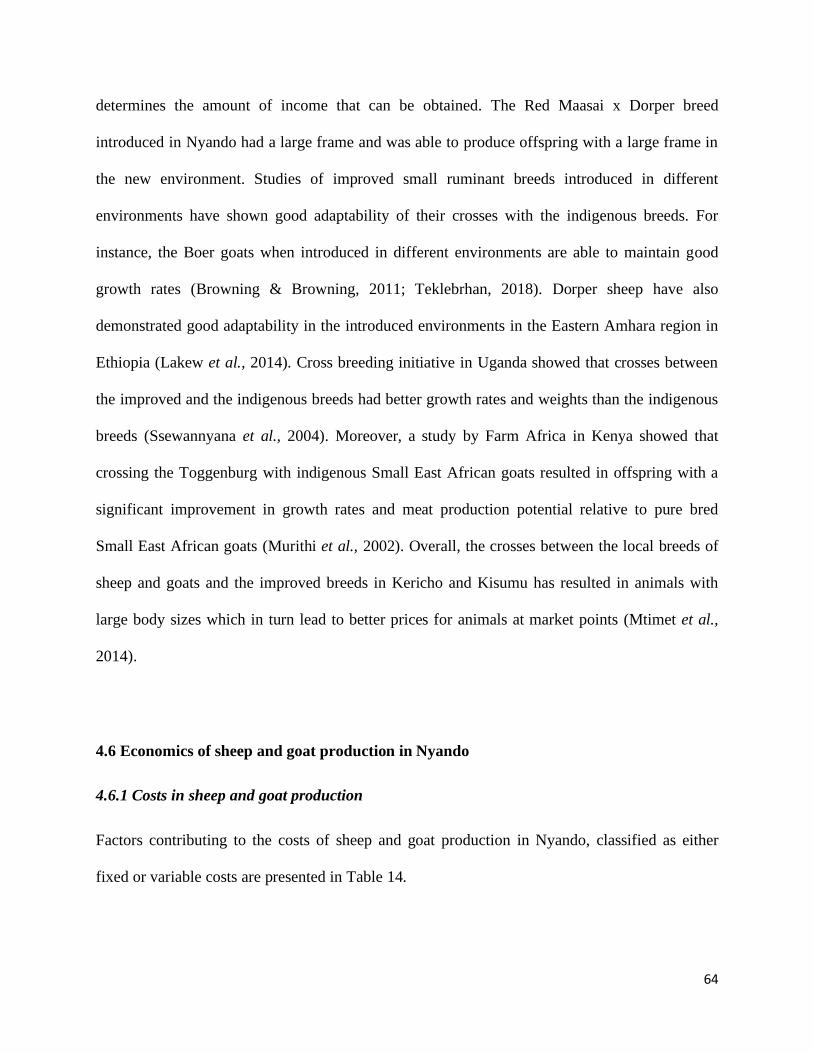
64
determines the amount of income that can be obtained. The Red Maasai x Dorper breed
introduced in Nyando had a large frame and was able to produce offspring with a large frame in
the new environment. Studies of improved small ruminant breeds introduced in different
environments have shown good adaptability of their crosses with the indigenous breeds. For
instance, the Boer goats when introduced in different environments are able to maintain good
growth rates (Browning & Browning, 2011; Teklebrhan, 2018). Dorper sheep have also
demonstrated good adaptability in the introduced environments in the Eastern Amhara region in
Ethiopia (Lakew et al., 2014). Cross breeding initiative in Uganda showed that crosses between
the improved and the indigenous breeds had better growth rates and weights than the indigenous
breeds (Ssewannyana et al., 2004). Moreover, a study by Farm Africa in Kenya showed that
crossing the Toggenburg with indigenous Small East African goats resulted in offspring with a
significant improvement in growth rates and meat production potential relative to pure bred
Small East African goats (Murithi et al., 2002). Overall, the crosses between the local breeds of
sheep and goats and the improved breeds in Kericho and Kisumu has resulted in animals with
large body sizes which in turn lead to better prices for animals at market points (Mtimet et al.,
2014).
4.6 Economics of sheep and goat production in Nyando
4.6.1 Costs in sheep and goat production
Factors contributing to the costs of sheep and goat production in Nyando, classified as either
fixed or variable costs are presented in Table 14.
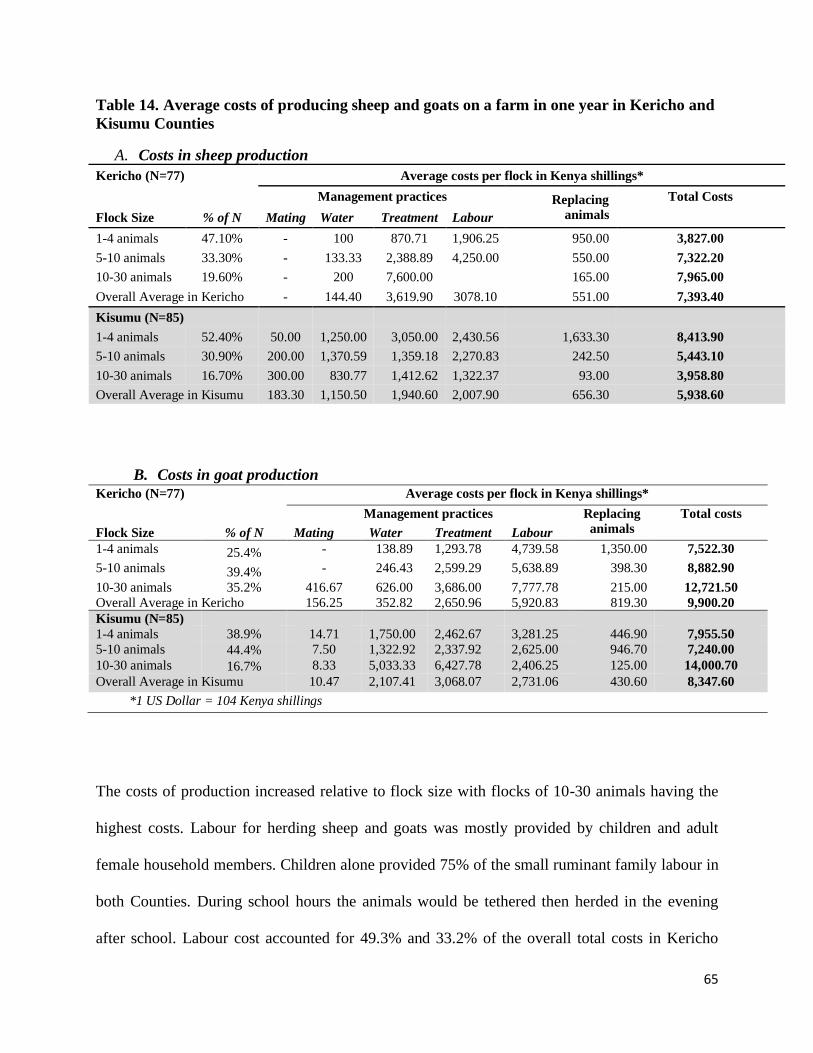
65
Table 14. Average costs of producing sheep and goats on a farm in one year in Kericho and
Kisumu Counties
A. Costs in sheep production
Kericho (N=77) Average costs per flock in Kenya shillings*
Management practices Replacing
animals
Total Costs
Flock Size % of N Mating Water Treatment Labour
1-4 animals 47.10% - 100 870.71 1,906.25 950.00 3,827.00
5-10 animals 33.30% - 133.33 2,388.89 4,250.00 550.00 7,322.20
10-30 animals 19.60% - 200 7,600.00 165.00 7,965.00
Overall Average in Kericho - 144.40 3,619.90 3078.10 551.00 7,393.40
Kisumu (N=85)
1-4 animals 52.40% 50.00 1,250.00 3,050.00 2,430.56 1,633.30 8,413.90
5-10 animals 30.90% 200.00 1,370.59 1,359.18 2,270.83 242.50 5,443.10
10-30 animals 16.70% 300.00 830.77 1,412.62 1,322.37 93.00 3,958.80
Overall Average in Kisumu 183.30 1,150.50 1,940.60 2,007.90 656.30 5,938.60
B. Costs in goat production
Kericho (N=77)
Average costs per flock in Kenya shillings*
Management practices Replacing
animals
Total costs
Flock Size % of N Mating Water Treatment Labour
1-4 animals 25.4% - 138.89 1,293.78 4,739.58 1,350.00 7,522.30
5-10 animals 39.4% - 246.43 2,599.29 5,638.89 398.30 8,882.90
10-30 animals 35.2% 416.67 626.00 3,686.00 7,777.78 215.00 12,721.50
Overall Average in Kericho 156.25 352.82 2,650.96 5,920.83 819.30 9,900.20
Kisumu (N=85)
1-4 animals 38.9% 14.71 1,750.00 2,462.67 3,281.25 446.90 7,955.50
5-10 animals 44.4% 7.50 1,322.92 2,337.92 2,625.00 946.70 7,240.00
10-30 animals 16.7% 8.33 5,033.33 6,427.78 2,406.25 125.00 14,000.70
Overall Average in Kisumu 10.47 2,107.41 3,068.07 2,731.06 430.60 8,347.60
*1 US Dollar = 104 Kenya shillings
The costs of production increased relative to flock size with flocks of 10-30 animals having the
highest costs. Labour for herding sheep and goats was mostly provided by children and adult
female household members. Children alone provided 75% of the small ruminant family labour in
both Counties. During school hours the animals would be tethered then herded in the evening
after school. Labour cost accounted for 49.3% and 33.2% of the overall total costs in Kericho
66
and Kisumu respectively (Table 14). Other studies have highlighted the role played by women
and children in the provision of labour for small ruminant production (Oluwatayo & Oluwatayo,
2012). Kumar & Deoghare, (2003) reported family labour to be an important contributor to costs
in livestock production.
Variable costs comprised costs for water, animal health services, flock replacement, and
breeding (Table 14). These accounted for a higher share of the overall total costs in both
counties, Kericho (50.7%) and Kisumu (66.8%) compared to the fixed costs. Other studies in
smallholder systems have described variable costs to be the foremost contributor to production
costs in sheep and goat production (Al-Khalidi et al., 2013; Al-Khaza’leh et al., 2015).
Costs for water differed significantly (P<0.01) between the two counties, accounting for 6.8%
and 32.5% of the variable costs in Kericho and Kisumu respectively.In relation to the overall
costs of production water accounted for 2.7% and 22.9% of the costs in Kericho and Kisumu
Counties respectively (Table 14). The high costs of water in Kisumu can be attributed to the high
dependance of piped water which was primarily the main source of water (Figure 3). Water
availability is a great challenge in Nyando area due to increased drought occurrences resulting
from climate change (Masese et al., 2008).
Animal health costs did not differ significantly between the two counties but accounted for a
large proportion of costs, 69% and 50% of the total variable cost and 37.7% and 34.3% of the
overall total costs of production in Kericho and Kisumu respectively. Disease control rather than
treatment should be emphasized as a strategy of lowering production costs. Other studies have
recommended enhanced disease management strategies as a way of improving productivity as
manifested in growth (Delia et al., 2015; Ayantunde, 2016; Gitonga et al., 2016).
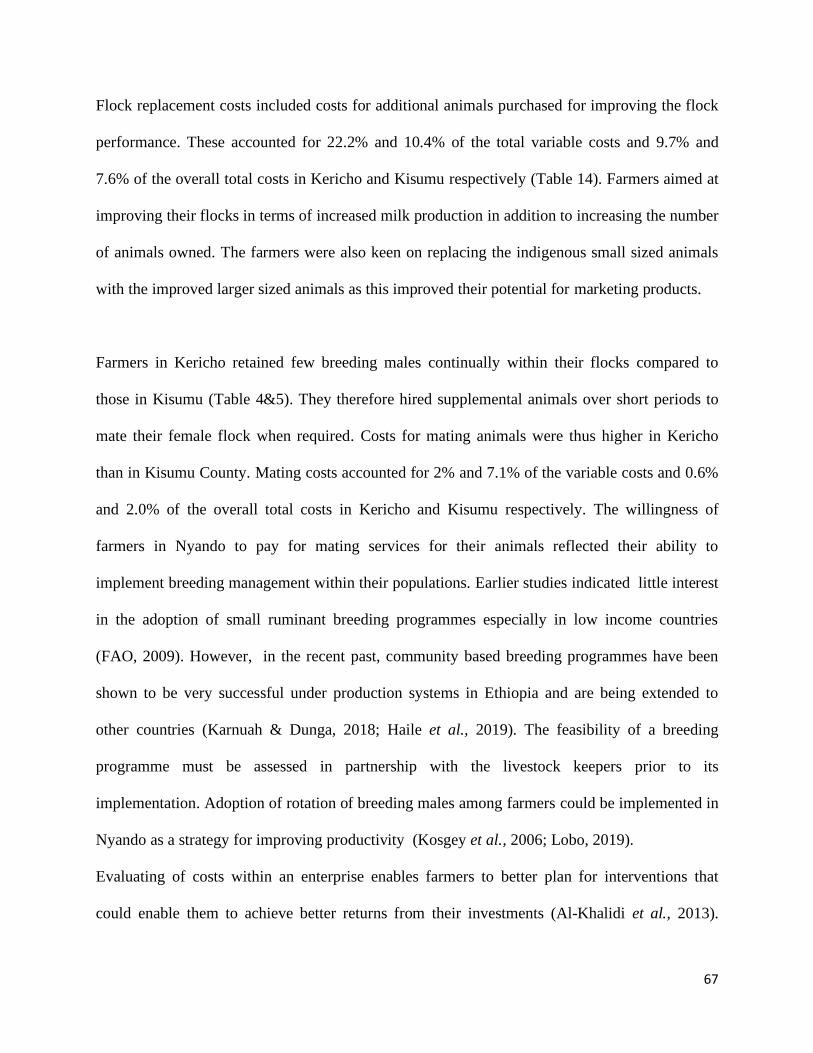
67
Flock replacement costs included costs for additional animals purchased for improving the flock
performance. These accounted for 22.2% and 10.4% of the total variable costs and 9.7% and
7.6% of the overall total costs in Kericho and Kisumu respectively (Table 14). Farmers aimed at
improving their flocks in terms of increased milk production in addition to increasing the number
of animals owned. The farmers were also keen on replacing the indigenous small sized animals
with the improved larger sized animals as this improved their potential for marketing products.
Farmers in Kericho retained few breeding males continually within their flocks compared to
those in Kisumu (Table 4&5). They therefore hired supplemental animals over short periods to
mate their female flock when required. Costs for mating animals were thus higher in Kericho
than in Kisumu County. Mating costs accounted for 2% and 7.1% of the variable costs and 0.6%
and 2.0% of the overall total costs in Kericho and Kisumu respectively. The willingness of
farmers in Nyando to pay for mating services for their animals reflected their ability to
implement breeding management within their populations. Earlier studies indicated little interest
in the adoption of small ruminant breeding programmes especially in low income countries
(FAO, 2009). However, in the recent past, community based breeding programmes have been
shown to be very successful under production systems in Ethiopia and are being extended to
other countries (Karnuah & Dunga, 2018; Haile et al., 2019). The feasibility of a breeding
programme must be assessed in partnership with the livestock keepers prior to its
implementation. Adoption of rotation of breeding males among farmers could be implemented in
Nyando as a strategy for improving productivity (Kosgey et al., 2006; Lobo, 2019).
Evaluating of costs within an enterprise enables farmers to better plan for interventions that
could enable them to achieve better returns from their investments (Al-Khalidi et al., 2013).
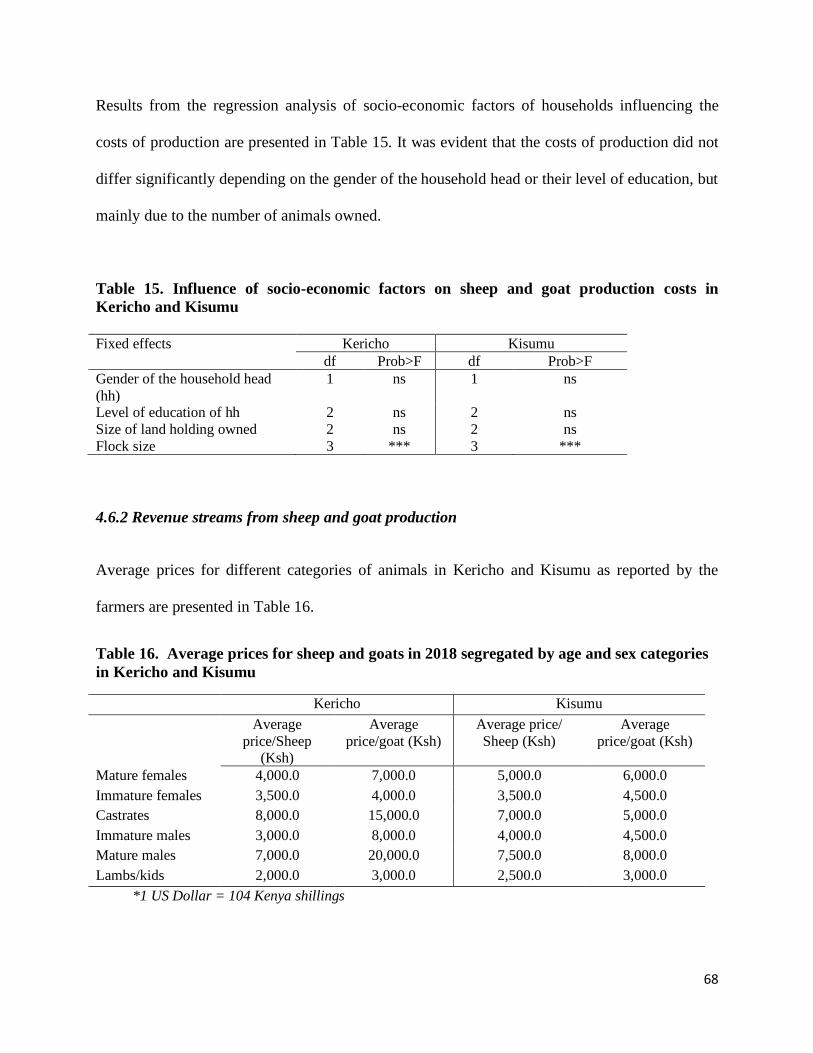
68
Results from the regression analysis of socio-economic factors of households influencing the
costs of production are presented in Table 15. It was evident that the costs of production did not
differ significantly depending on the gender of the household head or their level of education, but
mainly due to the number of animals owned.
Table 15. Influence of socio-economic factors on sheep and goat production costs in
Kericho and Kisumu
Fixed effects Kericho Kisumu
df Prob>F df Prob>F
Gender of the household head
(hh)
1 ns 1 ns
Level of education of hh 2 ns 2 ns
Size of land holding owned 2 ns 2 ns
Flock size 3 *** 3 ***
4.6.2 Revenue streams from sheep and goat production
Average prices for different categories of animals in Kericho and Kisumu as reported by the
farmers are presented in Table 16.
Table 16. Average prices for sheep and goats in 2018 segregated by age and sex categories
in Kericho and Kisumu
Kericho Kisumu Average
price/Sheep (Ksh)
Average
price/goat (Ksh) Average price/
Sheep (Ksh) Average
price/goat (Ksh)
Mature females 4,000.0 7,000.0 5,000.0 6,000.0
Immature females 3,500.0 4,000.0 3,500.0 4,500.0
Castrates 8,000.0 15,000.0 7,000.0 5,000.0
Immature males 3,000.0 8,000.0 4,000.0 4,500.0
Mature males 7,000.0 20,000.0 7,500.0 8,000.0
Lambs/kids 2,000.0 3,000.0 2,500.0 3,000.0
*1 US Dollar = 104 Kenya shillings
69
The price of animals was higher for larger mature animals than smaller and young animals
(Table 16). It was noted that the animals attracted better prices (Table 16) compared to those
reported for animals in the same region in 2016 by Ojango et al., (2018). During the FGD, the
farmers attributed the higher prices to cross breeding of the local animals with the improved
breeds which yielded a larger sized animal which attracted much higher market prices.
Revenue streams from sheep and goat for farms in the two counties are presented in Table 17
and Table 18 respectively. Revenues from sale of stock were the primary contributor to the total
income from both sheep and goats in Kericho and Kisumu, representing 82% and 75.1% of the
incomes respectively (Table 17 and 18).
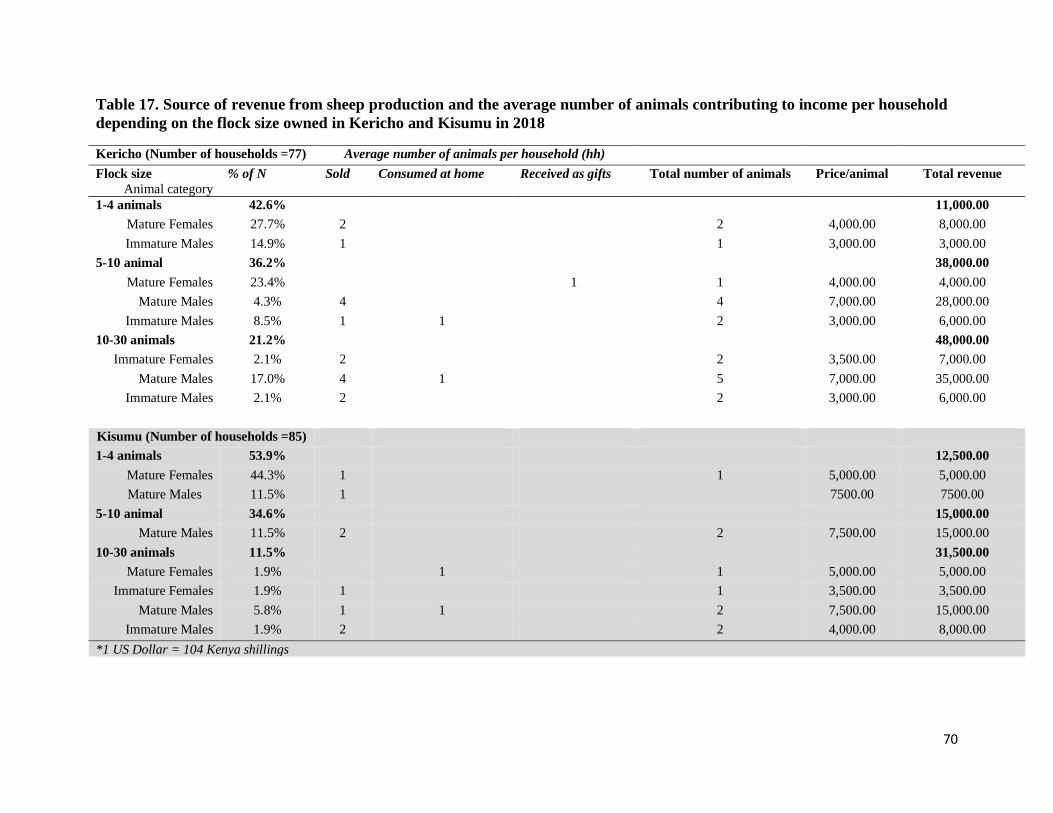
70
Table 17. Source of revenue from sheep production and the average number of animals contributing to income per household
depending on the flock size owned in Kericho and Kisumu in 2018
Kericho (Number of households =77) Average number of animals per household (hh)
Flock size
Animal category
% of N Sold Consumed at home Received as gifts Total number of animals Price/animal Total revenue
1-4 animals 42.6%
11,000.00
Mature Females 27.7% 2
2 4,000.00 8,000.00
Immature Males 14.9% 1
1 3,000.00 3,000.00
5-10 animal 36.2%
38,000.00
Mature Females 23.4%
1 1 4,000.00 4,000.00
Mature Males 4.3% 4
4 7,000.00 28,000.00
Immature Males 8.5% 1 1
2 3,000.00 6,000.00
10-30 animals 21.2%
48,000.00
Immature Females 2.1% 2
2 3,500.00 7,000.00
Mature Males 17.0% 4 1
5 7,000.00 35,000.00
Immature Males 2.1% 2
2 3,000.00 6,000.00
Kisumu (Number of households =85)
1-4 animals 53.9% 12,500.00
Mature Females 44.3% 1 1 5,000.00 5,000.00
Mature Males 11.5% 1 7500.00 7500.00
5-10 animal 34.6% 15,000.00
Mature Males 11.5% 2 2 7,500.00 15,000.00
10-30 animals 11.5% 31,500.00
Mature Females 1.9% 1 1 5,000.00 5,000.00
Immature Females 1.9% 1 1 3,500.00 3,500.00
Mature Males 5.8% 1 1 2 7,500.00 15,000.00
Immature Males 1.9% 2 2 4,000.00 8,000.00
*1 US Dollar = 104 Kenya shillings
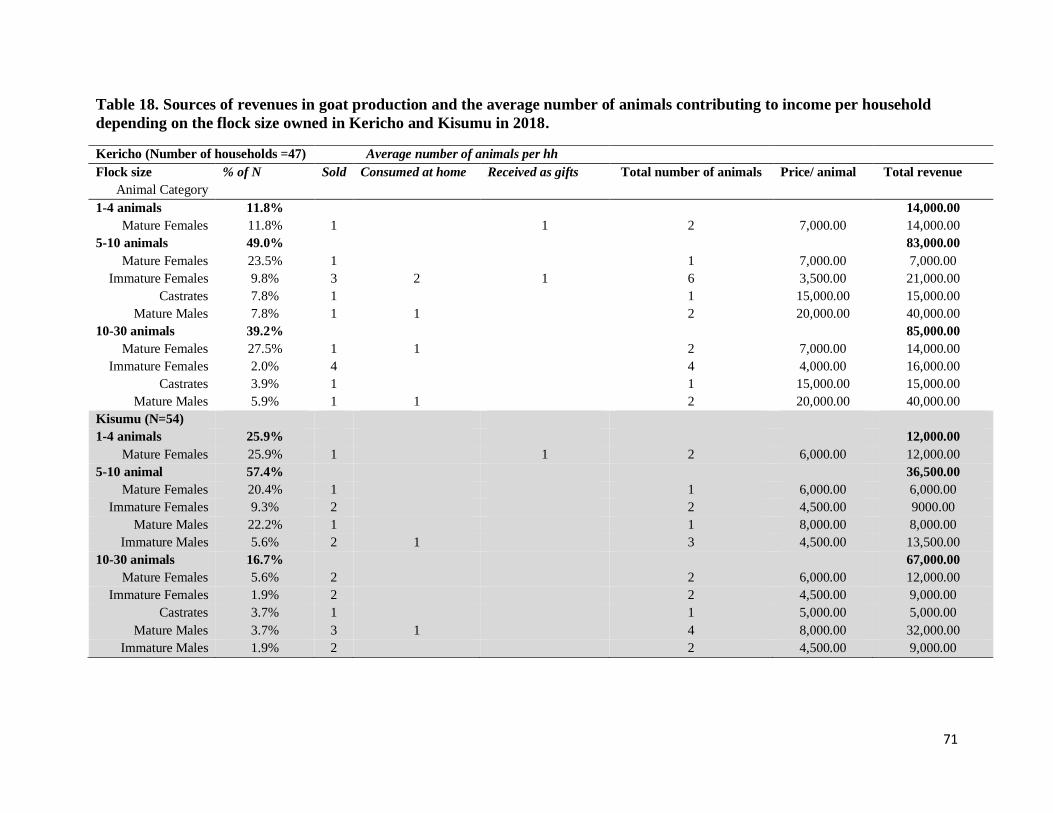
71
Table 18. Sources of revenues in goat production and the average number of animals contributing to income per household
depending on the flock size owned in Kericho and Kisumu in 2018.
Kericho (Number of households =47) Average number of animals per hh
Flock size
Animal Category
% of N Sold Consumed at home Received as gifts Total number of animals Price/ animal Total revenue
1-4 animals 11.8%
14,000.00
Mature Females 11.8% 1
1 2 7,000.00 14,000.00
5-10 animals 49.0%
83,000.00
Mature Females 23.5% 1
1 7,000.00 7,000.00
Immature Females 9.8% 3 2 1 6 3,500.00 21,000.00
Castrates 7.8% 1
1 15,000.00 15,000.00
Mature Males 7.8% 1 1
2 20,000.00 40,000.00
10-30 animals 39.2%
85,000.00
Mature Females 27.5% 1 1
2 7,000.00 14,000.00
Immature Females 2.0% 4
4 4,000.00 16,000.00
Castrates 3.9% 1
1 15,000.00 15,000.00
Mature Males 5.9% 1 1
2 20,000.00 40,000.00
Kisumu (N=54)
1-4 animals 25.9% 12,000.00
Mature Females 25.9% 1 1 2 6,000.00 12,000.00
5-10 animal 57.4% 36,500.00
Mature Females 20.4% 1 1 6,000.00 6,000.00
Immature Females 9.3% 2 2 4,500.00 9000.00
Mature Males 22.2% 1 1 8,000.00 8,000.00
Immature Males 5.6% 2 1 3 4,500.00 13,500.00
10-30 animals 16.7% 67,000.00
Mature Females 5.6% 2 2 6,000.00 12,000.00
Immature Females 1.9% 2 2 4,500.00 9,000.00
Castrates 3.7% 1 1 5,000.00 5,000.00
Mature Males 3.7% 3 1 4 8,000.00 32,000.00
Immature Males 1.9% 2 2 4,500.00 9,000.00
72
The sale price for animals in Nyando depended on age, sex, body weight, and the season in
which animals were sold. Households owning goat flocks earned greater returns compared to
those owning either only sheep or and both sheep and goat flocks. Seventy percent of the
animals sold were mature (Tables 17 and 18). During the FGD farmers indicated that animals
were sold to generate income for specific needs. Both male and female animals were sold
depending on their availability and the anticipated sale price. Though a higher number of
mature female animals (39.3%) were sold than male animals (30.5%) in both counties, the
difference was not significant. The farmers indicated that they desired to retain the female
animals, however, if there was no other animal ready for sale at the time of need, they would
sell the female one. The farmers in both counties sold significantly (P<0.01) more animals of
improved breeds of both sheep and goats than the indigenous breed-types. The improved
breeds were reported to have faster growth rates and larger mature body size.
Though the farmers tended to sell their animals when cash was needed for specific purposes
at any time of the year, peak marketing times for the small ruminants were during festive
seasons: Easter (April) and the Christmas & New year (December) holidays as illustrated in
Figure 6. During the FGD, farmers indicated that better prices were offered for animals
during the wet season relative to the dry season. A study on marketing practices for small
ruminants in Ethiopia also reported peak sale times for sheep and goats during festive seasons
(Legesse et al., 2008). The farmers in Nyando noted through the FGD that they sell animals
in the event of need rather than for making a profit. In the study by Legesse et al., (2010) it
was also noted that smallholder rural farmers tend to dispose animals in times of need or
climate challenges rather than to provide a regular household income or for profit.
Sheep and goats consumed at home represented 7.2% and 13.8% of the total revenues in
Kericho and Kisumu respectively. In the FGD it was established that farmers tended to
consume more of the local breeds at home as culled animals since they had lower mature
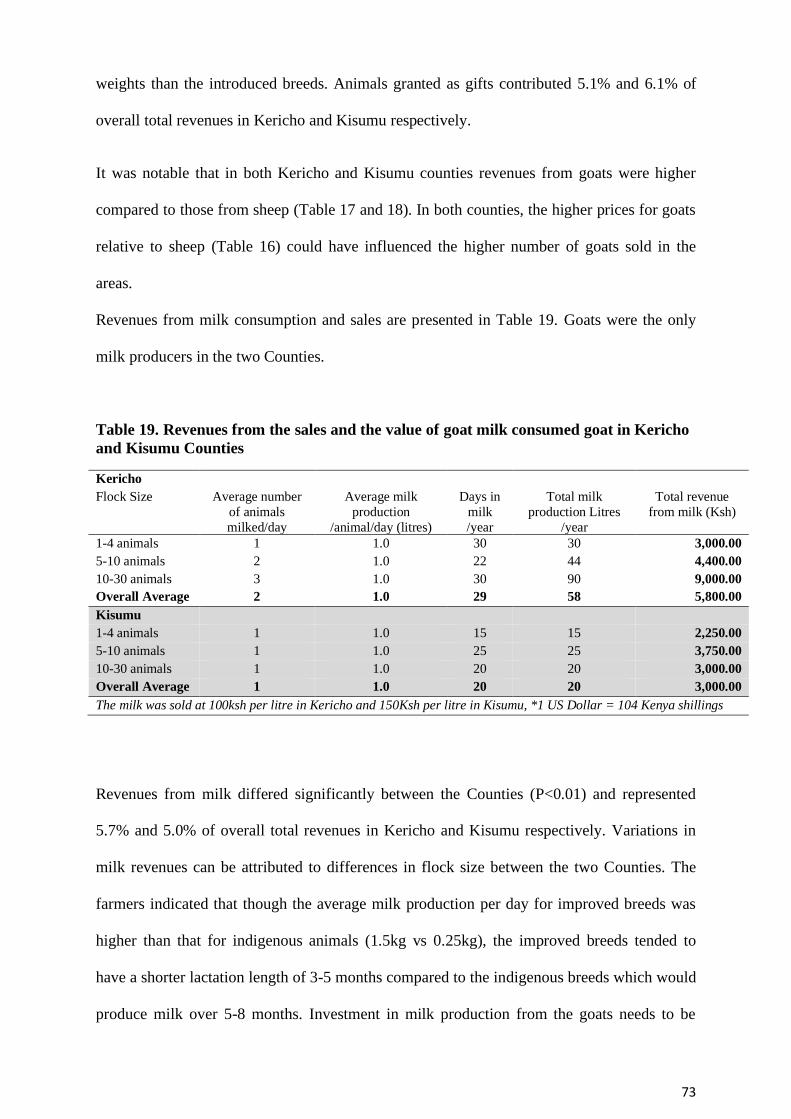
73
weights than the introduced breeds. Animals granted as gifts contributed 5.1% and 6.1% of
overall total revenues in Kericho and Kisumu respectively.
It was notable that in both Kericho and Kisumu counties revenues from goats were higher
compared to those from sheep (Table 17 and 18). In both counties, the higher prices for goats
relative to sheep (Table 16) could have influenced the higher number of goats sold in the
areas.
Revenues from milk consumption and sales are presented in Table 19. Goats were the only
milk producers in the two Counties.
Table 19. Revenues from the sales and the value of goat milk consumed goat in Kericho
and Kisumu Counties
Kericho
Flock Size Average number
of animals
milked/day
Average milk
production
/animal/day (litres)
Days in
milk
/year
Total milk
production Litres
/year
Total revenue
from milk (Ksh)
1-4 animals 1 1.0 30 30 3,000.00
5-10 animals 2 1.0 22 44 4,400.00
10-30 animals 3 1.0 30 90 9,000.00
Overall Average 2 1.0 29 58 5,800.00
Kisumu
1-4 animals 1 1.0 15 15 2,250.00
5-10 animals 1 1.0 25 25 3,750.00
10-30 animals 1 1.0 20 20 3,000.00
Overall Average 1 1.0 20 20 3,000.00
The milk was sold at 100ksh per litre in Kericho and 150Ksh per litre in Kisumu, *1 US Dollar = 104 Kenya shillings
Revenues from milk differed significantly between the Counties (P<0.01) and represented
5.7% and 5.0% of overall total revenues in Kericho and Kisumu respectively. Variations in
milk revenues can be attributed to differences in flock size between the two Counties. The
farmers indicated that though the average milk production per day for improved breeds was
higher than that for indigenous animals (1.5kg vs 0.25kg), the improved breeds tended to
have a shorter lactation length of 3-5 months compared to the indigenous breeds which would
produce milk over 5-8 months. Investment in milk production from the goats needs to be
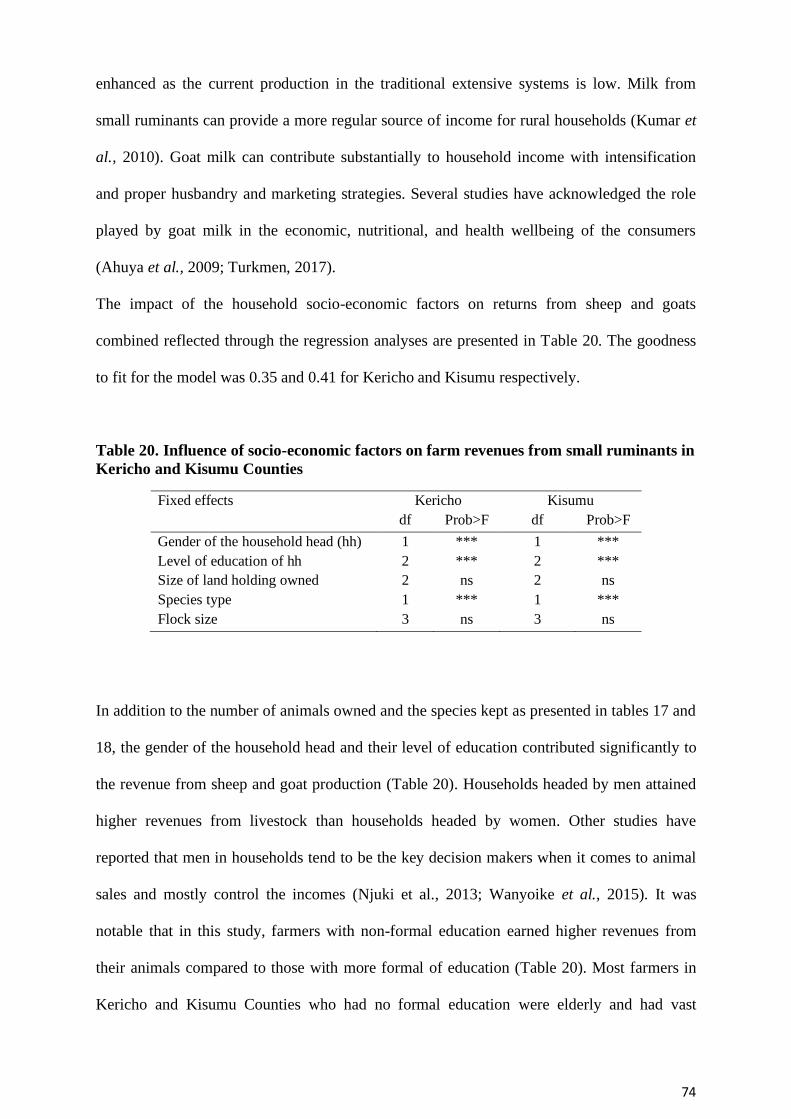
74
enhanced as the current production in the traditional extensive systems is low. Milk from
small ruminants can provide a more regular source of income for rural households (Kumar et
al., 2010). Goat milk can contribute substantially to household income with intensification
and proper husbandry and marketing strategies. Several studies have acknowledged the role
played by goat milk in the economic, nutritional, and health wellbeing of the consumers
(Ahuya et al., 2009; Turkmen, 2017).
The impact of the household socio-economic factors on returns from sheep and goats
combined reflected through the regression analyses are presented in Table 20. The goodness
to fit for the model was 0.35 and 0.41 for Kericho and Kisumu respectively.
Table 20. Influence of socio-economic factors on farm revenues from small ruminants in
Kericho and Kisumu Counties
Fixed effects Kericho Kisumu
df Prob>F df Prob>F
Gender of the household head (hh) 1 *** 1 ***
Level of education of hh 2 *** 2 ***
Size of land holding owned 2 ns 2 ns
Species type 1 *** 1 ***
Flock size 3 ns 3 ns
In addition to the number of animals owned and the species kept as presented in tables 17 and
18, the gender of the household head and their level of education contributed significantly to
the revenue from sheep and goat production (Table 20). Households headed by men attained
higher revenues from livestock than households headed by women. Other studies have
reported that men in households tend to be the key decision makers when it comes to animal
sales and mostly control the incomes (Njuki et al., 2013; Wanyoike et al., 2015). It was
notable that in this study, farmers with non-formal education earned higher revenues from
their animals compared to those with more formal of education (Table 20). Most farmers in
Kericho and Kisumu Counties who had no formal education were elderly and had vast
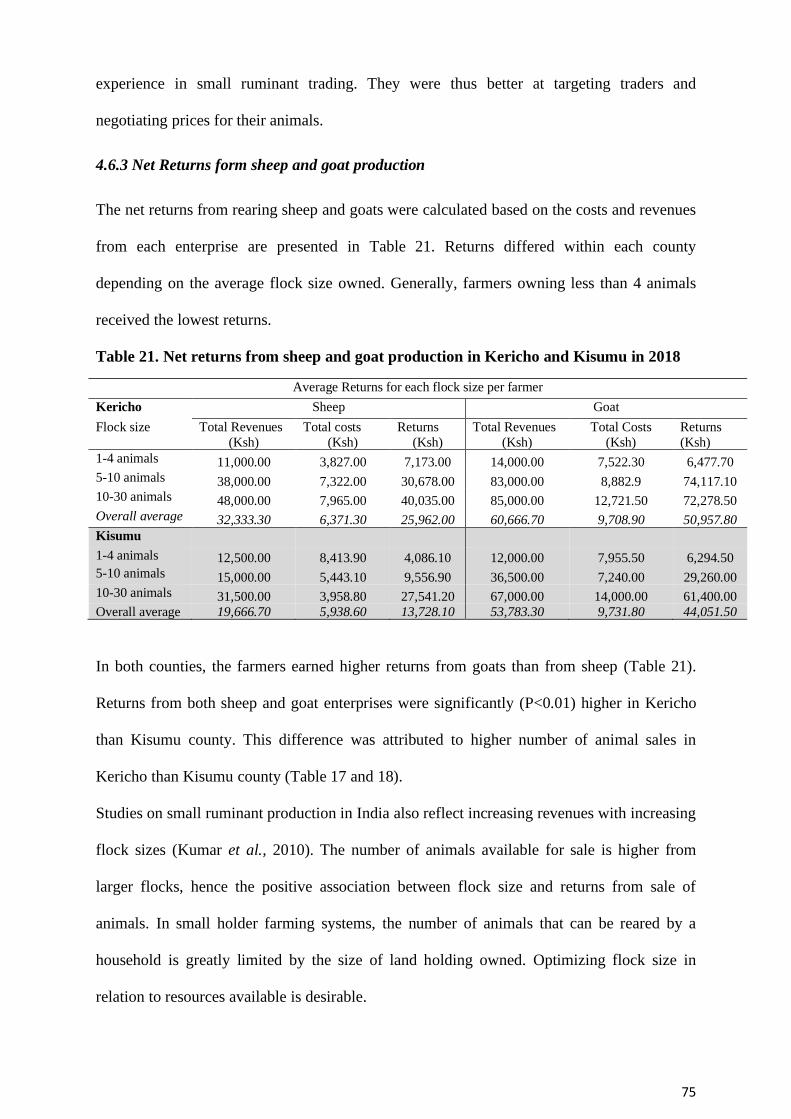
75
experience in small ruminant trading. They were thus better at targeting traders and
negotiating prices for their animals.
4.6.3 Net Returns form sheep and goat production
The net returns from rearing sheep and goats were calculated based on the costs and revenues
from each enterprise are presented in Table 21. Returns differed within each county
depending on the average flock size owned. Generally, farmers owning less than 4 animals
received the lowest returns.
Table 21. Net returns from sheep and goat production in Kericho and Kisumu in 2018
Average Returns for each flock size per farmer
Kericho Sheep Goat
Flock size Total Revenues
(Ksh)
Total costs
(Ksh)
Returns
(Ksh)
Total Revenues
(Ksh)
Total Costs
(Ksh)
Returns
(Ksh)
1-4 animals 11,000.00 3,827.00 7,173.00 14,000.00 7,522.30 6,477.70
5-10 animals 38,000.00 7,322.00 30,678.00 83,000.00 8,882.9 74,117.10 10-30 animals 48,000.00 7,965.00 40,035.00 85,000.00 12,721.50 72,278.50
Overall average 32,333.30 6,371.30 25,962.00 60,666.70 9,708.90 50,957.80
Kisumu
1-4 animals 12,500.00 8,413.90 4,086.10 12,000.00 7,955.50 6,294.50
5-10 animals 15,000.00 5,443.10 9,556.90 36,500.00 7,240.00 29,260.00
10-30 animals 31,500.00 3,958.80 27,541.20 67,000.00 14,000.00 61,400.00
Overall average 19,666.70 5,938.60 13,728.10 53,783.30 9,731.80 44,051.50
In both counties, the farmers earned higher returns from goats than from sheep (Table 21).
Returns from both sheep and goat enterprises were significantly (P<0.01) higher in Kericho
than Kisumu county. This difference was attributed to higher number of animal sales in
Kericho than Kisumu county (Table 17 and 18).
Studies on small ruminant production in India also reflect increasing revenues with increasing
flock sizes (Kumar et al., 2010). The number of animals available for sale is higher from
larger flocks, hence the positive association between flock size and returns from sale of
animals. In small holder farming systems, the number of animals that can be reared by a
household is greatly limited by the size of land holding owned. Optimizing flock size in
relation to resources available is desirable.
76
CHAPTER FIVE: CONCLUSION AND RECOMMENDATIONS
Conclusion
1. The improved breeds of sheep and goats introduced in the CSV of Nyando made a
significant contribution to the incomes of the smallholder farmers in the area. Most
revenue (82% and 75.1% of the total revenues in Kericho and Kisumu) came from the
sale of live animals. The improved breed-types for both sheep and goats introduced
through CCAFS fetched better prices.
2. The improved purebred Red Maasai and the ¾ Red Maasai crossed to Dorper sheep
breeds, and the Galla goats breeds and its crosses with local breeds had superior growth
performance. Results obtained in the CSV demonstrate the benefit of cross breeding using
improved indigenous breeds of small ruminants as an intervention to improve livestock
productivity under challenging environmental conditions.
Recommendations
1. The growth rates of the introduced breeds can be improved by training of farmers on the
importance of improved fodder.
2. Improved feeds should be introduced to match the genetics of the introduced breeds.
3. Value addition in goat milk should be implemented as a way of improving income.
77
REFERENCES
1. Abdi, O. A., Glover, E. K. and Luukkanen, O. (2013): Causes and Impacts of Land
Degradation and Desertification: Case Study of the Sudan. International Journal of
Agriculture and Forestry 3(2), 40–51. https://doi.org/10.5923/j.ijaf.20130302.03 .
2. Abdilatif, M. H., Onono, J. O. and Mutua, F. K. (2018): Analysis of pastoralists’
perception on challenges and opportunities for sheep and goat production in Northern
Kenya. Tropical Animal Health and Production 50(7), 1701–1710
https://doi.org/10.1007/s11250-018-1613-8 .
3. Abegaz, S., Duguma, G., Negussie, E., Gelmesa, U., Terefe, F., and Rege, J. (2002):
Factors affecting reproductive performance and estimates of genetic parameters of
litter size in Horro sheep. Journal of Agricultural Science (UK) 139(1):79–85
4. Abraham, H., Gizaw, S. and Urge, M. (2019): Growth and reproductive performances
of Begait goat under semi intensive and extensive management in western Tigray,
north Ethiopia. Livestock Research for Rural Development. Volume 31, Article #32.
http://www.lrrd.org/lrrd31/3/hagsa31032.html .
5. Acock, A. C. (2005): SAS, Stata, SPSS: A comparison. Journal of Marriage and the
Family, Vol. 67, 1093–1095.
6. Adama, K., Amadou, T., Isidoro, B. G., Man, N., Hamidou, T. H. and Gaston, B. M.
A. M. (2011): Constraints of small ruminant production among farming systems in
peri urban area of Ouagadougou , Burkina Faso (West Africa). Advances in Applied
Science Research 2 (6):588-594.
7. Adams, F. (2015): Socio-economic analysis of small ruminant livestock production in
northern Ghana. Kwame Nkrumah University of science& technology, Department of
Agricultural Economics, Agribusiness &Extension. Faculty of Agriculture, Kumasi-
Ghana.
8. Ådnøy, T. (2014): Strategies for improving productivity in small ruminants. 65th
EAPP Conference held in August 2014 at Norwegian University of Life Sciences
9. Agrawal, A. R., Karim, S. A., Kumar, R., Sahoo, A. and John, P. J. (2014): Sheep and
goat production: basic differences, impact on climate and molecular tools for rumen
microbiome study. International Journal of Current Microbiology and Applied
Sciences 3(1): 684-706.
10. Ahuya, C. O., Ojango, J. M. K., Mosi, R. O., Peacock, C. P. and Okeyo, A. M. (2009):
Performance of Toggenburg dairy goats in smallholder production systems of the
eastern highlands of Kenya. Small Ruminant Research 83, 7–13.
11. Alade, N., Mbap, S. and Aliyu, J. (2008): Genetic and Environmental Factors
Affecting Growth Traits of Goats in Semi-Arid Area Of Nigeria. Global Journal of
Agricultural Sciences 7, 85–91. https://doi.org/10.4314/gjass.v7i1.2365.
12. Alam, R. M. (2000): Goat rearing in the smallholder farming systems in Bangladesh.
Conference on Goats, 15-21 May, 2000, Tours, France, 329–330.
13. Alarcon, P., Fèvre, E. M., Murungi, M. K., Muinde, P., Akoko, J., Dominguez-Salas,
P., Kiambi, S., Ahmed, S., Häsler, B. and Rushton, J. (2017): Mapping of beef, sheep
and goat food systems in Nairobi - A framework for policy making and the
identification of structural vulnerabilities and deficiencies. Agricultural systems 152,
1–17. https://doi.org/10.1016/j.agsy.2016.12.005 .
14. Alary V., Aboul-Naga A., El Shafie M., Abdelkrim N., Hamdon H. and Metawi H.
(2015): Roles of small ruminants in rural livelihood improvement – Comparative
analysis in Egypt. Rev. Elev. Med. Vet. Pays Trop., 68 (2-3): 79-85.
78
15. Alemayehu, G. (2015): Quality Constraints in the Market Chains for Export of Small
Ruminants from Afar Pastoral and Agro-Pastoral Areas. Animal and Veterinary
Sciences, 3(2), 51. https://doi.org/10.11648/j.avs.20150302.14
16. Alemneh T and Getabalew M. (2019): Factors Influencing the Growth and
Development of Meat Animals. Int J Anim Sci. 3(2): 1048.
17. Alilo, A. A., Beyene, A. and Mola, M. (2018): Assessment of Sheep and Goat (Small
Ruminants) Production System in Esera District, of Dawro Zone, Southern Ethiopia.
Advances in Dairy Research, 6:4. DOI: 10.4172/2329-888X.1000215.
18. Al-Khalidi, K.M., Alassaf, A.A., Al-Shudiefat, M.F. and Al Tabini, R. (2013):
Economic performance of small ruminant production in a protected area: a case study
from Tell Ar-Rumman, a Mediterranean ecosystem in Jordan. Agric Econ 1, 8.
https://doi.org/10.1186/2193-7532-1-8 .
19. Al-Khaza’leh, J., Reiber, C., Al Baqain, R. and Valle Zárate, A. (2015): A comparative
economic analysis of goat production systems in Jordan with an emphasis on water
use. Livestock Research for Rural Development Volume 27, Article #81.
20. Al-Shorepy, S. A., Alhadrami, G. A. and Abdulwahab, K. (2002): Genetic and
phenotypic parameters for early growth traits in Emirati goat. Small Ruminant
Research, Volume 45, Issue 3, Pages 217-223.
21. Amankwah, K., Klerkx, L., Oosting, S. J., Sakyi-Dawson, O., van der Zijpp, A. J. and
Millar D. (2012): Diagnosing constraints to market participation of small ruminant
producers in northern Ghana: an innovation systems analysis. NJAS Wageningen
Journal of Life Sciences 60−63, 37–49.
22. Amare, T., Goshu, G. and Tamir, B. (2018): Flock composition, breeding strategies
and farmers’ traits of interest evaluation of Wollo highland sheep and their F1 crosses.
Journal of Animal Science and Technology 60:14 https://doi.org/10.1186/s40781-018-
0173-9 .
23. Ampong, E., Obese, F. Y. and Ayizanga, R. A. (2019): Growth and reproductive
performance of West African Dwarf Sheep (Djallonké) at the Livestock and Poultry
Research Centre, University of Ghana. Livestock Research for Rural Development.
Volume 31, Article #8. Retrieved November 23, 2020, from
http://www.lrrd.org/lrrd31/1/fyobe31008.html .
24. Amwata, D., Nyariki, D. and Musimba, N. (2015): Factors Influencing Pastoral and
Agropastoral Household Vulnerability to Food Insecurity in the Drylands of Kenya: A
Case Study of Kajiado and Makueni Counties. Journal of International Development.
28. n/a-n/a. 10.1002/jid.3123.
25. Anang B. T., Timo, S., Stefan, B. and Jukka, K. (2015): Factors influencing
smallholder farmers access to agricultural microcredit in Northern Ghana. African
Journal of Agricultural Research, 10(24), 2460–2469.
https://doi.org/10.5897/ajar2015.9536 .
26. Asmad, K., Kenyon, P. R., Pain, S. J., Parkinson,T.J., Peterson, S.W., N. Lopez-
Villalobos, N. and Blair,H. T. (2014): Effects of dam size and nutrition during
pregnancy on lifetime performance of female offspring, Small Ruminant Research,
Volume 121, Issues 2–3, Pages 325-335.
27. Assan N. (2015): The influence of flock dynamics, reproductive performance and
mortality on productivity of traditionally managed goats in Sub Saharan Africa. (ISSN:
2322- 1704, Scientific Journal of Animal Science, Volume 4, Issue 3, pages 32-41.
10.14196/sjas.v4i3.1841.
28. Ayantunde, A. (2016): Improving small ruminant productivity and livelihoods through
feed and health interventions. Evidence brief, November 2016
79
29. AU-IBAR 2019: The State of Farm Animal Genetic Resources in Africa. AU-IBAR
publication.
30. Ayantunde, A. A., Kango, M., Hiernaux, P., Udo, H. M. J. and Tabo, R. (2007):
Herders’ perceptions on ruminant livestock breeds and breeding management in
southwestern Niger. Human Ecology, 35(1), 139–149. https://doi.org/10.1007/s10745-
006-9049-6 .
31. Ayoade, J. A., Ibrahim, H.I and Ibrahim, H. Y. (2009): Analysis of women
involvement in livestock production in Lafia area of Nasarawa State, Nigeria.
Livestock Research for Rural Development, vol. 21, No. 12.
http://www.lrrd.org/lrrd21/12/ayoa21220.htm .
32. Baker, R., Audho, J., Aduda, E. and Thorpe, W. (2001): Genetic resistance to gastro-
intestinal nematode parasites in Galla and Small East African goats in the sub-humid
tropics. Animal Science, 73(1), 61-70. doi:10.1017/S1357729800058057.
33. Baker, R.L., Gray, G.D. (2004): Appropriate breeds and breeding schemes for
sheep and goats in the tropics. In: Sani, R.A., Gray, G.D., Baker, R.L. (Eds.), Worm
Control for Small Ruminants in Tropical Asia, Monograph, No. 113. Australian Centre
for International Agricultural Research (ACIAR), pp. 63–95 http://www.ilri.org or
from http://www.worminfo.org .
34. Baker, R.L. and Gray, G. D. (2003): Appropriate Breeds and Breeding Schemes for
Sheep and Goats in the Tropics: The Importance of Characterizing and Utilizing
Disease Resistance and Adaptation to Local Stresses. In: R. Sani, G.D. Gray and R.L.
Baker, Eds. https://cgspace.cgiar.org/handle/10568/2933.
35. Baker, R.L. and Rege, J.E.O. (1994): Genetic resistance to diseases and other stresses
in improvement of ruminant livestock in the tropics. In: Proceedings of the Fifth
World Congress on Genetics Applied to Livestock Production, vol. 20, University of
Guelph, Canada, 7-12 August 1994, pp. 405-412.
36. Balamurugan, B., Ramamoorthy, M., Mandal, R.S.K., Keerthana, J., Gopalakrishnan,
G., Kavya, K. M., Kharayat, N.S., Chaudhary G. R., and Katiyar, R. (2017): Mineral
an Important Nutrient for Efficient Reproductive Mineral an Important Nutrient for
Efficient. International Journal of Science, Environment and Technology, 6(1), 694–
701.
37. Beede, D. K. (2012): What will our ruminants drink? Animal Frontiers, 2(2), 36–43.
https://doi.org/10.2527/af.2012-0040 .
38. Beigh, Y. A., Ganai, A. M. and Ahmad, H.A. (2017): Prospects of complete feed
system in ruminant feeding: A review, Veterinary World, 10(4): 424-437.
39. Bela, B. and Haile, A. (2009). Factors affecting growth performance of sheep under
village management conditions in the south western part of Ethiopia. Livestock
Research for Rural Development 21(#189).
40. Belt, J., Kleijn, W., Chibvuma, P. A., Mudyazvivi, E., Gomo, M., Mfula, C., Mkojera,
E., Opio, M., Zakaria I. and Boafo, K. (2015): Market-based solutions for input
supply: making inputs accessible for smallholder farmers in Africa. KIT working
paper 2015-5.
41. Ben Salem, H. and Smith, T. (2008): Feeding strategies to increase small ruminant
production in dry environments. Small Ruminant Research 77: 174–194.
https://doi.org/10.1016/j.smallrumres.2008.03.008 .
42. Berihulay, H., Abied, A., He, X., Jiang, L. and Ma, Y. (2019): Adaptation Mechanisms
of Small Ruminants to Environmental Heat Stress. Animals, 9(3), 75.
https://doi.org/10.3390/ani9030075 .
80
43. Bett, R. C., Kosgey, I. S., Bebe, B. O. and Kahi, A. K. (2007): Breeding goals for the
Kenya Dual Purpose goat. I. Model development and application to smallholder
production systems. Tropical Animal Health and Production, 39(7), 477–492.
https://doi.org/10.1007/s11250-007-9015-3 .
44. Bett, R. C., Kosgey, I. S., Kahi, A. K., and Peters, K. J. (2009): Realities in breed
improvement programmes for dairy goats in East and Central Africa. Small Ruminant
Research, 85(2–3), 157–160. https://doi.org/10.1016/j.smallrumres.2009.08.001 .
45. Bettencourt, E. M. V., Tilman, M., Narciso, V., da Silva Carvalho, M. L. and de Sousa
Henriques, P. D. (2015): The livestock roles in the wellbeing of rural communities of
Timor-Leste. Revista de Economia e Sociologia Rural 53, S063–S080.
https://doi.org/10.1590/1234-56781806-94790053s01005 .
46. Bhattarai N, Kolachhapati M, D. N. (2016): Effect of non-genetic factors on average
daily gain in the kids of Nepalese hill goats (Capra hircus l.) in Nawalparasi, Nepal.
Nepalese Journal of Agricultural Sciences 14, 191–200.
47. Birteeb, P. T., Danquah, B. A. and Salifu, A. S. (2015). Growth Performance of West
African Dwarf Goats Reared in the Transitional Zone of Ghana. Asian Journal of
Animal Sciences, 9(6), 370–378. https://doi.org/10.3923/ajas.2015.370.378 .
48. Bosman, H.G. (1995): Productivity assessments in small ruminant improvement
programmes. A Case study of the West African Dwarf goat. Thesis Wageningen. -
With ref. - With summary in Dutch ISBN 90-5485-391-3.
49. Browning, R. J., and Leite-Browning, M. L. (2011): Birth to weaning kid traits from a
complete diallel of Boer , Kiko , and Spanish meat goat breeds semi-intensively
managed on humid sub tropical pasture. Journal of Animal Science 89, 2696–2707.
https://doi.org/10.2527/jas.2011-3865.
50. Carrasco, S., Ripoll, G., Sanz, A., Álvarez-Rodríguez, J., Panea, B., Revilla, R. and M.
Joy, M. (2009): Effect of feeding system on growth and carcass characteristics of
Churra Tensina light lambs, Livestock Science, Volume 121, Issue 1, Pages 56-63,
ISSN 1871-1413. https://doi.org/10.1016/j.livsci.2008.05.017 .
51. Casey, N. H., and Webb, E. C. (2010): Managing goat production for meat quality.
Small Ruminant Research. https://doi.org/10.1016/j.smallrumres.2009.12.047
52. Chambwera, M. and Stage, J. (2010): Climate change adaptation in developing
countries : issues and perspectives for economic analysis.Sustainable Markets Group
International Institute for Environment and Development (IIED)3 Endsleigh Street.
ISBN: 978-1-84369-775-6.
53. Charlier, J., van der Voort, M., Kenyon, F., Skuce, P., and Vercruysse, J. (2014):
Chasing helminths and their economic impact on farmed ruminants. Trends in
Parasitology, 30(7), 361–367. https://doi.org/10.1016/j.pt.2014.04.009.
54. Chenyambuga, S.W., Komwihangilo, D.W. and Jackson, M. (2012): Production
performance and desirable traits of Small East African goats in semi-arid areas of
Central Tanzania. Livestock Research for Rural Development 24. Article #118.
http://www.lrrd.org/lrrd24/7/chen24118.htm .
55. Chikagwa-Malunga, S. K., and Banda, J. W. (2006): Productivity and survival ability
of goats in smallholder crop/livestock farming systems in Malawi. Livestock Research
for Rural Development. Volume 18, Article #7. Retrieved August 23, 2020, from
http://www.lrrd.org/lrrd18/1/chik18007.html .
56. Chowdhury, S. A., Bhuiyan, M. S. A., and Faruk, S. (2002): Rearing black bengal goat
under semi-intensive management 1. Physiological and reproductive performances.
Asian-Australasian Journal of Animal Sciences, 15(4), 477–484.
https://doi.org/10.5713/ajas.2002.477.
81
57. Chukwuka, O., Okoli, I. C., Okeudo, N., Opara, M., Udo, H., Ifeany, O., and
Ekenyem, B. (2010): Reproductive Potentials of West African Dwarf Sheep and Goat:
A Review. Research Journal of Veterinary Sciences - RES J ANIM VET SCI. 3. 86-
100. 10.3923/rjvs.2010.86.100.
58. CIAT. (2015): Climate-Smart Agriculture in Kenya. CSA Country Profiles for Africa,
Asia, and Latin America and the Caribbean Series. Washington D.C.: The World Bank
Group.
59. Cloete, S. W. P., Snyman, M. A., & Herselman, M. J. (2000): Productive performance
of Dorper sheep. Small Ruminant Research 36, 119–135.
60. Craine, J., Elmore, A., Olson, K.C. and Tolleson, D. (2010): Climate change and cattle
nutritional stress. Global Change Biology 16. 2901 - 2911. 10.1111/j.1365-
2486.2009.02060.x.
61. CSA. Kenya Climate Smart Agriculture Implementation Framework 2018-2027.
(2018): Volume 3 Number 1 (2014) pp. 684-706. http://www.ijcmas.com .
62. De Brito, F.G., Ponnampalam, E.N., and Hopkins, D.L. (2017): The Effect of
Extensive Feeding Systems on Growth Rate, Carcass Traits , and Meat Quality of
Finishing Lambs. Comprehensive Reviews in Food Science and Food Safety(1)6, 23–
38. https://doi.org/10.1111/1541-4337.12230.
63. De Brito, G., Ponnampalam, E. and Hopkins, D. (2016): The Effect of Extensive
Feeding Systems on Growth Rate, Carcass Traits, and Meat Quality of Finishing
Lambs: Extensive feeding systems for lambs. Comprehensive Reviews in Food
Science and Food Safety. 10.1111/1541-4337.12230.
64. De Vries, J. (2008): Goats for the poor: Some keys to successful promotion of goat
production among the poor. Small Ruminant Research, 77(2–3), 221–224.
https://doi.org/10.1016/j.smallrumres.2008.03.006.
65. Deininger, K., Savastano, S., and Xia, F. (2017): Smallholders’ land access in Sub-
Saharan Africa: A new landscape? Food Policy, 67, 78–92.
https://doi.org/10.1016/j.foodpol.2016.09.012 .
66. Delgadillo, J. A. and Martin, G. B. (2015): Alternative methods for control of
reproduction in small ruminants: A focus on the needs of grazing industries. Animal
Frontiers, 5(1), 57–65. https://doi.org/10.2527/af.2015-0009 .
67. Delia G., Mwansa S., and Theo K. (2015): Impact of neglected diseases on animal
productivity and public health in Africa. OIE Regional Commission.
68. Deribe, B. and Taye, M. (2013): Growth performance and carcass characteristics of
central highland goats in Sekota District, Ethiopia. Agricultural Advances 2(8) 250-
258 ISSN 2251-7820. doi: 10.14196/aa.v2i8.902.
69. Deribe, B., Tilahun, M., Lakew, M., Belayneh, N., Zegeye, A., Walle, M., Ayichew,
D., Ali, S. T. and Abriham S. (2015): On Station Growth Performance of Crossbred
Goats (Boer X Central Highland ) at Sirinka , Ethiopia. Asian Journal of Animal
Sciences Volume: 9 Issue: 6 Page No.: 454-459. DOI: 10.3923/ajas.2015.454.459.
70. Devendra, C. (1999): Goats: Challenges for increased productivity and improved
livelihoods. Outlook on Agriculture, 28(4), 215–226.
71. Devendra, C. (2002): Crop-animal systems in Asia: future perspectives. Agricultural
Systems, Volume 71, Issues 1–2, Pages 179-186, ISSN 0308-521X.
https://doi.org/10.1016/S0308-521X(01)00043-9 .
72. Donkin, E. F., and Boyazoglu, P. A. (2004): Diseases and mortality of adult goats in a
South African milk goat herd. South African Journal of Animal Sciences,
34(5SUPPL.1), 254–257.
82
73. Dossa, G. L. H. (2007): Small Ruminants in the Smallholder Production System in
Southern Benin: Prospects for Conservation Through Community-based Management.
Cuvillier Verlag. ISBN 3867273448, 9783867273442.
74. Duku, S., van der Zijpp, A. J. and Howard, P. (2010): Small ruminant feed systems:
Perceptions and practices in the transitional zone of Ghana. Journal of Ethnobiology
and Ethnomedicine, 6, 1–15. https://doi.org/10.1186/1746-4269-6-11.
75. Ericksen, P., Thornton, P., Notenbaert, A., Cramer, L., Jones, P., and Herrero, M.
(2011): Mapping hotspots of climate change and food insecurity in the global tropics.
CCAFS Report 5. Copenhagen, Denmark: CCAFS.
76. Etalema, S. and Abera, A. (2018): Small ruminant production and constraints in
Misha. International Journal of Livestock Production Vol. 9(8), pp. 192-197, DOI:
10.5897/IJLP2018.0456.
77. Fadairo, O., Williams, P.A. and Nalwanga, F.S.(2020): Perceived livelihood impacts
and adaptation of vegetable farmers to climate variability and change in selected sites
from Ghana, Uganda and Nigeria. Environ Dev Sustain 22, 6831–6849.
https://doi.org/10.1007/s10668-019-00514-1 .
78. Fahmy, M. H. (1990): Development of DLS breed of sheep: genetic and phenotypic
parameters of date of lambing and litter size. Canadian Journal of Animal Science 70,
771–778.
79. Fantahun, T., Alemayehu, K. and Abegaz, S. (2016): Characterization of goat
production systems and trait preferences of goat keepers in Bench Maji zone, south
western Ethiopia. African Journal of Agricultural Research Vol. 11(30), pp. 2768-
2774, 28 July, 2016 DOI: 10.5897/AJAR2015.10170.
80. FAO. Food and Agriculture Organization (2017): Nutrition-sensitive agriculture and
food systems in practice: Options for intervention. Rome. 102 pp.
http://www.fao.org/3/a-i7848e.pdf .
81. FAO. Food and Agriculture Organization. (2009): The state of food and agriculture.
Food systems for better nutrition. In Lancet (Vol. 2). https://doi.org/10.1016/S0140-
6736(75)92740-3 .
82. FAO. Food and Agriculture Organization. (2016): Statistical Yearbook (Vol. 1).
Rome, Italy.
83. Fasae, O. A., Oyebade, O. A., Adewumi, O.O. and James, I. J. (2012): factors
affecting birth and weaning weights in lambs of Yankasa, West African dwarf breeds
and their crosses. Journal of Agricultural Science and Environment 12(2):89-95.
84. Fernanddez-Rivera, S., Okike, I., Manyong, V., Williams, T.O., Kruska, R.L. and
Tarawali, S. A. (2004): Classification and description of the major farming systems
incorporating ruminant livestock in West Africa.
85. Fikru S. and Omer A. A. (2015):Traditional Small Ruminant Production and
Management Practices in Awbare District of Ethiopian Somali Regional State. J Anim
Pro Adv 2015, 5(6): 697-704 DOI: 10.5455/japa.20150626043822.
86. Gardner, D. S., Buttery, P. J., Daniel, Z. and Symonds, M. E. (2007): Factors affecting
birth weight in sheep: maternal environment. Reproduction (Cambridge, England),
133(1), 297–307. https://doi.org/10.1530/REP-06-0042 .
87. Gebremedhin, B., Hoekstra, D., Tegegne, A., Shiferaw, K. and Aklilu, B. (2015):
"Household Market Participation Behavior in Small Ruminants in the Highlands of
Ethiopia: The Role of Herd Size, Herd Structure and Institutional Services," 2015
Conference, August 9-14, 2015, Milan, Italy 211649, International Association of
Agricultural Economists.
83
88. Gemeda, B. S. (2017): Production and Marketing Systems of Small Ruminants in
Western Ethiopia. MSc. Thesis. Hawassa University, Awassa.
89. George Z. and Tsiplakou, E. (2011): The effect of feeding systems on the
characteristics of products from small ruminants. Small Ruminant Research, 101(1–3),
140–149.
90. Girma, M. (2016). Participatory on Farm Evaluation and Demonstration of 25%
Crossbred (Boer x Woyito-Guji) Goats in Benatsemay District of South Omo Zone,
SNNPR, Ethiopia. Journal of Biology, Agriculture and Healthcare, 6, 41-45.
91. Gitonga, P. N., Gachene, C. K., Njoroge, E., and Thumbi, S. M. (2016): Small
ruminant husbandry practices amongst Kajiado and Marsabit pastoralists and their
effects on Peste des petits ruminants control strategies. Livestock Research for Rural
Development. Volume 28, Article #26. http://www.lrrd.org/lrrd28/2/gito28026.htm .
92. Gizaw, S., Hoekstra, D., Gebremedhin, B. and Tegegne, A. (2015): Classification of
small ruminant production sub-systems in Ethiopia: Implications for designing
development interventions. LIVES Working Paper 5. Nairobi, Kenya: International
Livestock Research Institute (ILRI).
93. Gizaw, S., Tegegne, A., Gebremedhin, B. and Hoekstra, D.(2010): Sheep and goat
production and marketing systems in Ethiopia: Characteristics and strategies for
improvement. IPMS (Improving Productivity and Market Success) of Ethiopian
Farmers Project Working Paper 23. ILRI (International Livestock Research Institute),
Nairobi, Kenya. 58 pp.
94. Gollin, D. (2014): Smallholder Africa agriculture in Africa:An overview and
implications for policy Smallholder agriculture in Africa. IIED Working Paper.
London, (October), 1–20.
95. Gonul, R., Kayar, A., Bilal, T., Erman, O. R. M., Parkan, D. V. M., Dodurka, H. T.,
Gulyasar, T. and Barutcu. (2009): Comparison of mineral levels in bone and blood.
Comparison of mineral levels in bone and blood serum of cattle in Northwestern
Turkey. J . Anim. Vet. Adv., 8, 1263-1267.
96. Greyling J. (2000): Reproduction traits in the Boer goat doe. Small Rumin Res, 36,
171–177. Retrieved from https://doi.org/10.1016/S0921-4488(99)00161-3 .
97. Guo, G., Wen, Q. and Zhu, J. (2015): The Impact of Aging Agricultural Labor
Population on Farmland Output: From the Perspective of Farmer Preferences.
Mathematical Problems in Engineering. 2015. 1-7. 10.1155/2015/730618.
98. Haile A. (2017): Breeding programs for Ethiopian Small Ruminants. CRP livestock
genetics flagship ICARDA report Breeding programs for Ethiopian Small Ruminants,
Addis Ababa, Ethiopia.
99. Haile, A., Gizaw, S., Getachew, T., Mueller, J. P., Amer, P., Rekik, M. and
Rischkowsky, B. (2019): Community-based breeding programmes are a viable
solution for Ethiopian small ruminant genetic improvement but require public and
private investments. Journal of Animal Breeding and Genetics, 136(5), 319–328.
https://doi.org/10.1111/jbg.12401.
100. Hailu, D., Mieso, G., Nigatu, A., Fufa, D. and Gamada, D. (2006): The effect of
environmental factors on preweaning survival rate of Borana and Arsi-Bale kids.
Small Ruminant Research, 66, 291–294.
101. Hango, A., Mtenga, L. A., Kifaro, G., Safari, J., Mushi, D. and Muhikambele, V.
(2007): A study on growth performance and carcass characteristics of Small East
African goats under different feeding regimes. Livestock Research for Rural
Development 19. http://www.lrrd.org/lrrd19/9/hang19130.htm .
84
102. Harvey, C. A., Rakotobe, Z. L., Rao, N. S., Dave, R., Razafimahatratra, H.,
Rabarijohn, R. H., Rajaofara, H. and MacKinnon J. L. (2014): Extreme vulnerability
of smallholder farmers to agri- cultural risks and climate change in Madagascar. Phil.
Trans. R. Soc. B 369: 20130089. http://dx.doi.org/10.1098/rstb.2013.0089 .
103. Herrero, M. and Thornton, P. K. (2013): Livestock and global change: Emerging
issues for sustainable food systems. Proceedings of the National Academy of Sciences
of the United States of America, 110(52), 20878–20881.
https://doi.org/10.1073/pnas.1321844111 .
104. Herrero, M., Grace, D., Njuki, J., Johnson, N., Enahoro, D., Silvestri, S. and Rufino,
M. C. (2013): The roles of livestock in developing countries. Animal, 7(SUPPL.1), 3–
18. https://doi.org/10.1017/S1751731112001954 .
105. Herrero, M., Havlik, P., McIntire, J., Palazzo, A. and Valin, H. (2014): African
Livestock Futures: Realizing the Potential of Livestock for Food Security, Poverty
Reduction and the Environment in Sub-Saharan Africa. Office of the Special
Representative of the UN Secretary General for Food Security and Nutrition and the
United Nations System Influenza Coordination (UNSIC), Geneva, Switzerland, 118 p
106. Holland, M. K. and McGowan, M. (2018). Manipulation of fertility to enhance
productivity of cattle. Biochemist, 40(3), 20–25. https://doi.org/10.1042/bio04003020 .
107. Hunter, G, L. (2010): Accelerated lambing: Increasing the frequency of pregnancy in
sheep. In Animal Science Review.
108. Hussein, T. (2018): Local sheep and goat reproductive performance managed under
farmer condition in Southern Ethiopia. Vol. 9(10), pp. 280-285.
https://doi.org/10.5897/IJLP2018.0509 .
109. Hyera, E., and Mlimbe, M. E., and Sanka, J. D., Minja, M. G., Rugaimukamu, A. P.,
Latonga, P. M., Mbembela, E. G., Nguluma, A., Nziku, Z., Mashingo, M.S. H. and
Shirima, E.J.M. (2018): On-station growth performance evaluation of small East
African and dual-purpose goat breeds in Northern Tanzania. Livestock Research for
Rural Development 30.
110. IPCC. International Panel of Climate Change (2014): Climate Change 2014:
Synthesis Report. Contribution of Working Groups I, II and III to the Fifth Assessment
Report of the Intergovernmental Panel on Climate Change. In R.K. Pachauri and L.A.
Meyer. https://doi.org/10.1017/CBO9781107415324.004 .
111. IPCC. International Panel of Climate Change (2019): Climate Change and Land: an
IPCC special report on climate change, desertification, land degradation, sustainable
land management, food security, and greenhouse gas fluxes in terrestrial ecosystems.
In P.R. Shukla, J. Skea, E. Calvo Buendia, V. Masson-Delmotte, H.-O. Pörtner, D. C.
Roberts, P. Zhai, R. Slade, S. Connors, R. van Diemen, M. Ferrat, E. Haughey, S. Luz,
S. Neogi, M. Pathak, J. Petzold, J. Portugal Pereira, P. Vyas, E. Huntley, K. Kissick, ,
423–449. https://doi.org/10.4337/9781784710644 .
112. Irshad, M., Inoue, M., Ashraf, M., Faridullah, Delower, H. K. M. and Tsunekawa, A.
(2007): Land desertification - An emerging threat to environment and food security of
Pakistan. Journal of Applied Sciences, Vol. 7, pp. 1199–1205.
https://doi.org/10.3923/jas.2007.1199.1205 .
113. Jaetzold, R., & Schmidt, H. (1983): farm management handbook of kenya Vol. II C
East Kenya.
114. Joshi, A., Kalauni, D. and Bhattarai, N. (2018): Factors Affecting Productive and
Reproductive Traits of Indigenous Goats in Nepal. Arch Vet Sci Med 1 (1): 019-027.
https://doi.org/10.26502/avsm.003 .
85
115. Kagira, J. and Kanyaria, P. W. (2001): The role of parasitic diseases as causes of
mortality in small ruminants in a high-potential farming area in central Kenya. Journal
of the South African Veterinary Association, 72(3), 147–149.
https://doi.org/10.4102/jsava.v72i3.638 .
116. Karnuah, A., Dunga, G. and Thomas, R. (2018): Community based breeding program
for improve goat production in Liberia. MOJ Current Research & Reviews.1.
10.15406/mojcrr.2018.01.00036.
117. Kathy, L. (2004): AI bulls ranked by conception rates, Michigan Dairy Review. pp. 1-
3, http://www.mdr.msu.edu .
118. Katiku, P. N., Kimitei, R. K., Korir, B. K., Muasya, T. K., Chengole, J. M., Ogillo, B.
P., Munyasi, J. W. and Karimi, S. K. (2013): Value chain assessment of small
ruminant production, challenges and opportunities: The case of southern rangelands of
Kenya. Livestock Research for Rural Development. Volume 25, Article #1. Retrieved
November 24, 2020, from http://www.lrrd.org/lrrd25/1/kati25001.htm .
119. Kawas, J. R., Andrade-Montemayor, H. and Lu, C. D. (2010): Strategic nutrient
supplementation of free-ranging goats. Small Ruminant Research, 89(2–3), 234–243.
https://doi.org/10.1016/j.smallrumres.2009.12.050 .
120. Kebebe E. G. (2015): Understanding factors affecting technology adoption in
smallholder livestock production systems in Ethiopia: The role of farm resources and
the enabling environment. PhD thesis, Wageningen University, Wageningen, NL.
121. Kebebe, E. (2019): Bridging technology adoption gaps in livestock sector in
Ethiopia: A innovation system perspective. Technology in Society, 57, 30–37.
https://doi.org/10.1016/j.techsoc.2018.12.002 .
122. Khan, M., Uddin, J. and Gofur, M. (2015): Effect of age, parity and breed on
conception rate and number of services per conception in artificially inseminated
cows. Bangladesh livestock journal ISSN 2409-7691. 1. 1-4.
123. Kinyangi, J., Recha, J., Kimeli, P. and Atakos, V. (2015): Climate-smart villages and
the hope of food secure households: Preliminary results from climate change
adaptation and mitigation initiatives in the Nyando climate-smart villages, ILRI,
Nairobi Kenya: Climate Change, Agriculture and Food Security, (CCAFS).
124. Kisamba-Mugerwa, W., Pender, J. and Kato, E. (2006): Impacts of Individualization
of Land Tenure on Livestock and Rangeland Management in Southwestern Uganda
Impacts of Individualization of Land Tenure on Livestock and Rangeland
Management in Southwestern Uganda. 11th Biennial Conference of the International
Association for the Study of Common Property June 19-23, in Bali, Indonesia, (April),
1–31.
125. Kiwuwa, G. H. (1992). Breeding strategies for small ruminant productivity in Africa.
Rey, B., Lebbie, S.H.B., Reynolds, L. (Eds.), Small Ruminant Research and
Development in Africa, Proceedings of the First Biennial Conference of the African
Small Ruminant Research Network.
126. KNBS. Kenya National Bureau of Statistics (2019). Census, 2019 Kenya Population
and Housing Volume IV: Distribution of Population by Socio-Economic
Characteristics.
127. Kolachhapati M. R., Bhattarai N, D. N. (2012). Goat Research Initiatives At Iaas
Nepal. Proceedings of the National Workshop on Research and Development
Strategies for Goat Enterprises in Nepal, 2012 182–187.
128. Kolachhapati, M. R. (2005). Goat nutrition and management for meat production.
Green Field Journal of Himalayan College of Agricultural Science and Technology
(HICAST), Gathagha Bhactapur, Nepal 5 (2005): 82–94.
86
129. König, Z. E., Ojango, J. M. K., Audho, J., Mirkena, T., Strandberg, E., Okeyo, A. M.,
and Philipsson, J. (2017): Live weight, conformation, carcass traits and economic
values of ram lambs of Red Maasai and Dorper sheep and their crosses. Tropical
Animal Health and Production, 49(1), 121–129. https://doi.org/10.1007/s11250-016-
1168-5 .
130. Kosgey, I. S. (2004): Breeding objectives and breeding strategies for small ruminants
in the tropics. In Ph.D. Thesis.
131. Kosgey, I. S., and Okeyo, A. M. (2007): Genetic improvement of small ruminants in
low‐input, smallholder production systems: Technical and infrastructural issues. Small
Ruminant Research, 70, 76–88. https://doi.org/10.1016/j.smallrumres.2007.01.007.
132. Kosgey, I. S., Baker, R. L., Udo, H. M. J., and Van Arendonk, J. A. M. (2006):
Successes and failures of small ruminant breeding programmes in the tropics: A
review. Small Ruminant Research, 61(1), 13–28.
https://doi.org/10.1016/j.smallrumres.2005.01.003 .
133. Kosgey, I. S., Rowlands, G. J., van Arendonk, J. A. M., and Baker, R. L. (2008):
Small ruminant production in smallholder and pastoral/extensive farming systems in
Kenya. Small Ruminant Research, 77(1), 11–24.
https://doi.org/10.1016/j.smallrumres.2008.02.005 .
134. KPHC. Kenya Population and Housing Census (2009): Population distribution by
age, sex and administrative units. Volume 1c.
135. Krätli, S., Huelsebusch, C., Brooks, S., and Kaufmann, B. (2013). Pastoralism: A
critical asset for food security under global climate change. Animal Frontiers, 3(1),
42–50. https://doi.org/10.2527/af.2013-0007 .
136. Krell, N. T., Giroux, S. A., Guido, Z., Hannah, C., Lopus, S. E., Caylor, K. K., and
Evans, T. P. (2020). Smallholder farmers’ use of mobile phone services in central
Kenya. Climate and Development. https://doi.org/10.1080/17565529.2020.1748847.
137. Kristjanson, P., Waters-Bayer, A., Johnson, N., Tipilda, A., Njuki, J., Baltenweck, I.,
Grace, D., and MacMillan, S. (2010). Livestock and Women’s Livelihoods: A Review
of the Recent Evidence. Discussion Paper No. 20. Nairobi, Kenya, ILRI.
138. Kumar, S. and Deoghare, P. R. (2003): Goat Production System and Livelihood
Security of Rural Landless Households. Indian Journal of Small Ruminants. 9 (1): 19
-24).
139. Kumar, S. and Roy, M. M. (2013) Small Ruminant’s Role in Sustaining Rural
Livelihoods in Arid and Semiarid Regions and their Potential for Commercialization.
New Paradigms in livestock production from traditional to commercial farming and
beyond (Eds), Agrotech publishing academy, Udaipur, pp. 57-80.
140. Kumar, S., Rama Rao, C. A., Kareemulla, K. and Venkateswarlu, B.(2010): Role of
goats in livelihood security of rural poor in the less favoured environments. Ind. Jn. of
Agri. Econ Vol. 65, No.4.
141. Lado, M. M., Jubarah, S. K., and Ochi, E. B. (2015): A Case Study on Major
Constraints of Small Ruminants Management in Juba County Central Equatoria State
South Sudan. International Journal of Innovative Science, Engineering & Technology
2(12), 785–789.
142. Lakew, M., Haile.-Melekot, M., and Mekuriaw, G. (2014): Evaluation of Growth
Performance of Local and Dorper × Local Crossbred Sheep in Eastern Amhara
Region, Iranian Journal of Applied Animal Science 4, 787–794.
143. Lamy, E., Harten, S., Sales-Baptista, E., Guerra, M. M. M. and Almeida, A. M.
(2012): Factors Influencing Livestock Productivity. Environmental Stress and
Amelioration in Livestock Production, DOI: 10.1007/978-3-642-29205-7_2.
87
144. Larson, C. K. (2005): Role of trace minerals in animal production: What do I need to
know about trace minerals for beef and dairy cattle, horses, sheep and goats?
Proceedings of the University of Tennessee Nutrition Conference, 1–12.
145. Legese, G., and Fadiga, M. (2014): Small ruminant value chain development in
Ethiopia: Situation analysis and trends. ICARDA/ILRI Project Report. Nairobi,
Kenya: International Center for Agricultural Research in the Dry Areas/International
Livestock Research Institute.
146. Legesse, G., Abebe, G., Siegmund-Schultze, M. and Valle Zárate, A. (2008): Small
ruminant production in two mixed-farming systems of southern Ethiopia: status and
prospects for improvement. Experimental Agriculture. 44(3): 399-412.
147. Legesse, G., Siegmund-Schultze, M., Abebe, G. and Zárate, A. V. (2010): Economic
performance of small ruminants in mixed-farming systems of Southern Ethiopia.
Tropical Animal Health and Production, 42(7), 1531–1539.
https://doi.org/10.1007/s11250-010-9603-5 .
148. Lehloenya, K. C., Greyling, J. P. C., and Schwalbach, L. M. J. (2005): Reproductive
performance of South African indigenous goats following oestrous synchronisation
and AI. Small ruminant research 57, 115–120.
https://doi.org/10.1016/j.smallrumres.2004.05.004 .
149. Lengarite, M. I., Mbugua, P. N., Gachuiri, C. K., and Kabuage, L. W. (2012): Mineral
status of sheep and goats grazing in the arid rangelands of northern Kenya. Pakistan
Journal of Nutrition, 11(4), 383–390. https://doi.org/10.3923/pjn.2012.383.390
150. Lobo, B. R. N. (2019): Opportunities for investment into small ruminant breeding
programmes in Brazil. Journal of Animal Breeding and Genetics.
https://doi.org/10.1111/jbg.12396 .
151. Lupi, T. M., Nogales, S., León, J. M., Cecilio, B., and Delgado, J.V. (2015): Analysis
of the Non-Genetic Factors Affecting the Growth of Segureño Sheep Analysis of the
non-genetic factors affecting the growth of Segureño sheep. Italian Journal of Animal
Science 14: 1. https://doi.org/10.4081/ijas.2015.3683.
152. Macoloo, C., Recha, J., Radeny, M. and Kinyangi, J. (2013): Empowering a local
community to address climate risk and food insecurity in Lower Nyando, Kenya. Case
Study for Hunger, Nutrition, Climate Justice 2013. A new Dialogue putting people at
the heart of develop- ment. Dublin Ireland (available at
http://cgspace.cgiar.org/handle/ 10568/27889).
153. Mandal, A., Neser, F., Rout, P., Roy, R., and Notter, D. (2006): Genetic parameters
for direct and maternal effects on body weights of Muzaffarnagari sheep. Animal
Science. 82. 133 - 140. 10.1079/ASC200531.
154. Mango, J., Mideva, A., Osanya, W., and Odhiambo, A. (2011): Summary of Baseline
Household Survey Results: Lower Nyando, Kenya. (September 2011), 1–32.
https://cgspace.cgiar.org/rest/bitstreams/18920/retrieve .
155. Manirakiza, J., Hatungumukama, G., Besbes, B., and Detilleux, J. (2020):
Characteristics of smallholders’ goat production systems and effect of Boer
crossbreeding on body measurements of goats in Burundi. Pastoralism 10, 2.
https://doi.org/10.1186/s13570-019-0157-5 .
156. Manoli, C., Ancey, V., Corniaux, C., Ickowicz, A., Dedieu, B., and Moulin, C. H.
(2014): How do pastoral families combine livestock herdswith other livelihood
security means to survive?The case of theFerloarea in Senegal. Research, Policy and
Practice, 1–11. Retrieved from https://doi.org/10.1186/2041-7136-4-3.
88
157. Marai, I. F. M., El-Darawany, A. A., Fadiel, A. and Abdel-Hafez, M. A. M. (2007):
Physiological traits as affected by heat stress in sheep. A review. Small Ruminant
Research 71:1-12.
158. Marino, R., Atzori, A. S., Andrea, M. D., Iovane, G., Trabalza-marinucci, M. and
Rinaldi, L. (2016): Climate change : Production performance , health issues ,
greenhouse gas emissions and mitigation strategies in sheep and goat farming. Small
Ruminant Research, 135, 50–59. https://doi.org/10.1016/j.smallrumres.2015.12.012.
159. Masese, F. O., Raburu, P. O., and Kwena, F. (2008): Threats to the Nyando Wetland.
Community Based Approachc to the Managment of Nyando Wetland.
160. Mayberry, D., Ash, A., Prestwidge, D., and Herrero, M. (2018): Closing yield gaps in
smallholder goat production systems in Ethiopia and India. Livestock Science, 214,
238–244. https://doi.org/10.1016/j.livsci.2018.06.015 .
161. Mbuku, S. M., Okeyo, A. M., Kosgey, I. S., and Kahi, A. K. (2015): Optimum
crossbreeding systems for goats in low-input livestock production system in Kenya.
Small Ruminant Research, 123(1), 55–61.
https://doi.org/10.1016/j.smallrumres.2014.10.001 .
162. Mengistie T., Girma A., Gizaw, S., Lemma, S., Abebe M. A. and Tibbo, M. (2010):
Growth performances of Washera sheep under smallholder management systems in
Yilmanadensa and Quarit districts, Ethiopia.Trop Anim Health Prod 42:659–667 DOI:
10.1007/s11250-009-9473-x.
163. Merkine T., Ahamed H., Herago, T. and Gebregeorgis, T. (2017): Analysis of
Morbidity and Mortality of Sheep and Goat in Wolaita Soddo Zuria District, Southern
Ethiopia. Global Veterinaria 18 (3): 168-177.
164. Metawi H., (2015): Contribution of small ruminants to household income in the
agroecological northwestern coastal zone of Egypt. Rev. Elev. Med. Vet. Pays Trop.,
68 (2-3): 75-78.
165. Mhlanga, T. T., Mutibvu, T., and Mbiriri, D. T. (2018): Goat flock productivity under
smallholder farmer management in Zimbabwe. Small Ruminant Research, 164, 105–
109. https://doi.org/10.1016/j.smallrumres.2018.05.010 .
166. Mioč, B., Zvonimir, P., Vnucec, I., Barać, Z., Sušić, V., Samarzija, D. and Vesna, P.
(2008): Factors affecting goat milk yield and composition. Mljekarstvo / Dairy. 58.
305-313.
167. Monau, P., Raphaka, K., Zvinorova-Chimboza, P., and Gondwe, T. (2020):
Sustainable Utilization of Indigenous Goats in Southern Africa. Diversity. 12. 20.
10.3390/d12010020.
168. Monteiro, A., Costa, J.M. and Lima M. J. (2017): Goat system productions:
Advantages and disadvantages to the animal, environment and farmer. In Goat science.
London, UK: IntechOpen.
169. Morel, P. C. H., Morris, S. T., and Kenyon, P. R. (2008): Effect of birthweight on
survival in triplet-born lambs. Australian Journal of Experimental Agriculture, 48(7),
984–987. https://doi.org/10.1071/EA07401 .
170. Moritz, M., Giblin, J., Ciccone, M., Andréa, D., Fuhrman, J., Kimiaie, M., Madzsar,
S., Olson, K., and Senn, M. (2011): Social Risk-Management Strategies in Pastoral
Systems: A Qualitative Comparative Analysis. Cross-cultural Research - CROSS-
CULT RES. 45. 286-317. 10.1177/1069397111402464.
171. Mtimet, N., Baker, D., Audho, J., Oyieng, E., and Ojango, J. M. K. (2014): Assessing
Sheep Traders’ Preferences in Kenya: A Best-worst Experiment from Kajiado County.
UMK Procedia, 1(October 2013), 63–73.
https://doi.org/10.1016/j.umkpro.2014.07.009.
89
172. Mueller, J.P., Rischkowsky, B., A. Haile, A., Philipsson, J., O. Mwai, O., Besbes, B.,
A. Zárate, A. V., M. Tibbo, M., Mirkena, T., Duguma, G., Sölkner, J., and Wurzinger,
M. (2015): Community-based livestock breeding programmes: essentials and
examples. Journal of Animal Breeding and Genetics 1.
173. Mufti, M., Alam, M., Sarker, M., Bostami, A., and Das, N. (2010): Study on factors
affecting the conception rate in Red Chittagong Cows. Bangladesh Journal of Animal
Science 32(2):155-168. doi:10.1111/jbg.12136 ,39(1–2), 52–57.
https://doi.org/10.3329/bjas.v39i1-2.9676 .
174. Muhammad, N., Maigandi, S. A., Hassan, W. A., & Daneji, A. I. (2008): Growth
performance and economics of sheep production with varying levels of rice milling
waste. Sokoto Journal of Veterinary Sciences 7(1): 59-64.
175. Muigai, A. W. T., Okeyo, A. M., and Ojango, J. M. K. (2017): Goat production in
Eastern Africa: Practices, breed characteristics, and opportunities for their
sustainability. In Sustainable Goat Production in Adverse Environments (Vol. 1).
https://doi.org/10.1007/978-3-319-71855-2-3 .
176. Mukasa-Mugerwa, E., Mutiga, E.R. and Girma, A. (1992): Studies on the
reproductive performance of Ethiopian sheep by means of Enzyme Immunoassay
Technique; Review. Reproduction, Fertility and Development;4(5): 523-532.
177. Murithi, F., Mosi, R., Matiri, F., Okeyo, A. and Ahuya, C. (2002): Body weight and
preweaning growth rate of pure indigenous, Toggenburg goat breeds and their crosses
under smallholder production systems in Kenya.
178. Mustafa, M. I., Mehmood, M. M., Lateef, M., Bashir, M. K., and Khalid, A. R.
(2014): Factors influencing lamb mortality from birth to weaning in Pakistan. Pakistan
Journal of Life and Social Sciences, 12(3), 139–143.
179. Mwacharo, J. M. and Drucker, A. G. (2005): Production objectives and management
strategies of livestock keepers in south-east Kenya: Implications for a breeding
programme. Tropical Animal Health and Production, 37(8), 635–652.
https://doi.org/10.1007/s11250-005-4253-8.
180. Namgay, K., Millar, J., Black, R. and Samdup, T. (2013): Transhumant agro-
pastoralism in Bhutan: Exploring contemporary practices and socio-cultural traditions.
Pastoralism, 3(1), 1–26. https://doi.org/10.1186/2041-7136-3-13 .
181. Nardone, A., Ronchi, B., Lacetera, N., Ranieri, M.S. and Bernabucci, U. (2010):
Effects of climate change on animal production and sustainability of livestock systems.
Livest. Sci. 130, 57–69.
182. Ndeke, A., M'Ikiugu, H., Tsuma, V., and Mutiga, E. (2015): Reproductive
Performance of the Galla and Toggenburg Goats and their Crosses in Mwingi Sub-
county of Kenya. The Journal of Agricultural Science. 1. 78-83.
183. Nelson, V., Morton, J., Chancellor, T., Burt, P., and Pound, B. (2010): Climate
Change, Agricultural Adaptation and Fairtrade Identifying the Challenges and
Opportunities. NRI Working Paper Series: Climate Change, Agriculture and Natural
Resources.
184. Neopane S. P., Pokharel P. K. (2008: Indigenous Goat of Nepal. National Animal
Science Research Institute, 7.
185. Ngila, P., Njarui, D.M., Musimba, N.K. and Njunie, M. (2016): Performance of Galla
Goats Fed Different Cultivars of Brachiaria in the Coastal Lowlands of Kenya. J
Fisheries Livest Prod 5: 210. doi: 10.4172/2332-2608.1000210.
186. Nirajan, B., Neena, G., Manaraj, K. and Sapkota, S. (2019): Breeds and Breeding
System of Indigenous and Crossbred Goats in Nepal. 10.5772/intechopen.82821.
187. Njarui, D. M. G., Gichangi, E. M., Gatheru, M., Nyambati, E. M., Ondiko, C. N.,
90
Njunie, M. N., Ndungu-Magiroi, K. W., Kiiya, W. W., Kute, C. A. O. and Ayako, W.
(2016): A comparative analysis of livestock farming in smallholder mixed crop-
livestock systems in Kenya: 1. Livestock inventory and management. Livestock
Research for Rural Development. Volume 28, Article #66. Retrieved August 23, 2020,
from http://www.lrrd.org/lrrd28/4/njar28066.html .
188. Njoro, J. N. (2001): Community initiatives in livestock improvement: the case of
Kathekani, Kenya. In: Community-based management of animal genetic resources,
Proceedings of the Workshop held in Mbabane, Swaziland, 7-11 May 2001, pp. 77-84
189. Njuki, J. and Mburu, S. (2013): Gender and ownership of livestock assets. In Women,
Livestock Ownership and Markets: Bridging the gender gap in Eastern and Southern
Africa.
190. Njuki, J., Waithanji, E., Lyimo-Macha, J. Kariuki, J., and Mburu, S. (2013): Women,
Livestock Ownership and Markets: Bridging the Gender Gap in Eastern and Southern
Africa. Routledge. https://doi.org/10.4324/9780203083604 .
191. Nugroho, T., Kustiyani, C., Ratriyanto, A., Widyas, N., and Prastowo, S. (2019):
Reproductive Rate Performance of Boer Goat and Its F1 Cross in Indonesia. IOP Conf.
Series: Earth and Environmental Science 334 doi:10.1088/1755-1315/334/1/012008.
192. Nugroho, T., Nurhidayati, A., Ayuningtyas, A.I., Kustiyani, C., Prastowo, S., and
Widyas, N. (2018): Birth and weaning weight of kids from different Boer goat crosses
Birth and weaning weight of kids from different Boer goat crosses. IOP Conf. Series:
Earth and Environmental Science 142 (2018) 012010 doi :10.1088/1755-
1315/142/1/012010.
193. Nyariki, D. M. and Amwata, D. A. (2019): The value of pastoralism in Kenya:
Application of total economic value approach. Pastoralism, 9(1).
https://doi.org/10.1186/s13570-019-0144-x .
194. Nyariki, D. M., W.Mwang’ombe, A. and Thompson, D. M. (2017): Land-Use Change
and Livestock Production Challenges in an Integrated System: The Masai-Mara
Ecosystem, Kenya. Journal of Human Ecology, 26(3), 163–173.
https://doi.org/10.1080/09709274.2009.11906178 .
195. Ochi, E., Jubarah, S. and Lado, M. M. (2015): A Case Study on Major Constraints of
Small Ruminants Management in Juba County Central Equatoria State South Sudan. 2.
196. Offor, E. I., Ekweanya, N. M., and Oleka, A. C. (2018): Effects of socio-economic
factors on small ruminant production in Ohafia Agricultural Zone of Abia State,
Nigeria. Agro-Science, 17(3), 7. https://doi.org/10.4314/as.v17i3.2.
197. Ogola, T. D. O., Nguyo, W. K. and Kosgey, I. S. (2010): Economic contribution and
viability of dairy goats: Implications for a breeding programme. Tropical Animal
Health and Production, 42(5), 875–885. https://doi.org/10.1007/s11250-009-9501-x .
198. Ojango, J., Audho, J., Oyieng, E., Recha, J. and Muigai, A. (2015): Sustainable small
ruminant breeding program for climate-smart villages in Kenya: Baseline household
survey report, (Copenhagen, Denmark: CGIAR Research Program on Climate Change,
Agriculture and Food Security (CCAFS)).
199. Ojango, J., Okeyo, A. and Rege, J. (2010): The Kenya Dual Purpose Goat
development project International Livestock Research Institute, 4–8.
https://cgspace.cgiar.org/handle/10568/3743 .
200. Ojango, J.M.K., Audho, J., Oyieng, E., Recha, J., Okeyo, A. M., Kinyangi, J., &
Muigai, A. W. T. (2016): System characteristics and management practices for small
ruminant production in “Climate Smart Villages” of Kenya. Animal Genetic
Resources/Ressources Génétiques Animales/Recursos Genéticos Animales, 58, 101–
110. https://doi.org/10.1017/s2078633615000417 .
91
201. Ojango, J.M.K., Oyieng, E.P., Audho, J. and Okeyo, A.M. (2014): Indigenous sheep
to help improve market access and livelihood security among pastoralists in Kenya:
Results of a baseline survey. Nairobi, Kenya: International Livestock Research
Institute.
202. Ojango, Julie M.K., Audho, J., Oyieng, E., Radeny, M., Kimeli, P., Recha, J. and
Muigai, A. W. T. (2018): Assessing actors in rural markets of sheep and goats in the
Nyando Basin of Western Kenya: a key to improving productivity from smallholder
farms. Tropical Animal Health and Production, 50(8), 1871–1879.
https://doi.org/10.1007/s11250-018-1638-z .
203. Oluwatayo, I., and Oluwatayo, T. (2012): Small Ruminants as a Source of Financial
Security: A Case Study of Women in Rural Southwest Nigeria. Journal of
Agribusiness and Rural Development. 49. 10.17306/J.JARD.2018.00358.
204. Omondi, I. (2008): Economic analysis of indigenous small ruminant breeds in the
pastoral system: a case of sheep and goats in Marsabit District, Kenya. Masters Thesis.
Egerton University.
205. Omondi, I.A., Baltenweck, I., Drucker, A.G., Obare, G. A. and Zander, K. K.
(2008):Valuing goat genetic resources: a pro-poor growth strategy in the Kenyan semi-
arid tropics. Trop Anim Health Prod 40, 583–596. https://doi.org/10.1007/s11250-008-
9137-2 .
206. Omonona, B. T., Lawal, J.O. and Oyinlana, A. O. (2010): Determinants of Credit
Constraint Conditions and Production Efficiency among Farming Households in
Southwestern Nigeria. African Association of Agricultural Economists (AAAE). 2010
AAAE Third Conference/AEASA 48th Conference, September 19-23, 2010, Cape
Town, South Africa. http://purl.umn.edu/95775.
207. Opiyo, F., Wasonga, O., Nyangito, M., Schilling, J. and Munang, R. (2015): Drought
Adaptation and Coping Strategies Among the Turkana Pastoralists of Northern Kenya.
International Journal of Disaster Risk Science, 6(3), 295–309.
https://doi.org/10.1007/s13753-015-0063-4 .
208. Oyebade, F. A. O., Adewumi, O. O. and James, I. J. (2012): Factors affecting birth
and weaning weights in lambs of Yankasa, West African dwarf breeds and their
crosses. J. Agric. Sci. Env. 12(2):89-95.
209. Oyinbo, O., Chamberlin, J., Vanlauwe, B., Vranken, L., Kamara, Y. A., Craufurd, P.,
and Maertens, M. (2019): Farmers’ preferences for high-input agriculture supported by
site-specific extension services: Evidence from a choice experiment in Nigeria.
Agricultural Systems, 173, 12–26. https://doi.org/10.1016/j.agsy.2019.02.003 .
210. Panin, A. (2000): A comparative economic analysis of smallholder cattle and small
ruminant production systems in Botswana. Tropical Animal Health and Production,
32(3), 189–196.
211. Parajuli, A. K., Kolachhapati, M. R., Bhattarai, N., and Devkota, N. R. (2015): Effect
of non genetic factors on reproductive performance of hill goat in Nawalparasi, Nepal.
Nepalese Journal of Agricultural Sciences Vol. 12 pp.198-203 ref.14.
212. Paten, A. M., Pain, S. J., Peterson, S. W., Lopez-Villalobos, N., Kenyon, P. R., &
Blair, H. T. (2017): Effect of dam weight and pregnancy nutrition on average lactation
performance of ewe offspring over 5 years. Animal :an international journal of animal
bioscience, 11(6), 1027–1035. https://doi.org/10.1017/S175173111600241X .
213. Peacock, C. (1996): ImprovingGoatProductionintheTropics. Manual for Development
Workers. Oxfam/FARM-Africa, Oxford.
214. Peacock, C. (2005): Goats — A pathway out of poverty. Small Ruminant Research
Volume 60, Issues 1–2, Pages 179-186.
92
215. Peacock, C. (2005): Goats:Unlocking their potential for Africa’s farmers. Seventh
Conference of Ministers Responsible for Animal Resources.
216. Peacock, C., Ahuya, C. O., Ojango, J. M. K., and Okeyo, A. M. (2011): Practical
crossbreeding for improved livelihoods in developing countries: The FARM Africa
goat project. Livestock Science, 136(1), 38–44.
https://doi.org/10.1016/j.livsci.2010.09.005.
217. Perry B.D., Randolph T.F., McDermott J.J., Sones K.R. and Thornton P.K. (2002):
Investing in animal health research to alleviate poverty. ILRI (International Livestock
Research), Nairobi, Kenya.
218. Peterman, A., Ng, S. W., Palermo, T. and Lee, I. E. (2013): Managing the double
burden: Effects of pregnancy on labor- intensive time use in rural China, Mexico and
Tanzania. Stud Fam Plann. 44(4): 411–430. doi: 10.1111/j.1728-4465.2013.00367.x.
219. Petros, A., Kassaye, A., and Shilima, B. (2014): Pre-weaning kid mortality in
Adamitulu Jedokombolcha District, Mid Rift Valley, Ethiopia. Journal of Veterinary
Medicine and Animal Health. 6.1-6. 10.5897/JVMAH13.0211.
220. Petrovic, M., Caro-Petrovic, V., Ruzic-Muslic, D., Maksimovic, N., Ilić, Z.,
Milosevic, B., Stojkovic, J. (2012): Some important factors affecting fertility in sheep.
Biotechnology in Animal Husbandry. 28. 517-528. 10.2298/BAH1203517P.
221. Pollott, G. and Wilson, T. R, (2009): Sheep and goats for diverse products and profits.
Diversification booklet number 9. Rural Infrastructure and Agro- Industries Division
Food and Agriculture Organization of the United Nations Rome, Italy.
222. Pragna, P., Chauhan, S. S., Sejian, V., Leury, B. J. and Dunshea, F. R. (2018):
Climate Change and Goat Production: Enteric Methane Emission and Its Mitigation.
Animals :an open access journal from MDPI, 8(12), 235.
https://doi.org/10.3390/ani8120235 .
223. Pulina, G., Avondo, M., Molle, G., Helena, A., Francesconi, D., Atzori, A. and
Cannas, A. (2013): Models for estimating feed intake in small ruminants. Revista
Brasileira de Zootecnia, 42(9), 675–690.
https://doi.org/10.1590/S151635982013000900010 .
224. Raburu, P. O. and Kwena, F. (2012): Community Based Approach to the
Management of Nyando Wetland , Lake Victoria Basin , Kenya. Nyando Wetland
Utility Resource Optimization Project, Ref:- AKEN/05/427, 68–79.
225. Recha T.O., Gachene, C. and Claessens, L. (2017): Adapting Nyando smallholder
farming systems to climate change and variability through modeling. African Journal
of Agricultural Research 2(26):2178-2187 DOI: 10.5897/AJAR2017.12421.
226. Robertson, I. D. (2020): Disease Control, Prevention and On-Farm Biosecurity: The
Role of Veterinary Epidemiology. Engineering, 6(1), 20–25.
https://doi.org/10.1016/j.eng.2019.10.004 .
227. Rocha, A., McKinnon, D. and Wilson R. T. (1990): Comparative performance of
Landim and Blackhead Persian sheep in Mozambique. Small Ruminant Research, 3,
527-538.
228. Rojas-Downing, M. M., Nejadhashemi, A. P., Harrigan, T., and Woznicki, S. A.
(2017). Climate change and livestock: Impacts, adaptation, and mitigation. Climate
Risk Management, 16, 145–163. https://doi.org/10.1016/j.crm.2017.02.001 .
229. Ruvuna, F., Cartwright, T. C., Taylor, J. F., Ahuya, C. and Chema, S. (1991): Factors
affecting body weight of East African and Galla goats. Small Ruminant
Research,Volume 4, Issue 4, 1991, Pages 339-347, https://doi.org/10.1016/0921-
4488(91)90080-A .
93
230. Safari, J., Mushi, D. E., Mtenga, L. A., Eik, L. O., Kifaro, G. C., Muhikambele, V. R.
M., Ndemanisho, E. E., Maeda Machang'u, A. D., Kassuku, A. A., Kimbita, E. N. and
Ulvund, M. (2005): A note on growth rates of local goats and their crosses with
Norwegian goats at village level in Tanzania. Livestock Research for Rural
Development. Volume 17, Art. #47. Retrieved November 24, 2020, from
http://www.lrrd.org/lrrd17/4/safa17047.htm .
231. Sahoo, A., Davendra, K., Naqvi, S.M.K. (Eds). (2013). Climate resilient small
ruminant production. National Initiative on Climate Resilient Agriculture (NICRA),
Central Sheep and Wool Research Institute, Izatnagar, India. p 1-106.
232. Salem, H. B. (2010): Nutritional management to improve sheep and goat
performances in semiarid regions. Revista Brasileira de Zootecnia, 39(suppl spe), 337–
347. https://doi.org/10.1590/s1516-35982010001300037 .
233. Sapkota, S., Pokharel, P. K., and Jha, P. K. (2012). Status of mid-western Khari
crossbred goat (khari x jamunapari): a case of Surkhet valley. Proceedings of the
National Workshop on Research and Development Strategies for Goat Enterprises in
Nepal (2012): 251-260.
234. Sarma, L., Nahardeka, N., Goswami, R. N., Aziz, A., Zaman, G., Das, A., and Akhtar,
F. (2019). Non-genetic factors affecting pre-weaning growth and morphometric traits
in Assam Hill goat. Veterinary world, 12(8), 1327–1331.
https://doi.org/10.14202/vetworld.2019.1327-1331 .
235. Sebei, P.J., McCrindle, C.M., and Webb, E.C. (2004). Factors influencing weaning
percentages of indigenous goats on communal grazing.
236. Segura-Correa, J. C., Magaña-Monforte, J. G., Ake-Lopez, J. R., and Segura-Correa,
V. M. (2017): Season and parity number influence the conception rate of zebu breed
cows in South-eastern Mexico. Livestock Research for Rural Development. Volume
29, Article #215. Retrieved August 23, 2020, from
http://www.lrrd.org/lrrd29/11/jose29215.html .
237. Sejian, V., (2013): Climate Change: Impact on Production and Reproduction,
Adaptation Mechanisms and Mitigation Strategies in Small Ruminants: a Review. The
Indian Journal of Small Ruminants, 19(1), 1–21. https://doi.org/10.1016/0014-
5793(94)00957-0.
238. Sejian, V., Bhatta, R., Gaughan, J., Dunshea, F., & Lacetera, N. (2018): Review:
Adaptation of animals to heat stress. Animal, 12(S2), S431-S444.
doi:10.1017/S1751731118001945.
239. Sejian, V., Maurya, V.P., Kumar, K., and Naqvi, S. M. K. (2012): Effect of multiple
stresses on growth and adaptive capability of Malpura ewes under semi-arid tropical
environment. Tropical Animal Health and Production 45, 107–116 (2012).
https://doi.org/10.1007/s11250-012-0180-7.
240. Shrestha BS, Pokharel PK. (2012): Potential and performances of goat breeds and
future breeding strategies for commercialization of goat production in Nepal.
Proceedings of the National Workshop on Research and Development Strategies for
Goat Enterprises in Nepal (2012): 14-22.
241. Shrestha, J. N. B. (2005): Conserving domestic animal diversity among composite
populations. Small Ruminant Research, 56, 3–20.
https://doi.org/10.1016/j.smallrumres.2004.06.014 .
242. Shrestha, J. N. B., and Fahmy, M.H. (2007): Breeding goats for meat production.
Small Ruminant Research, 67(2–3), 93–112.
243. Shrestha, N. B. and Fahmy, M.H. (2005): Breeding goats for meat production: a
review: Genetic resources, management and breed evaluation, Small Ruminant
94
Research, Volume 58, Issue 2, Pages 93-106, https://doi.org/10.1016/S0921-
4488(03)00183-4 .
244. Shrestha, S. P., Kunwar, B. L. and Prajapati, M. (2012): Enhancement of productivity
on goats with economical supplementation. Proceedings of the National Workshop on
Research and Development Strategies for Goat Enterprises in Nepal, 200–204.
245. Silanikove, N. (2000): The physiological basis of adaptation in goats to harsh
environments. Small Ruminant Research, 35(3), 181–193.
https://doi.org/10.1016/S0921-4488(99)00096-6.
246. Singh, E., Kaur, P., Singla, L. D., and Bal, M. S. (2017): Prevalence of
gastrointestinal parasitism in small ruminants in western zone of Punjab, India.
Veterinary World, 10(1), 61–66. https://doi.org/10.14202/vetworld.2017.61-66.
247. Singh, R., and Singh, G. S. (2017): Traditional agriculture: a climate-smart approach
for sustainable food production. Energy, Ecology and Environment, 2(5), 296–316.
https://doi.org/10.1007/s40974-017-0074-7.
248. Smith, T., Godfrey, S.H., Buttery, P. J. and Owen, E. (2004): The contribution of
small ruminants in alleviating poverty: communicating messages from research:
Proceedings of the third DFID Livestock Production Programme Link Project (R7798)
workshop for small ruminant keepers. Izaak Walton Inn, Embu, Kenya, 4-7 February
2003. Natural Resources International Ltd, Aylesford, Kent, UK.
249. Song, H. B., Jo, I. H. and Sol, H. S. (2006): Reproductive performance of Korean
native goats under natural and intensive conditions, Small Ruminant Research, 65(3)
Volume 65, Issue 3, Pages 284-287, ISSN 0921-4488.
https://doi.org/10.1016/j.smallrumres.2005.08.001.
250. Soundararajan, C., Sivakumar, T., and Palanidorai, R. (2006): Factors affecting birth
weight in goats. Indian Veterinary Journal, 83(7), 803–804.
251. Ssewannyana, E., Oluka J. and Masaba, J. K. (2004): Growth and performance of
indigenous and crossbred goats. Uganda Journal of Agricultural sciences, 9: 537-542
252. Staal, S.J., Waithaka, M., Njoroge, L., Mwangi, D.M., Njubi, D., and Wokabi, A.
(2003): Costs of milk production in Kenya: estimates from Kiambu, Nakuru and
Nyandarua districts. SDP Research and Development Report No. 1. Nairobi (Kenya):
Smallholder Dairy (R&D) Project.
253. Subramaniyan, M., Thanga, T., Subramanian, M., and Senthilnayagam, H. (2016):
Factors Affecting Pre-weaning Survivability of Kids in an Organized Goat Farm.
International Journal of Livestock Research, 6(11), 83.
https://doi.org/10.5455/ijlr.20161119100950.
254. Tabreze, M. M. S. (2018): The growth performance of Black Bengal Goat in village
condition. A Thesis Submitted to the Faculty of Animal Science & Veterinary
Medicine, Sher-e-Bangla Agricultural University, Dhaka-1207, in partial fulfillment of
the requirements for the degree of Master of Science (MSc) in Animal nutrition,
genetics and breeding.
255. Tadesse, D.M.U., Getachew, A., and Yoseph, M. (2014): Flock structure, level of
production, and marketing of three Ethiopian goat types kept under different
production systems. Livestock Research for Rural Development, 26, 5.
256. Tamou, C. (2017): Understanding relations between pastoralism and its changing
natural environment. Phd Thesis, Wageningen University. Retrieved from
http://edepot.wur.nl/411051.
257. Taye, M. T. (2008): On-farm performances of Washera sheep at Yilmanadensa and
Quarit districts of Amhara National Regional State. MSc Thesis, Hawassa University,
Hawassa, Ethiopia.
95
258. Tedeschi, L. O., Molle, G., Menendez, H. M., Cannas, A. and Fonseca, M. A. (2019):
The assessment of supplementation requirements of grazing ruminants using nutrition
models. Translational Animal Science, 3(2), 811–823.
https://doi.org/10.1093/tas/txy140.
259. Tegegn, F., Kefyalew, A. and Solomon, A. (2016): Characterization of goat
production systems and trait preferences of goat keepers in Bench Maji zone, south
western Ethiopia. African Journal of Agricultural Research, 11(30), 2768–2774.
https://doi.org/10.5897/ajar2015.10170.
260. Teklebrhan, T. (2018): Growth performance of crossbred kids ( Boer x Indigenous
Goat Breeds). Journal of Agriculture and Environment for International Development -
JAEID, 112 (1): 101-107 DOI: 10.12895/jaeid.20181.700.
261. Thiruvenkadan, A.K., Murugan, M., Karunanithi, K., Muralidharan, J., and
Chinnamani, K. (2009): Genetic and non-genetic factors affecting body weight in
Tellicherry goats. South African Journal of Animal Science, 39(5), 107-111.
262. Thorlakson, T., and Neufeldt, H. (2011): Reducing Subsistence Farmers’
Vulnerability to Climate Change: The Potential Contributions of Agroforestry in
Western Kenya. World Agroforestry Centre Occasional Paper 16. Agriculture & Food
Security, 1(15), 1–13.
263. Thornton, P. K. (2010): Livestock production: Recent trends, future prospects.
Philosophical Transactions of the Royal Society B: Biological Sciences, 365(1554),
2853–2867. https://doi.org/10.1098/rstb.2010.0134.
264. Thornton, P.K., and Herrero, M. (2010): Potential for reduced methane and carbon
dioxide emissions from livestock and pasture management in the tropics. Proc. Natl.
Acad. Sci. USA 2010. Pubmed, (107), 19667–19672.
265. Tibbo, M. (2006): Productivity and health of indigenous sheep breeds and crossbreds
in central Ethiopian Highlands. PhD dissertation. Uppsala, Sweden: Swedish
University of Agricultural Sciences.
266. Timpong-Jones, E. C., Adogla-Bessa, T., Adjorlolo, L. K., and Sarkwa, F. O. (2014):
Some constraints of ruminant livestock production in the Coastal Savannah Plains of
Ghana. Livestock Research for Rural Development. Volume 26, Article #84.
http://www.lrrd.org/lrrd26/5/timp26084.html.
267. Tulicha, A.Y. (2013): The Impact of Small Ruminant Diseases on Food Availability
and Accessibility of Pastoral Households in Ethiopia: The Case of Liben District in
Oromiya Region. Doctoral Dissertation. Rural Dev. Food Secur. Van Hall Larenstein
University of Applied Sciences, Wageningen University, Netherlands.
268. Turkmen, N. (2017): The Nutritional Value and Health Benefits of Goat Milk
Components, Editor(s): Ronald Ross Watson, Robert J. Collier, Victor R. Preedy,
Nutrients in Dairy and their Implications on Health and Disease, Academic Press,
Pages 441-449, ISBN 9780128097625, https://doi.org/10.1016/B978-0-12-809762-
5.00035-8.
269. Turkson, P. K. and Naandam, J. (2011): Constraints to ruminant production in East
Mamprusi District of Ghana. Ghana Journal of Agricultural Science, 39(2), 155–164.
https://doi.org/10.4314/gjas.v39i2.2138.
270. Turkson, P. and Sualisu, M. (2005): Risk Factors for Lamb Mortality in Sahelian
Sheep on a breeding Station in Ghana. Tropical Animal Health and Production 37, 49–
64 (2005). https://doi.org/10.1023/B:TROP.0000047935.78168.46.
271. Turner, K.E., Belesky, D. P., Cassida, K.A. and Zerby, H. N. (2014): Carcass merit
and meat quality in Suffolk lambs, Katahdin lambs, and meat-goat kids finished on a
grass–legume pasture with and without supplementation. Meat Science Volume 98,
96
Issue 2, Pages 211-219.
272. Wanyoike, F., Mtimet, N., Mugunieri, G., Ndiwa, N., Warsame, A. and Marshall, K.
(2015): Knowledge and exploitation of small ruminant grading and pricing systems
among Somaliland livestock producers. ILRI Research Report. 36. pp 29.
273. Warui, H., Kaufmann, B., Hulsebusch, C., Piepho, H.P. and Zarate, A.N. (2007):
Reproductive performance of local goats in extensive production systems of arid
Northern Kenya. In: Conference on International Research for Agricultural
Development. Tropentag. University of Kassel-Witzenhausen and university of
Gottingen, October 9–11, 2007.
274. Wheeler, T. and Reynolds, C. (2012): Predicting the risks from climate change to
forage and crop production for animal feed. Animal Frontiers, 3(1), 36–41.
https://doi.org/10.2527/af.2013-0006.
275. Williams, P.A., Crespo, O. and Essegbey, G. O. (2017): Economic Implications of a
Changing Climate on Smallholder Pineapple Production in Ghana. Journal of
Economics and Sustainable Development, 8, 34–43.
276. Wodajo, H. D., Gemeda, B. A., Kinati, W., Mulem, A. A., van Eerdewijk, A. and
Wieland, B. (2020): Contribution of small ruminants to food security for Ethiopian
smallholder farmers. Small Ruminant Research, 184, 106064.
https://doi.org/10.1016/j.smallrumres.2020.106064.
277. Wolff, C., Abigaba, S. and Sternberg L. S. (2019): Ugandan cattle farmers’ perceived
needs of disease prevention and strategies to improve biosecurity. BMC Veterinary
Research, 15(1), 1–11. https://doi.org/10.1186/s12917-019-1961-2 .
278. World Bank (2014): Levelling the field, improving opportunities for women farmers
in Africa (Washington, DC).
279. World Bank (2019): Productive diversification in African Agriculture and its effects
on resilience and nutrition.
280. Wurzinger, M., Sölkner, J. and Iñiguez, L. (2011): Important aspects and limitations
in considering community-based breeding programs for low-input smallholder
livestock systems. Small Ruminant Research, 98(1–3), 170–175.
https://doi.org/10.1016/j.smallrumres.2011.03.035.
281. Wurzinger, M., Willam, A., Delgado, J., Nürnberg, M., Valle Zarate, A., Stemmer,
A., Ugarte, G., and Sölkner, J. (2008): Design of a village breeding programme for a
llama population in the High Andes of Bolivia. Journal of Animal Breeding and
Genetics, 125, (5)(311), 319.
282. Yadav, B., Singh, G., Verma, A. K., Dutta, N. and Sejian, V. (2013):Impact of heat
stress on rumen functions. Veterinary World, 6(12), 992–996.
https://doi.org/10.14202/vetworld.2013.992-996.
283. Yami, A. and Merkel, R. C. (2008). Sheep and Goat Production Handbook for
Ethiopia. Ethiopia Sheep and Goat Productivity Improvement Program. 2008.
Retrieved from https://archive.org/details/ SheepGoatHandbook.
284. Yiheyis, A., Tegegn, F., H/Melekot, M. and Taye, M. (2012): Pre-weaning growth
performance of Sekota sheep breed in Waghimra zone, Ethiopia. Online Journal of
Animal and Feed Research Volume 2, Issue 4: 340-343.
285. Zahraddeen D., Butswat, I. S. R. and Mbap, S.T. (2008): Evaluation of some factors
influencing growth performance of local goats in Nigeria. African Journal of Food
Agriculture, Nutrition and Development Volume 8 No. 4.
286. Zegeye, T., Ali, A., Kebede, A., Renström, K. and Shone, G. (2000): Estimating Costs
and Benefits on Crop Production: A Simplified Guide for Smallholder Farmers in
97
Ethiopia. Regional Land Management Unit (RELMA), SIDA. Technical Report No.
24. Tropical Animal Health and Production, 42, 1531–1539.
287. Zeleke, Z. M. (2007): Environmental influences on pre-weaning growth
performances and mortality rates of extensively managed Somali goats in Eastern
Ethiopia. Livestock Research for Rural Development., Volume 19,(Article #186.).
Retrieved from http://www.lrrd.org/lrrd19/12/zele19186.htm.
288. Zvinorova, P. I., Halimani, T. E., Muchadeyi, F. C., Matika, O., Riggio, V., and
Dzama, K. (2016): Prevalence and risk factors of gastrointestinal parasitic infections in
goats in low-input low-output farming systems in Zimbabwe. Small Ruminant
Research, 143, 75–83. https://doi.org/10.1016/j.smallrumres.2016.09.005.
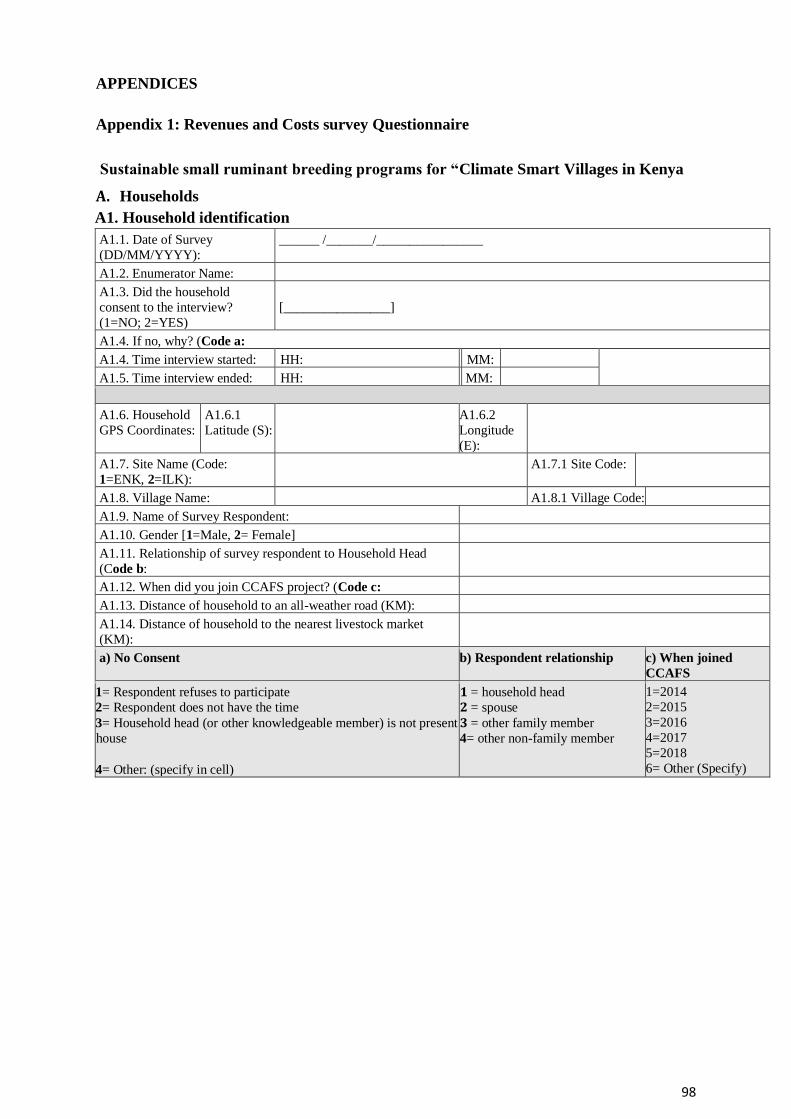
98
APPENDICES
Appendix 1: Revenues and Costs survey Questionnaire
Sustainable small ruminant breeding programs for “Climate Smart Villages in Kenya
A. Households
A1. Household identification
A1.1. Date of Survey
(DD/MM/YYYY):
______ /_______/________________
A1.2. Enumerator Name:
A1.3. Did the household
consent to the interview?
(1=NO; 2=YES)
[________________]
A1.4. If no, why? (Code a:
A1.4. Time interview started: HH: MM:
A1.5. Time interview ended: HH: MM:
A1.6. Household
GPS Coordinates:
A1.6.1
Latitude (S):
A1.6.2
Longitude
(E):
A1.7. Site Name (Code:
1=ENK, 2=ILK): A1.7.1 Site Code:
A1.8. Village Name: A1.8.1 Village Code:
A1.9. Name of Survey Respondent:
A1.10. Gender [1=Male, 2= Female]
A1.11. Relationship of survey respondent to Household Head
(Code b:
A1.12. When did you join CCAFS project? (Code c:
A1.13. Distance of household to an all-weather road (KM):
A1.14. Distance of household to the nearest livestock market
(KM):
a) No Consent b) Respondent relationship c) When joined
CCAFS
1 1= Respondent refuses to participate
2 2= Respondent does not have the time
3 3= Household head (or other knowledgeable member) is not present
at the house
4 4= Other: (specify in cell)
1 = household head
2 = spouse
3 = other family member
4= other non-family member
1=2014
2=2015
3=2016
4=2017
5=2018
6= Other (Specify)
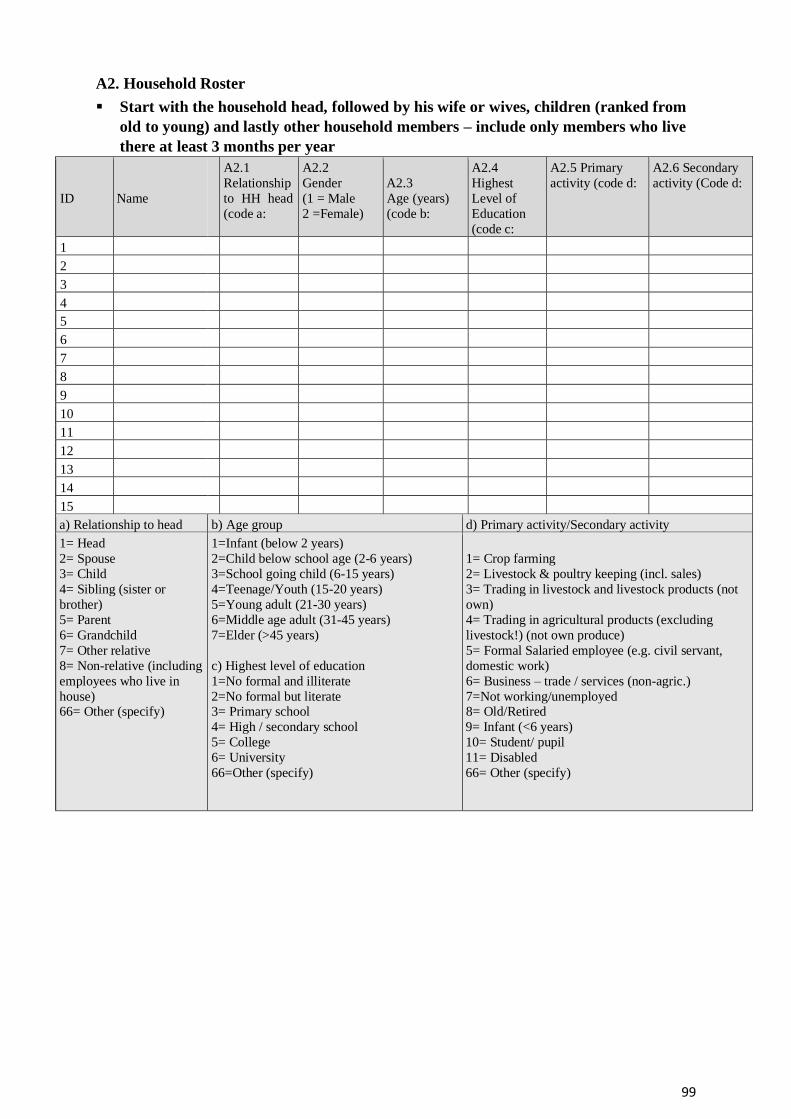
99
A2. Household Roster
▪ Start with the household head, followed by his wife or wives, children (ranked from
old to young) and lastly other household members – include only members who live
there at least 3 months per year
ID Name
A2.1
Relationship
to HH head
(code a:
A2.2
Gender
(1 = Male
2 =Female)
A2.3
Age (years)
(code b:
A2.4
Highest
Level of
Education
(code c:
A2.5 Primary
activity (code d:
A2.6 Secondary
activity (Code d:
1
2
3
4
5
6
7
8
9
10
11
12
13
14
15
a) Relationship to head b) Age group d) Primary activity/Secondary activity
1= Head
2= Spouse
3= Child
4= Sibling (sister or
brother)
5= Parent
6= Grandchild
7= Other relative
8= Non-relative (including
employees who live in
house) 66= Other (specify)
1=Infant (below 2 years)
2=Child below school age (2-6 years)
3=School going child (6-15 years)
4=Teenage/Youth (15-20 years)
5=Young adult (21-30 years)
6=Middle age adult (31-45 years)
7=Elder (>45 years)
c) Highest level of education
1=No formal and illiterate
2=No formal but literate 3= Primary school
4= High / secondary school
5= College
6= University
66=Other (specify)
1= Crop farming
2= Livestock & poultry keeping (incl. sales)
3= Trading in livestock and livestock products (not
own)
4= Trading in agricultural products (excluding
livestock!) (not own produce)
5= Formal Salaried employee (e.g. civil servant,
domestic work)
6= Business – trade / services (non-agric.)
7=Not working/unemployed 8= Old/Retired
9= Infant (<6 years)
10= Student/ pupil
11= Disabled
66= Other (specify)
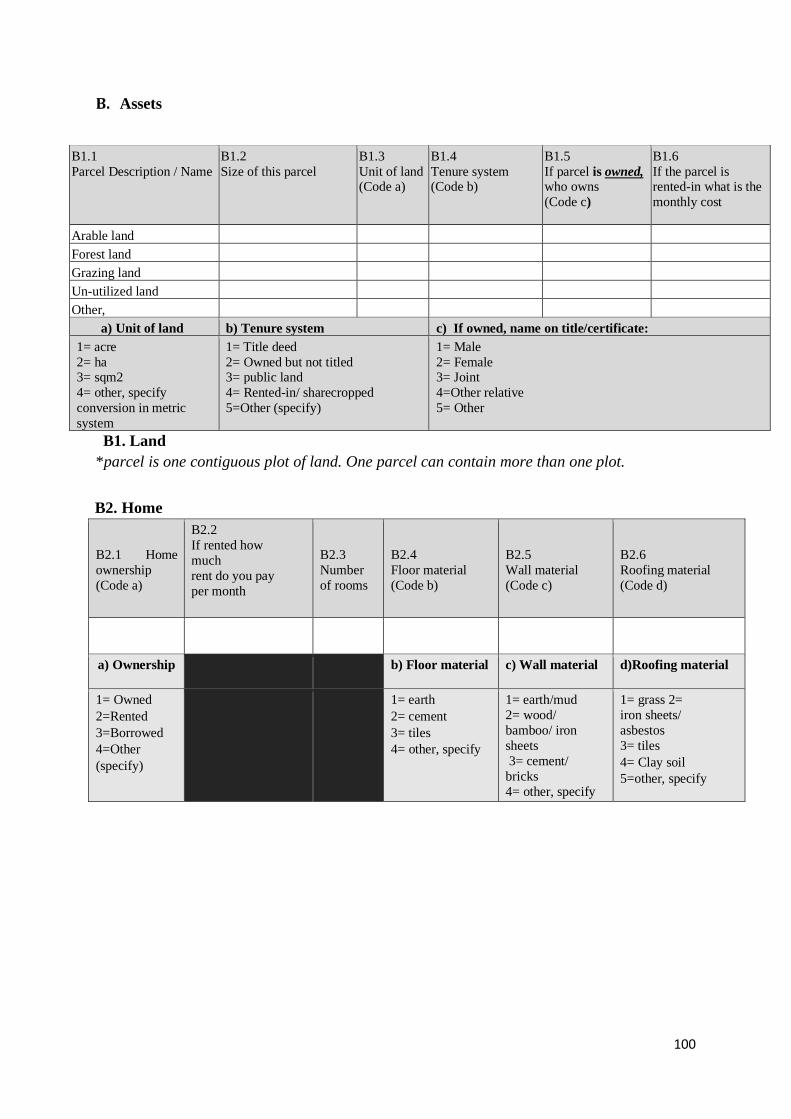
100
B. Assets
B1. Land
*parcel is one contiguous plot of land. One parcel can contain more than one plot.
B2. Home
B2.1 Home
ownership
(Code a)
B2.2
If rented how
much
rent do you pay
per month
B2.3
Number
of rooms
B2.4
Floor material
(Code b)
B2.5
Wall material
(Code c)
B2.6
Roofing material
(Code d)
a) Ownership b) Floor material c) Wall material d)Roofing material
1= Owned
2=Rented
3=Borrowed
4=Other
(specify)
1= earth
2= cement
3= tiles
4= other, specify
1= earth/mud
2= wood/
bamboo/ iron
sheets
3= cement/
bricks
4= other, specify
1= grass 2=
iron sheets/
asbestos
3= tiles
4= Clay soil
5=other, specify
B1.1
Parcel Description / Name
B1.2
Size of this parcel
B1.3
Unit of land (Code a)
B1.4
Tenure system (Code b)
B1.5
If parcel is owned, who owns
(Code c)
B1.6
If the parcel is rented-in what is the
monthly cost
Arable land
Forest land
Grazing land
Un-utilized land
Other,
a) Unit of land b) Tenure system c) If owned, name on title/certificate:
1= acre
2= ha 3= sqm2
4= other, specify
conversion in metric
system
1= Title deed
2= Owned but not titled 3= public land
4= Rented-in/ sharecropped
5=Other (specify)
1= Male
2= Female 3= Joint
4=Other relative
5= Other
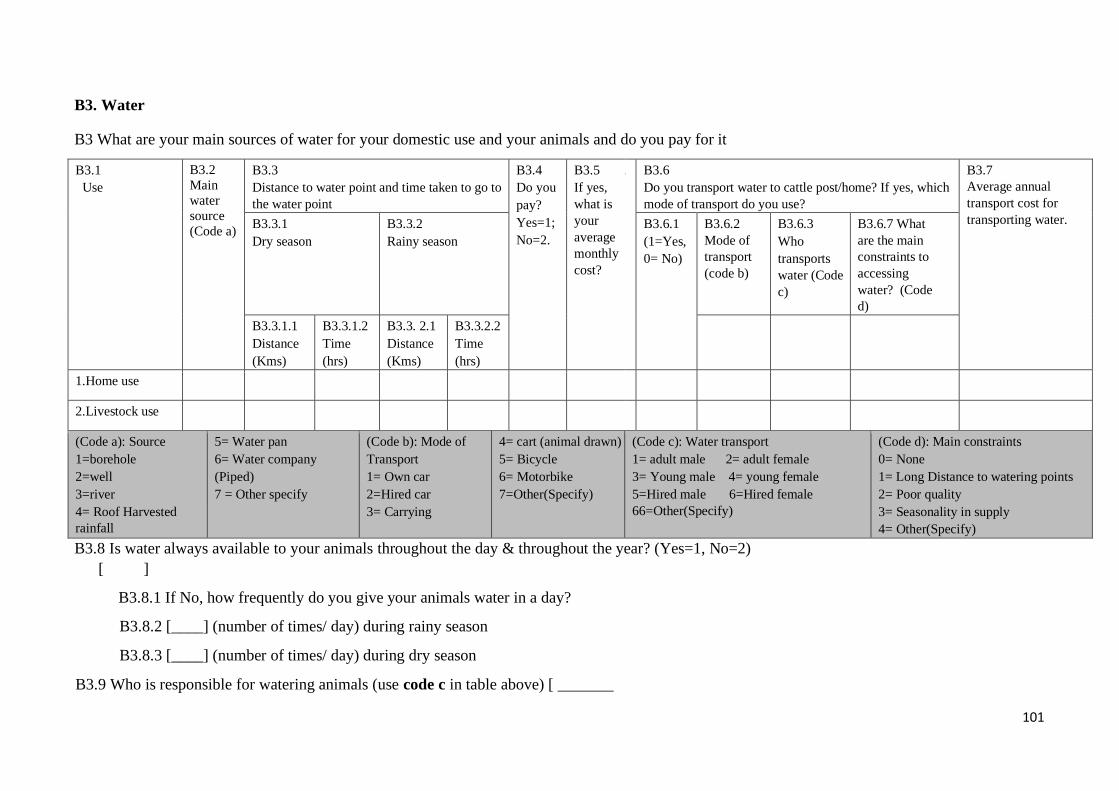
101
B3. Water
B3 What are your main sources of water for your domestic use and your animals and do you pay for it
B3.1
Use
B3.2
Main
water
source
(Code a)
B3.3
Distance to water point and time taken to go to
the water point
B3.4
Do you
pay?
Yes=1;
No=2.
B3.5
If yes,
what is
your
average
monthly
cost?
. B3.6
Do you transport water to cattle post/home? If yes, which
mode of transport do you use?
B3.7
Average annual
transport cost for
transporting water. B3.3.1
Dry season
B3.3.2
Rainy season
B3.6.1
(1=Yes,
0= No)
B3.6.2
Mode of
transport
(code b)
B3.6.3
Who
transports
water (Code
c)
B3.6.7 What
are the main
constraints to
accessing
water? (Code
d)
B3.3.1.1
Distance
(Kms)
B3.3.1.2
Time
(hrs)
B3.3. 2.1
Distance
(Kms)
B3.3.2.2
Time
(hrs)
1.Home use
2.Livestock use
(Code a): Source
1=borehole
2=well
3=river
4= Roof Harvested
rainfall
5= Water pan
6= Water company
(Piped)
7 = Other specify
(Code b): Mode of
Transport
1= Own car
2=Hired car
3= Carrying
4= cart (animal drawn)
5= Bicycle
6= Motorbike
7=Other(Specify)
(Code c): Water transport
1= adult male 2= adult female
3= Young male 4= young female
5=Hired male 6=Hired female
66=Other(Specify)
(Code d): Main constraints
0= None
1= Long Distance to watering points
2= Poor quality
3= Seasonality in supply
4= Other(Specify)
B3.8 Is water always available to your animals throughout the day & throughout the year? (Yes=1, No=2)
[ ]
B3.8.1 If No, how frequently do you give your animals water in a day?
B3.8.2 [____] (number of times/ day) during rainy season
B3.8.3 [____] (number of times/ day) during dry season
B3.9 Who is responsible for watering animals (use code c in table above) [ _______
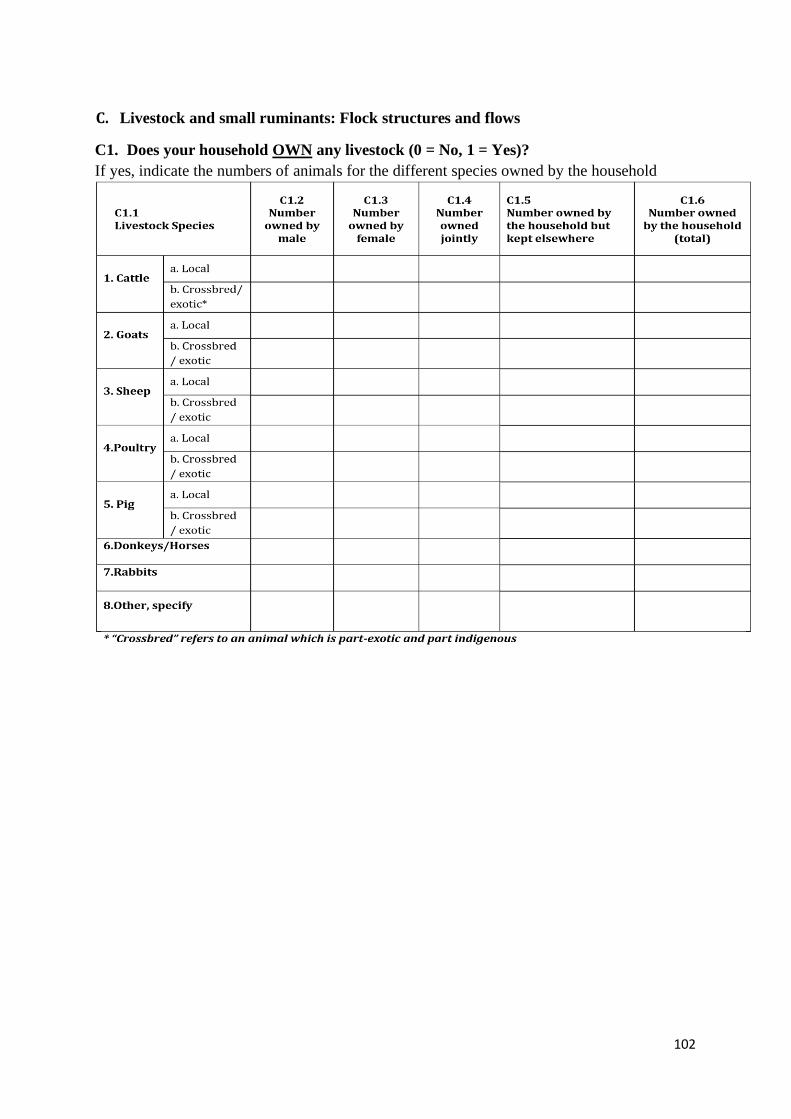
102
C. Livestock and small ruminants: Flock structures and flows
C1. Does your household OWN any livestock (0 = No, 1 = Yes)?
If yes, indicate the numbers of animals for the different species owned by the household
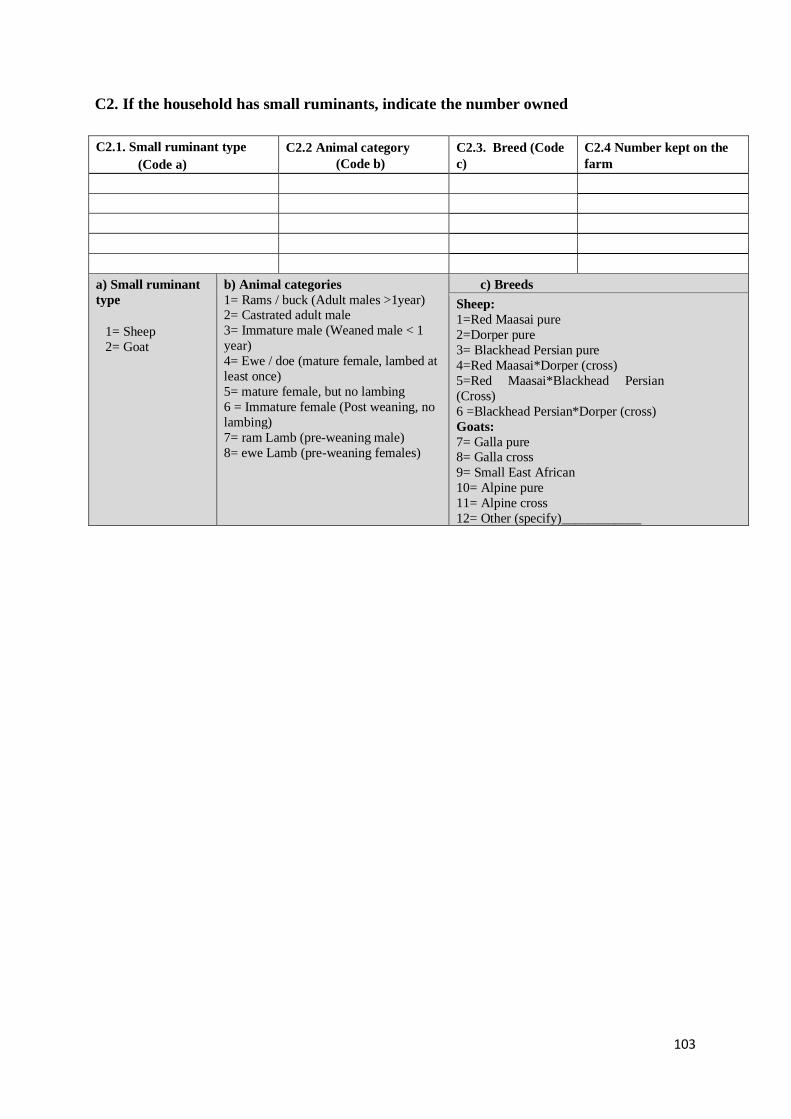
103
C2. If the household has small ruminants, indicate the number owned
C2.1. Small ruminant type
(Code a)
C2.2 Animal category
(Code b)
C2.3. Breed (Code
c)
C2.4 Number kept on the
farm
a) Small ruminant
type
1= Sheep
2= Goat
b) Animal categories
1= Rams / buck (Adult males >1year) 2= Castrated adult male
3= Immature male (Weaned male < 1
year)
4= Ewe / doe (mature female, lambed at
least once)
5= mature female, but no lambing
6 = Immature female (Post weaning, no
lambing)
7= ram Lamb (pre-weaning male)
8= ewe Lamb (pre-weaning females)
c) Breeds
Sheep:
1=Red Maasai pure
2=Dorper pure
3= Blackhead Persian pure
4=Red Maasai*Dorper (cross)
5=Red Maasai*Blackhead Persian
(Cross)
6 =Blackhead Persian*Dorper (cross)
Goats:
7= Galla pure 8= Galla cross
9= Small East African
10= Alpine pure
11= Alpine cross
12= Other (specify)____________
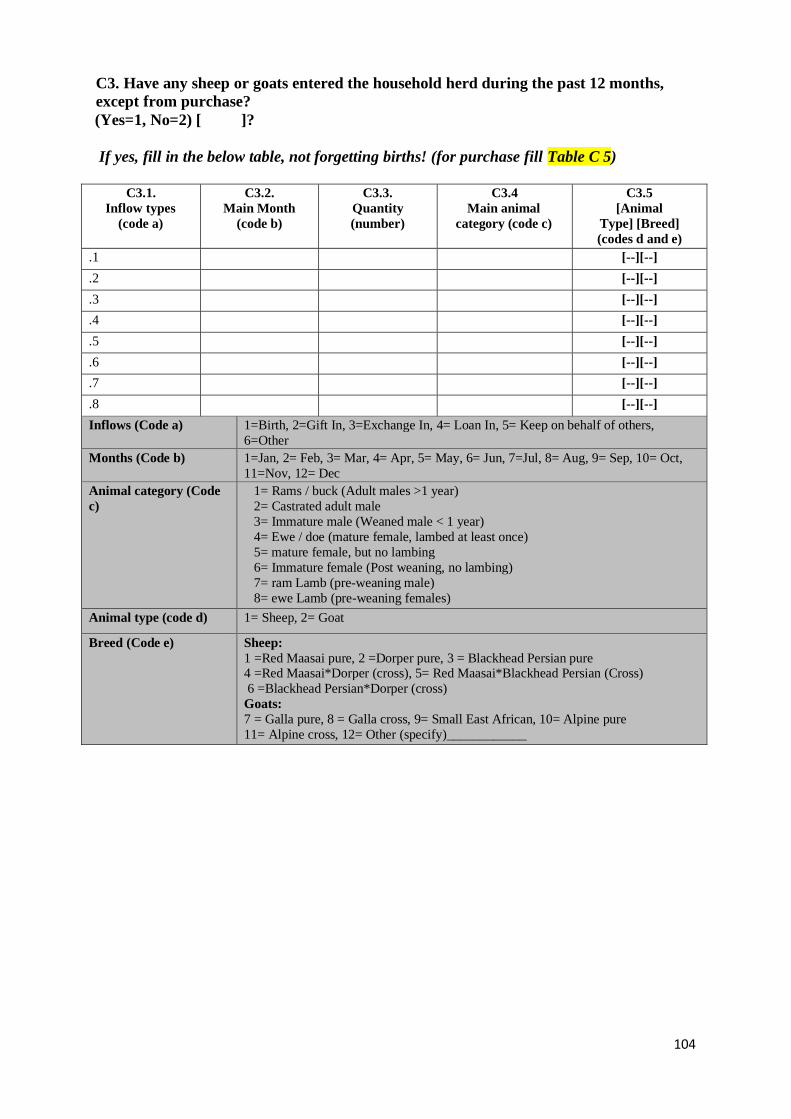
104
C3. Have any sheep or goats entered the household herd during the past 12 months,
except from purchase?
(Yes=1, No=2) [ ]?
If yes, fill in the below table, not forgetting births! (for purchase fill Table C 5)
C3.1.
Inflow types
(code a)
C3.2.
Main Month
(code b)
C3.3.
Quantity
(number)
C3.4
Main animal
category (code c)
C3.5
[Animal
Type] [Breed]
(codes d and e)
.1 [--][--]
.2 [--][--]
.3 [--][--]
.4 [--][--]
.5 [--][--]
.6 [--][--]
.7 [--][--]
.8 [--][--]
Inflows (Code a) 1=Birth, 2=Gift In, 3=Exchange In, 4= Loan In, 5= Keep on behalf of others,
6=Other
Months (Code b) 1=Jan, 2= Feb, 3= Mar, 4= Apr, 5= May, 6= Jun, 7=Jul, 8= Aug, 9= Sep, 10= Oct,
11=Nov, 12= Dec
Animal category (Code
c)
1= Rams / buck (Adult males >1 year)
2= Castrated adult male
3= Immature male (Weaned male < 1 year)
4= Ewe / doe (mature female, lambed at least once)
5= mature female, but no lambing
6= Immature female (Post weaning, no lambing)
7= ram Lamb (pre-weaning male)
8= ewe Lamb (pre-weaning females)
Animal type (code d) 1= Sheep, 2= Goat
Breed (Code e) Sheep:
1 =Red Maasai pure, 2 =Dorper pure, 3 = Blackhead Persian pure 4 =Red Maasai*Dorper (cross), 5= Red Maasai*Blackhead Persian (Cross)
6 =Blackhead Persian*Dorper (cross)
Goats:
7 = Galla pure, 8 = Galla cross, 9= Small East African, 10= Alpine pure
11= Alpine cross, 12= Other (specify)____________
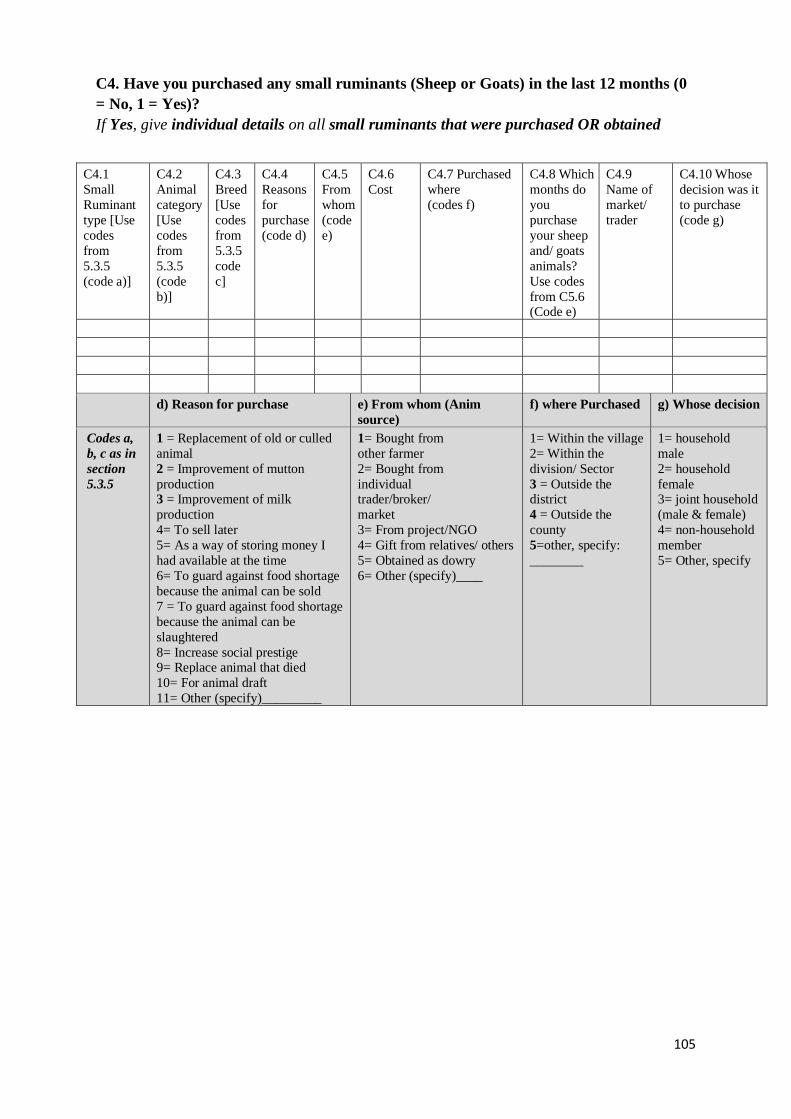
105
C4. Have you purchased any small ruminants (Sheep or Goats) in the last 12 months (0
= No, 1 = Yes)?
If Yes, give individual details on all small ruminants that were purchased OR obtained
C4.1
Small
Ruminant
type [Use
codes
from
5.3.5
(code a)]
C4.2
Animal
category
[Use
codes
from
5.3.5
(code
b)]
C4.3
Breed
[Use
codes
from
5.3.5
code
c]
C4.4
Reasons
for
purchase
(code d)
C4.5
From
whom
(code
e)
C4.6
Cost
C4.7 Purchased
where
(codes f)
C4.8 Which
months do
you
purchase
your sheep
and/ goats
animals?
Use codes
from C5.6 (Code e)
C4.9
Name of
market/
trader
C4.10 Whose
decision was it
to purchase
(code g)
d) Reason for purchase e) From whom (Anim
source)
f) where Purchased g) Whose decision
Codes a,
b, c as in
section
5.3.5
1 = Replacement of old or culled
animal
2 = Improvement of mutton
production 3 = Improvement of milk
production
4= To sell later
5= As a way of storing money I
had available at the time
6= To guard against food shortage
because the animal can be sold
7 = To guard against food shortage
because the animal can be
slaughtered
8= Increase social prestige 9= Replace animal that died
10= For animal draft
11= Other (specify)_________
1= Bought from
other farmer
2= Bought from
individual trader/broker/
market
3= From project/NGO
4= Gift from relatives/ others
5= Obtained as dowry
6= Other (specify)____
1= Within the village
2= Within the
division/ Sector
3 = Outside the district
4 = Outside the
county
5=other, specify:
________
1= household
male
2= household
female 3= joint household
(male & female)
4= non-household
member
5= Other, specify
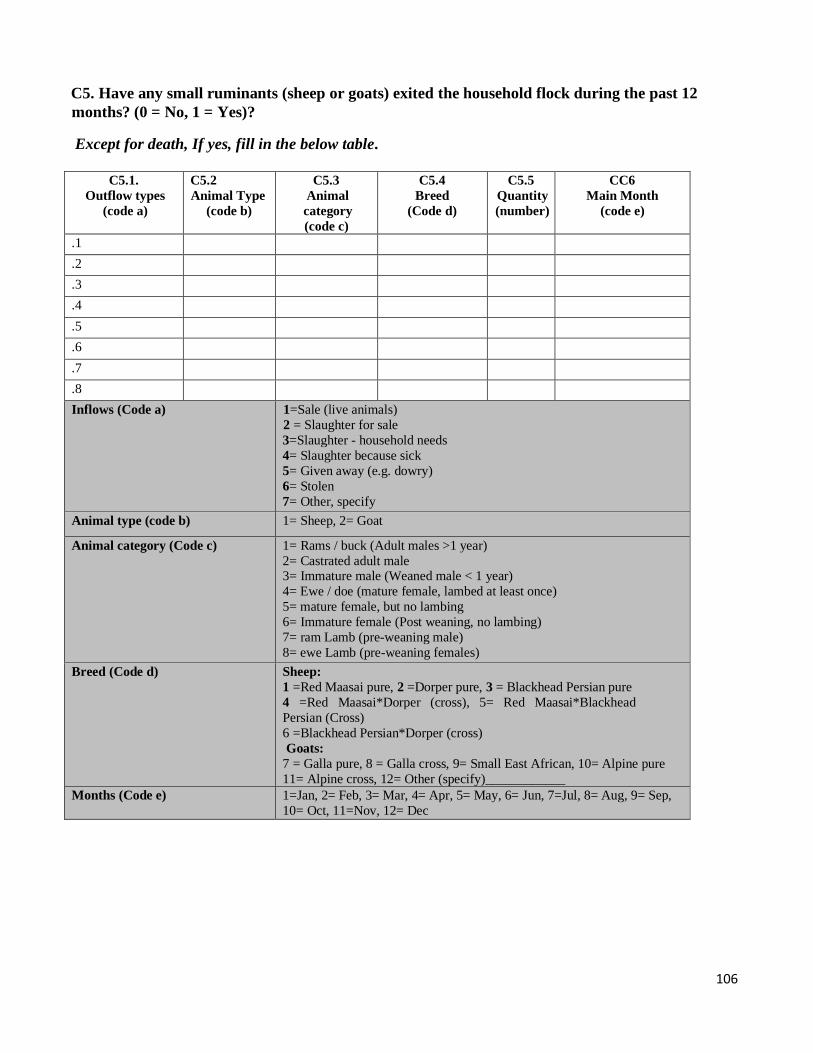
106
C5. Have any small ruminants (sheep or goats) exited the household flock during the past 12
months? (0 = No, 1 = Yes)?
Except for death, If yes, fill in the below table.
C5.1.
Outflow types
(code a)
C5.2
Animal Type
(code b)
C5.3
Animal
category
(code c)
C5.4
Breed
(Code d)
C5.5
Quantity
(number)
CC6
Main Month
(code e)
.1
.2
.3
.4
.5
.6
.7
.8
Inflows (Code a) 1=Sale (live animals)
2 = Slaughter for sale
3=Slaughter - household needs
4= Slaughter because sick
5= Given away (e.g. dowry)
6= Stolen
7= Other, specify
Animal type (code b) 1= Sheep, 2= Goat
Animal category (Code c) 1= Rams / buck (Adult males >1 year)
2= Castrated adult male 3= Immature male (Weaned male < 1 year)
4= Ewe / doe (mature female, lambed at least once)
5= mature female, but no lambing
6= Immature female (Post weaning, no lambing)
7= ram Lamb (pre-weaning male)
8= ewe Lamb (pre-weaning females)
Breed (Code d) Sheep:
1 =Red Maasai pure, 2 =Dorper pure, 3 = Blackhead Persian pure
4 =Red Maasai*Dorper (cross), 5= Red Maasai*Blackhead
Persian (Cross)
6 =Blackhead Persian*Dorper (cross)
Goats:
7 = Galla pure, 8 = Galla cross, 9= Small East African, 10= Alpine pure
11= Alpine cross, 12= Other (specify)____________
Months (Code e) 1=Jan, 2= Feb, 3= Mar, 4= Apr, 5= May, 6= Jun, 7=Jul, 8= Aug, 9= Sep,
10= Oct, 11=Nov, 12= Dec
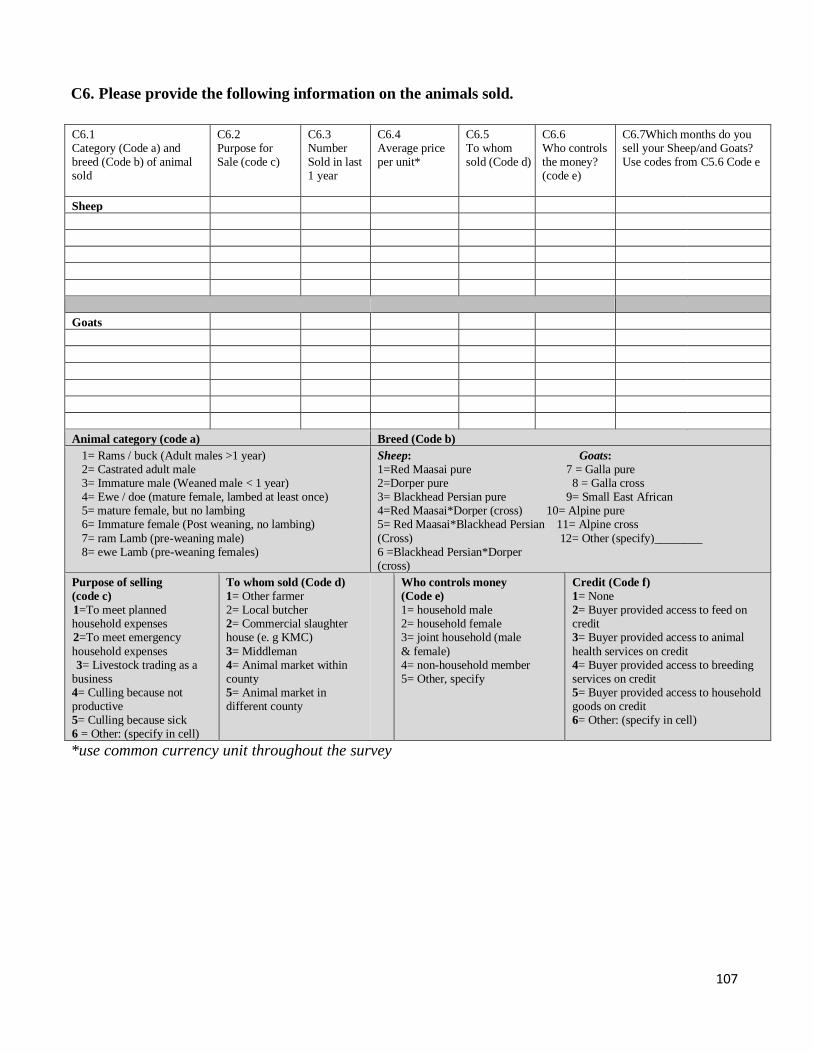
107
C6. Please provide the following information on the animals sold.
C6.1 Category (Code a) and breed (Code b) of animal sold
C6.2 Purpose for Sale (code c)
C6.3 Number Sold in last 1 year
C6.4 Average price per unit*
C6.5 To whom sold (Code d)
C6.6 Who controls the money? (code e)
C6.7Which months do you sell your Sheep/and Goats? Use codes from C5.6 Code e
Sheep
Goats
Animal category (code a) Breed (Code b)
1= Rams / buck (Adult males >1 year) 2= Castrated adult male 3= Immature male (Weaned male < 1 year) 4= Ewe / doe (mature female, lambed at least once) 5= mature female, but no lambing 6= Immature female (Post weaning, no lambing)
7= ram Lamb (pre-weaning male) 8= ewe Lamb (pre-weaning females)
Sheep: Goats: 1=Red Maasai pure 7 = Galla pure 2=Dorper pure 8 = Galla cross 3= Blackhead Persian pure 9= Small East African 4=Red Maasai*Dorper (cross) 10= Alpine pure 5= Red Maasai*Blackhead Persian 11= Alpine cross
(Cross) 12= Other (specify)________ 6 =Blackhead Persian*Dorper (cross)
Purpose of selling (code c) 1=To meet planned household expenses 2=To meet emergency
household expenses 3= Livestock trading as a business 4= Culling because not productive 5= Culling because sick 6 = Other: (specify in cell)
To whom sold (Code d) 1= Other farmer 2= Local butcher 2= Commercial slaughter house (e. g KMC)
3= Middleman 4= Animal market within county 5= Animal market in different county
Who controls money (Code e) 1= household male 2= household female 3= joint household (male
& female) 4= non-household member 5= Other, specify
Credit (Code f) 1= None 2= Buyer provided access to feed on credit 3= Buyer provided access to animal
health services on credit 4= Buyer provided access to breeding services on credit 5= Buyer provided access to household goods on credit 6= Other: (specify in cell)
*use common currency unit throughout the survey
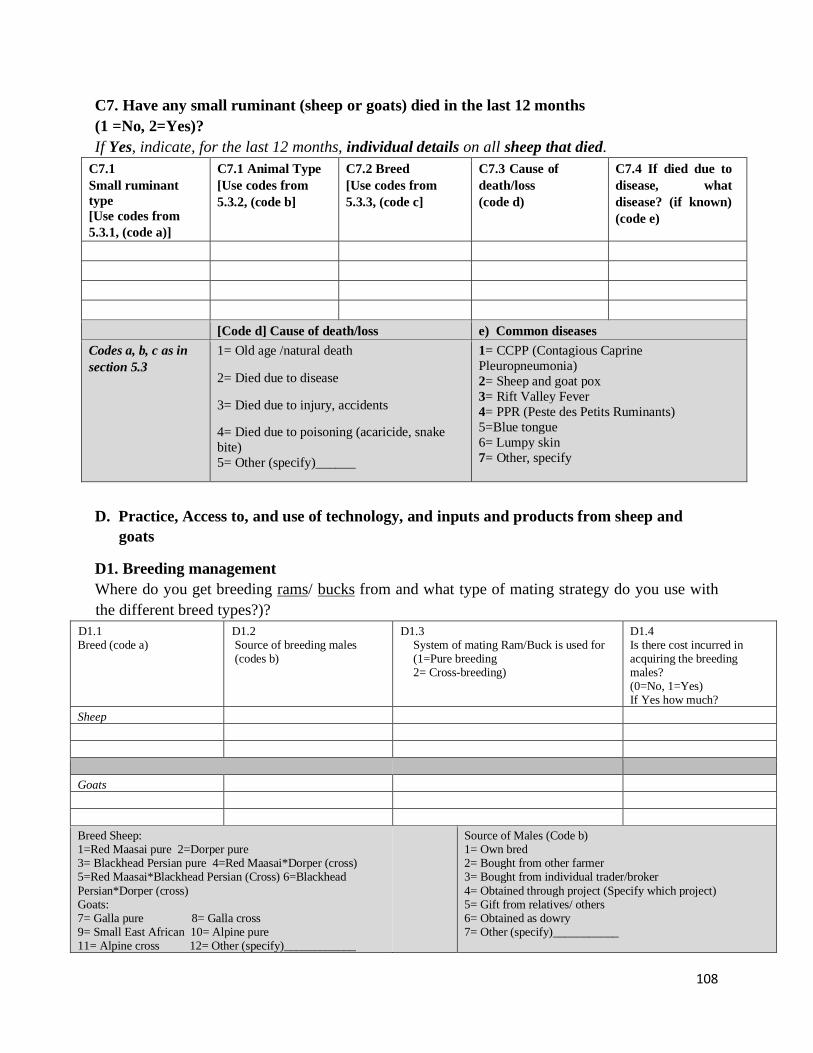
108
C7. Have any small ruminant (sheep or goats) died in the last 12 months
(1 =No, 2=Yes)?
If Yes, indicate, for the last 12 months, individual details on all sheep that died.
C7.1
Small ruminant
type
[Use codes from
5.3.1, (code a)]
C7.1 Animal Type
[Use codes from
5.3.2, (code b]
C7.2 Breed
[Use codes from
5.3.3, (code c]
C7.3 Cause of
death/loss
(code d)
C7.4 If died due to
disease, what
disease? (if known)
(code e)
[Code d] Cause of death/loss e) Common diseases
Codes a, b, c as in
section 5.3
1= Old age /natural death
2= Died due to disease
3= Died due to injury, accidents
4= Died due to poisoning (acaricide, snake
bite)
5= Other (specify)______
1= CCPP (Contagious Caprine
Pleuropneumonia)
2= Sheep and goat pox
3= Rift Valley Fever
4= PPR (Peste des Petits Ruminants)
5=Blue tongue
6= Lumpy skin
7= Other, specify
D. Practice, Access to, and use of technology, and inputs and products from sheep and
goats
D1. Breeding management
Where do you get breeding rams/ bucks from and what type of mating strategy do you use with
the different breed types?)?
D1.1 Breed (code a)
D1.2 Source of breeding males (codes b)
D1.3 System of mating Ram/Buck is used for (1=Pure breeding 2= Cross-breeding)
D1.4 Is there cost incurred in acquiring the breeding males? (0=No, 1=Yes) If Yes how much?
Sheep
Goats
Breed Sheep: 1=Red Maasai pure 2=Dorper pure 3= Blackhead Persian pure 4=Red Maasai*Dorper (cross) 5=Red Maasai*Blackhead Persian (Cross) 6=Blackhead
Persian*Dorper (cross) Goats: 7= Galla pure 8= Galla cross 9= Small East African 10= Alpine pure 11= Alpine cross 12= Other (specify)____________
Source of Males (Code b) 1= Own bred 2= Bought from other farmer 3= Bought from individual trader/broker
4= Obtained through project (Specify which project) 5= Gift from relatives/ others 6= Obtained as dowry 7= Other (specify)___________
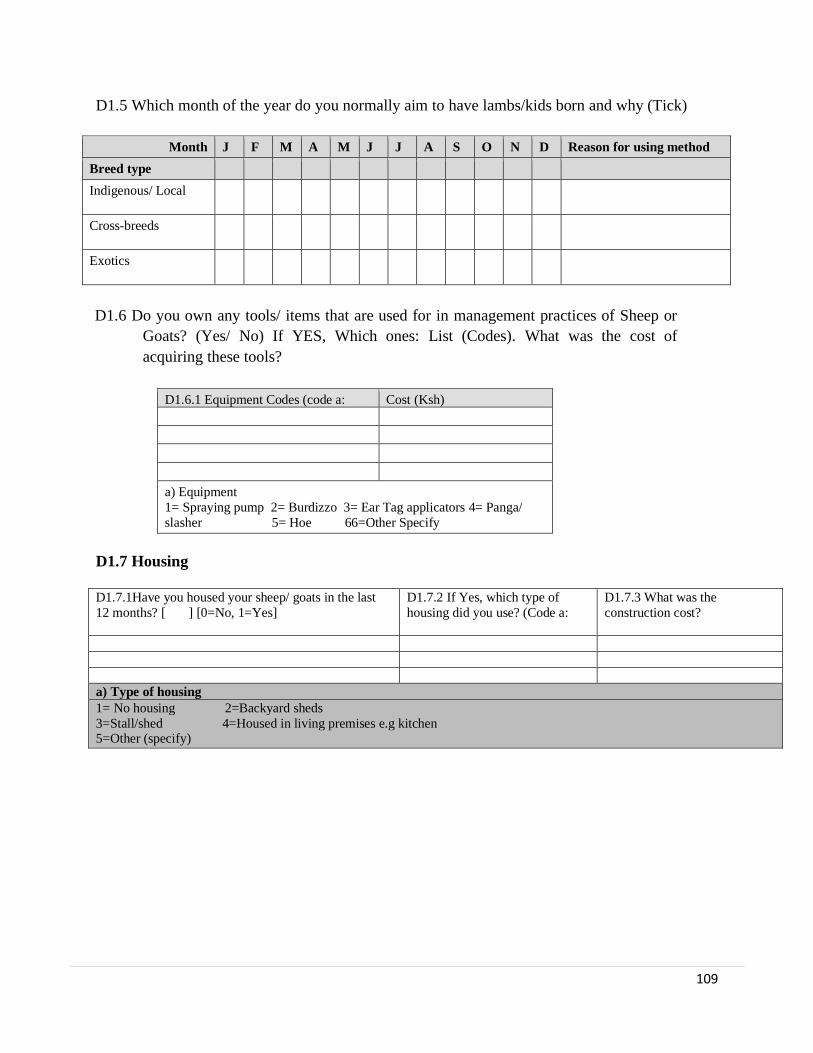
109
D1.5 Which month of the year do you normally aim to have lambs/kids born and why (Tick)
Month J F M A M J J A S O N D Reason for using method
Breed type
Indigenous/ Local
Cross-breeds
Exotics
D1.6 Do you own any tools/ items that are used for in management practices of Sheep or
Goats? (Yes/ No) If YES, Which ones: List (Codes). What was the cost of
acquiring these tools?
D1.6.1 Equipment Codes (code a: Cost (Ksh)
a) Equipment
1= Spraying pump 2= Burdizzo 3= Ear Tag applicators 4= Panga/
slasher 5= Hoe 66=Other Specify
D1.7 Housing
D1.7.1Have you housed your sheep/ goats in the last
12 months? [ ] [0=No, 1=Yes]
D1.7.2 If Yes, which type of
housing did you use? (Code a:
D1.7.3 What was the
construction cost?
a) Type of housing
1= No housing 2=Backyard sheds
3=Stall/shed 4=Housed in living premises e.g kitchen 5=Other (specify)
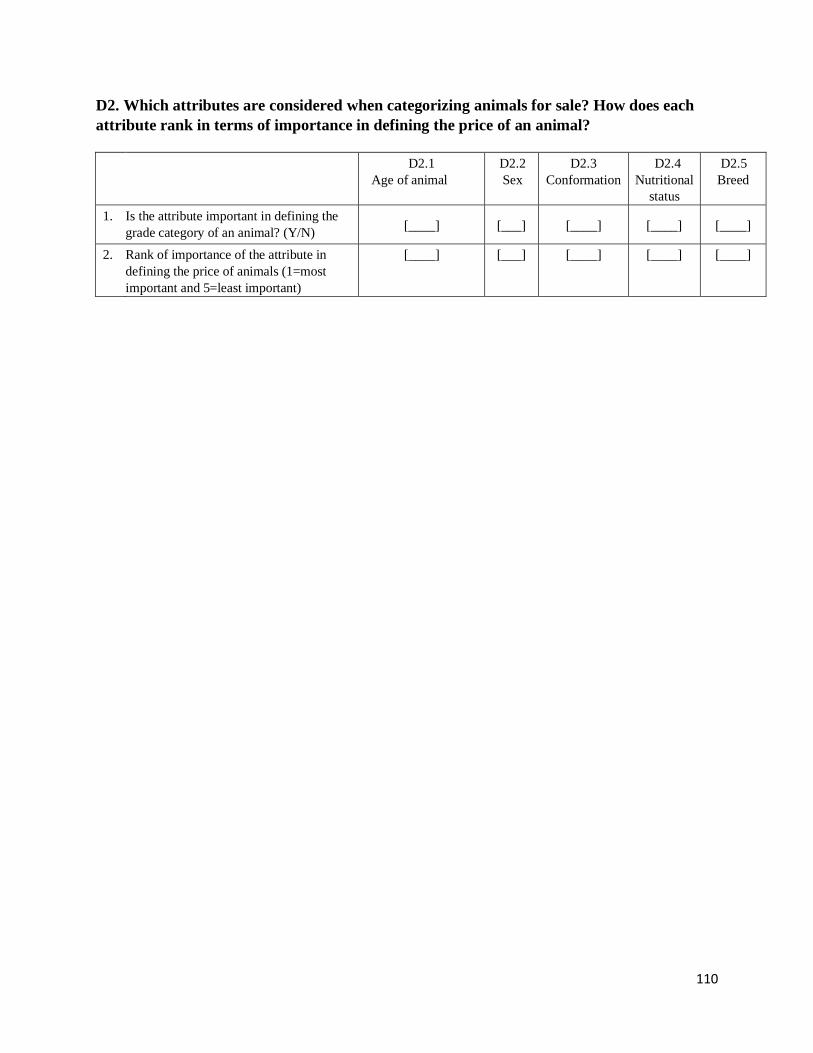
110
D2. Which attributes are considered when categorizing animals for sale? How does each
attribute rank in terms of importance in defining the price of an animal?
D2.1
Age of animal
D2.2
Sex
D2.3
Conformation
D2.4
Nutritional
status
D2.5
Breed
1. Is the attribute important in defining the
grade category of an animal? (Y/N) [____] [___] [____] [____] [____]
2. Rank of importance of the attribute in
defining the price of animals (1=most
important and 5=least important)
[____] [___] [____] [____] [____]
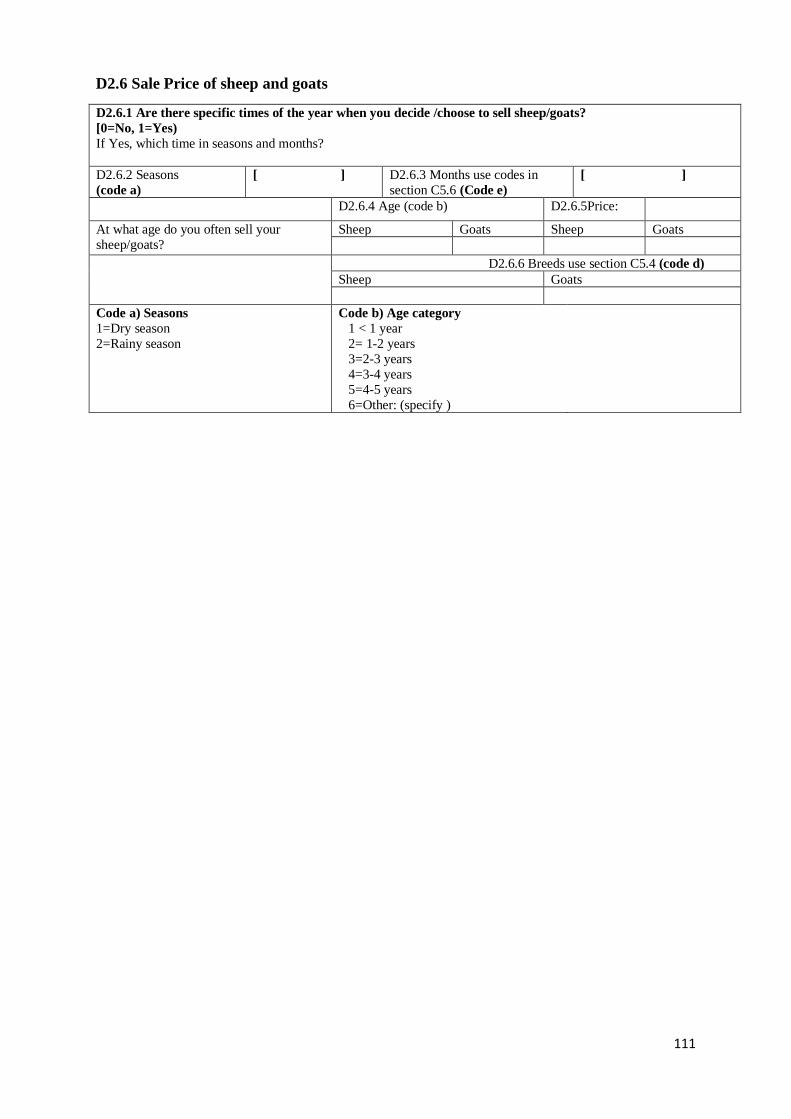
111
D2.6 Sale Price of sheep and goats
D2.6.1 Are there specific times of the year when you decide /choose to sell sheep/goats?
[0=No, 1=Yes)
If Yes, which time in seasons and months?
D2.6.2 Seasons
(code a)
[ ] D2.6.3 Months use codes in
section C5.6 (Code e)
[ ]
D2.6.4 Age (code b) D2.6.5Price:
At what age do you often sell your
sheep/goats?
Sheep Goats Sheep Goats
D2.6.6 Breeds use section C5.4 (code d)
Sheep Goats
Code a) Seasons
1=Dry season
2=Rainy season
Code b) Age category
1 < 1 year
2= 1-2 years
3=2-3 years
4=3-4 years
5=4-5 years
6=Other: (specify )
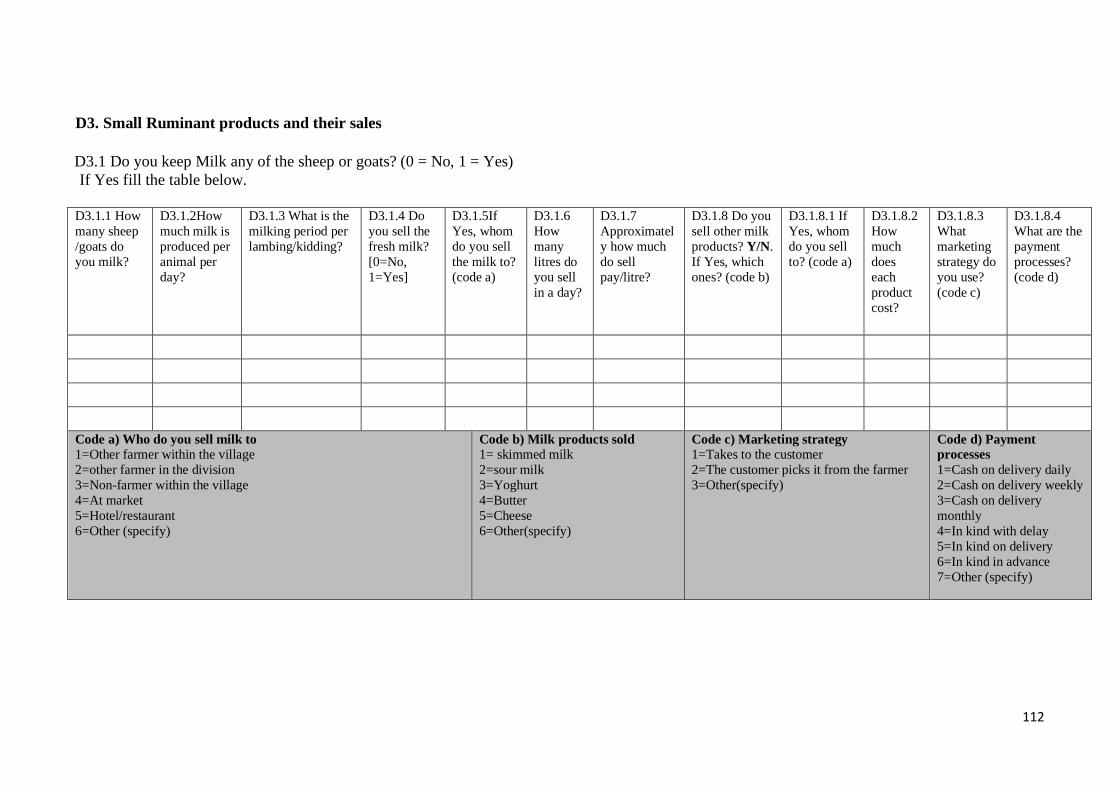
112
D3. Small Ruminant products and their sales
D3.1 Do you keep Milk any of the sheep or goats? (0 = No, 1 = Yes)
If Yes fill the table below.
D3.1.1 How
many sheep
/goats do
you milk?
D3.1.2How
much milk is
produced per
animal per
day?
D3.1.3 What is the
milking period per
lambing/kidding?
D3.1.4 Do
you sell the
fresh milk?
[0=No,
1=Yes]
D3.1.5If
Yes, whom
do you sell
the milk to?
(code a)
D3.1.6
How
many
litres do
you sell
in a day?
D3.1.7
Approximatel
y how much
do sell
pay/litre?
D3.1.8 Do you
sell other milk
products? Y/N.
If Yes, which
ones? (code b)
D3.1.8.1 If
Yes, whom
do you sell
to? (code a)
D3.1.8.2
How
much
does
each
product
cost?
D3.1.8.3
What
marketing
strategy do
you use?
(code c)
D3.1.8.4
What are the
payment
processes?
(code d)
Code a) Who do you sell milk to
1=Other farmer within the village
2=other farmer in the division
3=Non-farmer within the village
4=At market
5=Hotel/restaurant
6=Other (specify)
Code b) Milk products sold
1= skimmed milk
2=sour milk
3=Yoghurt
4=Butter
5=Cheese
6=Other(specify)
Code c) Marketing strategy
1=Takes to the customer
2=The customer picks it from the farmer
3=Other(specify)
Code d) Payment
processes
1=Cash on delivery daily
2=Cash on delivery weekly
3=Cash on delivery
monthly
4=In kind with delay
5=In kind on delivery
6=In kind in advance
7=Other (specify)
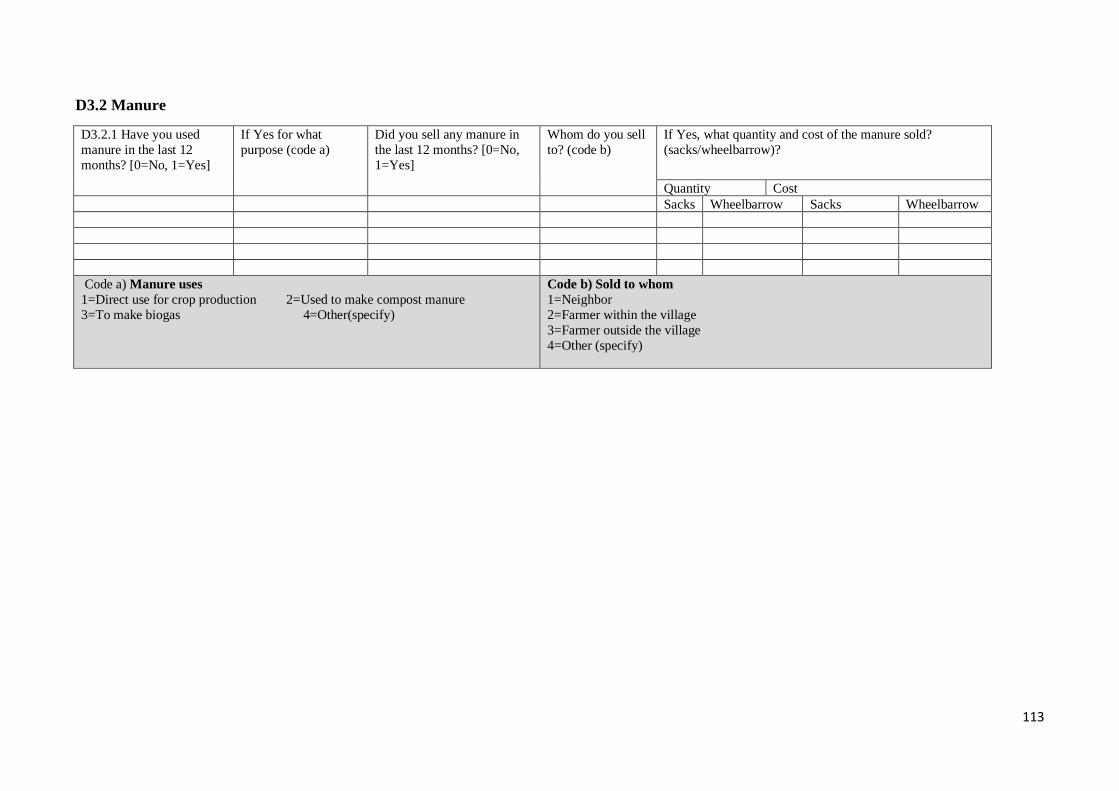
113
D3.2 Manure
D3.2.1 Have you used
manure in the last 12
months? [0=No, 1=Yes]
If Yes for what
purpose (code a)
Did you sell any manure in
the last 12 months? [0=No,
1=Yes]
Whom do you sell
to? (code b)
If Yes, what quantity and cost of the manure sold?
(sacks/wheelbarrow)?
Quantity Cost
Sacks Wheelbarrow Sacks Wheelbarrow
Code a) Manure uses
1=Direct use for crop production 2=Used to make compost manure
3=To make biogas 4=Other(specify)
Code b) Sold to whom
1=Neighbor
2=Farmer within the village
3=Farmer outside the village
4=Other (specify)
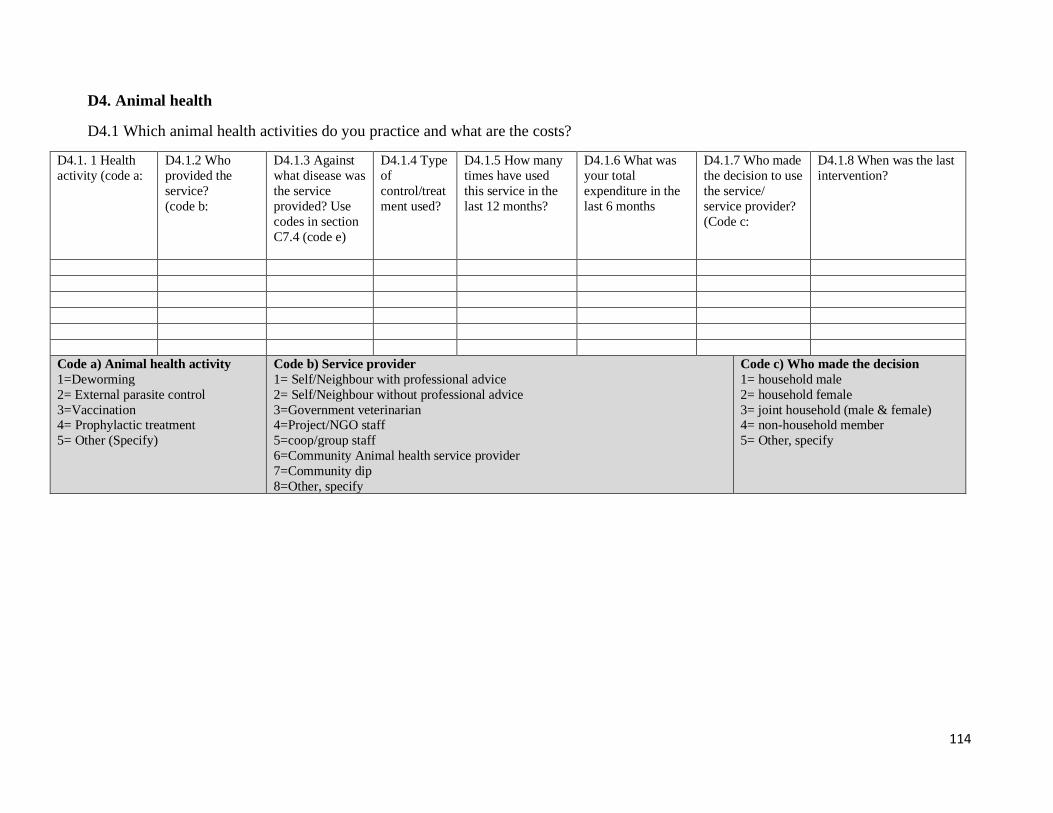
114
D4. Animal health
D4.1 Which animal health activities do you practice and what are the costs?
D4.1. 1 Health
activity (code a:
D4.1.2 Who
provided the
service?
(code b:
D4.1.3 Against
what disease was
the service
provided? Use
codes in section
C7.4 (code e)
D4.1.4 Type
of
control/treat
ment used?
D4.1.5 How many
times have used
this service in the
last 12 months?
D4.1.6 What was
your total
expenditure in the
last 6 months
D4.1.7 Who made
the decision to use
the service/
service provider?
(Code c:
D4.1.8 When was the last
intervention?
Code a) Animal health activity
1=Deworming
2= External parasite control
3=Vaccination 4= Prophylactic treatment
5= Other (Specify)
Code b) Service provider
1= Self/Neighbour with professional advice
2= Self/Neighbour without professional advice
3=Government veterinarian 4=Project/NGO staff
5=coop/group staff
6=Community Animal health service provider
7=Community dip
8=Other, specify
Code c) Who made the decision
1= household male
2= household female
3= joint household (male & female) 4= non-household member
5= Other, specify
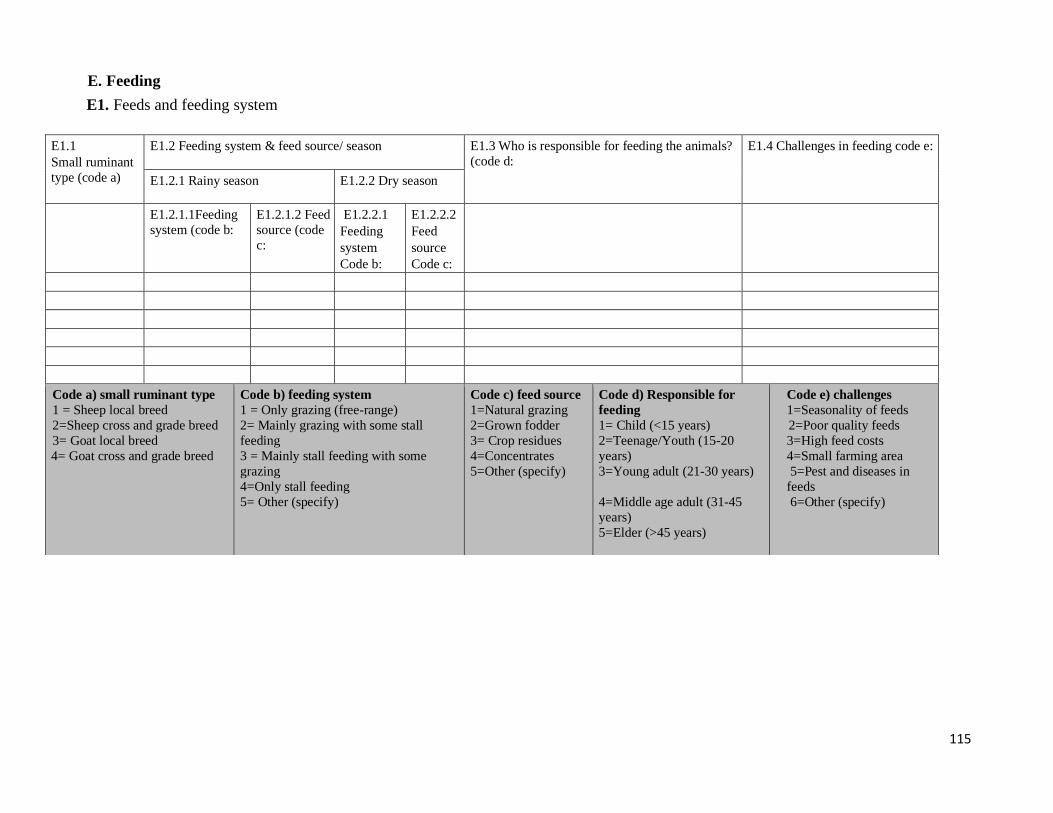
115
E. Feeding
E1. Feeds and feeding system
E1.1
Small ruminant
type (code a)
E1.2 Feeding system & feed source/ season
E1.3 Who is responsible for feeding the animals?
(code d:
E1.4 Challenges in feeding code e:
E1.2.1 Rainy season E1.2.2 Dry season
E1.2.1.1Feeding
system (code b:
E1.2.1.2 Feed
source (code
c:
E1.2.2.1
Feeding
system
Code b:
E1.2.2.2
Feed
source
Code c:
Code a) small ruminant type
1 = Sheep local breed
2=Sheep cross and grade breed
3= Goat local breed
4= Goat cross and grade breed
Code b) feeding system
1 = Only grazing (free-range)
2= Mainly grazing with some stall
feeding
3 = Mainly stall feeding with some
grazing
4=Only stall feeding
5= Other (specify)
Code c) feed source
1=Natural grazing
2=Grown fodder
3= Crop residues
4=Concentrates
5=Other (specify)
Code d) Responsible for
feeding
1= Child (<15 years)
2=Teenage/Youth (15-20
years)
3=Young adult (21-30 years)
4=Middle age adult (31-45
years)
5=Elder (>45 years)
Code e) challenges
1=Seasonality of feeds
2=Poor quality feeds
3=High feed costs
4=Small farming area
5=Pest and diseases in
feeds
6=Other (specify)
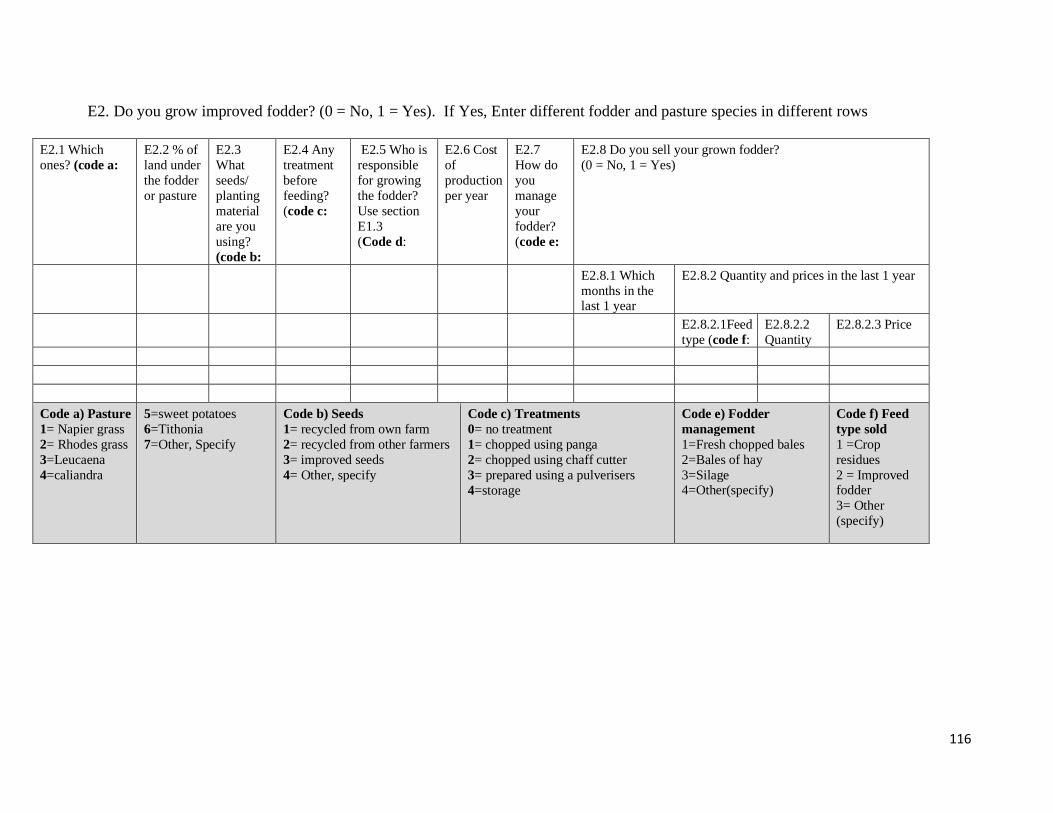
116
E2. Do you grow improved fodder? (0 = No, 1 = Yes). If Yes, Enter different fodder and pasture species in different rows
E2.1 Which
ones? (code a:
E2.2 % of
land under
the fodder
or pasture
E2.3
What
seeds/
planting
material
are you
using?
(code b:
E2.4 Any
treatment
before
feeding?
(code c:
E2.5 Who is
responsible
for growing
the fodder?
Use section
E1.3
(Code d:
E2.6 Cost
of
production
per year
E2.7
How do
you
manage
your
fodder?
(code e:
E2.8 Do you sell your grown fodder?
(0 = No, 1 = Yes)
E2.8.1 Which
months in the last 1 year
E2.8.2 Quantity and prices in the last 1 year
E2.8.2.1Feed
type (code f:
E2.8.2.2
Quantity
E2.8.2.3 Price
Code a) Pasture
1= Napier grass
2= Rhodes grass
3=Leucaena
4=caliandra
5=sweet potatoes
6=Tithonia
7=Other, Specify
Code b) Seeds
1= recycled from own farm
2= recycled from other farmers
3= improved seeds
4= Other, specify
Code c) Treatments
0= no treatment
1= chopped using panga
2= chopped using chaff cutter
3= prepared using a pulverisers
4=storage
Code e) Fodder
management
1=Fresh chopped bales
2=Bales of hay
3=Silage 4=Other(specify)
Code f) Feed
type sold
1 =Crop
residues
2 = Improved fodder
3= Other
(specify)
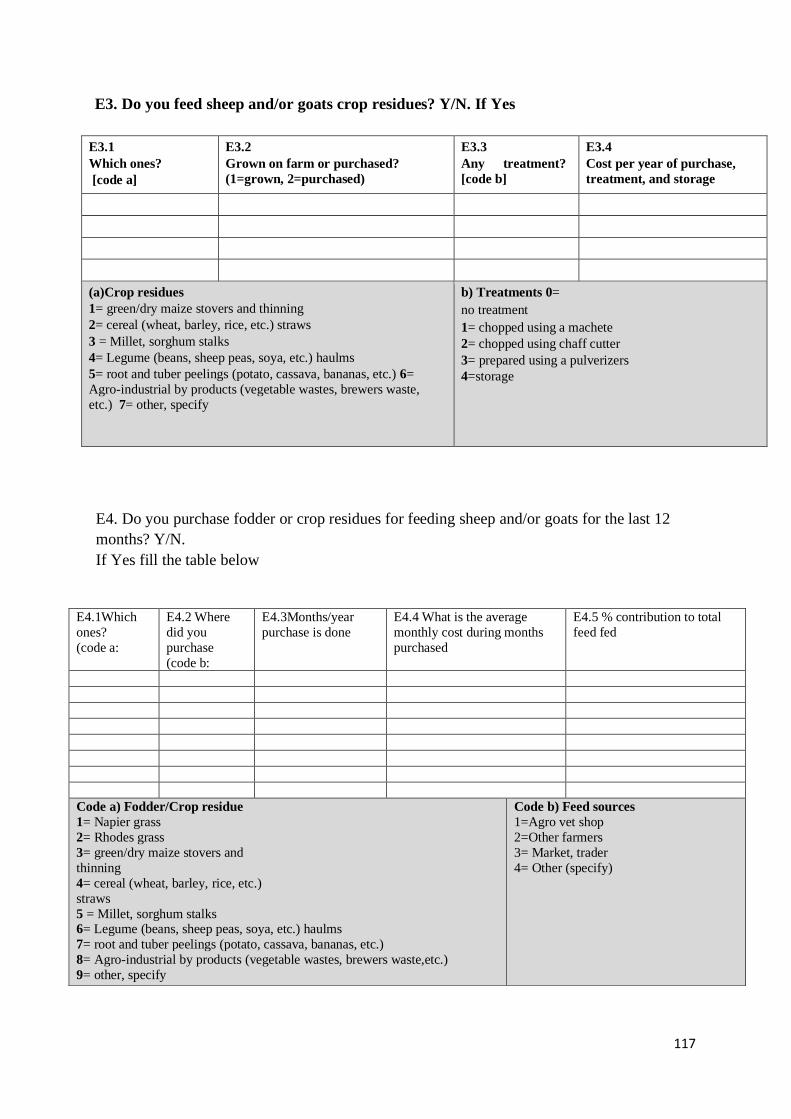
117
E3. Do you feed sheep and/or goats crop residues? Y/N. If Yes
E3.1
Which ones?
[code a]
E3.2
Grown on farm or purchased?
(1=grown, 2=purchased)
E3.3
Any treatment?
[code b]
E3.4
Cost per year of purchase,
treatment, and storage
(a)Crop residues
1= green/dry maize stovers and thinning
2= cereal (wheat, barley, rice, etc.) straws
3 = Millet, sorghum stalks
4= Legume (beans, sheep peas, soya, etc.) haulms
5= root and tuber peelings (potato, cassava, bananas, etc.) 6=
Agro-industrial by products (vegetable wastes, brewers waste,
etc.) 7= other, specify
b) Treatments 0=
no treatment
1= chopped using a machete
2= chopped using chaff cutter
3= prepared using a pulverizers
4=storage
E4. Do you purchase fodder or crop residues for feeding sheep and/or goats for the last 12
months? Y/N.
If Yes fill the table below
E4.1Which
ones?
(code a:
E4.2 Where
did you
purchase
(code b:
E4.3Months/year
purchase is done
E4.4 What is the average
monthly cost during months
purchased
E4.5 % contribution to total
feed fed
Code a) Fodder/Crop residue
1= Napier grass
2= Rhodes grass
3= green/dry maize stovers and
thinning
4= cereal (wheat, barley, rice, etc.)
straws
5 = Millet, sorghum stalks 6= Legume (beans, sheep peas, soya, etc.) haulms
7= root and tuber peelings (potato, cassava, bananas, etc.)
8= Agro-industrial by products (vegetable wastes, brewers waste,etc.)
9= other, specify
Code b) Feed sources
1=Agro vet shop
2=Other farmers
3= Market, trader
4= Other (specify)
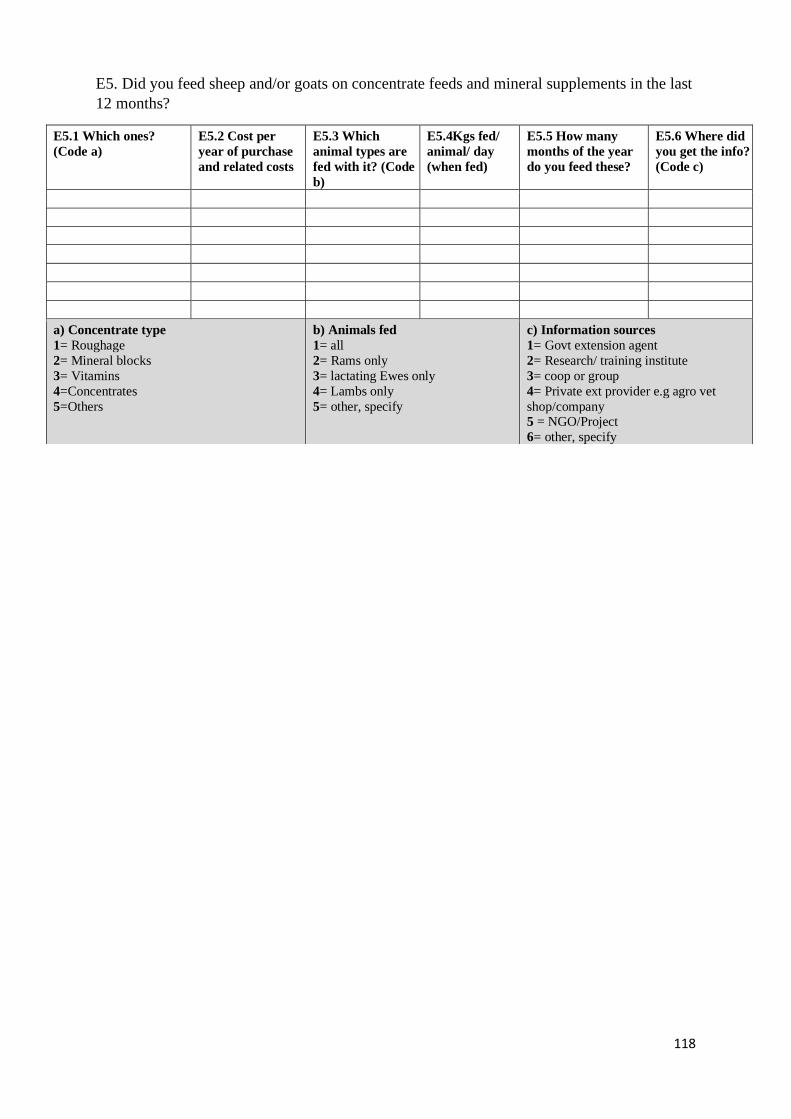
118
E5. Did you feed sheep and/or goats on concentrate feeds and mineral supplements in the last
12 months?
E5.1 Which ones?
(Code a)
E5.2 Cost per
year of purchase
and related costs
E5.3 Which
animal types are
fed with it? (Code
b)
E5.4Kgs fed/
animal/ day
(when fed)
E5.5 How many
months of the year
do you feed these?
E5.6 Where did
you get the info?
(Code c)
a) Concentrate type
1= Roughage
2= Mineral blocks
3= Vitamins
4=Concentrates
5=Others
b) Animals fed
1= all
2= Rams only
3= lactating Ewes only
4= Lambs only
5= other, specify
c) Information sources
1= Govt extension agent
2= Research/ training institute
3= coop or group
4= Private ext provider e.g agro vet
shop/company 5 = NGO/Project
6= other, specify
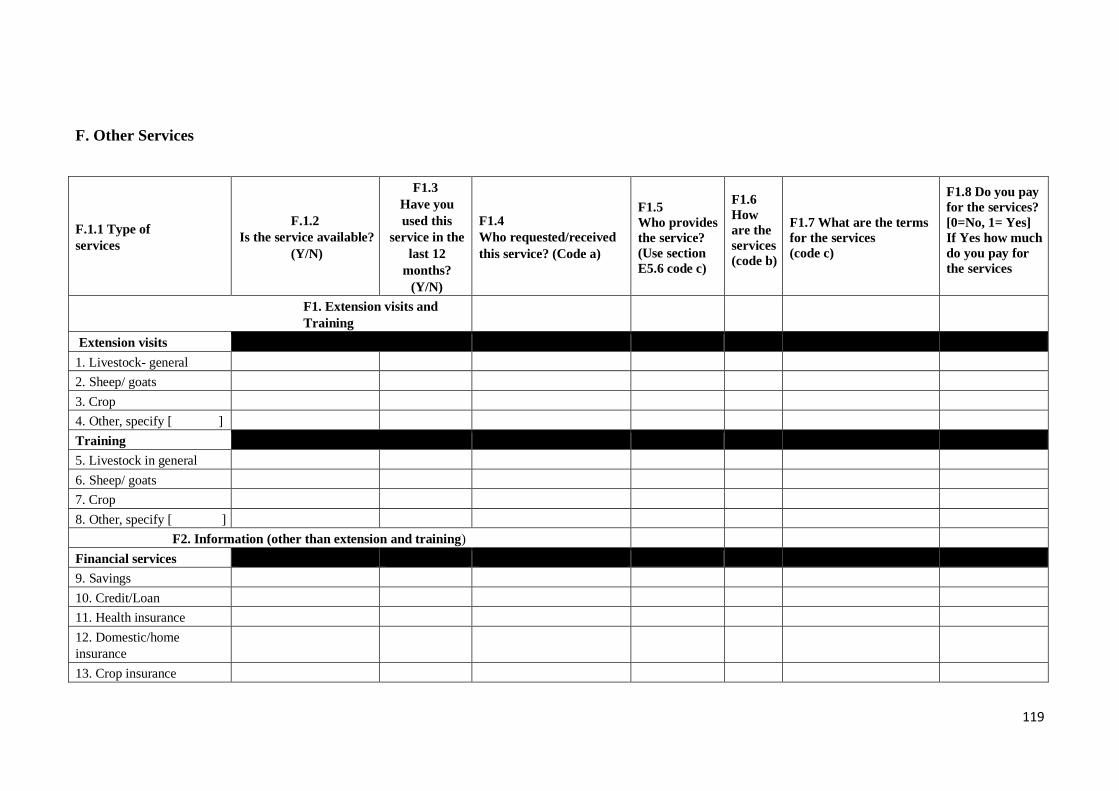
119
F. Other Services
F.1.1 Type of
services
F.1.2
Is the service available?
(Y/N)
F1.3
Have you
used this
service in the
last 12
months?
(Y/N)
F1.4
Who requested/received
this service? (Code a)
F1.5
Who provides
the service?
(Use section
E5.6 code c)
F1.6
How
are the
services
(code b)
F1.7 What are the terms
for the services
(code c)
F1.8 Do you pay
for the services?
[0=No, 1= Yes]
If Yes how much
do you pay for
the services
F1. Extension visits and
Training
Extension visits
1. Livestock- general
2. Sheep/ goats
3. Crop
4. Other, specify [ ]
Training
5. Livestock in general
6. Sheep/ goats
7. Crop
8. Other, specify [ ]
F2. Information (other than extension and training)
Financial services
9. Savings
10. Credit/Loan
11. Health insurance
12. Domestic/home
insurance
13. Crop insurance
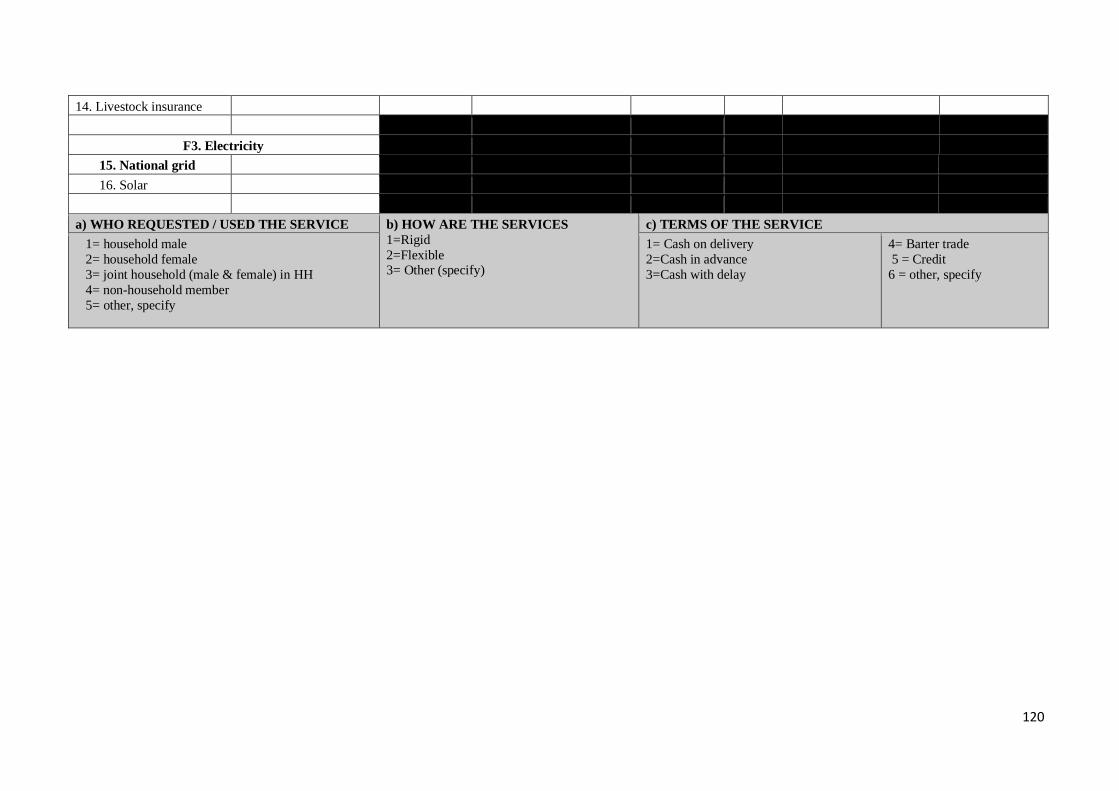
120
14. Livestock insurance
F3. Electricity
15. National grid
16. Solar
a) WHO REQUESTED / USED THE SERVICE b) HOW ARE THE SERVICES
1=Rigid
2=Flexible 3= Other (specify)
c) TERMS OF THE SERVICE
1= household male
2= household female
3= joint household (male & female) in HH
4= non-household member
5= other, specify
1= Cash on delivery
2=Cash in advance
3=Cash with delay
4= Barter trade
5 = Credit
6 = other, specify
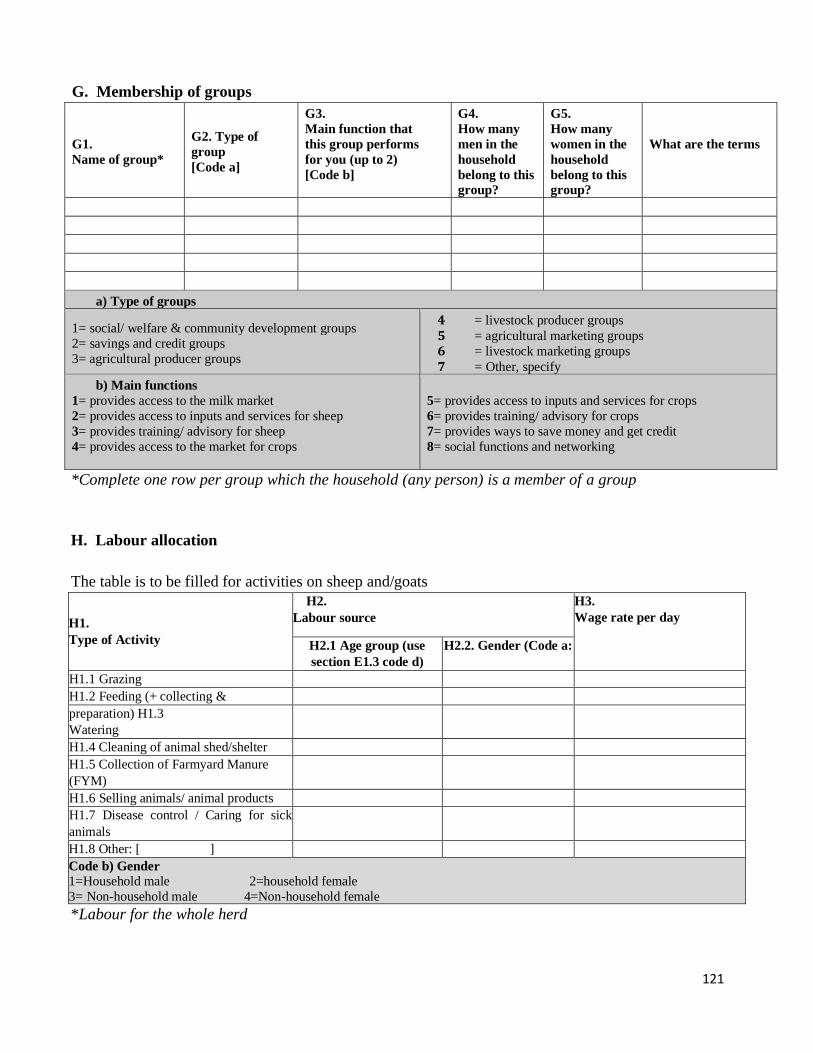
121
G. Membership of groups
G1.
Name of group*
G2. Type of
group
[Code a]
G3.
Main function that
this group performs
for you (up to 2)
[Code b]
G4.
How many
men in the
household
belong to this
group?
G5.
How many
women in the
household
belong to this
group?
What are the terms
a) Type of groups
1= social/ welfare & community development groups
2= savings and credit groups
3= agricultural producer groups
4 = livestock producer groups
5 = agricultural marketing groups
6 = livestock marketing groups
7 = Other, specify
b) Main functions
1= provides access to the milk market
2= provides access to inputs and services for sheep
3= provides training/ advisory for sheep
4= provides access to the market for crops
5= provides access to inputs and services for crops
6= provides training/ advisory for crops
7= provides ways to save money and get credit
8= social functions and networking
*Complete one row per group which the household (any person) is a member of a group
H. Labour allocation
The table is to be filled for activities on sheep and/goats
H1.
Type of Activity
H2.
Labour source
H3.
Wage rate per day
H2.1 Age group (use
section E1.3 code d)
H2.2. Gender (Code a:
H1.1 Grazing
H1.2 Feeding (+ collecting &
preparation) H1.3
Watering
H1.4 Cleaning of animal shed/shelter
H1.5 Collection of Farmyard Manure
(FYM)
H1.6 Selling animals/ animal products
H1.7 Disease control / Caring for sick
animals
H1.8 Other: [ ]
Code b) Gender
1=Household male 2=household female
3= Non-household male 4=Non-household female
*Labour for the whole herd
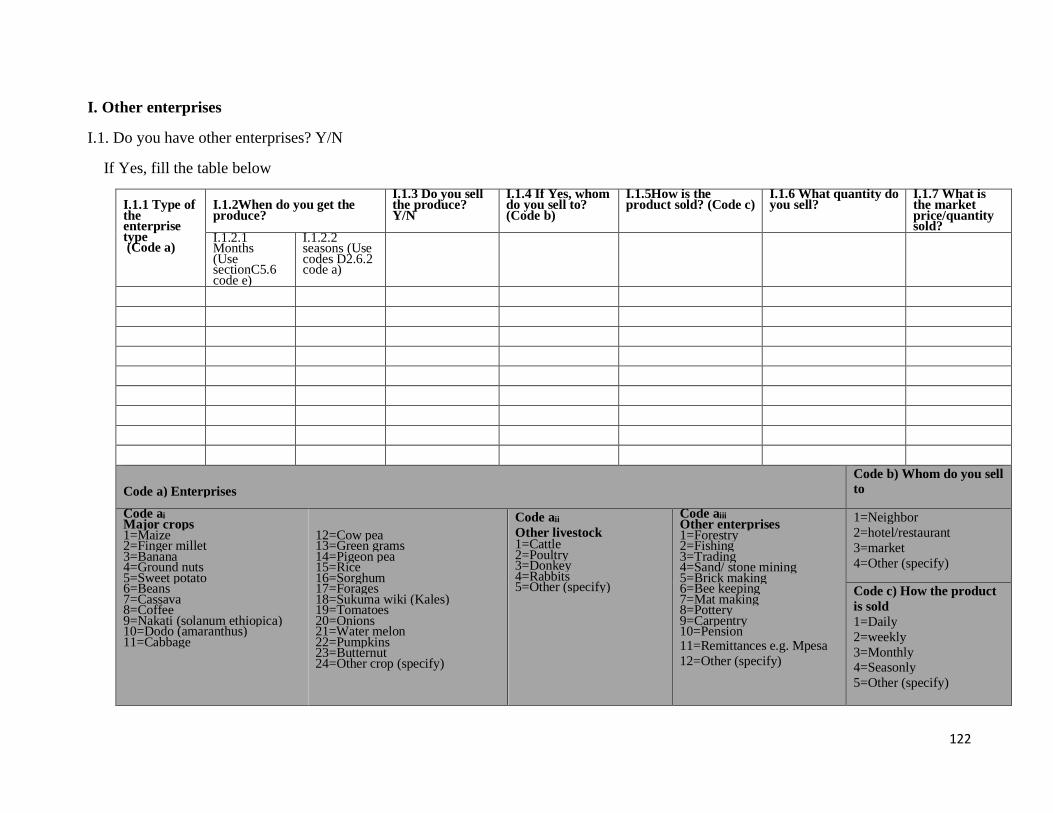
122
I. Other enterprises
I.1. Do you have other enterprises? Y/N
If Yes, fill the table below
I.1.1 Type of the enterprise type (Code a)
I.1.2When do you get the produce?
I.1.3 Do you sell the produce? Y/N
I.1.4 If Yes, whom do you sell to? (Code b)
I.1.5How is the product sold? (Code c)
I.1.6 What quantity do you sell?
I.1.7 What is the market price/quantity sold?
I.1.2.1 Months (Use sectionC5.6 code e)
I.1.2.2 seasons (Use codes D2.6.2 code a)
Code a) Enterprises
Code b) Whom do you sell
to
Code ai
Major crops 1=Maize 2=Finger millet 3=Banana 4=Ground nuts 5=Sweet potato 6=Beans 7=Cassava 8=Coffee 9=Nakati (solanum ethiopica) 10=Dodo (amaranthus) 11=Cabbage
12=Cow pea 13=Green grams 14=Pigeon pea 15=Rice 16=Sorghum 17=Forages 18=Sukuma wiki (Kales) 19=Tomatoes 20=Onions 21=Water melon 22=Pumpkins 23=Butternut 24=Other crop (specify)
Code aii
Other livestock 1=Cattle 2=Poultry 3=Donkey 4=Rabbits 5=Other (specify)
Code aiii
Other enterprises 1=Forestry 2=Fishing 3=Trading 4=Sand/ stone mining 5=Brick making 6=Bee keeping 7=Mat making 8=Pottery 9=Carpentry 10=Pension 11=Remittances e.g. Mpesa
12=Other (specify)
1=Neighbor
2=hotel/restaurant
3=market
4=Other (specify)
Code c) How the product
is sold
1=Daily
2=weekly
3=Monthly 4=Seasonly
5=Other (specify)
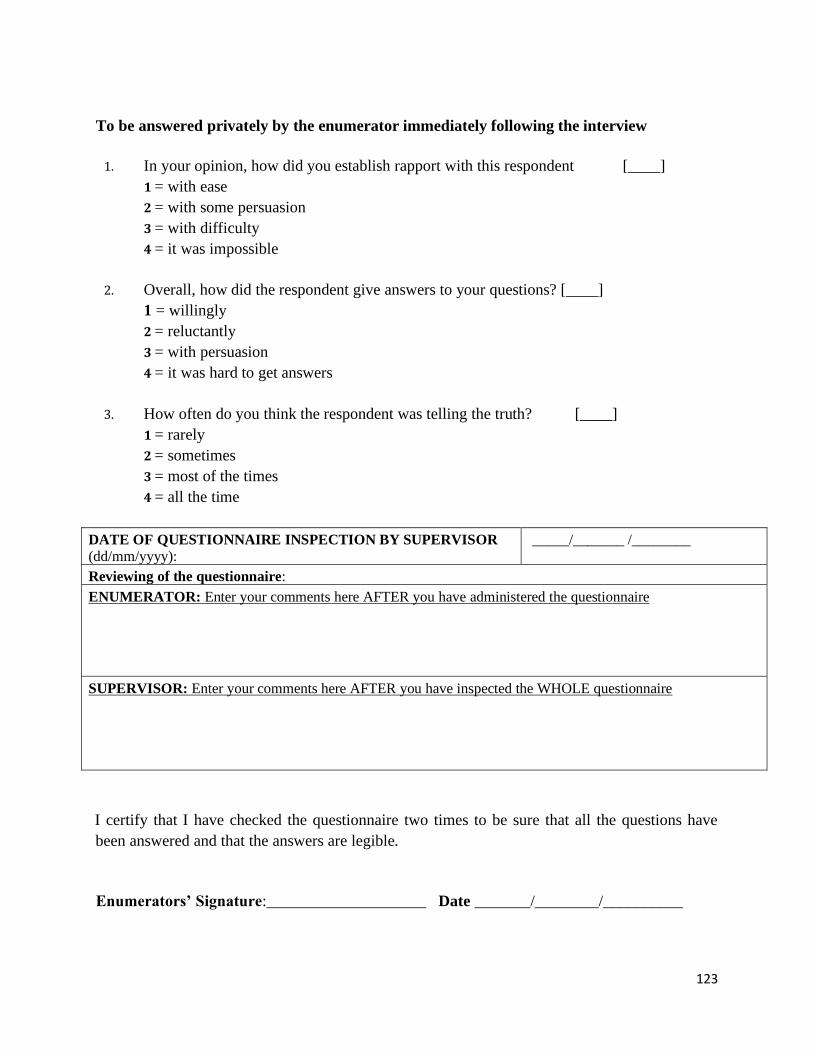
123
To be answered privately by the enumerator immediately following the interview
1. In your opinion, how did you establish rapport with this respondent [____]
1 = with ease
2 = with some persuasion
3 = with difficulty
4 = it was impossible
2. Overall, how did the respondent give answers to your questions? [____]
1 = willingly
2 = reluctantly
3 = with persuasion
4 = it was hard to get answers
3. How often do you think the respondent was telling the truth? [____]
1 = rarely
2 = sometimes
3 = most of the times
4 = all the time
DATE OF QUESTIONNAIRE INSPECTION BY SUPERVISOR (dd/mm/yyyy):
_____/_______ /________
Reviewing of the questionnaire:
ENUMERATOR: Enter your comments here AFTER you have administered the questionnaire
SUPERVISOR: Enter your comments here AFTER you have inspected the WHOLE questionnaire
I certify that I have checked the questionnaire two times to be sure that all the questions have
been answered and that the answers are legible.
Enumerators’ Signature:____________________ Date _______/________/__________
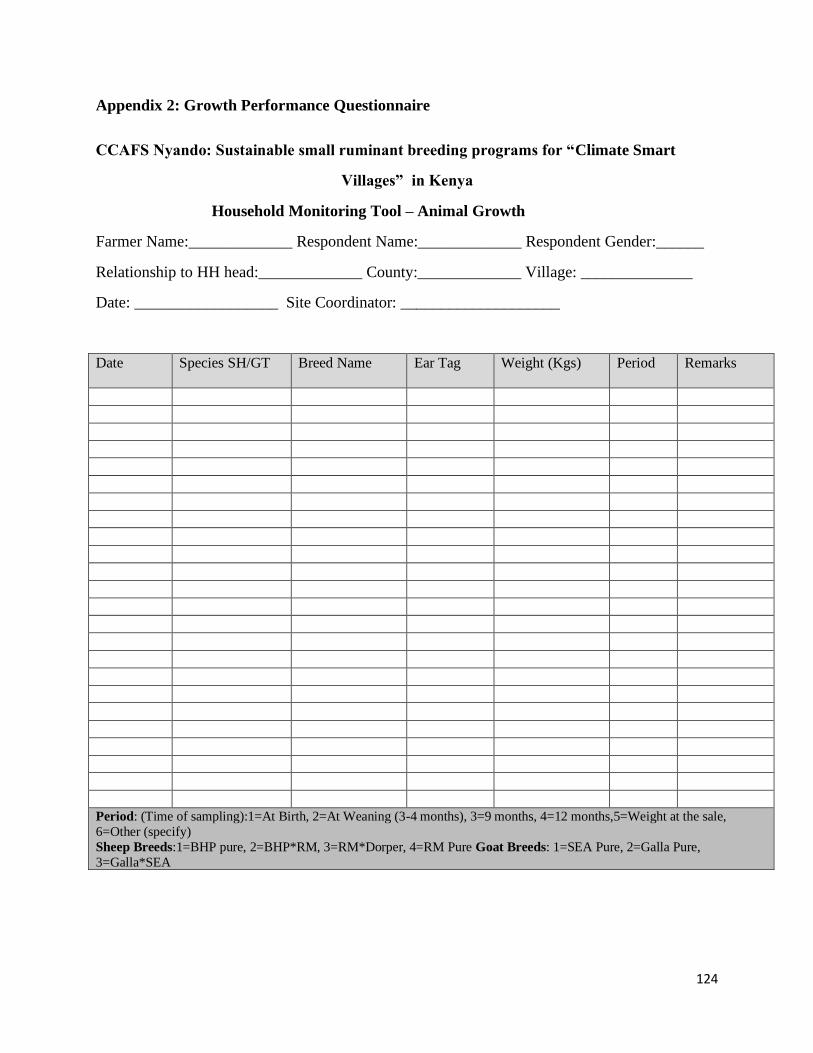
124
Appendix 2: Growth Performance Questionnaire
CCAFS Nyando: Sustainable small ruminant breeding programs for “Climate Smart
Villages” in Kenya
Household Monitoring Tool – Animal Growth
Farmer Name:_____________ Respondent Name:_____________ Respondent Gender:______
Relationship to HH head:_____________ County:_____________ Village: ______________
Date: __________________ Site Coordinator: ____________________
Date Species SH/GT Breed Name Ear Tag Weight (Kgs) Period Remarks
Period: (Time of sampling):1=At Birth, 2=At Weaning (3-4 months), 3=9 months, 4=12 months,5=Weight at the sale,
6=Other (specify)
Sheep Breeds:1=BHP pure, 2=BHP*RM, 3=RM*Dorper, 4=RM Pure Goat Breeds: 1=SEA Pure, 2=Galla Pure,
3=Galla*SEA