Embed Size (px)
Citation preview
Contents lists available at ScienceDirect
Bioresource Technology
journal homepage: www.elsevier.com/locate/biortech
Evaluation of photosynthetic light integration by microalgae in a pilot-scaleraceway reactor
M. Barceló-Villalobosa, P. Fernández-del Olmoc, J.L. Guzmána, J.M. Fernández-Sevillab,F.G. Acién Fernándezb,⁎
a Department of Informatics, Universidad de Almería, ceiA3, CIESOL, E04120 Almería, SpainbDepartment of Chemical Engineering, Universidad de Almería, Spainc Institute for Research in Agriculture and Fisheries, Junta de Andalucía, E04720 Almería, Spain
A R T I C L E I N F O
Keywords:MicroalgaeRacewayBiomass productionLight frequencyCFD
A B S T R A C T
The improvement of photosynthetic efficiency in a 100m2 raceway reactor by enhancement of light regime towhich the cells are exposed is here reported. From Computational Fluid Dynamics it was calculated that the lightexposure times ranged from 0.4 to 3.6 s while the exposure times to darkness were much longer, from 6 to 21 s. Itwas demonstrated that these times are too long for light integration, the cells fully adapting to local irradiances.This phenomenon was validated in the real outdoor raceway at different seasons. Simulations allows to confirmthat if total light integration is achieved biomass productivity can increase up to 40 g/m2·day compared to 29 g/m2·day obtained considering local adaptation, which is close to the experimental value of 25 g/m2·day. Thispaper provides clear evidence of microalgae cell adaptation to local irradiance because of the unfavourable cellmovement pattern in raceway reactors.
1. Introduction
Raceway reactors are the most extended technology for microalgaegrowth; more than 90% of the worldwide microalgae production isperformed using this technology. The design of raceway reactors wasfirst proposed by Oswald and Golueke in the 1960’s (Oswald andGolueke, 1960). This design has recently been revised to increase mi-croalgae production, and especially to integrate these reactors intolarge applications such as wastewater treatment. Therefore, the energyconsumption, mixing and mass transfer of these reactors are currentlythe subject of research (Barceló-Villalobos et al., 2018; de Godos et al.,2014; Labatut et al., 2007; Liffman et al., 2013; Mendoza et al., 2013b).In spite of the recent improvements regarding these aspects, the overallperformance of whichever microalgae culture is always limited by thelight utilization efficiency; that is to say, by how the microalgae use thelight impinging on the reactor surface.
In raceway reactors, as in any microalgae culture system, lightgradients exist due to the light attenuation caused by the cells.According to the culture movement (vertical mixing), the cells are ex-posed to different light regimes as a function of the existing light gra-dients. The relevance of the light regime (to which the cells are ex-posed) on microalgae culture performance has been widely discussed,
and is still a hot topic in the microalgae biotechnology field given itsimportance in improving the biomass productivity of real systems(Brindley et al., 2016, 2011; Grobbelaar, 1989; Schulze et al., 2014;Ugwu et al., 2005; Vejrazka et al., 2011). Moreover, it is not only lightintensity and frequency that matter - the actual “shape” of the irra-diance variation pattern also influences the response of microalgae cells(Brindley et al., 2016). These authors showed that pure flashing light(neat dark/light changes represented by square-wave functions) elicit alower photosynthetic response than other light patterns, calling intoquestion the idea that any light regime is a mere transition from light todark. On the basis of the photosynthesis mechanism, the time requestedfor reactions to take place in PSI-PSII is much lower than the time re-quired to use the energy produced by the cells. High frequency fluc-tuating light (< 100ms) has been reported to lead to higher growthrates and higher photosynthesis rates than continuous light (Matthijset al., 1996; Nedbal et al., 1996). These values are a function of lightintensity and other variables such as the strain and status of the cells,among others; thus it is a complex phenomenon. To summarize, it isgenerally accepted that to allow complete light integration, dark cyclesat frequencies higher than 1 Hz are required (Brindley et al., 2011).
However, applying these results to large-scale reactors is difficultbecause the real patterns in these systems have barely been analysed.
https://doi.org/10.1016/j.biortech.2019.02.032Received 11 December 2018; Received in revised form 4 February 2019; Accepted 5 February 2019
⁎ Corresponding author.E-mail address: [email protected] (F.G. Acién Fernández).
Bioresource Technology 280 (2019) 404–411
Available online 06 February 20190960-8524/ © 2019 Elsevier Ltd. All rights reserved.
T
Recently, the utilization of Computational Fluid Dynamics (CFD) tools,such as ANSYS Fluent, have allowed us to analyse the hydrodynamics inreal-scale reactors (Bitog et al., 2011; Fernández-Del Olmo et al., 2017;García et al., 2012; Soman and Shastri, 2015). The studies performed todate are mainly focused on the reactor’s energy consumption and onhow to minimize the pressure drop caused by the liquid circulation.Other papers are focused on the elucidation of the light pattern towhich the cells are exposed as a function of the design, operational andenvironmental parameters. There is, however, an underlying incon-sistency in the literature dealing with the light integration effect inmicroalgae reactors. While numerous studies provide converging evi-dence for enhanced photosynthetic efficiency at a higher frequency ofon/off signals (Perner-Nochta et al., 2007), there is no clear experi-mental evidence that more mixing actually enhances growth. Overall,studies that demonstrate productivity enhancement through increasedmixing are scarce compared to studies restricted to the flashing effect,and they are rarely supported by experimental evidence (Demory et al.,2018) However, most of these studies have been performed on smallreactors. Moreover, no clear figures were provided regarding the lightregimes to which the cells were exposed in these reactors. The re-levance of the reactor size must be emphasized because the circulationpattern is significantly modified according to the scale of the reactors.Consequently, when using small raceway reactors, the contribution ofbends, paddlewheel and other structural elements, such as baffles,greatly modifies the liquid pattern in the channel, with these sectionsincreasing the vertical mixing. Conversely, in large reactors, the con-tribution of these sections is minimal so the vertical mixing is very low(Demory et al., 2018; Mendoza et al., 2013a).
Accordingly, this paper focuses on quantifying the light utilizationphenomenon taking place in real raceway reactors. For this, the lightexposure times in a real pilot-scale reactor were determined and theirinfluence on the cells’ photosynthesis rate was measured under la-boratory conditions. The objective was to determine if the biomassproductivity of real-scale raceway reactors can be improved by en-hancing the light regime to which the cells are exposed; and how itwould be possible to achieve this objective. Clarifying this question ishighly relevant for microalgae biotechnology, not only in terms of thepotential improvements in the productivity of real production systems,but also because it would affect all the models and design tools cur-rently used in this field.
2. Materials and methods
2.1. Microorganism, raceway reactor and culture conditions
The microalgae strain used was Scenedesmus almeriensis (CCAP 276/24). Inoculum for the raceway reactor was produced in a 3.0m3 tubularphotobioreactor under controlled conditions (pH 8 by on-demand CO2
injection and a temperature ranging from 18 to 22 °C) using freshwaterand Mann & Myers medium prepared with fertilizers (0.14 g·L−1
KH2PO4, 0.18 g·L−1 MgSO4 7H2O, 0.9 g·L−1 NaNO3, 0.02mL·L−1
Welgro, and 0.02 g·L−1 Kalentol).The raceway reactor is located at the “Las Palmerillas” Research
Centre, 36° 48′N–2° 43′W, part of the Cajamar Foundation (Almería,Spain). The reactor consists of two 50m long channels (0.46mhigh×1m wide), both connected by 180° bends at each end, with a0.59m3 sump (0.65 m long× 0.90m wide×1m deep) located 1malong one of the channels (Barceló-Villalobos et al., 2018). A paddle-wheel system was used to recirculate the culture through the reactor ata regular velocity of 0.2m·s−1, although this could be increased up to0.8 m·s−1 by manipulating the frequency inverter of the engine. ThepH, temperature and dissolved oxygen in the culture were measuredusing appropriate probes (5083 T and 5120, Crison Instruments, Bar-celona, Spain), connected to an MM44 control-transmitter unit (CrisonInstruments, Spain), and data acquisition software (Labview, NationalInstruments, USA) providing complete monitoring and control of the
system. The culture’s pH was maintained at 8.0 by on-demand CO2
injection whereas temperature was not controlled – this varied by±5 °C with respect to the daily mean air temperature, which, in turn,varied from 12 °C in winter to 28 °C in summer. The raceway reactorwas inoculated and operated in batch mode for one week, after which itwas operated in semi-continuous mode at 0.2 day−1 at a culture depthof 0.15m. Only samples from steady-state conditions were used. Eva-poration inside the reactor was compensated for by the daily addition offresh medium.
2.2. CFD model
The ANSYS Meshing 12.1 pre-processor was used to generate thenumerical grid for a suitable discretization of the computational do-main. Hexahedral mesh was used because of its capabilities in pro-viding a high-quality solution with fewer cells for simple geometry. Toobtain the mesh-independent result, three different mesh densities(1,096,250, 1,656,875 and 2,096,875 cells) were evaluated. The op-timal mesh density (1,656,875), in terms of computational time andaccuracy, was implemented in the numerical analysis. In order to ex-clude turbulence model dependence on the results, a sensitivity studyon the turbulence settings was performed on the optimal mesh. Therealizable k-ε model was used. The numerical model was based on thefinite-volume method. The transport equations were solved using theANSYS FLUENT 12.1 CFD commercial software package. The flow so-lution procedure used was the Semi-Implicit Method for Pressure-Linked Equation (SIMPLE) routine. The momentum equations werediscretized using both first and second-order upwind scheme options,and second-order upwind for the other transport equations. The con-vergence criterion consisted of monitoring the mass flow rate at theinlet and outlet, and the variation in velocity profiles with iteration, areduction of several orders of magnitude in the residual errors. Theresults were validated by comparing them with the experimentalmeasurements. 3D simulations were performed on a workstation withtwo Six-Core Intel Xeon X5650 2.66 GHz 12MB/1333 processors, andHP 48 GB RAM (6× 8GB) DDR3-1333 (Hewlett Packard, USA).
2.3. Photosynthetic rate measurement
The photosynthesis rate of the microalgae samples was determinedusing a photo-respirometer built by the Chemical EngineeringDepartment at the University of Almería. The system basically consistsof a magnetically-stirred jacketed vessel (0.03 m diameter, 80mL totalvolume), in which the pH (Crison pH5010, Spain), dissolved oxygen(Crison OD6050, Spain), temperature (Crison PT1000, Spain) and light(Walz US-SQS/L, Germany) probes are submerged; the light beingprovided by two LED lamps (SMD Bridgelux Pro 200W, Germany). Theentire system was computer controlled. Sensors were connected to anMM44 control-transmitter unit (Crison Instruments, Spain) and dataacquisition software (DAQFactory, Labjack, USA) to provide completeexperiment monitoring and control. The LED lamps were controlledboth in intensity and on/off period duration. The photosynthesis ratewas measured by providing the requested light conditions and evalu-ating the oxygen accumulation rate, also providing air between cyclesto always perform the measurements close to 100 %Sat; thus avoidingthe influence of this variable. A minimum of three cycles were used toobtain a mean value under the conditions assayed.
2.4. Experimental design and accuracy of measurements
A total of 172 samples were taken from the raceway reactor atdifferent times throughout the year (from February to July) and atdifferent times of the day (8:00 h, 10:00 h, 12:00 h and 14:00 h). Thephotosynthesis rate (PO2, mg L-1 h−1) was calculated by diluting theculture and providing the target light conditions, measuring the oxygenproduction over time. The performance of the microalgae cells under
M. Barceló-Villalobos, et al. Bioresource Technology 280 (2019) 404–411
405
continuous light conditions was evaluated first as a control stage.Following this, the performance of the cells under different light re-gimes was determined. In the first set of experiments, the irradiancewithout cells was kept at 500 µEm−2 s−1 and the light and dark timeswere modified from 1 to 10 s. In the second set of experiments, theirradiance was adjusted to that existing in real outdoor reactorswhereas the light and dark times were adjusted close to those experi-mentally determined by CFD, thus ranging from 1 to 24 s. In each ex-periment, the irradiance without cells (I0), the irradiance with cells (I),the light time, and the dark time were fixed. From these values, wecalculated the different parameters. The average irradiance, Iav, wascalculated as the light inside the jacketed vessel multiplied by theproportion of time that it was illuminated (Eq. (1)). The illuminatedcycle proportion, Φ, was calculated as the illuminated time to total timeratio (Eq. (2)). The light exposure frequency, υ, was calculated as theinverse of the total cycle time (Eq. (3)).
=
+
tt t
Iav I light
light dark (1)
=
+
tt t
Φ light
light dark (2)
=
+
υt t
1light dark (3)
2.5. Statistical analysis
Data were processed using Microsoft Excel 2016, and the statisticalanalysis was performed using Statgraphics Centurion 18. Data from theoutdoor reactors were obtained at steady state whereas measurementsunder laboratory conditions were performed in triplicate (as aminimum).
3. Results and discussion
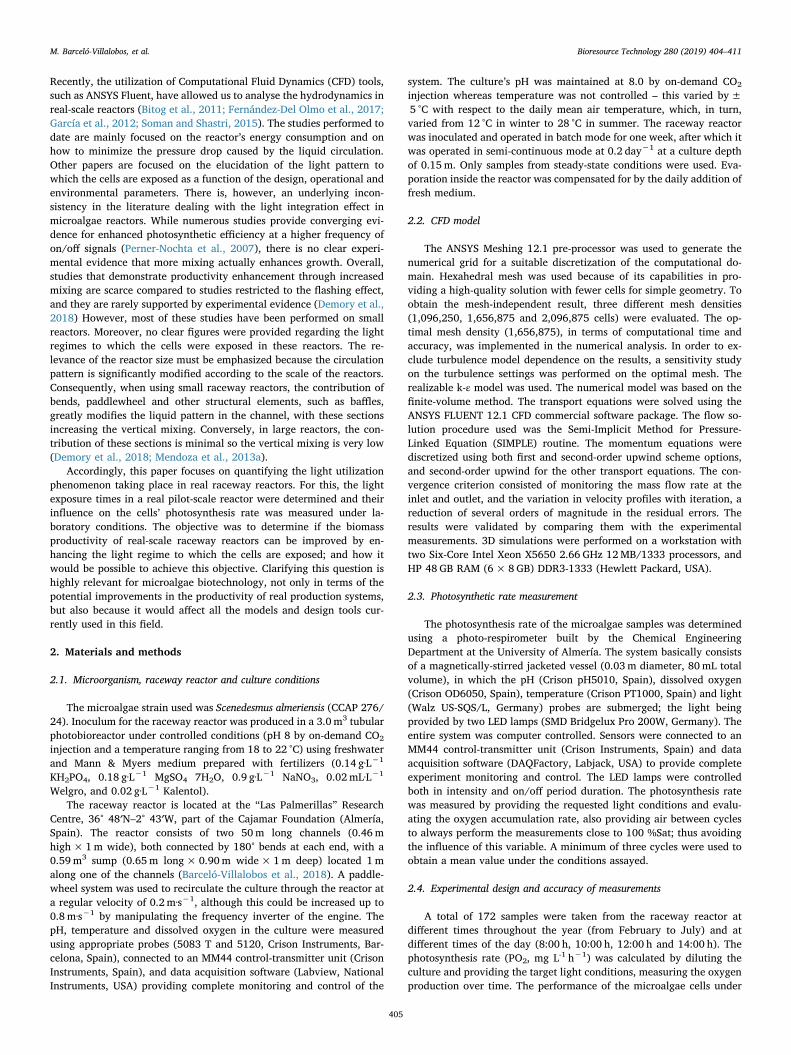
To study the influence of the light/dark cycles taking place in a100m2 raceway reactor on the performance of microalgae cells, thefirst step was to model the photosynthesis rate for continuous lightunder laboratory conditions. A classical P-I curve was obtained for theScenedesmus almeriensis cells taken directly from the reactor. The curvewas obtained at three different biomass concentrations, 0.1, 0.2 and0.4 g/L, by diluting the initial culture, 1.2 g/L, with fresh culture brothto minimize the variations in culture conditions. The results show thatthe photosynthesis rate increased hyperbolically with the irradiance,the system behaviour being equal at biomass concentrations of0.1–0.2 g/L whereas at 0.4 g/L, a lower photosynthesis rate was ob-served for the same irradiance values (Fig. 1). This can be attributed tothe light gradients inside the test cultures. In spite of the small size ofthe glass reactor used (0.03m diameter), light gradients always exist inmicroalgal cultures due to light attenuation by the cells; these are moreintense when the biomass concentration in the culture is high. In di-luted microalgae cultures, the cells are almost continuously exposed tolight and, under such conditions, photosynthetic performance is op-timal (0.1–0.2 g/L). In contrast, when intense light gradients are pre-sent (0.4 g/L), the cells remain at low irradiance for a significantamount of time and thus the photosynthesis rate is reduced.
Data from the three experiments were fitted to the hyperbolic model(Molina-Grima et al., 1996) (Eq. (4)); the model’s characteristic para-meter values being shown in Table 1. The results show that the max-imum photosynthesis rate, PO2max, was 101mgO2/gbiomass·h at the op-timal biomass concentration of 0.1–0.2 g/L but this reduced to63mgO2/gbiomass·h when using the higher biomass concentration of0.4 g/L. Regarding the irradiance at half-saturation, Ik, a value of82–90 µE/m2·s was obtained at the optimal biomass concentration of0.1–0.2 g/L whereas at the higher biomass concentration of 0.4 g/L, this
value dropped to 61 µE/m2·s. The value of form parameter, n, remainedconstant at 2.0. What is also highly relevant is that the respiration ratewas the same regardless of the biomass concentration; a value of−18mgO2/gbiomass·h being measured. This confirms that the respira-tion rate is independent of biomass concentration; it being only afunction of the culture conditions under which the cells are produced.Concerning the minimum irradiance for photosynthesis, Ic, values from39 to 43 µE/m2·s were obtained for the biomass concentrations assayed,with no tendency being observed of this characteristic parameter withregard to the biomass concentration. The maximum photosynthesis ratemeasured agreed with previously reported values of 270mgO2/gbiomass·h (Brindley et al., 2016). From these figures, the duty cycle canalso be calculated (that is to say, the percentage of time at which thecells were exposed to light) as the ratio between the irradiance with theculture present, I, and the initial irradiance with water only, Io (Eq.(5))- a value of 0.75 was obtained when using 0.4 g/L whereas thisparameter increased to 0.86 and 0.93 when using 0.2 and 0.1 g/L, re-spectively. These figures anticipate the relevance of the duty cycle onculture performance - the higher this parameter is, the higher thephotosynthesis rate for the same average irradiance results.
=×
+
+PO PO II I
ROmaxn
kn n2
22
(4)
=Φ IIo (5)
Once the photosynthesis model was known, the light/dark cyclesexisting in the 100m2 raceway reactor were studied, a critical para-meter that needs to be defined is the minimum irradiance required forthe microalgal cells to perform photosynthesis, Ic. On the basis of this
Fig. 1. Variation in the photosynthesis rate/of Scenedesmus almeriensis cells as afunction of the average irradiance for continuous light under laboratory con-ditions.
Table 1Characteristic parameter values of the hyperbolic model determined from thedifferent samples studied: samples from the same reactor at different biomassconcentrations; samples from the same reactor in different seasons.
Cb PO2max, n Ik RO2 Ic Φg/L mgO2/gbiomass·h µE/m2·s mgO2/gbiomass·h µE/m2·s %
0.1 101.3 2.01 82.2 −18.7 40.0 0.930.2 101.4 1.99 90.5 −18.9 43.0 0.860.4 63.5 2.00 61.3 −18.5 39.0 0.75
Season PO2max, n Ik RO2 Ic ΦmgO2/gbiomass·h µE/m2·s mgO2/gbiomass·h µE/m2·s %
Winter 130.0 2.00 120.0 −10.0 35.0 0.86Spring 180.0 2.00 70.0 −20.0 26.0 0.86Summer 160.0 2.00 90.0 −20.0 34.0 0.86
M. Barceló-Villalobos, et al. Bioresource Technology 280 (2019) 404–411
406
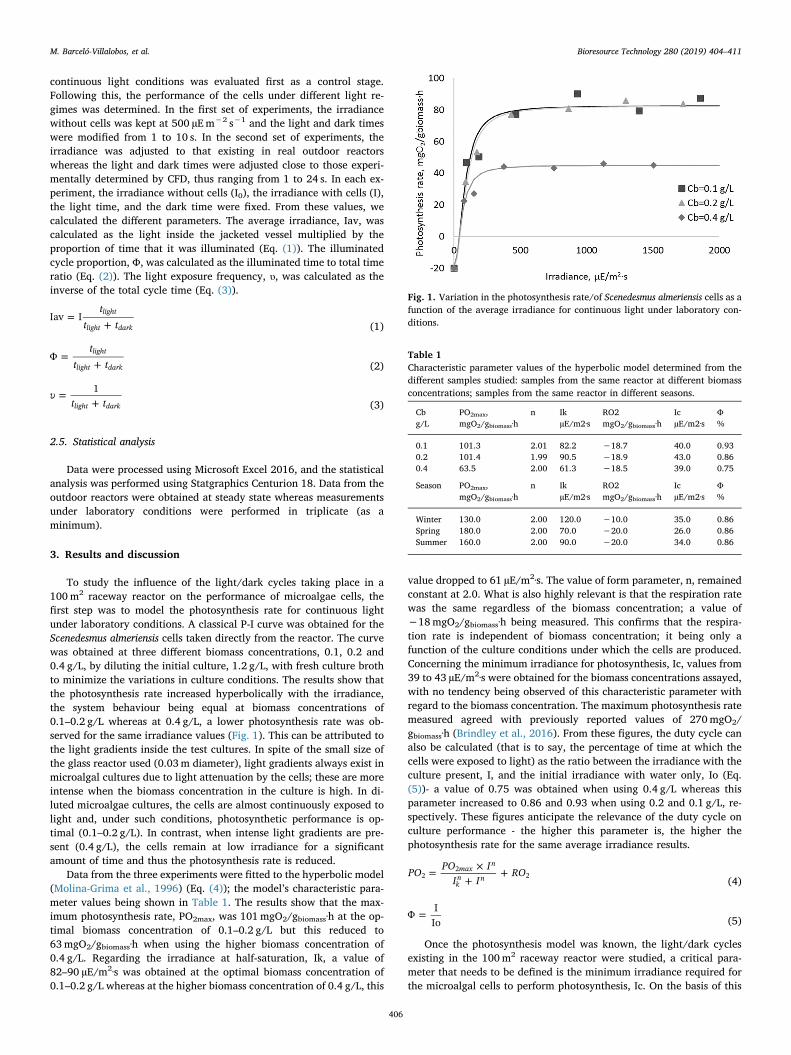
value, the entire volume of any reactor can be divided into light volume(a zone where there is enough light for photosynthesis to take place)and a dark volume (a zone where no photosynthesis is possible).Considering an Ic value equal to 40 µE/m2·s (Table 1), the time that thecells spend in the illuminated volume and in the dark volume of the realraceway reactor was calculated by CFD (Fig. 2). The results show thatthe time the cells were exposed to light, when close to the surface of theraceway reactor, was much shorter than the time that the cells re-mained in the dark, inside the reactor, where maximum values of 3.6and 28 s were obtained, respectively (Fig. 2A and B). Conversely, theminimum time the cells were exposed to light was 0.4 s compared to aminimum dark time of 5.6 s. All of these figures are mean values, ob-tained considering the average times for a total of 50 cells/particlesmoving along the raceway reactor for 50m in a straight channel. Thedata show that the vertical movement of the liquid in the raceway re-actor was minimal so displacement of the cells/particles from the re-actor’s light to dark zones was very slow, with some of them nevermoving between the light and dark zones; however, on average, thetimes calculated correspond to the expected average behaviour of asingle cell. The results also show how the light time increased whenincreasing the solar irradiance onto the reactor surface due to deeperlight penetration into the culture whereas this reduced when increasingthe liquid velocity because of the higher light/dark cycle frequencytaking place. Regarding the dark time, this was reduced when the solarirradiance was greater, again due to the increased light penetration intothe reactor. Likewise, higher liquid velocity in the reactor broughtabout an increase in the light/dark transition frequency to which thecells were exposed. Analysing the data on the frequency of light ex-posure, one observes how this increased when the liquid velocity in-creased; the solar irradiance influence being minimal in spite of themaximum frequencies measured at 0.17 Hz (Fig. 2C). It has been in-dicated that, to maximize the performance of microalgae cultures, anapproximate mixing frequency of 15 Hz is needed, which would require
an increase in liquid velocity up to 7.2 m/s in a 0.09m tube diametertubular photobioreactor (Brindley et al., 2016). Such a high liquid ve-locity would be very difficult to achieve in real reactors, and it wouldcause undesirable side-effects; for example, severe damage to the cellsby shear-related stress phenomena (Alías et al., 2004). In raceway re-actors, increasing the velocity above 0.8 m/s is almost impossible; inaddition, when the velocity is increased above 0.2 m/s, the powerconsumption required for circulating the liquid is greatly increased(Mendoza et al., 2013a). Regarding the duty cycle, the results showhow, in real raceway reactors, the proportion of time that the cellsreceived light was very low, with maximum values of 0.16, and whereno relevant variations were observed with liquid velocity or solar ir-radiance (Fig. 2D). Duty cycle values in the 0.05 range are typical forconcentrated cultures whereas in diluted cultures, values up to 0.4 canbe found; values up to 0.9 being measured only in really diluted cul-tures (Brindley et al., 2016). Higher duty cycle values favour light in-tegration by the cells although this is also influenced by other variablessuch as the irradiance and frequency under those conditions (Brindleyet al., 2011). In any case, the most relevant insight from the data ob-tained is that the times to which the cells are exposed to light or darkconditions are very large, especially when compared to that re-commended for light integration, which is less than 1 s (Brindley et al.,2011). Therefore, in order to evaluate the performance of microalgaecells based on the light/dark variations taking place inside real racewayreactors, experiments must be performed under these conditions, thusproviding light and dark periods in the range of seconds.
Consequently, the first set of experiments was performed takingculture from the raceway reactor and evaluating its photosynthesis rateunder laboratory conditions yet simulating those outdoors, thus pro-viding light and dark times based on the experimental raceway reactorresults. For this, a complete factorial experimental design was per-formed that considered light and dark times of 1, 2, 3, 4, 5 and 10 s withthe photosynthesis rate under these conditions being determined
Fig. 2. Variation in the light time (A), dark time (B) and light exposure frequency (C) of Scenedesmus almeriensis cultures in a raceway reactor as a function of theliquid velocity/and solar irradiance/on the reactor surface. Data obtained from CFD analysis of a real raceway reactor operated in continuous mode.
M. Barceló-Villalobos, et al. Bioresource Technology 280 (2019) 404–411
407
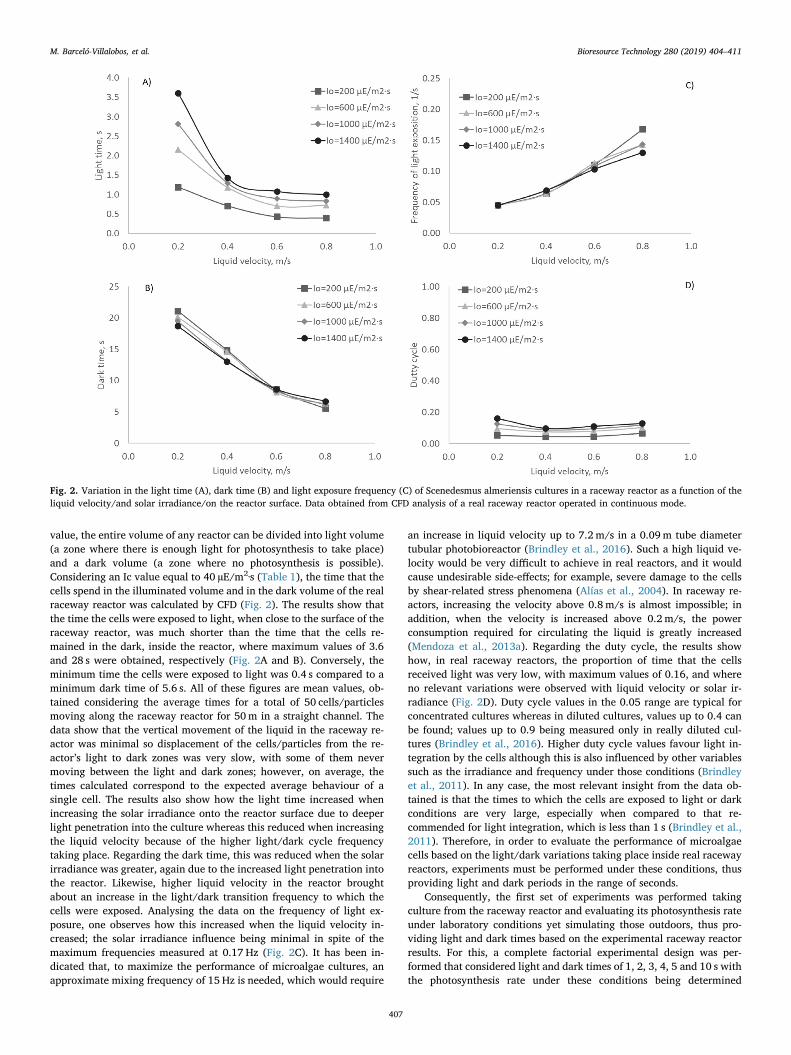
(Fig. 3). Based on the irradiance provided, the maximum photosynth-esis rate, PO2io, was calculated using the hyperbolic model previouslydescribed (Eq. (6)). By employing the average irradiance to which thecells were exposed, calculated as the irradiance provided multiplied bythe percentage of time for which it was provided, the theoreticalmaximal photosynthesis rate with full light integration (PO2iav) wasdetermined (Eq. (7)). Conversely, the theoretical minimum photo-synthesis rate, if null light integration took place, PO2local, was calcu-lated as the sum of the photosynthesis rate during light and dark per-iods, both calculated using the same hyperbolic model previouslydetermined (Eq. (8)). The experimental photosynthesis rate, PO2exp,must be midway between these two limit values, the higher the fre-quency at which the light was provided, the greater the light integra-tion with the experimental values of the photosynthesis rate ap-proaching the PO2iav values.
=×
+
+PO PO IoI Io
ROmaxn
kn n2io
22
(6)
=×
+
+PO PO IavI Iav
ROmaxn
kn n2iav
22
(7)
= + −PO PO RO( ·Φ) ( ·(1 Φ))light dark2local 2io 2 (8)
The results show how the maximal photosynthesis rate, PO2iav, in-creased hyperbolically with the average irradiance; as expected fromthe hyperbolic model used to calculate these values (Fig. 3). These
values correspond to the maximal values in the event that full lightintegration of the cells took place. Regarding the photosynthesis rate, ifnull light integration took place, PO2local, values increased linearly withthe average irradiance because these experiments were always per-formed at the same external irradiance of 500 µE/m2·s using dilutedcultures. Hence, the average irradiance increased linearly with theproportion of light in the illumination cycle assayed. What is more in-teresting is that the experimental measurements performed, PO2exp,completely fitted the trend of PO2local; thus indicating that light in-tegration does not occur under long light/dark times. The results showthat, only when the average irradiance was really high, did the ex-perimental photosynthesis rate approximate the maximal one althoughthis was because, under these conditions, the minimum dark times as-sayed were of 1 s. In contrast, it was also observed that, when providinglong light/dark times, the minimum average irradiance required to startthe photosynthesis process increased up to 100 µE/m2·s. Analysing thevariation in the normalized photosynthesis rate (PO2exp/PO2iav) withthe proportion of light time in the cycle, a clear linear correlation wasobserved (Fig. 3B). This confirms that, at the time scale used, there is nolight integration and the cells perform photosynthesis according to theirradiance that they receive during the “seconds-scale” times provided.It has been reported that, in commercial photobioreactors, medium-frequency fluctuations prevail, the behaviour being different formedium frequency fluctuations than for high frequency fluctuations(Barbosa et al., 2003). Light/dark cycles in the 6–87 s range lead tosimilar or lower growth rates and biomass yields on light energycompared to those obtained under continuous light of the same lightintensity as that during the light period of the light/dark cycles(Janssen et al., 2000a,b, 1999). No influence of light/dark cycles in the1–263 s range was found in terms of the volumetric productivity, spe-cific oxygen production, or carbon dioxide fixation (Grobbelaar, 1991,1989). On the other hand, it has been reported that maximal carbondioxide fixation is achieved under 4 s light/dark cycles (Bosca et al.,1991) whereas maximal growth rates are achieved under light/darkcycles with a dark period of 9 and 6 s (Lee and Pirt, 1981; Merchuket al., 1998).
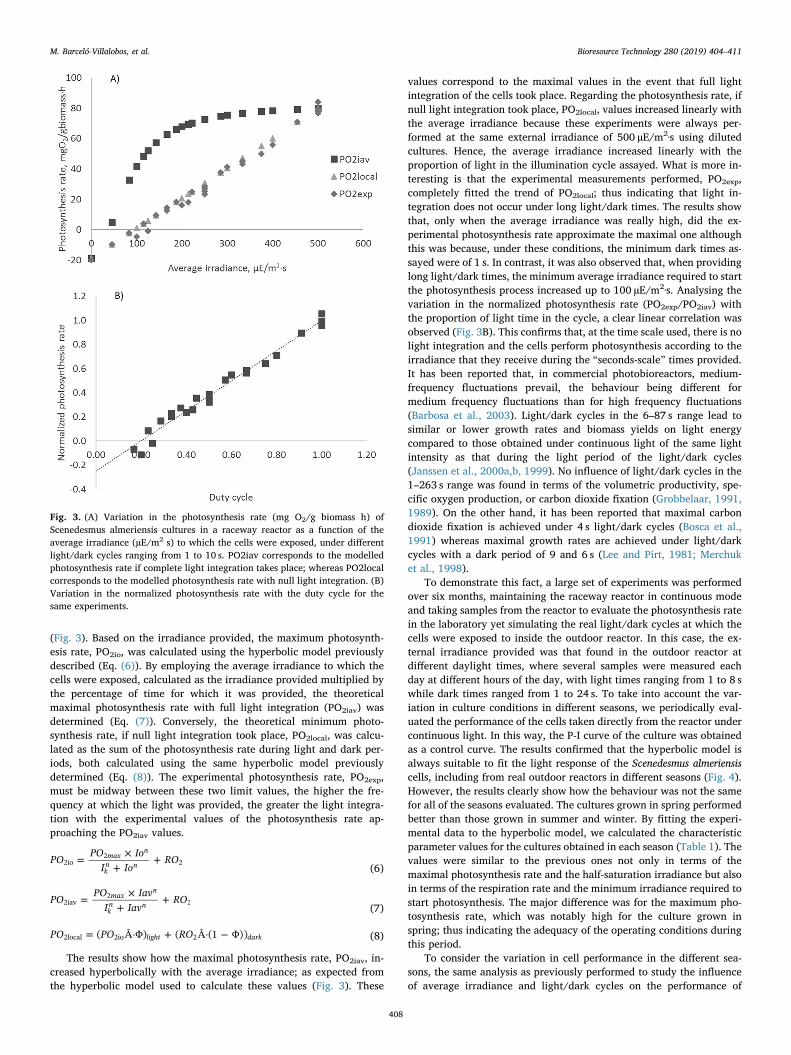
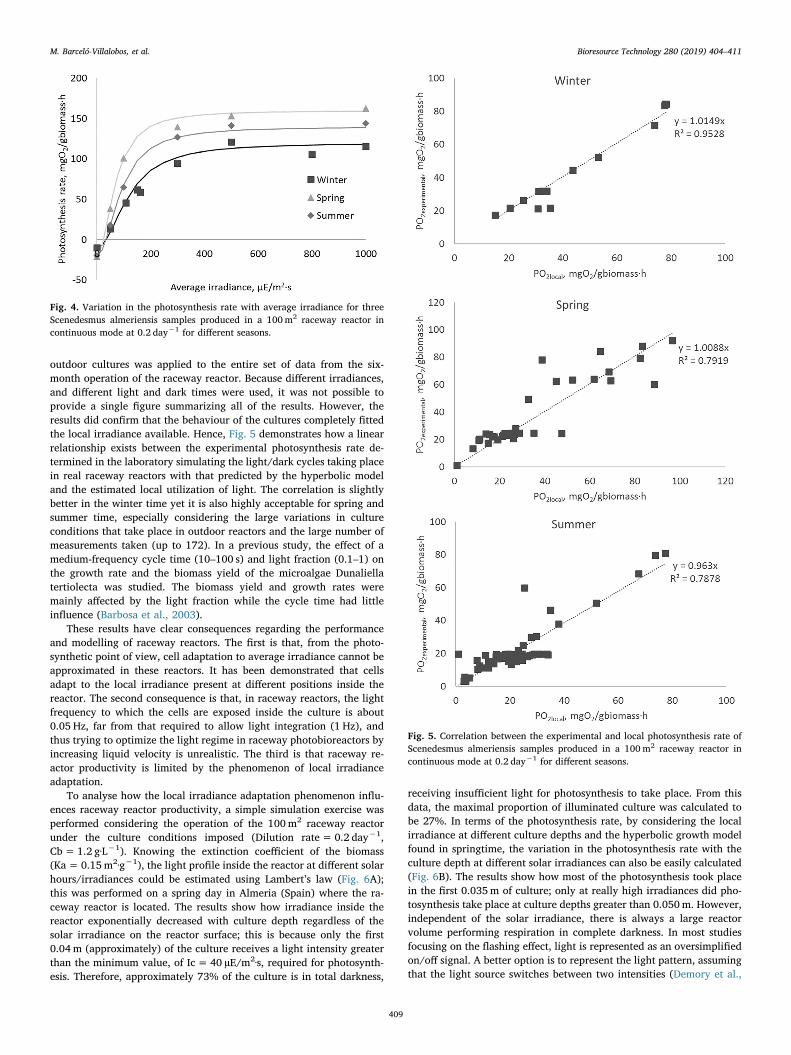
To demonstrate this fact, a large set of experiments was performedover six months, maintaining the raceway reactor in continuous modeand taking samples from the reactor to evaluate the photosynthesis ratein the laboratory yet simulating the real light/dark cycles at which thecells were exposed to inside the outdoor reactor. In this case, the ex-ternal irradiance provided was that found in the outdoor reactor atdifferent daylight times, where several samples were measured eachday at different hours of the day, with light times ranging from 1 to 8 swhile dark times ranged from 1 to 24 s. To take into account the var-iation in culture conditions in different seasons, we periodically eval-uated the performance of the cells taken directly from the reactor undercontinuous light. In this way, the P-I curve of the culture was obtainedas a control curve. The results confirmed that the hyperbolic model isalways suitable to fit the light response of the Scenedesmus almeriensiscells, including from real outdoor reactors in different seasons (Fig. 4).However, the results clearly show how the behaviour was not the samefor all of the seasons evaluated. The cultures grown in spring performedbetter than those grown in summer and winter. By fitting the experi-mental data to the hyperbolic model, we calculated the characteristicparameter values for the cultures obtained in each season (Table 1). Thevalues were similar to the previous ones not only in terms of themaximal photosynthesis rate and the half-saturation irradiance but alsoin terms of the respiration rate and the minimum irradiance required tostart photosynthesis. The major difference was for the maximum pho-tosynthesis rate, which was notably high for the culture grown inspring; thus indicating the adequacy of the operating conditions duringthis period.
To consider the variation in cell performance in the different sea-sons, the same analysis as previously performed to study the influenceof average irradiance and light/dark cycles on the performance of
Fig. 3. (A) Variation in the photosynthesis rate (mg O2/g biomass h) ofScenedesmus almeriensis cultures in a raceway reactor as a function of theaverage irradiance (µE/m2 s) to which the cells were exposed, under differentlight/dark cycles ranging from 1 to 10 s. PO2iav corresponds to the modelledphotosynthesis rate if complete light integration takes place; whereas PO2localcorresponds to the modelled photosynthesis rate with null light integration. (B)Variation in the normalized photosynthesis rate with the duty cycle for thesame experiments.
M. Barceló-Villalobos, et al. Bioresource Technology 280 (2019) 404–411
408
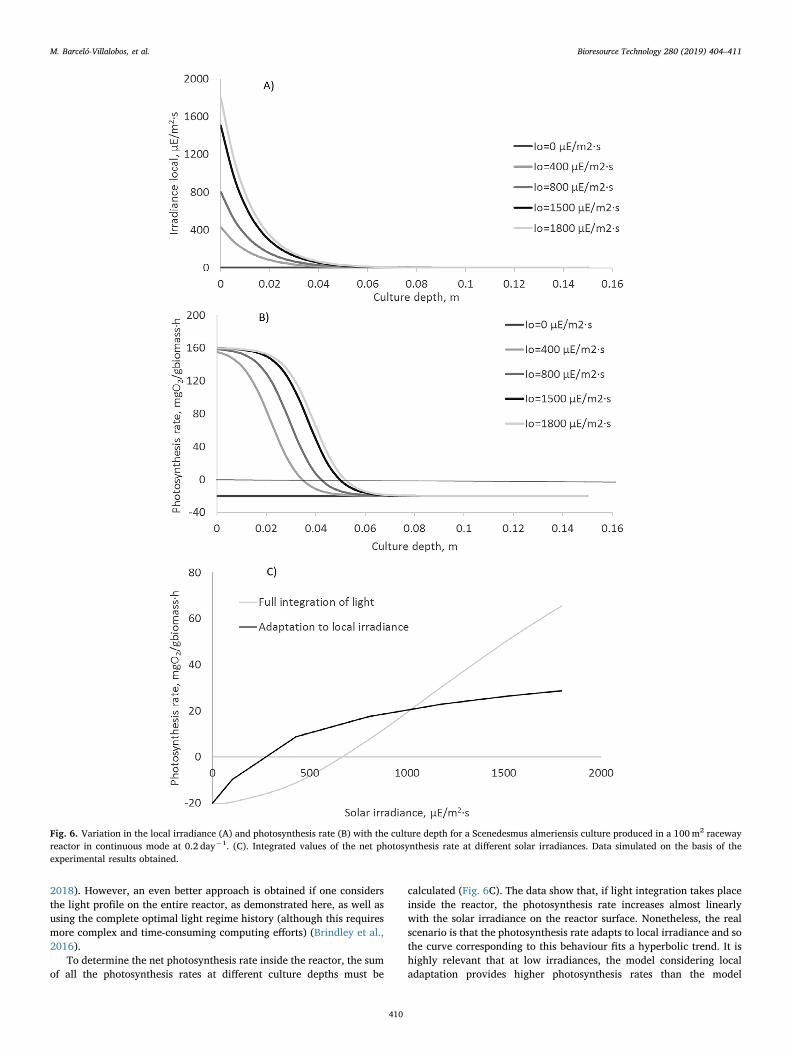
outdoor cultures was applied to the entire set of data from the six-month operation of the raceway reactor. Because different irradiances,and different light and dark times were used, it was not possible toprovide a single figure summarizing all of the results. However, theresults did confirm that the behaviour of the cultures completely fittedthe local irradiance available. Hence, Fig. 5 demonstrates how a linearrelationship exists between the experimental photosynthesis rate de-termined in the laboratory simulating the light/dark cycles taking placein real raceway reactors with that predicted by the hyperbolic modeland the estimated local utilization of light. The correlation is slightlybetter in the winter time yet it is also highly acceptable for spring andsummer time, especially considering the large variations in cultureconditions that take place in outdoor reactors and the large number ofmeasurements taken (up to 172). In a previous study, the effect of amedium-frequency cycle time (10–100 s) and light fraction (0.1–1) onthe growth rate and the biomass yield of the microalgae Dunaliellatertiolecta was studied. The biomass yield and growth rates weremainly affected by the light fraction while the cycle time had littleinfluence (Barbosa et al., 2003).
These results have clear consequences regarding the performanceand modelling of raceway reactors. The first is that, from the photo-synthetic point of view, cell adaptation to average irradiance cannot beapproximated in these reactors. It has been demonstrated that cellsadapt to the local irradiance present at different positions inside thereactor. The second consequence is that, in raceway reactors, the lightfrequency to which the cells are exposed inside the culture is about0.05 Hz, far from that required to allow light integration (1 Hz), andthus trying to optimize the light regime in raceway photobioreactors byincreasing liquid velocity is unrealistic. The third is that raceway re-actor productivity is limited by the phenomenon of local irradianceadaptation.
To analyse how the local irradiance adaptation phenomenon influ-ences raceway reactor productivity, a simple simulation exercise wasperformed considering the operation of the 100m2 raceway reactorunder the culture conditions imposed (Dilution rate= 0.2 day−1,Cb= 1.2 g·L−1). Knowing the extinction coefficient of the biomass(Ka= 0.15m2·g−1), the light profile inside the reactor at different solarhours/irradiances could be estimated using Lambert’s law (Fig. 6A);this was performed on a spring day in Almeria (Spain) where the ra-ceway reactor is located. The results show how irradiance inside thereactor exponentially decreased with culture depth regardless of thesolar irradiance on the reactor surface; this is because only the first0.04m (approximately) of the culture receives a light intensity greaterthan the minimum value, of Ic= 40 µE/m2·s, required for photosynth-esis. Therefore, approximately 73% of the culture is in total darkness,
receiving insufficient light for photosynthesis to take place. From thisdata, the maximal proportion of illuminated culture was calculated tobe 27%. In terms of the photosynthesis rate, by considering the localirradiance at different culture depths and the hyperbolic growth modelfound in springtime, the variation in the photosynthesis rate with theculture depth at different solar irradiances can also be easily calculated(Fig. 6B). The results show how most of the photosynthesis took placein the first 0.035m of culture; only at really high irradiances did pho-tosynthesis take place at culture depths greater than 0.050m. However,independent of the solar irradiance, there is always a large reactorvolume performing respiration in complete darkness. In most studiesfocusing on the flashing effect, light is represented as an oversimplifiedon/off signal. A better option is to represent the light pattern, assumingthat the light source switches between two intensities (Demory et al.,
Fig. 4. Variation in the photosynthesis rate with average irradiance for threeScenedesmus almeriensis samples produced in a 100m2 raceway reactor incontinuous mode at 0.2 day−1 for different seasons.
Fig. 5. Correlation between the experimental and local photosynthesis rate ofScenedesmus almeriensis samples produced in a 100m2 raceway reactor incontinuous mode at 0.2 day−1 for different seasons.
M. Barceló-Villalobos, et al. Bioresource Technology 280 (2019) 404–411
409
2018). However, an even better approach is obtained if one considersthe light profile on the entire reactor, as demonstrated here, as well asusing the complete optimal light regime history (although this requiresmore complex and time-consuming computing efforts) (Brindley et al.,2016).
To determine the net photosynthesis rate inside the reactor, the sumof all the photosynthesis rates at different culture depths must be
calculated (Fig. 6C). The data show that, if light integration takes placeinside the reactor, the photosynthesis rate increases almost linearlywith the solar irradiance on the reactor surface. Nonetheless, the realscenario is that the photosynthesis rate adapts to local irradiance and sothe curve corresponding to this behaviour fits a hyperbolic trend. It ishighly relevant that at low irradiances, the model considering localadaptation provides higher photosynthesis rates than the model
Fig. 6. Variation in the local irradiance (A) and photosynthesis rate (B) with the culture depth for a Scenedesmus almeriensis culture produced in a 100m2 racewayreactor in continuous mode at 0.2 day−1. (C). Integrated values of the net photosynthesis rate at different solar irradiances. Data simulated on the basis of theexperimental results obtained.
M. Barceló-Villalobos, et al. Bioresource Technology 280 (2019) 404–411
410
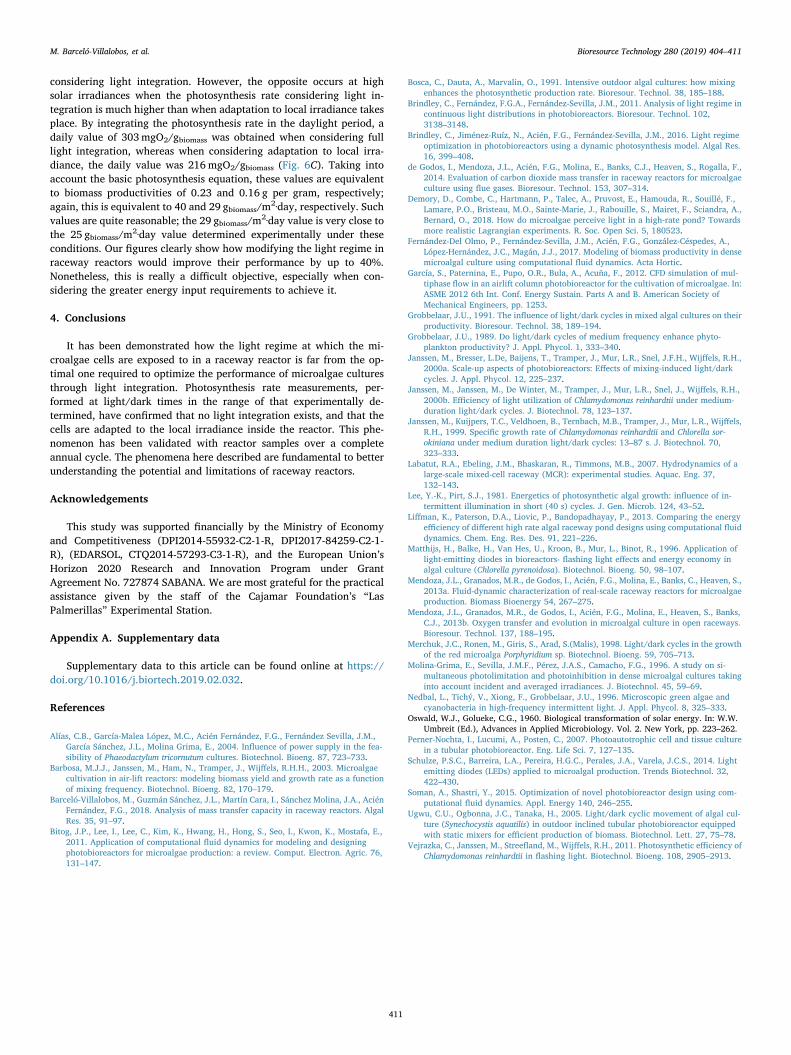
considering light integration. However, the opposite occurs at highsolar irradiances when the photosynthesis rate considering light in-tegration is much higher than when adaptation to local irradiance takesplace. By integrating the photosynthesis rate in the daylight period, adaily value of 303mgO2/gbiomass was obtained when considering fulllight integration, whereas when considering adaptation to local irra-diance, the daily value was 216mgO2/gbiomass (Fig. 6C). Taking intoaccount the basic photosynthesis equation, these values are equivalentto biomass productivities of 0.23 and 0.16 g per gram, respectively;again, this is equivalent to 40 and 29 gbiomass/m2·day, respectively. Suchvalues are quite reasonable; the 29 gbiomass/m2·day value is very close tothe 25 gbiomass/m2·day value determined experimentally under theseconditions. Our figures clearly show how modifying the light regime inraceway reactors would improve their performance by up to 40%.Nonetheless, this is really a difficult objective, especially when con-sidering the greater energy input requirements to achieve it.
4. Conclusions
It has been demonstrated how the light regime at which the mi-croalgae cells are exposed to in a raceway reactor is far from the op-timal one required to optimize the performance of microalgae culturesthrough light integration. Photosynthesis rate measurements, per-formed at light/dark times in the range of that experimentally de-termined, have confirmed that no light integration exists, and that thecells are adapted to the local irradiance inside the reactor. This phe-nomenon has been validated with reactor samples over a completeannual cycle. The phenomena here described are fundamental to betterunderstanding the potential and limitations of raceway reactors.
Acknowledgements
This study was supported financially by the Ministry of Economyand Competitiveness (DPI2014-55932-C2-1-R, DPI2017-84259-C2-1-R), (EDARSOL, CTQ2014-57293-C3-1-R), and the European Union’sHorizon 2020 Research and Innovation Program under GrantAgreement No. 727874 SABANA. We are most grateful for the practicalassistance given by the staff of the Cajamar Foundation’s “LasPalmerillas” Experimental Station.
Appendix A. Supplementary data
Supplementary data to this article can be found online at https://doi.org/10.1016/j.biortech.2019.02.032.
References
Alías, C.B., García-Malea López, M.C., Acién Fernández, F.G., Fernández Sevilla, J.M.,García Sánchez, J.L., Molina Grima, E., 2004. Influence of power supply in the fea-sibility of Phaeodactylum tricornutum cultures. Biotechnol. Bioeng. 87, 723–733.
Barbosa, M.J.J., Janssen, M., Ham, N., Tramper, J., Wijffels, R.H.H., 2003. Microalgaecultivation in air-lift reactors: modeling biomass yield and growth rate as a functionof mixing frequency. Biotechnol. Bioeng. 82, 170–179.
Barceló-Villalobos, M., Guzmán Sánchez, J.L., Martín Cara, I., Sánchez Molina, J.A., AciénFernández, F.G., 2018. Analysis of mass transfer capacity in raceway reactors. AlgalRes. 35, 91–97.
Bitog, J.P., Lee, I., Lee, C., Kim, K., Hwang, H., Hong, S., Seo, I., Kwon, K., Mostafa, E.,2011. Application of computational fluid dynamics for modeling and designingphotobioreactors for microalgae production: a review. Comput. Electron. Agric. 76,131–147.
Bosca, C., Dauta, A., Marvalin, O., 1991. Intensive outdoor algal cultures: how mixingenhances the photosynthetic production rate. Bioresour. Technol. 38, 185–188.
Brindley, C., Fernández, F.G.A., Fernández-Sevilla, J.M., 2011. Analysis of light regime incontinuous light distributions in photobioreactors. Bioresour. Technol. 102,3138–3148.
Brindley, C., Jiménez-Ruíz, N., Acién, F.G., Fernández-Sevilla, J.M., 2016. Light regimeoptimization in photobioreactors using a dynamic photosynthesis model. Algal Res.16, 399–408.
de Godos, I., Mendoza, J.L., Acién, F.G., Molina, E., Banks, C.J., Heaven, S., Rogalla, F.,2014. Evaluation of carbon dioxide mass transfer in raceway reactors for microalgaeculture using flue gases. Bioresour. Technol. 153, 307–314.
Demory, D., Combe, C., Hartmann, P., Talec, A., Pruvost, E., Hamouda, R., Souillé, F.,Lamare, P.O., Bristeau, M.O., Sainte-Marie, J., Rabouille, S., Mairet, F., Sciandra, A.,Bernard, O., 2018. How do microalgae perceive light in a high-rate pond? Towardsmore realistic Lagrangian experiments. R. Soc. Open Sci. 5, 180523.
Fernández-Del Olmo, P., Fernández-Sevilla, J.M., Acién, F.G., González-Céspedes, A.,López-Hernández, J.C., Magán, J.J., 2017. Modeling of biomass productivity in densemicroalgal culture using computational fluid dynamics. Acta Hortic.
García, S., Paternina, E., Pupo, O.R., Bula, A., Acuña, F., 2012. CFD simulation of mul-tiphase flow in an airlift column photobioreactor for the cultivation of microalgae. In:ASME 2012 6th Int. Conf. Energy Sustain. Parts A and B. American Society ofMechanical Engineers, pp. 1253.
Grobbelaar, J.U., 1991. The influence of light/dark cycles in mixed algal cultures on theirproductivity. Bioresour. Technol. 38, 189–194.
Grobbelaar, J.U., 1989. Do light/dark cycles of medium frequency enhance phyto-plankton productivity? J. Appl. Phycol. 1, 333–340.
Janssen, M., Bresser, L.De, Baijens, T., Tramper, J., Mur, L.R., Snel, J.F.H., Wijffels, R.H.,2000a. Scale-up aspects of photobioreactors: Effects of mixing-induced light/darkcycles. J. Appl. Phycol. 12, 225–237.
Janssen, M., Janssen, M., De Winter, M., Tramper, J., Mur, L.R., Snel, J., Wijffels, R.H.,2000b. Efficiency of light utilization of Chlamydomonas reinhardtii under medium-duration light/dark cycles. J. Biotechnol. 78, 123–137.
Janssen, M., Kuijpers, T.C., Veldhoen, B., Ternbach, M.B., Tramper, J., Mur, L.R., Wijffels,R.H., 1999. Specific growth rate of Chlamydomonas reinhardtii and Chlorella sor-okiniana under medium duration light/dark cycles: 13–87 s. J. Biotechnol. 70,323–333.
Labatut, R.A., Ebeling, J.M., Bhaskaran, R., Timmons, M.B., 2007. Hydrodynamics of alarge-scale mixed-cell raceway (MCR): experimental studies. Aquac. Eng. 37,132–143.
Lee, Y.-K., Pirt, S.J., 1981. Energetics of photosynthetic algal growth: influence of in-termittent illumination in short (40 s) cycles. J. Gen. Microb. 124, 43–52.
Liffman, K., Paterson, D.A., Liovic, P., Bandopadhayay, P., 2013. Comparing the energyefficiency of different high rate algal raceway pond designs using computational fluiddynamics. Chem. Eng. Res. Des. 91, 221–226.
Matthijs, H., Balke, H., Van Hes, U., Kroon, B., Mur, L., Binot, R., 1996. Application oflight-emitting diodes in bioreactors- flashing light effects and energy economy inalgal culture (Chlorella pyrenoidosa). Biotechnol. Bioeng. 50, 98–107.
Mendoza, J.L., Granados, M.R., de Godos, I., Acién, F.G., Molina, E., Banks, C., Heaven, S.,2013a. Fluid-dynamic characterization of real-scale raceway reactors for microalgaeproduction. Biomass Bioenergy 54, 267–275.
Mendoza, J.L., Granados, M.R., de Godos, I., Acién, F.G., Molina, E., Heaven, S., Banks,C.J., 2013b. Oxygen transfer and evolution in microalgal culture in open raceways.Bioresour. Technol. 137, 188–195.
Merchuk, J.C., Ronen, M., Giris, S., Arad, S.(Malis), 1998. Light/dark cycles in the growthof the red microalga Porphyridium sp. Biotechnol. Bioeng. 59, 705–713.
Molina-Grima, E., Sevilla, J.M.F., Pérez, J.A.S., Camacho, F.G., 1996. A study on si-multaneous photolimitation and photoinhibition in dense microalgal cultures takinginto account incident and averaged irradiances. J. Biotechnol. 45, 59–69.
Nedbal, L., Tichý, V., Xiong, F., Grobbelaar, J.U., 1996. Microscopic green algae andcyanobacteria in high-frequency intermittent light. J. Appl. Phycol. 8, 325–333.
Oswald, W.J., Golueke, C.G., 1960. Biological transformation of solar energy. In: W.W.Umbreit (Ed.), Advances in Applied Microbiology. Vol. 2. New York, pp. 223–262.
Perner-Nochta, I., Lucumi, A., Posten, C., 2007. Photoautotrophic cell and tissue culturein a tubular photobioreactor. Eng. Life Sci. 7, 127–135.
Schulze, P.S.C., Barreira, L.A., Pereira, H.G.C., Perales, J.A., Varela, J.C.S., 2014. Lightemitting diodes (LEDs) applied to microalgal production. Trends Biotechnol. 32,422–430.
Soman, A., Shastri, Y., 2015. Optimization of novel photobioreactor design using com-putational fluid dynamics. Appl. Energy 140, 246–255.
Ugwu, C.U., Ogbonna, J.C., Tanaka, H., 2005. Light/dark cyclic movement of algal cul-ture (Synechocystis aquatilis) in outdoor inclined tubular photobioreactor equippedwith static mixers for efficient production of biomass. Biotechnol. Lett. 27, 75–78.
Vejrazka, C., Janssen, M., Streefland, M., Wijffels, R.H., 2011. Photosynthetic efficiency ofChlamydomonas reinhardtii in flashing light. Biotechnol. Bioeng. 108, 2905–2913.
M. Barceló-Villalobos, et al. Bioresource Technology 280 (2019) 404–411
411