Embed Size (px)
Citation preview

Technology and Investment, 2019, 10, 1-29 http://www.scirp.org/journal/ti
ISSN Online: 2150-4067 ISSN Print: 2150-4059
DOI: 10.4236/ti.2019.101001 Feb. 28, 2019 1 Technology and Investment
Evaluation of Public R&D Policy: A Meta-Regression Analysis
Syoum Negassi, Jean-François Sattin
Université Paris 1 Panthéon-Sorbonne, PRISM Sorbonne, Paris, France
Abstract Economic theory and empirical evidence indicate that technological innova-tion is an important determinant of long-term economic development. Vari-ous country policies have been launched in favour of private research and development (R&D) with economic development as the main objective. As often in economics, public intervention is grounded on the presumed exis-tence of market failures. The purpose of this paper is two-fold. First, it pro-vides an overview of the history of R&D-related tax policies in more than ten industrial countries. Second, after reviewing the existent empirical evidence on the effectiveness of R&D tax credits policies, it presents a meta-regression analysis based on an econometric model. Our results show that an R&D tax credit is strongly significant in the studies taken cumulatively.
Keywords R&D, Meta-Analysis
1. Introduction
US, European and Asia policy makers have been concerned about the technolo-gical performance of their countries for large parts of the Twentieth Century. These concerns were sharpened by the post-war rise of the Japanese economy, which enjoyed very high growth rates until the 1990s based on a strong technol-ogical base and high commitment to R&D. The phenomenal growth of US, Eu-ropean and Asian economies (specially the Asian tiger economies) over the 1980s and mid-1990s has also been based on a high-tech strategy. These compet-itive threats have coincided with an intellectual movement in economic theory which emphasizes the conscious accumulation of R&D and human capital in ex-plaining economic growth [1].
Public support for innovation-related activities has been justified in several
How to cite this paper: Negassi, S. and Sattin, J.-F. (2019) Evaluation of Public R&D Policy: A Meta-Regression Analysis. Technology and Investment, 10, 1-29. https://doi.org/10.4236/ti.2019.101001 Received: December 17, 2018 Accepted: February 25, 2019 Published: February 28, 2019 Copyright © 2019 by author(s) and Scientific Research Publishing Inc. This work is licensed under the Creative Commons Attribution International License (CC BY 4.0). http://creativecommons.org/licenses/by/4.0/
Open Access

S. Negassi, J.-F. Sattin
DOI: 10.4236/ti.2019.101001 2 Technology and Investment
ways. First, governments are responsible for providing new or improved tech-nology for public sector functions (security, health, and communications) and R&D for these tasks may be performed in public research laboratories or con-tracted out to private firms and funded by public revenues. The second justifica-tion for public subsidies is to correct for market failures. Market failures in real and financial markets offer scope and justification for public support, as the re-turn may be not sufficient to justify private investment. The broad consensus on the use of public support is based on the inefficiencies of the market. The neoc-lassical theory based on a positive externality argument suggests that, because of the “public good” characteristics of R&D activities, the level of private R&D ex-penditure would be systematically lower than the socially optimal level. These create a gap between private and social return on R&D, and as a result less than optimal levels of research. Incomplete appropriability of research output and externalities deriving from the public good nature of R&D are at the base of this [2] [3]. The characteristics of imperfect appropriability and imperfect exclud-ability lead to the under-provision of innovation outputs by private decision makers in a market environment. This occurs since the benefits associated with R&D activities are easily and freely available to firms that are not engaged in R&D efforts. Indeed, the lack of full appropriability of R&D outcomes reduces the incentive to do R&D on the part of private firms so that, as in a classical Pigouvian context, government intervention through subsidization can reduce the extent of this “market failure”.
This argument has been widely criticized by several scholars. From an evolu-tionary perspective, Cohen and Levinthal [4] argued that knowledge cannot be so easily absorbed unless imitative firms, in turn, invest in a certain level of R&D effort: imitation is not costless and needs some pre-existing “hard core” R&D ac-tivity. This standpoint could lead to a paradoxical consequence: in an environ-ment characterized by significant spillover effects, firms could have greater in-centives to perform R&D since, in doing so, they might expand their absorptive capacity, i.e. their ability to benefit from the R&D efforts of others. In this way, they could more easily imitate and exploit market surpluses. As a consequence, the level of R&D could be too high (rather than too low), since many firms could undertake more R&D effort than that required to reach the optimal social results (e.g. by an increase of duplications in R&D expenditure).
Some scholars have suggested that R&D should not be taken as a pure public good: a firm has a great number of tools to protect its inventive capacity, such as patents and secrecy [5]. Therefore, the extent of positive externalities in produc-tion can be very limited and ⁄or industry-specific, and the need for supporting R&D activities more controversial than it might appear at first glance.
Additionally, knowledge is not subject to exhaustion or congestion because knowledge is a non-rival and partially excludable good [6]. The use of knowl-edge for one purpose does not diminish its supply or availability for other pur-poses. This “public good” feature demonstrates the social desirability of techno-logical knowledge, but also presents a major disincentive for private investment.
S. Negassi, J.-F. Sattin
DOI: 10.4236/ti.2019.101001 3 Technology and Investment
There is also asymmetric information about the expected outcome of R&D investments and sunk costs in R&D investment. Moreover, investment in R&D is riskier than investment in physical assets, and as a result there are likely to be more financial constrained [7] [8]. Public investment is designed to encourage firms to carry out R&D by lowering marginal costs and decreasing the uncer-tainties that are typically connected to this activity. In addition to these direct effects at the firm level, positive indirect impacts are also expected to spill over to other firms in the system.
Economic theory and empirical evidence indicate that technological innova-tion is an important determinant of long-term economic development. Various country policies have been launched in favour of private research and develop-ment (R&D) with economic development as the main objective. For example, some countries like the United States and France, pioneered in R&D tax credit programs at the beginning of the 1980s. The popularity of R&D tax credits con-tinued into this millennium, when other countries established their R&D tax credit programs in the end of 1990 and beginning of 2000, respectively. The ra-tionale backing such policies is that governments can pursue regional economic development by correcting market failure in innovation, thus enhancing private incentive to invest in research and development.
Given that the R&D tax credit has been in existence in many countries for a number of years, one legitimate question is whether this R&D-preferential policy has induced additional private R&D expenditure in these countries. There is no doubt that jobs and income are ultimate goals in countries’ innovation-based economic development. However, increasing private spending on R&D in the country is a necessary intermediate step toward these final goals. Therefore, evaluating the effects of tax credits on private R&D spending is an important first step toward a full evaluation of the economic effects of R&D tax incentives. Since the R&D tax credit co-exists with other countries R&D policy efforts, we can also include other relevant policy factors such as countries’ cooperative technology programs in Europe, and input and output of the higher education sector. Although R&D tax credit is just one of several policy instruments on R&D, it is a common strategy being employed by many countries for many years.
There have been many policy analyses of R&D tax credit, which confirm the effectiveness of R&D tax incentives on private spending in R&D. Studies of tax incentives aim mainly at measuring the additional private R&D spending and the cost-effectiveness of the incentives. Econometric estimation using two types of parametric methods developed first: impact models [9] in which a binary va-riable shows the impact of the tax incentive, and demand models [10] that di-rectly obtain the price-elasticity of R&D investment. More recently, parametric approaches have been combined with non-parametric ones in the evaluation of public policies. The second set of approaches has been widely used to determine whether R&D direct subsidies complement or crowd out private spending on

S. Negassi, J.-F. Sattin
DOI: 10.4236/ti.2019.101001 4 Technology and Investment
R&D. In these studies, the recent concern about endogeneity and selection problems has led researchers to identify patterns in the distribution of public support and to estimate counterfactual status [11].
As more and more emphasis is being given to the role of government sup-porting innovation-related activity, a clearer understanding of the historical in-tent of R&D related tax policies and of the effectiveness of these policies appears to be necessary.
The purpose of this paper is two-fold. First, it provides an overview of the history of R&D-related tax policies in more than ten industrial countries. Sec-ond, after reviewing the existent empirical evidence on the effectiveness of R&D tax credits policies, it presents a meta-regression analysis based on an economet-ric model.
Section 2 presents the aspects of the public scheme to be evaluated. Section 3 is devoted to the R&D tax incentives schemes and theoretical framework of the effectiveness of public policies with a brief introduction to models that are widely used in the evaluations of R&D public policies. Section 4 outlines the em-pirical methodologies and section 5 presents results and discussion.
2. R&D Tax Incentives Schemes and Theoretical Framework of Government Policies for Private R&D
2.1. Public Policy Scheme
R&D tax incentives also often seek to understand the channels underlying a pos-sible increase in the amount of R&D caused by the policy. For example, many questions can be raised: by how much do R&D tax incentives increase invest-ment for firms that already investing in R&D; how many firms that were not yet investing in R&D are induced to invest in R&D to the tax incentives; and how does the presence of R&D tax incentives across countries affect the decision of firms to locate their R&D investment in different tax jurisdictions.
The effectiveness of R&D tax incentives on increasing R&D investment can be evaluated by estimating the private “R&D price elasticity”, which measures the percentage change in R&D investment resulting from tax relief for every per-centage change in its after-tax price (also called the user cost of R&D), or by the “incrementality ratio,” which measures the change in R&D investment per dollar of forgone tax revenue that is spent on R&D fiscal incentives.
The incremental credit is meant to target tax relief to R&D expenditure that would not have occurred in absence of the credit. On the other hand, volume credits do not provide additional incentives to increase R&D investment from previous years since conditional on current level of R&D, firms will receive a tax credit regardless of their past investment.
An incremental scheme supports more firms with high R&D growth relative to a volume-based scheme which supports equally all R&D performing firms. A combination of volume and incremental tax incentives (hybrid schemes) main-tains the level R&D investment and simultaneously rewards high growth in R&D

S. Negassi, J.-F. Sattin
DOI: 10.4236/ti.2019.101001 5 Technology and Investment
investment [12]. R&D tax incentives may also affect the overall level of R&D investment in a
country by encouraging R&D by firms that have not previously invested in R&D. R&D tax incentives schemes can provide special provisions for new claimants (e.g. France) or starts-up (e.g. France, Netherland and Korea). At the same time, fiscal incentives might not be sufficient to spur a firm’s decision to invest in R&D; there is scarce empirical evidence on this issue, (see our results).
R&D tax incentives are now used in 26 out of 34 OECD member countries. Among non-OECD member countries, Brazil, China, India, Russia, Singapore and South Africa provide tax incentives for R&D.
The existing R&D tax incentives schemes differ significantly across coun-tries in terms of their generosity, their design, and how they explicitly target different firms or specific areas. Tax incentives for R&D include expendi-ture-based tax incentives, tax credits, R&D tax allowance, payroll withholding tax credit for R&D wages, and taxing royalty income and other income from knowledge capital at a preferential rate. Tax incentives differences are illus-trated in Table 1. Most OECD countries and emerging countries provide fiscal incentives through tax credits or enhanced allowances. Tax credits allow a di-rect deduction from the tax payable while enhanced allowances provide an ad-ditional tax deduction (above a normal deduction rate of 100% for wages, and depreciation for capital cost) from corporate taxable income. The main differ-ence between the two mechanisms is that the former directly reduces the tax liability while the latter approach the reduction in tax liability depends on corporate income tax rate.
Table 1. R&D tax incentives schemes in selected developed and emerging countries, 2013.
(a)
R&D Tax incentive scheme Countries
Incremental R&D tax credits United States, Ireland, Taiwan
Hybrid system of volume and an incremental credit Japan, Korea, Portugal, Spain
Volume-based R&D tax credit Australia, Canada, France, Norway, Brazil, China, India
R&D tax allowance Denmark, Czech Republic, Austria, Hungary, United Kingdom
(b)
Payroll withholding tax credit for R&D wage Belgium, Hungary, Netherland, Spain
More generous R&D tax incentives for SME’s
Canada, Australia, Japan, United Kingdom, Hungary, Korea, Norway
(c)
Targeting Countries
Special for energy United States
Special for collaboration Italy, Hungary, Japan, Norway

S. Negassi, J.-F. Sattin
DOI: 10.4236/ti.2019.101001 6 Technology and Investment
Continued
Special for new claimants France
Special for young firms and star-ups France, Netherland, Korea
(d)
Ceilings on amounts that can be claimed Italy, Japan, United States, Austria, Netherland
(e)
Income based R&D tax incentives Belgium, Netherland, Spain
(f)
No R&D tax incentives Estonia, Finland, Germany, Luxembourg, Mexico,
New Zealand, Sweden, Switzerland
This table shows in: (a) the three kind of tax incentives for R&D in the world; (b) countries which use pay-roll withholding as tax credit for R&D wages; (c) taxing royalty income and other income from knowledge capital at a preferential rate; (d) countries with ceilings on amounts given to the enterprises; (e) countries with Income based R&D tax incentives; (f) countries without tax incentives.
R&D tax incentives may apply to all qualified R&D expenditures (vol-
ume-based credits like in Canada) or only to the additional amount of R&D ex-penditure above a certain base amount (incremental credits like in USA).
Support for business R&D through the tax system is typically part of a broader set of policies to support investment in R&D, which also includes direct support, such as grants, loans or procurements contracts.
The overall costs associated with the R&D tax incentives schemes depend both on the uptake of the scheme by firms and the design of tax incentives in a coun-try. Significant differences exist in the generosity of R&D tax incentives across countries and within countries between small and large firms.
2.2. Theoretical Background
The majority of research on the effects of public policies on firm R&D expendi-ture have chosen to measure the presence/absence of “additionality” of public incentives by skipping, at least implicitly, the essential step of providing an ex-plicit theoretical framework to explain this causal relation (and also without en-tering too much into the analysis of other types of additionality, such as that based on output variables: productivity, profitability, innovation performance, etc.). David et al. [13] and David and Hall [14] provide more sound theoretical bases for the understanding of the effect of public policies on private R&D in-vestment. Their structural model identifies the optimal level of R&D investment as the point at which marginal rate of returns (MRR) and marginal capital costs (MCC) associated with R&D investments are equal. This is the classic profit maximization strategy of firms. The MRR curve derives from sorting R&D projects according to their internal rate of return, as in a usual investment plan. This curve is a decreasing function of R&D expenditure, since firms will first implement projects with higher internal rates of return and then those present-
S. Negassi, J.-F. Sattin
DOI: 10.4236/ti.2019.101001 7 Technology and Investment
ing lower rates. The MCC curve, instead, reflects opportunity costs of invest-ment funds, at any level of R&D. This curve has an upward slope due to the as-sumption that, as soon as the number of projects to implement increases, firms have to shift from financing them through retained earnings to equity and/or debt funding (i.e. from internal to external and more costly sources).
Both curves depend on a number of variables (other than R&D expenditure) that can move them either downward or upward. MRR depends of technological opportunities; state of demand; appropriability conditions and MCC of tech-nological policy tools; macroeconomic conditions; external costs of funds; and venture capital availability. The equilibrium condition, MRR = MCC, provides the optimal level of firm R&D investment. According to this framework, we might wonder what kind of effect a subsidy would have on the equilibrium level of the R&D expenditure: additionality; crowding-out, etc.
The difficulties that private parties are confronted with in reaping the benefits from their R&D investments and the intrinsic risks associated with innovations leave significant room for government intervention. According to microeco-nomic theory, governments can stimulate private R&D investment and spur economic development by reducing the marginal cost of capital (MCC) and/or raising the marginal rate of return (MRR) on private R&D investment. Govern-ment policies that directly target R&D include intellectual property rights, R&D tax credits, direct funding to industries and government R&D labs, and investing in public services (higher education in science and engineering disciplines, pro-grams for technology development and application, and so on).
The offer of R&D tax incentives offsets the inappropriability inherent in in-novation by reducing the cost of private R&D activities. The tax incentives have involved allowing R&D expenditures to be expensed rather than capitalized, of-fering depreciation allowance and tax credits for eligible R&D expenditures, and other tax benefits such as exemption of sales and use taxes for R&D properties.
Direct subsidies (either R&D contracts or R&D grants) are another major way governments intervene in private R&D activities. While tax incentives reduce the cost of private R&D, direct public subsidies induce additional private R&D in-vestment by raising the private MRR on R&D investment. Direct subsidies also relieve the firms of some joint costs of research and development activities. On the other hand, public R&D subsidies may simply substitute for some of the in-vestment that the performing firms otherwise would have prepared to under-take. Moreover, public R&D subsidies may negatively affect private investment in R&D by introducing the upward pressure on the prices of R&D inputs, such as wages of scientists and engineers.
In the public finance literature, the quality of public services is generally re-garded as an important factor in the decisions of business location and/or ex-pansion. Public services provide direct benefits to businesses and help to reduce business cost. For R&D investment, two types of services are important: higher education (which is a major source of R&D human resources and knowledge

S. Negassi, J.-F. Sattin
DOI: 10.4236/ti.2019.101001 8 Technology and Investment
spillovers to business R&D) and cooperative technology programs (which assist technology development and application to benefit companies and industries in the states).
In the past two decades, many governments in Europe have been very active in stimulating R&D investment within their borders by offering various incen-tives and services to industries. If properly designed and implemented, the addi-tional private R&D spending induced by the tax incentives can bring about some desirable economic benefits to the county. These benefits may include more highly paid jobs, higher per capita income, and an appropriate share of other benefits from the R&D conducted in their territory.
A number of studies have been done to evaluate the effectiveness of tax incen-tives in making firms spend more on R&D. The usual evaluation consists in checking whether there is R&D additionality, in the sense that private firms in-crease their R&D expenditures by more than it costs the government to support the tax incentives program. If per dollar of government support less than one dollar of additional private R&D gets spent by business, then public support par-tially crowds out private funding for R&D. The evaluation of the so-called ‘‘bang for the buck’’ is a rough cost-benefit analysis that generally does not take into account factors like spillovers, indirect tax returns, administration costs and the opportunity cost of spending taxable income on R&D support.
Different models may be used in analyzing a wide range of issues relevant to an evaluation of tax incentives, but their highest relevance and most widespread use are in the analysis of input additionality and result additionality. The discus-sion is concentrated around these issues.
Hall and van Reenen [15] focus their discussion on estimating the input addi-tionality effect, through econometric estimation of demand equations for R&D.
There are basically two approaches [15]: 1) R&D demand equation with shift parameter for existence of a tax cre-
dit scheme. The first approach is used in a large number of studies. In this ap-proach, the demand equation includes a variable that indicates whether the firm had access to the tax incentive, in addition to other variables that affect R&D in-vestments:
( )ln R&D it it ititC Xα β γ ε= + + + . (1)
where R&D i is the R&D expenditures of firm i, Ci is a variable measuring the taxcred it received by the firm i, and Xi is a vector of firm-specific characteristics affecting its R&D strategies (e.g. past R&D, cash flow and financial conditions, size, technological capabilities). In this specification, the parameter β (expected positive) measures the additionality ratio, which indicates the average increase that a tax credit induces in firms’ R&D investments.
This equation expresses the logarithm of the R&D investments of firm i in year t as a function of the presence of a tax incentive, Cit, that is equal to one if firm i had access to the scheme in year t and zero otherwise, and other variables, which are contained in the vector Xit. Such variables may be previous R&D in-

S. Negassi, J.-F. Sattin
DOI: 10.4236/ti.2019.101001 9 Technology and Investment
vestments, previous output and sales, expected future output, cash flow, product prices, etc. Whether the firms have been granted R&D subsidies through other channels will also be an important factor.
The β-parameter measures the expected growth of R&D investment following a firm getting access to the scheme. The basic framework assumes that this effect is identical across firms. This assumption is hardly innocuous, but it is not dis-cussed by Hall and van Reenen [15]. Such models should be estimated on mi-crodata to utilize cross-section variation in access to the scheme across firms. Using macro-data only, it is impossible to distinguish the effects of the scheme from unobserved macroeconomic shocks.
2) Demand equation with user cost of R&D. The second “demand equa-tion” approach has very much in common with the one described above. The major difference is that instead of just including a variable indicating existence of or access to a tax incentive for R&D, one calculates the so-called “user cost” of R&D investments, i.e. a variable that reflects the price of R&D investments for the firm, on the margin, taking into account R&D tax incentives, other tax rules, interest rates and depreciation. The introduction of, for example, a tax deduction scheme for R&D will reduce the user cost of R&D.
For R&D tax incentives, the “user cost of R&D” model is employed in most of the empirical studies at levels ranging from individual firms to the whole econ-omy. In a recent review, Hall and Van Reenen [15] conclude that a dollar in tax credit for R&D stimulates a dollar of additional private R&D investment. They argue that the estimation based on the “user cost of R&D” model is preferable because it is grounded in economic theory, and the price response of R&D in-vestment can be estimated directly. However, some weaknesses still exist in the model. One important methodological issue is the simultaneity between the R&D investment level of a firm and the tax price it faces. Additionally, since the user cost of R&D is a composite measure of depreciation allowance, tax credit, corporate income tax rate, and personal income tax rate, the visibility of policy effects is low.
( )ln R&D it it ititXα βρ γ ε= + + + . (2)
in which iρ is a variable measuring the user cost of R&D (i.e. its marginal costs), and the parameter β (expected negative) is the elasticity of R&D with re-spect to its price, measuring by how much R&D will increase when its marginal costs decrease.
In which itρ is a variable measuring the user cost of R&D (i.e. its marginal costs), and the parameter β (expected negative) is the elasticity of R&D with re-spect to its price, measuring by how much R&D will increase when its marginal costs decrease.
The key advantage of the user cost approach compared to the shift parameter approach is that one may utilize variations in the generosity of the scheme across firms, and also changes over time. Such variation may be very useful in identify-ing the effect of the scheme. In addition, variations in other components of the

S. Negassi, J.-F. Sattin
DOI: 10.4236/ti.2019.101001 10 Technology and Investment
user cost (tax rules, interest rates, depreciation rates) may in theory help in iden-tifying the effects of the fiscal measure. Within this framework, one may calcu-late the price elasticity of R&D, that is, how large the percentage change of R&D investments that follows from a one percentage change in the user cost.
The user cost is calculated by calculating what it costs for a profit-maximizing firm to invest “an additional dollar” in R&D at time t, and then “sell” this project in the next period. The tax system affects this cost in two respects. First, the re-turn to the investment is taxed at a rate τi. Second, the investment cost is re-duced by the tax subsidy and the allowed tax depreciation.
3. Econometric Analysis
Our meta-regression analysis builds upon a new database containing informa-tion on a large number of recent firm, country and state level studies on the ef-fects of R&D tax credits. We then investigate the factors that may explain dif-ferences in the estimated effects that are reported in the literature. In addition to several other control factors, the key explanatory variable that we focus on refers precisely to the specific characteristics. Our meta-regressions investigate whether those studies have controlled for these specific characteristics.
A clearer understanding of the historical intent of R&D-related tax policies and of the effectiveness of these policies appears to be necessary. Analysis of the effects of public financing on private investment in R&D has been the objective of numerous applied studies without it having been possible to arrive at a defi-nite conclusion. After the creation of a data-base including all relevant studies and their results and characteristics, a meta-analysis was carried out to examine whether the characteristic of the applied studies influence the results and explain the differences in the empirical literature on this subject.
This is an interesting pattern that calls for further research (i.e. constructed a model which takes into account some of the most important characteristics that explain variation in the estimated effects of R&D tax credits among different micro-econometric studies available in the literature). If corroborated by future investigations, this finding would cast some important doubts on the effective-ness of R&D tax incentives. This would in fact imply that fiscal resources in-tended to stimulate R&D and economic competitiveness have a relatively stronger effect on those specific characteristics that are characterized by low technological opportunities, sluggish demand conditions and weak spillover effects to the rest of the economy. If so, R&D tax incentives mechanisms should be redesigned in order to take into account the specific conditions that shape innovation propen-sity and dynamics in different industries of the economy, and in particular allocate a greater amount of fiscal incentives to R&D to high-opportunity and technologi-cally dynamic sectors.
The specific novelty of our survey paper and its intended contribution to the literature are twofold. First, we carry out a meta-analysis is to create a database that includes the relevant studies on the effectiveness of R&D tax credit policies

S. Negassi, J.-F. Sattin
DOI: 10.4236/ti.2019.101001 11 Technology and Investment
and on the relation between public funding of R&D and private R&D expendi-ture. In the end, more than 60 empirical studies were used in our meta-analysis (see Table 2). As is usual, most of them present more than one result (more than 700 estimation points in our econometric analysis, 341 for additivity ratio and 284 for user cost). The adoption of the meta-regression database and methodol-ogy opens up for future updates and extensions of this type of analysis of the ef-fects of R&D policy. Second, in explicitly investigating the role of the specific characteristics, we create a bridge between the R&D policy literature, on the one hand, and the important strand of research on firms’ industrial patterns of in-novation, on the other.
To compare the results of the existing studies it is necessary to have a sum-mary statistic of the main variable which is the dependent variable in the meta-regression. The empirical studies used in the meta-analysis sometimes es-timate elasticity and other marginal effects. The objective of a meta-analysis is to examine whether the characteristics of studies influence the results. These cha-racteristics are the independent variables (also frequently called moderator vari-able) in the meta-regression. The variables are presented in the next section.
Table 2. List of papers working on the effect of tax credit on private R&D.
Authors Date Country Period from Period to
Asmussen et Berriot
1993 France 1985 1989
Australian bureau of Economics
1993 Australia 1984 1994
Banno 2009 Italy 1991 2007
Bloom, Griffith and Van Reenen
2007 9 OECD countries 1979 1997
Baghna et Mohnen
2009 Canada (Québec) 1997 2003
Baily et Lawrence
1992 USA 1981 1989
Berger 1993 USA 1982 1985
Bernstein 1986 Canada 1981 1986
Bernstein 1998 Canada 1964 1992
Bloom et al. 2002 G7 + Australia + Spain 1979 1997
Collins 1983 USA 1981 1981
Lhullery et al. 2013 France 1993 2006
Dagenais et al. 1997 and 2004 Canada 1975 1992
Haegland et Moen (a)
2007 Norway 1993 2005
Hall 1993 USA 1981 1991
Cordes 1989 USA 1981 1985

S. Negassi, J.-F. Sattin
DOI: 10.4236/ti.2019.101001 12 Technology and Investment
Continued
Harris et al. 2009 Northern Ireland 1998 2003
Hines 1993 USA 1984 1989
Cozzarin 2008 Canada 2005 2006
HRMC 2010 United Kingdom 2003 2007
Cahu et al. 2010 France Prospectif horizon
2020
Klassen et al. 2004 Canada 1991 1997
Cappelen et al. 2010 Norway 2002 2009
Duguet 2008 France 1993 2003
Eisner et al. 1983 USA 1981 1982
Loskshin et Mohnen 2011 Pays-Bas 1996 2004
Loskshin et Mohnen 2007 Pays-Bas 1996 2004
Mairesse et Mulkay 2004 France 1983 1997
Mamuremas et Nadiri 1996 USA 1956 1988
Mansfield 1986 Sweden 1981 1988
Mansfield 1986 USA 1981 1983
Mansfield et Switzer 1985 Canada 1980 1983
Elschner and Ernst 2008 EU Member States 2006 2007
McCutchen 1993 USA 1982 1985
McFetridge et Warda 1983 Canada 1962 1982
McKenzie et Sershun 2005 G7 + Australie + Espagne 1979 1997
Parisi et Sembellini 2001 Italy 1992 1997
Shah 1994 Canada 1963 1983
Swenson 1992 USA 1981 1987
Van der Hove et al. 1998 Netherlands 1994 1996
Wilson 2007 USA 1981 2004
Czarnitzki et al. 2011 Canada 1997 1999
Wu 2005 USA 1979 1985
Falk 2004 OECD 1970 2002
Marra 2004 Spain 1991 1999
Thomson 2010 Australia 1990 2005
Falk 2006
Guellec et van Pottelsberghe
2003
Parson et Phillips 2007
Watkins and Paff 2009 USA 1994 1999
Corchuelle et Martinez-Roz
2009 Spain 1990 2002

S. Negassi, J.-F. Sattin
DOI: 10.4236/ti.2019.101001 13 Technology and Investment
Continued
Koga 2003 Japan 1989 1998
Lebeau 1996
Corchuelle et Martinez-Roz
2011 Spain 1998 2002
Fedderke and Teubes
2011 USA, China, South Africa,
Israel, Singapore and Malaysia
1990 1998
Haegland et Moen (b)
2007 Norway 2002 2005
Harris et al. 2009 Northern Ireland 1998 2003
Huang and Yang 2009 Taiwan 2001 2005
Ientile 2008 France 1986 2003
Kobayashi 2011 Japan 1999 2007
Klassen et al. 2004 USA and Canada 1992 1997
Onishi and Nagata 2009 Japan
Paff 2005 USA 1994 1999
Russo 2004 Canada
Lester 2011 Canada 2006 2008
Missaka 2008 USA 1987 2006
Caiumi 2011 Italy 2000 2005
Wang and Tsai 1998 Taiwan 1997 1997
Yohei 2011 Japan 2006 2006
Lhuillery et al. 2013 France 1998 2003
Ho 2006 USA 1975 1999
Huang 2009 Taiwan 2001 2005
Choi and Jeong 2013 USA 1980 2008
Corchuelo and Martinez-Ros
2009 Spain 2002 2002
Chang 2012 USA 1981 2006
Chiang, Lee and Anandarajan
2012 Taiwan 2002 2007
Wu 2005 USA 1979 1995
Yang et al. 2012 Taiwan 2001 2005
Rao 2010 USA 1981 1991
Romero Jordan et Sanz Sanz
2007 Spain 1990 2001
Shah 1994 Canada 1963 1983
Thomson 2010 Australia 1990 2005
Lee 2011 Japan, Canada, Korea, Taiwan, China, India
1997 1997
S. Negassi, J.-F. Sattin
DOI: 10.4236/ti.2019.101001 14 Technology and Investment
3.1. Data and Indicators
Following the standard meta-regression analysis methodology [16], the search process for relevant papers to include in the meta-analysis database included many reviews. Only papers that presented an econometric analysis of the effects of R&D tax creditson firm-level innovation and that provided enough informa-tion regarding the effect estimates (their standard errors or t-statistics) were further considered. Our literature search focused more carefully on those more old and recent micro-econometric studies produced from 1983 onwards. Earlier studies had been identified and surveyed in previous overview papers, which made some of our data collection tasks easier [13] [17] [18] [19] [20].
Typically, meta-analysis is a quantitative technique to summarize and evaluate the available empirical parameters (estimates) on a particular issue. That is, me-ta-analysis establishes guidelines to review, integrate, and synthesis studies ex-amining similar research questions.
Then, it can detect whether consensus conclusions are emerging in the studies and whether differences in the results across literatures. Therefore, the goal of meta-analysis is to detect the existence of an association among the variable of interest, the estimation of magnitude and the statistical significance of such as-sociation. By making the process of research explicit and systematic, meta-analysis clearly compares the different studies in a systematic way.
Meta-analysis is more objective than the traditional literature review. Me-ta-analysis can include non-sampling characteristics as a moderator variable in a meta-regression model. Typically, each study on the effects of R&D fiscal incen-tives presents estimation results for several regressions. But, there is no clear benchmark or rule in the meta-regression literature for deciding how many and which of these reported regressions should be included in a meta-regression analysis dataset. Another problem is concerned with the conclusions by com-paring and aggregating studies which are using different measuring techniques, definitions of variables, and subjects among the studies. The heterogeneity exists among studies because results from poorly-designed studies are included with results from good studies.
In order to have as many observations as possible and thus increase the varia-bility of our sample, the selection criterion we used was somewhat broad. We in-cluded all different regressions produced by the same micro-econometric study as different observations in our dataset, as long as these regressions differed be-tween them in some substantial way, e.g. in terms of their subsample, time pe-riod, model specification, tax-credit measure or dependent variable. This proce-dure is in line with other recent meta-analysis exercises in other fields of eco-nomic research [21] [22].
3.2. Econometric Methods
The empirical studies estimate the Equations (1) and (2) presented in Section 2 of this study. According to those empirical studies, the main coefficient of inter-

S. Negassi, J.-F. Sattin
DOI: 10.4236/ti.2019.101001 15 Technology and Investment
est is an estimate of the impact of tax credits R&D investment (β). Different re-searchers might present specific estimates of the effect of tax credit on R&D ex-penditure with and without a particular control variable.
Because the empirical studies mostly use different data sets, sample sizes and independent variables, variances of these estimated coefficients may not be equal and meta-regression errors are likely to be heteroscedastic. In order to compare with the research results from the empirical literature, it is necessary to trans-form the summary statistics to a common and comparable metric which is based on the concept of standardization [23].
Glass [24] [25] introduced the concept of effect size to integrate the findings of an experimental literature, so that effect size allows diverse studies to be compared directly.
In addition, Meta-analysis has been suggested by Stanley and Jarrell [26] as a means of summarising more accurately regression results across studies, such as those investigating the relationship between R&D tax credit and R&D activity, and making generalisations from available empirical evidence. Stanley and Jarrell [26] pay attention to the reported t-statistic, which provide the critical tests in the empirical studies.
Several variables have been applied in the literature to test the relation be-tween tax credit and R&D investment; our study follows Stanley and Jarrell [26] using t-values to compare a number of studies. In our work, the t-statistic which will be considered as the dependent variable had to be an estimate of the impact of some measures of tax credit. Most of the studies in our data sets provided more than one set of results for the estimation of initial regression. Following Stanley and Jarrell [26], multiple estimates from the same study were used as separate observations if they referred to different years. Estimates from dissimi-lar models using data from the same year were also included as separate obser-vations. On the other hand, an alternative modelling approach is to include only one estimate from each study and that is the best estimate by the authors. Nonetheless, the best estimate is not obvious in some cases, while the variation in the results is a key focus of most papers. Our study applies the first approach to aggregate different multiple estimates.
An advantage of the t-statistic is this standardized variable is a unitless meas-ure, allowing easy comparability across studies. It is why, in our work, we can ignore issues regarding the measurement scales of the R&D investment and tax credit variables. For this reason, we will include in our models a range of meas-ures of public policies (tax credits, etc.) and measures of R&D investment. Our paper will try to explain differences in the size of the estimated tax credit effects in the literature. Indeed, most econometric studies focus greater attention on significance than size because t-statistics are function of size. In our case, obser-vation is the sample size for each study estimate; see the variable of number of observations in our data sets, which gives sample size for each study.
To explain variation in the empirical results in the literature, we quantify the

S. Negassi, J.-F. Sattin
DOI: 10.4236/ti.2019.101001 16 Technology and Investment
impact of data and specification differences on the reported effect of tax credit on R&D activities. Our dependent variable, which is the parameter of interest, contains a vector of estimates of the effect being measured (the effect of tax credit on R&D investment). The t-statistics (dependent variable in this study) are explained by the many economic variables (dummy or continuous) and the usual error term. These moderator variables will be discussed below.
3.2.1. Publication Selection Bias “The simplest and most commonly used method to detect publication selection is an informal examination of a funnel plot” [27]. A funnel graph of our dataset is a scatter diagram of estimated effect (user-cost elasticity and additionality ra-tio in our case). The expected shape is an inverted funnel (this means an absence of publication selection).
Graphs are very often vulnerable to subjective interpretation and it is better to model publication selection which involves a meta-regression analysis between user-cost elasticity and its standard error [28] [29] [30] [31]:
1 0 .si si sia Seβ β ε= + + (3)
where 1, ,s n= (n studies), 1, ,i k= (k regression estimates), sia is the user-cost elasticity or the additivity elasticity for study s and regression estimate i, siSe is its standard error and siε is the error term. Equation (3) is the ex-plicit representation of meta-regression analysis model for publication selection. In the absence of publication selection, observed effects should vary randomly around the true value, β1, independently of standard error. When all studies are selected for statistical significance, publication selection bias will be proportional to the standard error siSe .
Studies using larger samples can be expected to report smaller publication bias. In most econometric models, siε is considerate to be heteroscedastic and to avoid it the classical practice is to weight Equation (1) by siSe . Dividing Equation (3) by this term gives:
11 0 .si si
si si si
aSe Se Se
εββ β= + + (4)
si
si
aSe
is the t-value (t of Student) for the estimated user-cost elasticity.
11 0 .si
sisi si
tSe Se
εββ β= + + (5)
Equation (3) is the Weight Least Squares (WLS) of Equation (1). Egger et al. [32] point out that the t-test of the intercept in Equation (3) is a test for publica-tion bias, which indicates whether some omitted variables in Equation (3) (characteristics of the studies … etc.) may lead to systemic selection effect and hence a bias in the estimated effect. Stanley [16], argues that the meta-regression model can be used to test not only for publication selection, but also for the true empirical effect after having controlled for publication bias. The first test is re-ferred to the funnel asymmetry test (FAT) and the latter as the precise-effect test

S. Negassi, J.-F. Sattin
DOI: 10.4236/ti.2019.101001 17 Technology and Investment
(PET). FAT tests the hypothesis:
( )( )
0 0
1 0
: 0 implies lack of publication selectionAgain
: 0 implies either upward positive sign or
downward publication negative sign
H
H
β
β
= ⇔ ≠ ⇔
PET tests the hypothesis:
1 1
1 1
: 0 implies no authentic empirical effect, this means also no true effect corrected for any publication biasAgain
: 0 implies the existence of authentic empirical effect
H
H
β
β
= ⇔
≠ ⇔ and could be interpreted as the true effect corrected
for any publication bias
3.2.2. Meta-Regression Analysis In our study, in addition to these two tests, we will investigate the effectiveness of R&D tax credits policies reported in the literature. We therefore extend the basic model in Equation (5) to include a set of additional explanatory variables (Xs,i). In the econometric specification, those explanatory variables correspond to individual study characteristics that may have a substantial impact on the re-sults of studies examining the relationship between tax credits and R&D activi-ties. Table 3 outlines a list of moderator variables. Those moderator variables can be continuous or binary variables. The binary variables used in this study re-flect the presence or absence of variables and generally take the form of dummy variables. Table 3. Variables in our models, Independent Variables: Tstudent = t-statistic.
Independent Variables Justification for introducing variables
PEP = period of estimation
R&D expenditure and public policies (incremental, hybrid, volume … etc.) change over time and one would think that these changing perspectives may affect the findings of studies. We introduce the average year of data or the number of years covered by the study to control for the study to control for any temporal impact on the estimate of tax credit on R&D investment. This enables us to capture any trend in tax credit.
NAUT = number of authors For each paper, we introduce the number of co-authors.
TD = type of data
Studies in our data set which evaluate the effect of tax credit on R&D investment have conducted their work at different levels of analysis, ranging from individual firm to the whole economy: some empirical studies use firm or industry level data and some studies evaluate the effectiveness of tax credit across nations. The various analysis levels of data correspond to different estimations across studies. By using a dummy variable, we control the unit of analysis because tax credit and its effect on R&D expenditure may vary according to the unit analyzed.

S. Negassi, J.-F. Sattin
DOI: 10.4236/ti.2019.101001 18 Technology and Investment
Continued
DSest = data structure and estimation methods
The existing studies have based their work on various types of data, such as cross-section, time-series and panel data. To each type of data corresponds an econometric methodology. Among different methodology of empirical of empirical studies, panel data method (fixed effects … etc.), ordinary least-squares and others estimates often vary greatly as a result. Our dummy variable distinguishes by coding 1 if panel data method and 0 for others.
Npoints = number of observations
It seems important to argue that the size of the sample can lead to different conclusions about factors leading to R&D activities.
USNUS = US or not US country variable
Most studies have documented the effectiveness of tax credit in the United States. Over time there was an increasing tendency to examine firms from elsewhere, such as Europe, Asia, Africa and South America. To distinguish the studies with and without United States data, we include a dummy variable.
Idum = includes industry dummy
Some omitted factors may influence both R&D expenditure and tax credit variables, such as the nature of competitive rivalry. To address concerns with the endogeneity of tax credit variable, most studies have included dummy variables to capture those effects, such as industry dummy. R&D investment might be determined by a variety of firm or industry specific characteristic in the policy-making processes, such as the supply of researchers, the degree of concentration, technology opportunities, industrial pressure … etc. We try to capture these characteristics by this dummy variable.
TDY: includes time dummy
Some studies include time variables to represent the effect of omitted variables and control the effect that is common across time. Since various common shocks, like business cycle or technology shocks, would affect the ability of firms to perform R&D, time dummy variable is included in the model to get rid of annual macroeconomic shocks. Time dummy capture the changes in public policy, technological progress or other time-specific effects which authors were not able to incorporate into the measure of tax credit.
BERD: business enterprises expenditure in R&D
R&D personnel in the total workforce is one of the major determinants in R&D intensity. Scientists undertake R&D research and also expand absorptive capacity. This variable measures the R&D activity of the firm.
GDERD: gross domestic exp on R&D total
The theory of industrial cluster argues that R&D investment depends on interactions between input supply and local demand conditions and the competition of industries, but those factors are complicated and immeasurable. To account for these omitted factors, the gross domestic expenses is included in the model to interpret fluctuations in economic health over the sample period. Its growth may be relevant to determine the market size for future inventions, which in turn is decisive to forecast the profitability of R&D project.
HE: high Edu expenditure by gov.
One of the key elements in the production of ideas is human capital which is dedicated to the production of R&D activity. The higher education influences the size of R&D employment and event stimulates R&D activity. The development of human capital generates a highly educated labour and increase the productivity of labour over time, so the efficient labour approaches the success in the innovation-based growth model. As a result, human capital consists of skills and knowledge which workers acquire through education and training.

S. Negassi, J.-F. Sattin
DOI: 10.4236/ti.2019.101001 19 Technology and Investment
Continued
GS: direct Gov. support on R&D
Direct subsidies that are accompanied a government’s project are distributed through grants to firms for specific projects or research areas. Such funding could be concentrated in areas where there is a large gap between the social and the private rate of return. The R&D subsidy lowers the private cost of the project, so the subsidy may turn an unprofitable project into a profitable one by the firm. R&D subsidy can also reduce the fixed costs of research facilities and it can motivate the profitability of undertaking R&D activity. Hence, the R&D subsidy can stimulate current and future private R&D expenditures. Compared with fiscal incentives for R&D activities, subsidies are likely to be captured by firms with low income taxes, so subsidies should not influence the tax coefficient.
Taux = rate of tax credit; CT = corporate income tax rate; LT = tax price of Labour related to R&D; MET = tax price of machinery and equipment used for the purposes of R&D; BST = tax price buildings and structures used for the purposes of R&D; FT = tax price for R&D expenditure that applicable to cross border R&D
Our focus now shifts to different types of fiscal incentives. Fiscal incentives for R&D can take various forms (see Table 1). There are many reasons for the government to use these policy instruments: changes in tax structure often affect agents’ behavior. For example an increase in corporate tax rates distort the relative value of resources and lower the net rate of return to private R&D investment. Then, R&D activity of resources and lower the net rate of return to private R&D investment. Then, R&D activities are less attractive and the rate of growth declines. Therefore, taxes on investment and income have a detrimental impact on investment activities and economic growth in an economy. On the other hand, R&D tax credit can support firms to increase financial resources which are committed to technological innovation. That is tax credit are deducted from the corporate income tax, so an increase in R&D tax credit lowers the user cost of capital and R&D investment becomes more competitive. Then, tax credit will stimulate further research on R&D and contribute to economic growth and social welfare.
RDR: RDt−1 (inclusion of lagged R&D)
To control for the prior year’s R&D expenditure, most empirical studies introduce lagged R&D expenditures to distinguish short-run and long-run effects. The prior year’s R&D spending for each firm acts as an important determinant in conducting the new investment. And the positive coefficient on the lagged R&D stock variables indicates that firms performing R&D continue to do so.
HTECH dummy: 1 if high-tech subsamples firms, 0 otherwise.
SME variable (dummy for SMEs subsamples).
INVERSE Inverse of the standard error (SE) of the effect estimated.
MANUF dummy: 1 if manufacturing subsamples, 0 otherwise.
FET Funds from abroad foreign enterprises.
NB: Some variables come from Russell Thomson who has given us his dataset constructed by him.
1, 0 , , ,1
, , ,
1 1ks i j j s i s ij
s i s i s i
t XSe Se Seβ
β α γ=
= + + +
∑ . (6)
,s it is the effect of tax credit on R&D investment. By using Equation (6), we will test the following two hypotheses: Hypothesis 1: Tax credit reduces the cost of R&D activity.

S. Negassi, J.-F. Sattin
DOI: 10.4236/ti.2019.101001 20 Technology and Investment
Hypothesis 2: Tax credit induces higher levels of R&D activity. A comparison of empirical studies is difficult due to the heterogeneity of em-
pirical models used. In our case, we split our data set in two due to the existence of two approaches in the evaluation of tax incentives (see Section 3 of this study). The sample across different literature suggests a number of explanatory variables, so we outline a list of moderator variables (see Table 3). We introduce four type of moderator variables: • variables which represent the R&D investment measure: R&D expenditures
by the private enterprises, Direct Government support on R&D, High Edu, Funds from abroad foreign enterprises;
• variables which represent R&D tax incentives: tax credit, labour tax, corpo-rate tax, machinery tax, building tax;
• variables which represent data characteristics and methodology; • variables which represent the various explanatory variables reported in the
original studies.
4. Results and Discussion 4.1. Funnel
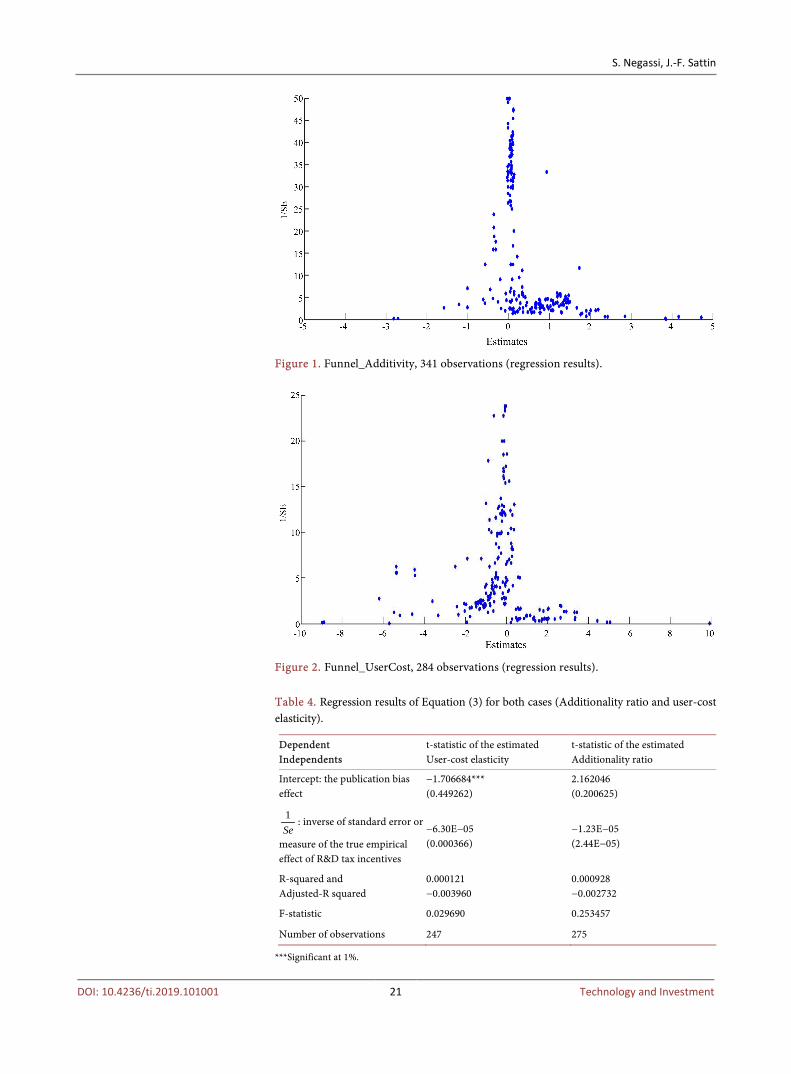
Figure 1 and Figure 2 plot the estimated user-cost elasticity and estimated addi-tionality ratio with their inverse of standard error (weight). These graphs are re-ferred to as funnel graphs because in the absence of publication selection it should look like an inverted funnel [28]. The symmetric shape is a necessary condition to exclude publication bias. These two figures have a funnel form and seem symmetric. We know that the visual interpretation of the funnel graph may be ambiguous, for this reason the FAT is generally associated with the Me-ta-regression analysis of Equation (3).
Table 4 displays results of Equation (1). This equation is a specification which
only includes the constant 0β (the publication bias effect) and 1Se
(measure
of the true empirical effect of R&D tax incentives).
4.2. Meta-Analysis
Many specifications designed to inform what study attributes affect the signifi-cance, the sign, and the magnitude of the estimated R&D tax credit effects are estimated. The R&D tax credit effects variable (represented by t-statistics) is then regressed on several study characteristics that are presumed to influence the study outcome.
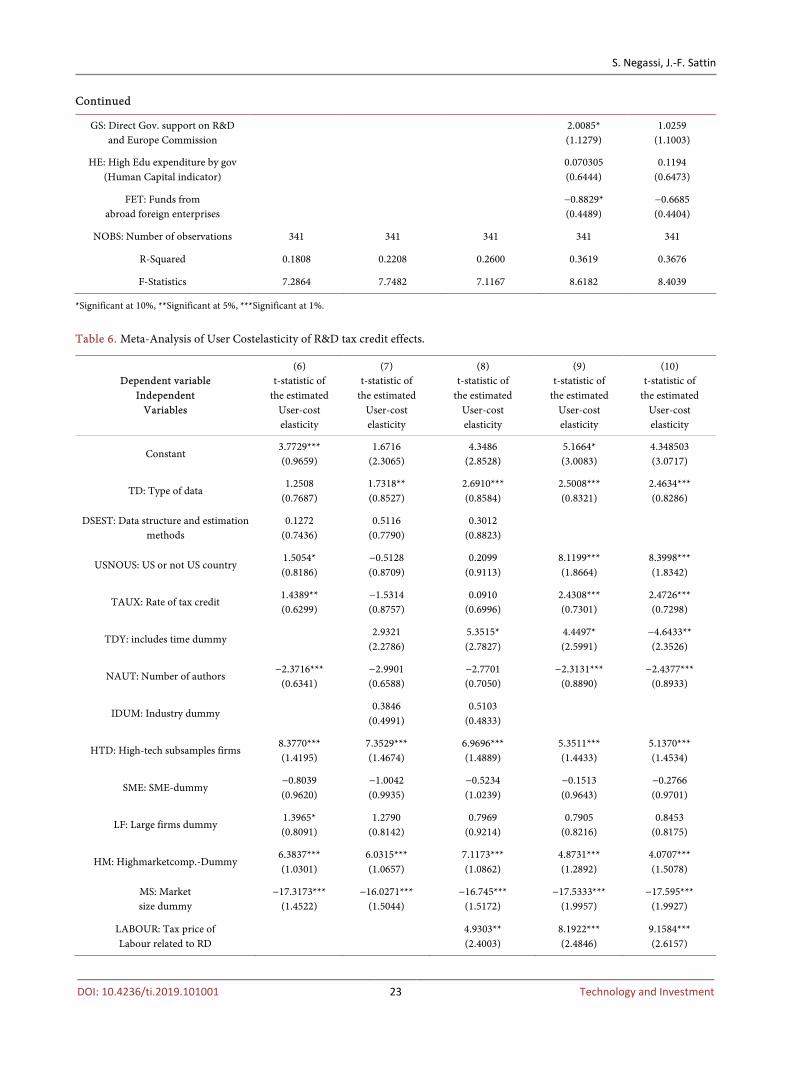
Table 5 and Table 6 present the results of meta-regression analysis. It reports the results of the estimation of Equation (3) and Equation (4), referring to the empirical approach in which the dependent variable used in previous studies is additionality ratio (Equation (1)) and referring to the second model specification that is typically adopted in the literature, which has as dependent variable the user-cost elasticity (Equation (2).
S. Negassi, J.-F. Sattin
DOI: 10.4236/ti.2019.101001 21 Technology and Investment
Figure 1. Funnel_Additivity, 341 observations (regression results).
Figure 2. Funnel_UserCost, 284 observations (regression results).
Table 4. Regression results of Equation (3) for both cases (Additionality ratio and user-cost elasticity).
Dependent Independents
t-statistic of the estimated User-cost elasticity
t-statistic of the estimated Additionality ratio
Intercept: the publication bias effect
−1.706684*** (0.449262)
2.162046 (0.200625)
1Se
: inverse of standard error or
measure of the true empirical effect of R&D tax incentives
−6.30E−05 (0.000366)
−1.23E−05 (2.44E−05)
R-squared and Adjusted-R squared
0.000121 −0.003960
0.000928 −0.002732
F-statistic 0.029690 0.253457
Number of observations 247 275
***Significant at 1%.

S. Negassi, J.-F. Sattin
DOI: 10.4236/ti.2019.101001 22 Technology and Investment
Table 5. Meta-Analysis of Additivity ratio of R&D tax credit effects.
Dependent variable Independent
Variables
(6) t-statistic of theestimated
Additionality ratio
(7) t-statistic of theestimated
Additionality ratio
(8) t-statistic of theestimated
Additionality ratio
(9) t-statistic of theestimated
Additionality ratio
(10) t-statistic of theestimated
Additionality ratio
Constant 3.2623*** (1.1744)
0.7175 (1.3236)
3.7662 (2.9066)
1.8937 (3.6035)
3.1045 (3.7466)
TD: Type of data 1.7307** (0.6943)
1.1660* (1.6682)
1.5690* (0.7677)
5.5154*** (1.7627)
5.9203*** (1.7925)
DSEST: Data structure and estimation methods
4.2464*** (0.8395)
5.3790*** (0.8761)
3.6090*** (1.0803)
3.0697*** (1.14263)
1.8953 (1.14330)
USNOUS: US or not US country 0.8169
(0.7306) 3.2760*** (0.9328)
1.8061* (0.9963)
6.1904** (2.911)
5.6568* (2.8915)
TAUX: Rate of tax credit 25.441*** (6.2685)
14.2701** (7.1469)
34.8228*** (10.7275)
43.2132*** (11.3344)
TDY: Includes time dummy −0.002506 (0.6732)
−1.5662** (0.7821)
−1.6259** (0.8209)
−1.7201* (0.8760)
−0.3354 (0.8632)
NAUT: Number of authors −0.5949 (0.6292)
−3.2245*** (1.2400)
−7.4583*** (1.3125)
−5.8906*** (1.2000)
IDUM: Industry dummy −0.4097 (0.5918)
0.1086 (0.5932)
1.0746 (0.7161)
2.7597*** (0.7465)
−1.3676* (0.6957)
HTD: High-tech subsamples firms 2.4148*** (0.5998)
2.2838*** (0.5889)
2.1143*** (0.6162)
0.4036 (0.7517)
0.7013 (0.7509)
SME: SME-dummy 0.9682
(0.8768) 1.2652
(0.8865) 1.6455* (0.9411)
2.9233*** (0.9686)
2.1165* (1.0922)
LF: Large firms dummy 1.5988** (0.6807)
1.2772* (0.6743)
1.1856* (0.6678)
0.8868 (0.6429)
1.0762* (0.6534)
HM: Highmarketcomp.-Dummy 1.7559** (0.7711)
3.5379*** (0.8710)
−0.8866 (1.4318)
−4.7104** (1.9299)
−3.0440 (1.8837)
MS: Market size dummy
−2.0361*** (0.6214)
−2.9848*** (0.6960)
−1.6254* (0.8405)
−0.9566 (0.8547)
−1.0523 (0.8781)
LABOUR: Tax price of Labour related to RD
8.3306*** (2.4023)
20.2679*** (3.9147)
−15.6995*** (3.71983)
MET: Tax price of machinery and equipment used for the purposes of RD
6.1961*** (2.0452)
9.8405*** (2.5432)
10.6221*** (2.5601)
CTR: Corporate income tax rate −10.1205 (6.5736)
1.2133 (6.6631)
6.4756 (6.7381)
BST: Tax price buildings and structures used for the purposes of RD
0.000957
(0.001232) 0.004329*** (0.001254)
0.005202*** (0.001320)
PEP: Average year of data or the number of years covert by the study
2.2887*** (0.5128)
1.8027*** (0.4966)
NB: Number of observations
0.7794*** (0.1914)
BRD: Lagged Business enterprises expenditure in R&D
0.2173
(0.91464) 0.4362
(0.9081)
S. Negassi, J.-F. Sattin
DOI: 10.4236/ti.2019.101001 23 Technology and Investment
Continued
GS: Direct Gov. support on R&D and Europe Commission
2.0085* (1.1279)
1.0259 (1.1003)
HE: High Edu expenditure by gov (Human Capital indicator)
0.070305 (0.6444)
0.1194 (0.6473)
FET: Funds from abroad foreign enterprises
−0.8829* (0.4489)
−0.6685 (0.4404)
NOBS: Number of observations 341 341 341 341 341
R-Squared 0.1808 0.2208 0.2600 0.3619 0.3676
F-Statistics 7.2864 7.7482 7.1167 8.6182 8.4039
*Significant at 10%, **Significant at 5%, ***Significant at 1%.
Table 6. Meta-Analysis of User Costelasticity of R&D tax credit effects.
Dependent variable Independent
Variables
(6) t-statistic of
the estimated User-cost elasticity
(7) t-statistic of
the estimated User-cost elasticity
(8) t-statistic of
the estimated User-cost elasticity
(9) t-statistic of
the estimated User-cost elasticity
(10) t-statistic of
the estimated User-cost elasticity
Constant 3.7729*** (0.9659)
1.6716 (2.3065)
4.3486 (2.8528)
5.1664* (3.0083)
4.348503 (3.0717)
TD: Type of data 1.2508
(0.7687) 1.7318** (0.8527)
2.6910*** (0.8584)
2.5008*** (0.8321)
2.4634*** (0.8286)
DSEST: Data structure and estimation methods
0.1272 (0.7436)
0.5116 (0.7790)
0.3012 (0.8823)
USNOUS: US or not US country 1.5054* (0.8186)
−0.5128 (0.8709)
0.2099 (0.9113)
8.1199*** (1.8664)
8.3998*** (1.8342)
TAUX: Rate of tax credit 1.4389** (0.6299)
−1.5314 (0.8757)
0.0910 (0.6996)
2.4308*** (0.7301)
2.4726*** (0.7298)
TDY: includes time dummy 2.9321
(2.2786) 5.3515* (2.7827)
4.4497* (2.5991)
−4.6433** (2.3526)
NAUT: Number of authors −2.3716***
(0.6341) −2.9901 (0.6588)
−2.7701 (0.7050)
−2.3131*** (0.8890)
−2.4377*** (0.8933)
IDUM: Industry dummy
0.3846 (0.4991)
0.5103 (0.4833)
HTD: High-tech subsamples firms 8.3770*** (1.4195)
7.3529*** (1.4674)
6.9696*** (1.4889)
5.3511*** (1.4433)
5.1370*** (1.4534)
SME: SME-dummy −0.8039 (0.9620)
−1.0042 (0.9935)
−0.5234 (1.0239)
−0.1513 (0.9643)
−0.2766 (0.9701)
LF: Large firms dummy 1.3965* (0.8091)
1.2790 (0.8142)
0.7969 (0.9214)
0.7905 (0.8216)
0.8453 (0.8175)
HM: Highmarketcomp.-Dummy 6.3837*** (1.0301)
6.0315*** (1.0657)
7.1173*** (1.0862)
4.8731*** (1.2892)
4.0707*** (1.5078)
MS: Market size dummy
−17.3173*** (1.4522)
−16.0271*** (1.5044)
−16.745*** (1.5172)
−17.5333*** (1.9957)
−17.595*** (1.9927)
LABOUR: Tax price of Labour related to RD
4.9303** (2.4003)
8.1922*** (2.4846)
9.1584*** (2.6157)

S. Negassi, J.-F. Sattin
DOI: 10.4236/ti.2019.101001 24 Technology and Investment
Continued
MET: Tax price of machinery and equipment used for the purposes of RD
−10.4777***
(3.6899) −7.5696* (4.1070)
−9.045713 (2.9122)
CTR: Corporate income tax rate 2.7470
(5.3648) −2.8114 (4.6122)
−3.4787 (4.6365)
BST: Tax price buildings and structures used for the purposes of RD
4.2040
(2.7930) −0.2782 (2.8422)
PEP: Average year of data or the number of years covert by the study
0.4873* (0.2754)
NB: Number of observations in the study
0.4408* (0.2446)
0.3786 (0.2514)
BRD: Lagged Business enterprises expenditure in R&D
0.9977* (0.5967)
0.9024 (0.6012)
GS: Direct Gov. support on RD and Europe Commission
0.2716
(0.6026) 0.468424 (0.6314)
HE: High Education expenditure by gov (Human Capital indicator)
0.4408* (0.2314)
−0.454677** (0.2289)
FET: Funds from abroad foreign enterprises
−0.5935***
(0.1444) −0.589440***
(0.1341)
NOB: Number of observation 284 284 284 284 284
R-squared 0.4597 0.4620 0.4776 0.5395 0.5413
F-statistics 23.2334 19.3939 15.2571 16.2785 16.3975
*Significant at 10%, **Significant at 5%, ***Significant at 1%.
4.3. Comments
A comparison of our results showed noticeable difference from other meta-analyse studies because we disaggregate the beta index on 3 components (respectively wages, mechanicals and building sub-indexes) that assess the R&D tax advan-tages allowed to firms depending on the nature of their spending. The effect of tax credit is mainly rooted in the fiscal advantages displayed toward wage, me-chanicals and buildings appear to have a significant impact on the mean effect size of tax credit.
VARIABLE DESCRIPTION MEAN Standard error
MIN MAX
Beta index Mean of the country beta index over the period covered by the database of the paper
0.958 0.126 0.566 1.059
Labor sub-index*
Mean of the current and labour components of the country beta index over the period covered by the database of the paper
0.927 0.129 0.497 1
Mechanicals sub-index*
Mean of the mechanicals component of the country beta index over the period covered by the database of the paper
1.057 0.188 0.538 1.563
Buildings sub-index*
Mean of the building component of the country beta index over the period covered by the database of the paper
1.365 0.245 0.664 1.941

S. Negassi, J.-F. Sattin
DOI: 10.4236/ti.2019.101001 25 Technology and Investment
Our focus now shifts to different types of fiscal incentives. Fiscal incentives for R&D can take various forms (see Table 1). There are many reasons for the gov-ernment to use these policy instruments: changes in tax structure often affect agents’ behavior. For example an increase in corporate tax rates distort the rela-tive value of resources and lower the net rate of return to private R&D invest-ment. Then, R&D activities are less attractive and the rate of growth declines. Therefore, taxes on investment and income have a detrimental impact on in-vestment activities and economic growth in an economy. On the other hand, R&D tax credit can support firms to increase financial resources which are committed to technological innovation. That is tax credit deducted from the corporate income tax, so an increase in R&D tax credit lowers the user cost of capital and R&D investment becomes more competitive. Then, tax credit will stimulate further research on R&D and contribute to economic growth and so-cial welfare.
Five specifications designed to inform what study attributes affect the signi-ficance, sign, and magnitude of estimated R&D tax credit effects are estimated and the results are reported below in Table 5 and Table 6. Positive coefficients of the moderator variables indicate that the characteristic of the study tends to provide a significant relationship between R&D tax credits and R&D expendi-tures. A negative sign implies that the associated characteristic of the study tends to return a non-significant relationship between the two variables. A non-significant coefficient implies that the characteristic of the study does not influence the rela-tionship.
In Table 4, the estimated parameter for the constant is significant for both specification (User-cost or Additionality), providing evidence of publication (selection) bias effect. The parameter is positive in the case of Additionality spe-cification and negative in the User-cost specification, indicating that previous studies overestimated the effect of R&D tax credits on firm’s innovation activi-ties (in additionality) and they failed to control for a set of factors that may affect this relationship (in User-cost). In addition to the publication bias, note that the estimated coefficient on the inverse of the standard error is negative and is not significant in both specifications. This implies no authentic empirical effect (measured by the coefficient of the inverse of the standard error), this means al-so no true effect corrected for any publication bias. The slope of PET in these specifications serves as a test for empirical effect corrected of publication bias. Our estimations of Equation (6) will try to correct this publication bias. The PET does not find a significant evidence of positive of R&D tax credit effects for both sample of our analysis.
It is reasonable to expect that if tax credit is significant across studies, estima-tion of Equation (6) will generate a positive and statistically significant coeffi-cient for the main variable R&D tax credit (Tax in Table 5). In different models (Table 5), results show that R&D tax credit is strongly significant in the studies taken cumulatively. A number of them have been done to evaluate the effective-ness of tax incentives in making firms spend more on R&D. The usual evalua-

S. Negassi, J.-F. Sattin
DOI: 10.4236/ti.2019.101001 26 Technology and Investment
tion consists in checking whether there is R&D additionality, in the sense that private firms increase their R&D expenditures by more than it costs the govern-ment to support the tax incentives program. The evaluation of the so-called ‘‘bang for the buck’’ is a rough cost-benefit analysis that generally does not take into account factors like spillovers, indirect tax returns, administration costs and the opportunity cost of spending taxable income on R&D support.
Different models may be used in analyzing a wide range of issues relevant to an evaluation of tax incentives, but their highest relevance and most widespread use are in the analysis of input additionality and result additionality. The discus-sion is concentrated around the input additionality effect, through econometric estimation of demand equations for R&D.
The second “demand equation” approach has very much in common with the one described above. The major difference is that instead of just including a variable indicating existence of access to a tax incentive for R&D, one calculates the so-called “user cost” of R&D investments, i.e. a variable that reflects the price of R&D investments for the firm, on the margin, taking into account R&D tax incentives, other tax rules, interest rates and depreciation. The introduction of say a tax deduction scheme for R&D will reduce the user cost of R&D.
For R&D tax incentives, the “user cost of R&D” model is employed in most of the empirical studies at levels ranging from individual firms to the whole econ-omy. Since the economic theory indicates that user cost of capital is a contribu-tor to R&D investment, the exclusion of variables which are related to the user cost in a study may affect the estimated tax credit effects leading to a mis-specified model. This is why we have included an indicator of size, human capital, sub-sidy, etc. All our models (in Table 5 and Table 6) present sensitivity results at three levels of significance (1%, 5% and 10%) for the estimated tax credit effects.
The intercept in most of our models (example model 1 and model 6) is sig-nificant in both specifications, implying that there is a statistically significant re-lationship between tax credit and R&D activity.
Some data characteristics do affect positively the empirical analysis of the in-fluence of tax credit on R&D activities, such as number of observations, the number of years covered by the study, and industry, firm, state or country level data. In contrast, a negative coefficient implies that number of observations and average years tends to provide a non-significant relationship between tax credit and R&D. The variable of the number of years covered is significantly positive in all our models, implying that early studies seem to give higher support to the re-lationship between tax credit and R&D. For instance, the variable of time dummy is significantly negative in some of our models. This indicates that the inclusion of this variable weaken the relationship between tax credit and R&D. In addition, the number of observations is significantly positive in models 6 and 9, that is, larger number of observations increase the probability of positive effect of tax credit on R&D activities.
Results indicate the inclusion of high-technology industry (variable HTD) as a

S. Negassi, J.-F. Sattin
DOI: 10.4236/ti.2019.101001 27 Technology and Investment
variable matter. Controlling for high-technology industry through a dummy variable contributes Controlling for high-technology industry through a dummy variable contributes to an important increase in the effect of R&D tax credit on R&D activities. These results suggest that there is a positive program effect on R&D spending for the high-technology industry in the different studies. In sum R&D tax credit have positive effects on growth of R&D spending for all industry and the high-technology industry. This tells us that the R&D tax credit has the effect of increasing R&D spending not only for the high-technology industry but also for the industry. This evidence supports the appropriateness of this public policy on the grounds that the primary purpose of this credit law has been ful-filled.
On the other hand, our results show that our expectation is not totally realized because in most models the tax credit is not strongly significant. Among the variable capturing data characteristic (variable TD), the coefficient of the obser-vation (variables NB and PEP), the country of data (Variable USNOUS), and the panel data (variable Desta) are also significant.
From the results, Private R&D expenditures, Government expenditure in high education, do not significantly affect the tax credit significance (coefficients positive and no significant except in model 10 Table 6). At all observation levels, Knowledge stocks (Variable HE) reveal positive effect but this is not strongly supported (only model 10 shows highly positive result).
The relationship between public funding and private funding is unclear from insignificant estimates in all our models.
5. Conclusion
This study presents a quantitative review of the empirical literature on the R&D investment from R&D tax credit policy. This study applies meta-regression analysis a sample of 625 t-statistics (341 t-statistics for additivity ratio model and 284 t-statistics for the user cost model) assembled for more than 60 studies to investigate the overall impact of tax credit on firms’ R&D investment. The re-search has painted a broad picture of the sorts of applications, methods, and findings, in the published literature. Our results show tax credit, other tax policy, estimation methods, sectorial dummy and level of analysis increased the esti-mated effect of tax credit on R&D expenditure. Lagged R&D, the inclusion of time, industry dummy, level of education and corporate tax rate do not appear to impact the estimated effect of R&D spending.
Conflicts of Interest
The authors declare no conflicts of interest regarding the publication of this paper.
References [1] Aghion, P. and Howitt, P. (2005) Growth with Quality-Improving Innovations: An
Integrated Framework. In: Aghion, P. and Durlauf, S., Eds., Handbook of Economic Growth, Elsevier, Amsterdam, Vol. 1A, 67-110.

S. Negassi, J.-F. Sattin
DOI: 10.4236/ti.2019.101001 28 Technology and Investment
https://doi.org/10.1016/S1574-0684(05)01002-6
[2] Mulkay, B. and Mairesse, J. (2003) The Effect of the R&D Tax Credit in France. LEREPS and UNU-MERIT, Preliminary Draft.
[3] Arrow, K.J. (1962) Economic Welfare and the Allocation of Resources for Inven-tion. In: Nelson, R.R., Ed., The Rate and Direction of Inventive Activity: Economic and Social Factors, Princeton University Press, Princeton, 609-625. https://doi.org/10.1515/9781400879762-024
[4] Cohen, W.M. and Daniel, A. Levinthal, D.A. (1990) Absorptive Capacity: A New Perspective on Learning and Innovation. Special Issue: Technology, Organizations, and Innovation, 35, 128-152. https://doi.org/10.2307/2393553
[5] Nadiri, M.I. (1993) Innovations and Technological Spillovers. NBER Working Pa-per No. 4423. https://doi.org/10.3386/w4423
[6] Romer, P. (1990) Endogeneous Technological Changes. Journal of Political Econo-my, 98, S71-S102. https://doi.org/10.1086/261725
[7] Hyytinen, A. and Toivanen, O. (2005) Do Financial Constraints Hold Back Innova-tion and Growth? Evidence on the Role of Public Policy. Research Policy, 34, 1385-1403. https://doi.org/10.1016/j.respol.2005.06.004
[8] Czarnitzki, D. (2005) Extent and Evolution of the Productivity Deficiency in East-ern Germany. Journal of Productivity Analysis, 24, 209-229. https://doi.org/10.1007/s11123-005-4706-0
[9] Berger, P.G. (1993) Explicit and Implicit Tax Effects of the R&D Tax Credit. Journal of Accounting Research, 31, 131-171. https://doi.org/10.2307/2491268
[10] Hall, B.H. (1993) Industrial Research During the 1980s: Did the Rate of Return Fall? Brookings Papers on Economic Activity, No. 2, 289-344. https://doi.org/10.2307/2534741
[11] Herrera, L. and Heijs, J. (2007) Difusión y Adicionalidad de las AyudasPúblicas a la Innovación. Revista de Economía Aplicada, 15, 177-197.
[12] Criscuolo, C., Czarnitzki, D., Hambro, C. and Warda, J. (2009) Design and Evalua-tion of Tax Incentives for Business Research and Development: Good Practice and Future Development. Final Report Submitted by the Expert Group on Impacts of R&D Tax Incentives to the European Commission, Directorate General.
[13] David, P.A., Hall, B.H. and Toole, A.A. (2000) Is Public R&D a Complement or Substitute for Private R&D? A Review of the Econometric Evidence. Research Pol-icy, 29, 497-529. https://doi.org/10.1016/S0048-7333(99)00087-6
[14] David, P.A. and Hall, B.H. (2000) Heart of Darkness: Modelling Public-Private In-teractions inside the R&D Black Box. Research Policy, 29, 1165-1183. https://doi.org/10.1016/S0048-7333(00)00085-8
[15] Hall, B.H. and van Reenen, J. (2000) How Effective Are Fiscal Incentives for R&D? A Review of the Evidence. Research Policy, 29, 449-469. https://doi.org/10.1016/S0048-7333(99)00085-2
[16] Stanley, T. (2008) Meta-Regression Methods for Detecting and Estimating Empiri-cal Effects in the Presence of Publication Selection. Oxford Bulletin of Economics and Statistic, 70, 103-127.
[17] Parsons, M. and Phillips, N. (2007) An Evaluation of the Federal Tax Credit for Scientific Research and Experimental Development. Department of Finance Work-ing Paper 2007-08.
[18] Mohnen, P. and Lokshin, B. (2009) What Does It Take for an R&D Tax Incentive Policy to be Effective? CIRANO Scientific Series 2009s-11.

S. Negassi, J.-F. Sattin
DOI: 10.4236/ti.2019.101001 29 Technology and Investment
https://doi.org/10.2139/ssrn.1499876
[19] Hall, B.H., Jacques Mairesse, J. and Mohnen, P. (2009) Measuring the Returns to R&D. NBER Working Paper Series 15622. https://doi.org/10.3386/w15622
[20] Yang, I.-H. (2011) The Effectiveness of Tax Credits as a Policy Tool to Promote R&D Activity: A Systematic Review and Meta-Regression Analysis. Dissertation, Auckland University of Technology, Auckland.
[21] Doucouliagos, H. and Stanley, T.D. (2009) Publication Selection Bias in Mini-mum-Wage Research? A Meta-Regression Analysis. British Journal of Industrial Relations, 47, 406-428. https://doi.org/10.1111/j.1467-8543.2009.00723.x
[22] Efendic, A., Pugh, G. and Adnett, N. (2011) Confidence in Formal Institutions and Reliance on Informal Institutions in Bosnia and Herzegovina: An Empirical Inves-tigation Using Survey Data. Economics of Transition, 19, 521-540. https://doi.org/10.1111/j.1468-0351.2010.00408.x
[23] Lipsey, M.W. and Wilson, D.B. (2001) Practical Meta-Analysis. SAGE, Thousand Oaks.
[24] Glass, G. (1976) Primary, Secondary, and Meta-Analysis of Research. Educational Researcher, 5, 3-8. https://doi.org/10.3102/0013189X005010003
[25] Glass, G. (1977) Integrating Findings: The Meta-Analysis of Research. Review of Research in Education, 5, 351-379. https://doi.org/10.2307/1167179
[26] Stanley, T. and Jarell, S.B. (1989) Meta-Regression Analysis: A Quantitative Method of Literature Survey. Journal of Economic Surveys, 3, 161-170. https://doi.org/10.1111/j.1467-6419.1989.tb00064.x
[27] Sutton, A.J., Duval, S.J., Tweedie, R.L., Abrams, K.R. and Jones, D.R. (2000) Em-pirical Assessment of Effect of Publication Bias on Meta-Analyses. British Medical Journal, 320, 1574-1577. https://doi.org/10.1136/bmj.320.7249.1574
[28] Ashenfelter, O., Harmon, C. and Oosterbeek, H. (1999) A Review of Estimates of Schooling/Earnings Relationship, with Test for Publication Bias. Labour Economics, 6, 453-470. https://doi.org/10.1016/S0927-5371(99)00041-X
[29] Card, D. and Krueger, A.B. (1995) Time-Series Minimum-Wage Studies: A Meta- Analysis. American Economic Review, 85, 234-243.
[30] Görg, H. and Strobl, E. (2001) Multinational Companies and Productivity Spill-overs: A Meta-Analysis. Economic Journal, 111, F723-F740. https://doi.org/10.1111/1468-0297.00669
[31] Mookerjee, R. (1991) A Meta-Analysis of the Export Growth Hypothesis. Econom-ics Letters, 91, 395-401. https://doi.org/10.1016/j.econlet.2005.12.020
[32] Egger, M., Davey, S.G., Schneider, M. and Minder, C. (1997) Bias in Meta-Analysis Detected by a Simple Graphical Test. BMJ, 315, 629-634. https://doi.org/10.1136/bmj.315.7109.629