Embed Size (px)
Citation preview

EVALUATION OF REACTION KINETICS AND MATERIAL PROPERTIES
OF CEMENTITIOUS CERAMIC MATERIALS USING ULTRASONIC
VELOCllY AND ATTENUATION MEASUREMENTS
A thesis submitted for the degree of Doctor of Philosophy
by
Robert Round
Department of Physics, Brunei University
June 1996

This thesis IS dedicated my to wife, GiII,and my children,
Janine and Adam, who suffered me, and succoured me, throughout
this work;
ABSTRACT
Ultrasonic velocity and attenuation measurements have been used
to characterise a range of phosphate bonded, alumina filled,
magnesia ceramics and other ceramic materials... Measurements
were made over a range of frequency from 50kHz - 1 OM Hz, using a
variety of commercial probes and equipment, and a variety of
techniques.
An ultrasonic double-probe method was used to monitor the
setting process of the cementitious ceramics using commercial
2.25MHz and 2MHz transducers, for compressional and shear wave
modes, respectively, in samples with alumina content in the
range of 0 - 60 wt 0/0. The elastic properties of the material
were determined from ultrasonic velocity measurements and
were found to be dependent upon the filler volume fraction. The
measured elastic moduli were found to Increase as porosity
decreased, and this effect might possibly be used to estimate
porosity .
The composition dependence of the elastic moduli is compared
with the Hashin and Shtrikman theoretical bounds for the elastic
moduli of two-phase materials. All data lie between these
bounds, suggesting that the alumina particles were well
dispersed and well bonded to the matrix. However, the fact that
the data are slightly above the lower bound suggested that the
particles are not spherical, and this, together with other evidence
obtained from an analysis of reaction rates, indicates the
predominence of plate-like gram structures.
ACKNOWLEDGEMENTS
I would like to thank my supervisors Prof. B. Bridge and Prof. D.
C. Imrie for their advice and support throughout this work. My
gratitude is also due to my fellow researchers, Mr K. S. Tan
and Miss T. Katerina for their collaboration in parts of this
thesis, and to Dr. S. R. Oaten and Dr S. B. Joshi. Encouragement
and support were also gratefully received from Professor C. A.
Hogarth, Mr. K. Schlachter, Mr. L. Lightowler and other members
of staff of the Physics Department of Brunei University.
I am indebted to the Science and Engineering Research council,
Polaris House, Swindon, and Thorn EMI, Central Research
Labroratories, Hayes, for financial support, and to BA Chemicals
Ltd. for the provision of the basic materials required for this
study.

CONTENTS
Chapter
1. INTRODUCTION.
2. CEMENTS, CERAMICS AND CONVENTIONAL EVALUATION
TECHNOLOGY.
2.1 CEMENTS AND CHEMICALLY BONDED CERAMICS.
2.1.1 Historical perspective.
2.1.2 Types of cements and concretes.
2.1.3 Development of novel strong cementitious
materials.
2.1.4 Macrodefect-free cements.
2.1.5 Reaction cements based upon phosphoric
compounds.
2.1.5.1 The chemistry of phosphate bonds.
2.1.5.2 Phosphoric acid.
2.1.5.3 Aluminium acid phosphates.
2.1.6 Properties of phosphate-bonded ceramics.
2.2 THE MECHANICAL TESTING OF BRIDLE CERAMICS.
2.2.1 Flexural testing.
page
1
11
11
13
19
21
27
33
34
35
38
40
42
46
Chapter page
2.2.2 The testing of cement and concrete structures. 49
2.2.3. Mechanical evaluation of actual structures with
minimal damage. 55
2.2.3.1 Penetration resistance. 56
2.2.3.2 Pull-out test. 57
2.2.3.3 Rebound hammer. 57
2.2.3.4 Lok test 59
2.2.4 Proof -testing. 60
2.3 NONDESTRUCTIVE TESTING AND EVALUATION. 62
2.3.1 The nature of nondestructive testing. 62
2.3.2 Selection of nondestructive testing methods. 67
2.4 ELECTRICAL AND ELECTROMAGNETIC RADIATION
METHODS. 72
2.4.1 Electrical methods. 72
2.4.2 Optical methods. 76
2.4.3 Radio and microwave methods. 77
2.4.4 Thermal methods. 80
2.4.4.1 Thermoelectrical and thermomechanical analysis. 80
2.4.4.2 Infrared thermography. 84
2.4.5 Radiography. 86

Chapter page
2.4.6 Computed tomography. 90
2.4.7 Nuclear magnetic resonance imaging. 96
2.5 SONIC AND ULTRASONIC NONDESTRUCTIVE
TESTING AND EVALUATION. 106
2.5.1 Acoustic emission. 106
2.5.2 Acousto ultrasonic methods. 107
2.5.3 Resonant frequency techniques. 113
2.5.4 Ultrasonic testing. 121
2.5.5 Dry coupling techniques. 125
2.5.6 Ultrasonic imaging. 133
2.5.7 Laser generation and detection of ultrasound. 140
2.6 APPLICATION OF NONDESTRUCTIVE TEST METHODS TO
CERAMIC MATERIALS. 148
2.6.1 Nondestructive evaluation of green and sintered
ceramics. 148
2.6.2 Nondestructive evaluation of chemically bonded
ceramics. 158
2.7 THE EVALUATION OF ELASTIC MODULI. 167
2.8 MATERIALS CHARACTERISATION USING
ATTENUATION SPECTRA. 171

Chapter
3.
4.
5.
2.9 ULTRASONIC MONITORING OF CURING.
THEORETICAL CONSIDERATIONS.
3.1 TRANSMISSION THROUGH MULTIPLE BOUNDARIES.
3.2 RELATIONSHIPS BETWEEN WAVE VELOCITY AND
MATERIAL STRUCTURE.
3.3 RELATIONSHIPS BETWEEN WAVE VELOCITY AND
ELASTIC MODULI FOR MUL TIPHASE MEDIA.
3.4 MODES OF PROPAGATION.
PREPARATION OF MATERIALS.
4.1 CHEMICAL REACTIONS.
4.2. AGGLOMERATION AND MIXING OF POWDERS.
4.2.1 Batch mixers.
4.2.2 Extrusion !Injection moulding
4.3 SAMPLE PREPARATION.
MATERIAL CHARACTERISATION.
5.1
5.2
PHASE IDENTIFICATION.
MATERIAL STRUCTURE AND MICROSTRUCTURE.
page
172
175
175
179
183
186
193
193
195
197
198
201
205
205
207

Chapter
6. EXPERIMENTAL METHODS.
6.1 GENERATION OF ULTRASOUND.
6.2 INSTRUMENTATION.
6.2.1 Low frequency measurements 24-500kHz.
6.2.2 High frequency velocity and narrow band
attenuation measurements.
6.2.3 Spectrum analysis.
6.2.4 Simultaneous shear and compressional velocity
measurements on setting material.
6.3 MEASUREMENT PROCEDURE.
6.3.1 Measurements on precast reinforced samples.
6.3.2 Continuous monitoring of setting samples.
7. EVALUATION OF PRECAST FULLY CURED CERAMIC
SPECIMENS.
7.1
7.2
7.3
LOW FREQUENCY VELOCITY MEASUREMENTS.
HIGH FREQUENCY ELASTIC MODULI.
ATTENUATION DATA.
page
211
211
216
216
218
220
221
222
222
223
228
228
230
242
Chapter
8.
9.
10.
COMPRESSIONAL AND SHEAR WAVE VELOCITY
MEASUREMENTS ON SETTING MATERIAL.
8.1 VELOCllY MEASUREMENTS.
8.2 THE COMPOSITION DEPENDENCE OF THE ELASTIC
PROPERTIES.
8.3 CHEMICAL REACTION RATES.
8.4 POROSITY - ELASTICITY RELATIONSHIPS.
CONCLUSIONS.
9.1 EVALUATION OF FULLY CURED MATERIAL.
9.2 MONITORING OF SETTING AND COMPOSITION
DEPENDENCE.
REFERENCES.
page
246
246
247
252
258
261
261
264
267

1. INTRODUCTION.
Inherent brittleness and a tendency towards catastrophic failure are
the major factors preventing the use of ceramics in many structural
applications. As a result the toughness of the composite is often
increased by reinforcement with filler and fibre phases.
Measurements on the toughness and strength achieved on incorporating
alumina and glass fibres, and particulate alumina, in a magnesium
aluminium phosphate matrix were the initial topics of the present
study. The basic material had been formulated and characterised by
workers at Thorn-EMI and co-workers using various techniques. Their
results will be discussed briefly in the appropriate context.
The main aims of this research were to evaluate current methods of
nondestructive evaluation (NDE) for this ceramic material and to
counter the problems of catastrophic failure by the development of
suitable NDE techniques to detect and reject substandard artifacts.
There are a number of well researched and reported cementitious
systems, ie materials which harden from a paste by chemical activity.
Many of these materials involve the phosphate bonding of a range of
1
oxides, and have been extensively reviewed, see for example Kingery
(1950) and Cassidy (1977). A number of compositions were
investigated at Thorn-EM I, see chapter 4. Following initial evaluation
and feasibility studies a range of materials based on the reaction
between magnesia and aluminium orthophosphate were selected for
further trials and evaluation, including non destructive evaluation.
The materials under consideration, the product of the exothermic
reaction of magnesium oxide with aluminium orthophosphate acidic
solution, filled with variable proportions of alumina, and with lesser
amounts of carbon or glass fibre as reinforcing phases. This material,
whilst combining excellent thermal and electrical insulation
properties with stiffness, fracture toughness and forgiving fracture is
almost as easy to mould as a polymer, and needs no sintering. In the
composites discussed here, typical dimensions of the alumina and
magnesia powder particles were 0.5-10J.lm and 3-40J.lm,
respectively, whilst the milled fibres were typically, 150J.lm x10J.lm
diameter.
The material was characterised by Finch and Sharp, Finch (1989), and
discovered to be largely composed of crystalline newberyite,
2

MgHP04·3H20 and an amorphous phase taken to be hydrated AIP04
. A
new hydrate was observed in some compositions depending upon the
source of the acidic component. This was referred to as hayesite and
is assumed to be a lower hydrate of MgHP04 probably MgHP04.H20 or
MgHP04·2H20. These matters are discussed in chapter 4, where the
preparation of samples is considered and in chapter 5, where the
structure and composition of the material is described.
For many years similar ceramic materials have been used for
refractory lining bricks and gunned furnace repairs. Such materials
have also found applications in dental surgery, particularly for repairs
to teeth and cementing prosthetic devices to teeth or bones. By virtue
of its unusual combination of thermal and mechanical properties the
material has also been suggested for stealth technology applications,
e.g. the minimisation of infrared signatures from aeroengine casings.
It also has a large potential impact on the mass marketing of domestic
appliances if used, for instance, as lightweight oven casings with
integral hobs and pipework. Simple one piece units can thus replace
the complex fabrications currently required to achieve the desired
physical requirements.
3

The fillers and reactants need to be dispersed in the acid solution in
order to produce samples with good mechanical properties. Therefore,
the mixing method must be able to wet the powders with the acid
solution and, since the composite changes from a slurry to a set
composite, any mixing equipment must be able to handle materials of
varying viscosity. Both continuous and batch mixers were assessed by
workers at Thorn-EM!. The outcome of this work is briefly discussed
in relation to the initial preparation of test samples in chapter 4.
The development of chemical bonds to unite the matrix and to cause it
to adhere to the other phases is dependent upon the temperature, which
itself is dependent upon the rates of exothermic chemical reactions
and the physical configuration of the reacting mass. Thus it is clear
that the development of the microstructure is by no means simple and
the production of identical components cannot be assumed in all
circumstances. This problem is compounded by the possibility of an
inhomogenious mix, and by the short mixing times imposed by the
increasing viscosity of the setting mass. Indeed the larger the mass
the greater the restriction on mixing time.
From the foregoing it is reasonable to expect variations in the
4
microstructure of the matrix due to local variations in the chemical
composition, the proportions of component materials, and the rate of
reaction. The distribution of reinforcing fibres, filler and porosity
will also be subject to variation. In addition to these material
variations, faults of a mechanical origin, including cracks, distortions,
inclusions and voids (as distinct from pores) are likely to be present.
The prototype material did indeed have serious void defects several
millimetres in diameter.
The primary aim of the current research programme was to investigate
the feasibility of nondestructively evaluating the structure of this and
other ceramic materials by ultrasonic and other nondestructive
methods commonly used for quality control and process control
applications.
The ceramic was characterised by a number of complementary
ultrasonic techniques in the frequency range 24kHz-5MHz for velocity
measurements and 1 OOHz-1 OMHz for broadband attenuation
measurements. Optical microscopy, radiography and electrical
methods were also employed, thus providing complementary data and
verification of various observations and assumptions.
5

The evaluation technology and theoretical background had first to be
developed and understood to enable an accurate interpretation of the
above test data from ceramic composites, and they are discussed in
chapters 2 and 3. Chapter 2 covers the history and development of
cementitious systems, and the properties of brittle ceramics and
cements, and goes on to discuss their measurement by conventional
mechanical and nondestructive means. The more relevant theoretical
background to ultrasonic evaluation is discussed in chapter 3.
As a result of the strong absorption and scattering in this material at
high frequencies, good ultrasound propagation is obtained only at low
frequency. Unfortunately, measurement problems occur at low
frequencies, where the wavelength is greater than the sample
dimensions.
It would have been a simple matter to produce larger samples, blocks
or cylinders with dimensions of the order of O.2-0.5m, more suited to
analysis by the methods and equipment used. However one of the
objectives of the research project was to develop a method of NDE
which would remain viable in a production environment. It was
therefore considered preferable to tailor the ultrasonic technique to
6
the artefact to be evaluated, rather than tailoring the artefact to the
available evaluation methods. Thus it was considered necessary to
gain an understanding of the nature of wave propagation in the
circumstances outlined. The lowest frequency at which the ultrasonic
propagation and properties are dependent on the material structure
alone, i.e. independent of sample size, was established to be 2MHz with
conveniently sized test pieces of dimensions 1.5 x 1.5 x 6 cm. At this
frequency the ultrasonic wavelength in the material was
approximately 2mm. The variety of equipment used and the techniques
employed in the evaluation of the materials are described in chapter 6.
Dynamic elastic moduli measurements have been found to agree well
with elastic constants calculated theoretically by treating the matrix
and filler as end members of a two phase material whose properties
obey the lower Hashin and Shtrikman bound, see chapter 3.6. In
addition, the bulk modulus of the matrix computed theoretically from
crystallographic data, making an allowance for porosity, agreed
closely with the experimentally determined modulus. Thus,
ultrasound velocity measurements, (from which moduli can be
calculated) combined with a simple theory, can be used for
nondestructive monitoring and quality control of the ceramic
7
composition.
The theoretically determined bulk modulus of the ideal, pore free
matrix is 10.4GPa. This matrix modulus is far less than the moduli of
the constituent oxides in the starting mixture because of the large
expansion in the size of closed rings of the cation-oxygen network
bonds that takes place during the reaction, rather than structural
weakening (breaking of rings of network bonds) by hydration.
The frequency dependence of ultrasonic attenuation has been used to
identify scattering regimes and thus determine the dimensions of the
major scattering particles. Grain sizes determined ultrasonically for
the three compositions showed excellent agreement with values
determined by optical microscopy.
Following some success with the evaluation and inspection of fully
cured artifacts the more difficult problem of monitoring the chemical
bonding process and the prediction of final properties from initial data
was investigated.
For this study an ultrasonic double-probe method was used to monitor
8

the setting process of phosphate bonded, alumina-filled, magnesia
ceramics using commercial (mainly Krautkramer and Sonatest)
2.25MHz and 2MHz transducers, for compressional and shear wave
modes respectively, in samples with alumina content in the range of
a -60 wt 0/0. Various elastic properties of the material i.e. bulk,
shear, and Young's moduli and Poisson's ratio were determined from
the ultrasonic velocity measurements, using equations 11-13, chapter
3.6. These properties were found to be dependent upon the filler
volume fraction, as expected. The reaction rate was also investigated
using the same ultrasonic data and found to increase with increasing
filler volume fraction overall.
The composition dependence of the elastic moduli is compared with
the Hashin and Shtrikman theoretical bounds for the elastic moduli of
two-phase materials. All data lie between these bounds, suggesting
that the alumina particles were well dispersed and well bonded to the
matrix. However, the fact that the data lie well above the lower
bound suggests that the particles are not spherical, and this together
with other evidence obtained from an analysis of reaction rates,
indicates the predominance of plate-like grain structures.
The measured elastic moduli were found to increase greatly as
9
porosity decreased. This behaviour can be used to measure or
estimate porosity.
The experimental procedures and the data thus obtained are discussed
in chapters 7 and 8. Chapter 7 deals primarily with the aquisition and
the interpretation of data for samples assumed to be effectively fully
cured. Chapter 8 is concerned with the rate of development of the
strength of the material as the chemical reactions progress. Here the
use of ultrasound velocity data to monitor the changes in elastic
moduli, and the inference of chemical reaction kinetics are discussed.
1 0

2. CEMENTS. CERAMICS AND CONVENTIONAL EVALUA'i-iON
TECHNOLOGY.
gJ. CEMENTS AND CHEMICALLY BONDED CERAMICS.
Cements may be defined as substances, capable of uniting fragments or
masses of solid matter together to form a single structure, usually by
the action of hardening from a liquid or paste to a solid. Such a
system relying upon some such material to form a solid mass or
coating, to adhesively bond two or more components, or to bind
aggregates or fillers into monolithic solids, have been classified by
G.C. Bye, as cementitious systems, Bye (1983). Aggregates are
particles of various sizes, generally from 1 to several tens of
millimetres, and of a range of materials, often fragments of minerals,
used singly or as a mixture of different materials. The cheapest, and
therefore the most widely used, practical systems incorporate a
mineral aggregate, often assorted gravel or pebbles, bound by an
inorganic cement, usually ordinary portland cement.
An inorganic cementitious material functions by forming a fluid or
fictile paste when mixed with water, or aqueous solution of reactants,
1 1

in appropriate amounts, and subsequently develops rigidity, or sets,
due to chemical reaction. There may be a further development of
compressive strength, referred to as hardening, due to the progress of
further chemical reactions. The simplest cements involve hydration
reactions whereby an anhydrous material or a low hydrate (a crystal
form with few waters of crystalisation), the result of calcination of a
naturally occuring higher hydrate (a crystal form with more waters of
crystalisation), or mixture of materials, is further hydrated. The
subsequent crystal growth must interlock with itself and any
aggregate if strength is to be developed and the material therefore
warrant the term cement. A cement which undergoes strength
development in the presence of excess water, or even underwater, is
said to be a hydraulic cement.
The predominance of gypsum plaster (calcium sulphate hemihydrate)
and portland cement (mainly tri-calcium silicate, di-calcium silicate,
and tri-calcium aluminate) are such that they are generally referred
to as plaster and cement respectively. This convention is not adhered
to in this thesis.
Portland cements are the basis for most cements and concretes used
for construction. A concrete is basically, a composite material
1 2

produced by binding a coarse and fine aggregate (usually sand and
gravel or a crushed rock such as limestone and granite) with a cement
to form a dense and coherent mass. Concrete can be cast into any
shape or size desired, and became particularly popular at the turn of
this century with the movement toward streamlined shapes in design
and architecture. For large scale architectural use concrete is
generally reinforced using steel girders and with the discovery of a
method of pre-stressing concrete and so improving the strength of the
concrete in 1927, taller buildings became possible. The material is
now so widely used and so durable that the very word "concrete" has
come to have a secondary meaning: substantial, intransient, definite,
certain, etc.
2.1.1 Historical perspective.
The first manufactured cements were probably produced where
outcrops of limestone or gypsum rock were quarried and the rocks
stacked in fires or bank kilns, and burnt, or calcined using wood or
charcoal. The earliest attempts to make cements and concretes
would, in all probability, have resulted in weak, friable materials with
limited durability. Such materials would be unlikely to remain extant
1 3
in any recognisable form. The oldest concrete structures still in
existence, hut floors dating from about 5600BC, were excavated at
Lepenski Vir, Yugoslavia, Stanley (1989).
Gypsum cements were used as mortar (for bedding, jointing or setting
bricks or masonry), notably in the Egyptian pyramids at Giza and the
tombs at Sakkara in Egypt. Egyptian mortars were thinly layered
between the great blocks of stone which made up the massive ancient
structures and were used as a lubricant to enable the heavy blocks to
be accurately placed, rather than as an adhesive medium.
The Romans developed the techniques of calcining lime in the form of
chalk, limestone or coral to about 900°C, thereby converting it into
quicklime. For building purposes the quicklime was then slaked with
water to produce hydrated lime. Roman concrete was a combination of
slaked lime, volcanic ash, sand, grit or pebbles as aggregates, and
strangely, 2 eggs per bucketful of mix, probably as a plasticiser.
The Romans found that by incorporating the pozzolanic material known
as tufa (volcanic ash) resulted in a superior product, a stronger
mortar. This pozzolanic ash was first found in the village of Pozzuoli,
near Vesuvius in Italy. In Britain they used a grog of crushed bricks or
14

tiles which produced a similar effect, in the absence of a local natural
pozzolana. The action of silica and alumina in the ash and grog
combined with the lime to produce pozzolanic cement. Whilst
calcined lime mortars would not harden under water, the pozzolanic
concrete could be used in waterlogged ground or in sea defences. It
could also be used to construct water impermeable linings for baths,
tanks, aqueducts etc. As a testament to the strength and the
resistivity of Roman mortars several structures remain in existence,
for example, the cement bonded masonry of the Colosseum in Rome, the
Pont du Gard aqueduct, near Nimes, and in the ruins of Pompeii where
the soft stone structures of the buildings are eroding faster than the
mortars.
The methods and technologies developed during the Roman Empire were
lost by the Middle Ages. There was a definite decline in the quality
and quantity of cements used in mediaeval constructions. Usually
they were non-hydraulic (non-pozzlanic) cements. It was not until the
16th. and 17th. centuries that Dutch pozzolanas (known as Dutch trass)
and lime mixtures were used, usually consisting of one part trass to
two parts slaked lime. The engineer John Smeaton (1726-1792),
visited Holland in 1754 and investigated a cement containing equal
parts of lime and trass. He then experimented with various limes and
1 5
found that the blue lias at Aberthaw, South Wales could be used
satisfactorily. This contained clay, and he concluded that by
deliberately mixing and burning together limestone and clay one might
produce a superior or at least consistent mortar. Equal proportions of
these materials were found to produce the best mortar. By
recognising the r.ole of clay in cements, Smeaton was the first to
demonstrate an understanding the chemical properties of hydraulic
limes.
At the end of the 18th. century James Parker of Northfleet in Kent,
found that he could make hydraulic cements by calcining nodules of
argillaceous limestone found washed out of the London Clay Cliffs
along the Thames estuary. It was referred to as "Roman cement" and
this name was used until the middle of the 19th century. Thomas
Telford (1757-1834) used Roman cement in the construction of the
Chirk Viaduct on the Ellesmere Canal (1795-1801), and Isambard
Kingdom Brunei (1769-1849) incorporated this material in his tunnel
under the Thames, linking Wapping to Rotherhithe.
James Frost patented the first bulk wet cement process in 1811, and
Joseph Aspdin, a Leeds builder took out the patent for "Portland
Cement" in 1824. The name Portland cement was given originally due
16
to the resemblance of the colour and quality of the set cement to
Portland stone, a limestone quarried on Portland Bill, Dorset.
However the prototype of modern cement was made in 1845 by Isaac
Johnson at Swanscombe, Kent. The process involved the mixing of
finely dispersed clay and chalk and higher temperature calcination in a
bottle kiln. Johnson's product was strongly cementious and relatively
consistent.
At the end of the 19th century the first rotary kilns were introduced,
leading to a better controlled, continuous process and more consistent
products. Comminution technologies also advanced allowing the
possibility of the grinding of the harder, higher fired clinkers.
In recent years the continuous rotary kiln production method has
changed from a wet to a dry process, resulting in improved energy
efficiency. In this process the raw materials are finely ground, during
which process the hot gases recycled from the kiln remove the
moisture from the materials. Once the dry ingredients are mixed they
pass down the inclined rotary kiln in a controlled schedule designed to
produce a phase assemblage tailored to the conditions of intended use.
The Romans were probably the first to appreciate the advantages of
1 7
cement in the construction of arches, vaults and domes. The Roman
engineers thus avoided the laborious hand carved stone structures by
means of which earlier civilisations constructed these features.
Instead this cheap readily available material could be used in
conjunction with brick built ribs or frameworks. Principally these
cements were used in surface finishes, concrete cores, mortars and in
underwater constructions. However the earliest concrete structures
were often podia or platforms on which their temples were
constructed.
Another major use was in the cement surface finishes known as stucco
which is a vague term applied to both internal and external renderings
of lime, gypsum and cement mixtures. Some of the Roman stucco are
highly ornate delicately modelled relief designs.
In 1818 the civil engineer Ralph Dodd placed wrought iron bars in
concrete to improve its performance in construction, and in 1825
Thomas Telford when building the Menai Bridge placed iron bars in the
concrete abutments, i.e. the structure against which the limb of an
arch rests for support. Fox and Barratt aquired a patent in 1844 for
their fireproof floors of cast iron beams buried in lime concrete, this
technique was used in Balmoral Castle. Further developments were
1 8
made in both insitu and precast concretes, the difference being that
the insitu concretes are mixed on the building sites and poured into
form work or shuttering before solidifying while precast concrete
components are prepared elsewhere and conveyed to the site for
erection, the sections being bolted and/or cemented together. Other
materials and configurations of reinforcements have been
investigated, eg, wire mesh, glass and carbon fibres.
At the beginning of the 20th. century, more and more reinforced
concrete was being used in commercial and municipal buildings,
however it was nearly always covered with some other material. The
principal features of this architecture were steel and reinforced
concrete framework and floors, and non-load bearing concrete slabs
used in the construction of partitioning and walls. This also
revolutionised the internal lighting of buildings as large non-load
bearing windows could now be constructed allowing more natural light
into the rooms.
2.1.2 Types of cements and concretes.
The chemical reactions which produce ceramic cements fall into three
1 9

categories, the first of which involves reaction with water i.e.
hydration or hydrolysis, as in the case of Portland cement and gypsum
plaster. Hydraulic cements depend upon water rather than air for
strength development and as the water is added an immediate chemical
reaction occurs. These hydraulic cements stiffen at first and later
develop strength. The stoichiometric quantity of water required to
hydrate cement is insufficient to promote the required rheological
properties. Additional water is required for this purpose and this
evaporates leaving voids, which reduces the density, strength and
durability of the products, see for example Lea (1970), Taylor (1966,
1981) and Glasser (1990)
A second type of cementitious system involves a chemical reaction, or
reactions, between two or more constituent compounds, where water
mayor may not be a by-product e.g. the two compounds alumina and
phosphoric acid react to give aluminium phosphate cement and water.
Magnesium oxychloride or Sorel cement is the product of a reaction
between calcined magnesia and a strong solution of magnesium
chloride. The product formed is magnesium oxychloride, which is
strong and hard but hygroscopic and is mainly used as a flooring with a
nonreactive filler and a colouring pigment.
20
The third type of cementitious bonding involves condensation or
polymerisation reactions where the cement molecules join by
condensation into polymer molecules, frequently releasing water.
2.1.3 Development of novel strong cementitious materials.
The strength of portland cement concretes has been improved in recent
years and their range of application has been extended. Birchall,
Howard and Kendall, Birchall (1983a), discussed these developments
and went on to consider economic and environmental issues. Beyond
the price per unit mass is an energy cost, where the amount of energy
and, in particular, fossil fuel consumed in the winning, ie the mining or
quarrying, of raw materials and subsequent processing is considered.
According to Birchall et al this is high for metals and very much lower
for cements. Sintered ceramics would have an energy cost slightly
less than, but of the same order as, that of metals. Rock and
aggregate have the lowest cost, but polymers are quite expensive
because their raw materials are fossil-fuel derivatives.
21

The major problem with hydraulic cement is its very low tensile
strength, largely due to pores left by evaporation of surplus water.
This is required to give rheological properties commensurate with
conventional forming techniques. These problems are overcome in the
construction industry by the use of massive, steel reinforced
structures designed to be loaded in compression. For smaller scale
domestic applications, of necessity more aesthetically designed, this
approach is unacceptable and with smaller quantities of material and
higher value products a greater cost per kilogram can be tolerated.
New developments in the production of strong cementitious materials
have resulted from (i) modifying cement compositions (and the
associated hydration, consolidation, and densification processes) and
(ii) manipulating the microstructures. The different routes to
generating such materials, include curing at slightly elevated
temperature and pressure, high-shear mixing with polymer additions,
and the making of fibre and particulate reinforced composites. There
are also many new reaction cement formulations which have moved
away from traditional portland cements and instead rely upon a
diverse range of chemical reactions.
Together, these developments have produced about tenfold
22

enhancements in their properties which approach those of many
traditional ceramics or modem composites. Strength, toughness,
durability, impermeability, and abrasion resistance of these new
materials have all been greatly improved, as have certain electrical
and acoustical properties. These materials were given the
classification of chemically bonded ceramics (CBC) by Della M. Roy,
Roy (1987), since the bonding that takes place is due to a chemical
reaction which proceeds at an acceptable rate at ambient or slightly
elevated temperature, as opposed to fusion or sintering at some
greatly elevated temperature in excess of 1000 °C. The bonding in
such CBCs is a mixture of ionic, covalent, and van der Waals bonding,
with the ionic and covalent dominating; in traditional cement
hydration products, van der Waals and hydrogen bonding dominate.
Portland and other similar cements-and the concretes made by
combining them with different kinds of aggregates-are used in greater
quantities than any other man-made materials. Such cements lack
toughness, are weak in tension but offer modest strength and stiffness
in compression. Yet even with the extremely primitive cement
technology that prevailed in ancient times, some Greek and Roman
structures have lasted for 2000 to 3000 years as mentioned.
23
Normal hydraulic cement (commonly called ordinary portland cement,
or OPC) is supplied as a finely ground powder the particles of which
comprise four major components or phases. These are tricalcium
silicate (3CaO.Si02), dicalcium silicate (2CaO.Si02 ), tricalcium
aluminate (3CaO.AI20 3 ), and calcium aluminoferrite solid solution
(Ca2Fex A12-x 05)· Small amounts of gypsum (CaS04 .2H20) and other
minor components, such as alkali sulphates, are also present. When
mixed with water the cement undergoes an exothermic hydration
hydrolysis reaction. Immediately after the paste is formed, there is a
period of time- possibly several hours-in which to place and, if
necessary, finish shaping the desired object in a simple fashion at
room temperature, before the setting reaction precludes further
handling. This is an essential feature of cementitious compositions,
and the amount of working time will, together with the workability or
consistency of the paste, govern the nature of the placing and forming
techniques which may be employed. Conversely for a given
application a cement with a suitable setting rate, workability and
working time must be selected, suitably modified, or formulated.
The reaction rate and consequent rate of heat evolution are a function
of the total chemical composition, the crystal chemistry of the cement
24
minerals, the fineness of the powder, and the temperature of setting.
Setting and hardening are the result of a complex sequence of
processes. Hardened cement paste has a finely intergrown
microstructure, a very high surface area, and submicrometer-sized
noncrystalline fibres or particles of calcium silicate hydrate (CSH).
These grow between and link together larger crystallites and residual
anhydrous cement grain cores, leaving a microporous material with
minimal interconnected capillaries. The solidification of cement
paste is a constant-volume process. When higher density cement
particles are mixed with lower density water, they react to form a
solid hydration product conSisting of solids of intermediate density
and interspersed residual porosity.
The strength of hardened cement paste increases as the ratio of water
to cement is reduced. Because the residual porosity distribution, and
the excess molecular water cause most of the limitations on the
properties of conventional hardened cement pastes, many attempts
have been made to reduce the amount water. There is a practical limit
if the mixture is to remain workable. Some decades ago it was
discovered that increased workability at constant water-cement ratio
could be achieved with admixtures that contain small amounts of
chemicals such as Iignosulphonates and related dispersants. However,
25
the setting is retarded when such admixtures are used. New chemical
admixtures made with superplasticisers provide much better control
of the setting of cement pastes and improve the properties of the
concrete, Roy (1980).
The utility of porous hydraulic cement products has been limited by
their low tensile strength (~3 MPa), and their low work of fracture
(~20 J/m3 ), despite a compressive strength of ~30MPa. In addition to
the presence of spherical pores and voids, cement pastes with a
normal w/c ratio (0.40) may undergo shrinkage during drying, which
induces microcracking when material is exposed to low-humidity
environments. This is a source of "Griffith flaws" which initiate
fracture under load, see section 2.2.
Since 1970 cement matrix composites have been developed
Four major advances have taken place:
(i) the formation of special densified or warm-pressed cement pastes
which have properties approximating those of fired ceramics;
(ii) modification of the chemical composition of the cement;
(iii) the formation of macrodefect-free cements prepared by special
processing; and
26
(iv) the manufacture of a variety of cement-based composites.
2.1.4 Macrodefect-free cements.
The engineering of a new class of high-strength materials called
macrodefect-free (M DF) cements was pursued originally by Birchall
and co-workers at Imperial Chemical Industries and Oxford University,
Birchall (1981, 1982a, 1912b), Kendall (1983), Birchall (1983a,
1983b). MDF refers to the absence of relatively large voids or
defects which are usually present in conventionally mixed cement
pastes because of entrapped air and inadequate dispersion. Such voids
and defects limit the strength that can be achieved by acting as stress
concentrators. In the MDF process 4 to 7% of one of several
water-soluble polymers (such as hydroxypropylmethyl cellulose,
polyacrylamide, or hydrolysed polyvinylacetate) is added as a
rheological aid to permit cement to be mixed with very small amounts
of water. Subsequent high-shear mixing produces a plastic, cohesive
mixture which can be shaped by extrusion or other forming technique
and which sets in times ranging from minutes to hours. The highest
strength materials have been prepared with calcium aluminate
cements, which harden rapidly, although portland cements have been
27
used less successfully. Besides being a processing aid, the polymer
appears to be a significant structural component. Control of the
particle size distribution (for optimum particle packing) was also
considered important for generating strength. A final processing
stage, in which entrapped air is removed by applying modest pressure
(=5 MPa), resulted in a paste that is free of all large defects. The
mechanical properties of MDF cements are remarkable when compared
with those of normal cements. The strength at any given flaw size
was higher than for normal cement pastes because the MDF cements
had a higher elastic modulus (=40 GPa) and higher fracture surface
energy (=200 J/m2). Very low porosity materials have been achieved
«10/0) (23) at considerably lower pressures than with warm-pressing
techniques, Roy (1973), as well as flexural strength of=150 MPa , a
compressive strength of=300 MPa, and a Young's modulus of =50 GPa.
A second major family of cement-based composites has emerged which
incorporate fine particles of oxide materials. Enhanced strength and
durability can be obtained by deliberately blending hydraulic cements
with various types of particulates, for instance ground granulated
blast furnace slag, fly ash, or silica fume. When combining such
particulates in a cementitious composite, it is necessary to consider:
(i) the particulate characteristics (such as size, shape, and density)
28

which affect rheology and optimal particle packing and
(ii) the chemical reactivity of the particles, which affects the
rheology and the strength of the particle-matrix bonding.
When two monodisperse powders of the same material, one with
course and the other with fine grains, are mixed, the fine particles
will pack within the interstices between the course grains. The
density of the paste or compact will be greater than that of a similar
paste or compact containing either powder alone, since the void space
is reduced. The addition of a third monodisperse powder, with
superfine grains small enough to pack within the interstices of the
fine grains, would cause a further densification.
In real polydisperse systems, soluble chemical species from the fine
particulates and the surfaces of the larger cement grains can react
with ease and speed. A colloidal particulate such as silica fume, (fine
or colloidal silica) initially reacts with the alkaline cement solution,
but much unreacted residue remains as slow reactions produce
ultrafine calcium silicate hydrate reaction products. This decreases
the mean pore size.
Because of this type of reaction, the microstructures and pore
29

structures developed from composites of cement with fine glassy slag
or silica fume, or both, are much finer and possess lower ionic
diffusivities than normal cements, and are much more chemically
resistant and durable. The combined physical and chemical effects
cause enhanced resistance to chloride-enhanced corrosion and
increased durability of steel-containing cementitious composites such
as in highways and bridges. Proper particle packing also achieves
very high strengths and stiffnesses .
Fine silica fume (also called condensed silica fume or microsilica) can
be substituted for portland cement in amounts ranging up to 25% .
Concretes containing 5 to 15% silica fume have high compressive
strengths (up to and above 100 MPa), flexural strengths (up to 12 MPa),
and Young's moduli (up to 34 GPa). They also have very low
permeabilities to water. The microstructure of the critical
interfacial zone between cement paste and the aggregates in concrete
is more dense and uniform than when conventional pastes are used,
Hjorth (1983), Hirsch (1983), and the bond between paste and other
embedded materials such as aggregates and fibres appears to be
improved.
Good properties have been achieved with silica fume substituted
30

pastes with up to 20 to 25% silica fume at a water to solids (w/s)
ratio of 0.12 to 0.22 using mechanical compaction. Compressive
strengths of up to 270 MPa with Young's moduli up to 80 GPa have been
achieved in such compositions. A dense but fairly fluid paste is
formed by the combination and chemical dispersion of particles that
have dissimilar size ranges. No major air voids, and only a few very
small capillary pores, remain in carefully processed products.
Shrinkage upon drying of the cement hydration product is limited, and
the residual cement grain cores act as a strong internal filler or
"microaggregate" .
Dense silica fume-based cementitious composites are used to resist
severe mechanical erosion in impeller screws for moving coal and fly
ash and in flooring for industrial buildings, Hjorth (1983). Another
version is commercially available as a tooling and moulding material
in applications where vacuum tightness or mirror finishes are
required. The latter material retains a compressive strength of = 300
MPa up to about 500°C and =200 MPa at about 700°C.
One approach to toughening brittle ceramic and cementitious
materials is to incorporate strong fibres into the microstructure. The
lack of ductility and the low tensile strength of cementitious
31

materials have long been remedied on a large scale by the use of steel
reinforcing bars or mesh. In a typical civil engineering application,
steel rods may contribute less than 1 % by volume.
On a much finer scale, composites of cement incorporating asbestos
fibre have been used since about 1900 but are now unpopular because
of asbestos hazards, despite their outstanding tensile properties and
durability. Other types of fibres investigated include steel, glass and
polypropylene.
The reinforcement of cement paste by glass fibres initially was
limited by the poor resistance to corrosion of glass fibres in the
highly alkaline environment in the pores, where the pH = 12.
Alkali-resistant glass fibres were developed by Majumdar, Majumdar
(1983) and co-workers at the Building Research Establishment,
Watford. These have a high Zr02 content and can resist the degrading
effects of the cement paste environment for some years. The
long-term (10 to 100 years) stability of the fibres is uncertain, this,
once assured, will lead to the widespread use of such materials.
Incorporation of fine fibres into brittle materials increases their
32
tensile strength severalfold and their toughness by several orders of
magnitude. Ultimate tensile strengths of about 15 MPa are common,
while modulus of rupture (MOR) values of 35 to 40 MPa are possible.
The work of fracture, or toughness, increases more substantially.
This assumes that after the first matrix crack has appeared there are
sufficient fibres and adequate bonding to support the load.
2.1.5 Reaction cements based upon phosphoric compounds.
In 1950 Kingery wrote the first comprehensive study of phosphate
bonding in refractories,which was subsequently quoted in other
reviews of these materials, for example that published by Cassidy,
Kingery (1950), Cassidy (1977).
In the intervening years progress has been made in three major areas:
(i) The fundamental chemistry of the bonding processes;
(ii) The development of more sophisticated phosphate bonds;
(iii) The application of phosphate-bonded materials.
33

2.1.5.1 The chemistry of phosphate Bonds.
Kingery considered three methods of achieving phosphate bonding:
(i) the reactions between siliceous materials and phosphoric acid;
(ii) the reactions between oxides and phosphoric acid;
(iii) the direct addition or formation of acid phosphates.
Cassidy considered a wider variety of bonding systems available in
both liquid and solid form, including ammonium phosphate,
chromium-aluminium phosphate, alkali polyphosphates, magnesium
acid phosphates, aluminium chlorophosphate hydrate, and mixtures of
aluminium phosphate hydrate and urea phosphate. Phosphoric acid and
solutions of monoaluminium phosphate (MAP) are widely used and well
studied bonding agents.
New bonding agents have been developed to overcome problems
associated with the use of liquid bonds particularly with certain
aggregates. The alkali polyphosphates are particularly useful in
bonding basic aggregates; phosphoric acid or solutions of MAP tend to
react very rapidly. Aluminium chlorophosphate hydrate (ACPH) is a
dry powder designed for use in castable refractories and counters bond
34
migration and bloating due to reaction with metallic iron, and
improves storage properties. Its setting reactions do not require the
formation of intermediate metaphosphate phases.
Mixtures of aluminium phosphate and urea phosphate have been
specifically developed to give a dry powder bonding agent, countering
the problem of hygroscopicity encountered with the use of solid
monoaluminium phosphate.
2.1.5.2 Phosphoric acid.
Phosphoric acid reacts with metal oxides and hydroxides at
temperatures ranging from 20 to 2000 C to form hard, solid
shapes,which can be built into structures without the need for firing.
They are also often employed as castable refractories (ie.
compositions which set without firing), to make monolithic refractory
structures or effect repairs to existing structures. In practice the
most favoured are the amphoteric oxides, because they react at a
controlable rate. Cassidy states that hardening systems based on
H3P04 and Ti02, CaO, FeO, Fe203, NiO, ZnO, Zr02, MgO, A1203, and Cr03
have all been investigated. The H3P04-AI203 system, and the
35
mechanisms and phase transformations occurring therein, have been
investigated and the phases formed by reacting H3P04
with either
alumina, A1203, or the hydrated form Gibbsite, AI(OH)3, have been
found to be similar. It is generally understood that the process
involves the formation of acid phosphates of the type AI(H2P0
4h
initially. However, on subsequent heating and in the presence of
excess AI203 the final bonding phase is almost certainly AIP04.
Direct calorimetric analysis (DCA) studies, O'Hara(1972), on tabular
alumina-phosphoric acid cementitious systems have shown that the
bonding reactions start at about 127°C. Most of the reactions occur
over the temperature range 127-427 °C and involve the formation of
aluminium phosphates and possibly formation and melting of
pyrophosphoric acid. At about 510°C a change in slope occurs which
remains up to 732 °C. Continuous changes in slope occur over the
temperature range 732-1327 °C, arising from the formation of
aluminium phosphate bonding phases and phase transitions therein. It
is suggested that this devitrification of the bond accounts for the fact
that specimens fired to 1093 °C have a lower strength than those fired
to either 371°C or 815° C. These authors also confirmed that the
addition of Cr03 increases the thermal stability of the phosphate bond.
36

It has long been established, initially by Sheets and co-workers,
Sheets (1958), that compositions based on particular grogs ( ground
prefired ceramic materials) such as zirconia, beryllia, mullite, and
silicon carbide exhibit material properties which, not surprisingly,
differ from those of materials based on pure alumina or other grogs.
Therefore it is not possible to make any general statement about the
properties of phosphate bonded materials without specification of
both the type of bond used and the composition and grading of the grog
or aggregate, particularly so if one is to compare the relative
properties of different binder systems.
These authors also found that it was not possible to get a cold set
using mixtures of phosphoric acid with either alumina grog, fine
reactive alumina, or hydrated alumina, but that such compositions had
to be dried. However, the addition of ammonium fluoride enabled a
cold-setting mixture to be produced.
Although phosphoric acid is a good bonding agent for high-alumina
refractories, ramming mixtures may experience premature hardening
and loss of workability associated with the formation of insoluble
37

AIP04 hydrate. Sequestering agents, which promote the formation of
complexes with soluble ions and thus reduce the chemical activity of
the system, can be added to stabilise the mix: 5-Sulphosalicylic acid,
acetylacetone, dextrin, oxalic acid and citric acid can all be used.
2.1.5.3 Aluminium acid phosphates.
Cassidy asserts that the most important characteristic of a liquid
binding agent is the acidity, which is denoted by x, the molar
P20s:AI20 3 ratio, and that mixtures with x < 3 are metastable, Cassidy
(1977). Mixtures in which x::= 2.3 throw down a deposit and harden on
prolonged storage, and mixtures with x < 2.3 are even more unstable.
Typical commercial products have x ::= 3, and are about 50% w/w
solutions of AI(H2P04b.
It must be remembered, however, that real systems contain an excess
of some reactive phase, Ti02, Zr02, MgO, Si02 and SiC. Under these
conditions solutions of aluminium phosphate bond in two ways: by
acidic metaphosphate binding and by chemical (or reaction) bonding
38
with the aggregate. Chemical bonding takes place when the acid
phosphates react with weakly basic or amphoteric oxides. This
results in the formation of crystalline orthophosphates as the bond.
Cold-setting cements and concretes are usually formulated as
two-pack systems, and can be prepared by adding a reactive oxide,
such as MgO, to the system. The reaction between MgO and aluminium
acid phosphate has been studied. Various systems were investigated
in which the molar P: (AI + Mg) ratio was varied using a reagent grade
MgO, monoaluminium phosphate, and aluminium hydroxide. As the
amount of MgO increased so the rate of setting increased. The
reaction was endothermic and the heat of reaction increased with the
magnesia content. MgHP04.3H20 is formed as a crystalline salt: some
gel-like (AIH3(P04)2.3H20 is also found. The details of these reactions
are discussed in chapter 4.
Attempts to form a cold-setting system in which the P: (AI + Mg) ratio
was greater than 1, have failed due to the formation of water soluble
MgH2(P04)20 . On subsequent heat treatment the various phase changes
which occur also depend on the molar P: (AI + Mg) ratio.
Various concretes based on this system have been patented and are
39
now commercially available in both single-pack and two-pack systems.
This type of material is the basis of the fibre and particulate ceramic
composite materials which are the subject of this thesis.
2.1.6 Properties of phosphate-bonded ceramics.
Phosphate-bonded refractory bricks, mortars, ramming mixes,
plastics, and cold setting castables utilising almost all the known
refractory oxides and silicon carbide are now widely used. In general
(i) they do not show 'weak' regions on heating.
(ii) they have good refractoriness,
(iii) they possess high abrasion resistance at elevated temperatures,
(iv) they have good slag resistance and melt repellency.
These desirable properties can only be achieved by the correct choice
of phosphate bond and aggregate. They can be further enhanced,
particularly with regard to mechanical strength and fracture
toughness by the correct choice of reinforcement or particulate filler,
with regard to both type and proportions.
'Cement free' phosphate-bonded castables are available as either
one-pack systems based on solid phosphate bonds such as ACPH, or
40

two-pack systems containing liquid bonds (such as monoaluminium
phosphate). They set in the cold by the reaction of the acid bond with
MgO. The properties of these materials vary depending on the type and
amount of bond used and the type and grading of the aggregate.
Cassidy compared hot strengths of ACPH-bonded SiC, AI20 3 and bauxite
castables, with those of calcium aluminate products and with
thermally processed materials, Cassidy (1977). Tabular
alumina-based materials showed a fall-off in hot strength at
temperatures above 800 °C, the rate of strength decrease being more
marked with the presence of MgO.
These materials are used widely in chemical plant, and have proved to
be very effective in ferrous metallurgical applications such as in
electric arc-furnace roofs. Phosphate-bonded high-aluminas make
effective patching materials for coal gasification reactors.
With ACPH-bonded silicon carbide the modulus increases up to 1100 °C
and then decreases probably due to the formation of silicophosphates.
The addition of silicon carbide to high alumina, phosphate-bonded
41
products results in an increase in their hot strengths.
2.2 THE MECHANICAL TESTING OF BRIDLE CERAMICS.
At room temperature, both crystalline and noncrystalline ceramics are
inclined to fracture before any plastic deformation can occur in
response to an applied tensile load. The brittle fracture process
consists of the formation and propagation of cracks through the cross
section of material in a direction perpendicular to the applied load.
Crack growth in crystalline ceramics is usually through the grains
(Le., transgranular) and along specific crystallographic (or cleavage)
planes, planes of high atomic density.
The measured fracture strengths of ceramic materials are
substantially lower than predicted by theory from interatomic bonding
forces. This may be explained by very small and omnipresent flaws in
the material which serve as stress focussing points, at which the
magnitude of an applied tensile stress is effectively amplified. The
degree of stress amplification depends on crack length and tip radius
of curvature, being greatest for long and pointed flaws ie cracks and
delaminations, Davidge (1989), Callister (1994). These stress
42
focussing flaws may be minute surface or interior cracks
(microcracks), internal pores, and grain corners, which are virtually
impossible to eliminate or control. Even moisture and contaminants
in the atmosphere can introduce surface cracks in freshly drawn glass
fibres, which deleteriously affect the strength. A stress
concentration at .aflaw tip can cause a crack to form, which may
propagate until the eventual failure of the piece.
The measure of a ceramic material's ability to resist fracture when a
crack is present is specified in terms of fracture toughness. The
stress intensity for plane strain, KI, is defined according to the
expression, Callister (1994):
(1 )
where Y is a dimensionless parameter which is a function of both
specimen and crack geometries, cr is the applied stress, and a is the
length of a surface crack or half of the length of an internal crack.
Crack propagation will not occur as long as the right-hand side of the
43
above equation is less than the plane strain fracture toughness of the
material. Effectively for a given system with fixed flaws this
implies that there is a critial value of stress,crf ' at which fa:ilure
occurs. Conversely, when components or test pieces are subjected to
particular service or test stress conditions, there is a a critical flaw
size at which crack growth would proceed rapidly to failure.
The critical stress intenSity or plane strain fracture toughness, K1c' is
defined according to the expression, Callister (1994):
Plane strain fracture toughness values for ceramic materials are
smaller than for metals; typically they are below 10 MPam-3 .
(2)
Under some circumstances, fracture of ceramic materials will occur
by the slow propagation of cracks, when stresses are static in nature,
and the stress intensity is less than K1c• This phenomenon is called
static fatigue, or delayed fracture; use of the term "fatigue" is
somewhat misleading since fracture may occur in the absence of
cyclic stresses. This type of fracture is especially sensitive to
environmental conditions, specifically when moisture is present in the
atmosphere. A stress-corrosion process probably occurs at the crack
44
tips where the combination of an applied tensile stress and material
dissolution leads to a sharpening and lengthening of the cracks until,
ultimately, one crack grows to a size capable of rapid propagation.
Furthermore, the duration of stress application preceding fracture
diminishes with increasing stress. Consequently, when specifying the
static fatigue strength, the time of stress application should also be
stipulated. Silicate glasses are especially susceptible to this type of
fracture; it has also been observed in portland cement, and other
ceramic materials including porcelain, high-alumina ceramics, barium
titanate, and silicon nitride.
There is usually considerable variation and scatter in the fracture
strength for many specimens of a specific brittle ceramic material.
This phenomenon may be explained by the dependence of fracture
strength on the probability of the existence of a flaw that is capable
of initiating a crack. This probability varies from specimen to
specimen of the same material and depends on fabrication technique
and any subsequent treatment. Specimen size or volume also
influences fracture strength; the larger the specimen, the greater this
flaw existence probability, and the lower the fracture strength. For
compressive stresses, there is comparatively little amplification
associated with any existent flaws. For this reason, brittle ceramics
45
display much higher strengths in compression than in tension, and they
are generally utilised when load conditions are compressive. Also,
the fracture strength of a brittle ceramic may be enhanced
dramatically by imposing residual compressive stresses at its surface.
2.2.1 Flexural testing.
The stress-strain behaviour of brittle ceramics is not usually
ascertained by a tensile test as is often the case with metals for
several reasons, Quinn (1991), Callister (1994). Firstly it can be
difficult to prepare and test specimens having the required geometry.
Secondly there is a significant difference in results obtained from
tests conducted in compressive and in tensile modes. Ceramics are
typically weak in tensile loading and it is considered prudent to avoid
loading ceramic structures in tension and to endeavour to ensure
compressive loading as far as possible. Tensile testing would not
approximate service conditions to any degree and would thus lead to an
inaccurate and inappropriate value.
Therefore, a more suitable transverse bending test is most frequently
employed, in which a rod specimen having either a circular or
46

central load specimen
supports ------"l~.
L
b
r
d
Figure 2.1 A three point loading scheme for a flexural test indicating specimen dimensions.
--
rectangular cross section is loaded until fracture takes place, using a
three- or four-point loading technique; the more common three-point
loading scheme is shown in Figure 2.1. Many commercial test rigs are
available where the load my be applied hydraulically or mechanically
with a gauge giving a suitable readout of the load at fracture, or more
simply by a mass of water delivered via a microswitch controlled
valve, and shut off and weighed following fracture. At the central
point of loading, the surface of the specimen proximal to the load point
is placed in a state of compression, whereas the distal surface is
placed in tension. The stress is calculated from the specimen
thickness, the bending moment, and the moment of inertia of the cross
section; these parameters are given in Figure 2.1 for rectangular and
circular cross sections.
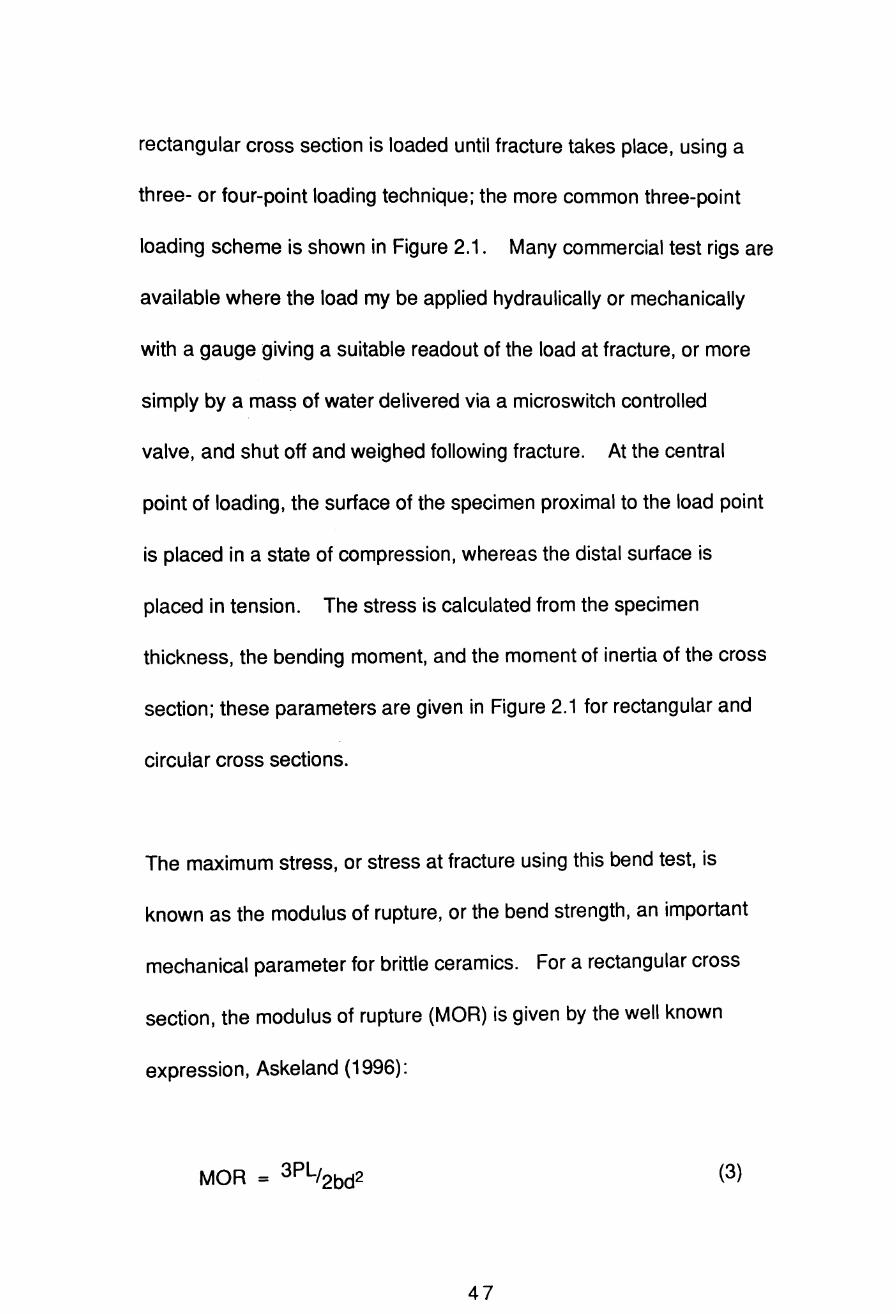
The maximum stress, or stress at fracture using this bend test, is
known as the modulus of rupture, or the bend strength, an important
mechanical parameter for brittle ceramics. For a rectangular cross
section, the modulus of rupture (MOR) is given by the well known
expression, Askeland (1996):
(3)
47

where P is the load at fracture, L is the distance between support
points, and the other parameters are as indicated in Figure 2.1.
When the cross section is circular, then:
(4)
where r is radius of the specimen and d is its diameter. The latter
form is more commonly quoted as the diameter of the specimen is
easier to obtain.
Since, during bending, a specimen is subjected to both compressive and
tensile stresses, the magnitude of its modulus of rupture is greater
than the tensile fracture strength.
Furthermore, MOR will depend on specimen size; as with increasing
specimen volume (under stress) there is an increase in the probability
of encountering significant flaws and, consequently, a decrease in the
modulus of rupture values obtained. It is usually specified that the
aspect ratio of the portion of the specimen under test should be
approximately 7:1.
48

2.2.2 The testing of cement and concrete structures.
The testing of cement and concrete structures is somewhat different
to the testing of fired ceramics. They are designed for compressive
loading, and are extremely weak in tension. The castable nature of
such materials enables easy installation of reinforcement for areas
subject to tensile stresses, but also introduces the complication of
age related mechanical properties and greater variability. Thus in
cementitious materials strength data is quoted for a range of ages and
for specified, standardised curing conditions, Neville (1987). The
mechanical testing of cementitious materials is accomplished by
several means the most widely applied being compressive or crushing
strength determinations. Such determinations are made using 150 x
300 mm cylinders in the US and 150 mm cubes in the UK, although
standards permit the use of other smaller specimens depending on the
maximum size of aggregate.
A range of reusable moulds can be made from steel, cast iron, brass
and various plastics, whilst expendable single use moulds can be made
from sheet metal, plastic, waterproof paper products or other
materials which satisfy the physical requirements of watertightness,
49
absorptivity and rigidity. A mould release agent, ego a thin layer of
mineral oil, is usually applied to the inside surfaces of most types of
moulds in order to prevent bonding between the concrete and the
mould. Concrete is then placed in the mould in layers. Compaction of
the concrete may be achieved in two or three layers, each layer being
compacted by means of a steel punner, or ramming bar, or by internal
or external vibration according to an appropriate national standard.
The top surface of the cast specimen, finished by a trowel, is not plane
and smooth enough for testing, and so requires further preparation.
There are two methods of obtaining a plane and smooth surface:
grinding or capping. Grinding is satisfactory but expensive and time
consuming. For capping, three materials can be used: a stiff Portland
cement paste on freshly-cast concrete, and either a mixture of sulphur
and a granular material (e.g. milled fired clay) or a high-strength
gypsum plaster on hardened concrete. The cap should be thin,
preferably 1.5 to 3 mm thick, and have a strength similar to that of the
concrete being tested. Probably the best capping material is the
sulphur-clay mixture which is suitable for concrete strengths up to
100 MPa, but the use of a fume cupboard is necessary.
In addition to being plane, the end surfaces of the test specimen should
be normal to its axis, and this guarantees also that the end planes are
50

parallel to one another. No significant variation in the measured value
of strength occurs as a result of a small deviation from the normal, or
a small lack of parallelism between the end surfaces of a specimen
does not affect its strength, provided the testing machine is equipped
with a seating which can align freely. Opposing cast faces of a cube
present fewer problems in this respect.
The curing conditions, eg the temperature and humidity, for the
standard test cylinders are specified in the appropriate standard so
that moisture loss is prevented. Subsequently, the de-moulded
specimens should be stored under the same temperature and humidity
conditions or in saturated lime water until the prescribed age at
testing. Because they are subjected to standard conditions, these
specimens give the potential strength of concrete. In addition,
service specimens subjected to the same conditions as the structure
may be used to determine, as near as possible, the actual quality of the
concrete in the structure. This data can be used to decide when
formwork may be struck, when further construction may continue, or
when the structure may be put into service.
The compressive strength of each specimen is determined at a
constant loading rate again as specified in the appropriate standard.
The maximum recorded load divided by the area of cross section of the

specimen gives the compressive strength, which is reported to an
accuracy of 0.05 MPa.
In the UK, the test cube is cast in steel or cast-iron moulds of
prescribed dimensions and plane ness with narrow tolerances, with the
mould and its base clamped together. BS 1881: Part 108: 1983
prescribes filling the mould in layers of approximately 50 mm.
Compaction of each layer is achieved by not less than 35 strokes (for
150mm cubes), or 25 strokes (for IOOmm cubes), of a 25mm square
steel punner; alternatively, vibration may be used. Further treatment
of the test cubes is prescribed by BS 1881: Part 111: 1983. After the
top surface has been finished by a trowel, the cube should be stored at
a temperature of 20+5 °C when the cubes are to be tested at, or more
than, 7 days or 20±2 °C when the test age is less than 7 days. The
preferred relative humidity is not less than 90 per cent, but storage
under damp material covered with an impervious cover is adequate.
The cube is de-moulded just before testing at 24 hours. For greater
ages at test, demoulding takes place between 16 to 28 hours after
adding water to the mix, and the specimens are stored in a curing tank
at 20+2 °C until the prescribed age. The most frequently used age at
test is 28 days, but additional tests can be made at 1,2,3,7 and 14
days, 13 and 26 weeks and 1 year, 3 and 7 days being quite frequently

used.
BS 1881: Part 116: 1983 specifies that the cube is placed with the
cast faces in contact with the platens of the testing machine, such
that the position of the cube under test is at right angles to the
position as cast.. The load is applied at a constant rate of stress
within the range of 0.2 to 0.4 MPa/s , and the crushing strength is
reported to the nearest 0.5 MPa (50 psi).
Pure uniaxial compression would be the ideal mode of testing, but the
compression test imposes a more complex system of stresses, mainly
because of lateral forces developed between the end surfaces of the
concrete specimen and the adjacent steel platens of the testing
machine. These forces are induced by the restraint of the concrete,
which attempts to expand laterally (Poisson effect), by the
several-times stiffer steel, which has a much smaller lateral
expansion. Consequently, in addition to the imposed uniaxial
compression, there is a lateral shearing stress, the effect of which is
to increase the apparent compressive strength of concrete.
The effect of shear is always present, although it decreases towards
the centre of the cube, so that the sides of the cube have near-vertical
cracks, or completely disintegrate so as to leave a relatively
undamaged central core. This happens when testing in a rigid testing
machine, but a less rigid machine can store more energy so that an
explosive failure is possible where one face, touching the platen,
cracks and disintegrates so as to leave a pyramid or a cone. Other
types of failure are regarded as unsatisfactory and indicate a probable
fault in the testing procedure or a defective specimen.
When the ratio of height to width of the specimen increases, the
influence of shear becomes smaller so that the central part of the
specimen may fail by lateral splitting. This is the situation in a
standard cylinder test where the height/diameter ratio is 2.
Sometimes cylinders of different height/diameter ratios are
encountered, for example, with test cores cut from in situ concrete:
the diameter depends on the core-cutting tool while the height of the
core depends on the thickness of the slab or member. If the core is
too long it can be trimmed to a height/diameter ratio of 2 but with too
short a core it is necessary to estimate the strength which would have
been obtained using a height/diameter ratio of 2 by applying correction
factors.
Since the influence of platen restraint on the mode of failure is
greater in a cube than in a standard cylinder, the cube strength is
approximately 1.25 times the cylinder strength, but the actual relation
between the strengths of the two types of specimen depends on the
level of strength and on the moisture condition of concrete at the time
of testing. Compared with the cube test, the advantages of the
cylinder are less end restraint and a more uniform distribution of
stress over the cross section; for these reasons, the cylinder strength
is probably closer to the true uniaxial compressive strength of
concrete than the cube strength. The great advantage of the cube over
the cylinder is that the capping procedure is unnecessary.
2.2.3. Mechanical eyaluation of actual structures with minimal
damage.
A group of tests aimed at the assessment of in situ concrete strength
has become established, with principal methods covered by BS
1881 ,part 207. They all cause localised surface damage,
necessitating repairs, but considerably less damage than that caused
by the removal of core samples, Bungey (1993). The basic features of
the more widely used of these tests are discussed below together with
the factors which influence the choice of test in given circumstances
and their correlation with mechanical test parameters. The range of
application includes quality control of fresh concrete and the
assessment of older structures Bungey (1993).
2.2.3.1 Penetration resistance.
Penetration resistance, also known as the Windsor probe test, is a
determination of the depth of penetration by a metal rod driven into
the concrete by a given amount of energy, generated by a standard
charge of powder. The penetration depth is inversely proportional to
the compressive strength of concrete but the actual relationship
depends on the hardness of the aggregate. Charts of strength versus
penetration (or length of exposed probe) are available for aggregates
with hardness of between 3 and 7 on Moh's scale. In practice, the
penetration resistance should be correlated with the compressive
strength of standard test specimens or cores of the actual concrete
used.
This test basically measures hardness and cannot yield absolute values
of strength, but the hardness is measured over a certain depth of
concrete and not just at the surface, unlike most hardness tests. In
large structures the penetration resistance test approaches

nondestructive status as the damage is localised and repairable, and it
is possible to retest in the vicinity.
2.2.3.2 Pull-out test.
The pUll-out test measures the force required to pull out a cast-in
steel rod with an embedded enlarged end. The rod assembly is pulled
out with a lump of concrete in the approximate shape of a frustum of a
cone. The pull-out strength is calculated as the ratio of the force to
the idealised area of the frustum, the strength being close to that of
the shearing strength of concrete. The pull-out force or strength
correlates well with the compressive strength of cores or standard
cylinders for a wide range of curing conditions and ages. The
disadvantages of this method lie in the greater amount of damage and
the requirement to place costly single use rods in the structure.
2.2.3.3 Rebound hammer.
This test is also known as the Schmidt hammer, impact hammer or
sclerometer test, and is a nondestructive method of testing concrete.

The test is based on the principle that the rebound of an elastic mass
depends on the hardness of the surface against which the mass
impinges. The rebound hammer has a spring-loaded mass which has a
fixed amount of energy imparted to it by extending the spring to a
fixed position by pressing a plunger against a smooth surface of
concrete. Upon release, the mass rebounds from the plunger which
remains in contact with the concrete surface, and the distance
travelled by the mass, expressed as a percentage of the initial
extension of the spring, is called the rebound number. This is
indicated by a rider moving along a graduated scale. The rebound
number is an arbitrary measure since it depends on the energy stored
in the given spring and on the size of the mass.
The test is sensitive to the presence of aggregate and of voids
immediately underneath the plunger so that it is necessary to take 10
to 12 readings over the area to be tested. The device must be held
such that the plunger is normal to the concrete surface, but the
position of the hammer relative to the vertical affects the rebound
number because of the influence of gravity on the moving mass. Thus,
for a given concrete, the rebound number of a floor is smaller than that
of a ceiling, whilst inclined and vertical surfaces show intermediate
values.
58
There is no unique relation between hardness and strength of concrete
but experimental relationships can be determined for a given concrete;
the relationship is dependent upon factors affecting the concrete
surface, such as degree of saturation and carbonation. The Schmidt
hammer test is therefore useful as a measure of uniformity and
relative quality of concrete in a structure or in the manufacture of a
number of similar precast members but not as an acceptance test.
2.2.3.4 Lok test.
A number of 25mm diameter metal discs are cast into the structure
some 25mm below the surface. This is fitted with a connecting bolt
and pulled using a hydraulic jack having a 55mm inside diameter
reaction ring bearing on the concrete surface. Whilst there is some
discussion of the detailed analysis of the fracture mechanics involved,
what is certain is that the results are more closely related to
compressive strength values, and are subject to fewer variables than
with other tests. The Capo test is a variation for application to
existing structures, whereby a hole is drilled and under reamed to take
a compressed steel split pin, which is expanded into the groove, and
pulled out as before.
59
2.2.4 Proof-testing.
Following statistical analysiS of the data generated from the
destructive mechanical testing of a suitable representative sample
from the prepared batch of components one is presented with a
probability of survival for a given period under given service
conditions. The pessimistic view of this is that a small percentage of
components will fail, within the same period under the same service
conditions. With ceramic materials failure is probably catastrophic,
ie the component fails suddenly, the crack, once initiated, propagating
rapidly across the piece. Where such failure is intolerable, expensive
or inconvenient such statistical probabilities are inadequate.
Proof-testing is a technique whereby individual samples from a batch,
which are not up to specification, can be identified and removed before
entering service, Davidge (1989). In its simplest form a proof test
would subject components to particular conditions relating to
performance requirements. The statistical analysis would be verified
as some pieces would would fail, the remainder could then be expected
to perform satisfactorily in service with 100% survival for the given
period under the given service conditions. This would be acceptable
for ceramics only if there were no time dependence of strength,this is
60
not the case and the fraction of specimens failing at 0p' the proof
stress, depends on the time chosen for the proof test and the rate of
load, Davidge (1989). Furthermore the stresses applied during the
proof test markedly weaken the weaker of the survivors of the test.
During a realistic proof test only a small fraction of the specimens
would be rejected given an appropriate selection of proof-test
conditions. Despite of the weakening effect of the proof test on the
weaker survivors, the strength distribution of these survivors is
generally greatly improved when compared with that of the original
population. It would be possible under ideal conditions to give a
guarantee for the performance of all the survivors, but conditions are
rarely ideal.
Ideally proof-testing should be conducted under conditions where
sub-critical crack growth is absent. The effects of the environment
could be eliminated by testing in vacuum or at very low temperatures
but this would still leave the less significant intrinsic crack growth.
When crack growth occurs during the proof test, growth at the proof
stress is accounted for automatically by the appropriate analysis.
Unfortunately any crack growth on unloading from the proof stress can
" ..

not be accounted for and, although this effect may be small, it
effectively nullifies the guarantee of performance, which can now only
be expressed in statistical terms.
The situation· is further complicated by the fact that most
experimental and theoretical data for the strength of ceramics relate
to a simple condition of uniaxial tensile stress. Many engineering
ceramic components, despite the best efforts of the designer to
confine loading to compressive loads only, are not subjected to this
simple stress state and a multiaxial-stress state is much more
common.
2.3 NONDESTRUCTIVE TESTING AND EVALUATION.
2.3.1 The Nature of nondestructive testing.
It is clear that the greatest disadvantage to these mechanical tests is
the sheer number of specimens required for destructive testing and
statistical analysis. This is particularly disadvantageous in the case
of cementitious materials due to the higher degree of variation due to
the chemical bonding process requiring a greater sample population,
and the extra variable of age. The number of samples required for
CI')

statistical analysis, generally considered to be a minimum of 50 must
then be multiplied by the number of ages for which data is required, to
determine the number of samples required.
NDE however enables the repeated testing of each component over a
period of time. Each value can be compared directly with the previous
and subsequent values obtained by examination of the same item in the
same location under the same specified conditions. Mean values for
each age and location can be calculated with a view to quality
monitoring of production and accept! reject criteria can be applied on
an individual basis thus removing substandard articles from service.
For any material a laboratory study of the reaction kinetics of
chemical bonding process with a view to optimising the curing
process, identifying minimum or optimum ages for demoulding and
finishing operations thereby optimising the manufacturing operation.
The same study would also enable a simple evaluation at an early stage
of curing with a view to the estimation of the projected strength of
the article prior to any further effort and expense. There also exists
the possibility of 100% testing and with it the ability to assure
satisfactory service of all products.
The aim of NDT is to detect defects, which can be defined as flaws in

the material that create a substantial risk of failure. Whether or not
a small flaw is a significant defect is determined primarily by its
nature and size.
Reynolds points out that generally in comparison with metals, ceramic
materials are significantly lighter and stiffer but they
characteristically show low values of fracture toughness, Reynolds
(1989). Their thermal and electrical conductivities are very low and
many have poor acoustic propagation characteristics. Thus the
physical parameters which have governed the evolution of NOT
procedures for metallic artefacts are no longer appropriate, and their
problems must be addressed from first principles. Different
techniques are required for the examination of unsintered or unfired
mouldings which may be in a friable condition and likely to
disintegrate in contact with water. A further range of techniques
would be required for the evaluation of large cementitious structures,
with the added complications of inhomogeneities and chemical
variations.
Individual significant defects in engineering ceramics may range in
size from 10 to 100 Jlm, or defect populations may require statistical
assessment. In addition, the morphology, chemical nature and

position of the defect may be decisive factors. In particular, a
surface defect is generally much more significant than one of the same
size situated internally, and a defect in a region stressed in tension is
more likely to cause failure than if the stress is in compression or
shear.
The defects generally found in ceramics are cracks, delaminations,
inclusions of foreign material, voids and variations in porosity or
density. Surface scratches, pits or gouges arising during machining
may also be important.
Edwards advises that porosity is inevitable, because complete
densification of the ceramic even with best practice sintering is
impossible, Edwards (1989). Acceptable levels of porosity can range
from almost 400/0 in alumina refractory blocks to 0.01 % in fine alumina
ceramics. For insulating refractories porosity is advantageous and
can be induced by various means, in which case this would not be a
defect condition unless the pores consolidated to produce large voids.
In fine engineering ceramics, failures can be initiated from pores no
more than 10 Jlm across.
During sintering, the loss of volatile constituents is the usual cause of
porosity. Inclusions may originate from the surroundings and the
atmosphere, eg dust, insects or fragments thereof, or wear debris
from the machinery used to crush, sieve and filter the ceramic
powders. Combustible materials may burn off in oxidising
atmospheres "leaving significant voids in the structure.
Delaminations and cracks caused by internal stresses may arise during
shaping and firing. Stresses are also set up when a ceramic is used in
conjunction with other materials, including other dissimilar ceramics,
or when welding a ceramic to a metal, because gross differences in
thermal expansion may occur between the ceramic and the other
materials. Surface cracks arising during machining present a
particularly difficult problem and place a severe limitation on the
machining of ceramic components.
Critical flaw size is determined by material properties and the service
conditions of ceramic components. Ceramic materials are extremely
brittle and they are therefore weak when subjected to thermal shock
and suffer brittle fracture on impact. This is a consequence of the
strong bonds between atoms in ceramics which, whilst they impart
their toughness and wear resistance, also make dislocation movement
difficult and local high stress concentrations cannot therefore be
dissipated. In contrast, the dislocations within metals require much
66

less energy to move so metals are ductile to some degree.
Great care is therefore needed in designing ceramic components to
avoid notches and other stress concentrations, and if possible to
ensure that the ceramic is under compressive loading. Even small
flaws cannot be tolerated in regions subjected to tension because
fracture, once initiated, will propagate catastrophically.
To improve their toughness ceramics may be produced with second,
metastable phases which lead to transformation-toughening
mechanisms. Here the second phase is in a lower volume, higher
density, form which is only stable at room temperature whilst it is
compressed within the major phase. Should a crack impinge upon this
phase, a phase transition or transformation ensues, resulting in a
volume increase, thereby impeding the propagation of the crack.
There is also an interest in the incorporation of ceramics into
composite materials, for example by reinforcement of ceramic
matrices with carbon, glass, ceramic, metal or other fibres.
2.3.2 Selection of nondestructive testing methods.
The applicability of nondestructive tests to ceramic components can
67
be assessed on the basis of four criteria:
I. the nature and size of the defect.
II. the properties of the ceramic material.
III. the type of ceramic component or structure.
IV. the conditions and restrictions imposed by the situation.
The strength of a ceramic is heavily dependent upon the size and
location of the small flaws created during the material processing and
manufacturing stages. The maximum permissible flaw size is
difficult to determine, because of the variability of destructive
mechanical test results. Statistical methods are therefore necessary
to establish fracture strengths under various test conditions and a
probabilistic view of failure and its consequences, and assessment of
critical flaw size, must be taken.
The service conditions which drive design engineers to specify
engineering ceramics generally include high temperatures and high
levels of abrasion. The choice of such materials is based upon their
refractory properties, ability to retain mechanical strength at high
temperature, and low density. Thus the inclusion of ceramic
materials in reciprocating engines would be expected to lead to
greater fuel efficiency because of the possibility of higher operating
68
temperatures and lower mass.
The material properties and extreme operating conditions therefore
dictate that critical flaw sizes are small in such applications. For
many applications the maximum flaw dimension may be only 25J.lm.
This sort of resolution requirement increases the sophistication
required of the technique and drives up the expense of testing. The
decision of whether nondestructive testing on 100% of components is
justified, must be based upon the acceptability of the consequences of
the failure of a component or structure. This would be based upon a
failure probability predicted by a statistical analysis of destructive
test data from a small sample of components or test pieces.
The material properties will determine the penetration of X-rays and
ultrasound and the levels of noise which may obscure defect images or
signals. Fortunately most special purpose engineering ceramics
present few problems in this respect. Other ceramic materials may
exhibit poor sound propagation properties, thus limiting ultrasonic
evaluation to low frequency operation, possibly only tens of kiloHertz.
Small components of complex shape are difficult to inspect with any
NOT method, because the presence of geometric features may obscure
defects. This problem is intensified as the frequency of the
ultrasonic equipment is reduced, thus increasing its wavelength,
69
eventually to the same order of magnitude as the specimen to be
inspected, or beyond. The difficulty is usually overcome by confining
tests to specific critical areas of the component for which the
geometric images or signals can be carefully monitored. This, as was
explained earlier, was of particular concern in the current study,
creating dificultie.s in the interpretation of data. The main solution
to the difficulties created by these effects was to limit the
frequencies recomended for practical systems to minimum values of
2MHz. This is also approaching a maximum frequency limit imposed by
poor propagation of ultrasound in the material.
Edwards suggests that the conditions set out for selecting a new test
method should include the following, Edwards (1989):
1. The test should be relevant.
A test capable of detecting one type of defect may not necessarily
detect another. Planar defects are a particular problem because their
orientation may determine whether or not they are detected. A crack
has to lie in a plane parallel to the X-ray beam, for example, to create
an image on the radiograph. Small pieces may be turned to eliminate
this problem, this may not be so easily accomplished with large
components.
70

2. The test should be precise.
It must be able to give quantitative data on which to base simple
accept/reject criteria, otherwise it is of no use in quality control.
3. The test should be reproducible.
It may be the onLy way of communicating information about the
severity of a defect and this may require comparisons with other
tests.
4. The test should be accurate and reliable.
Otherwise, design margins have to become large, resulting in greater
redundancy, less efficiency and greater cost.
5. The test should not be complex.
It must be practicable in the manufacturing environment, where it will
be in the hands of less-skilled operators. Detailed analysis should be
avoided or delegated to a computer, preferably in a self contained unit
capable of digital readout of parameters and data logging and transfer.
6. The test should be cost-effective.
There is little point in the expense of several thousands of pounds to
inspect all components in order to save several hundreds of pounds in
71

repair costs and downtime due to a few failures. However where a
component is vital, in its true sense, cost effectiveness should cease
to be an issue.
2.4 ELECTRICAL AND ELECTROMAGNETIC RADIATION METHODS.
2.4.1 Electrical methods.
Ceramic materials used for structural purposes are not normally
required to exhibit any particular electrical properties, save perhaps
to offer electrical resistance in some cases, and therefore values for
such properties as conductance or dielectric constant are deemed to be
irrelevant. However various electrical parameters may be measured,
and have been shown to be indicative of the mechanical or
microstructural attributes of materials. Properties such as a.c.
impedance, dielectric constant, dielectric loss and d.c. resistivity can
be used to evaluate materials, particularly composite materials,
where the volume fraction, size, shape and electrical properties of the
disperse phase govern the magnitude of the above parameters, Gerhardt
(1994).
It is well known that dissimilar phases will have dissimilar responses
72
to an applied electromagnetic field and indeed this is the basis of
many N.D.E. technologies, for example eddy current analysis, although
these are generally applied to conductive materials. Eddy current
methods would be suitable for measuring the thickness of ceramic
coatings on metals using the 'lift-off effect, where a test Signal is
created as the coil is lifted from the surface, where a resolution of
the order of 0.001 mm is possible.
When such phases are intimately joined, and in three dimensions, as in
composite materials additional interactions may occur dependent upon
the nature of the phases and of the interface. Orientation of fibres
can be expected to lead to anisotropic properties especially when the
fibre content is high. In particular where the fibre is a much better
conductor than the insulating matrix one may expect to find
Significant conduction only in a direction parallel to the long axes of
the fibres. Similarly hot pressed samples may be expected to exhibit
anisotropy with respect to the axis of pressing. It is important
therefore in the application of these methods, to such components,
that the orientation of the samples should be maintained consistent.
As the volume fraction of the disperse phase is increased the d.c
resistance and the a.c. impedance of the composite may rise or fall
73

depending upon whether the disperse phase is a poorer or better
conductor, than the matrix, respectively. The dielectric constant of
the material will also tend to rise and fall over a range of
compositions. Here however a further complication of frequency
arises where a more linear response can be expected at higher
frequencies. This is due to the tendency of lower frequency
measurements to be more susceptible to localised space charge and
interfacial effects than higher frequencies, which as a consequence
will give more representative data for the bulk composite material.
Impedance analysis using sophisticated equipment allows the small
conductivity of specimens to be determined. Capacitative
measurements can be made using the ceramic as the dielectric in a
simple two plate capacitor, where one plate could be a metal substrate
or coating, the other plate being, effectively, the probe. Moisture
levels could be problematical if not controlled, however taking a
converse view, for a given material with known properties, variations
in capacitance or impedance could be indicative of moisture content,
and given that moisture tends to reside in pores some information on
the distribution of porosity may also be gleaned.
74
Capacitance measurements were carried out on these materials, using
a Hewlett-Packard impedance analyser, as an adjunct to the work
reported in this thesis, Maturana (1988). The paste was-placed in a
mould cell with plates built into opposite walls. One plate was
smaller than the other to ensure consistent conditions. Measurements
of capacitance, and hence dielectric constant, and dielectric loss,
were made during the curing process over several days, showing
considerable variation in the value of the dielectric constant.
The method was used to monitor the setting process of phosphate
bonded ceramic, by measuring the dielectric constant and the
Dielectric Loss. The measured values of the dielectric constant
values at low frequency values are dominated by the high levels of
free water in the early stages. This predomination is lost as
frequency increases, and the other components of the ceramic material
come into play. It was possible to monitor chemical reactions and
reaction kinetics during the process, and to measure the amount of
alumina contained in the material by monitoring the first maximum
present. The optimum frequency for this system was found to be
approximately 1 kHz.
The dielectric loss measurements proved suitable for monitoring the
75

curing reaction for the alumina filled phosphate bonded materials, but
inadequate for determination of the alumina contents.
2.4.2 Optical methods.
Detection of subsurface defects in machined silicon nitride ceramics
by Optical Scattering
Optical scattering has previously been used to study surface features
of metals often intended for optical applications. The technique is
now showing promise for application in advanced ceramics for
analysis of surface features and where the material properties allow
light transmission, for subsurface features and defects, Ellingson
(1993).
Fundamental geometric optics indicates that on a perfect reflector the
angle of incidence is equal to the angle of reflection and the
reflectance is 1. However where the material is transparent or
partially so the reflectance is less than 1 and a transmitted
component exists. The reflected component will undergo scattering
from various surface features & defects including surface roughness,
76
scratches, cracks and particulate and liquid residues. The transmitted
component will also encounter subsurface material defects and grain
boundaries and a proportion of the light will be scattered t.owards the
detection device.
By the use of a laser light source and polarised detector systems and
careful choice of relative positioning to avoid configurations resulting
in high signal to noise (sin) ratios, and optimise the surface or
subsurface scattered light component, as appropriate to the mode of
application, optical scattering data can be gathered. Ellingson et al
have demonstrated some success in surface and subsurface analysis of
defects in machined silicon nitride by this means. Refinement of
their techniques should lead to the ability to detect intrinsic defects
and defects originated by the machining operation in these and other
materials.
2.4.3 Radio and microwave methods.
Radio wave methods can used for determining physico-mechanical
properties and revealing structure defects in raw materials, pastes,
cements and refractories. A variety of radio wave parameters may be
77
informative, such as phase, amplitude, or polarisation plane. The
greatest effect has been obtained by using the phase velocity of a
refracted wave as the measured parameter from which evaluation and
control of the physico-mechanical properties of refractories such as
apparent density, density gradient, porosity, and mechanical strength
is possible, Rapoport (1994).
The phase transition radio wave method is based on the functional
correlation between dielectric permeability, density, and structure,
which is characterised by a change in free energy. The method is used
for controlling properties of oxide and tar-bonded refractories, as
well as the activity of initial powders. A correlation between the
measured phase incursion of the refracted wave and the apparent
density of the material in the exposure zone has been demonstrated
and can be used for construction of calibration graphs. In edge zones
under conditions where radio wave diffraction has a certain effect an
experimentally determined correction is required in the calibration
graph. The close correlation between the radio wave phase incursion
and apparent density makes it possible to control the porosity of
materials, in particular open porosity. The ultimate compressive
strength of refractories may be evaluated from the phase velocity of
radio waves. If the technological process is not stable, a second
78

parameter, i.e., the weight of articles, is used for more accurate
determination of the mechanical strength.
The creep of refractories at high temperatures depends on certain
changes in their structure. which may be revealed by measuring the
phase incursion of a refracted radio wave. For estimating the extent
of sintering of refractory articles on roasting, the dielectric
permeability measured by the phase method is approximated to a
pore-free structure. The radio wave phase method also makes it
possible to reveal microfailures occurring in articles at early stages
of thermocycling well before the appearance of visible large cracks.
This effect can be used for quicker and more reliable testing of the
thermal stability of refractories.
The radio wave method for moisture estimation is based on the
dependence of the attenuation of super-high-frequency (SHF)
electromagnetic radiation, with wavelengths of th order of 3cm, on the
weight fraction of moisture in the material. The masking factors,
such as inhomogeneity of the sample, variable grain composition, etc,
affect the statistical nature of the correlation.
It is possible to use the above technique in an imaging system by the
79

incorporation of a scanning system, and gathering radio wave data and
associated spatial data, which can subsequently by analysed using
computer systems to generate an image. This has proved useful in the
microstructural control of fused badellyite-corrundum refractories
for glass furnace linings, Vainberg (1993).
2.4.4 Thermal methods.
2.4.4.1 Thermoelectrical and thermomechanical analysis
Properties such as thermal conductivity, specific heat, and thermal
diffusivity can be evaluated for database use or production monitoring
by measuring certain electrical responses of the test material.
Materials required to meet specific thermal-property requirements
frequently are evaluated by performing basic "pass/fail" electrical
measurements that correspond to these properties. Thermoelectrical
analysis can reveal significant information about the composition or
microstructural condition of materials, or it can simply distinguish
one material from another.
New equipment and new techniques have been developed to meet a
diverse array of needs. For example, researchers at Oak Ridge
80
National Laboratory's high-temperature materials laboratory routinely
evaluate high-temperature graphite and carbon/carbon composites by
measuring thermal diffusivity and specific heat, using an automated
system based on laser-flash technology to measure specimen
temperatures ranging from -170 to 2,000°C, Bittence (1989). A
pulsed laser beam irradiates one side of a specimen whilst
temperature rise is measured on the other side. The system,
automatically plots thermal diffusivity as a function of temperature.
Both thermal conductivity and diffusivity can be taken as a measure
of insulation characteristics,
Traditionally, thermomechanical analysis techniques have been used to
evaluate properties such as thermal linear-expansion coefficient,
flexural and elastic moduli, and the glass-transition temperature of
materials, can be used either directly or indirectly through
computer-assisted calculations of characteristics that are valuable at
the production level for process or quality control. These
characteristics can be included in materials specifications to meet
specific design requirements, and can be used in designing new
materials.
The basic T. M.A. system measures uniaxial displacement of a uniformly
81
heated specimen as a function of time and temperature, and hence the
coefficient of expansion, by means of a probe which measures
temperature while a displacement load is applied. The point at which
a sample undergoes a phase change can also be identified, when the
change involves an abrupt change in the coefficient of expansion.
Typically, this test can show the glass transition temperature and
softening point in polymers.
Further sophistication of the basic system is obtained by including
torsional or bending load cells, tensile-strain measuring devices, and a
variety of other sensors. Manufacturers offer modules that can be
assembled to customise a system to meet particular needs, and
appropriate computer software.
The ability to apply a variable or dynamic load to the specimen can
reveal many useful mechanical characteristics, including the cure
stage of a polymer resin. Frequencies can be selected by computer for
cyclic loading, and elastic and flexural moduli, along with thermal
characteristics, can be measured, to provide information on dynamic
relaxation, thermodynamic equilibrium, and activation energy.
Dynamic mechanical relaxation dynamic relaxation can be related to a
material's toughness, allowing producers to materials to meet specific
82

toughness requirements. This parameter also is important in the
design of pressure-sensitive adhesives for ceramic/metal/polymer
bonding.
Operating on a slightly different principle, stress-pattern analysis by
thermal emission (S.P.A.T.E.), introduced a few years ago, is capable of
noncontact measurement of surface stress. This technique is
particularly useful in evaluating materials in actual loading
applications and in monitoring structural damage due to impact or
fatigue loading. The method is based on a phenomenon common to
many ceramics, metals and polymers, where a reversible temperature
change is generated with the application of mechanical stress,
Bittence (1989).
The temperature change of a cyclically loaded part is measured by
infrared detection, which produces a stress map revealing relative
surface-stress conditions. Stresses are calculated by means of a
computer relating temperatures to various properties of the material
including surface emissivity, thermal expansion, and specific heat.
For materials evaluation, this technique is especially suitable to
detect subsurface defects which modify surface stresses. Typical
defects which can be detected include voids or cracks in ceramics and
83
in metal castings, debonding and broken fibres in reinforced
composites, delaminations in laminates and disbonds in honeycomb
composite structures. S.P.A.T.E. is also expected to prove useful in
the assessment of impact or fatigue damage in materials, and the
automotive and aerospace industries have expressed an interest.
2.4.4.2 Infrared Thermography
For ceramic materials and particularly for composite materials an
assumption may be made that volumetric material defects,
inhomogeneities, particle agglomerations and anisotropy due to fibre
lay-up direction can be detected by monitoring the infrared wavelength
spectra emitted by localised hot and cold regions. The data can be
displayed in the form of isothermal contour lines on a map or plan of
the surface of a material. Colours can be ascribed to temperature
regions on the isothermally mapped surface, by appropriate computer
software, greatly faCilitating the interpretation of the information
and identifying suspect regions in the artifact.
Infrared thermography may be used as a passive technique, where
externally applied heat is allowed to thermally conduct through a
84
material of interest. The alternative is an active method where a
non-thermal energy source is used and this energy is transformed into
thermal energy within the material. Both of these techniques will
produce the surface temperature gradients which are representative of
the aforementioned internal material defects and anomalies. The
active monitoring technique can be used in conjunction with a
non-contact, real-time sensor unit. With the use of this sensor,
temperature gradient values can be calculated with a sensitivity of
=O.2°C. Data proceSSing with the real time infrared thermography
system can include frame averaging, either over the total surface area
of the material of interest, or in the area where the most damage is
expected (Le. a stress concentration cross-sectional area).
Post-testing data processing can be performed on video-taped data in
order to calculate point and linear temperatures and emissivity values
of specific specimen locations where material damage was observed,
Boving (1989), Gianaris (1991).
Sumitoyo industries have patented a method of evaluation of specific
heat of samples at ambient temperatures and the comparison of this
value with a standard. This comparison is subsequently analysed with
reference to standard data to infer values of various mechanical
85

properties including creep strength. Yamikawa (1993). A method of
applying thermography to poor thermal conductors such as concrete
brick or fibrous composites using an array of infrared heaters-and the
subsequent observation of the cooling process by means of a thermal
imaging camera has been patented, Milne (1991).
Infrared thermography has found application in various materials
including the study of electrical contacts in use, insulators and
refractories, Deperrois (1988), and the monitoring of fatigue in thick
composite materials under compressive load, Gianaris (1991).
Thermography was carried out on samples of phosphate bonded
ceramic in conjunction with British Airways, using an infrared heat
source behind the sample. Concentrations of porosity large flaws and
cracks could be imaged, Anjorin (1988).
2.4.5 Radiography.
Edwards advises that the radiological test procedures used on
ceramics are different from those used on metals for three reasons:
86
1. Because they are made up of elements of low atomic number the
X-ray absorption coefficient of ceramics is lower than that of metals.
The image contrast improves when using low energy X-rays, typically
less than 50 kV.
2. The image contrast of inclusions is low, because they too are made
of elements with a low atomic number.
3. The critical flaw size in ceramics may be of the order of 25 ~m and
this is beyond the resolution capabilities of conventional radiography.
Micro-radiography is then necessary and there are two methods:
Contact radiography:
This method uses a conventional single wall-single image technique
with the object in contact with the radiographic film, but with a long
film-to-tube focus distance. This reduces the geometric unsharpness
or penumbra to a limit, where definition of the image on the film is
governed only by the energy of the X-rays and the graininess of the
film. By using the radiographic films designed for lithography and
spectrography, which have an ultra-fine grain size and an emulsion on
one surface only, the images can be optically magnified 200 times for
87
viewing and yet retain good image quality. However, there is some
loss in image quality because of the large amounts of scattered
radiation reaching the film.
Projection radiography:
This method pla?es the object close to the X-ray tube and projects the
image over a distance of typically 2m on to the radiographic film. To
reduce the geometric unsharpness to acceptable levels, the focal spot
size in the X-ray tube is as small as 10-100 Jlm in diameter. With a
magnification of 40 X, a lateral resolution in the image of 20 Jlm is
achievable.
The projection technique using a micro-focus X-ray tube is preferable
to a contact technique using a conventional X-ray tube because there is
less scattered radiation reaching the film and this improves image
quality. The method is suited for use with an image intensifier to
capture a video image instead of using radiographic film. Digital
image processing of the video image can improve the inherently poor
defect contrast in ceramics. There is also the possibility of
real-time imaging and scanning of the component. Unless real-time
imaging is used, the method is suitable for off-line inspection only.
88
Radiography is sensitive to volumetric flaws in ceramics if the kV is
low and the image can be magnified. Cracks may be detected with
ease when appropriately orientated, ie substantially along the axis of
projection of the X-ray beam, but otherwise only with difficulty. The
geometry of the component may make interpretation of the
radiographic image difficult, if defect images are superimposed on
images from geometriC features, but this is true of any material. The
visualisation of the bulk porosity, and the detection of inhomogeneious
distribution of porosity and constituents, particularly fillers and
aggregates whose densities differ substantially from that of the
matrix is readily achieved. Contact radiography techniques were used
to help characterise the material and to verify findings for publication
during the course of this research, Round (1988a).
X-rays are widely used to inspect metal structures and can also be
used successfully on ceramics. Although X-ray methods are easy to
apply to items such as firebricks, most NDT on such components is
done by ultrasound, which is cheaper and simpler, and in real time.
With larger structures such as refractory lined pipes and precast
concrete blocks, X-rays are more commonly used, but since it is still
usually necessary to bring the specimen to the X-ray machine, rather
than vice-versa, very large structures tend to be inspected using
89
gamma-ray techniques. Gamma-ray back scattering can be used to
measure the density of refractories, with the significant advantage
that access to only one surface is required. It is possible to produce a
plot of density against distance from the surface, which is extremely
useful in locating cracks and poorly bonded areas.
2.4.6 Computed tomography.
The development of many new materials and processes is generating a
need for improved nondestructive inspection technology. Conventional
methodologies, (ultrasonics, radiography and visual), may be
inappropriate or inadequate for many advanced materials. New
inspection methods such as computed tomography (C.T.) are needed to
characterise properties and defects of advanced materials and
processes. C.T. provides quantitative volumetric measures of
density, constituents and dimensions, and offers considerable
potential to reveal three-dimensional information, potentially useful
for design, manufacturing, inspection and analysis.
In conventional radiography, a source of radiation, X-rays or
gamma-rays, is used to project a shadowgraph image of a three
90
dimensional object onto a two dimensional film. A real-time
alternative is to display the two dimensional image on a cathode ray
tube. In either case information in the image is superimposed, and a
skilled interpreter is often required to examine the image, if useful
data is to be acquired, Georgeson (1991), Phillips (1993).
In computed tomography, a partially collimated, thin "fan shaped slice"
of radiation is passed through the object, and the transmitted
intensity measured by a detector array which is suitably curved and
orientated. The object is rotated and translated relative to the
source, in order to obtain views from all aspects, about the object.
The data is sent to a computer and the computer reconstructs the
object interior, as if it were sliced open. The image data points are
small volumetric measurements directly related to the X-ray linear
attenuation coefficient of the material present in the volume elements
defined by the slice thickness and the cross-sectional resolution
capability of the C.T. system. The interior of the object is visualised
in its true dimensional orientation. From sequential, multiple slices
taken over the whole part, a complete three dimensional image can be
built up and suitably displayed, normally in a two dimensional format.
The advantages of C. T. lie in the ready interpretation of complicated
geometries and quantitative nature of the data for dimensional and
91
density information. It can be used for density or constituent
variations with excellent sensitivity. Dimensional measurements are
a common application of C. T. and can be quite accurate in the typical
range of 0.050 to 0.25 mm.
C.T. offers considerable potential for nondestructive evaluation, but it
requires more sophisticated and precise equipment than other NDE
methods, thus the overall cost of C.T. data acquisition will generally
be high. However, C:T. can be cost effectively applied to many
advanced material applications.
New materials or products usually involve an iterative cycle of
manufacture and testing to bring the manufacturing process under
control. Understanding the interior configuration of a new product or
the effect of a new process on materials and dimensions is key to the
development of the product. Because C.T. allows for quantitative
measurements of material density and dimensions, it is ideal for
providing important information on many advanced material processes.
Accurate dimensional analysis with cross-sectional image information
can reduce development cycle times considerably, thereby affording
considerable cost savings. This is particularly true for new
92
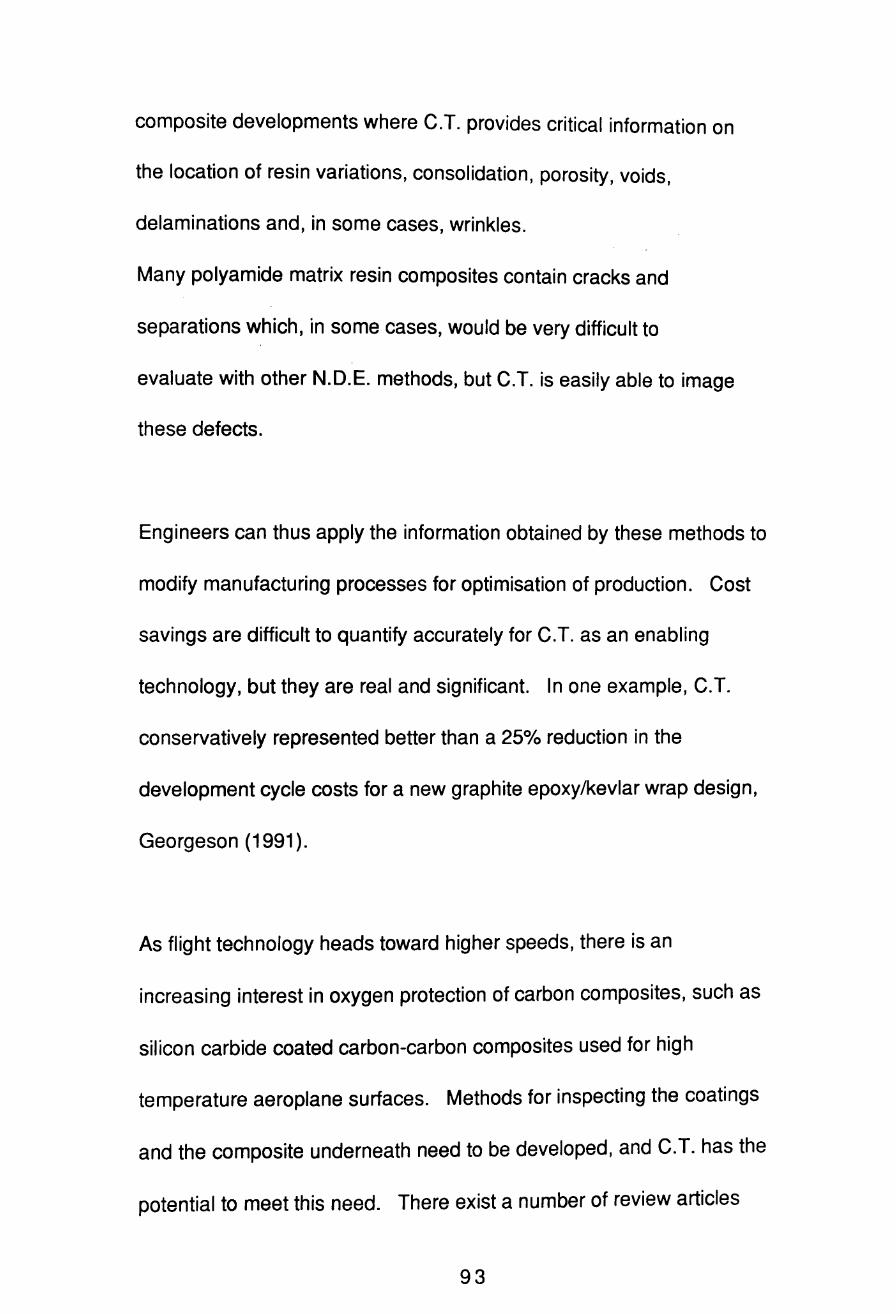
composite developments where C.T. provides critical information on
the location of resin variations, consolidation, porosity, voids,
delaminations and, in some cases, wrinkles.
Many polyamide matrix resin composites contain cracks and
separations which, in some cases, would be very difficult to
evaluate with other N.D.E. methods, but C.T. is easily able to image
these defects.
Engineers can thus apply the information obtained by these methods to
modify manufacturing processes for optimisation of production. Cost
savings are difficult to quantify accurately for C.T. as an enabling
technology, but they are real and significant. In one example, C.T.
conservatively represented better than a 25% reduction in the
development cycle costs for a new graphite epoxy/kevlar wrap design,
Georgeson (1991).
As flight technology heads toward higher speeds, there is an
increasing interest in oxygen protection of carbon composites, such as
silicon carbide coated carbon-carbon composites used for high
temperature aeroplane surfaces. Methods for inspecting the coatings
and the composite underneath need to be developed, and C.T. has the
potential to meet this need. There exist a number of review articles
93

indicating the widespread application of C.T. techniques to a variety of
materials including turbine blades and intercontinental ballistic
missiles Bossi (1991), ceramic turbocharger blades, Arnold (1991),
glass and graphite lepoxy aerofoils and panels for aircraft Georgeson
(1991), Sheppard (1990, 1991), and the assessment of impact damage
in aerospace composites, Potet (1988). On a more mundane level, and
perhaps more appropriate to the materials of interest here, C.T.
technology has been applied to the evaluation of porosity in portland
cement, Draper (1994).
In collaborative efforts between computer scientists and material
scientists the various theoretical aspects of computer analysis and
display technology have been studied, Engler (1990), Crostack (1987),
and algorithms have been developed to glean further useful
information, for example the quantification of flaw volumes in
ceramics, Stinson ( 1993).
X-ray tomographic microscopy (X.T.M.) is an advanced development of
the C.T. technology already discussed, which allows the materials
scientist to observe, in three dimensions and microscopic detail, the
interior of materials, Ashley (1993), Ekenhorst (1993). The technique
is nondestructive and non-invasive and as such does not interfere with
94
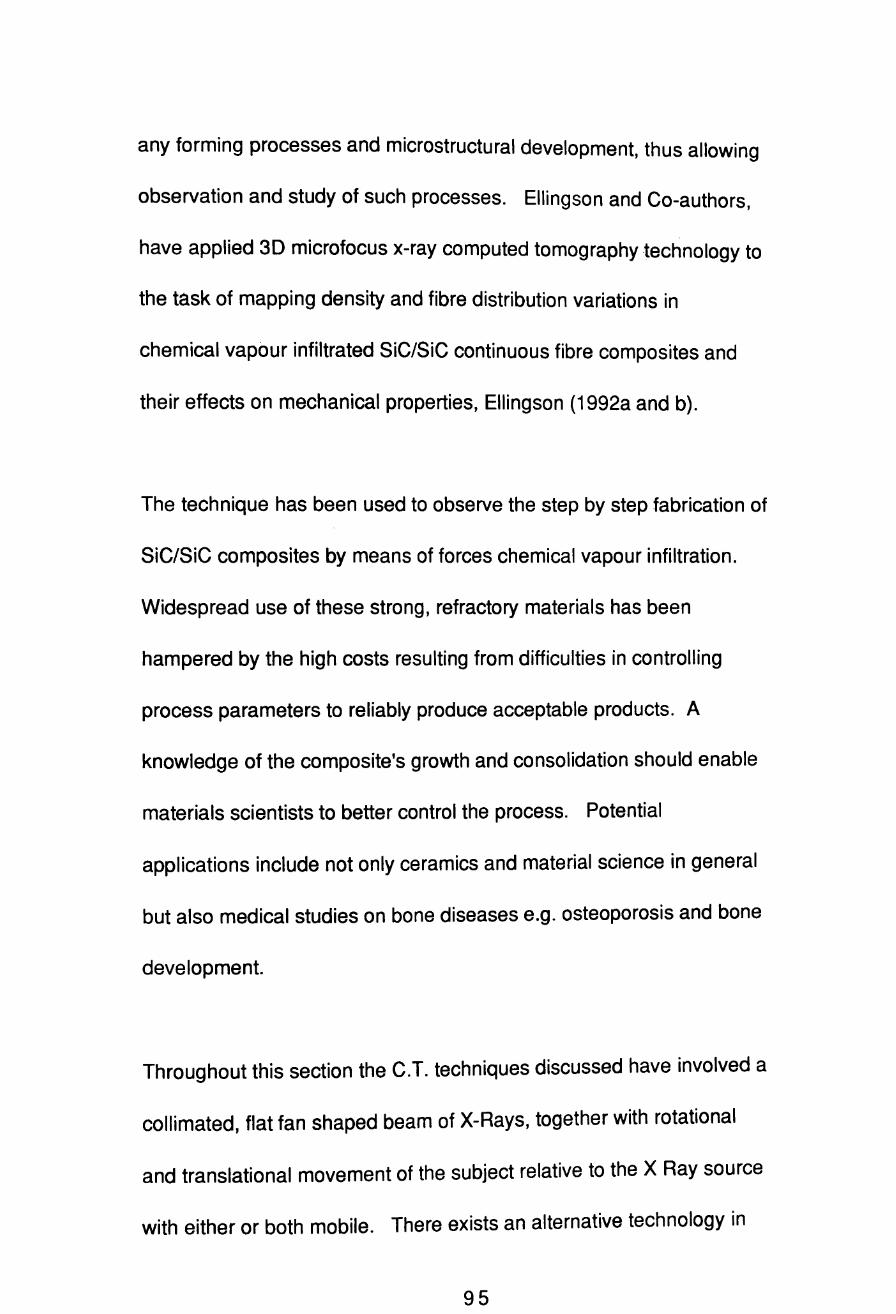
any forming processes and microstructural development, thus allowing
observation and study of such processes. Ellingson and Co-authors,
have applied 3D microfocus x-ray computed tomography technology to
the task of mapping density and fibre distribution variations in
chemical vapour infiltrated SiC/SiC continuous fibre composites and
their effects on mechanical properties, Ellingson (1992a and b).
The technique has been used to observe the step by step fabrication of
SiC/SiC composites by means of forces chemical vapour infiltration.
Widespread use of these strong, refractory materials has been
hampered by the high costs resulting from difficulties in controlling
process parameters to reliably produce acceptable products. A
knowledge of the composite's growth and consolidation should enable
materials scientists to better control the process. Potential
applications include not only ceramics and material science in general
but also medical studies on bone diseases e.g. osteoporosis and bone
development.
Throughout this section the C.T. techniques discussed have involved a
collimated, flat fan shaped beam of X-Rays, together with rotational
and translational movement of the subject relative to the X Ray source
with either or both mobile. There exists an alternative technology in
95
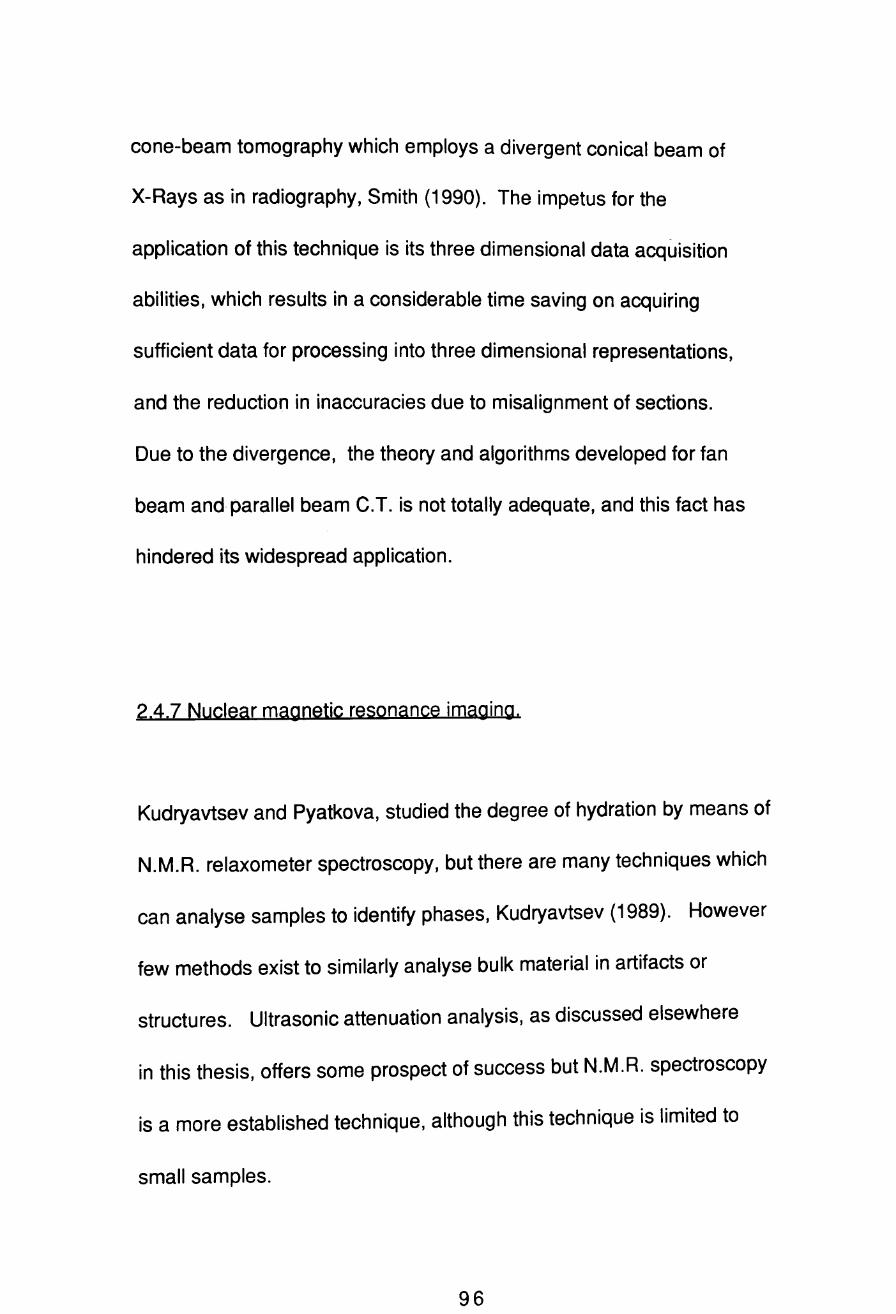
cone-beam tomography which employs a divergent conical beam of
X-Rays as in radiography, Smith (1990). The impetus for the
application of this technique is its three dimensional data acquisition
abilities, which results in a considerable time saving on acquiring
sufficient data for processing into three dimensional representations,
and the reduction in inaccuracies due to misalignment of sections.
Due to the divergence, the theory and algorithms developed for fan
beam and parallel beam C.T. is not totally adequate, and this fact has
hindered its widespread application.
2.4.7 Nuclear magnetic resonance imaging.
Kudryavtsev and Pyatkova, studied the degree of hydration by means of
N.M.R. relaxometer spectroscopy, but there are many techniques which
can analyse samples to identify phases, Kudryavtsev (1989). However
few methods exist to similarly analyse bulk material in artifacts or
structures. Ultrasonic attenuation analysis, as discussed elsewhere
in this thesis, offers some prospect of success but N.M.R. spectroscopy
is a more established technique, although this technique is limited to
small samples.
96
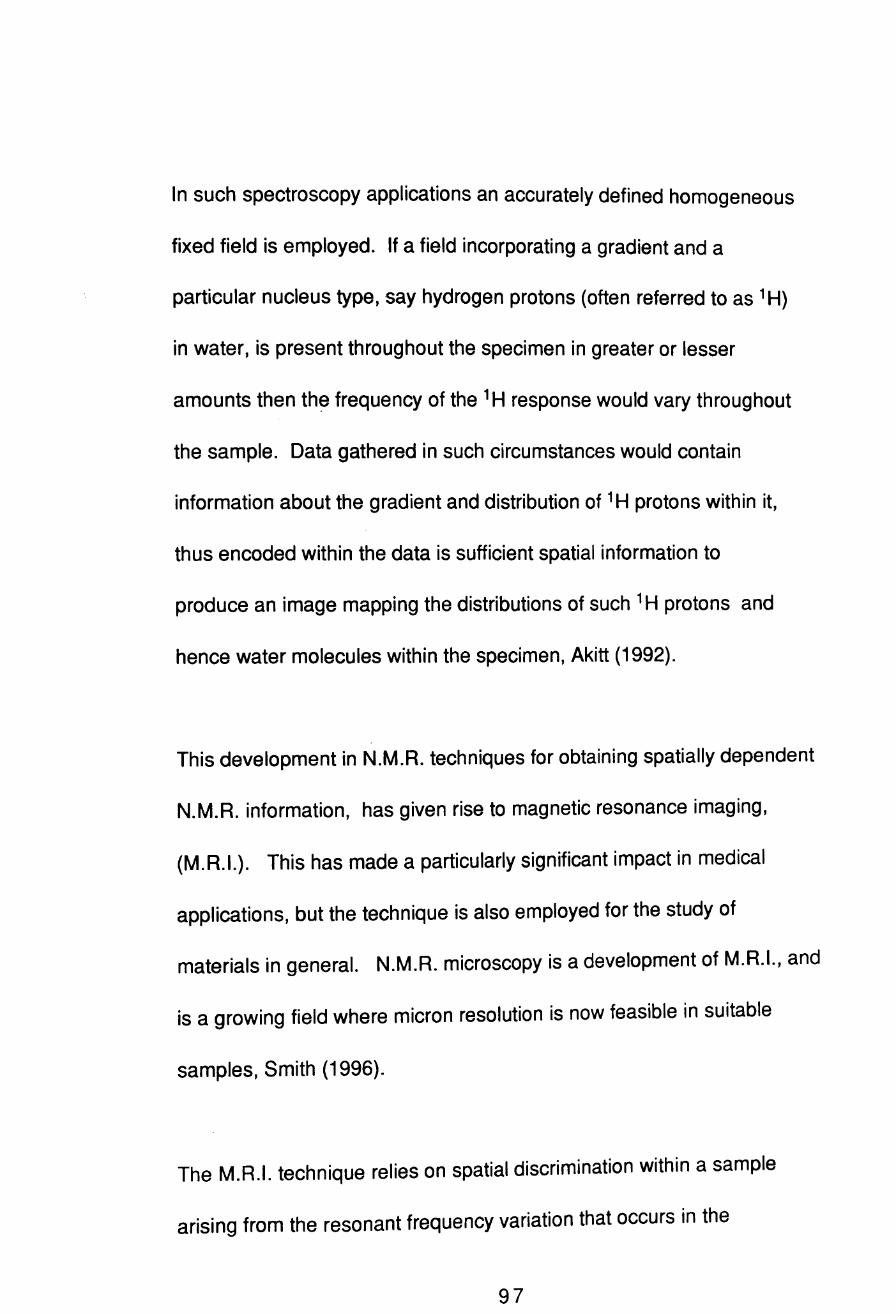
In such spectroscopy applications an accurately defined homogeneous
fixed field is employed. If a field incorporating a gradient and a
particular nucleus type, say hydrogen protons (often referred to as 1 H)
in water, is present throughout the specimen in greater or lesser
amounts then the frequency of the 1 H response would vary throughout
the sample. Data gathered in such circumstances would contain
information about the gradient and distribution of 1 H protons within it,
thus encoded within the data is sufficient spatial information to
produce an image mapping the distributions of such 1 H protons and
hence water molecules within the specimen, Akitt (1992).
This development in N.M.R. techniques for obtaining spatially dependent
N.M.R. information, has given rise to magnetic resonance imaging,
(M.R.I.). This has made a particularly significant impact in medical
applications, but the technique is also employed for the study of
materials in general. N.M.R. microscopy is a development of M.R.I., and
is a growing field where micron resolution is now feasible in suitable
samples, Smith (1996).
The M.R.I. technique relies on spatial discrimination within a sample
arising from the resonant frequency variation that occurs in the
97

presence of a magnetic field gradient G(xyz). The signal from resonant
nuclei separated by a distance az in a magnetic field gradient G(z) will
differ in frequency by )G(z)az, where 'Y is the gyromagnetic ratio of the
nuclei, and the resulting frequency spectrum will therefore provide a
means of mapping the spin density. The spin density profile is thus
determined along the direction of the applied gradient. A combination
of slice selection, using an initial 90° pulse in the presence, say, of
G(z) followed by a projection along G(x) can be extended to two- or
even three-dimensional images by repeated measurements with
different projection directions and then using back prOjection
techniques to produce the image. More efficient methods using
two-dimensional Fourier transformation are now more commonly used
where back projection is no longer required for image reconstruction.
This is probably more favourable since it can map space more evenly
than the back projection method.
The medical application of M.R.I. has been greatly assisted by the
liquid-like nature of the human body. Liquid state N.M.R., with its
narrow resonance lines permits the sensitivity associated with
narrow bandwidth techniques to be exploited. Mammalian tissue is
largely water, about 55% overall in human tissues, and this is
98
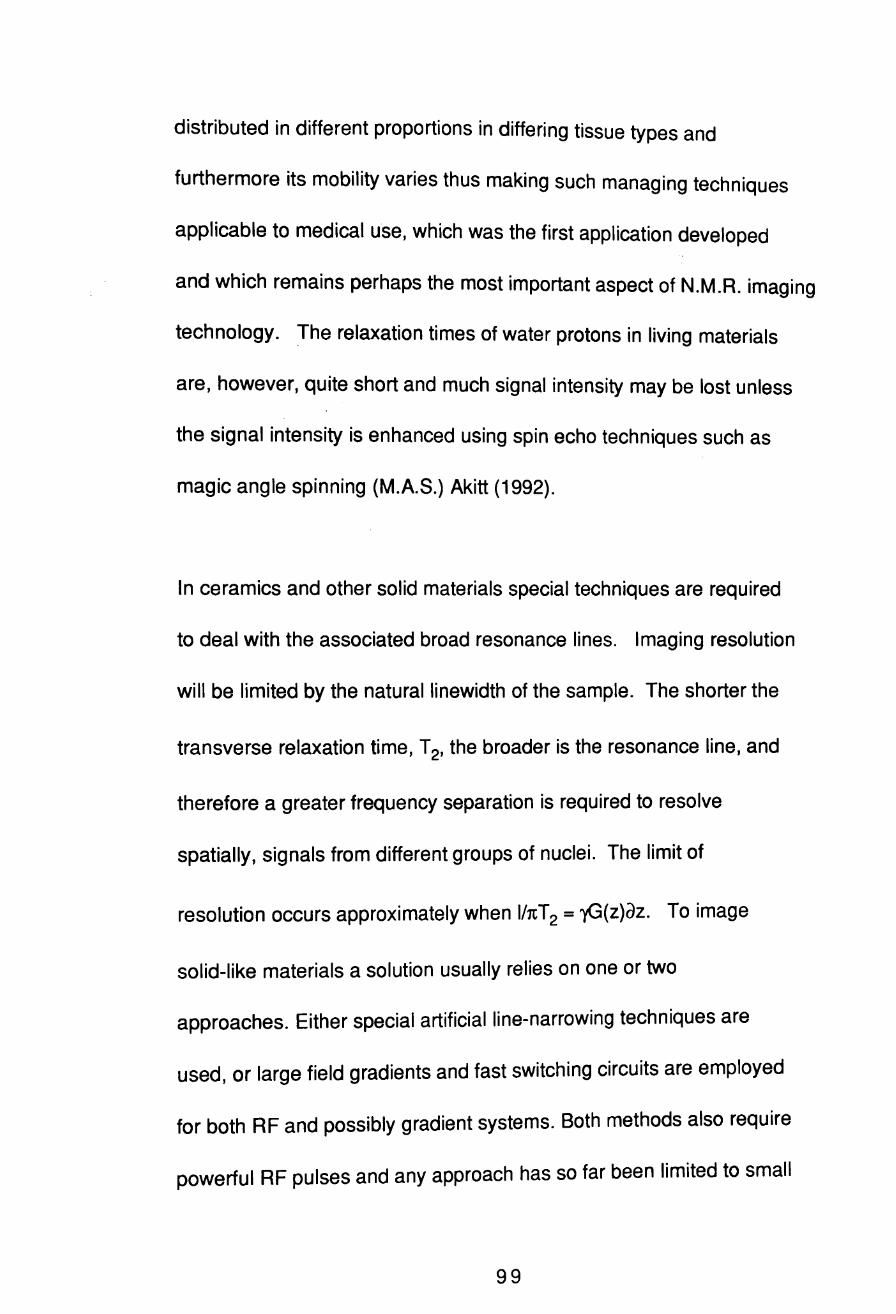
distributed in different proportions in differing tissue types and
furthermore its mobility varies thus making such managing techniques
applicable to medical use, which was the first application developed
and which remains perhaps the most important aspect of N.M.R. imaging
technology. The relaxation times of water protons in living materials
are, however, quite short and much signal intensity may be lost unless
the signal intensity is enhanced using spin echo techniques such as
magic angle spinning (M.A.S.) Akitt (1992).
In ceramics and other solid materials special techniques are required
to deal with the associated broad resonance lines. Imaging resolution
will be limited by the naturallinewidth of the sample. The shorter the
transverse relaxation time, T 2' the broader is the resonance line, and
therefore a greater frequency separation is required to resolve
spatially, signals from different groups of nuclei. The limit of
resolution occurs approximately when I/1tT 2 = -yG(z)az. To image
solid-like materials a solution usually relies on one or two
approaches. Either special artificial line-narrowing techniques are
used, or large field gradients and fast switching circuits are employed
for both RF and possibly gradient systems. 80th methods also require
powerful RF pulses and any approach has so far been limited to small
99

samples (::::::I cm3) due to the heavy power requirement.
Although some success has been achieved in special cases using magic
angle spin ( M.A.S.) methods in solids, achievable M.A.S. rotation rates
are insufficient to narrow the broadest lines, and multipulse methods
are generally required. Perhaps the simplest and most direct
technique is to use the very large field gradient (::::::40Tm-l) available in
the fringing field of a superconducting magnet. An excitation pulse of
duration t excites a bandwidth of lit = ')G(z)az and spins within a slice
az. With a 90° pulse of 10 Jls in 40Tm-1 a proton resolution az of 15Jlm
is predicted even in a solid. A stepper motor can be used to move the
sample through the sensitive plane of resonance to produce stray field
imaging. The method also renders internal background gradients
negligible and is therefore valuable for very heterogeneous (e.g.
porous) materials, as in this thesis, and those exhibiting large
paramagnetic susceptibility. This method has provided the best
resolution to date, but is very slow and requires physical movement
(translation and rotation for three dimensional imaging) of the
specimen. Techniques are now reasonably well developed but await
exploitation for serious materials investigation.
100

Whilst three dimensional imaging information can be acquired by the
methods outlined above, the data is generally displayed in a two
dimensional format, and thus a plane is defined whose data is gathered
and whose image is so displayed. Three dimensional images are built
up plane by plane and by means of computer manipulation and graphical
techniques a range of data for many planes is built up and can be
displayed as a three dimensional projection in a two dimensional
format. Further manipulation can result in other aspects or
orientations and planes in alternative axes.
Gathering data to enable the production of such an image takes an
appreciable time, several tens of minutes, depending upon the
resolution and definition required. This necessitates a reasonably
static subject. Rhythmic processes such as beating of the heart can be
observed if the data gathering can be synchronised with the process.
To produce such an image the subject must be placed in a strong
magnetic field and subjected to rapid changes in field gradient and to
strong short radio frequency pulses. This has not been found to have
any adverse effects upon human tissue and metabolism, and is thus in
this respect far superior to X-ray examination and imaging.
101
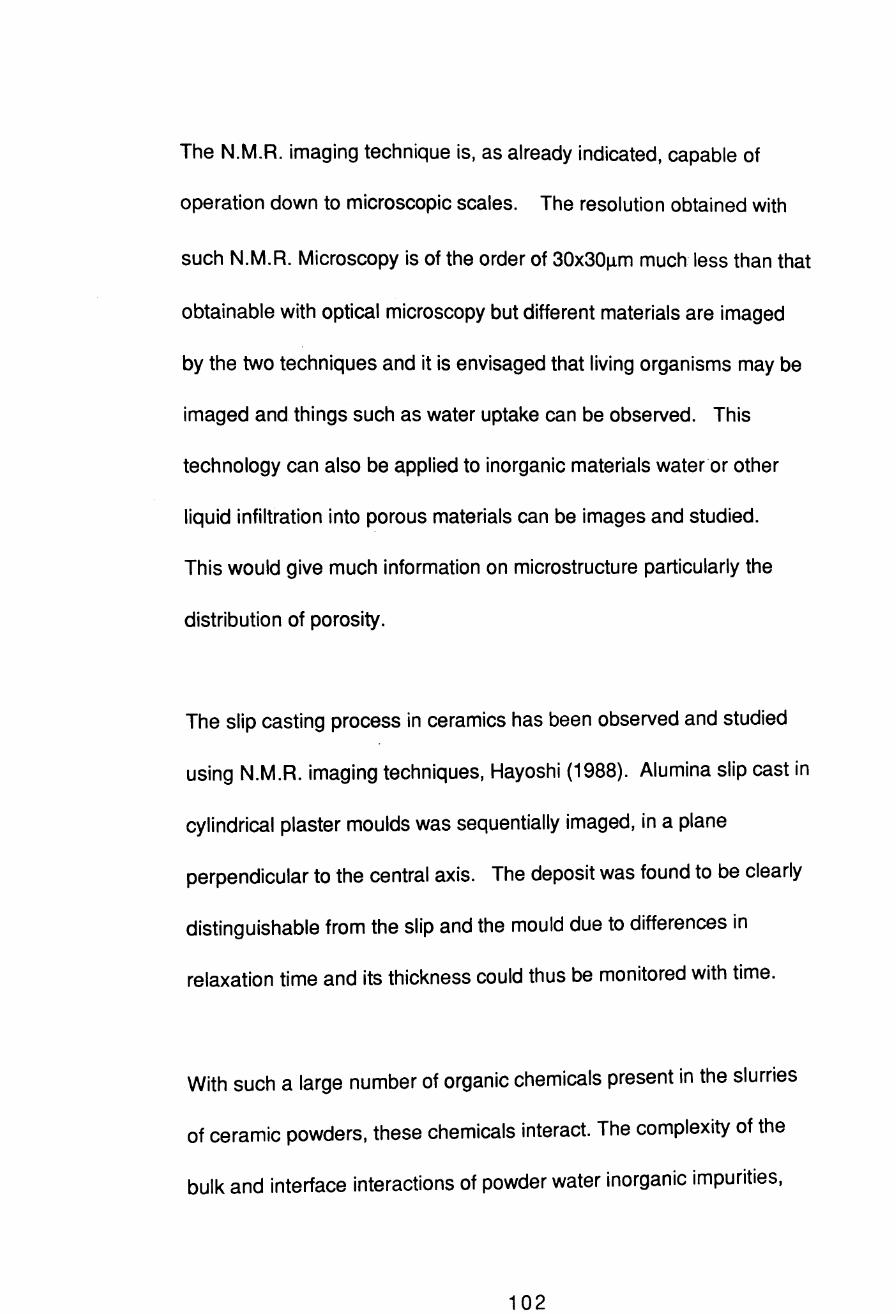
The N.M.R. imaging technique is, as already indicated, capable of
operation down to microscopic scales. The resolution obtained with
such N.M.R. Microscopy is of the order of 30x30~m much less than that
obtainable with optical microscopy but different materials are imaged
by the two techniques and it is envisaged that living organisms may be
imaged and things such as water uptake can be observed. This
technology can also be applied to inorganic materials water or other
liquid infiltration into porous materials can be images and studied.
This would give much information on microstructure particularly the
distribution of porosity.
The slip casting process in ceramics has been observed and studied
using N.M.R. imaging techniques, Hayoshi (1988). Alumina slip cast in
cylindrical plaster moulds was sequentially imaged, in a plane
perpendicular to the central axis. The deposit was found to be clearly
distinguishable from the slip and the mould due to differences in
relaxation time and its thickness could thus be monitored with time.
With such a large number of organic chemicals present in the slurries
of ceramic powders, these chemicals interact. The complexity of the
bulk and interface interactions of powder water inorganic impurities,
102
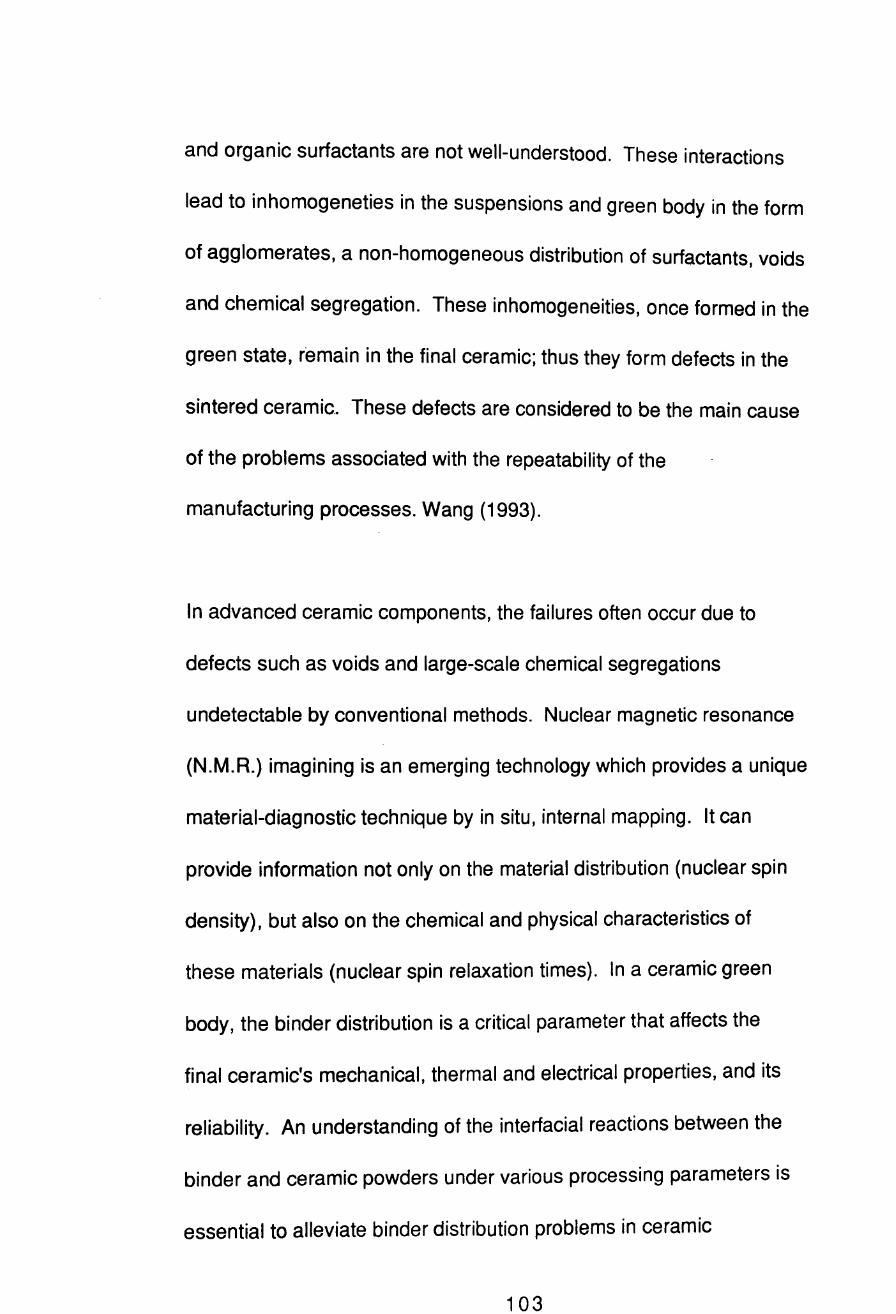
and organic surfactants are not well-understood. These interactions
lead to inhomogeneties in the suspensions and green body in the form
of agglomerates, a non-homogeneous distribution of surfactants, voids
and chemical segregation. These inhomogeneities, once formed in the
green state, remain in the final ceramic; thus they form defects in the
sintered ceramic. These defects are considered to be the main cause
of the problems associated with the repeatability of the
manufacturing processes. Wang (1993).
In advanced ceramic components, the failures often occur due to
defects such as voids and large-scale chemical segregations
undetectable by conventional methods. Nuclear magnetic resonance
(N.M.R.) imagining is an emerging technology which provides a unique
material-diagnostic technique by in situ, internal mapping. It can
provide information not only on the material distribution (nuclear spin
density), but also on the chemical and physical characteristics of
these materials (nuclear spin relaxation times). In a ceramic green
body, the binder distribution is a critical parameter that affects the
final ceramic's mechanical, thermal and electrical properties, and its
reliability. An understanding of the interfacial reactions between the
binder and ceramic powders under various processing parameters is
essential to alleviate binder distribution problems in ceramic
103
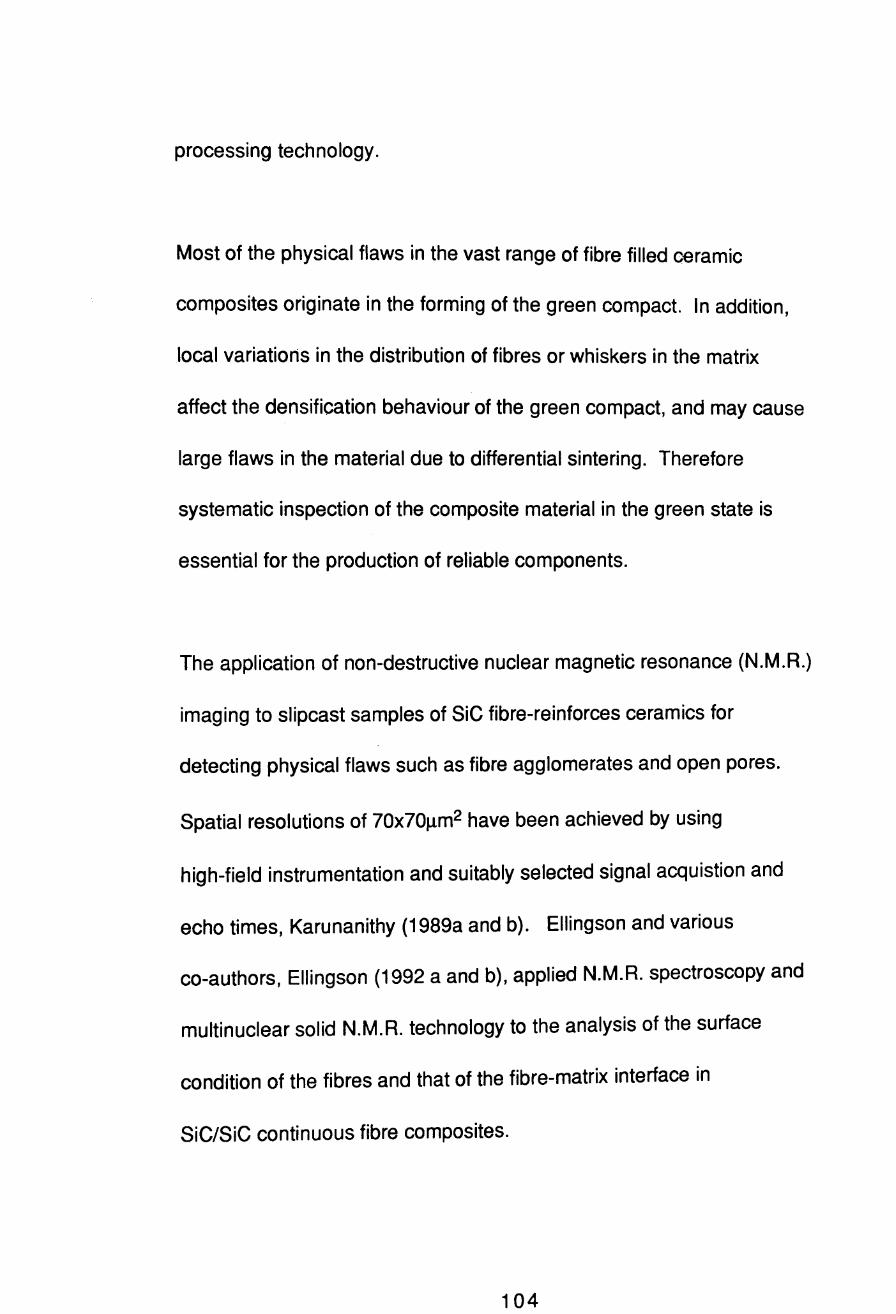
processing technology.
Most of the physical flaws in the vast range of fibre filled ceramic
composites originate in the forming of the green compact. In addition,
local variations in the distribution of fibres or whiskers in the matrix
affect the densification behaviour of the green compact, and may cause
large flaws in the material due to differential sintering. Therefore
systematic inspection of the composite material in the green state is
essential for the production of reliable components.
The application of non-destructive nuclear magnetic resonance (N.M.R.)
imaging to slipcast samples of SiC fibre-reinforces ceramics for
detecting physical flaws such as fibre agglomerates and open pores.
Spatial resolutions of 70x70)lm2 have been achieved by using
high-field instrumentation and suitably selected signal acquistion and
echo times, Karunanithy (1989a and b). Ellingson and various
co-authors, Ellingson (1992 a and b), applied N.M.R. spectroscopy and
multinuclear solid N.M.R. technology to the analysis of the surface
condition of the fibres and that of the fibre-matrix interface in
SiC/SiC continuous fibre composites.
104

N.M.R. imaging has also been used to obtain quantitative information
regarding the bulk distribution of SiC whiskers in whisker-reinforces
ceramics, in addition to detecting other physical flaws such as open
pores or hard inclusions, that may inadvertently be included during
sample preparation. Karunanithy (1991).
The considerable advancements which have been made in the medical
and biological applications have been accomplished because the
samples involved contain water in a mobile state. This is also the
case for the slip casting process and to a lesser extent with green
ceramic artifacts prior to firing, and as indicated some useful
information has been acquired by exploiting this technology. However,
due to the nuclear-dipolar broadening in solids, the development of
N.M.R. imaging for application to solid materials has been difficult.
In hard solids like ceramics the linewidth due to nuclear-dipolar
interaction is often a few thousand times larger than in mobile
samples because of the restriction in atomic motion. Consequently,
line narrowing and large field gradients are two factors critical to a
successful N.M.R. imaging technique for solids.
Considerable efforts have been made to develop various techniques for
105
the improvement of line narrowing in N.M.R. spectroscopy. These
techniques are readily applied to imaging so that a better resolved
solid image can be achieved. They range from the development of a
multiple-pulse sequence to multiple quantum coherence. However,
line broadening still remains as an obstacle to N.M.R. spectroscopy in
solids. Thus a large magnetic-field gradient is required to offset line
broadening for a useful resolution in N.M.R. imaging, Wang (1993).
2.5 SONIC AND ULTRASONIC NONDESTRUCTIVE TESTING AND
EVALUATION.
2.5.1 Acoustic emission.
Acoustic emission (A.E.) differs from the foregoing methods in that it
is not an 'interrogative' technique. It is not possible to examine an
unstressed component or structure, therefore it is necessary to stress
the component in some fashion and monitor cracking which may occur.
When a crack is initiated, a displacement wave is generated which
propagates through the material and may be detected by a sensitive
ultrasound transducer to yield a range of 'A.E. parameters'. Further
emissions occur as the crack propagates. These parameters can be
processed to yield useful information concerning crack damage to
106

ceramics.
Whilst there is considerable scope for developing the technique for
ceramics, attempts to detect cracking or dislocations during the
curing of chemically bonded ceramics, ie listening to the setting
process, were inconclusive due to the lack of a lock out system to
eliminate extraneous noise. Acoustic emission test methods would
provide a way of improving the sensitivity of current proof-testing
methods by providing information of sub-critical flaws.
2.5.2 Acousto ultrasonic methods
The acoustic emission method depends on loading to excite
spontaneous stress waves such as those accompanying plastic
deformation and crack growth. Acousto-ultrasonics, which term may
be taken as a contraction of "acoustic emission simulation with
ultrasonic sources," differs mainly in that benign ultrasonic waves
are generated externally by a pulsed source, usually a piezoelectric
transducer.
The general approach to acousto-ultrasonic testing is the use of a pair
of ultrasonic piezoelectric probes in a send/receive configuration, a
107

pulsed sending probe, optimised for wave generation, and a receiving
probe, optimised for signal sensing. The usual, and often most
convenient, arrangement is to have the probes on the same face - ,
coupJed at normal incidence to the surface of a test piece. The
receiver is displaced by a fixed distance from the sender, and in the
limit of zero separation, this configuration reduces to conventional
pulse-echo ultrasonics. The send-receive transducer pair is usually
moved about as a unit and the test object is scanned to map material
property variations, Vary (1989, 1991).
Acousto-ultrasonics differs from conventional ultrasonic methods
primarily in the nature of the received signal. Once launched inside
the material sample, the pulsed ultrasonic waves are modified by
stochastic processes like those which affect spontaneous acoustic
emissions from internal sources during stressing, deformation, etc.
Moreover, acousto-ultrasonic waves are launched periodically at
predetermined times and with predetermined repetition rates. Thus
instead of well-defined wave reflection and propagation paths, as in
flaw detection, the received signal will be the complex result of
multiple reflections, and interactions with material microstructure
and features, in a volume of material between the sending and
receiving probes. Bulk and guided waves and several types of plate
108
waves can arise and flexural Lamb waves will tend to dominate in
composite panels. In these cases, the wavelength will be comparable
to or less than the major dimensions of the sample, such as thickness.
Pure plate or Lamb waves are unlikely because wave generation is is
broadband pulsing, not long-duration, single-frequency. Moreover,
lamina and fibre-matrix interfaces will break up the wave-propagation
paths, thus producing stochastic wave propagation, which is desirable
because it ensures repeated wave interactions with microstructural
features and diffuse flaws. For composite panels, this means that
overlapping, scattered, and mode converted signals will arrive at the
receiver.
Selection of the sending transducer centre frequency and the receiving
transducer bandwidth and sensitivity are pivotal to successful
evaluation. For composite panels, it is advantageous for the sender
to produce wavelengths which are less than the thickness. This is to
ensure that there are multiple wave interactions with diffuse flaws
and microstructural features within the test volume. This may also
entail high ultrasonic frequencies which are quite strongly attenuated,
and the receiver must therefore be very sensitive, and have a
bandwidth covering all of the frequencies passed by the sample.
109

For many graphite fibre polymer matrix composite laminates both the
sender and receiver may be broadband 2MHz transducers. A bandwidth
of about 1 MHz may be adequate to characterise these materials,
however, experimental determination of appropriate transducer
properties should be made for each new structure. In highly
attenuating materials the receiver may need to be a sensitive
transducer of the type used for detecting acoustic emissions.
The acousto-ultrasonic technique depends strongly on establishing
reproducible probe coupling. Otherwise, signal modulations due to
material variations become confused with those due to coupling
variations. Probes are usually coupled to a surface with a thin film
of fluid, such as glycer~n, gel, silicone grease, and shear wave
couplants, and sufficient pressure must be applied to eliminate
unwanted reverberations within the couplant. In addition, deleterious
effects of surface roughness must be overcome. Similar precautions
are needed with dry coupling which usually involves a thin elastomer
buffer, e.g. silicone rubber, bonded to the transducer wearplate.
There are obvious disadvantages to the intermittent contact required
with direct coupled (dry or liquid) probes. The potential need to scan
large surface areas demands probes that can be readily moved about.
110

Using probes with the piezoelectric crystal mounted in the hub of a
rubber-rimmed wheel allows continuous rolling contact scanning,
rather than simply lifting and repositioning the probes. Even then,
great care has to be taken to ensure that coupling variations are
insignificant. .
The prospect of contactless laser probes, particularly for scanning
large complex surfaces, is very attractive. However the use of lasers
to excite and acquire acousto-ultrasonic signals does not eliminate
potential coupling problems because the signals are still influenced by
surface roughness and also emissivity, reflectivity, and other thermal
and optical factors.
In acousto-ultrasonics, quantification of information contained in the
simulated stress wave is achieved by calculating a stress wave factor
(S.W.F.). There are many ways to define and calculate the S.W.F. and
this definition, in any particular case, depends on the nature of the
signal, test piece (including material, size, and shape), types of flaws,
damage states, and the nature of the mechanical properties to be
assessed.
Because acousto-ultrasonic signals often resemble acoustic emission
burst waveforms, it has been found to be practical to use
111
signal-analysis methods based on acoustic emission practice. For
example, time domain quantities such as rise time, peak voltage,
voltage decay or ringdown count, and root-mean-square voltage values
tend to correlate with defect states and material properties.
Spectrum analysis and statistical analysis on spectral mean values,
second and third. moments etc. can also form a basis for defining the
S.W.F.
The techniques described above have been applied to various materials
and situations including damage assessment of composites, Talreja
(1989), monitoring thermal shock damage in alumina and zirconia
toughened alumina, Konsztowicz (1990), Thompson (1991), porosity in
glass systems, Aduda (1996), evaluation of cement quality in oil well
installations, Gai (1993), modelling the mechanical responses of
ceramic composites, Kautz (1989), Tiwari (1995), and the monitoring
the effects of inclusions in glasses, Jen (1996).
Flaws common to ceramics such as inhomogeneities microcracks and
voids together with poor interphase bonding, delaminations and
disbonds, which are particularly problematical in ceramic composite
materials, lead to a decrease in stress wave energy transmission.
Acousto ultrasonic techniques have the potential to detect and
iiI)
measure the sate of defect or damage in a material and thus offer a
means of detecting the effects of these properties nondestructively.
Das et al have explored the potential of acousto ultrasonics to
evaluate in a nondestructive manner the condition of aluminosilicate
castable refactories based on fireclay grog and calcium aluminate
cement subjected to thermal shock damage, Das (1991). These authors
calculated a stress wave factor, and considered this as a measure of
the efficiency of the stress wave energy transmission in thermally
stressed material, and thus an indication of the continuous propagation
of cracks in the cementitious materials.
These materials have much in common with the materials studied
herein and these techniques could well prove useful in future N.D.E.
strategies.
2.5.3 Resonant freQuency techniQues.
Many solids, including ceramics and composites can be made to
resonate mechanically by vibrating them at specific frequencies
depending on their physical properties and geometry. The resulting
1 1 ~
spectrum of mechanical resonances contains a wealth of information
about the sample's elastic properties, internal friction, structural
integrity, and shape. With a recently developed technique called
resonant ultrasound spectroscopy (R.U.S.), developed at Los Alamos
National Laboratory, this information can be accurately obtained in a
single measurement, Migliori (1993), Maynard (1996). This is of
particular importance for the characterisation and nondestructive
evaluation of many advanced materials such as polycrystaline
ceramics, single-crystal materials, and anistotropic composites,
which typically have more than one pair of elastic moduli. To fully
characterise these materials using conventional dynamic modulus
measurement systems, such as pulse echo techniques, requires
multiple laborious tests on large samples, which are not always
available.
An R.U.S. measurement is capable of the determination of all elastic
moduli of very small (0.001 cm3), possibly anisotropic, samples from
1 .5-600 K. In addition, information is obtained concerning
dimensional errors. Most simple solids require only two parameters
to fully describe their elastic responses. Typical pairs of parameters
include, for example, Young's modulus and the shear modulus, the bulk
modulus and Young's modulus, or Poisson's ratio and the shear modulus ..
114

However, many anisotropic materials require more than two
parameters to adequately characterise their elastic response.
To make a measurement, the samples are first polished or otherwise
shaped into rectangular parallelepipeds, right circular cylinders, or
spheres with tolerances for parallelism, roundness, and the like, of
about 0.10/0. Such tolerances are readily obtained using an ordinary
milling machine or surface grinder. The shaped sample is then
mounted between two diamond/lithium niobate composite ultrasonic
transducers, thus forming, in effect, an electromechanical bandpass
filter for which sample resonances determine the pass frequencies.
Optimal results are obtained if the sample contacts the transducers
only at its corners and if the contact force is less than 10-3 N. The
transducers are specially designed for this application. Coupling
fluids are not required, an advantage where samples are porous or
affected by water ingress, and the low contact pressures would be
essential for weaker materials in the earlier stages of processing.
This dry edge- or point-contact mount also eliminates any transducer
bond correction or bond failures at nonambient temperatures.
The transfer function of the transducer/sample assembly (essentially
it is sharply peaked at each resonance) is measured using an
11 5
automated, stepped, thermal-noise-limited superheterodyne detection
system also designed specifically for this application. For maximum
accuracy, processing algorithms are used to determine the centre
frequencies and widths of each peak by using all the data points that
trace out the peak shape.
The measured frequencies of the peak or resonances of the sample are
determined by its geometry, density, and elastic moduli. Computer
codes based on novel non-finite-element methods were developed to
determine the resonance spectra for rectangular parallelepipeds,
spheres and cylinders. These codes take very little computational
time while providing high accuracy compared with conventional
finite-element computational methods.
However, the inverse problem of finding moduli from resonances is
much more difficult, particularly if some resonances are missed or if
the sample has dimensional errors or high ultrasonic attenuation. The
solution requires a sophisticated multidimensional non-linear
optimisation scheme in which the elastic moduli are varied until the
difference between the measured and fitted frequencies is made as
small as possible.
116
Carbon-carbon (C/C) composites are particularly suitable for
structural applications in high temperature environments. In
comparison to conventional composites, the fabrication process of CIC
composites is rather complex, due to the multiple steps involved in the
carbonisation' and densification cycles that the composite is subjected
to after the initial, impregnation of graphite fibres with the matrix
precursor. While going through these cycles, the composite's
microstructure and properties change resulting in the formation of a
composite with wide ranging mechanical, physical and thermal
properties.
In practice, the change in density of the composite during processing
is used as an indicator of the change in material condition. An
increase in density directly corresponds to an improvement of
mechanical properties. Such an evaluation does not account for
potentially problematical, localised variations in the material
microstructure. Density variation is normally measured using
destructive techniques, which are time consuming and expensive.
There is hence a definite need to consider alternative means of
assessing the integrity of CIC composites during the processing
stages. The effectiveness of nondestructive vibration-based
measurements in determining the changes in microstructure and
11 7

mechanical properties that occur during the processing of CIC
composites has been demonstrated by Vaidya and Raju. The
vibration-based parameters used by these authors were III ate rial
damping and resonance frequency, Vaidya (1994).
In their technique, beam specimens were mounted at their geometric
centre on an impedance head connected to an electrodynamic exciter,
driven by a random noise generator. After the first carbonisation and
densification cycle, the resonance frequency value increased and was
found to be close to the value for the cured composite. In the
successive processing cycles, the resonance frequency decreased with
each carbonisation cycle while it recovered to higher values,
approximating those ascertained for the cured composite with each
densification cycle. After the fifth carbonisation cycle, it was
observed that the values of the resonance frequencies did not change
notably.
Measurements of damping were performed at the first four flexural
modes of the specimens. For all processing stages of the composite,
damping ratio values were found to be higher at higher flexural modes.
The density of the composite was found to have decreased when
compared to its value obtained in the previous stage, with each
118
carbonisation cycle, and was found to increase after each
densification cycle. The maximum density attained at the fifth
carbonisation cycle did not alter notably with further processing.
The vibration parameters, resonance frequency and damping ratio
values, were found to be useful in determining changes in the material
during processing. A strong qualitative correlation between different
parameters, namely density, dynamic modulus, resonance frequency
and microstructural changes of the composite during processing, was
observed.
Another, apparently more simple, resonant frequency technique, J.W.
Lemmen's grindosonic technique is an easily applied resonant
frequency test using a point contact probe, again requiring no couplant.
The specimen is set into various modes of vibration mechanically, by a
blow from a suitable small hammer or rod, Wolfenden (1989), Lemmens
(1991). The force of the blow is of such low magnitude that the
stresses produced lie well within the tolerance of the materials. Any
components damaged by such low levels of stress would be unfit for
service and thus this risk of damage is of no consequence. The system
determines the resonant frequency of vibration, and given the
necessary parameters, of suitable cuboidal specimens, or other simple
119
regular geometric forms, the on board computer system gives a display
of velocity. Both shear and compressional velocities, and hence
elastic moduli, can be determined, and displayed, depending on the
relationship between the point transducer and the location of the
hammer blow.
For more complex shapes the system is applicable for a rapid pass/fail
test based on experimentally determined parameters using specimens
known to be of good and poor quality. Such a technique can be applied
rapidly, by persons with minimal training, and a 100% testing of all
components can be achieved at minimal cost. Indeed the level of
expertise applied by selectors in the whitewares industry, tapping and
listening to the sound produced and visually inspecting the pieces,
exceeds that required for what is a much less subjective test.
There is currently much interest in the use of various thin film
coatings, diamond for example, applied by chemical vapour deposition
and sputtering etc. for various purposes. Such coatings are frequently
impure, porous, of an unwanted phase, eg graphite rather than diamond,
or otherwise imperfect. An important requirement in the application
of such technology is a suitable means of characterisation, difficult
when dealing with a coating. A measurement of the elastic constants
120
of a film would be ideal since all of the above faults would reduce the
stiffness and affect their values. Theoretically the ultrasonic
resonances in various modes can be manipulated mathematically to
yield such a range of elastic moduli values, Kawishima {1992}.
Chandra and' Clyne report on a simple method of measurement of these
resonance values, by means of the Grindo-sonic equipment, on elongate
subsrate samples before and after deposition of such coatings, with
some success.
2.5.4 Ultrasonic testing.
To take a simplistic view at this stage, the velocity of sound in a solid
material is a function of the square root of the ratio of an appropriate
modulus of elasticity, E, to its density. Various relationships which
can be used for the determination of the moduli of elasticity and
Poisson's ratio, and hence as a means of checking the quality of the
material, are discussed in chapter 3.
The apparatus generates a pulse of vibrations at an ultrasonic
frequency which are transmitted by an electro-acoustic transducer
held in contact with the surface of the sample under test. After
121
propagating through the material, the vibrations modified by their
interactions with it, are received and converted to an electrical signal
by a second electro-acoustic transducer, or the same transducer in
many cases. The signal is fed through an amplifier to a cathode-ray
oscilloscope for display and interpretation, or to data logging and
other circuitry for more stringent analysis. The time taken by the
pulse to travel through the material is measured by an electrical
timing-unit with an accuracy of 0.1 f.lS or better, and, knowing the
length of path travelled through the material, the pulse velocity can be
calculated.
It is necessary to have a high-energy pulse of vibrations to give a
sharp onset waveform because the boundaries of the various material
phases within the material cause the pulse to be reflected and
weakened. At any interface mode conversions occur such that
longitudinal or compressional waves, transverse or shear waves, and
surface waves may all be produced. These may be monitored and data
used to increase the range of parameters generated, see chapter 3.6.
For maximum sensitivity, the leading edge of the longitudinal waves is
detected by a receiving transducer located on the face of the material
122
opposite to the emitting transducer; this is direct transmission, and is
sometimes referred to as the pitch and catch method. An alternative
method requires only one transducer, which operates as the
transmitter and the receiver alternately, and interrogates the material
by its interaction with the sound passing through the material twice,
following reflection from the far boundary, or indeed any intermediate
boundary. This method, often referred to as the pulse-echo method,
gives extra information, particularly in relation to defect size and
location, and can be used when access to two opposite sides of a
specimen is not possible. The disadvantage of this method is that the
energy received is lower than with direct transmission, and in grainy
materials with poor propagation properties, such as the material with
which this thesis is primarily concerned, noise due to backscatter can
mask the doubly attenuated signal, making interpretation very
difficult.
The basic ultrasonic pulse velocity apparatus is shown in figure 2.2
and more specific details and diagrams of the equipment employed
during this research work are given in chapter 6.2.
In the case of cementitious materials both lack of compaction and a
change in the water/cement, or other component ratios can be
123
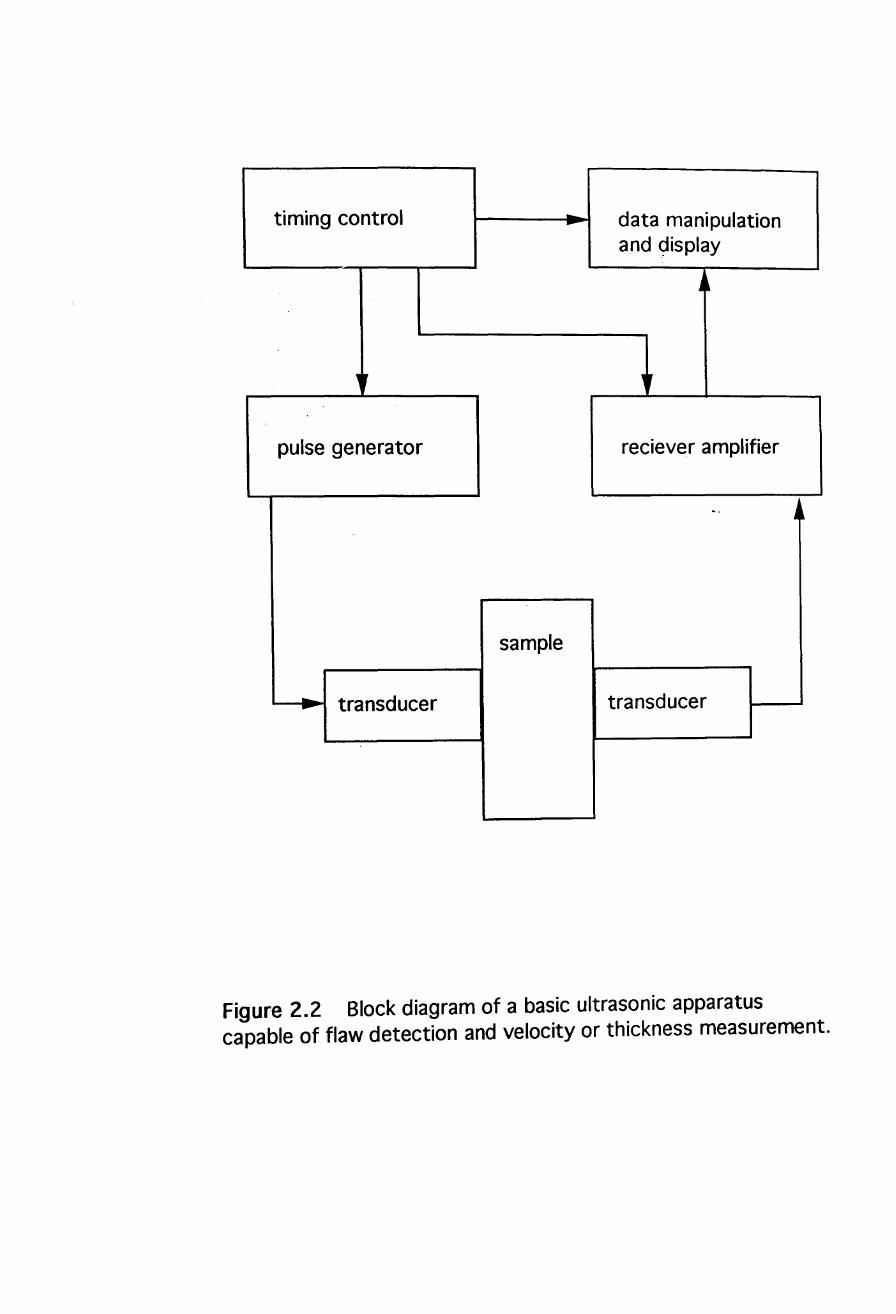
timing control
'f
pulse generator
-.. transducer
--- data manipulation and 9isplay
reciever amplifier
sample
transducer
Figure 2.2 Block diagram of a basic ultrasonic apparatus capable of flaw detection and velocity or thickness measurement.
detected. Unfortunately the pulse velocity is difficult to apply as a
general indicator of compressive strength because, for example, the
type and grade of aggregate or filler and its content in concrete
greatly influence the relationship between the pulse velocity and
strength. Other factors affecting the relationship are the moisture
content, age, presence of reinforcement and temperature. The pulse
velocity technique finds important applications in bulk concretes for
the detection of crack development in structures such as dams, and
checking for deterioration due to frost or chemical action.
For fine or engineering ceramics ultrasonic tests offer the most
promising methods for inspection of ceramics. Such fine ceramics
have a lower attenuation coefficient for ultrasound than metals,
though this is not the case for traditional ceramics and far from the
situation with regard to the chemically bonded ceramics with which
this thesis is concerned. The high impedance mismatch between voids
and the surrounding ceramic material ensures high reflectivity of
incident ultrasound pulses, although planar defects must lie in a plane
near the perpendicular to the sound beam axis if they are to be
detected. To refract the sound beam into a ceramic accurately is
more difficult than with metals. The high acoustic velocity in
ceramics angles the refracted beam sharply away from the normal
124

with only small changes in the angle of beam incidence.
2.5.5 Dry coupling techniques.
There are several difficulties associated with the ultrasonic
evaluation of porous ceramic materials, and these are particularly
problematical in green ceramics, or cementitious materials in the
early stages of curing. For example, low-frequency sound waves are
not scattered sufficiently to allow the detection of flaws much
smaller than 1 mm in size, on the other hand, sound waves with
frequencies of 3MHz or greater generally undergo excessive
attenuation in samples in excess of 3mm thick. Also, ordinary
couplants (e.g. water or glycerol) are often absorbed by green
ceramics, this not only mitigates their coupling function, but may also
affect the subsequent fabrication process. This problem can be
avoided by using pressure alone to couple the transducer to the
specimen, but great care is required because the applied pressure can
affect the data, or even result in sample breakage, Kupperman, (1984),
Bhardwaj (1990).
In spite of these difficulties, studies of ultrasonic attenuation and
125
acoustic velocity in green ceramics may provide useful information
related to density variations, porosity content, presence of
agglomerates and delaminations, elastic anisotropy, and material
quality in general. Further development of ultrasonic testing
techniques, coupled with signal enhancement techniques, may lead to
improved flaw detection sensitivity.
Dry coupling probes usually consist of a conventional transducer with
a piezoelectric element and a plastic material in front of it which
allows for a good sound transmission into the object under test. This
plastic material must be selected carefully to achieve optimal probe
features. Whereas at the transducer side it can be coupled by a fluid,
on the side of the test object it must give good ultrasonic contact
without any coupling medium. Therefore, the plastic material must be
soft to conform closely to the surface of the test object by slight
pressure, it must have low acoustic attenuation, and it must be strong
enough not to wear off or to deform significantly under pressure. A
soft silicon rubber was found to meet all the above mentioned
conditions, and it can be cast into any shape and then fixed in front of
the transducer by suitable means.
The dry coupling probes have been developed for three different types
of operation: one single crystal probe in pulse echo mode; two single
126

crystal probes in through-transmission; and a twin crystal probe in
pulse echo mode.
For normal incidence, the single crystal transducer has a silicon
rubber delay line fixed to its emitting surface which is coupled to the
transducer by a thin oil film. The delay line causes good near surface
resolution, as the interface echo becomes small, when the probe is
coupled to a material of low acoustic impedance. For the
transmission of angle beams, a standard angle beam transducer is
equipped with a thin foil of silicon rubber at its contact surface. The
foil is also coupled with oil to the transducer and does not change its
original angle of incidence.
These probes with a fixed delay line or foil can be used only for
measuring at discrete points as the friction of the silicon rubber on
the surface under test is normally too large to scan the probe
continuously. A much better performance is obtained by the
application of wheel-type probes. In such wheel probes, an ultrasonic
transducer is placed inside the wheel and a thin oil film couples the
sound to a special tyre on the wheel. The tyre is manufactured from
silicon rubber and is sealed against a rim. The tyre is sufficiently
soft to give a flat contact to the object under test for the whole
127

active area of the transducer, when the wheel probe is slightly pressed
down. Using two of these wheel probes and arranging them properly in
a fixture on both sides of the test specimen, a continuous_scanning in
through-transmission is easily accomplished. The diameter of the
wheel for a 1 MHz probe is about 50mm and the width of the tyre is
12mm.
If the access to the material under test is only possible from one side
and continuous scanning with good near surface resolution is required,
then a dual crystal, wheel probe is the best solution. This type of
probe consists of dual transducer elements inside the wheel which has
its acoustic barrier arranged perpendicularly to the wheel axis. Care
must be taken to ensure that the acoustic isolation between the
transmitter and receiver crystals is not impaired by the tyre in front
of the dual element transducer. With good design, the crosstalk level
could be kept sufficiently low to detect small delaminations close to
the surface of the test object. The wheel diameter of a 4MHz probe is
likely to be around 50mm and the width of the tyre is likely to be
around 20 mm.
Attempts to link the pertinent material properties of finished sintered
ceramics to those of the green formed piece have been made in order to
128
enable manufacturers to eliminate poorly formed pieces prior to
further costly processing, Jones (1985). Kulkarni, (1994a, 1994 b).
In order to avoid sample contamination by couplant absorption these
authors deve~oped dry coupling techniques for both longitudinal and
shear waves, using an elastomer as a coupling agent, thereby
considerably reducing the applied pressure, from the values required
by Kupperman, to acceptable values, which are well within the
tolerance of the material. Order magnitude differences were thus
observed between green and sintered materials. The presence of hard
agglomerates could be detected in the green and partially densified
states, but not in the fully dense state, Jones (1986).
Paper products can be affected by liquid couplants more severely than
ceramics thus prompting the use of dry contacted techniques, one of
which, the use of fluid filled wheel probes offers the prospect of easy
examination of large structures and possibly a technology transfer to
the monitoring of tape cast ceramic substitutes etc. Brodeur (1994).
In this technique probes are set in the centres of fluid filled flexible
rubber tyres as described previously, a pair of matched probes being
placed on opposite sides of the paper sheet.
129
The data collection techniques and subsequent analysis effectively
eliminate the tyre thickness and fluid thickness. This technique could
be modified to examine cast tapes and a single probe method could be
applied to the scanning of larger ceramic and cement structures where
access is available on one side only.
As an alternative to techniques involving dry contact probes it is
possible to protect the material using some kind of impermeable
barrier. Initial evaluation on the phosphate bonded samples was
effected with a grease as the couplant, which then became a barrier
and thus enabled the use of aqueous gel couplants. However this
altered the surface of these samples and could not be considered truly
nondestructive, and is certainly not noninvasive.
Some success has been achieved in coupling ultrasonic transducers to
alumina samples using a fluid couplant and an adhesive tape as a
barrier, Yamanaka (1988).
This method was indeed tried, but with little success because the
surfaces of the samples were not sufficiently smooth to eliminate any
air gap, the attenuation in the signal was thus too high for adequate
130
sound propagation.
Another barrier technique involving the packaging of the sample in an
evacuated polymer film enclosure has been developed, Roberts (1987),
Fraser (1991). This enables fluid coupling and even immersion
techniques to be applied. The disadvantage is the inability to package
large items and monolithic castings.
Dry contact probes have also been used for ultrasonic C-scan imaging,
for moisture sensitive aerospace components where moisture
contamination could adversely affect the material properties, Rogofski
(1991 ).
Amorphous silicone based gels are acoustically similar to water yet
sufficiently rigid to maintain a shape and remain non wetting. These
can be used as couplants for ultrasonic transducers, particularly
where aqueous couplants are inapropreate in porous materials and
materials prone to such degradation in the presence of water. This
method of coupling thus lends itself to examination of green ceramics,
porous ceramics and chemically bonded ceramics prone to such
degradation as indeed are the phosphate bonded materials in this study.
131
This silicon gel coupling medium can be applied to C-Scan techniques
whereby a block or sheet of the silicon material is placed in contact
with the porous ceramic material. The probe is coupled to this
material with a thin layer of aqueous couplant in order to allow sliding
contact during scanning, Wright (1995).
As already mentioned grease was used but found to be messy and
difficult to remove from the sample. Some types of rubber were
tested but the signal attenuation was increased in comparison to
grease. Silicon sealing mastic was found to be the best of these
materials in this respect. It was decided that whilst messy grease
worked well in the first instance, subsequently it was possible to
utilise aqueous couplants with the remnant layer of grease acting as a
surface barrier preventing fluid absorption. However for a production
situation the silicone couplant would probably be preferable as grease
would be unacceptable. Finished samples with surface coatings would
not present such problems and aqueous gels would suffice.
Capacitance transducers have been developed as receiving transducers,
Hutchins (1985), whereby the probe is one plate of a capacitor. This
is located above the material under evaluation any ultrasonic
displacements adjust the air gap and hence the capacitance of the
132

system.
The air gap capacitance transducer has more recently been
demonstrated to act as a generator of ultrasound, and contrary to
popular belief has been shown by Schindel and Hutchins to be capable
of operation with dielectrics, Schindel (1995). The sensitivity with
metals is low and in the case of dielectrics the sensitivity is two
orders of magnitudes less, thus limiting the application possibilities.
2.5.6 Ultrasonic imaging.
Ultrasonic C-scan inspection is an important tool for the NDE of these
structures since it allows high-resolution imaging of subsurface
regions, which would otherwise be inaccessible with the conventional
techniques of optical or scanning electron microscopy.
Essentially, a C-scan image provides a two-dimensional view of a
specimen in which differences in image contrast from the object's
interaction with an impinging acoustic wave.
Various techniques such as ultrasonic holography, interferometry,
133

acousto-optic scattering of light, one and two-dimensional arrays and
scanning laser acoustic microscopy have been used to generate C-scan
images, Gordon,(1993).
The acoustic 'energy is coupled from the transducer into the sample by
a liquid, usually water. A number of techniques to avoid immersion
have been tried, including the use of elastomer probe faces, vacuum
packaging of test specimens in elastomer membranes, Roberts (1987),
and the use of silicon rubber sheets in conjunction with liquid film
couplants, Wright (1995), as discussed in relation to dry coupling
techniques.
Data, in the form of returned signal amplitudes, are collected along a
two-dimensional grid as the transducer is raster-scanned over the
specimen. Electronic gates can be set to extract selected echoes from
the entire return signal, and these data are then used to vary the
intensity on a monitor, which can be printed to paper. Magnification
or reduction can be achieved by scaling the scanning grid.
The sample surface should preferably be smooth to within a
wavelength of the interrogating beam. At high frequencies, this
means that the samples are typically polished to optical flatness.
134

To eliminate inclination problems, many commercial C-scan software
packages offer a surface following routine. This feature can be used
to adjust dynamically the gated return from an inclined sample, so
that variations in path length between the sample and transducer are
removed from the data. Even more sophisticated scanning systems
can control the transducer movement through many degrees of freedom
and enable the transducer to follow curved surfaces. Most such
scanning systems employ guides and actuators enabling movement in
three axes independently or in combination, in the fashion of an
overhead factory crane. Manipulation of the probe to adjust its aspect
to the aspect of the surfaces under scrutiny is also frequently
necessary. Another method of obtaining a scan is by the use of a
serial link robotic arm, after the fashion of a JCB agricultural trench
digging and loading machine. This technique is particularly suited to
mounting on a remotely controlled roving vehicle for NDE of large
structures, Fan (1995).
C-scan systems can be configured in a variety of modes such as a pulse
echo, through transmission, and angle beam using either plane or
focused wave transducers. The pulse echo mode employs a single
transducer to send and to receive an acoustic wave, the image that is
135
developed depends on the variation in acoustic impedance experienced
by the wave.
When the electron gate is set to collect echoes corresponding to a
certain depth, or perhaps an interface, the C-san image becomes a
plane view of a slice of the specimen where the slice thickness is
proportional to the width of the gate.
In the through transmission mode, two con focally (focused) or con
axially (plane) mounted transducers are used, and the image contrast
is derived primarily from differences in attenuation experienced by
the acoustic wave as it passes through the entire sample.
Clearly, if a pulse echo image is made from a back wall reflection,
then the image is analogous to a through-transmission image.
However, in the pulse echo case, the wave has passed through the
sample twice, and is therefore more attenuated, and is more sensitive
to irrelevant sources such as backwall roughness and geometry.
Using high frequency ultrasonic transducers operating at frequencies
of the order of 100MHz, and precision X-Y -Z scanners to give high
resolutions, small ceramic products such as integrated circuit chips
136

and their mountings can be imaged. Such techniques are capable of
imaging disbonds, delaminations and holes with diameters of the order
of 10fJ.m, in ceramic metal interfaces, electrical connections etc. in
such integrated circuit chips, and other composite components, Nonaka
(1989).
Such techniques are also capable of imaging fine porosity in advanced
ceramics such as silicon nitride and silicon carbide, and have been
applied not only as an N.D.T. technique but also as a means of
monitoring the densification as sintering proceeds, Generazio (1989).
Ultrasonic velocity C-scans complement conventional defect and
amplitude C-scans. Velocity scans display elastic modulus variation
caused by non-uniformly distributed microporosity within ceramics.
With composite materials, velocity C-scans can also provide
information concerning percent fibre volume and matrix porosity.
In many cases, the information derived from velocity C-scans cannot
be derived from amplitude C-scans or from radiography. Also,
velocity C-scans are more repeatable and less sensitive to material
surface roughness and transducer frequency than are amplitude
137
C-scans. Furthermore, velocity C-scans often require less calibration
and setup time than amplitude C-scans.
Using a pulse echo technique it is possible to produce longitudinal
wave velocity C-scans in one scanning operation when the test
specimen has uniform thickness. The time of flight is measured
within the specimen, and the ultrasonic velocity is simply twice the
thickness of the part divided by the ultrasonic time of flight. When
the specimen does not have a uniform thickness, the longitudinal-wave
velocity C-scan is produced by dividing a specimen-thickness C-scan
by the time-of-flight C-scan.
Thus when a part has nonuniform thickness, a velocity image cannot be
directly constructed from its time-of-flight C-scan without first
constructing a thickness-variation C-scan. To measure thickness
variation within parts with inhomogeneous composition, the distance
between the transducer and the specimen surface is estimated by
measuring the water-path flight time. Shear wave velocity C-scans
can also be made by rotating the specimen through 30-50° to produce
shear waves by mode conversion.
Combining shear and compressional velocity C-scan data by suitable
computer aided techniques allows the production of C-scan maps of
138
elastic moduli, local material density and elastic module values being
estimated from longitudinal velocity C-scans. Fibre volume fraction
and porosity maps of uniaxial fibre reinforced graphite epoxy
composites have also been produces using dual velocity C-scans. This
technique has been applied to produce velocity C-scans of hot pressed
titanium diboride and sintered silicon carbide, Gruber (1988), Kunerth
(1989).
Ultrasonic velocity C-scans have also been applied to slip cast silicon
nitride ceramics in the green state. This required a dry contract
technique involving a silicon rubber protective layer enabling sliding
contract with a thin layer of couplant, Wright (1993, 1995)
Progress in ultrasonic imaging depends not only on the advancement of
ultrasonic techniques and technology but also upon advancement in
signal processing and computer technology. Such techniques serve to
enhance the image whilst maintaining processing times at reasonable
values. Scanning can be eliminated by the use of transducer arrays at
the expense of more complex processing techniques with algorithms to
reduce the processing time, Ozaki (1987), Paradis (1987).
Other workers have applied these techniques towards enhanced images,
optimising the ultrasonic techniques employed and using more
139

effective processing techniques to derive more information from
fewer data taken over reduced times, Crostack (1987), Hanstead
(1987).
2.5.7 Laser generation and detection of ultrasound.
Recently much effort has been expended on the development of lasers
as sources and receivers for nonconducting ultrasonic measurements.
Telschow (1990a). In order to use ultrasonics for characterisation of
microstructural features in ceramics, high frequencies (short
wavelengths) must be employed to obtain sufficient scattering from
the often small grains and porosity. Also it is often necessary to have
highly distinguishable features in the ultrasonic waveform to use for
velocity and attenuation measurements, such as well separated wave
pulses or sharp spikes. When a pulsed laser is used to generate
ultrasonic waves in solids by the thermoelastic mechanism, the
resulting elastic displacement waveform is wideband, and contains
such distinct features only at the times of arrival of the longitudinal
and transverse components of the initial thermal expansion.
The use of laser ablation as an ultrasound source produces a high
amplitude, sharp spike waveform with large bandwidth, which appears
140

at the longitudinal arrival time. This spike is readily used for both
velocity and attenuation measurements. Unfortunately the ablation
method can cause surface damage, although sometimes this can be
alleviated by ablating a surface coating, such as oil, from the sample.
However, this is not always feasible, especially in the processing
environment, where the noncontacting nature of the laser ultrasonic
technique is particularly useful, and may well be the major
consideration in the choice of this method.
Under appropriate conditions, a small, but relatively sharp, spike has
been observed involving only the thermoelastic generation regime. The
source of this spike, which has been termed a precursor, has been
attributed to thermal diffusion from the source point. Dewhurst
(1982). This was verified by doyle who provided a qualitative
explanation for its occurrence, Doyle (1986).
Most ceramics have a significant optical penetration depth, which
alters the thermoelastic generation mechanism. This can be used to
advantage. Thermoelastic generation at the surface produces an
elastic wave radiation pattern with large directionality away from the
surface normal, whereas ablation produces its largest wave motion in
the direction of the surface normal. Therefore, for through
141
transmission or pulse echo measurements the ablation mechanism is
preferred, and is easily produced in ceramics due to their small
thermal diffusivity compared to metals, but at the expense of
undesirable material surface damage. However, in ceramics which
exhibit a large optical penetration depth, the thermoelastic mechanism
itself produces a .significant component of the ultrasonic wave in the
direction of the surface normal because the thermoelastic expansion
extends into the material. This subsurface expansion produces a
significant normal surface motion, Telschow (1990b).
Telschow et al applied laser generation and detection of ultrasound to
the monitoring of sintering of ceramics using a conical, Fabry-Perot
interferometer, to detect the ultrasonic waves on the surface of the
samples. Such a detector is sensitive to the Doppler shift of light,
reflected from the sample surface, which is moving due to the
ultrasonic wave. An argon ion continuous laser was used to illuminate
the sample surface, a small portion of which was diverted for
electronic stabilisation of the Fabry-Perot cavity length with respect
to the laser frequency, such that the operating point was maintained
on the side of the interferometer transmission curve.
The output of the interferometer was detected by a photodiode which
yielded a signal proportional to the frequency shift of the light
142
scattered from the moving surface with respect to the stabilisation
point. The electronic stabilisation corrected for the laser drift and
low frequency instability due to ambient vibrations of the apparatus.
Such a detection scheme is self referencing, i.e., the photodiode signal
originates from the interference of light scattered from the sample
surface and delayed portions of that light within the Fabry-Perot
interferometer. Since all of the optical wavefronts are nearly
identical to those scattered from the sample surface, light from a
relatively large surface area (about 4mm2) including many speckles is
collected efficiently. The detection scheme thus has the sensitivity
required for detection from rough and/or optically diffuse material
surfaces, such as are encountered in ceramic materials in general and
"green" state ceramic materials in particular. Increasing the
detection laser power can compensate for much of the lack of specular
reflection due to this rough sample surfaces
Telschow et al undertook studies of the sintering of zinc oxide,
starting with green state samples which were pressed to
approximately 47% of theoretical density in disks 25mm in diameter
and 8-10mm thick. The green state samples were ablated
significantly by the source laser at the energy levels required for
143

adequate detection signal to noise ratio. Therefore, the ultrasonic
response of the green state samples was recorded with a minimum of
signal averaging, usually 10 pulses.
Their measurements were of the time of flight of longitudinal
ultrasonic waves propagating through the sample, as it sintered. In
order to determine the sample average density from these
measurements, it was necessary to know the sample thickness and the
effect of density and temperature on the ultrasonic velocity. Since
heating in the sintering process generally takes place from the surface
towards the centre, the internal temperature gradient would tend to
cause nonuniform density during the sintering process. The time of
flight of the ultrasonic wave would thus be an average value, over this
nonuniformity, and could not resolve the density variations.
During the sintering process, the ultrasonic measurements could be
used to determine the average density of the sample in real time.
With an assumption of uniform, isotropic shrinkage, the sample
thickness can be taken to be directly dependent on density during
sintering, thus allowing the calculation of both average density and
shrinkage of the sample as it sinters. During sintering, the ultrasonic
time of flight and material dimensions decreased significantly as the
144

material's density and wave velocity increased.
From measurements made on fully sintered samples, these authors
found that the longitudinal wave velocity is essentially temperature
independent (to within 5%) over the range of temperatures from
ambient to 1100 °G. Therefore, no correction for temperature was
considered necessary.
Ultrasonic velocity measurements thus provide a direct measure of the
densification of the material during sintering which can now be easily
and quickly determined by use of the noncontacting laser ultrasonic
measurement of densification. This then allows the direct
monitoring of the sintering process as a function of both time and
temperature.
During investigations on ceramic components at Rolls Royce, using
ultrasonic technology capable of finding defects of the order of 50Jlm,
to a depth of some 25mm, in advanced ceramic material, it was found
that many of the test pieces had experienced cracking during the
actual test process itself, Butcher (1993). This problem was not,
however, confined to locations which had encountered particularly high
stresses during the testing procedure. Significantly, the defects were
145

located at points were the artifact had been clamped, or had been
subjected to a high contact load during the post forming machining
process.
Thus it was assumed that residual stresses developed during the
machining process, and not subsequently relieved were at the root of
the problem. When during the test process, the component had been
heated, the stresses were redistributed, and the material cracked as a
consequence of these differing stresses. The defects were therefore
not, in fact the cracks, but the residual stresses which had caused
them. The crack depths in fact proved modest, not more than 5
microns, but they nevertheless propagated to swiftly cause failure.
Ultrasound and laser technology can be combined to provide an
efficient means of inspection and detection. With ultrasonics it is
possible to fine-tune control of the depth of penetration by altering
the magnitude of the acoustic wavelength. Laser technology, as
discussed above, can generate a high frequency ultrasonic wave of
great constancy,
Thus when a laser is beamed across the surface of the material to be
tested, the acoustic waves which it generates increase in speed over
146
the defective areas. A second laser can be employed to monitor the
increases in wave speed and thereby record the location, depth and
level of residual stress in the material under examination ..
One of the big advantages in using lasers for the propagation of
acoustic waves is that they obviate the need for piezoelectric
materials; sonic energy can be introduced into the test material
directly, avoiding the hazards of inaccuracy which can be encountered
in couplings using more traditional methods. Thus high quality
evidence can be collected with relative simplicity. There have been
other applications of similar techniques to ultrasonic measurements
at high temperatures, see for example Dewhurst (1988).
Linking laser generation and detection of ultrasound with fibre optics
technology could overcome problems associated with the mechanical
vibration of the object under test, control of the ultrasonic beam
characteristics, and ease problems of access in larger components and
structures. Vogel and Bruinsma have discussed such a fibre optic
laser ultrasound system to address these problems and others
associated with imaging techniques, Vogel (1987).
147
2.6 APPLICATION OF NONDESTRUCTIVE TEST METHODS TO CERAMICS.
2.6.1 Nondestructive evaluation of green and sintered ceramics.
Bell, in a review of nondestructive testing of refractories, Bell (1989)
suggests that when embarking upon any kind of programme designed to
improve service performance by materials testing (either destructive
or nondestructive), a clear-minded approach is necessary. NOT can
provide a great deal of interesting information but only some of this is
useful. Basically, there are two approaches which are employed. The
first is to establish which properties are important and then devise a
nondestructive method to measure those directly. A good example is
crack detection by ultrasound.
Such a simplistic approach can seldom be employed and the inference
of an important property from measurement of a related parameter is
much more common. Examples include strength prediction from
resonant frequency measurements, and density estimation from X-ray
or gamma-ray absorption or back-scattering. Such an approach is
clearly much more practicable but requires extensive background
work and theoretical knowledge in order to succeed. The best
results will be obtained where the property measured or inferred is
particularly relevant to the application. Cold crushing strength or
148
flexural test results (frequently referred to as modulus of rupture,
MOR) are often quoted on data sheets supplied by virtually all
manufacturers of ceramic materials. They are clearly of little
relevance for refractory materials designed (and defined) to be used at
high temperatures, and the loading of any component is unlikely to
correspond to that experienced in the flexural test. Such
measurements of "strength" are however widely accepted as a "quality
control parameter", where a value close to the expected value is taken
as indicative that other diverse properties such as density, thermal
conductivity, hot strength, porosity, hardness, will lie within
acceptable bounds. In this way, simple and relatively cheap tests can
be used to gain information about properties which would be much
more difficult to measure. It should be noted that a "strength" value
higher than expected is as indicative of property variation as a value
lower than expected. Furthermore, since in many cases an
improvement in one parameter is obtained at the expense of
detrimental effects upon others, variations above or below accepted
bounds should be treated with equal scepticism. NOT methods
currently available can be indicative of strength, density, crack
location, abrasion resistance, structural integrity and permeability to
149

Bell asserts that in general it is not possible to locate flaws in
refractories by the pulse-echo technique, although many attempts have
been made, including successfully measuring the thickness of paving
flags. Ultrasonic examination undertaken at British Ceramic Research
Ltd (now Ceram Research), using 1 MHz high power signals gave
acceptable results for fired products under ideal conditions, but no
clear back wall echo could be detected with castables. Bell concluded
that this technique was not suitable for use in the field to detect
cracks, voids, etc. The refractories of interest to Bell are very
similar acoustically to the chemically bonded ceramics with which
this thesis is concerned, making his observations particularly
relevant, although I would not altogether dismiss the pulse echo
technique having achieved some success, albeit in small samples.
He observes that correlations between ultrasound velocity and
crushing strength are often very good, and that the technique is
applicable as a control test for strength estimation. Accuracy in
strength estimation can be improved if ultrasound measurements are
combined with density measurements, Reynolds (1984 a).
Cracks and larger defects may be detected by the through transmission
technique, which is more suited to porous grainy materials. There are
two reasons for this, firstly the path length is halved, and secondly,
150

and perhaps more importantly whilst the sound wave is attenuated due
to scattering the scattered sound does not give rise to noise as it does
in the pulse echo technique, where the doubly attenuated·backwall echo
is masked by echoes due to scattered waves returning to the
transducer, now in receiving mode.
Various workers have developed techniques for particular applications,
both for research and quality assurance purposes. Some of these are
briefly discussed below, begining with the use of ultrasonic
techniques to study the slip casting process, through to automated on
line technology.
Slip casting is a commonly used forming technique found throughout
the ceramics industry from earthenware to advanced single oxide and
nitride ceramics. The ceramic material in the form of colloidal
particles is dispersed in water and poured into a mould made of
plaster in most cases. The mould being porous removes the water
from the slip causing a build up of a cake, the square of whose
thickness is proportional to the casting time. The constant of
proportionality is highly variable even from cast to cast in the same
mould. Thus it would be useful to monitor the casting process on line.
This has been accomplished by Hutchins and co authors, using an
1 ~ 1
ultrasonic immersion probe to monitor the thickness of a flat
bottomed cast, Hutchins (1989), Appleton (1991).
The casting thickness as a function of pH was also investigated, this
being a factor on the flocculation or deflocculation state of non-clay
ceramic materials, and thus affects the rheological properties of
immense importance in ceramic casting processes. The cake
structure, porosity and permeability have also been studied by a
similar technique, Haerle (1995).
As already mentioned the immersion probe is immersed in the slip and
monitors the thickness of the bottom section of the cast. In
commercial slip casting process such access is not always possible
and bottom sections are not always flat. It would thus be useful to
monitor the cast thickness from without, though preferably through
the bottom of the mould such that moulds passed over a fixed
transducer as part of an automated controlled sequence in a production
line.
Sintered structural ceramics are susceptible to thermal shock damage
in the form of microcracks which can propagate leading to eventual
failure. There is a critical temperature difference for the initiation
152
of thermal shock damage, beyond which there is an increase in the
severity of the damage with an increase in the magnitude of the
thermal shock, as measured by the magnitude of the abrupt
temperature change. Such thermal shock damage has been estimated
by the use of ·ultrasonic amplitude and shear and compressional
velocity measurements, Hefetz (1992). Elastic anisotropy due to
preferred crack orientation could be estimated along with the critical
temperature difference for the particular material under examination.
Another area of application of ultrasonic NDE is in the detection and
evaluation of surface breaking defects, for example following
machining. Such defects even when very small, 50-100llm, can prove
critical to the survival of highly stressed, specialised components in
crucial situations. These defects are smaller than those deemed to
be critical in similar metal components, due to the different elastic
behaviour of the materials and also to the fact that ceramic
components tend to be developed where metallic components prove to
be inadequate. The machining process whilst problematical in
providing a further source of defects is of great importance in the
production of ceramic materials to precision engineering tolerances.
Ultrasonic investigations on sintered silicon carbide and hot pressed
silicon nitride, using Leaky surface waves, have shown that the
153
probability and ease of detection of such defects depends upon the type
of material under test and the inhomogeneities in the surface, such as
porosity and surface roughness, in relation to the size of the defects . ,
Winterfeld (1993). This type of evaluation tends to require high
frequencies, of the order of 10-1 OOMHz, hence short wavelengths of
the orderof the defect size or smaller, to increase the resolution to
cope with such small defects. However a simple increase in the
ultrasound frequency does not automatically lead to certainty of
location of very small defects, due to the inhomogeneities discussed
above, thus it may be necessary to determine, empirically, the
probability of defect detection for different materials and surface
conditions. Winterfeld et al concluded that that the testing
frequency for surface defect evaluation should be selected such that
it is sufficiently high as to detect the critical defect size with the
required degree of certainty so that an optimal testing frequency is
used.
Whilst a considerable amount of research effort has been applied to
the nondestructive testing of advanced ceramics and composites, and
to the nondestructive evaluation of novel ceramics and composites to
facilitate research into various aspects of their formation, processing
154

and property development there has been comparatively little
development or application in the traditional clay based ceramics, and
this has been largely confined to the refractories sector, Bell (1989).
This is understandable in terms of their cost and non-critical
applications, however since the technology exists, following
development elsewhere, ultrasonic NDE is being applied, increasingly
more frequently and successfully to these materials. Ultrasonic shear
and compressional velocity measurements have been used for the
characterisation of sintered clay based porous ceramic materials, and
the variation in shear and compressional velocity with porosity
determined, Roth (1991), Panakkal (1992). From these the elastic
moduli and poissons ratio were evaluated, and the variation of these
parameters with porosity compared with values derived theoretically
from elasticity and scattering models. The approach of these authors
to these studies was substantially similar to that taken here in
relation to the cementitious materials of interest.
Edwards describes two ultrasonic test systems developed for
inspecting ceramics: a high frequency immersion testing system and a
computerised ultrasonic system, Edwards (1988).
The ultrasonic immersion testing system with a capability for testing
155
ceramic turbine blades employs ultrasound at a frequency of 50 MHz.
Magnification is achieved by spacing the raster scans made by the
probe across the test surface at only 2 Jlm apart and then expanding
the C-Scan image on a video screen. The C-Scan is a sound amplitude
map of the test object created by monitoring the amplitude of a
reference echo from a glass plate placed beneath the object.
Problems with curved specimens, eg turbine blades can be ameliorated
by the use of a computer-controlled scanning table which has three
axes of translational and one of rotational movement.
The computerised ultrasonic test facility has recently been installed
at Toyota Motors to inspect a ceramic precombustion chamber. The
system is totally automated. The components drop on to a turntable
on which they rotate inside an assembly of ultrasonic probes. The
component and probe assembly are immersed in water to give an
ultrasound coupling medium between transducers and component. As
the component rotates, one set of probes moves axially down the
cylindrical sides of the component and another set moves radially
across the flat end surface. The defects sought are pores on the
external and internal surface of diameter greater than 50 Jlm.
Five ultrasonic probes cover the critical areas. They propagate
ultrasound with a frequency of 15 MHz, providing adequate sensitivity
156
to detect small defects. Some are focused and others have collimated
sound beams to improve spatial resolution and reduce echoes from
geometric features in the component.
Control of the test sequence is by computer. The axial scans are made
at 0-5 mm increments. The data are taken from the A-Scan at each
1-60 angular displacement. A total of 19,350 data points is-thereby
collected in 8.8 s. For the radial scans, the increments are 0.25 mm
per revolution with a similar 1.60 angular displacement between
readings of the A-Scan. This results in a further 21,725 data points
acquired in 9.9 s.
The data from each of the five probes are processed and the results
displayed as either a C-Scan image or a line scan. The information
can be used for statistical quality control of the manufacturing
process.
Neither of these techniques, and there are many other examples, would
be applicable to the chemically bonded ceramics of interest as they
are too costly, the envisaged components are too large, they would be
harmed by prolonged exposure to water, and a drying station would be
required.
157

The ultrasonic testing of dense advanced ceramics is generally
accomplished using test equipment operating at frequencies of
10-50MHz. The method is sensitive to most defect types, particularly
planar ones, as long as the sound beam is incident along the normal to
the defect plane. Material properties present few problems because
of the low ultrasound attenuation coefficient. The geometry of the
component can make ultrasound coupling difficult and it may not be
possible to scan over complex surfaces. Defect resolution is poor if
the defect lies within a few microns of the surface. Computer aided
signal processing makes the method suitable for application to on-line
inspection.
2.6.2 Nondestructive evaluation of chemically bonded ceramics.
As technology advances and ceramics enter more critical fields of
application, quality control of their manufacture will become more
important. As part of this quality control, NDT has a role to play but
perhaps more important is nondestructive evaluation (NDE). NDE
extends beyond the physical test methods and includes an evaluation of
all the parameters which affect component performance, both in the
manufacturing processes and the service conditions.
158

The quality of engineering ceramics is generally susceptible to subtle
and minute changes in chemistry and microstructure during processing
and therefore NDE methods with a high level of defect sensitivity are
needed. Chemically bonded ceramics are even more susceptible to
chemical and physical inhomogeneities and variations from day to day
and structure to structure, governed in ways currently poorly
understood, and dependent upon, amongst other factors, moisture
content, humidity, temperature, and process parameters. Conventional
NDT methods cannot provide this level of sensitivity without
considerable refinement of the techniques. This may be accomplished
for example by using microfocus radiography or ultrasonic immersion
tests at frequencies of 50 MHz.
However the most versatile and most promising evaluation techniques
employ ultrasound, with current applications ranging from metallurgy
to maternity and electronics to elephants, why not carbides to
concrete. Ultrasonic test methods are the most sensitive to cracks
and delaminations but clusters of small defects can be difficult to
resolve. By increasing the test frequency, defects of small size can
be detected, but with a loss of penetrating power of sound below the
surface. With porous and grainy materials this is not an option as
159

scattering and wave attenuation become problematical, and limit the
frequencies used to 5MHz and preferably lower.
Ultrasonic techniques have, in fact, been applied to concrete
structures for some three decades or longer, with various reviews and
appraisals, Knab (1983), Reynolds (1984 b). Reynolds concluded that
the degree of correspondence achieved between the simple theoretical
model proposed and the wide range of experimental data presented
shows that attempts to correlate ultrasonic wave velocity or density
measurements with strength are subject to inherent ambiguities.
Where the quality of the aggregate and formulation can be guaranteed
constant these ambiguities may be reducible within acceptable limits
for specific purposes, which is the real object of establishing on-site
correlations. If the types of aggregate present are variable, some
other measurement is needed to narrow the limits and it has been
shown that density is a suitable parameter in this context.
Measurement of density may be made by coring, gamma-ray attenuation
or backscatter, or indirectly by surface rebound tests.
Through transmission ultrasonic pulse measurements for the
nondestructive estimation of concrete strength are performed today
160

in the same manner as they were at their introduction more than 40
years ago. Current pulse velocity measurements, do not therefore
correlate much better with concrete strength than in the past. In
fact, this pulse velocity method, even when used in conjunction with
preestablished calibration curves, is accurate to a degree of 200/0
error. If such a calibration is not available, which is the typical case
in practice, the strength estimates are less reliable because -different
concretes have different calibration curves. This is so because the
pulse velocity is controlled primarily by the young's modulus of the
material and not by its strength and the two parameters are affected
differently by changes in the composition of a concrete. As an
example, the strength of concrete is drastically decreased by
increasing water-cement ratio whilst little change is observed in the
pulse velocity.
This does not mean that there is no relationship between propagation
parameters and concrete strength, but rather that such a relationship
would be quite complex and the details of this have not yet been
established. The view that concrete strength is proportional to the
fourth power of the pulse velocity is an empirical oversimplification
that does not always work, Popovics (1990). The "theoretical" basis
of this simplistic view is that, according to the Poisson's formula, the
161
modulus of elasticity is proportional to the square root of the pulse
velocity. This relationship was obtained from the assumptions that
the material is homogeneous, isotropic and linearly elastic, and
concrete is none of these, thus, the Poisson's formula is not strictly
applicable to concrete. The modulus of elasticity is also assumed, in
an empirical manner, to be proportional to the square root of the
compressive strength of concrete. The combination of these two
formulae gives the spurious fourth power relationship, however it is
not sound practice to combine a theoretical formula with such a rough
empirical formula. Most experimental data do not support any fourth
power relationship between concrete strength and pulse velocity with
acceptable degree of fit, generally a second power is closer. This
means that the pulse velocity method , in the present form, cannot be
used accurately for in-situ determination of concrete strength.
Popovics et al have reviewed these theories, and following
experimental determinations, report their findings. The pulse
velocity in the longitudinal direction of a concrete cylinder differs
from the velocity in the lateral direction, at low velocities the
longitudinal velocities are greater, whereas at high velocities the
lateral velocities exceed the longitudinal velocities. This difference
is more pronounced with lower frequencies, and the pulse velocity in
162

concrete increases with higher frequencies, that is, concrete is a
dispersive material, the dispersive nature of concrete decreasing with
age. This is commensurate with low frequency velocity variations
observed in this study, as discussed elsewhere in this thesis. The
pulse velocity' is also largely independent of the stresses in concrete.
A feature-based computer system can be made applicable to concrete,
and is probably the most promising method of obtaining meaningful
strength evaluations and predictions.
Berthaud discussed and reported on investigations into the possible
correlations between the mechanical and acoustical consequences of
damage in concrete, Berthaud (1990). Microcracks or micropores
either initially existing in the virgin material or created by
mechanical loadings, or chemically in the case of concrete, are
responsible for the strong variations of the elastic constants and
therefore the acoustic properties of the material.
Data was gathered using transducers affixed to specimens under
compressive stresses to monitor the acoustic consequences of
increasing damage levels. To ensure the test to be meaningful for
heterogeneous materials, the size of the specimen must be much larger
than the maximum aggregate size, ratio of 10 being a valid lower

bound. The material must be seen by the wave as homogeneous and
that requires a ultrasonic transducer larger than the maximum
aggregate size, or maximum pore size. The small samples used in the
experimental work reported in this thesis also proved problematical in
this regard.
Our dependence upon the national concrete-based infrastructure is
obvious, as is the fact that many traditional analytical techniques
currently being used have not been adequate in predicting the
premature deterioration of these structures or, in some cases, in
recommending the proper courses of action for remedial action.
Because concrete is of such a complex and dynamic nature, we need to
employ all the means at our disposal in order to understand how it
responds to its environment and to predict how it will perform. Once
we are able to accomplish this, we can use this knowledge to design
concrete structures which do not begin to "self-destruct" after only a
few years of service. Methods and analytical techniques traditionally
developed for materials analysis can be used with excellent results
when evaluating concrete, especially when used in conjunction with
each other. Computer programmes and computer-controlled equipment
designed to maximise and complement each instrument's capabilities
are essential for efficient acquisition of the data, Lee (1992).
164
X and gamma radiography are particularly attractive because of the
directly accessible and quantitative information they yield -about an
object. Unfortunately, the physics of basic film radiography dictates
that the images produced by the passage of x and gamma rays through
an object result in a complete projected view of the object. This may
not be a problem if the object in question is of a homogeneous nature
such as a steel alloy or ceramic. However, in nonhomogeneous
materials such as concrete with emplaced rebar, the images resulting
from this method are often difficult to interpret and do not allow the
investigator to isolate and examine a particular area of interest
within an object.
Computer aided gamma ray tomography is potentially a very powerful
diagnostic tool for the evaluation of concrete and has been used
recently with some success by Lee et al at the Lawrence Livermore
National Laboratory.
Low frequency techniques and equipment developed for concrete
structures would seem promising but difficulties arise with small
samples due to uncertain modes of ultrasound propagation. Low
frequency ultrasonic NDE was therefore considered to be the most
165
promising technique for the chemically bonded ceramics under
investigation, together with radiography for corroboration where
appropriate. It was also decided to attempt to achieve some
understanding of the problems encountered with small specimens at
low frequencies, and to determine the most suitable techniques and
frequencies for routine application in the commercial production of
articles using these materials.
The greatest drawback to ultrasonic methods, however, lies in the
need to couple the transducers ultrasonically to the surface of the
ceramic. This is most satisfactorily accomplished by immersing the
test component in water, which is not always acceptable, and was not
attempted in this study. With the porous samples used, considerable
effort was expended investigating coupling techniques, particularly
for shear wave determinations. The main problem was the absorption
of the couplant into the pores, and the commercial solution to this is
to test the finished product following the application of the surface
coating, despite the increased costs incurred by the coating of
substandard articles.
166
2.7 THE EVALUATION OF ELASTIC MODULI.
Techniques for the measurement of the velocity of sound through a
medium, and the relationships of those velocities to the elastic moduli
and other material properties are discussed in chapter 3.6. The reader
is also referred to the works of Gooberman (1968), Szilard (1982),
Halmshaw (1987) and Kolsky (1963). The moduli so determined apply
to the bulk material rather than to any particular phase and are best
regarded as an effective modulus for multiphase materials. Hashin,
Hashin (1962), and Hashin and Shtrikman, Hashin (1963), considered
composite materials with an assumption of a uniform matrix with
spherical inclusions, homogeneously dispersed in such concentration
as to remain discrete. They viewed each inclusion surrounded by a
section of matrix as two concentric spheres (with conservation of
volume) and considered them to be individual spherical composite
elements in an array of such elements. The volume of matrix
remaining between these elements was considered to be under
constant stress and small strain due to perfect packing of a range of
sizes, see figure 2.3.
Hashin and Shtrikman derived for this idealised system a relationship
between the actual moduli and Poisson's ratio of the matrix and
167
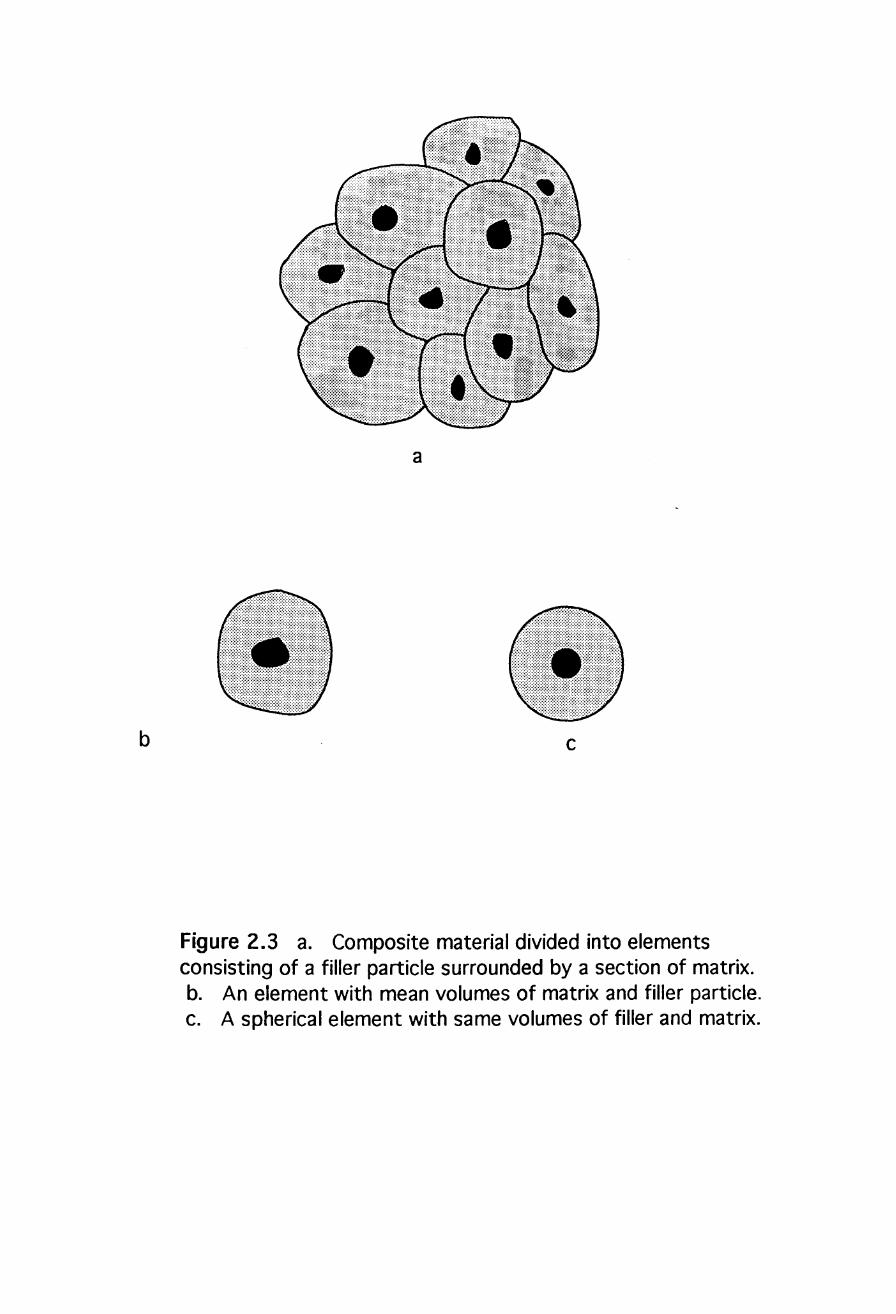
b
a
c
Figure 2.3 a. Composite material divided into elements consisting of a filler particle surrounded by a section of matrix. b. An element with mean volumes of matrix and filler particle. c. A spherical element with same volumes of filler and matrix.
disperse phase, or filler, on the one hand, and the maximum and
minimum values of the effective moduli on the other. Where the
bounds are close together their mean values would, in most cases, be a
close approximation of the effective moduli of the material. Where
this is not sO,.as in the case of the disperse phase and matrix having
very different moduli, the bounds are not suitable for such an
estimate. They would, however, still be useful as an indication of
this fact and would allow inferences as to packing and homogeneity to
be made.
To apply the formulae of Hashin and Shtrikman, discussed in chapter
3.6, it is necessary to know the values of the elastic constants of the
components of the two phase material. For pure materials of known
composition and structure this information may be available in tables
or published literature, otherwise, if samples are available it may be
obtained by measurement. Of course, the elastic data required are
unlikely to be available for obscure crystals, amorphous phases and
solid solutions, all of which are likely reaction products.
It is therefore useful to be able to predict the elastic properties of
polycomponent systems solely from a knowledge of the system
composition, density and well-known tabulated physical properties.
168

Makishima and Mackenzie, Makishima (1973, 1975), proposed
expressions relating the elastic moduli of glasses to the dissociation
energies of the constituent bonds, and the packing density of atoms
expressed as a summation function of their Pauling radii. These
semi-empirical formulae use known elastic data on silicate and borate
glasses.
In an extensive range of papers, O.L. Anderson and co-workers,
Anderson (1965), Soga (1966), Anderson (1971), related the bulk
modulus of isostructural, multicomponent crystalline oxides to the
packing density of atoms, and a summation over the valence charge
products and ionic character of the various bonds. In contrast to the
work of Makishima and Mackenzie, packing density was defined in
, terms of the molar volume per ion pair.
More recently, Bridge and Higazy, Bridge (1986a), proposed a model in
which the elastic moduli of polycomponent oxide glasses were
expressed as a summation over the number of network bonds per unit
volume, the cross-link densities per cation, and the stretching force
constants, for each bond type. The model was tested on a range of
phosphate glasses, the force constants being estimated from
electro negativity data when unknown.
169

The common feature in all of these models is that elastic moduli are ,
in effect, related to the number, and arrangement, of network bonds
per unit volume, and the magnitude of their force constants. In the
Makishima and Mackenzie model, bond dissociation energies are
assumed to correlate with force constants. The models differ
substantially in the calculations required and in the results produced.
Bridge with other co-workers, Bridge (1983, 1986b, 1988a), extended
the range of application of this model and derived a simpler one. In
the model of Bridge and Higazy, Bridge (1986a), the important
variables were the coordination numbers, ie the number of atoms of a
particular species coordinated or bonded with the atom in question,
and first order stretching force constants. There is a linear
dependence of bulk modulus on coordination numbers and all other
interactions as well as nearest neighbour interactions, are subsumed
in the values of stretching force constants to be used in the model.
The experimental values of these constants are therefore the net
results of combined long-range and nearest neighbour interactions.
Long-range effects are thus allowed for in these values which, one
may anticipate, will tend to become smaller with increasing
coordination numbers.
170
2.8 MATERIALS CHARACTERISATION USING ATTENUATION SPECTRA.
For the determination of ultrasound attenuation as a means of material
characterisation Papadakis, Papadakis (1972, 1984), suggested the
use of liquid or solid buffers to separate the specimen and
transducers, as shown in figure 6.3. This not only precluded any
influence of the transducer on signals in the specimen but for this
research provided a useful reference signal through the buffer alone.
A graph of attenuation in the specimen could thus be derived from the
difference between this reference signal, and the signal after
transmission through the specimen, see chapter 7.3 and figures
7.5-7.9.
Reynolds and Smith, Reynolds (1984 a), Smith (1987), developed a
model for the analysis of attenuation spectra based on the accepted
treatment of grain scattering valid in the Rayleigh, stochastic and
diffusive regions. At low frequencies the scattering is proportional
to the fourth power of the frequency, whilst at higher frequencies the
scattering is in direct proportion to the square of the frequency. As
the frequency increases attenuation eventually becomes independent of
the frequency.
171
In this model the frequency at which each scattering mechanism
becomes dominant depends upon the ratio of the grain size to the
wavelength. In the case of a real material with a grain size
distribution about some mean it is possible to observe all three
mechanisms simultaneously at a single frequency within some
frequency range. There will usually also be a frequency range where
all grains will scatter in a fourth power Rayleigh mode.
Reynolds and Smith with other co-authors applied the model to a
variety of metallic systems, Smith (1984), Reynolds (1985), Sayers
(1985) ,to polymers, Reynolds (1986), composites and ceramics,
Smith (1985), Reynolds (1989). It was reported that fibre reinforced
composite materials presented difficulties in measurement and
analysis due to fibre boundary porosity and disbonds.
2.9 ULTRASONIC MONITORING OF CURING.
All of the foregoing discussion on nondestructive evaluation and the
theory behind it is concerned with the analysis of solid specimens
which were chemically inactive, or assumed to be so in view of the
slow rate of reaction in their advanced stage of curing. As previously
172

discussed with cementitious materials the strength develops over a
greater or lesser period as a result of chemical reactions and the
development of elastic moduli can be studied nondestruct~vely. Such
studies were undertaken by Lawrence et ai, Lawrence (1974), who
monitored the sound velocity changes in calcium silicate pastes and
studied the effects upon the reaction kinetics of such pastes
containing various admixtures. The hydration and other types of
chemical reactions involved in the setting and hardening of Portland
cements and other cementitious systems are discussed in chapter
2.1.2. The chemical reactions and phase changes involved in the
preparation and curing processes of the materials studied in this
thesis are considered in detail in chapters 4 and 5.
Further studies were undertaken by Stepisnik et ai, Stepisnik 1981,
who used measurements of the reflection coefficient for ultrasonic
waves to follow hydration kinetics of Portland cement pastes under
various conditions. The development of the shear modulus of
elasticity and dynamic viscosity were determined, together with the
geometry of the grain growth.
These studies inspired the research into the reaction kinetics and
strength development of the newberyite materials under discussion,
173

although the methods employed here differ considerably from those
used by either of the above authors.
174

3. THEORETICAL CONSIDERATIONS.
3.1 TRANSMISSION THROUGH MULTIPLE BOUNDARIES.
A plane wave incident on an interface between two media will have
reflected and 'refracted components governed by the nature of the
interface and the, boundary conditions to be met. The specific
acoustic impedance, l, can be defined as the acoustic pressure, p,
divided by the acoustic velocity, u, such that l = p/u. The first
boundary condition is that the algebraic sum of the acoustic pressures
of the incident and reflected waves, the waves in the first medium, is
equal to the acoustic pressure of the transmitted wave in the second
medium. The second boundary condition is that the algebraic sum of
the particle velocities of the incident and reflected waves is equal to
the particle velocity of the transmitted wave or the media would not
remain in contact. Using subscripts i, rand t to denote values for
incident, reflected and transmitted waves the first condition gives:
and since p = l.u this gives:
(5)
The second condition gives:
u· + u = ut I r (6)
175

Denoting the first medium by subscript 1 and the second medium by
subscript 2 then Zj = Z1 ' Zr· = -Z1 and ~ = Z2.
Multiplying equation (6) by Z1 gives:
Addition of equations (5) and (7) then gives:
ut!uj = 2 Z1/ Z1 + Z2 = t
where t is the amplitude transmission coefficient.
Multiplying equation (6) by Z2 gives:
Z2 uj + Z2 ur = Z2 ut
Subtraction of equation (5) from equation (8) then gives:
where r is the amplitude reflection coefficient.
(7)
(8)
(9)
Acoustic intensity reflection and transmission coefficients (R and H
respectively) can be similarly derived denoting acoustic intensity by 11
with subscripts as before.
For the transmission coefficient.
176
H = 4. Z1 . Z2 / (Z1 + Z2) 2
For the reflection coefficient:
These formulae would also apply to a probe which has a buffer rod
attached to the front face of the transducer, providing that the
thickness of the buffer is greater than the pulse length.
For the case of a wave incident upon a series of media with a pulse
length in excess of the thickness of laminations the situation is much
more complicated. The various boundary conditions become
independent and so both Hand R become complicated periodic functions
of the media thickness relative to the wavelength. The subscript
Considering a simple case, that of three media with parallel
interfaces, and the most commonly encountered example of transducer,
coupling fluid and specimen, denoting these as media 1,2, and 3,
respectively, then their specific acoustic impedances are such that
Z1 » Z2 « Z3 . If Z1== Z3 and A«I then the transmission coefficient, H, of
the pulse through the fluid of thickness I is given by :
177

When wave energy is transmitted into a material some of the energy is
scattered in all directions by the inhomogeneities in the material such
as grain boundaries, dislocations, small defects, and residual stress
distribution caused by variations in interatomic spacings.
Part of this scattered energy travels backwards along the beam
eventually returning to the probe and is called backscatter. This is
seen on the display as spiky noise, usually referred to as grass.
In most metals this is of a lower amplitude than the signal but in
polycrystalline materials such as the ceramic materials in this study
backscatter amplitudes, particularly from grain boundaries, are often
greater than those of the reflected signals which are highly
attenuated. Where materials evaluation is the aim, a two probe
technique is frequently more effective since the receiver does not
collect the backscatter noise and the one way signal is attenuated to a
much smaller degree. Unfortunately, information on faults is minimal
and limited to comparison of signal amplitudes and wave velocities
with standards or in different locations on a specimen. This was
investigated and published, Round (1988a).
178
If there is a residual stress distribution, the velocity , c , varies
spatially which gives rise to impedance variations, and if these
variations are sharp, scattering will take place. This effect leads to
the use of backscatter as an evaluation technique. However in the
polycrystalline materials under discussion this effect is masked by
scatter from grain boundaries.
3.2 RELATIONSHIPS BETWEEN WAVE VELOCITY AND MATERIAL
STRUClURE.
Whilst the idea that elastic moduli should be directly proportional to
interatomic forces is attractive, it is not supported by observations.
Elastic moduli of materials like steel exceed those of plastics by a
factor of 100 or more yet the atomic bonds in plastiC (strong covalent
bonds) along the chain are much stronger than the metallic bonds in
steel. Similarly P-O bonds are rather stronger than Si-O bonds, yet
the elastic moduli of Si02 glasses are approximately double those of
P20S glasses.
179

The reason for these anomalies is that the nature of the atomic
configurations determines the macroscopic elastic moduli, rather than
the magnitude of the inter-atomic forces. If, when a material
structure is compressed, all atomic bonds are uniformly reduced in
length, without bond angles being changed, then for a simple structure,
with one kind of bond only (eg. any metal or simple oxide like FeO,
Fe203 , A1203 , and Si02) the bulk modulus, K, would be given by, Bridge
(1986a) :
K =n.r2.F/q
Where:
n is the number of bonds per unit volume,
r is the bond length,
and F is the bond stretching constant.
(10)
In a few materials,eg. diamond, this formula gives approximately the
right answer, but in most cases (eg.in many plastics, glasses, etc) the
bulk modulus predicted by the bond compression model, ~c' is greater
than the experimental bulk modulus, Ke , by a factor of 3-10. This
suggests that isotropic compression involves a process taking much
less energy than bond compression, ie. that some bond bending is
180
taking place (typically bond stretching force constants are 10 to 20
times greater than bending force constants).
The extent of this bond bending will increase, ie. Ktx! Ke will increase,
as the size of the atomic rings increases and the atomic structure
becomes more open.
The term atomic ring can be applied to the shortest closed circuit of
atomic bonds. Diamond has small rings of six carbon atoms all with the
same force constants and bond lengths. This structure is three
dimensional with similar rings in all three axes. The values of bulk
moduli calculated from the bond compression model and the
experimentally observed values are in agreement and Kbd Ke .:=1.
In the case of larger rings of silica tetrahedra, consisting of six
silicon atoms and six oxygen atoms, which are more easily
compressed, Kbd Ke is approximately 3.5.
In contrast, polymers consist of hydrocarbon chains with strong C-C
bonds along the chain and very weak hydrogen bonds between chains
with force constants perhaps a thousand times smaller than those of
the C-C bond.
181
For forces applied parallel to the chains, the elastic moduli of
polymers can be very high. Usually, polymers consist of randomly
oriented chains; thus isotropic compression results in some bending of
C-C bonds, together with some compression of the much weaker H-H
bonds.
The effect of the hydrogen bonds is to produce quite small rings of
alternating strong C-C and weak H-H bonds. So isotropic compression
produces fairly direct compression rather than bending of these bonds.
As a result, the observed modulus Ke for unbranched chain polymers
(ie.high density polymers) lies between the values of Kbc calculated for
C-C bonds and for H-H bonds.
In crystals held together by Van der Waal's forces, small atomic rings
are obtained, and therefore Ktx/ Ke =1, ie. isotropic compression
produces bond compression rather than bending. Such crystals have
very low moduli because Van der Waal's force constants are small.
As a general rule, for covalent bonds, Poisson's ratio (cr) increases as
the crosslink density per cation decreases. Crosslink density per
cation is the number of network bonds minus two. With 4 bonds per
silicon atom the crosslink density is 2, and Poisson's ratio is 1.5.
182
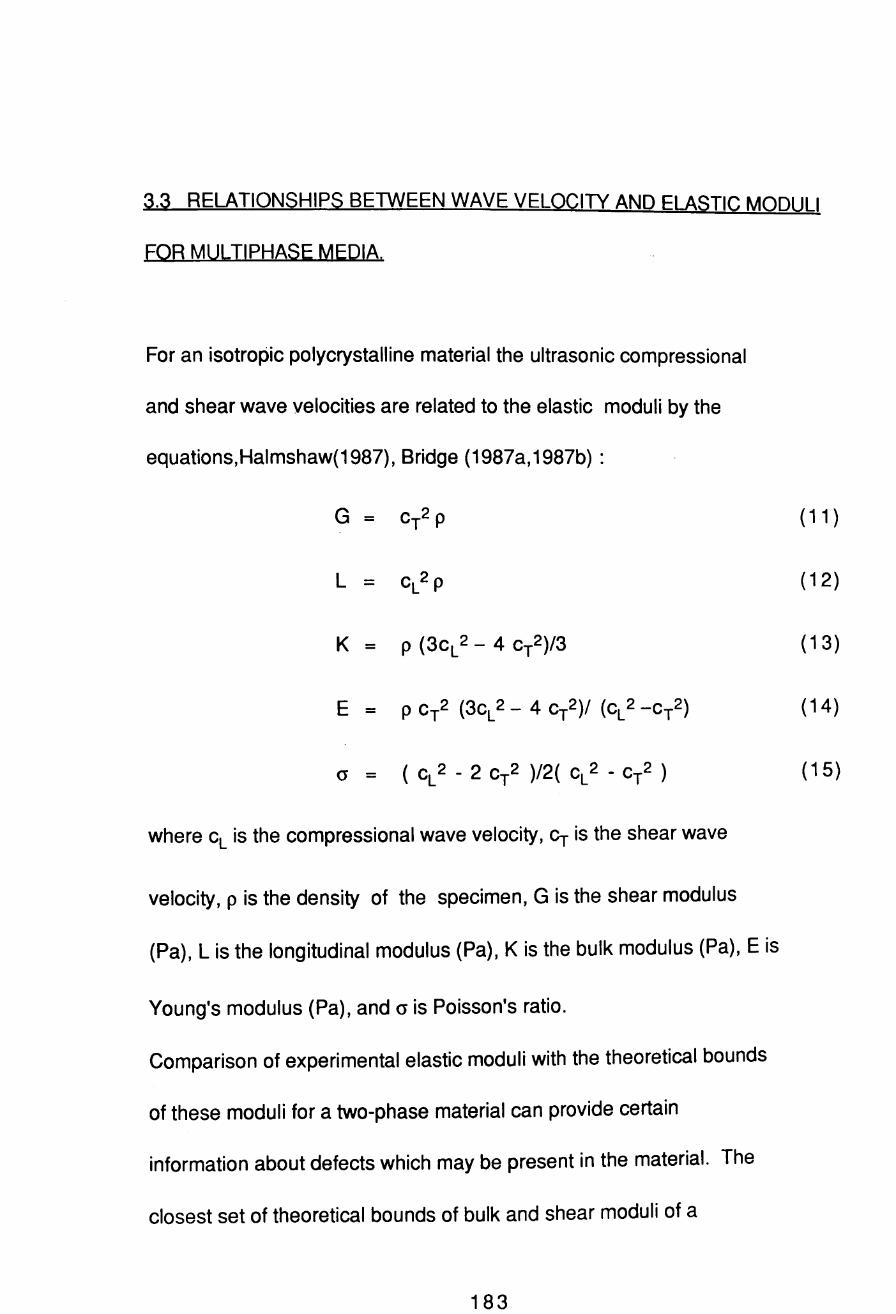
3.3 RELATIONSHIPS BETWEEN WAVE VELOCITY AND ELASTIC MODULI
FOR MULTIPHASE MEDIA.
For an isotropic polycrystalline material the ultrasonic compressional
and shear wave velocities are related to the elastic moduli by the
equations,Halmshaw(1987), Bridge (1987a,1987b) :
G = CT2 P
L - CL2 P
K = P (3CL 2 - 4 cT2)/3
E = P CT2 (3CL 2 - 4 CT
2)/ (cL 2 -CT
2)
(J - (CL 2 - 2 CT
2 )/2( c L 2 - CT
2 )
where cL is the compressional wave velocity, Cr is the shear wave
velocity, p is the density of the specimen, G is the shear modulus
(Pa), L is the longitudinal modulus (Pa), K is the bulk modulus (Pa), E is
Young's modulus (Pa), and (J is Poisson's ratio.
Comparison of experimental elastic moduli with the theoretical bounds
of these moduli for a two-phase material can provide certain
information about defects which may be present in the material. The
closest set of theoretical bounds of bulk and shear moduli of a
183
(11 )
( 12)
( 13)
(14 )
( 15)

two-phase material, in which the second phase is in the form of a
particulate filler, are given by the well known formulae originally
attributable to Hashin and Shtrikman, Hashin (1963) :
6(K1 + 2G 1X1 -V~) 5 G1 (3 K1 + 4 G1)
where the subscripts U and L denote upper and lower bounds
respectively, subscripts 1 and 2 denote the matrix and the particulate
phase respectively, and V 2 is the filler volume fraction which is
184
(16)
(17)
(18)
(19)

given by, Bridge (1987c) :
where P is the density of the sample, PI is the density of the matrix
and P2 is the density of the filler.
It is important to note that the above equations apply even for two end
members, ie. matrix and filler (particulate) components consisting of
multiple phases. Thus, equations (16)-(20) will be applicable to the
materials under discussion, taking the reaction products as the matrix
component and the alumina as the particulate filler component. If
these equations are to be practical for the prediction of the volume
fraction dependence of moduli bounds one has to assume that the
elastic moduli of the end-members are themselves independent of
volume fraction. This assumption can be justified if the proportions
of any multiple phases present in the end members are independent of
volume fraction. This condition will doubtless hold for the
non-reactive filler. There is some doubt in the case of the matrix
because reaction rates and temperatures during the reactions were
dependent on volume fraction. Nevertheless, to allow an analysis of
185
(20)

the composition dependence of elastic properties, it is assumed that
the elastic properties of the fully cured matrix are relatively
insensitive to filler volume fraction.
Upper and lower bounds for Young's modulus, E, and Poisson's ratio, 0,
are obtained by combining equations (16) to (19) with equations (14)
and (15). The Hashin and Shtrikman bounds apply for an arbitrary
phase geometry ie; the size, shape, and spatial distribution of the
filler particles. The only restriction of the theory is that there should
be a reasonable number of particles in any layer of the sample running
perpendicular to the wave propagation direction, and one wavelength
thick. When particles are exactly spherical, the lower theoretical
bound for each modulus should apply exactly. Finally there is an
implicit assumption in the Hashin and Shtrikman theory that there is
good bonding between the filler and matrix.
3.4 MODES OF PROPAGATION.
In rods, an infinite set of compressional wave modes (which one can
label by n, where n=1 ,2,3 ... ) is possible, see figure 3.1, each one having
186

." -t
,ct) .c c (I) :::J (")
'< .-.. ~ ::J: N ~
N CJ1 o
CJ1 0 0
---.I CJ1 0
o o o
velocity (m/s)
CJ1 o o ~----------------------------~--------~ o
Figure 3.1. Theoretical frequency dependence of phase velocity of a longitudinal wave pulse. The three curves correspond to propagation consisting of the rod wave mode combined with the 1 st 2nd and 3rd cn for
a 1.5 x 6cm section.

a dispersion relationship which depends on the dimensions of the
sample perpendicular to the propagation direction, and a peak
amplitude which decreases as n increases. In each mode the pressure
distribution perpendicular to the rod axis is not uniform. Thus, to
propagate a pure mode, a non uniform pressure distribution across the
couplant-sample interface is required and it follows that a uniform
pressure distribution in the couplant will necessarily lead to mixed
mode propagation. This condition almost certainly applied throughout
this research because the transducers were too rigid to permit the
formation of meniscus-shaped coupling films to produce non uniform
pressure distributions.
The above description describes qualitatively the solutions to the
general wave equation subject to the boundary condition that the
stress over the sidewalls of the rod must vanish. Quantitatively the
solutions are exceedingly complicated. As a first approximation a
simplified quantitative picture can be obtained as follows. Each mode
consists of two compressional plane waves which travel back and
forth across the sample at such an angle, a, that the boundary
condWons can be satisfied. Divergence of the beam generated by the
transmitting probe provides the necessary mechanism to launch the
187
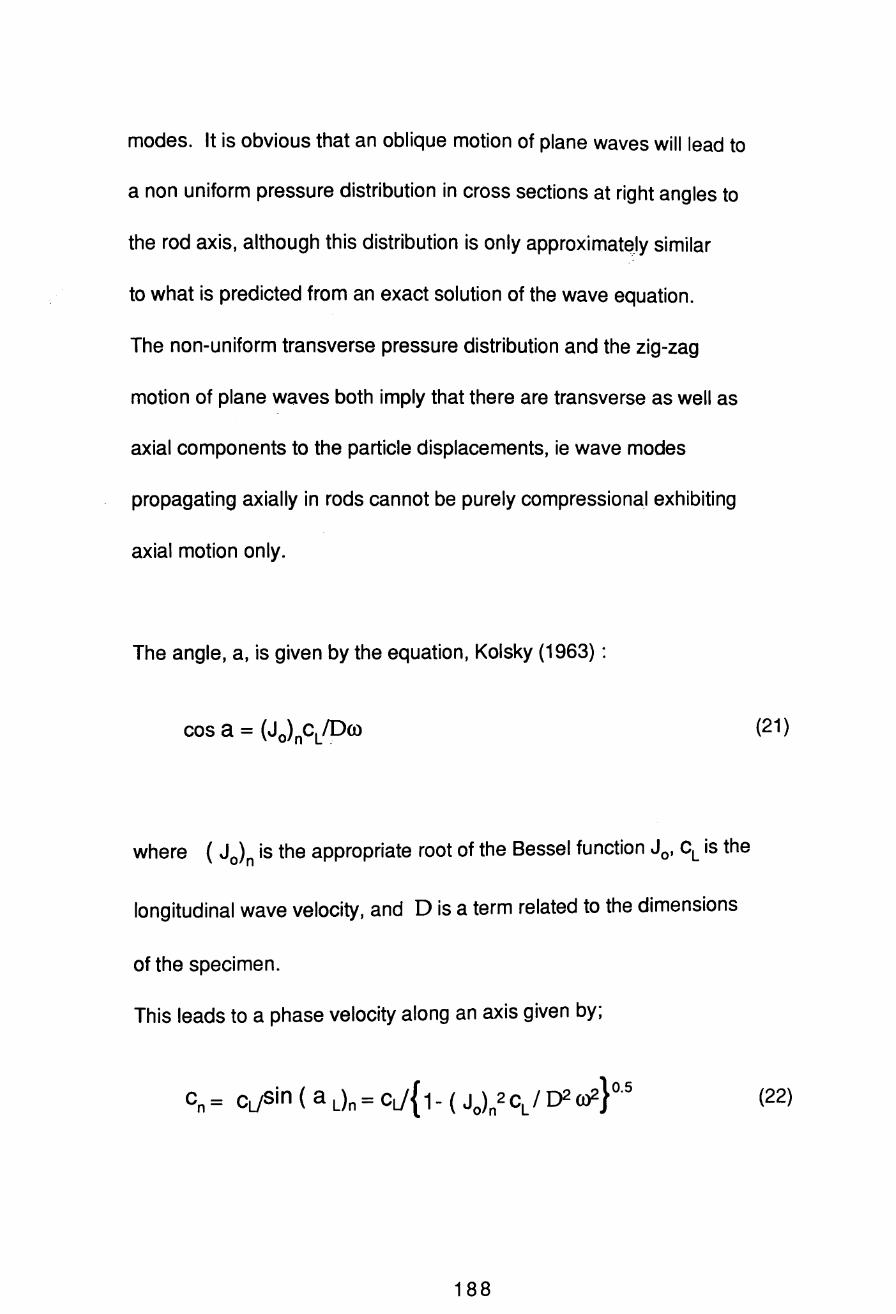
modes. It is obvious that an oblique motion of plane waves will lead to
a non uniform pressure distribution in cross sections at right angles to
the rod axis, although this distribution is only approximateJy similar
to what is predicted from an exact solution of the wave equation.
The non-uniform transverse pressure distribution and the zig-zag
motion of plane waves both imply that there are transverse as well as
axial components to the particle displacements, ie wave modes
propagating axially in rods cannot be purely compressional exhibiting
axial motion only.
The angle, a, is given by the equation, Kolsky (1963) :
where (Jo)n is the appropriate root of the Bessel function Jo' CL is the
longitudinal wave velocity, and D is a term related to the dimensions
of the specimen.
This leads to a phase velocity along an axis given by;
188
(21 )
(22)

For a cylindrical rod, D is the radius. For other geometries, D is
more complex and, for a rectangular cross section, Kolsky advocates
uSing:
D = (d2/3) 0.5
as the dimensional term in equation (22), where d is the diagonal of
the rectangular cross sectionperpendicular to the axis of ultrasound
propagation.
It will be noted that there is a low frequency cut off, coc,where cn rises
asymptotically to 00 and below which no propagation is possible
(imaginary cn values). Above the cut off, cn decreases monotonically
and asymptotically to CL as co tends towards infinity. Because of the
finite bandwidth of the pulses, infinite phase velocities are not
observable in practice. If the bandwidth of the pulse encompasses the
cut-off frequency, because of the variation of cn close to the cut-off,
the proportion of the pulse energy which travels at velocities
approaching infinity is infinitesimal, so that the leading cycles in the
pulse are too small to be observed. In practice, the velocity of a mode
will be seen to rise to a high but finite value in the vicinity of the
cut-off.
189
(23)

There is an additional longitudinal wave mode called the rod wave
mode, whose velocity can be denoted by cE, which has no low frequency
cut-off but exhibits a maximum of;
(24)
where E is Young's modulus, as Cl) tends towards O. As Cl) increases, cE
falls continuously, approaching the surface wave velocity as ro tends to
infinity. Now cE(O) is always less than cL so that cE is always less
than cn. Thus, if a pulse consists of a mixture of the rod wave mode
with one or more cn modes, the plot of the frequency dependence of the
fastest observable phase velocity in the pulse will exhibit maximum
and limiting values of cE(O) and CL as ro tends to 0 and 00 respectively.
The maximum will lie somewhere within the range of cut-off
frequencies for the different cn modes present. As ro drops below the
cut-off point roc the velocity will not drop suddenly to cE (which is
<CL)' Instead, because of the finite bandwidth of the pulse extending to
Cl»roc the velocity will fall off continuously from a maximum value, to
cE(O) as ro tends towards O.
Using the above model an apparent frequency dependence of velocity
190

and certain other questionable, but repeatable, low frequency
observations can be explained. Typical cases of the theoretical
frequency dependence are plotted in figure 3.1, for the fastest
observable phase velocity (ie the speed of the first quarter cycle to be
visible) of a longitudinal wave pulse. The three curves correspond to
propagation consisting of the rod wave mode combined with the 1 st 2nd
and 3rd cn respectively. Velocities above the cut-off frequency are
obtained from equation (22) substituting the appropriate value of n,
calculated from equation (23) and using for cL the experimental
compressional wave velocity at a frequency of SMHz.
At the cut-off frequency, coc' a finite value of cn has been derived from
the following argument. To a reasonable approximation, a pulse of
centre frequency co has a spectrum bandwidth of co+ coclp where p is the
number of cycles in the pulse, assumed of equal amplitude. Thus to a
first approximation, because of finite bandwidth, the velocity at the
cut-off frequency, cn(coc) may be taken as the velocity evaluated at the
frequency COc + coc/p i.e.
191
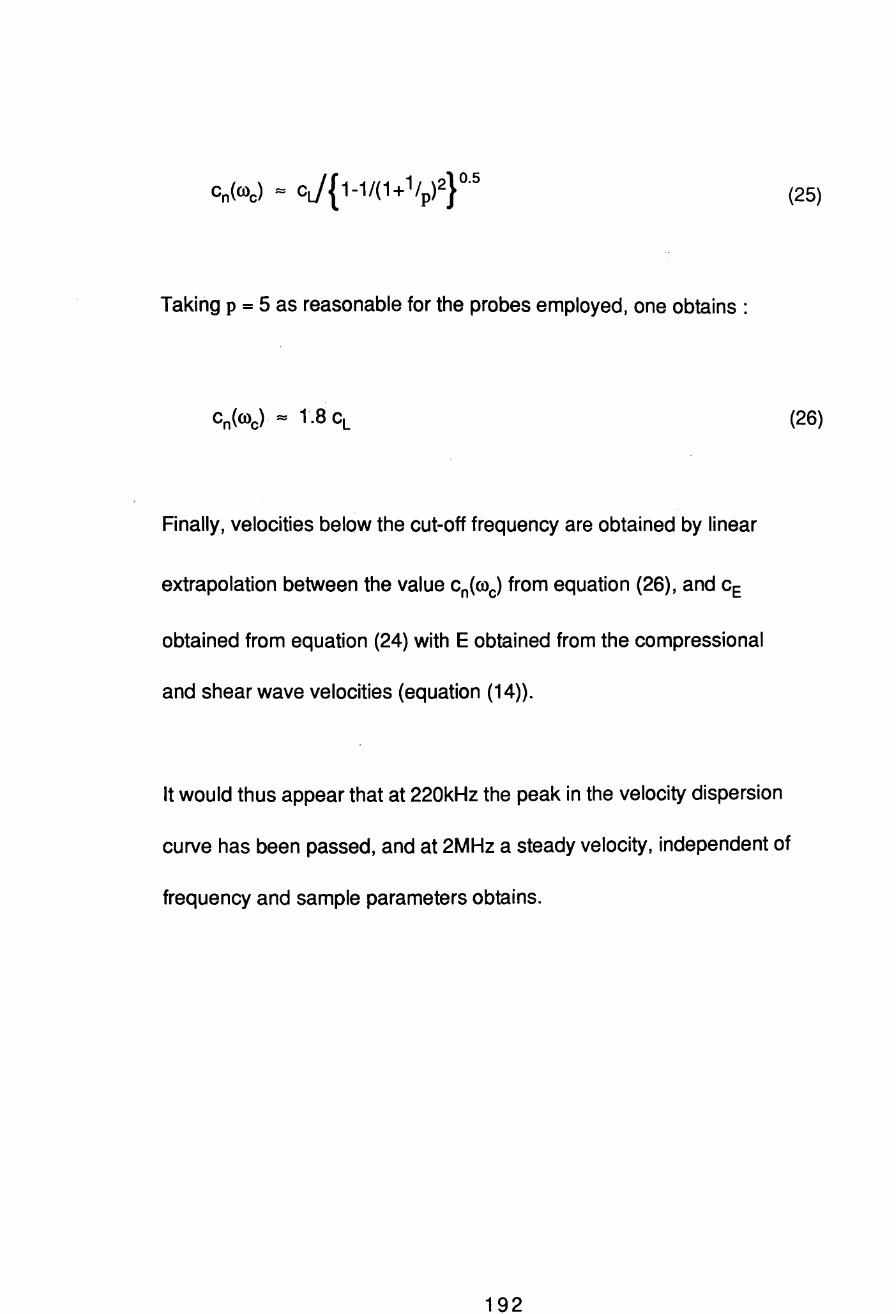
Taking p = 5 as reasonable for the probes employed, one obtains:
Finally, velocities below the cut-off frequency are obtained by linear
extrapolation between the value cn(roc) from equation (26), and cE
obtained from equation (24) with E obtained from the compressional
and shear wave velocities (equation (14)).
(25)
(26)
It would thus appear that at 220kHz the peak in the velocity dispersion
curve has been passed, and at 2MHz a steady velocity, independent of
frequency and sample parameters obtains.
192
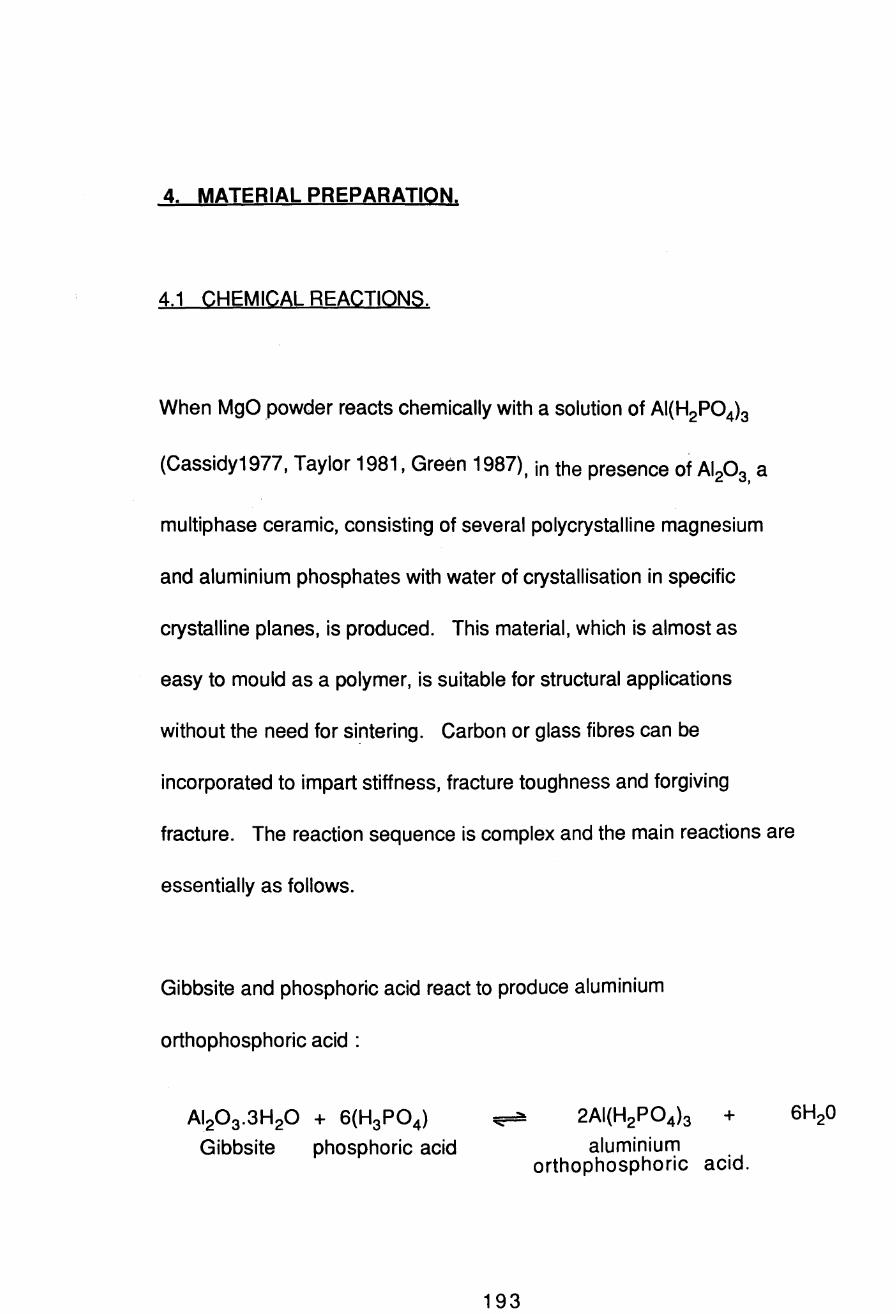
4. MATERIAL PREPARATION.
4.1 CHEMICAL REACTIONS.
When MgO powder reacts chemically with a solution of AI(H2P04h
(Cassidy1977, Taylor 1981, Green 1987), in the presence of AI20
3 a ,
multiphase ceramic, consisting of several polycrystalline magnesium
and aluminium phosphates with water of crystallisation in specific
crystalline planes, is produced. This material, which is almost as
easy to mould as a polymer, is suitable for structural applications
without the need for si~tering. Carbon or glass fibres can be
incorporated to impart stiffness, fracture toughness and forgiving
fracture. The reaction sequence is complex and the main reactions are
essentially as follows.
Gibbsite and phosphoric acid react to produce aluminium
orthophosphoric acid :
A120 3·3H20 + 6(H3P04)
Gibbsite phosphoric acid
"' .... 2AI(H2P04b +
193
aluminium orthophosphoric acid.
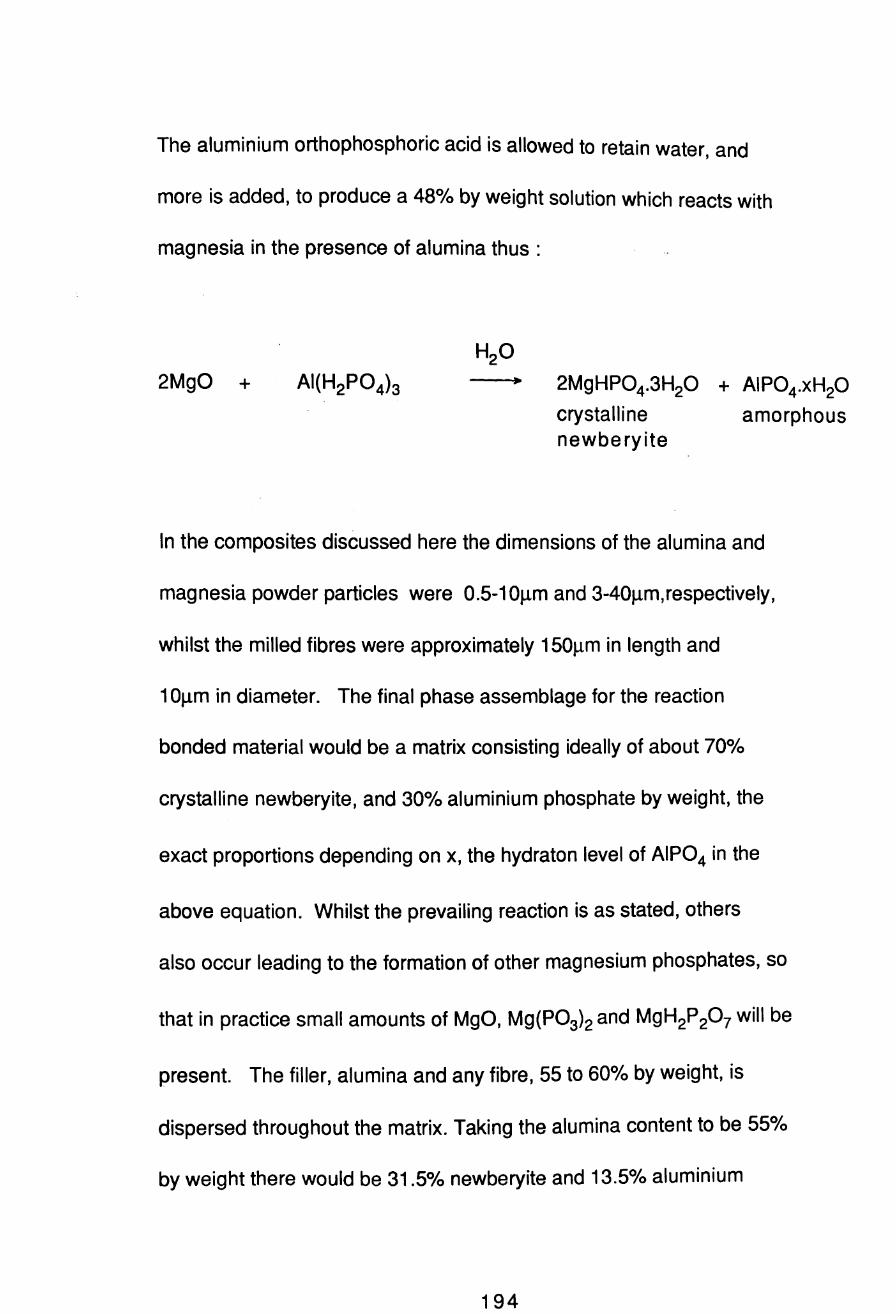
The aluminium orthophosphoric acid is allowed to retain water, and
more is added, to produce a 48% by weight solution which reacts with
magnesia in the presence of alumina thus:
2MgO +
crystalline newberyite
amorphous
In the composites discussed here the dimensions of the alumina and
magnesia powder particles were 0.5-10Jlm and 3-40flm,respectively,
whilst the milled fibres were approximately 150flm in length and
10Jlm in diameter. The final phase assemblage for the reaction
bonded material would be a matrix consisting ideally of about 70%
crystalline newberyite, and 30% aluminium phosphate by weight, the
exact proportions depending on x, the hydraton level of AIP04 in the
above equation. Whilst the prevailing reaction is as stated, others
also occur leading to the formation of other magnesium phosphates, so
that in practice small amounts of MgO, Mg(P03)2 and MgH2P20 7 will be
present. The filler, alumina and any fibre, 55 to 60% by weight, is
dispersed throughout the matrix. Taking the alumina content to be 55%
by weight there would be 31.5% newberyite and 13.5% aluminium
194

phosphate by weight ignoring minor phases.
Throughout this thesis the residual alumina is defined as the filler
whilst the matrix is formed of the reaction products. Thus the matrix
might consist-of two phases with newberyite predominating, as
described in the equation. Alternatively, since the equation is only an
approximate description of the chemical process occurring, the matrix
will probably consist of more than two phases.
4.2. AGGLOMERATION AND MIXING OF POWDERS.
In September 1986, work started at THORN EMI Central Research
Laboratories, with trials undertaken by co-workers from Thorn-EMI at
Baker Perkins Chemical Machinery, Stoke-on-Trent, on the
investigation of a suitable formulation and production process for
moulded phosphate bonded ceramics, Green (1987).
The process commences with a mixture of two powders, alumina and
magnesia, dispersed in and 'wetted' by an aluminium orthophosphate
acid solution. Samples in which the powder components are not fully
'wetted' are of lower strength and the mixing technique must therefore
195

ensure the 'wetting' of the powders by the acid solution and overcome
any tendency of the powders to agglomerate.
Powder particles agglomerate or stick together by three main
mechanisms ':
I) Solid Bridging which may come about as the result of sintering,
solid diffusion or chemical reaction.
2) Liquid bridging, which is the presence of a liquid phases between
the particles. Small amounts of the liquid may concentrate in saddles
lying between the particles, greater quantities may form a continuous
network, eventually completely coating the particles, and finally
filling the interstices. Surface tension forces on the outside of the
drop keep the particles together. With the earlier stages there is a
negative capillary pressure in the filled saddles, and subsequently
surface tension causes the bonding between grains.
(3) Attraction between particles due to Van der Waal's forces.
The mixing process must overcome these mechanisms and break up the
agglomerations in order to ensure that each particle is 'wetted' by the
196
acid solution. Thorough 'wetting' in necessary to maximise the rate of
reaction between orthophosphoric acid and the magnesium oxide.
Imperfect 'wetting' of either of the powder components causes
agglomerates within the matrix, which reduces the mechanical
strength.
The material, as it undergoes processing, also varies in viscosity as
the MgO/acid reaction proceeds. The mixing equipment must therefore
be able to handle materials of different and varying viscosities.
The MgO/acid reaction is exothermic which necessitates cooling, and
furthermore the incorporation of temperature control would enable the
control of reaction or setting time. Ease of cleaning and the ability to
withstand corrosive and abrasive conditions are also important
considerations.
For volume production of the phosphate ceramic material in both
research and production environments batch mixing and continuous
extrusion could be considered.
4.2.1 Batch mixers.
These generally consist of two contra-rotating blades or cylinders
197

which are set on parallel shafts along a trough. The blades are
designed to draw the material down between them, thus working it
between the blades and the trough wall, which is usually shaped to the
contour of the blades or cylinders for greatest efficiency. The mixers
work a small proportion of the batch at a time which leads to long
mixing times to ensure a uniform product.
Long mixing times do not pose a problem unless, as with these
composites, the time available to work the material is restricted by
setting reactions. Cooling of the phosphate composites can delay
setting, but where there is a large bulk of material, efficient removal
of heat is difficult. Problems encountered with overheating of the
material would only be intensified as batch sizes increase,
necessitating the dissipation of extra heat from a proportionately
lower surface area. Trials using a Z-blade mixer by co-workers from
Thorn-EMI at Baker Perkins Chemical Machinery, Stoke-on-Trent met
with little success.
4.2.2 Extrusion / Injection moulding
This is a continuous production method widely applied to the plastics
198
industry and the most likely method for the commercial production of
artifacts from the ceramic composite. An extruder is used to
compound material and pump it into a die. The extruder alone
produces a continuous length of constant cross section, which would
be inappropriate for this material without initial support. Clearly, if
the material is sufficiently viscous to support its own weight
immediately on exit from the extruder, there is a strong probability of
the material setting within the machinery with little safety margin.
The advantages of extrusion are continuous production, accurate
temperature control and effective transport of difficult materials.
Single screw machines impart high degrees of shear, but are less
intense mixers than twin screw machines which can be co-rotatory or
counter-rotatory.
The differences between the two types of twin screw machines are the
methods by which they transport and mix the material. Co-rotating
extruders, have inter-meshing screws which are self wiping.
Material moves helically along the inside barrel wall in a figure of 8
path from the feed section to the discharge point. The screw design is
such that the root of one screw is constantly being wiped by the flight
tip of the other, with a uniformly small distance between them. This
eliminates dead spots and the residence time of each mix component is
199

uniform. Clearly this is of great advantage with chemically setting
material.
In the counter-rotating type of twin screw extruder the mixing
operation is accomplished by the screw flights, which carry the
material, forcing it towards the point where the two screws meet, or
are at their closest proximity to each other. This is often referred to
as a 'nip'. Contra-rotating extruders can put the material through
high degrees of shear by means of this nip. The degree of shear can be
controlled by narrowing or increasing the clearance between the
screws, but only a proportion of the material is subjected to the high
shear present at the nip and contra-rotating twin screws are not
totally self cleaning.
Single screw extruders are not generally used for compounding
operations requiring a high degree of mixing. In view of the problems
outlined above the counter rotating twin screw machine also seems
inappropriate for phosphate bonded ceramic material.
Two co-rotatory extruders were used as compounding mixers for the
manufacture of prototype moulded ceramic items in trials undertaken
by co-workers from Thorn-EM\, These were a Baker Perkins twin
200

screw extruder and a Werner Pfleiderer compounding extruder,
modified to run in a horizontal mode.
4.3 SAMPLE PREPARATION.
The silicone rubber moulds for producing 15xl5x220mm3 test
specimens were made using Silastic grade E RTV from Dow Corning,
this was degassed under a slight vacuum for 30-40 minutes before
being cast around the wooden formers and cured over 24 hours at 60°C.
The softness of the rubber caused non-uniformity of some samples and
mismatch at the mould join led to poor sample geometry in several
cases. A wide selection of mechanical test specimens were,
however, successfully moulded.
The mixture was extruded under vacuum, vibrated into moulds and set
at 100°C or 20°C. After mechanical testing by workers at Thorn-EMI
the fragments of these test pieces (now approximately 15x15x55mm)
were made available for use in the research project herein reported.
The compositions of the various samples produced are given in table
4.1 below. The compositions in columns 1-3 were produced as
201
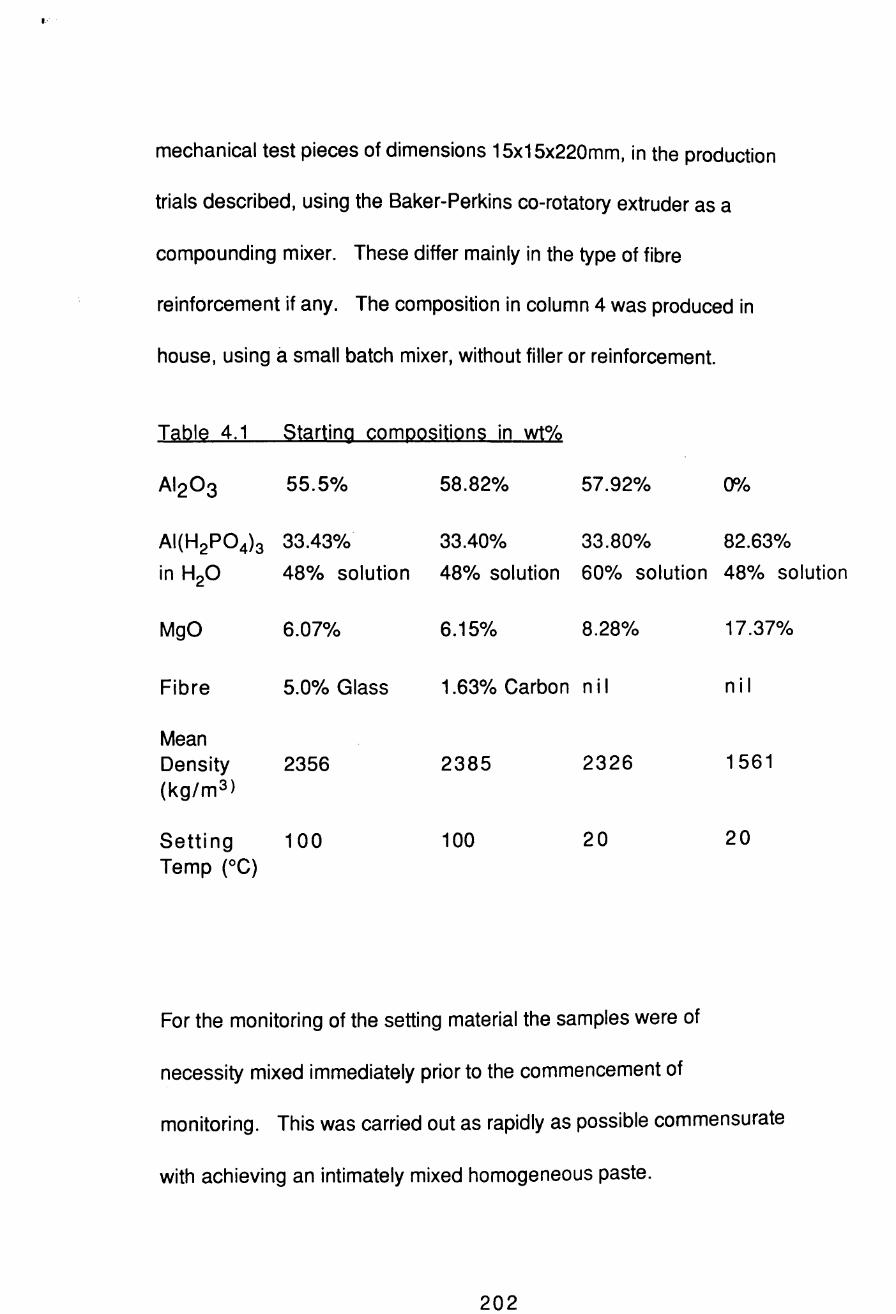
I-
mechanical test pieces of dimensions 15x15x220mm, in the production
trials described, using the Baker-Perkins co-rotatory extruder as a
compounding mixer. These differ mainly in the type of fibre
reinforcement if any. The composition in column 4 was produced in
house, using a small batch mixer, without filler or reinforcement.
Table 4.1 Starting compositions in wt%
AI203 55.5% 58.82% 57.92% 00/0
AI(H2P04b 33.43% 33.40% 33.80% 82.63%
in H2O 48% solution 48% solution 60% solution 48% solution
MgO 6.07% 6.15% 8.28% 17.37%
Fibre 5.0% Glass 1.63% Carbon nil nil
Mean Density 2356 2385 2326 1561 (kg/m 3 )
Setting 100 100 20 20
Temp (OC)
For the monitoring of the setting material the samples were of
necessity mixed immediately prior to the commencement of
monitoring. This was carried out as rapidly as possible commensurate
with achieving an intimately mixed homogeneous paste.
202
Initially 59.80 wt.% of MA95 calcined a-alumina, 6.25 wtO/o of HMD4
magnesia and 33.95 wt.% of the 48% w/w solution of aluminium
orthophosphoric acid (AI(H2P04h) were hand mixed in a- glazed
earthenware bowl, the dry ingredients being intimately mixed by
means of a pestle prior to the addition of acid, until a consistent
paste was achieved, in most cases after approximately 3 to 4 minutes.
The paste was then transferred into the prepared cell. All elapsed
times were measured relative to the time at which the acid was added.
The MgO used in this work was obtained from Steetley Chemicals,
Hartlepool~ under the ~rade name HMD4. It consisted of 960/0 MgO, dead
burnt, with 65% of the particles being less than 53 Jlm diameter. Where
the term "AOP" is used in the text, it refers specifically to a solution
obtained from Albright and Wilson, Oldbury. This is a 48% wtlwt
solution of AOP in water where "AOP" has the nominal composition of
AI(H2P04b, although some variation in P:AI ratio may occur between
batches.
Any given batch is probably comprised of a number of different
aluminium acid phosphates, for example:
203
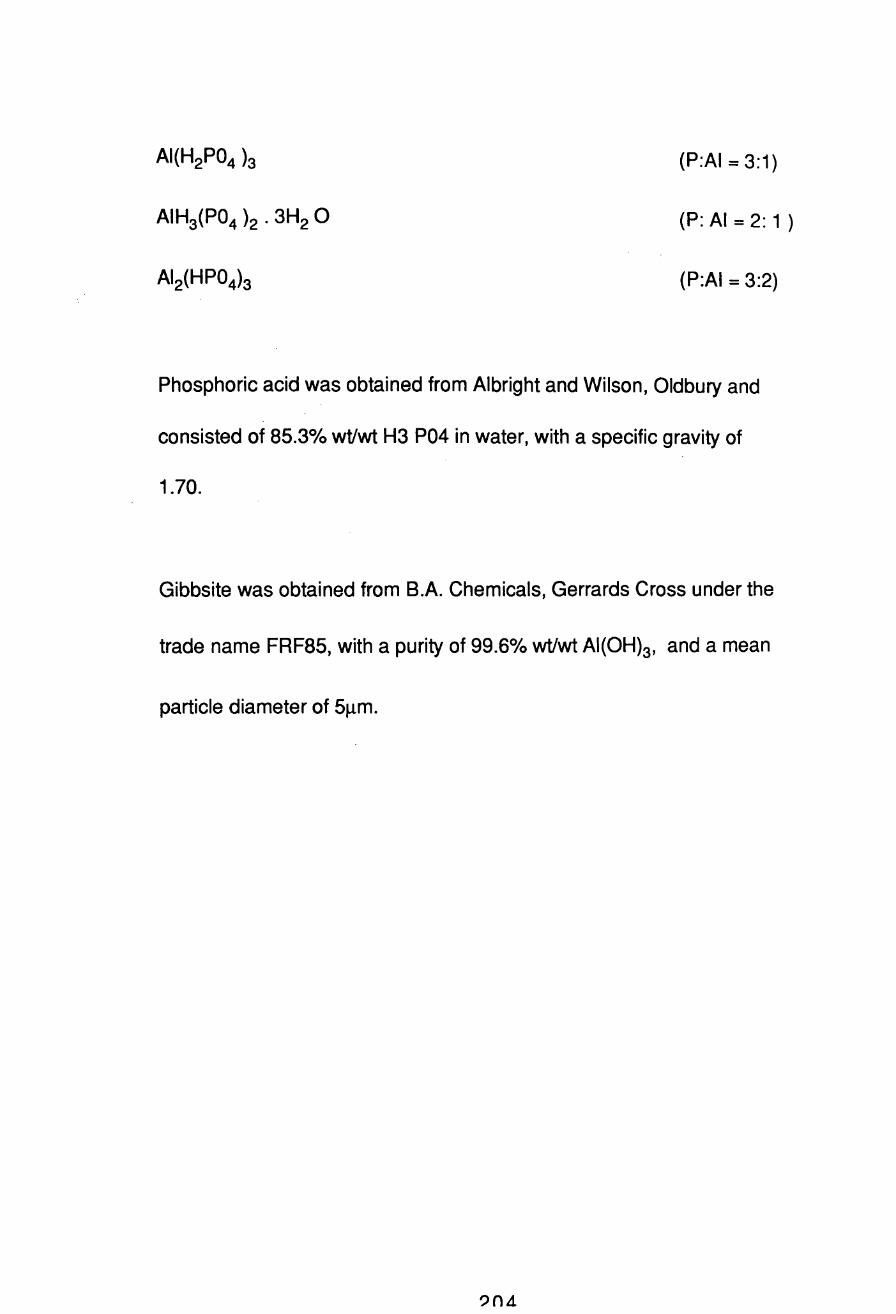
AI(H2P04 b
AIH3(P04 )2 . 3H2 0
A12(HP04b
(P:AI = 3:1)
(P: AI = 2: 1 )
(P:AI = 3:2)
Phosphoric acid was obtained from Albright and Wilson, Oldbury and
consisted of 85.3% wtlwt H3 P04 in water, with a specific gravity of
1.70.
Gibbsite was obtained from B.A. Chemicals, Gerrards Cross under the
trade name FRF85, with a purity of 99.60/0 wtlwt AI(OHb, and a mean
particle diameter of 5Jlm.
5. MATERIAL CHARACTERISATION.
5.1 PHASE IDENTIFICATION.
Chemical and structural analysis would normally have been undertaken
as part of a research programme of this nature, however since
co-workers at Thorn-EMI, in conjunction with Sheffield University, had
already undertaken this work on similar samples produced from the
same batches of raw materials this was not necessary. Their results
have been published, Finch (1989), and their main findings are
discussed below.
Using X-ray diffraction analysis (XRD) Finch and Sharp found that these
phosphate cements appear to contain both crystalline and amorphous
phases, the presence of an amorphous phase being clearly indicated by
a hump in the XRD pattern at values of 29 between 20° and 35°. Sharp
peaks on the XRD trace were identified as due to the presence of two
distinct crystalline phases, newberyite, MgHP04.3H20, and MgO.
The relative amounts of the crystalline materials present in the set
205

cements depended largely on the molar ratio of MgO: AOP used as
starting materials. A maximum amount of newberyite is associated
with a molar ratio of about 4:1.
As the molar ratio MgO: AOP is increased, the cement sets faster and
with a larger evolution of heat. From analysis of the time taken to
reach the maximum exotherm temperature (which provides an estimate
of the setting time) it was found that mixtures with an MgO: AOP ratio
of less than two failed to produce set cements. At a ratio of exactly
two, the mixture "set", but only slowly and always remained tacky.
Varying quantities of magnesium can be accommodated in the
amorphous material, saturation being reached when the atomic ratio in
this phase is around Mg:AI = 1 :1. The exact amount of magnesium which
appears in the form of newberyite, magnesia or in the amorphous phase
depends on a number of factors, such as the molar ratio MgO:AOP, the
particle size and reactivity of the starting materials, and the intimacy
and duration of mixing.
Hence the most accurate equation for the reaction is
+ H20
pM gO + AI(H2P04b > qMgHP04 . 3H20 + [1/2A1 203 . rMgO. 2P20S. sH20] + tMgO
206
where r<1, t = 0 until p> 3, and p must > 2 to produce a set cement.
Phosphorreslerite, MgHP04 7 H20, can be formed in the presence of
excess water, but readily transforms into the trihydrate, newberyite,
at ambient temperatures. This may be an intermediate phase and
could produce anomalies.
Acids with lower water contents can react to form a new hydrate
called "hayesite" by Finch and Sharp which is probably a lower
hydrate of MgHP04 than newberyite, perhaps MgHP04.H20 or
MgHP04·2H20.
5.2 MATERIAL STRUCTURE AND MICROSTRUCTURE.
Simple observation of the surface shows that the material suffers
from serious void defects which can be several millimetres in
diameter in extreme cases, and arise from gaseous reaction products,
mainly water vapour, and air incorporated during mixing and mOUlding.
Hand lens observation of fracture surfaces reveals a coarse texture,
. with grain dimensions on a millimetre scale. Therefore another
possible defect is poor intergranular bonding (which may be related to
grain dimensions) due to departures from the intended chemical
207
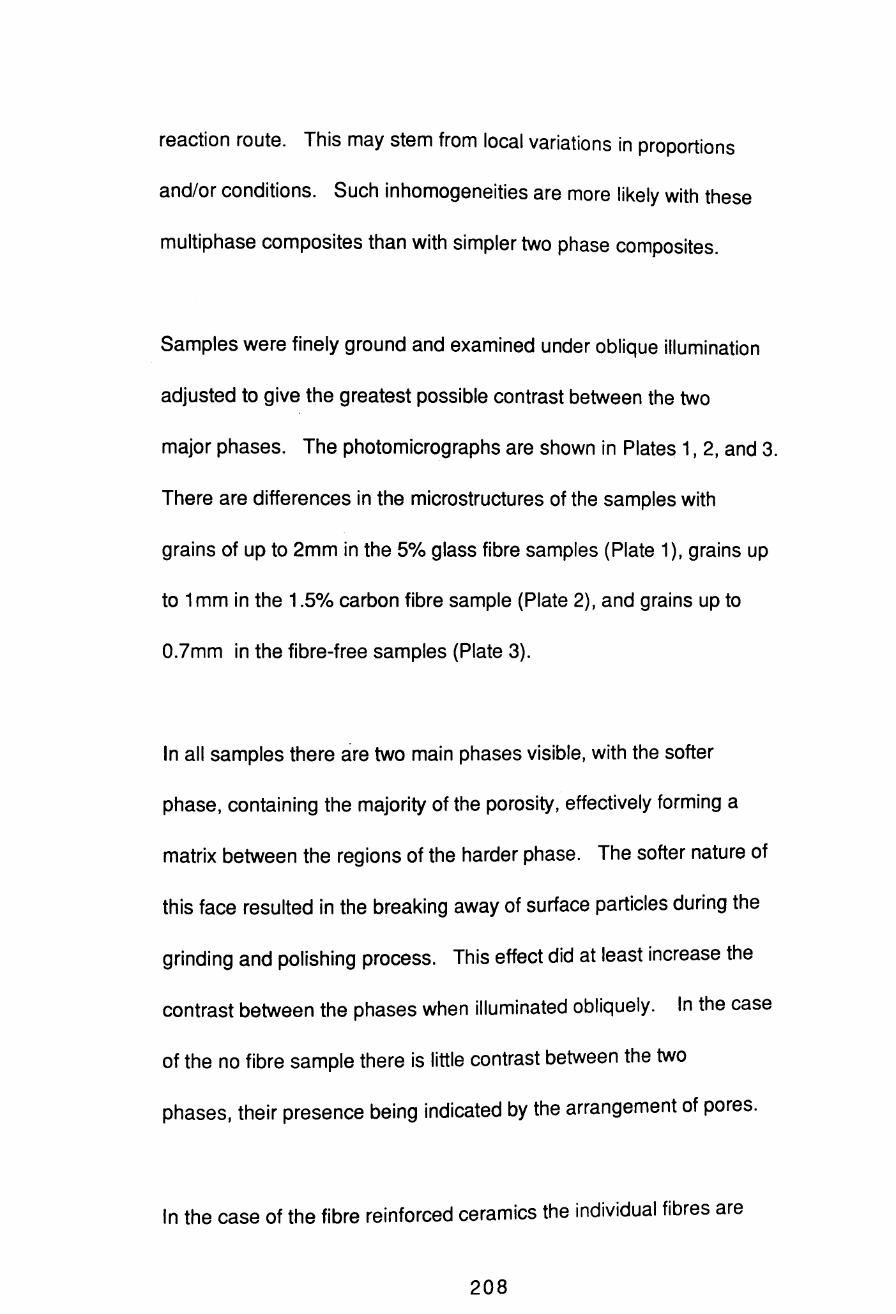
reaction route. This may stem from local variations in proportions
and/or conditions. Such inhomogeneities are more likely with these
multiphase composites than with simpler two phase composites.
Samples were finely ground and examined under oblique illumination
adjusted to give the greatest possible contrast between the two
major phases. The photomicrographs are shown in Plates 1, 2, and 3.
There are differences in the microstructures of the samples with
grains of up to 2mm in the 5% glass fibre samples (Plate 1), grains up
to 1 mm in the 1.5% carbon fibre sample (Plate 2), and grains up to
0.7mm in the fibre-free samples (Plate 3).
In all samples there are two main phases visible, with the softer
phase, containing the majority of the porosity, effectively forming a
matrix between the regions of the harder phase. The softer nature of
this face resulted in the breaking away of surface particles during the
grinding and polishing process. This effect did at least increase the
contrast between the phases when illuminated obliquely. In the case
of the no fibre sample there is little contrast between the two
phases, their presence being indicated by the arrangement of pores.
In the case of the fibre reinforced ceramics the individual fibres are
208

visible in all phases and the differences in microstructure would not
appear to be related to fibre content.
The overall structure of the basic materials can therefore best be
described as a two phase material, each phase being composed of a
complex mixture of other phases: alumina, aluminium phosphate,
newberyite, and any fibres present. The extent to which the
proportions of these phases differ from the theoretical proportions
described earlier is unknown.
The foregoing low power optical observations confirm the conclusions
of the attenuation analyses, with regard to the dimensions of the
major scatterers, which are discussed in chapter 7.3. Unfortunately
they do not confirm the presence of flattened crystals indicated from
a consideration of the values of theelastic moduli with respect to the
Hashin and Shtrikman bounds, a theoretically derived set of limits,
which is discussed in chapter 8.2. In fact the grains appear to be
somewhat rounded, and therefore at odds with the above prediction.
However the grains so far observed are agglomerations of various
crystals produced from the reactions, alumina filler particles and in
some cases fibre for toughening purposes.
209

Plate 1. . Photomicrograph of the material containing glass fibres, taken using oblique illumination. The field width is 7mm. Grains or agglomerations with dimensions approaching 2.0mm are shown.
Plate 2. Photomicrograph of the material containing carbon fibres, taken using oblique illumination. The field width is 7mm. Grains or agglomerations with dimensions approaching 1.5mm are shown.

Plate 3. Photomicrograph of the material containing glass fibres, taken using oblique illumination. The field width is 7mm. The presence of grains or agglomerations with dimensions approaching 0.7mm is suggested by the distribution of porosity.
, '-r
. ' \ " ..,. . .
" ' ., I _ ~: I or
"'
,
0' t
, I
,. ..
20~M 10KV 01 017 S
Plate 4. Scanning electron micrograph of the material containing 0% alumina showing flat and leyered structures in a pore. The scale is given by
the bar.

Plate 5. Scanning electron micrograph of the material containing 50% alumina showing a variety of irregular flat cristallites. The large leyered structure at the edge of a pore may have been dislodged from the surface by a gaseous eruption. The scale is given by the bar.
Plate 6. Scanning electron micrograph of the material containing 50% alumina showing a variety of thin, flat interlocking cristallites with irregular, jagged shapes. The scale is given by the bar.
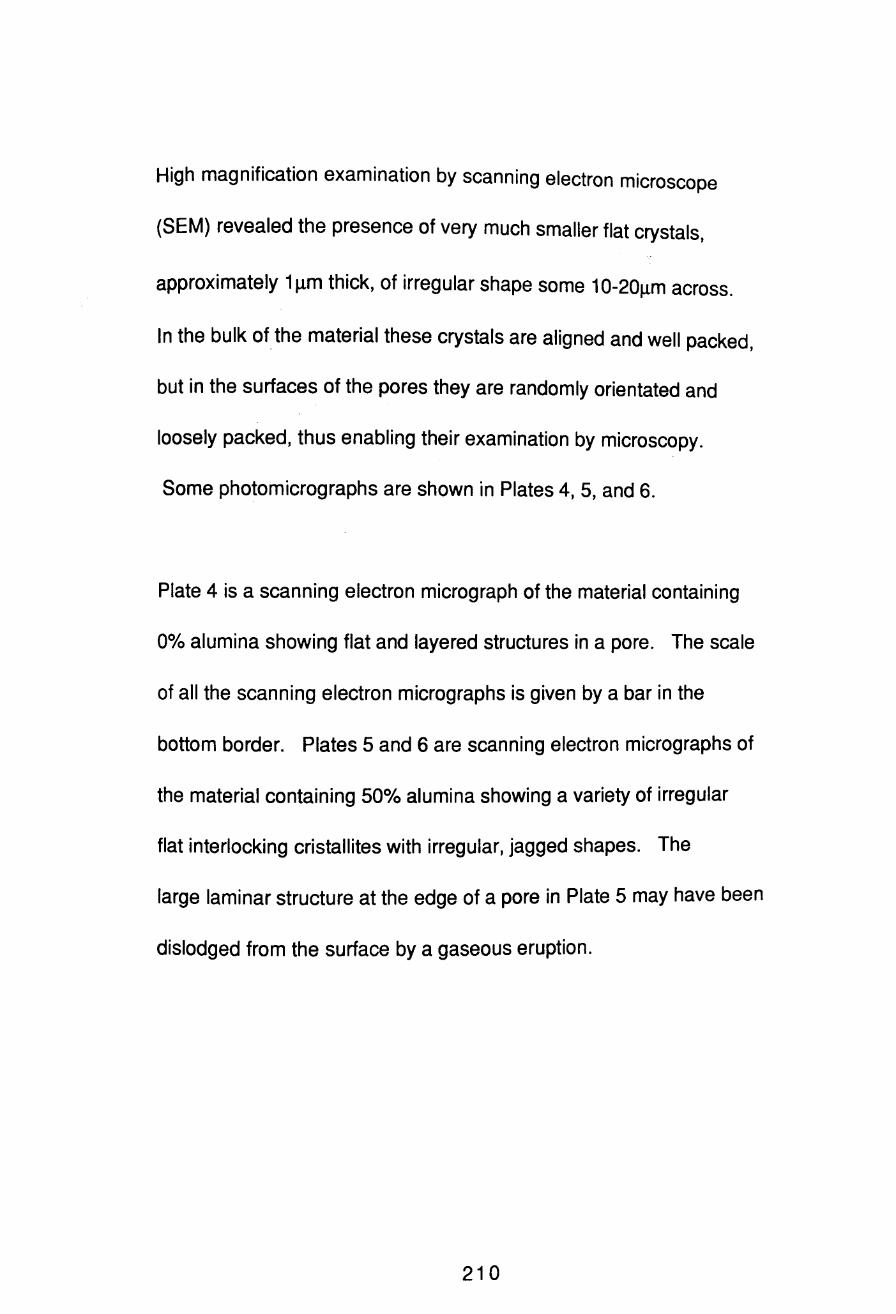
High magnification examination by scanning electron microscope
(SEM) revealed the presence of very much smaller flat crystals,
approximately 1 Jlm thick, of irregular shape some 10-20Jlm across.
In the bulk of the material these crystals are aligned and well packed,
but in the surfaces of the pores they are randomly orientated and
loosely packed, thus enabling their examination by microscopy.
Some photomicrographs are shown in Plates 4, 5, and 6.
Plate 4 is a scanning electron micrograph of the material containing
0% alumina showing flat and layered structures in a pore. The scale
of all the scanning electron micrographs is given by a bar in the
bottom border. Plates 5 and 6 are scanning electron micrographs of
the material containing 50% alumina showing a variety of irregular
flat interlocking cristallites with irregular, jagged shapes. The
large laminar structure at the edge of a pore in Plate 5 may have been
dislodged from the surface by a gaseous eruption.
210

6. EXPERIMENTAL METHODS.
6.1 GENERATION OF ULTRASOUND.
Electromechanical transducers operating on the piezoelectric effect
are the usual means by which u~trasound is generated for application
in nondestructive testing (NOT), and nondestructive evaluation (NDE) of
materials.
Consider a disc of piezoelectric mineral which has been cut along an
appropriate crystal plane, or a polycrystalline ceramic which has been
poled by an applied electric field with suitable thermal treatment, so
as to exhibit the desired piezoelectric properties in an appropriate
plane or axis. When excited by an alternating voltage applied to
electrode plates on opposite faces of the disc, the thickness increases
and decreases cyclically such that the surface of the disc vibrates.
This will cause similar vibrations in materials with which the disc is
in contact. The frequency of vibration is the same as the electrical
excitation frequency but its amplitude is only appreciable when the
applied frequency matches a natural frequency, f, of the crystal. This
will occur when the thickness, t, of the crystal is an exact multiple of
211

half wavelengths such that
t = nIJ2. and since f = ciA, then f = cn/2t
where A is the the wavelength of the acoustic wave in the crystal, c is
the acoustic velocity and n is an integer. This is known as harmonic
excitation.
Shock excitation, which produces short, fast rise-time pulses, is the
normal method used in commercial flaw detectors. Here, a spike
voltage pulse excites the crystal into vibration which decays in a few
cycles. The frequency of these vibrations is the crystal's
fundamental frequency, such that:
t = IJ2. and f = c/2t.
Harmonic excitation tends to be used mostly in NOT research
laboratories, rather than in 'field work' for which shock excitation is
normally used.
Common piezoelectric and electrostrictive materials include quartz
crystal which can be naturally occurring or manufactured, and
polarised ceramics such as lead zirconate titanate (PZT), lead
niobate,and barium titanate.
212
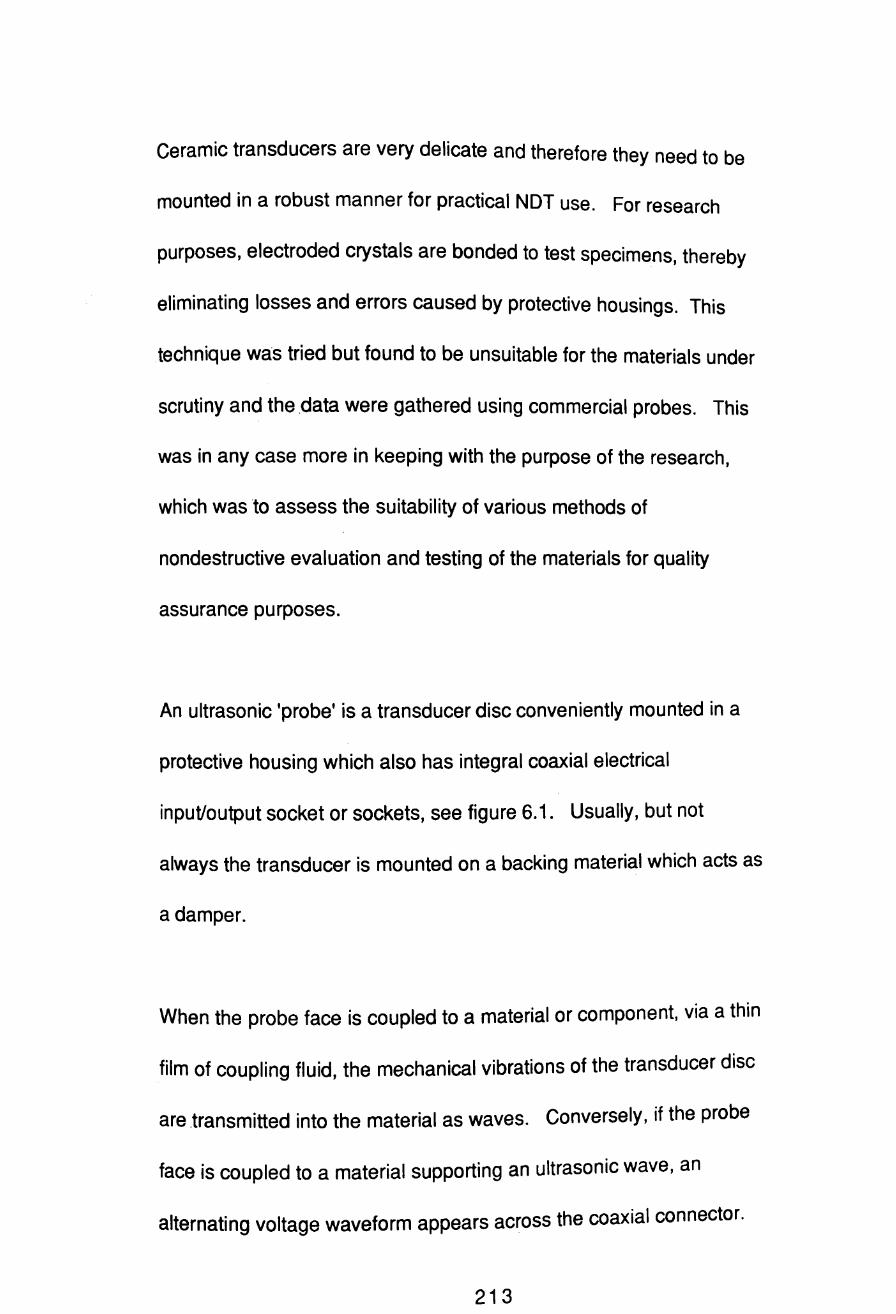
Ceramic transducers are very delicate and therefore they need to be
mounted in a robust manner for practical NDT use. For research
purposes, electroded crystals are bonded to test specimens, thereby
eliminating losses and errors caused by protective housings. This
technique was tried but found to be unsuitable for the materials under
scrutiny and the .data were gathered using commercial probes. This
was in any case more in keeping with the purpose of the research,
which was to assess the suitability of various methods of
nondestructive evaluation and testing of the materials for quality
assurance purposes.
An ultrasonic 'probe' is a transducer disc conveniently mounted in a
protective housing which also has integral coaxial electrical
input/output socket or sockets, see figure 6.1. Usually, but not
always the transducer is mounted on a backing material which acts as
a damper.
When the probe face is coupled to a material or component, via a thin
film of coupling fluid, the mechanical vibrations of the transducer disc
are transmitted into the material as waves. Conversely, if the probe
face is coupled to a material supporting an ultrasonic wave, an
alternating voltage waveform appears across the coaxial connector.
213

Tungsten/ epoxy backing
electrostrictive ceramic
case -~I---->'''\IIIIIII~~~1
connecting wires
BNC connector
conductive coating
epoxy wear face
Figure 6.1 Typical ultrasonic probe, diameter could be from12mm to 12cm, tending to larger probes for lower frequency operation
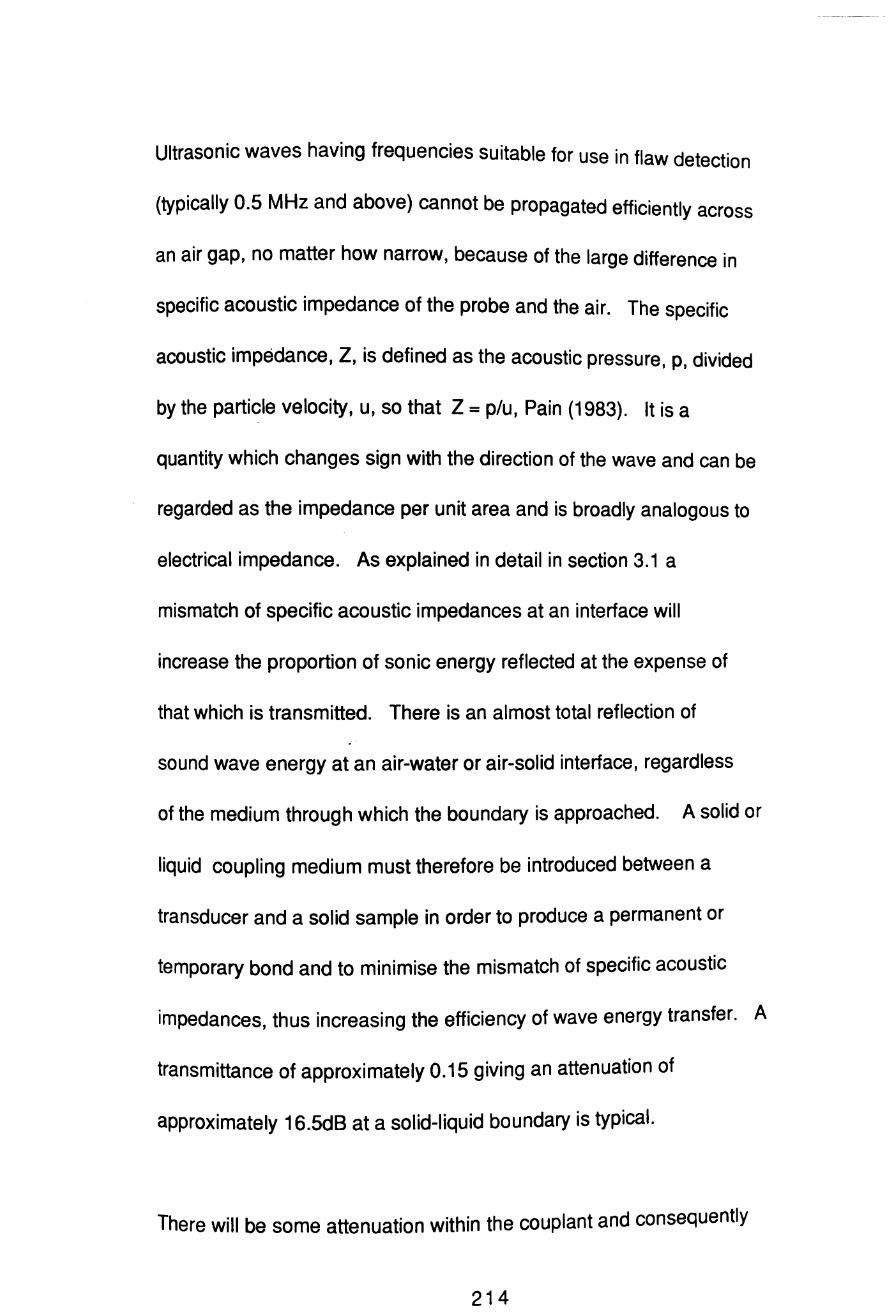
Ultrasonic waves having frequencies suitable for use in flaw detection
(typically 0.5 MHz and above) cannot be propagated efficiently across
an air gap, no matter how narrow, because of the large difference in
specific acoustic impedance of the probe and the air. The specific
acoustic impedance, Z, is defined as the acoustic pressure, p, divided
by the particle velocity, u, so that Z = p/u, Pain (1983). It is a
quantity which changes sign with the direction of the wave and can be
regarded as the impedance per unit area and is broadly analogous to
electrical impedance. As explained in detail in section 3.1 a
mismatch of specific acoustic impedances at an interface will
increase the proportion of sonic energy reflected at the expense of
that which is transmitted. There is an almost total reflection of
sound wave energy at an air-water or air-solid interface, regardless
of the medium through which the boundary is approached. A solid or
liquid coupling medium must therefore be introduced between a
transducer and a solid sample in order to produce a permanent or
temporary bond and to minimise the mismatch of specific acoustic
impedances, thus increasing the efficiency of wave energy transfer. A
transmittance of approximately 0.15 giving an attenuation of
approximately 16.5dB at a solid-liquid boundary is typical.
There will be some attenuation within the couplant and consequently
214
the coupling medium should be maintained as thin as possible. The
couplant will have a finite but variable thickness and the ultrasonic
beam will propagate across the couplant layer in a significant time
which must be considered during data analysis. It is possible to
eliminate the transmission time of the beam through the couplant by
taking data for second and subsequent echoes where conditions allow
this. Unfortunately, the ceramic specimens under discussion were
highly attenuative and this was not always possible. An alternative
technique is to calibrate the timebase to zero using probes coupled
face to face. This may result in errors due to the slight variation in
the thickness of the couplant layers from specimen to specimen.
Taking the mean of several readings on each specimen minimises this
source of error. Rough specimens require thicker films than polished
ones and consequently the error is increased. Where the specimen is
porous there is a tendency for the coupling medium to be absorbed.
The timing error decreases as the film becomes thinner and the signal
amplitude decreases as the quality of the coupling deteriorates. It
was observed that this problem diminished as the couplant filled
surface pores but the surface had, of course, been altered by the
absorption of couplant.
?1~

6.2 INSTRUMENTATION.
6.2.1 Low FreQuency Measurements 24-500kHz.
Measurements were made at 24, 37, 54, 82, 150, 220 and 500kHz using
the C.N.S. electronics PUNDIT ( an acronym: Portable Ultrasonic
Nondestructive Digital Indicating Tester). This equipment uses two
probes, one to transmit and the other to receive the ultrasonic pulse,
and gives a digital readout of the transit time of the pulse through the
sample. From these measurements and thickness data, measured by
micrometer, the ultrasound velocity was calculated. The clock circuit
measures the arrival time of the earliest negative going quarter cycle
of the pulse to exceed the trigger threshold of 200JlV. If the sample
attenuation is so high that the threshold is not reached then no time
measurement at all is obtained. Thus it appears that the fastest
'observable' phase velocity in the received wave group is usually
measured rather than a group velocity, which is the velocity with
which the energy in a pulse of waves is transmitted, Kolsky (1963).
'Observable' , as implied earlier, means that the waveform must
exceed the trigger threshold. Thus depending on attenuation levels
and the spectral energy distribution in the pulse, the fastest
observable phase velocity is not necessarily the fastest phase velocity
in the wave components of the pulse.
Ultrasonic coupling between the probes and the sample was achieved
using Castrol water pump grease. Whilst the grease is difficult to
remove from the ceramic surface it has proved superior to an aqueous
gel couplant (KRAUTKRAMER ultragel II) since the latter is absorbed by
the porous ceramic, leading to loss of adequate coupling and probably
degradation of the ceramic in time. Care must be exercised when
applying the grease since excessive amounts result in a thick layer of
couplant and low velocity values. Insufficient grease causes
inadequate coupling which also leads to low values of sound velocity.
Repeated use of grease for coupling sealed the ceramic surface to
some extent and it was then possible to use ultragel II where
prolonged coupling was not required.
A delay circuit is incorporated in the instrument to enable calibration
against a standard test block thereby eliminating the time delay
introduced by the probe faces and couplant.
217
6.2.2 High freguency velocity and narrow band attenuation
measurements.
A broadband Pulser-receiver (PANAMETRICS 5052 PR) was employed to
generate and amplify ultrasound echoes by 40 dB before display on a
150 MHz oscilloscope (TEKTRONIX Model 2445). The receiver
bandwidth of 10 kHz- 35 MHz allowed the first quarter cycle.of the
first echo to be readily identified on a second CRO channel. The output
of a digital delay generator, (BERKELEY NUCLEONICS Model 7030),
triggered synchronously with the transmitter pulse, was also
displayed. This instrumentation is shown schematically in figure 6.2,
and figure 6.3 which is a simplified arrangement also illustrating the
probe switching circuitry essential for the timed monitoring of
setting samples, see chapter 6.2.4.
By triggering the oscilloscope from the second channel and using time
base expansion and adjustment of the delay time, the peak of the first
quarter cycle of the first echo was made to coincide with a fixed peak
in the delay pulse. This adjustment was carried out both with and
without the presence of the ceramic (with the mould cell outer plates
in contact for the monitoring trials). By taking the difference in the
two delay settings, the travel times in the protective buffers and any
218
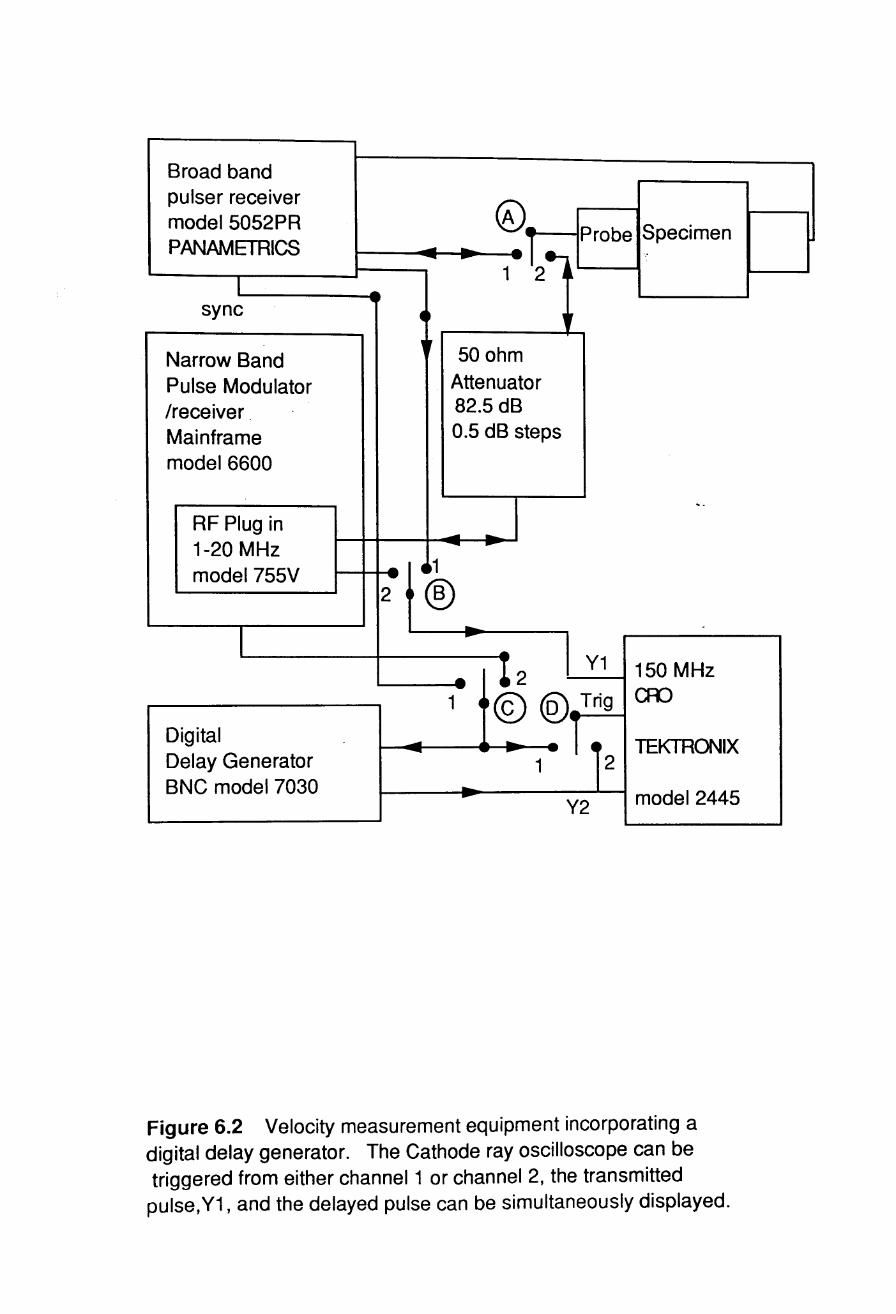
Broad band pulser receiver model 5052PR PANAMETRICS
I sync
Narrow Band Pulse Modulator /receiver Mainframe model 6600
RF Plug in 1-20 MHz model 755V
I
Digital Delay Generator BNC model 7030
--2 t
~~ Probe Specimen ;l~ - -....
1 2 III
4 "
" 50 ohm Attenuator 82.5 dB 0.5 dB steps
, -
-- -.... ... 4 1
® ---
1
-12
Y1 150 MHz
© ® Trig cro
1
Y2
TEKTRONIX 2
model 2445
Figure 6.2 Velocity measurement equipment incorporating a digital delay generator. The Cathode ray oscilloscope can be triggered from either channel 1 or channel 2, the transmitted pulse,Y1, and the delayed pulse can be simultaneously displayed.
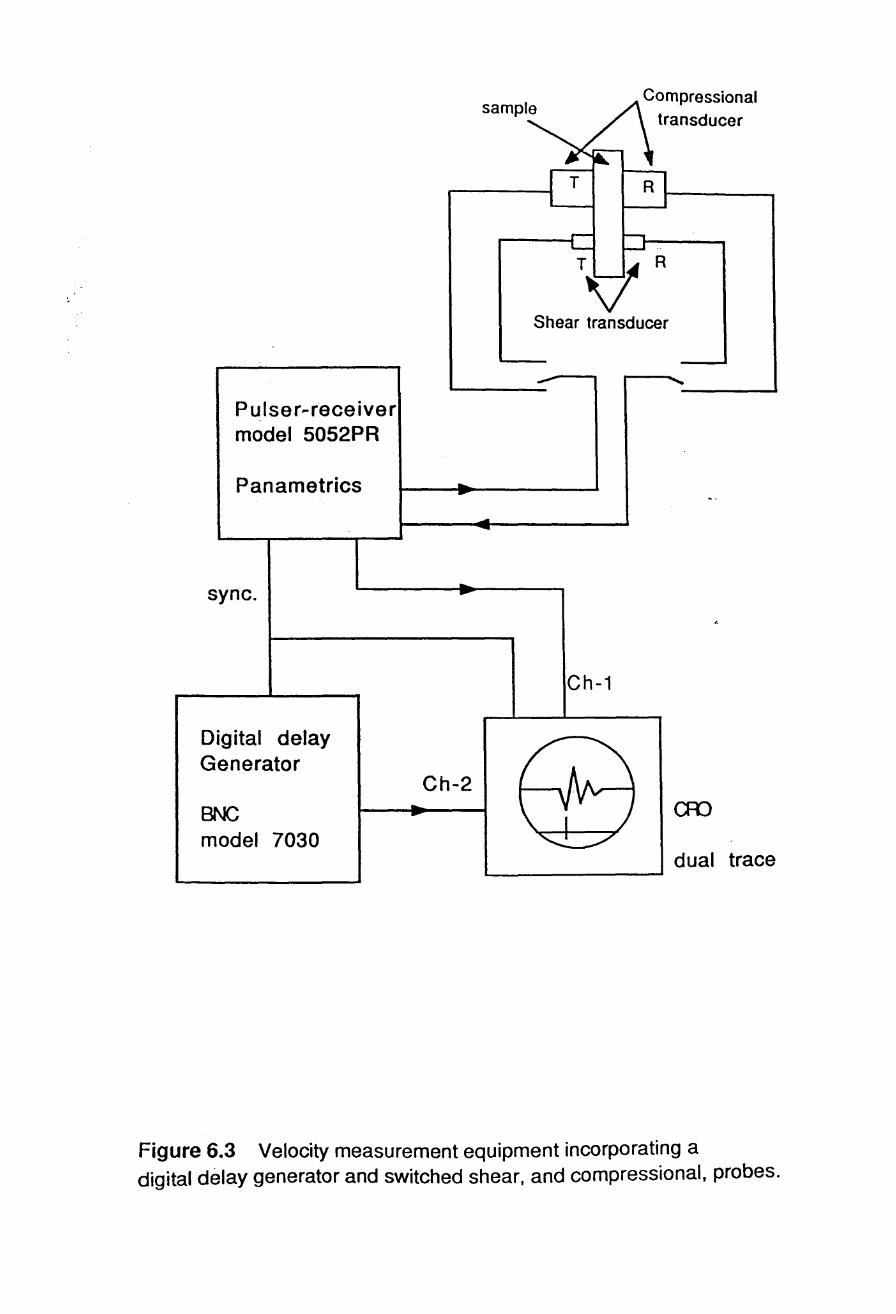
Pulser .. receiver model 5052PR
Panametrics
sync.
Digital delay Generator
BNC model 7030
-•
-..
Ch-2 -..
..
Compressional transducer
T'\j' R Shear transducer
-
Ch-1
-
H a=o I
'-..,.. ./ d ual trace
Figure 6.3 Velocity measurement equipment incorporating a digital delay generator and switched shear, and compressional, probes.
possible small delay between the start of the transmitter pulse and
the triggering of delay generator and the oscilloscope, all cancel to
yield the transit time 't in the specimen. With interpolation between
1 ns intervals the instrumentation error for time differences is only
+1 OOps, the specified time jitter. Timing errors due to other causes
such as sample wedging effects, bond thickness variations, and
location of cycle peaks on the CRO are, of course, much larger.
Setting the sample between the probes, an optimal signal was
obtained, the peak height being marked by the cursor trace. With all
equipment settings remaining constant, a reference signal obtained
with the probes in direct contact was reduced by the attenuator such
that the peak height was the same as the sample peak height, as
indicated by the cursor. This procedure was repeated several times
for each piece at frequencies of 0.25, 0.5, 1.25, 2.25, 5 and 1 OMHz, for
all material variations.
This equipment can be used in single probe or dual probe
configuration, but for these samples the single probe technique was, in
general, inadequate for frequencies above 2 MHz.
Some velocity and attenuation measurements were repeated using
219

pulses of narrower bandwidth from the MATEC pulse modulator. This
data confirmed that errors in the original measurements with broader
pulse bandwidths were negligible compared with other sources of
experimental error.
The pulser/receiver was linked via a high gain amplifier to the dual
channel oscilloscope, the second channel of which was used as a
cursor. A switched attenuator, variable from 0 - 82.5 dB in O.5dB
increments, was incorporated in the circuit.
6.2.3 Spectrum analysis.
Spectrum analysis was carried out using a Marconi Instruments
spectrum analyser 2382 with display unit, together with Panametrics
pulser-receiver PR 5052, gated peak detector GPD 5052, and 5MHz
broad band probes, as shown in figure 6.4. Again a dual probe
technique was used. The amplitudes may be in volts or dB with
various standards. These can be subtracted and the difference
displayed, thus giving a plot of frequency versus attenuation in dB in
the latter case.
220

pulser/receiver
PANAMETRICS 5052 PR
lSync· .
Gated peak detector panametrics 5052 GPD
"
--/"
~
R
T
echo
HEWLETT PACKARD 7475 A digital plotter
--
,r
gated -echo -
GP13 interface
I
probe
sample
quartz buffer rod
probe -
J
MARCONI spectrum analyser 2382 "
100kHz-400MHz 4Hz resolution
bandwidth
Figure 6.4 Instrumentation for the spectrum analysis attenuation measurements. The analyser plots the difference spectrum between the signals transmitted through the sample and the reference specimen, common errors are thus eliminated.

The best results were obtained using a quartz disc as a buffer rod,
taking as the reference the signal through the quartz, and subtracting
from this the signal through the specimen and the quartz, to give a
plot of attenuation versus frequency. The buffer rod introduced the
delay required to enable a correctly gated reference pulse to be
obtained, the low level of attenuation introduced by the quartz was
negated by the subtraction process. The grease proved to be the most
suitable couplant being capable of maintaining constant bonds
throughout the analysis process. Six repeat plots were made for every
sample, each obtained with independent probe-sample bonds. These
were superimposed on the same plot in different colours thus
facilitating the reading of attenuation data for analysis.
6.2.4 Simultaneous shear and compressional velocity measurements
on setting material.
For the simultaneous shear and compressional velocity measurements
on setting material the instrumentation described in 6.2.2 was used.
To enable both modes of propagation to be monitored on one sample a
switch box was incorporated to switch between the two pairs of
221
normal incidence shear and compressional wave probes.
Compressional wave probes of diameter 28.S0mm with nominal
transmitting frequencies of 1.2SMHz and 2.2SMHz and shear wave
probes, each "9.00mm in diameter, with nominal transmitting frequency
of 2.0MHz were used, with initially a separate experimental run for
each frequency. The receiving ultrasound probe for the two
compressional wave frequencies has a diameter of 28.S0mm and a
nominal frequency of 2.2SMHz whilst that for the shear wave has a
diameter of 9.00mm and a nominal frequency of S.OMHz. The frequency
bandwidth of the higher frequency probe used as a receiver covers the
frequency spectrum of the transmitting probe. At these higher
frequencies beam divergence problems were eliminated, but
unfortunately high attenuation during the first 30-S0 minutes of the
setting process prevented data acquisition during this time.
6.3 MEASUREMENT PROCEDURE,
6.3.1 Measurements on precast reinforced samples.
The mechanical test specimens for ultrasonic moduli measurements
were, as already stated, fragments some 1Sx1Sx220mm with at least
222

two parallel long faces. In order to ensure repeatable results the
samples were marked at various points so as to indicate direction of
measurement and measured with a digital micrometer and examined
ultrasonically at these same points. A simple jig was constructed to
support the samples and probes to ensure accurate placement and
parallelism. A constant contact pressure was arranged for each set of
probes by the application of a fixed mass to the upper probe which was
free to move in a vertical axis only. This arrangement shown in figure
6.5 provided adequate rigidity and accuracy for measurements together
with a quick and simple operation.
6.3.2 Continuous monitoring of setting samples.
A mould cell to retain the ceramic ensuring a constant thickness of
material for ultrasonic monitoring was made of perspex and is
illustrated in figure 6.6. The ultrasound probes were aligned in
contact with opposite sides of the perspex walls. Pressure on the
walls was kept to a minimum to prevent flexing of the thin walls
causing loss of parallelism. Cavities of suitable dimensions were
machined into the perspex both to locate the probes and minimise the
thickness of perspex at the measuring points. Screw clamps to fix the
223

weights
probe --.....f
:.:lii'r:::Iff:':r:m:tj_g--- slide arrangement to allow movement in vertical axis only
specimen
clamp -1~llliill probe ----4
Figure 6.5 Jig for maintaining steady probe /specimen contact The lightly stippled part complete with attached probe is free to move in a vertical axis against the fixed heavily stippled part.

compressional transducer
- - - "'t:' ==::t
09mm
-------------~~~~
compressional
transducer~
36.9mm
sample
\ ,.......--.,;._.....1.----,
II
~~ 1.85 mm
/compressional ¥ transducer
miniature shear transducer
perspex sheets 12.3mm thick
compressional
/ transducer
~~---------T-----------
~~---~------------
28.5 mm
Figure 6.6. Sample mould and transducer assembly. 80th the compressional and shear transducers locate in carefully aligned slots, milled to give an exact fit, and are secured by integral clamps. The lower diagram shows a cross section of the mould system.
probes in position were incorporated into the design.
Due to the high attenuation of the transmitted pulse in the sample, the
optimum thickness of the mould, for the high frequency measurements,
was found to be rather small (13mm). This was the minimum
thickness at which the received transmitted pulse could just be
separated from the pulse electromagnetically radiated directly from
the transmitting to the receiving probe.
The probes were aligned and clamped in position. Acoustic bonds
between the transducer buffers and the specimen were made using
Castrol water pump grease, (for compressional waves) and
Panametrics SWC supplied by Diagnostic Sonar Ltd (for shear waves).
Measurements were made on the first quarter cycle of the first
transmitted pulse to minimise any ambiguity, and monitoring
continued for approximately eighty hours. They were made at five
minute intervals for the first one hour and at half-hour intervals until
approximately twenty hours had elapsed when measurements at
approximately five hour intervals were adequate.
At a particular stage in the curing process the amplitude of the
transmitted ultrasound pulse decreased abruptly. This was attributed
224

to the hardened material becoming detached from the cell walls thus
breaking the ultrasonic bond. The ceramic was at this stage strong
enough to be removed from the cell without damage, and the sample
was then monitored with the probes in direct contact with the same
faces of the sample.
The surface roughness of the ceramic necessitated a thicker layer of
couplant than that required to couple two probes in direct contact,
which meant that a simple correction for the probe buffers by
difference between the delay settings with and without the specimen
was not valid. The difference between the corrected transit time
immediately before the loss of signal, and the measured time
immediately after the removal of the sample from the cell
(demoulding) is almost entirely due to the transit time of the probe
buffers and the couplant. Taking the difference between this change
in transit time, and the measured delay setting, yields the transit time
for the ultrasound beam through the ceramic alone.
At the end of each monitoring period, the bulk density of the sample
was measured using Archimedes' principle. After the initial weighing
the sample was given a thin coating of grease to prevent the
absorption of water by the ceramic. The error due to absorbed water
225
would invalidate the density value obtained, whilst that due to the
presence of the grease was considered negligible, approximately 0.30/0
at worst. The density calculated for the basic composition, with
approximately 60wt<>/0 alumina filler, was 2300 + 1 00kgm-3 over the
range of samples. Those prepared in the laboratory were generally at
the lower extreme due to lack of vacuum during preparation. The
variation in filler volume fraction resulted in a range of densities
down to 1561 kgm-3 . The density of the ceramic in its initial paste
state was also calculated from the mass of the paste in the cell and
the volume of cell filled by the paste. There was no detectable change
in density between the initial and final state of the ceramic within the
experimental error given above. This implies that practically all of
the water present in the original mix is taken up as water of
crystallisation during the course of the reaction. However the fact
that the material becomes detached from the mould indicates that
there must be some shrinkage taking place.
The time of flight values ranged from several microseconds to several
tens of microseconds for samples ranging from 6-15 mm. The sample
thickness was generally as high as possible commensurate with
adequate propagation of the ultrasonic pulses. The absolute timing
errors due to sample wedging effects and bond thickness variations
226
were estimated to be approximately 0.75% and 1 % for the
compressional and shear wave velocities respectively. Thus, the
changes in longitudinal and shear elastic moduli with composition are
accurate to within 1.5% and 2% respectively, whilst those of Poisson's
ratio are accurate to within 40/0. The changes in elastic moduli with
time are known to a much greater accuracy because of the high
precision of the timing circuitry, as implied earlier. Using the digital
delay generator, and spreading out the the waveform it is reasonable
to assume that the position of the peak of any cycle in an ultrasonic
echo can be spatially located on a CRO screen to a precision of about
1/100 of the wave period. This corresponds to a timing error of 5ns,
and it is clear that for the relative measurements under discussion the
precision is limited by the operating frequency employed (which was
as high as feasible given the high attenuation levels encountered)
rather than by the timing instrumentation.
227
7. EVALUATION OF PRECAST. FULLY CURED CERAMIC
SPECIMENS.
7.1 LOW FREQUENCY VELOCITY MEASUREMENTS.
As was established in section 3.4 an infinite set of compressional
wave modes of decreasing amplitude, (labelled by n, where n=1 ,2,3 ... )
are possible in the specimens, each one having a dispersion relation
which depends on the dimensions of the sample perpendicular to the
propagation direction. In each mode the pressure distribution across a
section perpendicular to the rod axis is not uniform. Thus to
propagate a pure mode a non uniform pressure distribution across the
couplant-sample interface is required, and it follows that a uniform
pressure distribution in the couplant will necessarily lead to mixed
mode propagation.
The experimental data measured at various frequencies up to 5MHz
show apparent variations in the longitudinal wave velocity in the three
samples. Figure 7.1 a-c shows a number of theoretical velocity
frequency curves with these data superimposed. The data generally lie
within the bounds of the peaks prescribed theoretically, and some
228
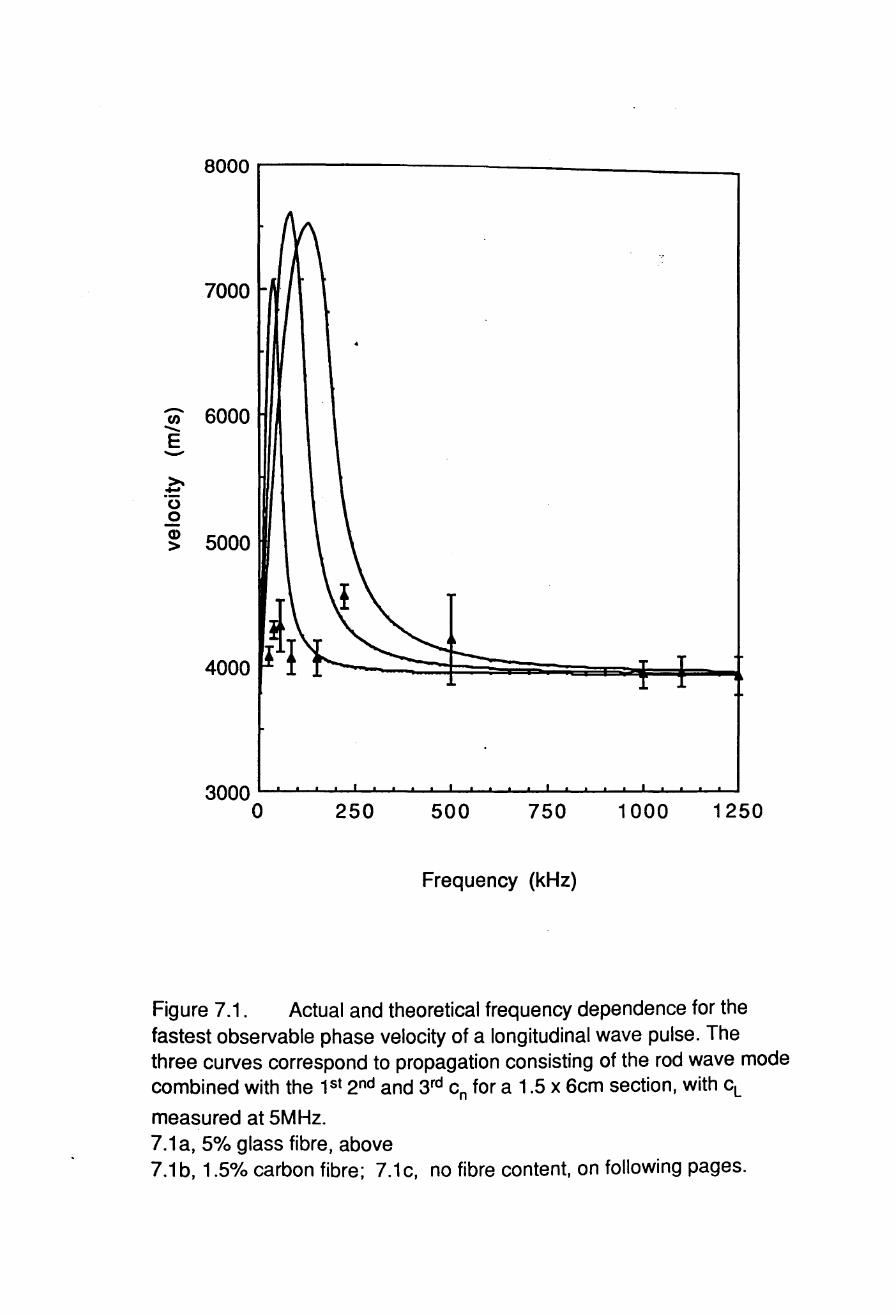
8000r-------------------------____ __
7000
- 6000 (/) ...... E -~ -0 0 Q)
5000 >
~ 4000 I
3000~~~~~~~~~~~~~~~~~
o 250 500 750 1000 1250
Frequency (kHz)
Figure 7.1 . Actual and theoretical frequency dependence for the fastest observable phase velocity of a longitudinal wave pulse. The three curves correspond to propagation consisting of the rod wave mode combined with the 1st 2nd and 3rd cn for a 1.5 x 6cm section, with cL
measured at 5MHz. 7.1 a, 50/0 glass fibre, above 7.1 b, 1.5% carbon fibre; 7.1 c, no fibre content, on following pages.
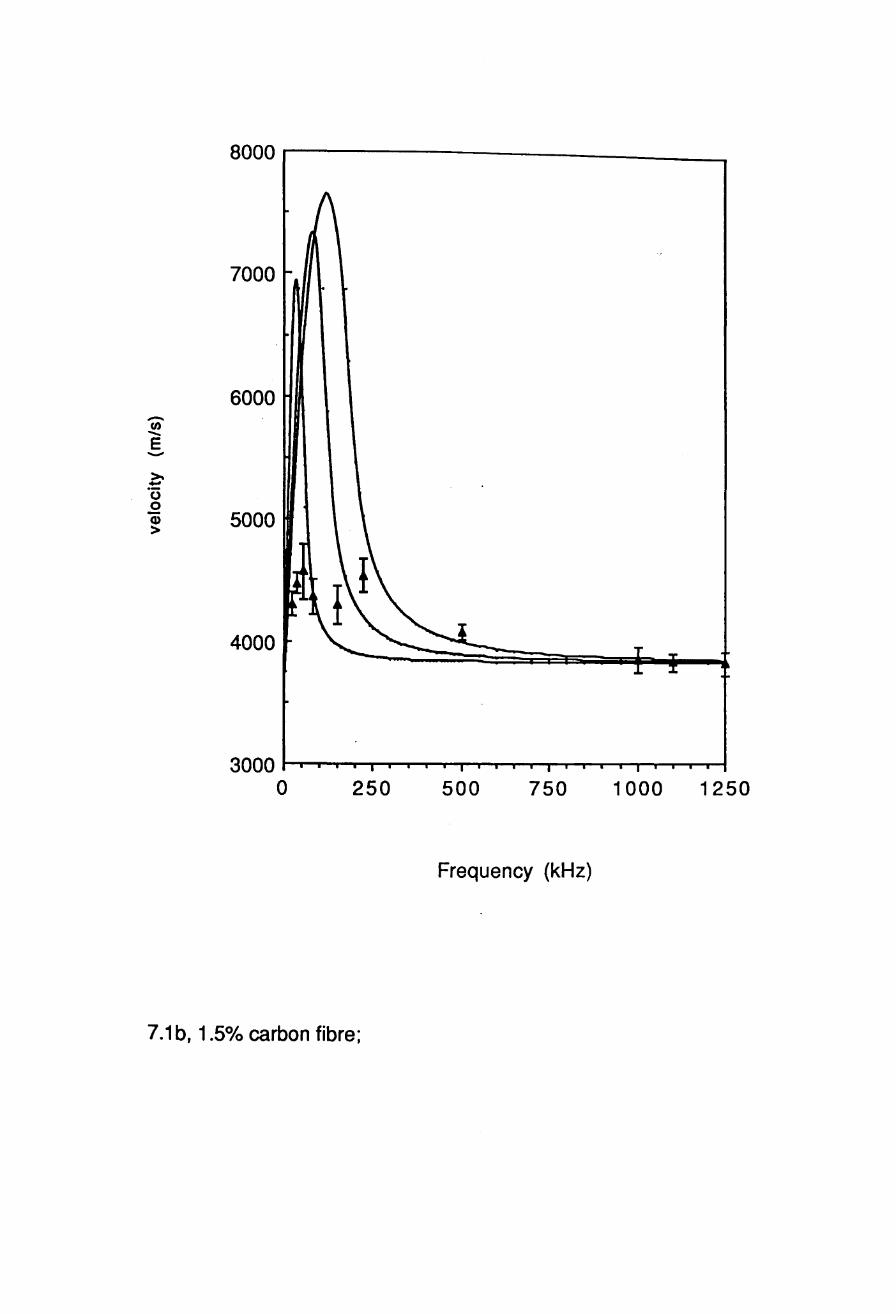
8000r-----------------------____ _
7000
6000 -(I) -E ->. -'0 0 CD 5000 >
4000
3000~~~~~~~~~~~~~~~~
o 250 500 750 1000 1250
Frequency (kHz)
7.1 b, 1.5% carbon fibre;
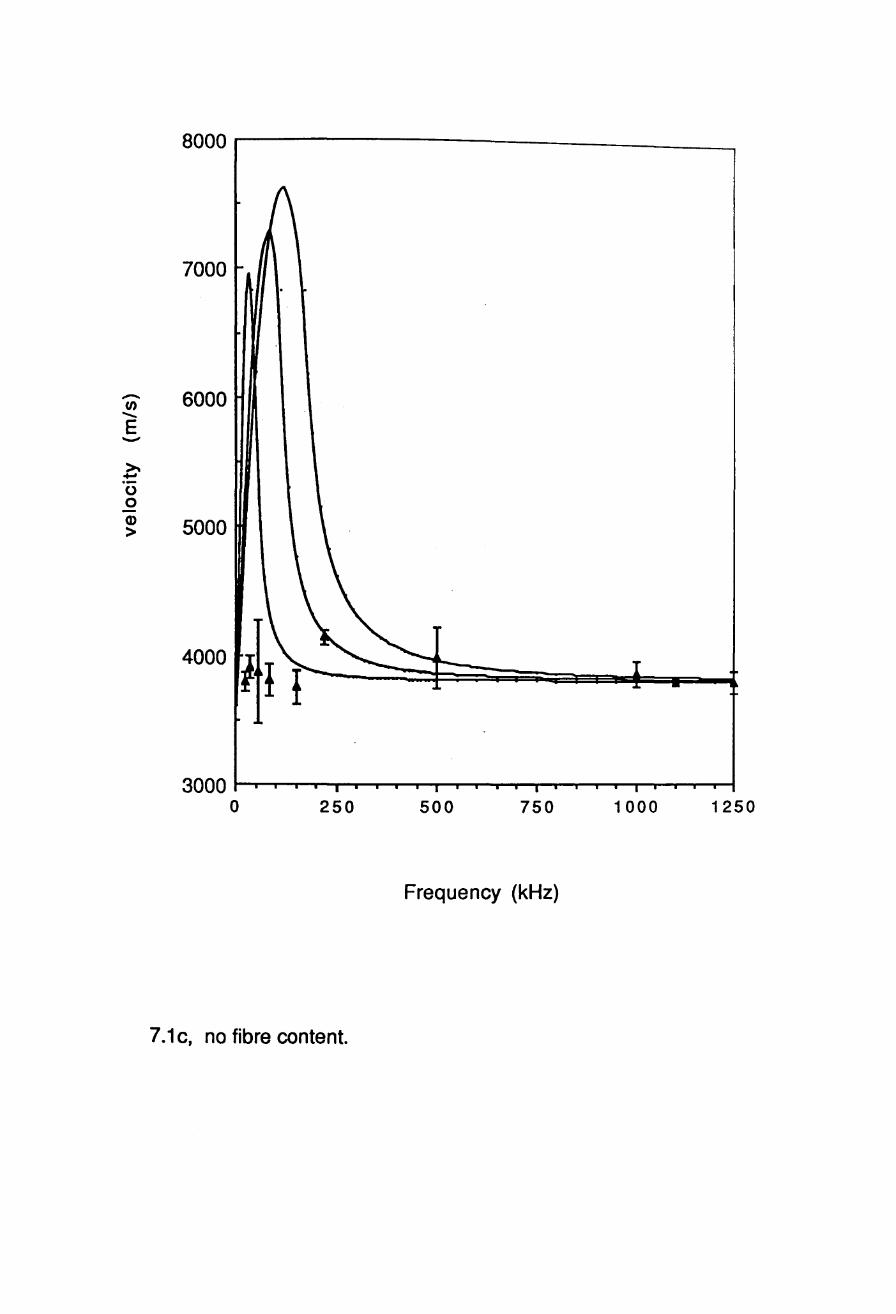
8000r---------------------------____ ~
7000
- 6000 (/) ....... E -~ ... 0 0 CD 5000 >
3000~~~~~~~--~----~~~~~~~
o 250 500 750 1000 1250
Frequency (kHz)
7.1 c, no fibre content.
coincide approximately with the theoretical curves. However they do
not correspond to any specific mode nor do they approach the
theoretical maxima. The presence of a mixture of c modes of low n n .
values (1,2,3) together with the rod wave mode at the lower
frequencies would explain the apparent variation in velocity with
frequency. These velocity data are derived from a digital indication of
time corresponding to that of the fastest mode having a pulse
amplitude in excess of of the equipment's trigger threshold. It is
possible that different mixtures of modes are propagated over this
range of frequencies thereby leading to inconsistent velocity values.
The use of these low frequency methods would seem to be limited by
specimen parameters but possibilities exist for their use where
samples are large and other methods are suffering from attenuation
problems. In this circumstance the uncertainties about the mode of
propagation and the apparent inconsistency of the velocity values will
diminish as the thickness of the specimen increases. In the case of a
particular component a specified measurement can be compared to
predetermined values particularly where accept/reject decisions are
all that is required.
229
7.2 HIGH FREQUENCY ELASTIC MODULI.
The data in section 7.1 demonstrate that any inconsistency in the
measured velocity values occur at frequencies of about 500kHz and
lower. Above this frequency the measured velocity values become
independent of frequency.
A comparison of ultrasonically measured elastic moduli with
theoretical bounds for 2-phase materials, Bridge (1986a, 1987c) as
discussed in chapter 3, can provide information about the material.
The Hashin and Shtrikman bounds are valid for an arbitrary phase
geometry (ie any particle size and shape distribution and any spatial
distribution of particles) providing that certain conditions hold.
These are:
(i) the particle dimensions are small with respect to 'JJ4,
(ii) adhesion between the filler and the matrix is good,
(iii) there are no voids in the matrix.
If an additional condition holds, namely that the particles are
spherical, then the experimental data should lie exactly on the lower
230
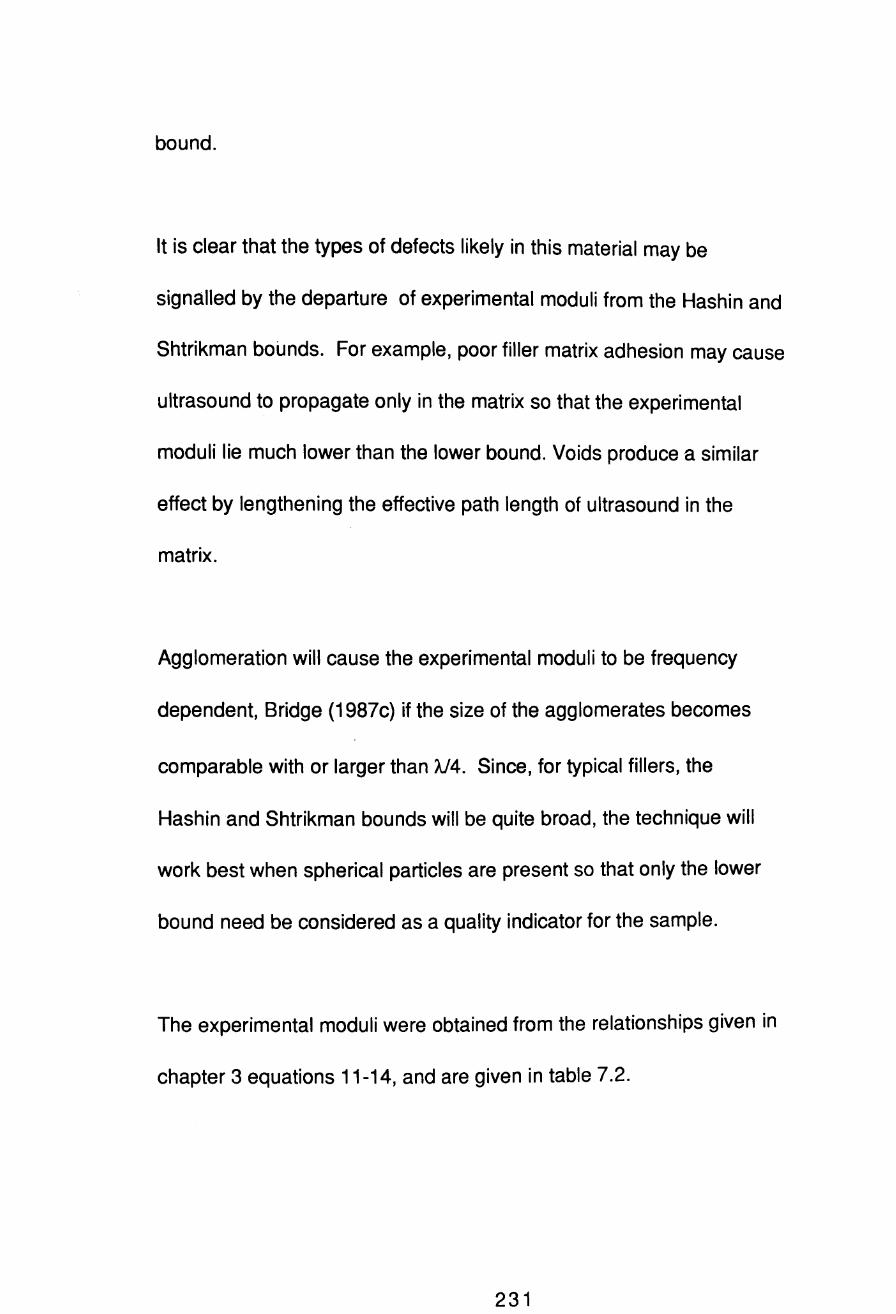
bound.
It is clear that the types of defects likely in this material may be
signalled by the departure of experimental moduli from the Hashin and
Shtrikman bounds. For example, poor filler matrix adhesion may cause
ultrasound to propagate only in the matrix so that the experimental
moduli lie much lower than the lower bound. Voids produce a similar
effect by lengthening the effective path length of ultrasound in the
matrix.
Agglomeration will cause the experimental moduli to be frequency
dependent, Bridge (1987c) if the size of the agglomerates becomes
comparable with or larger than A14. Since, for typical fillers, the
Hashin and Shtrikman bounds will be quite broad, the technique will
work best when spherical particles are present so that only the lower
bound need be considered as a quality indicator for the sample.
The experimental moduli were obtained from the relationships given in
chapter 3 equations 11-14, and are given in table 7.2.
231

Table 7,2 Elastic constants measured at 5MHz
5% Glass 1,50/0 carbon no fibre no alumina
Shear modulus (GPa) 14,33 14.77 12,66
Bulk modulus (GPa) 17.33 15,12 16,67
Young's modulus (GPa) 33,70 33.42 30,30
Poisson's ratio 0,18 0,13 0.19
The most striking feature of these results is that the bulk modulus of
the fibre-free ceramic is a factor of 10 less than the bulk moduli of
2,30
5,20
6.01
0.30
the constituent oxides, magnesia and alumina, which are 162 and
252GPa respectively, When such a large change of modulus occurs
during a manufacturing process there are obvious prospects of using
this property for non destructive process monitoring, since only a
slight departure of the final material from its intended composition
may produce substantial modulus variations. It is interesting to note
that the elastic moduli of the three finished samples differ by less
than 10%, notwithstanding the order of magnitude change in modulus
during processing mentioned previously, Therefore it seems
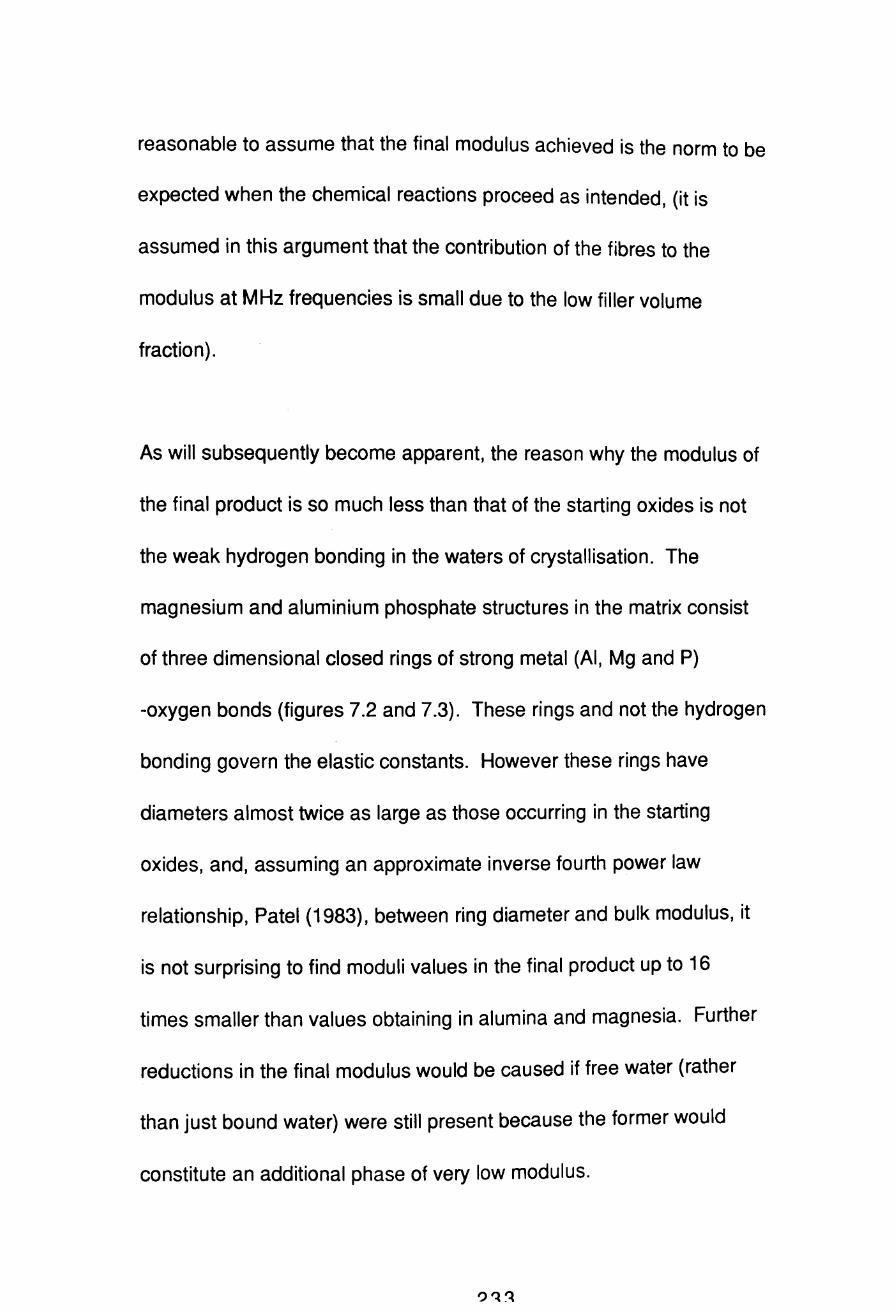
reasonable to assume that the final modulus achieved is the norm to be
expected when the chemical reactions proceed as intended, (it is
assumed in this argument that the contribution of the fibres to the
modulus at MHz frequencies is small due to the low filler volume
fraction).
As will subsequently become apparent, the reason why the modulus of
the final product is so much less than that of the starting oxides is not
the weak hydrogen bonding in the waters of crystallisation. The
magnesium and aluminium phosphate structures in the matrix consist
of three dimensional closed rings of strong metal (AI, Mg and P)
-oxygen bonds (figures 7.2 and 7.3). These rings and not the hydrogen
bonding govern the elastic constants. However these rings have
diameters almost twice as large as those occurring in the starting
oxides, and, assuming an approximate inverse fourth power law
relationship, Patel (1983), between ring diameter and bulk modulus, it
is not surprising to find moduli values in the final product up to 16
times smaller than values obtaining in alumina and magnesia. Further
reductions in the final modulus would be caused if free water (rather
than just bound water) were still present because the former would
constitute an additional phase of very low modulus.

~Mg p 00
Figure 7.2. Unit cell structure of crystaline newberyite after Sutor, 1967. The magnesium atoms are approximately coplanar and lie between two planes of phosphorus atoms. They are co-ordinated octahedrally by the oxygen atoms from the phosphate groups and the three water molecules, the hydrogen atoms have been ommitted for clarity.
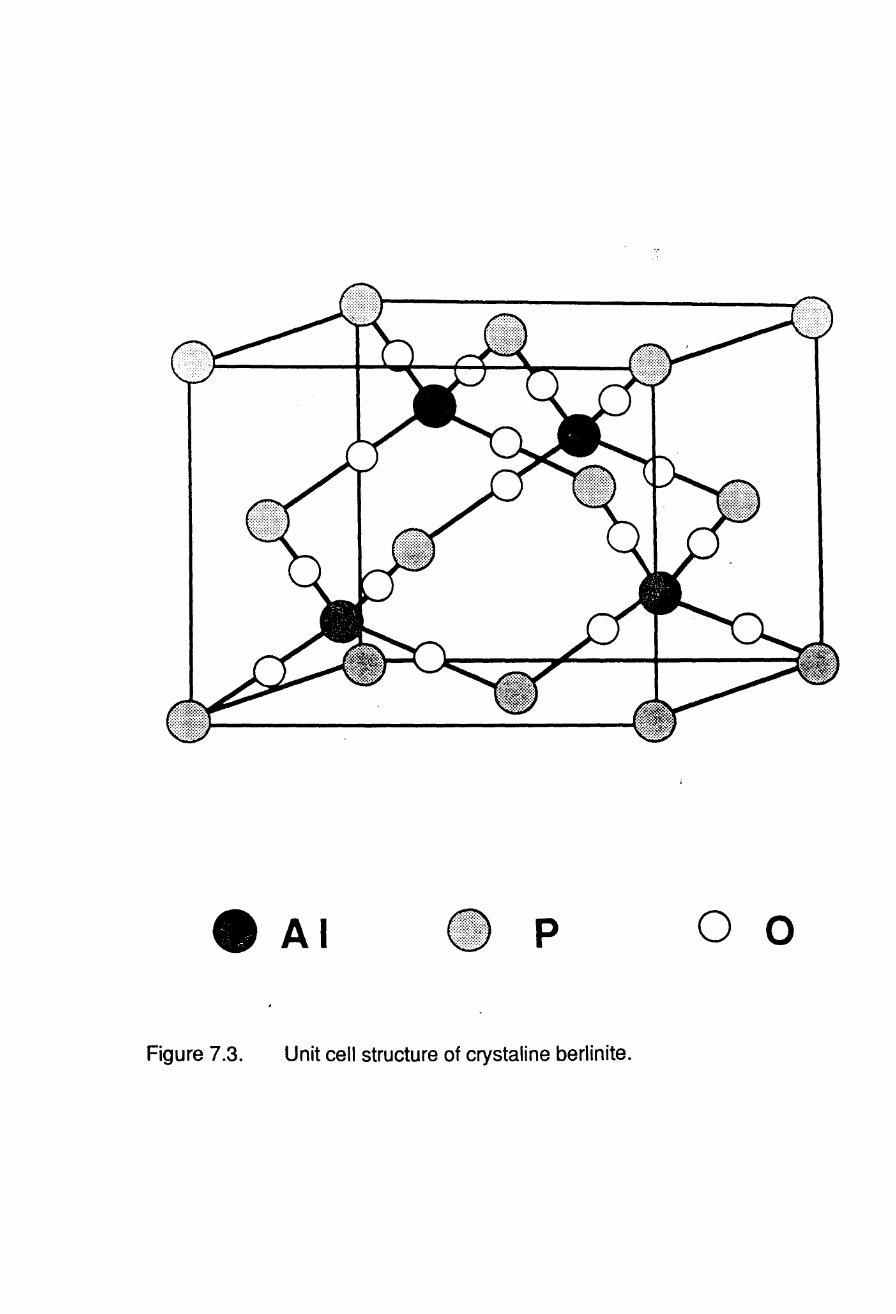
AI p o 0
Figure 7.3. Unit cell structure of crystaline berlinite.

A sample of material with the same aluminium acid phosphate:
magnesia ratio but devoid of alumina was prepared. This: was found to
have a density of 1561 kgm-3 , and elastic constants as given in table
7.2. Substituting this density and those of the filled sample and
alumina, 2356 and 3980kgm-3, Kingery (1950), respectively, into
equation 20, chapter 3, a matrix volume fraction of 0.67 is obtained.
This is in good agreement with the matrix volume fraction of 0.70
obtained from consideration of the starting composition, and implies
that the alumina is simply a space filler and takes little part in the
reaction. It would therefore seem reasonable to assume that the
elastic constants of the matrix in the filled composite are very
similar to those obtained for the unfilled sample.
Proceeding on this assumption, Hashin and Shtrikman bounds were
calculated considering the unfilled material and alumina as the end
members such that:
K1= 5.2 K2 = 251.2 G1 = 2.3 G2 = 163.4 V1 =0.67 V2= 0.33
Substituting in equations 16-19 from chapter 3 one obtains bounds for
the bulk modulus of 9.32 and 52.09GPa, and for the shear modulus of
4.42 and 34.75GPa. The actual measured values lie between these two

bounds towards the lower bound and thus one can conclude that there
is no definite layer structure, nor are the particles spherical, since
the moduli are not at the lower bound. It would be reasonable to
assume therefore that the particles are flattened or plate like. This
assumption has since been confirmed by scanning electron microscopy.
The structure of newberyite, one end product of the reaction, was
documented by Sutor, who worked on crystalline material from Skipton
caves, Australia, Sutor {1967}. The structure is illustrated in figure
7.2 after Sutor. Using this structural data a theoretical value for the
bulk modulus was calculated, using the model of Bridge and Higazy,
Bridge {1986a} discussed in chapter 2.7, from the relationship:
(27)
Where for bond type i, Nfi is the number of formula units in which
the bond resides per unit volume, nfi is the number of network
bonds per formula unit, rj is the network bond length, and Fi is the
first order stretching force constant. The factor S is less than
unity and decreases with the extent to which isotropic elastic
deformation leads to bending rather than direct compression of

bonds, Patel (1983). The summation function, conveniently
abbreviated to Kbc ' represents the bulk modulus that would obtain
if no bond bending takes place. Values of Fj can be estimated from
the empirical relation:
(Xa~) 3/4
F = 5.28N + 30 Nm-1 (28) r2
where r is in nm,. N is the bond order, and Xa and Xb are the
electronegativities of the two atoms.
Denoting i = 1 and 2 for Mg-O and P-O bonds respectively, and
neglecting the weaker H-O-H bonds, the following list of values
can be drawn up, t~king the unit cell as shown as the formula unit.
1
2
Mg-O
P-O
r1 = 0.204 nm
r2 = 0.153 nm
F1 = 198 GPa
F2 = 424 GPa
The values for r being the mean of the reported values, and the
values for F have been obtained from equation, Reynolds (1984), by
the use of electronegativity values (Allred-Rochow scale), of 1.2,
2.1 and 3.50 for Mg, P and 0, respectively, Cotton (1972). We also
236
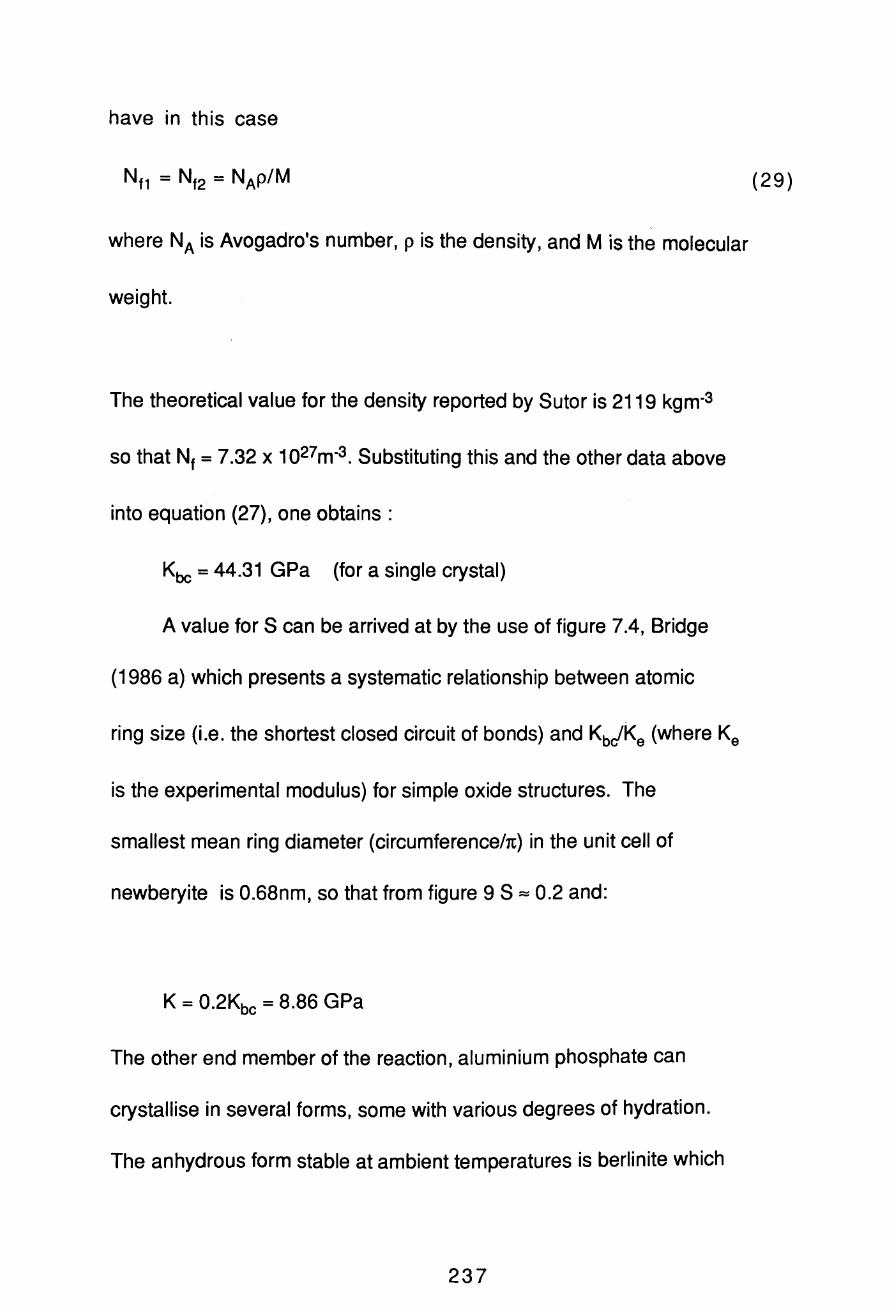
have in this case
where NA is Avogadro's number, p is the density, andM is the molecular
weight.
The theoretical value for the density reported by Sutor is 2119 kgm-3
so that Nt = 7.32 x 1027m-3. Substituting this and the other data above
into equation (27), one obtains:
Kbc = 44.31 GPa (for a single crystal)
A value for S can be arrived at by the use of figure 7.4, Bridge
(1986 a) which presents a systematic relationship between atomic
ring size (Le. the shortest closed circuit of bonds) and Kbc!Ke (where Ke
is the experimental modulus) for simple oxide structures. The
smallest mean ring diameter (circumferenceht) in the unit cell of
newberyite is 0.68nm, so that from figure 9 S ::= 0.2 and:
K = 0.2Kbc = 8.86 GPa
The other end member of the reaction, aluminium phosphate can
crystallise in several forms, some with various degrees of hydration.
The anhydrous form stable at ambient temperatures is berlinite which
237
(29)

12r---------------------------~--~
10
8
6
4
2
o~------~--------~--~--~--~~~ u.2 0.4 0.6 0.8 1 .0
ring diameter (nm)
Figure 7.4. Dependence of Kt,dKe on· the mean atomic ring size in pure
oxide glasses, where ~ is the theoretical bulk modulus that would
arise if bonds did not bend during isotropic deformation, and Ke is the
experimental modulus.

has the structure illustrated in Figure 7.3, Kingery (1950), Wyckoff
(1965), and a density of 2566kgm-3, CRC Handbook (1989). The
aluminium and phosphorus have, respectively, electronegativities of
1.5 and 2.1, bond lengths with oxygen of 0.156 and 0.170nm, Wyckoff
(1965), Sutor.(1967), and co-ordination number of 4.
Thus from equations 28 and 29 one can derive the following values:
1
2
AI-O
P-O
nf1 - 4
nf2 - 4
r1 = 0.170 nm
r2 = 0.156 nm
F1 = 291 Nm-1
F2= 413Nm-1
Substituting the data above into equation (27), and taking Nf1 and Nf2
(from equation 29) to be 1.26 x 1 028m-3 one obtains:
Kbc = 93.6 GPa (for a single crystal)
The mean atomic ring size of 0.622nm gives from figure 7.4 a value for
S of 0.29 and;
K= 0.29 Kbc =27GPa
Given the reaction proposed earlier the volume fraction of newberyite
in an unfilled ceramic is about 800/0. Thus, given the theoretical
estimates for the bulk moduli of newberyite and aluminium
orthophosphate, 8.9 and 27GPa respectively, the Hashin and Shtrikman
238
formulae (equations 16 and 18, chapter 3) can be applied to compute
theoretical bounds on the bulk modulus of this unfilled ceramic
product. In the absence of a theoretical computation of shear moduli
for newberyite or aluminium orthophosphate the approximation that G1
and G2 ( equations 17 and 19, chapter 3 ) are equal to the
experimentally determined shear modulus of the ceramic product
2.30GPa has been made. The result is:
K = 10.4GPa (theoretical estimate for non-porous unfilled ceramic)
there being no difference between upper and lower bound within the
first 3 significant figures.
So far we have only considered ideal pore-free samples. Substitution
of the theoretical (unit cell) density of newberyite (2111 kgm-3) and
aluminium orthophosphate ( 2566 kgm-3) into equation 20, chapter 3,
with an assumed volume fraction of newberyite of 0.8, the theoretical
density of the non-porous product is 2208 kgm-3. The density of the
actual product was, however 1561 kgm-3 . Substitution of these two
densities in equation 20, and taking the density of the pores to be zero,
the volume fraction of porous voids is established to be 0.29. If the
239
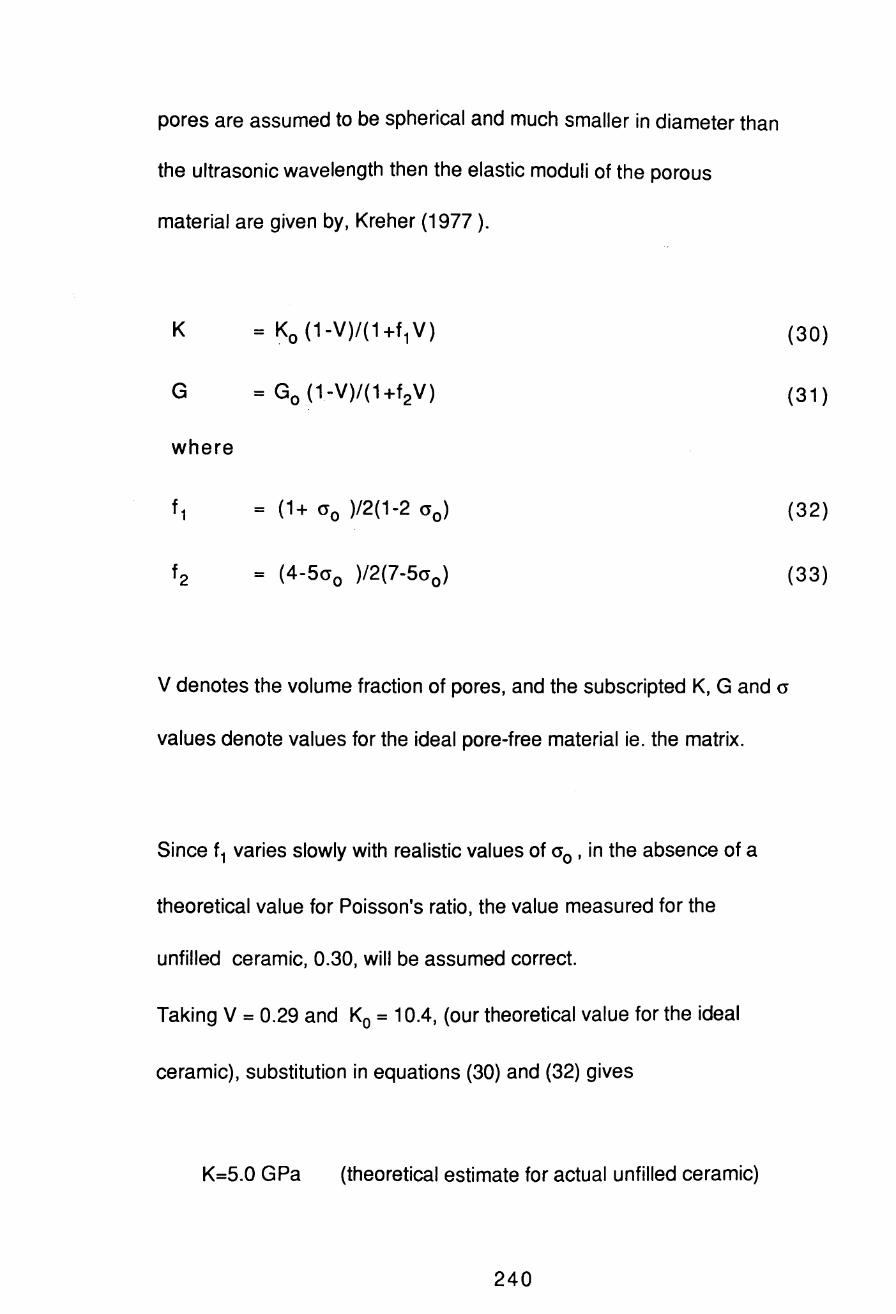
pores are assumed to be spherical and much smaller in diameter than
the ultrasonic wavelength then the elastic moduli of the porous
material are given by, Kreher (1977 ).
K
G
where
= Ko (1 -V) 1 ( 1 + f 1 V)
= Go (1-V)/(1+f2V)
= (1 + 00 )/2(1-2 (0)
= (4-500 )/2(7-500)
(30)
(31)
(32)
(33)
V denotes the volume fraction of pores, and the subscripted K, G and ° values denote values for the ideal pore-free material ie. the matrix.
Since f1 varies slowly with realistic values of 00' in the absence of a
theoretical value for Poisson's ratio, the value measured for the
unfilled ceramic, 0.30, will be assumed correct.
Taking V = 0.29 and Ko = 10.4, (our theoretical value for the ideal
ceramic), substitution in equations (30) and (32) gives
K=5.0 GPa (theoretical estimate for actual unfilled ceramic)
240

in reasonable agreement with the experimental value of 5.20. This
supports the hypothesis that newberyite is the main reaction product.
In the above model of the elastic behaviour of the ceramic matrix,
starting with equation (27), an implicit assumption has been made that
the presence of hydration does not affect moduli values dramatically.
This seems a reasonable assumption when one considers that in both
the newberyite and aluminium orthophosphate structures there are
closed ring networks comprising Mg-O or AI-O, and P-O bonds so that
there is no question of weak hydrogen bonds breaking what are
essentially 3-dimensional networks of strong and relatively
directional bonds. If such an effect had been present the Kbc!Ke - ring
size relationship used would have been invalid.
The excellent agreement between theory and experiment achieved in
the above analysis provides an example of how ultrasound -based
moduli measurements can be used for quality control and assurance
purposes. Comparison between experiment data and theory may allow
one· to decide non-destructively ie. without sectioning or chemical
analysis, whether the level of porosity in the matrix is within
,.. A ...

tolerable limits.
Certain of the above theories were applied to various compositions of
barium-yttrium-copper oxide high T c superconductors shortly after
their discovery. The data were obtained from samples made in house
and donated from other sources, together with published elastic data
and resulted in the publication of a number of papers, Round (1987),
Bridge (1988b, 1989).
7.3 ATTENUATION DATA.
The attenuation data obtained by narrow band and spectrum analysis
techniques are shown in figures 7.5 and 7.6. These graphs were
manually curve fitted, with estimated peaks drawn assuming the
theoretical analysis to hold, a reasonable assumption in view of the
spectrum analysis plots. These were obtained from the Hewlett
Packard spectrum analyser, which can display and plot the difference
between any two spectra of interest, printing the spectra displayed on
the VDU by means of a digital plotter, via the general purpose
interface bus (GPIB). Difference spectra between samples and a

60
50
-co -0 -c: 40 0 ~ «S :J c: CD ~ ~ «
30
20
10--~------~--~------------~--~--~
U.O 2.0 4.0 6.0 8.0 10.0
Frequency (MHz)
Figure 7.5. Plot of attenuation versus frequency determined by the narrowband technique on 1.Scm ceramic blocks with various fibre contents: A, 5% glass fibre; B, 1.5% carbon fibre; C, no fibre content.
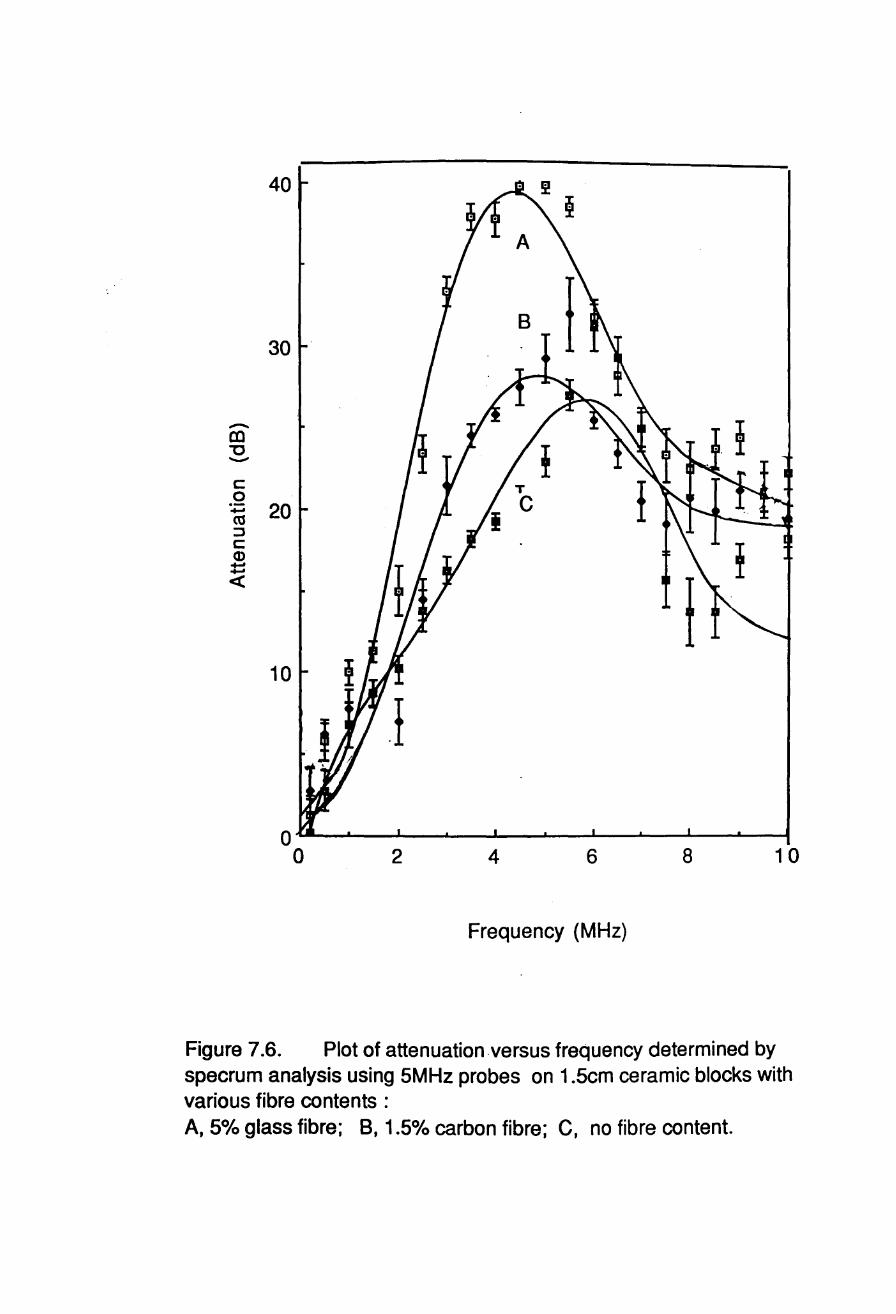
40
30
-c:c u -c: 0 ... 20 «S ::J c: (J) ... ... «
10
o~--~--~----~--~--~--~--~----~ o 2 4 6 8 10
Frequency (MHz)
Figure 7.6. Plot of attenuation versus frequency determined by specrum analysis using 5MHz probes on 1.5cm ceramic blocks with various fibre contents : A, 50/0 glass fibre; 8, 1.50/0 carbon fibre; C, no fibre content.
quartz buffer rod reference were plotted. Six repeat plots were made
for every sample, each obtained with independent probe-sample bonds,
and from these the data and error bars for figure 7.6 were derived.
Plots for the three samples under discussion are given in figures
7.7-7.9. The attenuation data show considerable differences in the
frequency dependence of the three samples indicating a considerable
potential of the measurements for materials sorting. They also show
pronounced maxima indicative of the transitions between Rayleigh,
stochastic and diffusive scattering modes, potentially useful in grain
size determination. Differences between the narrow band and
spectrum analysis techniques used would necessitate the adoption of
one technique as standard, and spectrum analysis would be the most
suitable commercially.
Examination of the frequency regime in which the data are most
reliable (2 - 4MHz) indicates that the attenuation of all samples varies
approximately as the first power of the frequency. This could be due
in part to a hysteresis or multi-relaxational loss, but if there is a
scattering contribution (as) it must be of the stochastic type,
i.e. IJ3 < d < 3", and as ==: const2.df. Given the typical wave velocity of
243
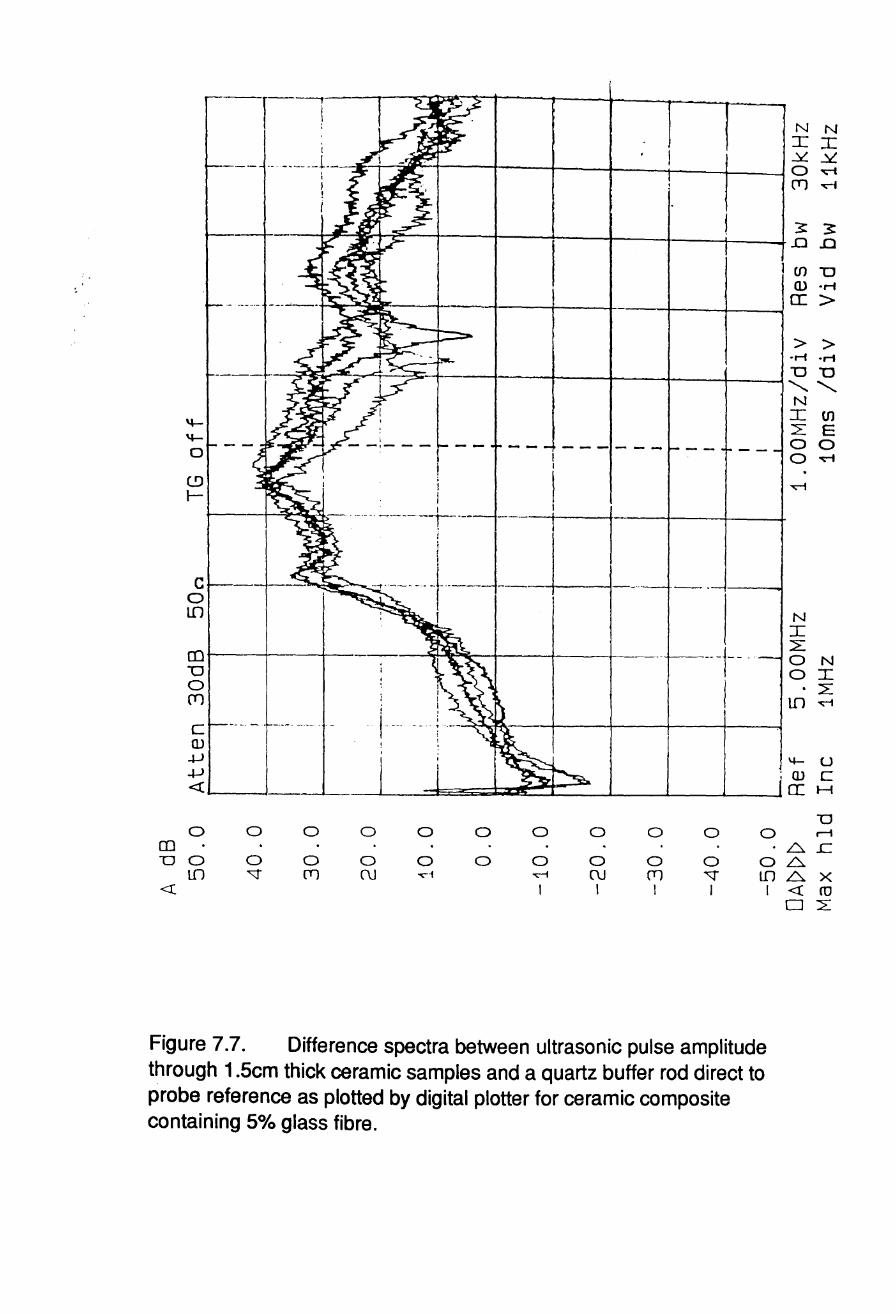
-- ------r
! N N
i I I -- -------1--- ~ .Y.
0 '1;""1
(T) ~
~ 3 .0 .0
I U) "0 W .r-t a: >
> > .r-t .r-t
---- ----;;~~~~.cr.:.~~-i---+----i--+~----l!---+-_~"O "0 ""- ""N
t!J l--
c o Ul
I
--t-------- J------I
: I
en ~-_1_-__+----_sor._~~+_-_+--+_- -+-"0 o (lJ
! --- ---
-- -1- --j
I Ul L E 00 o ~
N I 2: 0 N 0 I
L to n
4- U -w c a: H
D o o
o ~
o o (T)
o
o (\J
o o
0 0 0 0 0 0 rl m . 6. .c TI 0
l!l 0 0 0 0 0 o 6.
",1 ~ (\J (T) ~ LD 6. x I I I J
Figure 7.7. Difference spectra between ultrasonic pulse amplitude through 1.5cm thick ceramic samples and a quartz buffer rod direct to probe reference as plotted by digital plotter for ceramic composite containing 50/0 glass fibre.
I <! (tJ
02:

-- ----
1----4------- - .. -~~ ----- --
~ I~ ~ --+ -~;;;::.-.t~
\
CD I
~.+-~ I !
N N I I ..Y: ..Y: 0 ~
(T) ~
~ ~ -.0 .0
(f) TI ill ·rl a: >
> > ·rl ·rl
TID
"'- "'-N I en L E 00 o~
N I L
(I) --+---+----1 co N D 0 (TJ
C __ • ___ .• • i .. -----.
ill -+J -+J <:(
0 0 0 0 0 0 0 0 0 0 0 (I) D 0 0 0 0 0 0 0 0 0 0 0
tf1 '1" (T) C\J -rl ~ C\J (T) "'T lD <l: I I I I I
Figure 7.8. Difference spectra between ultrasonic pulse amplitude through 1.5cm thick ceramic samples and a quartz buffer rod direct to probe reference as plotted by digital plotter for ceramic composite containing 1.5% carbon fibre.
mJ: L
'1"~
4- U ill C a: H
D r-i
6 .c .6. .6. X <:( co 0 2:
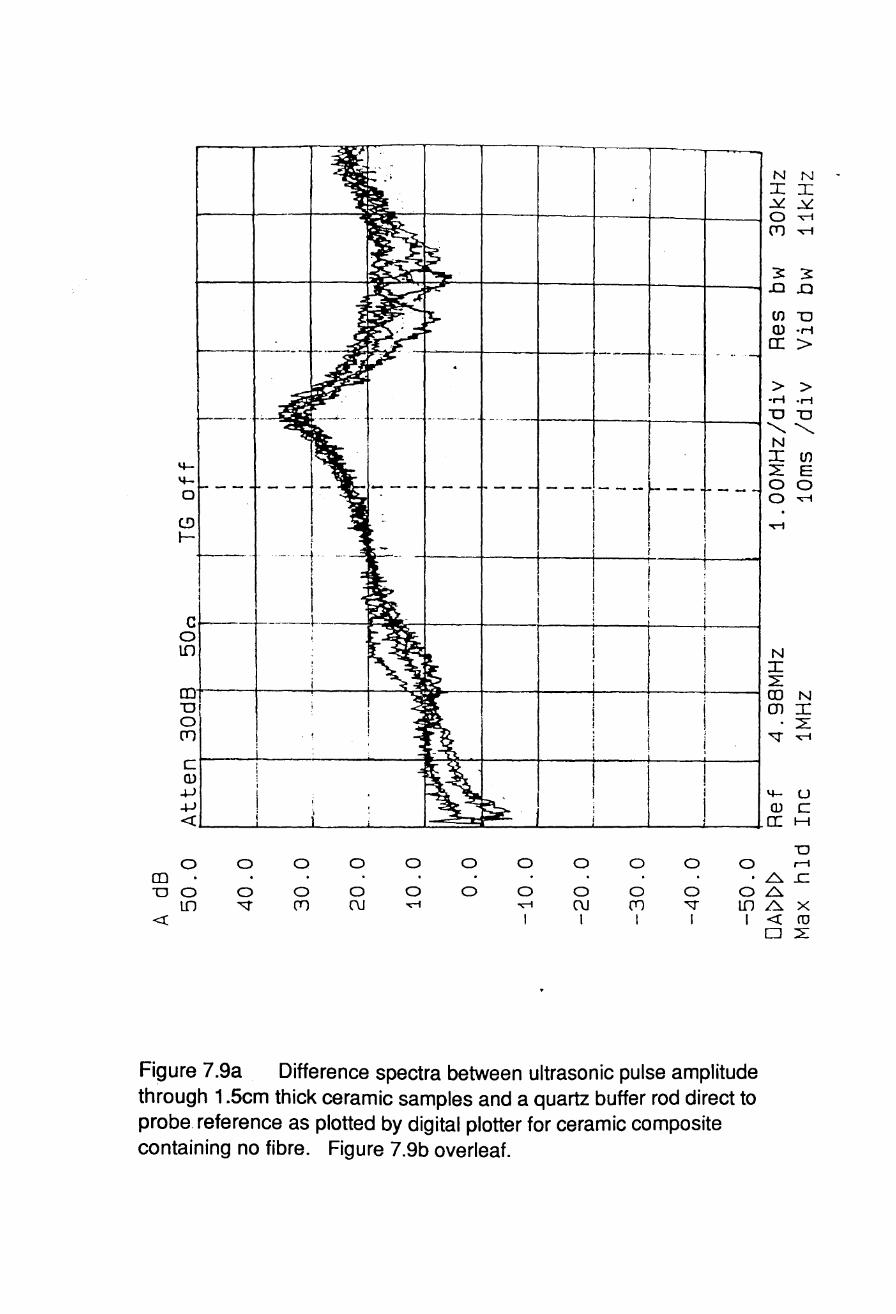
N N I :r:: .Y. .Y. 0 ~ (l1 ~
3: 3: .0 .a (J) "0 Q) ·rl a: > .-.. _-_ ... -
-~.- --. - -- ..
> > 'M ·rl _ .. - -- ... - .-.- -.-- -. ----"-- -0 "0 ""- '-....
. i
---I---r--t--N I (J)
4- :E E 4- 0 0 a 0 ~
CD ...., r- ! ! I i i
._-. --~ - -.- I ( I
i
I C --+-..-
0 tn N
I :E en CD N
"0' m :r: 0
1 . L (ll .. ~ ~
C OJ +J 4- U +J OJ C <t a: H
"0 0 0 0 0 0 0 0 0 0 0 0 rl
m . .6. ..c: "0 0 0 0 0 0 0 0 0 0 0 0.6.
tn ~ (ll (\j ...., ....--1 (\j (ll ~ lf1 « I I I I I
Figure 7.ga Difference spectra between ultrasonic pulse amplitude through 1.5cm thick ceramic samples and a quartz buffer rod direct to probe reference as plotted by digital plotter for ceramic composite containing no fibre. Figure 7.9b overleaf.
~ <t 0
x co L
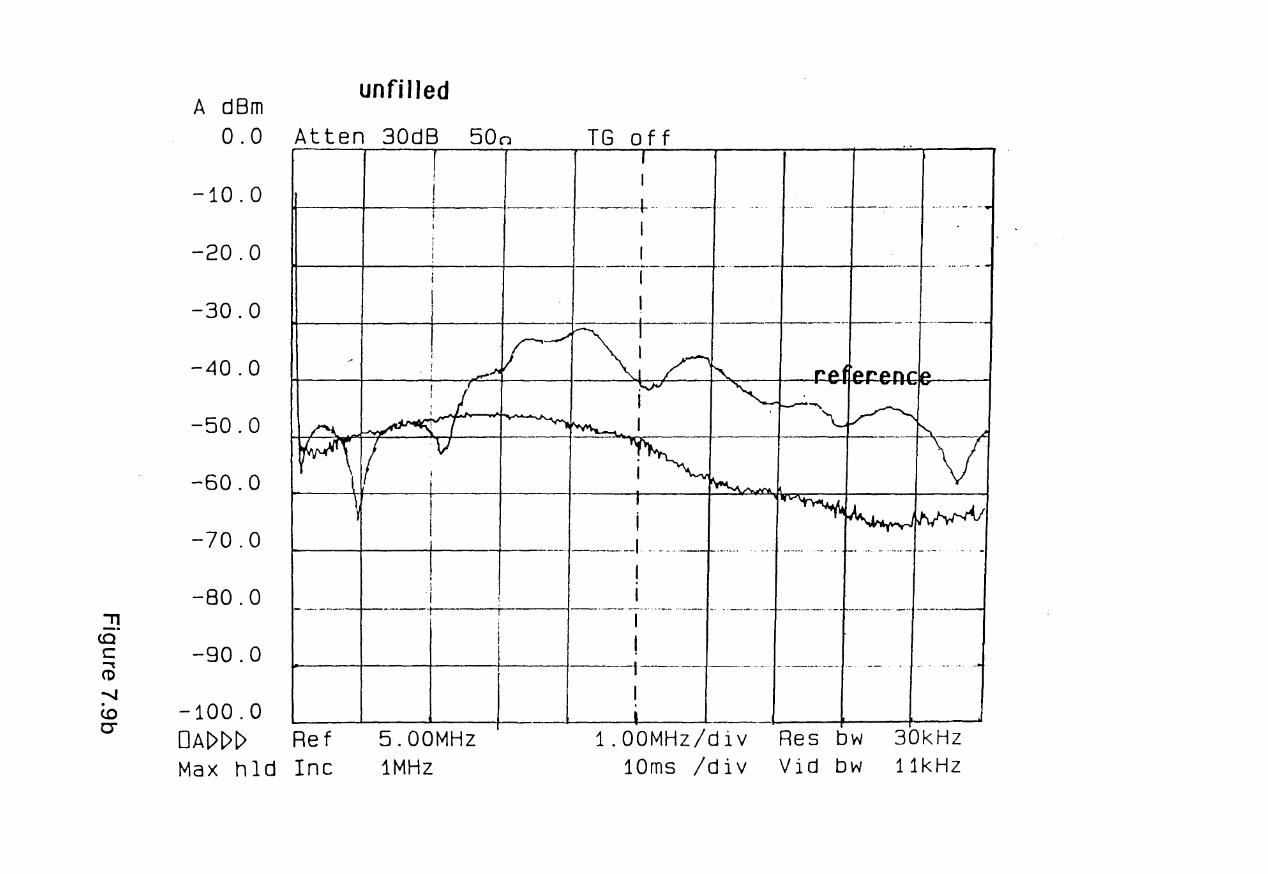
" _. (Q c """" co ........ . <.0 C"
A dBm 0.0
-10.0
-20.0
-30.0
-40.0
-50.0
-60.0
-70.0
-80.0
-90.0
-100.0 DA[>[>[>
unfilled
Atten 30dB 500 TG off
~ I----... -~-·-·----···l_·· . -_._ ...... '
I I H .---.-~-------+.- ... ---+- ___ ._L ___ · •••. ,.- .-
I I t--·· __ .. ··_--
U--.--L-+ ·~-----.--I -. -..... _-_.
"-- -_.-.' ....... __ ... -.. -_.-._. __ .-
" 1-------"-··- ---.. .,-.~.---- ..... --- .. - -- .. -.. '
Ref 5.00MHz Max hId Inc 1MHz
1.00MHz/div 10ms /div
Res bw 30kHz Vid bw 11kHz
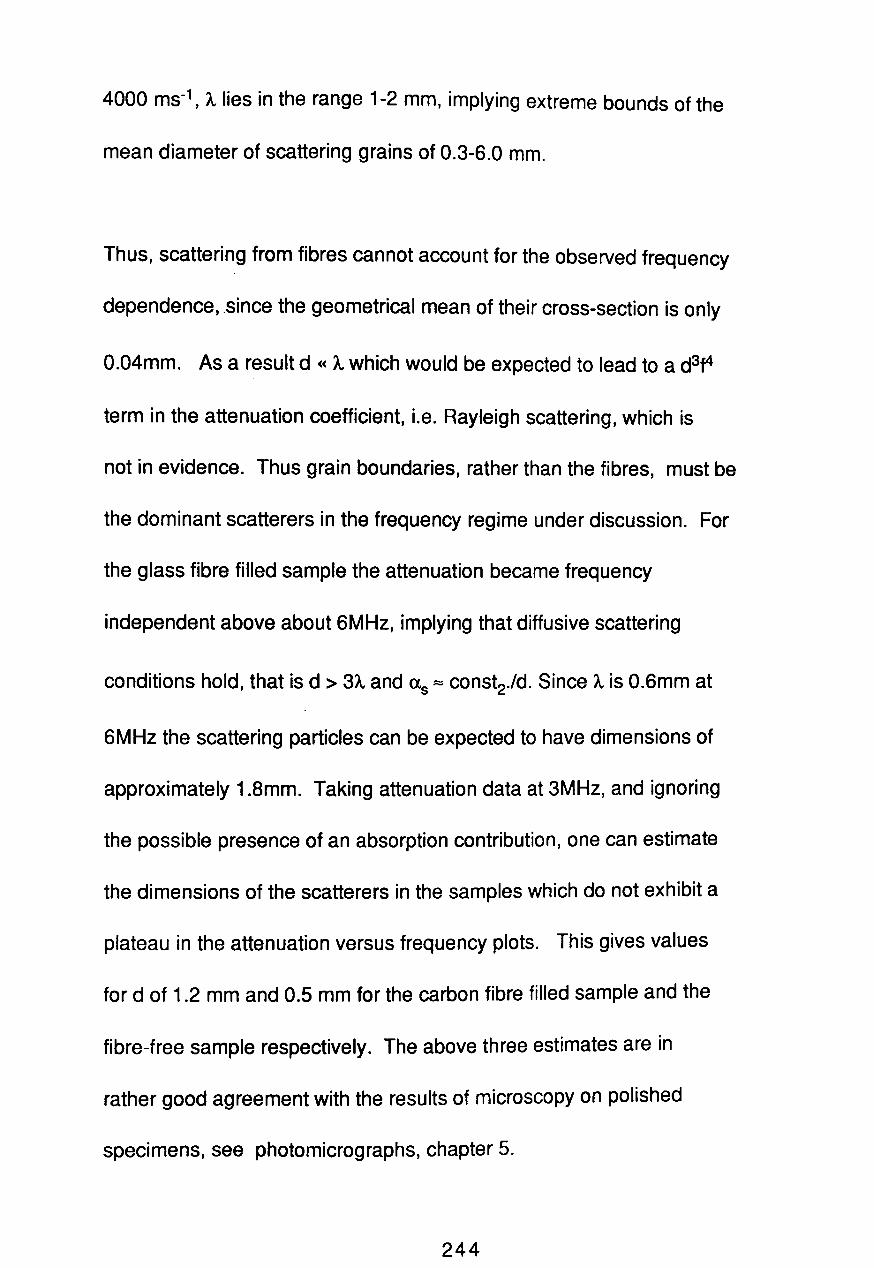
4000 ms-1, A lies in the range 1-2 mm, implying extreme bounds of the
mean diameter of scattering grains of 0.3-S.0 mm.
Thus, scattering from fibres cannot account for the observed frequency
dependence, .since the geometrical mean of their cross-section is only
0.04mm. As a result d « A which would be expected to lead to a d3f4
term in the attenuation coefficient, i.e. Rayleigh scattering, which is
not in evidence. Thus grain boundaries, rather than the fibres, must be
the dominant scatterers in the frequency regime under discussion. For
the glass fibre filled sample the attenuation became frequency
independent above about SMHz, implying that diffusive scattering
conditions hold, that is d > 3A and as ~ const2.1d. Since A is O.Smm at
SMHz the scattering particles can be expected to have dimensions of
approximately 1.8mm. Taking attenuation data at 3MHz, and ignoring
the possible presence of an absorption contribution, one can estimate
the dimensions of the scatterers in the samples which do not exhibit a
plateau in the attenuation versus frequency plots. This gives values
for d of 1.2 mm and 0.5 mm for the carbon fibre filled sample and the
fibre-free sample respectively. The above three estimates are in
rather good agreement with the results of microscopy on polished
specimens, see photomicrographs, chapter 5.
244

At frequencies higher than those presently investigated the Rayleigh
scattering contribution from the filler particles would begin to
become relatively strong compared with the diffusive scattering from
grains and the multi-relaxational and/or hysteresis losses. However
the high level of these "background" losses will require thinner
samples or increased probe output power for filler scattering to be
detectable.
The reseach data from samples made in house and supplied by Mr A.
Green of Thorn E.M.I., and interpretation leading to possible materials
evaluation strategies, discussed in this chapter, have since been
published, Round (1988a, 1988b), Bridge (1991).
245
8. COMPRESSIONAL AND SHEAR WAVE VELOCITY
MEASUREMENTS ON SETTING MATERIAL.
8.1 VELOCITY MEASUREMENTS.
By monitoring the transit time through a standard thickness of
ceramic the compressional and shear wave velocities for seven
samples were obtained over a period of 100 hours in each case. The
compositions used are given in table 8.1 and the values of sound
velocities and elastic moduli are given in table 8.2. The measured
compressional and shear wave velocities plotted against the elapsed
time for different alumina contents are shown in figures 8.1 and 8.2.
At some stage during each run, contact between the perspex and the
sample was broken, due to a slight shrinkage of the sample resulting in
a loss of signal. At this point the central piece of the mould was
removed, and, ensuring that the ceramic remained in the correct
location, both covers were again fixed in place, making new bonds.
Additional time delays were introduced by the new couplant layers and
slight changes in geometry, which led to an apparent fall in velocity
through the specimen. This delay was noted and used as a further

TABLE 8.1
The composition of alumina, magnesia and acid phosphate in weight % •
Sample AI203 AI( H2P04)3
A 0 15.55 84.45
B 10 13.99 ·76.01
C 20 12.44 67.56
D 30 10.88 59.12
E 40 9.33 50.67
F 50 7.77 42.23
G 60 6.22 33.78
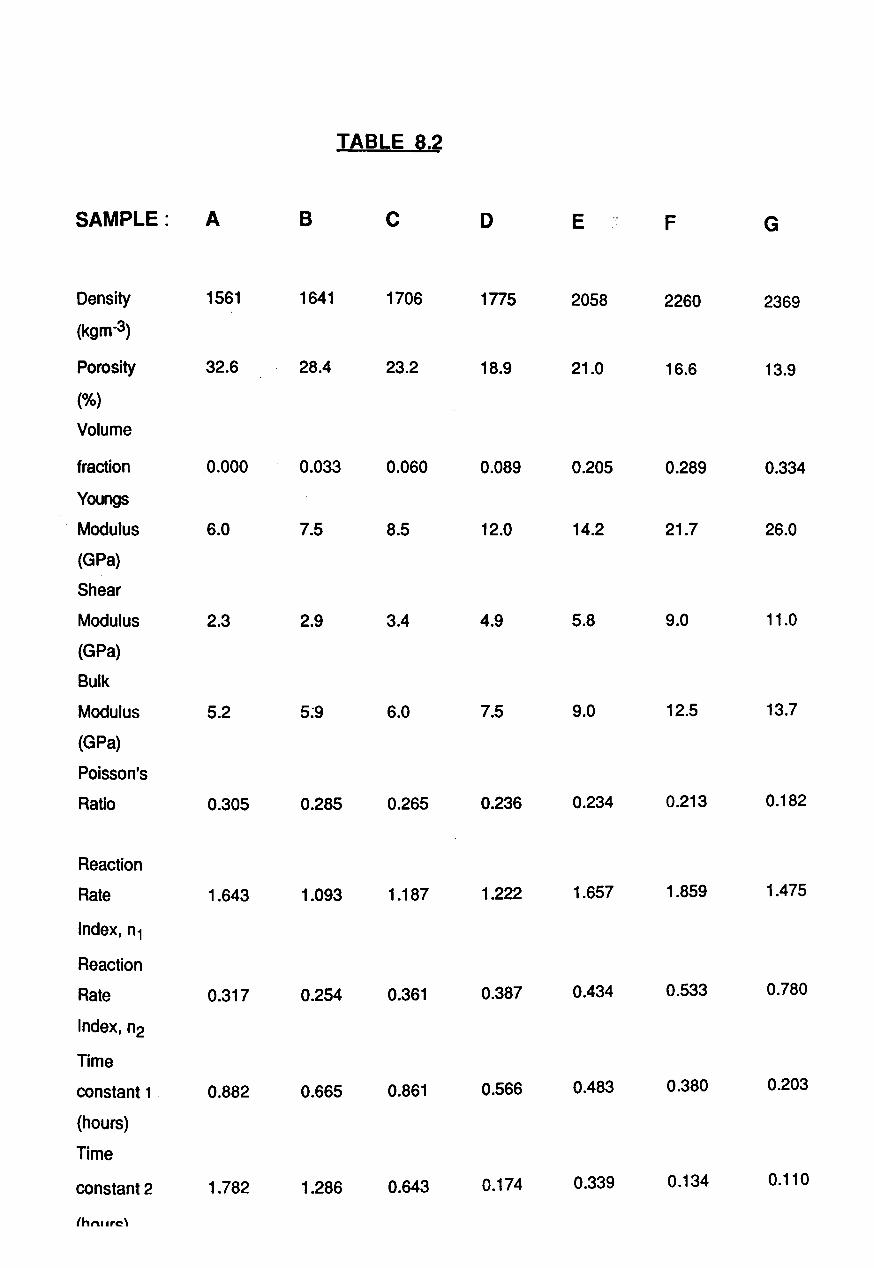
TABLE 8.2
SAMPLE: A B c D E F G
Density 1561 1641 1706 1775 2058 2260 2369
(kgm-3)
Porosity 32.6 28.4 23.2 18.9 21.0 16.6 13.9
(%)
Volume
fraction 0.000 0.033 0.060 0.089 0.205 0.289 0.334
Youngs
Modulus 6.0 7.5 8.5 12.0 14.2 21.7 26.0
(GPa)
Shear
Modulus 2.3 2.9 3.4 4.9 5.8 9.0 11.0
(GPa)
Bulk
Modulus 5.2 5~9 6.0 7.5 9.0 12.5 13.7
(GPa)
Poisson's
Ratio 0.305 0.285 0.265 0.236 0.234 0.213 0.182
Reaction
Rate 1.643 1.093 1.187 1.222 1.657 1.859 1.475
Index, n1
Reaction
Rate 0.317 0.254 0.361 0.387 0.434 0.533 0.780
Index, n2
Time
constant 1 - 0.882 0.665 0.861 0.566 0.483 0.380 0.203
(hours)
Time
constant 2 1.782 1.286 0.643 0.174 0.339 0.134 0.110
{hnllr~\

3400
-en 3000 ........ E -~ ·0 0 CD > 2600 CD > as ~
as c: 0 2200 ~/o en en CD .... EJ 0°/0 alumina a. E • 100/0 alumina 0 0 a 200/0 al urn ina
1800 0 300/0 alumina • 400/0 alumina c 500/0 alumina A 600/0 alumina
1400 0 40 80
time (hours)
Figure 8.1. Plot of compressional wave velocity versus time. The plots for the various compositions are generally in order and for clarity only the limiting alumina contents have been labelled. The legend, shown in this figure only, is applicable to all figures showing composition dependence.

2200
-en 1800 ...... E -~ ::: 0 0 Q)
> en
1400 Q)
> as ~ ~
as Q)
..c: COlo en
1000
600------~------~----~~----~----~
o 40 80
·time (hours)
Figure 8.2. Plot of shear wave velocity versus time, legend for the compositions as in figure 8.1.
correction in all later transit time measurements on that sample.
This work was based upon a feasibility study carried out in
conjunction with Mr K.S. Tan, a masters student working under my
guidance and supervision. This feasibility study was published and
the paper, Tan (1989).
From the compressional and shear wave velocity graphs, it can be seen
that the velocity increased with time, eventually reaching a constant
value after 15 to 100 hours, depending upon alumina fraction. It is
also clear that the sound velocity increases with increasing alumina
content.
8.2. THE COMPOSITION DEPENDENCE OF THE ELASTIC PROPERTIES.
It was established earlier that there is little change in the density of
the material between the initial and the final states. From the final
density of the material, assuming constant density, and equations (11)
to (15), section 3.3, the elastic moduli and Poisson's ratio were
determined. The calculated elastic moduli; (Young's modulus, bulk
modulus and shear modulus), and Poisson's ratio were plotted against
the elapsed time as shown in figures 8.3 to 8.6.
1)..17
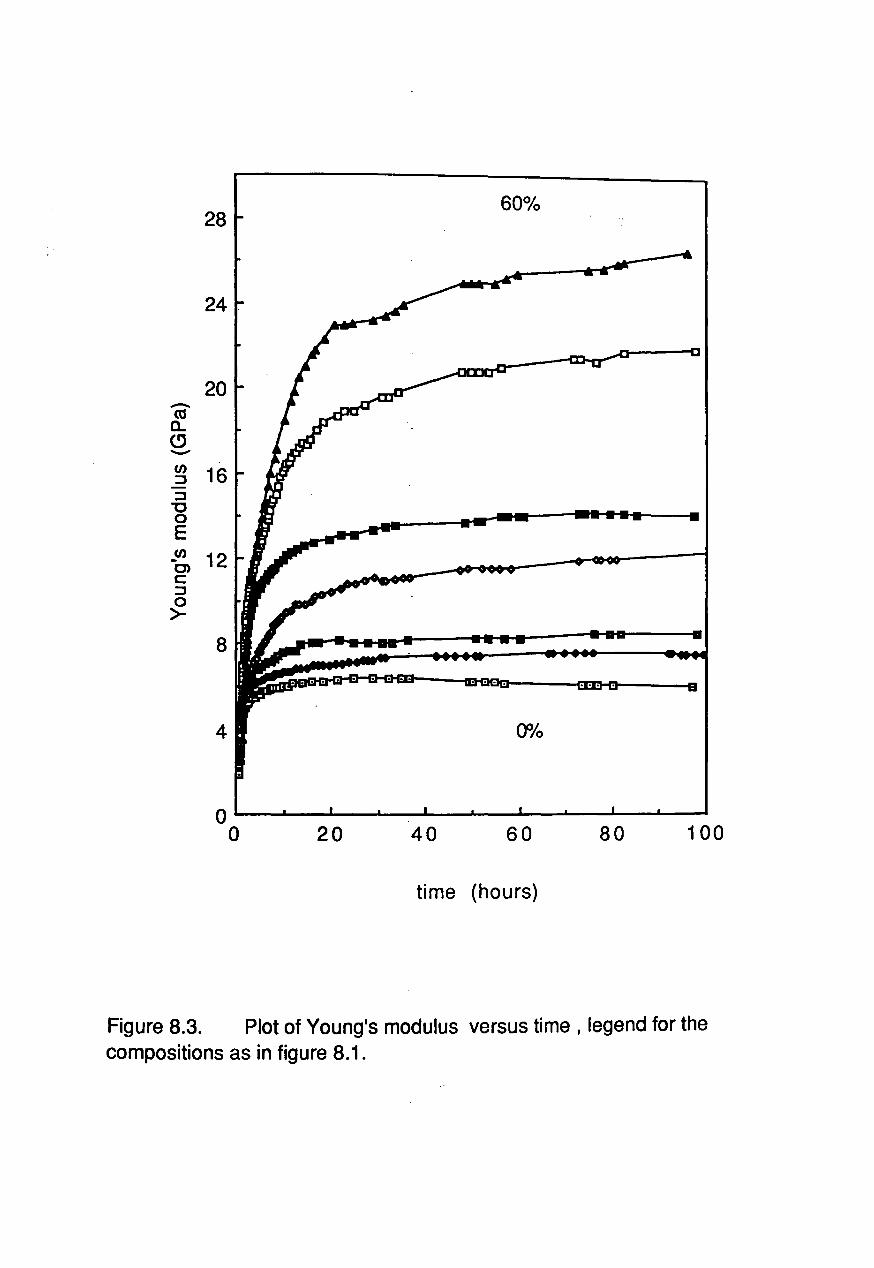
28
24
20 -tU a. CJ -00 16 :J :J "0 0 E
_00 12 C) c: :J 0 >-
8
4 0%
o~~~~--~--~--~--~--~~------~
o 20 40 60 80 100
time (hours)
Figure 8.3. Plot of Young's modulus versus time, legend for the compositions as in figure 8.1.
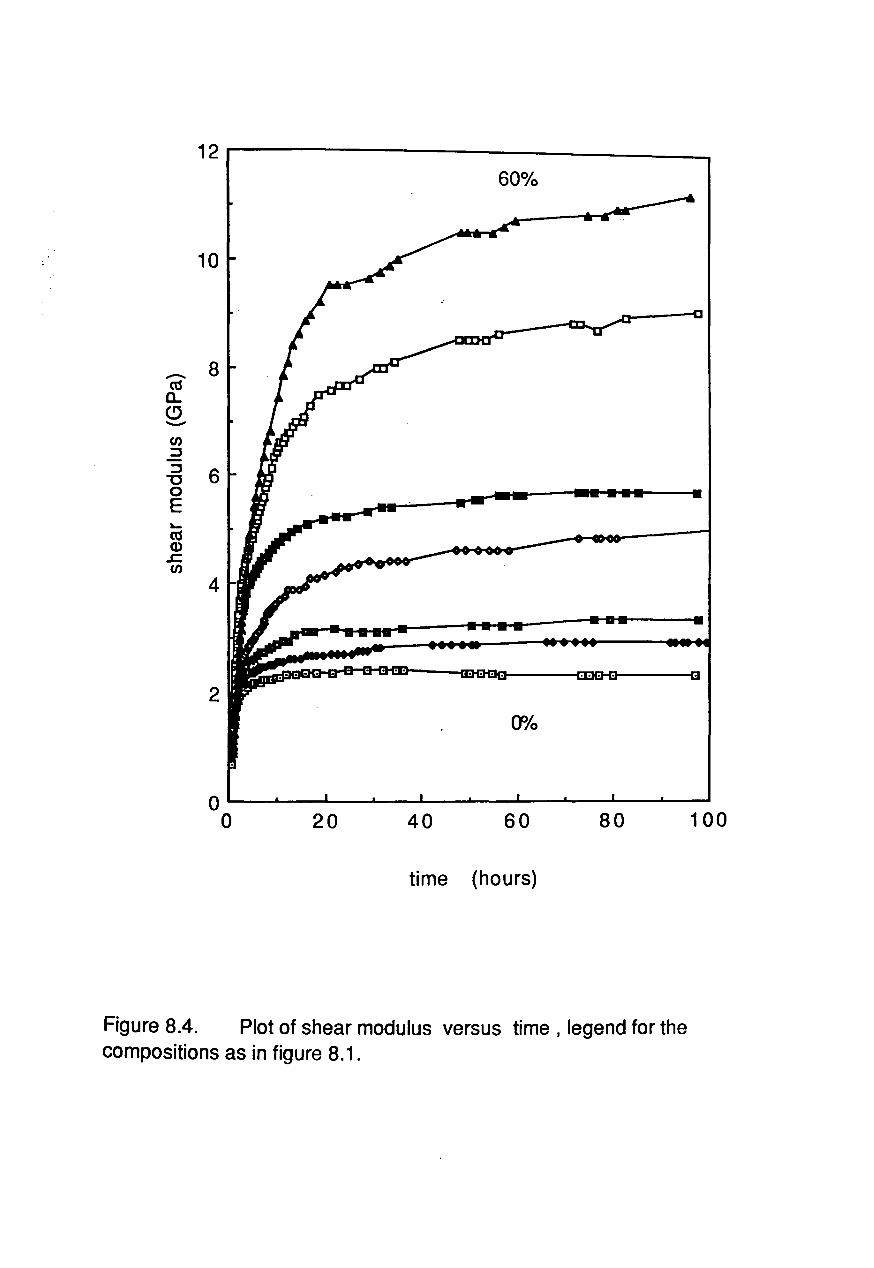
12r---------------------------____ _
600/0
10
- 8 cu a..
(!) -en :J :J 6 "C 0 E -cu Q)
.s:::. en
4
2 0%
OL-~--~--~--~--~~--~--~--~~
o 20 40 60 80 100
time (hours)
Figure 8.4. Plot of shear modulus versus time, legend for the compositions as in figure 8.1.
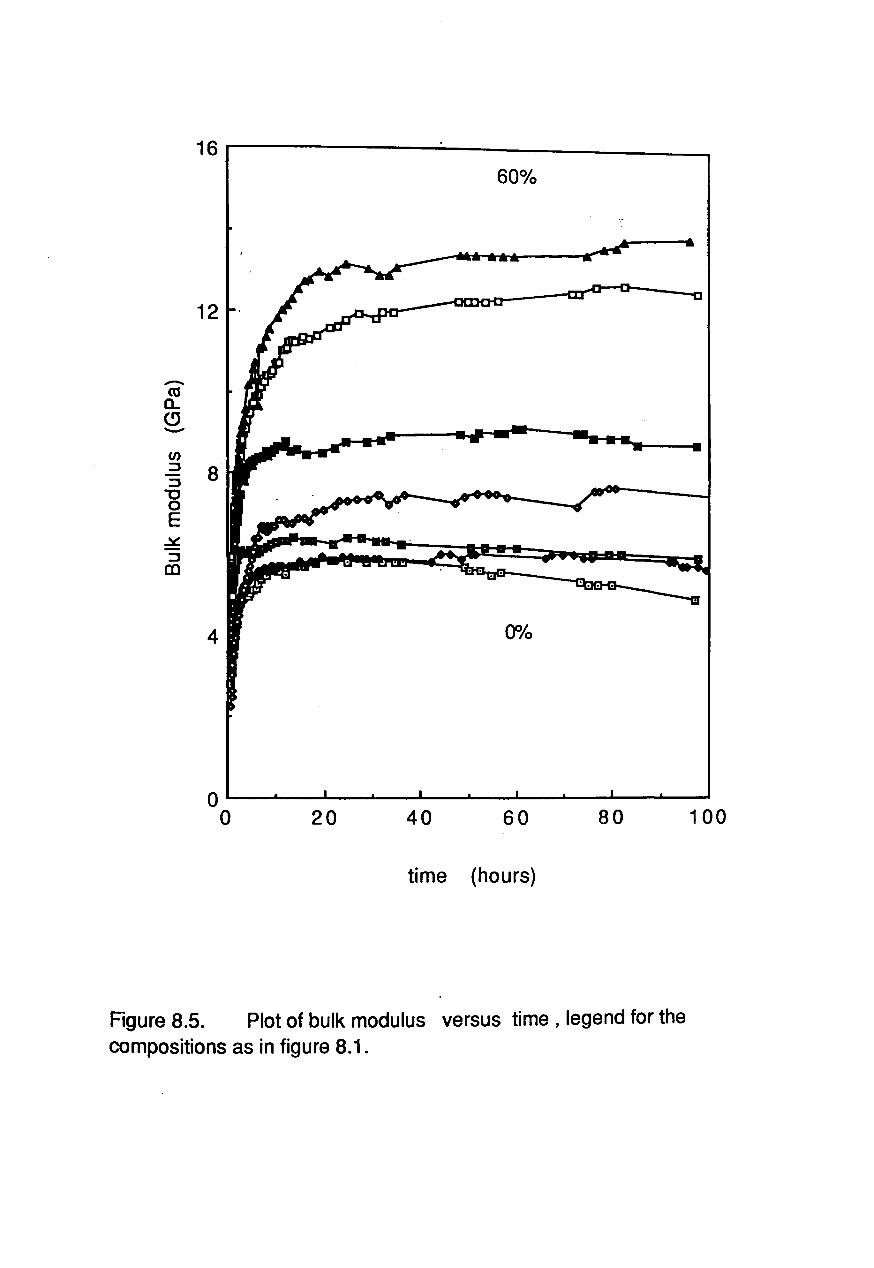
16r-----------~--------------~
12
-as a.. (!J -(f) ::l 8 ::l
"'0 0 E ~
::l co
4 0010
o~~~~--~--~--~--~--~--~--~~
o 20 40 60 80 100
time (hours)
Figure 8.5. Plot of bulk modulus versus time, legend for the compositions as in figure 8.1.

0.44 r--------------
0.40
0.36
0 .... tU 0.32 a: en . c: 0 en en 0.28 0 a..
0.24
0.20
600/0
0.16 '-----'-_--L.._...a.-----JL-....;....---'-_--L..._"-------1._--'-----.J
o 20 40 60 80 100
time (hours)
Figure 8.6. Plot of Poisson's ratio versus time, legend for the compositions as in figure 8.1.

From these graphs it can be seen that the elastic moduli increase with
time due to the curing of the sample, eventually reaching a constant
higher value, as would be expected, for the fully cured sample.
From the graph of Poisson's ratio, with the exception of the sample
having 30% by weight alumina, the monitored Poisson's ratio began
with a high value, then decreased with time to a constant lower value.
Kingery states that for viscous flow and plastic flow, the volume
remains constant so that the Poisson's ratio has a value of 0.5, hence
the high initial value of Poisson's ratio observed during the early
stages of the reaction, Kingery (1950, 1976).
By writing Poisson's ratio in the form (E/2G)-1 its subsequent
behaviour is easily understood. Initially, whilst flow can be observed
with the naked eye at low shear stress, G is clearly very low, and
therefore E/2G is very high. As the sample cures, G increases more
rapidly than does E (flow no longer being visible), hence the observed
asymptotic decrease in Poisson's ratio with increasing time.
The graph of Poisson's ratio for the sample with 30% alumina content
is shown in figure 8.7. This was initially a low value and increased to
248

0.34 r---------------
0.32
0.30
• 0 +J
cu 0.28 ~
en c: 0 en en 0.26 0 a.
• 0.24 -• •
• 0.22
o .20 "--__a..._'---__'__L..___a...~.L.___'__L..___a..._L___a...____J
Figure 8.7. alumina.
o 20 40 60 80 100 120
time (hrs)
Plot of Poisson's ratio versus time for a sample 30 wt.%

a maximum, and then decreased asymptotically to a constant level.
This behaviour had been observed previously and the low initial value
attributed to a transitional phase, Tan (1989). It would appear from
the inconsistent nature of this phenomenon that the amount of this
phase and its duration is dependent upon certain factors which are not
fully understood at present. The presence of impurities or variations
in the mixing procedure could be involved but further work is required
in order to establish this. The composition dependence of the elastic
moduli of the samples, after completion of all chemical reactions,
were compared with the theoretical bounds of Hashin and Shtrikman,
see chapter 7.
Since the matrix is complex, values for material constants cannot be
found in tables or calculated theoretically, therefore values
determined from measurements of unfilled (ie; 0% alumina) samples
were ascribed to the matrix, i.e. the alumina filler is assumed to be
entirely inert and its indirect effect upon the reaction taking place in
the matrix is neglected in the discussion of this section. These values
for the bulk modulus and shear modulus respectively are:
K1 = 5.2 GPa
G1 = 2.3 GPa
249
and the elastic moduli of the filler (alumina) are, Anderson (1965) :
K2 = 251.2 GPa
G2 = 163.4 GPa
The measured elastic moduli for the final product, after 80 hours
curing, are listed in Table 8.2.
The volume fractions were calculated from equation 20. Again the
matrix density, P1 = 1561 kg/m3 , is taken to be that of the sample
with 0% alumina content, P2 is the density of the alumina filler, 3980
kg/m3 , and P is the measured density of the sample.
It can be seen from figures 8.3-8.5 that the elastic moduli are highly
dependent on the alumina content. The variations of the elastic
moduli with filler volume fraction for two-phase materials are
related to the roles of matrix and filler. The elastic moduli would be
expected to increase with increasing filler volume fraction, up to a
limit where there is insufficient matrix for satisfactory filler-matrix
bonding. Beyond this limit one would not expect the Hashin and
Shtrikman bounds to hold. The mechanical properties of the ceramic
would deteriorate and the elastic moduli would be expected to
250
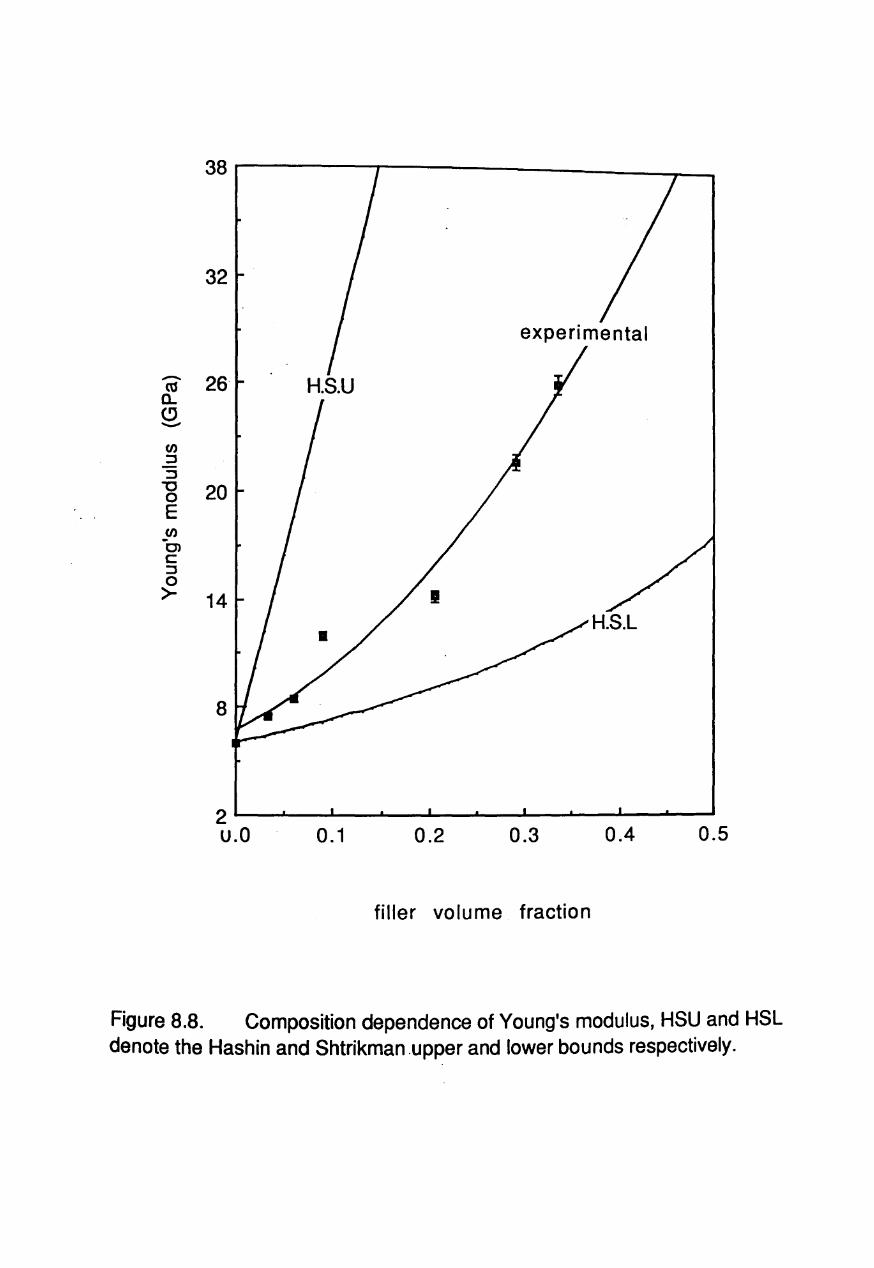
38r-------r---------------~~
32
experimental
-<U a.. (!) -en :J :J -c 20 0 E en C> c: :J 0 >- 14
H.S.l
8
2~~~~------~------~--~--~~~~
u.O 0.1 0.2 0.3 0.4 0.5
filler volume fraction
Figure 8.8. Composition dependence of Young's modulus, HSU and HSl denote the Hashin and Shtrikman .upper and lower bounds respectively.

20r---------Jr--------------~
16
experimental
-eu a. (!) 12 -(J) ::J ::J
'"C 0 E L-
eu 8 Q)
..c: en
4
o------~--~--~--~--~~--~--~~ u.O 0.1 0.2- 0.3 0.4 0.5
filler volume fraction
Figure 8.9. Composition dependence of shear modulus, HSU and HSL denote the Hashin and Shtrikman upper and lower bounds respectively.
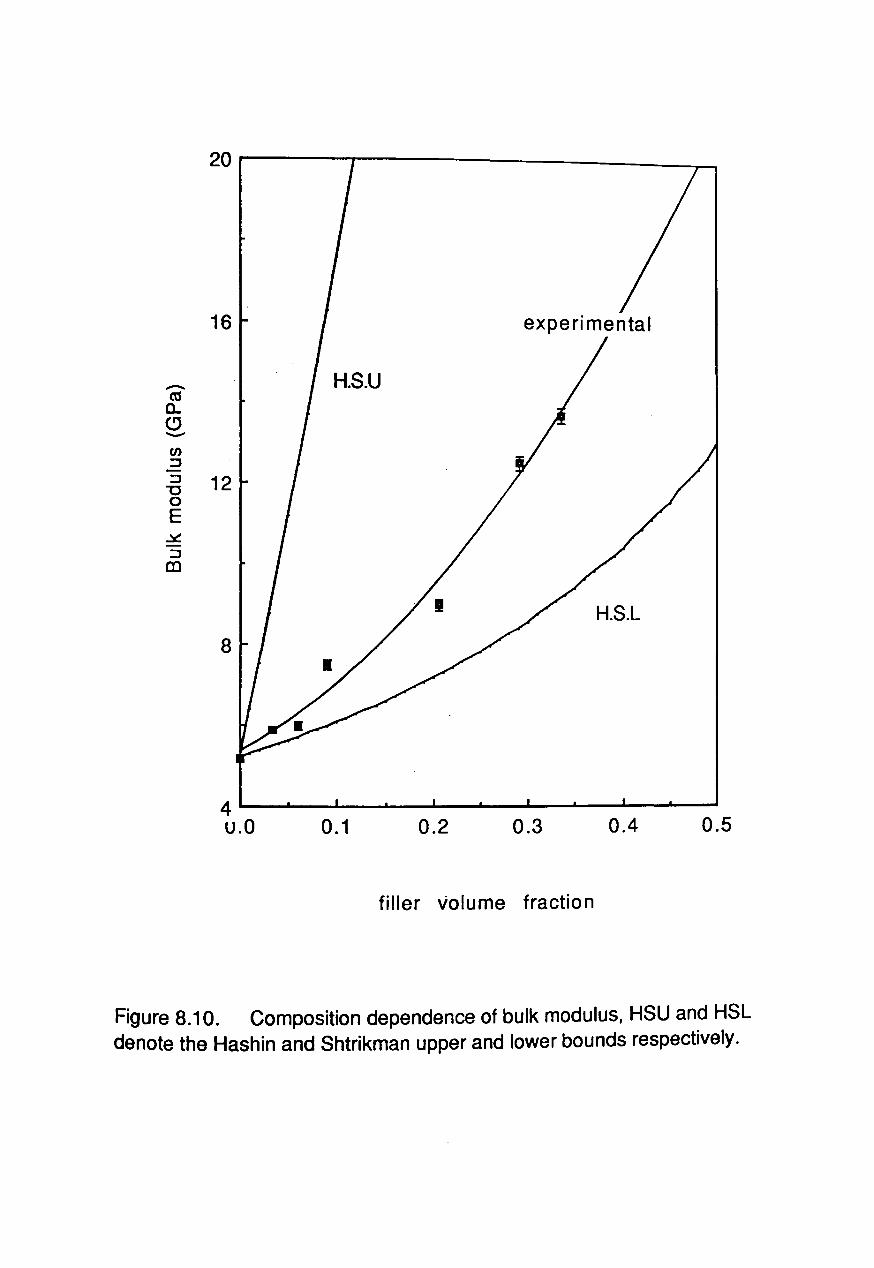
20r-----~------------------~
16
- H.S.U (\1 D-C) -en ~
::J 12 "'C 0 E ~
::J CD
H.S.L
8
4--~--~------~--~--L-~--~--~~ u.O 0.1 0.2 0.3 0.4 0.5
filler volume fraction
Figure 8.10. Composition dependence of bulk modulus, HSU and HSL denote the Hashin and Shtrikman upper and lower bounds respectively.
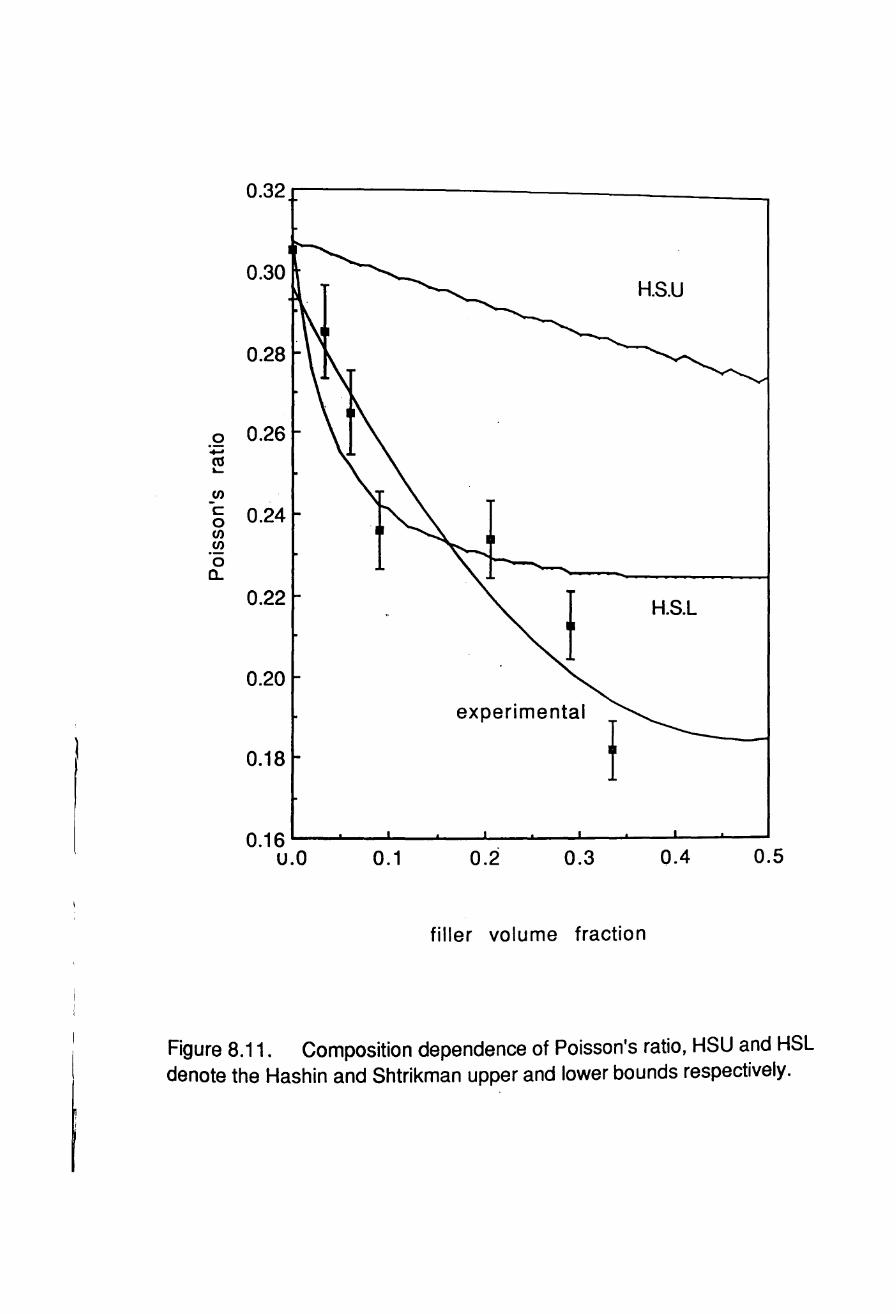
0.32 r---------------
0.30 H.S.U
0.28
0 0.26 ... «S L-
en c: 0.24 0 en en .-0
CL
0.22 H.S.L
0.20
experimental
I 0.18
0.16 L--........ _-'-_"""'---'_--'-_..l.----"_--1-_-'-----I
u.O 0.1 0.2 0.3 0.4 0.5
filler volume fraction
Figure 8.11. Composition dependence of Poisson's ratio, HSU and HSL denote the Hashin and Shtrikman upper and lower bounds respectively.

decrease.
The experimentally determined elastic moduli lie between the Hashin
and Shtrikman bounds, figures 8.8-8.10. This suggests that the
alumina filler particles were well dispersed and well bonded to the
matrix, but since the data lie well above the lower bound the particles
are not spherical" elongated grains probably being present. As already
noted microscopy shows that plate-like grain growths predominate.
For filler volume fractions up to about 0.3, the experimental data for
Poisson's ratio, shown in figure 8.11, lies, to a first approximation, on
the lower bound. This implies that in the 60 wf>/o alumina sample the
basic theoretical assumptions of Hashin and Shtrikman no longer hold,
suggesting that the limiting filler volume fraction has been exceeded.
As this result is at variance with the conclusion reached in the
preceding paragraph we may conclude that the Poisson's ratio plot may
be a more sensitive indicator of the filler-matrix bonding condition
than are plots of the elastic moduli, or that the Hashin- Shtrikman
model is a poor predictor of Poisson's ratio.
251
8.3 CHEMICAL REACTION RATES.
According to Stepisnik, Stepisnik (1981), the relationship between the
shear moduli and elapsed time can be expressed empirically as :
G(t) = Goo { 1 - exp.( -Btn ) }
where G(t) is the elastic shear modulus at time t, B is a constant, t is
the elapsed time, Goo is the elastic shear modulus at infinite time and
(34)
n is a value between 1 and 4 depending on the geometry of the growth.
From equation (34) :
In In [Goo /{Goo -G(t)}] = In B + n In t (35)
Equation (35) can be applied to the experimental data. Graphs of In In
[GocI{Goo-G(t)}] versus In t, for samples with alumina contents in the
range 0-60% by weight, are given in figure 8.12 a-g. These
essentially show linear relationships in each case with a change in
gradient occurring at times ranging from 0.9-2.2 hours.
The rate of the reactions involved in the curing process can be
n"antified by the values of the multiplier B and the exponent ,n, in
252

equations (34) and (35). This latter term could be considered to be
the reaction rate index, and its values determined from the gradients
in figure 8.12, a-g.
Considering data for a midrange sample with alumina content of 400/0
by weight, figure 8.12 e, the initial line is given by :
y = - 1.20 + 1.66 x
and the later line by :
y = - 0.47 + 0.43 x
where R is the correlation coefficient.
R=0.99
R=1.00
The reaction rate index can thus be determined from the gradients in
figure 8.12 e, given by the final terms in equations (36) and (37). Thus
the curing process under investigation has two stages, the first with a
value for n of 1.66, and the second with a value for n of 0.43 .
Stepisnik observed that the changes in reaction rate were due to the
changes in the grain geometry, such that when n = 3 to 4 the grains
are polyhedral, and when n=1 to 2 they are plate like. The
experimentally determined values of n, lower than Stepisnic's, would
therefore tend to confirm the presence of plate-like grains as
suggested earlier.
253
(36)
(37)
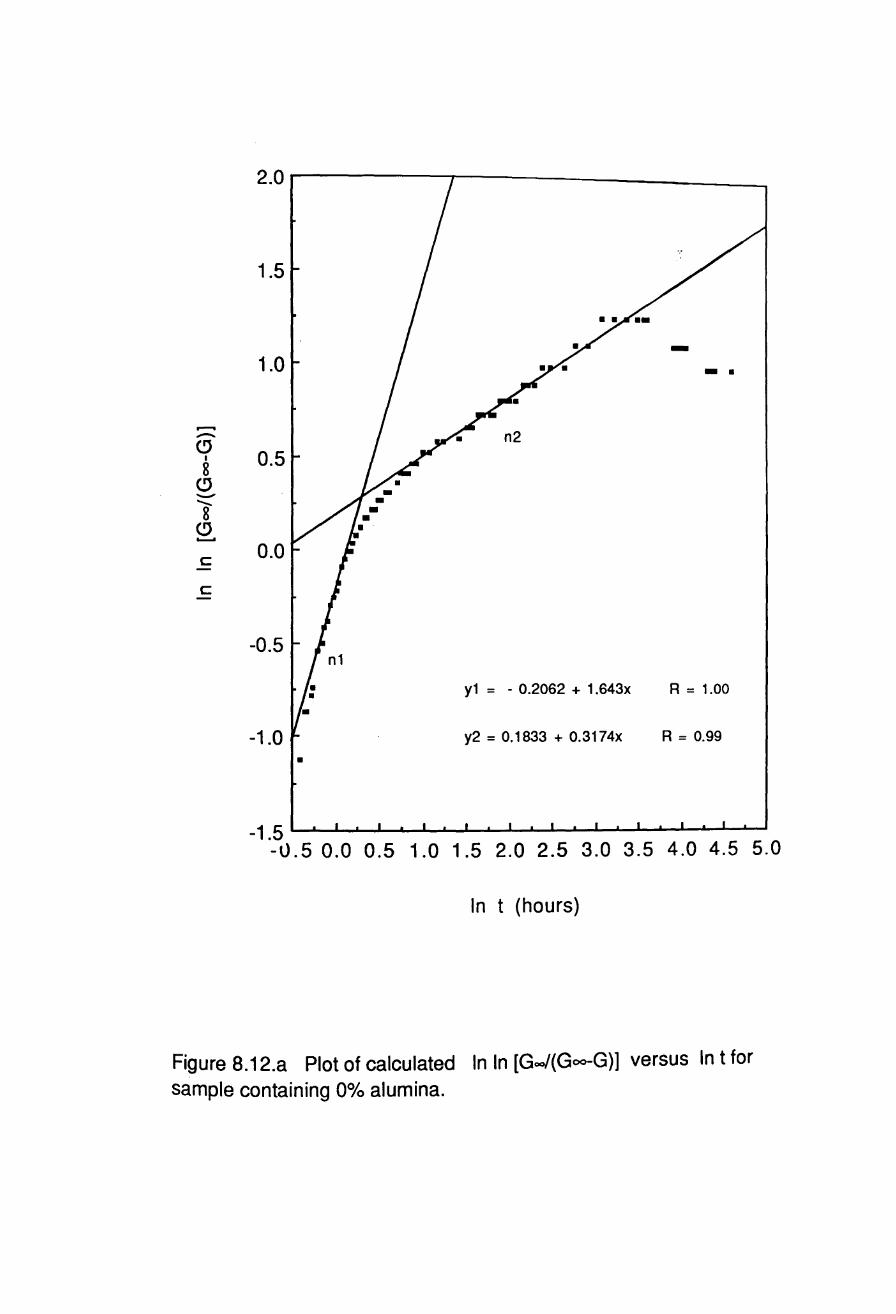
2.0 I---~r------____ _
1.5
-1.0 -. .--. - n2 C)
I 0.5 8 C) ---8 C) ........ c: 0.0 -c: -
-0.5
y1 = - 0.2062 + 1.643x R = 1.00
-1.0 y2 = 0.1833 + 0.3174x R = 0.99
•
-1 .5 ........ ---&.--'-....I.-...&.-..L-..I--'---'-~-'-L-.L-..L.....I..-...L-~L-.L~~ -l)'5 0.0 0.5 1.0 1.5 2.0 2.5 3.0 3.5 4.0 4.5 5.0
In t (hours)
Figure 8.12.a Plot of calculated In In [Goo/(Goo-G)] versus In t for sample containing 0% alumina.

2.0.-------,----___ _
1.5
1.0
.--. n2 -. (!J
I
8 (!J
0.5 --... 8 (!J 0......-0
c: -c: - 0.0
-0.5 y1 = - 0.4462 + 1.0938x R = 0.99
y2 = 0.064 + 0.2543x R = 0.99
-1.0 _______ """'--li..-&.--'--'--..&-a-..L ___ -'-...&.-"--'-.&..-'-----~
-u.5 0.0 0.5 1.0 1.5 2.0 2.5 3.0 3.5 4.0 4.5 5.0
In t (hours)
Figure 8.12.b Plot of calculated In In [Goo/(Goo-G)] versus In t for sample containing 10% alumina.
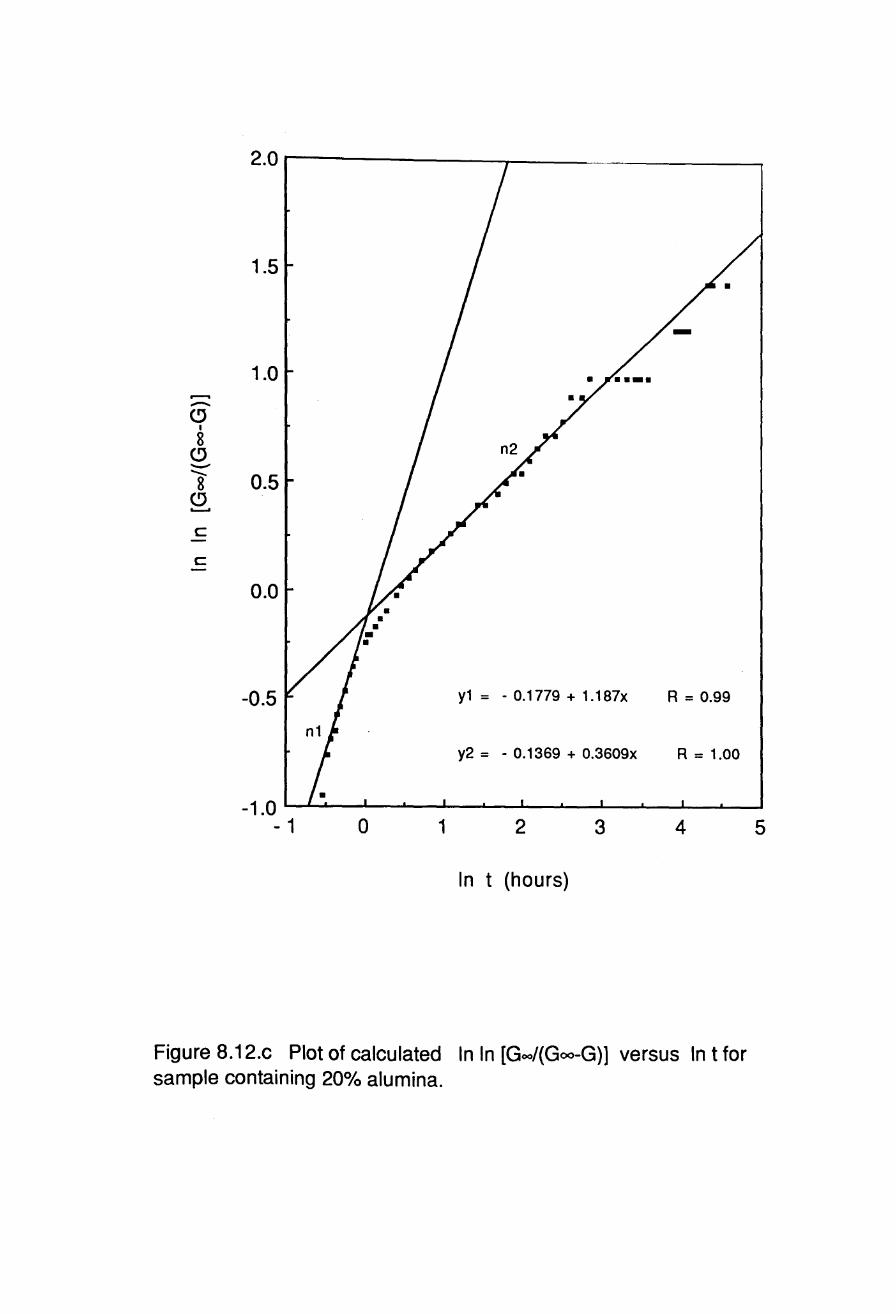
2.0 r-----------,r----~----~
1.5
1.0 ~ -(!)
I
8 (!) -......... 0.5 8 (!) ....... c -c -
0.0
-0.5 y1 = - 0.1779 + 1.187x R = 0.99
y2 = - 0.1369 + 0.3609x R = 1.00
-1.0 - 1 a 1 2 3 4
In t (hours)
Figure 8.12.c Plot of calculated In In [Goo/(Goo-G)] versus In t for sample containing 20% alumina.
5
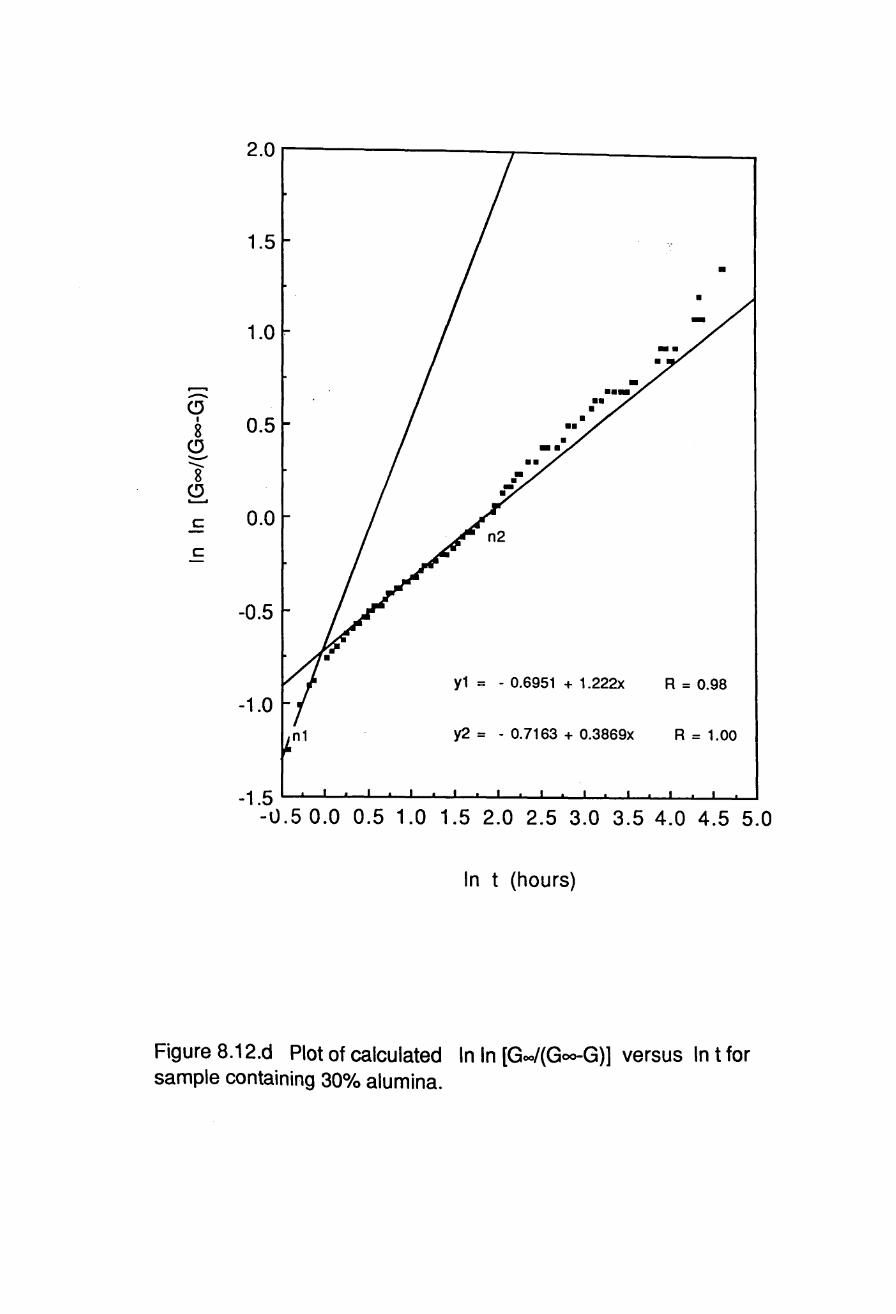
2.0 r--------.,------___ _
1.5 •
•
1.0 .
----CJ I 0.5 8
CJ '-'" --8 CJ "--"
c:: 0.0 -c:: -
-0.5
y1 = - 0.6951 + 1.222x R = 0.98 -1.0
y2 = - 0.7163 + 0.3869x R = 1.00
-1 .5 L......I.---L..--L-....&...-""'---IL.-&.---L..--L--'-""'---I ........... ---'---'---'--"'--'--'---'--..............
-lJ.50.0 0.5 1.0 1.5 2.0 2.5 3.0 3.5 4.0 4.5 5.0
In t (hours)
Figure 8.12.d Plot of calculated In In [Goo/(Goo-G)] versus In t for sample containing 30% alumina.

2.0.-------"J"----------
••
1.5
1.0 ~ n2 -(!)
I
8 (!) 0.5 -........ 8 (!) '--'
c: - 0.0 c: -
-0.5
y1 = - 1.2039 + 1.657x R = 0.99
-1.0 y2 = - 0.4687 + 0.4339x R = 1.00
-1 . 5 ioo-.&. ........... --L--'--L-...I---L-L-~..J._~__'___1__'__..L.......Ii.__..L.__'_....I_....L_...J
-u.50.0 0.5 1.0 1.5 2.0 2.5 3.0 3.5 4.0 4.5 5.0
In t (hours)
Figure 8.12.e Plot of calculated In In [Goo/(Goo-G)] versus In t for sample containing 40% alumina.
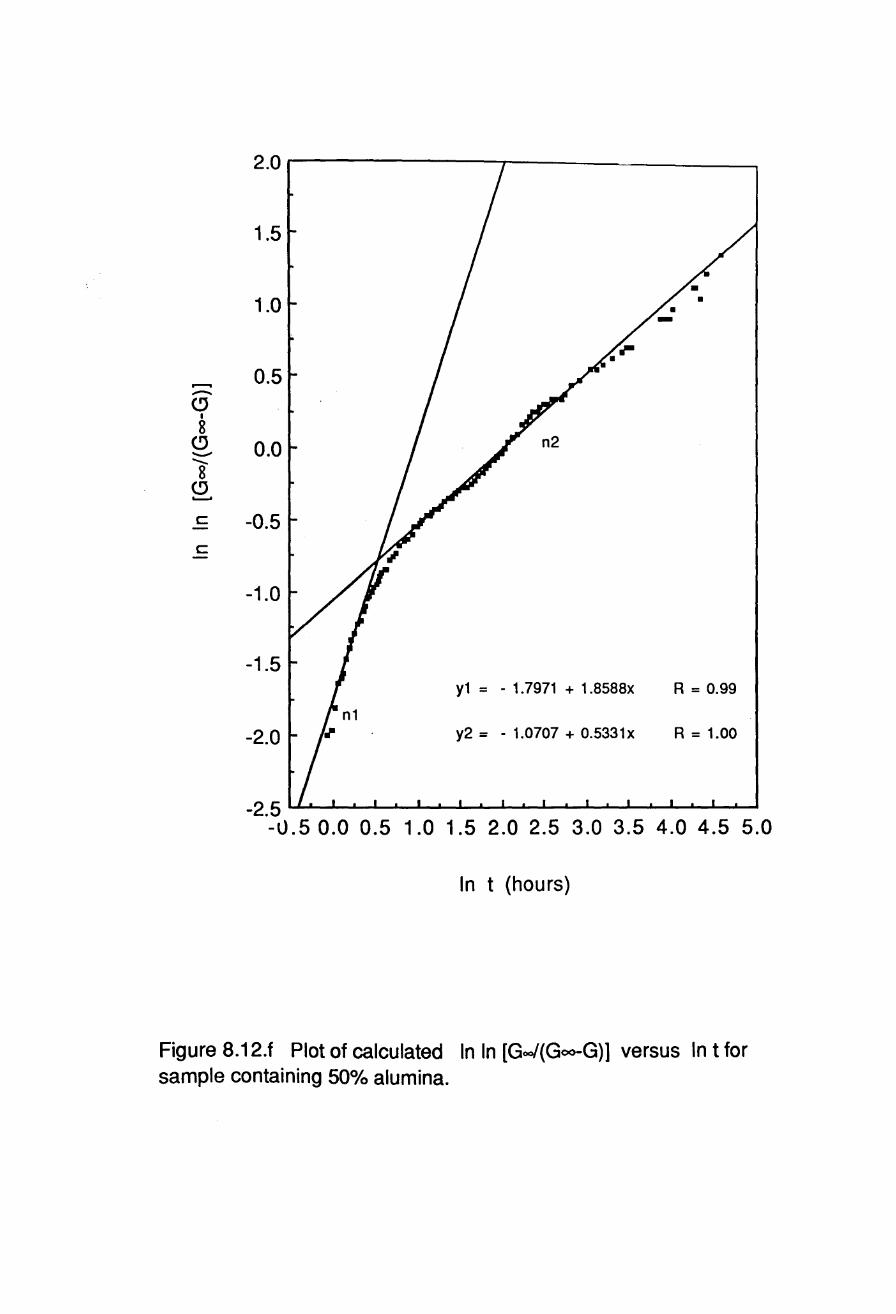
2.0 r--------r---~----___,
1.5
1.0
.--. 0.5 -C) I
8 C) 0.0 n2 -......... 8
C) '---'
c -0.5 -c -
-1.0
-1.5 y1 = - 1.7971 + 1.8588x R = 0.99
-2.0 y2 = - 1.0707 + 0.5331 x R = 1.00
-2. 5 LJ-L---'-....&.....~L---L .......... ....I.-~L.......&........L.-....a.-..L--L---'--'--"'"'--L-.L-.a...--I -u.5 0.0 0.5 1.0 1.5 2.0 2.5 3.0 3.5 4.0 4.5 5.0
In t (hours)
Figure 8.12.f Plot of calculated In In [Goo/(Goo-G)] versus In t for sample containing 50% alumina.

2r-----------------~----------~~
1
.......... -CJ 0 I
8 CJ ----8 CJ .----
c - -1 c -
-2 n1
-3 0
n2
y = - 2.3539 + 1.4749x
Y = - 1.7161 + 0.7797x
1 2 3
In t (hours)
-• -• -
•
R = 1.00
R = 1.00
4
Figure 8.12.g Plot of calculated In In [Goo/(Goo-G)] versus In t for sample containing 60% alumina.
5
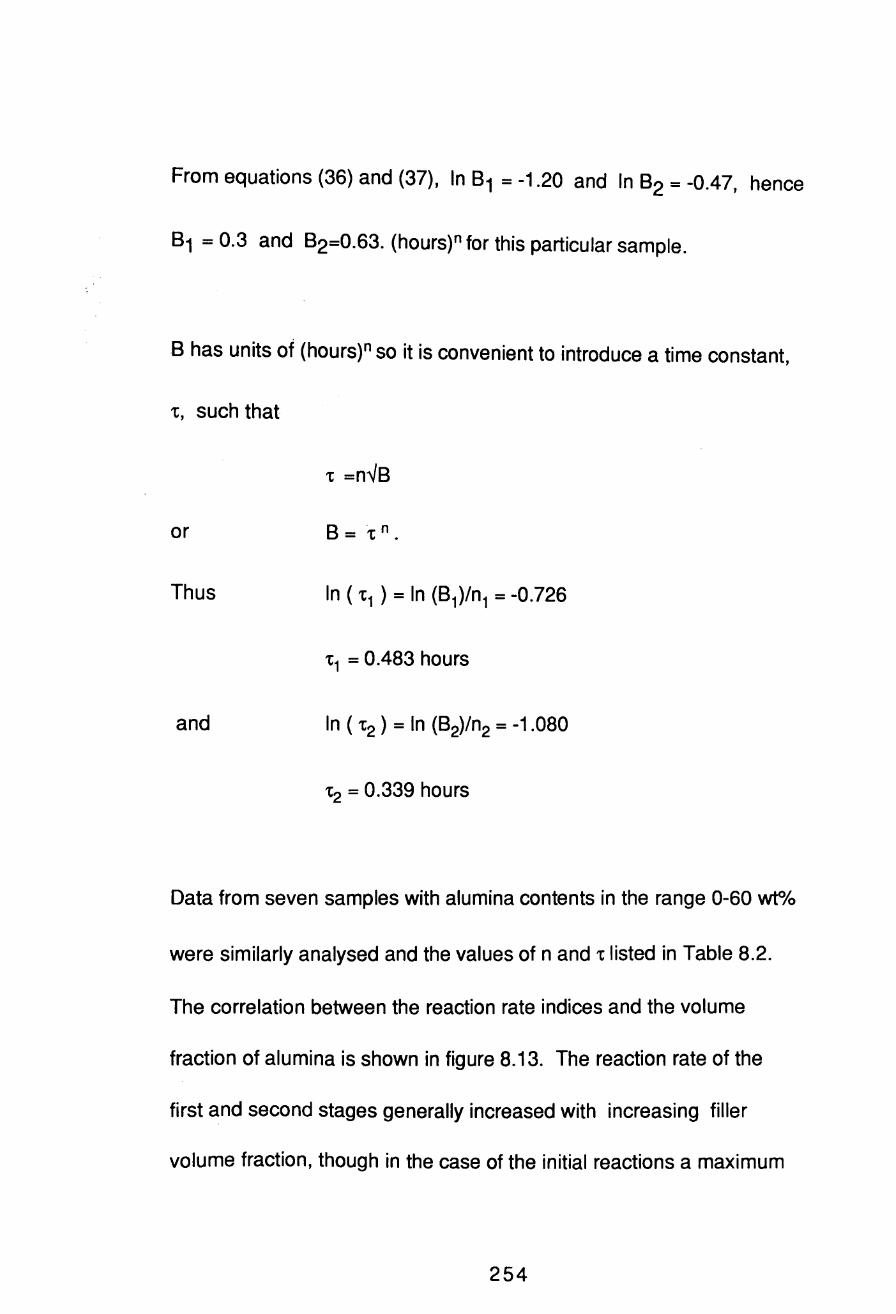
From equations (36) and (37), In B1 = -1.20 and In B2 = -0.47, hence
B1 = 0.3 and B2=0.63. (hours)" for this particular sample.
B has units of (hours)" so it is convenient to introduce a time constant ,
t, such that
or
Thus
t1 = 0.483 hours
and
t2 = 0.339 hours
Data from seven samples with alumina contents in the range 0-60 wt<>/o
were similarly analysed and the values of nand t listed in Table 8.2.
The correlation between the reaction rate indices and the volume
fraction of alumina is shown in figure 8.13. The reaction rate of the
first and second stages generally increased with increasing filler
volume fraction, though in the case of the initial reactions a maximum
254
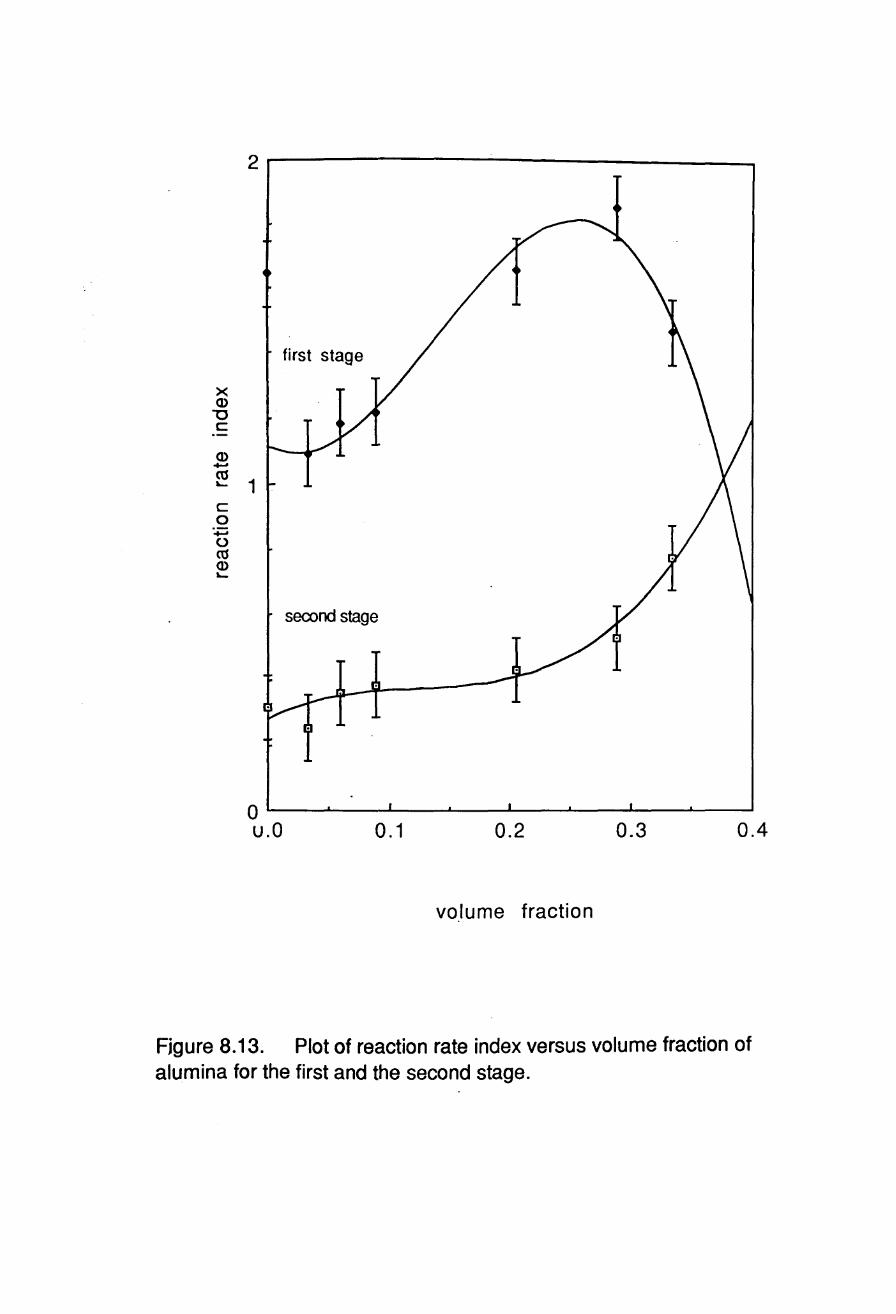
x Q)
"0 c
Q) ......
2r-------------~----------------~
first stage
~ 1 c a ...... o ro Q) L.
second stage
o ~--~--~~--~--~----~--~----~--~ U.O 0.1 0.2 0.3 0.4
volume fraction
Fjgure 8.13. Plot of reaction rate index versus volume fraction of alumina for the first and the second stage.
is reached at a volume fraction of about 0.25 probably due to the
reduced water content of the system. This again suggests the
possibility that the optimum alumina content has been exceeded.
The correlation between time constant and the filler volume fraction
as shown in figure 8.14 indicates that the time constant for both
stages increases with increasing filler volume fraction, the time
constant of the second stage being shorter than that of the first.
From inspection of equation (34) we note that the reaction rate dG/dt,
at constant t, increases as both Band n increase. This suggests that
there are two mechanisms affecting the reaction rate, one manifesting
itself through n and the· other through B.
B is probably less significant than n , and an increase in n will always
be assumed to be associated with an increase in reaction rate.
Stepisnik et al take the view that the reaction rate index is a function
of the geometry of the grains developing during the hydration reaction
but there are other factors to be considered. Independent
measurements with a thermometer buried in the centre of starting
mixtures established that there was a considerable initial
temperature rise peaking typically at 40-50°C after a few hours. This
255

+-' c: cu ... en c:
2.----------------------------------
8 1 (J)
E
o ----~--~--------~--~--~~~~~~ 0.4 U.O 0.1 0.2 0.3
volume fraction
Figure 8.14. Plot of time constant versus volume fraction of alumina for the first and the second stage.
coincided with a peak in Poisson's ratio evident in figure 8.7.
The presence of a peak value for n2 at an intermediate level of filler
volume fraction suggests that the reaction rate is governed by two
opposing factors. Increasing the filler content tends to decrease the
amount of reactants per unit volume and hence to reduce the rate and
magnitude of the temperature rise. Another contributory factor
tending to cause n1 to decrease with increasing filler content is the
fact that the non-reactive filler inhibits the degree of physical
contact between the reactants. However, an increase in the amount of
filler, which has low thermal conductivity, will inhibit the heat loss
by thermal conduction and therefore, in respect of this, will tend to
increase the magnitud.e of the initial temperature rise.
The fact that n2 increases monotonically with filler volume fraction
shows that another mechanism affecting the reaction rate must also
be present since the initial temperature-rise effect has ceased. It is
tempting to conclude that the alumina must have some catalysing
effect on the reaction.
However, whilst the bulk of the filler has been described as inert,
some interfacial reactions between the matrix and filler particles
256
must take place for satisfactory filler-matrix bonding to occur.
There may be chemical reactions or merely a physical bond as the
matrix keys into the surface irregularities of the alumina particles.
The chemical concentration of the mixture between filler particles,
which governs the rate of reaction to form the the matrix, is little
affected by the filler concentration at low levels of filler content
content. As filler content is increased its effect upon the
concentration of reacants and the physical properties of the curing
material will become more significant.
In this thesis the rates of progression of the chemical reactions, and
their effects upon the physical condition of the paste, are investigated
by the changes in its physical interactions with ultrasonic waves. It
would therefore seem logical that there should be at least two
mechanisms involved. The first governing the rates of progression of
the chemical reactions in the matrix, the other governing the
interaction between this forming matrix and the filler particles
dispersed within it. This latter mechanism could be expected to show
a maximum curing rate or minimum curing time corresponding, to a
first approximation, to a maximum strength composition with well
filled interstices.
257

The ascribed reaction rate indices and time constants are subject to
the above constraints, and therefore abstracted from the actual rates
of reactions of the matrices of the various samples. This- is not a
major problem, since for practical purposes the rate of change in the
physical condition, rather than that of the chemical conditon, is the
important parameter, and that which corresponds most closely to the
measured parameters
8.4 POROSITY - ELASTICITY RELATIONSHIPS.
Kupperman has reported on several investigations into porosity which
show that Young's modulus increases exponentially as porosity
decreases, Kupperman (1987). This can be expressed as :
E = Eo (1-p)e
or In E = In Eo +In(1-P)
where Eo is Young's modulus for the nonporous material, P is the
porosity of the material expressed as a volume fraction and e is the
appropriate exponent. Plotting In E versus InP, as shown in figure
8.15, gives an approximately linear correlation between Young's
modulus (In E) and porosity. Similarly, bulk and shear moduli could be
258
(38)
(39)

w c:
4.-----------------------------------~
3
2
1 ------------~----~----~----~--~ -0.4 -0.3 -0.2 -0. 1
In 1-P
Figure 8.15. The relationship between Youngs modulus and porosity expressed in terms of In E versus the volume fraction of solid material.
correlated with porosity.
Essentially Eo will vary with filler volume fraction and should lie
between the Hashin and Shtrikman upper and lower bounds. Therefore,
it is interesting that the seven data points for E and P (corresponding
to seven diffe'rent volume fractions) fit equation (39) quite well with
a nominally constant Eo, as indicated by the straight line in the plot in
figure 8.15. Thus, the inverse logarithm of the intercept on the E axis
gives a value of 67GPa for Eo with a standard deviation of +10. The
value of the exponent e is 6.67 as determined from the gradient of the
line. It is clear that Eo varies between relatively small bounds
compared with the variation of E with volume fraction in real
(Le. porous) samples.
However, the measured value of Eo, i.e. the value of E, for the
pore-free matrix is much higher than would have been expected in the
light of the theoretical predicted bulk modulus of (10.4 GPa) in
chapter 7.
With a knowledge of the correlation between the elastic moduli and
porosity for a particular ceramic product, ultrasonic examination can
be used as a method of porosity measurement. The conventional
methods which involve knowledge of the theoretial and bulk density
259

determinations or mercury porosimetry are accurate and convenient
for small artefacts or those of a regular shape whose volume can be
calculated. Such methods are inaccurate and inconvenient for articles
of complex shape, and inappropriate if not impossible in the case of
large structures. Furthermore the inference of porosity from the
difference between theoretical density and bulk density assumes that
the material comprising the artefact is homogeneously distributed. If
this is not a valid assumption, or if the theoretical density of the
material is unknown an ultrasonic method of density determination
could be useful. Such determinations would be of only secondary
importance the elastic moduli being of greater significance and use.
This chapter was based upon research carried out in conjunction with
Miss T Kathrina, a masters student working under my guidance and
supervision, which has now been published, Katarina (1991).
260
9. CONCLUSIONS.
9.1 EVALUATION OF FULLY CURED MATERIAL.
1 At low frequencies, in the range 24 -500kHz, such that the
wavelength is significant compared with the size of the samples,
inconsistencies in the measured velocities were observed .. An
explanation in terms of the simultaneous propagation of the rod wave
mode and the first one or two longitudinal wave modes, and an
assumption that the pulse bandwidths are about ±1 0% has been offered,
but not by any means proved. This would tend to limit the use of
equipment operating at these frequencies to large articles or
structures.
2 With considerable further work a theoretical explanation for the
observed anomalies may be deduced. The variations may be highly
sensitive to material property variations and therefore suitable for
N.D.E. purposes. Unfortunately such data would be extremely difficult
to determine practically and interpret theoretically. On line
computers and probe development facilitate the application of these
techniques.
261
.a In materials of reasonable density the high-frequency shear and
compressional velocities, and hence the elastic moduli, could be
determined easily. This technique is therefore useful for Q.A. and
N.D.E. purposes. Alternatively, an indication of density could be
obtained, assuming a standard value for the modulus of the -specimen.
Inability to propagate at or above a specified frequency,such as 2MHz,
could be taken as an indication of substandard material.
4 It is possible to determine the attenuation-frequency relationship
and from this to estimate the grainsize of the material assuming grain
boundary scattering. This was carried out for the samples examined
and confirmed microscopically. Since the grain size is dependent upon
the production process and chemical reaction, and may even be
indicative of the end point of the reaction, spectrum analyser plots and
attenuation-frequency curves could prove invaluable in process
monitoring and quality control of the material.
262

5 It is possible to differentiate between the three samples examined
by observation of their attenuation spectra. The extent of the ability
of this technique to characterise specimens has yet to be.determined.
It should be possible to identify poor material by changes in the
spectrum,and it may be possible to differentiate between batches of
similar material in a quality assurance situation, dependent upon the
extent of the material property variation.
6 I n all samples there are two main phases visible, one phase
containing the majority of the porosity and a second phase, less porous
and probably of greater density. Precise compositions and structures
of these two phases are not yet available from x-ray diffraction
studies, hence it is not at this point possible to determine Hashin and
Shtrikman upper and lower bounds based on these phases. However, a
theoretical calculation of bulk modulus based on the assumption that
the matrix consisted of 80% newberyite and 20% aluminium
orthophosphate by volume, was in excellent agreement with the
measured matrix modulus after allowing for porosity. Such
comparisons highlight the potential value of ultrasound velocity
measurements for nondestructive evaluation and testing, and quality
control of this ceramic material.
263

9.2 MONITORING OF SETTING AND COMPOSITION DEPENDENCE.
The setting (hydration) process in ceramics produced by the reaction
of aluminium orthophosphoric acid with magnesia in the presence of an
inert filler of alumina has been monitored by means of time-of-flight
measurements on MHz frequency ultrasound pulses. The ultrasonic
measurements allow the possibility of several important properties to
be evaluated on-line and non-destructively, namely reaction rates,
porosity levels, the optimum time for sample machining, the geometry
of grain growth, and the time taken for samples to reach their
maximum elastic moduli and strength values (not the infinite time
implicit in reaction rate theory but the time beyond which no further
increases can be observed outside the standard deviation of the
measurements). The important physical parameters are the time
constants. The summary of the main conclusions of the measurements
are as follows.
1 The strength of the ceramic material increased asymptotically to a
maximum value after about 100 hours. It was established that the
velocity and elasticity values at any point in time increase with
264
increasing alumina content to an upper limit of about 60% by weight.
Beyond this amount there is insufficient matrix material for proper
mixing, which results in a weak friable material which defied
evaluation.
2 It was thus established that the optimum alumina content for
maximum strength is about 60% by weight. The observed variations
in the elastic moduli would tend to indicate that the optimum alumina
content lies within the range 50 to 60YJtO/0. Further work within this
range of compositions is required in order to establish this optimum
alumina content more closely and thus maximise the potential
applications of the material.
a To a good approximation the chemical reaction can be divided into
two stages, each having different reaction rates with the first stage
being the fastest. The temperature rise transient during the initial
stage obviously has a direct effect on reaction rate. However it also
has an indirect effect through the fact that changes in the
temperature-time profile will produce changes in grain growth. The
reaction rate in both stages increases as the filler volume fraction
increases due largely to an increase in temperature.
265

4 The composition dependences of the elastic properties were
compared with the Hashin and Shtrikman bounds for two-phase
materials. All experimental data lie in between upper and lower
Hashin and Shtrikman bounds, suggesting that the filler particles were
well dispersed, and well bonded to the matrix. However the data lie
so far above the lower bound as to suggest that the particles were far
from spherical which was as expected. This was confirmed by the low
values of n (n<2) in the empirical reaction rate equation which indicate
a plate structure.
5 It was also established that the elastic moduli increase
exponentially with decreasing porosity within large errors.
266
10. REFERENCES.
ADUDA, D.B.C. and RAWLINGS, R.D. (1996). Br. Ceram. Trans., 95,1, 10-14.
AKITT, J.W. (1992). N.M.R. and Chemistry, 3rd edition, Chapman and Hall.
ANDERSON,' O.L, and NAFE, J.E. (1965). J. Geophys. Res. 70, 16, 3951-63.
ANDERSON, D.L and ANDERSON, O.L. (1971). J. Geophys. Res. 75, 3494-3500.
ANJORIN, M.O. (1988). M.Sc. Dissertation, Brunei University.
APPLETON, S., HUTCHINS, D.A. and LEWIS, M.H. (1991). J. European Ceram. Soc., 8, 339-44.
ARNOLD, W.W.and REITER, H. (1991). Key Engineering Materials, 57, 393-410.
ASHLEY, S. (1993). Mechanical Engineering, 115, 70-71.
ASKELAND, D.R., The Science and Engineering of Materials, 3rd edition, Chapman and Hall, 1996.
BELL, D.A. (1989). Br. Ceram. Trans. J., 88,4,133-37.
BERTHAUD, Y. (1991). Cement and Concrete Research, 21,1, 73-82.
BHARWAJ, M.C. (1990). Metal and Ceramic Matrix Composites; Processing, Modeling and Mechanical Behaviour, Bhagat et al (eds), The Minerals, metals and Materials Society, 509-22.
BIRCHALL, J.D., HOWARD, A.J. and KENDALL, K. (1981). Nature (London),
289,388-89.
BIRCHALL, J.D., HOWARD, A.J. and KENDALL, K. (1982 a). Proc. Br. Ceram. Soc. 32, 25-32, March.
BIRCHALL, J.D., HOWARD, A.J. and KENDALL, K. (1982 b). Chemistry in Britain, 860-63, December.
267

BIRCHALL, J.D., HOWARD, A.J. and KENDALL, K. (1983 a). The Metalurgist and Materials Technologist, 35-38, January.
BIRCHALL, J.D. (1983 b). Technology in the 1990's: Developments in Hydraulic Cements, Hirsch, P. (ed), Phil. Trans. Royal Society, London, A 310,31-42.
BITTENCE, J.C. (1989). Advanced Materials and Processing, 136, 5, 25-40.
BOSSI, R.H. and GEORGESON, G.E. (1991). J. Minerals, Metals and Materials Society, 43, 9, 8-15.
BOVING, K.G. (1989). N.D.E. Handbook, Butterworths.
BRAY, D.E. and STANLEY, R.K. (1989). Nondestructive Evaluation, McGraw-Hili.
BRIDGE, B., PATEL, N.D. and WATERS, D.N. (1983). Phys. Stat. Solidi (a), 77,655-68.
BRIDGE, B. and HIGAZY, A.A. (1986 a). Phys. Chern. Glasses, 27, 1, 1-14.
BRIDGE, B. and PATEL, N.D. (1986 b). J. Mat. Sci. 21, 3783-3800.
BRIDGE, B. and BAGHINI, N. (1987 a). Phys. Chern. Glasses 28, 34-38.
BRIDGE, B., Br. J. NOT, 29, (1987 b). 326-31.
BRIDGE, B. and CHENG, K.H. (1987 c). J. Mat. Sci. Lett. 23, 3118-28.
BRIDGE, B. (1988 a). J. Mat. Sci., 23, 988-94.
BRIDGE, B. and ROUND, R. (1988 b). J. Mat. Sci. Lett., 24, 63-65.
BRODEUR, P.H. (1994). Tappi Journal, 77, 3, 213-8.
BUTCHER, R. (1993). Ceramic Forum International, 70, 10, 550-51.
BUNGEY, J.H. (1993). Proc. Inst. Civ. Engs. Structs. Buildings., 99, 2, 64-67.
BYE, G.C. (1983). Portland cement, Pergamon, Oxford.
268
C.R.C. Press. (1989). Handbook of Chemistry and Physics, Table B69.
CALLISTER, W.D., Materials Science and Engineering, 3rd edition, Wiley, 1994.
CASSIDY, J.E. (1977). High Temperature Chemistry of Inorganic and Ceramic Materials, Glasser, F.P. (ed), Chemical society. 192-203. CHANDRA, L. and CLYNE, T.W. (1993). J. Mat. Sci. Lett., 12, 3, 191-95.
COTTON, F.A., and WILKINSON, G. (1972). Advanced Inorganic Chemistry, Interscience Publishers, 3rd edition, table 3-3.
CROSTACK,H.A., MORLO,H., and NIEHUS, R. (1987). Non Destructive Testing, Proceedings of the 4th European Conference, London, 2289-99, 13-17 September.
DAVIDGE, R. (1989). Br. Ceram. Trans. J., 88, 4,17-23.
DAS,A.C., NIYOGI, S.K. and MUKERGEE,S. (1991). J. Mat.Sci. Lett., 27, 10,173-75.
DEPERRIOS, J.M. (1988). Industrie Ceramique, 1988, 10,702-3.
DEWHURST, R.J., HUTCHINS, D.A., PALMER, S.B. and SCRUBY, C.B. (1982). J. Appl. Phys., 53, 6, 4064-71.
DEWHURST, R.J., EDWARDS, C., McKIE, A.D.W. and PALMER, S.B. (1988). J. Appl. Phys., 65, 8,1225-27.
DOYLE, P.A. (1986). J.Phys. 0, 19,9,1613-23.
DRAPER, E.A., SCALNY, J, and ROSENTHAL, M.S. (1994). Cement technology, 40, 187-94.
EDWARDS, G.R. (1989). Br. Ceram. Trans. J., 88, 4,117-23.
EKENHORST, D., GOEBBELS, J. and WOLFF, V. (1993). Ceramic Forum Int. 70, 10,557-60.
ELLINGSON, W.A., SINGH, J.P., HOLLOWAY, D.L., DIEKMAN, S.L., SINGH, D., SIVERS, E.A., SHEEN, S.H and WHEELER, M.J. (1992 a). Proceedings of the Sixth Annual Conference on Fossil Energy Materials. 229-39, July.
269
ELLINGSON, W.A., SINGH, J.P., SIVERS, E.A., HOLLOWAY, D.L., JACOBS, T.D., DIEKMAN, S.L. and SINGH, D. (1992 b). Proceedings of the Sixth Annual Conference on Fossil Energy Materials. 119-30, July.
ELLINGSON, W.A., AYAZ, D.M., BRADA, M.P. and O'CONNELL, W. (1993). NIST Special Publication 847, Proc. Int. Conf. on Advanced Mats., Gaithersburg, Maryland, 147-57,20-22 July.
ENGLER, P. and FRIEDMAN, W.O. (1990). Materials Evaluation, 48,5, 623-29.
FAN, K., KHALlD,A., SATTAR, T., CHENN,S., and BRIDGE,B. (1995). Non Destructive Testing and Evaluation, 12,3,181-196.
FINCH, T. and SHARP, J.H. (1989). J. Mat. Sci, 24, 4379-86.
FRASER, J.D., AMIN; K.E. and KHURI-YAKUB, B.T. (1991). Nondestructive evaluation and Material Properties of Advanced Materials, Liaw et al (eds), The Minerals, metals and materials Society, 1-3.
GAl, H. and LOCKYEAR, C.F. (1993). Acoustic Sensing and Imaging, I.E.E. Conf. Proc., 120-125,29-30 March.
GEORGESON, G.E. and BOSSI, R.H. (1991). Nondestructive Evaluation and Material Properties of Advanved Materials, Minerals, Metals and Materials Society, Liaw et al (eds), 99-108.
GENERAZIO, E.R., ROTH,D.J., STANG,D.B. (1989). J. Am. Ceram. Soc. 72, 7,1282-85.
GERHARDT, R. (1994). Ceramic Engineering and Science Proceedings, 15,5, 1174-81.
GIANARIS, N.J. and GREEN, R.E. (1991). Nondestructive Evaluation and Material Properties of Advanved Materials, Minerals, Metals and Materials Society, Liaw et al (eds). 29-35.
GLASSER. F.P. (1990). Br. Ceram. Trans. J., 89, 6,195-202.
GOOBERMAN, G.L. (1968). Ultrasonic Theory and application, English Universities Press. London.
GORDON,G., lITTMANN,B., CANUMALLA, S. and SEGALL,A.E. (1993). Ceramic Industry, 79-82, May.
?7n

GOUDA, G. and ROY, D.M. (1976). J. Am. Ceram. Soc., 59, 412-14.
GREEN, A. (1987). Private communication.
GRUBER,J.J., SMITH,J.M., and BROCKLEMAN,R.H. (1988). Materials Evaluation, 46,1, 90-96.
HALMSHAW, R. (1987). Non-destrucnve Testing, Edward Arnold, London.
HANSTEAD, P.O. (1987). Non Destructive Testing, Proceedings of the 4th European Conference, London. 13-17 September. 2279-88.
HASHIN, l., J. (1962). Appl. Mech., 29, 143-50.
HASHIN, l., and SHTRIKMAN, S. (1963). J. Mech, Phys. Solids, 11, 127-140.
HAYASHI, K. KATSUHIRO, K. KOSE, K. and INOUYE, (1988). T., J. Phys. D. 21, 1037-39.
HEARLE, A.G. and HABER, R.A. (1995). J. Am. Ceram. Soc., 78, 3, 819-23.
HEFETl, M. and ROKHLlN, S. (1992). J. Am. Ceram. Soc., 75, 7,1839-45.
HIRSCH, P. (1983). (ed). Technology in the 1990's: Developments in Hydraulic Cements, Phil. Trans. Royal Society, London, A 310.
HJORTH. L. (1983). Technology in the 1990's: Developments in Hydraulic Cements, Hirsch, P. (ed), Phil. Trans. Royal Society, London, A 310, 167-73.
HUTCHINS,D.A. (1985). J. Phys. E, 18, 1,69-73.
HUTCHINS, D.A. and MAIR, H.D. (1989). J. Mat. Sci. Lett., 25, 8, 1185-87.
JEN, K-C. and NERO, C. (1993). J. Am. Ceram. Soc., 76,3,712-16.
JONES,M.P., BLESSING. G.V. and ROBBINS, C.R. (1986). Materials Evaluation, 44, 6, 859-62.
271
KARUNANITHY, S. and MOOIBROEK, S. (1989 a). J. Mat. Sci., 24, 3686-90.
KARUNANITHY, S. and FALK, M. (1989 b). Ceram. Eng. Sci. Proc., 10, 998-1002.
KARUNANITHY, S. (1991). J. Mat. ScL, 26, 2169-72.
KATERINA, T., ROUND, R. and BRIDGE, B. (1991). J. Phys. 0,24, 1673-86.
KAUTZ, H.E. (1989). Acousto-ultrasonics, Theory and Application, Duke, J.C. (ed), Plenum.
KAWASHIMA, K. and WRIGHT, O.B. (1992). J. Appl. Phys., 72,10, 4830-39.
KENDALL, K., HOWARD, A.J. and BIRCHALL, J.D. (1983). Technology in the 1990's: Developments in Hydraulic Cements. Hirsch, P. (ed), Phil. Trans. Royal Society, London, A 310,139-53.
KINGERY, W.O. (1950). J. Am. Ceram.Soc., 33, 8, 239-50.
KINGERY, W.O., BOWEN,H.K. and UHLMANN,D.R. (1976). Introduction to Ceramics, 2nd edition, Wiley.
KNAB, L.I., BLESSING, G.V. and CLIFTON, J.R. (1983). Am. Concrete Inst. J. 17-27, Jan-Feb.
KOLSKY, H. (1963). Stress Waves in Solids, ch 3, Dover books.
KONSZTOWICZ, K.J. (1990). J. Am. Ceram. Soc., 73,10,2809-14.
KREHER W, RANACHOWSKI, J. and RAYMUND F. (1977). Ultrasonics 15,
70-74.
KUDRYATSEV, A.B. and PYATKOVA, A.V. (1989). Industrial Laboratory, 55,4,426-32.
KULKARNI, N., MOUDGIL, B. and BHARDWAJ, M. (1994 a). Am. Ceram. Soc. Bull., 73, 6, 146-53.
KULKARNI, N., MOUDGIL, B. and BHARDWAJ, M. (1994 b). Am. Ceram. Soc. BulL, 73, 7, 83-85.
272

KUPPERMAN, D.S. and KARPLUS, H.B. (1984). Ceramic Bulletin, 63,12,
1505-09.
KUPPERMAN, D.S. (1987). Materials Analysis by Ultrasonics: Metal, Ceramics, Composites., Vary, A. (ed). Noyes Data Corporation, New Jersey, USA, 99-111.
KUNERTH, D.C., TELSCHOW, K.L. and WALTER, J.B. (1989). Materials Evaluation, 47, 571-75, May 1989.
LAWRENCE, F.V. YOUNG, J.F. and BERGER, R.L. (1974). Proceedings of the 6th International congress on the chemistry of cement, Moscow, 134-44.
LEA, F.M. (1970). The Chemistry of Cement and Concrete, Edward Arnold.
LEE,R.J., DRAPER,E.A. and SKALNY, J. (1992). Mat. Res. Soc. Symp. Proc., 245349-57.
LEMMENS, J.W. (1991). Ceramic Bulletin, 70, 2, 208.
MAJUMDAR, A.J. and LAWS, V. (1983). Technology in the 1990's: Developments in Hydraulic Cements. Hirsch, P. (ed), Phil. Trans. Royal Society, London, A 310, 191-202.
MAKISHIMA, A. and MACKENZIE, (1973). J.D., J. Non. cryst. Solids, 12,
35-45.
MAKISHIMA, A. and MACKENZIE, J.D. (1975). 17,147-57.
MATURANA, L.L. (1988). M.Sc. dissertation, Brunei University.
MAYNARD, J. (1996). Physics Today, 49,1,26-31.
MIGLIORI, A. (1993). Materials Technology, 8, 139-41.
MILNE, (1991). UK patent 2237 113A.
NEVILLE, A.M. and BROOKS, J.J. (1987). Concrete Technology, Longman.
NONAKA,T., HAYAKAWA,Y., TAKEDA,S. and NISHIMORI,H. (1989). Materials Evaluation, 47, 5,542-46.
273
O'HARA, M.J., DUGGA, J.J., and SHEETS, H. D. (1972). Amer. Ceram. Soc. Bull., 51, 590-95.
OZAKI, Y., SUMITANI,H., TOMODA,T., and TANAKA, M. (1987). Non Destructive Testing, Proceedings of the 4th European Conference, London. 13-17 September. 2489-98.
PAIN, H.J. (1983). The Physics of Vibrations and Waves. Wiley.
PANAKKAL, J.P. (1992). Br. J. NDT. 34,11,529-32.
PAPADAKIS, E.P. (1976). Physical Acoustics: Principles and Methods; Academic Press, New York, San Francisco, London. Vol xii, 277-374 ..
PAPADAKIS, E.P. (1984). J. Testing and Evaluation, 12,5,273-79.
PARADIS, L., DE VADDER, D., and SAMAIN, E. (1987). Non Destructive Testing, Proceedings of the 4th European Conference, London 13-17 September. 2475-82.
PATEL, N.D., BRIDGE, B. and WATERS, D.N. (1983). Phys. Chem. Glasses, 24, 5, 122-29.
PHILLIPS, D.H. and LANNUTTI, J.J. (1993). Am. Ceram. Soc. Bull.,72, 11, 69-75.
POPOVICS, S., ROSE,J.L. and POPOVICS,J.S. (1990). Cement and Concrete Research, 20, 2, 259-70.
POTET, P., BATHIAS, C. and DEGRIGNY, B. (1988). Materials Evaluation, 46, 7, 1050-54.
QUINN, G.D. and MORRELL, R. (1991). Design Data for Engineering Ceramics; A Review of the Flexure Test. J. Am. Ceram. Soc. 74, 9, 2037-66.
RAPOPORT, Y.M., SLOUSHCH, V.J. (1994). Refractories, 35,1-2,26-31.
REYNOLDS, W.N. and SMITH, R.L. (1984 a). J. Phys.D, 17, 109-16.
REYNOLDS, W.N. (1984 b). Br. J. N.D.T., 26,1,11-14.
REYNOLDS, W.N. (1985). and SMITH, R.L. Br. J. NOT., September, 291-94.
274
REYNOLDS, W.N. SCUDDER, L.P and PRESSMAN, H. (1986). Polymer
testing, 6, 325-36.
REYNOLDS, W.N. (1989). Br. Ceram. Trans. J., 88, 4, 124-26.
ROBERTS, R.A. (1988). Materials Evaluation, 46, 7, 758-66.
ROGOFSKY, A.J. (1991). Materials Evaluation, 49,12,1491-97.
ROUND, R., and BRIDGE, B. (1987). J. Mat. Sci. Lett., 23, 6, 1471-72.
ROUND, R., BRIDGE, B. and GREEN, A. (1988 a). J. Mat. Sci. Lett., 24, 7, 604-6.
ROUND, R., BRIDGE, B. and GREEN, A. (1988 b). J. Mat. Sci. Lett., 24, 7, 748-52.
ROTH, D.J., STANG, D.B., SWICKARD, M.S., DEGUIRE, M.R. and DOLHERT, L.E. (1991). Materials Evaluation, 49, 883-88.
ROY, D.M. and GOUDA, G. (1973). J. Am. Ceram. Soc. 56, 549-50.
ROY, D.M. (1980). report NMAB-361, National Materials Advisory Board, National research Council, Washington D.C.
ROY, D.M. (1987). Science, 235, 652-8, February.
SAYERS, C.M and SMITH, R.L. (1985). A.E.R.E. Harwell report R 11589.
SCHINDEL, D.W. and HUTCHINS,D.A. (1995). J. Acoust. Soc. Am., 97,3,1650-59.
SHEETS, H. D., BULLOFF, J.J., and DUCKWORTH, W.H. (1958). Brick and Clay Record, 133, 55-57.
SHEPPARD, L.M. (1990). Advanced Materials and Processes, 132, 5, 53-60.
SHEPPARD, L.M. (1991). Ceramic Bulletin, 70, 8, 1265-79.
SMITH, R.L., REYNOLDS, W.N. and SCUDDER, L.P. (1984). Proceedings of the 5th Riso symposium on metallurgy and materials science, 519-23.
SMITH, R.L. (1985). A.E.R.E. Harwell report R 11885.
275
SMITH, R.L. (1987). NOT Int. 20, 1,43-48.
SMITH, S.D. (1990). Optical Engineering, 29, 5, 524-34.
SMITH, M.E. and STRANGE, J.H. (1996). Meas. Sci. Te.chnol., 7, 449-75.
SOGA, N. and ANDERSON, D.L. (1966). Proceedings of the 7th Int. Congress on Glass.
SPLITT, G. (1987). Nondestructive Testing, Proceedings of the 4th European Conference, London 13-17th September. 2300-04.
STANLEY, C.C. (1979). Highlights in the History of Concrete. Cement and Concrete Association.
STEPISNIK,J. LUKAS,M. and KOCUVAN, I. (1981). Ceram. Bull, 60,4, 481-83.
STINSON, M.P., HOLLOWAY, D.A. and ELLINGSON, W. (1993). Ceramic Engineering and Science Proceedings, 14, 7-8, 485-91, 1993.
SUTOR, D. J. (1967). Acta Cryst., 1967.23,418-22.
SZILARD,J. (ed). (1982). Ultrasonic Testing, non conventional techniques. Wiley-Interscience.
TALREJA, R. (1989). Acousto-ultrasonics, Theory and Application, Duke, J.C. (ed), Plenum. 177-190.
TAN,K.S., ROUND,R. and BRIDGE,B. (1989). Br. Ceram. Trans. J., 88, 4, 138-43.
TAYLOR, H.F.W. (1966). Chemistry of Cements, R.I.C. Lecture series.
TAYLOR, H.F.W. (1981). Chemistry of Cements, J. Inst. Ceram., December, 6-12.
TELSCHOW, K.L. and CONANT,R.J. (1990 a). J. Acoust. Soc. Am. 88, 3, 1494-1502 Correction: 1991. 89, 5, 2463.
TELSCHOW,K.L., WALTER, J.B., and GARCIA, G.V. (1990 b). J. App. Phys., 68, 12,6077-6082.
276
TIWARI, A., REIFSNIDER, K.L. and HENNEKE, E.G. (1995). J. Composite Mats., 29, 13, 1680-94.
THOMPSON, I. and RAWLINGS, R.D. (1991). J. Mat. Sci., 26, 12, 4534-4540.
VAIDYA, U.K. and RAJU, P.K. (1994). Materials Evaluafion, 52,6, 682-88.
VAINBERG,I.A., DOLGOMIROV, B.A., GRABOVSKII, S.B., ABRAMOV, V.A. and FEDOROV, A.B. (1993). Glass Ceramics, 50,1-2, 23-6.
VARY, A. (1989). Acousto-ultrasonics, Theory and Application, Duke, J.C. (ed), Plenum, 1989. 1-21.
VARY, A. (1991). J. Acoust. Soc. Am., 49, 4, 581-91.
VOGEL, J.A. and BRUINSMA, A.J.A. (1987). Nondestructive testing, Proceedings of the 4th European Conference, 13-17 September. 2267-78.
WANG, P.S., MINOR, D.B. and MALGHAN, S.G. (1993). J. Mat. Sci., 28, 4940-43.
WINTERFELD, J., TEITZ, H.D. and DEITZ, M. (1993). Ceramic Forum International, 70, 10,554-57.
WOLFENDEN, A., HARMOUCHE, M.R., BLESSING, G.V., CHEN, Y.T., TERRANOVA, P., DAYAL, V., KINRA, V.K., LEMMENS, J.W., PHILLIPS, R.R., SMITH, J., MAHMOODI, P. and WANN, R. (1989). J. Test. Eval. 17,1,2-5.
WRIGHT, W.D.M., HUTCHINS,D.A. and HAYWARD,G. (1993). Acoustic Sensing and Imaging, 29, March, 245-250.
WRIGHT, W.D.M., HUTCHINS,D.A. and LEWIS, M.H. (1995). J. Mat. Sci. Lett., 14, 336-39.
WYCKOFF, R.W.G. (1965). Crystal Structures, vol 3, Interscience Publishers, 2nd edition.
YAMANAKA,K., JEN, C.K., NERON,C. and BUSSIERE, J.F. (1989). Materials Evaluation, 47, July, 828-34.
YAMICAWA, (1993). US Patent no 5,217,503, 8th June.
277


![[bura.brunel.ac.uk]bura.brunel.ac.uk/bitstream/2438/5871/1/FulltextThesis.pdf · · 2014-11-01Acknowledgements To my parents with thanks for the sacrifices they have made so that](https://img.pdfslide.net/doc/110x75/5ac7ba477f8b9a5d718c0472/bura-bura-to-my-parents-with-thanks-for-the-sacrifices-they-have-made-so-that.jpg)