Embed Size (px)
Citation preview

1
EVALUATION OF RECLAIMED WATER FOR COOLING IN
COAL-FIRED POWER PLANTS OF NORTH CAROLINA
By
Meng-Ying Lee
Dr. David E. Hinton, Advisor
Dr. Darmawan Prasodjo, Advisor
Spring 2012
Masters project submitted in partial fulfillment of the
requirements for the Master of Environmental Management degree in
the Nicholas School of the Environment of
Duke University
2012

2
Abstract
Cooling systems for thermoelectric power generation are responsible for 39% of the freshwater
withdrawal in the US. As the demand for electricity increases, finding alternative water source is
crucial. Studies have shown that reclaimed water can be used in certain applications, including
makeup water in power plant cooling systems. Concerns about reclaimed water for cooling
purpose include potential environmental health impacts during the cooling process, and
reclaimed water availability for the cooling systems. This study reviewed the federal and NC
state regulations governing the use of reclaimed water for cooling purposes, and the toxicological
and epidemiological studies on potential human health impacts of hazards emitted from the
cooling systems. In addition, a scenario analysis was conducted to assess reclaimed water
availability for coal-fired power plants in NC regarding water transportation costs. The result
showed that using a spatial-economic optimization model considering pipeline construction
conditions and the potential of pipeline merging can effectively minimize the pipeline
construction cost and obtain the least-cost pipeline network infrastructure. The unit transport cost
analysis for each power plant also provided the power plant companies the practical information
they need for evaluating the feasibility of reclaimed water application for each power plant.
Considering the potential issues from water quality and availability, establishing stable supply-
demand relationships between reclaimed water source and power plants can be beneficial for
both water quality control and makeup water security for power plants.

3
Table of Contents
1 Introduction ............................................................................................................................. 5
1.1 Cooling system for thermoelectric power plants.............................................................. 5
1.2 Publicly Owned Treatment Works (POTWs) and reclaimed water reuse regulation ...... 7
1.3 Local availability of reclaimed water for power plant cooling needs .............................. 8
1.4 Pipeline deployment for reclaimed water transport ......................................................... 9
1.5 Health concerns about reclaimed water for cooling......................................................... 9
1.6 Aim and scale of study ................................................................................................... 10
2 Methodology of the study...................................................................................................... 11
3 Regulations and risk assessments of reclaimed water for cooling ........................................ 13
3.1 Federal and state regulations of reclaimed water for power plant cooling .................... 13
3.1.1 Regulations for wastewater treatment and POTW operation ................................. 15
3.1.2 Regulations for reclaimed water reuse.................................................................... 15
3.1.3 Regulations for cooling tower discharge ................................................................ 16
3.1.4 Regulations for cooling tower air emission ............................................................ 17
3.2 Risk assessment of applying reclaimed water to power plant cooling system............... 17
3.2.1 Potential hazards in reclaimed water ...................................................................... 18
3.2.2 Exposure routes to workers and general populations ............................................. 21
3.2.3 Risk factors and management ................................................................................. 21
4 Water availability and transportation analysis....................................................................... 23
4.1 Factors affecting water transportation efficiency........................................................... 24
4.1.1 Cost surface of pipeline transportation ................................................................... 24
4.1.2 Pipeline merging and spatial permutation............................................................... 26
4.1.3 Optimization model for pipeline transportation network........................................ 28
4.2 Assumption and Scenario analysis ................................................................................. 29
4.3 Water consumer inventory - existing coal-fired power plants in NC ............................ 31
4.4 Water supplier inventory – POTWs in NC .................................................................... 33
4.5 Reclaimed water transportation analysis........................................................................ 34
5 Conclusions and Recommendations ...................................................................................... 38
References..................................................................................................................................... 40

4
Figures
Figure 1: County-wide Thermoelectric Cooling Constraint Index for 2025 of the US. ................. 6Figure 2: Conventional wastewater treatment process ................................................................... 8Figure 3: Methodology flowchart of the study. ............................................................................ 12Figure 4: Least-cost pipeline routing on (A) baseline surface and (B) cost surface..................... 26Figure 5: Pipe diameter vs. average CO2 transport cost. .............................................................. 27Figure 6: Spatial permutation for two POTWs and one power plant. .......................................... 28Figure 7: Optimization model consists of spatial analysis and mathematical modeling. ............. 29Figure 8: Power plants and POTWs distributions in NC.............................................................. 32Figure 9: POTWs selected and the pipeline routes for Roxboro power plant under 3 scenarios. 36Figure 10: Pipeline construction costs and total lengths for Roxboro with three scenarios. ........ 36Figure 11: Unit transport cost for each power plant for scenario 3. ............................................. 37
Tables
Table 1: Summary of federal and NC regulations and guidelines on reclaimed water reuse. ...... 14Table 2: Factors considered in reclaimed water pipeline transportation design. .......................... 24Table 3: Obstacles encountered during pipeline construction and the relative cost factors. ........ 25Table 4: Factors considered in three scenarios. ............................................................................ 30Table 5: Existing coal-fired power plants in NC. ......................................................................... 31Table 6: Water withdrawal factors for electricity generating technologies (gal/MWh)............... 33
5
1 Introduction
Coal with its relatively low cost and abundance has been utilized to generate half of the
electricity consumed in the US. A number of studies have focused on the pollutants released to
the environment during coal burning process. Coal-burning results in significant emissions of
greenhouse gas, airborne particles, sulfur and nitrogen oxides, and heavy metals into the
atmosphere [1]. Therefore, the operation of coal-fired power stations has caused human health
and environmental impacts. Both federal and state authorities have established clear regulations
and guidelines for the burning operations with respect to potential environmental impacts. In
addition to the pollution during combustion, a rising issue of coal-fired power generation is that
the use of steam turbines requires significant amounts of water for cooling of the exiting steam.
Cooling in electric power facilities is responsible for 39% of freshwater withdrawn in the US [2].
As the demand of electricity resulting from rapid economic development increases, alternative
sources of cooling water are needed. This study aims at conducting a comprehensive analysis to
evaluate the feasibility of using impaired water for cooling in coal-fired power plants in North
Carolina. To evaluate the feasibility of water reuse in North Carolina, potential health risk from
use of reclaimed water as well as the spatial availability and transportation of reclaimed water to
the power plants is analyzed.
1.1 Cooling system for thermoelectric power plants
Cooling procedures are critical for electricity generation efficiency. In thermoelectric power
plants, process water is heated to produce steam that then drives the turbine and generates
electricity. The steam is then exhausted from the turbine, cooled and condensed for reuse. The
condensing process requires additional water to serve as coolant. Two major types of water-
based cooling systems are currently used. These are the once-through and the closed-cycle
systems. The former withdraws large volumes of cooling water from adjacent water body. This
water is then pumped through the condenser and returned to the water body. The operation of
water intake system and the heated water discharge have been shown to cause significant impacts
on the natural habitats in the adjacent water bodies. It follows that new construction of the once-
through cooling systems are being challenged.

6
Due to the constraints of constructing once-through cooling systems, closed-cycled cooling
systems are increasingly used in newly-built power plants. The closed-cycled cooling system
recycles warm water to cooling tower and exposes it to ambient air for cooling through
evaporation, which is enhanced by the material used in cooling tower and the natural draft to
increase the contact between water and air. Closed-cycled systems may also utilize cooling
pond with similar mechanism with cooling tower except that cooling ponds rely on natural heat
transfer from water to air. The volume of water withdrawn for closed-cycled cooling system is
smaller than once-through system since water will be circulating for reuse, but consumption of
cooling waters occurs through blowdown and evaporation. Water withdrawal volume required
for cooling in thermoelectric power plants varies depending on the fuel type and cooling systems.
The increase of electricity demand has further burdened limited local water resources in some
regions of the US. Figure 1 shows the county-level Thermoelectric Cooling Constraints Index
considering local water supply sustainability and the growth of electricity generation in 2025 [3].
Cooling water constraints occur in a nation-wide scale, especially in pacific coast states. This
phenomenon indicates that alternative cooling water sources to sustain freshwater consumption
is inevitable in the future.
Figure 1: County-wide Thermoelectric Cooling Constraint Index for 2025 of the US [3].

7
1.2 Publicly Owned Treatment Works (POTWs) and reclaimed water reuse
regulation
Three potential alternative sources of cooling water have been proposed including: treated
wastewater, treated mine drainage, and ash transport water from coal-fired power plants [4].
Among the alternatives, secondary treated waste water from POTWs is the most common and
widespread recycled water source in the US. Owned by local governments, POTWs receive
domestic sewage and some non-domestic wastewater from residential, commercial, and
industrial facilities for pre-treatment processes before waters are transported to treatment plants.
In the US, an estimated 21,594 POTWs are currently providing wastewater collection, treatment,
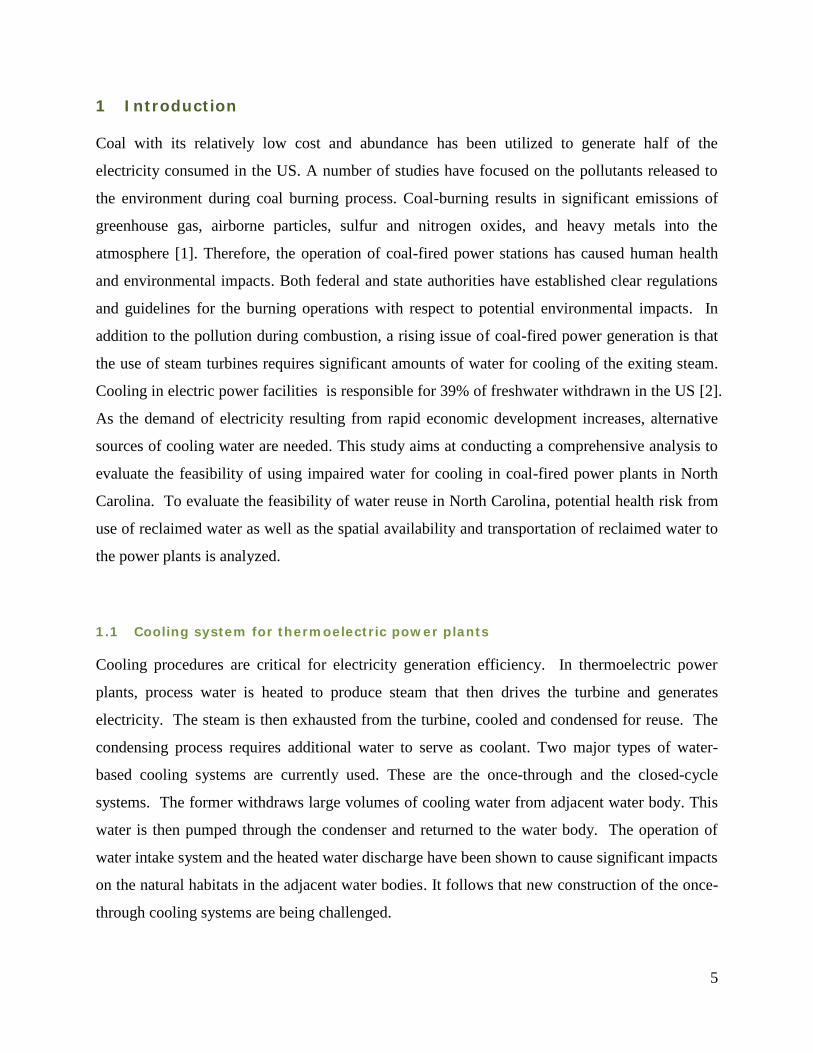
and disposal service to 226.4 million people [5]. The general wastewater treatment process is
illustrated in Figure 2.
The level of required treatment depends on how reclaimed water is to be used. The treatment
process can be divided into primary, secondary, and tertiary (advanced) treatments [6]. Before
entering the sewer system, wastewater is strained to remove the large items by bar screens to
prevent their flowing into and damaging the clarifier. After the preliminary treatment,
wastewater undergoes primary treatment, which further removes suspended solids by
sedimentation creating a generally homogeneous liquid for subsequent biological processes.
Secondary treatment uses activated sludge in an aeration environment to remove up to 90%
suspended organic matters as well as heavy metals and other impurities attached to the
suspended solids. The clarified liquid then continues on to disinfection mainly through
chlorination. After removing the disinfectant, the water is then clean enough for discharge to the
environment and for some reuse processes. Tertiary treatment usually proceeds under the
requirement for specific reuse purposes. The advanced treatment can be accomplished by a
variety of methods including coagulation sedimentation, filtration, reverse osmosis, and nutrient
removal by secondary biological processes.
8
Figure 2: Conventional wastewater treatment process [7]
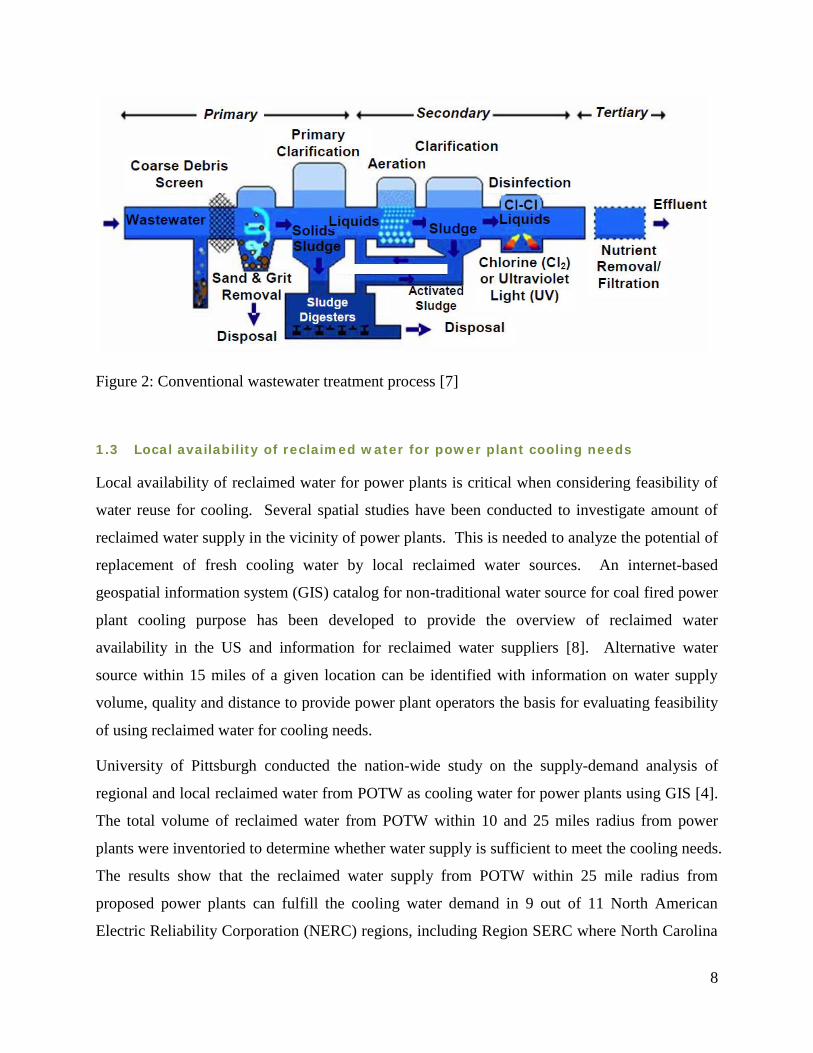
1.3 Local availability of reclaimed water for power plant cooling needs
Local availability of reclaimed water for power plants is critical when considering feasibility of
water reuse for cooling. Several spatial studies have been conducted to investigate amount of
reclaimed water supply in the vicinity of power plants. This is needed to analyze the potential of
replacement of fresh cooling water by local reclaimed water sources. An internet-based
geospatial information system (GIS) catalog for non-traditional water source for coal fired power
plant cooling purpose has been developed to provide the overview of reclaimed water
availability in the US and information for reclaimed water suppliers [8]. Alternative water
source within 15 miles of a given location can be identified with information on water supply
volume, quality and distance to provide power plant operators the basis for evaluating feasibility
of using reclaimed water for cooling needs.
University of Pittsburgh conducted the nation-wide study on the supply-demand analysis of
regional and local reclaimed water from POTW as cooling water for power plants using GIS [4].
The total volume of reclaimed water from POTW within 10 and 25 miles radius from power
plants were inventoried to determine whether water supply is sufficient to meet the cooling needs.
The results show that the reclaimed water supply from POTW within 25 mile radius from
proposed power plants can fulfill the cooling water demand in 9 out of 11 North American
Electric Reliability Corporation (NERC) regions, including Region SERC where North Carolina

9
is located. The nation-wide study provides an overview of the regional proximity of POTWs to
power plants and the number of POTWs needed to fulfill the cooling water demand for any
proposed power plants.
1.4 Pipeline deployment for reclaimed water transport
The transport of reclaimed water from POTWs to power plants requires pipeline connection.
Pipeline construction and route for deployment are greatly influenced by the geographic
elevation and land use patterns. To further identify POTW sites with most potential for certain
power plants and to minimize pipeline construction cost, the cost surface representing relative
cost of constructing a pipeline through various types of terrain must be determined. Both
geographic features and land cover data should be considered in the POTW selection process. A
cost surface for the transportation of carbon dioxide from source to sink developed at
Massachusetts Institute of Technology (MIT) for carbon dioxide capture and storage (CCS)
deployment can be utilized [9]. The cost surface quantified the difficulties of pipeline
construction based on those surfaces with higher cost such as the crossing of waterways,
highways, railroads, and slopes, as well as the environmental impacts for sensitive areas
including national parks, state parks, wetlands, and populated areas. Choosing the water sources
for the power plants considering the transportation difficulties provide more feasible assessment
for future practice.
1.5 Health concerns about reclaimed water for cooling
According to “Guidelines for Water Reuse” [10] released by US Environmental Protection
Agency (USEPA), secondary treatment is the minimum standard for municipal waste water in
POTW, and the quality of treated water effluent is also regulated including pH values, and the
concentration of BOD5, TSS, and fecal coliform. 40CFR423 also limits the concentrations of
free chlorine, Chromium, and Zinc in discharge. However, some additional concerns are still
needed for regulating contaminants in cooling tower using reclaimed water. For example, both
organic matter and nutrients in the reclaimed water provide the growth environment for
microorganisms. Thus, free chlorine has been utilized as a biocide in waste water treatment with

10
the minimal concentration of 1 mg/L. However, high concentration of chlorine will produce
trihalomethanes and other byproducts which are considered carcinogenic or mutagenic [11].
Another significant hazard identified from the cooling tower is Legionella, a pathogenic
bacterium and the cause of Legionnaires' disease (LD). Legionella can be transmitted from
cooling towers to the susceptible receptors through aerosols. LD has been definitively linked by
retrospective epidemiological studies with exposure to contaminated water in cooling towers [12,
13]. Improper maintenance of cooling towers can result in outbreak of Legionella due to
temperature conditions around cooling towers creating a favored environment for bacterial
growth. California state government regulates the emission of Legionella through requiring the
addition of chlorine or other biocides during the treatment, yet neither federal nor North Carolina
governments include this requirement.
The exposure routes for hazards in reclaimed water include water- and airborne routes.
Waterborne routes include the blowdown water from the cooling tower, waste streams from
treatment processes associated with the cooling circuit, and sludge generated from cooling
system maintenance. Airborne routes include evaporation during the cooling process and drift
exhausted with air into atmosphere from the cooling towers. Among these routes, drift contains
highly concentrated metals, nutrients, and microorganisms and can pose health risks for workers
and residents in the vicinity areas; thus, the airborne exposure route is considered as the most
important for hazards associated with cooling towers [14].
1.6 Aim and scale of study
My study aims at providing a comprehensive evaluation for the application of reclaimed water
from POTW for cooling in coal-fired power plants in NC. I shall confine my scale of analysis to
NC to provide analysis under the same state regulation and limitation. Potential hazard,
Legionella, is assessed regarding their health risks to examine current water quality regulations.
Reclaimed water availability for individual power plants with the optimal pipeline transportation
network is also included using a spatial-economic optimization model. This analysis results in
both reclaimed water quality and availability for the reuse application and provides an analytical
basis for future strategic planning and decision making.

11
2 Methodology of the study
The flowchart of the analysis procedure is shown in Figure 3.
The federal and NC state regulations and guidelines including wastewater standards, reclaimed
water treatment standards, and the regulations on cooling tower water discharge and air emission
on reclaimed water reuse for power plant cooling were first reviewed. The epidemiological and
risk assessment studies on the potential human health risks from reclaimed water applied to
power plant cooling systems were also reviewed. These focused on the potential hazards from
drift released to the atmosphere during cooling processes. Further reviews on toxicological and
epidemiological studies, guidelines, and management standards for Legionella were also
conducted.
In addition to water and risk assessment, water availability analysis in NC was also conducted.
The inventories of POTWs and coal fired power plants were developed considering their
geospatial information availability and state regulation. The volume of water supply was derived
from the database, and the water demands from power plants were estimated according to annual
electricity generation. Both POTWs and power plants in NC were transferred to digital spatial
data. A scenario study was then conducted to assess water availability considering water
transportation costs and properties in NC. Water availability regarding the least linear distance
from POTWs, the least distance from POTWs considering pipeline construction conditions, and
the cost minimization considering both the construction conditions and the potential of pipeline
merging are assessed as three scenarios. A unit transport cost analysis for each power plant was
also conducted to evaluate the feasibility of reclaimed water for cooling in each power plant.
The suggestion for the reuse of reclaimed water for power plant cooling was based on the risk
assessment reviews and the cost analysis of water pipeline network.

12
Figure 3: Methodology flowchart of the study.The human health impact assessment as well as the reclaimed water availability and transportationanalysis led to the suggestions for using reclaimed water for power plant cooling in NC
Digitalization of watersupply and demand
inventory
Inventory of POTWwater supply
Inventory of powerplant cooling water
Calculation of coolingwater demand
Unit transport costanalysis for each power
plant
Review on federal andNC state regulations onwater reuse for cooling
Suggestions for usingreclaimed water for power
plant cooling in NC
Review onepidemiological and risk
assessment studies onreclaimed water in
cooling systems
Identification of potentialhazards in reclaimed
water in cooling systems
Review on toxicologicaland risk assessment
studies, guidelines, andmanagement standards
for Legionella
Human health impactassessments:
Reclaimed water availability andtransportation analysis:
Scenario analysis:calculate pipeline routes
for each power plant withthree scenarios
13
3 Regulations and risk assessments of reclaimed water for cooling
The process of wastewater reuse, as cooling water, contains three main steps. Municipal and
industrial wastewater is first transported to vicinity POTWs for treatment and become reclaimed
water. The reclaimed water is then transported to the site of power plants through water
pipelines, and reclaimed water is then imported into cooling tower as makeup water. Wastewater
typically contains a range of hazards including heavy metals, pathogens, and organic matters that
are proven to be harmful to human health and ecological environment. Therefore, intense
regulations regarding treatment operations and discharge of POTWs have been established by
both federal and state governments. In contrast, the requirements and regulations for the
following reuse process for reclaimed water from POTWs have not yet been specified. The
related regulations and guidelines of reclaimed water reuse for cooling were reviewed in this
chapter.
In addition to current regulations, increasing studies are conducted to identify the potential risks
for reclaimed water reuse for cooling. Although no current study has conducted a complete
environmental risk assessment specifically for the reuse, a number of potential hazardous
materials in the reclaimed water and their potential exposure routes to human have been
discussed. In this chapter, the studies related to the risks from the reuse processes were reviewed,
and potential approaches for future studies were also reviewed and discussed.
3.1 Federal and state regulations of reclaimed water for power plant cooling
Federal and North Carolina state regulations for the reclaimed water reuse process are
summarized in Table 1. According to the hierarchy of American legal system, state regulations
will only be equal to or stricter than federal regulations for the states to comply. If the states do
not have specific regulations, federal regulations or guidelines are applied. For the reclaimed
water reuse related regulations, North Carolina has specific regulations on the reclaimed water
quality requirements and on the cooling tower discharge, which are considered in the following
feasibility analysis for North Carolina.

14
Table 1: Summary of federal and NC regulations and guidelines on reclaimed water reuse.
Federal North Carolina
Wastewatertreatment
Clean Water Act
Prohibited DischargeStandards (40 CFR 403.5)
Categorical PretreatmentStandards (CWA S307)
Local Limits (40 CFR403.8(f)(4), 40 CFR403.5(c))
N/A
Reclaimedwater reuse
Guideline for Water Reuse
>secondary treatment
<30 mg/L of BOD and TSS
<200 fecal coliform/100 ml
>1 mg/L residual chlorine
pH 6-9
15A NCAC 02T.0906
>tertiary treatment
<10 mg/L (monthly) and 15 mg/L (daily) of BOD
<5 mg/L (monthly) and 10 mg/L (daily) of TSS
<4 mg/L (monthly) and 6 mg/L (daily) of NH3
<14/100 mL (monthly) and 25/100 mL (daily) offecal coliform
>10 NTU Turbidity
15A NCAC 02T.0910
notification, education, records
cooling towerdischarge
CWA
NPDES permit
40CFR423
pH 6-9
<0.2 mg/L (monthly) and 0.5mg/L (daily) Chlorine
<0.2 mg/L Chromium
<1.0 mg/L Zinc
15A NCAC 02B.0208
15A NCAC 02B.0211
Thermal (Temperature) Variances to NorthCarolina Water Quality Standards
water quality standard for temperature for specificwater bodies
air emission NAAQS
PM10: 150 ug/m3 (24 hrs)
PM2.5: 15 ug/m3 (annual)
35 ug/m3 (24 hrs)
N/A

15
3.1.1 Regulations for wastewater treatment and POTW operation
From Table 1 above, POTW operations are regulated by the Federal Clean Water Act (CWA).
CWA is the statutory authority for both the National Pollutant Discharge Elimination System
(NPDES) Permit Program and the National Pretreatment Program. A POTW is identified as a
point source that discharges pollutants to surface waters and thereby requires a NPDES permit
for the treatment operations. Section 307(b) regulates industrial facilities and requires that pre-
treatments be conducted before discharging wastewater to ensure the effectiveness of treatment
for POTWs. In addition, the National Pretreatment Program regulates the source of wastewater
that flows to POTWs with discharge standards and pretreatment standards for particular
industrial categories.
The National Pretreatment Program applies three types of discharge standards:
Prohibited Discharge Standard: the standard applied to all Industrial Users (IUs)
forbids the discharge of specified pollutants, including pollutants that will affect or
damage the function of POTW or cause health and safety problems to a POTW. The
standard, however, does not set up specific pollutant limitations, so the additional
regulations, such as Categorical Pretreatment Standard and Local Limit, are needed.
Categorical Pretreatment Standard: the standard is applied to Significant Industrial
Users (SIUs) defined by 40 CFR 403.3(v). EPA developed general pretreatment
standards for many industrial categories.
Local Limit: EPA gives POTWs the authority to develop their own local limits for their
potential waste water source in order to achieve the effluent limitations as specified in its
National Pollutant Discharge Elimination System (NPDES) permit.
3.1.2 Regulations for reclaimed water reuse
Federal regulation
Although the limitations for POTW water effluent quality are clearly identified in CWA, the
reuse of reclaimed water as power plant cooling water has not been specifically regulated. In
2004 Federal EPA published "Guidelines for Water Reuse" [10], which includes the types of

16
water reuse, treatment suggestions, related technical issues, and a number of water reuse
examples for different purposes. The federal guidelines for using reclaimed water for
cooling are listed below [14].
The minimum treatment requirements include secondary treatment, disinfection, and
possible chemical coagulation and filtration. Additional treatment may be performed
by the user to prevent scaling, corrosion, biological growth, fouling, and foaming.
The reclaimed water should contain <30 mg/L of biochemical oxygen demand (BOD)
and total suspended solids (TSS), <200 fecal coliform/100 milliliters (ml), a
minimum of 1 mg/L residual chlorine, and a pH range of 6.0–9.0.
Windblown spray should not reach areas accessible to workers or the public. This
requirement can be met by providing a setback distance of 90 meters. The setback
may be reduced or eliminated if a high level of disinfection is provided.
NC regulation
In general, North Carolina has developed stricter regulations regarding reclaimed water reuse
and discharge from industrial cooling systems. Specific information regarding the North
Carolina Administrative Code (NCAC) for Reclaimed Water Utilization was reviewed in
National Energy Technology Laboratory report [4]. Tertiary treatment is required for
reclaimed water to be reused for cooling. The limitations for BOD, TSS and fecal coliform
are also stricter than the federal standard. In addition, the concentration of NH3 and the
turbidity of water are also regulated. Other requirements for reclaimed water reuse in NC
includes the notifications to public and employees of the reuse about the non-potable
properties of reclaimed water, the appropriate education to reclaimed water users and
approval from the reclaimed water generator, the records of reclaimed water distribution, and
the inspection and review of the pathways for water transportation.
3.1.3 Regulations for cooling tower discharge
Federal regulation

17
The application of federal regulations also does not have specific regulations on the
discharge of reclaimed water from cooling tower [15]. In CWA, cooling tower is regulated
as a point source discharge of pollutants to surface water bodies, requiring an authorized
NPDES permit. Specific Clean Water Act regulations in the Code of Federal Regulations
(40CFR423) set up the standards for steam electric power plant discharges, including the
limitations for pH values, free chlorine, total chromium and zinc for once-through cooling
water and cooling tower blowdown water.
NC regulation
NCAC develops thermal discharge water requirements to protect the destination water bodies
[16]. The rule limits thermal discharges to 2.8 degrees C above the natural temperature of
the destination water bodies. The permit is required for exceptions to the limits. In North
Carolina, 8 coal-fired power plants hold the permits by demonstrating that the less stringent
thermal limitations will not affect aquatic systems in a site-specific manner.
3.1.4 Regulations for cooling tower air emission
In addition to blowdown water, air emission through evaporation and aerosol drift during cooling
process is addressed in the Guideline for Water Reuse [10]. This suggests that when reclaimed
water is used in industrial cooling, windblown spray should not reach areas accessible to workers
or the public, since the drift usually contains highly concentrated contaminants including metals,
chlorine metabolites, nutrients, and microorganisms. Most of the power plants have also
installed drift eliminators to reduce the amount of drift released into the environment. Although
no federal regulations specifically limit the air emission from cooling towers using reclaimed
water, Clean Air Act (CAA) regulates cooling tower as potential point emission source, which is
required to comply with National Ambient Air Quality Standards (NAAQS).
3.2 Risk assessment of applying reclaimed water to power plant cooling system
The human health risk assessment of reclaimed water reuse has focused more on irrigation. This
is mainly due to the multiple exposure routes of environmental toxicants through irrigation,
including crop contamination, inhalation and dermal contact by the farmers and workers. As

18
more reclaimed water is applied to industrial cooling, potential environmental impacts from
water reuse as cooling water have led to increased concern [4]. The potential hazards in cooling
water, exposure routes of contaminants from cooling towers to the environment, and the toxicity
of contaminants to human will be reviewed in this chapter.
3.2.1 Potential hazards in reclaimed water
Hazards in reclaimed water largely depend on the source and composition of the wastewater.
The contaminants from POTWs that are of the most concern include: pathogens, trace organics,
heavy metals, endocrine disrupting chemicals, pharmaceutically-active compounds, and nutrients.
In addition, the byproducts of chlorine, the common disinfectant used in wastewater treatment,
are also found both in the effluent and the emitted drift from cooling towers [17]. Emission of
particulates from air drift is also of major concern in cooling towers due to salt deposition and
concentration during the cooling process. Although federal regulations and guidelines have set
up standards and limitations for most hazardous materials, the limitations to some pathogens are
still not well-defined in North Carolina state regulation. The most concerned pathogen that has
been detected in both the drift and blowdown water from cooling towers is Legionella that
causes LD. Also, the additional disinfection treatment required for reclaimed water in the
cooling towers may also cause excessive concentrations of hazardous chlorine byproducts with
their subsequent release to the environment. Among all potential hazards, Legionella is the most
prevalent contaminant currently associated with cooling towers, especially when reclaimed water
is reused as the alternative cooling water source [1, 4, 13].
3.2.1.1 Legionella - Environmental source
Legionella is commonly found in natural aquatic environment such as rivers and ponds. Widely
spreading via aerosols and capable of surviving extreme environmental conditions, Legionella is
also found to contaminate a wide range of human water facilities. Cooling tower provides one of
Legionella’s favorite environments for growth. The following conditions are particularly
important:
1. The warm water environment between 68 and 113 degrees F (the optimal reproduction
temperature for Legionella is 95 degrees F)
2. Sediment and food sources supporting the growth of Legionella and the microbiota that
supply essential nutrients for Legionella

19
3. Certain amoebae and other protozoa that provide the habitats for the environmental
survival and reproduction of Legionella
Other potential sources of contaminated water include large air conditioning systems, whirlpools
and spas, fountains, ice machines, vegetable misters, shower heads, and even potable water
system [18]. The wide spread of Legionella in the urban water systems would increase the risk
of potential outbreak of LD and thus raise the public health concern.
3.2.1.2 Legionella - Pathogenesis and epidemiology
Legionella is a pathogenic Gram negative bacterium including L. pneumophila that is the major
species to cause LD. Legionella typically proliferates intracellularly in protozoa within biofilms.
The growth within protozoa enhances the capability of Legionella to survive under less favorable
conditions and also protects Legionella from disinfection treatment. Legionella is transmitted
via aerosols. Person-to-person transmission does not occur in the existing outbreaks [19].
LD was first recognized as a distinct pneumonia during the outbreak of pneumonia in
Philadelphia in 1976 [20]. 182 cases with 29 deaths were reported, including the members of the
Pennsylvania State American Legion who attended the annual convention in the summer of 1976,
visitors, and residents. Legionella were isolated from lungs of patients and identified as the
etiologic agent of Legionnaires’ diseases. The potable water system in a hotel where the Legion
members stayed was identified as the source of Legionella, which was spread through aerosols to
patients in town.
A number of epidemiological studies have also found that the Legionella-contaminated cooling
tower systems in urban areas, including hospital and air conditioner cooling towers, were linked
to the regional outbreak of LD. In 1994, a community outbreak of LD with 29 cases was reported
in Delaware [21]. The case-control study found that for those people who lived, worked, or
visited within 4 miles of the hospital, the odds ratio for the disease increased when the distance
from the hospital decreased and when the time spent near the hospital increased. The dose of
exposure was quantified by “Aerosol Exposure Unit” (AEU). The water samples taken from the
main cooling tower were found to contain identical subtypes of Legionella species with water
samples from the homes of 2 patients. The results suggested that contaminated aerosols from the
hospital cooling tower were responsible for the outbreak.

20
An outbreak in Pas-de-Calais, France in 2004 demonstrated that the contaminated aerosols
emitted from an industrial cooling tower can undergo transport over a long distance [22]. The
case-control study confirmed 86 cases as having LD. The living locations of these cases were
compared with the concentration contours of aerosols from the plant simulated by the air
dispersion model. The consistency between estimated concentrations of the presumably
contaminated aerosols and the commune-attack rate suggested that the cooling tower in the
petrochemical plant was the source of Legionella. The results showed that the Legionella-
contaminated aerosols spread at least 6 kilometers from the petrochemical plant and, after spread,
remained pathogenic.
3.2.1.3 Legionella - Detection and disinfection
Due to the symbiosis of Legionella with protozoa within biofilms, detection and disinfection of
the pathogen become more difficult. The standard method for detection is to cultivate samples in
selective media. The pretreatment of inhibitors for other bacteria in the sample is usually needed
to enrich Legionella species [18]. In addition to cultivation, other techniques have been
developed to detect Legionella in various environments, including direct fluorescent antibody
techniques for natural aquatic environment and the gas chromatographic-mass spectrometric
method for detecting unique fatty acids of the L. pneumophila lipopolysaccharides in biofilms in
potable water with complex microbial communities [18]. Polymerase chain reaction methods
have also been developed and used as a detection kit for initial analysis of water [23].
The association with biofilms also makes Legionella more resistant to conventional chlorination.
Legionella are able to survive in low levels of chlorine for relatively long periods of time [24].
Legionella have been detected in all phases of the sewage treatment processes, and the
population number of Legionella failed to decline during treatment processes [25]. Another
study detected Legionella in reclaimed water after tertiary treatment and in the aerosols obtained
above a secondary sewage treatment basin [26]. Legionella in reclaimed water was also found
to reestablish in the reservoir and during the distribution after treatment due to the loss of
residual disinfectant and high assimilable organic carbon (AOC) [27]. These findings suggest
that additional and continuous chlorination may be required to inhibit the growth of Legionella
during reuse process, although additional chlorine treatment may raise the issue of emissions of
hazardous chlorine byproducts.

21
3.2.2 Exposure routes to workers and general populations
Human exposure routes to Legionella have been documented in various epidemiological and
experimental studies. Legionella is found to directly transmit from environment to humans.
Little evidence showed that Legionella can transmit in a human-to-human manner [18]. In most
epidemiologic cases, Legionella transmitted through contaminated airborne aerosols from types
of aerosol generators [28] and was subsequently inhaled by humans. Other less common
exposure routes includes ingestion of contaminated potable water, immersion in raw water,
inhalation of contaminated water/oil mixtures, and excavation in dusts or soil [19].
Legionella enters human respiratory systems and reaches the lower respiratory tract of humans to
begin the pathological process of infection [29, 30]. Legionella can also be deposited in the
upper airways and then aspirated to deeper portion of the lung to trigger serious pneumonia [31].
The symbiotic characteristic of Legionella with microorganisms further enhances its prevalence
and resistance to disinfection. Legionella-filled vesicles are formed and expelled by the
microorganisms in cooling towers after biocide treatment. Such vesicles enable transmission of
Legionella and protect Legionella from dessication during the transmission, thereby maintaining
the infectious dose of Legionella when reaching the respiratory systems of vulnerable receptors
[32].
3.2.3 Risk factors and management
The low attack rates of Legionella in the U.S. represent the resistance of general populations to
the infection [19]. However, several risk factors have also been identified to increase the
incidence of LD. Patients living in the hospital requiring intubation, ventilation assistance, and
respiratory therapy have increased risks to cause LD [33]. Also, patients with diseases such as
chronic obstructive pulmonary disease, diabetes, head or neck cancer, or end-stage renal disease
also have a significant increased risk of LD [34, 35].
Due to the widespread prevalence of Legionella in cooling towers, workers at industrial plants or
power plants have become susceptible population for the exposure to Legionella. To control and
assess the potential Legionnaires’ disease at worksites, Occupational Safety & Health

22
Administration (OSHA) at United States Department of Labor has designed an eTool [36] to
provide information on disease recognition, potential disease source identification, investigation
procedure, and the response and control strategies once an outbreak occurs. Given the fact that
Legionella is widely found in cooling towers and the inhalation and aspiration of contaminated
aerosols or water are major exposure routes to Legionella, adequate risk management at the
worksites can be effective to prevent the outbreak of LD.

23
4 Water availability and transportation analysis
With the construction of new power plants, the most urgent concern with the wet cooling system
has been water availability. Competition from municipal and agricultural water demand has
decreased the amount of freshwater and causes the alternative water source more important for
industrial use. To evaluate reclaimed water availability for each power plant, the distance from
POTWs to the power plant was used as the single most important criterion in the previous
national study [4]. POTWs with lowest linear distance to the power plant were considered the
most cost-effective reclaimed water source [4]. However, when considering the difficulties and
cost of pipeline construction, geographic properties and land use pattern become important. The
shortest linear distance does not necessarily represent the most cost-effective choice of water
source. In addition, the potential for use of pipeline networks rather than individual pipelines
potentially increases water transportation efficiency and should also be taken into account to
minimize pipeline transportation costs [37].
To solve this problem, I employed the concept of a spatial and economic optimization model
modified from OptimaCCS, a CO2 pipeline transportation network model established by
Nicholas Institute for Environmental Policy Solutions [37]. OptimaCCS, a spatial economic
optimization model, can help minimize costs by simultaneously considering costs of CCS
pipeline construction and injection [37]. The algorithm of OptimaCCS first identifies every
single pipeline segment through a spatial permutation process and obtains the cost for each
segment spatial optimized using ArcGIS by considering the cost surface which reflects the
multiple factors listed in Table 4. Each CO2 source can be a potential hub in which small
pipelines can merge to become a trunk pipeline [37]. In my study, each POTW was also
considered as a hub that connects other POTWs to a downstream POTW or to the destination
power plant. In addition, the pipe size for each pipeline segment was obtained from the model.
Factors affecting pipeline transportation were considered in the model using both geospatial
analysis and mathematical modeling to optimize pipeline routes for reclaimed water supply for
each power plant. I also conducted scenario study to compare the difference of pipeline routing
when considering different pipeline transportation factors.

24
4.1 Factors affecting water transportation efficiency
Two factors affecting water transportation efficiency include pipeline construction conditions
and the potential of cost-effective pipeline network design. As shown in Table 2, the concept of
cost surface in ArcGIS was applied to assess the spatial obstacles in the area of pipeline
construction. For the cost-effective network design, pipeline merging and route permutation
were conducted using The General Algebraic Modeling System (GAMS) [38]. The concepts of
the two factors are described in the following sections. The spatial and economic optimization
model integrates ArcGIS and GAMS to design optimal pipeline transportation network for each
power plant.
Table 2: Factors considered in reclaimed water pipeline transportation design.
Factors Methods Programs
Pipeline constructionconditions
Cost surface ArcGIS: Spatial analysis
Cost-effectivenetwork design
Pipeline merging Route permutation
GAMS: Mathematical programmingand optimization
4.1.1 Cost surface of pipeline transportation
A cost surface reflects the spatial obstacles for constructing pipelines in the area. The cost
surface used in this study is a raster layer of North Carolina derived from the cost surface used
for MIT CO2 transportation cost model [9] with a cell size of 1 km2. This cost surface is also
incorporated in OptimaCCS model [37]. The cell values are multipliers of an assumed baseline
pipeline cost. This baseline pipeline cost (cost multiplier of 1) is for a pipeline that traverses a
flat surface (without any obstacles) and includes the fixed cost of material, labor, and
miscellaneous costs. The multiplier adjusts cost by factoring in the contribution of land slope,
protected areas, and crossings of three line-type obstacles (waterways, railroads, and highways)
[9]. Once all of the multiplier variables are assigned for each cell, they are added to the base
value to give each cell its final cost surface multiplier value. The weight factors for the different
construction conditions are shown in Table 3.

25
Table 3: Obstacles encountered during pipeline construction and the relative cost factors [9].
Construction Condition Cost Factor
Base Case 1
Slope1
10-20% 0.1
20-30% 0.4
>30% 0.8
Protected Area
Populated Place 15
Wetland 15
National Park 30
State Park 15
Crossing
Wateway Crossing 10
Railroad Crossing 3
Highway Crossing 3
To identify those POTWs needed for power plants with the water transportation cost and the
routes from each POTW to the next POTW or to the power plant, the CostDistance function in
ArcGIS was used [39]. The CostDistance function is designed to identify the accumulating cost
from a beginning point to an end point on the cost surface, and also provides a way to trace back
the back link grid between two points. The CostPath function uses the intermediate output from
CostDistance to come up with the optimized route (represented as a vector) between two points.
The combination of these two functions enables the routing modeling of the least-cost path
between two points. Each of the above is described in detail in ArcGIS Desktop Help 9.3
Document [40].
For instance, there are two points (P1 and P2) on a uniform cost surface with each pixel
having a level difficulty multiplier of 1 (baseline), such as a desert. Since it is a uniform cost
surface, the least-cost path between P1 and P2 will be a straight line path with cost distance of 5
units (Figure 4A). Another instance is that the two points are located on a mixed cost surface
area (Figure 4B). This surface area contains some pixels with a pipeline development multiplier
of 2 (e.g urban areas), which means that those areas are twice as expensive as the baseline
development cost. Using the least-cost path function to move from P1 to P2 results in a pipeline

26
route that avoids high-cost development areas. A normalized distance is used to reflect the
weighted distance related to building a pipeline over varying terrain. For example, if it is twice
as difficult to build a pipeline over a 1 km stretch of terrain, the cost distance for that 1 km
distance is 2. In the above example, a straight line route results in a cost distance of 9 units
(purple arrows), while the spatially-optimized, least-cost path has the cost distance of 6.8 units
(red arrows) (Figure 4B). This demonstrates that the CostDistance and CostPath functions in
ArcGIS are capable of identifying the least-cost path between two points [39].
Figure 4: Least-cost pipeline routing on (A) baseline surface and (B) cost surface.
4.1.2 Pipeline merging and spatial permutation
Rather than individual small pipelines, merged pipelines with larger pipe size are more cost-
efficient in terms of unit cost for transporting reclaimed water. This concept can be derived from
pipeline engineering principle of CO2 transportation that is characterized by the decreasing of
average cost of transporting a unit ton of CO2 per unit distances as the pipe diameter increases
[41]. The same concept can also be applied in the water transportation study. Figure 5 shows
the relationship between the unit cost of water transportation and the pipeline size. The data of
water flow rate and pipeline unit cost for different sizes of pipelines are obtained from the
engineering data of stainless steel Schedule 40 pipe (flow to size) [42], and the unit cost of steel
pipes are estimated from the cost for CO2 steel pipelines in OptimaCCS proportional to the
thicknesses of the pipes (size to cost) [43]. The cost of pumping device for the pipelines is
ignored in this study. According to Figure 3, the average cost-per-ton per km of water decreases
at a decreasing rate as the pipeline diameter increases. This means that there is an incentive to
aggregate water flow from multiple sources into larger diameter pipelines to reduce costs.

27
Figure 5: Pipe diameter vs. average CO2 transport cost.The data is calculated based on “flow to size” [42] and “size to cost” [43] data for water pipelines.
Given that each pipeline segment between points can be the candidates of the pipeline network,
the pipeline cost for each segment is required to identify optimal pipeline routes [37]. The
concept of spatial permutation is used to obtain the cost distance for each segment. The
permutation result is then input to the optimization model to identify the least cost combination
of pipeline segments. For example, if a power plant requires the reclaimed water demand from
both POTW1 and POTW2 for cooling, the spatial permutation and optimization outcome can be
shown in Figure 6. The cost distances for the four segments among two POTWs and one plant
demonstrate that if POTW1 and POTW2 connect to the plant individually, the cost distance for
the two pipelines is 50 (30 from POTW1 to the plant and 20 from POTW2 to the plant).
However, if the reclaimed water supplied from POTW1 is transported to POTW2, and then the
joint water is transported to the plant, the cost distance will be 30 (10 from POTW1 to POTW2
and 20 from POTW2 to the plant). In addition, the joint water from POTW2 to the plant will use
a larger pipeline with lower unit water transport cost, which means the pipeline cost can be
further reduced. More detailed information can be found in the OptimaCCS study [37].
0
50
100
150
200
0 10 20 30 40 50 60
Dolla
r/ga
llon/
km
Pipe size (inches)
Cost of transporting water per gallon/km

28
Figure 6: Spatial permutation for two POTWs and one power plant.
The number of possible pipeline segments can be counted by multiplying the number of
beginning and ending points. Given n POTWs (circles in Figure 6) and s power plants (triangle
in Figure 6), the number of pipeline segment beginning points is simply n. Pipeline segment
ending points could be either another POTW with (n-1) possibilities or a power plant with s
possibilities with total count of (n-1+s). Hence, the number of exhaustive spatial permutations
which also reflects the number of pipeline segment candidates is the product of the number of
beginning points multiplied by the number of ending points: n(n+s-1). In our example in figure
7 we have two POTWs and one power plant with a total number of pipeline segments 2(2-1+1)
which is equal to 4. Exhaustive spatial permutation facilitates the cost minimization process by
considering every possible pipeline convergence.
4.1.3 Optimization model for pipeline transportation network
The optimization model employed in this study combines the capabilities of ArcGIS spatial
optimization and mathematical programming based cost minimization. POTWs and power
plants are first analyzed by ArcGIS to obtain the least cost distance value for each possible
segment between points. The result of spatial permutation is then input to GAMS mathematical
model along with the information of water supply volume from each POTW and water demand
from the given power plants. The mathematical model is capable to identify the pipe size and
cost required for each segment including all possible combinations of pipeline merging. The
objective function of the mathematical model is to minimize the pipeline cost for each power
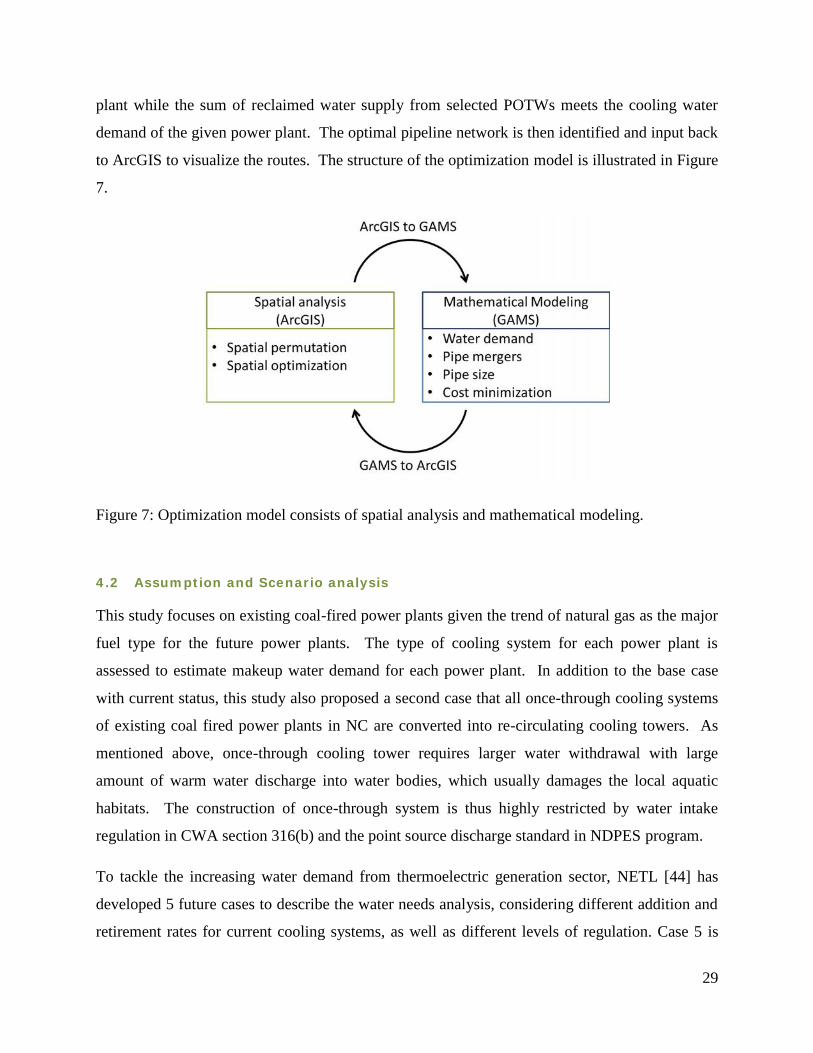
29
plant while the sum of reclaimed water supply from selected POTWs meets the cooling water
demand of the given power plant. The optimal pipeline network is then identified and input back
to ArcGIS to visualize the routes. The structure of the optimization model is illustrated in Figure
7.
Figure 7: Optimization model consists of spatial analysis and mathematical modeling.
4.2 Assumption and Scenario analysis
This study focuses on existing coal-fired power plants given the trend of natural gas as the major
fuel type for the future power plants. The type of cooling system for each power plant is
assessed to estimate makeup water demand for each power plant. In addition to the base case
with current status, this study also proposed a second case that all once-through cooling systems
of existing coal fired power plants in NC are converted into re-circulating cooling towers. As
mentioned above, once-through cooling tower requires larger water withdrawal with large
amount of warm water discharge into water bodies, which usually damages the local aquatic
habitats. The construction of once-through system is thus highly restricted by water intake
regulation in CWA section 316(b) and the point source discharge standard in NDPES program.
To tackle the increasing water demand from thermoelectric generation sector, NETL [44] has
developed 5 future cases to describe the water needs analysis, considering different addition and
retirement rates for current cooling systems, as well as different levels of regulation. Case 5 is

30
the conversion case describing the retrofit of once-through cooling systems to become re-
circulating systems under regulatory and public pressures. In this study, both base case (the case
continues current status) and the conversion case are assessed. I ignored the timeline for
conversion, assuming that the all power plants in NC have already converted into re-circulating
cooling system when starting using reclaimed water as makeup water. The two cases will be
assessed at the reclaimed water inventory stage to see if the overall reclaimed water supply
fulfills the makeup water demand from all existing coal-fired power plants in NC.
To understand how the geographical properties and the potential of pipeline merging affect the
route design for pipelines, I conducted the pipeline transportation analysis with three scenarios
described below and in Table 4.
Scenario 1: Those POTWs that supply reclaimed water for each power plant were selected
according to the least linear distance from the POTW to the plant. This scenario does not
consider the difficulties of water pipeline construction.
Scenario 2: The POTWs for each power plant were selected according to the least cost
distance considering the MIT cost surface from the POTW to the plant. This scenario
considers the pipeline construction conditions, so the selected POTWs have the lowest
pipeline construction cost if we only consider individual pipelines between POTWs to the
power plant.
Scenario 3: The spatial-economic optimization model described above is used in this scenario.
The scenario considers both the cost surface for pipeline construction conditions and the
pipeline merging. These factors affecting pipeline transportation are quantified to estimate the
optimal pipeline networks with minimal pipeline cost for each power plant.
Table 4: Factors considered in three scenarios.
ScenarioMinimal
linear distanceMinimal cost
distancePipelinemerging
Minimalpipeline cost
1: Linear distance √
2: Cost distance √
3: Optimal network √ √ √

31
4.3 Water consumer inventory - existing coal-fired power plants in NC
Data of coal fired power plants in NC were obtained from NETL Coal-Fired Power Plants
database [45]. Those power plants with longitude/latitude, net annual electrical generation, and
cooling system information in the database were included in the study. 14 power plants were
finally selected. The information of 14 power plants was compiled from the database and listed
in Table 5. Power plants with larger water demands are located at northen and western areas of
NC (Figure 8). The largest three cooling water demands are from Roxboro, Marshall, and
Belews Creek power plants.
Table 5: Existing coal-fired power plants in NC [45].
Plant NameCooling WaterSource
CurrentPrimaryCoolingSystem
Net AnnualElectricalGeneration(MW-h)
Waterwithdrawal –BAU (milliongal/year)
Waterwithdrawal -conversion case(million gal/year)
Asheville Lake Julian Recirculating 2,845 2,845 2,845Cape Fear Cape Fear River Once through 2,251 93,809 2,251Lee H F Lee Lake Recirculating 2,459 2,459 2,459Roxboro Lake Hyco Recirculating 22,850 22,850 22,850L V Sutton Sutton Lake Recirculating 3,703 3,703 3,703W H Weatherspoon Weatherspoon Lake Recirculating 957 957 957G G Allen Lake Wylie Once through 7,699 320,774 7,699Buck Yadkin River Once through 1,976 82,351 1,976Cliffside Broad River Once through 4,480 186,662 4,480Dan River Dan River Once through 779 32,466 779Marshall Lake Norman Once through 18,599 774,962 18,599Riverbend Catawba River Once through 2,203 91,789 2,203Mayo Mayo Lake Recirculating 5,945 5,945 5,945Belews Creek Belews Lake Once through 18,416 767,321 18,416Sum 79,302,597 2,388,894 95,163

32
Figure 8: Power plants and POTWs distributions in NC.Water withdrawal volumes and the locations of power plants were estimated and digitized based onNETL database [45]. Reclaimed water supply volume from POTWs and the locations were obtainedfrom CWNS 2008 database [5]. The cost surface is derived from MIT CO2 transportation cost model [9].
The cooling water demand for each power plant is estimated according to their annual generation,
water to energy ratio, and capacity factor based on the following equation [4]:
E = G * R
Where
E = Estimated water demand, gal/year
G = Net annual electrical generation, MW*h
R = Water withdrawal factor, gal/MW*h
The net annual electrical generation was obtained from NETL database [45]. The water
withdrawal factor was derived from the National Renewable Energy Laboratory (NREL) [46]
estimating the average water withdrawal and consumption for different type of power plant
cooling systems. The withdrawal factors for coal fired power plants are listed in Table 6. Two
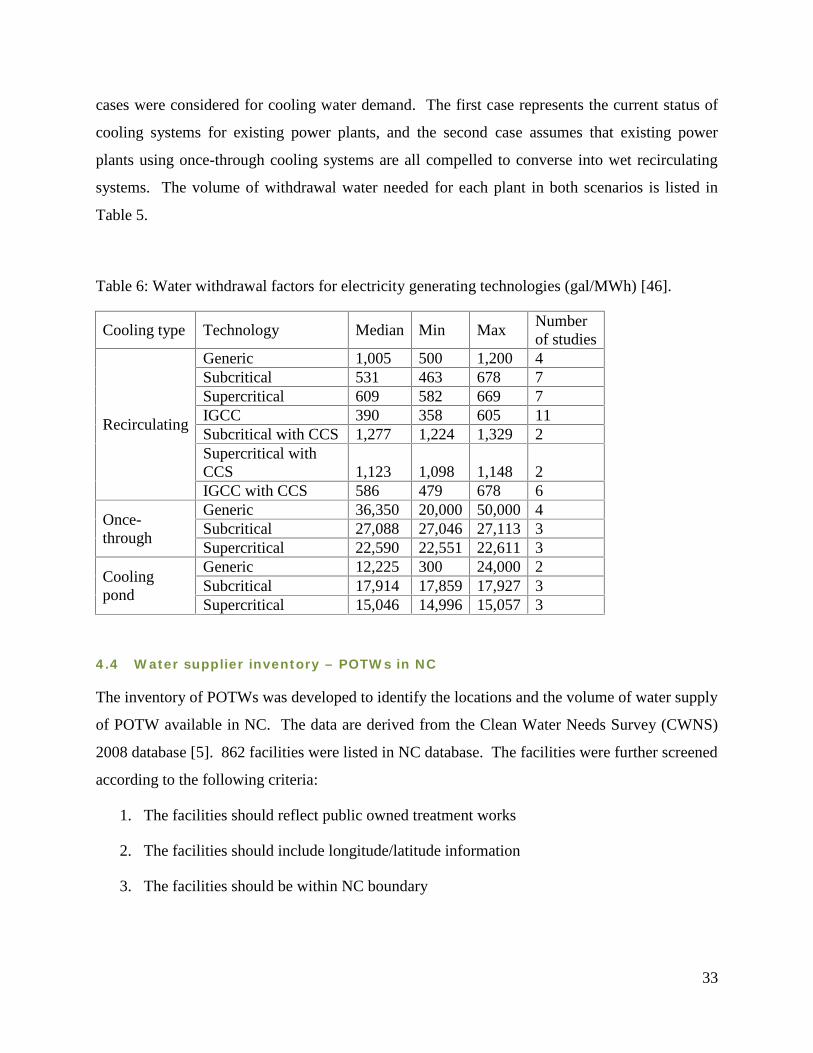
33
cases were considered for cooling water demand. The first case represents the current status of
cooling systems for existing power plants, and the second case assumes that existing power
plants using once-through cooling systems are all compelled to converse into wet recirculating
systems. The volume of withdrawal water needed for each plant in both scenarios is listed in
Table 5.
Table 6: Water withdrawal factors for electricity generating technologies (gal/MWh) [46].
Cooling type Technology Median Min MaxNumberof studies
Recirculating
Generic 1,005 500 1,200 4Subcritical 531 463 678 7Supercritical 609 582 669 7IGCC 390 358 605 11Subcritical with CCS 1,277 1,224 1,329 2Supercritical withCCS 1,123 1,098 1,148 2IGCC with CCS 586 479 678 6
Once-through
Generic 36,350 20,000 50,000 4Subcritical 27,088 27,046 27,113 3Supercritical 22,590 22,551 22,611 3
Coolingpond
Generic 12,225 300 24,000 2Subcritical 17,914 17,859 17,927 3Supercritical 15,046 14,996 15,057 3
4.4 Water supplier inventory – POTWs in NC
The inventory of POTWs was developed to identify the locations and the volume of water supply
of POTW available in NC. The data are derived from the Clean Water Needs Survey (CWNS)
2008 database [5]. 862 facilities were listed in NC database. The facilities were further screened
according to the following criteria:
1. The facilities should reflect public owned treatment works
2. The facilities should include longitude/latitude information
3. The facilities should be within NC boundary

34
4. The minimum level of treatment should be tertiary treatment to comply with NC
regulation 15A NCAC 02T.0906
After screening, 150 POTWs are identified as reclaimed water suppliers to power plants for
cooling needs in NC. The sum of volume supplied is 330,989 million gallon per year. The 150
POTWs were imported into GIS with World Geodetic Survey 1984 (WGS 84) as the geographic
coordinate system for further spatial analysis. The distribution of POTWs is shown in Figure 8.
Comparing with total water needed for NC coal fired power plants in Table 4, the total water
supply from POTW in NC does not meet the needs for existing power plants with current cooling
systems (2,388,894 million gallons per year), indicating that the large amount of water
withdrawal required by once through cooling system exceeds the water reuse capacity in NC.
On the other hand, in conversion case where all existing once-through cooling systems are
assumed to be converted into recirculating systems in the future, the cooling water demand is
95,163 million gallon per year, which is 28% of total tertiary treated municipal water supplied in
NC. Therefore, in the following analysis, the conversion case is used, assuming recirculating
cooling systems are to be used in all power plants in the future in NC.
4.5 Reclaimed water transportation analysis
The POTWs for each power plant and the pipeline transportation routes were selected and
delineated in 3 scenarios. The analysis for Roxboro power plant, the largest coal-fired power
plant in NC, was demonstrated in Figure 9 as an example. As shown in Figure 9, the pipelines in
scenario 1 and 2 appear to be complex and redundant. All pipelines from each POTW connect to
Roxboro plant individually and pipelines share the same route where the cost surface is “flatter”
when approaching the power plant. This indicates that merging those pipelines on the same
route can substantially reduce the pipeline construction cost. It is also shown that POTW
selection is different in scenario 1 and 2. In scenario 1, some selected POTWs (red dots) locate
at the area with high cost meaning that the selection of POTWs in scenario 1 disregards the
geographical properties and pipeline construction conditions, which is practically infeasible. In
scenario 2, the selected POTWs are all locate at low cost areas, while overlapped pipelines are
still not cost-efficient.

35
The optimization model is used for scenario 3 to further consider pipeline merging and cost
minimization. The result shows that the amount of pipelines is largely reduced due to pipeline
merging, and the selection of POTWs is also different from that in scenario 2. In scenario 3, a
POTW at high cost area on west is selected, while two power plants at lower cost area on north
are not selected. The reason is that the POTW on west supplies more reclaimed water than the
two POTWs on north, so selecting one POTW instead of two is more cost-efficient. In addition,
selecting POTW upstream is preferred because larger single pipeline is more cost-efficient than
smaller pipeline branches. This example demonstrates that the optimization model estimate the
least cost pipeline network in a comprehensive manner with multiple dimensions. The
optimization assessment provides power plants substantial cost estimation for applying reclaimed
water for their cooling systems.
36
Figure 9: POTWs selected and the pipeline routes for Roxboro power plant under 3 scenarios.See above descriptions for the different criteria of selecting POTWs in three scenarios.
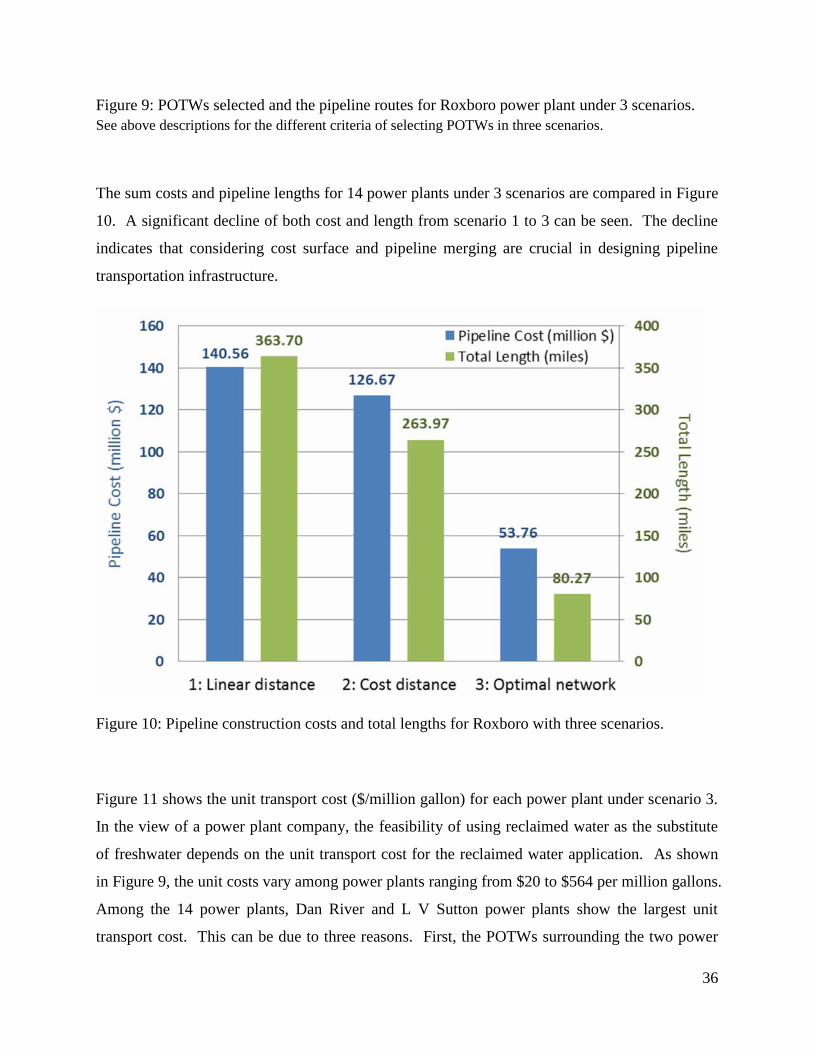
The sum costs and pipeline lengths for 14 power plants under 3 scenarios are compared in Figure
10. A significant decline of both cost and length from scenario 1 to 3 can be seen. The decline
indicates that considering cost surface and pipeline merging are crucial in designing pipeline
transportation infrastructure.
Figure 10: Pipeline construction costs and total lengths for Roxboro with three scenarios.
Figure 11 shows the unit transport cost ($/million gallon) for each power plant under scenario 3.
In the view of a power plant company, the feasibility of using reclaimed water as the substitute
of freshwater depends on the unit transport cost for the reclaimed water application. As shown
in Figure 9, the unit costs vary among power plants ranging from $20 to $564 per million gallons.
Among the 14 power plants, Dan River and L V Sutton power plants show the largest unit
transport cost. This can be due to three reasons. First, the POTWs surrounding the two power

37
plants supply smaller amount of reclaimed water, so more and longer pipelines are required for
the two plants to reach out farther POTWs to fulfill their cooling water demands. Second, the
two power plants are located at the regions with higher costs that the pipelines have to bypass
some areas, resulting in higher transport costs. In addition, these two power plants require small
amounts of cooling water, which means that the pipelines for these two plants are smaller and
less cost-efficient. The difference of unit transport cost among the power plants shows the
properties of power plants that are unfavorable for using reclaimed water as cooling water for
power plants.
Figure 11: Unit transport cost for each power plant for scenario 3.See descriptions above for the implications of unit transport cost for each power plant. See aboveexplanation for the high transport cost for Dan River and L V Sutton power plants.

38
5 Conclusions and Recommendations
The use of reclaimed water for coal-fired power plant cooling was evaluated in this study. The
federal and North Carolina state regulations and guidelines regarding the process of reuse were
reviewed, as well as the studies on risk assessments related to potential hazards in the reclaimed
water. L. pneumophilahas been shown as a potential pathogen to cause LD in both potable and
reclaimed water. Cooling towers that generate aerosols are the main source for Legionella that
can be exposed to humans through aerosols inhalation; and, Legionella can spread and remain
pathogenic for a long distance from the source plant. Adequate risk management and monitoring
of Legionella levels at worksites have been well established by OSHA in the US to can reduce
potential risk of LD.
In addition to water quality assessment, reclaimed water availability is of more concern. It is
crucial to consider water pipeline transportation feasibility when assessing water availability for
cooling of power plants. Using the spatial-economic optimization model considering pipeline
construction condition and pipeline merging potential, I was able to identify the optimal pipeline
network infrastructure for reclaimed water transportation with minimal pipeline construction cost.
The unit transport cost analysis for each power plant provides the necessary information to
evaluate the feasibility of applying reclaimed water for cooling in each power plant.
If regulations from source wastewater treatment and reclaimed water reuse standard to cooling
tower discharge and air emissions are followed, the water quality concern of reclaimed water
reuse for cooling will be minimized. Given the variety of water quality from different
wastewater sources, some potential problems may require further assessment and investigation to
ensure the safety of specific reclaimed water for reuse. Conclusions of this master’s project are:
Legionella infection is a health problem in reclaimed water systems globally. Although
some states have established standards for Legionella monitoring and treatment in
cooling towers, there is no specific regulation for detecting and monitoring Legionella in
cooling towers using reclaimed water under both federal and NC state regulations.
Although there is currently no Legionella outbreak reported in NC, periodical monitoring
is recommended given the high capability of Legionella bacteria to transmit and cause
diseases.

39
Reclaimed water reuse in industrial cooling systems can lead to health effects through
evaporation and drift emissions. In addition, concentrations of other pathogens and
chlorine byproducts in air drifts from the cooling systems must be carefully monitored.
Reclaimed water availability and water transport cost for power plants are crucial for evaluating
the feasibility of applying reclaimed water as makeup water for cooling towers. Several
perspectives are worthy of consideration for future investigations and real-world practices.
When assessing reclaimed water availability for power plants, the construction of
transportation pipelines and the potential of pipeline merging should be considered to
minimize the construction costs and design the optimal pipeline transportation network
infrastructure.
In North Carolina, tertiary treatment is required for reclaimed water reuse. While this is
beneficial for controlling water quality and reducing potential health and environmental
impacts from reuse, water availability will also decrease under the requirement and thus
the cost of reuse will increase. A cost-benefit analysis can be used to evaluate the overall
cost for tertiary treatment requirements and the costs of secondary treatment with specific
additional treatment for specific reuse purposes. Further investigation should focus on
prioritizing reclaimed water with higher quality for more vulnerable purposes.
The establishment of reclaimed water pipeline networks for the power plants provides
stable supply-demand relationships between POTWs and power plants. Because
reclaimed water quality varies with wastewater sources, the stable reclaimed water supply
provides consistent water quality for certain power plants and thus can be beneficial for
water quality control and risk management in specific conditions.
A large number of water transportation projects in the U.S. are currently using PVC pipes.
PVC pipes have a number of useful properties including resistance to corrosion and
chemicals, light weight, flexibility, and low price. However, the material is non-
biodegradable and can pose adverse environmental impacts. The addition of phthalate
also poses health problems to human throughout the life cycle of the pipes. Therefore,
stainless steel pipes may be a better choice when deploying a large scale of pipeline
network construction.

40
References1. Bolten, J.G., Estimating the Chronic Health Risk from Coal-Fired Power-Plant Toxic Emissions.
Journal of Hazardous Materials, 1985. 10(2-3): p. 351-387.
2. Joan F. K., N.L.B., Susan S. H., Kristin S. L., John K. L., and Molly A. M., Estimated Use ofWater in the United States in 2005. U S Geological Survey circular2009, Reston, Va.: U.S.Geological Survey. iv, 52 p.
3. Roy, S.B., et al., Evaluation of the sustainability of water withdrawals in the United States, 1995to 2025. Journal of the American Water Resources Association, 2005. 41(5): p. 1091-1108.
4. Radisav D. V., D.A.D., Reuse of Treated Internal or External Wastewaters in the CoolingSystems of Coal-Based Thermoelectric Power Plants, 2009, Department of Civil andEnvironmental Engineering, University of Pittsburgh: Pittsburgh, PA.
5. USEPA, Clean Watersheds Needs Survey – CWNS 2008 Report to Congress, 2008, U.S.Environmental Protection Agency Research Triangle Park, NC,.
6. Green, D., Managing Water: Avoiding Crisis in California2007, Berkeley and Los Angeles, CA:University of California Press.
7. Treatments, T.W. Waste Water Treatment Process. 2011 [cited 2012 March 5]; Available from:http://watertreatmentprocess.net/waste-water-treatment-process/waste-water-treatment-process/.
8. Energy, U.S.D.o., Internet-Based, GIS Catalog of Non-Traditional Sources of Cooling Water forUse at America’s Coal-Fired Power Plants, 2009, National Energy Technology Laboratory.
9. Herzog, H., Li, W., Hongliang, Z., Diao, M., Singleton, G., & Bohm, M., West Coast RegionalCarbon Sequestration Partnership: Source - Sink Characterization and Geographic InformationSystem - Based Matching., 2007.
10. USEPA, Guidelines for Water Reuse, 2004, U.S. Agency for International Development:Washington, DC.
11. Morris, R.D., et al., Chlorination, Chlorination by-Products, and Cancer - a Metaanalysis.American Journal of Public Health, 1992. 82(7): p. 955-963.
12. Keller, D.W., et al., Community outbreak of legionnaires' disease: An investigation confirmingthe potential for cooling towers to transmit Legionella species. Clinical Infectious Diseases, 1996.22(2): p. 257-261.
13. Mouchtouri, V.A., et al., Legionella species colonization in cooling towers: risk factors andassessment of control measures. Am J Infect Control, 2010. 38(1): p. 50-5.
14. USEPA, Guidelines for water reuse, Washington, DC: U.S. Environmental Protection Agency :U.S. Agency for International Development. v.
15. USEPA, Introduction to the national pretreatment program, 2011, U.S. Environmental ProtectionAgency, Office of Wastewater Management: Washington DC.
16. USEPA. Thermal (Temperature) Variances to North Carolina Water Quality Standards. 2006[cited 2012 February 10]; Available from:http://water.epa.gov/scitech/swguidance/standards/upload/2006_09_26_standards_wqslibrary_nc_nc_4_denr-thermal.pdf.
17. Toze, S., Reuse of effluent water - benefits and risks. Agricultural Water Management, 2006.80(1-3): p. 147-159.

41
18. Atlas, R.M., Legionella: from environmental habitats to disease pathology, detection and control.Environ Microbiol, 1999. 1(4): p. 283-93.
19. EPA, Legionella: Human Health Criteria Document, 1999, United States EnvironmentalProtection Agency, Office of Water: Washington, DC.
20. McDade, J.E., et al., Legionnaires' disease: isolation of a bacterium and demonstration of its rolein other respiratory disease. N Engl J Med, 1977. 297(22): p. 1197-203.
21. Brown, C.M., et al., A community outbreak of Legionnaires' disease linked to hospital coolingtowers: an epidemiological method to calculate dose of exposure. Int J Epidemiol, 1999. 28(2): p.353-9.
22. Nguyen, T.M., et al., A community-wide outbreak of legionnaires disease linked to industrialcooling towers--how far can contaminated aerosols spread? Journal of Infectious Diseases, 2006.193(1): p. 102-11.
23. Saint, C.P., A colony based confirmation assay for Legionella and Legionella pneumophilaemploying the EnviroAmp (TM) Legionella system and seroagglutination. Lett Appl Microbiol,1998. 26(5): p. 377-381.
24. Kuchta, J.M., et al., Susceptibility of Legionella pneumophila to chlorine in tap water. ApplEnviron Microbiol, 1983. 46(5): p. 1134-9.
25. Palmer, C.J., et al., Detection of Legionella species in sewage and ocean water by polymerasechain reaction, direct fluorescent-antibody, and plate culture methods. Appl Environ Microbiol,1993. 59(11): p. 3618-24.
26. Palmer, C.J., et al., Detection of Legionella species in reclaimed water and air with theEnviroAmp Legionella PCR kit and direct fluorescent antibody staining. Appl Environ Microbiol,1995. 61(2): p. 407-12.
27. Jjemba, P.K., et al., Regrowth of potential opportunistic pathogens and algae in reclaimed-waterdistribution systems. Appl Environ Microbiol, 2010. 76(13): p. 4169-78.
28. Fields, B.S., The molecular ecology of legionellae. Trends in Microbiology, 1996. 4(7): p. 286-290.
29. Andersen, P., Pathogenesis of lower respiratory tract infections due to Chlamydia, Mycoplasma,Legionella and viruses. Thorax, 1998. 53(4): p. 302-307.
30. Reingold, A.L., Role of Legionellae in Acute Infections of the Lower Respiratory-Tract. Reviewsof Infectious Diseases, 1988. 10(5): p. 1018-1028.
31. Jaresova, M., et al., Legionella pneumophila airway colonisation in patients admitted to hospital.Indoor and Built Environment, 2003. 12(1-2): p. 25-29.
32. Berk, S.G., et al., Production of respirable vesicles containing live Legionella pneumophila cellsby two Acanthamoeba spp. Appl Environ Microbiol, 1998. 64(1): p. 279-286.
33. Woo, A.H., A. Goetz, and V.L. Yu, Transmission of Legionella by Respiratory Equipment andAerosol Generating Devices. Chest, 1992. 102(5): p. 1586-1590.
34. Marston, B.J., H.B. Lipman, and R.F. Breiman, Surveillance for Legionnaires-Disease - Risk-Factors for Morbidity and Mortality. Archives of Internal Medicine, 1994. 154(21): p. 2417-2422.
35. Johnson, J.T., et al., Nosocomial Legionellosis in Surgical Patients with Head-and-Neck Cancer -Implications for Epidemiological Reservoir and Mode of Transmission. Lancet, 1985. 2(8450): p.298-300.
42
36. Occupational Safety & Health Administration, U.S.D.o.L. eTool: Legionnaires' Disease. [cited2012 March]; Available from: http://www.osha.gov/dts/osta/otm/legionnaires/index.html.
37. Prasodjo D., P.L., OptimaCCS Carbon Capture and Storage Infrastructure Optimization: TexasCase Study, 2011, Joint report of the Nicholas Institute for Environmental Policy Solutions andNicholas School of the Environment, Duke University.
38. University, T.A.M., GAMS Distribution 23.2, 2009: College Station, TX.
39. ESRI, ArcGIS Desktop 9.3.1, E.S.R. Institute, Editor 2009: Redlands, CA.
40. ESRI. ArcGIS Desktop Help 9.3. 2009.
41. Chandel, M.K., Pratson, L. F., and Williams, E, Potential economies of scale in CO2 transportthrough use of a trunk pipeline. Energy Conversion and Management, 2010. 51(12): p. 10.
42. ToolBox, T.E. Steel Pipes - Maximum Water Flow Capacities. [cited 2012 Feburary 5];Available from: http://www.engineeringtoolbox.com/steel-pipes-flow-capacities-d_640.html.
43. Prasodjo, D., CO2 Steel pipe unit cost for pipelines with different sizes in OptimaCCS, 2012.
44. NETL, Estimating Freshwater Needs to Meet Future Thermoelectric Generation Requirements,2008, National Energy Technology Laboratory.
45. USDOE, NETL's 2007 Coal Power Plant DataBase, 2007, The National Energy TechnologyLaboratory, U.S. Department of Energy.
46. Macknick, J., Newmark, R., Heath, G., and Hallett KC., A Review of Operational WaterConsumption and Withdrawal Factors for Electricity Generating Technologies, 2011, NationalRenewable Energy Laboratory.