Embed Size (px)
Citation preview
EVALUATION OF ROAD SAFETY LEVEL OF FEDERAL ROUTE 3 (F3) AND STATE
ROUTE C17 (C17): A CASE STUDY OF KUANTAN MAIN ENTRANCE ROAD FROM PEKAN
SANGEETHA RAMASAMY (AA07035)
A thesis submitted in fulfillment of the requirement for the award of the degree of
Bachelor of Civil Engineering
Faculty of Civil Engineering & Earth Resources
University Malaysia Pahang
NOVEMBER 2010
11
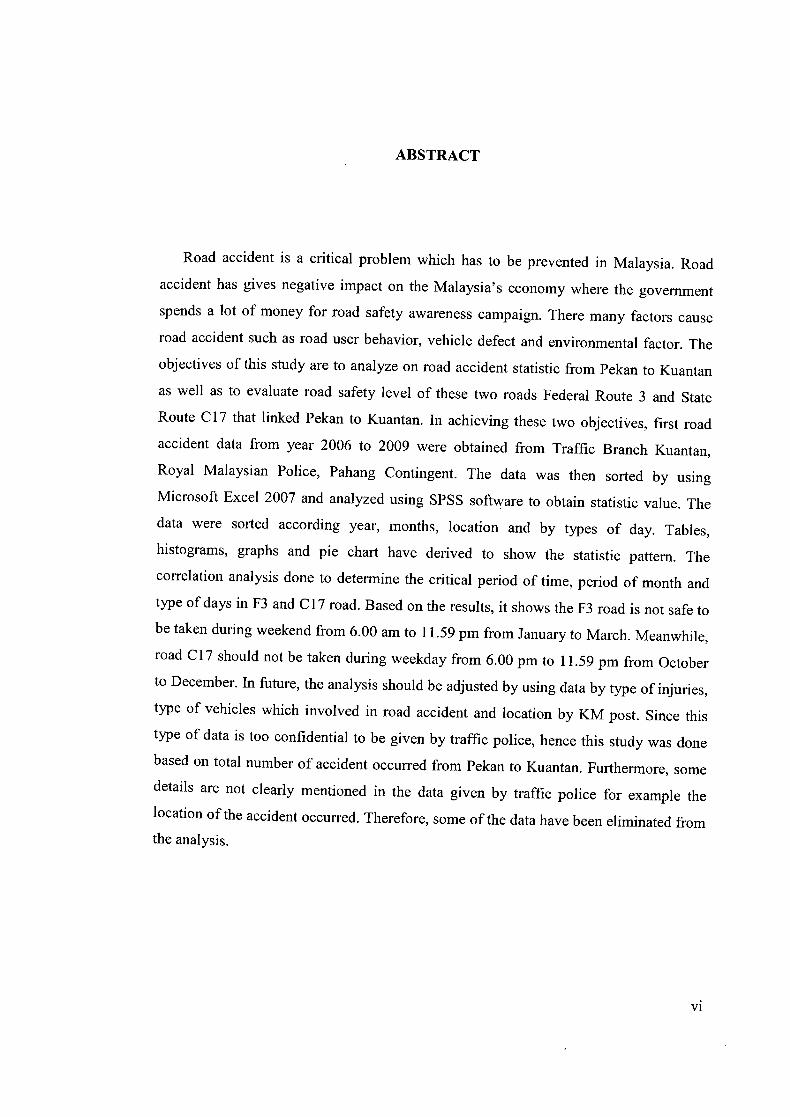
ABSTRACT
Road accident is a critical problem which has to be prevented in Malaysia. Road
accident has gives negative impact on the Malaysia's economy where the government
spends a lot of money for road safety awareness campaign. There many factors cause
road accident such as road user behavior, vehicle defect and environmental factor. The
objectives of this study are to analyze on road accident statistic from Pekan to Kuantan
as well as to evaluate road safety level of these two roads Federal Route 3 and State
Route C17 that linked Pekan to Kuantan. In achieving these two objectives, first road
accident data from year 2006 to 2009 were obtained from Traffic Branch Kuantan,
Royal Malaysian Police, Pahang Contingent. The data was then sorted by using
Microsoft Excel 2007 and analyzed using SPSS software to obtain statistic value. The
data were sorted according year, months, location and by types of day. Tables,
histograms, graphs and pie chart have derived to show the statistic pattern. The
correlation analysis done to determine the critical period of time, period of month and
type of days in F3 and C 17 road. Based on the results, it shows the F3 road is not safe to
be taken during weekend from 6.00 am to 11.59 pm from January to March. Meanwhile,
road C17 should not be taken during weekday from 6.00 pm to 11.59 pm from October
to December. In future, the analysis should be adjusted by using data by type of injuries,
type of vehicles which involved in road accident and location by KM post. Since this
type of data is too confidential to be given by traffic police, hence this study was done
based on total number of accident occurred from Pekan to Kuantan. Furthermore, some
details are not clearly mentioned in the data given by traffic police for example the
location of the accident occurred. Therefore, some of the data have been eliminated from the analysis.
vi
ABSTRAK
Kemalangan jalan raya adalah masalah kritikal yang hams dibendung di
Malaysia. Kemalangan jalan telah memberi impak negatif pada ekonomi Malaysia di
mana kerajaan membelanjakan pendapatan negara untuk kempen kesedaran keselamatan
jalan. Terdapat beberapa faktor yang menyebabkan kemalangan jalan raya seperti sikap
pemandu, masalah kerosakan kenderaan dan faktor persekitaran. Kemalangan jalan raya
dapat dielakkan preancangan perjalanan yang baik sebelurn menuju destinasi yang
dikehendaki. Sebuah perjalanan yang gagal untuk dirancang maka ia adalah dirancang
untuk gagal. Objektif kajian mi adalah untuk menganalisis statistik kemalangan jalan
raya dari Pekan ke Kuantan serta membandingkan kemalangan jalan raya yang berlaku
diantara dua jalan iaitu laluan Federal 3 dan State Route C17 dan Pekan ke Kuantan
Dalam mencapai dua tujuan mi, data kemalangan jalan raya dari tahun 2006 hingga
2009 diperolehi dan Polis Trafik Cawangan Kuantan, Polis Diraja Malaysia,Kontinjensj
Pahang. Data tersebut kemudian diaturkan dengan menggunakan Microsoft Excel 2007
dan dianalisis menggunakan SPSS untuk mendapatkan nilai statistik. Data diaturkan
mengikut tahun, bulan, lokasi dan jenis han berlaku kemalangan. Jadual, histogram, graf
dan carta pai dihasilkan melalui analisis mi. Daripada basil kajian didapati jalan F3 tidak
selamat digunakan pada hari minggu dan pukul 6.00 pagi sampai 11.59 pagi dari bulan
Januari hingga Mac. Manakala jalan C17 tidak selamat digunakan pada han biasa dan
pukul 6.00 petang hingga 11.59 malam dari bulan Oktober hingga Disember Data
mengikut jenis kemalangan merupakan makiumat sulit daripada pihak polis. OIeh itu,
basil kajian mi hanya berdasarkanjumlah kemalangan jalan raya.Selain itu, terdapatjuga
maklumat kemalangan jalan raya yang tidak lengkap danipada data yang diperolehi.
OIeh itu, data-data tersebut disingkirkan daripada basil kajian.
vii
TABLE OF CONTENTS
CHAPTER TITLE
TITLE PAGE
DECLARATION
DEDICATION
ACKNOWLEDGEMENT
ABSTRACT
TABLE OF CONTENTS
LIST OF TABLES
LIST OF FIGURES
LIST OF APPENDICES
PAGE
Ii
II'
iv
V
Vi
Vi"
Xi
XII
xl"
INTRODUCTION
1.1 Introduction
1.2 Background of Problem
1.3 Objectives of Research
1.4 Scope of Research
1.5 Significance of Research
1.6 Problem Statement
2 LITERATURE REVIEW
2.1 Definition of Road Traffic Accident
2.2 Causes of Road Traffic Accident
2.3 Road Accident in Malaysia
2.4 Road Accident in Pahang
1
2
3
4
5
5
6
7
8
10
vii'
2.5 Road Traffic Safety 11 2.5.1 Road Traffic Safety Definition ii 2.5.2 Road Accident Safety Measure ii
2.6 Studies on the Background and Usage of Software 13 2.6.1 Microsoft Excel 2007 (Ms Excel 2007) 13
2.6.1.1 Results-oriented user interface 14
2.6.1.2 Easy sorting and filtering 14
2.6.1.3 Easy development of charts 15 2.6.2 Statistical Package for Social Sciences (SPSS) 15
2.7 Summary 16
3 METHODOLOGY
3.1 Introduction 17 3.2 Project Flow Chart 18 3.3 Literature Review 20 3.4 Data Collection 20 3.5 Method of Statistic Analysis Using MS Excel 2007 24 3.6 Method of Descriptive Analysis Using SPSS 30 3.7 Method of Statistic Comparison Analysis of Two Roads 33 3.8 Method of Correlation Analysis using SPSS 34 3.9 Method of Evaluate of Road Safety Level of
Two Road 38 3.10 Summary 40
4 RESULTS and ANALYSIS
4.1 Introduction 41 4.2 Road Traffic Accident Statistic from
Pekan to Kuantan 42
lx
4.3 Pattern of Road Accident Statistic by Roads 56
4.3.1 Road Accident Statistic of Federal Route 3 (F3) 56
4.3.1.1 Descriptive Analysis of Federal
Route 3 (F3) 62
4.3.2 Road Accident in State Route C17 64
4.3.2.1 Descriptive Analysis of State
Road C17 69 4.4 Comparison of Road Accident of F3 and C17 71
4.5 Correlation Analysis 75
4.5.1 Correlation Analysis of Federal Route 3 (F3) 75
4.5.2 Correlation Analysis of State Road C17 81
4.6 Evaluation of Road Safety Level of Two Roads 87
4.7 Summary 89
5 DISCUSSION and CONCLUSIONS
5.1 Discussion 90
5.2 Conclusion 91
REFERENCES 94-95 Appendix A: Road Accident Data Year 2006 96
Appendix B: Road Accident Data Year 2007 97 Appendix C: Road Accident Data Year 2008 98 Appendix D: Road Accident Data Year 2009 101
X
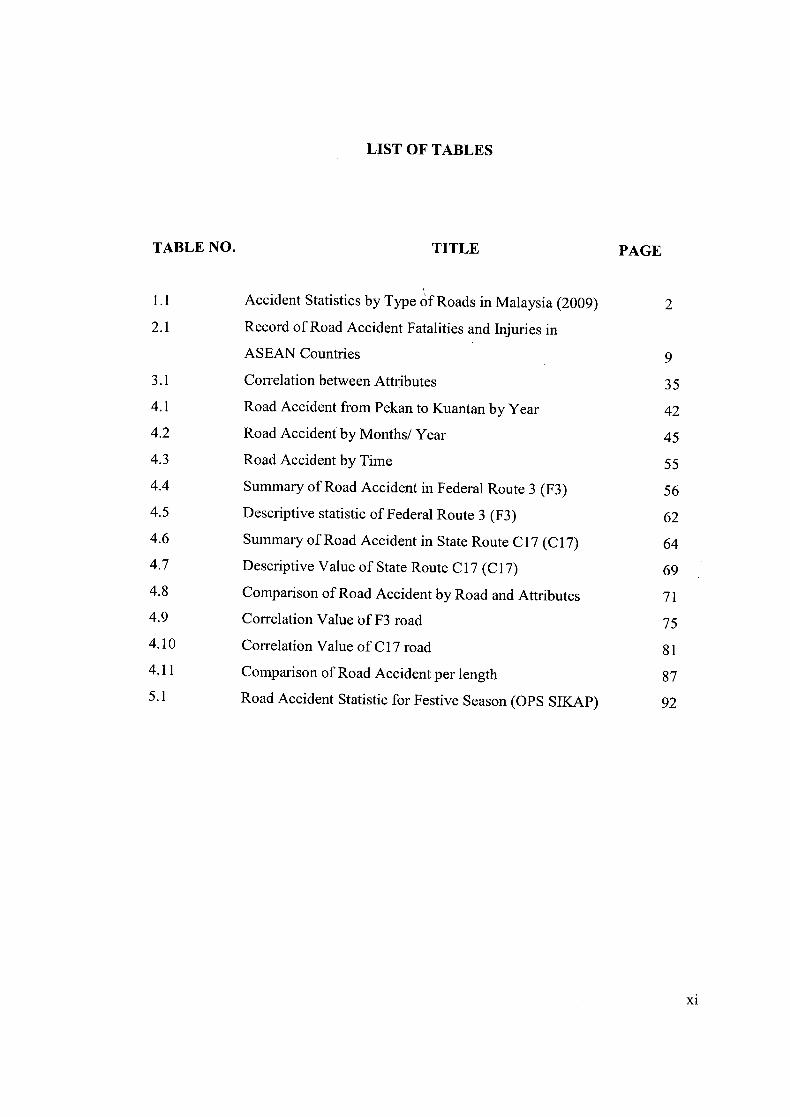
LIST OF TABLES
TABLE NO. TITLE
PAGE
1.1 Accident Statistics by Type of Roads in Malaysia (2009)
2.1 Record of Road Accident Fatalities and Injuries in
ASEAN Countries
3.1 Correlation between Attributes
4.1 Road Accident from Pekan to Kuantan by Year
4.2 Road Accident by Months! Year
4.3 Road Accident by Time
4.4 Summary of Road Accident in Federal Route 3 (F3)
4.5 Descriptive statistic of Federal Route 3 (F3)
4.6 Summary of Road Accident in State Route C17 (C 17)
4.7 Descriptive Value of State Route C 17 (C 17)
4.8 Comparison of Road Accident by Road and Attributes
4.9 Correlation Value of F3 road
4.10 Correlation Value of C 17 road
4.11 Comparison of Road Accident per length
5.1 Road Accident Statistic for Festive Season (OPS SIKAP)
2
9
35
42
45
55
56
62
64
69
71
75
81
87
92
xl
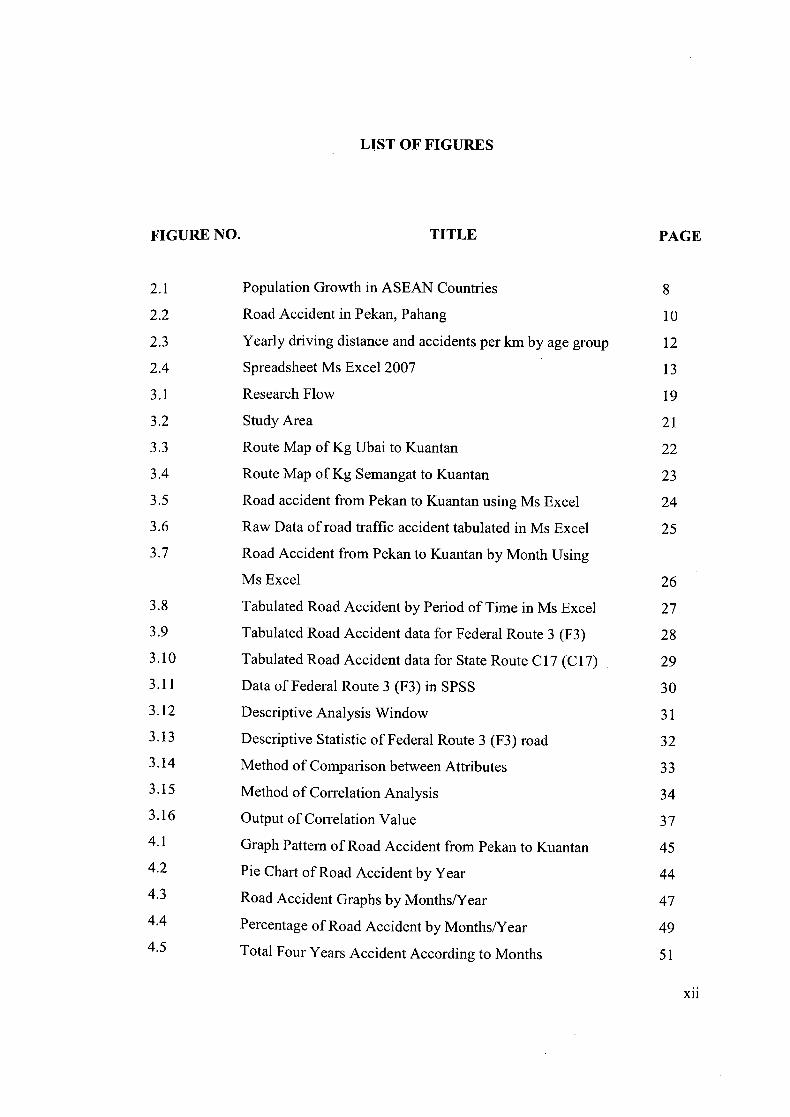
LIST OF FIGURES
FIGURE NO. TITLE PAGE
2.1 Population Growth in ASEAN Countries 8
2.2 Road Accident in Pekan, Pahang 10
2.3 Yearly driving distance and accidents per km by age group 12
2.4 Spreadsheet Ms Excel 2007 13
3.1 Research Flow 19
3.2 Study Area 21
3.3 Route Map of Kg Ubai to Kuantan 22
3.4 Route Map of Kg Semangat to Kuantan 23
3.5 Road accident from Pekan to Kuantan using Ms Excel 24
3.6 Raw Data of road traffic accident tabulated in Ms Excel 25
3.7 Road Accident from Pekan to Kuantan by Month Using
Ms Excel 26
3.8 Tabulated Road Accident by Period of Time in Ms Excel 27
3.9 Tabulated Road Accident data for Federal Route 3 (F3) 28
3.10 Tabulated Road Accident data for State Route C17 (C 17) 29
3.11 Data of Federal Route 3 (F3) in SPSS 30 3.12 Descriptive Analysis Window 31 3.13 Descriptive Statistic of Federal Route 3 (F3) road 32 3.14 Method of Comparison between Attributes 33 3.15 Method of Correlation Analysis 34 3.16 Output of Correlation Value 37 4.1 Graph Pattern of Road Accident from Pekan to Kuantan 45 4.2 Pie Chad of Road Accident by Year 44 4.3 Road Accident Graphs by Months/Year 47 4.4 Percentage of Road Accident by Months/Year 49 4.5 Total Four Years Accident According to Months 51
xli
4.6 Percentage of Road Accident for Total Four Years by
Months/Year
4.7 Histogram of Road Accident by Time
4.8 Pie Chart of Percentage of Road Accident by Period of Time
4.9 Road Accident in F3 According Attributes
4.10 Pie Chart of F3 Road Accident by Attributes
4.11 Road Accident in State Route Cl 7 (C 17) by Attributes
4.12 Pie Chart of C17 Road Accident by Attributes
4.13 Differences of Road Accident between Two Roads by Attributes
4.14 Percentage of road accident by road and attributes
4.15 Correlation Matrix of Federal Road 3 (173)
4.16 Correlation Matrix of State Route C 17 (C 17)
52
54
55
58
60
65
67
72
75
79
85
xiii
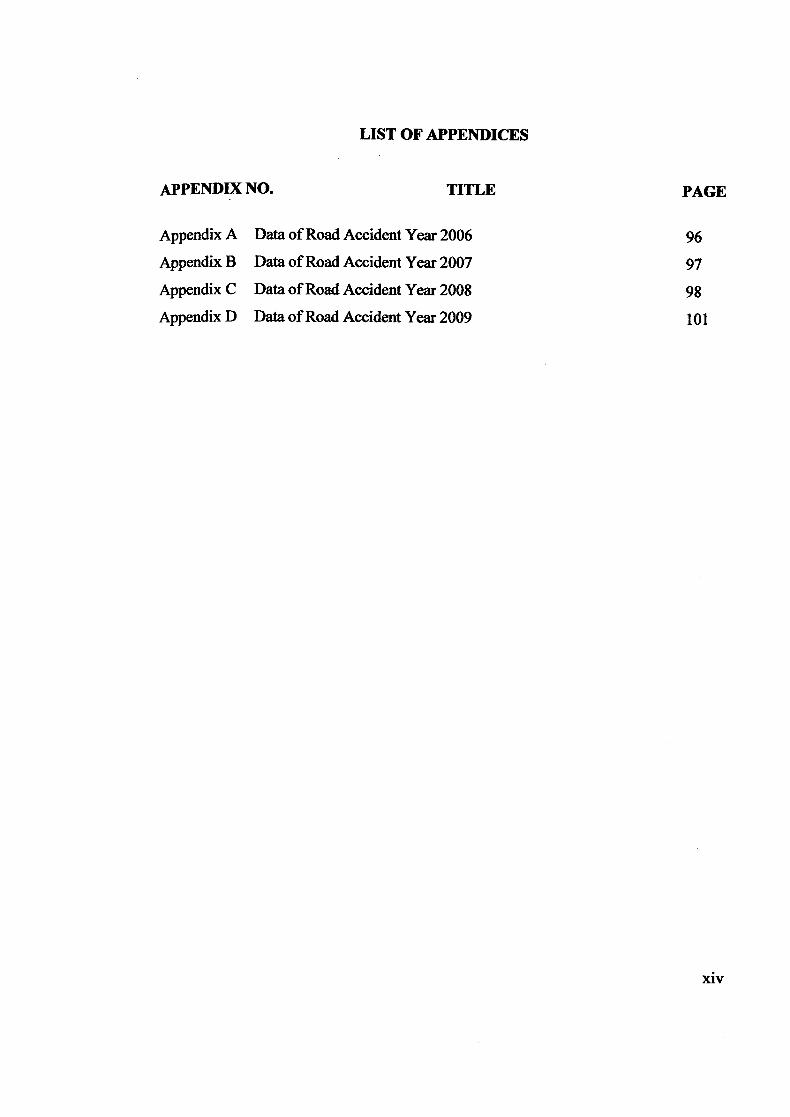
LIST OF APPENDICES
APPENDIX NO. TITLE PAGE
Appendix A Data of Road Accident Year 2006 96
Appendix B Data of Road Accident Year 2007 97
Appendix C Data of Road Accident Year 2008 98
Appendix D Data of Road Accident Year 2009 101
xiv
CHAPTER 1
INTRODUCTION
1.1 Introduction
In this modernized and fast moving world, road traffic accident fatalities and
injuries have become a global issue. The rapid urbanization and motorization has
resulted in worsening to atmosphere, traffic congestion and major road safety issues
(Yunan Zheng, 2004). As reported by World Health Organization (2004), road crashes
are the second leading cause of death globally. Road traffic accident also becomes a
severe problem in Malaysia. A research by Fajaruddin Mustakim and his team (2008)
updated that in the year 2006, 341,252 accidents were recorded and resulting in an
average 18 deaths from road accidents every single day.
1
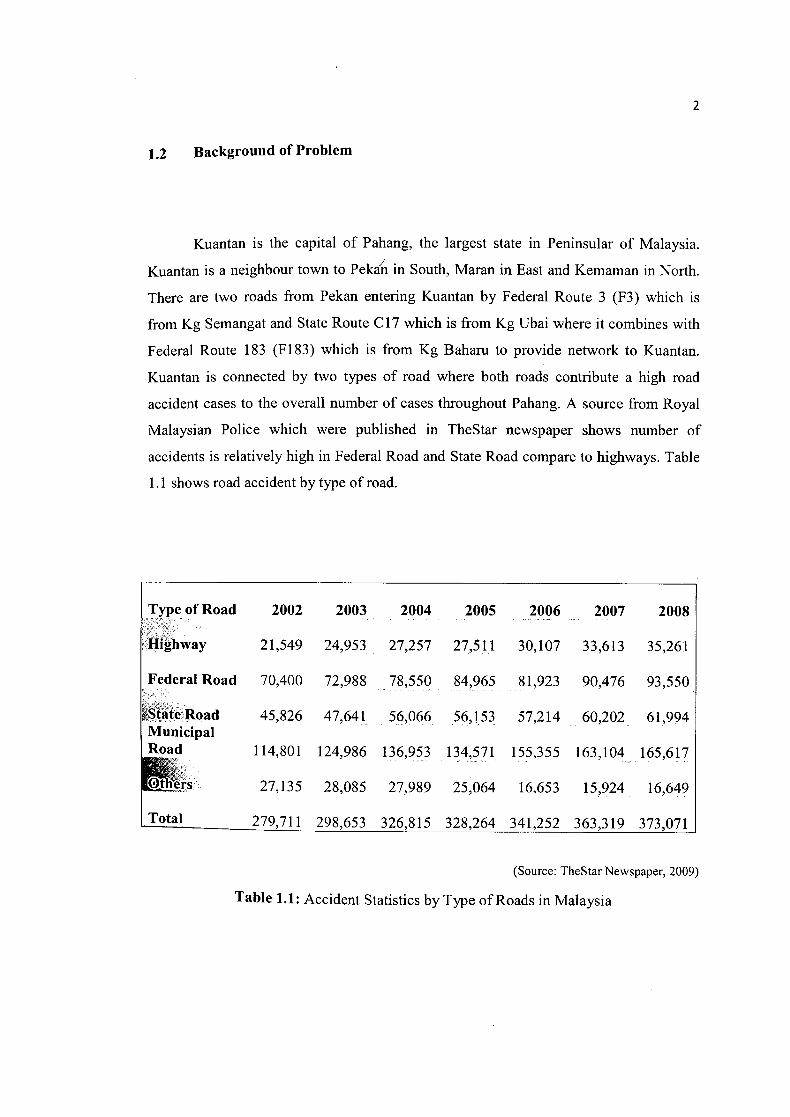
1.2 Background of Problem
Kuantan is the capital of Pahang, the largest state in Peninsular of Malaysia. 1 Kuantan is a neighbour town to Pekan in South, Maran in East and Kemaman in North.
There are two roads from Pekan entering Kuantan by Federal Route 3 (P3) which is
from Kg Semangat and State Route C17 which is from Kg Ubai where it combines with
Federal Route 183 (F183) which is from Kg Baharu to provide network to Kuantan.
Kuantan is connected by two types of road where both roads contribute a high road
accident cases to the overall number of cases throughout Pahang. A source from Royal
Malaysian Police which were published in TheStar newspaper shows number of
accidents is relatively high in Federal Road and State Road compare to highways. Table
1.1 shows road accident by type of road.
Type of Road 2002 2003 2004 2005 2006 2007 2008
Highway 21,549 24,953 27,257 27,511 30,107 33,613 35,261
Federal Road 70,400 72,988 78,550 84,965 81,923 90,476 93,550
State Road 45,826 47,641 56,066 56,153 57,214 60,202 61,994 Municipal Road 114,801 124,986 136,953 134,571 155,355 163,104 165,617
Others 27,135 28,085 27,989 25,064 16,653 15,924 16,649
Total 279,711 298,653 326,815 328,264 341,252 363,319 373,071
(Source: TheStar Newspaper, 2009)
Table 1.1: Accident Statistics by Type of Roads in Malaysia
3
Another study by Road Safety Department Malaysia in year 2006 stated the
number of road accident cases in Pahang was 13,242 while in year 2007, the number of
road accident cases was 13,982. The difference between year 2006 and 2007 was
reported as 740 accident cases in Pahang which was relatively high.
1.3 Objectives of Research
The main goals of this research are:
To analyze road traffic accident pattern of accident from Pekan entering Kuantan
based on road accident data from year 2006 to 2009.
ii. To evaluate road safety level between Federal Route 3 (F3) and State Road C17
that linked Pekan to Kuantan based on road traffic accident data from year 2006
to 2009.
4
1.4 Scopes of Research
The areas of the research are:
i. The road accidents data was collected within Pekan to Kuantan road which only
focusing on Federal Route 3 (FR3) and State Route C17 (C 17).
ii. The road accidents data was collected from Traffic Branch Kuantan, Royal
Malaysian Police, Pahang Contingent which covers from the year 2006 to 2009.
In conjunction to that, all analyses reported in this study were only applicable to
that particular period of year.
iii. This research focus on statistic analysis from Pekan to Kuantan and comparing
road accident between F3 road and C 17 road from Pekan to Kuantan. The State
Route C17 was linked with Federal Route 183 (F183) to Kuantan. Hence the
road accident falls on F183 was added to the C17 road accident data for the
statistic analysis.
iv. Statistical analyses done in this thesis were analyzed using Ms Excel 2007 and
SPSS Version 17.0 software only. Any results that may come out differently
when using different type of analysis software is not taken into consideration by
the researcher.
1.5 significance of Research
The important of this study is the results from the analysis can be implemented
as an indicator for reducing number of road accident in Malaysia by Malaysian
Government plan. This study also evaluate road safety level of the roads that have higher
risk for road accident cases to be happen based on the statistic analysis.
1.6 Problem Statement
The number of accident cases increases day by day in our country. Reducing road
traffic accidents is not an easy task. There are many factors that lead to road accident in
Malaysia. However to justify the factors of road accident is sometimes impossible. Road
accident also can occur if there is no proper planning on which road to travel in safe
condition. A plan by Malaysian Road Safety Council (2002), have targeted for the
reduction of the road accident death rate for the year 2010. Therefore, this study can be
indicators for Malaysian Government in road accident reduction plan by determining
highest number of accident cases based on location, types of day, period of month and
time. At the end of this study, it is hope that road safety level of both roads connecting
Pekan to Kuantan can be determined. Furthermore, this study can be used as a guideline
to all road users travelled from Pekan to Kuantan to choose the safest road.
CHAPTER 2
LITERATURE REVIEW
2.1 Definition of Road Traffic Accident
A road traffic accident usually involves one road vehicle colliding with, another
vehicle, another road user, or a stationary roadside object, and which may result in injury
or property damage, or possibly death. Although these events are rare in terms of the
number of vehicles and drivers on the road, addressing the contributing factors can
reduce the likelihood of collisions (R.J. AkalTo, 2009).
Based on a research by Azree, UTM (2005) he stated that an accurate time of an
accident occurred can never be predicted. Road traffic accident also is defined as any
vehicle accident occurring on a public highway. It includes collisions between vehicles
and animals, vehicles and pedestrians, or vehicles and fixed obstacles. Single vehicle
accidents, which involve a single vehicle, that means without other road user, are also
included (Safecarguide, 2004).
6
8
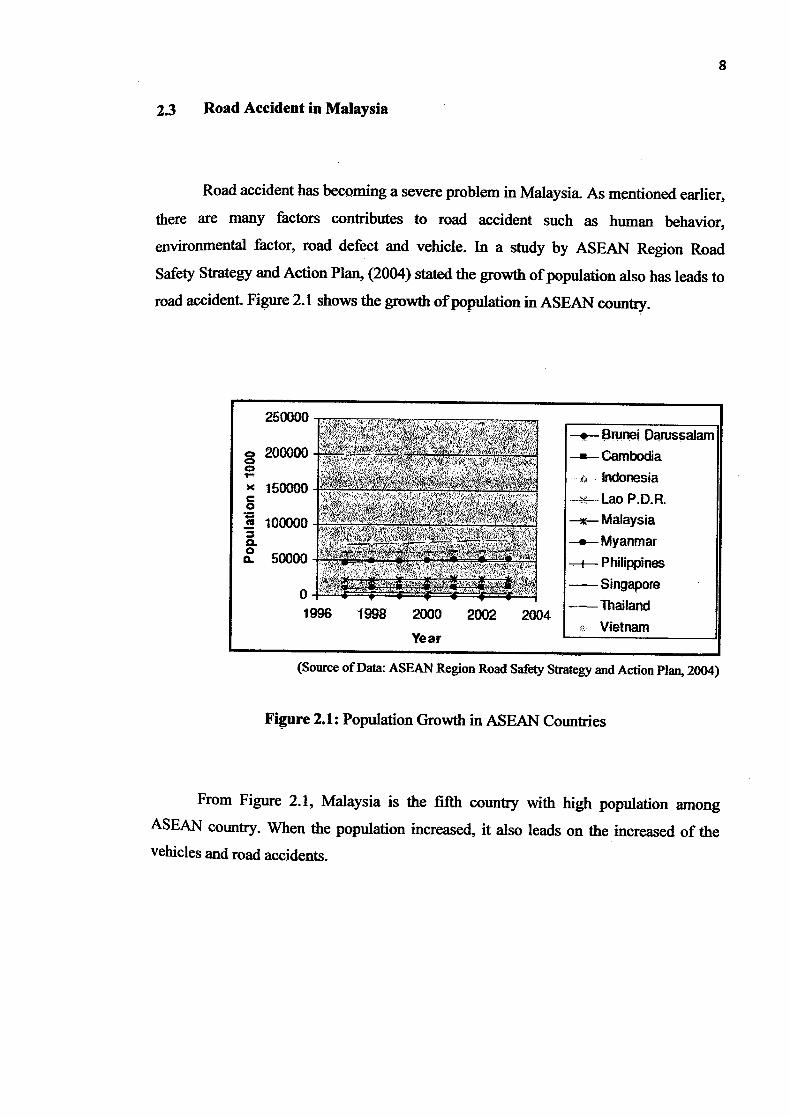
23 Road Accident in Malaysia
Road accident has becoming a severe problem in Malaysia. As mentioned earlier,
there are many factors contributes to road accident such as human behavior,
environmental factor, road defect and vehicle. In a study by ASEAN Region Road
Safety Strategy and Action Plan, (2004) stated the growth of population also has leads to
road accident. Figure 2.1 shows the growth of population in ASEAN country.
250000-.-- Brunei DarusaIarn
a 200000 - - - .----i —Cambodia ••- Indonesia x 150000 - . -----I
0 —---Lao P.D.R.
100000 - .. . --- Malaysia
—.---Myanmar -. - - 50000- - .. a - • , . -. - _i _ Philippines
--- --i— Singapore 0 -• - -
—' 1996 1998 2000 2002 2004—Thailand
Vietnam Year
(Source of Data: ASEAN Region Road Safety Strategy and Action Plan, 2004)
Figure 2.1: Population Growth in ASEAN Countries
From Figure 2. 1, Malaysia is the fifth country with high population among
ASEAN country. When the population increased, it also leads on the increased of the
vehicles and road accidents.
7
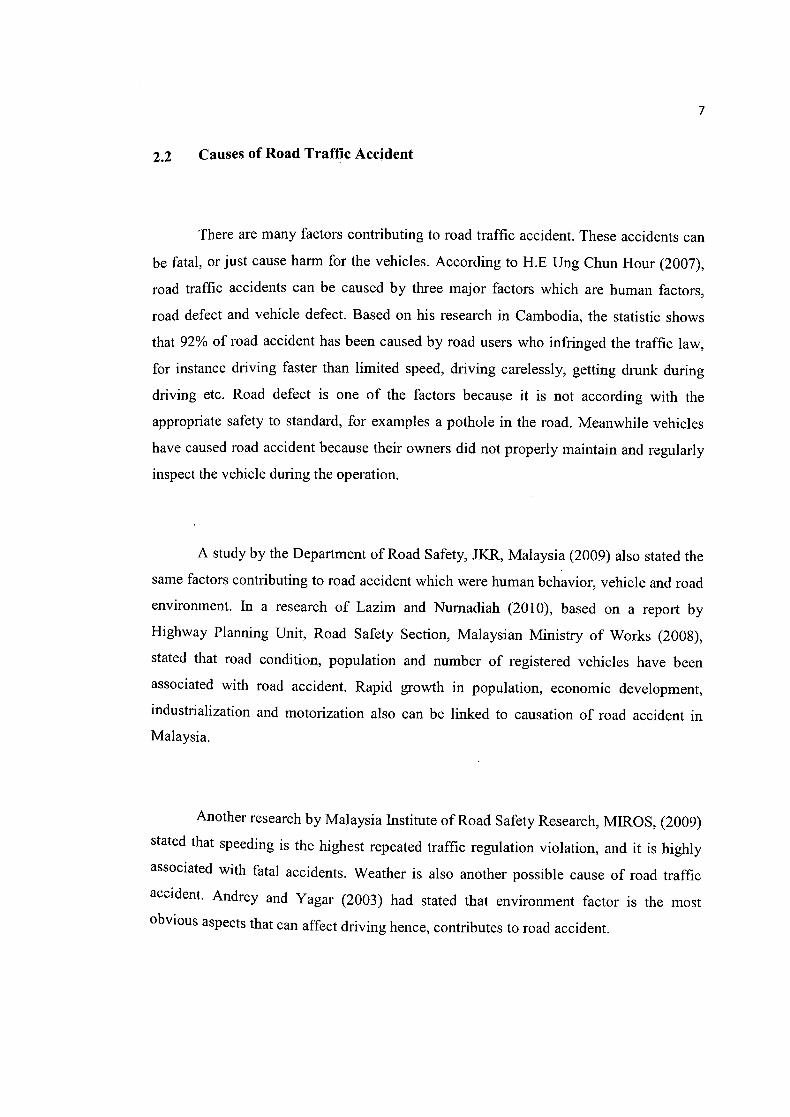
2.2 Causes of Road Traffic Accident
There are many factors contributing to road traffic accident. These accidents can
be fatal, or just cause harm for the vehicles. According to H.E Ung Chun Hour (2007),
road traffic accidents can be caused by three major factors which are human factors,
road defect and vehicle defect. Based on his research in Cambodia, the statistic shows
that 92% of road accident has been caused by road users who infringed the traffic law,
for instance driving faster than limited speed, driving carelessly, getting drunk during
driving etc. Road defect is one of the factors because it is not according with the
appropriate safety to standard, for examples a pothole in the road. Meanwhile vehicles
have caused road accident because their owners did not properly maintain and regularly
inspect the vehicle during the operation.
A study by the Department of Road Safety, JKR, Malaysia (2009) also stated the
same factors contributing to road accident which were human behavior, vehicle and road
environment. In a research of Lazim and Nurnadiah (2010), based on a report by
Highway Planning Unit, Road Safety Section, Malaysian Ministry of Works (2008),
stated that road condition, population and number of registered vehicles have been
associated with road accident. Rapid growth in population, economic development,
industrialization and motorization also can be linked to causation of road accident in
Malaysia.
Another research by Malaysia Institute of Road Safety Research, MIROS, (2009)
stated that speeding is the highest repeated traffic regulation violation, and it is highly
associated with fatal accidents. Weather is also another possible cause of road traffic
accident. Andrey and Yagar (2003) had stated that environment factor is the most
Obvious aspects that can affect driving hence, contributes to road accident.
9
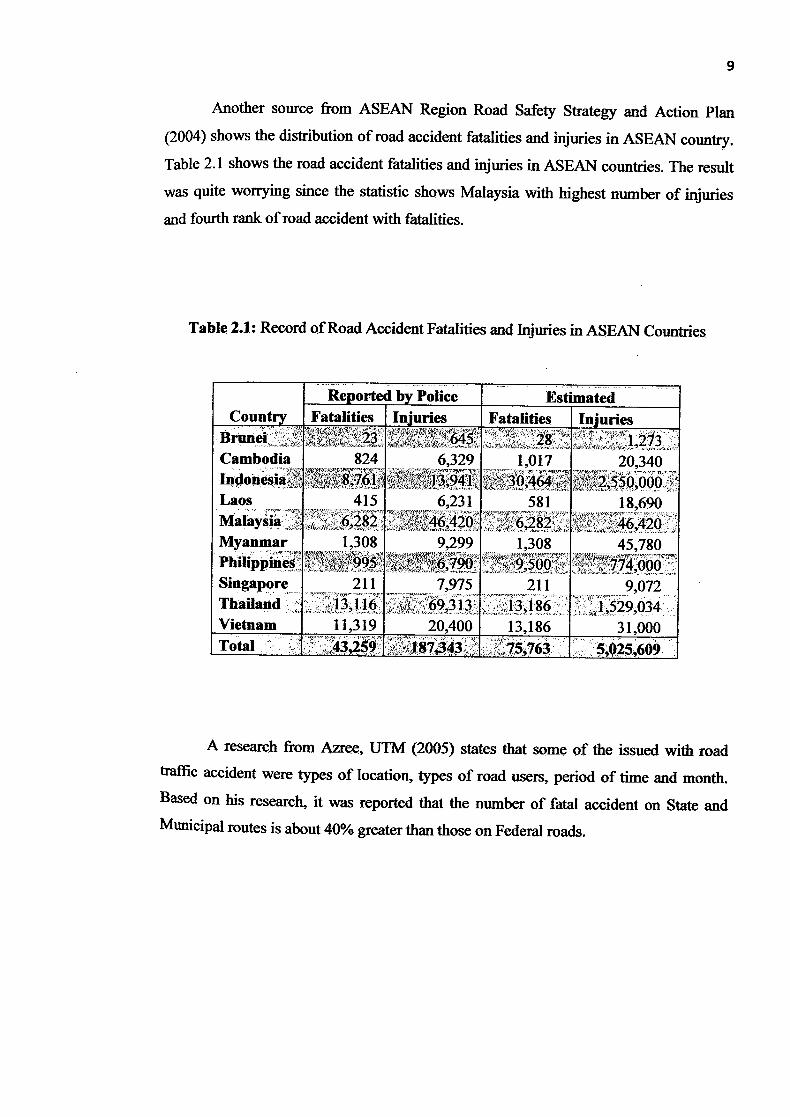
Another source from ASEAN Region Road Safety Strategy and Action Plan
(2004) shows the distribution of road accident fatalities and injuries in ASEAN country.
Table 2.1 shows the road accident fatalities and injuries in ASEAN countries. The result
was quite worrying since the statistic shows Malaysia with highest number of injuries
and fourth rank of road accident with fatalities.
Table 2.1: Record of Road Accident Fatalities and Injuries in ASEAN Countries
Reported by Police Estimated Country__ Fatalities - _Injuics -Fatalities_ Injuries
Brunci 23 28 1,273 Cambodia 824 6,329 1,017 20,340 Indonesia .76I 13,941 0,464 25550.000 Laos 415 6,231 581 Malaysia 6,282 4.420 6,282 46.420 Myanmar 1.308 9.299 1.308 45.780 Philippines Q95 ,790 9.500 774,000
Singapore 2 I I 7.975 211 9,072 Thailand 13016 69.3 13 13.186 1,529,034 Vietnam 11.319 20,400 135186 31,000 Total 43,259 187,343 75,763 5,0251609
A research from Azree, UTM (2005) states that some of the issued with road
traffic accident were types of location, types of road users, period of time and month.
Based on his research, it was reported that the number of fatal accident on State and
Municipal routes is about 40% greater than those on Federal roads.
10
2.4 Road Accident in Pahang
Pahang is the biggest state in Peninsular Malaysia. A case study by Ruslan
jnis and Noresah Mohd Shariff, UTM (2003) on population in Pahang states that in
year 1980, 1991 and 2000 are 768,801 units, 1,045,003 units and 1,231,176 units
respectively. It shows that growth of the population was increasing tremendously from
earlier 80's until year 2000. As mentioned earlier, the rapid growth in population has
caused an increase in the number of road traffic accident.
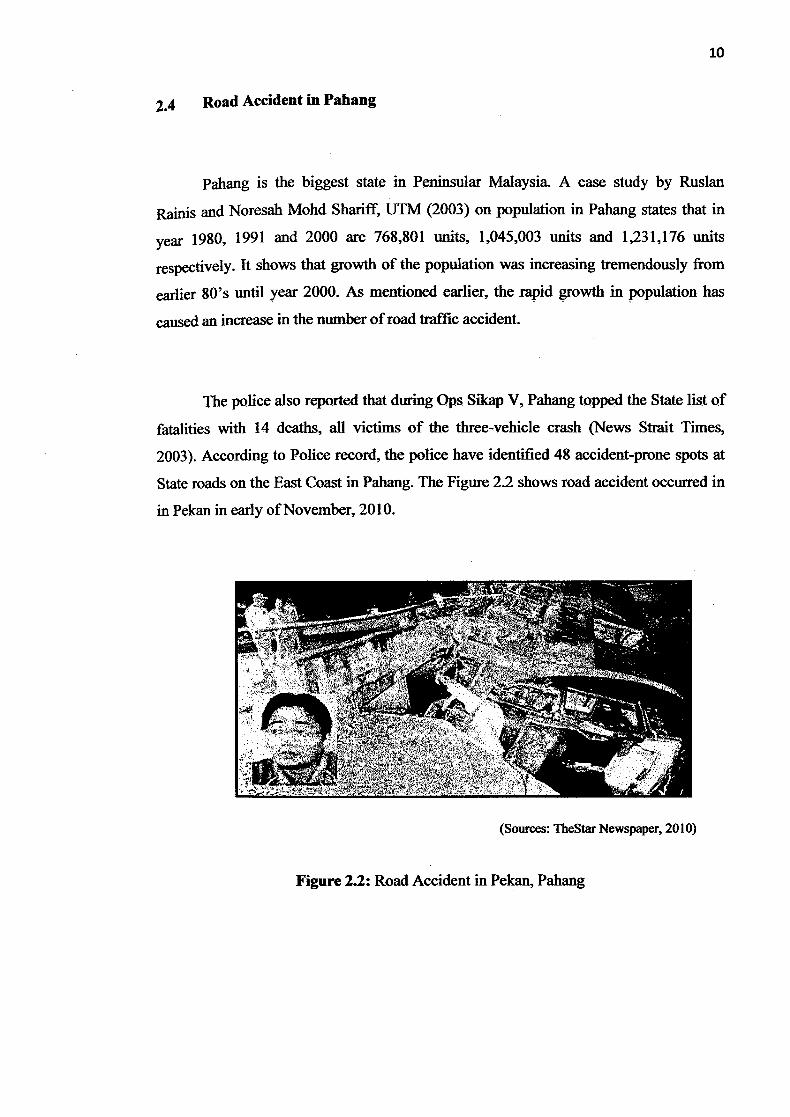
The police also reported that dining Ops Sikap V. Pahang topped the State list of
fatalities with 14 deaths, all victims of the three-vehicle crash (News Strait Times,
2003). According to Police record, the police have identified 48 accident-prone spots at
State roads on the East Coast in Pahang. The Figure 2.2 shows road accident occurred in
in Pekan in early of November, 2010.
-._• .l, - 1 -
FrVI
. .*
(Sources: TheStar Newspaper, 2010)
Figure 2.2: Road Accident in Pekan, Pahang
11
2.5 Road Traffic Safety
2.5.1 Road Traffic Safety Definition
Generally, road safety is important to reduce accident causes on road for proper
driving. According to "The Handbook of Road Safety Measure" by Rune Elvik, he
stated that road safety is defined and evaluated in terms of the recorded number of
accidents or the number of killed or injured road users.
2.5.2 Road Accident Safety Measure
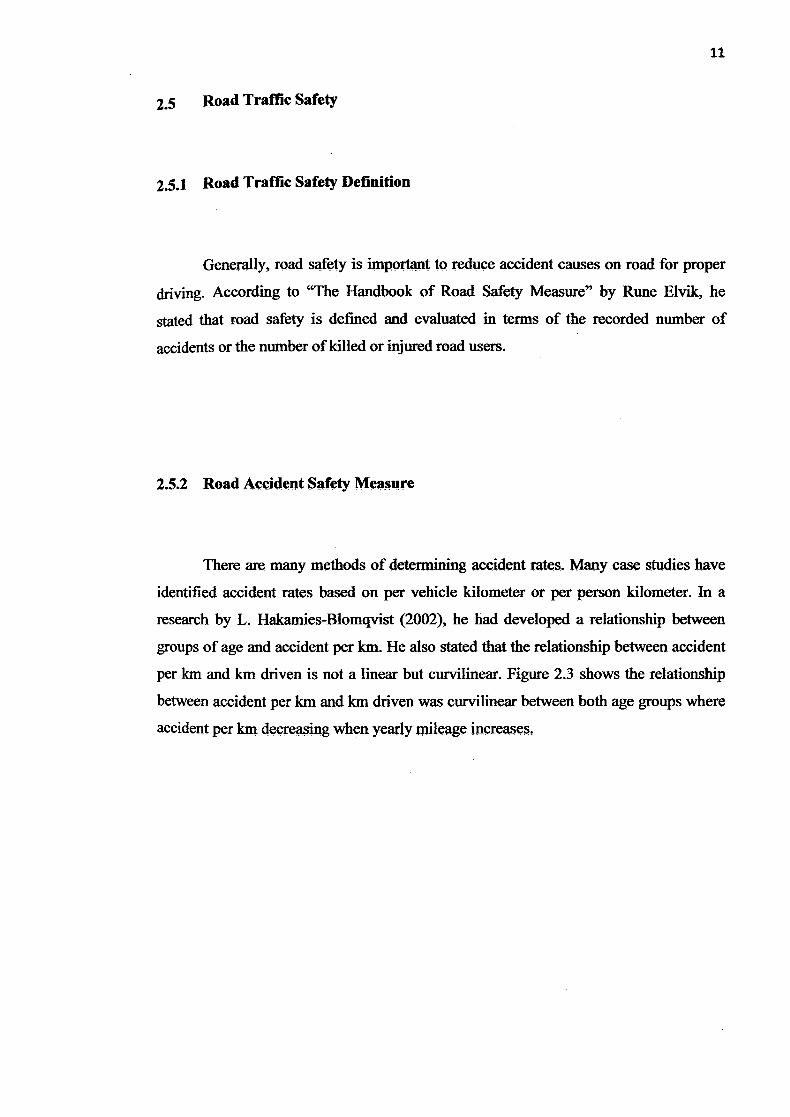
There are many methods of determining accident rates. Many case studies have
identified accident rates based on per vehicle kilometer or per person kilometer. In a
research by L. Hakamies-Blomqvist (2002), he had developed a relationship between
groups of age and accident per km. He also stated that the relationship between accident
per km and km driven is not a linear but curvilinear. Figure 2.3 shows the relationship
between accident per km and km driven was curvilinear between both age groups where
accident per km decreasing when yearly mileage increases.
12
80
70
60.
50
'
Old
Low Medium High Yearly driving distance
Figure 2.3: Yearly driving distance and accidents per km by age group
Figure 2.3 shows that there was existence of the formula of accident/year/km to
measure road safety. This formula can give the approximate number of accident per km.
Correlation analysis is used to determine the relationship between any variables.
In a study by Lazjm Abdullah and Nurnadiah Zamri (2010), they have used correlation
analysis to rank the factor that causes road accident. The three variables that they used to
rank the road accident were by population, vehicle registered and road length. Based on
their result, they found that registered vehicles achieved the highest positive correlation
at 0.989428. The second highest positive correlation is the variable of population with
0.987049 correlation measure. The third place in correlation intensity is the variable of
road length.
13
2.6 Statistic Software in Evaluating Road Safety Level
2.6.1 Microsoft Excel 2007 (Ms Excel 2007)
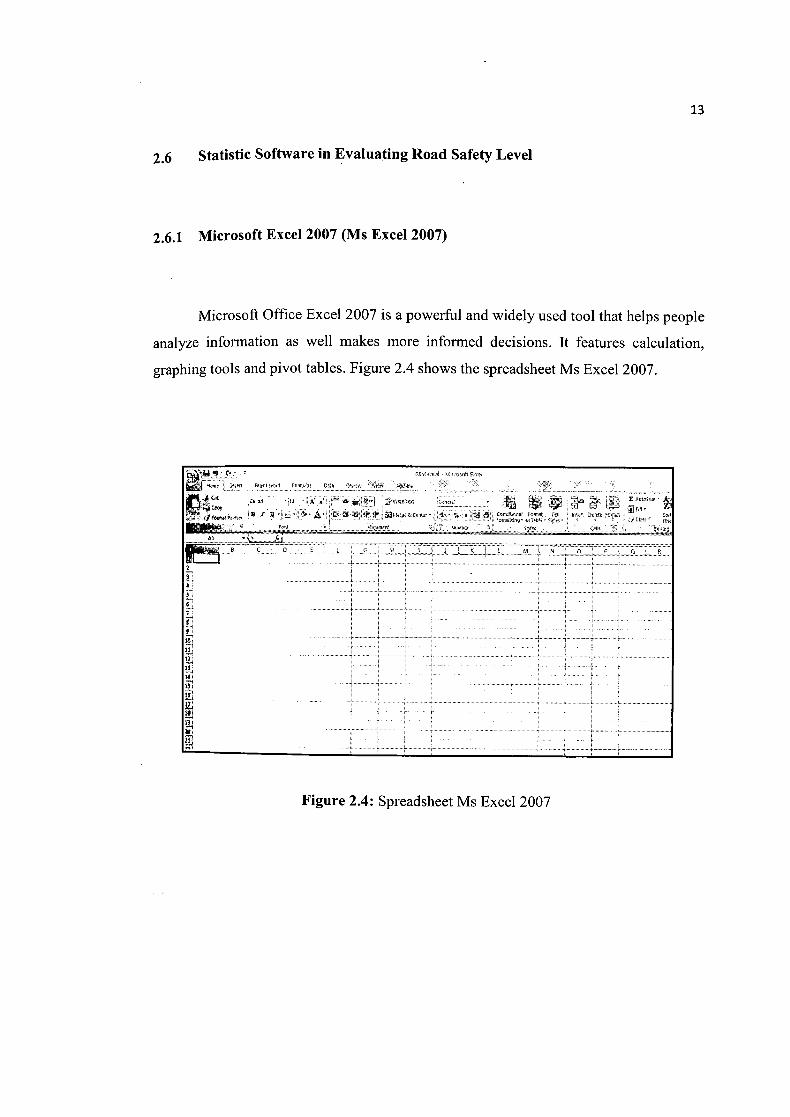
Microsoft Office Excel 2007 is a powerful and widely used tool that helps people
analyze information as well makes more informed decisions. It features calculation,
graphing tools and pivot tables. Figure 2.4 shows the spreadsheet Ms Excel 2007.
1 1B.l FIB B
C5 wi u A B B
' 8 1 - B r .31
Fl
B U U H
inn
F
w 11.
JAI V
. - -
Figure 2.4: Spreadsheet Ms Excel 2007
14
Microsoft Excel has the basic features of all spreadsheets, using a grid of cells
arranged in numbered rows and letter-named columns to Organize data manipulations
like arithmetic operations. It has a battery of supplied functions to answer statistical,
engineering and financial needs. In addition, it can display data as line graphs,
histograms and charts, and with a very limited three-dimensional graphical display. It
allows sectioning of data to view its dependencies on various factors from different
perspectives. A source from Window Microsoft states the following are some of the
advantages of using Microsoft Excel 2007:
2.6.1.1 Results-oriented user interface
2.6.1.2 Easy sorting and filtering
2.6.1.3 Easy development of charts
2.6.1.1 Results-oriented user interface
The new results-oriented user interface makes it easy to work in Microsoft Office
Excel. In Ms Excel 2007, commands and features in the toolbars are easier to find on
task-oriented tabs that contain logical groups of commands and features. The commands
and features can be easily accessed to arrange data and develop charts.
2.6.1.2 Easy sorting and filtering
In Office Excel 2007, the worksheet data can be arranged quickly to find the
answers that required by filtering and sorting. The filtering and sorting makes any data
to be adjusted easily without time consumption.