Embed Size (px)
Citation preview
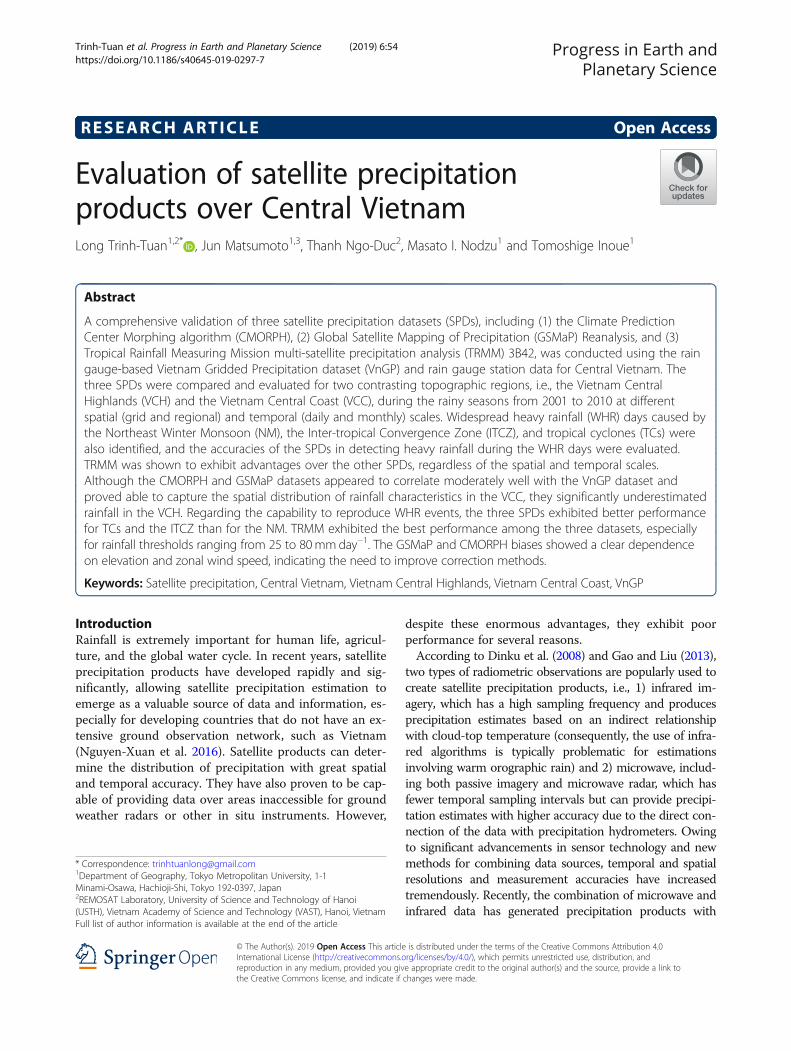
RESEARCH ARTICLE Open Access
Evaluation of satellite precipitationproducts over Central VietnamLong Trinh-Tuan1,2* , Jun Matsumoto1,3, Thanh Ngo-Duc2, Masato I. Nodzu1 and Tomoshige Inoue1
Abstract
A comprehensive validation of three satellite precipitation datasets (SPDs), including (1) the Climate PredictionCenter Morphing algorithm (CMORPH), (2) Global Satellite Mapping of Precipitation (GSMaP) Reanalysis, and (3)Tropical Rainfall Measuring Mission multi-satellite precipitation analysis (TRMM) 3B42, was conducted using the raingauge-based Vietnam Gridded Precipitation dataset (VnGP) and rain gauge station data for Central Vietnam. Thethree SPDs were compared and evaluated for two contrasting topographic regions, i.e., the Vietnam CentralHighlands (VCH) and the Vietnam Central Coast (VCC), during the rainy seasons from 2001 to 2010 at differentspatial (grid and regional) and temporal (daily and monthly) scales. Widespread heavy rainfall (WHR) days caused bythe Northeast Winter Monsoon (NM), the Inter-tropical Convergence Zone (ITCZ), and tropical cyclones (TCs) werealso identified, and the accuracies of the SPDs in detecting heavy rainfall during the WHR days were evaluated.TRMM was shown to exhibit advantages over the other SPDs, regardless of the spatial and temporal scales.Although the CMORPH and GSMaP datasets appeared to correlate moderately well with the VnGP dataset andproved able to capture the spatial distribution of rainfall characteristics in the VCC, they significantly underestimatedrainfall in the VCH. Regarding the capability to reproduce WHR events, the three SPDs exhibited better performancefor TCs and the ITCZ than for the NM. TRMM exhibited the best performance among the three datasets, especiallyfor rainfall thresholds ranging from 25 to 80mmday−1. The GSMaP and CMORPH biases showed a clear dependenceon elevation and zonal wind speed, indicating the need to improve correction methods.
Keywords: Satellite precipitation, Central Vietnam, Vietnam Central Highlands, Vietnam Central Coast, VnGP
IntroductionRainfall is extremely important for human life, agricul-ture, and the global water cycle. In recent years, satelliteprecipitation products have developed rapidly and sig-nificantly, allowing satellite precipitation estimation toemerge as a valuable source of data and information, es-pecially for developing countries that do not have an ex-tensive ground observation network, such as Vietnam(Nguyen-Xuan et al. 2016). Satellite products can deter-mine the distribution of precipitation with great spatialand temporal accuracy. They have also proven to be cap-able of providing data over areas inaccessible for groundweather radars or other in situ instruments. However,
despite these enormous advantages, they exhibit poorperformance for several reasons.According to Dinku et al. (2008) and Gao and Liu (2013),
two types of radiometric observations are popularly used tocreate satellite precipitation products, i.e., 1) infrared im-agery, which has a high sampling frequency and producesprecipitation estimates based on an indirect relationshipwith cloud-top temperature (consequently, the use of infra-red algorithms is typically problematic for estimationsinvolving warm orographic rain) and 2) microwave, includ-ing both passive imagery and microwave radar, which hasfewer temporal sampling intervals but can provide precipi-tation estimates with higher accuracy due to the direct con-nection of the data with precipitation hydrometers. Owingto significant advancements in sensor technology and newmethods for combining data sources, temporal and spatialresolutions and measurement accuracies have increasedtremendously. Recently, the combination of microwave andinfrared data has generated precipitation products with
© The Author(s). 2019 Open Access This article is distributed under the terms of the Creative Commons Attribution 4.0International License (http://creativecommons.org/licenses/by/4.0/), which permits unrestricted use, distribution, andreproduction in any medium, provided you give appropriate credit to the original author(s) and the source, provide a link tothe Creative Commons license, and indicate if changes were made.
* Correspondence: [email protected] of Geography, Tokyo Metropolitan University, 1-1Minami-Osawa, Hachioji-Shi, Tokyo 192-0397, Japan2REMOSAT Laboratory, University of Science and Technology of Hanoi(USTH), Vietnam Academy of Science and Technology (VAST), Hanoi, VietnamFull list of author information is available at the end of the article
Progress in Earth and Planetary Science
Trinh-Tuan et al. Progress in Earth and Planetary Science (2019) 6:54 https://doi.org/10.1186/s40645-019-0297-7
higher resolutions, allowing for the use of various emergingalgorithms for hydrological purposes (Tapiador et al. 2012).Many studies have been conducted to evaluate satellite
precipitation products for different areas around theworld. For example, Dinku et al. (2008, 2010) showedthat some satellite precipitation products performed rea-sonably well on 10 day to monthly time scales, with aresolution of 2.5° over the complex topography of EastAfrica. Thiemig et al. (2012) reported that the ClimatePrediction Center Morphing (CMORPH) algorithm hasthe ability to replicate rainfall, even with the sparseground data available in African river basins. Severalstudies reported that satellite observation does not suffi-ciently reproduce precipitation in high elevation areassuch as the Tibetan Plateau (Yin et al. 2008), subtropicalAndes (Hobouchian et al. 2017), river basins in South-east Asia (Ngo-Duc et al. 2013), and African coastalareas (Toté et al. 2015). In addition, the performance ofsatellite precipitation products has been reported to varyamong different regions. For instance, Vernimmen et al.(2012) and Jamandre and Narisma (2013) showed thatCMORPH presented lower verification scores than theTropical Rainfall Measuring Mission (TRMM) precipita-tion 3B42 Version 6 over Indonesia and the Philippines,respectively. In contrast, Shen et al. (2010) showed thatCMORPH performed better for spatial and temporalpatterns of precipitation over China compared toTRMM. These findings are also supported by Shige etal. (2013), who reported that the accuracy of the satelliteestimations varies for different regions or countries aswell as topographic profiles.Very few studies to date have evaluated satellite pre-
cipitation products for Vietnam. Of most relevance,Ngo-Duc et al. (2013) evaluated the performance of theGlobal Satellite Mapping of Precipitation data (GSMaP_MVK, Version 5) for North Central Vietnam and foundlarge biases over the study area. The GSMaP quality wassignificantly improved with the implementation of acorrection method using an artificial neural network. Inrecent decades, the National Hydro-MeteorologicalService of Vietnam (NHMS, recently was renamed toVietnam Meteorological Hydrological Administration—VMHA) has recorded frequent severe floods that weremainly caused by heavy rainfall events in CentralVietnam. Previous studies have shown that heavy rainfallevents in Central Vietnam are related to either tropicalcyclones (TCs) (Nguyen-Thi et al. 2012), the Inter-
tropical Convergence Zone (ITCZ), the NortheastMonsoon (NM), or sometimes a combination of two ormore factors interacting with topography (Yokoi andMatsumoto 2008; Chen et al. 2012a, 2012b).Accordingly, the aim of this study was to evaluate the
performance of three satellite precipitation datasets(SPDs) for the Vietnam Central Highlands (VCH) fromMay to August (MJJA), and the Vietnam Central Coast(VCC) from September to December (SOND), wherecomplex topography and contrasted rainfall seasonalityare found (Nguyen-Le et al. 2015; Ngo-Thanh et al.2017). Moreover, rivers in the VCC are fairly short andflow steeply, creating high probabilities of flooding dur-ing widespread heavy rainfall (WHR, defined in the nextsection) events. Therefore, WHRs caused by both TCsand ITCZ (hereafter termed TI) and by NM were specif-ically taken into consideration in this study to provideuseful information for hydrological applications, such aswater management and flood warning, in the VCC.
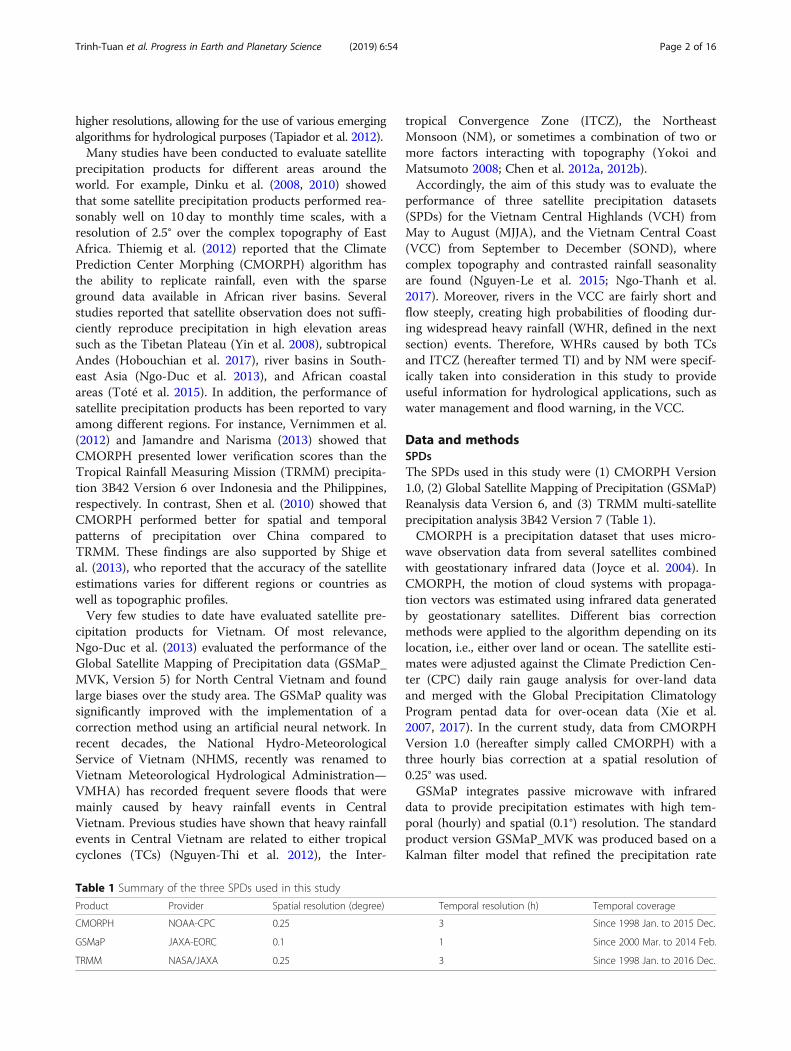
Data and methodsSPDsThe SPDs used in this study were (1) CMORPH Version1.0, (2) Global Satellite Mapping of Precipitation (GSMaP)Reanalysis data Version 6, and (3) TRMM multi-satelliteprecipitation analysis 3B42 Version 7 (Table 1).CMORPH is a precipitation dataset that uses micro-
wave observation data from several satellites combinedwith geostationary infrared data (Joyce et al. 2004). InCMORPH, the motion of cloud systems with propaga-tion vectors was estimated using infrared data generatedby geostationary satellites. Different bias correctionmethods were applied to the algorithm depending on itslocation, i.e., either over land or ocean. The satellite esti-mates were adjusted against the Climate Prediction Cen-ter (CPC) daily rain gauge analysis for over-land dataand merged with the Global Precipitation ClimatologyProgram pentad data for over-ocean data (Xie et al.2007, 2017). In the current study, data from CMORPHVersion 1.0 (hereafter simply called CMORPH) with athree hourly bias correction at a spatial resolution of0.25° was used.GSMaP integrates passive microwave with infrared
data to provide precipitation estimates with high tem-poral (hourly) and spatial (0.1°) resolution. The standardproduct version GSMaP_MVK was produced based on aKalman filter model that refined the precipitation rate
Table 1 Summary of the three SPDs used in this study
Product Provider Spatial resolution (degree) Temporal resolution (h) Temporal coverage
CMORPH NOAA-CPC 0.25 3 Since 1998 Jan. to 2015 Dec.
GSMaP JAXA-EORC 0.1 1 Since 2000 Mar. to 2014 Feb.
TRMM NASA/JAXA 0.25 3 Since 1998 Jan. to 2016 Dec.
Trinh-Tuan et al. Progress in Earth and Planetary Science (2019) 6:54 Page 2 of 16
propagated based on the atmospheric moving vector de-rived from two successive infrared images (Ushio et al.2009). The reanalysis version of the GSMaP (GSMaP_RNL) implemented the same GSMaP_MVK algorithmsand used the Japanese 55 year reanalysis six hourly data(Kobayashi et al. 2015) as ancillary data to ensure thecontinuity and homogeneity of the dataset for the pastperiod. The current study used GSMaP_RNL Version 6(hereafter simply called GSMaP), since some noticeableimprovements in the algorithms have been implementedsince Version 5, such as an orographic rainfall correctionmethod for warm rainfall in coastal areas (Yamamotoand Shige 2015).Additionally, with combined estimations from multiple
satellites based on both passive microwave and geosta-tionary infrared data, TRMM was computed for real-time monitoring and post real-time research (referred toas 3B42). In the TRMM 3B42 algorithm, the calibrationand combination of microwave precipitation estimateswere followed by the generation of infrared precipitationestimates based on the calibrated microwave data. Infra-red and microwave data were then combined before be-ing rescaled on a monthly basis using the GlobalPrecipitation Climatology Centre (GPCC) precipitationdata (Huffman and Bolvin 2013). In the current study,data from TRMM 3B42 Version 7 (hereafter simplycalled TRMM) at 3 hour intervals were analyzed.It should be noted that prior to this analysis,
CMORPH and TRMM were already bias-adjusted usingthe CPC dataset (Xie et al. 2007) and the GPCC dataset(Schneider et al. 2014), respectively, while GSMaP wasonly based on satellite products. Thus, the monthlyvalues from CMORPH and TRMM were expected to becloser to the observed rainfall values for the areas whererainfall stations are available.
Gauge precipitation dataTo compare and evaluate the SPDs, the Vietnam Grid-ded Precipitation (VnGP) dataset (Nguyen-Xuan et al.2016) and observational data obtained from rain gaugestations operated by the NHMS (Fig. 1 and Table 2)were used. VnGP is a daily gridded precipitation datasetproduced from data collected by 481 rain gauges inVietnam using the Spheremap interpolation method(Willmott et al. 1985). The VnGP dataset has two ver-sions with spatial resolutions of 0.1° and 0.25°, coveringthe period from 1980 to 2010. In the present study, theVnGP dataset at the resolution of 0.25° from 2001 to2010 was used. In Vietnam, both daily rain gauge andVnGP data were collected and designated as 24 h rainfallamounts that were accumulated from 1200 UTC (1900local time) on the previous day to 1200 UTC on thecurrent day. For this reason, the daily-accumulated rain-fall for the SPDs was computed for each grid on a
particular day by summing the 1 h or 3 h rainfall datavalues for the same time span as that mentioned abovebefore evaluations were processed.To investigate the effects of monsoonal wind speed
and elevation, both of which influence satellite precipita-tion estimations, the 925-hPa zonal wind from ERA-In-terim reanalysis data (Dee et al. 2011) with a spatialresolution of 0.25o from ECMWF and the topographydata from the Global 30 Arc-Second Elevation(GTOPO30) dataset were used.
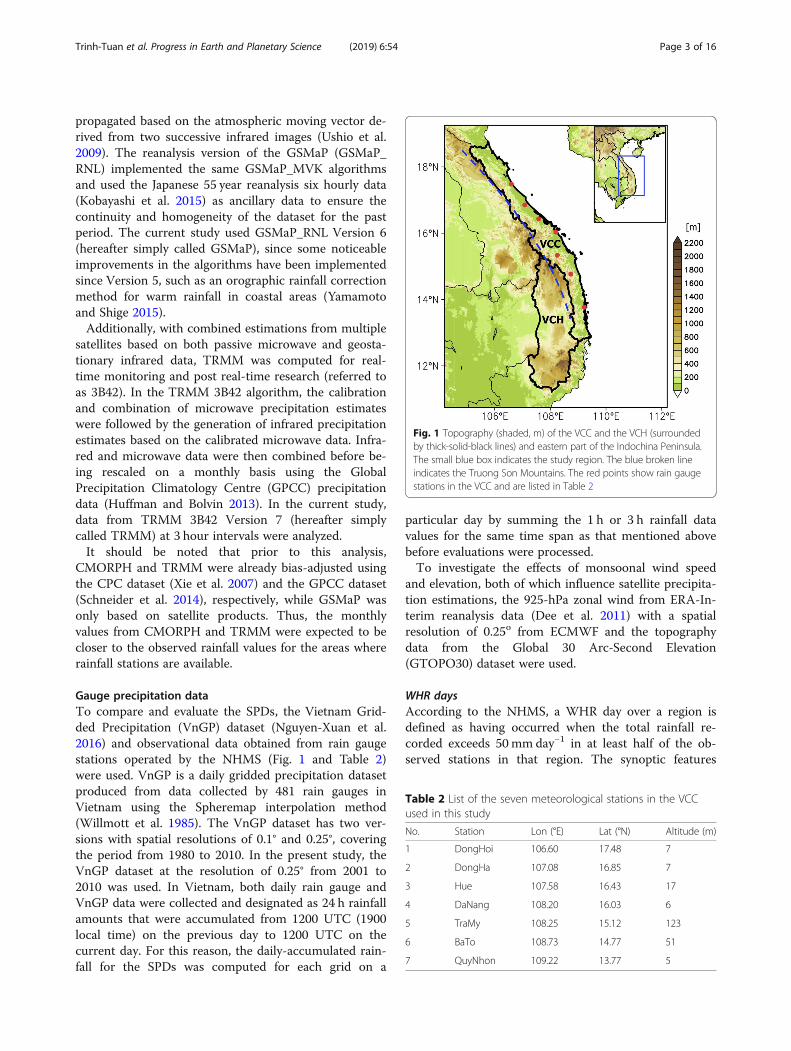
WHR daysAccording to the NHMS, a WHR day over a region isdefined as having occurred when the total rainfall re-corded exceeds 50mm day−1 in at least half of the ob-served stations in that region. The synoptic features
Fig. 1 Topography (shaded, m) of the VCC and the VCH (surroundedby thick-solid-black lines) and eastern part of the Indochina Peninsula.The small blue box indicates the study region. The blue broken lineindicates the Truong Son Mountains. The red points show rain gaugestations in the VCC and are listed in Table 2
Table 2 List of the seven meteorological stations in the VCCused in this study
No. Station Lon (°E) Lat (°N) Altitude (m)
1 DongHoi 106.60 17.48 7
2 DongHa 107.08 16.85 7
3 Hue 107.58 16.43 17
4 DaNang 108.20 16.03 6
5 TraMy 108.25 15.12 123
6 BaTo 108.73 14.77 51
7 QuyNhon 109.22 13.77 5
Trinh-Tuan et al. Progress in Earth and Planetary Science (2019) 6:54 Page 3 of 16
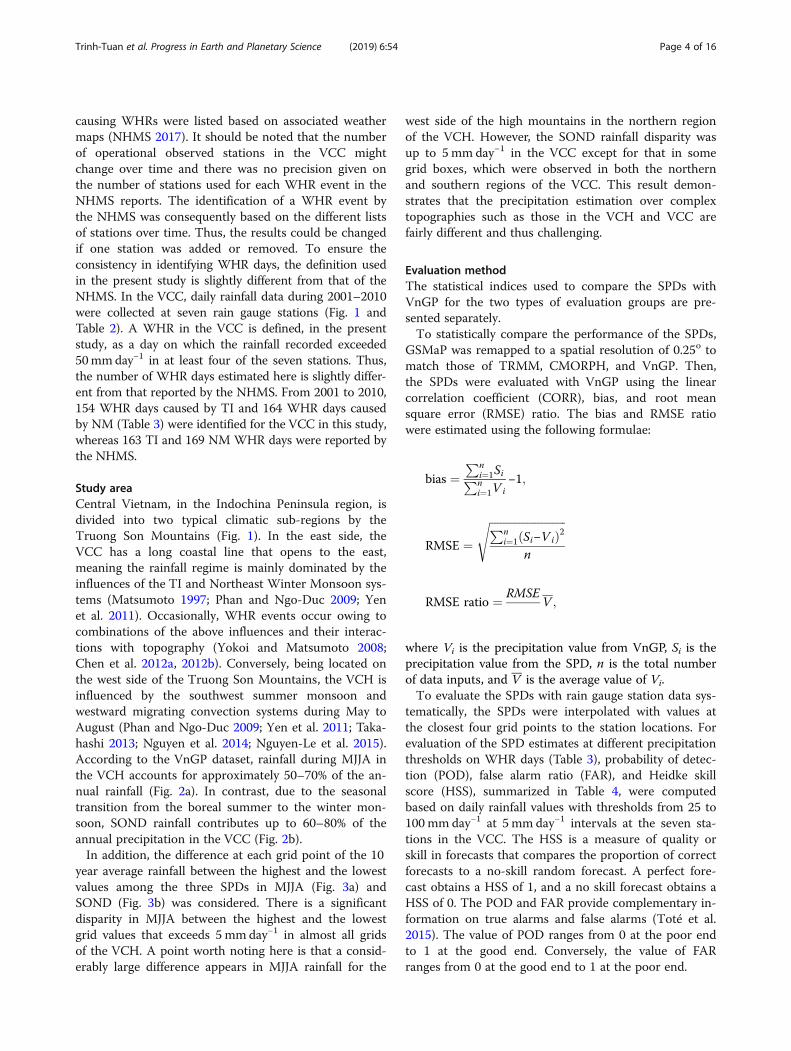
causing WHRs were listed based on associated weathermaps (NHMS 2017). It should be noted that the numberof operational observed stations in the VCC mightchange over time and there was no precision given onthe number of stations used for each WHR event in theNHMS reports. The identification of a WHR event bythe NHMS was consequently based on the different listsof stations over time. Thus, the results could be changedif one station was added or removed. To ensure theconsistency in identifying WHR days, the definition usedin the present study is slightly different from that of theNHMS. In the VCC, daily rainfall data during 2001–2010were collected at seven rain gauge stations (Fig. 1 andTable 2). A WHR in the VCC is defined, in the presentstudy, as a day on which the rainfall recorded exceeded50mmday−1 in at least four of the seven stations. Thus,the number of WHR days estimated here is slightly differ-ent from that reported by the NHMS. From 2001 to 2010,154 WHR days caused by TI and 164 WHR days causedby NM (Table 3) were identified for the VCC in this study,whereas 163 TI and 169 NM WHR days were reported bythe NHMS.
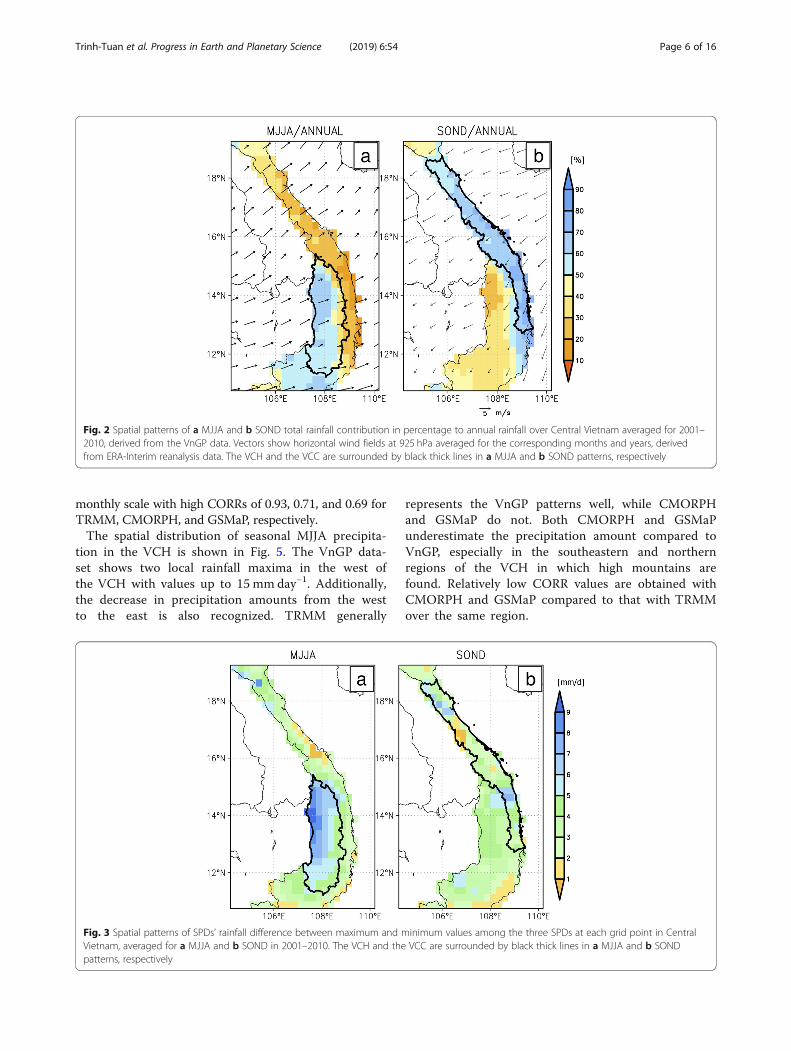
Study areaCentral Vietnam, in the Indochina Peninsula region, isdivided into two typical climatic sub-regions by theTruong Son Mountains (Fig. 1). In the east side, theVCC has a long coastal line that opens to the east,meaning the rainfall regime is mainly dominated by theinfluences of the TI and Northeast Winter Monsoon sys-tems (Matsumoto 1997; Phan and Ngo-Duc 2009; Yenet al. 2011). Occasionally, WHR events occur owing tocombinations of the above influences and their interac-tions with topography (Yokoi and Matsumoto 2008;Chen et al. 2012a, 2012b). Conversely, being located onthe west side of the Truong Son Mountains, the VCH isinfluenced by the southwest summer monsoon andwestward migrating convection systems during May toAugust (Phan and Ngo-Duc 2009; Yen et al. 2011; Taka-hashi 2013; Nguyen et al. 2014; Nguyen-Le et al. 2015).According to the VnGP dataset, rainfall during MJJA inthe VCH accounts for approximately 50–70% of the an-nual rainfall (Fig. 2a). In contrast, due to the seasonaltransition from the boreal summer to the winter mon-soon, SOND rainfall contributes up to 60–80% of theannual precipitation in the VCC (Fig. 2b).In addition, the difference at each grid point of the 10
year average rainfall between the highest and the lowestvalues among the three SPDs in MJJA (Fig. 3a) andSOND (Fig. 3b) was considered. There is a significantdisparity in MJJA between the highest and the lowestgrid values that exceeds 5 mm day−1 in almost all gridsof the VCH. A point worth noting here is that a consid-erably large difference appears in MJJA rainfall for the
west side of the high mountains in the northern regionof the VCH. However, the SOND rainfall disparity wasup to 5 mm day−1 in the VCC except for that in somegrid boxes, which were observed in both the northernand southern regions of the VCC. This result demon-strates that the precipitation estimation over complextopographies such as those in the VCH and VCC arefairly different and thus challenging.
Evaluation methodThe statistical indices used to compare the SPDs withVnGP for the two types of evaluation groups are pre-sented separately.To statistically compare the performance of the SPDs,
GSMaP was remapped to a spatial resolution of 0.25o tomatch those of TRMM, CMORPH, and VnGP. Then,the SPDs were evaluated with VnGP using the linearcorrelation coefficient (CORR), bias, and root meansquare error (RMSE) ratio. The bias and RMSE ratiowere estimated using the following formulae:
bias ¼Pn
i¼1SiPni¼1V i
−1;
RMSE ¼ffiffiffiffiffiffiffiffiffiffiffiffiffiffiffiffiffiffiffiffiffiffiffiffiffiffiffiffiPn
i¼1 Si−V ið Þ2n
s
RMSE ratio ¼ RMSEV ;
where Vi is the precipitation value from VnGP, Si is theprecipitation value from the SPD, n is the total numberof data inputs, and V is the average value of Vi.To evaluate the SPDs with rain gauge station data sys-
tematically, the SPDs were interpolated with values atthe closest four grid points to the station locations. Forevaluation of the SPD estimates at different precipitationthresholds on WHR days (Table 3), probability of detec-tion (POD), false alarm ratio (FAR), and Heidke skillscore (HSS), summarized in Table 4, were computedbased on daily rainfall values with thresholds from 25 to100 mm day−1 at 5 mm day−1 intervals at the seven sta-tions in the VCC. The HSS is a measure of quality orskill in forecasts that compares the proportion of correctforecasts to a no-skill random forecast. A perfect fore-cast obtains a HSS of 1, and a no skill forecast obtains aHSS of 0. The POD and FAR provide complementary in-formation on true alarms and false alarms (Toté et al.2015). The value of POD ranges from 0 at the poor endto 1 at the good end. Conversely, the value of FARranges from 0 at the good end to 1 at the poor end.
Trinh-Tuan et al. Progress in Earth and Planetary Science (2019) 6:54 Page 4 of 16
ResultsOverall performanceCentral Highlands (VCH)Figure 4 shows the scatter plots for the VCH regionalmean daily and monthly precipitation data from the SPDsin comparison with VnGP during MJJA of 2001–2010. On
both the daily and monthly scales, TRMM shows goodagreement with the VnGP data while GSMaP andCMORPH significantly underestimate rainfall over theVCH region. On the daily scale, the CORR values forCMORPH and GSMaP are 0.66 and 0.60, respectively.Moreover, the performances of the SPDs are better on the
Table 3 WHR events during 2001–2010 detected in this study in the VCC and caused by TI and NM
From To Duration (days) From To Duration (days)
Central Coast—TC and ITCZ (154 days)
Oct. 19, 2001 Oct. 26, 2001 8 Dec. 3, 2006 Dec. 6, 2006 4
Nov. 12, 2001 Nov. 15, 2001 4 Oct. 1, 2007 Oct. 5, 2007 5
Dec. 9, 2001 Dec. 11, 2001 3 Oct. 30, 2007 Nov. 5, 2007 7
Sep. 18, 2002 Sep. 25, 2002 8 Nov. 10, 2007 Nov. 13, 2007 4
Sep. 7, 2003 Sep. 14, 2003 8 Sep. 8, 2008 Sep. 12, 2008 5
Sep. 24, 2003 Sep. 26, 2003 3 Sep. 28, 2008 Oct. 1, 2008 4
Oct. 2, 2003 Oct. 6, 2003 5 Nov. 17, 2008 Nov. 18, 2008 2
Oct. 14, 2003 Oct. 20, 2003 7 Sep. 3, 2009 Sep. 9, 2009 7
Sep.17, 2004 Sep. 19, 2004 3 Sep. 22, 2009 Sep. 26, 2009 5
Sep. 10, 2005 Sep. 14, 2005 5 Sep. 28, 2009 Sep. 30, 2009 3
Sep. 18, 2005 Sep. 20, 2005 3 Oct. 15, 2009 Oct. 23, 2009 9
Sep. 26, 2005 Sep. 27, 2005 2 Nov. 2, 2009 Nov. 4, 2009 3
Oct. 7, 2005 Oct. 13, 2005 7 Oct. 14, 2010 Oct. 19, 2010 6
Oct. 29, 2005 Nov. 2, 2005 5 Nov. 3, 2010 Nov. 5, 2010 3
Sep. 23, 2006 Sep. 27, 2006 5 Nov. 13, 2010 Nov. 17, 2010 5
Sep. 29, 2006 Oct. 4, 2006 6
Central Coast—Northeast Monsoon (164 days)
Oct. 4, 2001 Oct. 5, 2001 2 Nov. 24, 2005 Nov. 26, 2005 3
Dec. 13, 2001 Dec. 15, 2001 3 Nov. 30, 2005 Dec. 8, 2005 9
Oct. 6, 2002 Oct. 7, 2002 2 Dec. 11, 2005 Dec. 21, 2005 11
Oct. 14, 2002 Oct. 16, 2002 3 Dec. 10, 2006 Dec. 11, 2006 2
Oct. 24, 2002 Oct. 26, 2002 3 Oct. 13, 2007 Oct. 18, 2007 6
Nov. 1, 2002 Nov. 4, 2002 4 Nov. 16, 2007 Nov. 20, 2007 5
Nov. 6, 2002 Nov. 12, 2002 7 Nov. 22, 2007 Nov. 24, 2007 3
Nov. 10, 2003 Nov. 14, 2003 5 Dec. 4, 2007 Dec. 7, 2007 4
Nov. 23, 2003 Nov. 25, 2003 3 Oct. 10, 2008 Oct. 13, 2008 4
Dec. 8, 2003 Dec. 11, 2003 4 Oct. 16, 2008 Oct. 18, 2008 3
Sep. 9, 2004 Sep. 13, 2004 5 Oct. 23, 2008 Oct. 25, 2008 3
Oct. 2, 2004 Oct. 4, 2004 3 Oct. 27, 2008 Oct. 30, 2008 4
Oct. 23, 2004 Oct. 24, 2004 2 Nov. 3, 2008 Nov. 6, 2008 4
Oct. 27, 2004 Oct. 29, 2004 3 Nov. 23, 2008 Nov. 27, 2008 5
Nov. 15, 2004 Nov. 18, 2004 4 Dec. 5, 2008 Dec. 7, 2008 3
Nov. 23, 2004 Nov. 28, 2004 6 Sep. 29, 2010 Oct. 5, 2010 7
Dec. 1, 2004 Dec. 2, 2004 2 Oct. 27, 2010 Oct. 28, 2010 2
Oct. 18, 2005 Oct. 20, 2005 3 Oct. 30, 2010 Nov. 2, 2010 4
Oct. 22, 2005 Oct. 26, 2005 5 Nov. 6, 2010 Nov. 10, 2010 5
Nov. 16, 2005 Nov. 20, 2005 5 Nov. 28, 2010 Nov. 30, 2010 3
Trinh-Tuan et al. Progress in Earth and Planetary Science (2019) 6:54 Page 5 of 16
monthly scale with high CORRs of 0.93, 0.71, and 0.69 forTRMM, CMORPH, and GSMaP, respectively.The spatial distribution of seasonal MJJA precipita-
tion in the VCH is shown in Fig. 5. The VnGP data-set shows two local rainfall maxima in the west ofthe VCH with values up to 15 mm day−1. Additionally,the decrease in precipitation amounts from the westto the east is also recognized. TRMM generally
represents the VnGP patterns well, while CMORPHand GSMaP do not. Both CMORPH and GSMaPunderestimate the precipitation amount compared toVnGP, especially in the southeastern and northernregions of the VCH in which high mountains arefound. Relatively low CORR values are obtained withCMORPH and GSMaP compared to that with TRMMover the same region.
Fig. 2 Spatial patterns of a MJJA and b SOND total rainfall contribution in percentage to annual rainfall over Central Vietnam averaged for 2001–2010, derived from the VnGP data. Vectors show horizontal wind fields at 925 hPa averaged for the corresponding months and years, derivedfrom ERA-Interim reanalysis data. The VCH and the VCC are surrounded by black thick lines in a MJJA and b SOND patterns, respectively
Fig. 3 Spatial patterns of SPDs’ rainfall difference between maximum and minimum values among the three SPDs at each grid point in CentralVietnam, averaged for a MJJA and b SOND in 2001–2010. The VCH and the VCC are surrounded by black thick lines in a MJJA and b SONDpatterns, respectively
Trinh-Tuan et al. Progress in Earth and Planetary Science (2019) 6:54 Page 6 of 16
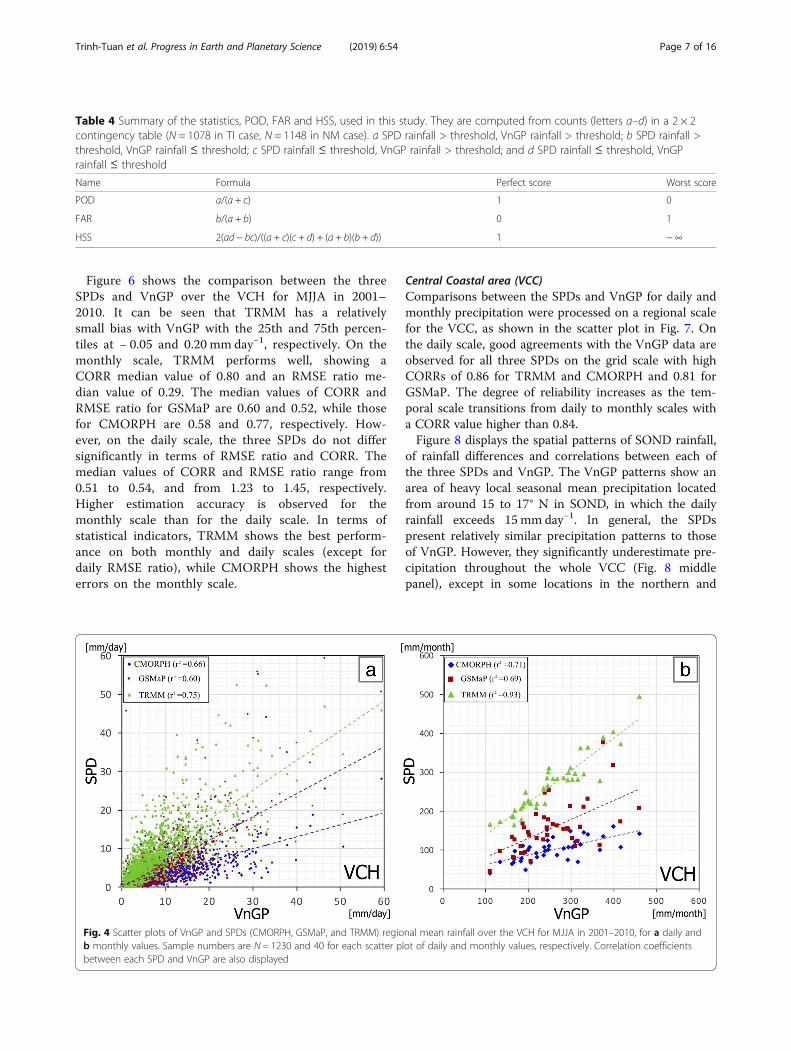
Figure 6 shows the comparison between the threeSPDs and VnGP over the VCH for MJJA in 2001–2010. It can be seen that TRMM has a relativelysmall bias with VnGP with the 25th and 75th percen-tiles at − 0.05 and 0.20 mm day−1, respectively. On themonthly scale, TRMM performs well, showing aCORR median value of 0.80 and an RMSE ratio me-dian value of 0.29. The median values of CORR andRMSE ratio for GSMaP are 0.60 and 0.52, while thosefor CMORPH are 0.58 and 0.77, respectively. How-ever, on the daily scale, the three SPDs do not differsignificantly in terms of RMSE ratio and CORR. Themedian values of CORR and RMSE ratio range from0.51 to 0.54, and from 1.23 to 1.45, respectively.Higher estimation accuracy is observed for themonthly scale than for the daily scale. In terms ofstatistical indicators, TRMM shows the best perform-ance on both monthly and daily scales (except fordaily RMSE ratio), while CMORPH shows the highesterrors on the monthly scale.
Central Coastal area (VCC)Comparisons between the SPDs and VnGP for daily andmonthly precipitation were processed on a regional scalefor the VCC, as shown in the scatter plot in Fig. 7. Onthe daily scale, good agreements with the VnGP data areobserved for all three SPDs on the grid scale with highCORRs of 0.86 for TRMM and CMORPH and 0.81 forGSMaP. The degree of reliability increases as the tem-poral scale transitions from daily to monthly scales witha CORR value higher than 0.84.Figure 8 displays the spatial patterns of SOND rainfall,
of rainfall differences and correlations between each ofthe three SPDs and VnGP. The VnGP patterns show anarea of heavy local seasonal mean precipitation locatedfrom around 15 to 17° N in SOND, in which the dailyrainfall exceeds 15mm day−1. In general, the SPDspresent relatively similar precipitation patterns to thoseof VnGP. However, they significantly underestimate pre-cipitation throughout the whole VCC (Fig. 8 middlepanel), except in some locations in the northern and
Table 4 Summary of the statistics, POD, FAR and HSS, used in this study. They are computed from counts (letters a–d) in a 2 × 2contingency table (N = 1078 in TI case, N = 1148 in NM case). a SPD rainfall > threshold, VnGP rainfall > threshold; b SPD rainfall >threshold, VnGP rainfall ≤ threshold; c SPD rainfall ≤ threshold, VnGP rainfall > threshold; and d SPD rainfall ≤ threshold, VnGPrainfall ≤ threshold
Name Formula Perfect score Worst score
POD a/(a + c) 1 0
FAR b/(a + b) 0 1
HSS 2(ad − bc)/((a + c)(c + d) + (a + b)(b + d)) 1 −∞
Fig. 4 Scatter plots of VnGP and SPDs (CMORPH, GSMaP, and TRMM) regional mean rainfall over the VCH for MJJA in 2001–2010, for a daily andb monthly values. Sample numbers are N = 1230 and 40 for each scatter plot of daily and monthly values, respectively. Correlation coefficientsbetween each SPD and VnGP are also displayed
Trinh-Tuan et al. Progress in Earth and Planetary Science (2019) 6:54 Page 7 of 16
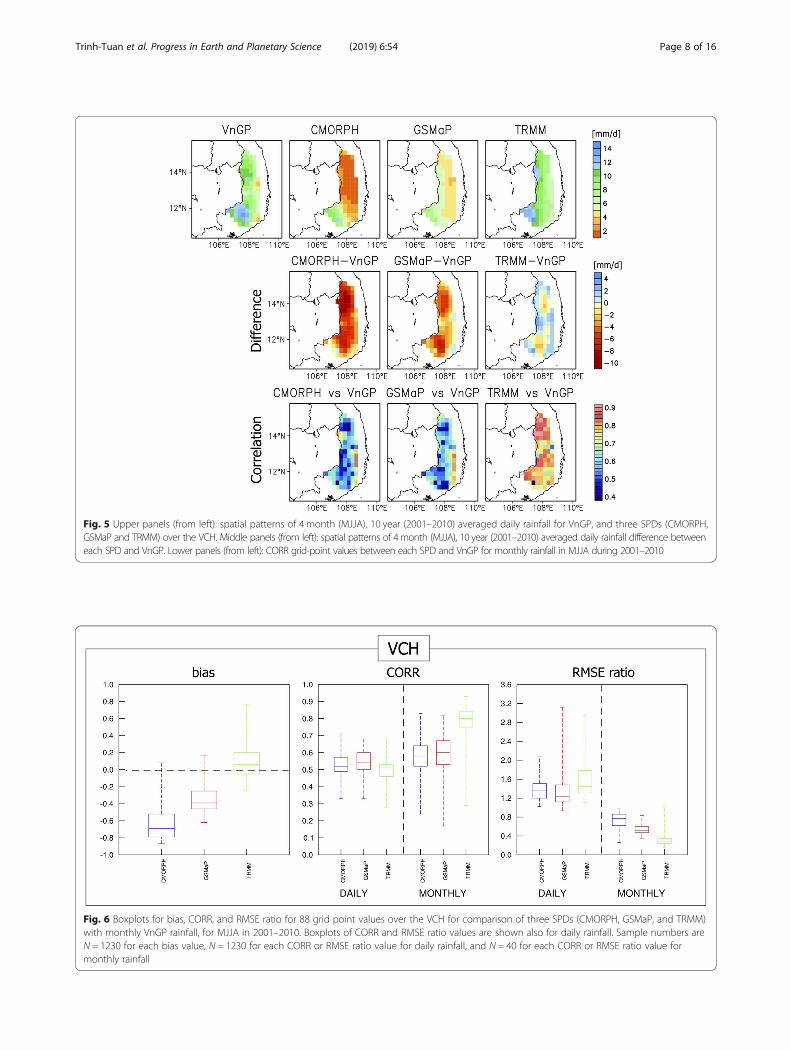
Fig. 5 Upper panels (from left): spatial patterns of 4 month (MJJA), 10 year (2001–2010) averaged daily rainfall for VnGP, and three SPDs (CMORPH,GSMaP and TRMM) over the VCH. Middle panels (from left): spatial patterns of 4month (MJJA), 10 year (2001–2010) averaged daily rainfall difference betweeneach SPD and VnGP. Lower panels (from left): CORR grid-point values between each SPD and VnGP for monthly rainfall in MJJA during 2001–2010
Fig. 6 Boxplots for bias, CORR, and RMSE ratio for 88 grid point values over the VCH for comparison of three SPDs (CMORPH, GSMaP, and TRMM)with monthly VnGP rainfall, for MJJA in 2001–2010. Boxplots of CORR and RMSE ratio values are shown also for daily rainfall. Sample numbers areN = 1230 for each bias value, N = 1230 for each CORR or RMSE ratio value for daily rainfall, and N = 40 for each CORR or RMSE ratio value formonthly rainfall
Trinh-Tuan et al. Progress in Earth and Planetary Science (2019) 6:54 Page 8 of 16
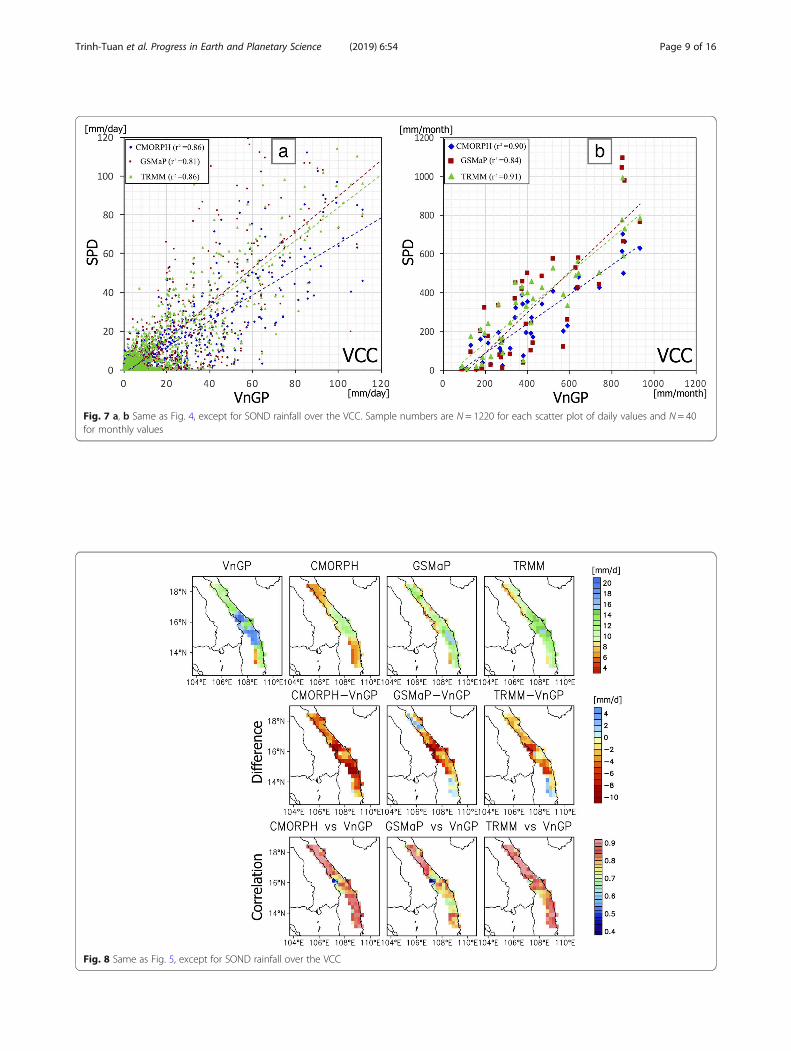
Fig. 7 a, b Same as Fig. 4, except for SOND rainfall over the VCC. Sample numbers are N = 1220 for each scatter plot of daily values and N = 40for monthly values
Fig. 8 Same as Fig. 5, except for SOND rainfall over the VCC
Trinh-Tuan et al. Progress in Earth and Planetary Science (2019) 6:54 Page 9 of 16
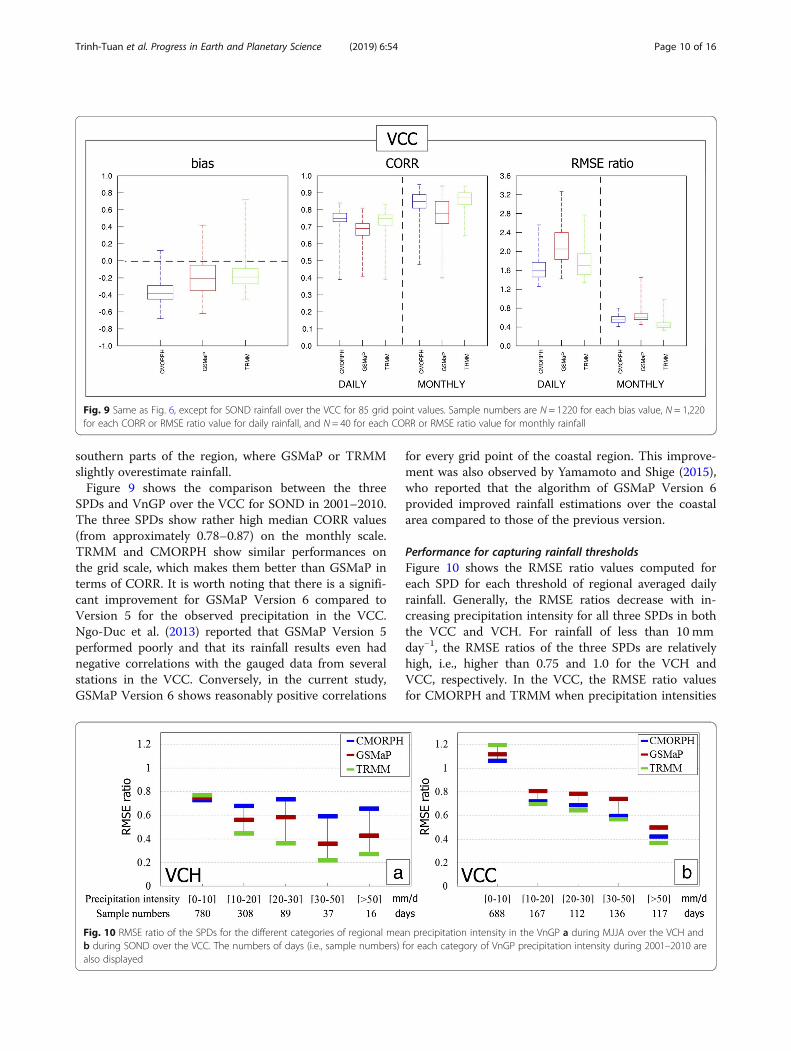
southern parts of the region, where GSMaP or TRMMslightly overestimate rainfall.Figure 9 shows the comparison between the three
SPDs and VnGP over the VCC for SOND in 2001–2010.The three SPDs show rather high median CORR values(from approximately 0.78–0.87) on the monthly scale.TRMM and CMORPH show similar performances onthe grid scale, which makes them better than GSMaP interms of CORR. It is worth noting that there is a signifi-cant improvement for GSMaP Version 6 compared toVersion 5 for the observed precipitation in the VCC.Ngo-Duc et al. (2013) reported that GSMaP Version 5performed poorly and that its rainfall results even hadnegative correlations with the gauged data from severalstations in the VCC. Conversely, in the current study,GSMaP Version 6 shows reasonably positive correlations
for every grid point of the coastal region. This improve-ment was also observed by Yamamoto and Shige (2015),who reported that the algorithm of GSMaP Version 6provided improved rainfall estimations over the coastalarea compared to those of the previous version.
Performance for capturing rainfall thresholdsFigure 10 shows the RMSE ratio values computed foreach SPD for each threshold of regional averaged dailyrainfall. Generally, the RMSE ratios decrease with in-creasing precipitation intensity for all three SPDs in boththe VCC and VCH. For rainfall of less than 10 mmday−1, the RMSE ratios of the three SPDs are relativelyhigh, i.e., higher than 0.75 and 1.0 for the VCH andVCC, respectively. In the VCC, the RMSE ratio valuesfor CMORPH and TRMM when precipitation intensities
Fig. 9 Same as Fig. 6, except for SOND rainfall over the VCC for 85 grid point values. Sample numbers are N = 1220 for each bias value, N = 1,220for each CORR or RMSE ratio value for daily rainfall, and N = 40 for each CORR or RMSE ratio value for monthly rainfall
Fig. 10 RMSE ratio of the SPDs for the different categories of regional mean precipitation intensity in the VnGP a during MJJA over the VCH andb during SOND over the VCC. The numbers of days (i.e., sample numbers) for each category of VnGP precipitation intensity during 2001–2010 arealso displayed
Trinh-Tuan et al. Progress in Earth and Planetary Science (2019) 6:54 Page 10 of 16
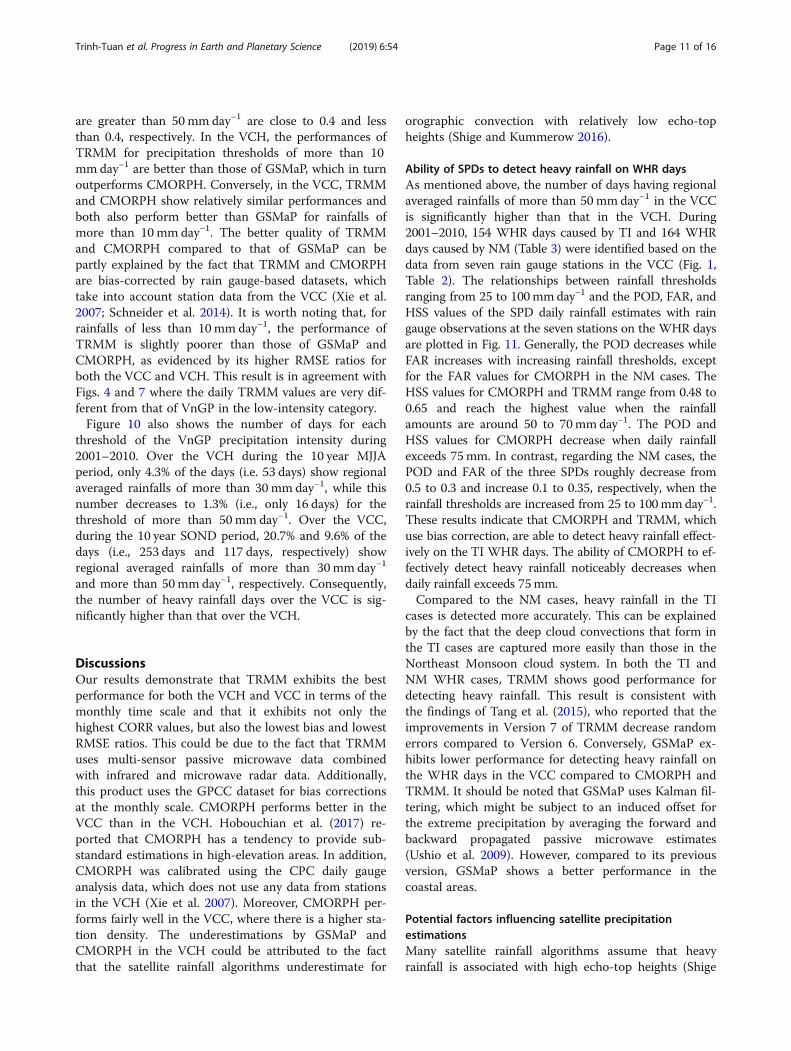
are greater than 50 mm day−1 are close to 0.4 and lessthan 0.4, respectively. In the VCH, the performances ofTRMM for precipitation thresholds of more than 10mm day−1 are better than those of GSMaP, which in turnoutperforms CMORPH. Conversely, in the VCC, TRMMand CMORPH show relatively similar performances andboth also perform better than GSMaP for rainfalls ofmore than 10 mm day−1. The better quality of TRMMand CMORPH compared to that of GSMaP can bepartly explained by the fact that TRMM and CMORPHare bias-corrected by rain gauge-based datasets, whichtake into account station data from the VCC (Xie et al.2007; Schneider et al. 2014). It is worth noting that, forrainfalls of less than 10mm day−1, the performance ofTRMM is slightly poorer than those of GSMaP andCMORPH, as evidenced by its higher RMSE ratios forboth the VCC and VCH. This result is in agreement withFigs. 4 and 7 where the daily TRMM values are very dif-ferent from that of VnGP in the low-intensity category.Figure 10 also shows the number of days for each
threshold of the VnGP precipitation intensity during2001–2010. Over the VCH during the 10 year MJJAperiod, only 4.3% of the days (i.e. 53 days) show regionalaveraged rainfalls of more than 30 mm day−1, while thisnumber decreases to 1.3% (i.e., only 16 days) for thethreshold of more than 50mm day−1. Over the VCC,during the 10 year SOND period, 20.7% and 9.6% of thedays (i.e., 253 days and 117 days, respectively) showregional averaged rainfalls of more than 30mm day−1
and more than 50mm day−1, respectively. Consequently,the number of heavy rainfall days over the VCC is sig-nificantly higher than that over the VCH.
DiscussionsOur results demonstrate that TRMM exhibits the bestperformance for both the VCH and VCC in terms of themonthly time scale and that it exhibits not only thehighest CORR values, but also the lowest bias and lowestRMSE ratios. This could be due to the fact that TRMMuses multi-sensor passive microwave data combinedwith infrared and microwave radar data. Additionally,this product uses the GPCC dataset for bias correctionsat the monthly scale. CMORPH performs better in theVCC than in the VCH. Hobouchian et al. (2017) re-ported that CMORPH has a tendency to provide sub-standard estimations in high-elevation areas. In addition,CMORPH was calibrated using the CPC daily gaugeanalysis data, which does not use any data from stationsin the VCH (Xie et al. 2007). Moreover, CMORPH per-forms fairly well in the VCC, where there is a higher sta-tion density. The underestimations by GSMaP andCMORPH in the VCH could be attributed to the factthat the satellite rainfall algorithms underestimate for
orographic convection with relatively low echo-topheights (Shige and Kummerow 2016).
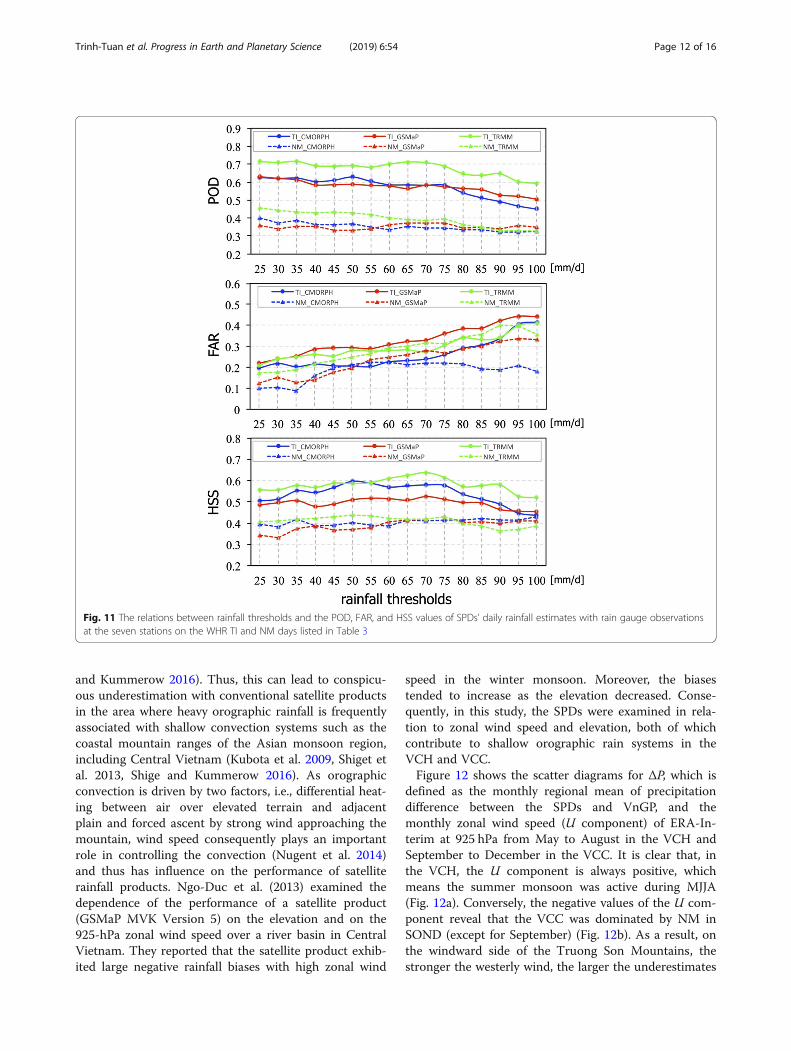
Ability of SPDs to detect heavy rainfall on WHR daysAs mentioned above, the number of days having regionalaveraged rainfalls of more than 50 mm day−1 in the VCCis significantly higher than that in the VCH. During2001–2010, 154 WHR days caused by TI and 164 WHRdays caused by NM (Table 3) were identified based on thedata from seven rain gauge stations in the VCC (Fig. 1,Table 2). The relationships between rainfall thresholdsranging from 25 to 100mmday−1 and the POD, FAR, andHSS values of the SPD daily rainfall estimates with raingauge observations at the seven stations on the WHR daysare plotted in Fig. 11. Generally, the POD decreases whileFAR increases with increasing rainfall thresholds, exceptfor the FAR values for CMORPH in the NM cases. TheHSS values for CMORPH and TRMM range from 0.48 to0.65 and reach the highest value when the rainfallamounts are around 50 to 70mmday−1. The POD andHSS values for CMORPH decrease when daily rainfallexceeds 75mm. In contrast, regarding the NM cases, thePOD and FAR of the three SPDs roughly decrease from0.5 to 0.3 and increase 0.1 to 0.35, respectively, when therainfall thresholds are increased from 25 to 100mmday−1.These results indicate that CMORPH and TRMM, whichuse bias correction, are able to detect heavy rainfall effect-ively on the TI WHR days. The ability of CMORPH to ef-fectively detect heavy rainfall noticeably decreases whendaily rainfall exceeds 75mm.Compared to the NM cases, heavy rainfall in the TI
cases is detected more accurately. This can be explainedby the fact that the deep cloud convections that form inthe TI cases are captured more easily than those in theNortheast Monsoon cloud system. In both the TI andNM WHR cases, TRMM shows good performance fordetecting heavy rainfall. This result is consistent withthe findings of Tang et al. (2015), who reported that theimprovements in Version 7 of TRMM decrease randomerrors compared to Version 6. Conversely, GSMaP ex-hibits lower performance for detecting heavy rainfall onthe WHR days in the VCC compared to CMORPH andTRMM. It should be noted that GSMaP uses Kalman fil-tering, which might be subject to an induced offset forthe extreme precipitation by averaging the forward andbackward propagated passive microwave estimates(Ushio et al. 2009). However, compared to its previousversion, GSMaP shows a better performance in thecoastal areas.
Potential factors influencing satellite precipitationestimationsMany satellite rainfall algorithms assume that heavyrainfall is associated with high echo-top heights (Shige
Trinh-Tuan et al. Progress in Earth and Planetary Science (2019) 6:54 Page 11 of 16
and Kummerow 2016). Thus, this can lead to conspicu-ous underestimation with conventional satellite productsin the area where heavy orographic rainfall is frequentlyassociated with shallow convection systems such as thecoastal mountain ranges of the Asian monsoon region,including Central Vietnam (Kubota et al. 2009, Shiget etal. 2013, Shige and Kummerow 2016). As orographicconvection is driven by two factors, i.e., differential heat-ing between air over elevated terrain and adjacentplain and forced ascent by strong wind approaching themountain, wind speed consequently plays an importantrole in controlling the convection (Nugent et al. 2014)and thus has influence on the performance of satelliterainfall products. Ngo-Duc et al. (2013) examined thedependence of the performance of a satellite product(GSMaP MVK Version 5) on the elevation and on the925-hPa zonal wind speed over a river basin in CentralVietnam. They reported that the satellite product exhib-ited large negative rainfall biases with high zonal wind
speed in the winter monsoon. Moreover, the biasestended to increase as the elevation decreased. Conse-quently, in this study, the SPDs were examined in rela-tion to zonal wind speed and elevation, both of whichcontribute to shallow orographic rain systems in theVCH and VCC.Figure 12 shows the scatter diagrams for ΔP, which is
defined as the monthly regional mean of precipitationdifference between the SPDs and VnGP, and themonthly zonal wind speed (U component) of ERA-In-terim at 925 hPa from May to August in the VCH andSeptember to December in the VCC. It is clear that, inthe VCH, the U component is always positive, whichmeans the summer monsoon was active during MJJA(Fig. 12a). Conversely, the negative values of the U com-ponent reveal that the VCC was dominated by NM inSOND (except for September) (Fig. 12b). As a result, onthe windward side of the Truong Son Mountains, thestronger the westerly wind, the larger the underestimates
Fig. 11 The relations between rainfall thresholds and the POD, FAR, and HSS values of SPDs’ daily rainfall estimates with rain gauge observationsat the seven stations on the WHR TI and NM days listed in Table 3
Trinh-Tuan et al. Progress in Earth and Planetary Science (2019) 6:54 Page 12 of 16
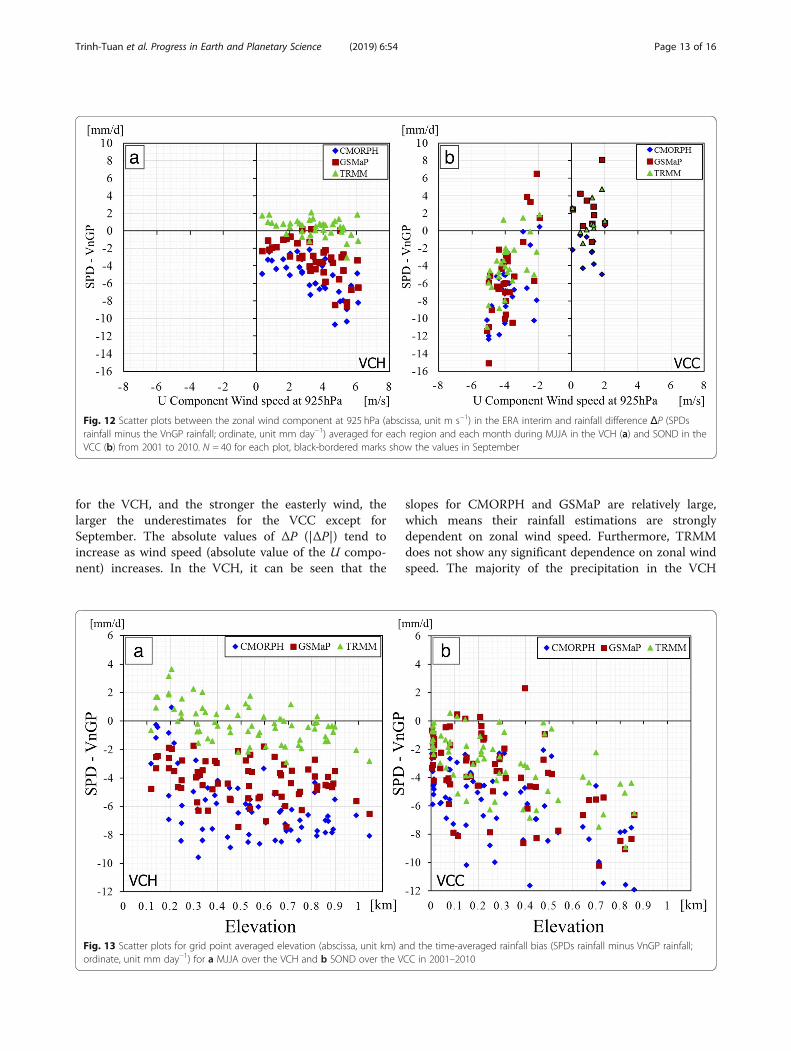
for the VCH, and the stronger the easterly wind, thelarger the underestimates for the VCC except forSeptember. The absolute values of ΔP (|ΔP|) tend toincrease as wind speed (absolute value of the U compo-nent) increases. In the VCH, it can be seen that the
slopes for CMORPH and GSMaP are relatively large,which means their rainfall estimations are stronglydependent on zonal wind speed. Furthermore, TRMMdoes not show any significant dependence on zonal windspeed. The majority of the precipitation in the VCH
Fig. 12 Scatter plots between the zonal wind component at 925 hPa (abscissa, unit m s−1) in the ERA interim and rainfall difference ΔP (SPDsrainfall minus the VnGP rainfall; ordinate, unit mm day−1) averaged for each region and each month during MJJA in the VCH (a) and SOND in theVCC (b) from 2001 to 2010. N = 40 for each plot, black-bordered marks show the values in September
Fig. 13 Scatter plots for grid point averaged elevation (abscissa, unit km) and the time-averaged rainfall bias (SPDs rainfall minus VnGP rainfall;ordinate, unit mm day−1) for a MJJA over the VCH and b SOND over the VCC in 2001–2010
Trinh-Tuan et al. Progress in Earth and Planetary Science (2019) 6:54 Page 13 of 16
could be attributed to the southwest monsoon, while inthe VCC, precipitation is caused by several factors, suchas the impacts of the NM and TI and/or the interactionsbetween them. Therefore, the relationship between theU component and ΔP in the VCH is more significantthan that in the VCC.In addition, to evaluate the relationship between the
time-averaged rainfall bias (ΔP) at each grid and the ele-vation over these regions, the mean elevation of eachgrid was obtained from the GTOPO30 data. Overall,|ΔP| tends to increase as the elevation increases (Fig. 13).A similar relationship between elevation and the accur-acy of the SPDs has also been observed in previous stud-ies, and this is mainly attributed to the fact that retrievalalgorithms based on infrared imagery have problems as-sociated with the detection of warm orographic rainfall(Kidd 2001; Dinku et al. 2008; Toté et al. 2015). TheCMORPH estimation is largely based on the thermal in-frared band (Joyce et al. 2004), thus the CMORPH algo-rithm can misinterpret warm clouds in elevatedtopography, such as that in the VCH (Fig. 13a). In thecase of the VCC, CMORPH and GSMaP clearly presentslopes similar to those from TRMM, but with differentbiases (Fig. 13b). These results indicate that other SPDscould potentially be improved in high-elevation areas byusing the correction methods proposed by Yin et al.(2008) and Shige et al. (2013).
ConclusionsIn this study, three SPDs (CMORPH, GSMaP, andTRMM) were assessed by comparison with VnGP duringrainy seasons in 2001–2010 over Central Vietnam. Inaddition to evaluations based on spatial (grid and region)and temporal (daily and monthly) scales, the ability ofSPDs to detect the heavy rainfall in WHR days causedby TI and NM in the VCC region was also considered.The results obtained demonstrate that, in complex
topographic regions such as Central Vietnam, estimationalgorithms combined with multi-sensors and rain gaugeobservation or data reanalysis-based correction processeslead to different performances. In general, the SPDs stud-ied generate reasonable estimates of precipitation in theplains but exhibit slightly poorer performance for higher-elevation areas. TRMM exhibits superior performance (interms of higher correlations, lower biases, and lowerRMSE ratios) than GSMaP and CMORPH for the VCH,specifically at regional and monthly scales. GSMaP ex-hibits moderately good performance for the VCH but isless efficient for the VCC. Conversely, CMORPH performsbetter for the VCC than for the VCH.The three SPDs perform better in detecting heavy
rainfall on the WHR days in TI cases than in NMcases. In general, TRMM presents lower RMSE ratiosand higher POD and HSS values than GSMaP and
CMORPH for most thresholds. Therefore, TRMM isdeemed to be reliable and, thus, shows potential foruse in hydrological applications. This conclusion isconsistent with those of other studies (Hobouchian etal. 2017; Mantas et al. 2015) conducted in differentareas, which demonstrated the advantages of gaugecalibration and multi-satellite passive microwave dataincorporation. Hydrological applications considered infurther studies should take into account these poten-tial suggestions.Finally, the SPDs underestimate rainfall depending on
zonal wind speed and elevation, but the CMORPH andGSMaP biases are larger than those of TRMM. There-fore, variability in elevation plays an important role inthese biases and suggests that CMORPH and GSMaPcan be further improved via algorithm correction for ele-vation and zonal wind speed.
AbbreviationsCMORPH: Climate Prediction Center Morphing; CORR: Correlation coefficient;CPC: Climate Prediction Center; FAR: False alarm ratio; GPCC: GlobalPrecipitation Climatology Centre; GSMaP: Global Satellite Mapping ofPrecipitation; HSS: Heidke skill score; ITCZ: Inter-tropical Convergence Zone;MJJA: May to August; NHMS: National Hydro-Meteorology Service ofVietnam; NM: Northeast Winter Monsoon; POD: Probability of detection;RMSE ratio: Root mean square error ratio; SOND: September to December;SPDs: Satellite Precipitation Datasets; TC: Tropical cyclone; TI: TCs and ITCZ;TRMM: Tropical Rainfall Measuring Mission; VCC: Vietnam Central Coast;VCH: Vietnam Central Highlands; VnGP: Vietnam Gridded Precipitation;WHR: Widespread heavy rainfall
AcknowledgementsWe would like to acknowledge the constructive comments of the editor andthe three anonymous reviewers. The authors also acknowledge Dr. PhuNguyen, University of California Irvine, for his contributions and comments toimprove the manuscript. This research was supported by the JapanAerospace Exploration Agency (JAXA) Precipitation Measuring Mission andthe Vietnam National Foundation for Science and Technology Development(NAFOSTED) under Grant 105.06-2018.05. We would like to thank theNational Hydro-Meteorological Service of Vietnam (NHMS) for providing sta-tion data. The GSMaP products were produced and distributed by the EarthObservation Research Center, JAXA. The CMORPH data were sourced fromNOAA/CPC from their website at ftp://ftp.cpc.ncep.noaa.gov/precip/CMORPH_V1.0/, while the TRMM data were sourced from NASA/JAXA fromhttps://disc.gsfc.nasa.gov/mirador-guide?keyword=TRMM_3B42, the ERA-Interim Reanalysis data were obtained from ECMWF at http://apps.ecmwf.int/datasets/, and the GTOPO30 were obtained from EROS Data Center athttps://earthexplorer.usgs.gov/.
Authors’ contributionsLTT, JM, and TND conceived the topic. LTT carried out the analysis andconducted major parts of the study. All authors discussed the results andcommented on the manuscript. All authors read and approved the finalmanuscript.
Authors’ informationLTT is currently a researcher at the University of Science and Technology ofHanoi, in the REMOSAT laboratory, Department of Space and Applications.This study was mainly conducted when LTT was a Ph.D. student at theTokyo Metropolitan University, Japan, in the Department of Geography,Laboratory of Climatology. JM is the director of the Research Center forClimatology, a professor in the Department of Geography at the TokyoMetropolitan University, and a visiting principal scientist at the Japan Agencyfor Marine-Earth Science and Technology. TND is an associate professor inthe Department of Space and Applications at the University of Science and
Trinh-Tuan et al. Progress in Earth and Planetary Science (2019) 6:54 Page 14 of 16
Technology of Hanoi. MIN is a research fellow at the Tokyo Metropolitan Uni-versity. TI is a project assistant professor at the Tokyo Metropolitan University.
FundingLTT, JM, TND, and MIN were supported by the 8th JAXA PMM Project (JX-PSPC-436541, PI No. 204). LTT and JM were also supported by the TokyoHuman Resources Fund for City Diplomacy of Tokyo Metropolitan Universityreceived from the Tokyo Metropolitan Government. JM and TI wereadditionally supported by the JSPS KAKENHI grant number 26220202. TNDwas supported by the Vietnam National Foundation for Science andTechnology Development (NAFOSTED) under grant 105.06–2018.05.
Availability of data and materialsThe datasets analyzed in the current study are available from thecorresponding author on request.
Competing interestsThe authors declare that they have no competing interests.
Author details1Department of Geography, Tokyo Metropolitan University, 1-1Minami-Osawa, Hachioji-Shi, Tokyo 192-0397, Japan. 2REMOSAT Laboratory,University of Science and Technology of Hanoi (USTH), Vietnam Academy ofScience and Technology (VAST), Hanoi, Vietnam. 3Dynamic Coupling ofOcean-Atmosphere-Land Research Program, Japan Agency for Marine-EarthScience and Technology, Yokosuka, Kanagawa 237-0061, Japan.
Received: 4 July 2017 Accepted: 5 July 2019
ReferencesChen TC, Tsay JD, Yen MC, Matsumoto J (2012a) Interannual variation of the late
fall rainfall in Central Vietnam. J Clim 25:392–413. https://doi.org/10.1175/JCLI-D-11-00068.1
Chen TC, Yen MC, Tsay JD, Alpert J, Tan Thanh NT (2012b) Forecast advisory forthe late fall heavy rainfall/flood event in Central Vietnam developed fromdiagnostic analysis. Wea Forecasting 27:1155–1177. https://doi.org/10.1175/WAF-D-11-00104.1
Dee DP, Uppala SM, Simmons AJ, Berrisford P, Poli P, Kobayashi S, Andrae U,Balmaseda MA, Balsamo G, Bauer P, Bechtold P, Beljaars ACM, van de Berg L,Bidlot J, Bormann N, Delsol C, Dragani R, Fuentes M, Geer AJ, Haimberger L,Healy SB, Hersbach H, Hólm EV, Isaksen L, Kållberg P, Köhler M, Matricardi M,McNally AP, Monge BM, Morcrette JJ, Park BK, Peubey C, Rosnay P, TavolatoC, Thépaut JN, Vitart F (2011) The ERA-interim reanalysis: configuration andperformance of the data assimilation system. Quar J Royal Meteorol Soc 137:553–597. https://doi.org/10.1002/qj.828
Dinku T, Ceccato P, Grover-Kopec E, Lemma M, Connor SJ, Ropelewski CF (2008)Validation of satellite rainfall products over East Africa’s complex topography. IntJ Remote Sensing 28:1503–1526. https://doi.org/10.1080/01431160600954688
Dinku T, Ruiz F, Connor SJ, Ceccato P (2010) Validation and intercomparison ofsatellite rainfall estimates over Colombia. J Appl Meteorol Climatol 49:1004–1014. https://doi.org/10.1175/2009JAMC2260.1
Gao YC, Liu M (2013) Evaluation of high-resolution satellite precipitation productsusing rain gauge observations over the Tibetan Plateau. Hydrol Earth Syst Sci17:837. https://doi.org/10.5194/hess-17-837-2013
Hobouchian MP, Salio P, Skabar YG, Vila D, Garreaud R (2017) Assessment ofsatellite precipitation estimates over the slopes of the subtropical Andes.Atmos Res 190:43–54. https://doi.org/10.1016/j.atmosres.2017.02.006
Huffman GJ, Bolvin DT (2013) TRMM and other data precipitation data setdocumentation. NASA, Greenbelt, pp 1–40 Available online at https://pmm.nasa.gov/sites/default/files/document_files/3B42_3B43_doc_V7.pdf
Jamandre CA, Narisma GT (2013) Spatio-temporal validation of satellite-basedrainfall estimates in the Philippines. Atmos Res 122:599–608. https://doi.org/10.1016/j.atmosres.2012.06.024
Joyce RJ, Janowiak JE, Arkin PA, Xie P (2004) CMORPH: a method that producesglobal precipitation estimates from passive microwave and infrared data athigh spatial and temporal resolution. J Hydrometeorol 5:487–503. https://doi.org/10.1175/1525-754
Kidd C (2001) Satellite rainfall climatology: a review. Int J Climatol 21:1041–1066.https://doi.org/10.1002/joc.635
Kobayashi S, Yukinari OTA, Harada Y, Ebita A, Moriya M, Onoda H, Onogi K,Kamahori H, Kobayashi C, Miyaoka K, Takahashi K (2015) The JRA-55reanalysis: general specifications and basic characteristics. J Met Soc Japan93:5–48. https://doi.org/10.2151/jmsj.2015-001
Kubota T, Ushio T, Shige S, Kida S, Kachi M, Okamoto KI (2009) Verification ofhigh-resolution satellite-based rainfall estimates around Japan using a gauge-calibrated ground-radar dataset. J Met Soc Japan 87A:203–222. https://doi.org/10.2151/jmsj.87A.203
Mantas VM, Liu Z, Caro C, Pereira AJSC (2015) Validation of TRMM multi-satelliteprecipitation analysis (TMPA) products in the Peruvian Andes. Atmos Res 163:132–145. https://doi.org/10.1016/j.atmosres.2014.11.012
Matsumoto J (1997) Seasonal transition of summer rainy season over Indochinaand adjacent monsoon region. Adv Atmos Sci 14:231–245. https://doi.org/10.1007/s00376-997-0022-0
Ngo-Duc T, Matsumoto J, Kamimera H, Bui HH (2013) Monthly adjustment ofGlobal Satellite Mapping of Precipitation (GSMaP) data over the VuGia–ThuBon River Basin in Central Vietnam using an artificial neural network.Hydrol Res Lett 7:85–90. https://doi.org/10.3178/hrl.7.85
Ngo-Thanh H, Ngo-Duc T, Nguyen-Hong H, Baker P, Phan-Van T (2017) A distinctionbetween rainy season and summer season over the Central Highlands ofVietnam. Theor Appl Climatol. https://doi.org/10.1007/s00704-017-2178-6
Nguyen DQ, Renwick J, McGregor J (2014) Variations of surface temperature andrainfall in Vietnam from 1971 to 2010. Int J Climatol 34:249–264. https://doi.org/10.1002/joc.3684
Nguyen-Le D, Matsumoto J, Ngo-Duc T (2015) Onset of the rainy seasons in theeastern Indochina Peninsula. J Clim 28:5645–5666. https://doi.org/10.1175/JCLI-D-14-00373.1
Nguyen-Thi HA, Matsumoto J, Ngo-Duc T, Endo N (2012) A climatological studyof tropical cyclone rainfall in Vietnam. SOLA 8:41–44. https://doi.org/10.2151/sola.2012-011
Nguyen-Xuan T, Ngo-Duc T, Kamimera H, Trinh-Tuan L, Matsumoto J, Inoue T, Phan-Van T (2016) The Vietnam gridded precipitation (VnGP) dataset: constructionand validation. SOLA 12:291–296. https://doi.org/10.2151/sola.2016-057
NHMS (2017) Annual Reports of Hydro-Meteorological Characteristics. http://kttvqg.gov.vn. Accessed 1 Jan 2017. (in Vietnamese)
Nugent AD, Smith RB, Minder JR (2014) Wind speed control of tropicalorographic convection. J Atmos Sci 71:2695–2712. https://doi.org/10.1175/JAS-D-13-0399.1
Phan VT, Ngo-Duc T (2009) Seasonal and interannual variations of surface climateelements over Vietnam. Clim Res 40:49–60. https://doi.org/10.3354/cr00824
Schneider U, Becker A, Finger P, Meyer-Christoffer A, Ziese M, Rudolf B (2014)GPCC's new land surface precipitation climatology based on quality-controlled in situ data and its role in quantifying the global water cycle.Theor Appl Climatol 115:15–40. https://doi.org/10.1007/s00704-013-0860-x
Shen Y, Xiong A, Wang Y, Xie P (2010) Performance of high resolution satelliteprecipitation products over China. J Geophys Res Atmos 115(D2). https://doi.org/10.1029/2009JD012097
Shige S, Kida S, Ashiwake H, Kubota T, Aonashi K (2013) Improvement of TMI rainretrievals in mountainous areas. J Appl Meteorol Climatol 52:242–254. https://doi.org/10.1175/JAMC-D-12-074.1
Shige S, Kummerow CD (2016) Precipitation-Top Heights of heavy orographicrainfall in the Asian monsoon region. J Atmos Sci 73:3009–3024. https://doi.org/10.1175/JAS-D-15-0271.1
Takahashi HG (2013) Orographic low-level clouds of Southeast Asia during thecold surges of the winter monsoon. Atmos Res 131:22–33. https://doi.org/10.1016/j.atmosres.2012.07.005
Tang L, Tian Y, Yan F, Habib E (2015) An improved procedure for the validationof satellite-based precipitation estimates. Atmos Res 163:61–73. https://doi.org/10.1016/j.atmosres.2014.12.016
Tapiador FJ, Turk FJ, Petersen W, Hou AY, García-Ortega E, Machado LA,Angelis CF, Salio P, Kidd C, Huffman GJ, De Castro M (2012) Globalprecipitation measurement: methods, datasets and applications. AtmosRes 104:70–97. https://doi.org/10.1016/j.atmosres.2011.10.021
Thiemig V, Rojas R, Zambrano-Bigiarini M, Levizzani V, De Roo A (2012)Validation of satellite-based precipitation products over sparsely gaugedAfrican river basins. J Hydrometeorol 13:1760–1783. https://doi.org/10.1175/JHM-D-12-032.1
Toté C, Patricio D, Boogaard H, van der Wijngaart R, Tarnavsky E, Funk C(2015) Evaluation of satellite rainfall estimates for drought and floodmonitoring in Mozambique. Remote Sens 7:1758–1776. https://doi.org/10.3390/rs70201758
Trinh-Tuan et al. Progress in Earth and Planetary Science (2019) 6:54 Page 15 of 16

Ushio T, Sasashige K, Kubota T, Shige S, Okamoto KI, Aonashi K, Inoue T,Takahashi N, Iguchi T, Kachi M, Oki R (2009) A Kalman filter approach to theGlobal Satellite Mapping of Precipitation (GSMaP) from combined passivemicrowave and infrared radiometric data. J Met Soc Japan 87A:137–151.https://doi.org/10.2151/jmsj.87A.137
Vernimmen RRE, Hooijer A, Aldrian E, van Dijk AIJM (2012) Evaluation and biascorrection of satellite rainfall data for drought monitoring in Indonesia.Hydrol Earth Syst Sci 16:133–146. https://doi.org/10.5194/hess-16-133-2012
Willmott CJ, Rowe CM, Philpot WD (1985) Small-scale climate maps: a sensitivityanalysis of some common assumptions associated with grid-pointinterpolation and contouring. Amer Cartogr 12:5–16. https://doi.org/10.1559/152304085783914686
Xie P, Chen M, Yang S, Yatagai A, Hayasaka T, Fukushima Y, Liu C (2007) A gauge-based analysis of daily precipitation over East Asia. J Hydrometeorol 8:607–626. https://doi.org/10.1175/JHM583.1
Xie P, Joyce R, Wu S, Yoo SH, Yarosh Y, Sun F, Lin R (2017) Reprocessed, bias-corrected CMORPH global high-resolution precipitation estimates from 1998.J Hydrometeorol. https://doi.org/10.1175/JHM-D-16-0168.1
Yamamoto MK, Shige S (2015) Implementation of an orographic/nonorographic rainfall classification scheme in the GSMaP algorithm formicrowave radiometers. Atmos Res 163:36–47. https://doi.org/10.1016/j.atmosres.2014.07.024
Yen MC, Chen TC, Hu HL, Tzeng RY, Dinh DT, Nguyen TTT, Wong CJ (2011)Interannual variation of the fall rainfall in Central Vietnam. J Met Soc Japan89A:259–270. https://doi.org/10.2151/jmsj.2011-A16
Yin ZY, Zhang X, Liu X, Colella M, Chen X (2008) An assessment of the biases ofsatellite rainfall estimates over the Tibetan Plateau and correction methodsbased on topographic analysis. J Hydrometeorol 9:301–326. https://doi.org/10.1175/2007JHM903.1
Yokoi S, Matsumoto J (2008) Collaborative effects of cold surge and tropicaldepression-type disturbance on heavy rainfall in Central Vietnam. Mon WeaRev 136:3275–3287. https://doi.org/10.1175/2008MWR2456.1
Publisher’s NoteSpringer Nature remains neutral with regard to jurisdictional claims inpublished maps and institutional affiliations.
Trinh-Tuan et al. Progress in Earth and Planetary Science (2019) 6:54 Page 16 of 16