Embed Size (px)
Citation preview

EVALUATION OF SEISMIC RETROFITS
FOR POST AND PIER FOUNDATION SYSTEMS
Eric Tomishima
and
Ian N. Robertson
Research Report UHM/CEE/11-10
December 2011


i
Abstract
A research study was performed to evaluate two seismic retrofit schemes proposed
to improve the lateral resistance of post and pier foundation homes in Hawaii. The
retrofit designs are based on a FEMA funded report by UH Manoa and Martin & Chock,
Inc. developed after the Kiholo Bay Earthquake on Hawaii Island in October 2006. The
first retrofit scheme involved anchoring the posts to the pier foundation and installing
metal plate connectors at all joints in the post and pier framing. The second retrofit
scheme involved adding new shear walls, using 2x4 studs with plywood sheathing, and a
new plywood sub diaphragm to the existing floor system, and pouring new cast-in-place
concrete footings. The retrofitted post and pier foundations were subjected to cyclic
lateral loading simulating seismic ground shaking to compare their performance with that
of an un-retrofitted control specimen. In addition to validating the two retrofit designs,
this project will develop a video tool to encourage implementation of these retrofits by
homeowners. The video will be posted on appropriate websites and combined with an
assisting web-based expert system for selection of the retrofit system.
Each test specimen represented a 6 foot by 12 foot, 1 bay wide by 2 bay long post
and pier floor system on isolated footings. The specimens were loaded laterally using a
hydraulic actuator to apply 10 cycles at various displacement amplitudes at a frequency
of 1Hz. The displacement amplitude was increased each time the frame was loaded until
a structural failure of the specimen was observed.
When loaded with approximately the same cyclic lateral loading as the failure load
of the un-retrofitted frame, both retrofit option 1 and retrofit option 2 showed no signs of
failure. Retrofit 1 with the hold-downs, ties and straps installed at all the foundation
blocks, posts, and braces performed as designed, as did retrofit 2 with plywood shear
walls and sub diaphragm. Based on the performance of a partially retrofitted foundation,
it was determined that a partial retrofit anchoring only the post to the foundation blocks
appeared to be detrimental to the seismic performance of the assembly.

ii
Acknowledgements
This report is based on Masters Plan B research performed by Eric Tomishima
under the direction of Dr. Ian Robertson. The authors wish to thank Drs. David Ma and
H. Ronald Riggs for their assistance in reviewing this report. The authors also wish to
thank Jerry Doctolero and Al Pascual from Integrated Construction, Inc., and Steve
Kawachi, Wayne Kawachi, Ronald Tomishima, Reef Ozaki-Train, and Steven Mitsuyuki
for help with construction of the test specimens. The authors also wish to recognize Mel
Yasuda from White Cap, Wes Oda from Industrial Hardware, Howard Inouye from
Precast Inc, and Paul Adachi Jr., Neal Adachi and Eric Mastumoto from Paul’s Electrical
Contracting Inc. for their generous donations of building materials.
This project was funded by a grant from the Federal Emergency Management
Agency, FEMA, through the Hawaii State Civil Defense. This funding is gratefully
acknowledged. The findings and opinions in this report are those of the authors, and do
not necessarily reflect those of the funding agencies.

iii
Table of Contents
EVALUATION OF SEISMIC RETROFITS ................................................................... i
FOR POST AND PIER FOUNDATION SYSTEMS ...................................................... i
1. Introduction ...............................................................................................................1
1.1 Background .................................................................................................. 1 1.2 Objectives ..................................................................................................... 1 1.3 Project Scope ................................................................................................ 2
2. Literature Review......................................................................................................3
3. Project Description ....................................................................................................4
3.1 Test Specimens ............................................................................................ 4 3.1.1 Specimen 1 - Control.................................................................... 4
3.2 Specimen 2 – Partial Retrofit ....................................................................... 7 3.3 Specimen 3 - Retrofit Scheme 1 .................................................................. 9 3.4 Specimen 4 - Retrofit Scheme 2 ................................................................ 14 3.5 Test Set up .................................................................................................. 18
3.5.1 Gravity Loading ......................................................................... 18 3.5.2 Lateral Loading .......................................................................... 18
4. Results 22
4.1 Control Specimen ....................................................................................... 22 4.2 Partial Retrofit Specimen ........................................................................... 27 4.3 Retrofit 1 Specimen.................................................................................... 32 4.4 Retrofit 2 Specimen.................................................................................... 37 4.5 Specimen Comparison ............................................................................... 41
5. Summary and Conclusions .....................................................................................45
iv
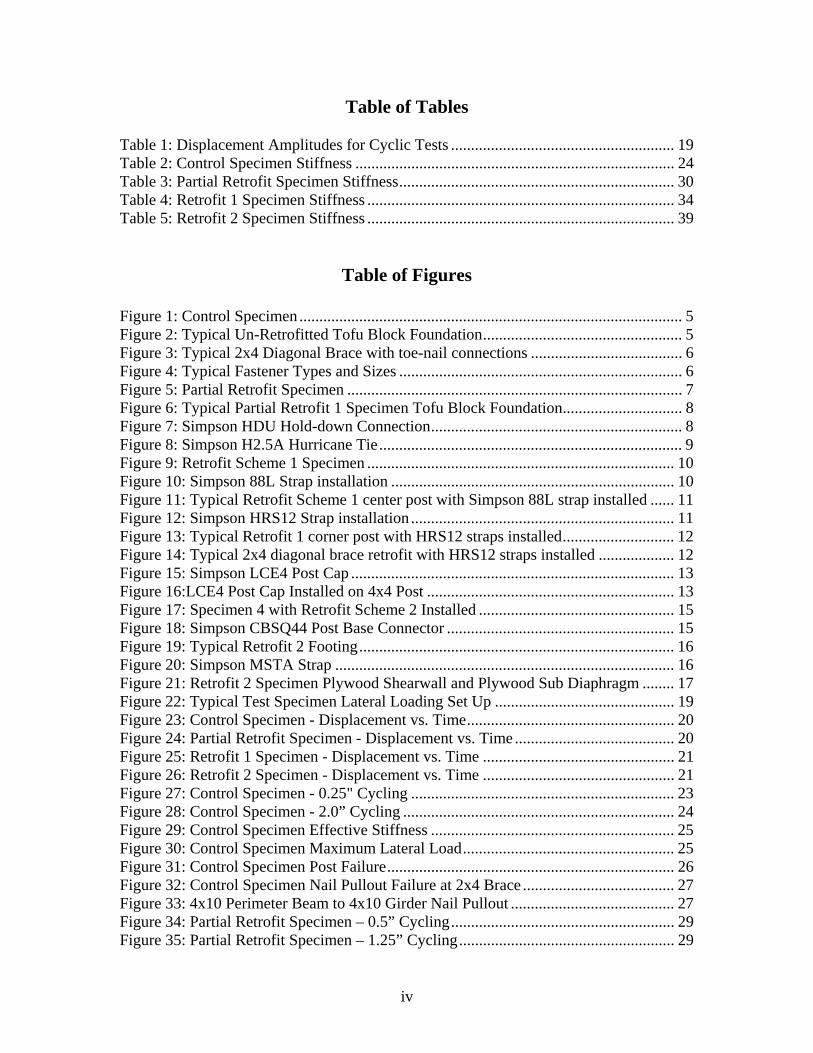
Table of Tables Table 1: Displacement Amplitudes for Cyclic Tests ........................................................ 19 Table 2: Control Specimen Stiffness ................................................................................ 24 Table 3: Partial Retrofit Specimen Stiffness ..................................................................... 30 Table 4: Retrofit 1 Specimen Stiffness ............................................................................. 34 Table 5: Retrofit 2 Specimen Stiffness ............................................................................. 39
Table of Figures
Figure 1: Control Specimen ................................................................................................ 5 Figure 2: Typical Un-Retrofitted Tofu Block Foundation .................................................. 5 Figure 3: Typical 2x4 Diagonal Brace with toe-nail connections ...................................... 6 Figure 4: Typical Fastener Types and Sizes ....................................................................... 6 Figure 5: Partial Retrofit Specimen .................................................................................... 7 Figure 6: Typical Partial Retrofit 1 Specimen Tofu Block Foundation .............................. 8 Figure 7: Simpson HDU Hold-down Connection ............................................................... 8 Figure 8: Simpson H2.5A Hurricane Tie ............................................................................ 9 Figure 9: Retrofit Scheme 1 Specimen ............................................................................. 10 Figure 10: Simpson 88L Strap installation ....................................................................... 10 Figure 11: Typical Retrofit Scheme 1 center post with Simpson 88L strap installed ...... 11 Figure 12: Simpson HRS12 Strap installation .................................................................. 11 Figure 13: Typical Retrofit 1 corner post with HRS12 straps installed ............................ 12 Figure 14: Typical 2x4 diagonal brace retrofit with HRS12 straps installed ................... 12 Figure 15: Simpson LCE4 Post Cap ................................................................................. 13 Figure 16:LCE4 Post Cap Installed on 4x4 Post .............................................................. 13 Figure 17: Specimen 4 with Retrofit Scheme 2 Installed ................................................. 15 Figure 18: Simpson CBSQ44 Post Base Connector ......................................................... 15 Figure 19: Typical Retrofit 2 Footing ............................................................................... 16 Figure 20: Simpson MSTA Strap ..................................................................................... 16 Figure 21: Retrofit 2 Specimen Plywood Shearwall and Plywood Sub Diaphragm ........ 17 Figure 22: Typical Test Specimen Lateral Loading Set Up ............................................. 19 Figure 23: Control Specimen - Displacement vs. Time .................................................... 20 Figure 24: Partial Retrofit Specimen - Displacement vs. Time ........................................ 20 Figure 25: Retrofit 1 Specimen - Displacement vs. Time ................................................ 21 Figure 26: Retrofit 2 Specimen - Displacement vs. Time ................................................ 21 Figure 27: Control Specimen - 0.25" Cycling .................................................................. 23 Figure 28: Control Specimen - 2.0” Cycling .................................................................... 24 Figure 29: Control Specimen Effective Stiffness ............................................................. 25 Figure 30: Control Specimen Maximum Lateral Load ..................................................... 25 Figure 31: Control Specimen Post Failure ........................................................................ 26 Figure 32: Control Specimen Nail Pullout Failure at 2x4 Brace ...................................... 27 Figure 33: 4x10 Perimeter Beam to 4x10 Girder Nail Pullout ......................................... 27 Figure 34: Partial Retrofit Specimen – 0.5” Cycling ........................................................ 29 Figure 35: Partial Retrofit Specimen – 1.25” Cycling ...................................................... 29

v
Figure 36: Partial Retrofit Effective Stiffness .................................................................. 30 Figure 37: Partial Retrofit Specimen Maximum Lateral Load ......................................... 31 Figure 38: Partial Retrofit Specimen Nail Pullout ............................................................ 31 Figure 39: 4x10 Perimeter Beam to 4x10 Girder Toe-nail Pull Out ................................. 32 Figure 40: Retrofit 1 Specimen – 0.5" Cycling ................................................................ 33 Figure 41: Retrofit 1 Specimen – 1.5” Cycling ................................................................ 33 Figure 42: Retrofit 1 Specimen Effective Stiffness .......................................................... 34 Figure 43: Retrofit 1 Specimen Maximum Lateral Load .................................................. 35 Figure 44: Retrofit 1 Specimen Monotonic Pushover Test .............................................. 35 Figure 45: HDU5 separation from 2x4 Blocking Separation From 4x4 Posts ................. 36 Figure 46: 4x10 Perimeter Beam to 4x10 Girder Nail Pullout ......................................... 37 Figure 47: Retrofit 2 Specimen – 0.35” Cycling .............................................................. 38 Figure 48: Retrofit 2 Specimen – 2.5” Cycling ................................................................ 38 Figure 49: Retrofit 2 Specimen Effective Stiffness .......................................................... 40 Figure 50: Retrofit 2 Specimen Maximum Lateral Load .................................................. 40 Figure 51: Plywood Shearwall Edge Nailing Shear Failure ............................................. 41 Figure 52: Specimen Comparison – 0.5” Cycling ............................................................ 42 Figure 53: Specimen Comparison – 1.5” Cycling ............................................................ 43 Figure 54: Specimen Comparison Effective Stiffness (+) ................................................ 43 Figure 55: Specimen Comparison Effective Stiffness (-) ................................................. 44 Figure 56: Specimen Comparison Maximum Lateral Load (+) ....................................... 44 Figure 57: Specimen Comparison Maximum Lateral Load (-) ........................................ 45 Figure 58: Control Specimen – 0.5” Cycling .................................................................... 49 Figure 59: Control Specimen – 1.0” Cycling .................................................................... 49 Figure 60: Control Specimen - 1.5” Cycling .................................................................... 50 Figure 61: Partial Retrofit Specimen - 0.25” Cycling....................................................... 50 Figure 62: Partial Retrofit Specimen – 0.35” Cycling ...................................................... 51 Figure 63: Partial Retrofit Specimen – 1.0” Cycling ........................................................ 51 Figure 64: Partial Retrofit Specimen – 0.75” Cycling ...................................................... 52 Figure 65: Partial Retrofit Specimen – 1.5” Cycling ........................................................ 52 Figure 66: Retrofit 1 Specimen – 0.25” Cycling .............................................................. 53 Figure 67: Retrofit 1 Specimen – 0.35” Cycling .............................................................. 53 Figure 68: Retrofit 1 Specimen – 0.75” Cycling .............................................................. 54 Figure 69: Retrofit 1 Specimen – 1.0” Cycling ................................................................ 54 Figure 70: Retrofit 1 Specimen – 1.25” Cycling .............................................................. 55 Figure 71: Retrofit 2 Specimen – 0.1” Cycling ................................................................ 55 Figure 72: Retrofit 2 Specimen – 0.15” Cycling .............................................................. 56 Figure 73: Retrofit 2 Specimen – 0.2” Cycling ................................................................ 56 Figure 74: Retrofit 2 Specimen – 0.25” Cycling .............................................................. 57 Figure 75: Retrofit 2 Specimen – 0.30” Cycling .............................................................. 57 Figure 76: Retrofit 2 Specimen – 0.40” Cycling .............................................................. 58 Figure 77: Retrofit 2 Specimen- 0.50” Cycling ................................................................ 58 Figure 78: Retrofit 2 Specimen – 0.60” Cycling .............................................................. 59 Figure 79: Retrofit 2 Specimen – 0.75” Cycling .............................................................. 59 Figure 80: Retrofit 2 Specimen – 0.875” Cycling ............................................................ 60 Figure 81: Retrofit 2 Specimen – 1.0” Cycling ................................................................ 60

vi
Figure 82: Retrofit 2 Specimen – 1.125” Cycling ............................................................ 61 Figure 83: Retrofit 2 Specimen – 1.25” Cycling .............................................................. 61 Figure 84: Retrofit 2 Specimen – 1.375” Cycling ............................................................ 62 Figure 85: Retrofit 2 Specimen – 1.5” Cycling ................................................................ 62 Figure 86: Retrofit 2 Specimen – 1.75” Cycling .............................................................. 63 Figure 87: Retrofit 2 Specimen – 2.0” Cycling ................................................................ 63

1
1. Introduction
1.1 Background
The October 15th, 2006 earthquakes off the Northwest coast of Hawaii Island with a
maximum recorded moment magnitude of 6.7 highlighted the vulnerability of post and
pier residential construction to major damage during an earthquake (USGS 2006).
Approximately 30% of the total housing inventory of the County of Hawaii, or about
15,000 residences, utilizes a post and pier supported elevated first floor (Robertson and
Chock 2009). Many of these buildings are also single wall construction, where the
bottom of the exterior wallboard is nailed to a rim joist or sill beam, transferring the roof
and wall load by vertical shear through the nails, rather than by bearing. The first floor
framing is supported by individual posts, commonly spaced between 8 and 12 feet on
center in both directions. Each individual post is supported on unanchored small concrete
blocks locally known as “tofu blocks” which in turn rest on 16”x16”x7” unreinforced
concrete foundation blocks that have little or no embedment into the soil. The soft-story
lateral resisting “system” below the first floor consists of toe-nailed 2x4 braces in each
direction from the posts to the main floor framing members. In more recent construction,
conventional wood stud and light-gage steel double wall framed homes are often still
elevated on post and pier foundations for economy and convenience. Connections
between the post and pier framing members typically have minimal uplift and lateral
capacity. Based on Hawaii’s historic building code provisions and property tax records,
less than 10% of post and pier homes are estimated to have utilized metal plate
connectors and straps for lateral resistance; the remainder are framed using only toe-nails
(Robertson and Chock 2009).
1.2 Objectives
The objective of this study was to evaluate the seismic performance of two retrofit
schemes proposed in the report titled, “Structural Seismic Retrofits for Hawaii Single
2
Family Residences with Post and Pier Foundations” by Robertson and Chock (2009).
The first retrofit scheme involves adding metal straps and hold down connectors to an
existing post and pier system to form a complete load path from the existing floor system
down to the foundation. The second retrofit scheme involves adding plywood shear walls
below the first floor with new cast-in-place concrete spread footings, and a new sub-
diaphragm below the floor system to transfer lateral loads to the shear walls.
1.3 Project Scope
Three timber frames were built to test the performance of the post and pier retrofit
schemes. A control specimen was constructed and subjected to lateral loads to simulate a
typical post and pier foundation. The two retrofitted post and pier foundations were
subjected to cyclic lateral loading simulating seismic ground shaking to evaluate their
performance. The performance of the two retrofitted post and pier specimens were
compared against the performance of the control specimen.

3
2. Literature Review
Robertson and Chock (2009) researched the effects of two earthquakes on October
15th, 2006 off the Northwest coast of the island of Hawaii, namely the Kiholo bay
earthquake, and the Mahukona earthquake. Based on their analysis of 53 homes on the
island of Hawaii, three retrofit schemes were created. The retrofits are presented in a
general format that can be applied to a wide range of houses without specific input from a
structural engineer, except in special cases. Retrofit Option 1 is primarily a strengthening
of connections using the existing post and pier foundation system, applicable in regions
of low to moderate seismic hazard and for houses with moderate differential post heights.
Retrofit option 2 uses additional plywood shear walls between the ground and first floor
of the house to provide additional lateral strength and stiffness to the foundation system.
Retrofit option 3 uses additional masonry shear walls between the ground and first floor
of the house to provide additional lateral strength and stiffness to the foundation system.
Retrofit option 3 provides the most strength out of the 3 proposed retrofit schemes,
however is the most expensive and difficult to install.
Based on the report by Robertson and Chock (2009) with the aid of UH Hilo’s ICS
department in 2010, a website called the “Retrofit Expert System” has been created to
help homeowners determine which of the three retrofit options are applicable to their
home. The homeowner will follow some basic steps, such as counting the number of
posts on their homes, the post height and spacing, and enter the information into the
program. Based on the information entered, the Retrofit Expert System will provide the
homeowner with the applicable retrofit schemes, construction drawings to follow, as well
as a list of items that are required to complete the retrofit. Due to the difficulty of
installing some of the retrofits, a contractor may be required to assist the homeowner.

4
3. Project Description
3.1 Test Specimens
3.1.1 Specimen 1 - Control
The control specimen was a 12 foot long by 6 foot wide floor system (Figure 1).
Six 16”x16”x7” thick standard concrete foundation blocks with smaller 7”x7”x4”
concrete blocks (“tofu” blocks) placed on top were used as the main foundation (Figure
2). The foundation blocks were embedded 4 inches into a 10 foot x 4 foot x 6 inch deep
soil bed. The soil was compacted using a pneumatic pole tamper or a “pogo” stick.
Metal termite barriers were placed on top of the smaller “tofu” block (Figure 2). The
4x4 posts were placed on the termite shields with no connection to the precast concrete
foundation blocks below. This is typical of existing post and pier foundations in Hawaii.
The top of the posts were toe-nailed to the 4x10 girders with 3-16d (0.162” diameter by
3½” long) common box nails. The floor was framed with 2x10 joists spaced at 24 inches
on center placed on top of the three main 4x10 girders with 4x10 perimeter beams and a
2x10 fascia. The 2x10 joists and the 4x10 perimeter beams were toe-nailed to the 4x10
girders with 2-16d common box nails. The 2x10 fascia was face nailed to the 4x10
perimeter beams and the 2x10 joists with 3-16d common box nails. All posts were
braced in all directions by 2x4 diagonal braces toe-nailed to the 4x10 girder and
perimeter beams using two 16d common box nails at each end of the brace (Figure 3).
The floor diaphragm consisted of 3/4” thick plywood sheathing with 10d (0.148”
diameter by 3” long) common box nails at 4 inches on center around the panel edges and
12 inches on center along the joists. See Figure 4 for typical fasteners used in
construction of the test specimens.

5
Figure 1: Control Specimen
Figure 2: Typical Un-Retrofitted Tofu Block Foundation

6
Figure 3: Typical 2x4 Diagonal Brace with toe-nail connections
Figure 4: Typical Fastener Types and Sizes

7
3.2 Specimen 2 – Partial Retrofit
After testing, the control specimen was retrofitted with Simpson HDU5 hold-downs
on each side of the 4x4 posts to connect the posts to the foundation blocks (Figure 5,
Figure 6 and Figure 7). Simpson H2.5A hurricane ties were installed at each joist to
beam connection (Figure 8). The Simpson HDU5 connectors were installed per the
manufacturer’s recommendations with a 5/8” diameter threaded rod drilled and epoxied
with a 4 inch embedment into the 16” x 16” masonry foundation blocks with Hilti HY-
150 Max. Spacers made from 2x4 blocking were installed on either side of the 4x4 post
with 4-10d common box nails, so that the HDU5 hold-down would clear the “tofu” block.
Due to the dimension of the smaller tofu block, on one side of the 4x4 post an additional
½” thick piece of plywood was added in addition to the 2x4 blocking. The HDU5 hold-
down was connected to the 2x4 blocking and the 4x4 post with 14- ¼” diameter by 2 ½”
long Simpson SDS screws. The braces were left with toe-nail connections at both ends.
The post to beam connection was left with the original toe-nail connection. Everything
else remained the same as in the un-retrofitted control specimen.
Figure 5: Partial Retrofit Specimen

8
Figure 6: Typical Partial Retrofit 1 Specimen Tofu Block Foundation
Figure 7: Simpson HDU Hold-down Connection

9
Figure 8: Simpson H2.5A Hurricane Tie
3.3 Specimen 3 - Retrofit Scheme 1
After testing the partial retrofit, the specimen was retrofitted with the complete
retrofit scheme 1 (Figure 9). Simpson Strongtie connectors were installed to connect the
4x4 posts to the 4x10 girder and perimeter beams and at both ends of the 2x4 diagonal
knee braces. Simpson 88L straps were added on both sides of the interior brace to post
connections (Figure 10 and Figure 11). In order to accommodate nailing for the 88L
straps, 2x4 blocking was added to the end of the braces near the post connection with 4-
10d nails by 3 inches long (Figure 10 and Figure 11). At interior diagonal bracing
conditions, the added 2x4 blocking could not be installed without completely removing
both of the braces as shown in Figure 10.
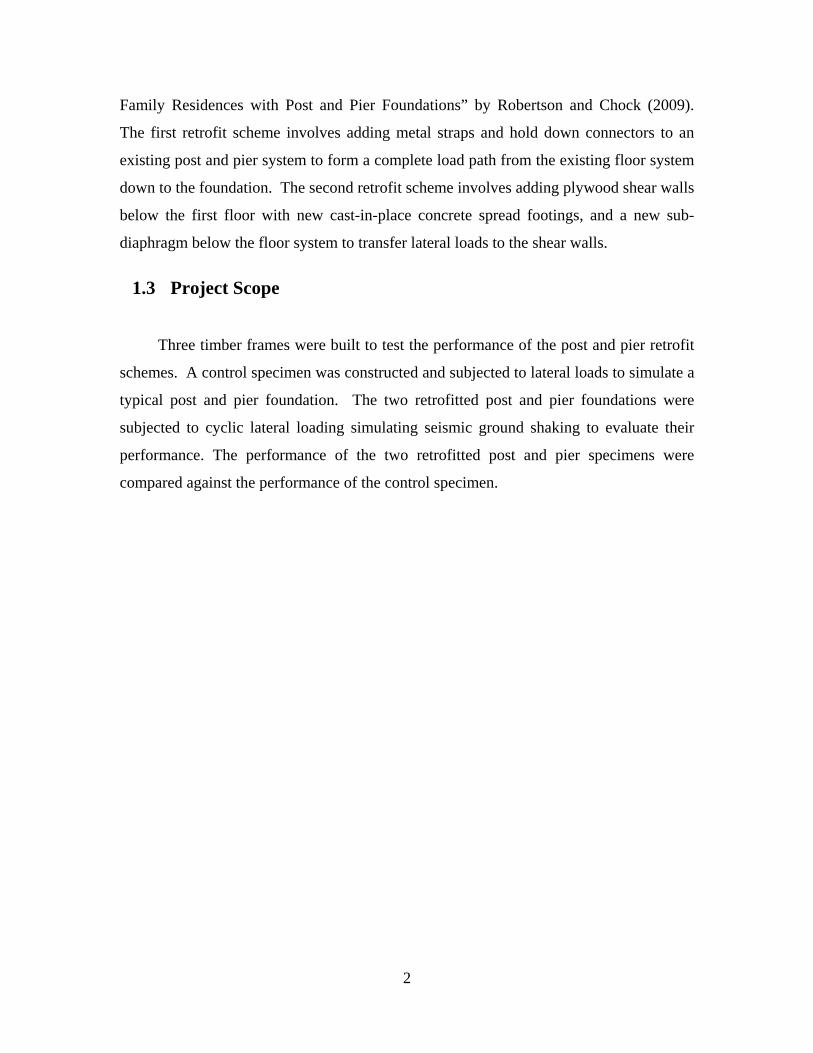
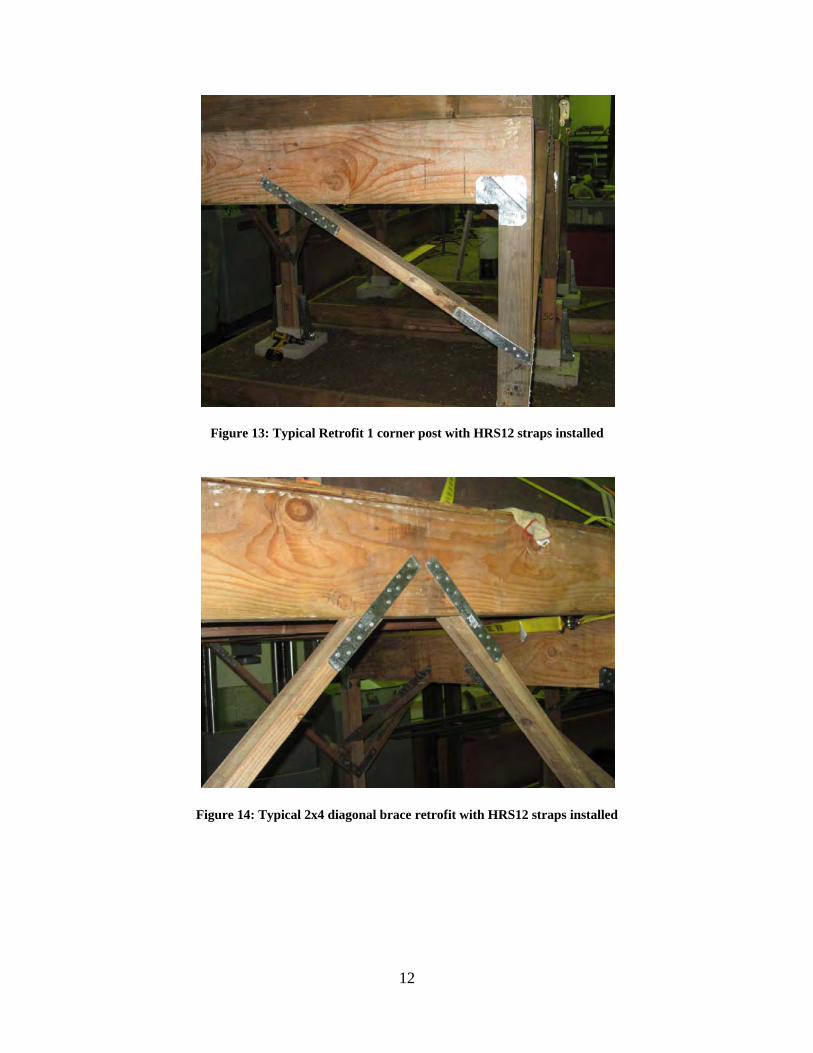
Simpson HRS12 straps were added to both sides of the brace where the brace was
only in one direction (Figure 12 and Figure 13) and at the brace to beam connections
(Figure 14). Simpson LCE4 post caps were installed on both sides at all 4x4 post to 4x10
beam connections (
Figure 15 and
Figure 16). All other connections not mentioned above remained the same as in the
partial retrofit specimen.

10
Figure 9: Retrofit Scheme 1 Specimen
Figure 10: Simpson 88L Strap installation

11
Figure 11: Typical Retrofit Scheme 1 center post with Simpson 88L strap installed
Figure 12: Simpson HRS12 Strap installation
12
Figure 13: Typical Retrofit 1 corner post with HRS12 straps installed
Figure 14: Typical 2x4 diagonal brace retrofit with HRS12 straps installed

13
Figure 15: Simpson LCE4 Post Cap
Figure 16:LCE4 Post Cap Installed on 4x4 Post
14
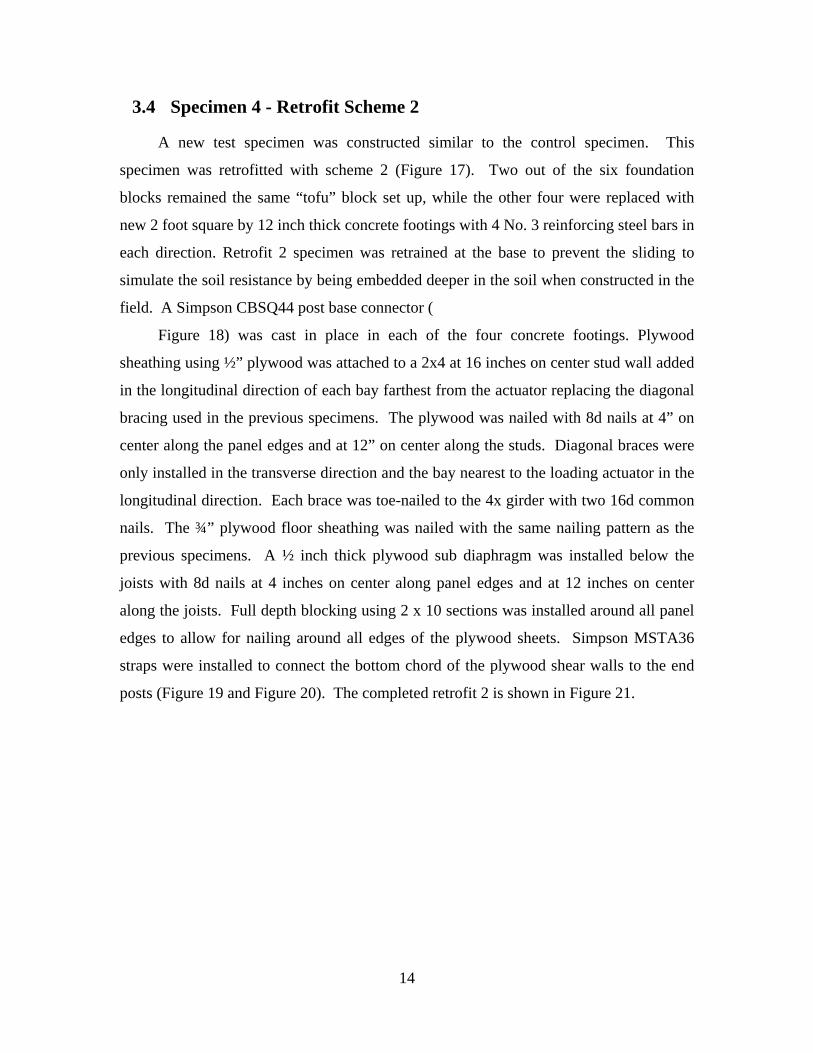
3.4 Specimen 4 - Retrofit Scheme 2
A new test specimen was constructed similar to the control specimen. This
specimen was retrofitted with scheme 2 (Figure 17). Two out of the six foundation
blocks remained the same “tofu” block set up, while the other four were replaced with
new 2 foot square by 12 inch thick concrete footings with 4 No. 3 reinforcing steel bars in
each direction. Retrofit 2 specimen was retrained at the base to prevent the sliding to
simulate the soil resistance by being embedded deeper in the soil when constructed in the
field. A Simpson CBSQ44 post base connector (
Figure 18) was cast in place in each of the four concrete footings. Plywood
sheathing using ½” plywood was attached to a 2x4 at 16 inches on center stud wall added
in the longitudinal direction of each bay farthest from the actuator replacing the diagonal
bracing used in the previous specimens. The plywood was nailed with 8d nails at 4” on
center along the panel edges and at 12” on center along the studs. Diagonal braces were
only installed in the transverse direction and the bay nearest to the loading actuator in the
longitudinal direction. Each brace was toe-nailed to the 4x girder with two 16d common
nails. The ¾” plywood floor sheathing was nailed with the same nailing pattern as the
previous specimens. A ½ inch thick plywood sub diaphragm was installed below the
joists with 8d nails at 4 inches on center along panel edges and at 12 inches on center
along the joists. Full depth blocking using 2 x 10 sections was installed around all panel
edges to allow for nailing around all edges of the plywood sheets. Simpson MSTA36
straps were installed to connect the bottom chord of the plywood shear walls to the end
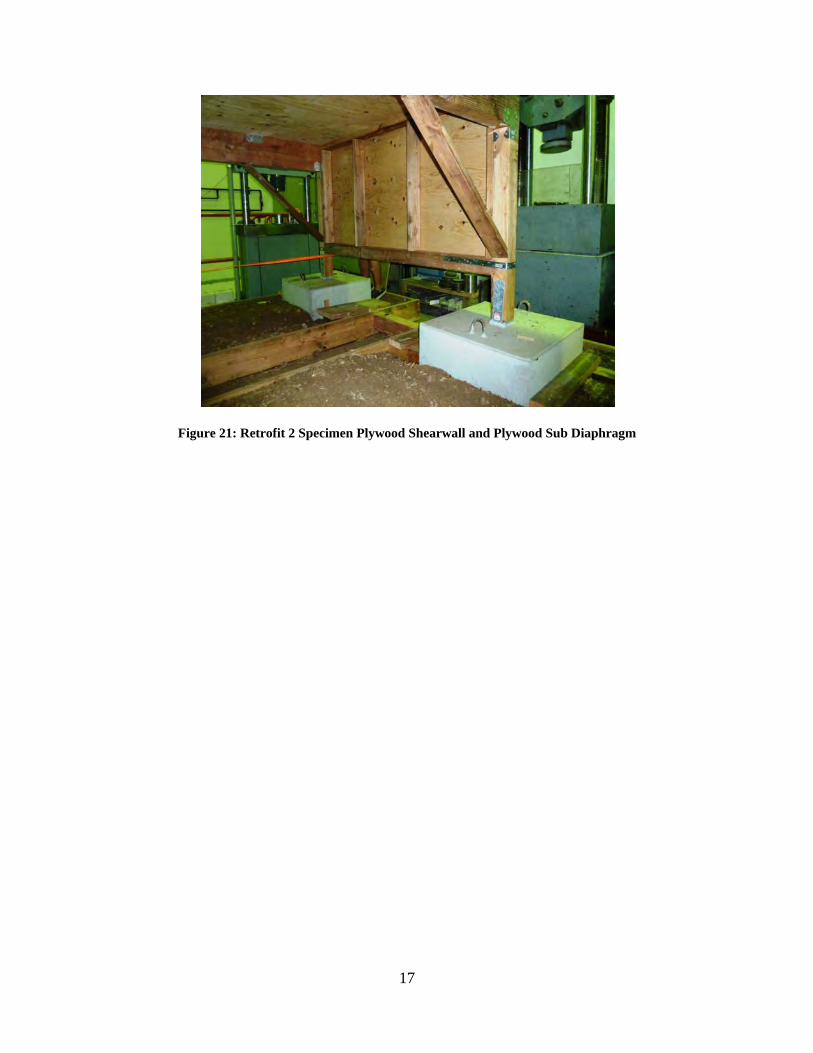
posts (Figure 19 and Figure 20). The completed retrofit 2 is shown in Figure 21.

15
Figure 17: Specimen 4 with Retrofit Scheme 2 Installed
Figure 18: Simpson CBSQ44 Post Base Connector

16
Figure 19: Typical Retrofit 2 Footing
Figure 20: Simpson MSTA Strap
17
Figure 21: Retrofit 2 Specimen Plywood Shearwall and Plywood Sub Diaphragm

18
3.5 Test Set up
3.5.1 Gravity Loading
To simulate dead loads applied to the post and pier foundation system from the
weight of the walls, floors and roof above, structural steel wide flange beams weighing a
total of 2,364 pounds were added to the top of the test specimens. The beams were
secured to the floor framing using straps to avoid movement when the lateral loading was
applied. The equivalent loading on the 6 foot by 12 foot floor was approximately 33
pounds per square foot (psf). This represents a reasonable dead weight of a single family
residence.
3.5.2 Lateral Loading
A 30,000 pound hydraulic actuator was used to apply cyclic displacements to each
test specimen. The actuator applied 10 cycles of each amplitude displacement at 1Hz,
increasing the amplitude after each test until failure. After each series of 10 cycles the
specimens were inspected for any visible signs of structural damage before increasing the
lateral displacement. During each segment the applied load and lateral displacement at
the load application point were recorded by a load cell and displacement transducer in the
load actuator. Cycling amplitudes for each of the specimens are shown in Table 1.
Actual displacement versus time graphs were compared to the theoretical displacement
time graphs for the typical 1.0 inch cyclic lateral loading for each test specimen to ensure
that the hydraulic actuator was providing the correct amount of displacement to the
specimens (Figure 23, Figure 24, Figure 25 and Figure 26).

19
Figure 22: Typical Test Specimen Lateral Loading Set Up
Test Series
Control Specimen Disp (in)
Partial Retrofit
Specimen Disp (in)
Retrofit Specimen
1 Disp (in)
Retrofit Specimen
2 Disp (in)
1 0.25 0.25 0.25 0.25 2 0.5 0.35 0.35 0.1 3 1 0.5 0.5 0.15 4 1.5 0.75 0.75 0.2 5 2 1 1 0.3 6 1.25 1.25 0.35 7 1.5 1.5 0.4 8 0.5 9 0.6 10 0.75 11 0.875 12 1 13 1.125 14 1.25 15 1.375 16 1.5 17 1.75 18 2 19 2.5
Table 1: Displacement Amplitudes for Cyclic Tests

20
Figure 23: Control Specimen - Displacement vs. Time
Figure 24: Partial Retrofit Specimen - Displacement vs. Time

21
Figure 25: Retrofit 1 Specimen - Displacement vs. Time
Figure 26: Retrofit 2 Specimen - Displacement vs. Time

22
4. Results
4.1 Control Specimen
When loaded laterally, the control specimen appeared to slide back and forth within
the foundation on the metal termite shield. When the post began to slip off the termite
shield it created an oscillation in the force displacement plot curve which can be seen in
Figure 27 and Figure 28. The oscillation is caused by the vibration of the posts as they
slip on the foundation. The graphs represent the hysteric response of the specimen.
Hysteric plots for all levels of cycling are included in the appendix. Stiffness is the
relationship of the applied lateral displacement and the lateral force experienced by the
specimen. The initial and effective stiffness of the control specimen and maximum
resisted load, are shown in Table 2 for each of the cyclic tests.

23
Figure 29 shows the decay of the effective stiffness of the specimen as the lateral
displacement is increased. Figure 30 shows the maximum lateral load resisted by the
foundation system during each set of 10cycles at increasing displacements.
Figure 27: Control Specimen - 0.25" Cycling

24
Figure 28: Control Specimen - 2.0” Cycling
Control Specimen Stiffness Max Lateral
Load
Lateral Load / Approximate
Weight
Test Displacement Amplitude (in)
Initial (k/in)
Effective (+)
(k/in) Effective (-) (k/in) + (kip) - (kip)
+ -
1 0.25 14.41 3.32 -3.81 0.91 -1.22 0.30 0.41 2 0.5 17.58 2.45 -2.38 1.25 -1.19 0.42 0.40 3 1 23.8 1.25 -1.01 1.64 -1.73 0.55 0.58 4 1.5 16.15 0.73 -0.67 3.00 -2.59 1.00 0.86 5 2 13.37 0.48 -0.63 3.16 -3.38 1.05 1.13
Table 2: Control Specimen Stiffness

25
Figure 29: Control Specimen Effective Stiffness
Figure 30: Control Specimen Maximum Lateral Load
26
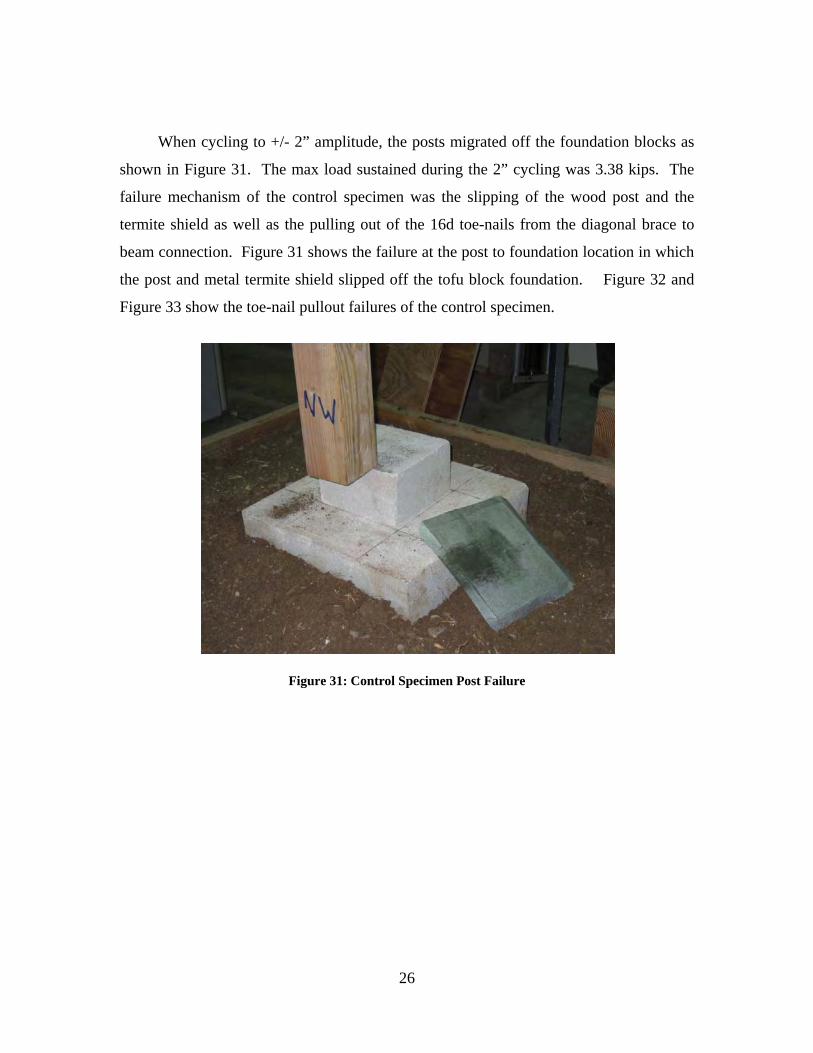
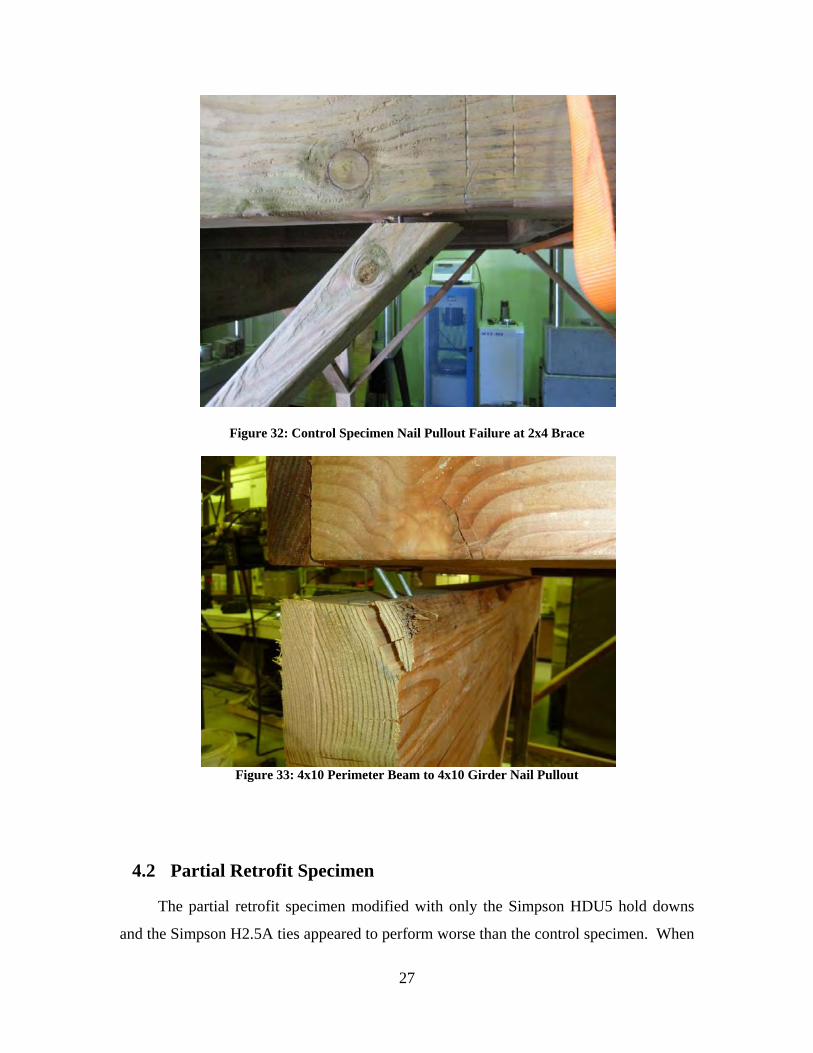
When cycling to +/- 2” amplitude, the posts migrated off the foundation blocks as
shown in Figure 31. The max load sustained during the 2” cycling was 3.38 kips. The
failure mechanism of the control specimen was the slipping of the wood post and the
termite shield as well as the pulling out of the 16d toe-nails from the diagonal brace to
beam connection. Figure 31 shows the failure at the post to foundation location in which
the post and metal termite shield slipped off the tofu block foundation. Figure 32 and
Figure 33 show the toe-nail pullout failures of the control specimen.
Figure 31: Control Specimen Post Failure
27
Figure 32: Control Specimen Nail Pullout Failure at 2x4 Brace
Figure 33: 4x10 Perimeter Beam to 4x10 Girder Nail Pullout
4.2 Partial Retrofit Specimen
The partial retrofit specimen modified with only the Simpson HDU5 hold downs
and the Simpson H2.5A ties appeared to perform worse than the control specimen. When

28
loading the frame, the max sustained load was approximately 2.5 kips during 1.5” cycling
at 1Hz. The frame was not loaded beyond 1.5” so as to prevent additional damage to the
specimen as it needed to be modified for retrofit specimen 1. There was a significant
decrease in the amount of movement in the frame due to the HDU5 hold downs which
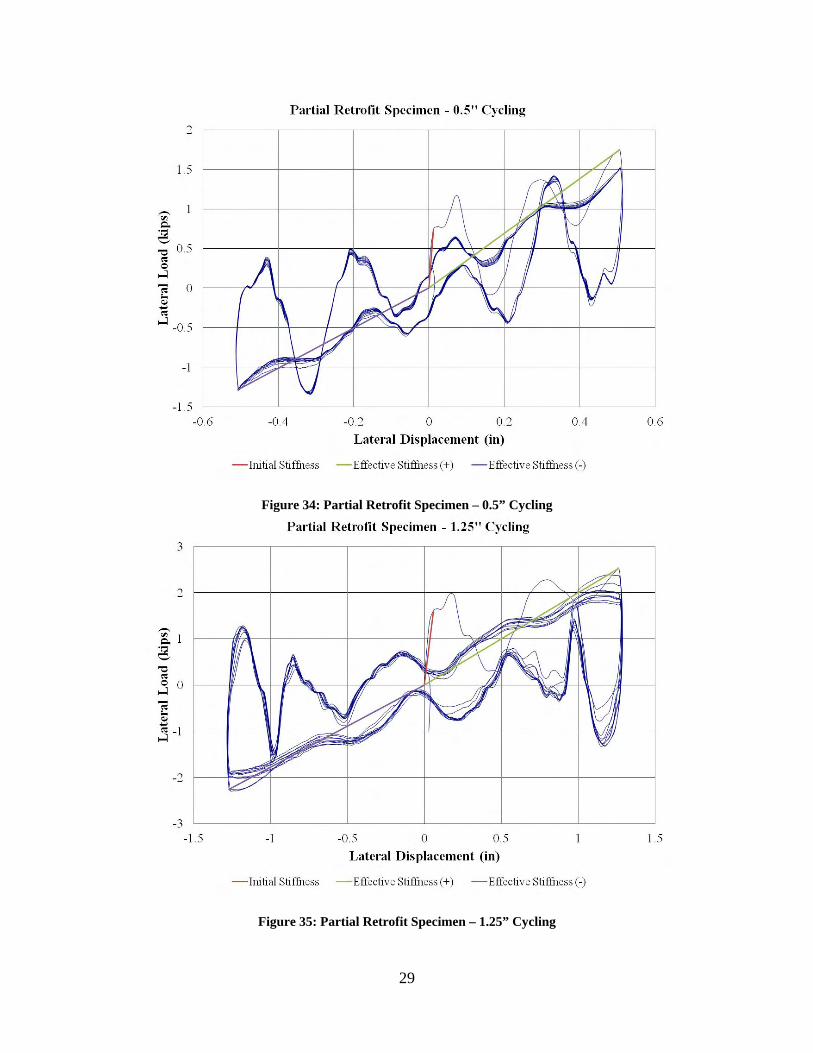
prevented the 4x4 posts from sliding on the foundation blocks. The oscillation seen in
Figure 34 and Figure 35 can be attributed to movement of the foundation blocks in the
soil. Under the cycling lateral loading, the soil was displaced, therefore providing very
little passive lateral resistance. The shifting of the footing caused a reduction in the
lateral load applied to the specimen by the actuator. The effective stiffness compared to
the control specimen was slightly higher due to the added hold-downs restraining the
slipping of the 4x4 posts from the tofu block foundation. The initial and effective
stiffness of the partial retrofit specimen are shown in
Partial Retrofit Specimen Stiffness
Max Lateral Load
Lateral Load / Approximate
Weight
Test Displacement Amplitude (in)
Initial (k/in)
Effective (+)
(k/in)
Effective (-) (k/in)
+ (kip) - (kip) + -
1 0.25 37.32 4.07 -2.86 1.02 -0.71 0.34 0.24 2 0.35 44.91 3.87 -2.89 1.35 -1.01 0.45 0.34 3 0.5 66.4 3.49 -2.57 1.75 -1.29 0.58 0.43 4 0.75 50.7 2.94 -2.28 2.21 -1.71 0.74 0.57 5 1 28.52 2.42 -2.07 2.42 -2.07 0.81 0.69 6 1.25 27.59 2.02 -1.81 2.53 -2.26 0.84 0.75 7 1.5 18.45 1.55 -1.49 2.32 -2.23 0.77 0.74
Table 3 along with the maximum lateral load resisted during each set of cycling.
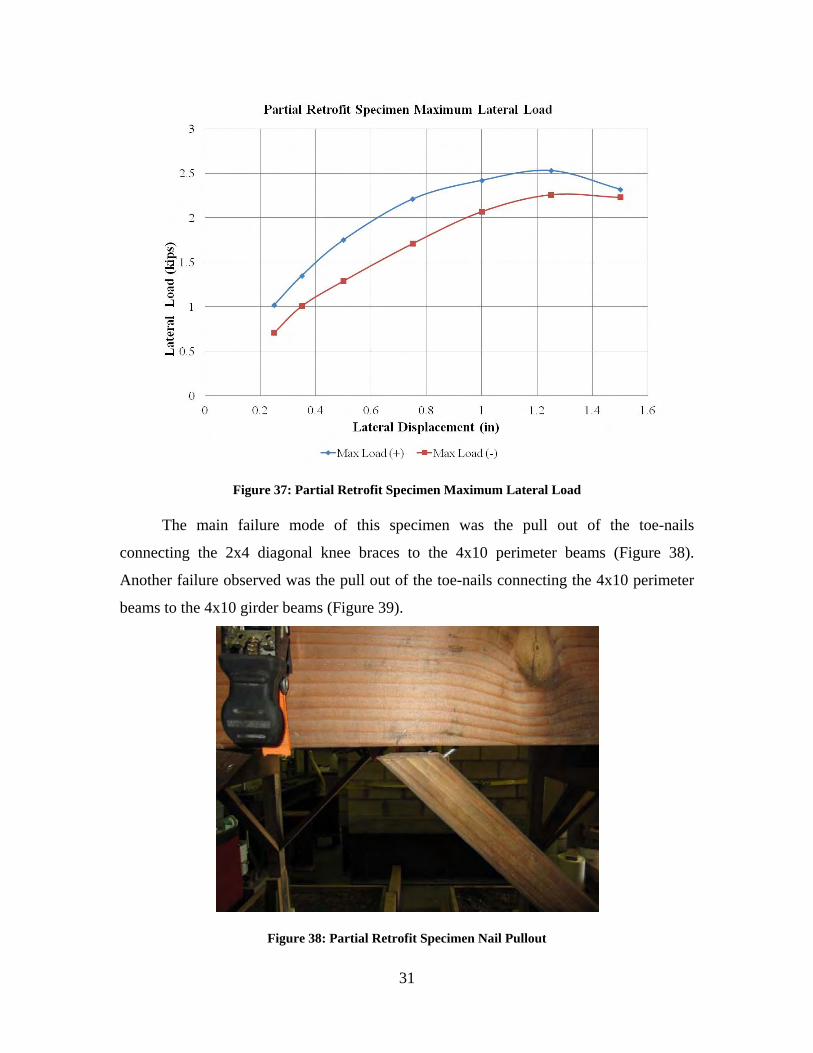
Figure 36 shows the decay in effective stiffness as the cycling amplitude increases, while
Figure 37 shows the change in maximum resisted load. The drop in lateral load capacity
during the 1.5” cycling was attributed to the pull-out of the toe-nails.
29
Figure 34: Partial Retrofit Specimen – 0.5” Cycling
Figure 35: Partial Retrofit Specimen – 1.25” Cycling

30
Partial Retrofit Specimen Stiffness
Max Lateral Load
Lateral Load / Approximate
Weight
Test Displacement Amplitude (in)
Initial (k/in)
Effective (+)
(k/in)
Effective (-) (k/in)
+ (kip) - (kip) + -
1 0.25 37.32 4.07 -2.86 1.02 -0.71 0.34 0.24 2 0.35 44.91 3.87 -2.89 1.35 -1.01 0.45 0.34 3 0.5 66.4 3.49 -2.57 1.75 -1.29 0.58 0.43 4 0.75 50.7 2.94 -2.28 2.21 -1.71 0.74 0.57 5 1 28.52 2.42 -2.07 2.42 -2.07 0.81 0.69 6 1.25 27.59 2.02 -1.81 2.53 -2.26 0.84 0.75 7 1.5 18.45 1.55 -1.49 2.32 -2.23 0.77 0.74
Table 3: Partial Retrofit Specimen Stiffness
Figure 36: Partial Retrofit Effective Stiffness
31
Figure 37: Partial Retrofit Specimen Maximum Lateral Load
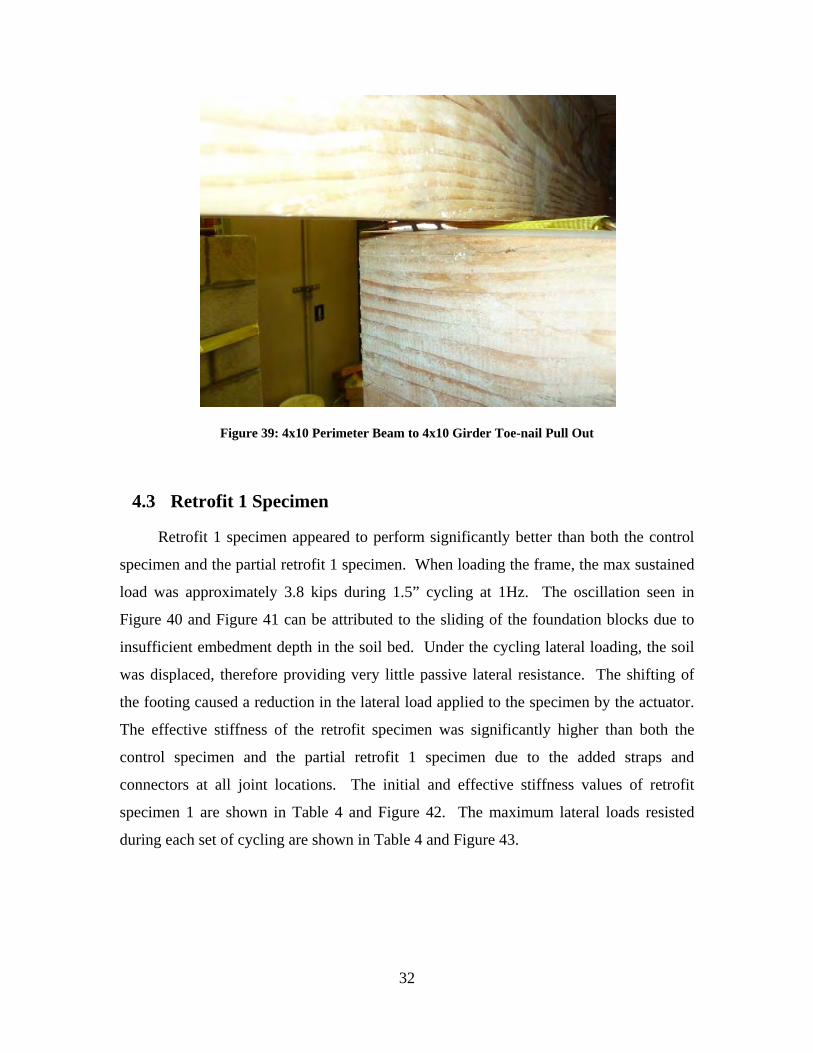
The main failure mode of this specimen was the pull out of the toe-nails
connecting the 2x4 diagonal knee braces to the 4x10 perimeter beams (Figure 38).
Another failure observed was the pull out of the toe-nails connecting the 4x10 perimeter
beams to the 4x10 girder beams (Figure 39).
Figure 38: Partial Retrofit Specimen Nail Pullout
32
Figure 39: 4x10 Perimeter Beam to 4x10 Girder Toe-nail Pull Out
4.3 Retrofit 1 Specimen
Retrofit 1 specimen appeared to perform significantly better than both the control
specimen and the partial retrofit 1 specimen. When loading the frame, the max sustained
load was approximately 3.8 kips during 1.5” cycling at 1Hz. The oscillation seen in
Figure 40 and Figure 41 can be attributed to the sliding of the foundation blocks due to
insufficient embedment depth in the soil bed. Under the cycling lateral loading, the soil
was displaced, therefore providing very little passive lateral resistance. The shifting of
the footing caused a reduction in the lateral load applied to the specimen by the actuator.
The effective stiffness of the retrofit specimen was significantly higher than both the
control specimen and the partial retrofit 1 specimen due to the added straps and
connectors at all joint locations. The initial and effective stiffness values of retrofit
specimen 1 are shown in Table 4 and Figure 42. The maximum lateral loads resisted
during each set of cycling are shown in Table 4 and Figure 43.

33
Figure 40: Retrofit 1 Specimen – 0.5" Cycling
Figure 41: Retrofit 1 Specimen – 1.5” Cycling

34
Retrofit 1 Specimen Stiffness Max Lateral
Load
Lateral Load / Approximate
Weight
Test Displacement Amplitude (in)
Initial (k/in)
Effective (+)
(k/in)
Effective (-) (k/in)
+ (kip) - (kip) + -
1 0.25 37.81 6 -6.44 1.5 -1.61 0.50 0.54 2 0.35 68.51 5.46 -5.95 1.91 -2.08 0.64 0.69 3 0.5 44.31 4.47 -4.49 2.23 -2.25 0.74 0.75 4 0.75 65.73 3.59 -3.21 2.69 -2.41 0.90 0.80 5 1 59.06 3.01 -2.77 3.01 -2.77 1.00 0.92 6 1.25 42.03 2.58 -2.21 3.23 -2.77 1.08 0.92 7 1.5 13.98 2.46 -1.95 3.69 -2.92 1.23 0.97
Table 4: Retrofit 1 Specimen Stiffness
Figure 42: Retrofit 1 Specimen Effective Stiffness

35
Figure 43: Retrofit 1 Specimen Maximum Lateral Load
Figure 44: Retrofit 1 Specimen Monotonic Pushover Test

36
Retrofit 1 showed no signs of structural failure during cyclic lateral load testing.
To determine the maximum resisted strength of the specimen, a monotonic pushover test
was performed (Figure 44). The main failure mode of retrofit 1 specimen during the
monotonic push over test was the failure of the connection between the HDU5 hold
downs and the 4x4 post with the added 2x4 blocking. The 2 ½” long SDS screws were
inadequate to connect the HDU5 through the 2x4 and ½” plywood spacers (Figure 45).
Another failure observed was the pull out of the toe-nails connecting the 4x10 perimeter
beams to the 4x10 girder beams (Figure 46).
Figure 45: HDU5 separation from 2x4 Blocking Separation From 4x4 Posts

37
Figure 46: 4x10 Perimeter Beam to 4x10 Girder Nail Pullout
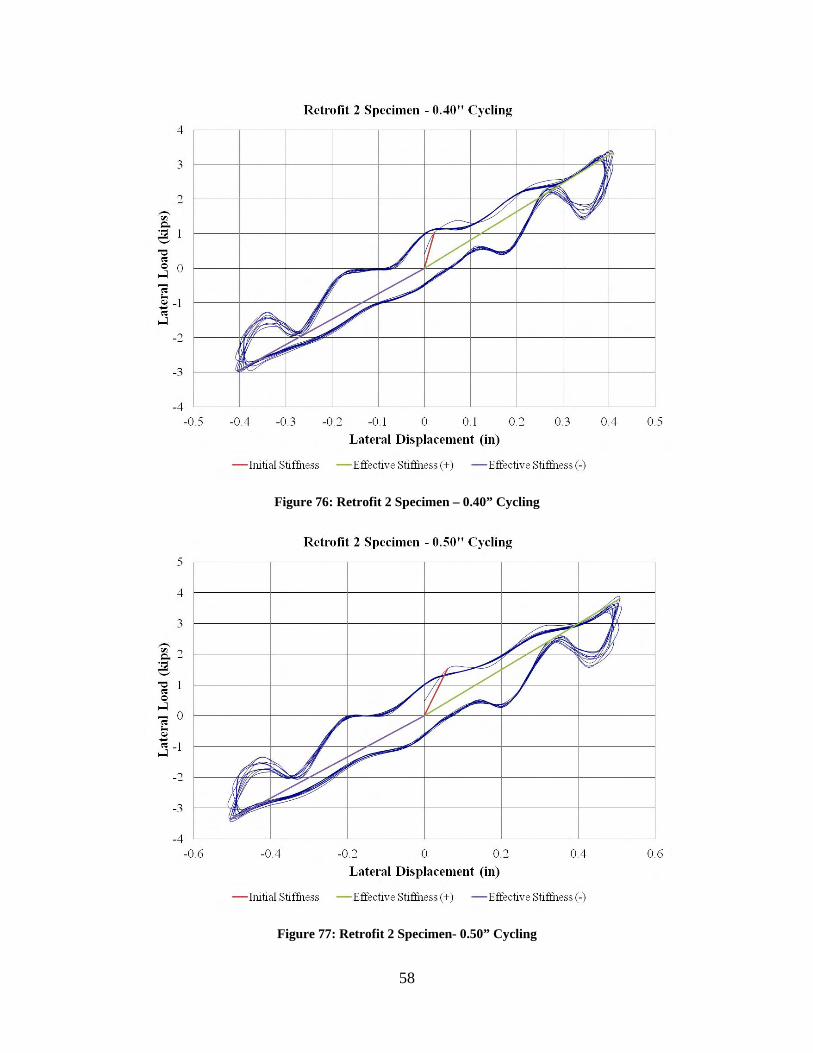
4.4 Retrofit 2 Specimen
Retrofit 2 specimen was modified with plywood shear walls and new cast-in-place
concrete footings. When loading the frame, the maximum sustained load recorded was
approximately 7 kips during 2.5” cycling at 1Hz. The force displacement hysteretic
response for retrofit specimen 2 appears to have little to no oscillation at all
displacements (Figure 47 and Figure 48). The new concrete footings appear to provide
better resistance to sliding than the retrofitted “tofu” block foundation used in the retrofit
scheme 1. Retrofit 2 appeared to be much more rigid than the other specimens. A
similar load to the max load achieved from the control specimen of 3.1 kips was obtained
with 0.35” cyclic loading at 1 Hz as opposed to 2” cyclic loading for the control
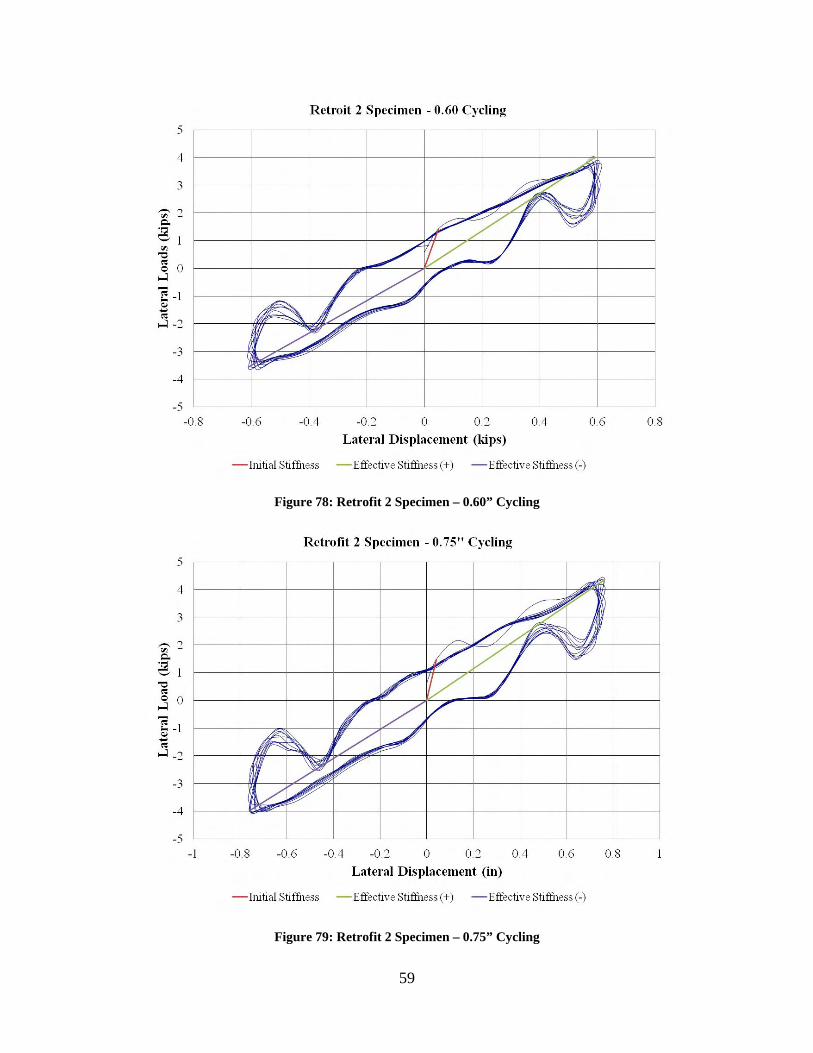
specimen. Retrofit 2 specimen had a significantly higher effective stiffness than the other
test specimens due to the new foundation and added shear walls. The initial and effective
stiffness values and the maximum lateral load values for retrofit specimen 2 are shown in
Table 5 and plotted in Figure 49 and Figure 50.

38
Figure 47: Retrofit 2 Specimen – 0.35” Cycling
Figure 48: Retrofit 2 Specimen – 2.5” Cycling

39
Retrofit 2 Specimen Stiffness Max Lateral
Load
Lateral Load / Approximate
Weight
Test Displacement Amplitude (in)
Initial (k/in)
Effective (+)
(k/in)
Effective (-) (k/in)
+ (kip) - (kip) + -
1 0.1 73.23 12.99 -8.84 1.3 -0.88 0.43 0.29 2 0.15 44.65 11.43 -9.53 1.71 -1.43 0.57 0.48 3 0.2 41.08 10.54 -9.27 2.11 -1.85 0.70 0.62 4 0.25 20.21 9.57 -9.44 2.39 -2.36 0.80 0.79 5 0.3 28.07 9.54 -8.88 2.86 -2.66 0.95 0.89 6 0.35 48.47 8.79 -8 3.08 -2.8 1.03 0.93 7 0.4 47.17 8.34 -7.41 3.34 -2.96 1.11 0.99 8 0.5 25.4 7.62 -6.78 3.81 -3.39 1.27 1.13 9 0.6 28.79 6.65 -5.95 3.99 -3.57 1.33 1.19
10 0.75 36.46 5.81 -5.28 4.35 -3.96 1.45 1.32 11 0.88 20.81 5.32 -4.82 4.66 -4.22 1.55 1.41 12 1 19.69 4.92 -4.47 4.92 -4.47 1.64 1.49 13 1.13 16.13 4.47 -4.09 5.03 -4.6 1.68 1.53 14 1.25 24.18 4.14 -3.59 5.17 -4.49 1.72 1.50 15 1.38 19.71 3.9 -3.6 5.36 -4.95 1.79 1.65 16 1.5 15.13 3.81 -3.43 5.71 -5.15 1.90 1.72 17 1.75 17.77 3.49 -2.91 6.11 -5.09 2.04 1.70 18 2 18.62 3.2 -2.59 6.4 -5.18 2.13 1.73 19 2.5 83.39 2.91 -2.2 7.27 -5.49 2.42 1.83
Table 5: Retrofit 2 Specimen Stiffness

40
Figure 49: Retrofit 2 Specimen Effective Stiffness
Figure 50: Retrofit 2 Specimen Maximum Lateral Load
41
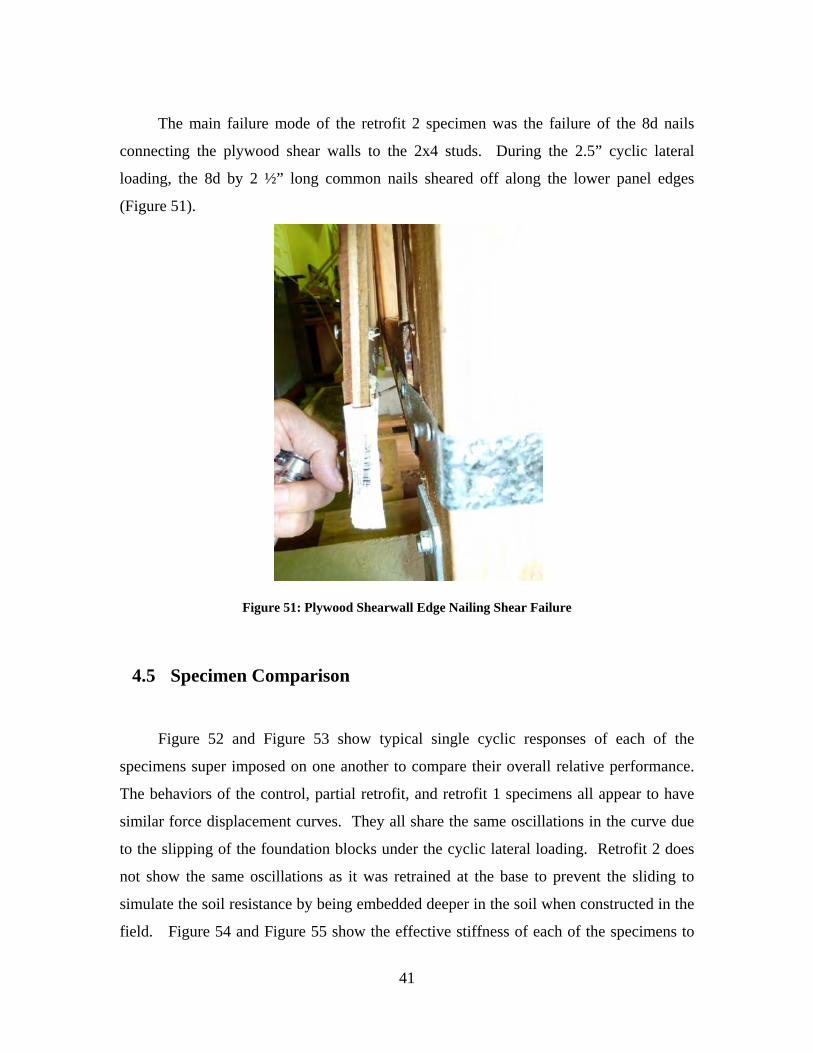
The main failure mode of the retrofit 2 specimen was the failure of the 8d nails
connecting the plywood shear walls to the 2x4 studs. During the 2.5” cyclic lateral
loading, the 8d by 2 ½” long common nails sheared off along the lower panel edges
(Figure 51).
Figure 51: Plywood Shearwall Edge Nailing Shear Failure
4.5 Specimen Comparison
Figure 52 and Figure 53 show typical single cyclic responses of each of the
specimens super imposed on one another to compare their overall relative performance.
The behaviors of the control, partial retrofit, and retrofit 1 specimens all appear to have
similar force displacement curves. They all share the same oscillations in the curve due
to the slipping of the foundation blocks under the cyclic lateral loading. Retrofit 2 does
not show the same oscillations as it was retrained at the base to prevent the sliding to
simulate the soil resistance by being embedded deeper in the soil when constructed in the
field. Figure 54 and Figure 55 show the effective stiffness of each of the specimens to

42
compare their overall relative performance. Each specimen’s effective stiffness decreased
as lateral displacement was increased. Retrofit specimen 2 provided the greatest increase
in effective stiffness when compared to the un-retrofitted control specimen. Figure 56 and
Figure 57 show the maximum resisted lateral load of each of the specimens to compare
their overall relative performance. Each specimen’s maximum resisted lateral load
increased as lateral displacement was increased. Retrofit specimen 2 provided the
greatest increase in maximum lateral load resisted when compared to the un-retrofitted
control specimen.
Figure 52: Specimen Comparison – 0.5” Cycling

43
Figure 53: Specimen Comparison – 1.5” Cycling
Figure 54: Specimen Comparison Effective Stiffness (+)

44
Figure 55: Specimen Comparison Effective Stiffness (-)
Figure 56: Specimen Comparison Maximum Lateral Load (+)

45
Figure 57: Specimen Comparison Maximum Lateral Load (-)
5. Summary and Conclusions
A research study was performed to evaluate two seismic retrofit schemes proposed
to improve the lateral resistance of post and pier foundation homes in Hawaii. The first
retrofit scheme involved anchoring the posts to the foundation and installing metal plate
connectors at all joints in the post and pier framing. The second retrofit scheme involved
adding a new 2x4 stud wall plywood shearwall and a new plywood sub diaphragm to an
existing floor system and pouring new cast-in-place concrete footings. The retrofitted
post and pier foundations when subjected to cyclic lateral loading simulating seismic
ground shaking to compare their performance with that of an un-retrofitted control
specimen. In addition to validating the two retrofit designs, this project will provide a
video tool to encourage implementation of these retrofits by homeowners. The video will
be posted on appropriate websites and combined with an assisting web-based expert
system for selection of the retrofit system.

46
Based on the cyclic lateral loading tests performed in this study, the following
conclusions were drawn:
1) When loaded with approximately the same cyclic lateral loading as the failure
load of the un-retrofitted frame, both retrofit option 1 and retrofit option 2 showed
no signs of failure. Retrofit 1 with the hold-downs, ties and straps installed at all
the foundation blocks, posts, and braces performed as designed, as did retrofit 2
with plywood shear walls and sub diaphragm.
2) Based on the performance of a partially retrofitted foundation, it was determined
that a partial retrofit anchoring only the post to the foundation blocks appeared to
be detrimental to the overall seismic performance of the assembly.
3) The effective stiffness of the retrofit 1 specimen was approximately double that of
the control specimen at all levels of cycling. The effective stiffness of the retrofit
2 specimen was approximately four times that of the control specimen.
4) The strength of the retrofit 1 specimen was approximately double that of the
control specimen at all levels of cycling. The strength of the retrofit 2 specimen
was approximately three times that of the control specimen.

47
References
Robertson, Ian N. and Chock, Gary (2009). "Structural Seismic Retrofits For Single Family Residences With Post and Pier Foundations", Honolulu, HI.
International Code Council, Inc. (2006). “2006 International Building Code”. Country Club Hills, IL. Simpson Strong-Tie (2011). Retrieved September 2011, from http://www.strongtie.com/. USGS (2006). “Magnitude 6.7 – Hawaii Region, Hawaii”. Retrieved September 2011 from http://earthquake.usgs.gov/earthquakes/eqinthenews/2006/ustwbh/

48
Appendix

49
Figure 58: Control Specimen – 0.5” Cycling
Figure 59: Control Specimen – 1.0” Cycling

50
Figure 60: Control Specimen - 1.5” Cycling
Figure 61: Partial Retrofit Specimen - 0.25” Cycling

51
Figure 62: Partial Retrofit Specimen – 0.35” Cycling
Figure 63: Partial Retrofit Specimen – 1.0” Cycling

52
Figure 64: Partial Retrofit Specimen – 0.75” Cycling
Figure 65: Partial Retrofit Specimen – 1.5” Cycling

53
Figure 66: Retrofit 1 Specimen – 0.25” Cycling
Figure 67: Retrofit 1 Specimen – 0.35” Cycling

54
Figure 68: Retrofit 1 Specimen – 0.75” Cycling
Figure 69: Retrofit 1 Specimen – 1.0” Cycling

55
Figure 70: Retrofit 1 Specimen – 1.25” Cycling
Figure 71: Retrofit 2 Specimen – 0.1” Cycling

56
Figure 72: Retrofit 2 Specimen – 0.15” Cycling
Figure 73: Retrofit 2 Specimen – 0.2” Cycling

57
Figure 74: Retrofit 2 Specimen – 0.25” Cycling
Figure 75: Retrofit 2 Specimen – 0.30” Cycling
58
Figure 76: Retrofit 2 Specimen – 0.40” Cycling
Figure 77: Retrofit 2 Specimen- 0.50” Cycling
59
Figure 78: Retrofit 2 Specimen – 0.60” Cycling
Figure 79: Retrofit 2 Specimen – 0.75” Cycling

60
Figure 80: Retrofit 2 Specimen – 0.875” Cycling
Figure 81: Retrofit 2 Specimen – 1.0” Cycling

61
Figure 82: Retrofit 2 Specimen – 1.125” Cycling
Figure 83: Retrofit 2 Specimen – 1.25” Cycling

62
Figure 84: Retrofit 2 Specimen – 1.375” Cycling
Figure 85: Retrofit 2 Specimen – 1.5” Cycling

63
Figure 86: Retrofit 2 Specimen – 1.75” Cycling
Figure 87: Retrofit 2 Specimen – 2.0” Cycling