Embed Size (px)
Citation preview
EVALUATION OF SEISMIC RISK IN THE TONGA-FIJI-VANUATU REGION OF THE SOUTHWEST PACIFIC
A COUNTRY REPORT FIJI
Prepared by Michael W Hamburger I Bryan L Isacks2 Muawia Barazangi2 Joyce L Kruger-Knuepfer2 John Kelleher 3 George Hade 2
IDepartment of Geology Indiana University
Bloomington IN 47405
2Departmeit of Geological Sciences Cornell University
Ithaca New York 14853
3 Redwood Research Inc 801 N Humboldt St 407
San Mateo California 94401
Report submitted to Office of US Foreign Disaster Assistance Grant No PDC-0000-G-SS-2134-00 Evaluation of Seismic Risk in the Tonga-Fiji-Vanuatu Region of the Southwest Pacific
1986
TABLE OF CONTENTS
EXECUTIVE SUMMARY
INTRODUCTION 1 Evaluation of Seismic Hazard 2 The 1953 Suva Earthquake 5
ACTIVITIES SUMMARY 7 Seismological Investigations 7 Strong Motion Accelerographs 9 Related Scientific Programs 9 Critical Facilities 11 Earthquake Preparedness Programs 12
TECTONICS GEOLOGY AND PHYSIOGRAPHY 13 Plate Tectonic Setting 13 Physiography and Submarine Morphology 19 Geological Evolution of Fiji 21
SPATIAL DISTRIBUTION OF EARTHQUAKES IN FIJI 25 Historical Earthquakes 26 Teleseismically Located Earthquakes 29 Tripartite Seismic Network 1966-1969 31 Fiji Telemetered Seismic Network 1979-1985 32 Earthquake Locations 36 Depth Determinations 38 Earthquake Magnitudes 40 Seismicity Maps 42 Earthquake Focal Mechanisms 79
CONCLUSIONS 88
ASSESSMENT OF EARTHQUAKE HAZARD 90 Earthquake Recurrence Intervals 90 Earthquake Potential 93 Macroseismic Effects of Large Earthquakes 95 Tsunami Hazard 98 Volcanic Hazard 100
IMPLICATIONS FOR MITIGATION OF EARTHQUAKE RISK 102 Earthquake Education 102 Building Codes 103 Emergency Civil Defense Procedures 103 Long-term Seismicity Observations 104 International Cooperation 104
REFERENCES 106
APPENDIX I DEFINITIONS 112
APPENDIX II MODIFIED MERCALLI INTENSITY SCALE (1956 VERSION) 115
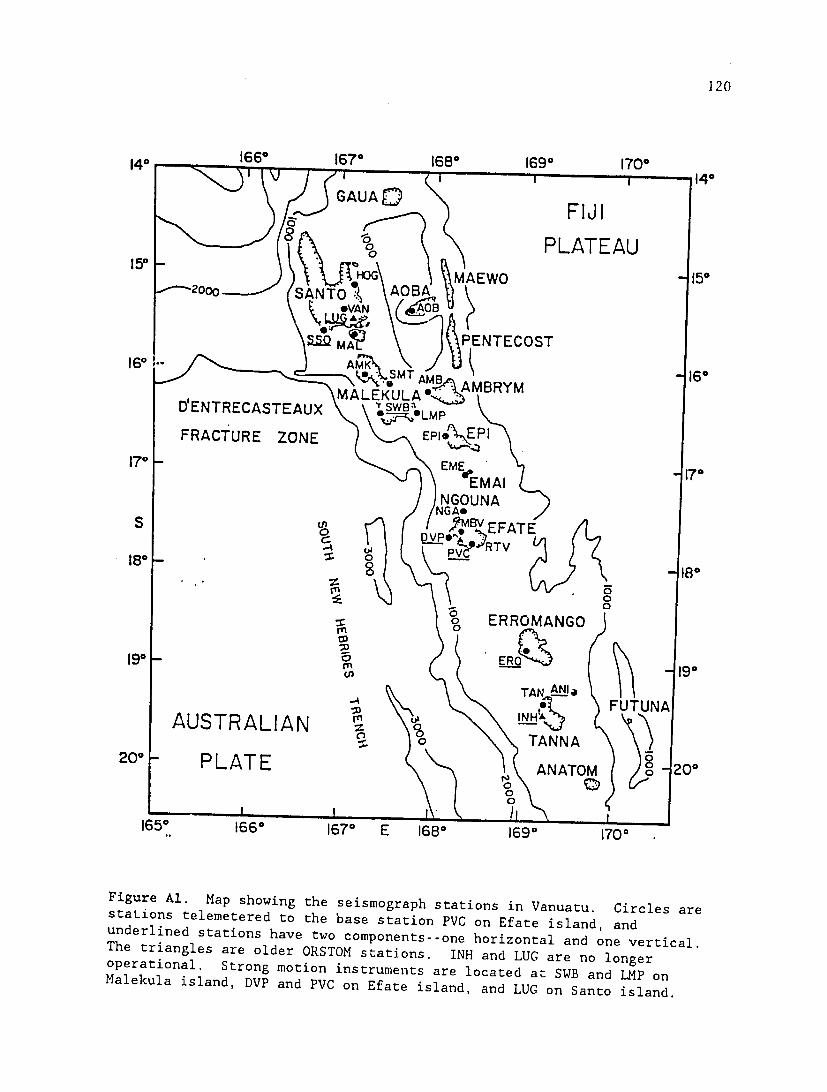
APPENDIX III SEISMOLOGICAL FACILITIES AND EARTHQUAKE HAZARD
PROGRAMS IN THE SOUTHWEST PACIFIC 117 TONGA VANUATU WESTERN SAMOA SOLOMON ISLANDS PAPUA NEW GUINEA NEW ZEALAND REFERENCES
INFORMATION CONTACTS
117 118 121
122
124 127 133
135
APPENDIX IV TSUNAMI SAFETY RULES 137
EXECUTIVE SUMMARY
Overall Program
This country report is a summary of our contribution to a long-term program to evaluate earthquake risk to the island countries of Tonga Fijiand Vanuatu in the Southwest Pacific These countries are located within one of the most active belts of seismicity in the world and seismic hazard in these countries has been largely neglected in national planning and development programs The fundamental contributions of our investigations include (1) analysis of regional seismicity and seismotectonic data (2) maintenance and improvement of seismological facilities in the region(3) establishment of P regional network of strong-motion accelerographs (4) initiation of regional cooperation between national and international agencies working in this region and (5) training of national technical and scientific personnel Our investigations in Fiji have been carried out tbrough cooperative work with the Fiji Mineral Resources Department
Summary of Work Completed
(A) Historical Earthouakes in Fiji The majority of the large earthshyquakes reported in the last 130 years occurred along the tectonic boundaries that surround the Fiji Platform However a large number of significantearthquakes occurred within the platform including the damaging 1953 Suva and 1979 Taveuni earthquakes The magnitudes of these events are all less than 71 suggesting that the thin lithosphere of the Fiji region is incapable of storing sufficient stress to result in great earthquakes
(B) Teleseismically Located Earthquakes A new compilation of earthshyquakes located by the global seismic network is used to constrain the activity of the plate boundaries surrounding the Fiji Platform the FijiFracture Zone to the north the West Viti Levu zone to the west the Hunter Fracture Zone to the south and the northwestern edge of the Lau Basin to the northeast
(C) Tripartite Seismic Network 1966-1969 The first microearthquakestudy of Fiji used a three-station network of seismic stations on the main islands of Viti Levu and Vanua Levu These microearthquakes show the same distribution of seismicity to the northeast north and west of the Fiji Platform as the teleseismic data Scattered seismicity is observed in areas within the platform previously thought to be aseismic
(D) Fiji Telemetered Seismic Network 1979-1985 The nineteen-station national seismic network of Fiji has operated for over six years and proshyvides the bulk of the data for this research program Over 5000 events were recorded by the network of which approximately 1800 earthquakes were located Microearthquakes are located both along the edges of and within the Fiji Platform The interplate zones that surround the platform are continuously active at moderate magnitudes while the intraplate earthshyquakes within the platform occur more sporadically separated by long periods of quiescence
iv
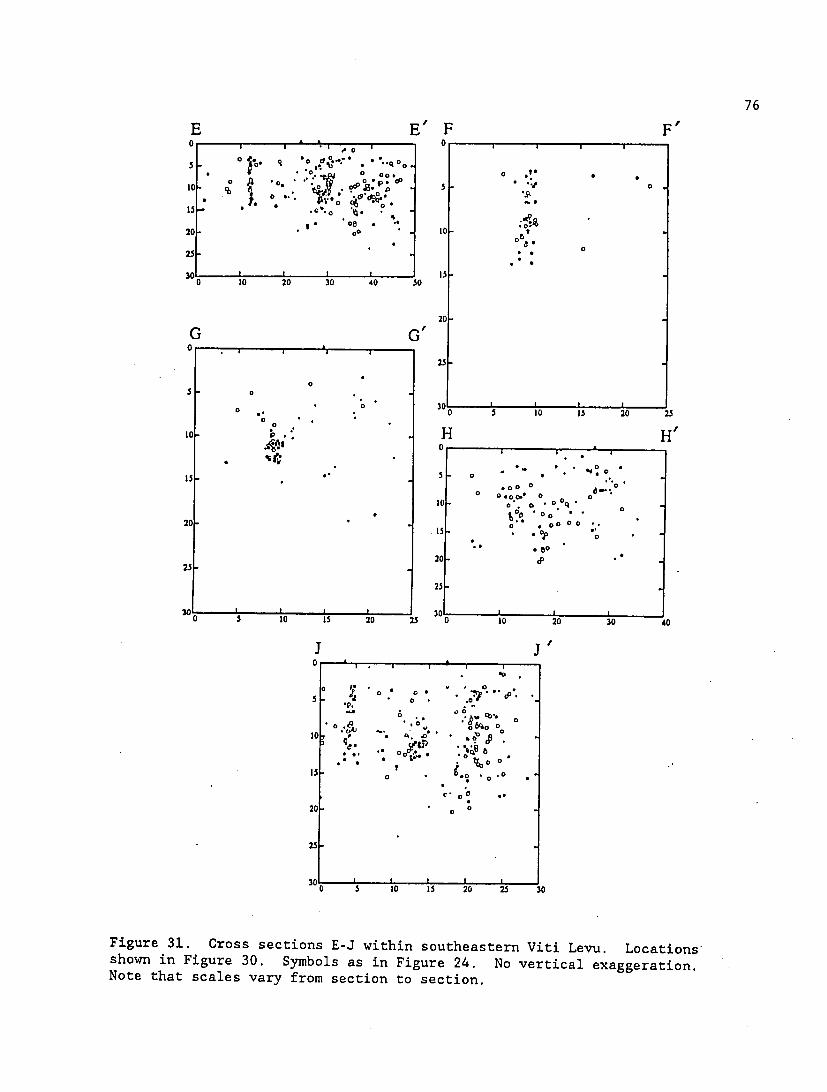
(E) Earthquake Depths The dense seismic network in southern Viti Levu accurately constrains earthquake focal depths They are uniformly shallow concentrated in the upper 18 km of Fijis crust The distribution is similar to other areas of extension and strike-slip deformation
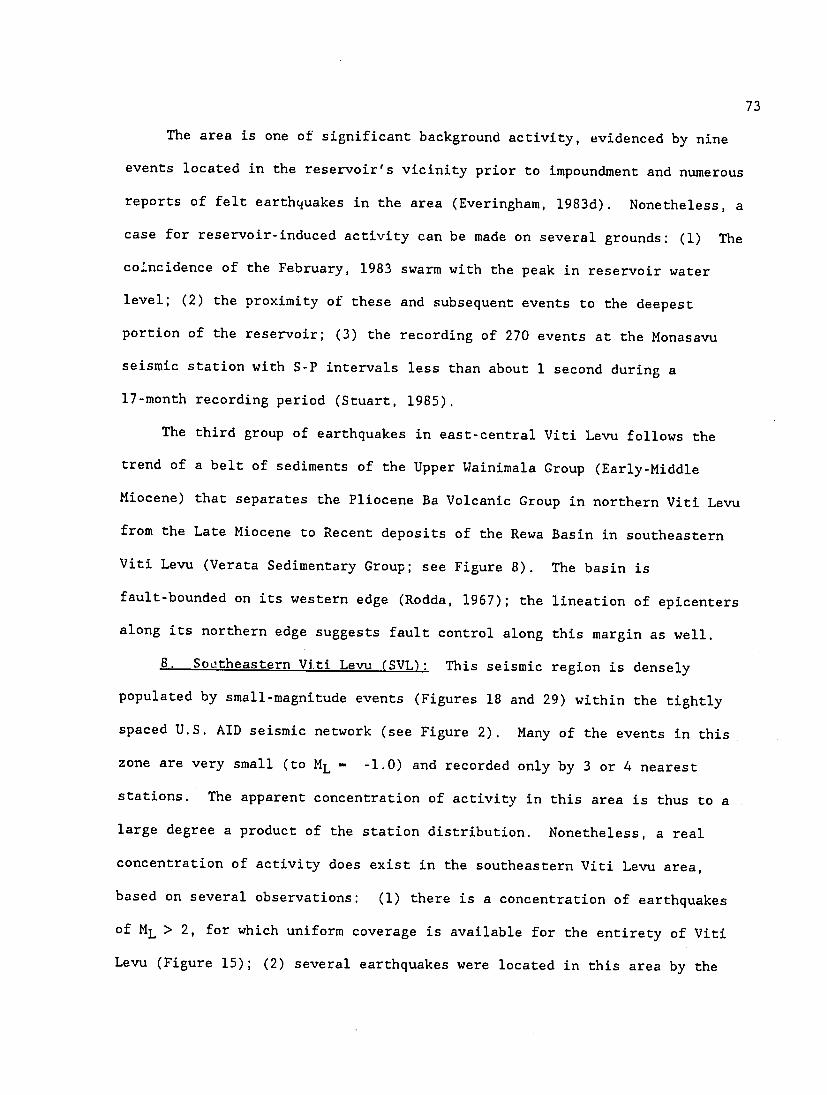
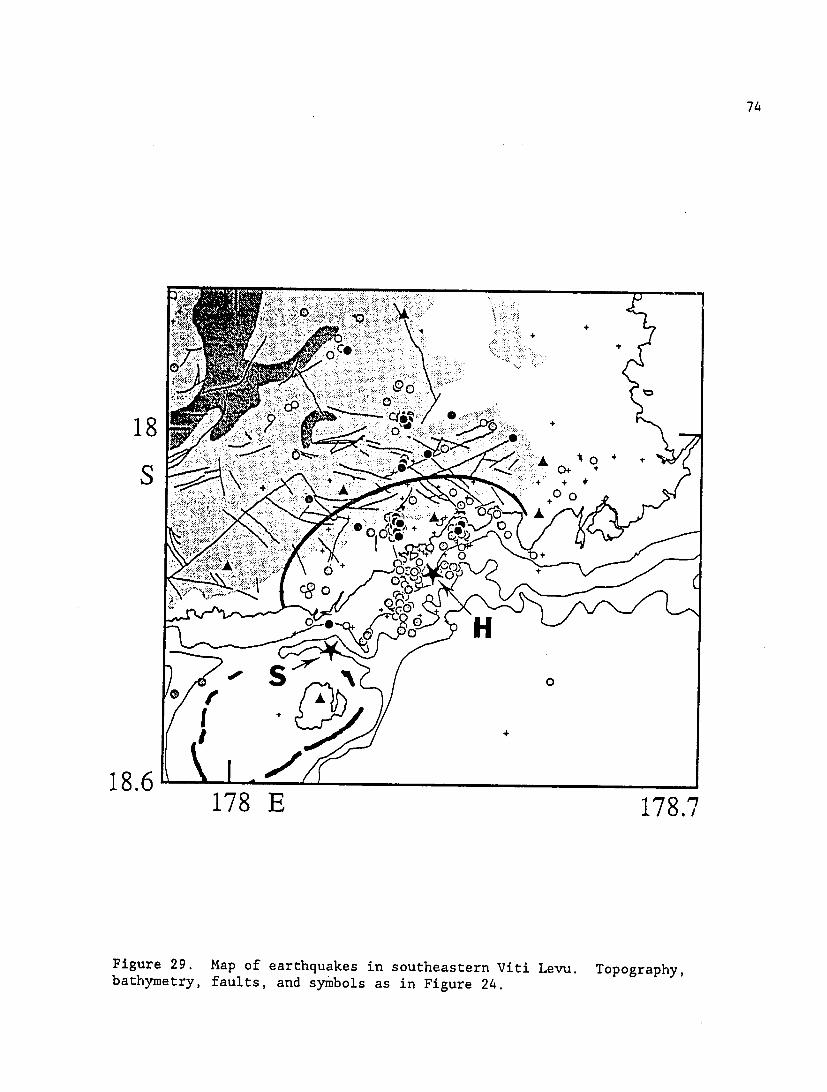
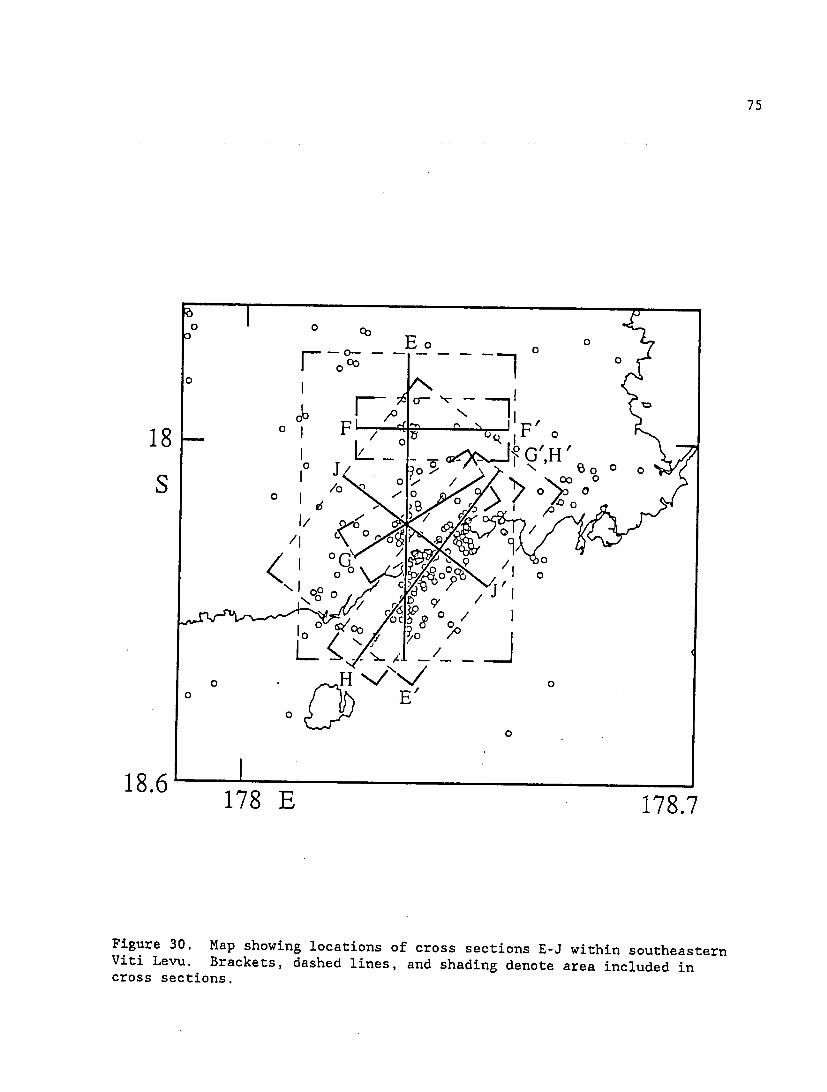
(F) Earthquakes within Viti Levu Earthquakes located in the central portion of the island may be related to rapid doming of the island A group of events near Monasavu Reseivoir were induced by rapid filling of a large artificial lake Earthquakes in southeastern Viti Levu occur in discrete nests that are tightly clustered in space and time They are related to a series of near-vertical east- to northeast-striking faults that cut the Mio-Pliocene rocks of southeastern Viti Levu
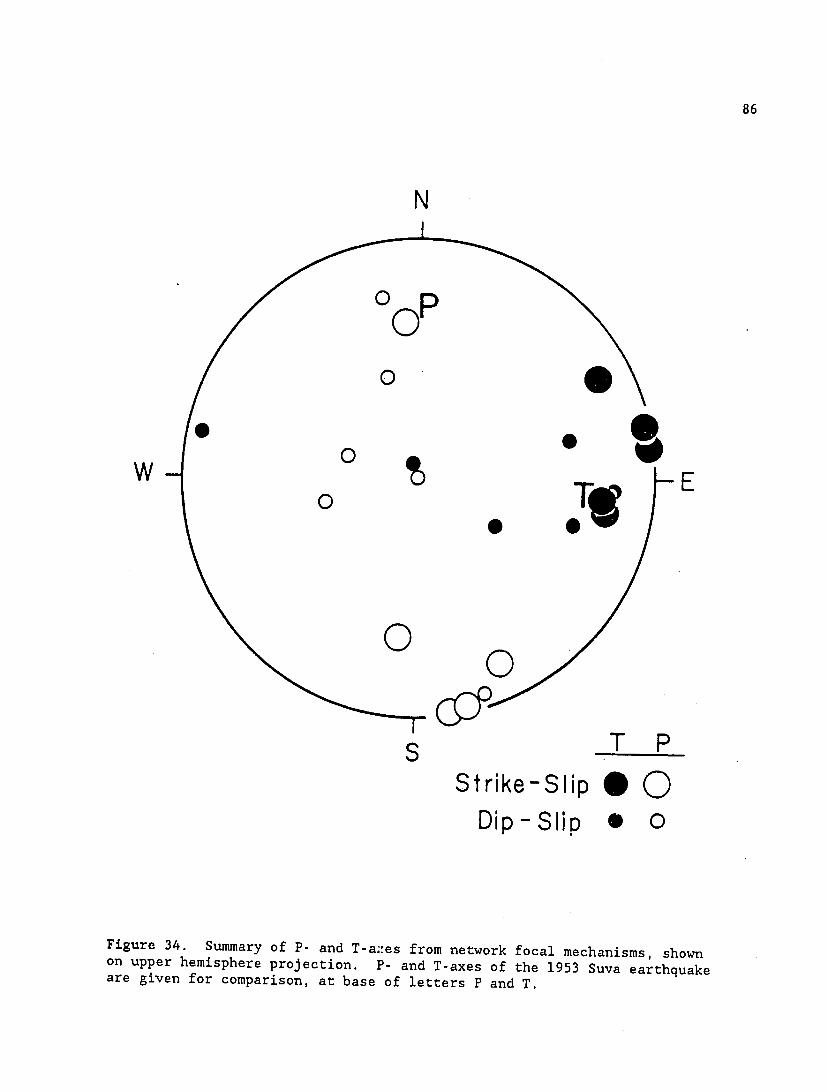
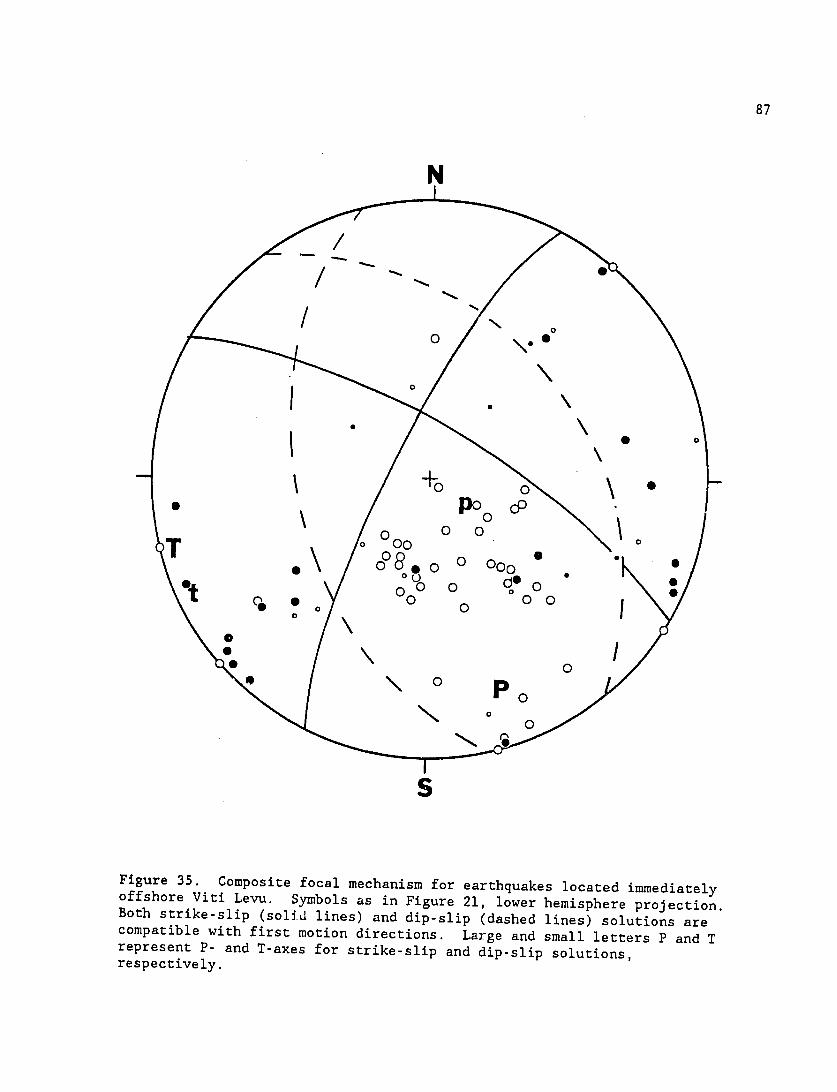
(G) Earthquake Focal Mechanisms A new focal mechanism for the 1953 Suva earthquake combined with mechanisms for microearthquakes within and near Viti Levu suggest the predominance of strike-slip faulting along northwest- or northeast-striking fault planes The stress direction orienshytation is similar to that observed throughout the Fiji region and indicates that the Platform is not isolated in a tectonic sense from the remainder of the interarc region of the Southwest Pacific
Earthquake Recurrence Intervals
Two studies of magnitude-frequency relations for the Fiji region suggest similar recurrence intervals for large earthquakes near Fiji earthquakes of magnitude 7 or greater are expected every 15 - 21 years while events of magnitude 65 or greater are expected every 2 12 - 6 years
Earthquake Potential
The earthquake potential is not uniform throughout the Fiji region We have subdivided the Fiji region into four zones of seismic potential based on the available seismicity data Zone I includes the Fiji Fracture Zone Taveuni-northeast Vanua Levu zone West Viti Levu zone and the western Lau Basin and is conservatively assigned a maximum magnitude of 75 Zone II includes the Kadavu Island region the Hunter Fracture Zone the Baravi and Suva basins and the Koro Sea The maximum magnitude assigned to this zone is 70 however recurrence intervals may be considerably larger than in Zone I Zone III includes central and eastern Viti Levu Ovalau Island and Vatu-Ira Channel and is assigned a maximum magnitude of 65 Zone IV includes northern and western Viti Levu the Bligh Water Basin northern Vanua Levu the South Fiji Basin and the Lau Ridge These areas have been virtually devoid of seismic activity on all time and magnitude scales Because of their proximity to the zones of active tectonism a conservative maximum magnitude of 60 has been assigned
Macroseismic Effects of Large Earthquakes
Based on the maximum probable earthquakes assigned to each of the seismic zones we have predicted maximum intensity of ground shaking at 14 population centers and islands within Fiji These predictions are based on extrapolations from observed intensity data and are intended to serve as a
v
general guideline to identify areas of higher and lower risk The highest intensities from earthquakes occurring in Zone I are projected for Taveuni Island and the Yasawa Group (MM 9-10) somewhat lower intensity (8) is predicted for Labasa Savusavu and Koro Earthquakes occurring within Zone Ii are capable of producing high intensities (8-9) at Suva Sigatoka Labasa Savusavu Koro Kadavu and Taveuni Slightly lower intensities (8) are predicted for Nadi Monasavu and Ovalau Earthquakes within Zone III are capable of producing MM8 shaking in Suva Monasavu Sigatoka and Ovalau slightly lower values (7-8) are projected for Lautoka Nadi and Ba Intensities predicted for Zone IV are all less than MM8
Tsunami Hazard
The history of earthquake-generated tsunamis in Fiji documents a very real hazard to Fijis population Tsunamis are of particular concern because of the concentration of population in low-lying coastal areas While tsunamis are not generated by all earthquakes they must be considered a possible effect of all major earthquakes that occur in submarine areas that surround the Fiji Platform Real-time monitoring of seismic activity combined with an active tsunami education program could significantly aid in tsunami risk mitigation
Volcanic Hazard
Quaternary volcanic activity is far less prevalent in Fiji than elseshywhere in the Southwest Pacific There is no historical record of volcanic eruptions in Fiji The evidence for prehistoric volcanism on Taveuni Island warrants continuous seismic monitoring of activity there
Conclusions and Recommendations We recommend that (1) an earthquake and tsunami education program be
adopted and combined with other disaster preparedness programs (eg hurricane floods and so on) (2) adoption of more stringent building codes for all of Fiji is strongly recommended (3) long-term seismicity and strong motion observations be continued in order to refine estimates of seismic potential (4) regional cooperation among the island countries of the Southwest Pacific be encouraged in order to assist in Fijis earthquake preparedness program
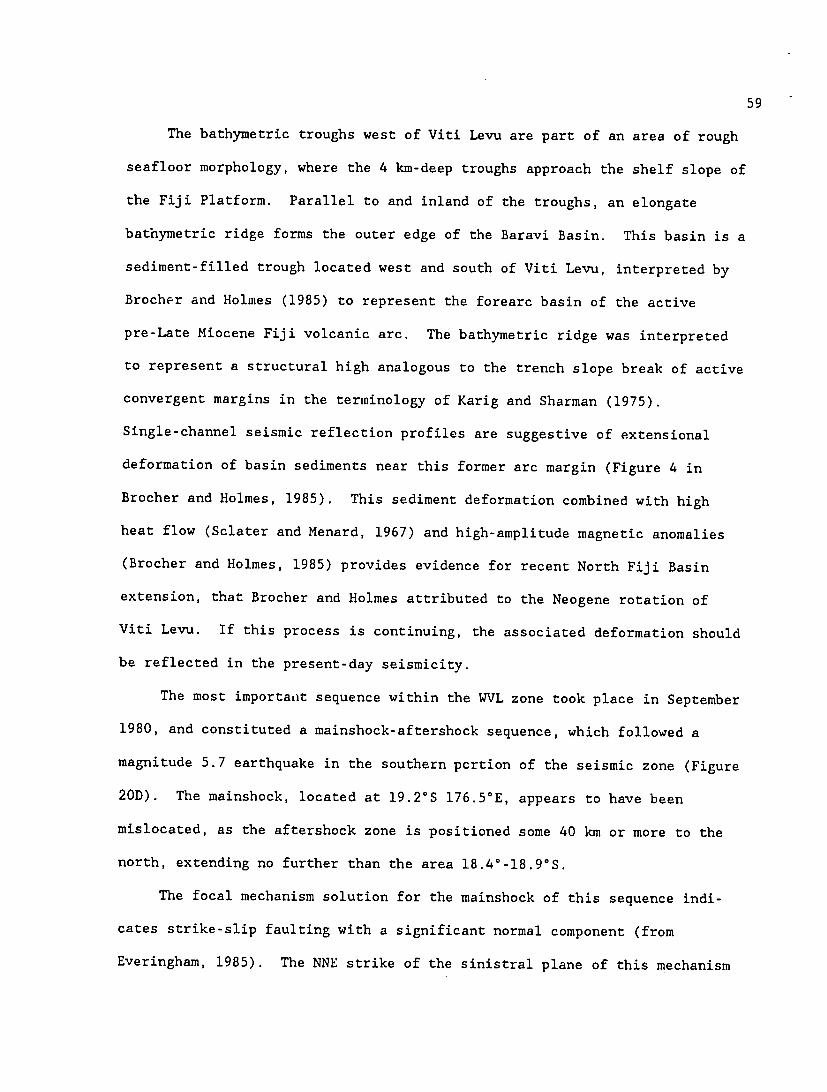
INTRODUCTION
The island countries of the Southwest Pacific are subject to natural
disasters including earthquakes volcanic eruptions and tsuramis which
threaten human life and property every year Geological and geophysical
observations indicate that these natural disasters are manifestations of
continuous geological processes the inexorable movements of the earth
guarantee that they will continue to occur in the future
The Southwest Pacific region is the source area for a large percentage
of the worlds seismicity Approximately seventy percent of the worlds
intermediate and deep earthquakes occur in this region A large number of
great shallow earthquakes have taken place along the plate boundaries that
affect New Zealand Kermadec Islands Tonga Vanuatu Solomon Ilands Papua
New Guinea and Fiji
Normally public attention focuses on emergency and rescue operations
once a disaster has taken place While little can be done to prevent
earthquakes or volcanic eruptions from occurring significant steps may be
taken to minimize the destructive effects of such disasters Scientists are
striving to better understand what causes these phenomena and to learn what
measures might be taken to mitigate their destructive nature This report
is a summary of the available scientific data that help constrain the
potential for destructive earthquakes that may affect the populated areas of
Fiji The report is by no means the final analysis of earthquake hazards to
Fiji it is however a well documented synthesis of all available seismic
information that provides a basis for judicious engineering planning and
civil defense decisions in the years to come Definitions of some of the
technical terms that will appear in this report are contained in Appendix I
2
The ultimate aim of earthquake risk programs--mitigation of human and
economic losses due to earthquakes--involves prediction of the frequency of
occurrence and intensity of strong ground motion produced by future earthshy
quakes of specific magnitudes in the vicinity of any given site These
predictions are often summarized in the form of seismic zoning maps and
microzonation which give the spatial distributions of the following paramshy
eters maximum intensity of shaking engineering design codes maximum
acceleration of ground motion (velocity displacement) for given return
periods of earthquakes of a particular size or seismic risk (which relates
to the expected human and property losses from earthquakes) In this
report we focus on the fundamental seismological observations that will
provide the basis for more applied engineering studies of earthquake risk to
Fij i
Evaluation of Seismic Hazard
The seismic hazard in any region is a function of the frequency of
occurrence and magnitude of earthquakes as well as the proximity of the
earthquake foci to population and industrial centers Fiji is located close
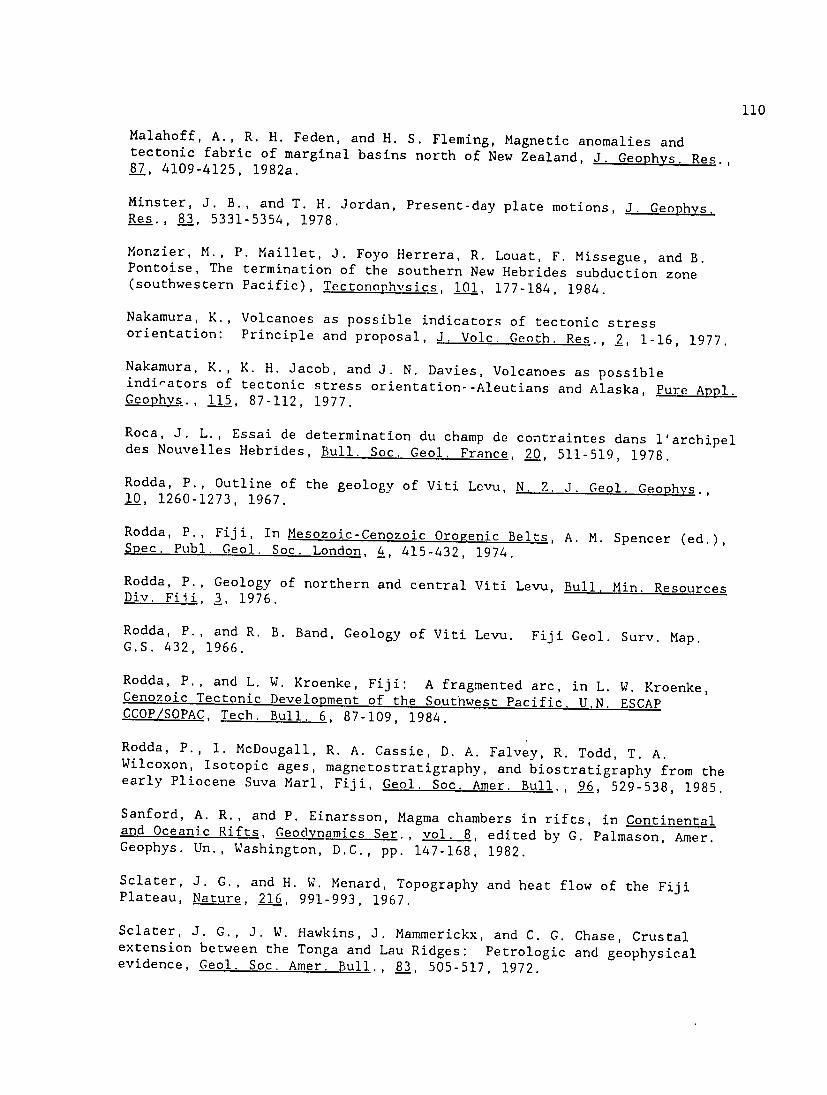
to the major seismic zones of the Southwest Pacific (Figure 1) the area has
an instrumental history of earthquakes with magnitudes greater than 70
Although the country is not heavily populated or industrialized its
proximity to major seismic zones leaves it particularly vulnerable to the
risk of earthquake damage The capital city of Suva is now under increasing
development pressures The construction of multi-storied buildings to
accommodate the increasing urban populations and tourism as well as other
essential structures such as dams and power plants pipelines schools and
hospitals adds to the immediacy of the problem of earthquake risk
3
160 E 170 180 W 170
CENTRAL PACIFIC BA5IN
4 V ITI A I
SO 15 - deg
100 0 1000
0 o V 0 CH
BASIN BASIN o-
d~ FIJI~ r(
20 4 a 4 ~~ 20
LA SOUTH
0 BASINV- ZE
I P A I IS S A 0
0 S - 0
300 A
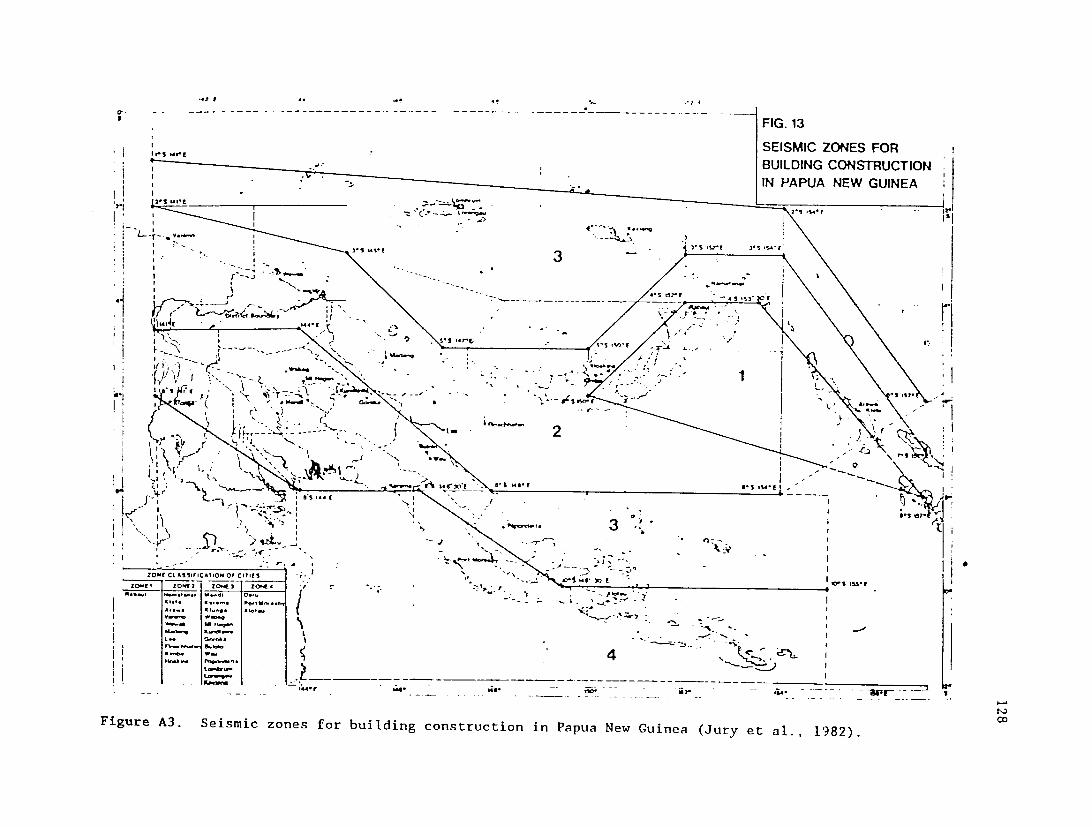
BINPI- )A C CIFICPA~~ 3
USTRALIAN~ 4V PLATE
PLATEZEA~LAND SOUTHWEST
400 b BASINBASIN
RISE40
150 160 E 170 180 170 W
Figure 1A Tectonic and morphologic features of the PacificIndo-Australian plate boundary Open arrows indicate direction of relative plate convergence Contour line shows 2-km isobath Holocene volcanoes are indicated by open triangles Data on bathymetry volcanoes and plate motions are taken from Circum-Pacific Council for Energy and Mineral Resources (1981)
4
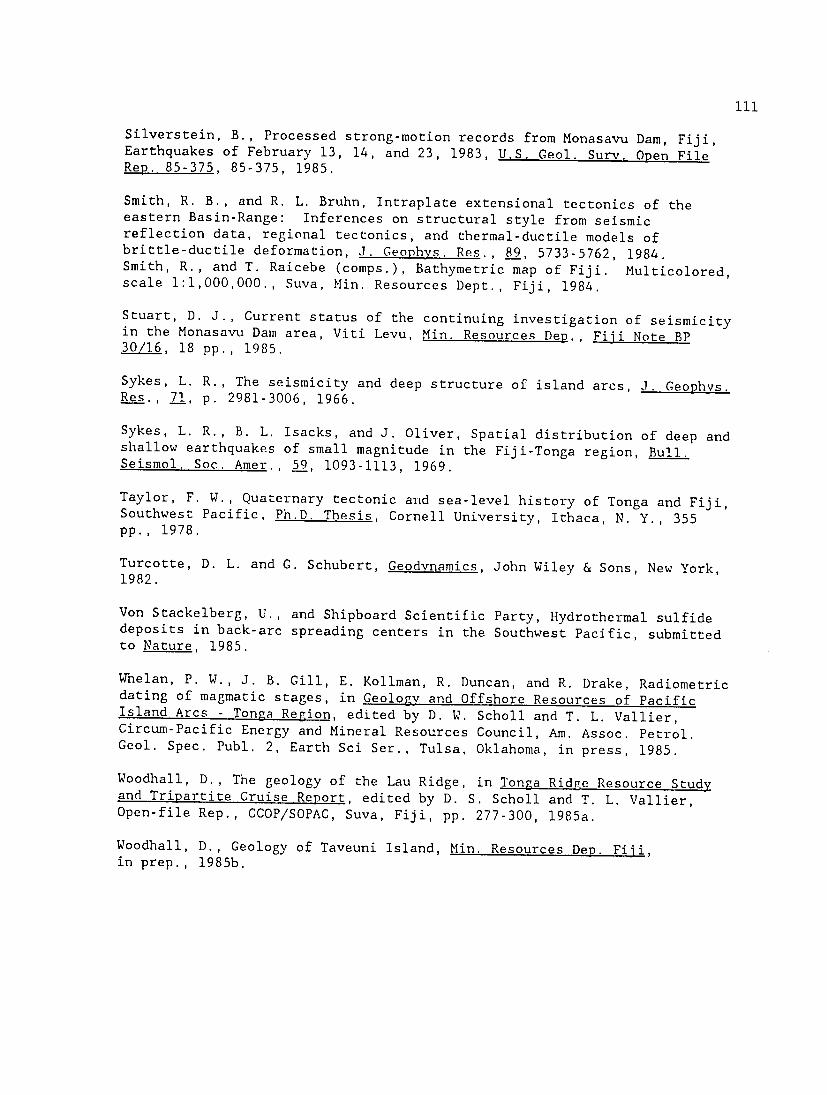
10 deg1600 E 170 W 170 bull
20
20shy
-
0
at
4vkr 40v
30030 20IN W
170
the in
180 50)gt
(Ms40
170
earthquakes
2 I shallow
as large scale for1Bto sameat Councilis
Map Moderate Circum-Pacific
1964-1977from period taken
the arefor Data
Figure Pacific (1981)1Bcomparison
Southwest for Resources MineralFigure and
Energy
5
Past disaster associated loss of life in the Fiji has been relatively
limited but the increasing urban concentration and industrial development
raises the potential human and economic losses brought on by a large earthshy
quake occurring in the immediate vicinity These losses are usually the
result of the collapse of man-made structures and can be substantially
reduced by adequate engineering precautions
The 1953 Suva Earthquake
The most significant event in Fijis seismic history is the large 1953
Suva earthquake This event with a magnitude of Ms - 675 was the most
destructive in Fijis history The earthquake occurred within 30 km of the
capital city of Suva and produced extensive damage throughout southern Viti
Levu Intensities reach MM VII (Modified Mercalli Index see Appendices I
and II) along 40 km of the islands coast landslides were triggered over an
area of approximately 2380 km2 along the southern coast and extending nearly
20 km inland (Houtz 1962a) A major tsunami was triggered by the earthshy
quake reaching 43 meters height on the island of Kadavu 100 km south of
the epicenter The earthquake and tsunami resulted in 8 deaths 12 serious
injuries and over pound250000 in property damage The event also triggered
turbidity currents along the shelf south of Viti Levu that damaged communshy
ication cables at distances to 100 km from the epicenter (Houtz and Wellman
1962)
At the time of the earthquake Suvas population was only 35000 and
development consisted entirely of low-rise structures Since that time
Suva has grown to over 100000 population and has established itself as the
major regional center for commerce shipping tourism education and
administration Multistory building is widespread in the city and urban
development has rapidly extended to outlying areas Clearly a repetition
6
of the Suva earthquake is of major concern to Fijis Government planners
The seismic risk related to a recurrence of an event of this size (or
larger) far outweighs the potential effects of an earthquake along any of
the other seismogenic zones near Fiji
The earthquake has been of considerable interest from a seismotectonic
perspective as well it took plac3 like a small number of other historical
events directly within the platform on which the Fiji Islands reside Much
of the well-documented seismic activity has occurred along the boundaries of
the Fiji block (Hamburger and Everingham 1986) The cause of the large and
infrequent events that take place within the platform has remained a
tectonic enigma A major goal of these seismological investigations has
been to comprehend the tectonic causes for such unusual and extremely
hazardous earthquakes that occur close to and within the Fiji Islands
The major new data base that bears on this problem originates from the
new telemetered seismic network established in 1979 This network has
recorded several thousand earthquakes both within and along the margins of
the Fiji Platform Because the network can locate events as small as
magnitude -10 small earthquakes in less active seismic zones can be
examined Importantly the network located over 500 earthquakes within and
offshore southeastern Viti Levu near the source area for the 1953 Suva
earthquake In the following sections the distribution of earthquakes in
the Fiji region is analyzed in order to elucidate the nature of deformation
both within and along the boundaries of the Fiji Platform
A second important observation that bears on the Suva earthquake is the
examination of original records collected from over forty observatories
operating at the time Using these records we have obtained a new focal
7
mechanism for the 1953 event that places it in a clear tectonic context
one that proves to be closely linked to the deformation occurring on either
side of the Fiji Platform in the Lau and North Fiji basins
ACTIVITIES SUMMARY
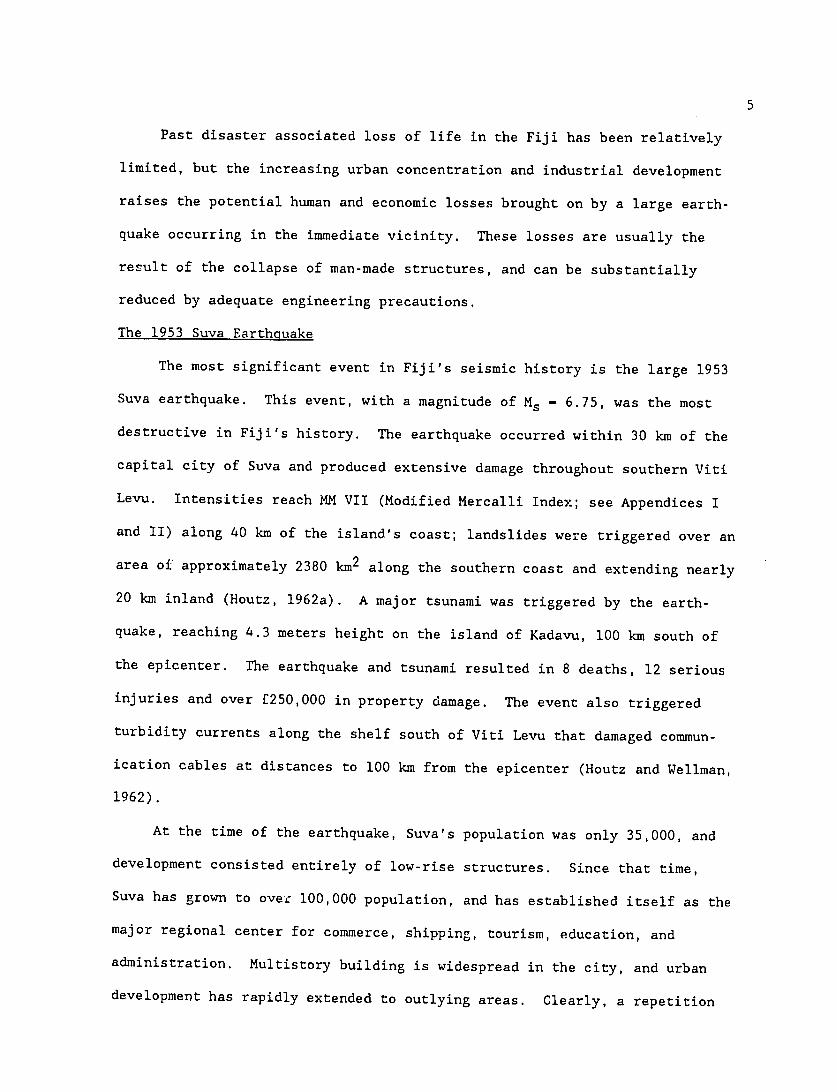
Seismological Investigations
Reliable seismological observations are necessary for accurate
location study and ultimate prediction of earthquakes Seismological
observations in Fiji are conducted by the Mineral Resources Department a
subdivision of the Ministry of Energy and Mineral Resources The government
has made a major commitment to seismological work since the establishment of
a major US AID-supported seismic network in 1979 In fact seismological
observations in Fiji have been carried out since the early part of this
century supported at first by the New Zealand scientific organizations and
subsequently strengthened by Lamont Geological Observatorys Upper Mantle
Project in the 1950s and 1960s In late 1979 the 8-station US AID
network was established to complement three permanent stations in Viti Levu
The network was significantly expanded by installation of a five-station
telemetry network in 1981 supported by Japanese aid Additional stations
were installed in 1983 and 1984 the network has now expanded to a
nineteen-station national network with excellent coverage of the Fiji region
(see Figure 2) In addition MRD now has available five MEQ-800 portable
seismographs for occupation of temporary field sites telemetry station
testing and special refraction experiments While the Fiji network has
experienced considerable technical difficulties it has recorded some 5000
earthquakes since its installation and provides an invaluable basis for
seismological study of the Fiji region
8
15 FIJI SEISMIC NETWORK
)US AID (1979-1985)S A Japanese Aid (1981-1985)
16 A Fiji MRD (1983-1985)
E Temporary stations shy
17 A Taveuni
U ARKoro
Ovalau A UI 0
18 LEVU ~Gau Lakebae(J)Beqa
19 - a o_ Kadavu
20 I I I I 176 E 177 178 179 180 179 W178
Figure 2 Locations of seismic stations comprising the national seismic network of Fiji
9 The present OFDA-supported program has provided for three years of
field and laboratory research on the seismicity and tectonics of the Fiji
region and included approximately fifteen months of field work in Fiji
The field program resulted in substantial improvement of the Fiji seismic
network as well as in detailed studies of seismicity crustal structure
and tectonics of Fiji The work has already resulted in a number of
publications (Hamburger and Isacks 1983 Hamburger and Qiolevu 1983
Draunidalo and Hamburger 1984 Hamburger 1986 Hamburger and Isacks 1986
Hamburger and Everingham 1986) as well as several others in preparation
The scientific work summarized in this report represents a portion of those
studies
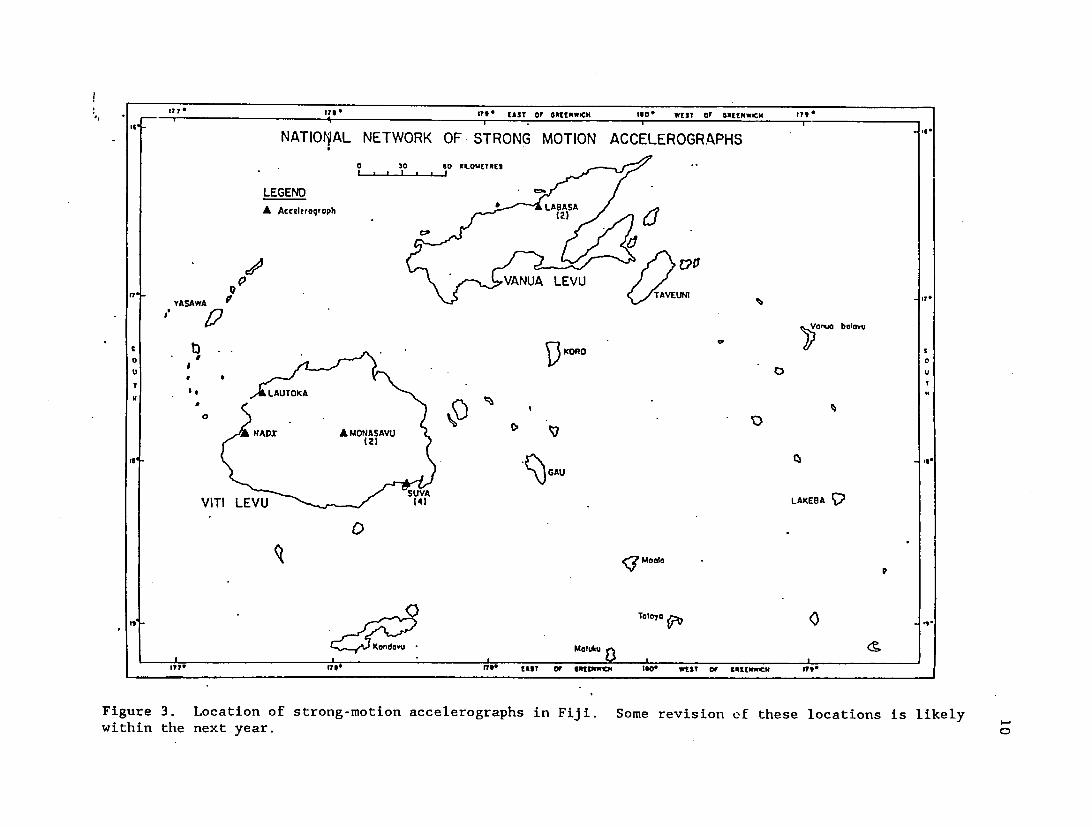
Strong Motion Accelerographs
The Mineral Resources Department also operates a network of strong
motion accelerographs now numbering ten Kinemetrics SMA-ls (Figure 3)
The initial six instruments of this network were granted to Fiji by AID the
remainder was purchased by the Fiji government Since establishment of the
SMA network three accelerogram records have been obtained from
moderate-sized earthquakes in Viti Levu The accelerograms are discussed in
detail in the following sections Records obtained from this network are
expected in the long run to provide the basis for ground accelerations
and thus for development of building codes specific to Fijis tectonic
setting and seismic regime
Related Scientific Programs
The Mineral Resources Department (MRD) includes an Offshore Geology
section which has an active program of marine geological and geophysical
- 1tEA 171 lT S Of GREENWICH 11W WEST OF OREENICN 17
NATIONAL NETWORK OF- STRONG MOTION ACCELEROGRAPHS
0 so 60 XLOUCTICI
LEGEND
LEVUE210 1--0VANUA
YASAWA I
Von boiftu
T
GAU
IT L LUTLAKEBA
I r r I I| 7~ WIiT OP SRZICI 360 WtST 0 pound[llUNWCHr 171
Figure 3 Location of strong-motion accelerographs in Fiji Some revision of these locations is likely within the next year
7
investigations in and around Fiji waters MRD also employs an engineering
geologist whose work includes microzonation of the Suva area mapping of
active faults in southeastern Viti Levu and investigation of soils subject
to earthquake-induced liquefaction An active program of geological mapping
and structural studies is also carried out by MRD They are supported by
personnel assistance from Australia and Great Britain
Suva is also the home of the United Nationij Committee for Coordination
of Offshore Prospecting in South Pacific Offshore Areas (CCOPSOPAC) This
organization coordinates much of the international marine research carried
on in the region and has been particularly helpful with Fijis investigashy
tion of its offshore waters
Critical Facilities
The major development in Fiji has been in and around the capital city
of Suva The population of the metropolitan area now exceeds 145000 and
most of the government commercial and industrial operations are concenshy
trated there The city has become a major comnercial transportation and
regional political center and has developed rapidly in the past ten years
Development in this period has incl ded construction of multistory
buildings a major electric power plant expansion of the Suva harbor and
most recently completion of the thirteen-story Central Monetary Authority
building in downtown Suva Much of this development has taken place on an
area of filled land close to sea level particularly vulnerable to earthshy
quake and tsunami damage This area was extensively damaged by the 1953
Suva earthquake and tsunami and is thus at significant risk from a repeat
occurrence of an event of comparable size
12
Other population centers with significant development include the towns
of Lautoka (pop 29000) Nadi (13000) and Ba (9000) on the island of
Viti Levu and Labasa (13000) on Vanua Levu The tourist industry which
is a major part of Fijis economy is concentrated on the southern and
western coasts of Viti Levu and is also vulnerable to earthquake and
tsunami damage The major development project in Fiji is the 82-meter high
Monasavu Dam in the interior of Viti Levu The earthfill dam was completed
in 1983 and is planned to provide most of the countrys electric power
needs through the end of the century
Earthquake Preparedness Programs
In awareness of the serious earthquake risk to development in Fiji the
government has adopted New Zealand earthquake design codes for most of the
urban areas of the country Seisric zone B codes applicable to areas of
moderate seismic activity in New Zealand have been chosen as appropriate
and are applied (in theory) to all domestic and commercial construction in
urban areas Considerable difficulty remains in enforcement of these
regulations particularly in construction of private dwellings Major
multistory building design is generally handled by overseas (Australia or
New Zealand) engineers and dynamic modelling tests are generally applied
for earthquake loadings at least as large as those required by the New
Zealand codes The Monasavu Dam underwent dynamic model testing by
Australian consulting engineers
Disaster preparedness is the responsibility of the Emergency Services
Committee (EMSEC) and the Prime Ministers Relief and Rehabilitation
Committee (PMRRC) EMSEC is responsible for coordination of disaster plans
maintenance of essential services advice to the Cabinet on emergency
13
measures and direction of relief work It is comprised of representatives
of the related ministries and public agencies PMRRC is chaired by the
Prime Minister of Fiji and has responsibility for long-term relief policy
and rehabilitation programs Fijis experience with recurrent weathershy
related disasters has spurred efforts for emergency communication systems
supply distribution temporary shelters and so on Much of this hurricane
disaster planning is applicable as well to earthquake and tsunami damage
Fiji is also a participant in the International Tsunami Warning System
Educational programs have been handled through the Fiji Broadcasting
System the Red Cross and the school system To a limited degree the
Public Works Department and the Mineral Resources Department have produced
educational materials related to earthquake hazards in Fiji
TECTONICS GEOLOGY AND PHYSIOGRAPHY
Plate Tectonic Setting
The theory of plate tectonics has provided a fundamental new undershy
standing of the distribution of earthquakes in the Fiji region This
section of the report is intended to briefly review the fundamental concepts
of plate tectonics and to establish the geologic and plate tectonic setting
of the Fiji Islands This information provides a basis for evaluating the
seismicity data presented in the following sections
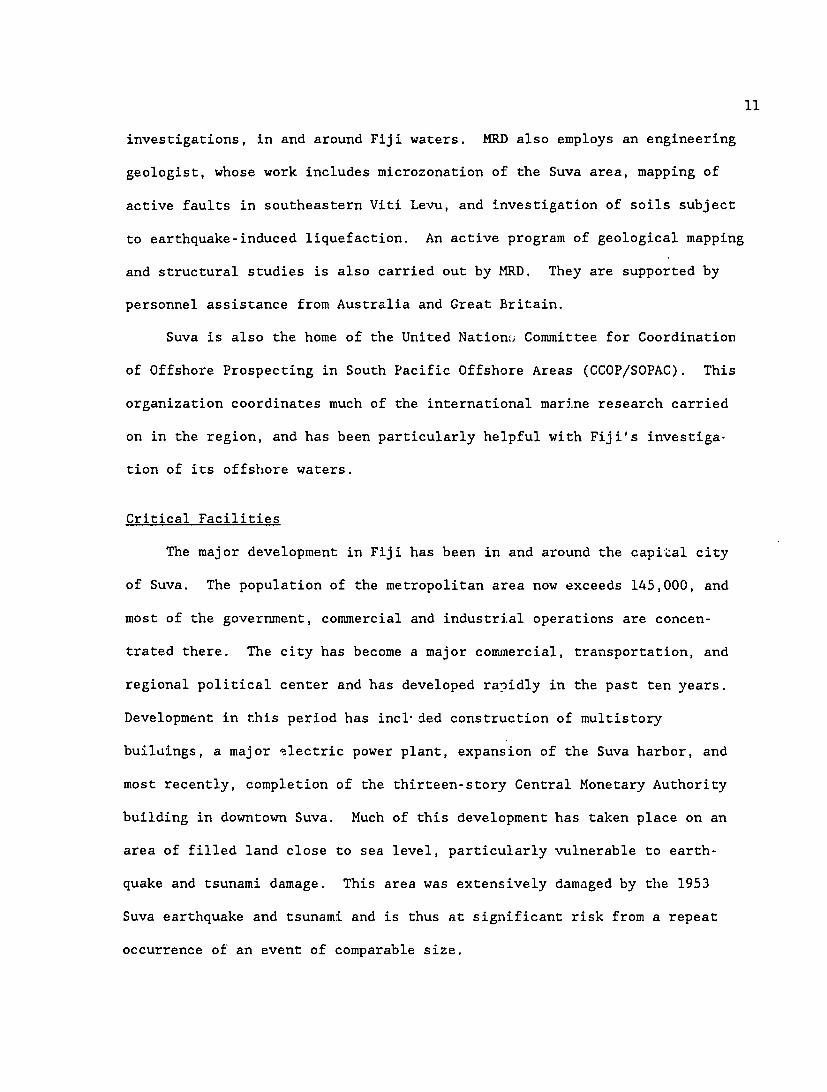
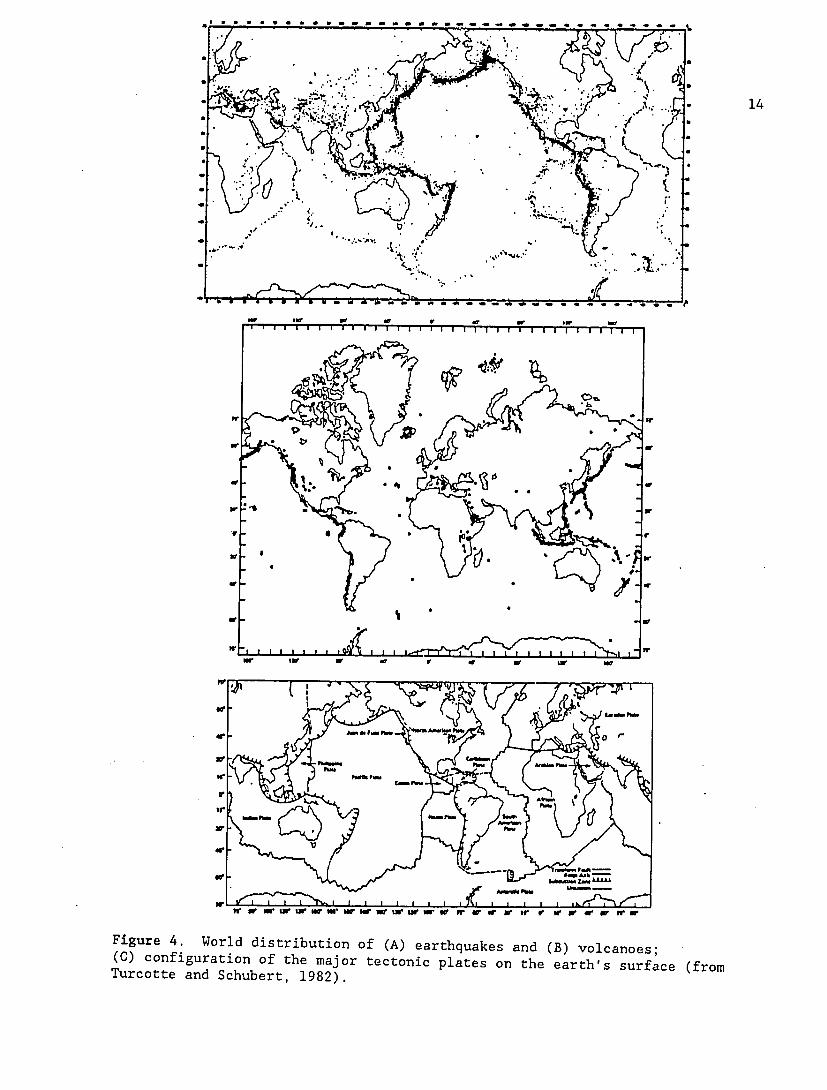
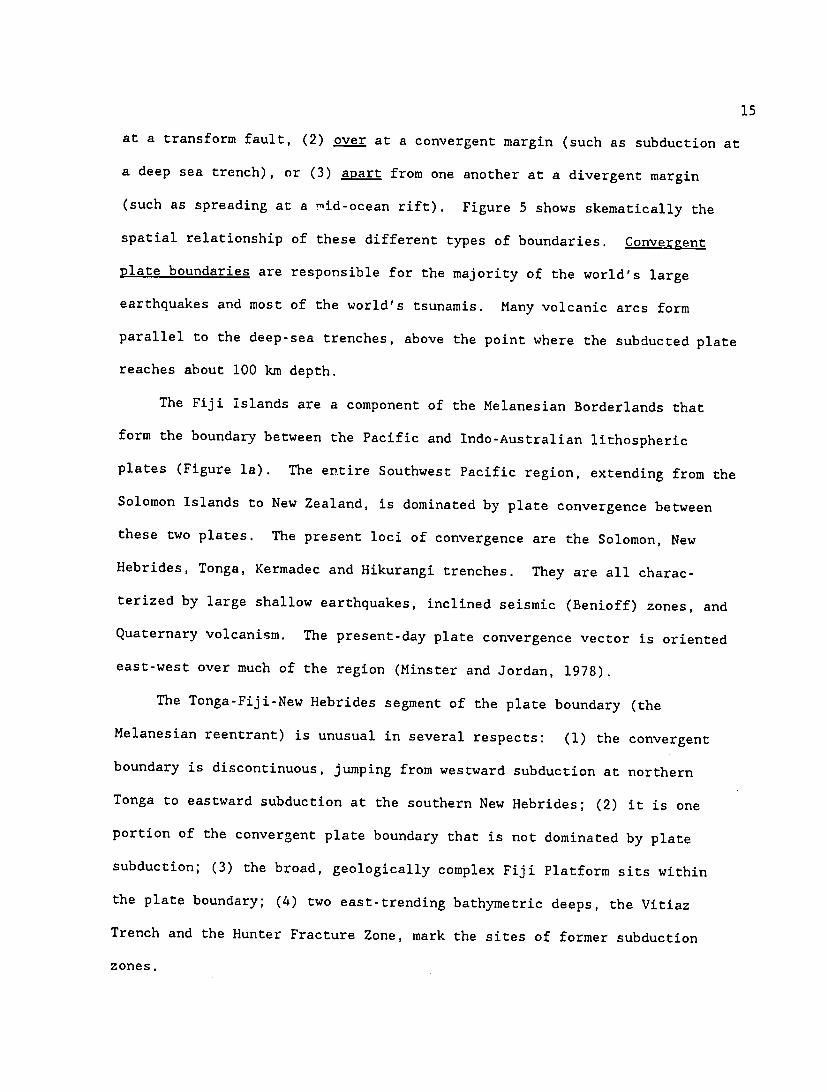
Fiji is located along a portion of what is commonly called the Pacific
Ring of Fire The concentration of earthquakes (Figure 4a) and volcanoes
(Figure 4b) along this trend were used to establish the boundaries of the
lithospheric plates in the modern view of plate tectonic theory (Figure 4c)
These plates which are relatively rigid cover the surface of the earth
like a mosaic of rigid caps and move against each other by sliding (1) past
~ 14-
bull - bull-bull -
44
N
-V V r
0
t
for OrN rw Or r U wrr w I - I 4
configu
Figue Wrddsrbto f()erhuksad()vlaos (0) rto fte mjr tcoi lts o h at ufc fo Turctte a Scuet 1982 0
TuUote n Schubrt 982
15
at a transform fault (2) over at a convergent margin (such as subduction at
a deep sea trench) or (3) apart from one another at a divergent margin
(such as spreading at a mid-ocean rift) Figure 5 shows skematically the
spatial relationship of these different types of boundaries Convergent
plate boundaries are responsible for the majority of the worlds large
earthquakes and most of the worlds tsunamis Many volcanic arcs form
parallel to the deep-sea trenches above the point where the subducted plate
reaches about 100 km depth
The Fiji islands are a component of the Melanesian Borderlands that
form the boundary between the Pacific and Indo-Australian lithospheric
plates (Figure la) The entire Southwest Pacific region extending from the
Solomon Islands to New Zealand is dominated by plate convergence between
these two plates The present loci of convergence are the Solomon New
Hebrides Tonga Kermadec and Hikurangi trenches They are all characshy
terized by large shallow earthquakes inclined seismic (Benioff) zones and
Quaternary volcanism The present-day plate convergence vector is oriented
east-west over much of the region (Minster and Jordan 1978)
The Tonga-Fiji-New Hebrides segment of the plate boundary (the
Melanesian reentrant) is unusual in several respects (1) the convergent
boundary is discontinuous jumping from westward subduction at northern
Tonga to eastward subduction at the southern New Hebrides (2) it is one
portion of the convergent plate boundary that is not dominated by plate
subduction (3) the broad geologically complex Fiji Platform sits within
the plate boundary (4) two east-trending bathymetric deeps the Vitiaz
Trench and the Hunter Fracture Zone mark the sites of former subduction
zones
16
A ST H E N 0 3 P H ERE
M E S 0 S P H E R E
ridge
trench ALshy
transform fault
Figure 5 (A) Sketch of the different types of plate tectonic boundaries and their relationships (Isacks et al 1968) (B) Diagram of the three types of boundaries in three-dimensional view
16a
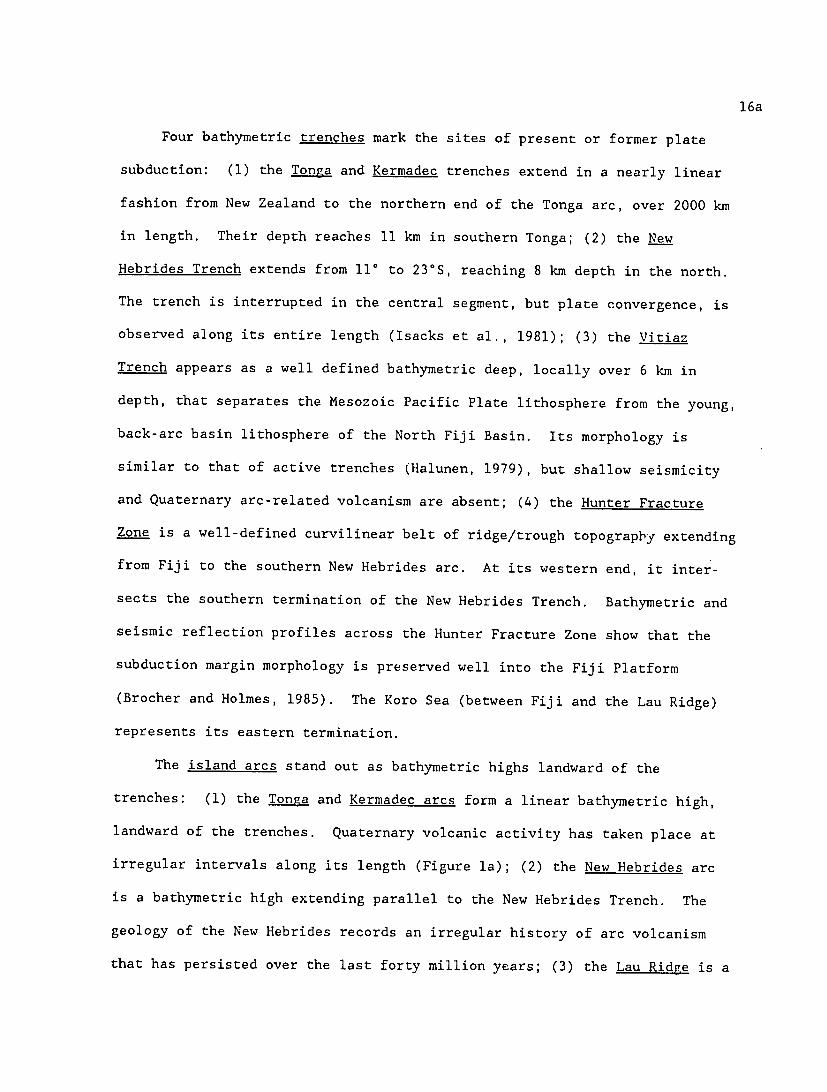
Four bathymetric trenches mark the sites of present or former plate
subduction (1) the Tonga and Kermadec trenches extend in a nearly linear
fashion from New Zealand to the northern end of the Tonga arc over 2000 km
in length Their depth reaches 11 km in southern Tonga (2) the New
Hebrides Trench extends from 110 to 23degS reaching 8 km depth in the north
The trench is interrupted in the central segment but plate convergence is
observed along its entire length (Isacks et al 1981) (3) the Vitiaz
Trench appears as a well defined bathymetric deep locally over 6 km in
depth that separates the Mesozoic Pacific Plate lithosphere from the young
back-arc basin lithosphere of the North Fiji Basin Its morphology is
similar to that of active trenches (11alunen 1979) but shallow seismicity
and Quaternary arc-related volcanism are absent (4) the Hunter Fracture
Zone is a well-defined curvilinear belt of ridgetrough topography extending
from Fiji to the southern New Hebrides arc At its western end it intershy
sects the southern termination of the New Hebrides Trench Bathymetric and
seismic reflection profiles across the Hunter Fracture Zone show that the
subduction margin morphology is preserved well into the Fiji Platform
(Brocher and Holmes 1985) The Koro Sea (between Fiji and the Lau Ridge)
represents its eastern termination
The island arcs stand out as bathymetric highs landward of the
trenches (1) the Tonga and Kermadec arcs form a linear bathymetric high
landward of the trenches Quaternary volcanic activity has taken place at
irregular intervals along its length (Figure la) (2) the New Hebrides arc
is a bathymetric high extending parallel to the New Hebrides Trench The
geology of the New Hebrides records an irregular history of arc volcanism
that has persisted over the last forty million years (3) the Lau Ridge is a
17
remnant arc isolated from the Tonga subduction zone by back-arc spreading
in the Lau Basin (Karig 1970) It previously formed part of the active
Tonga arc but is no longer volcanically active (Whelan et al 1985
Woodhall 1985a) (4) the Fiji Platform is delineated by a broad area of
shallow water depths separated from the Tonga and New Hebrides arcs by the
North Fiji and Lau basins The rocks exposed on the Fiji Islands record a
complex history of arc volcanism and deformation beginning in the Late
Eocene and extending into the Quatednary (Rodda 1967 1974 Gill et al
1984 Rodda and Kroenke 1984)
Active back-arc basin spreading has been identified in the North Fiji
Basin and Lau Basin based on shallow seismicity seismic wave velocities
and attenuation high heat flow magnetic anomalies and the presence of
tholeiitic basalts (Karig 1970 Chase 1971 Barazangi and Isacks 1971
Sclater et al 1972) These basins are marked by relatively uniform areas
of shallow water depths (-3 km) surrounding the Fiji Platform Inactive
back-arc basins have been identified in the Loyalty Basin (west of the New
Hebrides Trench) and the South Fiji Basin (south of the Hunter Fracture
Zone) They are marked by areas of relatively deep water that are separated
from the Southwest Pacific Basin by the active arcs and trenches Finally a
major regional scale transcurrent boundary in the interarc region is the
Fiji Fracture Zone (FFZ) The FFZ is most clearly evident as a continuous
belt of seismicity extending westward from the northern termination of the
Tonga Trench (Figure 6) Along several segments of the FFZ the belt of
seismicity coincides with rough seafloor morphology north of Fiji the FFZ
forms the well defined linear boundary of the Fiji Platform Strike-slip
focal mechanisms along its entire length confirm its identification as the
18
10 0 o0
S 0 ~ 0 C Cgt0
15 deg 0 0o 0 0 0 0
200 o 00
00
0 00C
coe20 ston L s 00
300 25 7 a e c th 165 B07 751017 7
dm 0 ( 0 0
165 E 170 175 180 175 W 170
Figure 6 Shallow earthquakes (depth _lt80 km) in the interarc region 1961-1984 Locations are from Preliminary Determination of Epicenters (PDE) constrained by _gt 20 stations Light shading indicates areas gt 2 km depth heavy shading shows areas gt 5 km depth for New Hebrides and Vitiaz trenches gt 75 km depth for Tonga and Kermadec trenches Bathymetric data from Kroenke et al (1983)
19
southern transcurrent boundary of the Pacific Plate in this area (Chase
1971 Isacks et al 1969 Green and Cullen 1973) However new seismoshy
logical and bathymetric observations require that the FFZ be a complex plate
boundary zone rather than a simple linear fault zone
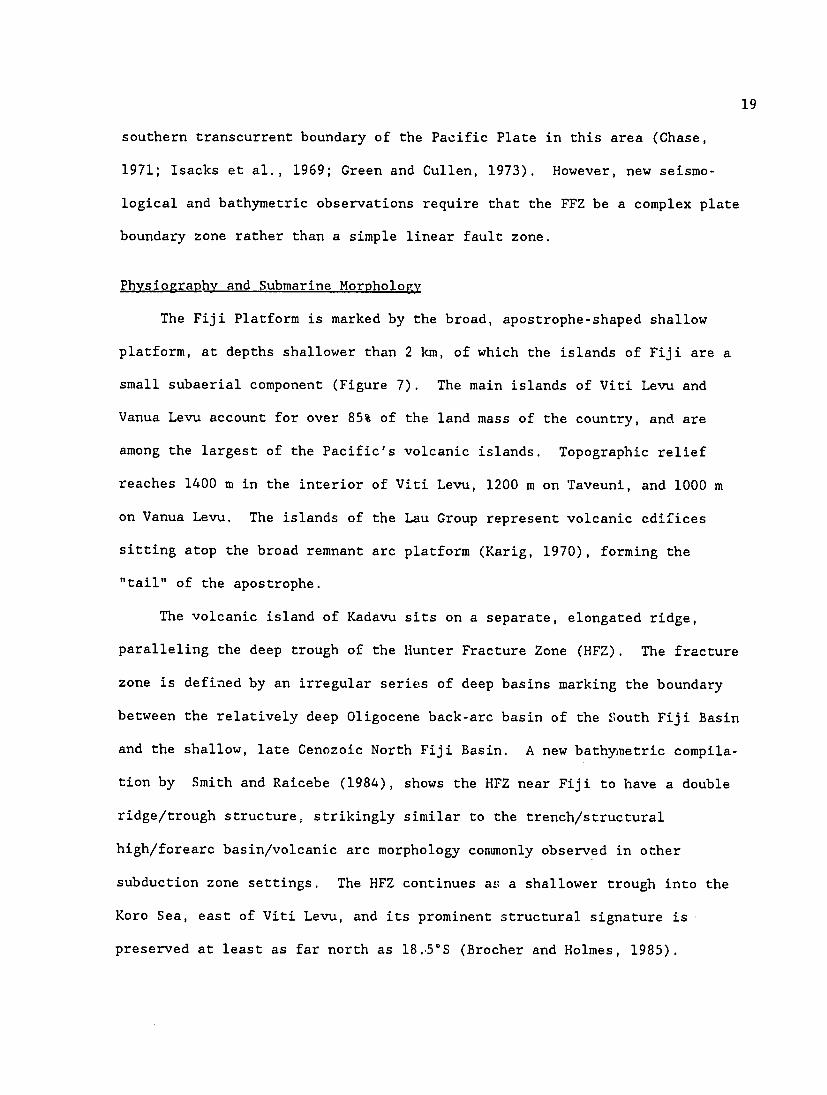
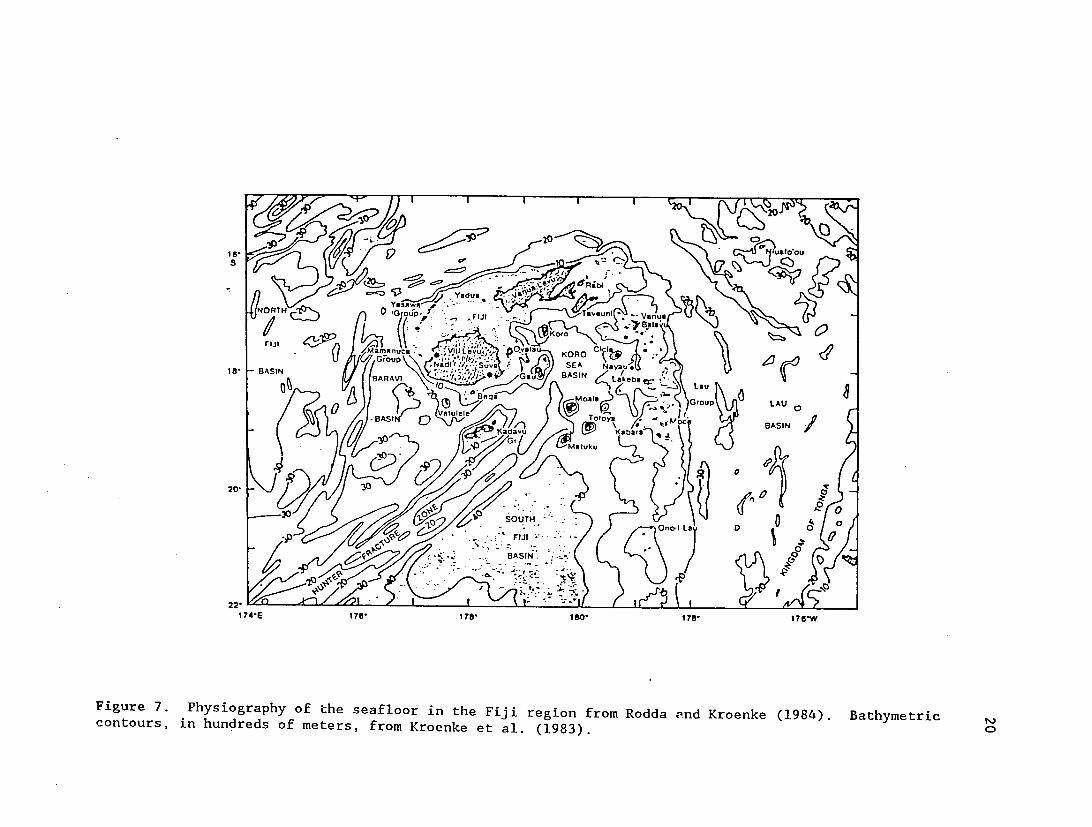
Physiography and Submarine Morphology
The Fiji Platform is marked by the broad apostrophe-shaped shallow
platform at depths shallower than 2 km of which the islands of Fiji are a
small subaerial component (Figure 7) The main islands of Viti Levu and
Vanua Levu account for over 85 of the land mass of the country and are
among the largest of the Pacifics volcanic islands Topographic relief
reaches 1400 m in the interior of Viti Levu 1200 m on Taveuni and 1000 m
on Vanua Levu The islands of the Lau Group represent volcanic edifices
sitting atop the broad remnant arc platform (Karig 1970) forming the
tail of the apostrophe
The volcanic island of Kadavu sits on a separate elongated ridge
paralleling the deep trough of the Hunter Fracture Zone (HFZ) The fracture
zone is defined by an irregular series of deep basins marking the boundary
between the relatively deep Oligocene back-arc basin of the South Fiji Basin
and the shallow late Cenozoic North Fiji Basin A new bathynetric compilashy
tion by Smith and Raicebe (1984) shows the HFZ near Fiji to have a double
ridgetrough structure strikingly similar to the trenchstructural
highforearc basinvolcanic arc morphology conmonly observed in other
subduction zone settings The HFZ continues as a shallower trough into the
Koro Sea east of Viti Levu and its prominent structural signature is
preserved at least as far north as 185degS (Brocher and Holmes 1985)
NORTHCjv
~~ 0
UP
aen
Yadua
Tavun
au
Vau
FIJI ~ 1-BSNBARAVI
~ a ~
BASIN 0
30G
alulele
0 Gau
( 5 ) j
10 -1
OA L k
BASIN Lkb
e ~ aoa~ ~ 5
M a ukru
b t~ mGrou t )
tooa~
LA U
AI ASI
200
~ SOUTH~ 7 J ~Ono-I-L D
0
BASIN
1741E 176 1781W78 6-
Figure 7 Physiography of the seafloor in the Fiji region from Rodda and Kroenke (1984) Bathymetriccontours in hundreds of meters from Kroenke et al (1983) C
21
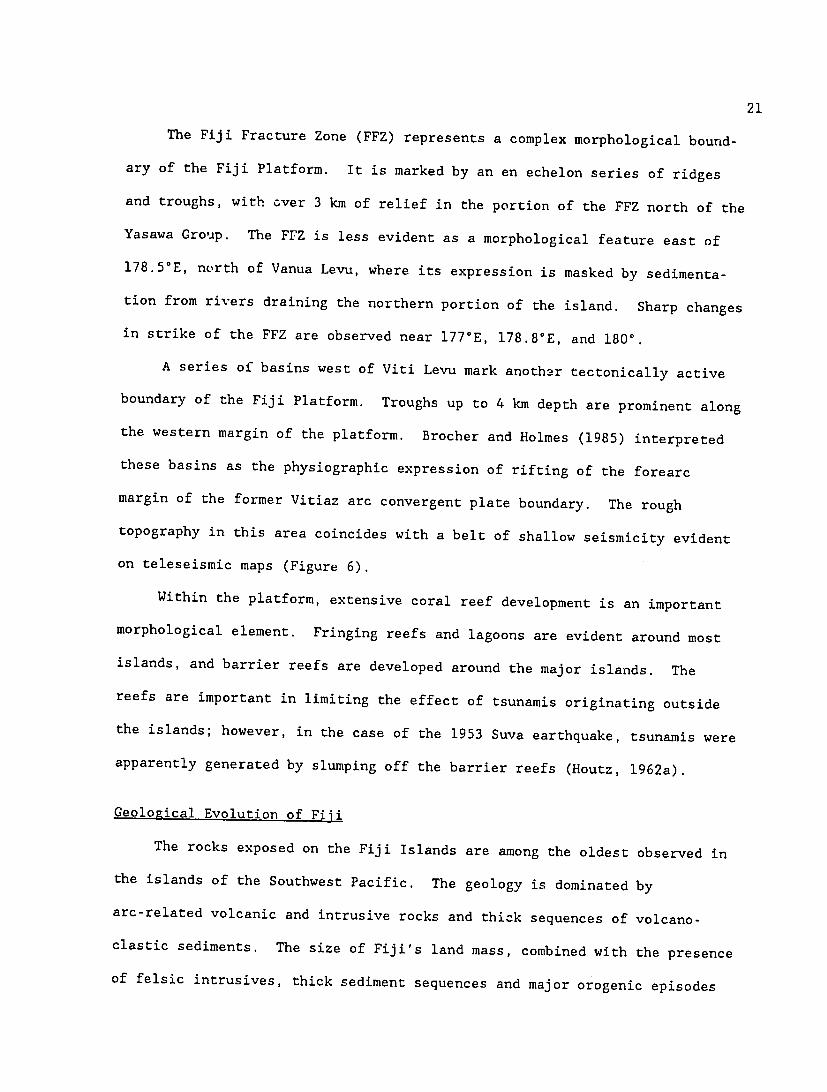
The Fiji Fracture Zone (FFZ) represents a complex morphological boundshy
ary of the Fiji Platform It is marked by an en echelon series of ridges
and troughs with over 3 km of relief in the portion of the FFZ north of the
Yasawa Group The FFZ is less evident as a morphological feature east of
1785degE north of Vanua Levu where its expression is masked by sedimentashy
tion from rivers draining the northern portion of the island Sharp changes
in strike of the FFZ are observed near 177degE 1788degE and 180 deg
A series of basins west of Viti Levu mark another tectonically active
boundary of the Fiji Platform Troughs up to 4 km depth are prominent along
the western margin of the platform Brocher and Holmes (1985) interpreted
these basins as the physiographic expression of rifting of the forearc
margin of the former Vitiaz arc convergent plate boundary The rough
topography in this area coincides with a belt of shallow seismicity evident
on teleseismic maps (Figure 6)
Within the platform extensive coral reef development is an important
morphological element Fringing reefs and lagoons are evident around most
islands and barrier reefs are developed around the major islands The
reefs are important in limiting the effect of tsunamis originating outside
the islands however in the case of the 1953 Suva earthquake tsunamis were
apparently generated by slumping off the barrier reefs (Houtz 1962a)
Geological Evolution of Fiji
The rocks exposed on the Fiji Islands are among the oldest observed in
the islands of the Southwest Pacific The geology is dominated by
arc-related volcanic and intrusive rocks and thick sequences of volcanoshy
clastic sediments The size of Fijis land mass combined with the presence
of felsic intrusives thick sediment sequences and major orogenic episodes
22
has led Fiji to be described as continental or quasi-continental in
character (Green and Cullen 1973 Eden and Smith 1984) However the Fiji
Platform differs from continental land masses in several important respects
(1) the average crustal thickness of 15-20 km is far les6 than normal
continental crust (2) low mantle velocities beneath the platform demonshy
strate a thermally attenuated lithosphere lacking the thick rigid mantle
lid that underlies most continental crust (3) the presence of ongoing
deformation and Neogene volcanism in the Fiji region observed both around
and within the Fiji Platform indicates a degree of crustal mobility that is
not expected of stable continental masses
Figure 8 presents a simplified geological map of Fiji from Rodda and
Kroenke (1984) The oldest known strata in Fiji are the Late Eocene rocks
of the Wainimala Group (Rodda 1976 Gill et al 1984 Rodda and Kroenke
1984) These strata were mildly deformed during the Wainimala Orogeny
during the middle Oligocene It is marked by a period of nondeposition
throughout Fiji that extends to the latest Oligocene Arc tholeiitic and
calc-alkaline magmatism occurred in Viti Levu throughout the Miocene (Gill
et al 1984 Rodda and Kroenke 1984)
The major orogenic episode in Fiji was the Colo Orogeny around 10 my
BP It is marked by (1) a prolonged gap in the stratigraphic record (2)
widespread folding and faulting accompanied by greenschist metamorphism
and (3) intrusion of tonalite gabbro and trondhjemite The Colo Orogeny
also coincides with a significant arc-deforming event in the New Hebrides
arc uplift and erosion of the Western Belt province at 11-8 my BP
(Carney and Macfarlane 1982)
160 1 1 i
S
VANUALV RAB
ax TAVEU-
17 Seatura V NAMENALALA U MIOCENE - HOLOCENE
_ O
B Rakiraki KORO
K
SEDIMENTARY ROCKS U OLIGOCENE - U MIOCENE UPPER WAINIMALA (includes someIgneous rocks) SIGATOKA (SI) and
SAVURA (Sa) GPS -~~~~ - MO~AKOGAI PLIOACAENE SHOHONITI OVROA
bull CALCALKALINE BASALTIC VOLCA-
Lautoka T Tavua V
NAIGANI Wand WAKAYA
NOES (includes Ba in part andesilic (B)Koroimavua (K) volcanic groups)
K -
ALAU 7BASALTS NA IR 2
BATIKI NAIRA__
JOVALAUMIOCENE HOLOCENE ALKALIC (I Mio on Vili Levu Plio on
Vanua Levu Plio-Pleist on Koro Pleist-Holo on Taveuni)
U MIOCENE - L PLIOCENEMACUADROVE SUPER GROUP
180 _(Vanua Levu) GAU U MIOCENE CALCALKALINE
ROCKS
MIOCENE STOCKS 010 LVPLUTONIC
(D BEOA OLIGOCENELGCN AUASOK SUITE(Tholeiitic )
177degE 178deg 179 deg 180
Figure 8 Simplified geology of Fiji from Rodda and Kroenke (1984) Blank areas within Viti Levu are known or likely Lower Wainimala Group (Late Eocene to Early Miocene rocks)
24
Following the Colo deformation a resurgence of volcanizm took place
throughout Fiji (Gill et al 1984 Woodhall 1985a) An unusual sequence
of thick rhyolitic volcanics were extruded at -7 my BP in northeastern
Vanua Levu that may be related to incipient fragmentation of the Fiji arc
(Gill et al 1984)
During the period 5-3 my BP magmatism in Fiji changed dramatically
to become dominated by transitionalshoshonitic volcanism in northern Viti
Levu and the Lomaiviti Group (Dickenson et al 1968 Gill 1976 Gill et
al 1984) After 3 my BP volcanic rocks in Fiji were dominated by
alkali basalts generated from a very different ocean island-like source
(Gill 1976 Gill et al 1984)
Through the period of arc modification an unusual remnant of
calc-alkaline iolcanism persisted on Kadavu Island at the southern edge of
the Fiji Platform Kadavu is on a major bathymetric ridge paralleling the
Hunter Fracture Zone The trench-like morphology of the fracture zone
(Launay 1982a) combined with the oblique truncation of linear magnetic
anomalies in the South Fiji Basin is indicative of subduction along this
boundary post-dating the Oligocene creation of the South Fiji Basin
Subduction-related andesites and dacites dated at 34 + 05 my BP
(Whelan et al 1985) document convergence along the Hunter Fracture Zone
extending into the Quaternary
Other documented Quaternary volcanism in Fiji is found in the alkali
basalts of the Lomaiviti and southern Lau Groups (Whelan et al 1985
Woodhall 1985a) and on Taveuni Island (Frost 1974) The Taveuni ash
eruption dated at 2050 years BP based on archaeological investigations
is the only documented Holocene activity in Fiji
25 Post-Colo structural deformation is evidenced by faulting of rocks
deposited above the Colo unconformity Many of these faults observed in
Viti Levu are near-vertical with significant stratigraphic throws (Band
1968 Rodda 1974) In many cases the post-Colo rocks are unaffected by
the faults in the underlying basement (Rodda 1974) From the Late
Pliocene the island of Viti Levu has been affected by rapid domal uplift
that has resulted in the abandonment and deformation of late Cenozoic
erosion surfaces in western Viti Levu (Dickenson 1972) Basaltic rocks of
the Ba Volcanic Group erupted as pillow lavas below sea level during the
Pliocene have subsequently been uplifted to over 1000 m elevation in
central Viti Levu (Rodda 1976) This uplift within the Fiji Platform
clearly post-dates the fragmentation of the Vitiaz arc and the establishment
of the present tectonic configuration The observation of anomalous
(low-velocity) mantle beneath the Fiji Platform (Hamburger 1986) reflects
thermal thinning of the Fiji lithosphere associated with the processes of
back-arc magmatism in the neighboring Lau and North Fiji basins The rapid
doming of Viti Levu then may be an isostatic response to the introduction
of low-density mantle material beneath the Fiji Platform
On a historical time scale geodetic observations in southeastern Viti
Levu by Berryman (1981) indicate rates of shear strain on the order of 06
pradyr accumulated over the period 1909-1980 The crustal seismicity that
is documented in the folowing section is the product of ongoing deformation
of the Fiji lithosphere
SPATIAL DISTRIBUTION OF EARTHQUAKES IN FIJI
A prodigious amount of seismicity data has been gathered for the Fiji
region including (1) the historical record of large earthquakes based on
26
macroseismic and instrumental observations (2) teleseismic earthquake
locations from the global seismic network (3) results from an early
three-station network operated in Fiji during 1965-1969 and (4) local and
regional earthquake locations from the telemetered network operated in Fiji
since 1979
The combination of all these data sources provides a composite picture
of the seismicity of Fiji over a wide range of spatial temporal and
magnitude scales each data source is limited by its magnitude threshold
duration of observation and degree of spatial resolution Together they
provide the state-of-the-art in our understanding of where and how earthshy
quakes occur within and around the Fiji Islands The important application
of this understanding is a more realistic assessment of seismic potential
along Fijis seismogenic zones and the seismic risk to major development
within the country
Historical Earthquakes
Fijis short written history prevents a complete reconstruction of the
recurrence cycles of major earthquakes throughout the Fiji region Nonetheshy
less the earthquake history for the past 1) years however incomplete
demonstrates aspects of Fiji seismicity not evident from an examination of
more uniform but shorter-term seismicity catalogs
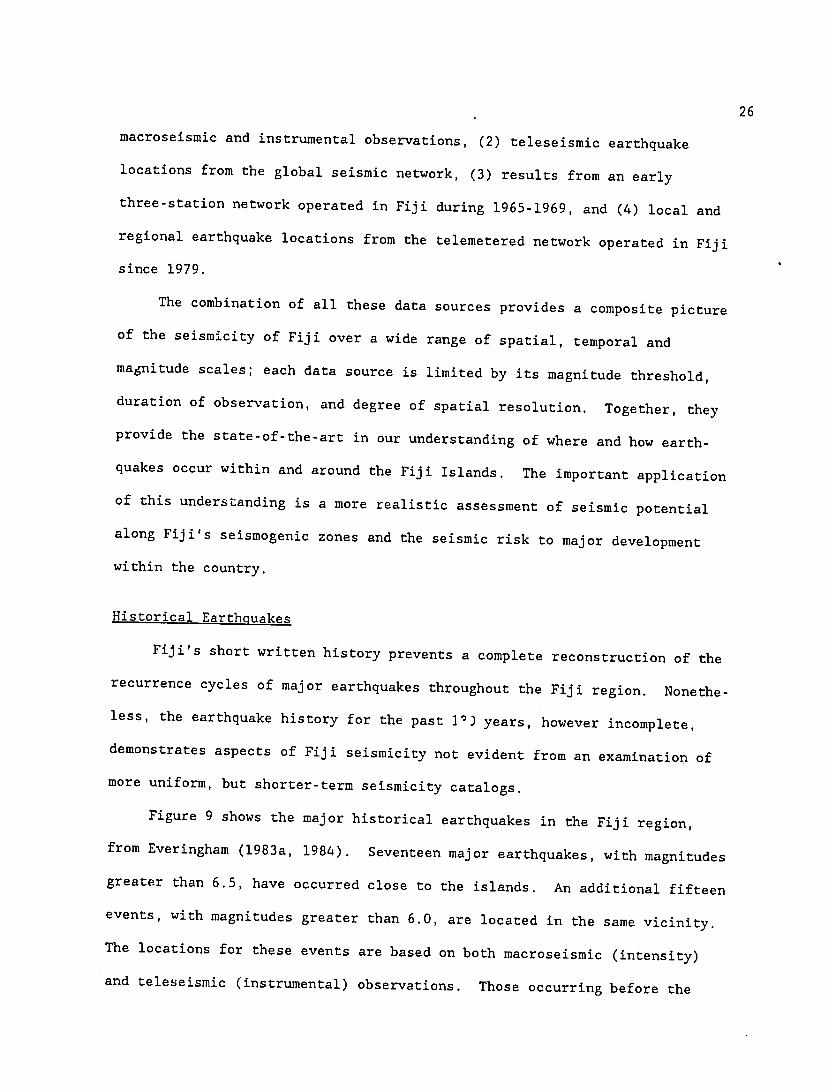
Figure 9 shows the major historical earthquakes in the Fiji region
from Everingham (1983a 1984) Seventeen major earthquakes with magnitudes
greater than 65 have occurred close to the islands An additional fifteen
events with magnitudes greater than 60 are located in the same vicinity
The locations for these events are based on both macroseismic (intensity)
and teleseismic (instrumental) observations Those occurring before the
27
1971
01982 t1962
1950 a96oO-O a
974 O195760199 0A L9VU 1919 1)
1884 97 199574
0 06 1921 G151AWALEV
G1932
VITI LEVU t869
00 NIJON
195953 05
0934 01953 C5 omI 15
1950 o
01965 D LARGE SHALLOW EARTHOUAKES IN THE FIJI REGION
01955 0 Moviluot 60 - 64 195 IMS) 65 -70
1963 SC-Lt
II I I 1 I
Figure 9 Historical seismicity in the Fiji region Data are from Everingham (1983a 1984)
28
middle of this century must be regarded as approximate Errors of up to one
degree in instrumental locations result from inaccuracies in reporting of
arrival times uneven station distribution manual earthquake locations
etc Reporting of earthquake intensities is not altogether reliable
particularly before the beginning of the century Nonetheless the level of
development in Fiji since 1900 provides assurance that major events have not
been omitted from the catalogs
A large proportion of the major events around Fiji took place along the
microplate boundaries surrounding the platform As with the teleseismic and
microseismic events discussed below these earthquakes concentrate in the
northwestern Lau Basin (large events northeast of Vanua Levu) along the
Fiji Fracture Zone (seven events located north and west of Vanua Levu) and
along a zone of seismicity west of Viti Levu (five events near 176degE)
In contrast to the overall distribution of teleseismically located
earthquakes however several major events occurred within the Fiji
Platform These include the 1953 Suva earthquake (N - 675) the 1932 Koros
earthquake (Ms - 65) and the 1979 Taveuni earthquake (Ms - 69) discussed
in the following sections In addition Everingham (1983a 1984) reported
four significant events near Kadavu Island (1850 1935 and 1950) and one
within Viti Levu (1869) Two smaller but damaging earthquakes took place
near Kadavu (1918) and near Ovalau Island (1906) None of these events
exceeded magnitude (Ms) 71 however several had significant macroseismic
effects and are thus important for seismic hazard evaluation The occurshy
rence of large earthquakes within the platform confirms a conclusion that
emerges from the microearthquake observations intraplate deformation
within the Fiji Platform is a significant component of the regional deformashy
29
tion field but it occurs more infrequently and is separated by longer
periods of quiescence than that occurring along the interplate seismic zones
that bound the platform The obser7ation that earthquakes larger than
Ms - 71 are not recorded in a region characterized by high rates of relashy
tive plate motion suggests that the Fiji lithosphere is incapable of storing
sufficient stress to result in larger earthquakes Because of the brevity
of the seismological history of the Fiji region the occurrence of larger
prehistoric earthquakes cannot be ruled out
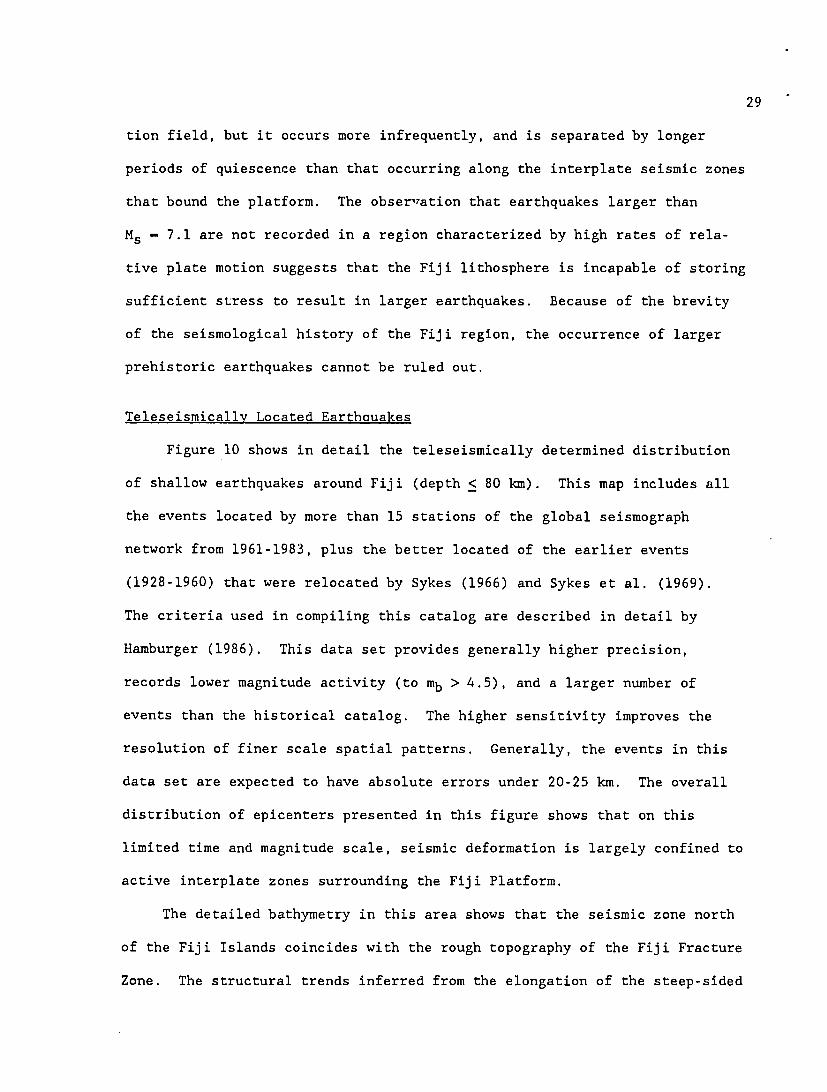
Teleseismicallv Located Earthquakes
Figure 10 shows in detail the teleseismically determined distribution
of shallow earthquakes around Fiji (depth lt 80 km) This map includes all
the events located by more than 15 stations of the global seismograph
network from 1961-1983 plus the better located of the earlier events
(1928-1960) that were relocated by Sykes (1966) and Sykes et al (1969)
The criteria used in compiling this catalog are described in detail by
Hamburger (1986) This data set provides generally higher precision
records lower magnitude activity (to mb gt 45) and a larger number of
events than the historical catalog The higher sensitivity improves the
resolution of finer scale spatial patterns Generally the events in this
data set are expected to have absolute errors under 20-25 km The overall
distribution of epicenters presented in this figure shows that on this
limited time and magnitude scale seismic deformation is largely confined to
active interplate zones surrounding the Fiji Platform
The detailed bathymetry in this area shows that the seismic zone north
of the Fiji Islands coincides with the rough topography of the Fiji Fracture
Zone The structural trends inferred from the elongation of the steep-sided
30
15
~ ~ 00
16 C lt -rdeg ro2 0
16 0pound0
~0017 shy
18 bull
00
20O
176 E 177 178 179 180 179 W 178
Figure 10 Teleseismically located earthquakes in the Fiji region Locations from Sykes (1966) and Sykes et al (1969) for 1928-1960 (A and B grades) from International Seismological Summary (ISS) and International Seismological Centre (ISC) catalogs for 1961-1980 and PreliminaryDetermination of Epicenters (PDE) Catalog for 1981-1984 Depth contours for 2 3 and 4 km depth are from Smith and Raicebe (1984)
31
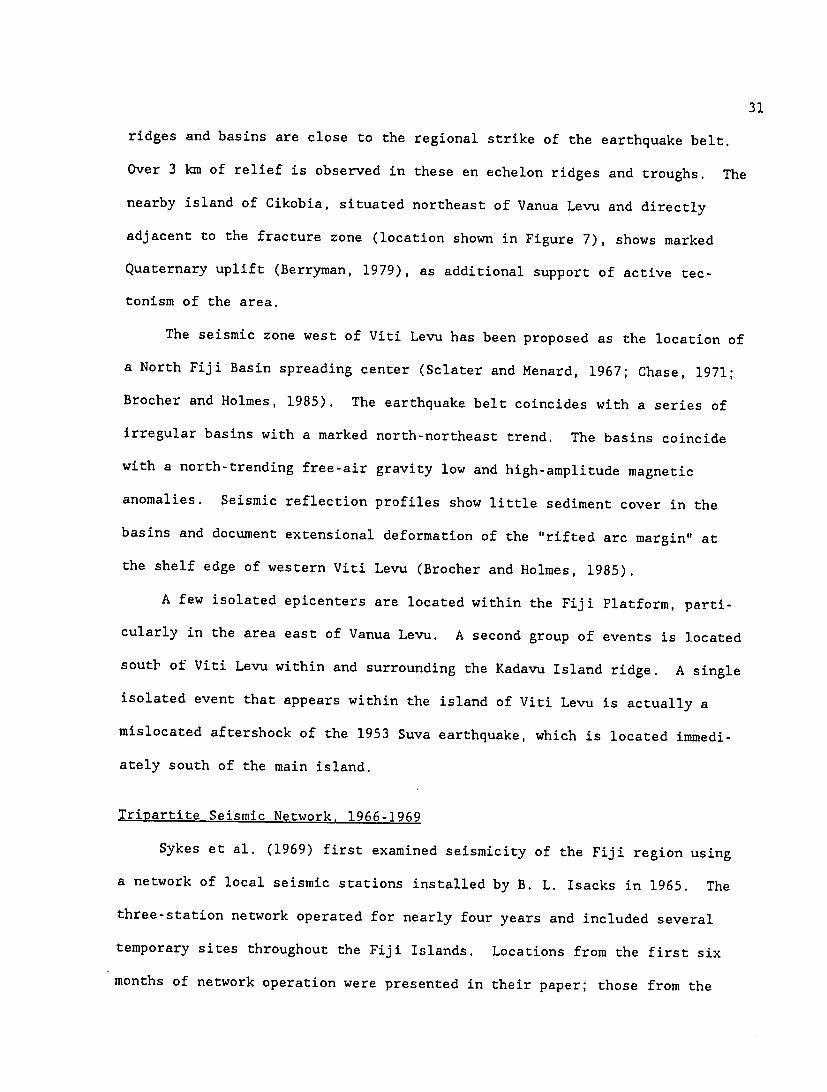
ridges and basins are close to the regional strike of the earthquake belt
Over 3 km of relief is observed in these en echelon ridges and troughs The
nearby island of Cikobia situated northeast of Vanua Levu and directly
adjacent to the fracture zone (location shown in Figure 7) shows marked
Quaternary uplift (Berryman 1979) as additional support of active tecshy
tonism of the area
The seismic zone west of Viti Levu has been proposed as the location of
a North Fiji Basin spreading center (Sclater and Menard 1967 Chase 1971
Brocher and Holmes 1985) The earthquake belt coincides with a series of
Irregular basins with a marked north-northeast trend The basins coincide
with a north-trending free-air gravity low and high-amplitude magnetic
anomalies Seismic reflection profiles show little sediment cover in the
basins and document extensional deformation of the rifted arc margin at
the shelf edge of western Viti Levu (Brocher and Holmes 1985)
A few isolated epicenters are located within the Fiji Platform partishy
cularly in the area east of Vanua Levu A second group of events is located
sout of Viti Levu within and surrounding the Kadavu Island ridge A single
isolated event that appears within the island of Viti Levu is actually a
mislocated aftershock of the 1953 Suva earthquake which is located immedishy
ately south of the main island
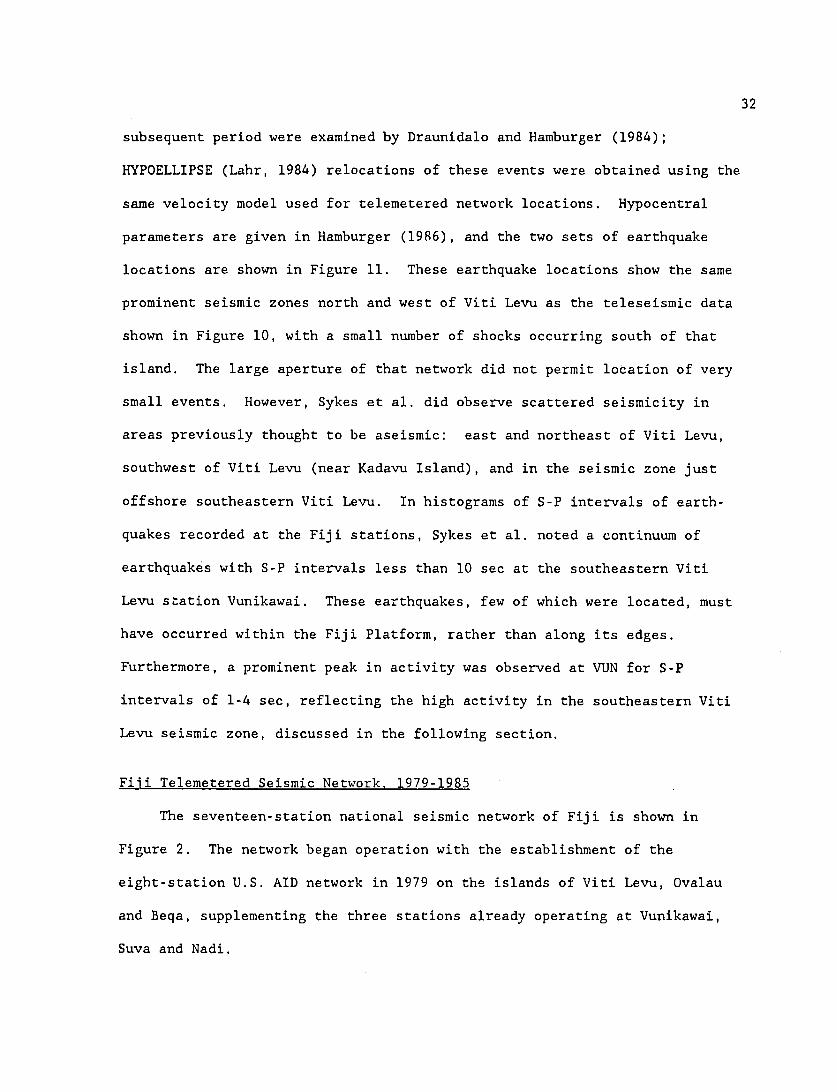
Tripartite Seismic Network 1966-1969
Sykes et al (1969) first examined seismicity of the Fiji region using
a network of local seismic stations installed by B L Isacks in 1965 The
three-station network operated for nearly four years and included several
temporary sites throughout the Fiji Islands Locations from the first six
months of network operation were presented in their paper those from the
32
subsequent period were examined by Draunidalo and Hamburger (1984)
HYPOELLIPSE (Lahr 1984) relocations of these events were obtained using the
same velocity model used for telemetered network locations Hypocentral
parameters are given in Hamburger (1986) and the two sets of earthquake
locations are shown in Figure 11 These earthquake locations show the same
prominent seismic zones north and west of Viti Levu as the teleseismic data
shown in Figure 10 with a small number of shocks occurring south of that
island The large aperture of that network did not permit location of very
small events However Sykes et al did observe scattered seismicity in
areas previously thought to be aseismic east and northeast of Viti Levu
southwest of Viti Levu (near Kadavu Island) and in the seismic zone just
offshore southeastern Viti Levu In histograms of S-P intervals of earthshy
quakes recorded at the Fiji stations Sykes et al noted a continuum of
earthquakes with S-P intervals less than 10 sec at the southeastern Viti
Levu station Vunikawai These earthquakes few of which were located must
have occurred within the Fiji Platform rather than along its edges
Furthermore a prominent peak in activity was observed at VUN for S-P
intervals of 1-4 sec reflecting the high activity in the southeastern Viti
Levu seismic zone discussed in the following section
Fiji Telemetered Seismic Network 1979-1985
The seventeen-station national seismic network of Fiji is shown in
Figure 2 The network began operation with the establishment of the
eight-station US AID network in 1979 on the islands of Viti Levu Ovalau
and Beqa supplementing the three stations already operating at Vunikawai
Suva and Nadi
33
S1WRN I[A 41iI
S
2
176 E 177 178 179 180 179 W178
Figure 11 Microearthquakes in the Fiji region 1965-1969 Locations from 3-station seismic network operated by Sykes et al (1969) Triangles show locations of seismic stations Squares indicate locations obtained by Sykes et al for first 6 months of network operation Circles indicate relocations of events reported in subsequent 2 12 years by Draunidalo and Hamburger (1984) Depths constrained at 10 kin Bathymetry as in Figure 10
34
In December 1981 a five-station telemetered network was established
on the islands of Vanua Levu Koro and Taveuni through the Japanese aid
program From that time all the telemetered stations have been recorded on
a Japanese event-triggered 25-channel hot stylus pen recorder In early
1983 the Fiji Mineral Resources Department expanded the network by the
establishment of a three-station telemetry network around Monasavu Dam in
central Viti Levu Considerable technical difficulties have been encounshy
tered at many of the telemetered stations due to unreliable power supplies
degradation of electronic equipment weather-related interference and wind
and lightning damage Such problems have limited the operation of network
stations to some 50-75 of total operating time
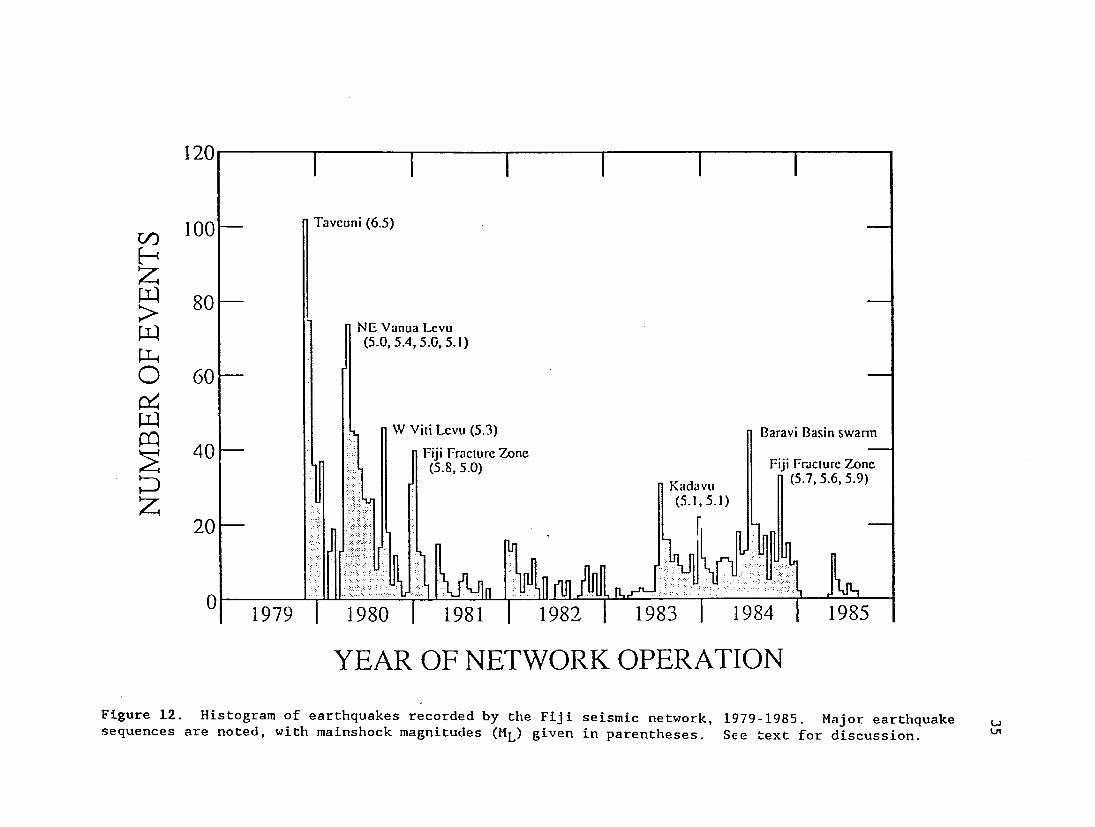
The history of network operation is reflected in the histogram of
earthquakes located by the network (Figure 12) The system began recording
in November 1979 and was immediately inaugurated by the occurrence of two
major earthquake sequences the November 16 Taveuni earthquake (Ms - 69)
and its aftershocks and a prolonged swarm of moderate-sized events in
April-May 1980 including three events with ML gt 50 northeast of Vanua
Levu Two additional peaks in the histogram are associated with sequences
west of Viti Levu and along the Fiji Fracture Zone in September and
December 1980 respectively Through 1981 the network operated less
reliably debilitated by technical problems with field stations telemetry
and the recording system
The increase in activity in December 1981 reflected a period of
maintenance and repair of existing instruments and the establishment of the
Japanese aid network Through June 1983 the level of recorded seismicity
was to some degree limited by the operation of an event-triggered recording
120 1 1 1 1 1 1
C 100 Taveuni (65)
H
80 gtNE Vanua Levu
(5054 5051)
0 60
40 W Viii Levu (53)
Fiji Fracture Zone Baravi Basin swarm
Z (58 50)
~(51 KadaVU
51)
Fiji Fracture Zone (57 56 59)
20 1
0 1979 1980 1981 1982 1983 1984 1985
YEAR OF NETWORK OPERATION
Figure 12 Histogram of earthquakes recorded by the Fiji seismic network 1979-1985 Major earthquake sequences are noted with mainshock magnitudes (ML) given in parentheses See text for discussion
36
system The sudden increase in mid-1983 followed the reinstallation of a
continuous recording system and a second period of instrument maintenance
Subsequent peaks in the histogram are associated with major earthquake
sequences near Kadavu Island (July-August 1983) along the Baravi Basin
(June 1984) and along the western Fiji Fracture Zone (October 1984) The
major gap in recording at the beginning of 1985 follows the devastation of
network telemetry by Hurricanes Nigel and Eric The data available at the
time of this writing end in August 1985
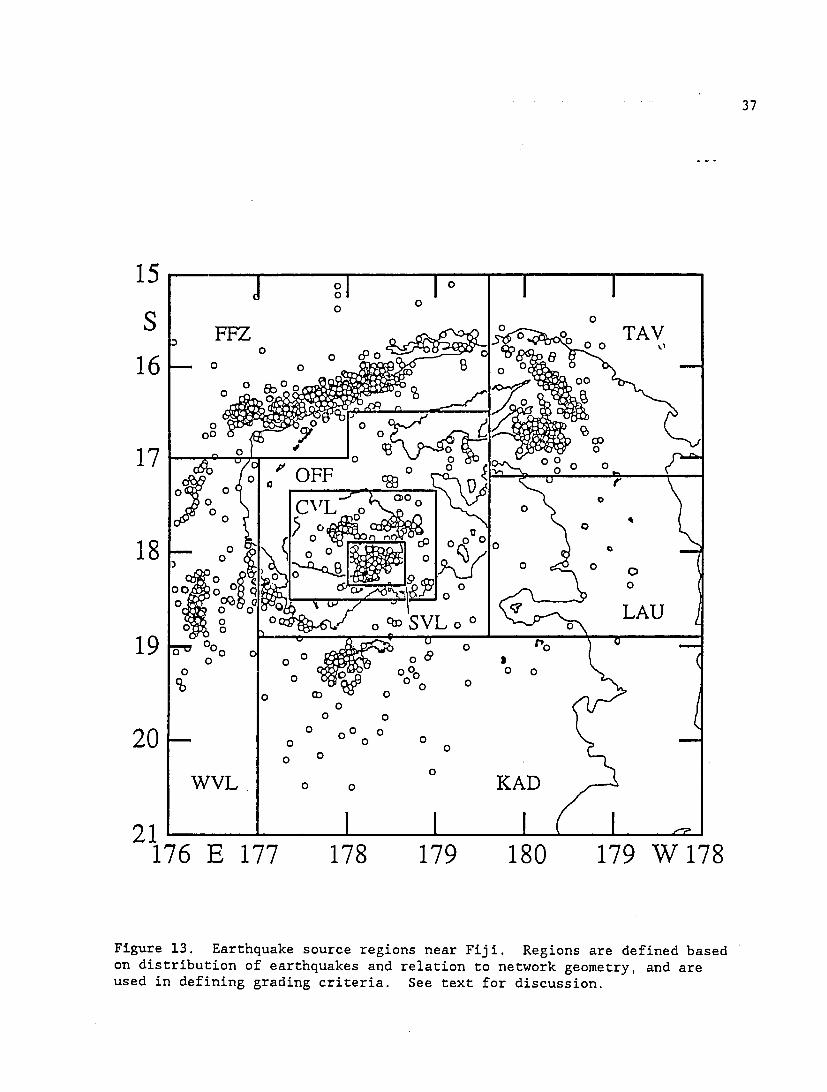
Earthquake Locations
During the nearly six years of network operation over 5000 local
earthquakes were recorded by the Fiji seismic network Of these events
approximately 1800 were recorded with sufficient redundancy to provide
reliable earthquake locations Details of the earthquake location procedure
can be found in Hamburger (1986)
A grading scheme was designed to cull out the best locations within
each earthquake source region The earthquakes were first classified into
eight source regions based on the distribution of earthquake foci and their
relation to the seismic network (Figure 13) Grading criteria were applied
consistently within each seismic region but varied from region to region
The criteria used are based on the output parameters from the location
program HYPOELLIPSE number of recorded P- and S-arrivals RMS residuals
minimum epicenter-station distance azimuthal gap and the size of the error
ellipse for each event The grading criteria are summarized by Hamburger
(1986) These grading criteria provide a systematic means to compare
earthquake locations within each area
37
0100 Io15
S FFZ 0 S o TAV 0S
00 0 o o0 0o - 0
0 O 00 0 0 0POFF 0 U _
0 L 0 0
FEo 3 o o o o 0
0 0 o0
SVL o oo LAU 19 degVo o CC 1 0 00 0 0 11760 E 17 o 17 17 r10 17W7
00 0 D 000 0
0 0 0
000
WVL 0 0o KAD
21 1 1 ( - -a
176 E 177 178 179 180 179 W 178
Figure 13 Earthquake source regions near Fiji Regions are defined based
on distribution of earthquakes and relation to network geometry and are used in defining grading criteria See text for discussion
38
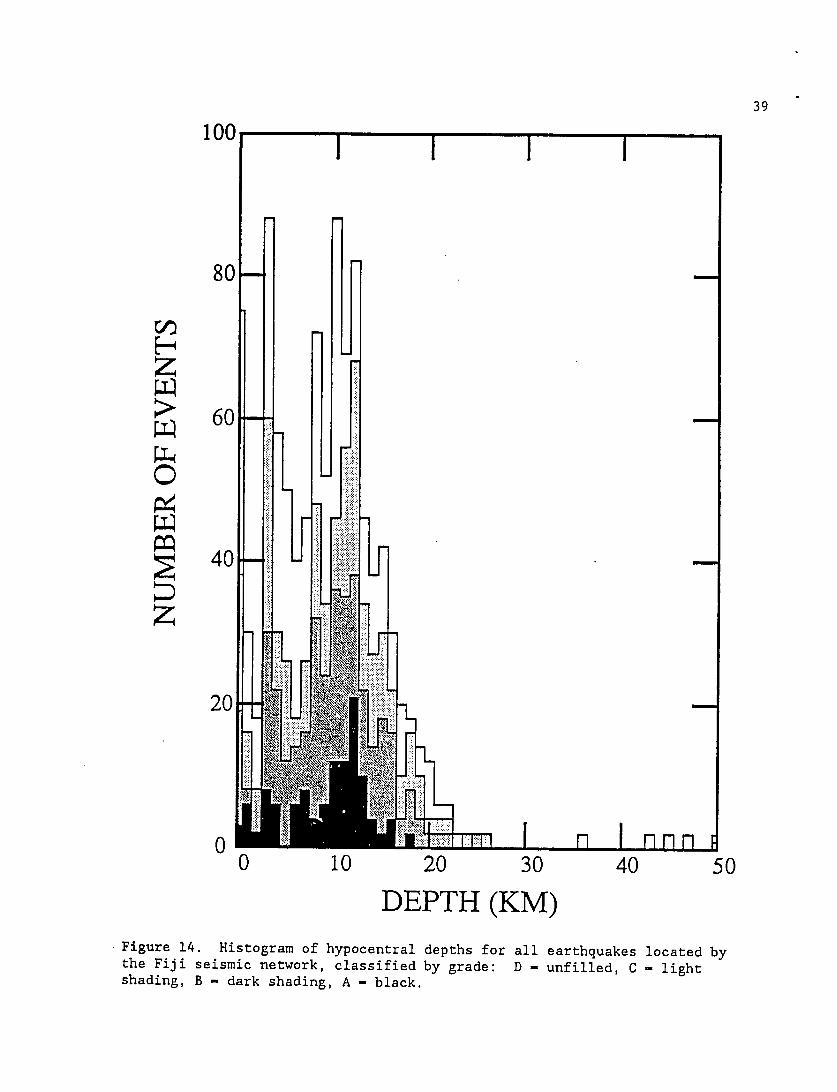
Depth Determinations
Determination of reliable earthquake depths is a function of the number
and accuracy of arrival time readings and of the geometry of the network
used for locating each event For earthquakes located within the dense
network of southeastern Viti Levu the pattern of arrival times (or
source-to-station distances) uniquely determines a particular depth at which
the RMS of the traveltime residuals is minimized On the other hand for an
earthquake in the Taveuni region far outside the seismic network the
arrival-time data can be matched by virtually any crustal depth
Because there is very little constraint on hypocentral depths outside
the seismic network the hypocenters of these earthquakes were simply fixed
at a midcrustal depth of 10 km consistent with the observed focal depths in
Viti Levu (see below) Depths were allowed to vary only for earthquakes
within and near Viti Levu and for the small number of events outside this
region recording both P- and S-arrivals at a station within 50 km
The distribution of earthquake depths in Fiji is given in Figure 14
Virtually all the well constrained depths fall within 20 km of the earths
surface and a ubstantial majority at depths lt 13 km A very small number
of earthquakes were located at depths exceeding 30 km but all of these
events are considered poorly constrained (grade D) From the network
locations there is no evidence of any intermediate-depth activity that
might be expected from the recent northward subduction of South Fiji Basin
lithosphere beneath the Fiji Platform (Malahoff et al 1982a Gill et al
1984) A single teleseismic event located south of the Platform at 73 km
depth was found to be a mislocated shallow event The best-constrained
hypocentral depths those located within the small-aperture network in
39
100
80
z ~60
20shy
o
0 10 20 30 40 50
DEPTH (KM) Figure 14 Histogram of hypocentral depths for all earthquakes located bythe Fiji seismic network classified by grade D - unfilled C - light shading B - dark shading A - black
40
southeastern Viti Levu cluster at midcrustal depths of 7-13 km The deepest
A-grade event is near the base of the crust at 18 km The B-grade events
extend to 20 km depth
In general the depth distribution is quite similar to that observed in
areas of continental extension and strike-slip deformation (Chen and Molnar
1983 Smith and Bruhn 1984) Corbett (1984) found earthquakes located by
the southern California seismic network to be limited to the upper 22 km of
crust A similar double-peaked histogram was observed with concentrations
of activity in the upper 4 km and between 10 and 16 km depth Chen and
Molnar ascribe the overall concentration of activity in the upper crust to
high geothermal gradients limiting the material strength in the mantle and
lower crust The observed concentration of seismic activity within the Fiji
crust and the sharp drop-off in activity near its base is consistent with
the observation of anomalous (low-velocity) upper mantle beneath Fiji
stresses sufficient to generate earthquakes can accumulate only in the thin
crust that forms a rigid cap on the relatively hot ductile mantle of the
Fiji Platform
Earthquake Magnitudes
When possible earthquake magnitudes have been assigned to all of the
newly located events in Fiji The magnitudes were computed from trace
amplitudes and coda durations recorded on instruments of the telemetered
network The development of a magnitude scale for the Fiji network is
described in detail by Hamburger (1986)
The distribution of magnitudes reported for all events during the
operation of the seismic network is shown in Figure 15 Magnitudes range
from local magnitude ML - -10 (microearthquakes in southeastern Viti Levu)
41
150
125
W
Z 100
75--shy
25-shy
mm4
62 0 2 4
MAGNITUDE
Figure 15 Histogram of magnitudes for all earthquakes located by the Fiji seismic network
42
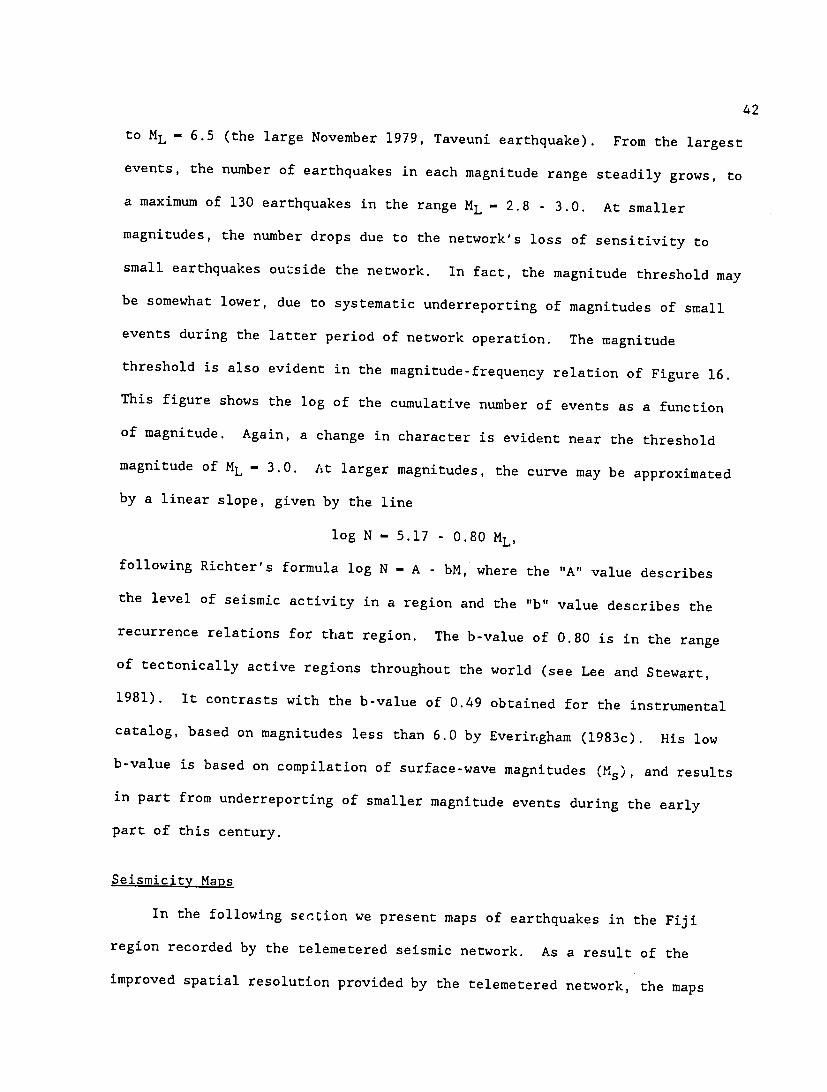
to ML - 65 (the large November 1979 Taveuni earthquake) From the largest
events the number of earthquakes in each magnitude range steadily grows to
a maximum of 130 earthquakes in the range ML - 28 - 30 At smaller
magnitudes the number drops due to the networks loss of sensitivity to
small earthquakes outside the network In fact the magnitude threshold may
be somewhat lower due to systematic underreporting of magnitudes of small
events during the latter period of network operation The magnitude
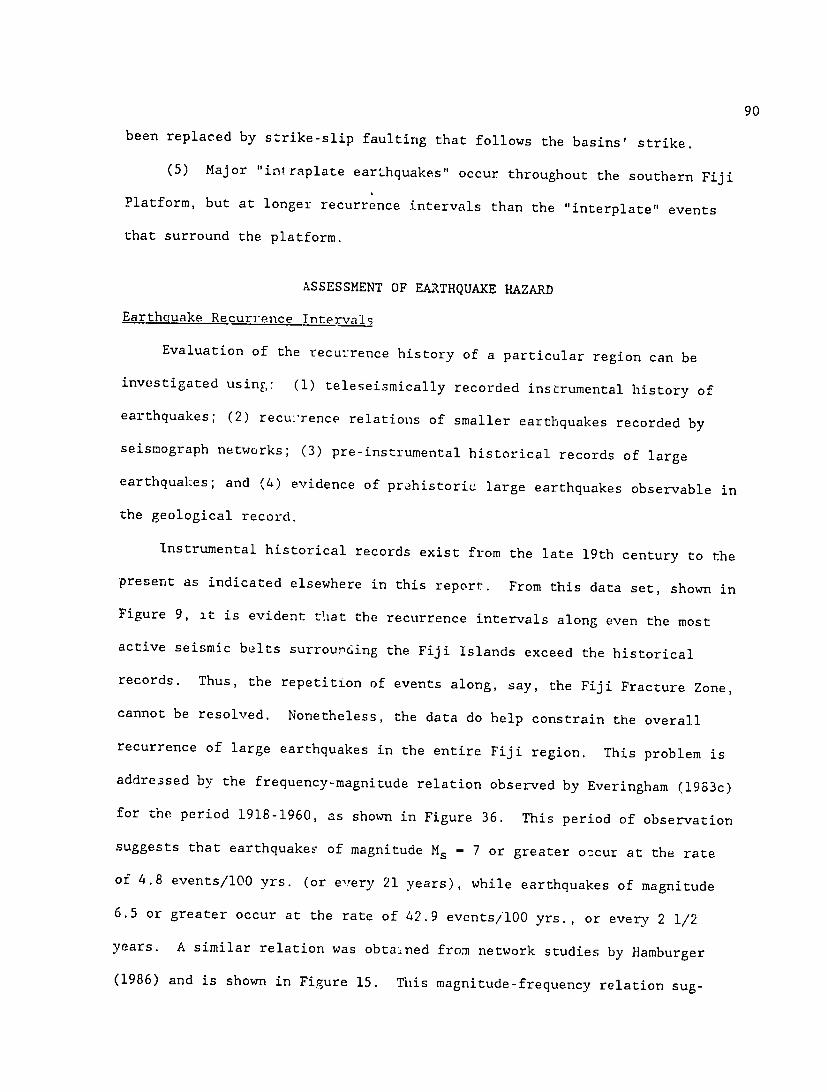
threshold is also evident in the magnitude-frequency relation of Figure 16
This figure shows the log of the cumulative number of events as a function
of magnitude Again a change in character is evident near the threshold
magnitude of ML - 30 At larger magnitudes the curve may be approximated
by a linear slope given by the line
log N - 517 - 080 ML
following Richters formula log N - A shy bM where the A value describes
the level of seismic activity in a region and the b value describes the
recurrence relations for that region The b-value of 080 is in the range
of tectonically active regions throughout the world (see Lee and Stewart
1981) It contrasts with the b-value of 049 obtained for the instrumental
catalog based on magnitudes less than 60 by Everingham (1983c) His low
b-value is based on compilation of surface-wave magnitudes (Ms) and results
in part from underreporting of smaller magnitude events during the early
part of this century
Seismicity Maps
In the following section we present maps of earthquakes in the Fiji
region recorded by the telemetered seismic network As a result of the
improved spatial resolution provided by the telemetered network the maps
3-shy
+
+
2 ++++ ++++ + +++ ++ ++ ++ +++ +++ +++++++++++++ +
-gt 1 U
00
0 2 4 6
MAGNITUDE (ML)
Figure 16 Magnitude-frequency plot for all events located by the Fijiseismic network The portion of the curve above ML - 30 is approximatedby the straight line log N - 517 - 080 ML The maximum network threshold near ML - 30 is indicated by the falloff in the curve at smaller magnitudelevels
44
can be used to characterize the seismic regime along each of the seismic
zones in the Fiji region Space-time diagrams of the network seismicity are
used to elucidate temporal patterns of earthquake occurrence along the
seismic zones Gross sections are presented for the earthquakes located
within and around the island of Viti Levu where depth resolution is
greatest
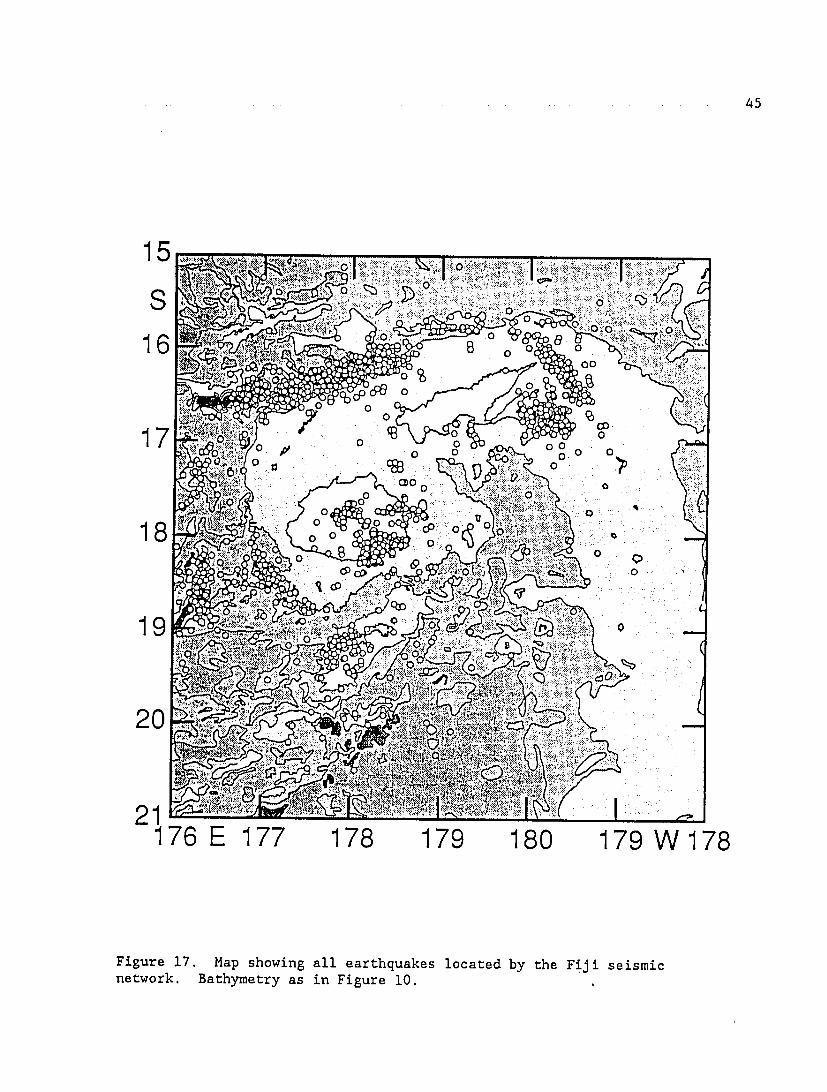
The 1800 earthquakes located by the telemetered network are presented
in Figure 17 Hypocentral parameters for each event are given in Hamburger
(1986) Figure 18 shows all earthquakes classified by magnitude Detailed
maps of several major earthquake sequences are displayed in Figure 20
Figures 24 and 29 present larger-scale maps of the seismicity within the
island of Viti Levu
Compared to the historical and teleseismic data shown in Figures 9 and
10 these new seismicity maps provide a new detailed picture of the pattern
of deformation within and around the Fiji Platform Several initial obsershy
vations stand out First the pattern of activity is far from uniform
Earthquakes occur in concentrated zones both within and along the boundaries
of the platform large areas exist which are virtually aseismic
Second the major zones of activity along the platforms margins
coincide with those defined by the historical teleseismic and the triparshy
tite network data the northeastern edge of the platform the Fiji Fracture
Zone the basins west of Viti Levu and to a lesser extent the Hunter
Fracture ZoneKadavu region That is these zones are also active at higher
magnitude ranges within a time scale observable by instrumental observashy
tions The areas of high activity within the Fiji Platform are not well
populated in the teleseismic data This contrast between network and
bull bull
45
15 0
0
OO 0 0
0 ~ii
0 A 0f) 0
k 993_
20 0
176 o 07 P 8 7 7178 170
FigZr hwn l atqae 07 oae yteFj esi0a
newoDBahm r asi igr 0
46
15 1 1
+S o16 0 +Q 1
0
0 0 _to017 0o 4 A 0 0
4~0
0 + 0
1 0 0 o +0~ Oc
100 + + 00 00
1 P0 0 0 O 0 00
0 o4
00 + S0 0 + 0 O
D R 01 0
0 00
0 0
21 +0 + 0 I I 176 E 177 178 179 180 179 W178
Figure 18 Map showing all earthquakes located by the Fiji seismic network classified by magnitude Grosses ML lt 2 small open circles 2 lt ML lt 3 large open circles 3 _ltML lt 4 shaded circles 4 lt ML lt 5 filled circles ML gt 5 2-km contour as in Figure 10
47
S i I
t
16
WA
17
00
19 0
20
M~A
176 E 177 178 179 180 179 W 178
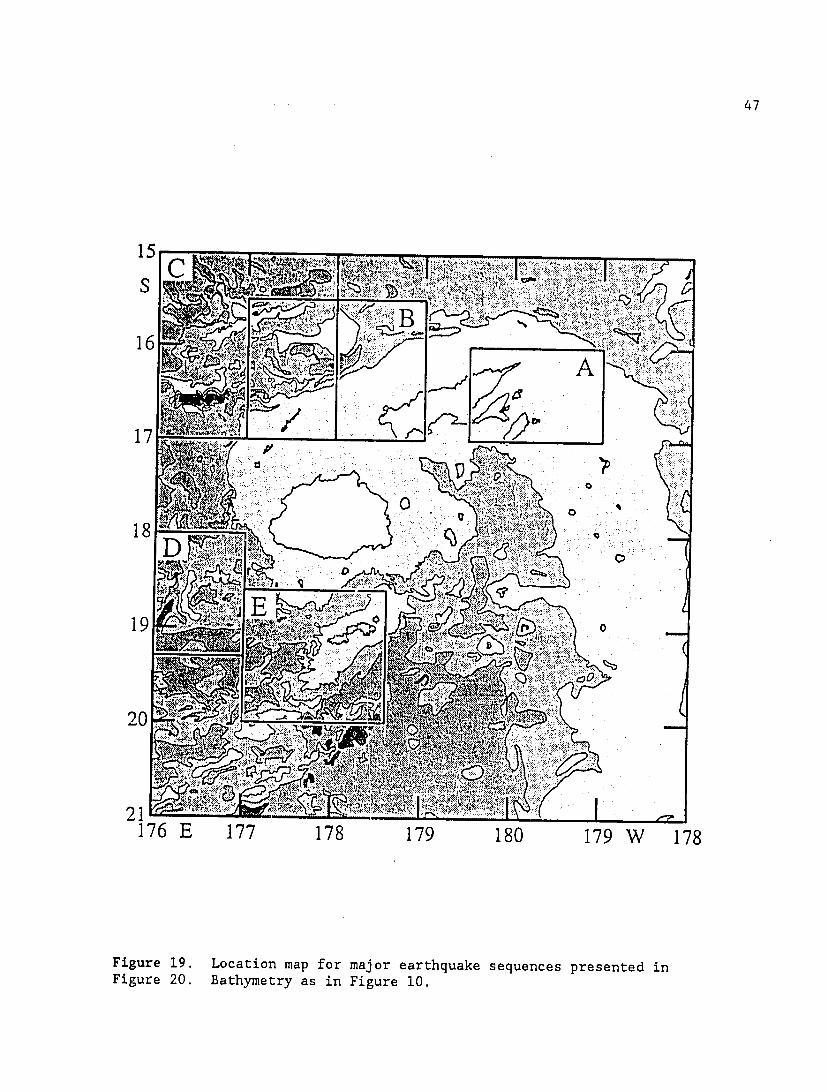
Figure 19 Location map for major earthquake sequences presented in Figure 20 Bathymetry as in Figure 10
48
17
0 A S VI VII S
180 E 179 W
A C
19
E 176177
19 V V
C
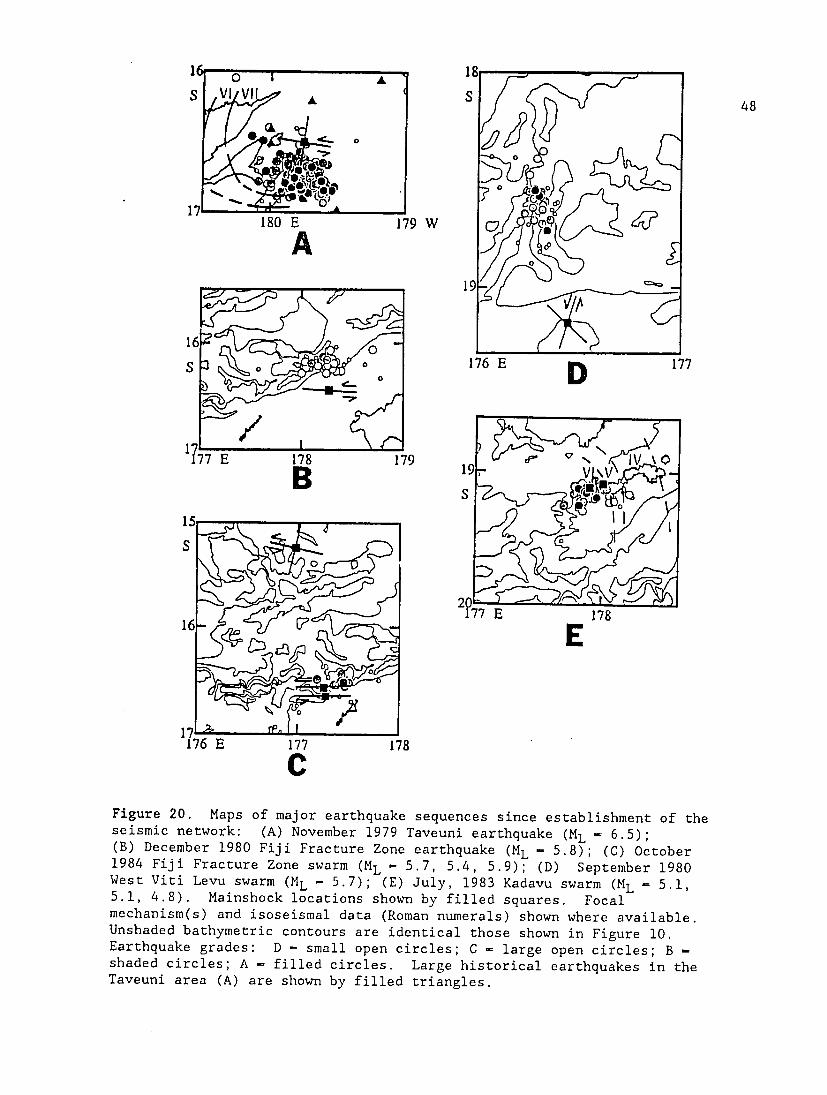
Figure 20 Maps of major earthquake sequences since establishment of the seismic network (A) November 1979 Taveuni earthquake (ML - 65)(B) December 1980 Fiji Fracture Zone earthquake (ML - 58) (C) October 1984 Fiji Fracture Zone swarm (ML 57 54 59) (D) September 1980 West Viti Levu swarm (ML - 57) (E) July 1983 Kadavu swarm (ML = 51 51 48) Mainshock locations shown by filled squares Focal mechanism(s) and isoseismal data (Roman numerals) shown where available Unshaded bathymetric contours are identical those shown in Figure 10 Earthquake grades D - small open circles C = large open circles B shyshaded circles A - filled circles Large historical earthquakes in the Taveuni area (A) are shown by filled triangles
49
teleseismic observations is fundamentally a sampling problem The intrashy
plate zones of activity are observed by the network because (1) the
intraplate seismic zones are very active at lower magnitude ranges and
(2) the network happened to catch several unusual major earthquake
sequences in areas of relatively low activity The distribution of earthshy
quake magnitudes (Figure 18) bears out both causes (1) the concentration
of activity in southeastern Viti Levu is almost entirely composed of small
events (ML lt 3) Of the 500 earthquakes located within Viti Levu none have
been large enough (mb gt 45) to have been located teleseismically (2) the
concentration of activity near Taveuni Island is the result of a fortuitous
earthquake sequence two weeks after the network began operation In the
following section each of the major earthquake source areas in the Fiji
region are considered in detail (shown in Figure 13)
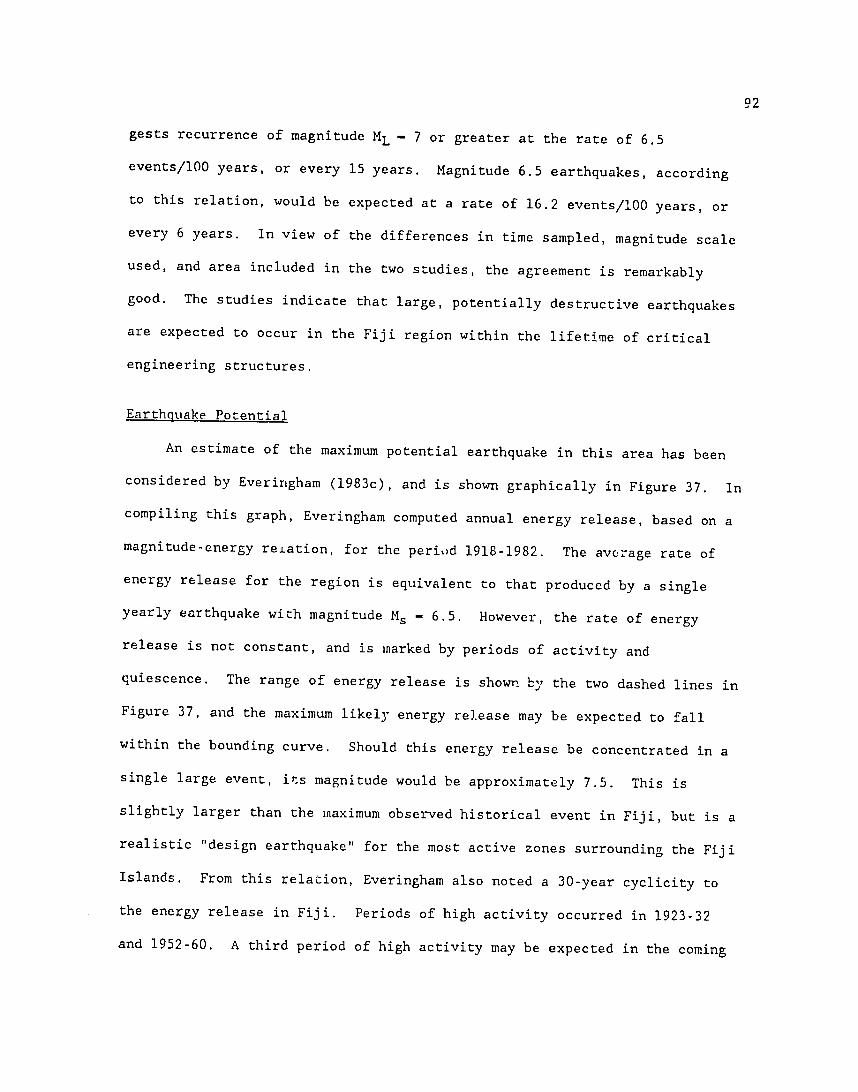
1 Taveuni (TAV) This area is dominated by two major earthquake
sequences that occurred early in the networks operation The 16 November
1979 Taveuni earthquake (M - 69) is the largest event to occur in thes
region in over 30 years and the most destructive in Fiji since the 1953 Suva
earthquake The earthquake was strongly felt (MM VII in the closest
islands) throughout the islands of Taveuni Vanua Levu Rabi and Kioa
(Figure 20A) An intense aftershock sequence continued for several weeks
following the mainshock and isolated events continued for over a year
thereafter The probable mainshock location was constrained by the pattern
of macroseismic data as well as by S-P intervals at temporary seismic
stations occupying nearby sites in the days following the mainshock
(Everingham 1982a) The teleseismic solutions (PDE ISC locations) did not
utilize the local network observations and are positioned 20 km to the
50
southwest of the probable location In any case the mainshock and aftershy
shock locations indicate that the rupture occurred well within the thickened
crust of the Fiji Platform
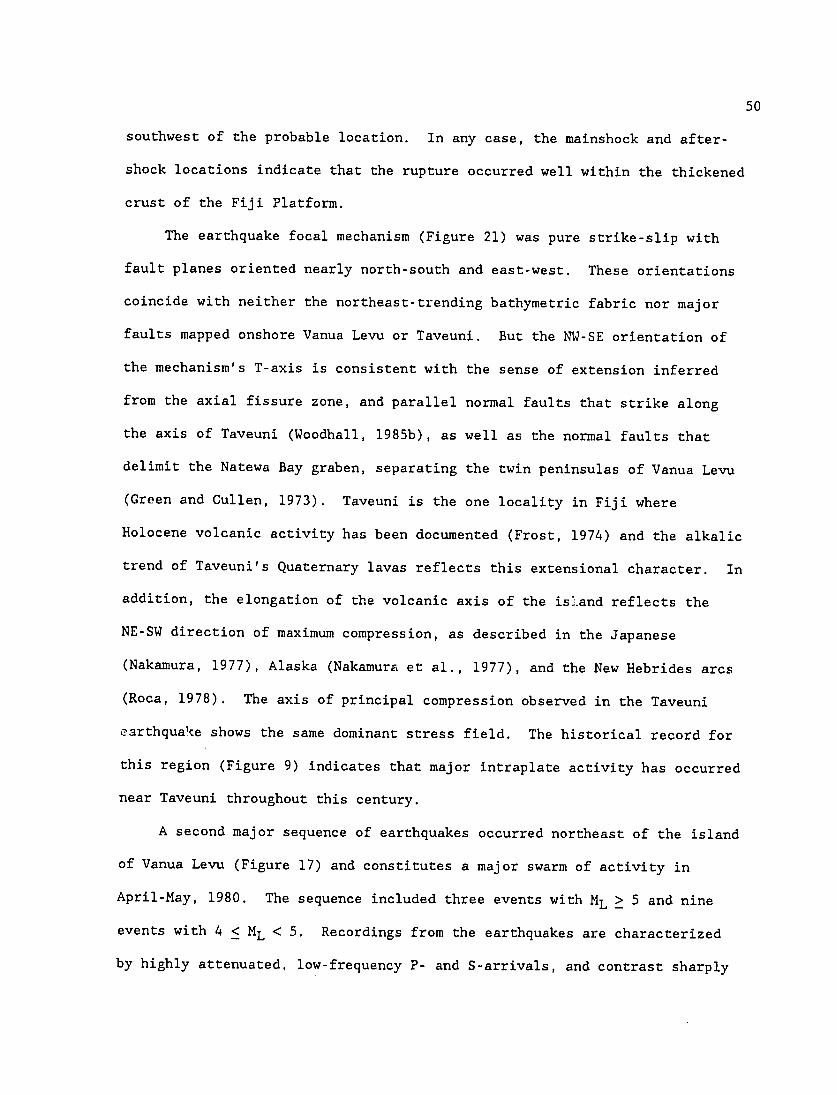
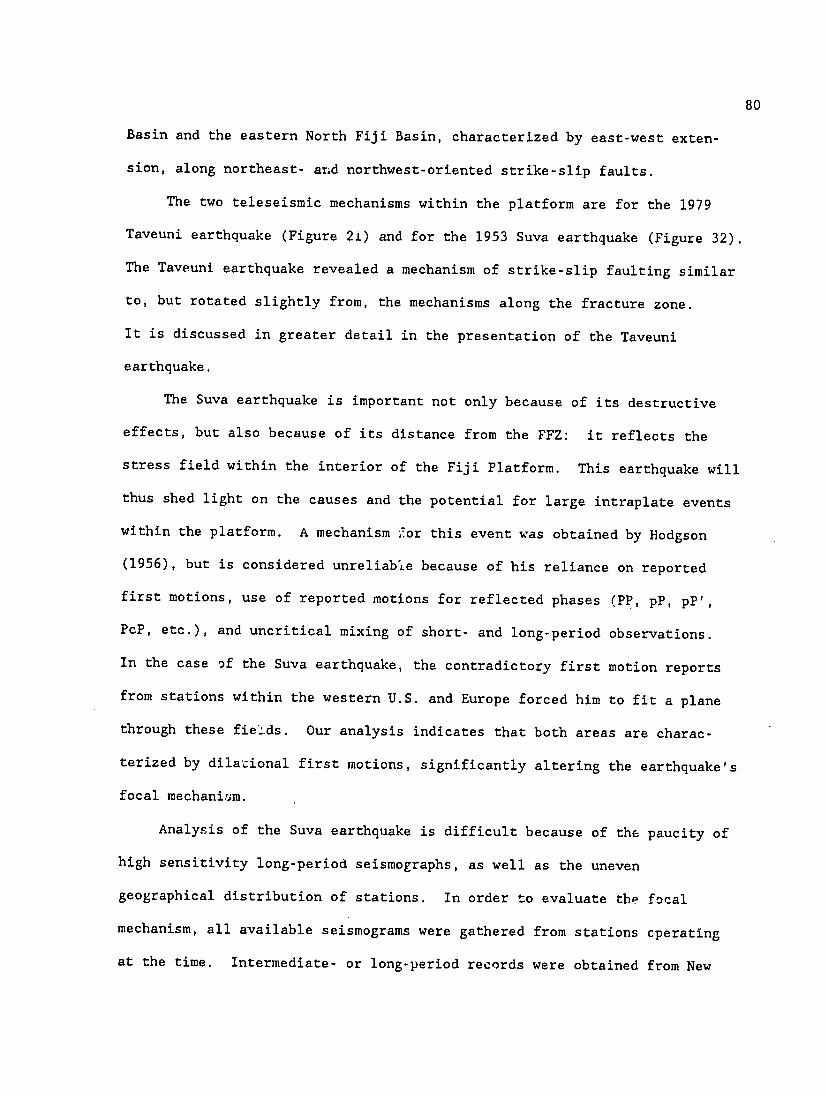
The earthquake focal mechanism (Figure 21) was pure strike-slip with
fault planes oriented nearly north-south and east-west These orientations
coincide with neither the northeast-trending bathymetric fabric nor major
faults mapped onshore Vanua Levu or Taveuni But the NW-SE orientation of
the mechanisms T-axis is consistent with the sense of extension inferred
from the axial fissure zone and parallel normal faults that strike along
the axis of Taveuni (Woodhall 1985b) as well as the normal faults that
delimit the Natewa Bay graben separating the twin peninsulas of Vanua Levu
(Green and Cullen 1973) Taveuni is the one locality in Fiji where
Holocene volcanic activity has been documented (Frost 1974) and the alkalic
trend of Taveunis Quaternary lavas reflects this extensional character In
addition the elongation of the volcanic axis of the is]and reflects the
NE-SW direction of maximum compression as described in the Japanese
(Nakamura 1977) Alaska (Nakamura et al 1977) and the New Hebrides arcs
(Roca 1978) The axis of principal compression observed in the Taveuni
earthquake shows the same dominant stress field The historical record for
this region (Figure 9) indicates that major intraplate activity has occurred
near Taveuni throughout this century
A second major sequence of earthquakes occurred northeast of the island
of Vanua Levu (Figure 17) and constitutes a major swarm of activity in
April-May 1980 The sequence included three events with ML gt 5 and nine
events with 4 lt ML lt 5 Recordings from the earthquakes are characterized
by highly attenuated low-frequency P- and S-arrivals and contrast sharply
51
N
T o
0W- 0 shy
00
0
0 0
Figure 21 Focal mechanism for the 1979 Taveuni earthquake Equal-areaprojection of the lower hemisphere of the focal sphere Large open andfilled circles represent clear dilatational and compressional firstmotions respectively Less reliable first motions are shown as small openand filled circles Large and small X-marks indicate clear and uncertain P-wave arrivals respectively that are judged to be near a nodal planeArrows show directions of S-wave polarization The P (pressure) aizd T(tension) axes are located at the base of the letters P and T
52
with those associated with the nearby Taveuni aftershock sequence Because
the propagation path from the Vanua Levu swarm to the seismic network is
nearly identical to that followed by the Taveuni sequence the zone of
attenuation must be located close to the swarms source area In any event
the quality of the arrivals resulted in a generally poor location accuracy
which implies that the strong apparent northwesterly trend to the sequence
is simply an artifact of the poor constraint on station arrival times The
best constrained locations cluster near the northeastern tip of Vanua Levu
island the probable source area for the sequence Like the Taveuni earthshy
quakes this sequence is located within the margins of the Fiji Platform
The area is adjacent to a particularly complex confluence of tectonic
elements where the Fiji Fracture Zone intersects the margin of the Fiji
Platform and Lau Basin The influence of magmatic processes is suggested by
the swarmlike character of the sequence (eg Hill 1977) and the highly
attenuated waveforms (eg Sanford and Einarsson 1982 Iyer 1984) Other
than these two major earthquake sequences the Taveuni region appears to be
quiescent
The temporal distribution of earthquakes in the Taveuni area is shown
graphically in Figure 23E This figure demonstrates the dense clustering of
activity in the 1979 Taveuni mainshock-aftershock sequence and the 1980
swarm offshore Vanua Levu as well as the subsequent quiescence of the
region This pattern is characteristic of intraplate activity within the
platform and contrasts with the more continuous activity along the Fiji
Fracture Zone (Figure 23A) and the West Viti Levu seismic zone (Figure 23B)
Long-term aftershocks of the Taveuni event are recorded up to a year after
the mainshock subsequently the zone is entirely aseismic (at the magnitude
53
15 S 0 0 Ao
16o 0 00 0 0o0171
o o gt 17 B 0 o OoDC
9 00
17 r ef o 0o -- 0 0 D 930--o0
0 0 0 L) I_P
19degoO 0 o 0
00 020 B 0 oO 0o 0- oJ C o 0
0 V 0
21 III176 B 177 178 179 180 179 W178
Figure 22 Map showing locations of space-time diagrams presented in Figure 23 Brackets denote area included in diagrams
A 1 I8--
2993
109 0
S1982 1981 o
I 199
o
0
doo -0
0
bull
0
0
I
A I9s
-0
0
B -
19
MA0
0
0 1993 lt
-
1982
0
I
C0
i I
bO2
I I
0
B C
198
1
CC1913
rL19R7
0-shy
0lt
C
r 9 (
1950
Cb oS00 0
Q I
50 i0
0
0
150 200 70 30o
DISTANCE (KM)
0 bull
0 0
350 400 450
19 1
2920
0
0 = -
o 50
0
0 O0000
0
00 150
DISTANCE
200
(KM)
230 o
300
190
980
29790 0
ishy50 100 150
DISTANCE
0
200
(KM)
230 300
D
19
I
e
I I I D E
1985
I I I 0
I E
lt 0 0
--982
~~~~ P
o
-- A 198
22 S
2920
190
S1981 2
29S(0
1970
o
Oshy Q
0 50 1979
100 150
DISTANCE
200
(KM)
235 300
1~~979
0 30
-0
200 150
DISTANCE
200
(KM)
230 300
Figure 23 Space-time diagrams for main earthquake zones in Fiji Small open circles ML lt 3 large opencircles 3 lt ML lt 4 shaded circles 4 lt ML lt 5 filled circles ML gt 5 Locations shown in Figure 22
55
range to which the network is sensitive) Activity at very small magnishy
tudes like that observed in southeastern Viti Levu is probably charactershy
istic of the Taveuni area as well small events with S-P times less than
10 seconds are recorded on seismographs on Taveuni and Udu Point but are
seldom of sufficient size to be recorded by the remainder of the network
This sporadic nature of intraplate activity underscores the importance of
the network data (low magnitude threshold) and historical data (long time
scale) in evaluating intraplate activity within the Fiji Platform
2 Fiji Fracture Zone (FFZ) Through each period of observation the
area of rough topography north of the platform has been the most seismically
active area of the Fiji region This belt of earthquakes is part of a
larger seismogenic feature 2nd continues to the east as a complex but
continuous zone of seismic activity which extends to the northern end of the
Tonga Trench) Further west it continues as a linear belt of seismicity
into the center of the North Fiji Basin As such it represents the present
southern transform boundary of the Pacific Plate in this area and has been
termed the Fiji Fracture Zone (Green and Cullen 1973 Hamburger and
Everingham 1985) The concentration of large earthquakes along this belt
(Hamburger and Everingham 1985 Hamburger and Isacks 1985 see Figures 9
and 18) confirms the contention that a major portion of the interplate
deformation is taken up there The westward extent of the fracture zone is
more ambiguous as its topographic expression is not well preserved west of
Fiji Seismicity extends into the central portion of the North Fiji Basin
but rapidly drops off west of about 174degE
Within the FFZ the seismic activity is non-uniform At all time and
magnitude scales (Figures 9 10 11 17) the portion of the FFZ directly
56
north of Viti Levu (1765deg-1785degE) has been continuously active The
portions of the FFZ further west and that located north of Vanua Levu (east
of 1785degE) are far less active However the historical record of seismishy
city (Figure 9) shows that significant earthquakes have occurred in the
quiet zone north of Vanua Levu during the last century indicating that the
present quiescence reflects a temporary locking of the plate boundary during
the interseismic period
The difference in seismic regime along the adjacent segments of the FFZ
reflects differences in the dynamics of plate interaction along this
boundary The eastern zone is oriented close to the PacificIndo-Australian
plate motion vector in this area implying predominant strike-slip motion
along the FFZ A sharp kink in the strike of the fracture zone occurs at
1788degE where the seismic activity picks up It is in the portion of the
FFZ west of 1788degE where active rifting has been observed Von
Stackelberg et al (1985) reported minor north-trending bathymetric ridges
offsetting the FFZ bearing fresh hydrothermally altered pillow basalts
These observations indicate that plate motion in this area is accommodated
by extensional as well as strike-slip deformation The continuous
swarm-like activity of the western FFZ is typical of localized areas of
extension within strike-slip tectonic environments (Hill 1977)
The space-time diagram for the FFZ (Figure 23A) clearly demonstrates
this contrast in activity The portion of the FFZ west of 1788degE (lt 225 km
distance) is characterized by virtually continuous activity with larger
events occurring in swarm-like sequences The eastern FFZ is characterized
by more isolated individual small to moderate-sized events Despite the
lower level of activity this quiescent portion of the FFZ has the evenly
57
distributed occurrence of events that is characteristic of the interplate
seismic zones The two major sequences along the FFZ (December 1980 and
October 1984) occurred near the edges of the active zone
These two important sequences are shown in detail in Figure 20BC The
December 1980 cluster was a mainshock-aftershock sequence following a
ML - 58 mainshock The sequence occurred close to the eastern edge of the
fracture zones active belt and close to a pronounced change in strike of
the zone The aftershocks are generally not very well located due to the
limited number of stations operating at the time their distribution sugshy
gests a very small rupture area near 162degS 1785degE
The October 1984 sequence is somewhat more complex and involved three
major events with magnitudes of 57 54 and 59 Centroid moment-tensor
focal mechanism solutions for these three events were available from the
US Geological Surveys Preliminary Determination of Epicenters This
sequence took place on the western end of the active zone near a second
change in strike of the FFZ The mainshocks are all characterized by
strike-slip faulting with east-west nodal planes paralleling the western
segment of the fracture zone The third major event of the sequence occurshy
red 125 km north of the fracture zone in a normally quiet portion of the
North Fiji Basin While this event may be considered a coincidental occurshy
rence its proximity in time and the similarity of mechanism suggest that
the earthquake was triggered by the rupture along the fracture zone The
east-west trend of the mechanisms nodal planes implies that it was the
portion of the FFZ west of 1775degE that ruptured during the sequence rather
than the active ENE-trending segment
58
At moderate magnitudes (3 lt ML lt 4) the portion of the FFZ between
17680 and 1788degE is continuously active In contrast the same area is
devoid of major historical events (Figure 9) During the six years of
operation of the telemetered network the two major earthquake sequences
along the FFZ nucleated at the edges of the active zone These phenomena
indicate that slip occurs relatively freely along the ENE-trending active
segment accommodated by continuous occurrence of small earthquakes and by
possible aseismic slip The occurrence of back-arc extension within the
seismically active portion of the FFZ also indicates that normal stresses
acting along this portion of the FFZ are at a minimum Slip along the
east-trending relatively quiescent portion of the FFZ occurs in major
earthquake sequences such sequences may nucleate at the edges of the active
zone
3 West Viti Levu Zone (WVL) Some 200 earthquakes are located in the
seismic zone forming the western edge of the Fiji Platform Like the events
northeast of Vanua Levu many of the WVL earthquakes produce poorly
recorded low-frequency shear arrivals that degrade the location accuracy in
this area In general the epicenters coincide with a series of bathymetric
troughs that mark the extensionally deformed margin of a former forearc
terrane (Larue et al 1980 Brocher and Holmes 1985) While the activity
in this zone is considerably lower than that along the Fiji Fracture Zone
the character of earthquake occurrence (Figure 23B) is similar--earthquakes
occur irregularly throughout the network operation The WVL zone is marked
by relatively high activity on all time and magnitude scales (Figures 9 10
11)
59
The bathymetric troughs west of Viti Levu are part of an area of rough
seafloor morphology where the 4 km-deep troughs approach the shelf slope of
the Fiji Platform Parallel to and inland of the troughs an elongate
bathymetric ridge forms the outer edge of the Baravi Basin This basin is a
sediment-filled trough located west and south of Viti Levu interpreted by
Brocher and Holmes (1985) to represent the forearc basin of the active
pre-Late Miocene Fiji volcanic arc The bathymetric ridge was interpreted
to represent a structural high analogous to the trench slope break of active
convergent margins in the terminology of Karig and Sharman (1975)
Single-channel seismic reflection profiles are suggestive of extensional
deformation of basin sediments near this former arc margin (Figure 4 in
Brocher and Holmes 1985) This sediment deformation combined with high
heat flow (Sclater and Menard 1967) and high-amplitude magnetic anomalies
(Brocher and Holmes 1985) provides evidence for recent North Fiji Basin
extension that Brocher and Holmes attributed to the Neogene rotation of
Viti Levu If this process is continuing the associated deformation should
be reflected in the present-day seismicity
The most importaLlt sequence within the WVL zone took place in September
1980 and constituted a mainshock-aftershock sequence which followed a
magnitude 57 earthquake in the southern pcrtion of the seismic zone (Figure
20D) The mainshock located at 192degS 1765degE appears to have been
mislocated as the aftershock zone is positioned some 40 km or more to the
north extending no further than the area 184deg-189degS
The focal mechanism solution for the mainshock of this sequence indishy
cates strike-slip faulting with a significant normal component (from
Everingham 1985) The NNE strike of the sinistral plane of this mechanism
60
coincides with the strike of the seismic zone and also parallels the deep
basins west of Viti Levu This observation suggests that the basins forming
the western margin of the Fiji Platform are presently accommodating a
dominant component of left-lateral strike-slip faulting parallel to the
basins strike The sense of motion along this fault is close to that
observed throughout the eastern North Fiji Basin and within the Fiji
Platform
Thus the hypothesis of simple extensional deformation of the WVL zone
is not supported by the seismicity patterns associated with the 1980
sequence Rather they suggest that in its present configuration the
western margin of Fiji is accommodating a significant degree of strike-slip
motion Nonetheless the attenuation of seismic waves that originate in
this zone the high heat flow the recent extensional deformation of the
margin and the high-amplitude short wavelength magnetic anomalies suggest
that backarc rifting is a significant component of deformation in this area
However contrary to Brocher and Holmes simple model of mid-ocean
ridge-type extension this area like the Fiji Fracture Zone appears to be
characterized by a leaky transform-type extension dominated by strike-slip
deformation In this case the proposed transform faults offsetting the
west Viti Levu basins would become a series of left steps of a longer
sinistral strike-slip feature According to this model rifting is concenshy
trated along the shallower ridges separating the basins rather than within
the basins themselves
4 KadavuHunter Fracture Zone Region (KAD) This zone stands at the
intersection of a former convergent plate margin with the Fiji Platform
The Hunter Fracture Zone is a well-defined curvilinear belt of ridgetrough
61
topography extending from Fiji to the southern New Hebrides arc At its
western end it intersects the southern termination of the New Hebrides
Trench The transition between these two features is a morphologically
complex zone characterized by subduction-related volcanism on Matthew and
Hunter Islands irregular bathymetric features on the upper plate and
intense shallow seismic activity (Louat 1982 Maillet and Monzier 1982
Monzier et al 1984) In fact bathymetric and seismic reflection profiles
across the Hunter Fracture Zone show that the subduction margin morphology
is preserved well into the Fiji Platform The Koro Sea (east of Viti Levu
see Figure 7) represents its eastern termination Hinge-faulting focal
mechanism solutions at the western end of the HFZ document tearing of the
Indo-Australian Plate (Hamburger and Isacks 1985) Chase (1971) pointed
out that shallow seismicity along the Hunter Fracture Zone rapidly drops off
east of 174degE where it was hypothesized to intersect a major North Fiji
Basin spreading center East of this intersection the fracture zone may
simply mark a relict lithospheric scar tracing the westward migration of the
southern New Hebrides arc Malahoff et al (1982a) and Gill et al (1984)
however proposed that the fracture zone has accommodated oblique subduction
of South Fiji Basin lithosphere as recently as che early Quaternary In
fact Kadavu Island is the one area of Fiji where calc-alkaline volcanism
persisted beyond the Pliocene (Gill et al 1984 Whelan et al 1985)
Nonetheless the absence of an inclined seismic (Benioff) zone and shallow
thrust-type mechanisms suggests that the Hunter Fracture Zone is not accomshy
modating plate convergence at present however isolated earthquakes do
occur along the entire length of the Hunter Fracture Zone and major events
62
have occurred near its intersection with the Fiji Platform (Figures 9 and
10)
A significant number of earthquake recorded by the seismic network are
located in this region Virtually all of them are positioned landward of
the Fracture Zone and its continuation into the Koro Sea The depths of
these events are not well constrained but there is no evidence of any
intermediate-depth subduction-related seismicity in this zone
The major earthquake sequence in this zone is the Kadavu earthquake
swarm of July-August 1983 (Hamburger anO Qiolevu 1983) The swarm
included over 100 earthquakes and culminated in mainshocks of magnitude 51
51 and 48 The maximum intensitLes were reported in westernmost Kadavu
(MM V-VI) and several landslides were triggered by the largest of the
mainshocks The earthquakes occurred approximately 20 km offshore western
Kadavu (Figure 20E) along a submarine extension of the Kadavu ridge
The concentration of activity at shallow depths of the HFZ demonstrates
active deformation of the upper plate of this former subduction zone plate
kinematic arguments suggest that the HFZ is presently accommodating extenshy
sion between the South Fiji Basin (Indo-Australian Plate) and the Fiji
Platform The shallow activity is the manifestation of that deformation
5 Lau Ridge (LAU) This is the least active portion of the Fiji
region most of the earthquakes within this seismic region are in fact
located along the western edge of the ridge or within the eastern Koro Sea
One reliably located event however is positioned within the central
portion of the ridge it was recorded by the temporary station operating on
Lakeba Island (Figure 2) Tectonically the Lau Ridge is now part of the
stable Indo-Australian Plate and the major deformational areas are the
63
extensional centers of the Lau Basin to the East the Fiji Fracture Zone to
the North and the Hunter Fracture Zone to the west No major historical
earthquakes (Figure 9) are reported in this region Quaternary volcanism
has been reported at several localities in the Lau Group (Whelan et al
1985 Woodhall 1985a) and recent tilting of the islands was observed by
Taylor (1978) Teleseismically located earthquakes are reported from the
southern Lau Ridge This evidence of recent tectonism indicates that the
stability of the Lau Ridge is only relative and that there is potential for
moderate-sized earthquakes even within this relatively quiescent block of
the Fiji region
6 Offshore Viti Levu (OF0T This seismic region is characterized by
low activity relative to the active belts of seismicity surrounding this
region The low activity is reflected in a minimum in S-P intervals at
times of 6-20 seconds at seismic station Vunikawai in southeastern Viti Levu
(Sykes et al 1969) It is striking that the broad shallow shelf north of
Viti Levu (Bligh Water Basin) is virtually devoid of seismicity (for ML gt 3)
through the entire period of network observation Activity is observed only
near the 1 km-deep trough (Vatu-Ira Channel) separating the basin from the
western shelf of Vanua Levu This trough follows a major structural trend
controlling Pliocene volcanism in the Lomaiviti Group (Green and Cullen
1973) and has been proposed as an active transform fault terminating the
Hunter Fracture Zone (Rodda and Kroenke 1984) This corclusion is
certainly not warranted by the seismological data however the bathymetric
and structural trends combined with the concentration of activity here
indicate fault control
64
A second area of seismic activity is the area surrounding the island of
Koro near the termination of the Hunter Fracture Zone This zone has been
active at low magnitude levels during several brief periods of activity
(Figure 23E) It is clearly a zone of significant seismic potential
evidenced by the occurrence of a major historical event the Ms 65 Koro-
earthquake of 1932 (Everingham 1982b) The area is an important confluence
of major structures the western end of the Hunter Fracture Zone terminates
against the strong northeast-striking structural fabric of eastern Vanua
Levu and Taveuni (Green and Cullen 1973) There is evidence that convershy
gence along the HFZ has terminated (Hamburger 1986) but the Late Pliocene
and Quaternary volcanic activity landward of the fracture zone attests to
its recent activity Throughout the area south and east of Viti Levu
seismic activity is concentrated on the landward (north and west) side of
the bathymetric trough The extensional stresses deforming the Fiji
Platform do not appear to significantly deform the lithosphere of the
neighboring South Fiji Basin or its continuation into the arc complex the
Koro Sea However where the South Fiji Basin lithosphere meets the
deformed arc lithosphere south of Vanua Levu it becomes a zone of high
seismic activity and is capable of a damaging earthquake of the size of the
1953 Suva or 1979 Taveuni events
A third area of high activity is observed in the opposite corner of the
offshore region the Baravi Basin Here like other intra-platform seismic
zones activity is concentrated in several discrete periods of activity
separated by long periods of quiescence (Figure 23C) Activity is focussed
along the 2 km depth contour marking the edge of the Fiji shelf The
contour also marks the edge of a major sedimentary basin fed by the rivers
65
of southern and western Viti Levu (Larue et al 1980) It is characterized
by free-air gravity lows to -70 mgal that result from up to 3 km of sediment
fill in the basin Seismic reflection profiles across the basin (Brocher
and Holmes 1985) demonstrate significant post-Pliocene extensional deformashy
tion along the its seaward margin The high-angle faults show a significant
normal displacement but a strike-slip component is also suggested by
Brocher and Holmes based on the coincidence with structural trends in the
West Viti Levu zone In any case the major earthquake sequences in
1979-1980 and 1984 demonstrate ongoing deformation of the Baravi Basin
margin Like other actively deforming zones close to the Fiji Platform the
apparent quiescence of the Baravi Basin at larger magnitudes (Figures 9 and
10) is likely to be a temporary one reflecting a period of interseismic
strain accumulation
7 Central Viti Levu (CVL) Within the island of Viti Levu the
telemetered seismic network offers the best opportunity for evaluating the
detailed characteristics of crustal seismicity associated with deformation
within the Fiji Platform The island of Viti Levu is also the source area
for the most destructive earthquake in Fijis history the 1953 Suva earthshy
quake (Ms - 675) making it the critical focal point of seismic hazard
analysis for the country
The earthquakes within the island of Viti Levu (Figure 24) are concenshy
trated in two zones one a broad swath extending from central Viti Levu
across the island to Ovalau the second a dense concentration of earthshy
quakes within and offshore the southeastern portion of the main island
Cross sections AA and BB (Figure 26) taken across the entire island
demonstrate the relative quiescence of northern and western Viti Levu and
66
177 E 0
178 A+
179
Figure 24 Moip of earthquakes within and around the island of Viti Levu Earthquake grades D - crosses C - open circles B - shaded circles A - filled circles Light shading shows areas of relief gt 75 m dark shading emphases high inland Nadrau Plateau at elevation gt 750 m Topography from Dickenson 1972 Faults from Rodda and Band (1966) are shown by heavy lines 100 500 and 1000 m bathymetric contours are from Smith and Raicebe (1984) Seismic stations are shown as filled triangles
67
17
B 000
0 0
AI or o C oOOo deg0 0018 0
D0 n OC 0A 0 0 0
0 0 0
o1o r 0o c( (~ 0 0 0
177 E 178 179
Figure 25 Map showing locations of cross sections A-D within the islandof Viti Levu Brackets denote area included in sections
A B B0 00 0 DD B0
40 o6
0 0- 0 d 3020l -o 6 ~ deg0
0 0a
C CAR 0
40O-5~~ 30 0o6amp A0l0l0 0 0 0shy deg
20 - 0o e
2 0 0 4 0
100050 go000
012
50 4 00
0 20o
o oo0 o
bull bull
o A 25
D0 -
0 o
0
0
15shy
8 10 300 10 20 30 40 30 0 20 30 40
Figure 26 Cross sections within the island of Viti LevuFigure 18 Locations shown in Figure 25 Symbols denote earthquake grades as inTriangles at top of sections denote positions of seismic
stations along strike of the projections No vertical exaggeration Note that scales vary from section tosection
0
69 the dense concentrations of microearthquakes in the central and southeastern
portions of the island The sections also demonstrate graphically the confinement of seismicity to the upper 20 km of Fijis lithosphere The two subcrustal events at 42 and 45 km depth are poorly constrained (grade D) and are considered to be mislocations The limiting depth is close to the average crustal thickness of -19 km this coincidence of focal and crustal depths is unique in all other areas of extensional and strike-slip tecshytonism the seismicity does not extend deeper than midcrustal depth (Chen and Molnar 1983) Little information however is available from tectonic
settings comparable to Fiji The errors in hypocentral depth determinations and in crustal thickness estimates permit the existence of a relatively
thin aseismic lower crust In any case the crustal activity begins to taper off from 13 km depth the majority of the earthquakes take place in
the upper two-thirds of the crust
The cross sections CC and DD examine the earthquake clusters in central Viti Levu Two notable groupings stand out one near 178degS
1778degE which will be referred to as the Nadrau swarm and a second near 178degS 178degE which will be referred to as the Monasavu swarm Approxishymately fifty earthquakes occurred in clusters of activity from early 1980 to mid-1981 in the western or Nadrau swarm Because only the southshyeastern Viti Levu stations were operating at the time the swarm earthquake
depths in this area are poorly constrained they appear to correspond to those observed within the seismic network that is generally limited to the upper 20 km of crust (cross section CC Figure 26) A small number of deeper events are located in this area but these too probably remain
within the thickened crust beneath the axis of Viti Levu The swarm
70
included three events with magnitudes ML gt 3 The cause of the swarm is
unclear but it is located on the western flank of the large central uplift
at the core of Viti Levu Adjacent to the Nadrau Plateau is a broad upland
basin the Mbukuya-Nandrungu basin According to Dickenson (1972) this
heavily dissected inland valley of Pliocene age was rapidly deformed from a
gently graded concave stream valley to a convex plateau surface at 300-500 m
above sea level this uplifted valley surface has been deeply incised by
modern streams whose floors are 50-150 m below the plateau surface
Because of their posicion outside the seismic network focal mechanism
solutions for individual events are not available however a composite focal
mechanism for the Nadrau swarm indicates east-west extension but is comshy
patible with either a dip-slip (pure normal faulting) or strike-slip
solution In either case the direction of extension is compatible with the
regional direction of extension inferred from strike-slip focal mechanisms
in the North Fiji and Lau basins (Hamburger 1986) The crustal flexure
induced by the rapid domal uplift that is peculiar to central Viti Levu is
also likely to result in localized extensional stresses
The second concentration of activity in central Viti Levu is the
Monasavu swarm positioned atop the central uplift of Viti Levu (Figure 24)
This earthquake sequence presents a strong case for reservoir-induced
seismic activity The earthquakes also occur at crustal depths those well
constrained by the nearby Monasavu seismic station are shown to occur in the
upper 4 km of crust (cross section DD Figure 26) adjarent to the Monasavu
Reservoir The Monasavu Dam is an 82-meter high earthfiil dam on the Nanuku
Creek which impounds 133 x 106 metric tons of water it is designed to
provide hydroelectric power for the island of Viti Levu The dam is the
71
largest public works project in the countrys history and represents the
major critical structure from the standpoint of seismic risk Earthquakes
within Viti Levu were unknown during the planning for the project but a
subsequent historical study (Everingham 1983a) has uncovered at least one
major event during the last century of a size that could affect the dams
structure The dam was completed in April 1982 and rapidly filled to its
operating volume by February 1983 Three felt earthquakes shook the damsite
as the water first approached its spill level when the water weight in the
reservoir increased most rapidly (J Campbell pers comm 1984) The
three shocks of magnitude 33 27 and 28 were part of a sequence
including 14 recorded events several of the events were strongly felt in
the surrounding villages (Everingham 1983d) Each of the swarm
mainshocks triggered a strong-motion accelerograph atop the dam producing
peak accelerations of 013 g 007 g and 004 g all on the north-south
component of the accelerograph (Figure 27) A nearby accelerograph posishy
tioned on bedrock adjacent to the dam went untriggered demonstrating
considerable amplification of ground acceleration by the dam structure The
accelerograms are all extremely similar in character with large monoshy
frequency oscillations on the north-south component clearly shown by a
sharp peak in the Fourier amplitude spectra at a period of 02 sec
(Figure 28) This component is oriented transverse to the dams structure
and indicates probable resonant oscillation of the dam as a whole
The limited number of stations operating at the time of the swarm did
not permit very accurate locations of the mainshocks However the mainshy
shocks are shallow and positioned within 5 km of the dam and the deepest
part of the reservoir
-- -- -- -- ------- ------------ ----
----------------------------- ---
- -
--- -- -- -- -------------- -- -- -- -- --
-----------------------
72
MONASAVU r
FIJI MONASAVU DAM ___
13 February 1983 09 53 003 UTC
- - - - - - - - L - - - - - - - - - - -
FIJI MONASAVU DAM 14 February 1983 12 18 416 UTC
I - - - -
WEST
FIJI MONASAVU DAM U
23 February 1983 UP 15 17 303 UTC
SOUTH
I 5 sec -
Figure 27 Accelerograms from strong-motion accelerograph operating on Monasavu Dam Viti Levu from earthquakes of 13 14 and 23 February 1983 (ML- 33 27 and 29 respectively) North-south component is transverse to the dams structure Figure is from Silverstein 1985
I F I0
0C1)F
LUJ
(M(---Utj
CJ
CL 0_
2 CE
- I shy_
Cc =3
0 a a I I i p a a I I a
70 5 10 15 20 25
FREOUENCT HZ Figure 28 Fourier amplitude spectrum of acceleration from Monasavu Dam accelerograph earthquake of 13 February 1983 North-south component transverse to dams structure Note resonance at approximately 5 Hz
73
The area is one of significant background activity evidenced by nine
events located in the reservoirs vicinity prior to impoundment and numerous
reports of felt earthquakes in the area (Everingham 1983d) Nonetheless a
case for reservoir-induced activity can be made on several grounds (1) The
coIncidence of the February 1983 swarm with the peak in reservoir water
level (2) the proximity of these and subsequent events to the deepest
portion of the reservoir (3) the recording of 270 events at the Monasavu
seismic station with S-P intervals less than about 1 second during a
17-month recording period (Stuart 1985)
The third group of earthquakes in east-central Viti Levu follows the
trend of a belt of sediments of the Upper Wainimala Group (Early-Middle
Miocene) that separates the Pliocene Ba Volcanic Group in northern Viti Levu
from the Late Miocene to Recent deposits of the Rewa Basin in southeastern
Viti Levu (Verata Sedimentary Group see Figure 8) The basin is
fault-bounded on its western edge (Rodda 1967) the lineation of epicenters
along its northern edge suggests fault control along this margin as well
8 Southeastern Viti Levu (SVL) This seismic region is densely
populated by small-magnitude events (Figures 18 and 29) within the tightly
spaced US AID seismic network (see Figure 2) Many of the events in this
zone are very small (to ML - -10) and recorded only by 3 or 4 nearest
stations The apparent concentration of activity in this area is thus to a
large degree a product of the station distribution Nonetheless a real
concentration of activity does exist in the southeastern Viti Levu area
based on several observations (1) there is a concentration of earthquakes
of ML gt 2 for which uniform coverage is available for the entirety of Viti
Levu (Figure 15) (2) several earthquakes were located in this area by the
74
181
jS 0 711E) 0 0
186shy
178 E 1787
Figure 29 Map of earthquakes in southeastern Viti Levu Topographybathymetry faults and symbols as in Figure 24
74 a
tripartite network during 1965-1969 whereas the remainder of Viti Levu
appears to be altogether aseismic (Figure 11) (3) a peak in S-P intervals
was observed at times of 1-4 seconds at station Vunikawai corresponding to
earthquakes in the SVL zone (Sykes et al 1969) (4) several felt earthshy
quakes have originated in this portion of Viti Levu including the destrucshy
tive 1953 Suva earthquake (Houtz 1962ab Everingham 1983a 1984) Earthshy
quakes occur both on- and offshore southeastern Viti Levu They are concenshy
trated near the coast in the area extending from Suva to Navua that was
most severely affected by the 1953 Suva earthquake (Houtz 1962a) The
Houtz (1962a) H location of the 1953 mainshock based on macroseismic
data submarine cable breakage and tsunami traveltimes is directly within
the dense nest of activity offshore Viti Levu (Figure 29) The teleseismic
location by Sykes et al (1969) S is significantly offset from the main
zone of activity Based on Houtzs field observations and the microearthshy
quake activity recorded by the telemetered network the Houtz location is
accepted as the best estimate of the earthquake epicenter Houtz proposed a
normal (33 km) focal depth for the Suva earthquake while Sykes et al found
a 21 km depth The shallower depth is supported by the distribution of
earthquakes offshore Viti Levu and by the character of the P-waveform
recorded on long-period instrumeits at teleseismic distances Cross section
HH (Figure 31) shows that earthquake depths in the area like those within
Viti Levu are limited to the upper 22 km the best constrained events are
limited to the upper 15 km of crust The Suva earthquake is likely to have
occurred at a similar midcrustal depth this is also suggested by the
limited area from which maximum intensities were reported
75
o 0 C B E
18 1 E 1787 Vo s d oe i
Figure30 Map showing ~lcation Vitigt rces ahdlns
of crs etosEwihnsuhatr 0eun hdn eoeae nlddi
cross se1ins crs e sci 1
76 FE FE
0 0
5-o q o qo
o o obull7 o c o oo
0
T Vo Wq
15 V4 S0
C20 C 4
20- 0Io 10 o
25shy
30 IS 0-10 20 30 40 50
20
G G 0
25
bull I
o 301 LC 0 5 to 15 20 25
10 H H
o 0o10- c c qC
202
253
300 I 30 I- I0 5 10 15 20 25 0 10 20 30 40
J j 0 iI l i
0
bull o o
C o0Cc c b
o 4B
15- oC o o
0 5 1 5 20 25 30
Figure 31 Gross sections E-J within southeastern Viti Levu Locationsshown in Figure 30 Symbols as in Figure 24 No vertical exaggeration Note that scales vary from section to section
77 The well located events offshore Viti Levu fall into three groups two
north-trending belts of activity (near 178250 E and 17835degE) offset by an
east-trending segment near 183degS The epicentral pattern is suggestive of
small fault segments within a broad complex zone of deformation offshore
Viti Levu The north-south trends are close to the strike of a series of
submarine canyons that cut the shelf of Viti Levu as well as to important
structural trends in south-central Viti Levu (Houtz 1959) A subtle change
in actiriry occurs near the coast (cross section JJ Figure 31) where
activity wiuely distributed thrccent-haut the crust gives way to discrete nests
of fault-related activity within Viti Levu
On land the southeastern Viti Levu seismicity is located within an area
of faulting which disrupts the Oligocene to Pliocene strata exposed in the
southeastern portion of the island In only one case has an upper age limit
been placed on faulting in this area by the presence of a Miocene intrusion
post-dating the tectonism In all other cases faulting may have continued
into the Quaternary (P Rodda personal communication 1984) While
Tertiary faulting is documented elsewhere in Viti Levu faulting is particushy
larly evident in this portion of the island (Rodda and Band 1966) The
association with active shallow seismicity suggests that renewed (or conshy
tinuing) movement along these faults in southeastern Viti Levu is accomshy
modating the present stress system of the Fiji region That this portion of
Fiji is presently deforming is also corroborated by geodetic observations in
southeastern Viti Levu Berryman (1981) used retriangulation of six benchshy
marks in southeastern Viti Levu and one on Beqa Island to analyze shear
strain within the southeastern Viti Levu seismic zone Only by omitting the
Beqa benchmark and one of the Viti Levu benchmarks could a consistent strain
78
pattern be resolved With this correction Berryman determined a shear
strain rate of 06 pradyr accumulated over the period 1909-1980 The
direction of maximum compression determined was nearly east-west in
contrast with the east-west extension determined from focal mechanism
solutions However the area from which the data are taken (within southshy
eastern Viti Levu) is within the area strongly affected by the 1953 earthshy
quake Thus the deformation may be dominated by the coseismic movement
rather than continuously accumulating coseismic strain In any case the
data do suggest that significant hoLzontal deformation is taking place in
an area coinciding with the southeastern Viti Levu seismic zone
The earthquakes occur in discrete clusters within the seismic zone
Two densely populated centers of activity are located in southern Viti Levu
they are tightly clustered in space and time The Waidina swarm near
180-S 17825-E is characterized by low magnitude activity
(-09 _lt ML lt 29) occurring within a six-month period from late 1979 to
early 1980 In cross section (EE and FF Figure 31) the well located
earthquakes define a narrow cylindrical zone less than 15 km in width
extending from 3 to 14 km depth The swarm coincides with the eastern
termination of a major east-striking fault the Nakasu Fault (Colley
1976) which paralls the southern boundary of the large Middle Miocene
Wainivalu stock (Whelan et al 1985) At its eastern end the fault
terminates at a small intrusive body located along the western flank of the
Medrausucu Range Based on field observations this Miocene intrusion is
thought to post-date activity along the fault (P Rodda personal communicashy
tion 1984) in fact the high activity along its margin suggests a concenshy
79
tration of stress where movement along an active fault is limited by the
presence of this intrusion
The second major swarm in southeastern Viti Levu is the Waimanu swarm
located near 1815degS 17825degE The swarm had a magnitude range similar to
the Waidina swarm and was also clustered in time In cross section (G
JJ Figure 31) the well located events originate from a small volume
located at depths of 10-12 km The swarm is located along a 10 km-long
near-vertical normal fault that offsets a gabbro stock of probable Colo
(Middle Miocene) age (Band 1968) The northeast trend of the fault coincishy
des with that of a series of important post-Colo normal faults The trend
is also close to that defined by the new mechanism for the Suva earthquake
and indicates probable reactivation in a strike-slip sense
A secondary concentration of activity is observed along the
Wainivakidau Fault another of the northeast-striking faults that deform the
late Tertiary rocks of southeastern Viti Levu The sense of throw on this
fault is similar to that observed near the Waimanu swarm Earthquakes along
the fault are concentrated at midcrustal depths (cross section EE
Figure 31)
Earthquake Focal Mechanisms
Only a limited amount of information is available on the state of
stress and the nature of faulting within the Fiji Platform As described by
Hamburger and Isacks (1985) and Hanburger (1986) earthquakes in the intershy
arc region describe two basic fields of stress one associated with the
Fiji Fracture Zone characterized by strike-slip faulting along east- to
northeast-striking fault planes and a second found throughout the Lau
80
Basin and the eastern North Fiji Basin characterized by east-west extenshy
sion along northeast- and northwest-oriented strike-slip faults
The two teleseismic mechanisms within the platform are for the 1979
Taveuni earthquake (Figure 2i) and for the 1953 Suva earthquake (Figure 32)
The Taveuni earthquake revealed a mechanism of strike-slip faulting similar
to but rotated slightly from the mechanisms along the fracture zone
It is discussed in greater detail in the presentation of the Taveuni
earthquake
The Suva earthquake is important not only because of its destructive
effects but also because of its distance from the FFZ it reflects the
stress field within the interior of the Fiji Platform This earthquake will
thus shed light on the causes and the potential for large intraplate events
within the platform A mechanism -or this event was obtained by Hodgson
(1956) but is considered unreliable because of his reliance on reported
first motions use of reported motions for reflected phases (PP pP pP
PcP etc) and uncritical mixing of short- and long-period observations
In the case of the Suva earthquake the contradictory first motion reports
from stations within the western US and Europe forced him to fit a plane
through these fields Our analysis indicates that both areas are characshy
terized by dila-ional first motions significantly altering the earthquakes
focal mechanism
Analysis of the Suva earthquake is difficult because of the paucity of
high sensitivity long-period seismographs as well as the uneven
geographical distribution of stations In order to evaluate the focal
mechanism all available seismograms were gathered from stations cperating
at the time Intermediate- or long-period records were obtained from New
81
N
Qo
00
S
Figure 32 Focal mechanism for the 1953 Suva earthquake Equal-areaprojection of the lower hemisphere of the focal sphere Large open and filled circles represent clear dilatational and compressional first motions respectively from long-period instruments Moderate-sized circles are fom intermediate- or short-period instruments Small circles are less reliable first motions Small + and - symbols are reported first motions from Hodgson (1956) Solid lines show orientation of S-wave polarizations P- and T-axes as in Figure 21
82 Zealand Australia Japan the western US the eastern USSR and Europe
Short-period records were also examined but given less weight than reliable
long-period first motions S-wave polarizations were available only from
three short-period stations in Japan the eastern USSR and Indonesia but
were of considerable help in constraining the fault planes The best-fit
solution shown in Figure 32 indicates strike-slip faulting with a signishy
ficant but not very well constrained dip-slip component The east-west
extension shown by the position of the T-axis as well as the northwest and
northeast strikes of the nodal planes are remarkably similar to those
observed in the neighboring Lau and North Fiji basins While one mechanism
is not necessarily representative of the entire stress field in the platshy
form this earthquake demonstrates that a major part of the contemporary
deformation in the platform takes place by strike-slip faulting in response
to extensional stresses
Houtz (1962a) favored a northwesterly-striking fault plane for the Suva
earthquake based on the orientation of submarine canyons offshore southern
Viti Levu In fact the canyons strike in a north to north-northeast
direction (Houtz 1959) which parallels neither of the fault planes
Several major structural features cortenad the interpretation of the
northeast-striking fault plane (1) the Suva Peninsula (Figure 29) forms a
major northeast-trending promontory along the coast it is composed of
uplifted Pliocene marine sediments of the Medrausucu Group (Suva Marl Rodda
et al 1985) The western edge of the peninsula defines the deep-water
Suva Harbor dropping to over 20 m depth within 300 m from shore The edge
of the peninsula is marked by parallel lineaments recognized in airpilotos
and the sediments in the harbor are sharply truncated against the peninsula
83
suggesting active faulting along the basin edge (G Shorten personal
communication 1984) (2) the northeast trends are also important in the
faulting observed in southeastern Viti Levu (Band 1968 Figure 29) (3) a
major northeast-striking structural fabric is reflected in the unusual
submarine morphology near Beqa Island south of Viti Levu The barrier reef
has a pronounced nortneast-striking linear trend as does the scarp that
defines the Kadavu Passage to the south (Figure 29) (4) a major structural
high termed the Beqa-Vatulele Lineament separates the deep Suva and
Baravi sedimentary basins offshore southern Viti Levu (Brocher and Holmes
1985) This northeast-trending feature is marked by strong gravity and
magnetic anomalies (5) the overall trend of the seismicity offshore Viti
Levu is suggestive of a northeast-striking zone From the foregoing the
northeast-striking sinistral shear fault of the Suva earthquake focal
mechanism is chosen
Earthquakes located by he telemetered network provide additional
information on intraplate deformation in the platform The small number of
stations that record the microearthquakes in southeastern Viti Levu limits
the quality on individual focal mechanism solutions The first-motion
directions recorded on the network stations constrain but do not uniquely
determine earthquake fault planes Most events can be satisfied by a range
of solutions from pure strike-slip to nearly pure dip-slip Upper hemishy
sphere projections for six events in southeastern Viti Levu are shown in
Figure 33 with both strike-slip and dip-slip solutions where possible
Because of the dominance of strike-slip faulting throughout the region we
have chosen the strike-slip solution as primary However the first-motion
data alone do not demand this
84
A commonality to the southeastern Viti Levu focal mechanisms is docushy
mented in Figure 34 The earthquakes T-axes whether for strike-slip or
dip-slip mechanisms are dominated by an east-west orientation Similarly
the P-axes are generally oriented north-south The pattern of stress
orientation is very close to that observed in the 1953 Suva earthquake
(shown by the letters P and T in Figure 34) and coincides with the
stress field in the North Fiji and Lau basins
The focal mechanism for the 1953 earthquake is corroborated by a
composite focal mechanism for events located immediately offshore Viti Levu
shown in Figure 35 The first-motions for these events are consistent with
a strike-slip mechanism with fault planes oriented parallel to the fault
planes determined from the Suva earthquake A normal faulting solution is
equally possible (dashed lines in Figure 35) In either case the east-west
T-axis coincides with the regional direction of principal extension
The stress orientations within the Fiji Platform demonstrate that the
platform is not isolated in a plate tectonic sense from the interaction of
microplates along its boundaries The seismic deformation in the back-arc
basins east and west of Fiji is dominated by the east-west growth of the
interarc region Hamburger (1986) showed that this extension takes place
through strike-slip faulting along northeast- and northwest-trending fault
planes The same process is taking place in Fiji This former arc terrane
once deformed by major compressive stresses is now being extended by
ductile thinning of the lithosphere by creation of new oceanic crust around
its edges and by major strike-slip faulting both surrounding and within the
platform
85
N N
-_ o P
0 amp 7912-7 0618 80419 1921
073178-147 18 71 178-147
2 S
80619 1430 8600
Figure3m 33 Ffor et a18k27 178it152
o IT
0712 0222 84312 0041 deg D18 f 73 17 8deg013 9 163 17802511
Figure 33 Focal mechanisms for earthquakes in southeastern Viti LevL based on data obtained from the telemetered network Upper hemisphereprojections Syrrols as in Figure 21 Both strike-slip (solid lines) anddip-slip (dashed lines) solutions are compatible with first motion directions
86
N
0 00
0
00
T PS Strike-Slip S 0
Dip- Slip 0
Figure 34 Summary of P- and T-aes from network focal mechanisms shown on upper hemisphere projection P- and T-axes of the 1953 Suva earthquakeare given for comparison at base of letters P and T
87
0
0 0
0 0 0
0 P 0 0bull 0T
S
Figure 35 Composite focal mechanism for earthquakes located immediatelyoffshore Viti Levu Symbols as in Figure 21 lower hemisphere projectionBoth strike-slip (solid lines) and dip-slip (dashed lines) solutions arecompatible with first motion directions Large and small letters P and T represent P- and T-axes for strike-slip and dip-slip solutionsrespectively
88
CONCLUSIONS
Our seismicity studies in Fiji have led to several significant new
conclusions that bear directly on the earthquake hazard to Fijis populashy
tion
(1) Major earthquake zones are located along the edges of the Fiji
Platform where deformation is concentrated These zones are continuously
active at moderate magnitudes (ML 3-5) The seismic regime along one of
these zones (the Fiji Fracture Zone) varies as a function of the zones
orientation relative to the plate motion directions
(2) Secondary earthquake zones are located within the Fiji Platform
Large earthquakes occur more sporadically separated by long periods of
quiescence Many of these zones are active at low magnitudes (ML lt 3)
(3) Earthquake depths are shallow concentrated in the upper 18 km of
Fijis crust The distribution is similar to that in other areas of extenshy
sion and strike-slip deformation
(4) Earthquake magnitudes in the Fiji region have all been less than
71 Despite the large rates of relative plate motion in the area the thin
lithosphere may be incapable of storing large stresses to generate great
earthquakes (Ms gt 78)
(5) The large 1953 Suva earthquake occurred at 182degS 1783degE
(Houtzs location) at crustal depths by strike-slip faulting The stress
orientation from the focal mechanism is similar to that observed in the
North Fiji and Lau basins indicating that the platform is not isolated from
the regional tectonic stresses The nodal plane striking NSO0 E is chosen as
the probable fault plane
89
(6) Microearthquakes in Viti Levu occur as a result of extensional
stresses similar to those determined from the Suva earthquake
(7) Earthquakes in central Viti Levu may be related to the rapid
doming of the island A group of events near Monasavu Reservoir were
induced by rapid filling of a large artificial lake in the interior of the
island
(8) Earthquakes in southeastern Viti Levu occur in discrete nests that
are tightly clustered in space and time They are related to a series of
near-vertical east to northeast-striking faults that cut the Mio-Pliocene
rocks of southeastern Viti Levu
These empirical observations combined with the our regional studies of
the Southwest Pacific described by Hamburger (1986) permit several imporshy
tant tectonic conclusions to be drawn
(1) Fiji is part of a large shear system connecting the Tonga and New
Hebrides arcs extension is taking place throughout the region along short
irregular spreading centers and leaky transform faults involving both
strike-slip and extensional deformation
(2) While convergence appears to have taken place along the Hunter
Fracture Zone in the past there is no evidence for present-day convergence
Rather this plate boundary appears to be reactivated by extensional or
strike-slip deformation of the upper plate
(3) The Fiji Platform is rotating in a clockwise sense relative to
the tectonic blocks that form its northern western and southern boundshy
aries This rotation is interpreted as P relatively stable block resisting
more rapid counterclockwise rotational shear of the surrounding matrix
(4) The extension that produced the deep basins west of Viti Levu has
90
been replaced by strike-slip faulting that follows the basins strike
(5) Major iniraplate earthquakes occur throughout the southern Fiji
Platform but at longer recurrence intervals than the interplate events
that surround the platform
ASSESSMENT OF EARTHQUAKE HAZARD
Earthquake Recurrence Intervals
Evaluation of the recurrence history of a particular region can be
investigated using (1) teleseismically recorded instrumental history of
earthquakes (2) recu-rence relations of smaller earthquakes recorded by
seismograph networks (3) pre-instrumental historical records of large
earthquakes and (4) evidence of prehistoric large earthquakes observable in
the geological record
Instrumental historical records exist from the late 19th century to the
present as indicated elsewhere in this report From this data set shown in
Figure 9 it is evident that the recurrence intervals along even the most
active seismic belts surrounding the Fiji Islands exceed the historical
records Thus the repetition of events along say the Fiji Fracture Zone
cannot be resolved Nonetheless the data do help constrain the overall
recurrence of large earthquakes in the entire Fiji region This problem is
addressed by the frequency-magnitude relation observed by Everingham (1983c)
for the period 1918-1960 as shown in Figure 36 This period of observation
suggests that earthquakes of magnitude Ms 7 or greater occur= at the rate
of 48 eventsl0O yrs (or every 21 years) while earthquakes of magnitude
65 or greater occur at the rate of 429 events100 yrs or every 2 12
years A similar relation was obtained from network studies by Hamburger
(1986) and is shown in Figure 15 This magnitude-frequency relation sugshy
91
I I I
000
z
Z-10
w
D z~1o
Ushy
w L10
0 b=0 50
b=097
()0111
-1
I SOOO 1900-1973
5 6 MAGNITUDE M
IS
7 8
b16
50 I I
60 A
MAGNITUDE MS
70
Figure 36 Magnitude frequency plot for all earthquakes in the Fijiregion 1918-1960 (from Everingham 1983c)
92
gests recurrence of magnitude ML - 7 or greater at the rate of 65
eventsl0O years or every 15 years Magnitude 65 earthquakes according
to this relation would be expected at a rate of 162 eventsl00 years or
every 6 years In view of the differences in time sampled magnitude scale
used and area included in the two studies the agreement is remarkably
good The studies indicate that large potentially destructive earthquakes
are expected to occur in the Fiji region within the lifetime of critical
engineering structures
Earthquake Potential
An estimate of the maximum potential earthquake in this area has been
considered by Everingham (1983c) and is shown graphically in Figure 37 In
compiling this graph Everingham computed annual energy release based on a
magnitude-energy reiation for the period 1918-1982 The avcrage rate of
energy release for the region is equivalent to that produced by a single
yearly earthquake with magnitude Ms - 65 However the rate of energy
release is not constant and is marked by periods of activity and
quiescence The range of energy release is shown by the two dashed lines in
Figure 37 and the maximum likely energy release may be expected to fall
within the bounding curve Should this energy release be concentrated in a
single large event its magnitude would be approximately 75 This is
slightly larger than the maximum observed historical event in Fiji but is a
realistic design earthquake for the most active zones surrounding the Fiji
Islands From this relation Everingham also noted a 30-year cyclicity to
the energy release in Fiji Periods of high activity occurred in 1923-32
and 1952-60 A third period of high activity may be expected in the coming
93
- I
-2 -
m -
0
L1
3400 60 70 19
Figure 37 Cumulative energy release in the Fiji region 1918-1982 (fromEveringham 1983c)
94 few years terminating a relatively quiescent period for the period
1961-1982
Clearly the earthquake potential is not uniform throughout the Fiji
region Historically large earthquakes have concentrated in zones surshy
rounding the Fiji Platform with isolated large events occurring within the
platform itself In Figure 38 we separate the Fiji region into zones of
seismic potential based on the available seismicity data summarized in the
previous section
Zone I (Fiji Fracture Zone Taveuni-northeast Vanua Levu region West
Viti Levu zone western Lau Basin) This seisinic region is characterized by
high levels of seismicity on all time and magnitude scales (Figures 9 10
11 17 18) These belts apparently accommodate a large portion of the
PacificJndo-Australian plate motion The largest recorded earthquake in
this belt was a magnitude 71 event that occurred northeast of Vanua Levu in
1949 Considering the history of earthquake energy release discussed above
a conservative estimate of Mmax along these active zones is Mmax - 75
Zone II (Kadavu region Hunter Fracture Zone Baravi and Suva Basins
Koro Sea) this area is one of moderately high seismic potential with a
history of occasional large earthquakes separated by long periods of
quiescence This zone includes large events near Kadavu in 1850 1950 and
1963 the 1932 Koro earthquake and the 1953 Suva quake The largest of
these events was the magnitude 67 Suva earthquake This zone has been much
less active at moderate magnitudes than zone I (Figures 10 11 18) but is
clearly capable of large and potentially destructive events We have
included southern and eastern Vanua Levu in zone II based on evidence for
small-magnitude activity near southern Vanua Levu (Figure 18) structural
95
15
PCJi iii~l~ii~i~rIN
16
177
200
I N - s
2 1 ____
176 E 177 178 179 180 179 W 178
Figure 38 Seismic zoning of the Fiji region See text for discussion
95a disruption of the CaukandroveNatewa Bay region (Green and Cullen 1973) and
the confluence of the Hunter Fracture Zone with the Fiji Platform A
reasonable maximum design earthquake for this zone is Mmax - 70 A larger
event is possible but is considered less likely here based on the hisshy
torical record of seismicity in this zone
Zone III (central and eastern Viti Levu Ovalau Island Vatu-Ira
Channel this zone is characterized by far lower activity than zones I and
II with the exception of a single destructive event in the mid-nineteenth
century (Figure 9) is virtually devoid of historical activity However
low-magnitude activity is common in this region (Figures 17 18)
Reservoir-induced activity at Monasavu Reservoir in central Viti Levu
attests to significant tectonic stress accumulation in that area The
maximum probable earthquake for this zone is Mmax - 65
Zone IV (northern and western Viti Levu Bligh Water Basin northern
Vanua Levu South Fiji Basin Lau Ridge) these areas have been virtually
devoid of seismic activity on all time scales Isolated microearthquakes
have occurred in this zone but no significant activity has been observed
These areas represent the most stable blocks within the broad
PacificIndo-Australian plate boundary and are not expected to generate
significant activity in the future Nonetheless because of its proximity to
the active zones of deformation earthquakes to magnitude Mmax shy 60 should
be considered possible for this area
Macroseismic Effects of Large Earthquakes
Expected values of strong ground motion are of prime engineering
interest However even if the recurrence interval of large earthquakes
near Fiji were reliably forec-ast a major difficulty arises in trying to
96 translate earthquake size into actual values of ground motion at a partishycular site To date amp relatively large number of strong-motion acceleroshygrams have been generated in the far field of large earthquakes especially in California and Japan The difficulty in using magnitude-acceleration
relations developed elsewhere lies in the extreme variability in attenuation of ground acceleration in various geologic environments (eg Hays 1980) The absence of ground acceleration data for Fiji makes direct predictions of structural effects of earthquakes difficult Hopefully the presence of strong-motion accelerographs distributed throughout Fiji (Figure 3) will
change this situation over the coming decades
Until that time we are altogether reliant on observations of intensity of ground shaking That is the large historical events in Fiji have been studied by their effects on cultural features (ie houses) rather than near-field seismological observations (ie strong-motion accelerograms) The magnitude-intensity relations observed for Fiji may then be used to predict the distribution of intensities that may be expected from large earthquakes along the major seismic zones close to the Fiji Islands (Figure 38) In some cases the predicted intensities can be translated (under rather questionable assumptions) to peak ground accelerations from intensity-acceleration relations obtained elsewhere (eg Hays 1980) For this study we have used only intensities to avoid the added complication of
intensity-acceleration conversion
Everingham (1984) has summarized the available information on observed intensities in Fiji based on six moderate to large events during this century Modified Mercalli intensities observed in Fiji as a function of magnitude and epicentral distance are shown in Figure 39 These relations
97
MS7
DEPTH 20KM
6 0
w
z 4
1979 MS 6-9 bull _
GO 0 53 675 x
3- X 19 69 0 75 52
DISTANCE KM
Figure 39 Earthquake intensities (Modified Mercalli Index) observed inFiji as a function of magnitude and epicentral distance (fromt gveringham1984)
98 were used to compute maximum intensities generated by design earthquakes
located along each of the seismic zones defined in the previous segment
These predicted maximum intensities given for population centers in Viti Levu and Vanua Levu and several of the outer islands are shown in Table 1 These predictions provide a basis for conservative engineering planning
and civil defense decisions that pertain to development in Fiji
Several important caveats however should be taken into consideration
in using these maximum intensities
(1) they are only estimates based on extrapolations from the brief
historical record of earthquakes in Fiji The design earthquakes for each
seismic zone are considered to be realistic upper bounds on the magnitudes
expected there However anomalous unpredictLd earLiiatiRkes tat exceed
that size are conceivable occurrences
(2) the estimates contain no information on recurrence of intensities
Thus the recurrence of a given intensity may be much higher for one site than another site depending on the return time for large earthquakes on the
neighboring seismic zones as well as the substrate of each site
(3) the estimates are based on far-field effects of earthquakes
Information on near-field effects of even moderate events in Fiji are
scanty and highly unpredictable Thus a magnitude 5 event directly
beneath a city may produce extremely high intensities in a very restricted
area close to the epicenter
Tsunami Hazard
In addition to the direct damage from groun shaking in the vicinity of
an earthquake large earthquakes in the southwest Pacific have been shown to cause considerable damage at both regional and global distances by
99
Table 1 Predicted maximum intensities of ground shaking (Modified Mercalli Index) generated by maximum probable earthquakes along the seismic zones shown in Figure 37
Zone I Zone II Zone III Zone IV Location Mmax - 75 Mmax shy 70 Mmax shy 65 Mmax shy 60
Suva 5-6 8-9 8 4-5 Lautoka 67 7 7-8 7 Nadi 6-7 8 7-8 7 Monasavu 6 8 8 6 Ba 6-7 6-7 7-8 7 Sigatoka 6 8-9 8 6-7 Labasa 8 8-9 6 7 Savusavu 8 8-9 6-7 6-7 Ovalau 6 8 8 4-5 Koro 7-8 8-9 6 4-5 Kadavu 5-6 8-9 5 3-4 Lakeb-a 6 5 3-4 7 Yasawa Group 9 6-7 5-6 7 Taveuni 9-10 8-9 5 6-7
100
earthquake-generated tsunamis Tsunamis (seismic sea waves) are caused by
displacements in submarine copography that are induced by earthquakes andor
volcanic activity occurring below or near the floor of the ocean Low-lying
areas near the coast are particularly vulnerable to damage by these waves
The shallow seismic zones of the Southwest Pacific have a history of
earthquakes-generated tsunamis (Figure 40) A few tsunamis have originated
in the Fiji region Two significant tsunamis occurred in 1881 and 1953 the
latter was associated with the 1953 Suva earthquake A smaller event
located southwest of Suva in 1975 generated a very small sea wave
(Everingham 1983b) Major Pacific-wide tsunamis such as those generated
along the South American or Alaskan plate margins apparently are not
generated near Fiji Significant local tsunamis however may be associated
with large shallow earthquakes in the immediate vicinity The potential for
tsunamis is of particular importance in view of the concentration of popushy
lation anamp development in low-lying coastal areas of Fiji
A tsunami education program for the residents of Fiji is recommended
(Appendix IV contains a listing of safety rules from the National Oceanic
and Atmospheric Administration (NOAA) which operates the Pacific tsunami
warning system in Hawaii USA)
Volcanic Hazard
Quaternary volcanic activity is far less prevalent in Fiji than elseshy
where in the Southwest Pacific Volcanism less than 2 million years old has
been reported in only six localities in Fiji (Naigani Kadavu Koro Moala
Mago and Taveuni Islands see Rodda and Kroenke 1984) There is no
historical record of volcanic activity in Fiji However Frost (1974)
reported evidence for a prehistoric eruption on Taveuni Island dated at
101
10 I1i
1967
-980
amp) C32
0
St 1905-11
15
1881 g1917
20
1878(2) 2 0 12 O~~
1976
Fiji
1953
1975 j
-
0
1977
~19 15 18 5
0- l948
~~853
000 1977
25 -r 0 198
0 00
1977
30
165deg 170 E 175 180
1917(2)
1976
W
0 0 200 400 Kilometers
175 170
Figure 40 Tsunami history of the Southwest Pacific Filled circles indicate locations of tsunamigenic events dashed circles indicate inferred locations of tsunamigenic events
102 2050 plusmn 150 years before present based on carbon dating Elsewhere there
is no evidence for volcanic activity younger than 250000 years and thus
volcanic activity presents little threat to the inhabitants of those
islands The recent activity on Taveuni warrants seismic monitoring in the
future
Eruptions elsewhere in the Pacific can also have significant effects on
Fiji The submarine eruptions at Home Reef Tonga during March 1984 proshy
duced large quantities of pumice which subsequently rafted across vast
areas of the Southwest Pacific The floating pumice piled ashore locally
and resulted in serious problems with shipping in the region (SEAN Bulletin
1984)
IMPLICATIONS FOR MITIGATION OF EARTHQUAKE RISK
Several significant steps may be taken that will significantly mitigate
the loss of life and property from future earthquakes in Fiji The
following five paragraphs provide suggestions for mitigation of the earthshy
quake risk
Earthquake Education
First an earthquake education program in Fiji should be strongly
encouraged At minimal cost to the Government such a program may be
mounted through the schools Red Cross programs and through the news media
In other countries earthquake education programs have taught simple methods
of strengthening house construction and minimizing hazardous conditions
within the home they have warned of tsunami hazards to coastal dwellers
they have instructed on proper behavior during an earthquake they have
helped to encourage storage of emergency food water and equipment in many
103
households and importantly they have helped avoid panic during an earthshy
quake and stimulated cooperation with government officials following such a
disaster Earthquake education programs are effectively combined with other
disaster preparedness programs (eg cyclones floods and so on)
Building Codes
Second adoption of stringent building codes for all of Fiji is impershy
ative The experience of the 1953 Suva earthquake (Houtz 1962a) demonshy
strates the severe effects of a moderate-sized earthquake near the capital
There is a very real danger of a larger earthquake occurring very close to
Suva the effects of such an event would be multiplied by the increased
development since 1953 In general the adequacy of construction is a major
factcr controlling the damage and loss of life brought on by such an earthshy
quake Building codes designed for areas of similar earthquake hazard such
as New Zealand Code A California Building Codes or Papua New Guinea
Codes 1 or 2 may be appropriate for the portions of Fiji at greatest risk
Certainly New Zealand Code B should be mandated for all public edifices
in Fiji Observation of such codes is most crucial for public multistory
buildings in the major towns of Viti Levu and Vanua Levu As important as
the design of such buildings is the construction methods and quality of
construction material used to implement building design Careful monitoring
of construction by competent engineers is important for critical facilities
Emergency Civil Defense Procedures
Third specific Civil Defense plans for emergency procedures following
an earthquake or tsunami should be developed Of course earthquake preshy
paredness plans have much in common with hurricane or other natural disaster
104
planning that has been implemented in Fiji but specific effects of earthshy
quake occurrence must be considered structural damage to multistory
buildings interruption of water supply disruption of electrical and gas
lines secondary geological effects such as ground liquefaction or landshy
slides in the near-source region complicating effects of aftershocks in the
days and weeks following a major earthquake The primary structure for such
civil defense plans already is in place in Fiji Programs specific to the
earthquake hazard may be added following similar programs in Papua New
Guinea and New Zealand
Long-term Seismicitv Observations
Fourth long-term seismicity and strong motion observations should be
continued and supported by both the Fiji government and overseas aid proshy
grams In the long-term such information will help to refine estimates of
seismic potential along the plate boundaries that surround Fiji they will
help to more directly and accurately assess the ground motion parameters of
direct concern to engineers for building design in Fiji--ground accelershy
ation frequency spectra horizontal and vertical components of ground
motion local amplification effects and so on Furthermore seismicity
patterns may provide a key to long-term forecasting and short-term predicshy
tion of the location and size of future earthquakes that may affect Fijis
population
International Cooperation
Fifth international cooperation among the island countries of the
Southwest Pacific may significantly help in Fijis earthquake preparedness
program All of the countries affected by earthquakes (Tonga Western
105
Samoa Fiji Vanuatu Solomon Islands Papua New Guinea and New Zealand)
have to varying degrees developed earthquake preparedness programs Fiji
may take advantage of the previous current and any future efforts of the
other countries in the region
106
REFERENCES
Band R B Geology of southern Viti Levu and Mbengga Bull Geol Surv Fii 15 1968
Barazangi M and B L Isacks Lateral variations of seismic waveattenuation in the upper mantle above the inclined zone of the Tonga island arc Deep anomaly in the upper mantle J Geophys Res 76 8493-8516 1971
Berryman K Seismotectonic zoning stud of the Fiji Islands EarthDeformation Section Report 70 Wellington NZ DSIR 40 pp 1979
Berryman K Retriangulation of Navua base net (across Suva-Mbenggaseismic zone) Fiji Islands August 1980 Earth Deformation Section Report Wellington NZ DSIR 26 pp 1981
Brocher T M and R Holmes The marine geology of sedimentary basinssouth of Viti Levu Fiji in Investigations of the Northern Melanesian Borderland edited by T M Brocher Circum-Pacific Council for Energy andMineral Resources Earth Science Series Tulsa Oklahoma Amer Assoc Petrol Geol pp 122-137 1985
Calder N The Restless earth A Report on the New Geology The VikingPress New York New York 1972
Carney J N and A Macfarlane Geological evidence bearing on the Miocene to Recent structural evolution of the New Hebrides Arc Tectonophysics 87 147-175 1982
Chase C G Tectonic history of the Fiji Plateau Geol Doc Amer Bull L2 3087-3110 1971
Chen W P and P Molnar Focal depths of intracontinental and intraplateearthquakes and their implications for the thermal and mechanical properties of the lithosphere J Geophys Res 88 4183-4215 1983
Circum-Pacific Council for Energy and Mineral Resources Plate tectonic mapof the circum-Pacific region southwest quadrant 110000000 Amer Assoc Petrol Geol Tulsa Oklahoma 1981
Colley H Metallogenic map of Viti Levu Min Resources Div Fiji Ma 552 1976
Corbett E J Seismicity and crustal structure studies in southernCalifornia Tectonic implications from improved earthquake locationsPhD thesis 231 pp California Institute of Technology 1984
Dickenson W R Dissected erosion surfaces in northwest Viti Levu FijiZ Geomorph N F 16 151-167 1972
107
Dickenson W R M J Rickard F I Coulson J G Smith and R L Lawrence Late Cenozoic shoshonitic lavas in northwestern Viti Levu Fiji Nature 219 148 1968
Draunidalo K B and M W Hamburger Seismicity of Fiji 1965-1969 Min Resources Dep Fiji Note BP 3014 7 pp 1984
Eden R A and R Smith Fiji as a Petroleum Prospect Suva Min Resources Dep 8 pp 1984
Everingham I B Focal mechanism for the 16 November 1979 earthquake near Taveuni Fiji Min Resources Dep Fiji Report 49 1982a
Everingham I B The 1932 Koro earthquake epicenter Mineral Resources Dep Fiji Note BP 331 14 pp 1982b
Everingham I B Reports of earthquakes felt in Fiji 1850-1940 Min Resources Dep Fiji Report 48 54 pp 1983a
Everingham I B The effects of the 16 December 1975 earthquake in Kadavu Passage Fiji Min Resources Dep Fiji Note BP337 16 pp 1983b
Everingham I B Magnitude determinations for shallow earthquakes in Fiji and their implications Min Resources Dep Fiji Rep 48 1983c
Everingham I B Preliminary report of seismic events in the Monasavu Dam area Min Resources Dep Fiji Note BP 332 14 pp 1983d
Everingham I B Provisional list of felt earthquakes reports in Fiji 1941-1981 Min Resources Dep Fiji Note BP 338 17 pp 1984
Everingham I B Focal mechanisms of earthquakes near Fiji Min Resources Dep Fiji Note 1985
Frost E L Archaeological excavations of fortified sites in Taveuni Fiji Asian Pacif Archaeol Ser Univ Hawaii 6 1974
Gill J B From island arc to oceanic islands Fiji southwestern Pacific Geology 4 122-126 1976
Gill J B Stork A L Whelan P M Volcanism accompanying back-arc basin development in the Southwest Pacific Tectonophysics 102 207-224 1984
Green D and D J Cullen The tectonic evolution of the Fiji region in The Western Pacific Island Arcs Marginal Seas Geochemistry edited byPJ Coleman Nedlands University of Western Australia Press pp 127-145 1973
Halunen A J Tectonic history of the Fiji Plateau PhD thesis 127 pp University of Hawaii Honolulu HI 1979
108
Hamburger M W Seismicity of the Fiji Islands and Tectonics of the Southwest Pacific PhD thesis 3i2 pp Cornell University Ithaca NY 1986
Hamburger M W and B L Isacks Seismicity and seismotectonic studies in the Southwest Pacific Min Resources Dep Fiji Note BP3015 50 pp 1983
Hamburger M W and Qiolevu S R The Kadavu earthquakes of July-August 1983 Min Rescurces Dep Fiji Note BP 337 15 pp 1983
Hamburger M W and B L Isacks Shallow seismicity of the North FijiBasin in Basin Formation Ridge Crest Processes and Metallogenesis in the North Fiji Basin edited by L W Kroneke and J V Eade Circum-Pacific Council for Energy and Mineral Resources Earth Science Series Tulsa Oklahoma Amer Assoc Petrol Geol in press 1986
Hamburger M W and I B Everingham Seismic and aseismic zones in the Fiji region in Proceedings of the International Symposium on Recent Crustal Movements of the Pacific Region edited by W I ReillyWellington NZ 9-14 Feb 1984 in press 1986
Hays W W Procedures for estimating earthquake ground motions US Geological Surv Prof Paper 1114 77 pp 1980
Hill D P A model for earthquake swarms J Geophys Res 82 1347-1352 1977
Hodgson J H Direction of faulting in some of the larger earthquakesof the southwest Pacific 1959-1954 Publ Dominion Observ Ottawa 18 171-216 1956
Houtz R E Submarine canyons near Suva as possible fault lineations Rep Geol Surv Fiji 51 3 pp 1959
Houtz R E The 1953 Suva earthquake and tsunami Bull Seismol Soc Amer 52 1-12 1962a
Houtz R Note on minor damage caused by the Suva earthquake of June 1961 Bull Seismol Soc Amer 52 13-16 1962b
Houtz R E and H W Wellman Turbidity current at Kandavu Passage Fiji Geol Mag 99 57-62 1962
Isacks B L L R Sykes and J Oliver Focal mechanisms of deep and shallow earthquakes in the Tonga-Kermadec region and the tectonics of island arcs Geol Soc Amer Bull 80 1443-1470 1969
109
Isacks B L R K Cardwell J L Chatelain M Barazangi J M Marthelot D Chinn and R Louat Seismicity and tectonics of the central New Hebrides island arc in Earthquake Prediction An International Review Maurice Ewing Ser edited by D W Simpson and P G Richards pp 93-116 1981
Iyer H M Geophysical evidence for the locations shapes and sizes and internal structures of magma chambers beneath regions of Quaternary volcanism Phil Trans Roy Soc Lond A310 473-510 1984
Karig D E Ridges and basins of the Tonga-Kermadec island arc system J Geophys Res 75 239-254 1970
Karig D E and G F Sharman III Subduction and accretion in trenches Geol Soc Amer Bull 86 377-389 1975
Kroenke L W C Jouannic and P Woodward Bathymetry of the Southwest Pacific Chart 1 of Geophysical Atlas of the Pacific CCOPSOPAC 1983
Lahr J C HYPOELLIPSEVAX A computer program for determining local earthquake hypocentral parameters magnitude and first-motion pattern US Geol Surv Open-File Rep 84-519 60 pp 1984
Larue B M J Y Collot A Malahoff A sedimentary structure southwest of Viti Levu Fiji The Baravi Basin in Symposium on Petroleum Potential in Island Arcs Small Ocean Basins Submerged Margins and Related Areas UN ESCAP CCOPSOPAC Tech Bull 3 Wellington NZ DSIR pp 77-83 1980
Launay J Morphologie et structure de larc insulaire des Nouvelles-Hebrides dans sa terminaison sud in Contribution a ]Etude Geodvnamigue du Sud-Ouest Pacifioue Travau et Documents de ]ORSTOM No 147 pp 163-178 1982a
Launay J Essai de schema tectonique de la terminaison sud de larc insulaire des Nouvelles-Hebrides In Contribution a 1Etude Geodynamique du Sud-Ouest Pacifique Travaux et Documents de lORSTOM No 147 pp 217-220 1982b
lee W H K and S W Stewart Principles and Applications of Microearthquake Networks New York Academic Press 292 pp 1981
Louat R Seismicite et subduction de la terminaison sud de larc insulaire des Nouvelles Hebrides in Contribution a lEtude Geodvnamique du Sud-Ouest Pacifique Travaux et documents de lORSTOM No 147 Paris ORSTOM p 179-185 1982
Maillet P and M Monzier Volcanisme et petrologie des iles Matthew et Hunter donnees preliminaires in Contribution a lEtude Geodvnamique du Sud-Ouest Pacifique Travaux et documents de lORSTOM No 147 Paris ORSTOM pp 187-216 1982
110
Malahoff A R H Feden and H S Fleming Magnetic anomalies and tectonic fabric of marginal basins north of New Zealand J Geophys Res 7 4109-4125 1982a
Minster J B and T H Jordan Present-day plate motions J Geophys Res 83 5331-5354 1978
Monzier M P Maillet J Foyo Herrera R Louat F Missegue and B Pontoise The termination of the southern New Hebrides subduction zone (southwestern Pacific) Tectonophvsics 101 177-184 1984
Nakamura K Volcanoes as possible indicators of tectonic stress orientation Principle and proposal J Volc Geoth Res 2 1-16 1977
Nakamura K K H Jacob and J N Davies Volcanoes as possibleindirators of tectonic stress orientation--Aleutians and Alaska Pure ApplGeophv 115 87-112 1977
Roca J L Essai de determination du champ de contraintes dans larchipeldes Nouvelles Hebrides Bull Soc Geol France 20 511-519 1978
Rodda P Outline of the geology of Viti Levu N Z J Geol Geophys I0 1260-1273 1967
Rodda P Fiji In Mesozoic-Cenozoic Orogenic Belts A M Spencer (ed)Spec Publ Geol Soc London 4 415-432 1974
Rodda P Geology of northern and central Viti Levu Bull Min Resources Div Fiji 3 1976
Rodda P and R B Band Geology of Viti Levu Fiji Geol Surv Map GS 432 1966
Rodda P and L W Kroenke Fiji A fragmented arc in L W Kroenke Cenozoic Tectonic Development of the Southwest Pacific UN ESCAP CCOPSOPAC Tech Bull 6 87-109 1984
Rodda P I McDougall R A Cassie D A Falvey R Todd T A Wilcoxon Isotopic ages magnetostratigraphy and biostratigraphy from the early Pliocene Suva Marl Fiji Geol Soc Amer Bull 96 529-538 1985
Sanford A R and P Einarsson Magma chambers in rifts in Continental and Oceanic Rifts Geodynamics Ser vol 8 edited by G Palmason Amer Geophys Un Washington DC pp 147-168 1982
Sclater J G and H W Menard Topography and heat flow of the Fiji Plateau Nature 216 991-993 1967
Sclater J G J W Hawkins J Mammerickx and C G Chase Crustal extension between the Tonga and Lau Ridges Petrologic and geophysical evidence Geol Soc Amer Bull 83 505-517 1972
Silverstein B Processed strong-motion records from Monasavu Dam Fiji Earthquakes of February 13 14 and 23 1983 US Geol Surv Open File Rep 85-375 85-375 1985
Smith R B and R L Bruhn Intraplate extensional tectonics of the eastern Basin-Range Inferences on structural style from seismic reflection data regional tectonics and thermal-ductile models of brittle-ductile deformation J Geophys Res 89 5733-5762 1984 Smith R and T Raicebe (comps) Bathymetric map of Fiji Multicolored scale 11000000 Suva Min Resources Dept Fiji 1984
Stuart D J Current status of the continuing investigation of seismicity in the Monasavu Dam area Viti Levu Min Resources Dep Fiji Note BP 3016 18 pp 1985
Sykes L R The seismicity and deep structure of island arcs J Geophys Res 71 p 2981-3006 1966
Sykes L R B L Isacks and J Oliver Spatial distribution of deep and shallow earthquakes of small magnitude in the Fiji-Tonga region Bull Seismol Soc Amer 59 1093-1113 1969
Taylor F W Quaternary tectonic and sea-level history of Tonga and FijiSouthwest Pacific PhD Thesis Cornell University Ithaca N Y 355 pp 1978
Turcotte D L and G Schubert Geodynamics John Wiley amp Sons New York 1982
Von Stackelberg U and Shipboard Scientific Party Hydrothermal sulfide deposits in back-arc spreading centers in the Southwest Pacific submitted to Nature 1985
Whelan P W J B Gill E Kollman R Duncan and R Drake Radiometric dating of magmatic stages in Geology and Offshore Resources of Pacific Island Arcs - Tonga Region edited by D W Scholl and T L Vallier Circum-Pacific Energy and Mineral Resources Council Am Assoc Petrol Geol Spec Publ 2 Earth Sci Ser Tulsa Oklahoma in press 1985
Woodhall D The geology of the Lau Ridge in Tonga Ridge Resource Studyand Tripartite Cruise Report edited by D S Scholl and T L Vallier Open-file Rep CCOPSOPAC Suva Fiji pp 277-300 1985a
Woodhall D Geology of Taveuni Island Min Resources Dep Fiji in prep 1985b
112
APPENDIX I DEFINITIONS
Two measures of the size of an earthquake are magnitude and intensity
Magnitude is a measure of the energy from an earthquake source to indicate the
strength of an earthquake In comparison intensity is a measure of the amount
of ground shaking caused by the earthquake at a particular site Thus an
earthquake of a given magnitude will produce a wide range of intensities
depending largely on distance from the source
In general a small earthquake with a magnitude less than 5 may be felt
only in the area near the source and a moderate earthquake with a magnitude
between 5 and 7 will be felt over a wider area and may produce significant
damage in the area very close to the source A large earthquake refers to an
earthquake with a magnitude greater than 7 Such events are often very desshy
tructive if they are located near population centers A major earthquake
refers to magnitudes between 7 and 7 34 and a great earthquake refers to
magnitudes greater than 7 34 These great earthquakes cause widespread desshy
truction and possible regional tsunamis Generally the potential damage from
earthquakes is multiplied by the secondary effects of earthquake occurrence
such as ground faulting generation of tsunamis landslides slumping or
liquefaction
The depth of earthquakes range from the surface to approximately 700 km
depth Shallow earthquakes refer to those with depths between the surface and
70 km Intermediate earthquakes refer to those with depths between 70 km and
300 km depth De earthquakes refer to those with depths greater than 300 km
(but less than 700 km) Intermediate depth earthquakes occasionally produce
damage at the earths surface only if the earthquake is very large Deep
events are generally not felt
113
The seismic (earthquake) potential of a particular region is defined as
the likelihood of that region to experience a (destructive) earthquake within a
particular magnitude range within a particular time period The seismic
(earthquake) hazard of a particular location refers to the amount of ground
motion that might be expected from an earthquake within or near that region
Adequate data on seismotectonic features instrumental (strong-motion) and
macroseismic (intensity) records of near-field effects of large earthquakes
source parameters of large earthquakes earthquake spectra and ground attenuashy
tion or amplification are necessary in order to reasonably evaluate earthquake
hazard for any region The seismic potential is the integration of all of
these bits of information The average length of time between earthquakes of a
particular size (recurrence interval) and the amount of time elapsed since the
last earthquake of that size help to define the probability of future earthshy
quake occurrence along a particular seismogenic zone hence the seismic
potential of that zone
Seismic risk of a particular region refers to the expected degree of
losses of people and their property which result from the seismic hazard and
the vulnerability in the region One method that has been widely used for this
risk determination (and is used here) involves the determination of a maximum
probable earthquake (design earthquake) that is likely to occur in the imshy
mediate region Calculations of seismic hazard which are based on design
earthquakes generally yield conservative estimates of risk
The most important conclusion of historical studies of seismicity is to
define the seismogenic zones of a region and extrapolate what the future earthshy
quake potential is for those zones Seismically quiescent regions refer to
regions with a lower level of seismic activity which are surrounded by more
114
active regions Portions of major plate boundaries that have not experienced a
major or great earthquake during a particular time interval are seismic gaps
This time interval is taken to be a significant portion of the earthquake
recurrence interval for a large earthquake An estimate to within several
decades of the location and size (magnitude) of a large earthquake constitutes
a forecast If a precise calculation of the time and probability of occurrence
can be added to the location and size information then the estimation is a
prediction
115 APPENDIX II MODIFIED MERCALLI INTENSITY SCALE (1956 VERSION)1
Masonry A B C D To avoid ambiguity of language the quality ofmasonry brick or otherwise is specified by the following lettering (whichhas no connection with the conventional Class A B C construction)
Masonry A Good workmanship mortar and design reinforced especiallylaterally and bound together by using steel concrete etc designed toresist lateral forces
Masonry B Good workmanship and mortar reinforced but not eesigned indetail to resist lateral forces
Masonry C Ordinary workmanship and mortar no extreme weaknesses likefailing to tie in at corners but neither reinforced nor designed againsthorizontal forces
Masonry D Weak materials such as adobe poor mortar low standards ofworkmanship weak horizontally
DESCRIPTION (INTENSITY VALUES RANGE FROM I TO XII)
I Not felt Marginal and long-period effects of large earthquakes
II Felt by persons at rest on upper floors or favorably placed
III Felt indoors Hanging objects swing Vibration like passing oflight trucks Duration estimated May not be recognized as an earthquake
IV Hanging objects swing Vibration like passing of heavy trucks orsensation of a jolt like a heavy ball striking the wallsStanding motor cars rock Windows dishes doors rattle Glassesclink Crockery clashes In the upper range of IV wooden walls and frames creak
V Felt outdoors direction estimated Sleepers wakened Liquidsdisturbed some spilled Small unstable objects displaced orupset Doors swing close open Shutters pictures movePendulum clocks stop start change rate
Original 1931 version in Wood H 0 and F Newmann 1931 ModifiedMercalli Intensity Scale of 1931 Bull Seis Soc Amer 53 979-9871956 version prepared by Charles F Richter in Elementary Seismology(1958) 137-138 W H Freeman and Company
116 VI Felt by all Many frightened and run outdoors Persons walk unsteadily Windows dishes glassware broken Knickknacks booksetc off shelves Pictures off walls Furniture moved or overshyturned Weak plaster and masonry D cracked Small bells ring(church school) Trees bushes shaken (visibly or heard to
rustle--CFR)
VII Difficult to stand Noticed by drivers of motor cars Hangingobjects quiver Furniture broken Damage to masonry D includingcracks Weak chimneys broken at roof line Fall of plasterloose bricks stones tiles cornices (also unbraced parapets andarchitectural ornaments--CFR) Some cracks in masonry C Waveson ponds water turbid with mud Small slides and caving in alongsand or gravel banks Large bells ring Concrete irrigationditches damaged
VIII Steering of motor cars affected Damage to masonry C partialcollapse Some damage to masonry B none to A Fall of stucco andsome masonry walls Twisting fall of chimneys factory stacksmonuments towers elevated tanks Frame houses moved onfoundations if not bolted down loose panel walls thrown outDecayed piling broken off Branches broken from trees Changes inflow or temperature of springs and wells Cracks in wet groundand steep slopes
IX General panic Masonry D destroyed masonry C heavily damagedsome times with complete collapse masonry B seriousiy damagedGeneral damage to foundations--CFR) Frame structures if notbolted shifted oft foundations Framed cracked Serious damageto reservoirs Underground pipes broken Conspicuous cracks inground In alluviated areas sand and mud ejected earthquakefountains sand craters
X Most masonry and frame structures and bridges destroyed Seriousdamage to dams dikes embankments Large landslides Waterthrown on banks of canals rivers lakes etc Sand and mudshifted horizontally on beaches and flat land Rails bent slightly
XI Damage nearly total Large rock masses displaced Lines of sightand level distorted Objects thrown into the air
117 APPENDIX III SEISMOLOGICAL FACILITIES AND EARTHQUAKE HAZARD PROGRAMS IN
THE SOUTHWEST PACIFIC
As part of our program of field investigations in Fiji Tonga andVanuatu our researcher was able to visit the neighboring island countriesof the Southwest Pacific region During these visits he was able to meetwith scientists and public officials involved with the earthquake hazardproblem fEcing each country In every case the governments are awareand have taken some action to ofmitigate the potential losses due to destrucshytive earthquakes but these governmental responses have varied widely fromcountry to country This report focusses on the seismological institutionsand facilities in each of the counltries and their capabilities in assessingand planning for earthquake hazards In the following sections weconsider each of the island countries of this area which face a severeearthquake risk Fiji Tonga Vanuatu Western Samoa Solomon IslandsPapua New Guinea and New Zealand
TONGA
Seismological Facilities Seismological observations in Tonga are the responsibility of theMinistry of Lands Surveys and Natural Resources Due to fiscal conshystraints however these efforts have in the past been entirely dependenton foreign assistance Seismological experiments began in Tonga in themid-1960s with Lamont-Dohertys Upper Mantle Project Seismic stationswere operated by Lamont-Doherty and subsequently by Cornell scientiststhrough the early 197 0 s when operations were suspended In late 1983 aspart of the present AID-supported seismic hazard program Cornell reinshystalled a three-component short-period seismograph in the capitalNukualofa The seismograph was installed upon the request of the governshyment geologist to be operated by the Tongan government with technicalassistance from Cornell Unfortunately after operation of the seismographfor eight months Tongas Cabinet decided that the drain on its resourcesand personnel was excessive and the instruments were disconnected in May1984 with the components transferred to Fiji and Vanuatu where they canbe utilized There are presently no plans to reinstall permanent seismoshy
graphs in Tonga
Strong Motion Accelerographs
Two strong-motion accelerographs provided by the AID seismic hazardprogram are presently operating in Tonga one in Nukualofa and one in thenorthern Vavau Islands They have been in operation for one year andhave not to date recorded any large earthquakes They require a minimum ofmaintenance and their operation will continue to be supen-sed by thegovernment geologists with assistance from Cornell A third accelerographmay be made available to tonga by the British Geological Survey and couldbe installed on Eua Island in a zone of high activity close to the TongaTrench
118 Related Research Programs
The Ministry of Lands Surveys and Natural Resources employs a singlegovernment geologist whose responsibilities include coordination of oilprospecting geological mapping of the islands and assessment of earthquakeand tsunami hazards There has been considerable scientific study of theTonga Trench subduction zone by research groups from the United StatesJapan New Zealand Australia Germany and the Soviet Union More detailedmarine geophysical data have been collected near Tongatapu Island byAmerican petroleum exploration groups
Critical Facilities
The capital city of Nukualofa has a population of only 20000 butdoes include several three- and four-story buildings The larger buildingshave in general been designed by foreign engineers and have includedearthquake-resistant design specifications Other significant developmentprojects include the expansion of the government wharf in Nukualofa anddevelopFnent of tourist resorts on Tongatapu and several of the outer islands
Earthquake Preparedness Programs
There are no building codes presently enforced in Tonga Howeverconstruction of public buildings must be approved by the Ministries ofWorks and Health The largest office buildings and hotels are designed byoverseas engineering firms and generally include some earthquake loadingcriteria The Land and Environment Act currently under consideration bythe Tongan government would require review of all development projects bythe government planner application of building codes largely adapted fromNew Zealand codes is expected to followDisaster preparedness programs are the responsibility of the CabinetsNational Disaster Committee including representatives from the relatedgovernment ministries and departments Subcommittees focus on disasterpreparedness action planning and long-term relief and rehabilitation
There is no earthquake education program in Tonga
VANUATU
Seismological Facilities
Seismic stations in Vanuatu were first established in the mid-1960sby the French Office de la Recherche Scientifique et Technique Outre-Mer(ORSTOM) Station PVC in Port Vila has operated continuously from 1964 tothe present while LUG in Luganville Santo operated through 1980 A thirdstation on Tanna Island (INH) operated through 1978 Cornells cooperativefield programs with ORSTOM began in 1976 with a microearthquake experimenton Santo Island an ocean-bottom seismograph experiment was carried out insouthern Vanuatu in 1977 and in central Vanuatu in 1978 The
119 Cornell-ORSTOM telemetered seismic network was established in 1978 and hasoperated continuously since that time The seismic network now includes 19telemetered stations (Figure Al) to date over 17000 earthquakes havebeen recorded by the network A permanent ORSTOM mission is now based inPort Vila and takes primary responsibility for day-to- day maintenance ofthe network These seismological facilities are complemented by studies ofground deformation using seven bubble-level tiltmeter a two-componentlong-baseline water tube tiltmeter and two levelling arrays
Strong Motion Accelerographs
As part of the present program of seismic hazard evaluation inVanuatu Cornell has installed five strong motion accelerographs on theislands of Efate Malekula and Santo (Figure Al) These instruments havealready been triggered by five moderate-sized shallow events and will beused to provide a basis for predicting local ground motion induced by largeinterplate earthquakes in Vanuatu The high level of seismicity along thisplate boundary suggests that a valuable baseline of strong motion data canbe collected in a relatively short period of time
Related Scientific Programs
The seismology program is carried out in cooperation with the VanuatuDepartment of Mines Geology and Rural Water Supplies They areresponsible for regional geology studies resource assessment detailedmapping and hydrological activities In addition ORSTOMs geology andgeophysics department based in New Caledonia carries out an extensiveprogram of investigations covering submarine morphology marine geologyand geophysics island geology and crustal structure Recently the USGeological Survey has undertaken a series of detailed marine studies in thecentral and northern portions of the island arc using the research vesselSP Lee A detailed hydrographic survey was carried out in coastal watersby Australian researchers In addition proton-precession magnetometersare maintained by Queensland University (Australia) researchers A tidegauge is maintained by the ORSTOM mission in Port Vila
Critical Facilities
Port Vila with a population of under 20000 is the administrativeand commercial center of the country There are a number of multistorybuildings in the capital and most of Vanuatus small tourist industry islocated in and near Port Vila A large shipping wharf is located near the center of the city on Vila Bay
Apart from Port Vila the only significant development in Vanuatu isat Luganville on Santo Island (pop 5000) It remains an importanteconomic center for the country with agricultural processing and shippingfacilities located there There are several three- and four-storybuildings in the center of Luganville There was significant damage to
120
14 o 166 deg 1670 1680 1690 1700
GAUA FIJI
150 0 PLATEAU
a ~ SANTO A013AoVAN CAAO 1
APENTECOST deg - STAMB16 aAMKs 160 AMBRYM 16
MALEKULA MML~DENTRECASTEAUX FRACTIURE ZONE
IEP
170- EM I-170
NGOUNANGA IN
S EFAT 180- oJ pV
0-180
mV
o ERROMANGO o -OAUSTRALIANR FUTUNAT ANN
19 6669190 o
-4 00 FUTUNA00AUSTRALIAN
0 0 N__
20ht PLAT E S I ANATOM l 0
165c 166deg 1670 degE 1680 169 1700
Figure Al Map showing the seismograph stations in Vanuatu Circles arestations telemetered to the base station PVC on Efate island andunderlined stations have two components--one horizontal and one verticalThe triangles are older ORSTOM stations INH and LUG are no longer operational Strong motion instruments are located at SWB and LMP onMalekula island DVP and PVC on Efate island and LUG on Santo island
121
buildings wharves and bridges in Luganville following the 1965 Santo earthquake
Earthquake Preparedness Programs
Disaster preparedness is the responsibility of the Ministry of Home Affairs a revised Rescue Plan has been adopted since independence They are responsible for damage assessment and coordination of emergency relief efforts by other ministries and public agencies
There are presently no building codes enforced in Vanuatu At present the government has requested the assistance of a consultant from New Zealand to help provide uniform building codes for the country The Public Works Department enforces New Zealand seismic zone B codes to construction of public buildings Large buildings for the most part are designed by overseas engineering firms and generally comply with their earthquake design standards Smaller buildings are generally designed close to the New Zealand loading specifications but there continues to be great difficulty in supervising construction projects
There is no large-scale earthquake education project in Vanuatu Materials have been prepared by ORSTOM seismologists for distribution to teachers public officials and planners involved in earthquake hazards
WESTERN SAMOA
Seismological Facilities
One of the earliest seismic stations in the Pacific was established at the Apia Observatory in 1902 during the German colonial period through the University of G6ttingen In 1921 control of the observatory was transshyferred to the New Zealand Government Weichert seismographs were operated continuously at Apia through 1957 when they were replaced by Benioff instruments at Afiamalu and by short-period Wood-Anderson instruments at Apia Since Samoan independence in 1963 the Observatory has been operated jointly by the Samoan Government and the Department of Scientific and Industrial Research (DSIR) New Zealand In 1963 a Worldwide Standard Seismograph Station was established at Afiamalu Operation of this six-component station is supported by the US Geological Survey In 1980 the station was upgraded to allow digital recording equipment was added to upgrade the statior co the status of a Global Digital Seismic Network station Seismic records are sent to DSIR in Wellington for permanent storage
Strong Motion Accelerographs
A simple strong motion instrument has been operating in Apia since 1979 It is an event-triggered low-gain seismograph recording on an ink-stylus recorder At the time of our visit to Western Samoa the instrument had been out of service for several months Only one event has to date triggered the instrument
122
Related Scientific Programs
The Apia Observatory has also made continuous magnetic field measureshyments since 1905 Measurements are currently made using a Schultze earth inductor an Askania declinometer and a proton magnetometer The observashytory maintains two tide gauges as part of the Pacific Tsunami Warning System Offshore resource studies have been carried out through CCOPSOPAC and by various international research groups Much of the reconnaissance geological work in Western Samoa has been carried out by DSIR in New Zealand
Critical Facilities
Like many -f the other island countries of the Pacific Western Samoas development has been concentrated around the capital Apia (pop34000) A major deep-water harbor and the countrys tourist industry are based in Apia Several multistory buildings have been erected in Apia in the past several years A hydroelectric dam on Upolu Island was completed in 1978
Earthquake Preparedness Programs
There is presently no disaster plan in effect in Western Samoa The various agencies involved with emergency action are coordinated through the Police Commissioner New Zealand seismic zone B codes are applied to construction in Western 5amoa Enforcement is handled by the Public Works Department Modest educational materials have been prepared by the ApiaObservatory staff in English and Samoan for distribution through schools and public agencies
SOLOMON ISLANDS
Seismological Facilities
Seismological Observatories in the Solomon Islands are conducted by the Ministry of Lands Energy and Natural Resources They have operated a Worldwide Standard Seismic Station in Honiara since 1962 operation of the station is supported by funds from the US Geological Survey The station was augmented by two short-period telemetered seismic stations in 1982 This three-station network was provided through the British GeologicalSurvey with the aim of identifying volcanic earthquakes associated with the active volcano Savo located close to the capital
In awareness of the high volcanic risk to population centers in the Solomon Islands the Ministry has drawn up plans for two three-station telemetered arrays to be deployed around the active volcanoes on Simbo Island (New Georgia Group) and on Tinakula Island (Santa Cruz Group) They are presently seeking foreign aid in the form of seismic instrumentation and technical assistance to establish the network
123
The Ministry also has responsibility for field surveys following majorearthquakes in the Solomon Islands Studies of ground deformation and cultural effects of the large 1977 and 1984 earthquakes were made by seisshymology officers
Strong Motion Accelerographs
Two strong motion accelerogaphs were installed on Guadalcanal by the Ministry in late 1984 They will be responsible for maintaining the instruments but have requested Cornells assistance in analyzingaccelerograms obtained during their operation The high level of shallow activity near Guadalcanal suggests that a significant number of strong-motion records will be obtained during the lifetime of the instruments
Related Scientific Programs
The Ministry also carries out related research programs in regionalgeology minerals assessment groundwater studies and so on Extensive marine surveys have been carried out in the Solomon Islands by the US Geological Surveys Resource Assessment Program Local offshore surveys have been carried out through CCOPSOPAC A tide gauge is maintained by the Solomon Islands Hydrographic Unit Six proton-precession magnetometers are operated in the Solomon Islands by the Queensland University (Australia)
Critical Facilities
Over 90 of the Solomon Islands population remains in rural areas The major development is in Honiara the administrative and commercial center of the country Honiara (pop 15000) is the major shipping center of the country and now includes several multistory buildings
Earthquake Preparedness Programs
The Solomon Islands implemented a National Disaster Plan in 1980 subsequently revised in 1982 The Plan gives the Ministry for Home Affairs and National Development overall responsibility for coordination of efforts in earthquake volcanic and tsunami disasters Operational relief efforts are carried out through the Disaster Operations Coordinator and the Provincial governments
The government has adopted the most stringent earthquake building code (Zone A) from New Zealand for multistory building construction in Honiara Implementation of these guidelines continues to be a problem One multi- story building in Honiara (Australian High Commission Building) was severely damaged during the 1984 earthquake Some efforts have been made to develop small-scale earthquake-resistant building techniques appropriate for rural areas The Pacific Islands Development Program organized a model
124
house constrtction and workshop during early 1984 A modest outreach program has developed through the school system adult education programsand the government broadcasting company
PAPUA NEW GUINEA
Seismological Facilities
The government of Papua New Guinea has made an extensive commitment to earthquake and volcanic hazard mitigation through construction of a national intLwor cif seisn graphs and accelerographs (Figure A2) Aten-station national network of seismographs is monitored by the Port Moresby Geophysical Observatory (Department of Minerals and Energy) Three of the remote stations are telemetered to Port Moresby via microwave linksfour stations operate as permanent field stations and two are operated at temporary sites on outlying islands Port Moresby is presently the site of a Worldwide Standard Seismic Station that has operated since 1958 The national network reports arrival times to the US Geological SurveysPreliminary Determination of Epicenters and the International SeismologicalCentre but does not routinely locate events independently
In addition t0 the national seismic network the Rabaul VolcanologicalObservatory operates seven seismic stations near active volcanoes around the country and a nine-station telemetry network around the Rabaul Caldera Bougainville Copper Limited operates a 5-station network on Bougainville Island (North Solomons Province)
Stronm Motion Accelerographs
The Port Moresby Geophysical Observatory maintains a national networkof thirteen strong motion accelerographs distributed in the highly seismic areas of the country (Figure A2) This includes a closely spacedfour-station network around the Rabaul Caldera A single strong motion accelerograph is situated on Bougainville Island and is maintained byBougainville Copper Limited The network uses Kinemetrics SMA-I and New Zealand DSIR MO-2 instruments and has recorded tens of accelerograms since its establishment in 1967 The Observatory is presently trying to establish an engineering seismologist position to analyze the accumulatingdata and to further upgrade the accelerograph network
Related Scientific Activities
In addition to the Geophysical Observatory the Department of Minerals and Energy includes the Geological Survey of Papua New Guinea The Surveyundertakes a wide range of geological investigations including regionalgeological mapping petroleum and mineral exploration engineering and environmental geology and energy resource development Offshore surveyshave been carried out through CCOPSOPAC as well as American and Australian research vessels Continuous monitoring of the magnetic field is carried out by the University of Queensland (Australia) Ten tiltmeters have been
CSA v~cwS~Ior m~ 16008 O
fR o- c ~ 1
a ~ 19CL SOewPV ftfa
b (b UACCO40 t wa aj
R~bOVIRAR AI
Ap~~ooj Toel Pbu IR TL
R (l
YOM~I -oob
vtvtOOalork Island WO)ISI
NETWORKS MARCH 1384
Figure A2 Panua New Guinea seismograph and accelerograph networks U
126 deployed by the Volcanological Observatory to monitor ground deformation near Papua New Guineas active volcanoes Four of these instruments aredeployed around Rabaul Caldera
Critical Facilities
Papua New Guinea is the most developed of the island countries of theSouthwest Pacific with a population of over 3000000 and extensive urbandevelopment The capital city of Port Moresby has a population of over130000 with major multistory construction in the downtown area a majordeep water harbor and significant commercial and industrial activity in thePort Moresby area There is significant development as well in the smallertowns of Rabaul Lae Madang Wewak Goroka Mount Hagen Wau BuloloDaru and Kerema Major hydroelectric schemes have been established on theRamu and Rouna rivers with additional hydroelectric plans at variousstages of evaluation and development Extensive mineral development hastaken place in the North Solomons Morobe and Western provinces of PapuaNew Guinea Extensive natural gas and limited oil deposits have beenlocated these may become commercially exploited in the near future
Earthquake Preparedness Programs
Papua New Guinea has a long history of earthquake and volcano-relateddisasters A national disaster program was established in 1981 and proshyvides for a National Disaster Emergency Committee which formulates emershygency government policy and a Disaster Civil Defence Committee which isresponsible for implementation of short-term relief effortsprovincial governments are
The given major responsibility for initialcoordination and assessment of disasters assistance is subsequently
requested from the federal government for major disasters Many of theprovincial governments have not revised preparedrcs plmns sLnce thecolonial period However particularly intense effort has been directed inEast New Britain province because of the imminence of a potentially desshytructive volcanic eruption in Rabaul Caldera
The town of Rabaul (pop 15000) is a major commercial center forPapua New Guinea and is situated directly within the caldera of an activevolcano A relatively small eruption took place at a secondary eruptivecenter near Rabaul in 1937 killing over five hundred nearby residents andforcing the evacuation of the town In order to avoid a repeat of such adisaster the government established the Volcanological Observatory withfour full-time volcanologists and real-time earthquake location andanalysis of tilt data A drastic increase in volcanic seismicity inmid-1983 led to a volcanic hazard alert and intensification ofseismological and ground deformation studies around Rabaul In additionthe alert allowed the provincial and national Disaster Emergency Committeesto make extensive evacuation and relief plans for a possible eruption atRabaul including preparation of a new airstrip improvement of roads andemergency water supplies communications systems detailed evacuationplans education programs and so on To date there has been remarkablecooperation of efforts by provincial national and overseas officials to
127
mitigate the potentially devastating effectq of a volcanic eruption at Rabaul
Papua New Guinea is the only country of the developing nations of the Southwest Pacific to have devised its own seismic zoning system(Figure A3) The Nationwide Housing Code for Papua New Guinea sets up a four-level system of seismic loading oriented toward moderate-sized (to 8 stories) buildings Major buildings require independent dynamic analysisusually carried out by overseas engineering firms Seismic Zone 1 of the Housing Code is among the most stringent earthquake loading codes in theworld and includes the town of Rabaul and much of the East New Britain and North Solomons provinces Seismic zone 2 includes the towns of LaeWewak and Madang and is approximately equivalent to New Zealand Zone A or California loading designs The capital Port Moresby is in the lowest seismic zone (4) but buildings constructed there still require designs allowing for significant lateral loadings
Earthquake education is handled through the National Radio Government Printing Office the Civil Defence Department and the school system withinformation supplied by the Geophysical and Volcanological Observatories A particularly intense education effort has been mounted in Rabaul where educational materials have been produced and distributed in three languages and public involvement in preparedness plans has been emphasized
NEW ZEALAND
While New Zealand cannot be considered one of the developing countries of the Southwest Pacific its seismology programs have been responsible for much of the observational data available for the entire region Because of its importance to the other national seismology programs we briefly review here the New Zealands observational facilities Its extensive programs in engineering seismology its critical facilities and its earthquake preparedness programs will not be covered here
National Seismic Network
Seismological facilities in New Zealand are maintained by the Geophysics Division of the Department of Scientific and Industrial Research (DSIR) in Wellington The national standard seismograph network presentlyconsisting of thirty short-period stations is shown in Figure A5 The network routinely locates all earthquakes of ML gt 38 within New Zealandand earthquakes with Ms gt 50 for the region within 100 of New Zealand Arrival time data are routinely transmitted to the US Geological Surveyand the International Seismological Centre The events located by the network are reported in the annual New Zealand Seismological ReportSeveral hundred earthquakes are located by the DSIR national network each year
The network is augmented by long-period instruments operating at Karopiro Roxburgh and Wellington DSIR also operates a three-componentborehole seismometer in Wellington as part of the Seismic Research Observatory network supported by the US Geological Survey
bull ------- - -- -shy - +----2
FIG 13
f 4tSEISMIC ZONES FOR BUILDING CONSTRUCTION IN PAPUA NEW GUINEA
4
7r
Zce CtASSIICION OF CITIEI Pr 3 12OI- ZO I Z7oE
Figure A3 Seismic zones for building construction in Papua New Guinea (Jury et al 1982)
129
CAPEREINGA
ONERAHI
0GREAT BARRIER
AUCVAND 0
WHITE ISLAND B OCT1914
KARAPIRO EASTCAPE
r WHAKATANE WAIRAKEI
PI5 SEP 13EARATA 0 TUAI 2BJUSBRNE21 CHATEAU MARADALE 4 2 FEJUL1931
90 MANGAHAD v5 MAR 19340 B8AUG 190A
CASTLEPOINT 4JUN 1942 COB ELLINGTON 2 A ~ C BB~3 A16
23 MAY 1968 JANa5
KAIMATA KAIKOURA 9 MAR 19 U 0
3 AUG 1999
CASHMERE lb NOVIqDMT JOHN
PUKA I24 MAR 1960MILFORD -SOUND ) MAY 1976Y
OAMARU ROXBURGH
BORLAND DUNEDIN MAGNITUDE7 OR GREATER 4LODGE 118 0O1019791MAGNITUDE6OR GREATER
OBAN 11940to 19791
Figure A5 Seismograph stations of the national network (left) and the distribution of large shallow earthquakes (right) in New Zealand (Seismological Observatory Wellington 1980)
130 Stations in Outlying Territories
New Zealand has also taken anstations in outlying areas
important lead in operating seismographof the Southwest -acific These stations havebeen extremely important in hypocentral control for the Tonga - Kermadecseismic zone and for nuclear event detection in the Pacificoperates three 6 DSIR-component Worldwide Standard Seismograph stations atAfiamalu (Western Samoa) Raratonga (Cook Islands) and Scott Base(Antarctica) Short-period stations operate at Apia (Western Samoa)Campbell Island (New Zealand) Chatham Islands (New Zealand) Nadi (Fiji)Nime and Raoul Island (Kermadec Island New Zealand) Readings from thesestations are routinely reported to PDE and ISC for global earthquakelocation
Wellington Network
A small-aperture high-gain seismic network is operated aroundWellington an area of greatest seismic risk in New Zealandare The stationstelemetered by radio or telephone link to the central recording siteThe network now consists of eleven stations Earthquakes are presentlydetected by a microprocessor-based Automatic Seismic Monitor and automatedlocation processing is expected to follow The network routinely locatesevents with ML gt 15
Pukaki Network
A second microeartlhquake network has operated around Lake Pukakihydroelectric project in the South Island New Zealand a
established in 1975 The network wasto monitor reservoir-induced seismicity associatedwith impoundment of the reservoir The network consisted of nine stationsand was intended to operate on a temporary basis It has been closed sinceearly 1984 with several of the stations continuing to support thenational network and to monitor any future reservoir-related activity
Related Seismolo Research
In addition to its regular observatory seismology the GeophysicsDivision has an active seismology research programfocussed on Their studies havetheoretical seismology earthquake prediction crustalstructure of New Zealand historical earthquake studies nuclear eventdetection seismic risk in New Zealand strong motion studies and volcanicseismology The monitoring of active volcanoes is closely coordinated withcrustal deformation monitoring conducteu by the Earth Deformation Sectionof the New Zealand Geological SurveyThe New Zealand strong motion accelerograph network now consists of225 instruments operated by the Physics and Engineering Laboratory ofDSIR Most of these instruments are of a New Zealand design (Mechanicaland Optical Accelerographs) and analog records
film are made on photographicThree digitally recording accelerographs are now in operation in
131
Stations in Outlying Territories
New Zealand has also taken an important lead in operating seismographstations in outlying areas of the Southwest Pacific These stations have been extremely important in hypocentral control for the Tonga - Kermadec seismic zone and for nuclear event detection in the Pacific DSIR operates three 6-component Worldwide Standard Seismograph stations at Afiamalu (Western Samoa) Raratonga (Cook Islands) and Scott Base (Antarctica) Short-period stations operate at Apia (Western Samoa)Campbell Island (New Zealand) Chatham Islands (New Zealand) Nadi (Fiji)Nime and Raoul Island (Kermadec Island New Zealand) Readings from these stations are routinely reported to PDE and ISC for global earthquake location
Wellington Network
A small-aperture high-gain seismic network is operated around Wellington an area of greatest seismic risk in New Zealand The stations are telemetered by radio or telephone link to the central recording site The network now consists of eleven stations Earthquakes are presentlydetected by a microproeszor-based Automatic Seismic Monitor and automated location processing is expected to follow The network routinely locates events with ML gt 15
Pukaki Network
A second microearthquake network has operated around Lake Pukaki a hydroelectric project in the South Island New Zealand The network was established in 1975 to monitor reservoir-induced seismicity associated with impoundment of the reservoir The network consisted of nine stations and was intended to operate on a temporary basis It has been closed since early 1984 with several of the stations continuing to support the national network and to monitor any future reservoir-related activity
Related Seismology Research
In addition to its regular observatory seismology the GeophysicsDivision has an active seismology research program Their studies have focussed on theoretical seismology earthquake prediction rustal structure of New Zealand historical earthquake studies nuclear event detection seismic risk in New Zealand strong motion studies amc volcanic seismology The monitoring of active volcanoes is closely coordinated with crustal deformation monitoring conducted by the Earth Deformation Section of the New Zealand Geological Survey
The New Zealand strong motion accelerograph network now consists of 225 instruments operated by the Physics and Engineering Laboratory of DSIR Most of these instruments are of a New Zealand design (Mechanicaland Optical Accelerographs) and analog records are made on photographicfilm Three digitally recording accelerographs are now in operation in
132
New Zealand and the MO records are digitized for computational analysisAnalysis of this empirical data is being used for a revision of New Zealands building codes
133
REFERENCES
Berryman K 1979 Seismotectonic zoning study of the Fiji Islands Earth Deformation Section Report 70 andWellington NZ Dept Sci Indust Research 40 pp
Everinghar IB 1983 Seismology section annual report 1983 Min Resources Dev Fiji Note 3310 Suva Fiji 46 pp
Franco AB MP Hamnett and J Makasiale 1982 Disaster Preparednessand Disaster Experience in the South Pacific Pacific Islands Developshymental Program Honolulu 380 pp
Geological Survey of Papua New Guinea 1979 Information Booklet Port Moresby Dept Minerals and Energy 12 pp
Government of Western Samoa 1977 Apia Observatory 1902-1977 Apia Apia Observatory 8 pp
Jury RD JP Hollings and IAN Fraser 1982 The development of seismic zones and the evaluation of lateral loadings for earthquakeresistant design of buildings in Papua New Guinea Bull NZ Nat Soc for Eartho Engr 15 123140
Lowenstein PL 1982 Problems of volcanic hazards in Papua New GuineaGeol Surv Papua New Guinea Rept 827 Port Moresby Papua New Guinea 62 pp
McCue KF and ID Ripper 1980 The Papua New Guinea Strong MotionAccelerograph Network Geol Surv Papua New Guinea Rept 807 Port Moresby Papua New Guinea 13 pp
Mineral Resources Department Seismology Section 1983 National activityreport Fiji Submitted to Session IX Intl Coord Group for TsunamiWarning System in the Pacific Min Resources Dept Fiji Note 333 Suva Fiji 4 pp
Parliament of Fiji 1984 Mineral Resources Department Annual Report for The Year 1982 Parliam Paper No 13 Suva Fiji 90 pp
Power CA 1978 Earthquake risk in Fiji and the problems of earthquakeengineering Presented to the Fiji Society 17 pp
Prdvot R and JL Chatelain 1983 Seismicity and Seismic Hazard in Vanuatu ORSTOM Rept 5-83 Noum~a 51 pp
Ripper ID 1982 Accelerogram library Geol Surv Papua New Guinea Rept 198211 Port Moresby Papua New Guinea 44 pp
Seismological Observatory Wellington 1980 The earthquake problem in NewZealand Alpha DSIR Extension Information Wellington NZ 4 pp
134
Smith WD 1979 Seismology and related research in New Zealand1975-1978 NZ DSIR Information Series No 140 30 pp
Smith WD 1983 Seismology and related research in New Zealand1979-1982 Seismol Observatory Wellington Bull 276 32 pp
Solomon Islands Government 1982 National Disaster Plan 1982 Honiara Solomon Is 14 pp
135
A Rahamin A Simpson R Holmes P Rodda R Singh I Everingham
K Draunidalo G Shorten M Mehrotra J Booth J Campbell
R Carter R Byrne G Gauss D Rubin
S Tongilava
D Tappin S Lemoto T Tukia
C Clarke
R Campillo R Foy L Mollard T Lee J Recy J Chatelain R Prdvot
L loane S losa A Titimaea
INFORMATION CONTACTS
FIJI
Director Mineral Resources Dept Asst Director (MRD) Princ Geol OffshoreSeismol (MRD) Princ Geol Inform Services (MRD) Principle Geophysicist (MRD) Senior Seismologist (KRD) Seismologist (MRD) Senior Engineering Geologist (MRD) Struc Engr Suva City Council Civil Engineer Su Engineering Geologit A Gibb amp Partners (Monasavu) Marine Geologist kCCOPSOPAC) Marine Geologist (CCOPSOPAC) Marine Geologist (CCOPSOPAC) Marine Geologist (CCOPSOPAC)
TONGA
Superintendent of Lands Surveys and Natural Resources Government Geologist (LSNR) Land Assessor (LSNR) Government Planner (LSNR)
VANUATU
Director Dept Mines Geology and Rural Water Supplies
Director ORSTOM Mission Engineer ORSTOM Engineer ORSTOM Civil Engineer Public Works Dept Director ORSTOM Dept Geol and Geophys (Nouma) Seismologist ORSTOM (Noumda) Seismologist ORSTOM (Noumda)
WESTERN SAMOA
Director Apia Observatory Senior Seismologist (AO) Geologist (AO)
136
SOLOMON ISLANDS
S Danitofea Chief Geologist Ministry of Lands Energy and Natural Resources
D Tuni Senior Seismologist (MLENR)R Walshaw Senior Geologist (MLENR)J Vunagi Ministry of Home Affairs and National DevelopmentD Gwynn Civil Engineer Public Works Department
PAPUA NEW GUINEA
K Doble Chief Geologist Geological SurveyI Ripper Chief Seismologist Geophysical ObservatoryC Seidel Information Officer Volcanological ObservatoryC Anderson Engineering Geologist Geological SurveyJ Wilkins Civil Engineer Dept of Works and Supply
NEW ZEALAND
W Smith Director Seismological Observatory Wellington
UNITED STATES
M Hamnett Pacific Islands Development ProgramG Burton Director Pacific Tsunami Warning Center R Sillcox Seismologist (PTJC)G Pararis-Corayannis Director International Tsunami Information CenterG Greene Branch of Pacific Marine Geology (USGS)
137 APPENDIX IV TSUNAMI SAFETY RULES
1 All earthquakes do not cause tsunamis but many do When you hearthat an earthquake has occurred stand by for a tsunami emergency
2 An earthquake in your area is a natural tsunami warning Do not stayin low-lying coastal areas after a local earthquake
3 A tsunami is not a single wave but a series of waves Stay out ofdanger areas until an all-clear is issued by competent authority
4 Approaching tsunamis are sometimes heralded by a noticeable rise orfall of coastal water This is natures tsunami warning and should be heeded
5 A small tsunami at one beach can be a giant a few miles away Dontlet the modest size of one make you lose respect for all
6 The Tsunami Warning System does not issue false alarms When anocean-wide warning is issued a tsunami exists When a regionalwarning is issued a tsunami probably exists The tsunami of May 1960killed 61 people in Hilo Hawaii who thought it was just another false alarm
7 All tsunamis--like hurricanes--are potentially dangerous even thoughthey may not damage every coastline they strike
8 Never go down to the beach to watch for a tsunami When you can seethe wave you are too close to escape it
9 Sooner or later tsunamis visit every coastline in the PacificWarnings apply to you if you live in any Pacific coastal area
10 During a tsunami emergency your local Civil Defense police andother emergency organizations will try to sdav your life Give them your fullest cooperation
Unless otherwise determined by competent scientists potential danger areasare those less than 50 feet above sea level and within 1 mile of the coastfor tsunamis of distant origin or ess than 100 feet above sea level andwithin 1 mile of the coast for tsunaois of local origin
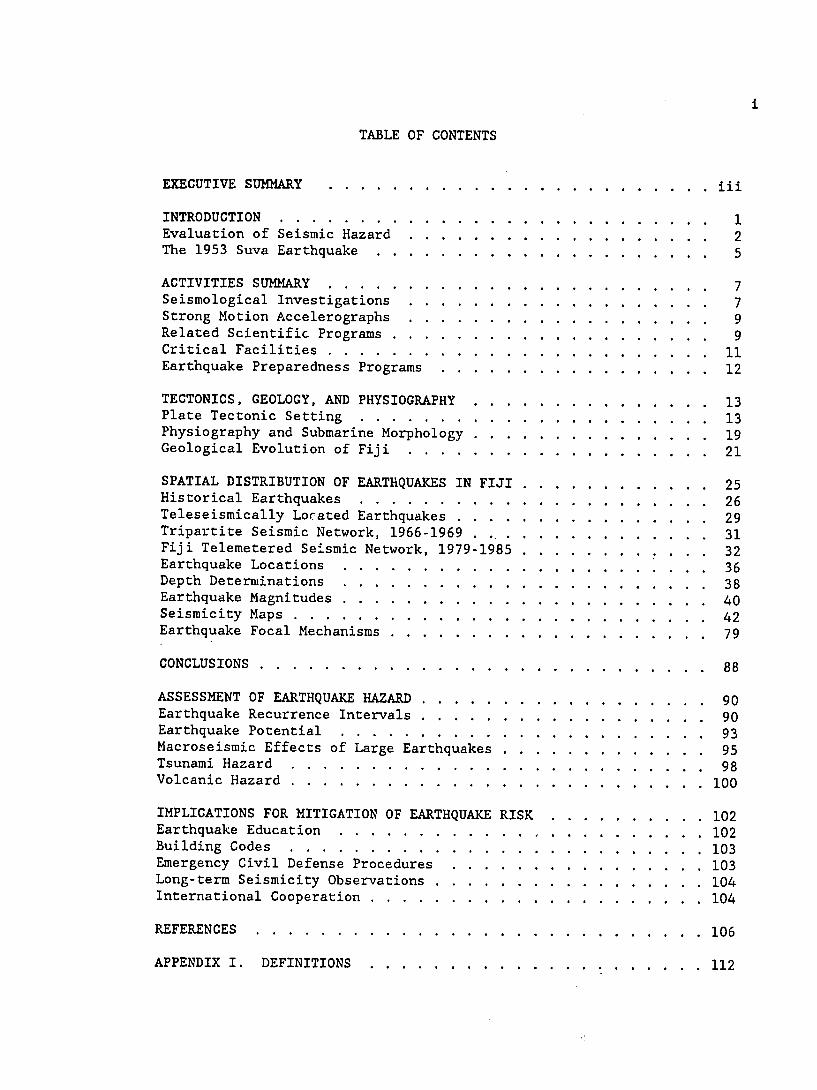
TABLE OF CONTENTS
EXECUTIVE SUMMARY
INTRODUCTION 1 Evaluation of Seismic Hazard 2 The 1953 Suva Earthquake 5
ACTIVITIES SUMMARY 7 Seismological Investigations 7 Strong Motion Accelerographs 9 Related Scientific Programs 9 Critical Facilities 11 Earthquake Preparedness Programs 12
TECTONICS GEOLOGY AND PHYSIOGRAPHY 13 Plate Tectonic Setting 13 Physiography and Submarine Morphology 19 Geological Evolution of Fiji 21
SPATIAL DISTRIBUTION OF EARTHQUAKES IN FIJI 25 Historical Earthquakes 26 Teleseismically Located Earthquakes 29 Tripartite Seismic Network 1966-1969 31 Fiji Telemetered Seismic Network 1979-1985 32 Earthquake Locations 36 Depth Determinations 38 Earthquake Magnitudes 40 Seismicity Maps 42 Earthquake Focal Mechanisms 79
CONCLUSIONS 88
ASSESSMENT OF EARTHQUAKE HAZARD 90 Earthquake Recurrence Intervals 90 Earthquake Potential 93 Macroseismic Effects of Large Earthquakes 95 Tsunami Hazard 98 Volcanic Hazard 100
IMPLICATIONS FOR MITIGATION OF EARTHQUAKE RISK 102 Earthquake Education 102 Building Codes 103 Emergency Civil Defense Procedures 103 Long-term Seismicity Observations 104 International Cooperation 104
REFERENCES 106
APPENDIX I DEFINITIONS 112
APPENDIX II MODIFIED MERCALLI INTENSITY SCALE (1956 VERSION) 115
APPENDIX III SEISMOLOGICAL FACILITIES AND EARTHQUAKE HAZARD
PROGRAMS IN THE SOUTHWEST PACIFIC 117 TONGA VANUATU WESTERN SAMOA SOLOMON ISLANDS PAPUA NEW GUINEA NEW ZEALAND REFERENCES
INFORMATION CONTACTS
117 118 121
122
124 127 133
135
APPENDIX IV TSUNAMI SAFETY RULES 137
EXECUTIVE SUMMARY
Overall Program
This country report is a summary of our contribution to a long-term program to evaluate earthquake risk to the island countries of Tonga Fijiand Vanuatu in the Southwest Pacific These countries are located within one of the most active belts of seismicity in the world and seismic hazard in these countries has been largely neglected in national planning and development programs The fundamental contributions of our investigations include (1) analysis of regional seismicity and seismotectonic data (2) maintenance and improvement of seismological facilities in the region(3) establishment of P regional network of strong-motion accelerographs (4) initiation of regional cooperation between national and international agencies working in this region and (5) training of national technical and scientific personnel Our investigations in Fiji have been carried out tbrough cooperative work with the Fiji Mineral Resources Department
Summary of Work Completed
(A) Historical Earthouakes in Fiji The majority of the large earthshyquakes reported in the last 130 years occurred along the tectonic boundaries that surround the Fiji Platform However a large number of significantearthquakes occurred within the platform including the damaging 1953 Suva and 1979 Taveuni earthquakes The magnitudes of these events are all less than 71 suggesting that the thin lithosphere of the Fiji region is incapable of storing sufficient stress to result in great earthquakes
(B) Teleseismically Located Earthquakes A new compilation of earthshyquakes located by the global seismic network is used to constrain the activity of the plate boundaries surrounding the Fiji Platform the FijiFracture Zone to the north the West Viti Levu zone to the west the Hunter Fracture Zone to the south and the northwestern edge of the Lau Basin to the northeast
(C) Tripartite Seismic Network 1966-1969 The first microearthquakestudy of Fiji used a three-station network of seismic stations on the main islands of Viti Levu and Vanua Levu These microearthquakes show the same distribution of seismicity to the northeast north and west of the Fiji Platform as the teleseismic data Scattered seismicity is observed in areas within the platform previously thought to be aseismic
(D) Fiji Telemetered Seismic Network 1979-1985 The nineteen-station national seismic network of Fiji has operated for over six years and proshyvides the bulk of the data for this research program Over 5000 events were recorded by the network of which approximately 1800 earthquakes were located Microearthquakes are located both along the edges of and within the Fiji Platform The interplate zones that surround the platform are continuously active at moderate magnitudes while the intraplate earthshyquakes within the platform occur more sporadically separated by long periods of quiescence
iv
(E) Earthquake Depths The dense seismic network in southern Viti Levu accurately constrains earthquake focal depths They are uniformly shallow concentrated in the upper 18 km of Fijis crust The distribution is similar to other areas of extension and strike-slip deformation
(F) Earthquakes within Viti Levu Earthquakes located in the central portion of the island may be related to rapid doming of the island A group of events near Monasavu Reseivoir were induced by rapid filling of a large artificial lake Earthquakes in southeastern Viti Levu occur in discrete nests that are tightly clustered in space and time They are related to a series of near-vertical east- to northeast-striking faults that cut the Mio-Pliocene rocks of southeastern Viti Levu
(G) Earthquake Focal Mechanisms A new focal mechanism for the 1953 Suva earthquake combined with mechanisms for microearthquakes within and near Viti Levu suggest the predominance of strike-slip faulting along northwest- or northeast-striking fault planes The stress direction orienshytation is similar to that observed throughout the Fiji region and indicates that the Platform is not isolated in a tectonic sense from the remainder of the interarc region of the Southwest Pacific
Earthquake Recurrence Intervals
Two studies of magnitude-frequency relations for the Fiji region suggest similar recurrence intervals for large earthquakes near Fiji earthquakes of magnitude 7 or greater are expected every 15 - 21 years while events of magnitude 65 or greater are expected every 2 12 - 6 years
Earthquake Potential
The earthquake potential is not uniform throughout the Fiji region We have subdivided the Fiji region into four zones of seismic potential based on the available seismicity data Zone I includes the Fiji Fracture Zone Taveuni-northeast Vanua Levu zone West Viti Levu zone and the western Lau Basin and is conservatively assigned a maximum magnitude of 75 Zone II includes the Kadavu Island region the Hunter Fracture Zone the Baravi and Suva basins and the Koro Sea The maximum magnitude assigned to this zone is 70 however recurrence intervals may be considerably larger than in Zone I Zone III includes central and eastern Viti Levu Ovalau Island and Vatu-Ira Channel and is assigned a maximum magnitude of 65 Zone IV includes northern and western Viti Levu the Bligh Water Basin northern Vanua Levu the South Fiji Basin and the Lau Ridge These areas have been virtually devoid of seismic activity on all time and magnitude scales Because of their proximity to the zones of active tectonism a conservative maximum magnitude of 60 has been assigned
Macroseismic Effects of Large Earthquakes
Based on the maximum probable earthquakes assigned to each of the seismic zones we have predicted maximum intensity of ground shaking at 14 population centers and islands within Fiji These predictions are based on extrapolations from observed intensity data and are intended to serve as a
v
general guideline to identify areas of higher and lower risk The highest intensities from earthquakes occurring in Zone I are projected for Taveuni Island and the Yasawa Group (MM 9-10) somewhat lower intensity (8) is predicted for Labasa Savusavu and Koro Earthquakes occurring within Zone Ii are capable of producing high intensities (8-9) at Suva Sigatoka Labasa Savusavu Koro Kadavu and Taveuni Slightly lower intensities (8) are predicted for Nadi Monasavu and Ovalau Earthquakes within Zone III are capable of producing MM8 shaking in Suva Monasavu Sigatoka and Ovalau slightly lower values (7-8) are projected for Lautoka Nadi and Ba Intensities predicted for Zone IV are all less than MM8
Tsunami Hazard
The history of earthquake-generated tsunamis in Fiji documents a very real hazard to Fijis population Tsunamis are of particular concern because of the concentration of population in low-lying coastal areas While tsunamis are not generated by all earthquakes they must be considered a possible effect of all major earthquakes that occur in submarine areas that surround the Fiji Platform Real-time monitoring of seismic activity combined with an active tsunami education program could significantly aid in tsunami risk mitigation
Volcanic Hazard
Quaternary volcanic activity is far less prevalent in Fiji than elseshywhere in the Southwest Pacific There is no historical record of volcanic eruptions in Fiji The evidence for prehistoric volcanism on Taveuni Island warrants continuous seismic monitoring of activity there
Conclusions and Recommendations We recommend that (1) an earthquake and tsunami education program be
adopted and combined with other disaster preparedness programs (eg hurricane floods and so on) (2) adoption of more stringent building codes for all of Fiji is strongly recommended (3) long-term seismicity and strong motion observations be continued in order to refine estimates of seismic potential (4) regional cooperation among the island countries of the Southwest Pacific be encouraged in order to assist in Fijis earthquake preparedness program
INTRODUCTION
The island countries of the Southwest Pacific are subject to natural
disasters including earthquakes volcanic eruptions and tsuramis which
threaten human life and property every year Geological and geophysical
observations indicate that these natural disasters are manifestations of
continuous geological processes the inexorable movements of the earth
guarantee that they will continue to occur in the future
The Southwest Pacific region is the source area for a large percentage
of the worlds seismicity Approximately seventy percent of the worlds
intermediate and deep earthquakes occur in this region A large number of
great shallow earthquakes have taken place along the plate boundaries that
affect New Zealand Kermadec Islands Tonga Vanuatu Solomon Ilands Papua
New Guinea and Fiji
Normally public attention focuses on emergency and rescue operations
once a disaster has taken place While little can be done to prevent
earthquakes or volcanic eruptions from occurring significant steps may be
taken to minimize the destructive effects of such disasters Scientists are
striving to better understand what causes these phenomena and to learn what
measures might be taken to mitigate their destructive nature This report
is a summary of the available scientific data that help constrain the
potential for destructive earthquakes that may affect the populated areas of
Fiji The report is by no means the final analysis of earthquake hazards to
Fiji it is however a well documented synthesis of all available seismic
information that provides a basis for judicious engineering planning and
civil defense decisions in the years to come Definitions of some of the
technical terms that will appear in this report are contained in Appendix I
2
The ultimate aim of earthquake risk programs--mitigation of human and
economic losses due to earthquakes--involves prediction of the frequency of
occurrence and intensity of strong ground motion produced by future earthshy
quakes of specific magnitudes in the vicinity of any given site These
predictions are often summarized in the form of seismic zoning maps and
microzonation which give the spatial distributions of the following paramshy
eters maximum intensity of shaking engineering design codes maximum
acceleration of ground motion (velocity displacement) for given return
periods of earthquakes of a particular size or seismic risk (which relates
to the expected human and property losses from earthquakes) In this
report we focus on the fundamental seismological observations that will
provide the basis for more applied engineering studies of earthquake risk to
Fij i
Evaluation of Seismic Hazard
The seismic hazard in any region is a function of the frequency of
occurrence and magnitude of earthquakes as well as the proximity of the
earthquake foci to population and industrial centers Fiji is located close
to the major seismic zones of the Southwest Pacific (Figure 1) the area has
an instrumental history of earthquakes with magnitudes greater than 70
Although the country is not heavily populated or industrialized its
proximity to major seismic zones leaves it particularly vulnerable to the
risk of earthquake damage The capital city of Suva is now under increasing
development pressures The construction of multi-storied buildings to
accommodate the increasing urban populations and tourism as well as other
essential structures such as dams and power plants pipelines schools and
hospitals adds to the immediacy of the problem of earthquake risk
3
160 E 170 180 W 170
CENTRAL PACIFIC BA5IN
4 V ITI A I
SO 15 - deg
100 0 1000
0 o V 0 CH
BASIN BASIN o-
d~ FIJI~ r(
20 4 a 4 ~~ 20
LA SOUTH
0 BASINV- ZE
I P A I IS S A 0
0 S - 0
300 A
BINPI- )A C CIFICPA~~ 3
USTRALIAN~ 4V PLATE
PLATEZEA~LAND SOUTHWEST
400 b BASINBASIN
RISE40
150 160 E 170 180 170 W
Figure 1A Tectonic and morphologic features of the PacificIndo-Australian plate boundary Open arrows indicate direction of relative plate convergence Contour line shows 2-km isobath Holocene volcanoes are indicated by open triangles Data on bathymetry volcanoes and plate motions are taken from Circum-Pacific Council for Energy and Mineral Resources (1981)
4
10 deg1600 E 170 W 170 bull
20
20shy
-
0
at
4vkr 40v
30030 20IN W
170
the in
180 50)gt
(Ms40
170
earthquakes
2 I shallow
as large scale for1Bto sameat Councilis
Map Moderate Circum-Pacific
1964-1977from period taken
the arefor Data
Figure Pacific (1981)1Bcomparison
Southwest for Resources MineralFigure and
Energy
5
Past disaster associated loss of life in the Fiji has been relatively
limited but the increasing urban concentration and industrial development
raises the potential human and economic losses brought on by a large earthshy
quake occurring in the immediate vicinity These losses are usually the
result of the collapse of man-made structures and can be substantially
reduced by adequate engineering precautions
The 1953 Suva Earthquake
The most significant event in Fijis seismic history is the large 1953
Suva earthquake This event with a magnitude of Ms - 675 was the most
destructive in Fijis history The earthquake occurred within 30 km of the
capital city of Suva and produced extensive damage throughout southern Viti
Levu Intensities reach MM VII (Modified Mercalli Index see Appendices I
and II) along 40 km of the islands coast landslides were triggered over an
area of approximately 2380 km2 along the southern coast and extending nearly
20 km inland (Houtz 1962a) A major tsunami was triggered by the earthshy
quake reaching 43 meters height on the island of Kadavu 100 km south of
the epicenter The earthquake and tsunami resulted in 8 deaths 12 serious
injuries and over pound250000 in property damage The event also triggered
turbidity currents along the shelf south of Viti Levu that damaged communshy
ication cables at distances to 100 km from the epicenter (Houtz and Wellman
1962)
At the time of the earthquake Suvas population was only 35000 and
development consisted entirely of low-rise structures Since that time
Suva has grown to over 100000 population and has established itself as the
major regional center for commerce shipping tourism education and
administration Multistory building is widespread in the city and urban
development has rapidly extended to outlying areas Clearly a repetition
6
of the Suva earthquake is of major concern to Fijis Government planners
The seismic risk related to a recurrence of an event of this size (or
larger) far outweighs the potential effects of an earthquake along any of
the other seismogenic zones near Fiji
The earthquake has been of considerable interest from a seismotectonic
perspective as well it took plac3 like a small number of other historical
events directly within the platform on which the Fiji Islands reside Much
of the well-documented seismic activity has occurred along the boundaries of
the Fiji block (Hamburger and Everingham 1986) The cause of the large and
infrequent events that take place within the platform has remained a
tectonic enigma A major goal of these seismological investigations has
been to comprehend the tectonic causes for such unusual and extremely
hazardous earthquakes that occur close to and within the Fiji Islands
The major new data base that bears on this problem originates from the
new telemetered seismic network established in 1979 This network has
recorded several thousand earthquakes both within and along the margins of
the Fiji Platform Because the network can locate events as small as
magnitude -10 small earthquakes in less active seismic zones can be
examined Importantly the network located over 500 earthquakes within and
offshore southeastern Viti Levu near the source area for the 1953 Suva
earthquake In the following sections the distribution of earthquakes in
the Fiji region is analyzed in order to elucidate the nature of deformation
both within and along the boundaries of the Fiji Platform
A second important observation that bears on the Suva earthquake is the
examination of original records collected from over forty observatories
operating at the time Using these records we have obtained a new focal
7
mechanism for the 1953 event that places it in a clear tectonic context
one that proves to be closely linked to the deformation occurring on either
side of the Fiji Platform in the Lau and North Fiji basins
ACTIVITIES SUMMARY
Seismological Investigations
Reliable seismological observations are necessary for accurate
location study and ultimate prediction of earthquakes Seismological
observations in Fiji are conducted by the Mineral Resources Department a
subdivision of the Ministry of Energy and Mineral Resources The government
has made a major commitment to seismological work since the establishment of
a major US AID-supported seismic network in 1979 In fact seismological
observations in Fiji have been carried out since the early part of this
century supported at first by the New Zealand scientific organizations and
subsequently strengthened by Lamont Geological Observatorys Upper Mantle
Project in the 1950s and 1960s In late 1979 the 8-station US AID
network was established to complement three permanent stations in Viti Levu
The network was significantly expanded by installation of a five-station
telemetry network in 1981 supported by Japanese aid Additional stations
were installed in 1983 and 1984 the network has now expanded to a
nineteen-station national network with excellent coverage of the Fiji region
(see Figure 2) In addition MRD now has available five MEQ-800 portable
seismographs for occupation of temporary field sites telemetry station
testing and special refraction experiments While the Fiji network has
experienced considerable technical difficulties it has recorded some 5000
earthquakes since its installation and provides an invaluable basis for
seismological study of the Fiji region
8
15 FIJI SEISMIC NETWORK
)US AID (1979-1985)S A Japanese Aid (1981-1985)
16 A Fiji MRD (1983-1985)
E Temporary stations shy
17 A Taveuni
U ARKoro
Ovalau A UI 0
18 LEVU ~Gau Lakebae(J)Beqa
19 - a o_ Kadavu
20 I I I I 176 E 177 178 179 180 179 W178
Figure 2 Locations of seismic stations comprising the national seismic network of Fiji
9 The present OFDA-supported program has provided for three years of
field and laboratory research on the seismicity and tectonics of the Fiji
region and included approximately fifteen months of field work in Fiji
The field program resulted in substantial improvement of the Fiji seismic
network as well as in detailed studies of seismicity crustal structure
and tectonics of Fiji The work has already resulted in a number of
publications (Hamburger and Isacks 1983 Hamburger and Qiolevu 1983
Draunidalo and Hamburger 1984 Hamburger 1986 Hamburger and Isacks 1986
Hamburger and Everingham 1986) as well as several others in preparation
The scientific work summarized in this report represents a portion of those
studies
Strong Motion Accelerographs
The Mineral Resources Department also operates a network of strong
motion accelerographs now numbering ten Kinemetrics SMA-ls (Figure 3)
The initial six instruments of this network were granted to Fiji by AID the
remainder was purchased by the Fiji government Since establishment of the
SMA network three accelerogram records have been obtained from
moderate-sized earthquakes in Viti Levu The accelerograms are discussed in
detail in the following sections Records obtained from this network are
expected in the long run to provide the basis for ground accelerations
and thus for development of building codes specific to Fijis tectonic
setting and seismic regime
Related Scientific Programs
The Mineral Resources Department (MRD) includes an Offshore Geology
section which has an active program of marine geological and geophysical
- 1tEA 171 lT S Of GREENWICH 11W WEST OF OREENICN 17
NATIONAL NETWORK OF- STRONG MOTION ACCELEROGRAPHS
0 so 60 XLOUCTICI
LEGEND
LEVUE210 1--0VANUA
YASAWA I
Von boiftu
T
GAU
IT L LUTLAKEBA
I r r I I| 7~ WIiT OP SRZICI 360 WtST 0 pound[llUNWCHr 171
Figure 3 Location of strong-motion accelerographs in Fiji Some revision of these locations is likely within the next year
7
investigations in and around Fiji waters MRD also employs an engineering
geologist whose work includes microzonation of the Suva area mapping of
active faults in southeastern Viti Levu and investigation of soils subject
to earthquake-induced liquefaction An active program of geological mapping
and structural studies is also carried out by MRD They are supported by
personnel assistance from Australia and Great Britain
Suva is also the home of the United Nationij Committee for Coordination
of Offshore Prospecting in South Pacific Offshore Areas (CCOPSOPAC) This
organization coordinates much of the international marine research carried
on in the region and has been particularly helpful with Fijis investigashy
tion of its offshore waters
Critical Facilities
The major development in Fiji has been in and around the capital city
of Suva The population of the metropolitan area now exceeds 145000 and
most of the government commercial and industrial operations are concenshy
trated there The city has become a major comnercial transportation and
regional political center and has developed rapidly in the past ten years
Development in this period has incl ded construction of multistory
buildings a major electric power plant expansion of the Suva harbor and
most recently completion of the thirteen-story Central Monetary Authority
building in downtown Suva Much of this development has taken place on an
area of filled land close to sea level particularly vulnerable to earthshy
quake and tsunami damage This area was extensively damaged by the 1953
Suva earthquake and tsunami and is thus at significant risk from a repeat
occurrence of an event of comparable size
12
Other population centers with significant development include the towns
of Lautoka (pop 29000) Nadi (13000) and Ba (9000) on the island of
Viti Levu and Labasa (13000) on Vanua Levu The tourist industry which
is a major part of Fijis economy is concentrated on the southern and
western coasts of Viti Levu and is also vulnerable to earthquake and
tsunami damage The major development project in Fiji is the 82-meter high
Monasavu Dam in the interior of Viti Levu The earthfill dam was completed
in 1983 and is planned to provide most of the countrys electric power
needs through the end of the century
Earthquake Preparedness Programs
In awareness of the serious earthquake risk to development in Fiji the
government has adopted New Zealand earthquake design codes for most of the
urban areas of the country Seisric zone B codes applicable to areas of
moderate seismic activity in New Zealand have been chosen as appropriate
and are applied (in theory) to all domestic and commercial construction in
urban areas Considerable difficulty remains in enforcement of these
regulations particularly in construction of private dwellings Major
multistory building design is generally handled by overseas (Australia or
New Zealand) engineers and dynamic modelling tests are generally applied
for earthquake loadings at least as large as those required by the New
Zealand codes The Monasavu Dam underwent dynamic model testing by
Australian consulting engineers
Disaster preparedness is the responsibility of the Emergency Services
Committee (EMSEC) and the Prime Ministers Relief and Rehabilitation
Committee (PMRRC) EMSEC is responsible for coordination of disaster plans
maintenance of essential services advice to the Cabinet on emergency
13
measures and direction of relief work It is comprised of representatives
of the related ministries and public agencies PMRRC is chaired by the
Prime Minister of Fiji and has responsibility for long-term relief policy
and rehabilitation programs Fijis experience with recurrent weathershy
related disasters has spurred efforts for emergency communication systems
supply distribution temporary shelters and so on Much of this hurricane
disaster planning is applicable as well to earthquake and tsunami damage
Fiji is also a participant in the International Tsunami Warning System
Educational programs have been handled through the Fiji Broadcasting
System the Red Cross and the school system To a limited degree the
Public Works Department and the Mineral Resources Department have produced
educational materials related to earthquake hazards in Fiji
TECTONICS GEOLOGY AND PHYSIOGRAPHY
Plate Tectonic Setting
The theory of plate tectonics has provided a fundamental new undershy
standing of the distribution of earthquakes in the Fiji region This
section of the report is intended to briefly review the fundamental concepts
of plate tectonics and to establish the geologic and plate tectonic setting
of the Fiji Islands This information provides a basis for evaluating the
seismicity data presented in the following sections
Fiji is located along a portion of what is commonly called the Pacific
Ring of Fire The concentration of earthquakes (Figure 4a) and volcanoes
(Figure 4b) along this trend were used to establish the boundaries of the
lithospheric plates in the modern view of plate tectonic theory (Figure 4c)
These plates which are relatively rigid cover the surface of the earth
like a mosaic of rigid caps and move against each other by sliding (1) past
~ 14-
bull - bull-bull -
44
N
-V V r
0
t
for OrN rw Or r U wrr w I - I 4
configu
Figue Wrddsrbto f()erhuksad()vlaos (0) rto fte mjr tcoi lts o h at ufc fo Turctte a Scuet 1982 0
TuUote n Schubrt 982
15
at a transform fault (2) over at a convergent margin (such as subduction at
a deep sea trench) or (3) apart from one another at a divergent margin
(such as spreading at a mid-ocean rift) Figure 5 shows skematically the
spatial relationship of these different types of boundaries Convergent
plate boundaries are responsible for the majority of the worlds large
earthquakes and most of the worlds tsunamis Many volcanic arcs form
parallel to the deep-sea trenches above the point where the subducted plate
reaches about 100 km depth
The Fiji islands are a component of the Melanesian Borderlands that
form the boundary between the Pacific and Indo-Australian lithospheric
plates (Figure la) The entire Southwest Pacific region extending from the
Solomon Islands to New Zealand is dominated by plate convergence between
these two plates The present loci of convergence are the Solomon New
Hebrides Tonga Kermadec and Hikurangi trenches They are all characshy
terized by large shallow earthquakes inclined seismic (Benioff) zones and
Quaternary volcanism The present-day plate convergence vector is oriented
east-west over much of the region (Minster and Jordan 1978)
The Tonga-Fiji-New Hebrides segment of the plate boundary (the
Melanesian reentrant) is unusual in several respects (1) the convergent
boundary is discontinuous jumping from westward subduction at northern
Tonga to eastward subduction at the southern New Hebrides (2) it is one
portion of the convergent plate boundary that is not dominated by plate
subduction (3) the broad geologically complex Fiji Platform sits within
the plate boundary (4) two east-trending bathymetric deeps the Vitiaz
Trench and the Hunter Fracture Zone mark the sites of former subduction
zones
16
A ST H E N 0 3 P H ERE
M E S 0 S P H E R E
ridge
trench ALshy
transform fault
Figure 5 (A) Sketch of the different types of plate tectonic boundaries and their relationships (Isacks et al 1968) (B) Diagram of the three types of boundaries in three-dimensional view
16a
Four bathymetric trenches mark the sites of present or former plate
subduction (1) the Tonga and Kermadec trenches extend in a nearly linear
fashion from New Zealand to the northern end of the Tonga arc over 2000 km
in length Their depth reaches 11 km in southern Tonga (2) the New
Hebrides Trench extends from 110 to 23degS reaching 8 km depth in the north
The trench is interrupted in the central segment but plate convergence is
observed along its entire length (Isacks et al 1981) (3) the Vitiaz
Trench appears as a well defined bathymetric deep locally over 6 km in
depth that separates the Mesozoic Pacific Plate lithosphere from the young
back-arc basin lithosphere of the North Fiji Basin Its morphology is
similar to that of active trenches (11alunen 1979) but shallow seismicity
and Quaternary arc-related volcanism are absent (4) the Hunter Fracture
Zone is a well-defined curvilinear belt of ridgetrough topography extending
from Fiji to the southern New Hebrides arc At its western end it intershy
sects the southern termination of the New Hebrides Trench Bathymetric and
seismic reflection profiles across the Hunter Fracture Zone show that the
subduction margin morphology is preserved well into the Fiji Platform
(Brocher and Holmes 1985) The Koro Sea (between Fiji and the Lau Ridge)
represents its eastern termination
The island arcs stand out as bathymetric highs landward of the
trenches (1) the Tonga and Kermadec arcs form a linear bathymetric high
landward of the trenches Quaternary volcanic activity has taken place at
irregular intervals along its length (Figure la) (2) the New Hebrides arc
is a bathymetric high extending parallel to the New Hebrides Trench The
geology of the New Hebrides records an irregular history of arc volcanism
that has persisted over the last forty million years (3) the Lau Ridge is a
17
remnant arc isolated from the Tonga subduction zone by back-arc spreading
in the Lau Basin (Karig 1970) It previously formed part of the active
Tonga arc but is no longer volcanically active (Whelan et al 1985
Woodhall 1985a) (4) the Fiji Platform is delineated by a broad area of
shallow water depths separated from the Tonga and New Hebrides arcs by the
North Fiji and Lau basins The rocks exposed on the Fiji Islands record a
complex history of arc volcanism and deformation beginning in the Late
Eocene and extending into the Quatednary (Rodda 1967 1974 Gill et al
1984 Rodda and Kroenke 1984)
Active back-arc basin spreading has been identified in the North Fiji
Basin and Lau Basin based on shallow seismicity seismic wave velocities
and attenuation high heat flow magnetic anomalies and the presence of
tholeiitic basalts (Karig 1970 Chase 1971 Barazangi and Isacks 1971
Sclater et al 1972) These basins are marked by relatively uniform areas
of shallow water depths (-3 km) surrounding the Fiji Platform Inactive
back-arc basins have been identified in the Loyalty Basin (west of the New
Hebrides Trench) and the South Fiji Basin (south of the Hunter Fracture
Zone) They are marked by areas of relatively deep water that are separated
from the Southwest Pacific Basin by the active arcs and trenches Finally a
major regional scale transcurrent boundary in the interarc region is the
Fiji Fracture Zone (FFZ) The FFZ is most clearly evident as a continuous
belt of seismicity extending westward from the northern termination of the
Tonga Trench (Figure 6) Along several segments of the FFZ the belt of
seismicity coincides with rough seafloor morphology north of Fiji the FFZ
forms the well defined linear boundary of the Fiji Platform Strike-slip
focal mechanisms along its entire length confirm its identification as the
18
10 0 o0
S 0 ~ 0 C Cgt0
15 deg 0 0o 0 0 0 0
200 o 00
00
0 00C
coe20 ston L s 00
300 25 7 a e c th 165 B07 751017 7
dm 0 ( 0 0
165 E 170 175 180 175 W 170
Figure 6 Shallow earthquakes (depth _lt80 km) in the interarc region 1961-1984 Locations are from Preliminary Determination of Epicenters (PDE) constrained by _gt 20 stations Light shading indicates areas gt 2 km depth heavy shading shows areas gt 5 km depth for New Hebrides and Vitiaz trenches gt 75 km depth for Tonga and Kermadec trenches Bathymetric data from Kroenke et al (1983)
19
southern transcurrent boundary of the Pacific Plate in this area (Chase
1971 Isacks et al 1969 Green and Cullen 1973) However new seismoshy
logical and bathymetric observations require that the FFZ be a complex plate
boundary zone rather than a simple linear fault zone
Physiography and Submarine Morphology
The Fiji Platform is marked by the broad apostrophe-shaped shallow
platform at depths shallower than 2 km of which the islands of Fiji are a
small subaerial component (Figure 7) The main islands of Viti Levu and
Vanua Levu account for over 85 of the land mass of the country and are
among the largest of the Pacifics volcanic islands Topographic relief
reaches 1400 m in the interior of Viti Levu 1200 m on Taveuni and 1000 m
on Vanua Levu The islands of the Lau Group represent volcanic edifices
sitting atop the broad remnant arc platform (Karig 1970) forming the
tail of the apostrophe
The volcanic island of Kadavu sits on a separate elongated ridge
paralleling the deep trough of the Hunter Fracture Zone (HFZ) The fracture
zone is defined by an irregular series of deep basins marking the boundary
between the relatively deep Oligocene back-arc basin of the South Fiji Basin
and the shallow late Cenozoic North Fiji Basin A new bathynetric compilashy
tion by Smith and Raicebe (1984) shows the HFZ near Fiji to have a double
ridgetrough structure strikingly similar to the trenchstructural
highforearc basinvolcanic arc morphology conmonly observed in other
subduction zone settings The HFZ continues as a shallower trough into the
Koro Sea east of Viti Levu and its prominent structural signature is
preserved at least as far north as 185degS (Brocher and Holmes 1985)
NORTHCjv
~~ 0
UP
aen
Yadua
Tavun
au
Vau
FIJI ~ 1-BSNBARAVI
~ a ~
BASIN 0
30G
alulele
0 Gau
( 5 ) j
10 -1
OA L k
BASIN Lkb
e ~ aoa~ ~ 5
M a ukru
b t~ mGrou t )
tooa~
LA U
AI ASI
200
~ SOUTH~ 7 J ~Ono-I-L D
0
BASIN
1741E 176 1781W78 6-
Figure 7 Physiography of the seafloor in the Fiji region from Rodda and Kroenke (1984) Bathymetriccontours in hundreds of meters from Kroenke et al (1983) C
21
The Fiji Fracture Zone (FFZ) represents a complex morphological boundshy
ary of the Fiji Platform It is marked by an en echelon series of ridges
and troughs with over 3 km of relief in the portion of the FFZ north of the
Yasawa Group The FFZ is less evident as a morphological feature east of
1785degE north of Vanua Levu where its expression is masked by sedimentashy
tion from rivers draining the northern portion of the island Sharp changes
in strike of the FFZ are observed near 177degE 1788degE and 180 deg
A series of basins west of Viti Levu mark another tectonically active
boundary of the Fiji Platform Troughs up to 4 km depth are prominent along
the western margin of the platform Brocher and Holmes (1985) interpreted
these basins as the physiographic expression of rifting of the forearc
margin of the former Vitiaz arc convergent plate boundary The rough
topography in this area coincides with a belt of shallow seismicity evident
on teleseismic maps (Figure 6)
Within the platform extensive coral reef development is an important
morphological element Fringing reefs and lagoons are evident around most
islands and barrier reefs are developed around the major islands The
reefs are important in limiting the effect of tsunamis originating outside
the islands however in the case of the 1953 Suva earthquake tsunamis were
apparently generated by slumping off the barrier reefs (Houtz 1962a)
Geological Evolution of Fiji
The rocks exposed on the Fiji Islands are among the oldest observed in
the islands of the Southwest Pacific The geology is dominated by
arc-related volcanic and intrusive rocks and thick sequences of volcanoshy
clastic sediments The size of Fijis land mass combined with the presence
of felsic intrusives thick sediment sequences and major orogenic episodes
22
has led Fiji to be described as continental or quasi-continental in
character (Green and Cullen 1973 Eden and Smith 1984) However the Fiji
Platform differs from continental land masses in several important respects
(1) the average crustal thickness of 15-20 km is far les6 than normal
continental crust (2) low mantle velocities beneath the platform demonshy
strate a thermally attenuated lithosphere lacking the thick rigid mantle
lid that underlies most continental crust (3) the presence of ongoing
deformation and Neogene volcanism in the Fiji region observed both around
and within the Fiji Platform indicates a degree of crustal mobility that is
not expected of stable continental masses
Figure 8 presents a simplified geological map of Fiji from Rodda and
Kroenke (1984) The oldest known strata in Fiji are the Late Eocene rocks
of the Wainimala Group (Rodda 1976 Gill et al 1984 Rodda and Kroenke
1984) These strata were mildly deformed during the Wainimala Orogeny
during the middle Oligocene It is marked by a period of nondeposition
throughout Fiji that extends to the latest Oligocene Arc tholeiitic and
calc-alkaline magmatism occurred in Viti Levu throughout the Miocene (Gill
et al 1984 Rodda and Kroenke 1984)
The major orogenic episode in Fiji was the Colo Orogeny around 10 my
BP It is marked by (1) a prolonged gap in the stratigraphic record (2)
widespread folding and faulting accompanied by greenschist metamorphism
and (3) intrusion of tonalite gabbro and trondhjemite The Colo Orogeny
also coincides with a significant arc-deforming event in the New Hebrides
arc uplift and erosion of the Western Belt province at 11-8 my BP
(Carney and Macfarlane 1982)
160 1 1 i
S
VANUALV RAB
ax TAVEU-
17 Seatura V NAMENALALA U MIOCENE - HOLOCENE
_ O
B Rakiraki KORO
K
SEDIMENTARY ROCKS U OLIGOCENE - U MIOCENE UPPER WAINIMALA (includes someIgneous rocks) SIGATOKA (SI) and
SAVURA (Sa) GPS -~~~~ - MO~AKOGAI PLIOACAENE SHOHONITI OVROA
bull CALCALKALINE BASALTIC VOLCA-
Lautoka T Tavua V
NAIGANI Wand WAKAYA
NOES (includes Ba in part andesilic (B)Koroimavua (K) volcanic groups)
K -
ALAU 7BASALTS NA IR 2
BATIKI NAIRA__
JOVALAUMIOCENE HOLOCENE ALKALIC (I Mio on Vili Levu Plio on
Vanua Levu Plio-Pleist on Koro Pleist-Holo on Taveuni)
U MIOCENE - L PLIOCENEMACUADROVE SUPER GROUP
180 _(Vanua Levu) GAU U MIOCENE CALCALKALINE
ROCKS
MIOCENE STOCKS 010 LVPLUTONIC
(D BEOA OLIGOCENELGCN AUASOK SUITE(Tholeiitic )
177degE 178deg 179 deg 180
Figure 8 Simplified geology of Fiji from Rodda and Kroenke (1984) Blank areas within Viti Levu are known or likely Lower Wainimala Group (Late Eocene to Early Miocene rocks)
24
Following the Colo deformation a resurgence of volcanizm took place
throughout Fiji (Gill et al 1984 Woodhall 1985a) An unusual sequence
of thick rhyolitic volcanics were extruded at -7 my BP in northeastern
Vanua Levu that may be related to incipient fragmentation of the Fiji arc
(Gill et al 1984)
During the period 5-3 my BP magmatism in Fiji changed dramatically
to become dominated by transitionalshoshonitic volcanism in northern Viti
Levu and the Lomaiviti Group (Dickenson et al 1968 Gill 1976 Gill et
al 1984) After 3 my BP volcanic rocks in Fiji were dominated by
alkali basalts generated from a very different ocean island-like source
(Gill 1976 Gill et al 1984)
Through the period of arc modification an unusual remnant of
calc-alkaline iolcanism persisted on Kadavu Island at the southern edge of
the Fiji Platform Kadavu is on a major bathymetric ridge paralleling the
Hunter Fracture Zone The trench-like morphology of the fracture zone
(Launay 1982a) combined with the oblique truncation of linear magnetic
anomalies in the South Fiji Basin is indicative of subduction along this
boundary post-dating the Oligocene creation of the South Fiji Basin
Subduction-related andesites and dacites dated at 34 + 05 my BP
(Whelan et al 1985) document convergence along the Hunter Fracture Zone
extending into the Quaternary
Other documented Quaternary volcanism in Fiji is found in the alkali
basalts of the Lomaiviti and southern Lau Groups (Whelan et al 1985
Woodhall 1985a) and on Taveuni Island (Frost 1974) The Taveuni ash
eruption dated at 2050 years BP based on archaeological investigations
is the only documented Holocene activity in Fiji
25 Post-Colo structural deformation is evidenced by faulting of rocks
deposited above the Colo unconformity Many of these faults observed in
Viti Levu are near-vertical with significant stratigraphic throws (Band
1968 Rodda 1974) In many cases the post-Colo rocks are unaffected by
the faults in the underlying basement (Rodda 1974) From the Late
Pliocene the island of Viti Levu has been affected by rapid domal uplift
that has resulted in the abandonment and deformation of late Cenozoic
erosion surfaces in western Viti Levu (Dickenson 1972) Basaltic rocks of
the Ba Volcanic Group erupted as pillow lavas below sea level during the
Pliocene have subsequently been uplifted to over 1000 m elevation in
central Viti Levu (Rodda 1976) This uplift within the Fiji Platform
clearly post-dates the fragmentation of the Vitiaz arc and the establishment
of the present tectonic configuration The observation of anomalous
(low-velocity) mantle beneath the Fiji Platform (Hamburger 1986) reflects
thermal thinning of the Fiji lithosphere associated with the processes of
back-arc magmatism in the neighboring Lau and North Fiji basins The rapid
doming of Viti Levu then may be an isostatic response to the introduction
of low-density mantle material beneath the Fiji Platform
On a historical time scale geodetic observations in southeastern Viti
Levu by Berryman (1981) indicate rates of shear strain on the order of 06
pradyr accumulated over the period 1909-1980 The crustal seismicity that
is documented in the folowing section is the product of ongoing deformation
of the Fiji lithosphere
SPATIAL DISTRIBUTION OF EARTHQUAKES IN FIJI
A prodigious amount of seismicity data has been gathered for the Fiji
region including (1) the historical record of large earthquakes based on
26
macroseismic and instrumental observations (2) teleseismic earthquake
locations from the global seismic network (3) results from an early
three-station network operated in Fiji during 1965-1969 and (4) local and
regional earthquake locations from the telemetered network operated in Fiji
since 1979
The combination of all these data sources provides a composite picture
of the seismicity of Fiji over a wide range of spatial temporal and
magnitude scales each data source is limited by its magnitude threshold
duration of observation and degree of spatial resolution Together they
provide the state-of-the-art in our understanding of where and how earthshy
quakes occur within and around the Fiji Islands The important application
of this understanding is a more realistic assessment of seismic potential
along Fijis seismogenic zones and the seismic risk to major development
within the country
Historical Earthquakes
Fijis short written history prevents a complete reconstruction of the
recurrence cycles of major earthquakes throughout the Fiji region Nonetheshy
less the earthquake history for the past 1) years however incomplete
demonstrates aspects of Fiji seismicity not evident from an examination of
more uniform but shorter-term seismicity catalogs
Figure 9 shows the major historical earthquakes in the Fiji region
from Everingham (1983a 1984) Seventeen major earthquakes with magnitudes
greater than 65 have occurred close to the islands An additional fifteen
events with magnitudes greater than 60 are located in the same vicinity
The locations for these events are based on both macroseismic (intensity)
and teleseismic (instrumental) observations Those occurring before the
27
1971
01982 t1962
1950 a96oO-O a
974 O195760199 0A L9VU 1919 1)
1884 97 199574
0 06 1921 G151AWALEV
G1932
VITI LEVU t869
00 NIJON
195953 05
0934 01953 C5 omI 15
1950 o
01965 D LARGE SHALLOW EARTHOUAKES IN THE FIJI REGION
01955 0 Moviluot 60 - 64 195 IMS) 65 -70
1963 SC-Lt
II I I 1 I
Figure 9 Historical seismicity in the Fiji region Data are from Everingham (1983a 1984)
28
middle of this century must be regarded as approximate Errors of up to one
degree in instrumental locations result from inaccuracies in reporting of
arrival times uneven station distribution manual earthquake locations
etc Reporting of earthquake intensities is not altogether reliable
particularly before the beginning of the century Nonetheless the level of
development in Fiji since 1900 provides assurance that major events have not
been omitted from the catalogs
A large proportion of the major events around Fiji took place along the
microplate boundaries surrounding the platform As with the teleseismic and
microseismic events discussed below these earthquakes concentrate in the
northwestern Lau Basin (large events northeast of Vanua Levu) along the
Fiji Fracture Zone (seven events located north and west of Vanua Levu) and
along a zone of seismicity west of Viti Levu (five events near 176degE)
In contrast to the overall distribution of teleseismically located
earthquakes however several major events occurred within the Fiji
Platform These include the 1953 Suva earthquake (N - 675) the 1932 Koros
earthquake (Ms - 65) and the 1979 Taveuni earthquake (Ms - 69) discussed
in the following sections In addition Everingham (1983a 1984) reported
four significant events near Kadavu Island (1850 1935 and 1950) and one
within Viti Levu (1869) Two smaller but damaging earthquakes took place
near Kadavu (1918) and near Ovalau Island (1906) None of these events
exceeded magnitude (Ms) 71 however several had significant macroseismic
effects and are thus important for seismic hazard evaluation The occurshy
rence of large earthquakes within the platform confirms a conclusion that
emerges from the microearthquake observations intraplate deformation
within the Fiji Platform is a significant component of the regional deformashy
29
tion field but it occurs more infrequently and is separated by longer
periods of quiescence than that occurring along the interplate seismic zones
that bound the platform The obser7ation that earthquakes larger than
Ms - 71 are not recorded in a region characterized by high rates of relashy
tive plate motion suggests that the Fiji lithosphere is incapable of storing
sufficient stress to result in larger earthquakes Because of the brevity
of the seismological history of the Fiji region the occurrence of larger
prehistoric earthquakes cannot be ruled out
Teleseismicallv Located Earthquakes
Figure 10 shows in detail the teleseismically determined distribution
of shallow earthquakes around Fiji (depth lt 80 km) This map includes all
the events located by more than 15 stations of the global seismograph
network from 1961-1983 plus the better located of the earlier events
(1928-1960) that were relocated by Sykes (1966) and Sykes et al (1969)
The criteria used in compiling this catalog are described in detail by
Hamburger (1986) This data set provides generally higher precision
records lower magnitude activity (to mb gt 45) and a larger number of
events than the historical catalog The higher sensitivity improves the
resolution of finer scale spatial patterns Generally the events in this
data set are expected to have absolute errors under 20-25 km The overall
distribution of epicenters presented in this figure shows that on this
limited time and magnitude scale seismic deformation is largely confined to
active interplate zones surrounding the Fiji Platform
The detailed bathymetry in this area shows that the seismic zone north
of the Fiji Islands coincides with the rough topography of the Fiji Fracture
Zone The structural trends inferred from the elongation of the steep-sided
30
15
~ ~ 00
16 C lt -rdeg ro2 0
16 0pound0
~0017 shy
18 bull
00
20O
176 E 177 178 179 180 179 W 178
Figure 10 Teleseismically located earthquakes in the Fiji region Locations from Sykes (1966) and Sykes et al (1969) for 1928-1960 (A and B grades) from International Seismological Summary (ISS) and International Seismological Centre (ISC) catalogs for 1961-1980 and PreliminaryDetermination of Epicenters (PDE) Catalog for 1981-1984 Depth contours for 2 3 and 4 km depth are from Smith and Raicebe (1984)
31
ridges and basins are close to the regional strike of the earthquake belt
Over 3 km of relief is observed in these en echelon ridges and troughs The
nearby island of Cikobia situated northeast of Vanua Levu and directly
adjacent to the fracture zone (location shown in Figure 7) shows marked
Quaternary uplift (Berryman 1979) as additional support of active tecshy
tonism of the area
The seismic zone west of Viti Levu has been proposed as the location of
a North Fiji Basin spreading center (Sclater and Menard 1967 Chase 1971
Brocher and Holmes 1985) The earthquake belt coincides with a series of
Irregular basins with a marked north-northeast trend The basins coincide
with a north-trending free-air gravity low and high-amplitude magnetic
anomalies Seismic reflection profiles show little sediment cover in the
basins and document extensional deformation of the rifted arc margin at
the shelf edge of western Viti Levu (Brocher and Holmes 1985)
A few isolated epicenters are located within the Fiji Platform partishy
cularly in the area east of Vanua Levu A second group of events is located
sout of Viti Levu within and surrounding the Kadavu Island ridge A single
isolated event that appears within the island of Viti Levu is actually a
mislocated aftershock of the 1953 Suva earthquake which is located immedishy
ately south of the main island
Tripartite Seismic Network 1966-1969
Sykes et al (1969) first examined seismicity of the Fiji region using
a network of local seismic stations installed by B L Isacks in 1965 The
three-station network operated for nearly four years and included several
temporary sites throughout the Fiji Islands Locations from the first six
months of network operation were presented in their paper those from the
32
subsequent period were examined by Draunidalo and Hamburger (1984)
HYPOELLIPSE (Lahr 1984) relocations of these events were obtained using the
same velocity model used for telemetered network locations Hypocentral
parameters are given in Hamburger (1986) and the two sets of earthquake
locations are shown in Figure 11 These earthquake locations show the same
prominent seismic zones north and west of Viti Levu as the teleseismic data
shown in Figure 10 with a small number of shocks occurring south of that
island The large aperture of that network did not permit location of very
small events However Sykes et al did observe scattered seismicity in
areas previously thought to be aseismic east and northeast of Viti Levu
southwest of Viti Levu (near Kadavu Island) and in the seismic zone just
offshore southeastern Viti Levu In histograms of S-P intervals of earthshy
quakes recorded at the Fiji stations Sykes et al noted a continuum of
earthquakes with S-P intervals less than 10 sec at the southeastern Viti
Levu station Vunikawai These earthquakes few of which were located must
have occurred within the Fiji Platform rather than along its edges
Furthermore a prominent peak in activity was observed at VUN for S-P
intervals of 1-4 sec reflecting the high activity in the southeastern Viti
Levu seismic zone discussed in the following section
Fiji Telemetered Seismic Network 1979-1985
The seventeen-station national seismic network of Fiji is shown in
Figure 2 The network began operation with the establishment of the
eight-station US AID network in 1979 on the islands of Viti Levu Ovalau
and Beqa supplementing the three stations already operating at Vunikawai
Suva and Nadi
33
S1WRN I[A 41iI
S
2
176 E 177 178 179 180 179 W178
Figure 11 Microearthquakes in the Fiji region 1965-1969 Locations from 3-station seismic network operated by Sykes et al (1969) Triangles show locations of seismic stations Squares indicate locations obtained by Sykes et al for first 6 months of network operation Circles indicate relocations of events reported in subsequent 2 12 years by Draunidalo and Hamburger (1984) Depths constrained at 10 kin Bathymetry as in Figure 10
34
In December 1981 a five-station telemetered network was established
on the islands of Vanua Levu Koro and Taveuni through the Japanese aid
program From that time all the telemetered stations have been recorded on
a Japanese event-triggered 25-channel hot stylus pen recorder In early
1983 the Fiji Mineral Resources Department expanded the network by the
establishment of a three-station telemetry network around Monasavu Dam in
central Viti Levu Considerable technical difficulties have been encounshy
tered at many of the telemetered stations due to unreliable power supplies
degradation of electronic equipment weather-related interference and wind
and lightning damage Such problems have limited the operation of network
stations to some 50-75 of total operating time
The history of network operation is reflected in the histogram of
earthquakes located by the network (Figure 12) The system began recording
in November 1979 and was immediately inaugurated by the occurrence of two
major earthquake sequences the November 16 Taveuni earthquake (Ms - 69)
and its aftershocks and a prolonged swarm of moderate-sized events in
April-May 1980 including three events with ML gt 50 northeast of Vanua
Levu Two additional peaks in the histogram are associated with sequences
west of Viti Levu and along the Fiji Fracture Zone in September and
December 1980 respectively Through 1981 the network operated less
reliably debilitated by technical problems with field stations telemetry
and the recording system
The increase in activity in December 1981 reflected a period of
maintenance and repair of existing instruments and the establishment of the
Japanese aid network Through June 1983 the level of recorded seismicity
was to some degree limited by the operation of an event-triggered recording
120 1 1 1 1 1 1
C 100 Taveuni (65)
H
80 gtNE Vanua Levu
(5054 5051)
0 60
40 W Viii Levu (53)
Fiji Fracture Zone Baravi Basin swarm
Z (58 50)
~(51 KadaVU
51)
Fiji Fracture Zone (57 56 59)
20 1
0 1979 1980 1981 1982 1983 1984 1985
YEAR OF NETWORK OPERATION
Figure 12 Histogram of earthquakes recorded by the Fiji seismic network 1979-1985 Major earthquake sequences are noted with mainshock magnitudes (ML) given in parentheses See text for discussion
36
system The sudden increase in mid-1983 followed the reinstallation of a
continuous recording system and a second period of instrument maintenance
Subsequent peaks in the histogram are associated with major earthquake
sequences near Kadavu Island (July-August 1983) along the Baravi Basin
(June 1984) and along the western Fiji Fracture Zone (October 1984) The
major gap in recording at the beginning of 1985 follows the devastation of
network telemetry by Hurricanes Nigel and Eric The data available at the
time of this writing end in August 1985
Earthquake Locations
During the nearly six years of network operation over 5000 local
earthquakes were recorded by the Fiji seismic network Of these events
approximately 1800 were recorded with sufficient redundancy to provide
reliable earthquake locations Details of the earthquake location procedure
can be found in Hamburger (1986)
A grading scheme was designed to cull out the best locations within
each earthquake source region The earthquakes were first classified into
eight source regions based on the distribution of earthquake foci and their
relation to the seismic network (Figure 13) Grading criteria were applied
consistently within each seismic region but varied from region to region
The criteria used are based on the output parameters from the location
program HYPOELLIPSE number of recorded P- and S-arrivals RMS residuals
minimum epicenter-station distance azimuthal gap and the size of the error
ellipse for each event The grading criteria are summarized by Hamburger
(1986) These grading criteria provide a systematic means to compare
earthquake locations within each area
37
0100 Io15
S FFZ 0 S o TAV 0S
00 0 o o0 0o - 0
0 O 00 0 0 0POFF 0 U _
0 L 0 0
FEo 3 o o o o 0
0 0 o0
SVL o oo LAU 19 degVo o CC 1 0 00 0 0 11760 E 17 o 17 17 r10 17W7
00 0 D 000 0
0 0 0
000
WVL 0 0o KAD
21 1 1 ( - -a
176 E 177 178 179 180 179 W 178
Figure 13 Earthquake source regions near Fiji Regions are defined based
on distribution of earthquakes and relation to network geometry and are used in defining grading criteria See text for discussion
38
Depth Determinations
Determination of reliable earthquake depths is a function of the number
and accuracy of arrival time readings and of the geometry of the network
used for locating each event For earthquakes located within the dense
network of southeastern Viti Levu the pattern of arrival times (or
source-to-station distances) uniquely determines a particular depth at which
the RMS of the traveltime residuals is minimized On the other hand for an
earthquake in the Taveuni region far outside the seismic network the
arrival-time data can be matched by virtually any crustal depth
Because there is very little constraint on hypocentral depths outside
the seismic network the hypocenters of these earthquakes were simply fixed
at a midcrustal depth of 10 km consistent with the observed focal depths in
Viti Levu (see below) Depths were allowed to vary only for earthquakes
within and near Viti Levu and for the small number of events outside this
region recording both P- and S-arrivals at a station within 50 km
The distribution of earthquake depths in Fiji is given in Figure 14
Virtually all the well constrained depths fall within 20 km of the earths
surface and a ubstantial majority at depths lt 13 km A very small number
of earthquakes were located at depths exceeding 30 km but all of these
events are considered poorly constrained (grade D) From the network
locations there is no evidence of any intermediate-depth activity that
might be expected from the recent northward subduction of South Fiji Basin
lithosphere beneath the Fiji Platform (Malahoff et al 1982a Gill et al
1984) A single teleseismic event located south of the Platform at 73 km
depth was found to be a mislocated shallow event The best-constrained
hypocentral depths those located within the small-aperture network in
39
100
80
z ~60
20shy
o
0 10 20 30 40 50
DEPTH (KM) Figure 14 Histogram of hypocentral depths for all earthquakes located bythe Fiji seismic network classified by grade D - unfilled C - light shading B - dark shading A - black
40
southeastern Viti Levu cluster at midcrustal depths of 7-13 km The deepest
A-grade event is near the base of the crust at 18 km The B-grade events
extend to 20 km depth
In general the depth distribution is quite similar to that observed in
areas of continental extension and strike-slip deformation (Chen and Molnar
1983 Smith and Bruhn 1984) Corbett (1984) found earthquakes located by
the southern California seismic network to be limited to the upper 22 km of
crust A similar double-peaked histogram was observed with concentrations
of activity in the upper 4 km and between 10 and 16 km depth Chen and
Molnar ascribe the overall concentration of activity in the upper crust to
high geothermal gradients limiting the material strength in the mantle and
lower crust The observed concentration of seismic activity within the Fiji
crust and the sharp drop-off in activity near its base is consistent with
the observation of anomalous (low-velocity) upper mantle beneath Fiji
stresses sufficient to generate earthquakes can accumulate only in the thin
crust that forms a rigid cap on the relatively hot ductile mantle of the
Fiji Platform
Earthquake Magnitudes
When possible earthquake magnitudes have been assigned to all of the
newly located events in Fiji The magnitudes were computed from trace
amplitudes and coda durations recorded on instruments of the telemetered
network The development of a magnitude scale for the Fiji network is
described in detail by Hamburger (1986)
The distribution of magnitudes reported for all events during the
operation of the seismic network is shown in Figure 15 Magnitudes range
from local magnitude ML - -10 (microearthquakes in southeastern Viti Levu)
41
150
125
W
Z 100
75--shy
25-shy
mm4
62 0 2 4
MAGNITUDE
Figure 15 Histogram of magnitudes for all earthquakes located by the Fiji seismic network
42
to ML - 65 (the large November 1979 Taveuni earthquake) From the largest
events the number of earthquakes in each magnitude range steadily grows to
a maximum of 130 earthquakes in the range ML - 28 - 30 At smaller
magnitudes the number drops due to the networks loss of sensitivity to
small earthquakes outside the network In fact the magnitude threshold may
be somewhat lower due to systematic underreporting of magnitudes of small
events during the latter period of network operation The magnitude
threshold is also evident in the magnitude-frequency relation of Figure 16
This figure shows the log of the cumulative number of events as a function
of magnitude Again a change in character is evident near the threshold
magnitude of ML - 30 At larger magnitudes the curve may be approximated
by a linear slope given by the line
log N - 517 - 080 ML
following Richters formula log N - A shy bM where the A value describes
the level of seismic activity in a region and the b value describes the
recurrence relations for that region The b-value of 080 is in the range
of tectonically active regions throughout the world (see Lee and Stewart
1981) It contrasts with the b-value of 049 obtained for the instrumental
catalog based on magnitudes less than 60 by Everingham (1983c) His low
b-value is based on compilation of surface-wave magnitudes (Ms) and results
in part from underreporting of smaller magnitude events during the early
part of this century
Seismicity Maps
In the following section we present maps of earthquakes in the Fiji
region recorded by the telemetered seismic network As a result of the
improved spatial resolution provided by the telemetered network the maps
3-shy
+
+
2 ++++ ++++ + +++ ++ ++ ++ +++ +++ +++++++++++++ +
-gt 1 U
00
0 2 4 6
MAGNITUDE (ML)
Figure 16 Magnitude-frequency plot for all events located by the Fijiseismic network The portion of the curve above ML - 30 is approximatedby the straight line log N - 517 - 080 ML The maximum network threshold near ML - 30 is indicated by the falloff in the curve at smaller magnitudelevels
44
can be used to characterize the seismic regime along each of the seismic
zones in the Fiji region Space-time diagrams of the network seismicity are
used to elucidate temporal patterns of earthquake occurrence along the
seismic zones Gross sections are presented for the earthquakes located
within and around the island of Viti Levu where depth resolution is
greatest
The 1800 earthquakes located by the telemetered network are presented
in Figure 17 Hypocentral parameters for each event are given in Hamburger
(1986) Figure 18 shows all earthquakes classified by magnitude Detailed
maps of several major earthquake sequences are displayed in Figure 20
Figures 24 and 29 present larger-scale maps of the seismicity within the
island of Viti Levu
Compared to the historical and teleseismic data shown in Figures 9 and
10 these new seismicity maps provide a new detailed picture of the pattern
of deformation within and around the Fiji Platform Several initial obsershy
vations stand out First the pattern of activity is far from uniform
Earthquakes occur in concentrated zones both within and along the boundaries
of the platform large areas exist which are virtually aseismic
Second the major zones of activity along the platforms margins
coincide with those defined by the historical teleseismic and the triparshy
tite network data the northeastern edge of the platform the Fiji Fracture
Zone the basins west of Viti Levu and to a lesser extent the Hunter
Fracture ZoneKadavu region That is these zones are also active at higher
magnitude ranges within a time scale observable by instrumental observashy
tions The areas of high activity within the Fiji Platform are not well
populated in the teleseismic data This contrast between network and
bull bull
45
15 0
0
OO 0 0
0 ~ii
0 A 0f) 0
k 993_
20 0
176 o 07 P 8 7 7178 170
FigZr hwn l atqae 07 oae yteFj esi0a
newoDBahm r asi igr 0
46
15 1 1
+S o16 0 +Q 1
0
0 0 _to017 0o 4 A 0 0
4~0
0 + 0
1 0 0 o +0~ Oc
100 + + 00 00
1 P0 0 0 O 0 00
0 o4
00 + S0 0 + 0 O
D R 01 0
0 00
0 0
21 +0 + 0 I I 176 E 177 178 179 180 179 W178
Figure 18 Map showing all earthquakes located by the Fiji seismic network classified by magnitude Grosses ML lt 2 small open circles 2 lt ML lt 3 large open circles 3 _ltML lt 4 shaded circles 4 lt ML lt 5 filled circles ML gt 5 2-km contour as in Figure 10
47
S i I
t
16
WA
17
00
19 0
20
M~A
176 E 177 178 179 180 179 W 178
Figure 19 Location map for major earthquake sequences presented in Figure 20 Bathymetry as in Figure 10
48
17
0 A S VI VII S
180 E 179 W
A C
19
E 176177
19 V V
C
Figure 20 Maps of major earthquake sequences since establishment of the seismic network (A) November 1979 Taveuni earthquake (ML - 65)(B) December 1980 Fiji Fracture Zone earthquake (ML - 58) (C) October 1984 Fiji Fracture Zone swarm (ML 57 54 59) (D) September 1980 West Viti Levu swarm (ML - 57) (E) July 1983 Kadavu swarm (ML = 51 51 48) Mainshock locations shown by filled squares Focal mechanism(s) and isoseismal data (Roman numerals) shown where available Unshaded bathymetric contours are identical those shown in Figure 10 Earthquake grades D - small open circles C = large open circles B shyshaded circles A - filled circles Large historical earthquakes in the Taveuni area (A) are shown by filled triangles
49
teleseismic observations is fundamentally a sampling problem The intrashy
plate zones of activity are observed by the network because (1) the
intraplate seismic zones are very active at lower magnitude ranges and
(2) the network happened to catch several unusual major earthquake
sequences in areas of relatively low activity The distribution of earthshy
quake magnitudes (Figure 18) bears out both causes (1) the concentration
of activity in southeastern Viti Levu is almost entirely composed of small
events (ML lt 3) Of the 500 earthquakes located within Viti Levu none have
been large enough (mb gt 45) to have been located teleseismically (2) the
concentration of activity near Taveuni Island is the result of a fortuitous
earthquake sequence two weeks after the network began operation In the
following section each of the major earthquake source areas in the Fiji
region are considered in detail (shown in Figure 13)
1 Taveuni (TAV) This area is dominated by two major earthquake
sequences that occurred early in the networks operation The 16 November
1979 Taveuni earthquake (M - 69) is the largest event to occur in thes
region in over 30 years and the most destructive in Fiji since the 1953 Suva
earthquake The earthquake was strongly felt (MM VII in the closest
islands) throughout the islands of Taveuni Vanua Levu Rabi and Kioa
(Figure 20A) An intense aftershock sequence continued for several weeks
following the mainshock and isolated events continued for over a year
thereafter The probable mainshock location was constrained by the pattern
of macroseismic data as well as by S-P intervals at temporary seismic
stations occupying nearby sites in the days following the mainshock
(Everingham 1982a) The teleseismic solutions (PDE ISC locations) did not
utilize the local network observations and are positioned 20 km to the
50
southwest of the probable location In any case the mainshock and aftershy
shock locations indicate that the rupture occurred well within the thickened
crust of the Fiji Platform
The earthquake focal mechanism (Figure 21) was pure strike-slip with
fault planes oriented nearly north-south and east-west These orientations
coincide with neither the northeast-trending bathymetric fabric nor major
faults mapped onshore Vanua Levu or Taveuni But the NW-SE orientation of
the mechanisms T-axis is consistent with the sense of extension inferred
from the axial fissure zone and parallel normal faults that strike along
the axis of Taveuni (Woodhall 1985b) as well as the normal faults that
delimit the Natewa Bay graben separating the twin peninsulas of Vanua Levu
(Green and Cullen 1973) Taveuni is the one locality in Fiji where
Holocene volcanic activity has been documented (Frost 1974) and the alkalic
trend of Taveunis Quaternary lavas reflects this extensional character In
addition the elongation of the volcanic axis of the is]and reflects the
NE-SW direction of maximum compression as described in the Japanese
(Nakamura 1977) Alaska (Nakamura et al 1977) and the New Hebrides arcs
(Roca 1978) The axis of principal compression observed in the Taveuni
earthquake shows the same dominant stress field The historical record for
this region (Figure 9) indicates that major intraplate activity has occurred
near Taveuni throughout this century
A second major sequence of earthquakes occurred northeast of the island
of Vanua Levu (Figure 17) and constitutes a major swarm of activity in
April-May 1980 The sequence included three events with ML gt 5 and nine
events with 4 lt ML lt 5 Recordings from the earthquakes are characterized
by highly attenuated low-frequency P- and S-arrivals and contrast sharply
51
N
T o
0W- 0 shy
00
0
0 0
Figure 21 Focal mechanism for the 1979 Taveuni earthquake Equal-areaprojection of the lower hemisphere of the focal sphere Large open andfilled circles represent clear dilatational and compressional firstmotions respectively Less reliable first motions are shown as small openand filled circles Large and small X-marks indicate clear and uncertain P-wave arrivals respectively that are judged to be near a nodal planeArrows show directions of S-wave polarization The P (pressure) aizd T(tension) axes are located at the base of the letters P and T
52
with those associated with the nearby Taveuni aftershock sequence Because
the propagation path from the Vanua Levu swarm to the seismic network is
nearly identical to that followed by the Taveuni sequence the zone of
attenuation must be located close to the swarms source area In any event
the quality of the arrivals resulted in a generally poor location accuracy
which implies that the strong apparent northwesterly trend to the sequence
is simply an artifact of the poor constraint on station arrival times The
best constrained locations cluster near the northeastern tip of Vanua Levu
island the probable source area for the sequence Like the Taveuni earthshy
quakes this sequence is located within the margins of the Fiji Platform
The area is adjacent to a particularly complex confluence of tectonic
elements where the Fiji Fracture Zone intersects the margin of the Fiji
Platform and Lau Basin The influence of magmatic processes is suggested by
the swarmlike character of the sequence (eg Hill 1977) and the highly
attenuated waveforms (eg Sanford and Einarsson 1982 Iyer 1984) Other
than these two major earthquake sequences the Taveuni region appears to be
quiescent
The temporal distribution of earthquakes in the Taveuni area is shown
graphically in Figure 23E This figure demonstrates the dense clustering of
activity in the 1979 Taveuni mainshock-aftershock sequence and the 1980
swarm offshore Vanua Levu as well as the subsequent quiescence of the
region This pattern is characteristic of intraplate activity within the
platform and contrasts with the more continuous activity along the Fiji
Fracture Zone (Figure 23A) and the West Viti Levu seismic zone (Figure 23B)
Long-term aftershocks of the Taveuni event are recorded up to a year after
the mainshock subsequently the zone is entirely aseismic (at the magnitude
53
15 S 0 0 Ao
16o 0 00 0 0o0171
o o gt 17 B 0 o OoDC
9 00
17 r ef o 0o -- 0 0 D 930--o0
0 0 0 L) I_P
19degoO 0 o 0
00 020 B 0 oO 0o 0- oJ C o 0
0 V 0
21 III176 B 177 178 179 180 179 W178
Figure 22 Map showing locations of space-time diagrams presented in Figure 23 Brackets denote area included in diagrams
A 1 I8--
2993
109 0
S1982 1981 o
I 199
o
0
doo -0
0
bull
0
0
I
A I9s
-0
0
B -
19
MA0
0
0 1993 lt
-
1982
0
I
C0
i I
bO2
I I
0
B C
198
1
CC1913
rL19R7
0-shy
0lt
C
r 9 (
1950
Cb oS00 0
Q I
50 i0
0
0
150 200 70 30o
DISTANCE (KM)
0 bull
0 0
350 400 450
19 1
2920
0
0 = -
o 50
0
0 O0000
0
00 150
DISTANCE
200
(KM)
230 o
300
190
980
29790 0
ishy50 100 150
DISTANCE
0
200
(KM)
230 300
D
19
I
e
I I I D E
1985
I I I 0
I E
lt 0 0
--982
~~~~ P
o
-- A 198
22 S
2920
190
S1981 2
29S(0
1970
o
Oshy Q
0 50 1979
100 150
DISTANCE
200
(KM)
235 300
1~~979
0 30
-0
200 150
DISTANCE
200
(KM)
230 300
Figure 23 Space-time diagrams for main earthquake zones in Fiji Small open circles ML lt 3 large opencircles 3 lt ML lt 4 shaded circles 4 lt ML lt 5 filled circles ML gt 5 Locations shown in Figure 22
55
range to which the network is sensitive) Activity at very small magnishy
tudes like that observed in southeastern Viti Levu is probably charactershy
istic of the Taveuni area as well small events with S-P times less than
10 seconds are recorded on seismographs on Taveuni and Udu Point but are
seldom of sufficient size to be recorded by the remainder of the network
This sporadic nature of intraplate activity underscores the importance of
the network data (low magnitude threshold) and historical data (long time
scale) in evaluating intraplate activity within the Fiji Platform
2 Fiji Fracture Zone (FFZ) Through each period of observation the
area of rough topography north of the platform has been the most seismically
active area of the Fiji region This belt of earthquakes is part of a
larger seismogenic feature 2nd continues to the east as a complex but
continuous zone of seismic activity which extends to the northern end of the
Tonga Trench) Further west it continues as a linear belt of seismicity
into the center of the North Fiji Basin As such it represents the present
southern transform boundary of the Pacific Plate in this area and has been
termed the Fiji Fracture Zone (Green and Cullen 1973 Hamburger and
Everingham 1985) The concentration of large earthquakes along this belt
(Hamburger and Everingham 1985 Hamburger and Isacks 1985 see Figures 9
and 18) confirms the contention that a major portion of the interplate
deformation is taken up there The westward extent of the fracture zone is
more ambiguous as its topographic expression is not well preserved west of
Fiji Seismicity extends into the central portion of the North Fiji Basin
but rapidly drops off west of about 174degE
Within the FFZ the seismic activity is non-uniform At all time and
magnitude scales (Figures 9 10 11 17) the portion of the FFZ directly
56
north of Viti Levu (1765deg-1785degE) has been continuously active The
portions of the FFZ further west and that located north of Vanua Levu (east
of 1785degE) are far less active However the historical record of seismishy
city (Figure 9) shows that significant earthquakes have occurred in the
quiet zone north of Vanua Levu during the last century indicating that the
present quiescence reflects a temporary locking of the plate boundary during
the interseismic period
The difference in seismic regime along the adjacent segments of the FFZ
reflects differences in the dynamics of plate interaction along this
boundary The eastern zone is oriented close to the PacificIndo-Australian
plate motion vector in this area implying predominant strike-slip motion
along the FFZ A sharp kink in the strike of the fracture zone occurs at
1788degE where the seismic activity picks up It is in the portion of the
FFZ west of 1788degE where active rifting has been observed Von
Stackelberg et al (1985) reported minor north-trending bathymetric ridges
offsetting the FFZ bearing fresh hydrothermally altered pillow basalts
These observations indicate that plate motion in this area is accommodated
by extensional as well as strike-slip deformation The continuous
swarm-like activity of the western FFZ is typical of localized areas of
extension within strike-slip tectonic environments (Hill 1977)
The space-time diagram for the FFZ (Figure 23A) clearly demonstrates
this contrast in activity The portion of the FFZ west of 1788degE (lt 225 km
distance) is characterized by virtually continuous activity with larger
events occurring in swarm-like sequences The eastern FFZ is characterized
by more isolated individual small to moderate-sized events Despite the
lower level of activity this quiescent portion of the FFZ has the evenly
57
distributed occurrence of events that is characteristic of the interplate
seismic zones The two major sequences along the FFZ (December 1980 and
October 1984) occurred near the edges of the active zone
These two important sequences are shown in detail in Figure 20BC The
December 1980 cluster was a mainshock-aftershock sequence following a
ML - 58 mainshock The sequence occurred close to the eastern edge of the
fracture zones active belt and close to a pronounced change in strike of
the zone The aftershocks are generally not very well located due to the
limited number of stations operating at the time their distribution sugshy
gests a very small rupture area near 162degS 1785degE
The October 1984 sequence is somewhat more complex and involved three
major events with magnitudes of 57 54 and 59 Centroid moment-tensor
focal mechanism solutions for these three events were available from the
US Geological Surveys Preliminary Determination of Epicenters This
sequence took place on the western end of the active zone near a second
change in strike of the FFZ The mainshocks are all characterized by
strike-slip faulting with east-west nodal planes paralleling the western
segment of the fracture zone The third major event of the sequence occurshy
red 125 km north of the fracture zone in a normally quiet portion of the
North Fiji Basin While this event may be considered a coincidental occurshy
rence its proximity in time and the similarity of mechanism suggest that
the earthquake was triggered by the rupture along the fracture zone The
east-west trend of the mechanisms nodal planes implies that it was the
portion of the FFZ west of 1775degE that ruptured during the sequence rather
than the active ENE-trending segment
58
At moderate magnitudes (3 lt ML lt 4) the portion of the FFZ between
17680 and 1788degE is continuously active In contrast the same area is
devoid of major historical events (Figure 9) During the six years of
operation of the telemetered network the two major earthquake sequences
along the FFZ nucleated at the edges of the active zone These phenomena
indicate that slip occurs relatively freely along the ENE-trending active
segment accommodated by continuous occurrence of small earthquakes and by
possible aseismic slip The occurrence of back-arc extension within the
seismically active portion of the FFZ also indicates that normal stresses
acting along this portion of the FFZ are at a minimum Slip along the
east-trending relatively quiescent portion of the FFZ occurs in major
earthquake sequences such sequences may nucleate at the edges of the active
zone
3 West Viti Levu Zone (WVL) Some 200 earthquakes are located in the
seismic zone forming the western edge of the Fiji Platform Like the events
northeast of Vanua Levu many of the WVL earthquakes produce poorly
recorded low-frequency shear arrivals that degrade the location accuracy in
this area In general the epicenters coincide with a series of bathymetric
troughs that mark the extensionally deformed margin of a former forearc
terrane (Larue et al 1980 Brocher and Holmes 1985) While the activity
in this zone is considerably lower than that along the Fiji Fracture Zone
the character of earthquake occurrence (Figure 23B) is similar--earthquakes
occur irregularly throughout the network operation The WVL zone is marked
by relatively high activity on all time and magnitude scales (Figures 9 10
11)
59
The bathymetric troughs west of Viti Levu are part of an area of rough
seafloor morphology where the 4 km-deep troughs approach the shelf slope of
the Fiji Platform Parallel to and inland of the troughs an elongate
bathymetric ridge forms the outer edge of the Baravi Basin This basin is a
sediment-filled trough located west and south of Viti Levu interpreted by
Brocher and Holmes (1985) to represent the forearc basin of the active
pre-Late Miocene Fiji volcanic arc The bathymetric ridge was interpreted
to represent a structural high analogous to the trench slope break of active
convergent margins in the terminology of Karig and Sharman (1975)
Single-channel seismic reflection profiles are suggestive of extensional
deformation of basin sediments near this former arc margin (Figure 4 in
Brocher and Holmes 1985) This sediment deformation combined with high
heat flow (Sclater and Menard 1967) and high-amplitude magnetic anomalies
(Brocher and Holmes 1985) provides evidence for recent North Fiji Basin
extension that Brocher and Holmes attributed to the Neogene rotation of
Viti Levu If this process is continuing the associated deformation should
be reflected in the present-day seismicity
The most importaLlt sequence within the WVL zone took place in September
1980 and constituted a mainshock-aftershock sequence which followed a
magnitude 57 earthquake in the southern pcrtion of the seismic zone (Figure
20D) The mainshock located at 192degS 1765degE appears to have been
mislocated as the aftershock zone is positioned some 40 km or more to the
north extending no further than the area 184deg-189degS
The focal mechanism solution for the mainshock of this sequence indishy
cates strike-slip faulting with a significant normal component (from
Everingham 1985) The NNE strike of the sinistral plane of this mechanism
60
coincides with the strike of the seismic zone and also parallels the deep
basins west of Viti Levu This observation suggests that the basins forming
the western margin of the Fiji Platform are presently accommodating a
dominant component of left-lateral strike-slip faulting parallel to the
basins strike The sense of motion along this fault is close to that
observed throughout the eastern North Fiji Basin and within the Fiji
Platform
Thus the hypothesis of simple extensional deformation of the WVL zone
is not supported by the seismicity patterns associated with the 1980
sequence Rather they suggest that in its present configuration the
western margin of Fiji is accommodating a significant degree of strike-slip
motion Nonetheless the attenuation of seismic waves that originate in
this zone the high heat flow the recent extensional deformation of the
margin and the high-amplitude short wavelength magnetic anomalies suggest
that backarc rifting is a significant component of deformation in this area
However contrary to Brocher and Holmes simple model of mid-ocean
ridge-type extension this area like the Fiji Fracture Zone appears to be
characterized by a leaky transform-type extension dominated by strike-slip
deformation In this case the proposed transform faults offsetting the
west Viti Levu basins would become a series of left steps of a longer
sinistral strike-slip feature According to this model rifting is concenshy
trated along the shallower ridges separating the basins rather than within
the basins themselves
4 KadavuHunter Fracture Zone Region (KAD) This zone stands at the
intersection of a former convergent plate margin with the Fiji Platform
The Hunter Fracture Zone is a well-defined curvilinear belt of ridgetrough
61
topography extending from Fiji to the southern New Hebrides arc At its
western end it intersects the southern termination of the New Hebrides
Trench The transition between these two features is a morphologically
complex zone characterized by subduction-related volcanism on Matthew and
Hunter Islands irregular bathymetric features on the upper plate and
intense shallow seismic activity (Louat 1982 Maillet and Monzier 1982
Monzier et al 1984) In fact bathymetric and seismic reflection profiles
across the Hunter Fracture Zone show that the subduction margin morphology
is preserved well into the Fiji Platform The Koro Sea (east of Viti Levu
see Figure 7) represents its eastern termination Hinge-faulting focal
mechanism solutions at the western end of the HFZ document tearing of the
Indo-Australian Plate (Hamburger and Isacks 1985) Chase (1971) pointed
out that shallow seismicity along the Hunter Fracture Zone rapidly drops off
east of 174degE where it was hypothesized to intersect a major North Fiji
Basin spreading center East of this intersection the fracture zone may
simply mark a relict lithospheric scar tracing the westward migration of the
southern New Hebrides arc Malahoff et al (1982a) and Gill et al (1984)
however proposed that the fracture zone has accommodated oblique subduction
of South Fiji Basin lithosphere as recently as che early Quaternary In
fact Kadavu Island is the one area of Fiji where calc-alkaline volcanism
persisted beyond the Pliocene (Gill et al 1984 Whelan et al 1985)
Nonetheless the absence of an inclined seismic (Benioff) zone and shallow
thrust-type mechanisms suggests that the Hunter Fracture Zone is not accomshy
modating plate convergence at present however isolated earthquakes do
occur along the entire length of the Hunter Fracture Zone and major events
62
have occurred near its intersection with the Fiji Platform (Figures 9 and
10)
A significant number of earthquake recorded by the seismic network are
located in this region Virtually all of them are positioned landward of
the Fracture Zone and its continuation into the Koro Sea The depths of
these events are not well constrained but there is no evidence of any
intermediate-depth subduction-related seismicity in this zone
The major earthquake sequence in this zone is the Kadavu earthquake
swarm of July-August 1983 (Hamburger anO Qiolevu 1983) The swarm
included over 100 earthquakes and culminated in mainshocks of magnitude 51
51 and 48 The maximum intensitLes were reported in westernmost Kadavu
(MM V-VI) and several landslides were triggered by the largest of the
mainshocks The earthquakes occurred approximately 20 km offshore western
Kadavu (Figure 20E) along a submarine extension of the Kadavu ridge
The concentration of activity at shallow depths of the HFZ demonstrates
active deformation of the upper plate of this former subduction zone plate
kinematic arguments suggest that the HFZ is presently accommodating extenshy
sion between the South Fiji Basin (Indo-Australian Plate) and the Fiji
Platform The shallow activity is the manifestation of that deformation
5 Lau Ridge (LAU) This is the least active portion of the Fiji
region most of the earthquakes within this seismic region are in fact
located along the western edge of the ridge or within the eastern Koro Sea
One reliably located event however is positioned within the central
portion of the ridge it was recorded by the temporary station operating on
Lakeba Island (Figure 2) Tectonically the Lau Ridge is now part of the
stable Indo-Australian Plate and the major deformational areas are the
63
extensional centers of the Lau Basin to the East the Fiji Fracture Zone to
the North and the Hunter Fracture Zone to the west No major historical
earthquakes (Figure 9) are reported in this region Quaternary volcanism
has been reported at several localities in the Lau Group (Whelan et al
1985 Woodhall 1985a) and recent tilting of the islands was observed by
Taylor (1978) Teleseismically located earthquakes are reported from the
southern Lau Ridge This evidence of recent tectonism indicates that the
stability of the Lau Ridge is only relative and that there is potential for
moderate-sized earthquakes even within this relatively quiescent block of
the Fiji region
6 Offshore Viti Levu (OF0T This seismic region is characterized by
low activity relative to the active belts of seismicity surrounding this
region The low activity is reflected in a minimum in S-P intervals at
times of 6-20 seconds at seismic station Vunikawai in southeastern Viti Levu
(Sykes et al 1969) It is striking that the broad shallow shelf north of
Viti Levu (Bligh Water Basin) is virtually devoid of seismicity (for ML gt 3)
through the entire period of network observation Activity is observed only
near the 1 km-deep trough (Vatu-Ira Channel) separating the basin from the
western shelf of Vanua Levu This trough follows a major structural trend
controlling Pliocene volcanism in the Lomaiviti Group (Green and Cullen
1973) and has been proposed as an active transform fault terminating the
Hunter Fracture Zone (Rodda and Kroenke 1984) This corclusion is
certainly not warranted by the seismological data however the bathymetric
and structural trends combined with the concentration of activity here
indicate fault control
64
A second area of seismic activity is the area surrounding the island of
Koro near the termination of the Hunter Fracture Zone This zone has been
active at low magnitude levels during several brief periods of activity
(Figure 23E) It is clearly a zone of significant seismic potential
evidenced by the occurrence of a major historical event the Ms 65 Koro-
earthquake of 1932 (Everingham 1982b) The area is an important confluence
of major structures the western end of the Hunter Fracture Zone terminates
against the strong northeast-striking structural fabric of eastern Vanua
Levu and Taveuni (Green and Cullen 1973) There is evidence that convershy
gence along the HFZ has terminated (Hamburger 1986) but the Late Pliocene
and Quaternary volcanic activity landward of the fracture zone attests to
its recent activity Throughout the area south and east of Viti Levu
seismic activity is concentrated on the landward (north and west) side of
the bathymetric trough The extensional stresses deforming the Fiji
Platform do not appear to significantly deform the lithosphere of the
neighboring South Fiji Basin or its continuation into the arc complex the
Koro Sea However where the South Fiji Basin lithosphere meets the
deformed arc lithosphere south of Vanua Levu it becomes a zone of high
seismic activity and is capable of a damaging earthquake of the size of the
1953 Suva or 1979 Taveuni events
A third area of high activity is observed in the opposite corner of the
offshore region the Baravi Basin Here like other intra-platform seismic
zones activity is concentrated in several discrete periods of activity
separated by long periods of quiescence (Figure 23C) Activity is focussed
along the 2 km depth contour marking the edge of the Fiji shelf The
contour also marks the edge of a major sedimentary basin fed by the rivers
65
of southern and western Viti Levu (Larue et al 1980) It is characterized
by free-air gravity lows to -70 mgal that result from up to 3 km of sediment
fill in the basin Seismic reflection profiles across the basin (Brocher
and Holmes 1985) demonstrate significant post-Pliocene extensional deformashy
tion along the its seaward margin The high-angle faults show a significant
normal displacement but a strike-slip component is also suggested by
Brocher and Holmes based on the coincidence with structural trends in the
West Viti Levu zone In any case the major earthquake sequences in
1979-1980 and 1984 demonstrate ongoing deformation of the Baravi Basin
margin Like other actively deforming zones close to the Fiji Platform the
apparent quiescence of the Baravi Basin at larger magnitudes (Figures 9 and
10) is likely to be a temporary one reflecting a period of interseismic
strain accumulation
7 Central Viti Levu (CVL) Within the island of Viti Levu the
telemetered seismic network offers the best opportunity for evaluating the
detailed characteristics of crustal seismicity associated with deformation
within the Fiji Platform The island of Viti Levu is also the source area
for the most destructive earthquake in Fijis history the 1953 Suva earthshy
quake (Ms - 675) making it the critical focal point of seismic hazard
analysis for the country
The earthquakes within the island of Viti Levu (Figure 24) are concenshy
trated in two zones one a broad swath extending from central Viti Levu
across the island to Ovalau the second a dense concentration of earthshy
quakes within and offshore the southeastern portion of the main island
Cross sections AA and BB (Figure 26) taken across the entire island
demonstrate the relative quiescence of northern and western Viti Levu and
66
177 E 0
178 A+
179
Figure 24 Moip of earthquakes within and around the island of Viti Levu Earthquake grades D - crosses C - open circles B - shaded circles A - filled circles Light shading shows areas of relief gt 75 m dark shading emphases high inland Nadrau Plateau at elevation gt 750 m Topography from Dickenson 1972 Faults from Rodda and Band (1966) are shown by heavy lines 100 500 and 1000 m bathymetric contours are from Smith and Raicebe (1984) Seismic stations are shown as filled triangles
67
17
B 000
0 0
AI or o C oOOo deg0 0018 0
D0 n OC 0A 0 0 0
0 0 0
o1o r 0o c( (~ 0 0 0
177 E 178 179
Figure 25 Map showing locations of cross sections A-D within the islandof Viti Levu Brackets denote area included in sections
A B B0 00 0 DD B0
40 o6
0 0- 0 d 3020l -o 6 ~ deg0
0 0a
C CAR 0
40O-5~~ 30 0o6amp A0l0l0 0 0 0shy deg
20 - 0o e
2 0 0 4 0
100050 go000
012
50 4 00
0 20o
o oo0 o
bull bull
o A 25
D0 -
0 o
0
0
15shy
8 10 300 10 20 30 40 30 0 20 30 40
Figure 26 Cross sections within the island of Viti LevuFigure 18 Locations shown in Figure 25 Symbols denote earthquake grades as inTriangles at top of sections denote positions of seismic
stations along strike of the projections No vertical exaggeration Note that scales vary from section tosection
0
69 the dense concentrations of microearthquakes in the central and southeastern
portions of the island The sections also demonstrate graphically the confinement of seismicity to the upper 20 km of Fijis lithosphere The two subcrustal events at 42 and 45 km depth are poorly constrained (grade D) and are considered to be mislocations The limiting depth is close to the average crustal thickness of -19 km this coincidence of focal and crustal depths is unique in all other areas of extensional and strike-slip tecshytonism the seismicity does not extend deeper than midcrustal depth (Chen and Molnar 1983) Little information however is available from tectonic
settings comparable to Fiji The errors in hypocentral depth determinations and in crustal thickness estimates permit the existence of a relatively
thin aseismic lower crust In any case the crustal activity begins to taper off from 13 km depth the majority of the earthquakes take place in
the upper two-thirds of the crust
The cross sections CC and DD examine the earthquake clusters in central Viti Levu Two notable groupings stand out one near 178degS
1778degE which will be referred to as the Nadrau swarm and a second near 178degS 178degE which will be referred to as the Monasavu swarm Approxishymately fifty earthquakes occurred in clusters of activity from early 1980 to mid-1981 in the western or Nadrau swarm Because only the southshyeastern Viti Levu stations were operating at the time the swarm earthquake
depths in this area are poorly constrained they appear to correspond to those observed within the seismic network that is generally limited to the upper 20 km of crust (cross section CC Figure 26) A small number of deeper events are located in this area but these too probably remain
within the thickened crust beneath the axis of Viti Levu The swarm
70
included three events with magnitudes ML gt 3 The cause of the swarm is
unclear but it is located on the western flank of the large central uplift
at the core of Viti Levu Adjacent to the Nadrau Plateau is a broad upland
basin the Mbukuya-Nandrungu basin According to Dickenson (1972) this
heavily dissected inland valley of Pliocene age was rapidly deformed from a
gently graded concave stream valley to a convex plateau surface at 300-500 m
above sea level this uplifted valley surface has been deeply incised by
modern streams whose floors are 50-150 m below the plateau surface
Because of their posicion outside the seismic network focal mechanism
solutions for individual events are not available however a composite focal
mechanism for the Nadrau swarm indicates east-west extension but is comshy
patible with either a dip-slip (pure normal faulting) or strike-slip
solution In either case the direction of extension is compatible with the
regional direction of extension inferred from strike-slip focal mechanisms
in the North Fiji and Lau basins (Hamburger 1986) The crustal flexure
induced by the rapid domal uplift that is peculiar to central Viti Levu is
also likely to result in localized extensional stresses
The second concentration of activity in central Viti Levu is the
Monasavu swarm positioned atop the central uplift of Viti Levu (Figure 24)
This earthquake sequence presents a strong case for reservoir-induced
seismic activity The earthquakes also occur at crustal depths those well
constrained by the nearby Monasavu seismic station are shown to occur in the
upper 4 km of crust (cross section DD Figure 26) adjarent to the Monasavu
Reservoir The Monasavu Dam is an 82-meter high earthfiil dam on the Nanuku
Creek which impounds 133 x 106 metric tons of water it is designed to
provide hydroelectric power for the island of Viti Levu The dam is the
71
largest public works project in the countrys history and represents the
major critical structure from the standpoint of seismic risk Earthquakes
within Viti Levu were unknown during the planning for the project but a
subsequent historical study (Everingham 1983a) has uncovered at least one
major event during the last century of a size that could affect the dams
structure The dam was completed in April 1982 and rapidly filled to its
operating volume by February 1983 Three felt earthquakes shook the damsite
as the water first approached its spill level when the water weight in the
reservoir increased most rapidly (J Campbell pers comm 1984) The
three shocks of magnitude 33 27 and 28 were part of a sequence
including 14 recorded events several of the events were strongly felt in
the surrounding villages (Everingham 1983d) Each of the swarm
mainshocks triggered a strong-motion accelerograph atop the dam producing
peak accelerations of 013 g 007 g and 004 g all on the north-south
component of the accelerograph (Figure 27) A nearby accelerograph posishy
tioned on bedrock adjacent to the dam went untriggered demonstrating
considerable amplification of ground acceleration by the dam structure The
accelerograms are all extremely similar in character with large monoshy
frequency oscillations on the north-south component clearly shown by a
sharp peak in the Fourier amplitude spectra at a period of 02 sec
(Figure 28) This component is oriented transverse to the dams structure
and indicates probable resonant oscillation of the dam as a whole
The limited number of stations operating at the time of the swarm did
not permit very accurate locations of the mainshocks However the mainshy
shocks are shallow and positioned within 5 km of the dam and the deepest
part of the reservoir
-- -- -- -- ------- ------------ ----
----------------------------- ---
- -
--- -- -- -- -------------- -- -- -- -- --
-----------------------
72
MONASAVU r
FIJI MONASAVU DAM ___
13 February 1983 09 53 003 UTC
- - - - - - - - L - - - - - - - - - - -
FIJI MONASAVU DAM 14 February 1983 12 18 416 UTC
I - - - -
WEST
FIJI MONASAVU DAM U
23 February 1983 UP 15 17 303 UTC
SOUTH
I 5 sec -
Figure 27 Accelerograms from strong-motion accelerograph operating on Monasavu Dam Viti Levu from earthquakes of 13 14 and 23 February 1983 (ML- 33 27 and 29 respectively) North-south component is transverse to the dams structure Figure is from Silverstein 1985
I F I0
0C1)F
LUJ
(M(---Utj
CJ
CL 0_
2 CE
- I shy_
Cc =3
0 a a I I i p a a I I a
70 5 10 15 20 25
FREOUENCT HZ Figure 28 Fourier amplitude spectrum of acceleration from Monasavu Dam accelerograph earthquake of 13 February 1983 North-south component transverse to dams structure Note resonance at approximately 5 Hz
73
The area is one of significant background activity evidenced by nine
events located in the reservoirs vicinity prior to impoundment and numerous
reports of felt earthquakes in the area (Everingham 1983d) Nonetheless a
case for reservoir-induced activity can be made on several grounds (1) The
coIncidence of the February 1983 swarm with the peak in reservoir water
level (2) the proximity of these and subsequent events to the deepest
portion of the reservoir (3) the recording of 270 events at the Monasavu
seismic station with S-P intervals less than about 1 second during a
17-month recording period (Stuart 1985)
The third group of earthquakes in east-central Viti Levu follows the
trend of a belt of sediments of the Upper Wainimala Group (Early-Middle
Miocene) that separates the Pliocene Ba Volcanic Group in northern Viti Levu
from the Late Miocene to Recent deposits of the Rewa Basin in southeastern
Viti Levu (Verata Sedimentary Group see Figure 8) The basin is
fault-bounded on its western edge (Rodda 1967) the lineation of epicenters
along its northern edge suggests fault control along this margin as well
8 Southeastern Viti Levu (SVL) This seismic region is densely
populated by small-magnitude events (Figures 18 and 29) within the tightly
spaced US AID seismic network (see Figure 2) Many of the events in this
zone are very small (to ML - -10) and recorded only by 3 or 4 nearest
stations The apparent concentration of activity in this area is thus to a
large degree a product of the station distribution Nonetheless a real
concentration of activity does exist in the southeastern Viti Levu area
based on several observations (1) there is a concentration of earthquakes
of ML gt 2 for which uniform coverage is available for the entirety of Viti
Levu (Figure 15) (2) several earthquakes were located in this area by the
74
181
jS 0 711E) 0 0
186shy
178 E 1787
Figure 29 Map of earthquakes in southeastern Viti Levu Topographybathymetry faults and symbols as in Figure 24
74 a
tripartite network during 1965-1969 whereas the remainder of Viti Levu
appears to be altogether aseismic (Figure 11) (3) a peak in S-P intervals
was observed at times of 1-4 seconds at station Vunikawai corresponding to
earthquakes in the SVL zone (Sykes et al 1969) (4) several felt earthshy
quakes have originated in this portion of Viti Levu including the destrucshy
tive 1953 Suva earthquake (Houtz 1962ab Everingham 1983a 1984) Earthshy
quakes occur both on- and offshore southeastern Viti Levu They are concenshy
trated near the coast in the area extending from Suva to Navua that was
most severely affected by the 1953 Suva earthquake (Houtz 1962a) The
Houtz (1962a) H location of the 1953 mainshock based on macroseismic
data submarine cable breakage and tsunami traveltimes is directly within
the dense nest of activity offshore Viti Levu (Figure 29) The teleseismic
location by Sykes et al (1969) S is significantly offset from the main
zone of activity Based on Houtzs field observations and the microearthshy
quake activity recorded by the telemetered network the Houtz location is
accepted as the best estimate of the earthquake epicenter Houtz proposed a
normal (33 km) focal depth for the Suva earthquake while Sykes et al found
a 21 km depth The shallower depth is supported by the distribution of
earthquakes offshore Viti Levu and by the character of the P-waveform
recorded on long-period instrumeits at teleseismic distances Cross section
HH (Figure 31) shows that earthquake depths in the area like those within
Viti Levu are limited to the upper 22 km the best constrained events are
limited to the upper 15 km of crust The Suva earthquake is likely to have
occurred at a similar midcrustal depth this is also suggested by the
limited area from which maximum intensities were reported
75
o 0 C B E
18 1 E 1787 Vo s d oe i
Figure30 Map showing ~lcation Vitigt rces ahdlns
of crs etosEwihnsuhatr 0eun hdn eoeae nlddi
cross se1ins crs e sci 1
76 FE FE
0 0
5-o q o qo
o o obull7 o c o oo
0
T Vo Wq
15 V4 S0
C20 C 4
20- 0Io 10 o
25shy
30 IS 0-10 20 30 40 50
20
G G 0
25
bull I
o 301 LC 0 5 to 15 20 25
10 H H
o 0o10- c c qC
202
253
300 I 30 I- I0 5 10 15 20 25 0 10 20 30 40
J j 0 iI l i
0
bull o o
C o0Cc c b
o 4B
15- oC o o
0 5 1 5 20 25 30
Figure 31 Gross sections E-J within southeastern Viti Levu Locationsshown in Figure 30 Symbols as in Figure 24 No vertical exaggeration Note that scales vary from section to section
77 The well located events offshore Viti Levu fall into three groups two
north-trending belts of activity (near 178250 E and 17835degE) offset by an
east-trending segment near 183degS The epicentral pattern is suggestive of
small fault segments within a broad complex zone of deformation offshore
Viti Levu The north-south trends are close to the strike of a series of
submarine canyons that cut the shelf of Viti Levu as well as to important
structural trends in south-central Viti Levu (Houtz 1959) A subtle change
in actiriry occurs near the coast (cross section JJ Figure 31) where
activity wiuely distributed thrccent-haut the crust gives way to discrete nests
of fault-related activity within Viti Levu
On land the southeastern Viti Levu seismicity is located within an area
of faulting which disrupts the Oligocene to Pliocene strata exposed in the
southeastern portion of the island In only one case has an upper age limit
been placed on faulting in this area by the presence of a Miocene intrusion
post-dating the tectonism In all other cases faulting may have continued
into the Quaternary (P Rodda personal communication 1984) While
Tertiary faulting is documented elsewhere in Viti Levu faulting is particushy
larly evident in this portion of the island (Rodda and Band 1966) The
association with active shallow seismicity suggests that renewed (or conshy
tinuing) movement along these faults in southeastern Viti Levu is accomshy
modating the present stress system of the Fiji region That this portion of
Fiji is presently deforming is also corroborated by geodetic observations in
southeastern Viti Levu Berryman (1981) used retriangulation of six benchshy
marks in southeastern Viti Levu and one on Beqa Island to analyze shear
strain within the southeastern Viti Levu seismic zone Only by omitting the
Beqa benchmark and one of the Viti Levu benchmarks could a consistent strain
78
pattern be resolved With this correction Berryman determined a shear
strain rate of 06 pradyr accumulated over the period 1909-1980 The
direction of maximum compression determined was nearly east-west in
contrast with the east-west extension determined from focal mechanism
solutions However the area from which the data are taken (within southshy
eastern Viti Levu) is within the area strongly affected by the 1953 earthshy
quake Thus the deformation may be dominated by the coseismic movement
rather than continuously accumulating coseismic strain In any case the
data do suggest that significant hoLzontal deformation is taking place in
an area coinciding with the southeastern Viti Levu seismic zone
The earthquakes occur in discrete clusters within the seismic zone
Two densely populated centers of activity are located in southern Viti Levu
they are tightly clustered in space and time The Waidina swarm near
180-S 17825-E is characterized by low magnitude activity
(-09 _lt ML lt 29) occurring within a six-month period from late 1979 to
early 1980 In cross section (EE and FF Figure 31) the well located
earthquakes define a narrow cylindrical zone less than 15 km in width
extending from 3 to 14 km depth The swarm coincides with the eastern
termination of a major east-striking fault the Nakasu Fault (Colley
1976) which paralls the southern boundary of the large Middle Miocene
Wainivalu stock (Whelan et al 1985) At its eastern end the fault
terminates at a small intrusive body located along the western flank of the
Medrausucu Range Based on field observations this Miocene intrusion is
thought to post-date activity along the fault (P Rodda personal communicashy
tion 1984) in fact the high activity along its margin suggests a concenshy
79
tration of stress where movement along an active fault is limited by the
presence of this intrusion
The second major swarm in southeastern Viti Levu is the Waimanu swarm
located near 1815degS 17825degE The swarm had a magnitude range similar to
the Waidina swarm and was also clustered in time In cross section (G
JJ Figure 31) the well located events originate from a small volume
located at depths of 10-12 km The swarm is located along a 10 km-long
near-vertical normal fault that offsets a gabbro stock of probable Colo
(Middle Miocene) age (Band 1968) The northeast trend of the fault coincishy
des with that of a series of important post-Colo normal faults The trend
is also close to that defined by the new mechanism for the Suva earthquake
and indicates probable reactivation in a strike-slip sense
A secondary concentration of activity is observed along the
Wainivakidau Fault another of the northeast-striking faults that deform the
late Tertiary rocks of southeastern Viti Levu The sense of throw on this
fault is similar to that observed near the Waimanu swarm Earthquakes along
the fault are concentrated at midcrustal depths (cross section EE
Figure 31)
Earthquake Focal Mechanisms
Only a limited amount of information is available on the state of
stress and the nature of faulting within the Fiji Platform As described by
Hamburger and Isacks (1985) and Hanburger (1986) earthquakes in the intershy
arc region describe two basic fields of stress one associated with the
Fiji Fracture Zone characterized by strike-slip faulting along east- to
northeast-striking fault planes and a second found throughout the Lau
80
Basin and the eastern North Fiji Basin characterized by east-west extenshy
sion along northeast- and northwest-oriented strike-slip faults
The two teleseismic mechanisms within the platform are for the 1979
Taveuni earthquake (Figure 2i) and for the 1953 Suva earthquake (Figure 32)
The Taveuni earthquake revealed a mechanism of strike-slip faulting similar
to but rotated slightly from the mechanisms along the fracture zone
It is discussed in greater detail in the presentation of the Taveuni
earthquake
The Suva earthquake is important not only because of its destructive
effects but also because of its distance from the FFZ it reflects the
stress field within the interior of the Fiji Platform This earthquake will
thus shed light on the causes and the potential for large intraplate events
within the platform A mechanism -or this event was obtained by Hodgson
(1956) but is considered unreliable because of his reliance on reported
first motions use of reported motions for reflected phases (PP pP pP
PcP etc) and uncritical mixing of short- and long-period observations
In the case of the Suva earthquake the contradictory first motion reports
from stations within the western US and Europe forced him to fit a plane
through these fields Our analysis indicates that both areas are characshy
terized by dila-ional first motions significantly altering the earthquakes
focal mechanism
Analysis of the Suva earthquake is difficult because of the paucity of
high sensitivity long-period seismographs as well as the uneven
geographical distribution of stations In order to evaluate the focal
mechanism all available seismograms were gathered from stations cperating
at the time Intermediate- or long-period records were obtained from New
81
N
Qo
00
S
Figure 32 Focal mechanism for the 1953 Suva earthquake Equal-areaprojection of the lower hemisphere of the focal sphere Large open and filled circles represent clear dilatational and compressional first motions respectively from long-period instruments Moderate-sized circles are fom intermediate- or short-period instruments Small circles are less reliable first motions Small + and - symbols are reported first motions from Hodgson (1956) Solid lines show orientation of S-wave polarizations P- and T-axes as in Figure 21
82 Zealand Australia Japan the western US the eastern USSR and Europe
Short-period records were also examined but given less weight than reliable
long-period first motions S-wave polarizations were available only from
three short-period stations in Japan the eastern USSR and Indonesia but
were of considerable help in constraining the fault planes The best-fit
solution shown in Figure 32 indicates strike-slip faulting with a signishy
ficant but not very well constrained dip-slip component The east-west
extension shown by the position of the T-axis as well as the northwest and
northeast strikes of the nodal planes are remarkably similar to those
observed in the neighboring Lau and North Fiji basins While one mechanism
is not necessarily representative of the entire stress field in the platshy
form this earthquake demonstrates that a major part of the contemporary
deformation in the platform takes place by strike-slip faulting in response
to extensional stresses
Houtz (1962a) favored a northwesterly-striking fault plane for the Suva
earthquake based on the orientation of submarine canyons offshore southern
Viti Levu In fact the canyons strike in a north to north-northeast
direction (Houtz 1959) which parallels neither of the fault planes
Several major structural features cortenad the interpretation of the
northeast-striking fault plane (1) the Suva Peninsula (Figure 29) forms a
major northeast-trending promontory along the coast it is composed of
uplifted Pliocene marine sediments of the Medrausucu Group (Suva Marl Rodda
et al 1985) The western edge of the peninsula defines the deep-water
Suva Harbor dropping to over 20 m depth within 300 m from shore The edge
of the peninsula is marked by parallel lineaments recognized in airpilotos
and the sediments in the harbor are sharply truncated against the peninsula
83
suggesting active faulting along the basin edge (G Shorten personal
communication 1984) (2) the northeast trends are also important in the
faulting observed in southeastern Viti Levu (Band 1968 Figure 29) (3) a
major northeast-striking structural fabric is reflected in the unusual
submarine morphology near Beqa Island south of Viti Levu The barrier reef
has a pronounced nortneast-striking linear trend as does the scarp that
defines the Kadavu Passage to the south (Figure 29) (4) a major structural
high termed the Beqa-Vatulele Lineament separates the deep Suva and
Baravi sedimentary basins offshore southern Viti Levu (Brocher and Holmes
1985) This northeast-trending feature is marked by strong gravity and
magnetic anomalies (5) the overall trend of the seismicity offshore Viti
Levu is suggestive of a northeast-striking zone From the foregoing the
northeast-striking sinistral shear fault of the Suva earthquake focal
mechanism is chosen
Earthquakes located by he telemetered network provide additional
information on intraplate deformation in the platform The small number of
stations that record the microearthquakes in southeastern Viti Levu limits
the quality on individual focal mechanism solutions The first-motion
directions recorded on the network stations constrain but do not uniquely
determine earthquake fault planes Most events can be satisfied by a range
of solutions from pure strike-slip to nearly pure dip-slip Upper hemishy
sphere projections for six events in southeastern Viti Levu are shown in
Figure 33 with both strike-slip and dip-slip solutions where possible
Because of the dominance of strike-slip faulting throughout the region we
have chosen the strike-slip solution as primary However the first-motion
data alone do not demand this
84
A commonality to the southeastern Viti Levu focal mechanisms is docushy
mented in Figure 34 The earthquakes T-axes whether for strike-slip or
dip-slip mechanisms are dominated by an east-west orientation Similarly
the P-axes are generally oriented north-south The pattern of stress
orientation is very close to that observed in the 1953 Suva earthquake
(shown by the letters P and T in Figure 34) and coincides with the
stress field in the North Fiji and Lau basins
The focal mechanism for the 1953 earthquake is corroborated by a
composite focal mechanism for events located immediately offshore Viti Levu
shown in Figure 35 The first-motions for these events are consistent with
a strike-slip mechanism with fault planes oriented parallel to the fault
planes determined from the Suva earthquake A normal faulting solution is
equally possible (dashed lines in Figure 35) In either case the east-west
T-axis coincides with the regional direction of principal extension
The stress orientations within the Fiji Platform demonstrate that the
platform is not isolated in a plate tectonic sense from the interaction of
microplates along its boundaries The seismic deformation in the back-arc
basins east and west of Fiji is dominated by the east-west growth of the
interarc region Hamburger (1986) showed that this extension takes place
through strike-slip faulting along northeast- and northwest-trending fault
planes The same process is taking place in Fiji This former arc terrane
once deformed by major compressive stresses is now being extended by
ductile thinning of the lithosphere by creation of new oceanic crust around
its edges and by major strike-slip faulting both surrounding and within the
platform
85
N N
-_ o P
0 amp 7912-7 0618 80419 1921
073178-147 18 71 178-147
2 S
80619 1430 8600
Figure3m 33 Ffor et a18k27 178it152
o IT
0712 0222 84312 0041 deg D18 f 73 17 8deg013 9 163 17802511
Figure 33 Focal mechanisms for earthquakes in southeastern Viti LevL based on data obtained from the telemetered network Upper hemisphereprojections Syrrols as in Figure 21 Both strike-slip (solid lines) anddip-slip (dashed lines) solutions are compatible with first motion directions
86
N
0 00
0
00
T PS Strike-Slip S 0
Dip- Slip 0
Figure 34 Summary of P- and T-aes from network focal mechanisms shown on upper hemisphere projection P- and T-axes of the 1953 Suva earthquakeare given for comparison at base of letters P and T
87
0
0 0
0 0 0
0 P 0 0bull 0T
S
Figure 35 Composite focal mechanism for earthquakes located immediatelyoffshore Viti Levu Symbols as in Figure 21 lower hemisphere projectionBoth strike-slip (solid lines) and dip-slip (dashed lines) solutions arecompatible with first motion directions Large and small letters P and T represent P- and T-axes for strike-slip and dip-slip solutionsrespectively
88
CONCLUSIONS
Our seismicity studies in Fiji have led to several significant new
conclusions that bear directly on the earthquake hazard to Fijis populashy
tion
(1) Major earthquake zones are located along the edges of the Fiji
Platform where deformation is concentrated These zones are continuously
active at moderate magnitudes (ML 3-5) The seismic regime along one of
these zones (the Fiji Fracture Zone) varies as a function of the zones
orientation relative to the plate motion directions
(2) Secondary earthquake zones are located within the Fiji Platform
Large earthquakes occur more sporadically separated by long periods of
quiescence Many of these zones are active at low magnitudes (ML lt 3)
(3) Earthquake depths are shallow concentrated in the upper 18 km of
Fijis crust The distribution is similar to that in other areas of extenshy
sion and strike-slip deformation
(4) Earthquake magnitudes in the Fiji region have all been less than
71 Despite the large rates of relative plate motion in the area the thin
lithosphere may be incapable of storing large stresses to generate great
earthquakes (Ms gt 78)
(5) The large 1953 Suva earthquake occurred at 182degS 1783degE
(Houtzs location) at crustal depths by strike-slip faulting The stress
orientation from the focal mechanism is similar to that observed in the
North Fiji and Lau basins indicating that the platform is not isolated from
the regional tectonic stresses The nodal plane striking NSO0 E is chosen as
the probable fault plane
89
(6) Microearthquakes in Viti Levu occur as a result of extensional
stresses similar to those determined from the Suva earthquake
(7) Earthquakes in central Viti Levu may be related to the rapid
doming of the island A group of events near Monasavu Reservoir were
induced by rapid filling of a large artificial lake in the interior of the
island
(8) Earthquakes in southeastern Viti Levu occur in discrete nests that
are tightly clustered in space and time They are related to a series of
near-vertical east to northeast-striking faults that cut the Mio-Pliocene
rocks of southeastern Viti Levu
These empirical observations combined with the our regional studies of
the Southwest Pacific described by Hamburger (1986) permit several imporshy
tant tectonic conclusions to be drawn
(1) Fiji is part of a large shear system connecting the Tonga and New
Hebrides arcs extension is taking place throughout the region along short
irregular spreading centers and leaky transform faults involving both
strike-slip and extensional deformation
(2) While convergence appears to have taken place along the Hunter
Fracture Zone in the past there is no evidence for present-day convergence
Rather this plate boundary appears to be reactivated by extensional or
strike-slip deformation of the upper plate
(3) The Fiji Platform is rotating in a clockwise sense relative to
the tectonic blocks that form its northern western and southern boundshy
aries This rotation is interpreted as P relatively stable block resisting
more rapid counterclockwise rotational shear of the surrounding matrix
(4) The extension that produced the deep basins west of Viti Levu has
90
been replaced by strike-slip faulting that follows the basins strike
(5) Major iniraplate earthquakes occur throughout the southern Fiji
Platform but at longer recurrence intervals than the interplate events
that surround the platform
ASSESSMENT OF EARTHQUAKE HAZARD
Earthquake Recurrence Intervals
Evaluation of the recurrence history of a particular region can be
investigated using (1) teleseismically recorded instrumental history of
earthquakes (2) recu-rence relations of smaller earthquakes recorded by
seismograph networks (3) pre-instrumental historical records of large
earthquakes and (4) evidence of prehistoric large earthquakes observable in
the geological record
Instrumental historical records exist from the late 19th century to the
present as indicated elsewhere in this report From this data set shown in
Figure 9 it is evident that the recurrence intervals along even the most
active seismic belts surrounding the Fiji Islands exceed the historical
records Thus the repetition of events along say the Fiji Fracture Zone
cannot be resolved Nonetheless the data do help constrain the overall
recurrence of large earthquakes in the entire Fiji region This problem is
addressed by the frequency-magnitude relation observed by Everingham (1983c)
for the period 1918-1960 as shown in Figure 36 This period of observation
suggests that earthquakes of magnitude Ms 7 or greater occur= at the rate
of 48 eventsl0O yrs (or every 21 years) while earthquakes of magnitude
65 or greater occur at the rate of 429 events100 yrs or every 2 12
years A similar relation was obtained from network studies by Hamburger
(1986) and is shown in Figure 15 This magnitude-frequency relation sugshy
91
I I I
000
z
Z-10
w
D z~1o
Ushy
w L10
0 b=0 50
b=097
()0111
-1
I SOOO 1900-1973
5 6 MAGNITUDE M
IS
7 8
b16
50 I I
60 A
MAGNITUDE MS
70
Figure 36 Magnitude frequency plot for all earthquakes in the Fijiregion 1918-1960 (from Everingham 1983c)
92
gests recurrence of magnitude ML - 7 or greater at the rate of 65
eventsl0O years or every 15 years Magnitude 65 earthquakes according
to this relation would be expected at a rate of 162 eventsl00 years or
every 6 years In view of the differences in time sampled magnitude scale
used and area included in the two studies the agreement is remarkably
good The studies indicate that large potentially destructive earthquakes
are expected to occur in the Fiji region within the lifetime of critical
engineering structures
Earthquake Potential
An estimate of the maximum potential earthquake in this area has been
considered by Everingham (1983c) and is shown graphically in Figure 37 In
compiling this graph Everingham computed annual energy release based on a
magnitude-energy reiation for the period 1918-1982 The avcrage rate of
energy release for the region is equivalent to that produced by a single
yearly earthquake with magnitude Ms - 65 However the rate of energy
release is not constant and is marked by periods of activity and
quiescence The range of energy release is shown by the two dashed lines in
Figure 37 and the maximum likely energy release may be expected to fall
within the bounding curve Should this energy release be concentrated in a
single large event its magnitude would be approximately 75 This is
slightly larger than the maximum observed historical event in Fiji but is a
realistic design earthquake for the most active zones surrounding the Fiji
Islands From this relation Everingham also noted a 30-year cyclicity to
the energy release in Fiji Periods of high activity occurred in 1923-32
and 1952-60 A third period of high activity may be expected in the coming
93
- I
-2 -
m -
0
L1
3400 60 70 19
Figure 37 Cumulative energy release in the Fiji region 1918-1982 (fromEveringham 1983c)
94 few years terminating a relatively quiescent period for the period
1961-1982
Clearly the earthquake potential is not uniform throughout the Fiji
region Historically large earthquakes have concentrated in zones surshy
rounding the Fiji Platform with isolated large events occurring within the
platform itself In Figure 38 we separate the Fiji region into zones of
seismic potential based on the available seismicity data summarized in the
previous section
Zone I (Fiji Fracture Zone Taveuni-northeast Vanua Levu region West
Viti Levu zone western Lau Basin) This seisinic region is characterized by
high levels of seismicity on all time and magnitude scales (Figures 9 10
11 17 18) These belts apparently accommodate a large portion of the
PacificJndo-Australian plate motion The largest recorded earthquake in
this belt was a magnitude 71 event that occurred northeast of Vanua Levu in
1949 Considering the history of earthquake energy release discussed above
a conservative estimate of Mmax along these active zones is Mmax - 75
Zone II (Kadavu region Hunter Fracture Zone Baravi and Suva Basins
Koro Sea) this area is one of moderately high seismic potential with a
history of occasional large earthquakes separated by long periods of
quiescence This zone includes large events near Kadavu in 1850 1950 and
1963 the 1932 Koro earthquake and the 1953 Suva quake The largest of
these events was the magnitude 67 Suva earthquake This zone has been much
less active at moderate magnitudes than zone I (Figures 10 11 18) but is
clearly capable of large and potentially destructive events We have
included southern and eastern Vanua Levu in zone II based on evidence for
small-magnitude activity near southern Vanua Levu (Figure 18) structural
95
15
PCJi iii~l~ii~i~rIN
16
177
200
I N - s
2 1 ____
176 E 177 178 179 180 179 W 178
Figure 38 Seismic zoning of the Fiji region See text for discussion
95a disruption of the CaukandroveNatewa Bay region (Green and Cullen 1973) and
the confluence of the Hunter Fracture Zone with the Fiji Platform A
reasonable maximum design earthquake for this zone is Mmax - 70 A larger
event is possible but is considered less likely here based on the hisshy
torical record of seismicity in this zone
Zone III (central and eastern Viti Levu Ovalau Island Vatu-Ira
Channel this zone is characterized by far lower activity than zones I and
II with the exception of a single destructive event in the mid-nineteenth
century (Figure 9) is virtually devoid of historical activity However
low-magnitude activity is common in this region (Figures 17 18)
Reservoir-induced activity at Monasavu Reservoir in central Viti Levu
attests to significant tectonic stress accumulation in that area The
maximum probable earthquake for this zone is Mmax - 65
Zone IV (northern and western Viti Levu Bligh Water Basin northern
Vanua Levu South Fiji Basin Lau Ridge) these areas have been virtually
devoid of seismic activity on all time scales Isolated microearthquakes
have occurred in this zone but no significant activity has been observed
These areas represent the most stable blocks within the broad
PacificIndo-Australian plate boundary and are not expected to generate
significant activity in the future Nonetheless because of its proximity to
the active zones of deformation earthquakes to magnitude Mmax shy 60 should
be considered possible for this area
Macroseismic Effects of Large Earthquakes
Expected values of strong ground motion are of prime engineering
interest However even if the recurrence interval of large earthquakes
near Fiji were reliably forec-ast a major difficulty arises in trying to
96 translate earthquake size into actual values of ground motion at a partishycular site To date amp relatively large number of strong-motion acceleroshygrams have been generated in the far field of large earthquakes especially in California and Japan The difficulty in using magnitude-acceleration
relations developed elsewhere lies in the extreme variability in attenuation of ground acceleration in various geologic environments (eg Hays 1980) The absence of ground acceleration data for Fiji makes direct predictions of structural effects of earthquakes difficult Hopefully the presence of strong-motion accelerographs distributed throughout Fiji (Figure 3) will
change this situation over the coming decades
Until that time we are altogether reliant on observations of intensity of ground shaking That is the large historical events in Fiji have been studied by their effects on cultural features (ie houses) rather than near-field seismological observations (ie strong-motion accelerograms) The magnitude-intensity relations observed for Fiji may then be used to predict the distribution of intensities that may be expected from large earthquakes along the major seismic zones close to the Fiji Islands (Figure 38) In some cases the predicted intensities can be translated (under rather questionable assumptions) to peak ground accelerations from intensity-acceleration relations obtained elsewhere (eg Hays 1980) For this study we have used only intensities to avoid the added complication of
intensity-acceleration conversion
Everingham (1984) has summarized the available information on observed intensities in Fiji based on six moderate to large events during this century Modified Mercalli intensities observed in Fiji as a function of magnitude and epicentral distance are shown in Figure 39 These relations
97
MS7
DEPTH 20KM
6 0
w
z 4
1979 MS 6-9 bull _
GO 0 53 675 x
3- X 19 69 0 75 52
DISTANCE KM
Figure 39 Earthquake intensities (Modified Mercalli Index) observed inFiji as a function of magnitude and epicentral distance (fromt gveringham1984)
98 were used to compute maximum intensities generated by design earthquakes
located along each of the seismic zones defined in the previous segment
These predicted maximum intensities given for population centers in Viti Levu and Vanua Levu and several of the outer islands are shown in Table 1 These predictions provide a basis for conservative engineering planning
and civil defense decisions that pertain to development in Fiji
Several important caveats however should be taken into consideration
in using these maximum intensities
(1) they are only estimates based on extrapolations from the brief
historical record of earthquakes in Fiji The design earthquakes for each
seismic zone are considered to be realistic upper bounds on the magnitudes
expected there However anomalous unpredictLd earLiiatiRkes tat exceed
that size are conceivable occurrences
(2) the estimates contain no information on recurrence of intensities
Thus the recurrence of a given intensity may be much higher for one site than another site depending on the return time for large earthquakes on the
neighboring seismic zones as well as the substrate of each site
(3) the estimates are based on far-field effects of earthquakes
Information on near-field effects of even moderate events in Fiji are
scanty and highly unpredictable Thus a magnitude 5 event directly
beneath a city may produce extremely high intensities in a very restricted
area close to the epicenter
Tsunami Hazard
In addition to the direct damage from groun shaking in the vicinity of
an earthquake large earthquakes in the southwest Pacific have been shown to cause considerable damage at both regional and global distances by
99
Table 1 Predicted maximum intensities of ground shaking (Modified Mercalli Index) generated by maximum probable earthquakes along the seismic zones shown in Figure 37
Zone I Zone II Zone III Zone IV Location Mmax - 75 Mmax shy 70 Mmax shy 65 Mmax shy 60
Suva 5-6 8-9 8 4-5 Lautoka 67 7 7-8 7 Nadi 6-7 8 7-8 7 Monasavu 6 8 8 6 Ba 6-7 6-7 7-8 7 Sigatoka 6 8-9 8 6-7 Labasa 8 8-9 6 7 Savusavu 8 8-9 6-7 6-7 Ovalau 6 8 8 4-5 Koro 7-8 8-9 6 4-5 Kadavu 5-6 8-9 5 3-4 Lakeb-a 6 5 3-4 7 Yasawa Group 9 6-7 5-6 7 Taveuni 9-10 8-9 5 6-7
100
earthquake-generated tsunamis Tsunamis (seismic sea waves) are caused by
displacements in submarine copography that are induced by earthquakes andor
volcanic activity occurring below or near the floor of the ocean Low-lying
areas near the coast are particularly vulnerable to damage by these waves
The shallow seismic zones of the Southwest Pacific have a history of
earthquakes-generated tsunamis (Figure 40) A few tsunamis have originated
in the Fiji region Two significant tsunamis occurred in 1881 and 1953 the
latter was associated with the 1953 Suva earthquake A smaller event
located southwest of Suva in 1975 generated a very small sea wave
(Everingham 1983b) Major Pacific-wide tsunamis such as those generated
along the South American or Alaskan plate margins apparently are not
generated near Fiji Significant local tsunamis however may be associated
with large shallow earthquakes in the immediate vicinity The potential for
tsunamis is of particular importance in view of the concentration of popushy
lation anamp development in low-lying coastal areas of Fiji
A tsunami education program for the residents of Fiji is recommended
(Appendix IV contains a listing of safety rules from the National Oceanic
and Atmospheric Administration (NOAA) which operates the Pacific tsunami
warning system in Hawaii USA)
Volcanic Hazard
Quaternary volcanic activity is far less prevalent in Fiji than elseshy
where in the Southwest Pacific Volcanism less than 2 million years old has
been reported in only six localities in Fiji (Naigani Kadavu Koro Moala
Mago and Taveuni Islands see Rodda and Kroenke 1984) There is no
historical record of volcanic activity in Fiji However Frost (1974)
reported evidence for a prehistoric eruption on Taveuni Island dated at
101
10 I1i
1967
-980
amp) C32
0
St 1905-11
15
1881 g1917
20
1878(2) 2 0 12 O~~
1976
Fiji
1953
1975 j
-
0
1977
~19 15 18 5
0- l948
~~853
000 1977
25 -r 0 198
0 00
1977
30
165deg 170 E 175 180
1917(2)
1976
W
0 0 200 400 Kilometers
175 170
Figure 40 Tsunami history of the Southwest Pacific Filled circles indicate locations of tsunamigenic events dashed circles indicate inferred locations of tsunamigenic events
102 2050 plusmn 150 years before present based on carbon dating Elsewhere there
is no evidence for volcanic activity younger than 250000 years and thus
volcanic activity presents little threat to the inhabitants of those
islands The recent activity on Taveuni warrants seismic monitoring in the
future
Eruptions elsewhere in the Pacific can also have significant effects on
Fiji The submarine eruptions at Home Reef Tonga during March 1984 proshy
duced large quantities of pumice which subsequently rafted across vast
areas of the Southwest Pacific The floating pumice piled ashore locally
and resulted in serious problems with shipping in the region (SEAN Bulletin
1984)
IMPLICATIONS FOR MITIGATION OF EARTHQUAKE RISK
Several significant steps may be taken that will significantly mitigate
the loss of life and property from future earthquakes in Fiji The
following five paragraphs provide suggestions for mitigation of the earthshy
quake risk
Earthquake Education
First an earthquake education program in Fiji should be strongly
encouraged At minimal cost to the Government such a program may be
mounted through the schools Red Cross programs and through the news media
In other countries earthquake education programs have taught simple methods
of strengthening house construction and minimizing hazardous conditions
within the home they have warned of tsunami hazards to coastal dwellers
they have instructed on proper behavior during an earthquake they have
helped to encourage storage of emergency food water and equipment in many
103
households and importantly they have helped avoid panic during an earthshy
quake and stimulated cooperation with government officials following such a
disaster Earthquake education programs are effectively combined with other
disaster preparedness programs (eg cyclones floods and so on)
Building Codes
Second adoption of stringent building codes for all of Fiji is impershy
ative The experience of the 1953 Suva earthquake (Houtz 1962a) demonshy
strates the severe effects of a moderate-sized earthquake near the capital
There is a very real danger of a larger earthquake occurring very close to
Suva the effects of such an event would be multiplied by the increased
development since 1953 In general the adequacy of construction is a major
factcr controlling the damage and loss of life brought on by such an earthshy
quake Building codes designed for areas of similar earthquake hazard such
as New Zealand Code A California Building Codes or Papua New Guinea
Codes 1 or 2 may be appropriate for the portions of Fiji at greatest risk
Certainly New Zealand Code B should be mandated for all public edifices
in Fiji Observation of such codes is most crucial for public multistory
buildings in the major towns of Viti Levu and Vanua Levu As important as
the design of such buildings is the construction methods and quality of
construction material used to implement building design Careful monitoring
of construction by competent engineers is important for critical facilities
Emergency Civil Defense Procedures
Third specific Civil Defense plans for emergency procedures following
an earthquake or tsunami should be developed Of course earthquake preshy
paredness plans have much in common with hurricane or other natural disaster
104
planning that has been implemented in Fiji but specific effects of earthshy
quake occurrence must be considered structural damage to multistory
buildings interruption of water supply disruption of electrical and gas
lines secondary geological effects such as ground liquefaction or landshy
slides in the near-source region complicating effects of aftershocks in the
days and weeks following a major earthquake The primary structure for such
civil defense plans already is in place in Fiji Programs specific to the
earthquake hazard may be added following similar programs in Papua New
Guinea and New Zealand
Long-term Seismicitv Observations
Fourth long-term seismicity and strong motion observations should be
continued and supported by both the Fiji government and overseas aid proshy
grams In the long-term such information will help to refine estimates of
seismic potential along the plate boundaries that surround Fiji they will
help to more directly and accurately assess the ground motion parameters of
direct concern to engineers for building design in Fiji--ground accelershy
ation frequency spectra horizontal and vertical components of ground
motion local amplification effects and so on Furthermore seismicity
patterns may provide a key to long-term forecasting and short-term predicshy
tion of the location and size of future earthquakes that may affect Fijis
population
International Cooperation
Fifth international cooperation among the island countries of the
Southwest Pacific may significantly help in Fijis earthquake preparedness
program All of the countries affected by earthquakes (Tonga Western
105
Samoa Fiji Vanuatu Solomon Islands Papua New Guinea and New Zealand)
have to varying degrees developed earthquake preparedness programs Fiji
may take advantage of the previous current and any future efforts of the
other countries in the region
106
REFERENCES
Band R B Geology of southern Viti Levu and Mbengga Bull Geol Surv Fii 15 1968
Barazangi M and B L Isacks Lateral variations of seismic waveattenuation in the upper mantle above the inclined zone of the Tonga island arc Deep anomaly in the upper mantle J Geophys Res 76 8493-8516 1971
Berryman K Seismotectonic zoning stud of the Fiji Islands EarthDeformation Section Report 70 Wellington NZ DSIR 40 pp 1979
Berryman K Retriangulation of Navua base net (across Suva-Mbenggaseismic zone) Fiji Islands August 1980 Earth Deformation Section Report Wellington NZ DSIR 26 pp 1981
Brocher T M and R Holmes The marine geology of sedimentary basinssouth of Viti Levu Fiji in Investigations of the Northern Melanesian Borderland edited by T M Brocher Circum-Pacific Council for Energy andMineral Resources Earth Science Series Tulsa Oklahoma Amer Assoc Petrol Geol pp 122-137 1985
Calder N The Restless earth A Report on the New Geology The VikingPress New York New York 1972
Carney J N and A Macfarlane Geological evidence bearing on the Miocene to Recent structural evolution of the New Hebrides Arc Tectonophysics 87 147-175 1982
Chase C G Tectonic history of the Fiji Plateau Geol Doc Amer Bull L2 3087-3110 1971
Chen W P and P Molnar Focal depths of intracontinental and intraplateearthquakes and their implications for the thermal and mechanical properties of the lithosphere J Geophys Res 88 4183-4215 1983
Circum-Pacific Council for Energy and Mineral Resources Plate tectonic mapof the circum-Pacific region southwest quadrant 110000000 Amer Assoc Petrol Geol Tulsa Oklahoma 1981
Colley H Metallogenic map of Viti Levu Min Resources Div Fiji Ma 552 1976
Corbett E J Seismicity and crustal structure studies in southernCalifornia Tectonic implications from improved earthquake locationsPhD thesis 231 pp California Institute of Technology 1984
Dickenson W R Dissected erosion surfaces in northwest Viti Levu FijiZ Geomorph N F 16 151-167 1972
107
Dickenson W R M J Rickard F I Coulson J G Smith and R L Lawrence Late Cenozoic shoshonitic lavas in northwestern Viti Levu Fiji Nature 219 148 1968
Draunidalo K B and M W Hamburger Seismicity of Fiji 1965-1969 Min Resources Dep Fiji Note BP 3014 7 pp 1984
Eden R A and R Smith Fiji as a Petroleum Prospect Suva Min Resources Dep 8 pp 1984
Everingham I B Focal mechanism for the 16 November 1979 earthquake near Taveuni Fiji Min Resources Dep Fiji Report 49 1982a
Everingham I B The 1932 Koro earthquake epicenter Mineral Resources Dep Fiji Note BP 331 14 pp 1982b
Everingham I B Reports of earthquakes felt in Fiji 1850-1940 Min Resources Dep Fiji Report 48 54 pp 1983a
Everingham I B The effects of the 16 December 1975 earthquake in Kadavu Passage Fiji Min Resources Dep Fiji Note BP337 16 pp 1983b
Everingham I B Magnitude determinations for shallow earthquakes in Fiji and their implications Min Resources Dep Fiji Rep 48 1983c
Everingham I B Preliminary report of seismic events in the Monasavu Dam area Min Resources Dep Fiji Note BP 332 14 pp 1983d
Everingham I B Provisional list of felt earthquakes reports in Fiji 1941-1981 Min Resources Dep Fiji Note BP 338 17 pp 1984
Everingham I B Focal mechanisms of earthquakes near Fiji Min Resources Dep Fiji Note 1985
Frost E L Archaeological excavations of fortified sites in Taveuni Fiji Asian Pacif Archaeol Ser Univ Hawaii 6 1974
Gill J B From island arc to oceanic islands Fiji southwestern Pacific Geology 4 122-126 1976
Gill J B Stork A L Whelan P M Volcanism accompanying back-arc basin development in the Southwest Pacific Tectonophysics 102 207-224 1984
Green D and D J Cullen The tectonic evolution of the Fiji region in The Western Pacific Island Arcs Marginal Seas Geochemistry edited byPJ Coleman Nedlands University of Western Australia Press pp 127-145 1973
Halunen A J Tectonic history of the Fiji Plateau PhD thesis 127 pp University of Hawaii Honolulu HI 1979
108
Hamburger M W Seismicity of the Fiji Islands and Tectonics of the Southwest Pacific PhD thesis 3i2 pp Cornell University Ithaca NY 1986
Hamburger M W and B L Isacks Seismicity and seismotectonic studies in the Southwest Pacific Min Resources Dep Fiji Note BP3015 50 pp 1983
Hamburger M W and Qiolevu S R The Kadavu earthquakes of July-August 1983 Min Rescurces Dep Fiji Note BP 337 15 pp 1983
Hamburger M W and B L Isacks Shallow seismicity of the North FijiBasin in Basin Formation Ridge Crest Processes and Metallogenesis in the North Fiji Basin edited by L W Kroneke and J V Eade Circum-Pacific Council for Energy and Mineral Resources Earth Science Series Tulsa Oklahoma Amer Assoc Petrol Geol in press 1986
Hamburger M W and I B Everingham Seismic and aseismic zones in the Fiji region in Proceedings of the International Symposium on Recent Crustal Movements of the Pacific Region edited by W I ReillyWellington NZ 9-14 Feb 1984 in press 1986
Hays W W Procedures for estimating earthquake ground motions US Geological Surv Prof Paper 1114 77 pp 1980
Hill D P A model for earthquake swarms J Geophys Res 82 1347-1352 1977
Hodgson J H Direction of faulting in some of the larger earthquakesof the southwest Pacific 1959-1954 Publ Dominion Observ Ottawa 18 171-216 1956
Houtz R E Submarine canyons near Suva as possible fault lineations Rep Geol Surv Fiji 51 3 pp 1959
Houtz R E The 1953 Suva earthquake and tsunami Bull Seismol Soc Amer 52 1-12 1962a
Houtz R Note on minor damage caused by the Suva earthquake of June 1961 Bull Seismol Soc Amer 52 13-16 1962b
Houtz R E and H W Wellman Turbidity current at Kandavu Passage Fiji Geol Mag 99 57-62 1962
Isacks B L L R Sykes and J Oliver Focal mechanisms of deep and shallow earthquakes in the Tonga-Kermadec region and the tectonics of island arcs Geol Soc Amer Bull 80 1443-1470 1969
109
Isacks B L R K Cardwell J L Chatelain M Barazangi J M Marthelot D Chinn and R Louat Seismicity and tectonics of the central New Hebrides island arc in Earthquake Prediction An International Review Maurice Ewing Ser edited by D W Simpson and P G Richards pp 93-116 1981
Iyer H M Geophysical evidence for the locations shapes and sizes and internal structures of magma chambers beneath regions of Quaternary volcanism Phil Trans Roy Soc Lond A310 473-510 1984
Karig D E Ridges and basins of the Tonga-Kermadec island arc system J Geophys Res 75 239-254 1970
Karig D E and G F Sharman III Subduction and accretion in trenches Geol Soc Amer Bull 86 377-389 1975
Kroenke L W C Jouannic and P Woodward Bathymetry of the Southwest Pacific Chart 1 of Geophysical Atlas of the Pacific CCOPSOPAC 1983
Lahr J C HYPOELLIPSEVAX A computer program for determining local earthquake hypocentral parameters magnitude and first-motion pattern US Geol Surv Open-File Rep 84-519 60 pp 1984
Larue B M J Y Collot A Malahoff A sedimentary structure southwest of Viti Levu Fiji The Baravi Basin in Symposium on Petroleum Potential in Island Arcs Small Ocean Basins Submerged Margins and Related Areas UN ESCAP CCOPSOPAC Tech Bull 3 Wellington NZ DSIR pp 77-83 1980
Launay J Morphologie et structure de larc insulaire des Nouvelles-Hebrides dans sa terminaison sud in Contribution a ]Etude Geodvnamigue du Sud-Ouest Pacifioue Travau et Documents de ]ORSTOM No 147 pp 163-178 1982a
Launay J Essai de schema tectonique de la terminaison sud de larc insulaire des Nouvelles-Hebrides In Contribution a 1Etude Geodynamique du Sud-Ouest Pacifique Travaux et Documents de lORSTOM No 147 pp 217-220 1982b
lee W H K and S W Stewart Principles and Applications of Microearthquake Networks New York Academic Press 292 pp 1981
Louat R Seismicite et subduction de la terminaison sud de larc insulaire des Nouvelles Hebrides in Contribution a lEtude Geodvnamique du Sud-Ouest Pacifique Travaux et documents de lORSTOM No 147 Paris ORSTOM p 179-185 1982
Maillet P and M Monzier Volcanisme et petrologie des iles Matthew et Hunter donnees preliminaires in Contribution a lEtude Geodvnamique du Sud-Ouest Pacifique Travaux et documents de lORSTOM No 147 Paris ORSTOM pp 187-216 1982
110
Malahoff A R H Feden and H S Fleming Magnetic anomalies and tectonic fabric of marginal basins north of New Zealand J Geophys Res 7 4109-4125 1982a
Minster J B and T H Jordan Present-day plate motions J Geophys Res 83 5331-5354 1978
Monzier M P Maillet J Foyo Herrera R Louat F Missegue and B Pontoise The termination of the southern New Hebrides subduction zone (southwestern Pacific) Tectonophvsics 101 177-184 1984
Nakamura K Volcanoes as possible indicators of tectonic stress orientation Principle and proposal J Volc Geoth Res 2 1-16 1977
Nakamura K K H Jacob and J N Davies Volcanoes as possibleindirators of tectonic stress orientation--Aleutians and Alaska Pure ApplGeophv 115 87-112 1977
Roca J L Essai de determination du champ de contraintes dans larchipeldes Nouvelles Hebrides Bull Soc Geol France 20 511-519 1978
Rodda P Outline of the geology of Viti Levu N Z J Geol Geophys I0 1260-1273 1967
Rodda P Fiji In Mesozoic-Cenozoic Orogenic Belts A M Spencer (ed)Spec Publ Geol Soc London 4 415-432 1974
Rodda P Geology of northern and central Viti Levu Bull Min Resources Div Fiji 3 1976
Rodda P and R B Band Geology of Viti Levu Fiji Geol Surv Map GS 432 1966
Rodda P and L W Kroenke Fiji A fragmented arc in L W Kroenke Cenozoic Tectonic Development of the Southwest Pacific UN ESCAP CCOPSOPAC Tech Bull 6 87-109 1984
Rodda P I McDougall R A Cassie D A Falvey R Todd T A Wilcoxon Isotopic ages magnetostratigraphy and biostratigraphy from the early Pliocene Suva Marl Fiji Geol Soc Amer Bull 96 529-538 1985
Sanford A R and P Einarsson Magma chambers in rifts in Continental and Oceanic Rifts Geodynamics Ser vol 8 edited by G Palmason Amer Geophys Un Washington DC pp 147-168 1982
Sclater J G and H W Menard Topography and heat flow of the Fiji Plateau Nature 216 991-993 1967
Sclater J G J W Hawkins J Mammerickx and C G Chase Crustal extension between the Tonga and Lau Ridges Petrologic and geophysical evidence Geol Soc Amer Bull 83 505-517 1972
Silverstein B Processed strong-motion records from Monasavu Dam Fiji Earthquakes of February 13 14 and 23 1983 US Geol Surv Open File Rep 85-375 85-375 1985
Smith R B and R L Bruhn Intraplate extensional tectonics of the eastern Basin-Range Inferences on structural style from seismic reflection data regional tectonics and thermal-ductile models of brittle-ductile deformation J Geophys Res 89 5733-5762 1984 Smith R and T Raicebe (comps) Bathymetric map of Fiji Multicolored scale 11000000 Suva Min Resources Dept Fiji 1984
Stuart D J Current status of the continuing investigation of seismicity in the Monasavu Dam area Viti Levu Min Resources Dep Fiji Note BP 3016 18 pp 1985
Sykes L R The seismicity and deep structure of island arcs J Geophys Res 71 p 2981-3006 1966
Sykes L R B L Isacks and J Oliver Spatial distribution of deep and shallow earthquakes of small magnitude in the Fiji-Tonga region Bull Seismol Soc Amer 59 1093-1113 1969
Taylor F W Quaternary tectonic and sea-level history of Tonga and FijiSouthwest Pacific PhD Thesis Cornell University Ithaca N Y 355 pp 1978
Turcotte D L and G Schubert Geodynamics John Wiley amp Sons New York 1982
Von Stackelberg U and Shipboard Scientific Party Hydrothermal sulfide deposits in back-arc spreading centers in the Southwest Pacific submitted to Nature 1985
Whelan P W J B Gill E Kollman R Duncan and R Drake Radiometric dating of magmatic stages in Geology and Offshore Resources of Pacific Island Arcs - Tonga Region edited by D W Scholl and T L Vallier Circum-Pacific Energy and Mineral Resources Council Am Assoc Petrol Geol Spec Publ 2 Earth Sci Ser Tulsa Oklahoma in press 1985
Woodhall D The geology of the Lau Ridge in Tonga Ridge Resource Studyand Tripartite Cruise Report edited by D S Scholl and T L Vallier Open-file Rep CCOPSOPAC Suva Fiji pp 277-300 1985a
Woodhall D Geology of Taveuni Island Min Resources Dep Fiji in prep 1985b
112
APPENDIX I DEFINITIONS
Two measures of the size of an earthquake are magnitude and intensity
Magnitude is a measure of the energy from an earthquake source to indicate the
strength of an earthquake In comparison intensity is a measure of the amount
of ground shaking caused by the earthquake at a particular site Thus an
earthquake of a given magnitude will produce a wide range of intensities
depending largely on distance from the source
In general a small earthquake with a magnitude less than 5 may be felt
only in the area near the source and a moderate earthquake with a magnitude
between 5 and 7 will be felt over a wider area and may produce significant
damage in the area very close to the source A large earthquake refers to an
earthquake with a magnitude greater than 7 Such events are often very desshy
tructive if they are located near population centers A major earthquake
refers to magnitudes between 7 and 7 34 and a great earthquake refers to
magnitudes greater than 7 34 These great earthquakes cause widespread desshy
truction and possible regional tsunamis Generally the potential damage from
earthquakes is multiplied by the secondary effects of earthquake occurrence
such as ground faulting generation of tsunamis landslides slumping or
liquefaction
The depth of earthquakes range from the surface to approximately 700 km
depth Shallow earthquakes refer to those with depths between the surface and
70 km Intermediate earthquakes refer to those with depths between 70 km and
300 km depth De earthquakes refer to those with depths greater than 300 km
(but less than 700 km) Intermediate depth earthquakes occasionally produce
damage at the earths surface only if the earthquake is very large Deep
events are generally not felt
113
The seismic (earthquake) potential of a particular region is defined as
the likelihood of that region to experience a (destructive) earthquake within a
particular magnitude range within a particular time period The seismic
(earthquake) hazard of a particular location refers to the amount of ground
motion that might be expected from an earthquake within or near that region
Adequate data on seismotectonic features instrumental (strong-motion) and
macroseismic (intensity) records of near-field effects of large earthquakes
source parameters of large earthquakes earthquake spectra and ground attenuashy
tion or amplification are necessary in order to reasonably evaluate earthquake
hazard for any region The seismic potential is the integration of all of
these bits of information The average length of time between earthquakes of a
particular size (recurrence interval) and the amount of time elapsed since the
last earthquake of that size help to define the probability of future earthshy
quake occurrence along a particular seismogenic zone hence the seismic
potential of that zone
Seismic risk of a particular region refers to the expected degree of
losses of people and their property which result from the seismic hazard and
the vulnerability in the region One method that has been widely used for this
risk determination (and is used here) involves the determination of a maximum
probable earthquake (design earthquake) that is likely to occur in the imshy
mediate region Calculations of seismic hazard which are based on design
earthquakes generally yield conservative estimates of risk
The most important conclusion of historical studies of seismicity is to
define the seismogenic zones of a region and extrapolate what the future earthshy
quake potential is for those zones Seismically quiescent regions refer to
regions with a lower level of seismic activity which are surrounded by more
114
active regions Portions of major plate boundaries that have not experienced a
major or great earthquake during a particular time interval are seismic gaps
This time interval is taken to be a significant portion of the earthquake
recurrence interval for a large earthquake An estimate to within several
decades of the location and size (magnitude) of a large earthquake constitutes
a forecast If a precise calculation of the time and probability of occurrence
can be added to the location and size information then the estimation is a
prediction
115 APPENDIX II MODIFIED MERCALLI INTENSITY SCALE (1956 VERSION)1
Masonry A B C D To avoid ambiguity of language the quality ofmasonry brick or otherwise is specified by the following lettering (whichhas no connection with the conventional Class A B C construction)
Masonry A Good workmanship mortar and design reinforced especiallylaterally and bound together by using steel concrete etc designed toresist lateral forces
Masonry B Good workmanship and mortar reinforced but not eesigned indetail to resist lateral forces
Masonry C Ordinary workmanship and mortar no extreme weaknesses likefailing to tie in at corners but neither reinforced nor designed againsthorizontal forces
Masonry D Weak materials such as adobe poor mortar low standards ofworkmanship weak horizontally
DESCRIPTION (INTENSITY VALUES RANGE FROM I TO XII)
I Not felt Marginal and long-period effects of large earthquakes
II Felt by persons at rest on upper floors or favorably placed
III Felt indoors Hanging objects swing Vibration like passing oflight trucks Duration estimated May not be recognized as an earthquake
IV Hanging objects swing Vibration like passing of heavy trucks orsensation of a jolt like a heavy ball striking the wallsStanding motor cars rock Windows dishes doors rattle Glassesclink Crockery clashes In the upper range of IV wooden walls and frames creak
V Felt outdoors direction estimated Sleepers wakened Liquidsdisturbed some spilled Small unstable objects displaced orupset Doors swing close open Shutters pictures movePendulum clocks stop start change rate
Original 1931 version in Wood H 0 and F Newmann 1931 ModifiedMercalli Intensity Scale of 1931 Bull Seis Soc Amer 53 979-9871956 version prepared by Charles F Richter in Elementary Seismology(1958) 137-138 W H Freeman and Company
116 VI Felt by all Many frightened and run outdoors Persons walk unsteadily Windows dishes glassware broken Knickknacks booksetc off shelves Pictures off walls Furniture moved or overshyturned Weak plaster and masonry D cracked Small bells ring(church school) Trees bushes shaken (visibly or heard to
rustle--CFR)
VII Difficult to stand Noticed by drivers of motor cars Hangingobjects quiver Furniture broken Damage to masonry D includingcracks Weak chimneys broken at roof line Fall of plasterloose bricks stones tiles cornices (also unbraced parapets andarchitectural ornaments--CFR) Some cracks in masonry C Waveson ponds water turbid with mud Small slides and caving in alongsand or gravel banks Large bells ring Concrete irrigationditches damaged
VIII Steering of motor cars affected Damage to masonry C partialcollapse Some damage to masonry B none to A Fall of stucco andsome masonry walls Twisting fall of chimneys factory stacksmonuments towers elevated tanks Frame houses moved onfoundations if not bolted down loose panel walls thrown outDecayed piling broken off Branches broken from trees Changes inflow or temperature of springs and wells Cracks in wet groundand steep slopes
IX General panic Masonry D destroyed masonry C heavily damagedsome times with complete collapse masonry B seriousiy damagedGeneral damage to foundations--CFR) Frame structures if notbolted shifted oft foundations Framed cracked Serious damageto reservoirs Underground pipes broken Conspicuous cracks inground In alluviated areas sand and mud ejected earthquakefountains sand craters
X Most masonry and frame structures and bridges destroyed Seriousdamage to dams dikes embankments Large landslides Waterthrown on banks of canals rivers lakes etc Sand and mudshifted horizontally on beaches and flat land Rails bent slightly
XI Damage nearly total Large rock masses displaced Lines of sightand level distorted Objects thrown into the air
117 APPENDIX III SEISMOLOGICAL FACILITIES AND EARTHQUAKE HAZARD PROGRAMS IN
THE SOUTHWEST PACIFIC
As part of our program of field investigations in Fiji Tonga andVanuatu our researcher was able to visit the neighboring island countriesof the Southwest Pacific region During these visits he was able to meetwith scientists and public officials involved with the earthquake hazardproblem fEcing each country In every case the governments are awareand have taken some action to ofmitigate the potential losses due to destrucshytive earthquakes but these governmental responses have varied widely fromcountry to country This report focusses on the seismological institutionsand facilities in each of the counltries and their capabilities in assessingand planning for earthquake hazards In the following sections weconsider each of the island countries of this area which face a severeearthquake risk Fiji Tonga Vanuatu Western Samoa Solomon IslandsPapua New Guinea and New Zealand
TONGA
Seismological Facilities Seismological observations in Tonga are the responsibility of theMinistry of Lands Surveys and Natural Resources Due to fiscal conshystraints however these efforts have in the past been entirely dependenton foreign assistance Seismological experiments began in Tonga in themid-1960s with Lamont-Dohertys Upper Mantle Project Seismic stationswere operated by Lamont-Doherty and subsequently by Cornell scientiststhrough the early 197 0 s when operations were suspended In late 1983 aspart of the present AID-supported seismic hazard program Cornell reinshystalled a three-component short-period seismograph in the capitalNukualofa The seismograph was installed upon the request of the governshyment geologist to be operated by the Tongan government with technicalassistance from Cornell Unfortunately after operation of the seismographfor eight months Tongas Cabinet decided that the drain on its resourcesand personnel was excessive and the instruments were disconnected in May1984 with the components transferred to Fiji and Vanuatu where they canbe utilized There are presently no plans to reinstall permanent seismoshy
graphs in Tonga
Strong Motion Accelerographs
Two strong-motion accelerographs provided by the AID seismic hazardprogram are presently operating in Tonga one in Nukualofa and one in thenorthern Vavau Islands They have been in operation for one year andhave not to date recorded any large earthquakes They require a minimum ofmaintenance and their operation will continue to be supen-sed by thegovernment geologists with assistance from Cornell A third accelerographmay be made available to tonga by the British Geological Survey and couldbe installed on Eua Island in a zone of high activity close to the TongaTrench
118 Related Research Programs
The Ministry of Lands Surveys and Natural Resources employs a singlegovernment geologist whose responsibilities include coordination of oilprospecting geological mapping of the islands and assessment of earthquakeand tsunami hazards There has been considerable scientific study of theTonga Trench subduction zone by research groups from the United StatesJapan New Zealand Australia Germany and the Soviet Union More detailedmarine geophysical data have been collected near Tongatapu Island byAmerican petroleum exploration groups
Critical Facilities
The capital city of Nukualofa has a population of only 20000 butdoes include several three- and four-story buildings The larger buildingshave in general been designed by foreign engineers and have includedearthquake-resistant design specifications Other significant developmentprojects include the expansion of the government wharf in Nukualofa anddevelopFnent of tourist resorts on Tongatapu and several of the outer islands
Earthquake Preparedness Programs
There are no building codes presently enforced in Tonga Howeverconstruction of public buildings must be approved by the Ministries ofWorks and Health The largest office buildings and hotels are designed byoverseas engineering firms and generally include some earthquake loadingcriteria The Land and Environment Act currently under consideration bythe Tongan government would require review of all development projects bythe government planner application of building codes largely adapted fromNew Zealand codes is expected to followDisaster preparedness programs are the responsibility of the CabinetsNational Disaster Committee including representatives from the relatedgovernment ministries and departments Subcommittees focus on disasterpreparedness action planning and long-term relief and rehabilitation
There is no earthquake education program in Tonga
VANUATU
Seismological Facilities
Seismic stations in Vanuatu were first established in the mid-1960sby the French Office de la Recherche Scientifique et Technique Outre-Mer(ORSTOM) Station PVC in Port Vila has operated continuously from 1964 tothe present while LUG in Luganville Santo operated through 1980 A thirdstation on Tanna Island (INH) operated through 1978 Cornells cooperativefield programs with ORSTOM began in 1976 with a microearthquake experimenton Santo Island an ocean-bottom seismograph experiment was carried out insouthern Vanuatu in 1977 and in central Vanuatu in 1978 The
119 Cornell-ORSTOM telemetered seismic network was established in 1978 and hasoperated continuously since that time The seismic network now includes 19telemetered stations (Figure Al) to date over 17000 earthquakes havebeen recorded by the network A permanent ORSTOM mission is now based inPort Vila and takes primary responsibility for day-to- day maintenance ofthe network These seismological facilities are complemented by studies ofground deformation using seven bubble-level tiltmeter a two-componentlong-baseline water tube tiltmeter and two levelling arrays
Strong Motion Accelerographs
As part of the present program of seismic hazard evaluation inVanuatu Cornell has installed five strong motion accelerographs on theislands of Efate Malekula and Santo (Figure Al) These instruments havealready been triggered by five moderate-sized shallow events and will beused to provide a basis for predicting local ground motion induced by largeinterplate earthquakes in Vanuatu The high level of seismicity along thisplate boundary suggests that a valuable baseline of strong motion data canbe collected in a relatively short period of time
Related Scientific Programs
The seismology program is carried out in cooperation with the VanuatuDepartment of Mines Geology and Rural Water Supplies They areresponsible for regional geology studies resource assessment detailedmapping and hydrological activities In addition ORSTOMs geology andgeophysics department based in New Caledonia carries out an extensiveprogram of investigations covering submarine morphology marine geologyand geophysics island geology and crustal structure Recently the USGeological Survey has undertaken a series of detailed marine studies in thecentral and northern portions of the island arc using the research vesselSP Lee A detailed hydrographic survey was carried out in coastal watersby Australian researchers In addition proton-precession magnetometersare maintained by Queensland University (Australia) researchers A tidegauge is maintained by the ORSTOM mission in Port Vila
Critical Facilities
Port Vila with a population of under 20000 is the administrativeand commercial center of the country There are a number of multistorybuildings in the capital and most of Vanuatus small tourist industry islocated in and near Port Vila A large shipping wharf is located near the center of the city on Vila Bay
Apart from Port Vila the only significant development in Vanuatu isat Luganville on Santo Island (pop 5000) It remains an importanteconomic center for the country with agricultural processing and shippingfacilities located there There are several three- and four-storybuildings in the center of Luganville There was significant damage to
120
14 o 166 deg 1670 1680 1690 1700
GAUA FIJI
150 0 PLATEAU
a ~ SANTO A013AoVAN CAAO 1
APENTECOST deg - STAMB16 aAMKs 160 AMBRYM 16
MALEKULA MML~DENTRECASTEAUX FRACTIURE ZONE
IEP
170- EM I-170
NGOUNANGA IN
S EFAT 180- oJ pV
0-180
mV
o ERROMANGO o -OAUSTRALIANR FUTUNAT ANN
19 6669190 o
-4 00 FUTUNA00AUSTRALIAN
0 0 N__
20ht PLAT E S I ANATOM l 0
165c 166deg 1670 degE 1680 169 1700
Figure Al Map showing the seismograph stations in Vanuatu Circles arestations telemetered to the base station PVC on Efate island andunderlined stations have two components--one horizontal and one verticalThe triangles are older ORSTOM stations INH and LUG are no longer operational Strong motion instruments are located at SWB and LMP onMalekula island DVP and PVC on Efate island and LUG on Santo island
121
buildings wharves and bridges in Luganville following the 1965 Santo earthquake
Earthquake Preparedness Programs
Disaster preparedness is the responsibility of the Ministry of Home Affairs a revised Rescue Plan has been adopted since independence They are responsible for damage assessment and coordination of emergency relief efforts by other ministries and public agencies
There are presently no building codes enforced in Vanuatu At present the government has requested the assistance of a consultant from New Zealand to help provide uniform building codes for the country The Public Works Department enforces New Zealand seismic zone B codes to construction of public buildings Large buildings for the most part are designed by overseas engineering firms and generally comply with their earthquake design standards Smaller buildings are generally designed close to the New Zealand loading specifications but there continues to be great difficulty in supervising construction projects
There is no large-scale earthquake education project in Vanuatu Materials have been prepared by ORSTOM seismologists for distribution to teachers public officials and planners involved in earthquake hazards
WESTERN SAMOA
Seismological Facilities
One of the earliest seismic stations in the Pacific was established at the Apia Observatory in 1902 during the German colonial period through the University of G6ttingen In 1921 control of the observatory was transshyferred to the New Zealand Government Weichert seismographs were operated continuously at Apia through 1957 when they were replaced by Benioff instruments at Afiamalu and by short-period Wood-Anderson instruments at Apia Since Samoan independence in 1963 the Observatory has been operated jointly by the Samoan Government and the Department of Scientific and Industrial Research (DSIR) New Zealand In 1963 a Worldwide Standard Seismograph Station was established at Afiamalu Operation of this six-component station is supported by the US Geological Survey In 1980 the station was upgraded to allow digital recording equipment was added to upgrade the statior co the status of a Global Digital Seismic Network station Seismic records are sent to DSIR in Wellington for permanent storage
Strong Motion Accelerographs
A simple strong motion instrument has been operating in Apia since 1979 It is an event-triggered low-gain seismograph recording on an ink-stylus recorder At the time of our visit to Western Samoa the instrument had been out of service for several months Only one event has to date triggered the instrument
122
Related Scientific Programs
The Apia Observatory has also made continuous magnetic field measureshyments since 1905 Measurements are currently made using a Schultze earth inductor an Askania declinometer and a proton magnetometer The observashytory maintains two tide gauges as part of the Pacific Tsunami Warning System Offshore resource studies have been carried out through CCOPSOPAC and by various international research groups Much of the reconnaissance geological work in Western Samoa has been carried out by DSIR in New Zealand
Critical Facilities
Like many -f the other island countries of the Pacific Western Samoas development has been concentrated around the capital Apia (pop34000) A major deep-water harbor and the countrys tourist industry are based in Apia Several multistory buildings have been erected in Apia in the past several years A hydroelectric dam on Upolu Island was completed in 1978
Earthquake Preparedness Programs
There is presently no disaster plan in effect in Western Samoa The various agencies involved with emergency action are coordinated through the Police Commissioner New Zealand seismic zone B codes are applied to construction in Western 5amoa Enforcement is handled by the Public Works Department Modest educational materials have been prepared by the ApiaObservatory staff in English and Samoan for distribution through schools and public agencies
SOLOMON ISLANDS
Seismological Facilities
Seismological Observatories in the Solomon Islands are conducted by the Ministry of Lands Energy and Natural Resources They have operated a Worldwide Standard Seismic Station in Honiara since 1962 operation of the station is supported by funds from the US Geological Survey The station was augmented by two short-period telemetered seismic stations in 1982 This three-station network was provided through the British GeologicalSurvey with the aim of identifying volcanic earthquakes associated with the active volcano Savo located close to the capital
In awareness of the high volcanic risk to population centers in the Solomon Islands the Ministry has drawn up plans for two three-station telemetered arrays to be deployed around the active volcanoes on Simbo Island (New Georgia Group) and on Tinakula Island (Santa Cruz Group) They are presently seeking foreign aid in the form of seismic instrumentation and technical assistance to establish the network
123
The Ministry also has responsibility for field surveys following majorearthquakes in the Solomon Islands Studies of ground deformation and cultural effects of the large 1977 and 1984 earthquakes were made by seisshymology officers
Strong Motion Accelerographs
Two strong motion accelerogaphs were installed on Guadalcanal by the Ministry in late 1984 They will be responsible for maintaining the instruments but have requested Cornells assistance in analyzingaccelerograms obtained during their operation The high level of shallow activity near Guadalcanal suggests that a significant number of strong-motion records will be obtained during the lifetime of the instruments
Related Scientific Programs
The Ministry also carries out related research programs in regionalgeology minerals assessment groundwater studies and so on Extensive marine surveys have been carried out in the Solomon Islands by the US Geological Surveys Resource Assessment Program Local offshore surveys have been carried out through CCOPSOPAC A tide gauge is maintained by the Solomon Islands Hydrographic Unit Six proton-precession magnetometers are operated in the Solomon Islands by the Queensland University (Australia)
Critical Facilities
Over 90 of the Solomon Islands population remains in rural areas The major development is in Honiara the administrative and commercial center of the country Honiara (pop 15000) is the major shipping center of the country and now includes several multistory buildings
Earthquake Preparedness Programs
The Solomon Islands implemented a National Disaster Plan in 1980 subsequently revised in 1982 The Plan gives the Ministry for Home Affairs and National Development overall responsibility for coordination of efforts in earthquake volcanic and tsunami disasters Operational relief efforts are carried out through the Disaster Operations Coordinator and the Provincial governments
The government has adopted the most stringent earthquake building code (Zone A) from New Zealand for multistory building construction in Honiara Implementation of these guidelines continues to be a problem One multi- story building in Honiara (Australian High Commission Building) was severely damaged during the 1984 earthquake Some efforts have been made to develop small-scale earthquake-resistant building techniques appropriate for rural areas The Pacific Islands Development Program organized a model
124
house constrtction and workshop during early 1984 A modest outreach program has developed through the school system adult education programsand the government broadcasting company
PAPUA NEW GUINEA
Seismological Facilities
The government of Papua New Guinea has made an extensive commitment to earthquake and volcanic hazard mitigation through construction of a national intLwor cif seisn graphs and accelerographs (Figure A2) Aten-station national network of seismographs is monitored by the Port Moresby Geophysical Observatory (Department of Minerals and Energy) Three of the remote stations are telemetered to Port Moresby via microwave linksfour stations operate as permanent field stations and two are operated at temporary sites on outlying islands Port Moresby is presently the site of a Worldwide Standard Seismic Station that has operated since 1958 The national network reports arrival times to the US Geological SurveysPreliminary Determination of Epicenters and the International SeismologicalCentre but does not routinely locate events independently
In addition t0 the national seismic network the Rabaul VolcanologicalObservatory operates seven seismic stations near active volcanoes around the country and a nine-station telemetry network around the Rabaul Caldera Bougainville Copper Limited operates a 5-station network on Bougainville Island (North Solomons Province)
Stronm Motion Accelerographs
The Port Moresby Geophysical Observatory maintains a national networkof thirteen strong motion accelerographs distributed in the highly seismic areas of the country (Figure A2) This includes a closely spacedfour-station network around the Rabaul Caldera A single strong motion accelerograph is situated on Bougainville Island and is maintained byBougainville Copper Limited The network uses Kinemetrics SMA-I and New Zealand DSIR MO-2 instruments and has recorded tens of accelerograms since its establishment in 1967 The Observatory is presently trying to establish an engineering seismologist position to analyze the accumulatingdata and to further upgrade the accelerograph network
Related Scientific Activities
In addition to the Geophysical Observatory the Department of Minerals and Energy includes the Geological Survey of Papua New Guinea The Surveyundertakes a wide range of geological investigations including regionalgeological mapping petroleum and mineral exploration engineering and environmental geology and energy resource development Offshore surveyshave been carried out through CCOPSOPAC as well as American and Australian research vessels Continuous monitoring of the magnetic field is carried out by the University of Queensland (Australia) Ten tiltmeters have been
CSA v~cwS~Ior m~ 16008 O
fR o- c ~ 1
a ~ 19CL SOewPV ftfa
b (b UACCO40 t wa aj
R~bOVIRAR AI
Ap~~ooj Toel Pbu IR TL
R (l
YOM~I -oob
vtvtOOalork Island WO)ISI
NETWORKS MARCH 1384
Figure A2 Panua New Guinea seismograph and accelerograph networks U
126 deployed by the Volcanological Observatory to monitor ground deformation near Papua New Guineas active volcanoes Four of these instruments aredeployed around Rabaul Caldera
Critical Facilities
Papua New Guinea is the most developed of the island countries of theSouthwest Pacific with a population of over 3000000 and extensive urbandevelopment The capital city of Port Moresby has a population of over130000 with major multistory construction in the downtown area a majordeep water harbor and significant commercial and industrial activity in thePort Moresby area There is significant development as well in the smallertowns of Rabaul Lae Madang Wewak Goroka Mount Hagen Wau BuloloDaru and Kerema Major hydroelectric schemes have been established on theRamu and Rouna rivers with additional hydroelectric plans at variousstages of evaluation and development Extensive mineral development hastaken place in the North Solomons Morobe and Western provinces of PapuaNew Guinea Extensive natural gas and limited oil deposits have beenlocated these may become commercially exploited in the near future
Earthquake Preparedness Programs
Papua New Guinea has a long history of earthquake and volcano-relateddisasters A national disaster program was established in 1981 and proshyvides for a National Disaster Emergency Committee which formulates emershygency government policy and a Disaster Civil Defence Committee which isresponsible for implementation of short-term relief effortsprovincial governments are
The given major responsibility for initialcoordination and assessment of disasters assistance is subsequently
requested from the federal government for major disasters Many of theprovincial governments have not revised preparedrcs plmns sLnce thecolonial period However particularly intense effort has been directed inEast New Britain province because of the imminence of a potentially desshytructive volcanic eruption in Rabaul Caldera
The town of Rabaul (pop 15000) is a major commercial center forPapua New Guinea and is situated directly within the caldera of an activevolcano A relatively small eruption took place at a secondary eruptivecenter near Rabaul in 1937 killing over five hundred nearby residents andforcing the evacuation of the town In order to avoid a repeat of such adisaster the government established the Volcanological Observatory withfour full-time volcanologists and real-time earthquake location andanalysis of tilt data A drastic increase in volcanic seismicity inmid-1983 led to a volcanic hazard alert and intensification ofseismological and ground deformation studies around Rabaul In additionthe alert allowed the provincial and national Disaster Emergency Committeesto make extensive evacuation and relief plans for a possible eruption atRabaul including preparation of a new airstrip improvement of roads andemergency water supplies communications systems detailed evacuationplans education programs and so on To date there has been remarkablecooperation of efforts by provincial national and overseas officials to
127
mitigate the potentially devastating effectq of a volcanic eruption at Rabaul
Papua New Guinea is the only country of the developing nations of the Southwest Pacific to have devised its own seismic zoning system(Figure A3) The Nationwide Housing Code for Papua New Guinea sets up a four-level system of seismic loading oriented toward moderate-sized (to 8 stories) buildings Major buildings require independent dynamic analysisusually carried out by overseas engineering firms Seismic Zone 1 of the Housing Code is among the most stringent earthquake loading codes in theworld and includes the town of Rabaul and much of the East New Britain and North Solomons provinces Seismic zone 2 includes the towns of LaeWewak and Madang and is approximately equivalent to New Zealand Zone A or California loading designs The capital Port Moresby is in the lowest seismic zone (4) but buildings constructed there still require designs allowing for significant lateral loadings
Earthquake education is handled through the National Radio Government Printing Office the Civil Defence Department and the school system withinformation supplied by the Geophysical and Volcanological Observatories A particularly intense education effort has been mounted in Rabaul where educational materials have been produced and distributed in three languages and public involvement in preparedness plans has been emphasized
NEW ZEALAND
While New Zealand cannot be considered one of the developing countries of the Southwest Pacific its seismology programs have been responsible for much of the observational data available for the entire region Because of its importance to the other national seismology programs we briefly review here the New Zealands observational facilities Its extensive programs in engineering seismology its critical facilities and its earthquake preparedness programs will not be covered here
National Seismic Network
Seismological facilities in New Zealand are maintained by the Geophysics Division of the Department of Scientific and Industrial Research (DSIR) in Wellington The national standard seismograph network presentlyconsisting of thirty short-period stations is shown in Figure A5 The network routinely locates all earthquakes of ML gt 38 within New Zealandand earthquakes with Ms gt 50 for the region within 100 of New Zealand Arrival time data are routinely transmitted to the US Geological Surveyand the International Seismological Centre The events located by the network are reported in the annual New Zealand Seismological ReportSeveral hundred earthquakes are located by the DSIR national network each year
The network is augmented by long-period instruments operating at Karopiro Roxburgh and Wellington DSIR also operates a three-componentborehole seismometer in Wellington as part of the Seismic Research Observatory network supported by the US Geological Survey
bull ------- - -- -shy - +----2
FIG 13
f 4tSEISMIC ZONES FOR BUILDING CONSTRUCTION IN PAPUA NEW GUINEA
4
7r
Zce CtASSIICION OF CITIEI Pr 3 12OI- ZO I Z7oE
Figure A3 Seismic zones for building construction in Papua New Guinea (Jury et al 1982)
129
CAPEREINGA
ONERAHI
0GREAT BARRIER
AUCVAND 0
WHITE ISLAND B OCT1914
KARAPIRO EASTCAPE
r WHAKATANE WAIRAKEI
PI5 SEP 13EARATA 0 TUAI 2BJUSBRNE21 CHATEAU MARADALE 4 2 FEJUL1931
90 MANGAHAD v5 MAR 19340 B8AUG 190A
CASTLEPOINT 4JUN 1942 COB ELLINGTON 2 A ~ C BB~3 A16
23 MAY 1968 JANa5
KAIMATA KAIKOURA 9 MAR 19 U 0
3 AUG 1999
CASHMERE lb NOVIqDMT JOHN
PUKA I24 MAR 1960MILFORD -SOUND ) MAY 1976Y
OAMARU ROXBURGH
BORLAND DUNEDIN MAGNITUDE7 OR GREATER 4LODGE 118 0O1019791MAGNITUDE6OR GREATER
OBAN 11940to 19791
Figure A5 Seismograph stations of the national network (left) and the distribution of large shallow earthquakes (right) in New Zealand (Seismological Observatory Wellington 1980)
130 Stations in Outlying Territories
New Zealand has also taken anstations in outlying areas
important lead in operating seismographof the Southwest -acific These stations havebeen extremely important in hypocentral control for the Tonga - Kermadecseismic zone and for nuclear event detection in the Pacificoperates three 6 DSIR-component Worldwide Standard Seismograph stations atAfiamalu (Western Samoa) Raratonga (Cook Islands) and Scott Base(Antarctica) Short-period stations operate at Apia (Western Samoa)Campbell Island (New Zealand) Chatham Islands (New Zealand) Nadi (Fiji)Nime and Raoul Island (Kermadec Island New Zealand) Readings from thesestations are routinely reported to PDE and ISC for global earthquakelocation
Wellington Network
A small-aperture high-gain seismic network is operated aroundWellington an area of greatest seismic risk in New Zealandare The stationstelemetered by radio or telephone link to the central recording siteThe network now consists of eleven stations Earthquakes are presentlydetected by a microprocessor-based Automatic Seismic Monitor and automatedlocation processing is expected to follow The network routinely locatesevents with ML gt 15
Pukaki Network
A second microeartlhquake network has operated around Lake Pukakihydroelectric project in the South Island New Zealand a
established in 1975 The network wasto monitor reservoir-induced seismicity associatedwith impoundment of the reservoir The network consisted of nine stationsand was intended to operate on a temporary basis It has been closed sinceearly 1984 with several of the stations continuing to support thenational network and to monitor any future reservoir-related activity
Related Seismolo Research
In addition to its regular observatory seismology the GeophysicsDivision has an active seismology research programfocussed on Their studies havetheoretical seismology earthquake prediction crustalstructure of New Zealand historical earthquake studies nuclear eventdetection seismic risk in New Zealand strong motion studies and volcanicseismology The monitoring of active volcanoes is closely coordinated withcrustal deformation monitoring conducteu by the Earth Deformation Sectionof the New Zealand Geological SurveyThe New Zealand strong motion accelerograph network now consists of225 instruments operated by the Physics and Engineering Laboratory ofDSIR Most of these instruments are of a New Zealand design (Mechanicaland Optical Accelerographs) and analog records
film are made on photographicThree digitally recording accelerographs are now in operation in
131
Stations in Outlying Territories
New Zealand has also taken an important lead in operating seismographstations in outlying areas of the Southwest Pacific These stations have been extremely important in hypocentral control for the Tonga - Kermadec seismic zone and for nuclear event detection in the Pacific DSIR operates three 6-component Worldwide Standard Seismograph stations at Afiamalu (Western Samoa) Raratonga (Cook Islands) and Scott Base (Antarctica) Short-period stations operate at Apia (Western Samoa)Campbell Island (New Zealand) Chatham Islands (New Zealand) Nadi (Fiji)Nime and Raoul Island (Kermadec Island New Zealand) Readings from these stations are routinely reported to PDE and ISC for global earthquake location
Wellington Network
A small-aperture high-gain seismic network is operated around Wellington an area of greatest seismic risk in New Zealand The stations are telemetered by radio or telephone link to the central recording site The network now consists of eleven stations Earthquakes are presentlydetected by a microproeszor-based Automatic Seismic Monitor and automated location processing is expected to follow The network routinely locates events with ML gt 15
Pukaki Network
A second microearthquake network has operated around Lake Pukaki a hydroelectric project in the South Island New Zealand The network was established in 1975 to monitor reservoir-induced seismicity associated with impoundment of the reservoir The network consisted of nine stations and was intended to operate on a temporary basis It has been closed since early 1984 with several of the stations continuing to support the national network and to monitor any future reservoir-related activity
Related Seismology Research
In addition to its regular observatory seismology the GeophysicsDivision has an active seismology research program Their studies have focussed on theoretical seismology earthquake prediction rustal structure of New Zealand historical earthquake studies nuclear event detection seismic risk in New Zealand strong motion studies amc volcanic seismology The monitoring of active volcanoes is closely coordinated with crustal deformation monitoring conducted by the Earth Deformation Section of the New Zealand Geological Survey
The New Zealand strong motion accelerograph network now consists of 225 instruments operated by the Physics and Engineering Laboratory of DSIR Most of these instruments are of a New Zealand design (Mechanicaland Optical Accelerographs) and analog records are made on photographicfilm Three digitally recording accelerographs are now in operation in
132
New Zealand and the MO records are digitized for computational analysisAnalysis of this empirical data is being used for a revision of New Zealands building codes
133
REFERENCES
Berryman K 1979 Seismotectonic zoning study of the Fiji Islands Earth Deformation Section Report 70 andWellington NZ Dept Sci Indust Research 40 pp
Everinghar IB 1983 Seismology section annual report 1983 Min Resources Dev Fiji Note 3310 Suva Fiji 46 pp
Franco AB MP Hamnett and J Makasiale 1982 Disaster Preparednessand Disaster Experience in the South Pacific Pacific Islands Developshymental Program Honolulu 380 pp
Geological Survey of Papua New Guinea 1979 Information Booklet Port Moresby Dept Minerals and Energy 12 pp
Government of Western Samoa 1977 Apia Observatory 1902-1977 Apia Apia Observatory 8 pp
Jury RD JP Hollings and IAN Fraser 1982 The development of seismic zones and the evaluation of lateral loadings for earthquakeresistant design of buildings in Papua New Guinea Bull NZ Nat Soc for Eartho Engr 15 123140
Lowenstein PL 1982 Problems of volcanic hazards in Papua New GuineaGeol Surv Papua New Guinea Rept 827 Port Moresby Papua New Guinea 62 pp
McCue KF and ID Ripper 1980 The Papua New Guinea Strong MotionAccelerograph Network Geol Surv Papua New Guinea Rept 807 Port Moresby Papua New Guinea 13 pp
Mineral Resources Department Seismology Section 1983 National activityreport Fiji Submitted to Session IX Intl Coord Group for TsunamiWarning System in the Pacific Min Resources Dept Fiji Note 333 Suva Fiji 4 pp
Parliament of Fiji 1984 Mineral Resources Department Annual Report for The Year 1982 Parliam Paper No 13 Suva Fiji 90 pp
Power CA 1978 Earthquake risk in Fiji and the problems of earthquakeengineering Presented to the Fiji Society 17 pp
Prdvot R and JL Chatelain 1983 Seismicity and Seismic Hazard in Vanuatu ORSTOM Rept 5-83 Noum~a 51 pp
Ripper ID 1982 Accelerogram library Geol Surv Papua New Guinea Rept 198211 Port Moresby Papua New Guinea 44 pp
Seismological Observatory Wellington 1980 The earthquake problem in NewZealand Alpha DSIR Extension Information Wellington NZ 4 pp
134
Smith WD 1979 Seismology and related research in New Zealand1975-1978 NZ DSIR Information Series No 140 30 pp
Smith WD 1983 Seismology and related research in New Zealand1979-1982 Seismol Observatory Wellington Bull 276 32 pp
Solomon Islands Government 1982 National Disaster Plan 1982 Honiara Solomon Is 14 pp
135
A Rahamin A Simpson R Holmes P Rodda R Singh I Everingham
K Draunidalo G Shorten M Mehrotra J Booth J Campbell
R Carter R Byrne G Gauss D Rubin
S Tongilava
D Tappin S Lemoto T Tukia
C Clarke
R Campillo R Foy L Mollard T Lee J Recy J Chatelain R Prdvot
L loane S losa A Titimaea
INFORMATION CONTACTS
FIJI
Director Mineral Resources Dept Asst Director (MRD) Princ Geol OffshoreSeismol (MRD) Princ Geol Inform Services (MRD) Principle Geophysicist (MRD) Senior Seismologist (KRD) Seismologist (MRD) Senior Engineering Geologist (MRD) Struc Engr Suva City Council Civil Engineer Su Engineering Geologit A Gibb amp Partners (Monasavu) Marine Geologist kCCOPSOPAC) Marine Geologist (CCOPSOPAC) Marine Geologist (CCOPSOPAC) Marine Geologist (CCOPSOPAC)
TONGA
Superintendent of Lands Surveys and Natural Resources Government Geologist (LSNR) Land Assessor (LSNR) Government Planner (LSNR)
VANUATU
Director Dept Mines Geology and Rural Water Supplies
Director ORSTOM Mission Engineer ORSTOM Engineer ORSTOM Civil Engineer Public Works Dept Director ORSTOM Dept Geol and Geophys (Nouma) Seismologist ORSTOM (Noumda) Seismologist ORSTOM (Noumda)
WESTERN SAMOA
Director Apia Observatory Senior Seismologist (AO) Geologist (AO)
136
SOLOMON ISLANDS
S Danitofea Chief Geologist Ministry of Lands Energy and Natural Resources
D Tuni Senior Seismologist (MLENR)R Walshaw Senior Geologist (MLENR)J Vunagi Ministry of Home Affairs and National DevelopmentD Gwynn Civil Engineer Public Works Department
PAPUA NEW GUINEA
K Doble Chief Geologist Geological SurveyI Ripper Chief Seismologist Geophysical ObservatoryC Seidel Information Officer Volcanological ObservatoryC Anderson Engineering Geologist Geological SurveyJ Wilkins Civil Engineer Dept of Works and Supply
NEW ZEALAND
W Smith Director Seismological Observatory Wellington
UNITED STATES
M Hamnett Pacific Islands Development ProgramG Burton Director Pacific Tsunami Warning Center R Sillcox Seismologist (PTJC)G Pararis-Corayannis Director International Tsunami Information CenterG Greene Branch of Pacific Marine Geology (USGS)
137 APPENDIX IV TSUNAMI SAFETY RULES
1 All earthquakes do not cause tsunamis but many do When you hearthat an earthquake has occurred stand by for a tsunami emergency
2 An earthquake in your area is a natural tsunami warning Do not stayin low-lying coastal areas after a local earthquake
3 A tsunami is not a single wave but a series of waves Stay out ofdanger areas until an all-clear is issued by competent authority
4 Approaching tsunamis are sometimes heralded by a noticeable rise orfall of coastal water This is natures tsunami warning and should be heeded
5 A small tsunami at one beach can be a giant a few miles away Dontlet the modest size of one make you lose respect for all
6 The Tsunami Warning System does not issue false alarms When anocean-wide warning is issued a tsunami exists When a regionalwarning is issued a tsunami probably exists The tsunami of May 1960killed 61 people in Hilo Hawaii who thought it was just another false alarm
7 All tsunamis--like hurricanes--are potentially dangerous even thoughthey may not damage every coastline they strike
8 Never go down to the beach to watch for a tsunami When you can seethe wave you are too close to escape it
9 Sooner or later tsunamis visit every coastline in the PacificWarnings apply to you if you live in any Pacific coastal area
10 During a tsunami emergency your local Civil Defense police andother emergency organizations will try to sdav your life Give them your fullest cooperation
Unless otherwise determined by competent scientists potential danger areasare those less than 50 feet above sea level and within 1 mile of the coastfor tsunamis of distant origin or ess than 100 feet above sea level andwithin 1 mile of the coast for tsunaois of local origin
2
The ultimate aim of earthquake risk programs--mitigation of human and
economic losses due to earthquakes--involves prediction of the frequency of
occurrence and intensity of strong ground motion produced by future earthshy
quakes of specific magnitudes in the vicinity of any given site These
predictions are often summarized in the form of seismic zoning maps and
microzonation which give the spatial distributions of the following paramshy
eters maximum intensity of shaking engineering design codes maximum
acceleration of ground motion (velocity displacement) for given return
periods of earthquakes of a particular size or seismic risk (which relates
to the expected human and property losses from earthquakes) In this
report we focus on the fundamental seismological observations that will
provide the basis for more applied engineering studies of earthquake risk to
Fij i
Evaluation of Seismic Hazard
The seismic hazard in any region is a function of the frequency of
occurrence and magnitude of earthquakes as well as the proximity of the
earthquake foci to population and industrial centers Fiji is located close
to the major seismic zones of the Southwest Pacific (Figure 1) the area has
an instrumental history of earthquakes with magnitudes greater than 70
Although the country is not heavily populated or industrialized its
proximity to major seismic zones leaves it particularly vulnerable to the
risk of earthquake damage The capital city of Suva is now under increasing
development pressures The construction of multi-storied buildings to
accommodate the increasing urban populations and tourism as well as other
essential structures such as dams and power plants pipelines schools and
hospitals adds to the immediacy of the problem of earthquake risk
3
160 E 170 180 W 170
CENTRAL PACIFIC BA5IN
4 V ITI A I
SO 15 - deg
100 0 1000
0 o V 0 CH
BASIN BASIN o-
d~ FIJI~ r(
20 4 a 4 ~~ 20
LA SOUTH
0 BASINV- ZE
I P A I IS S A 0
0 S - 0
300 A
BINPI- )A C CIFICPA~~ 3
USTRALIAN~ 4V PLATE
PLATEZEA~LAND SOUTHWEST
400 b BASINBASIN
RISE40
150 160 E 170 180 170 W
Figure 1A Tectonic and morphologic features of the PacificIndo-Australian plate boundary Open arrows indicate direction of relative plate convergence Contour line shows 2-km isobath Holocene volcanoes are indicated by open triangles Data on bathymetry volcanoes and plate motions are taken from Circum-Pacific Council for Energy and Mineral Resources (1981)
4
10 deg1600 E 170 W 170 bull
20
20shy
-
0
at
4vkr 40v
30030 20IN W
170
the in
180 50)gt
(Ms40
170
earthquakes
2 I shallow
as large scale for1Bto sameat Councilis
Map Moderate Circum-Pacific
1964-1977from period taken
the arefor Data
Figure Pacific (1981)1Bcomparison
Southwest for Resources MineralFigure and
Energy
5
Past disaster associated loss of life in the Fiji has been relatively
limited but the increasing urban concentration and industrial development
raises the potential human and economic losses brought on by a large earthshy
quake occurring in the immediate vicinity These losses are usually the
result of the collapse of man-made structures and can be substantially
reduced by adequate engineering precautions
The 1953 Suva Earthquake
The most significant event in Fijis seismic history is the large 1953
Suva earthquake This event with a magnitude of Ms - 675 was the most
destructive in Fijis history The earthquake occurred within 30 km of the
capital city of Suva and produced extensive damage throughout southern Viti
Levu Intensities reach MM VII (Modified Mercalli Index see Appendices I
and II) along 40 km of the islands coast landslides were triggered over an
area of approximately 2380 km2 along the southern coast and extending nearly
20 km inland (Houtz 1962a) A major tsunami was triggered by the earthshy
quake reaching 43 meters height on the island of Kadavu 100 km south of
the epicenter The earthquake and tsunami resulted in 8 deaths 12 serious
injuries and over pound250000 in property damage The event also triggered
turbidity currents along the shelf south of Viti Levu that damaged communshy
ication cables at distances to 100 km from the epicenter (Houtz and Wellman
1962)
At the time of the earthquake Suvas population was only 35000 and
development consisted entirely of low-rise structures Since that time
Suva has grown to over 100000 population and has established itself as the
major regional center for commerce shipping tourism education and
administration Multistory building is widespread in the city and urban
development has rapidly extended to outlying areas Clearly a repetition
6
of the Suva earthquake is of major concern to Fijis Government planners
The seismic risk related to a recurrence of an event of this size (or
larger) far outweighs the potential effects of an earthquake along any of
the other seismogenic zones near Fiji
The earthquake has been of considerable interest from a seismotectonic
perspective as well it took plac3 like a small number of other historical
events directly within the platform on which the Fiji Islands reside Much
of the well-documented seismic activity has occurred along the boundaries of
the Fiji block (Hamburger and Everingham 1986) The cause of the large and
infrequent events that take place within the platform has remained a
tectonic enigma A major goal of these seismological investigations has
been to comprehend the tectonic causes for such unusual and extremely
hazardous earthquakes that occur close to and within the Fiji Islands
The major new data base that bears on this problem originates from the
new telemetered seismic network established in 1979 This network has
recorded several thousand earthquakes both within and along the margins of
the Fiji Platform Because the network can locate events as small as
magnitude -10 small earthquakes in less active seismic zones can be
examined Importantly the network located over 500 earthquakes within and
offshore southeastern Viti Levu near the source area for the 1953 Suva
earthquake In the following sections the distribution of earthquakes in
the Fiji region is analyzed in order to elucidate the nature of deformation
both within and along the boundaries of the Fiji Platform
A second important observation that bears on the Suva earthquake is the
examination of original records collected from over forty observatories
operating at the time Using these records we have obtained a new focal
7
mechanism for the 1953 event that places it in a clear tectonic context
one that proves to be closely linked to the deformation occurring on either
side of the Fiji Platform in the Lau and North Fiji basins
ACTIVITIES SUMMARY
Seismological Investigations
Reliable seismological observations are necessary for accurate
location study and ultimate prediction of earthquakes Seismological
observations in Fiji are conducted by the Mineral Resources Department a
subdivision of the Ministry of Energy and Mineral Resources The government
has made a major commitment to seismological work since the establishment of
a major US AID-supported seismic network in 1979 In fact seismological
observations in Fiji have been carried out since the early part of this
century supported at first by the New Zealand scientific organizations and
subsequently strengthened by Lamont Geological Observatorys Upper Mantle
Project in the 1950s and 1960s In late 1979 the 8-station US AID
network was established to complement three permanent stations in Viti Levu
The network was significantly expanded by installation of a five-station
telemetry network in 1981 supported by Japanese aid Additional stations
were installed in 1983 and 1984 the network has now expanded to a
nineteen-station national network with excellent coverage of the Fiji region
(see Figure 2) In addition MRD now has available five MEQ-800 portable
seismographs for occupation of temporary field sites telemetry station
testing and special refraction experiments While the Fiji network has
experienced considerable technical difficulties it has recorded some 5000
earthquakes since its installation and provides an invaluable basis for
seismological study of the Fiji region
8
15 FIJI SEISMIC NETWORK
)US AID (1979-1985)S A Japanese Aid (1981-1985)
16 A Fiji MRD (1983-1985)
E Temporary stations shy
17 A Taveuni
U ARKoro
Ovalau A UI 0
18 LEVU ~Gau Lakebae(J)Beqa
19 - a o_ Kadavu
20 I I I I 176 E 177 178 179 180 179 W178
Figure 2 Locations of seismic stations comprising the national seismic network of Fiji
9 The present OFDA-supported program has provided for three years of
field and laboratory research on the seismicity and tectonics of the Fiji
region and included approximately fifteen months of field work in Fiji
The field program resulted in substantial improvement of the Fiji seismic
network as well as in detailed studies of seismicity crustal structure
and tectonics of Fiji The work has already resulted in a number of
publications (Hamburger and Isacks 1983 Hamburger and Qiolevu 1983
Draunidalo and Hamburger 1984 Hamburger 1986 Hamburger and Isacks 1986
Hamburger and Everingham 1986) as well as several others in preparation
The scientific work summarized in this report represents a portion of those
studies
Strong Motion Accelerographs
The Mineral Resources Department also operates a network of strong
motion accelerographs now numbering ten Kinemetrics SMA-ls (Figure 3)
The initial six instruments of this network were granted to Fiji by AID the
remainder was purchased by the Fiji government Since establishment of the
SMA network three accelerogram records have been obtained from
moderate-sized earthquakes in Viti Levu The accelerograms are discussed in
detail in the following sections Records obtained from this network are
expected in the long run to provide the basis for ground accelerations
and thus for development of building codes specific to Fijis tectonic
setting and seismic regime
Related Scientific Programs
The Mineral Resources Department (MRD) includes an Offshore Geology
section which has an active program of marine geological and geophysical
- 1tEA 171 lT S Of GREENWICH 11W WEST OF OREENICN 17
NATIONAL NETWORK OF- STRONG MOTION ACCELEROGRAPHS
0 so 60 XLOUCTICI
LEGEND
LEVUE210 1--0VANUA
YASAWA I
Von boiftu
T
GAU
IT L LUTLAKEBA
I r r I I| 7~ WIiT OP SRZICI 360 WtST 0 pound[llUNWCHr 171
Figure 3 Location of strong-motion accelerographs in Fiji Some revision of these locations is likely within the next year
7
investigations in and around Fiji waters MRD also employs an engineering
geologist whose work includes microzonation of the Suva area mapping of
active faults in southeastern Viti Levu and investigation of soils subject
to earthquake-induced liquefaction An active program of geological mapping
and structural studies is also carried out by MRD They are supported by
personnel assistance from Australia and Great Britain
Suva is also the home of the United Nationij Committee for Coordination
of Offshore Prospecting in South Pacific Offshore Areas (CCOPSOPAC) This
organization coordinates much of the international marine research carried
on in the region and has been particularly helpful with Fijis investigashy
tion of its offshore waters
Critical Facilities
The major development in Fiji has been in and around the capital city
of Suva The population of the metropolitan area now exceeds 145000 and
most of the government commercial and industrial operations are concenshy
trated there The city has become a major comnercial transportation and
regional political center and has developed rapidly in the past ten years
Development in this period has incl ded construction of multistory
buildings a major electric power plant expansion of the Suva harbor and
most recently completion of the thirteen-story Central Monetary Authority
building in downtown Suva Much of this development has taken place on an
area of filled land close to sea level particularly vulnerable to earthshy
quake and tsunami damage This area was extensively damaged by the 1953
Suva earthquake and tsunami and is thus at significant risk from a repeat
occurrence of an event of comparable size
12
Other population centers with significant development include the towns
of Lautoka (pop 29000) Nadi (13000) and Ba (9000) on the island of
Viti Levu and Labasa (13000) on Vanua Levu The tourist industry which
is a major part of Fijis economy is concentrated on the southern and
western coasts of Viti Levu and is also vulnerable to earthquake and
tsunami damage The major development project in Fiji is the 82-meter high
Monasavu Dam in the interior of Viti Levu The earthfill dam was completed
in 1983 and is planned to provide most of the countrys electric power
needs through the end of the century
Earthquake Preparedness Programs
In awareness of the serious earthquake risk to development in Fiji the
government has adopted New Zealand earthquake design codes for most of the
urban areas of the country Seisric zone B codes applicable to areas of
moderate seismic activity in New Zealand have been chosen as appropriate
and are applied (in theory) to all domestic and commercial construction in
urban areas Considerable difficulty remains in enforcement of these
regulations particularly in construction of private dwellings Major
multistory building design is generally handled by overseas (Australia or
New Zealand) engineers and dynamic modelling tests are generally applied
for earthquake loadings at least as large as those required by the New
Zealand codes The Monasavu Dam underwent dynamic model testing by
Australian consulting engineers
Disaster preparedness is the responsibility of the Emergency Services
Committee (EMSEC) and the Prime Ministers Relief and Rehabilitation
Committee (PMRRC) EMSEC is responsible for coordination of disaster plans
maintenance of essential services advice to the Cabinet on emergency
13
measures and direction of relief work It is comprised of representatives
of the related ministries and public agencies PMRRC is chaired by the
Prime Minister of Fiji and has responsibility for long-term relief policy
and rehabilitation programs Fijis experience with recurrent weathershy
related disasters has spurred efforts for emergency communication systems
supply distribution temporary shelters and so on Much of this hurricane
disaster planning is applicable as well to earthquake and tsunami damage
Fiji is also a participant in the International Tsunami Warning System
Educational programs have been handled through the Fiji Broadcasting
System the Red Cross and the school system To a limited degree the
Public Works Department and the Mineral Resources Department have produced
educational materials related to earthquake hazards in Fiji
TECTONICS GEOLOGY AND PHYSIOGRAPHY
Plate Tectonic Setting
The theory of plate tectonics has provided a fundamental new undershy
standing of the distribution of earthquakes in the Fiji region This
section of the report is intended to briefly review the fundamental concepts
of plate tectonics and to establish the geologic and plate tectonic setting
of the Fiji Islands This information provides a basis for evaluating the
seismicity data presented in the following sections
Fiji is located along a portion of what is commonly called the Pacific
Ring of Fire The concentration of earthquakes (Figure 4a) and volcanoes
(Figure 4b) along this trend were used to establish the boundaries of the
lithospheric plates in the modern view of plate tectonic theory (Figure 4c)
These plates which are relatively rigid cover the surface of the earth
like a mosaic of rigid caps and move against each other by sliding (1) past
~ 14-
bull - bull-bull -
44
N
-V V r
0
t
for OrN rw Or r U wrr w I - I 4
configu
Figue Wrddsrbto f()erhuksad()vlaos (0) rto fte mjr tcoi lts o h at ufc fo Turctte a Scuet 1982 0
TuUote n Schubrt 982
15
at a transform fault (2) over at a convergent margin (such as subduction at
a deep sea trench) or (3) apart from one another at a divergent margin
(such as spreading at a mid-ocean rift) Figure 5 shows skematically the
spatial relationship of these different types of boundaries Convergent
plate boundaries are responsible for the majority of the worlds large
earthquakes and most of the worlds tsunamis Many volcanic arcs form
parallel to the deep-sea trenches above the point where the subducted plate
reaches about 100 km depth
The Fiji islands are a component of the Melanesian Borderlands that
form the boundary between the Pacific and Indo-Australian lithospheric
plates (Figure la) The entire Southwest Pacific region extending from the
Solomon Islands to New Zealand is dominated by plate convergence between
these two plates The present loci of convergence are the Solomon New
Hebrides Tonga Kermadec and Hikurangi trenches They are all characshy
terized by large shallow earthquakes inclined seismic (Benioff) zones and
Quaternary volcanism The present-day plate convergence vector is oriented
east-west over much of the region (Minster and Jordan 1978)
The Tonga-Fiji-New Hebrides segment of the plate boundary (the
Melanesian reentrant) is unusual in several respects (1) the convergent
boundary is discontinuous jumping from westward subduction at northern
Tonga to eastward subduction at the southern New Hebrides (2) it is one
portion of the convergent plate boundary that is not dominated by plate
subduction (3) the broad geologically complex Fiji Platform sits within
the plate boundary (4) two east-trending bathymetric deeps the Vitiaz
Trench and the Hunter Fracture Zone mark the sites of former subduction
zones
16
A ST H E N 0 3 P H ERE
M E S 0 S P H E R E
ridge
trench ALshy
transform fault
Figure 5 (A) Sketch of the different types of plate tectonic boundaries and their relationships (Isacks et al 1968) (B) Diagram of the three types of boundaries in three-dimensional view
16a
Four bathymetric trenches mark the sites of present or former plate
subduction (1) the Tonga and Kermadec trenches extend in a nearly linear
fashion from New Zealand to the northern end of the Tonga arc over 2000 km
in length Their depth reaches 11 km in southern Tonga (2) the New
Hebrides Trench extends from 110 to 23degS reaching 8 km depth in the north
The trench is interrupted in the central segment but plate convergence is
observed along its entire length (Isacks et al 1981) (3) the Vitiaz
Trench appears as a well defined bathymetric deep locally over 6 km in
depth that separates the Mesozoic Pacific Plate lithosphere from the young
back-arc basin lithosphere of the North Fiji Basin Its morphology is
similar to that of active trenches (11alunen 1979) but shallow seismicity
and Quaternary arc-related volcanism are absent (4) the Hunter Fracture
Zone is a well-defined curvilinear belt of ridgetrough topography extending
from Fiji to the southern New Hebrides arc At its western end it intershy
sects the southern termination of the New Hebrides Trench Bathymetric and
seismic reflection profiles across the Hunter Fracture Zone show that the
subduction margin morphology is preserved well into the Fiji Platform
(Brocher and Holmes 1985) The Koro Sea (between Fiji and the Lau Ridge)
represents its eastern termination
The island arcs stand out as bathymetric highs landward of the
trenches (1) the Tonga and Kermadec arcs form a linear bathymetric high
landward of the trenches Quaternary volcanic activity has taken place at
irregular intervals along its length (Figure la) (2) the New Hebrides arc
is a bathymetric high extending parallel to the New Hebrides Trench The
geology of the New Hebrides records an irregular history of arc volcanism
that has persisted over the last forty million years (3) the Lau Ridge is a
17
remnant arc isolated from the Tonga subduction zone by back-arc spreading
in the Lau Basin (Karig 1970) It previously formed part of the active
Tonga arc but is no longer volcanically active (Whelan et al 1985
Woodhall 1985a) (4) the Fiji Platform is delineated by a broad area of
shallow water depths separated from the Tonga and New Hebrides arcs by the
North Fiji and Lau basins The rocks exposed on the Fiji Islands record a
complex history of arc volcanism and deformation beginning in the Late
Eocene and extending into the Quatednary (Rodda 1967 1974 Gill et al
1984 Rodda and Kroenke 1984)
Active back-arc basin spreading has been identified in the North Fiji
Basin and Lau Basin based on shallow seismicity seismic wave velocities
and attenuation high heat flow magnetic anomalies and the presence of
tholeiitic basalts (Karig 1970 Chase 1971 Barazangi and Isacks 1971
Sclater et al 1972) These basins are marked by relatively uniform areas
of shallow water depths (-3 km) surrounding the Fiji Platform Inactive
back-arc basins have been identified in the Loyalty Basin (west of the New
Hebrides Trench) and the South Fiji Basin (south of the Hunter Fracture
Zone) They are marked by areas of relatively deep water that are separated
from the Southwest Pacific Basin by the active arcs and trenches Finally a
major regional scale transcurrent boundary in the interarc region is the
Fiji Fracture Zone (FFZ) The FFZ is most clearly evident as a continuous
belt of seismicity extending westward from the northern termination of the
Tonga Trench (Figure 6) Along several segments of the FFZ the belt of
seismicity coincides with rough seafloor morphology north of Fiji the FFZ
forms the well defined linear boundary of the Fiji Platform Strike-slip
focal mechanisms along its entire length confirm its identification as the
18
10 0 o0
S 0 ~ 0 C Cgt0
15 deg 0 0o 0 0 0 0
200 o 00
00
0 00C
coe20 ston L s 00
300 25 7 a e c th 165 B07 751017 7
dm 0 ( 0 0
165 E 170 175 180 175 W 170
Figure 6 Shallow earthquakes (depth _lt80 km) in the interarc region 1961-1984 Locations are from Preliminary Determination of Epicenters (PDE) constrained by _gt 20 stations Light shading indicates areas gt 2 km depth heavy shading shows areas gt 5 km depth for New Hebrides and Vitiaz trenches gt 75 km depth for Tonga and Kermadec trenches Bathymetric data from Kroenke et al (1983)
19
southern transcurrent boundary of the Pacific Plate in this area (Chase
1971 Isacks et al 1969 Green and Cullen 1973) However new seismoshy
logical and bathymetric observations require that the FFZ be a complex plate
boundary zone rather than a simple linear fault zone
Physiography and Submarine Morphology
The Fiji Platform is marked by the broad apostrophe-shaped shallow
platform at depths shallower than 2 km of which the islands of Fiji are a
small subaerial component (Figure 7) The main islands of Viti Levu and
Vanua Levu account for over 85 of the land mass of the country and are
among the largest of the Pacifics volcanic islands Topographic relief
reaches 1400 m in the interior of Viti Levu 1200 m on Taveuni and 1000 m
on Vanua Levu The islands of the Lau Group represent volcanic edifices
sitting atop the broad remnant arc platform (Karig 1970) forming the
tail of the apostrophe
The volcanic island of Kadavu sits on a separate elongated ridge
paralleling the deep trough of the Hunter Fracture Zone (HFZ) The fracture
zone is defined by an irregular series of deep basins marking the boundary
between the relatively deep Oligocene back-arc basin of the South Fiji Basin
and the shallow late Cenozoic North Fiji Basin A new bathynetric compilashy
tion by Smith and Raicebe (1984) shows the HFZ near Fiji to have a double
ridgetrough structure strikingly similar to the trenchstructural
highforearc basinvolcanic arc morphology conmonly observed in other
subduction zone settings The HFZ continues as a shallower trough into the
Koro Sea east of Viti Levu and its prominent structural signature is
preserved at least as far north as 185degS (Brocher and Holmes 1985)
NORTHCjv
~~ 0
UP
aen
Yadua
Tavun
au
Vau
FIJI ~ 1-BSNBARAVI
~ a ~
BASIN 0
30G
alulele
0 Gau
( 5 ) j
10 -1
OA L k
BASIN Lkb
e ~ aoa~ ~ 5
M a ukru
b t~ mGrou t )
tooa~
LA U
AI ASI
200
~ SOUTH~ 7 J ~Ono-I-L D
0
BASIN
1741E 176 1781W78 6-
Figure 7 Physiography of the seafloor in the Fiji region from Rodda and Kroenke (1984) Bathymetriccontours in hundreds of meters from Kroenke et al (1983) C
21
The Fiji Fracture Zone (FFZ) represents a complex morphological boundshy
ary of the Fiji Platform It is marked by an en echelon series of ridges
and troughs with over 3 km of relief in the portion of the FFZ north of the
Yasawa Group The FFZ is less evident as a morphological feature east of
1785degE north of Vanua Levu where its expression is masked by sedimentashy
tion from rivers draining the northern portion of the island Sharp changes
in strike of the FFZ are observed near 177degE 1788degE and 180 deg
A series of basins west of Viti Levu mark another tectonically active
boundary of the Fiji Platform Troughs up to 4 km depth are prominent along
the western margin of the platform Brocher and Holmes (1985) interpreted
these basins as the physiographic expression of rifting of the forearc
margin of the former Vitiaz arc convergent plate boundary The rough
topography in this area coincides with a belt of shallow seismicity evident
on teleseismic maps (Figure 6)
Within the platform extensive coral reef development is an important
morphological element Fringing reefs and lagoons are evident around most
islands and barrier reefs are developed around the major islands The
reefs are important in limiting the effect of tsunamis originating outside
the islands however in the case of the 1953 Suva earthquake tsunamis were
apparently generated by slumping off the barrier reefs (Houtz 1962a)
Geological Evolution of Fiji
The rocks exposed on the Fiji Islands are among the oldest observed in
the islands of the Southwest Pacific The geology is dominated by
arc-related volcanic and intrusive rocks and thick sequences of volcanoshy
clastic sediments The size of Fijis land mass combined with the presence
of felsic intrusives thick sediment sequences and major orogenic episodes
22
has led Fiji to be described as continental or quasi-continental in
character (Green and Cullen 1973 Eden and Smith 1984) However the Fiji
Platform differs from continental land masses in several important respects
(1) the average crustal thickness of 15-20 km is far les6 than normal
continental crust (2) low mantle velocities beneath the platform demonshy
strate a thermally attenuated lithosphere lacking the thick rigid mantle
lid that underlies most continental crust (3) the presence of ongoing
deformation and Neogene volcanism in the Fiji region observed both around
and within the Fiji Platform indicates a degree of crustal mobility that is
not expected of stable continental masses
Figure 8 presents a simplified geological map of Fiji from Rodda and
Kroenke (1984) The oldest known strata in Fiji are the Late Eocene rocks
of the Wainimala Group (Rodda 1976 Gill et al 1984 Rodda and Kroenke
1984) These strata were mildly deformed during the Wainimala Orogeny
during the middle Oligocene It is marked by a period of nondeposition
throughout Fiji that extends to the latest Oligocene Arc tholeiitic and
calc-alkaline magmatism occurred in Viti Levu throughout the Miocene (Gill
et al 1984 Rodda and Kroenke 1984)
The major orogenic episode in Fiji was the Colo Orogeny around 10 my
BP It is marked by (1) a prolonged gap in the stratigraphic record (2)
widespread folding and faulting accompanied by greenschist metamorphism
and (3) intrusion of tonalite gabbro and trondhjemite The Colo Orogeny
also coincides with a significant arc-deforming event in the New Hebrides
arc uplift and erosion of the Western Belt province at 11-8 my BP
(Carney and Macfarlane 1982)
160 1 1 i
S
VANUALV RAB
ax TAVEU-
17 Seatura V NAMENALALA U MIOCENE - HOLOCENE
_ O
B Rakiraki KORO
K
SEDIMENTARY ROCKS U OLIGOCENE - U MIOCENE UPPER WAINIMALA (includes someIgneous rocks) SIGATOKA (SI) and
SAVURA (Sa) GPS -~~~~ - MO~AKOGAI PLIOACAENE SHOHONITI OVROA
bull CALCALKALINE BASALTIC VOLCA-
Lautoka T Tavua V
NAIGANI Wand WAKAYA
NOES (includes Ba in part andesilic (B)Koroimavua (K) volcanic groups)
K -
ALAU 7BASALTS NA IR 2
BATIKI NAIRA__
JOVALAUMIOCENE HOLOCENE ALKALIC (I Mio on Vili Levu Plio on
Vanua Levu Plio-Pleist on Koro Pleist-Holo on Taveuni)
U MIOCENE - L PLIOCENEMACUADROVE SUPER GROUP
180 _(Vanua Levu) GAU U MIOCENE CALCALKALINE
ROCKS
MIOCENE STOCKS 010 LVPLUTONIC
(D BEOA OLIGOCENELGCN AUASOK SUITE(Tholeiitic )
177degE 178deg 179 deg 180
Figure 8 Simplified geology of Fiji from Rodda and Kroenke (1984) Blank areas within Viti Levu are known or likely Lower Wainimala Group (Late Eocene to Early Miocene rocks)
24
Following the Colo deformation a resurgence of volcanizm took place
throughout Fiji (Gill et al 1984 Woodhall 1985a) An unusual sequence
of thick rhyolitic volcanics were extruded at -7 my BP in northeastern
Vanua Levu that may be related to incipient fragmentation of the Fiji arc
(Gill et al 1984)
During the period 5-3 my BP magmatism in Fiji changed dramatically
to become dominated by transitionalshoshonitic volcanism in northern Viti
Levu and the Lomaiviti Group (Dickenson et al 1968 Gill 1976 Gill et
al 1984) After 3 my BP volcanic rocks in Fiji were dominated by
alkali basalts generated from a very different ocean island-like source
(Gill 1976 Gill et al 1984)
Through the period of arc modification an unusual remnant of
calc-alkaline iolcanism persisted on Kadavu Island at the southern edge of
the Fiji Platform Kadavu is on a major bathymetric ridge paralleling the
Hunter Fracture Zone The trench-like morphology of the fracture zone
(Launay 1982a) combined with the oblique truncation of linear magnetic
anomalies in the South Fiji Basin is indicative of subduction along this
boundary post-dating the Oligocene creation of the South Fiji Basin
Subduction-related andesites and dacites dated at 34 + 05 my BP
(Whelan et al 1985) document convergence along the Hunter Fracture Zone
extending into the Quaternary
Other documented Quaternary volcanism in Fiji is found in the alkali
basalts of the Lomaiviti and southern Lau Groups (Whelan et al 1985
Woodhall 1985a) and on Taveuni Island (Frost 1974) The Taveuni ash
eruption dated at 2050 years BP based on archaeological investigations
is the only documented Holocene activity in Fiji
25 Post-Colo structural deformation is evidenced by faulting of rocks
deposited above the Colo unconformity Many of these faults observed in
Viti Levu are near-vertical with significant stratigraphic throws (Band
1968 Rodda 1974) In many cases the post-Colo rocks are unaffected by
the faults in the underlying basement (Rodda 1974) From the Late
Pliocene the island of Viti Levu has been affected by rapid domal uplift
that has resulted in the abandonment and deformation of late Cenozoic
erosion surfaces in western Viti Levu (Dickenson 1972) Basaltic rocks of
the Ba Volcanic Group erupted as pillow lavas below sea level during the
Pliocene have subsequently been uplifted to over 1000 m elevation in
central Viti Levu (Rodda 1976) This uplift within the Fiji Platform
clearly post-dates the fragmentation of the Vitiaz arc and the establishment
of the present tectonic configuration The observation of anomalous
(low-velocity) mantle beneath the Fiji Platform (Hamburger 1986) reflects
thermal thinning of the Fiji lithosphere associated with the processes of
back-arc magmatism in the neighboring Lau and North Fiji basins The rapid
doming of Viti Levu then may be an isostatic response to the introduction
of low-density mantle material beneath the Fiji Platform
On a historical time scale geodetic observations in southeastern Viti
Levu by Berryman (1981) indicate rates of shear strain on the order of 06
pradyr accumulated over the period 1909-1980 The crustal seismicity that
is documented in the folowing section is the product of ongoing deformation
of the Fiji lithosphere
SPATIAL DISTRIBUTION OF EARTHQUAKES IN FIJI
A prodigious amount of seismicity data has been gathered for the Fiji
region including (1) the historical record of large earthquakes based on
26
macroseismic and instrumental observations (2) teleseismic earthquake
locations from the global seismic network (3) results from an early
three-station network operated in Fiji during 1965-1969 and (4) local and
regional earthquake locations from the telemetered network operated in Fiji
since 1979
The combination of all these data sources provides a composite picture
of the seismicity of Fiji over a wide range of spatial temporal and
magnitude scales each data source is limited by its magnitude threshold
duration of observation and degree of spatial resolution Together they
provide the state-of-the-art in our understanding of where and how earthshy
quakes occur within and around the Fiji Islands The important application
of this understanding is a more realistic assessment of seismic potential
along Fijis seismogenic zones and the seismic risk to major development
within the country
Historical Earthquakes
Fijis short written history prevents a complete reconstruction of the
recurrence cycles of major earthquakes throughout the Fiji region Nonetheshy
less the earthquake history for the past 1) years however incomplete
demonstrates aspects of Fiji seismicity not evident from an examination of
more uniform but shorter-term seismicity catalogs
Figure 9 shows the major historical earthquakes in the Fiji region
from Everingham (1983a 1984) Seventeen major earthquakes with magnitudes
greater than 65 have occurred close to the islands An additional fifteen
events with magnitudes greater than 60 are located in the same vicinity
The locations for these events are based on both macroseismic (intensity)
and teleseismic (instrumental) observations Those occurring before the
27
1971
01982 t1962
1950 a96oO-O a
974 O195760199 0A L9VU 1919 1)
1884 97 199574
0 06 1921 G151AWALEV
G1932
VITI LEVU t869
00 NIJON
195953 05
0934 01953 C5 omI 15
1950 o
01965 D LARGE SHALLOW EARTHOUAKES IN THE FIJI REGION
01955 0 Moviluot 60 - 64 195 IMS) 65 -70
1963 SC-Lt
II I I 1 I
Figure 9 Historical seismicity in the Fiji region Data are from Everingham (1983a 1984)
28
middle of this century must be regarded as approximate Errors of up to one
degree in instrumental locations result from inaccuracies in reporting of
arrival times uneven station distribution manual earthquake locations
etc Reporting of earthquake intensities is not altogether reliable
particularly before the beginning of the century Nonetheless the level of
development in Fiji since 1900 provides assurance that major events have not
been omitted from the catalogs
A large proportion of the major events around Fiji took place along the
microplate boundaries surrounding the platform As with the teleseismic and
microseismic events discussed below these earthquakes concentrate in the
northwestern Lau Basin (large events northeast of Vanua Levu) along the
Fiji Fracture Zone (seven events located north and west of Vanua Levu) and
along a zone of seismicity west of Viti Levu (five events near 176degE)
In contrast to the overall distribution of teleseismically located
earthquakes however several major events occurred within the Fiji
Platform These include the 1953 Suva earthquake (N - 675) the 1932 Koros
earthquake (Ms - 65) and the 1979 Taveuni earthquake (Ms - 69) discussed
in the following sections In addition Everingham (1983a 1984) reported
four significant events near Kadavu Island (1850 1935 and 1950) and one
within Viti Levu (1869) Two smaller but damaging earthquakes took place
near Kadavu (1918) and near Ovalau Island (1906) None of these events
exceeded magnitude (Ms) 71 however several had significant macroseismic
effects and are thus important for seismic hazard evaluation The occurshy
rence of large earthquakes within the platform confirms a conclusion that
emerges from the microearthquake observations intraplate deformation
within the Fiji Platform is a significant component of the regional deformashy
29
tion field but it occurs more infrequently and is separated by longer
periods of quiescence than that occurring along the interplate seismic zones
that bound the platform The obser7ation that earthquakes larger than
Ms - 71 are not recorded in a region characterized by high rates of relashy
tive plate motion suggests that the Fiji lithosphere is incapable of storing
sufficient stress to result in larger earthquakes Because of the brevity
of the seismological history of the Fiji region the occurrence of larger
prehistoric earthquakes cannot be ruled out
Teleseismicallv Located Earthquakes
Figure 10 shows in detail the teleseismically determined distribution
of shallow earthquakes around Fiji (depth lt 80 km) This map includes all
the events located by more than 15 stations of the global seismograph
network from 1961-1983 plus the better located of the earlier events
(1928-1960) that were relocated by Sykes (1966) and Sykes et al (1969)
The criteria used in compiling this catalog are described in detail by
Hamburger (1986) This data set provides generally higher precision
records lower magnitude activity (to mb gt 45) and a larger number of
events than the historical catalog The higher sensitivity improves the
resolution of finer scale spatial patterns Generally the events in this
data set are expected to have absolute errors under 20-25 km The overall
distribution of epicenters presented in this figure shows that on this
limited time and magnitude scale seismic deformation is largely confined to
active interplate zones surrounding the Fiji Platform
The detailed bathymetry in this area shows that the seismic zone north
of the Fiji Islands coincides with the rough topography of the Fiji Fracture
Zone The structural trends inferred from the elongation of the steep-sided
30
15
~ ~ 00
16 C lt -rdeg ro2 0
16 0pound0
~0017 shy
18 bull
00
20O
176 E 177 178 179 180 179 W 178
Figure 10 Teleseismically located earthquakes in the Fiji region Locations from Sykes (1966) and Sykes et al (1969) for 1928-1960 (A and B grades) from International Seismological Summary (ISS) and International Seismological Centre (ISC) catalogs for 1961-1980 and PreliminaryDetermination of Epicenters (PDE) Catalog for 1981-1984 Depth contours for 2 3 and 4 km depth are from Smith and Raicebe (1984)
31
ridges and basins are close to the regional strike of the earthquake belt
Over 3 km of relief is observed in these en echelon ridges and troughs The
nearby island of Cikobia situated northeast of Vanua Levu and directly
adjacent to the fracture zone (location shown in Figure 7) shows marked
Quaternary uplift (Berryman 1979) as additional support of active tecshy
tonism of the area
The seismic zone west of Viti Levu has been proposed as the location of
a North Fiji Basin spreading center (Sclater and Menard 1967 Chase 1971
Brocher and Holmes 1985) The earthquake belt coincides with a series of
Irregular basins with a marked north-northeast trend The basins coincide
with a north-trending free-air gravity low and high-amplitude magnetic
anomalies Seismic reflection profiles show little sediment cover in the
basins and document extensional deformation of the rifted arc margin at
the shelf edge of western Viti Levu (Brocher and Holmes 1985)
A few isolated epicenters are located within the Fiji Platform partishy
cularly in the area east of Vanua Levu A second group of events is located
sout of Viti Levu within and surrounding the Kadavu Island ridge A single
isolated event that appears within the island of Viti Levu is actually a
mislocated aftershock of the 1953 Suva earthquake which is located immedishy
ately south of the main island
Tripartite Seismic Network 1966-1969
Sykes et al (1969) first examined seismicity of the Fiji region using
a network of local seismic stations installed by B L Isacks in 1965 The
three-station network operated for nearly four years and included several
temporary sites throughout the Fiji Islands Locations from the first six
months of network operation were presented in their paper those from the
32
subsequent period were examined by Draunidalo and Hamburger (1984)
HYPOELLIPSE (Lahr 1984) relocations of these events were obtained using the
same velocity model used for telemetered network locations Hypocentral
parameters are given in Hamburger (1986) and the two sets of earthquake
locations are shown in Figure 11 These earthquake locations show the same
prominent seismic zones north and west of Viti Levu as the teleseismic data
shown in Figure 10 with a small number of shocks occurring south of that
island The large aperture of that network did not permit location of very
small events However Sykes et al did observe scattered seismicity in
areas previously thought to be aseismic east and northeast of Viti Levu
southwest of Viti Levu (near Kadavu Island) and in the seismic zone just
offshore southeastern Viti Levu In histograms of S-P intervals of earthshy
quakes recorded at the Fiji stations Sykes et al noted a continuum of
earthquakes with S-P intervals less than 10 sec at the southeastern Viti
Levu station Vunikawai These earthquakes few of which were located must
have occurred within the Fiji Platform rather than along its edges
Furthermore a prominent peak in activity was observed at VUN for S-P
intervals of 1-4 sec reflecting the high activity in the southeastern Viti
Levu seismic zone discussed in the following section
Fiji Telemetered Seismic Network 1979-1985
The seventeen-station national seismic network of Fiji is shown in
Figure 2 The network began operation with the establishment of the
eight-station US AID network in 1979 on the islands of Viti Levu Ovalau
and Beqa supplementing the three stations already operating at Vunikawai
Suva and Nadi
33
S1WRN I[A 41iI
S
2
176 E 177 178 179 180 179 W178
Figure 11 Microearthquakes in the Fiji region 1965-1969 Locations from 3-station seismic network operated by Sykes et al (1969) Triangles show locations of seismic stations Squares indicate locations obtained by Sykes et al for first 6 months of network operation Circles indicate relocations of events reported in subsequent 2 12 years by Draunidalo and Hamburger (1984) Depths constrained at 10 kin Bathymetry as in Figure 10
34
In December 1981 a five-station telemetered network was established
on the islands of Vanua Levu Koro and Taveuni through the Japanese aid
program From that time all the telemetered stations have been recorded on
a Japanese event-triggered 25-channel hot stylus pen recorder In early
1983 the Fiji Mineral Resources Department expanded the network by the
establishment of a three-station telemetry network around Monasavu Dam in
central Viti Levu Considerable technical difficulties have been encounshy
tered at many of the telemetered stations due to unreliable power supplies
degradation of electronic equipment weather-related interference and wind
and lightning damage Such problems have limited the operation of network
stations to some 50-75 of total operating time
The history of network operation is reflected in the histogram of
earthquakes located by the network (Figure 12) The system began recording
in November 1979 and was immediately inaugurated by the occurrence of two
major earthquake sequences the November 16 Taveuni earthquake (Ms - 69)
and its aftershocks and a prolonged swarm of moderate-sized events in
April-May 1980 including three events with ML gt 50 northeast of Vanua
Levu Two additional peaks in the histogram are associated with sequences
west of Viti Levu and along the Fiji Fracture Zone in September and
December 1980 respectively Through 1981 the network operated less
reliably debilitated by technical problems with field stations telemetry
and the recording system
The increase in activity in December 1981 reflected a period of
maintenance and repair of existing instruments and the establishment of the
Japanese aid network Through June 1983 the level of recorded seismicity
was to some degree limited by the operation of an event-triggered recording
120 1 1 1 1 1 1
C 100 Taveuni (65)
H
80 gtNE Vanua Levu
(5054 5051)
0 60
40 W Viii Levu (53)
Fiji Fracture Zone Baravi Basin swarm
Z (58 50)
~(51 KadaVU
51)
Fiji Fracture Zone (57 56 59)
20 1
0 1979 1980 1981 1982 1983 1984 1985
YEAR OF NETWORK OPERATION
Figure 12 Histogram of earthquakes recorded by the Fiji seismic network 1979-1985 Major earthquake sequences are noted with mainshock magnitudes (ML) given in parentheses See text for discussion
36
system The sudden increase in mid-1983 followed the reinstallation of a
continuous recording system and a second period of instrument maintenance
Subsequent peaks in the histogram are associated with major earthquake
sequences near Kadavu Island (July-August 1983) along the Baravi Basin
(June 1984) and along the western Fiji Fracture Zone (October 1984) The
major gap in recording at the beginning of 1985 follows the devastation of
network telemetry by Hurricanes Nigel and Eric The data available at the
time of this writing end in August 1985
Earthquake Locations
During the nearly six years of network operation over 5000 local
earthquakes were recorded by the Fiji seismic network Of these events
approximately 1800 were recorded with sufficient redundancy to provide
reliable earthquake locations Details of the earthquake location procedure
can be found in Hamburger (1986)
A grading scheme was designed to cull out the best locations within
each earthquake source region The earthquakes were first classified into
eight source regions based on the distribution of earthquake foci and their
relation to the seismic network (Figure 13) Grading criteria were applied
consistently within each seismic region but varied from region to region
The criteria used are based on the output parameters from the location
program HYPOELLIPSE number of recorded P- and S-arrivals RMS residuals
minimum epicenter-station distance azimuthal gap and the size of the error
ellipse for each event The grading criteria are summarized by Hamburger
(1986) These grading criteria provide a systematic means to compare
earthquake locations within each area
37
0100 Io15
S FFZ 0 S o TAV 0S
00 0 o o0 0o - 0
0 O 00 0 0 0POFF 0 U _
0 L 0 0
FEo 3 o o o o 0
0 0 o0
SVL o oo LAU 19 degVo o CC 1 0 00 0 0 11760 E 17 o 17 17 r10 17W7
00 0 D 000 0
0 0 0
000
WVL 0 0o KAD
21 1 1 ( - -a
176 E 177 178 179 180 179 W 178
Figure 13 Earthquake source regions near Fiji Regions are defined based
on distribution of earthquakes and relation to network geometry and are used in defining grading criteria See text for discussion
38
Depth Determinations
Determination of reliable earthquake depths is a function of the number
and accuracy of arrival time readings and of the geometry of the network
used for locating each event For earthquakes located within the dense
network of southeastern Viti Levu the pattern of arrival times (or
source-to-station distances) uniquely determines a particular depth at which
the RMS of the traveltime residuals is minimized On the other hand for an
earthquake in the Taveuni region far outside the seismic network the
arrival-time data can be matched by virtually any crustal depth
Because there is very little constraint on hypocentral depths outside
the seismic network the hypocenters of these earthquakes were simply fixed
at a midcrustal depth of 10 km consistent with the observed focal depths in
Viti Levu (see below) Depths were allowed to vary only for earthquakes
within and near Viti Levu and for the small number of events outside this
region recording both P- and S-arrivals at a station within 50 km
The distribution of earthquake depths in Fiji is given in Figure 14
Virtually all the well constrained depths fall within 20 km of the earths
surface and a ubstantial majority at depths lt 13 km A very small number
of earthquakes were located at depths exceeding 30 km but all of these
events are considered poorly constrained (grade D) From the network
locations there is no evidence of any intermediate-depth activity that
might be expected from the recent northward subduction of South Fiji Basin
lithosphere beneath the Fiji Platform (Malahoff et al 1982a Gill et al
1984) A single teleseismic event located south of the Platform at 73 km
depth was found to be a mislocated shallow event The best-constrained
hypocentral depths those located within the small-aperture network in
39
100
80
z ~60
20shy
o
0 10 20 30 40 50
DEPTH (KM) Figure 14 Histogram of hypocentral depths for all earthquakes located bythe Fiji seismic network classified by grade D - unfilled C - light shading B - dark shading A - black
40
southeastern Viti Levu cluster at midcrustal depths of 7-13 km The deepest
A-grade event is near the base of the crust at 18 km The B-grade events
extend to 20 km depth
In general the depth distribution is quite similar to that observed in
areas of continental extension and strike-slip deformation (Chen and Molnar
1983 Smith and Bruhn 1984) Corbett (1984) found earthquakes located by
the southern California seismic network to be limited to the upper 22 km of
crust A similar double-peaked histogram was observed with concentrations
of activity in the upper 4 km and between 10 and 16 km depth Chen and
Molnar ascribe the overall concentration of activity in the upper crust to
high geothermal gradients limiting the material strength in the mantle and
lower crust The observed concentration of seismic activity within the Fiji
crust and the sharp drop-off in activity near its base is consistent with
the observation of anomalous (low-velocity) upper mantle beneath Fiji
stresses sufficient to generate earthquakes can accumulate only in the thin
crust that forms a rigid cap on the relatively hot ductile mantle of the
Fiji Platform
Earthquake Magnitudes
When possible earthquake magnitudes have been assigned to all of the
newly located events in Fiji The magnitudes were computed from trace
amplitudes and coda durations recorded on instruments of the telemetered
network The development of a magnitude scale for the Fiji network is
described in detail by Hamburger (1986)
The distribution of magnitudes reported for all events during the
operation of the seismic network is shown in Figure 15 Magnitudes range
from local magnitude ML - -10 (microearthquakes in southeastern Viti Levu)
41
150
125
W
Z 100
75--shy
25-shy
mm4
62 0 2 4
MAGNITUDE
Figure 15 Histogram of magnitudes for all earthquakes located by the Fiji seismic network
42
to ML - 65 (the large November 1979 Taveuni earthquake) From the largest
events the number of earthquakes in each magnitude range steadily grows to
a maximum of 130 earthquakes in the range ML - 28 - 30 At smaller
magnitudes the number drops due to the networks loss of sensitivity to
small earthquakes outside the network In fact the magnitude threshold may
be somewhat lower due to systematic underreporting of magnitudes of small
events during the latter period of network operation The magnitude
threshold is also evident in the magnitude-frequency relation of Figure 16
This figure shows the log of the cumulative number of events as a function
of magnitude Again a change in character is evident near the threshold
magnitude of ML - 30 At larger magnitudes the curve may be approximated
by a linear slope given by the line
log N - 517 - 080 ML
following Richters formula log N - A shy bM where the A value describes
the level of seismic activity in a region and the b value describes the
recurrence relations for that region The b-value of 080 is in the range
of tectonically active regions throughout the world (see Lee and Stewart
1981) It contrasts with the b-value of 049 obtained for the instrumental
catalog based on magnitudes less than 60 by Everingham (1983c) His low
b-value is based on compilation of surface-wave magnitudes (Ms) and results
in part from underreporting of smaller magnitude events during the early
part of this century
Seismicity Maps
In the following section we present maps of earthquakes in the Fiji
region recorded by the telemetered seismic network As a result of the
improved spatial resolution provided by the telemetered network the maps
3-shy
+
+
2 ++++ ++++ + +++ ++ ++ ++ +++ +++ +++++++++++++ +
-gt 1 U
00
0 2 4 6
MAGNITUDE (ML)
Figure 16 Magnitude-frequency plot for all events located by the Fijiseismic network The portion of the curve above ML - 30 is approximatedby the straight line log N - 517 - 080 ML The maximum network threshold near ML - 30 is indicated by the falloff in the curve at smaller magnitudelevels
44
can be used to characterize the seismic regime along each of the seismic
zones in the Fiji region Space-time diagrams of the network seismicity are
used to elucidate temporal patterns of earthquake occurrence along the
seismic zones Gross sections are presented for the earthquakes located
within and around the island of Viti Levu where depth resolution is
greatest
The 1800 earthquakes located by the telemetered network are presented
in Figure 17 Hypocentral parameters for each event are given in Hamburger
(1986) Figure 18 shows all earthquakes classified by magnitude Detailed
maps of several major earthquake sequences are displayed in Figure 20
Figures 24 and 29 present larger-scale maps of the seismicity within the
island of Viti Levu
Compared to the historical and teleseismic data shown in Figures 9 and
10 these new seismicity maps provide a new detailed picture of the pattern
of deformation within and around the Fiji Platform Several initial obsershy
vations stand out First the pattern of activity is far from uniform
Earthquakes occur in concentrated zones both within and along the boundaries
of the platform large areas exist which are virtually aseismic
Second the major zones of activity along the platforms margins
coincide with those defined by the historical teleseismic and the triparshy
tite network data the northeastern edge of the platform the Fiji Fracture
Zone the basins west of Viti Levu and to a lesser extent the Hunter
Fracture ZoneKadavu region That is these zones are also active at higher
magnitude ranges within a time scale observable by instrumental observashy
tions The areas of high activity within the Fiji Platform are not well
populated in the teleseismic data This contrast between network and
bull bull
45
15 0
0
OO 0 0
0 ~ii
0 A 0f) 0
k 993_
20 0
176 o 07 P 8 7 7178 170
FigZr hwn l atqae 07 oae yteFj esi0a
newoDBahm r asi igr 0
46
15 1 1
+S o16 0 +Q 1
0
0 0 _to017 0o 4 A 0 0
4~0
0 + 0
1 0 0 o +0~ Oc
100 + + 00 00
1 P0 0 0 O 0 00
0 o4
00 + S0 0 + 0 O
D R 01 0
0 00
0 0
21 +0 + 0 I I 176 E 177 178 179 180 179 W178
Figure 18 Map showing all earthquakes located by the Fiji seismic network classified by magnitude Grosses ML lt 2 small open circles 2 lt ML lt 3 large open circles 3 _ltML lt 4 shaded circles 4 lt ML lt 5 filled circles ML gt 5 2-km contour as in Figure 10
47
S i I
t
16
WA
17
00
19 0
20
M~A
176 E 177 178 179 180 179 W 178
Figure 19 Location map for major earthquake sequences presented in Figure 20 Bathymetry as in Figure 10
48
17
0 A S VI VII S
180 E 179 W
A C
19
E 176177
19 V V
C
Figure 20 Maps of major earthquake sequences since establishment of the seismic network (A) November 1979 Taveuni earthquake (ML - 65)(B) December 1980 Fiji Fracture Zone earthquake (ML - 58) (C) October 1984 Fiji Fracture Zone swarm (ML 57 54 59) (D) September 1980 West Viti Levu swarm (ML - 57) (E) July 1983 Kadavu swarm (ML = 51 51 48) Mainshock locations shown by filled squares Focal mechanism(s) and isoseismal data (Roman numerals) shown where available Unshaded bathymetric contours are identical those shown in Figure 10 Earthquake grades D - small open circles C = large open circles B shyshaded circles A - filled circles Large historical earthquakes in the Taveuni area (A) are shown by filled triangles
49
teleseismic observations is fundamentally a sampling problem The intrashy
plate zones of activity are observed by the network because (1) the
intraplate seismic zones are very active at lower magnitude ranges and
(2) the network happened to catch several unusual major earthquake
sequences in areas of relatively low activity The distribution of earthshy
quake magnitudes (Figure 18) bears out both causes (1) the concentration
of activity in southeastern Viti Levu is almost entirely composed of small
events (ML lt 3) Of the 500 earthquakes located within Viti Levu none have
been large enough (mb gt 45) to have been located teleseismically (2) the
concentration of activity near Taveuni Island is the result of a fortuitous
earthquake sequence two weeks after the network began operation In the
following section each of the major earthquake source areas in the Fiji
region are considered in detail (shown in Figure 13)
1 Taveuni (TAV) This area is dominated by two major earthquake
sequences that occurred early in the networks operation The 16 November
1979 Taveuni earthquake (M - 69) is the largest event to occur in thes
region in over 30 years and the most destructive in Fiji since the 1953 Suva
earthquake The earthquake was strongly felt (MM VII in the closest
islands) throughout the islands of Taveuni Vanua Levu Rabi and Kioa
(Figure 20A) An intense aftershock sequence continued for several weeks
following the mainshock and isolated events continued for over a year
thereafter The probable mainshock location was constrained by the pattern
of macroseismic data as well as by S-P intervals at temporary seismic
stations occupying nearby sites in the days following the mainshock
(Everingham 1982a) The teleseismic solutions (PDE ISC locations) did not
utilize the local network observations and are positioned 20 km to the
50
southwest of the probable location In any case the mainshock and aftershy
shock locations indicate that the rupture occurred well within the thickened
crust of the Fiji Platform
The earthquake focal mechanism (Figure 21) was pure strike-slip with
fault planes oriented nearly north-south and east-west These orientations
coincide with neither the northeast-trending bathymetric fabric nor major
faults mapped onshore Vanua Levu or Taveuni But the NW-SE orientation of
the mechanisms T-axis is consistent with the sense of extension inferred
from the axial fissure zone and parallel normal faults that strike along
the axis of Taveuni (Woodhall 1985b) as well as the normal faults that
delimit the Natewa Bay graben separating the twin peninsulas of Vanua Levu
(Green and Cullen 1973) Taveuni is the one locality in Fiji where
Holocene volcanic activity has been documented (Frost 1974) and the alkalic
trend of Taveunis Quaternary lavas reflects this extensional character In
addition the elongation of the volcanic axis of the is]and reflects the
NE-SW direction of maximum compression as described in the Japanese
(Nakamura 1977) Alaska (Nakamura et al 1977) and the New Hebrides arcs
(Roca 1978) The axis of principal compression observed in the Taveuni
earthquake shows the same dominant stress field The historical record for
this region (Figure 9) indicates that major intraplate activity has occurred
near Taveuni throughout this century
A second major sequence of earthquakes occurred northeast of the island
of Vanua Levu (Figure 17) and constitutes a major swarm of activity in
April-May 1980 The sequence included three events with ML gt 5 and nine
events with 4 lt ML lt 5 Recordings from the earthquakes are characterized
by highly attenuated low-frequency P- and S-arrivals and contrast sharply
51
N
T o
0W- 0 shy
00
0
0 0
Figure 21 Focal mechanism for the 1979 Taveuni earthquake Equal-areaprojection of the lower hemisphere of the focal sphere Large open andfilled circles represent clear dilatational and compressional firstmotions respectively Less reliable first motions are shown as small openand filled circles Large and small X-marks indicate clear and uncertain P-wave arrivals respectively that are judged to be near a nodal planeArrows show directions of S-wave polarization The P (pressure) aizd T(tension) axes are located at the base of the letters P and T
52
with those associated with the nearby Taveuni aftershock sequence Because
the propagation path from the Vanua Levu swarm to the seismic network is
nearly identical to that followed by the Taveuni sequence the zone of
attenuation must be located close to the swarms source area In any event
the quality of the arrivals resulted in a generally poor location accuracy
which implies that the strong apparent northwesterly trend to the sequence
is simply an artifact of the poor constraint on station arrival times The
best constrained locations cluster near the northeastern tip of Vanua Levu
island the probable source area for the sequence Like the Taveuni earthshy
quakes this sequence is located within the margins of the Fiji Platform
The area is adjacent to a particularly complex confluence of tectonic
elements where the Fiji Fracture Zone intersects the margin of the Fiji
Platform and Lau Basin The influence of magmatic processes is suggested by
the swarmlike character of the sequence (eg Hill 1977) and the highly
attenuated waveforms (eg Sanford and Einarsson 1982 Iyer 1984) Other
than these two major earthquake sequences the Taveuni region appears to be
quiescent
The temporal distribution of earthquakes in the Taveuni area is shown
graphically in Figure 23E This figure demonstrates the dense clustering of
activity in the 1979 Taveuni mainshock-aftershock sequence and the 1980
swarm offshore Vanua Levu as well as the subsequent quiescence of the
region This pattern is characteristic of intraplate activity within the
platform and contrasts with the more continuous activity along the Fiji
Fracture Zone (Figure 23A) and the West Viti Levu seismic zone (Figure 23B)
Long-term aftershocks of the Taveuni event are recorded up to a year after
the mainshock subsequently the zone is entirely aseismic (at the magnitude
53
15 S 0 0 Ao
16o 0 00 0 0o0171
o o gt 17 B 0 o OoDC
9 00
17 r ef o 0o -- 0 0 D 930--o0
0 0 0 L) I_P
19degoO 0 o 0
00 020 B 0 oO 0o 0- oJ C o 0
0 V 0
21 III176 B 177 178 179 180 179 W178
Figure 22 Map showing locations of space-time diagrams presented in Figure 23 Brackets denote area included in diagrams
A 1 I8--
2993
109 0
S1982 1981 o
I 199
o
0
doo -0
0
bull
0
0
I
A I9s
-0
0
B -
19
MA0
0
0 1993 lt
-
1982
0
I
C0
i I
bO2
I I
0
B C
198
1
CC1913
rL19R7
0-shy
0lt
C
r 9 (
1950
Cb oS00 0
Q I
50 i0
0
0
150 200 70 30o
DISTANCE (KM)
0 bull
0 0
350 400 450
19 1
2920
0
0 = -
o 50
0
0 O0000
0
00 150
DISTANCE
200
(KM)
230 o
300
190
980
29790 0
ishy50 100 150
DISTANCE
0
200
(KM)
230 300
D
19
I
e
I I I D E
1985
I I I 0
I E
lt 0 0
--982
~~~~ P
o
-- A 198
22 S
2920
190
S1981 2
29S(0
1970
o
Oshy Q
0 50 1979
100 150
DISTANCE
200
(KM)
235 300
1~~979
0 30
-0
200 150
DISTANCE
200
(KM)
230 300
Figure 23 Space-time diagrams for main earthquake zones in Fiji Small open circles ML lt 3 large opencircles 3 lt ML lt 4 shaded circles 4 lt ML lt 5 filled circles ML gt 5 Locations shown in Figure 22
55
range to which the network is sensitive) Activity at very small magnishy
tudes like that observed in southeastern Viti Levu is probably charactershy
istic of the Taveuni area as well small events with S-P times less than
10 seconds are recorded on seismographs on Taveuni and Udu Point but are
seldom of sufficient size to be recorded by the remainder of the network
This sporadic nature of intraplate activity underscores the importance of
the network data (low magnitude threshold) and historical data (long time
scale) in evaluating intraplate activity within the Fiji Platform
2 Fiji Fracture Zone (FFZ) Through each period of observation the
area of rough topography north of the platform has been the most seismically
active area of the Fiji region This belt of earthquakes is part of a
larger seismogenic feature 2nd continues to the east as a complex but
continuous zone of seismic activity which extends to the northern end of the
Tonga Trench) Further west it continues as a linear belt of seismicity
into the center of the North Fiji Basin As such it represents the present
southern transform boundary of the Pacific Plate in this area and has been
termed the Fiji Fracture Zone (Green and Cullen 1973 Hamburger and
Everingham 1985) The concentration of large earthquakes along this belt
(Hamburger and Everingham 1985 Hamburger and Isacks 1985 see Figures 9
and 18) confirms the contention that a major portion of the interplate
deformation is taken up there The westward extent of the fracture zone is
more ambiguous as its topographic expression is not well preserved west of
Fiji Seismicity extends into the central portion of the North Fiji Basin
but rapidly drops off west of about 174degE
Within the FFZ the seismic activity is non-uniform At all time and
magnitude scales (Figures 9 10 11 17) the portion of the FFZ directly
56
north of Viti Levu (1765deg-1785degE) has been continuously active The
portions of the FFZ further west and that located north of Vanua Levu (east
of 1785degE) are far less active However the historical record of seismishy
city (Figure 9) shows that significant earthquakes have occurred in the
quiet zone north of Vanua Levu during the last century indicating that the
present quiescence reflects a temporary locking of the plate boundary during
the interseismic period
The difference in seismic regime along the adjacent segments of the FFZ
reflects differences in the dynamics of plate interaction along this
boundary The eastern zone is oriented close to the PacificIndo-Australian
plate motion vector in this area implying predominant strike-slip motion
along the FFZ A sharp kink in the strike of the fracture zone occurs at
1788degE where the seismic activity picks up It is in the portion of the
FFZ west of 1788degE where active rifting has been observed Von
Stackelberg et al (1985) reported minor north-trending bathymetric ridges
offsetting the FFZ bearing fresh hydrothermally altered pillow basalts
These observations indicate that plate motion in this area is accommodated
by extensional as well as strike-slip deformation The continuous
swarm-like activity of the western FFZ is typical of localized areas of
extension within strike-slip tectonic environments (Hill 1977)
The space-time diagram for the FFZ (Figure 23A) clearly demonstrates
this contrast in activity The portion of the FFZ west of 1788degE (lt 225 km
distance) is characterized by virtually continuous activity with larger
events occurring in swarm-like sequences The eastern FFZ is characterized
by more isolated individual small to moderate-sized events Despite the
lower level of activity this quiescent portion of the FFZ has the evenly
57
distributed occurrence of events that is characteristic of the interplate
seismic zones The two major sequences along the FFZ (December 1980 and
October 1984) occurred near the edges of the active zone
These two important sequences are shown in detail in Figure 20BC The
December 1980 cluster was a mainshock-aftershock sequence following a
ML - 58 mainshock The sequence occurred close to the eastern edge of the
fracture zones active belt and close to a pronounced change in strike of
the zone The aftershocks are generally not very well located due to the
limited number of stations operating at the time their distribution sugshy
gests a very small rupture area near 162degS 1785degE
The October 1984 sequence is somewhat more complex and involved three
major events with magnitudes of 57 54 and 59 Centroid moment-tensor
focal mechanism solutions for these three events were available from the
US Geological Surveys Preliminary Determination of Epicenters This
sequence took place on the western end of the active zone near a second
change in strike of the FFZ The mainshocks are all characterized by
strike-slip faulting with east-west nodal planes paralleling the western
segment of the fracture zone The third major event of the sequence occurshy
red 125 km north of the fracture zone in a normally quiet portion of the
North Fiji Basin While this event may be considered a coincidental occurshy
rence its proximity in time and the similarity of mechanism suggest that
the earthquake was triggered by the rupture along the fracture zone The
east-west trend of the mechanisms nodal planes implies that it was the
portion of the FFZ west of 1775degE that ruptured during the sequence rather
than the active ENE-trending segment
58
At moderate magnitudes (3 lt ML lt 4) the portion of the FFZ between
17680 and 1788degE is continuously active In contrast the same area is
devoid of major historical events (Figure 9) During the six years of
operation of the telemetered network the two major earthquake sequences
along the FFZ nucleated at the edges of the active zone These phenomena
indicate that slip occurs relatively freely along the ENE-trending active
segment accommodated by continuous occurrence of small earthquakes and by
possible aseismic slip The occurrence of back-arc extension within the
seismically active portion of the FFZ also indicates that normal stresses
acting along this portion of the FFZ are at a minimum Slip along the
east-trending relatively quiescent portion of the FFZ occurs in major
earthquake sequences such sequences may nucleate at the edges of the active
zone
3 West Viti Levu Zone (WVL) Some 200 earthquakes are located in the
seismic zone forming the western edge of the Fiji Platform Like the events
northeast of Vanua Levu many of the WVL earthquakes produce poorly
recorded low-frequency shear arrivals that degrade the location accuracy in
this area In general the epicenters coincide with a series of bathymetric
troughs that mark the extensionally deformed margin of a former forearc
terrane (Larue et al 1980 Brocher and Holmes 1985) While the activity
in this zone is considerably lower than that along the Fiji Fracture Zone
the character of earthquake occurrence (Figure 23B) is similar--earthquakes
occur irregularly throughout the network operation The WVL zone is marked
by relatively high activity on all time and magnitude scales (Figures 9 10
11)
59
The bathymetric troughs west of Viti Levu are part of an area of rough
seafloor morphology where the 4 km-deep troughs approach the shelf slope of
the Fiji Platform Parallel to and inland of the troughs an elongate
bathymetric ridge forms the outer edge of the Baravi Basin This basin is a
sediment-filled trough located west and south of Viti Levu interpreted by
Brocher and Holmes (1985) to represent the forearc basin of the active
pre-Late Miocene Fiji volcanic arc The bathymetric ridge was interpreted
to represent a structural high analogous to the trench slope break of active
convergent margins in the terminology of Karig and Sharman (1975)
Single-channel seismic reflection profiles are suggestive of extensional
deformation of basin sediments near this former arc margin (Figure 4 in
Brocher and Holmes 1985) This sediment deformation combined with high
heat flow (Sclater and Menard 1967) and high-amplitude magnetic anomalies
(Brocher and Holmes 1985) provides evidence for recent North Fiji Basin
extension that Brocher and Holmes attributed to the Neogene rotation of
Viti Levu If this process is continuing the associated deformation should
be reflected in the present-day seismicity
The most importaLlt sequence within the WVL zone took place in September
1980 and constituted a mainshock-aftershock sequence which followed a
magnitude 57 earthquake in the southern pcrtion of the seismic zone (Figure
20D) The mainshock located at 192degS 1765degE appears to have been
mislocated as the aftershock zone is positioned some 40 km or more to the
north extending no further than the area 184deg-189degS
The focal mechanism solution for the mainshock of this sequence indishy
cates strike-slip faulting with a significant normal component (from
Everingham 1985) The NNE strike of the sinistral plane of this mechanism
60
coincides with the strike of the seismic zone and also parallels the deep
basins west of Viti Levu This observation suggests that the basins forming
the western margin of the Fiji Platform are presently accommodating a
dominant component of left-lateral strike-slip faulting parallel to the
basins strike The sense of motion along this fault is close to that
observed throughout the eastern North Fiji Basin and within the Fiji
Platform
Thus the hypothesis of simple extensional deformation of the WVL zone
is not supported by the seismicity patterns associated with the 1980
sequence Rather they suggest that in its present configuration the
western margin of Fiji is accommodating a significant degree of strike-slip
motion Nonetheless the attenuation of seismic waves that originate in
this zone the high heat flow the recent extensional deformation of the
margin and the high-amplitude short wavelength magnetic anomalies suggest
that backarc rifting is a significant component of deformation in this area
However contrary to Brocher and Holmes simple model of mid-ocean
ridge-type extension this area like the Fiji Fracture Zone appears to be
characterized by a leaky transform-type extension dominated by strike-slip
deformation In this case the proposed transform faults offsetting the
west Viti Levu basins would become a series of left steps of a longer
sinistral strike-slip feature According to this model rifting is concenshy
trated along the shallower ridges separating the basins rather than within
the basins themselves
4 KadavuHunter Fracture Zone Region (KAD) This zone stands at the
intersection of a former convergent plate margin with the Fiji Platform
The Hunter Fracture Zone is a well-defined curvilinear belt of ridgetrough
61
topography extending from Fiji to the southern New Hebrides arc At its
western end it intersects the southern termination of the New Hebrides
Trench The transition between these two features is a morphologically
complex zone characterized by subduction-related volcanism on Matthew and
Hunter Islands irregular bathymetric features on the upper plate and
intense shallow seismic activity (Louat 1982 Maillet and Monzier 1982
Monzier et al 1984) In fact bathymetric and seismic reflection profiles
across the Hunter Fracture Zone show that the subduction margin morphology
is preserved well into the Fiji Platform The Koro Sea (east of Viti Levu
see Figure 7) represents its eastern termination Hinge-faulting focal
mechanism solutions at the western end of the HFZ document tearing of the
Indo-Australian Plate (Hamburger and Isacks 1985) Chase (1971) pointed
out that shallow seismicity along the Hunter Fracture Zone rapidly drops off
east of 174degE where it was hypothesized to intersect a major North Fiji
Basin spreading center East of this intersection the fracture zone may
simply mark a relict lithospheric scar tracing the westward migration of the
southern New Hebrides arc Malahoff et al (1982a) and Gill et al (1984)
however proposed that the fracture zone has accommodated oblique subduction
of South Fiji Basin lithosphere as recently as che early Quaternary In
fact Kadavu Island is the one area of Fiji where calc-alkaline volcanism
persisted beyond the Pliocene (Gill et al 1984 Whelan et al 1985)
Nonetheless the absence of an inclined seismic (Benioff) zone and shallow
thrust-type mechanisms suggests that the Hunter Fracture Zone is not accomshy
modating plate convergence at present however isolated earthquakes do
occur along the entire length of the Hunter Fracture Zone and major events
62
have occurred near its intersection with the Fiji Platform (Figures 9 and
10)
A significant number of earthquake recorded by the seismic network are
located in this region Virtually all of them are positioned landward of
the Fracture Zone and its continuation into the Koro Sea The depths of
these events are not well constrained but there is no evidence of any
intermediate-depth subduction-related seismicity in this zone
The major earthquake sequence in this zone is the Kadavu earthquake
swarm of July-August 1983 (Hamburger anO Qiolevu 1983) The swarm
included over 100 earthquakes and culminated in mainshocks of magnitude 51
51 and 48 The maximum intensitLes were reported in westernmost Kadavu
(MM V-VI) and several landslides were triggered by the largest of the
mainshocks The earthquakes occurred approximately 20 km offshore western
Kadavu (Figure 20E) along a submarine extension of the Kadavu ridge
The concentration of activity at shallow depths of the HFZ demonstrates
active deformation of the upper plate of this former subduction zone plate
kinematic arguments suggest that the HFZ is presently accommodating extenshy
sion between the South Fiji Basin (Indo-Australian Plate) and the Fiji
Platform The shallow activity is the manifestation of that deformation
5 Lau Ridge (LAU) This is the least active portion of the Fiji
region most of the earthquakes within this seismic region are in fact
located along the western edge of the ridge or within the eastern Koro Sea
One reliably located event however is positioned within the central
portion of the ridge it was recorded by the temporary station operating on
Lakeba Island (Figure 2) Tectonically the Lau Ridge is now part of the
stable Indo-Australian Plate and the major deformational areas are the
63
extensional centers of the Lau Basin to the East the Fiji Fracture Zone to
the North and the Hunter Fracture Zone to the west No major historical
earthquakes (Figure 9) are reported in this region Quaternary volcanism
has been reported at several localities in the Lau Group (Whelan et al
1985 Woodhall 1985a) and recent tilting of the islands was observed by
Taylor (1978) Teleseismically located earthquakes are reported from the
southern Lau Ridge This evidence of recent tectonism indicates that the
stability of the Lau Ridge is only relative and that there is potential for
moderate-sized earthquakes even within this relatively quiescent block of
the Fiji region
6 Offshore Viti Levu (OF0T This seismic region is characterized by
low activity relative to the active belts of seismicity surrounding this
region The low activity is reflected in a minimum in S-P intervals at
times of 6-20 seconds at seismic station Vunikawai in southeastern Viti Levu
(Sykes et al 1969) It is striking that the broad shallow shelf north of
Viti Levu (Bligh Water Basin) is virtually devoid of seismicity (for ML gt 3)
through the entire period of network observation Activity is observed only
near the 1 km-deep trough (Vatu-Ira Channel) separating the basin from the
western shelf of Vanua Levu This trough follows a major structural trend
controlling Pliocene volcanism in the Lomaiviti Group (Green and Cullen
1973) and has been proposed as an active transform fault terminating the
Hunter Fracture Zone (Rodda and Kroenke 1984) This corclusion is
certainly not warranted by the seismological data however the bathymetric
and structural trends combined with the concentration of activity here
indicate fault control
64
A second area of seismic activity is the area surrounding the island of
Koro near the termination of the Hunter Fracture Zone This zone has been
active at low magnitude levels during several brief periods of activity
(Figure 23E) It is clearly a zone of significant seismic potential
evidenced by the occurrence of a major historical event the Ms 65 Koro-
earthquake of 1932 (Everingham 1982b) The area is an important confluence
of major structures the western end of the Hunter Fracture Zone terminates
against the strong northeast-striking structural fabric of eastern Vanua
Levu and Taveuni (Green and Cullen 1973) There is evidence that convershy
gence along the HFZ has terminated (Hamburger 1986) but the Late Pliocene
and Quaternary volcanic activity landward of the fracture zone attests to
its recent activity Throughout the area south and east of Viti Levu
seismic activity is concentrated on the landward (north and west) side of
the bathymetric trough The extensional stresses deforming the Fiji
Platform do not appear to significantly deform the lithosphere of the
neighboring South Fiji Basin or its continuation into the arc complex the
Koro Sea However where the South Fiji Basin lithosphere meets the
deformed arc lithosphere south of Vanua Levu it becomes a zone of high
seismic activity and is capable of a damaging earthquake of the size of the
1953 Suva or 1979 Taveuni events
A third area of high activity is observed in the opposite corner of the
offshore region the Baravi Basin Here like other intra-platform seismic
zones activity is concentrated in several discrete periods of activity
separated by long periods of quiescence (Figure 23C) Activity is focussed
along the 2 km depth contour marking the edge of the Fiji shelf The
contour also marks the edge of a major sedimentary basin fed by the rivers
65
of southern and western Viti Levu (Larue et al 1980) It is characterized
by free-air gravity lows to -70 mgal that result from up to 3 km of sediment
fill in the basin Seismic reflection profiles across the basin (Brocher
and Holmes 1985) demonstrate significant post-Pliocene extensional deformashy
tion along the its seaward margin The high-angle faults show a significant
normal displacement but a strike-slip component is also suggested by
Brocher and Holmes based on the coincidence with structural trends in the
West Viti Levu zone In any case the major earthquake sequences in
1979-1980 and 1984 demonstrate ongoing deformation of the Baravi Basin
margin Like other actively deforming zones close to the Fiji Platform the
apparent quiescence of the Baravi Basin at larger magnitudes (Figures 9 and
10) is likely to be a temporary one reflecting a period of interseismic
strain accumulation
7 Central Viti Levu (CVL) Within the island of Viti Levu the
telemetered seismic network offers the best opportunity for evaluating the
detailed characteristics of crustal seismicity associated with deformation
within the Fiji Platform The island of Viti Levu is also the source area
for the most destructive earthquake in Fijis history the 1953 Suva earthshy
quake (Ms - 675) making it the critical focal point of seismic hazard
analysis for the country
The earthquakes within the island of Viti Levu (Figure 24) are concenshy
trated in two zones one a broad swath extending from central Viti Levu
across the island to Ovalau the second a dense concentration of earthshy
quakes within and offshore the southeastern portion of the main island
Cross sections AA and BB (Figure 26) taken across the entire island
demonstrate the relative quiescence of northern and western Viti Levu and
66
177 E 0
178 A+
179
Figure 24 Moip of earthquakes within and around the island of Viti Levu Earthquake grades D - crosses C - open circles B - shaded circles A - filled circles Light shading shows areas of relief gt 75 m dark shading emphases high inland Nadrau Plateau at elevation gt 750 m Topography from Dickenson 1972 Faults from Rodda and Band (1966) are shown by heavy lines 100 500 and 1000 m bathymetric contours are from Smith and Raicebe (1984) Seismic stations are shown as filled triangles
67
17
B 000
0 0
AI or o C oOOo deg0 0018 0
D0 n OC 0A 0 0 0
0 0 0
o1o r 0o c( (~ 0 0 0
177 E 178 179
Figure 25 Map showing locations of cross sections A-D within the islandof Viti Levu Brackets denote area included in sections
A B B0 00 0 DD B0
40 o6
0 0- 0 d 3020l -o 6 ~ deg0
0 0a
C CAR 0
40O-5~~ 30 0o6amp A0l0l0 0 0 0shy deg
20 - 0o e
2 0 0 4 0
100050 go000
012
50 4 00
0 20o
o oo0 o
bull bull
o A 25
D0 -
0 o
0
0
15shy
8 10 300 10 20 30 40 30 0 20 30 40
Figure 26 Cross sections within the island of Viti LevuFigure 18 Locations shown in Figure 25 Symbols denote earthquake grades as inTriangles at top of sections denote positions of seismic
stations along strike of the projections No vertical exaggeration Note that scales vary from section tosection
0
69 the dense concentrations of microearthquakes in the central and southeastern
portions of the island The sections also demonstrate graphically the confinement of seismicity to the upper 20 km of Fijis lithosphere The two subcrustal events at 42 and 45 km depth are poorly constrained (grade D) and are considered to be mislocations The limiting depth is close to the average crustal thickness of -19 km this coincidence of focal and crustal depths is unique in all other areas of extensional and strike-slip tecshytonism the seismicity does not extend deeper than midcrustal depth (Chen and Molnar 1983) Little information however is available from tectonic
settings comparable to Fiji The errors in hypocentral depth determinations and in crustal thickness estimates permit the existence of a relatively
thin aseismic lower crust In any case the crustal activity begins to taper off from 13 km depth the majority of the earthquakes take place in
the upper two-thirds of the crust
The cross sections CC and DD examine the earthquake clusters in central Viti Levu Two notable groupings stand out one near 178degS
1778degE which will be referred to as the Nadrau swarm and a second near 178degS 178degE which will be referred to as the Monasavu swarm Approxishymately fifty earthquakes occurred in clusters of activity from early 1980 to mid-1981 in the western or Nadrau swarm Because only the southshyeastern Viti Levu stations were operating at the time the swarm earthquake
depths in this area are poorly constrained they appear to correspond to those observed within the seismic network that is generally limited to the upper 20 km of crust (cross section CC Figure 26) A small number of deeper events are located in this area but these too probably remain
within the thickened crust beneath the axis of Viti Levu The swarm
70
included three events with magnitudes ML gt 3 The cause of the swarm is
unclear but it is located on the western flank of the large central uplift
at the core of Viti Levu Adjacent to the Nadrau Plateau is a broad upland
basin the Mbukuya-Nandrungu basin According to Dickenson (1972) this
heavily dissected inland valley of Pliocene age was rapidly deformed from a
gently graded concave stream valley to a convex plateau surface at 300-500 m
above sea level this uplifted valley surface has been deeply incised by
modern streams whose floors are 50-150 m below the plateau surface
Because of their posicion outside the seismic network focal mechanism
solutions for individual events are not available however a composite focal
mechanism for the Nadrau swarm indicates east-west extension but is comshy
patible with either a dip-slip (pure normal faulting) or strike-slip
solution In either case the direction of extension is compatible with the
regional direction of extension inferred from strike-slip focal mechanisms
in the North Fiji and Lau basins (Hamburger 1986) The crustal flexure
induced by the rapid domal uplift that is peculiar to central Viti Levu is
also likely to result in localized extensional stresses
The second concentration of activity in central Viti Levu is the
Monasavu swarm positioned atop the central uplift of Viti Levu (Figure 24)
This earthquake sequence presents a strong case for reservoir-induced
seismic activity The earthquakes also occur at crustal depths those well
constrained by the nearby Monasavu seismic station are shown to occur in the
upper 4 km of crust (cross section DD Figure 26) adjarent to the Monasavu
Reservoir The Monasavu Dam is an 82-meter high earthfiil dam on the Nanuku
Creek which impounds 133 x 106 metric tons of water it is designed to
provide hydroelectric power for the island of Viti Levu The dam is the
71
largest public works project in the countrys history and represents the
major critical structure from the standpoint of seismic risk Earthquakes
within Viti Levu were unknown during the planning for the project but a
subsequent historical study (Everingham 1983a) has uncovered at least one
major event during the last century of a size that could affect the dams
structure The dam was completed in April 1982 and rapidly filled to its
operating volume by February 1983 Three felt earthquakes shook the damsite
as the water first approached its spill level when the water weight in the
reservoir increased most rapidly (J Campbell pers comm 1984) The
three shocks of magnitude 33 27 and 28 were part of a sequence
including 14 recorded events several of the events were strongly felt in
the surrounding villages (Everingham 1983d) Each of the swarm
mainshocks triggered a strong-motion accelerograph atop the dam producing
peak accelerations of 013 g 007 g and 004 g all on the north-south
component of the accelerograph (Figure 27) A nearby accelerograph posishy
tioned on bedrock adjacent to the dam went untriggered demonstrating
considerable amplification of ground acceleration by the dam structure The
accelerograms are all extremely similar in character with large monoshy
frequency oscillations on the north-south component clearly shown by a
sharp peak in the Fourier amplitude spectra at a period of 02 sec
(Figure 28) This component is oriented transverse to the dams structure
and indicates probable resonant oscillation of the dam as a whole
The limited number of stations operating at the time of the swarm did
not permit very accurate locations of the mainshocks However the mainshy
shocks are shallow and positioned within 5 km of the dam and the deepest
part of the reservoir
-- -- -- -- ------- ------------ ----
----------------------------- ---
- -
--- -- -- -- -------------- -- -- -- -- --
-----------------------
72
MONASAVU r
FIJI MONASAVU DAM ___
13 February 1983 09 53 003 UTC
- - - - - - - - L - - - - - - - - - - -
FIJI MONASAVU DAM 14 February 1983 12 18 416 UTC
I - - - -
WEST
FIJI MONASAVU DAM U
23 February 1983 UP 15 17 303 UTC
SOUTH
I 5 sec -
Figure 27 Accelerograms from strong-motion accelerograph operating on Monasavu Dam Viti Levu from earthquakes of 13 14 and 23 February 1983 (ML- 33 27 and 29 respectively) North-south component is transverse to the dams structure Figure is from Silverstein 1985
I F I0
0C1)F
LUJ
(M(---Utj
CJ
CL 0_
2 CE
- I shy_
Cc =3
0 a a I I i p a a I I a
70 5 10 15 20 25
FREOUENCT HZ Figure 28 Fourier amplitude spectrum of acceleration from Monasavu Dam accelerograph earthquake of 13 February 1983 North-south component transverse to dams structure Note resonance at approximately 5 Hz
73
The area is one of significant background activity evidenced by nine
events located in the reservoirs vicinity prior to impoundment and numerous
reports of felt earthquakes in the area (Everingham 1983d) Nonetheless a
case for reservoir-induced activity can be made on several grounds (1) The
coIncidence of the February 1983 swarm with the peak in reservoir water
level (2) the proximity of these and subsequent events to the deepest
portion of the reservoir (3) the recording of 270 events at the Monasavu
seismic station with S-P intervals less than about 1 second during a
17-month recording period (Stuart 1985)
The third group of earthquakes in east-central Viti Levu follows the
trend of a belt of sediments of the Upper Wainimala Group (Early-Middle
Miocene) that separates the Pliocene Ba Volcanic Group in northern Viti Levu
from the Late Miocene to Recent deposits of the Rewa Basin in southeastern
Viti Levu (Verata Sedimentary Group see Figure 8) The basin is
fault-bounded on its western edge (Rodda 1967) the lineation of epicenters
along its northern edge suggests fault control along this margin as well
8 Southeastern Viti Levu (SVL) This seismic region is densely
populated by small-magnitude events (Figures 18 and 29) within the tightly
spaced US AID seismic network (see Figure 2) Many of the events in this
zone are very small (to ML - -10) and recorded only by 3 or 4 nearest
stations The apparent concentration of activity in this area is thus to a
large degree a product of the station distribution Nonetheless a real
concentration of activity does exist in the southeastern Viti Levu area
based on several observations (1) there is a concentration of earthquakes
of ML gt 2 for which uniform coverage is available for the entirety of Viti
Levu (Figure 15) (2) several earthquakes were located in this area by the
74
181
jS 0 711E) 0 0
186shy
178 E 1787
Figure 29 Map of earthquakes in southeastern Viti Levu Topographybathymetry faults and symbols as in Figure 24
74 a
tripartite network during 1965-1969 whereas the remainder of Viti Levu
appears to be altogether aseismic (Figure 11) (3) a peak in S-P intervals
was observed at times of 1-4 seconds at station Vunikawai corresponding to
earthquakes in the SVL zone (Sykes et al 1969) (4) several felt earthshy
quakes have originated in this portion of Viti Levu including the destrucshy
tive 1953 Suva earthquake (Houtz 1962ab Everingham 1983a 1984) Earthshy
quakes occur both on- and offshore southeastern Viti Levu They are concenshy
trated near the coast in the area extending from Suva to Navua that was
most severely affected by the 1953 Suva earthquake (Houtz 1962a) The
Houtz (1962a) H location of the 1953 mainshock based on macroseismic
data submarine cable breakage and tsunami traveltimes is directly within
the dense nest of activity offshore Viti Levu (Figure 29) The teleseismic
location by Sykes et al (1969) S is significantly offset from the main
zone of activity Based on Houtzs field observations and the microearthshy
quake activity recorded by the telemetered network the Houtz location is
accepted as the best estimate of the earthquake epicenter Houtz proposed a
normal (33 km) focal depth for the Suva earthquake while Sykes et al found
a 21 km depth The shallower depth is supported by the distribution of
earthquakes offshore Viti Levu and by the character of the P-waveform
recorded on long-period instrumeits at teleseismic distances Cross section
HH (Figure 31) shows that earthquake depths in the area like those within
Viti Levu are limited to the upper 22 km the best constrained events are
limited to the upper 15 km of crust The Suva earthquake is likely to have
occurred at a similar midcrustal depth this is also suggested by the
limited area from which maximum intensities were reported
75
o 0 C B E
18 1 E 1787 Vo s d oe i
Figure30 Map showing ~lcation Vitigt rces ahdlns
of crs etosEwihnsuhatr 0eun hdn eoeae nlddi
cross se1ins crs e sci 1
76 FE FE
0 0
5-o q o qo
o o obull7 o c o oo
0
T Vo Wq
15 V4 S0
C20 C 4
20- 0Io 10 o
25shy
30 IS 0-10 20 30 40 50
20
G G 0
25
bull I
o 301 LC 0 5 to 15 20 25
10 H H
o 0o10- c c qC
202
253
300 I 30 I- I0 5 10 15 20 25 0 10 20 30 40
J j 0 iI l i
0
bull o o
C o0Cc c b
o 4B
15- oC o o
0 5 1 5 20 25 30
Figure 31 Gross sections E-J within southeastern Viti Levu Locationsshown in Figure 30 Symbols as in Figure 24 No vertical exaggeration Note that scales vary from section to section
77 The well located events offshore Viti Levu fall into three groups two
north-trending belts of activity (near 178250 E and 17835degE) offset by an
east-trending segment near 183degS The epicentral pattern is suggestive of
small fault segments within a broad complex zone of deformation offshore
Viti Levu The north-south trends are close to the strike of a series of
submarine canyons that cut the shelf of Viti Levu as well as to important
structural trends in south-central Viti Levu (Houtz 1959) A subtle change
in actiriry occurs near the coast (cross section JJ Figure 31) where
activity wiuely distributed thrccent-haut the crust gives way to discrete nests
of fault-related activity within Viti Levu
On land the southeastern Viti Levu seismicity is located within an area
of faulting which disrupts the Oligocene to Pliocene strata exposed in the
southeastern portion of the island In only one case has an upper age limit
been placed on faulting in this area by the presence of a Miocene intrusion
post-dating the tectonism In all other cases faulting may have continued
into the Quaternary (P Rodda personal communication 1984) While
Tertiary faulting is documented elsewhere in Viti Levu faulting is particushy
larly evident in this portion of the island (Rodda and Band 1966) The
association with active shallow seismicity suggests that renewed (or conshy
tinuing) movement along these faults in southeastern Viti Levu is accomshy
modating the present stress system of the Fiji region That this portion of
Fiji is presently deforming is also corroborated by geodetic observations in
southeastern Viti Levu Berryman (1981) used retriangulation of six benchshy
marks in southeastern Viti Levu and one on Beqa Island to analyze shear
strain within the southeastern Viti Levu seismic zone Only by omitting the
Beqa benchmark and one of the Viti Levu benchmarks could a consistent strain
78
pattern be resolved With this correction Berryman determined a shear
strain rate of 06 pradyr accumulated over the period 1909-1980 The
direction of maximum compression determined was nearly east-west in
contrast with the east-west extension determined from focal mechanism
solutions However the area from which the data are taken (within southshy
eastern Viti Levu) is within the area strongly affected by the 1953 earthshy
quake Thus the deformation may be dominated by the coseismic movement
rather than continuously accumulating coseismic strain In any case the
data do suggest that significant hoLzontal deformation is taking place in
an area coinciding with the southeastern Viti Levu seismic zone
The earthquakes occur in discrete clusters within the seismic zone
Two densely populated centers of activity are located in southern Viti Levu
they are tightly clustered in space and time The Waidina swarm near
180-S 17825-E is characterized by low magnitude activity
(-09 _lt ML lt 29) occurring within a six-month period from late 1979 to
early 1980 In cross section (EE and FF Figure 31) the well located
earthquakes define a narrow cylindrical zone less than 15 km in width
extending from 3 to 14 km depth The swarm coincides with the eastern
termination of a major east-striking fault the Nakasu Fault (Colley
1976) which paralls the southern boundary of the large Middle Miocene
Wainivalu stock (Whelan et al 1985) At its eastern end the fault
terminates at a small intrusive body located along the western flank of the
Medrausucu Range Based on field observations this Miocene intrusion is
thought to post-date activity along the fault (P Rodda personal communicashy
tion 1984) in fact the high activity along its margin suggests a concenshy
79
tration of stress where movement along an active fault is limited by the
presence of this intrusion
The second major swarm in southeastern Viti Levu is the Waimanu swarm
located near 1815degS 17825degE The swarm had a magnitude range similar to
the Waidina swarm and was also clustered in time In cross section (G
JJ Figure 31) the well located events originate from a small volume
located at depths of 10-12 km The swarm is located along a 10 km-long
near-vertical normal fault that offsets a gabbro stock of probable Colo
(Middle Miocene) age (Band 1968) The northeast trend of the fault coincishy
des with that of a series of important post-Colo normal faults The trend
is also close to that defined by the new mechanism for the Suva earthquake
and indicates probable reactivation in a strike-slip sense
A secondary concentration of activity is observed along the
Wainivakidau Fault another of the northeast-striking faults that deform the
late Tertiary rocks of southeastern Viti Levu The sense of throw on this
fault is similar to that observed near the Waimanu swarm Earthquakes along
the fault are concentrated at midcrustal depths (cross section EE
Figure 31)
Earthquake Focal Mechanisms
Only a limited amount of information is available on the state of
stress and the nature of faulting within the Fiji Platform As described by
Hamburger and Isacks (1985) and Hanburger (1986) earthquakes in the intershy
arc region describe two basic fields of stress one associated with the
Fiji Fracture Zone characterized by strike-slip faulting along east- to
northeast-striking fault planes and a second found throughout the Lau
80
Basin and the eastern North Fiji Basin characterized by east-west extenshy
sion along northeast- and northwest-oriented strike-slip faults
The two teleseismic mechanisms within the platform are for the 1979
Taveuni earthquake (Figure 2i) and for the 1953 Suva earthquake (Figure 32)
The Taveuni earthquake revealed a mechanism of strike-slip faulting similar
to but rotated slightly from the mechanisms along the fracture zone
It is discussed in greater detail in the presentation of the Taveuni
earthquake
The Suva earthquake is important not only because of its destructive
effects but also because of its distance from the FFZ it reflects the
stress field within the interior of the Fiji Platform This earthquake will
thus shed light on the causes and the potential for large intraplate events
within the platform A mechanism -or this event was obtained by Hodgson
(1956) but is considered unreliable because of his reliance on reported
first motions use of reported motions for reflected phases (PP pP pP
PcP etc) and uncritical mixing of short- and long-period observations
In the case of the Suva earthquake the contradictory first motion reports
from stations within the western US and Europe forced him to fit a plane
through these fields Our analysis indicates that both areas are characshy
terized by dila-ional first motions significantly altering the earthquakes
focal mechanism
Analysis of the Suva earthquake is difficult because of the paucity of
high sensitivity long-period seismographs as well as the uneven
geographical distribution of stations In order to evaluate the focal
mechanism all available seismograms were gathered from stations cperating
at the time Intermediate- or long-period records were obtained from New
81
N
Qo
00
S
Figure 32 Focal mechanism for the 1953 Suva earthquake Equal-areaprojection of the lower hemisphere of the focal sphere Large open and filled circles represent clear dilatational and compressional first motions respectively from long-period instruments Moderate-sized circles are fom intermediate- or short-period instruments Small circles are less reliable first motions Small + and - symbols are reported first motions from Hodgson (1956) Solid lines show orientation of S-wave polarizations P- and T-axes as in Figure 21
82 Zealand Australia Japan the western US the eastern USSR and Europe
Short-period records were also examined but given less weight than reliable
long-period first motions S-wave polarizations were available only from
three short-period stations in Japan the eastern USSR and Indonesia but
were of considerable help in constraining the fault planes The best-fit
solution shown in Figure 32 indicates strike-slip faulting with a signishy
ficant but not very well constrained dip-slip component The east-west
extension shown by the position of the T-axis as well as the northwest and
northeast strikes of the nodal planes are remarkably similar to those
observed in the neighboring Lau and North Fiji basins While one mechanism
is not necessarily representative of the entire stress field in the platshy
form this earthquake demonstrates that a major part of the contemporary
deformation in the platform takes place by strike-slip faulting in response
to extensional stresses
Houtz (1962a) favored a northwesterly-striking fault plane for the Suva
earthquake based on the orientation of submarine canyons offshore southern
Viti Levu In fact the canyons strike in a north to north-northeast
direction (Houtz 1959) which parallels neither of the fault planes
Several major structural features cortenad the interpretation of the
northeast-striking fault plane (1) the Suva Peninsula (Figure 29) forms a
major northeast-trending promontory along the coast it is composed of
uplifted Pliocene marine sediments of the Medrausucu Group (Suva Marl Rodda
et al 1985) The western edge of the peninsula defines the deep-water
Suva Harbor dropping to over 20 m depth within 300 m from shore The edge
of the peninsula is marked by parallel lineaments recognized in airpilotos
and the sediments in the harbor are sharply truncated against the peninsula
83
suggesting active faulting along the basin edge (G Shorten personal
communication 1984) (2) the northeast trends are also important in the
faulting observed in southeastern Viti Levu (Band 1968 Figure 29) (3) a
major northeast-striking structural fabric is reflected in the unusual
submarine morphology near Beqa Island south of Viti Levu The barrier reef
has a pronounced nortneast-striking linear trend as does the scarp that
defines the Kadavu Passage to the south (Figure 29) (4) a major structural
high termed the Beqa-Vatulele Lineament separates the deep Suva and
Baravi sedimentary basins offshore southern Viti Levu (Brocher and Holmes
1985) This northeast-trending feature is marked by strong gravity and
magnetic anomalies (5) the overall trend of the seismicity offshore Viti
Levu is suggestive of a northeast-striking zone From the foregoing the
northeast-striking sinistral shear fault of the Suva earthquake focal
mechanism is chosen
Earthquakes located by he telemetered network provide additional
information on intraplate deformation in the platform The small number of
stations that record the microearthquakes in southeastern Viti Levu limits
the quality on individual focal mechanism solutions The first-motion
directions recorded on the network stations constrain but do not uniquely
determine earthquake fault planes Most events can be satisfied by a range
of solutions from pure strike-slip to nearly pure dip-slip Upper hemishy
sphere projections for six events in southeastern Viti Levu are shown in
Figure 33 with both strike-slip and dip-slip solutions where possible
Because of the dominance of strike-slip faulting throughout the region we
have chosen the strike-slip solution as primary However the first-motion
data alone do not demand this
84
A commonality to the southeastern Viti Levu focal mechanisms is docushy
mented in Figure 34 The earthquakes T-axes whether for strike-slip or
dip-slip mechanisms are dominated by an east-west orientation Similarly
the P-axes are generally oriented north-south The pattern of stress
orientation is very close to that observed in the 1953 Suva earthquake
(shown by the letters P and T in Figure 34) and coincides with the
stress field in the North Fiji and Lau basins
The focal mechanism for the 1953 earthquake is corroborated by a
composite focal mechanism for events located immediately offshore Viti Levu
shown in Figure 35 The first-motions for these events are consistent with
a strike-slip mechanism with fault planes oriented parallel to the fault
planes determined from the Suva earthquake A normal faulting solution is
equally possible (dashed lines in Figure 35) In either case the east-west
T-axis coincides with the regional direction of principal extension
The stress orientations within the Fiji Platform demonstrate that the
platform is not isolated in a plate tectonic sense from the interaction of
microplates along its boundaries The seismic deformation in the back-arc
basins east and west of Fiji is dominated by the east-west growth of the
interarc region Hamburger (1986) showed that this extension takes place
through strike-slip faulting along northeast- and northwest-trending fault
planes The same process is taking place in Fiji This former arc terrane
once deformed by major compressive stresses is now being extended by
ductile thinning of the lithosphere by creation of new oceanic crust around
its edges and by major strike-slip faulting both surrounding and within the
platform
85
N N
-_ o P
0 amp 7912-7 0618 80419 1921
073178-147 18 71 178-147
2 S
80619 1430 8600
Figure3m 33 Ffor et a18k27 178it152
o IT
0712 0222 84312 0041 deg D18 f 73 17 8deg013 9 163 17802511
Figure 33 Focal mechanisms for earthquakes in southeastern Viti LevL based on data obtained from the telemetered network Upper hemisphereprojections Syrrols as in Figure 21 Both strike-slip (solid lines) anddip-slip (dashed lines) solutions are compatible with first motion directions
86
N
0 00
0
00
T PS Strike-Slip S 0
Dip- Slip 0
Figure 34 Summary of P- and T-aes from network focal mechanisms shown on upper hemisphere projection P- and T-axes of the 1953 Suva earthquakeare given for comparison at base of letters P and T
87
0
0 0
0 0 0
0 P 0 0bull 0T
S
Figure 35 Composite focal mechanism for earthquakes located immediatelyoffshore Viti Levu Symbols as in Figure 21 lower hemisphere projectionBoth strike-slip (solid lines) and dip-slip (dashed lines) solutions arecompatible with first motion directions Large and small letters P and T represent P- and T-axes for strike-slip and dip-slip solutionsrespectively
88
CONCLUSIONS
Our seismicity studies in Fiji have led to several significant new
conclusions that bear directly on the earthquake hazard to Fijis populashy
tion
(1) Major earthquake zones are located along the edges of the Fiji
Platform where deformation is concentrated These zones are continuously
active at moderate magnitudes (ML 3-5) The seismic regime along one of
these zones (the Fiji Fracture Zone) varies as a function of the zones
orientation relative to the plate motion directions
(2) Secondary earthquake zones are located within the Fiji Platform
Large earthquakes occur more sporadically separated by long periods of
quiescence Many of these zones are active at low magnitudes (ML lt 3)
(3) Earthquake depths are shallow concentrated in the upper 18 km of
Fijis crust The distribution is similar to that in other areas of extenshy
sion and strike-slip deformation
(4) Earthquake magnitudes in the Fiji region have all been less than
71 Despite the large rates of relative plate motion in the area the thin
lithosphere may be incapable of storing large stresses to generate great
earthquakes (Ms gt 78)
(5) The large 1953 Suva earthquake occurred at 182degS 1783degE
(Houtzs location) at crustal depths by strike-slip faulting The stress
orientation from the focal mechanism is similar to that observed in the
North Fiji and Lau basins indicating that the platform is not isolated from
the regional tectonic stresses The nodal plane striking NSO0 E is chosen as
the probable fault plane
89
(6) Microearthquakes in Viti Levu occur as a result of extensional
stresses similar to those determined from the Suva earthquake
(7) Earthquakes in central Viti Levu may be related to the rapid
doming of the island A group of events near Monasavu Reservoir were
induced by rapid filling of a large artificial lake in the interior of the
island
(8) Earthquakes in southeastern Viti Levu occur in discrete nests that
are tightly clustered in space and time They are related to a series of
near-vertical east to northeast-striking faults that cut the Mio-Pliocene
rocks of southeastern Viti Levu
These empirical observations combined with the our regional studies of
the Southwest Pacific described by Hamburger (1986) permit several imporshy
tant tectonic conclusions to be drawn
(1) Fiji is part of a large shear system connecting the Tonga and New
Hebrides arcs extension is taking place throughout the region along short
irregular spreading centers and leaky transform faults involving both
strike-slip and extensional deformation
(2) While convergence appears to have taken place along the Hunter
Fracture Zone in the past there is no evidence for present-day convergence
Rather this plate boundary appears to be reactivated by extensional or
strike-slip deformation of the upper plate
(3) The Fiji Platform is rotating in a clockwise sense relative to
the tectonic blocks that form its northern western and southern boundshy
aries This rotation is interpreted as P relatively stable block resisting
more rapid counterclockwise rotational shear of the surrounding matrix
(4) The extension that produced the deep basins west of Viti Levu has
90
been replaced by strike-slip faulting that follows the basins strike
(5) Major iniraplate earthquakes occur throughout the southern Fiji
Platform but at longer recurrence intervals than the interplate events
that surround the platform
ASSESSMENT OF EARTHQUAKE HAZARD
Earthquake Recurrence Intervals
Evaluation of the recurrence history of a particular region can be
investigated using (1) teleseismically recorded instrumental history of
earthquakes (2) recu-rence relations of smaller earthquakes recorded by
seismograph networks (3) pre-instrumental historical records of large
earthquakes and (4) evidence of prehistoric large earthquakes observable in
the geological record
Instrumental historical records exist from the late 19th century to the
present as indicated elsewhere in this report From this data set shown in
Figure 9 it is evident that the recurrence intervals along even the most
active seismic belts surrounding the Fiji Islands exceed the historical
records Thus the repetition of events along say the Fiji Fracture Zone
cannot be resolved Nonetheless the data do help constrain the overall
recurrence of large earthquakes in the entire Fiji region This problem is
addressed by the frequency-magnitude relation observed by Everingham (1983c)
for the period 1918-1960 as shown in Figure 36 This period of observation
suggests that earthquakes of magnitude Ms 7 or greater occur= at the rate
of 48 eventsl0O yrs (or every 21 years) while earthquakes of magnitude
65 or greater occur at the rate of 429 events100 yrs or every 2 12
years A similar relation was obtained from network studies by Hamburger
(1986) and is shown in Figure 15 This magnitude-frequency relation sugshy
91
I I I
000
z
Z-10
w
D z~1o
Ushy
w L10
0 b=0 50
b=097
()0111
-1
I SOOO 1900-1973
5 6 MAGNITUDE M
IS
7 8
b16
50 I I
60 A
MAGNITUDE MS
70
Figure 36 Magnitude frequency plot for all earthquakes in the Fijiregion 1918-1960 (from Everingham 1983c)
92
gests recurrence of magnitude ML - 7 or greater at the rate of 65
eventsl0O years or every 15 years Magnitude 65 earthquakes according
to this relation would be expected at a rate of 162 eventsl00 years or
every 6 years In view of the differences in time sampled magnitude scale
used and area included in the two studies the agreement is remarkably
good The studies indicate that large potentially destructive earthquakes
are expected to occur in the Fiji region within the lifetime of critical
engineering structures
Earthquake Potential
An estimate of the maximum potential earthquake in this area has been
considered by Everingham (1983c) and is shown graphically in Figure 37 In
compiling this graph Everingham computed annual energy release based on a
magnitude-energy reiation for the period 1918-1982 The avcrage rate of
energy release for the region is equivalent to that produced by a single
yearly earthquake with magnitude Ms - 65 However the rate of energy
release is not constant and is marked by periods of activity and
quiescence The range of energy release is shown by the two dashed lines in
Figure 37 and the maximum likely energy release may be expected to fall
within the bounding curve Should this energy release be concentrated in a
single large event its magnitude would be approximately 75 This is
slightly larger than the maximum observed historical event in Fiji but is a
realistic design earthquake for the most active zones surrounding the Fiji
Islands From this relation Everingham also noted a 30-year cyclicity to
the energy release in Fiji Periods of high activity occurred in 1923-32
and 1952-60 A third period of high activity may be expected in the coming
93
- I
-2 -
m -
0
L1
3400 60 70 19
Figure 37 Cumulative energy release in the Fiji region 1918-1982 (fromEveringham 1983c)
94 few years terminating a relatively quiescent period for the period
1961-1982
Clearly the earthquake potential is not uniform throughout the Fiji
region Historically large earthquakes have concentrated in zones surshy
rounding the Fiji Platform with isolated large events occurring within the
platform itself In Figure 38 we separate the Fiji region into zones of
seismic potential based on the available seismicity data summarized in the
previous section
Zone I (Fiji Fracture Zone Taveuni-northeast Vanua Levu region West
Viti Levu zone western Lau Basin) This seisinic region is characterized by
high levels of seismicity on all time and magnitude scales (Figures 9 10
11 17 18) These belts apparently accommodate a large portion of the
PacificJndo-Australian plate motion The largest recorded earthquake in
this belt was a magnitude 71 event that occurred northeast of Vanua Levu in
1949 Considering the history of earthquake energy release discussed above
a conservative estimate of Mmax along these active zones is Mmax - 75
Zone II (Kadavu region Hunter Fracture Zone Baravi and Suva Basins
Koro Sea) this area is one of moderately high seismic potential with a
history of occasional large earthquakes separated by long periods of
quiescence This zone includes large events near Kadavu in 1850 1950 and
1963 the 1932 Koro earthquake and the 1953 Suva quake The largest of
these events was the magnitude 67 Suva earthquake This zone has been much
less active at moderate magnitudes than zone I (Figures 10 11 18) but is
clearly capable of large and potentially destructive events We have
included southern and eastern Vanua Levu in zone II based on evidence for
small-magnitude activity near southern Vanua Levu (Figure 18) structural
95
15
PCJi iii~l~ii~i~rIN
16
177
200
I N - s
2 1 ____
176 E 177 178 179 180 179 W 178
Figure 38 Seismic zoning of the Fiji region See text for discussion
95a disruption of the CaukandroveNatewa Bay region (Green and Cullen 1973) and
the confluence of the Hunter Fracture Zone with the Fiji Platform A
reasonable maximum design earthquake for this zone is Mmax - 70 A larger
event is possible but is considered less likely here based on the hisshy
torical record of seismicity in this zone
Zone III (central and eastern Viti Levu Ovalau Island Vatu-Ira
Channel this zone is characterized by far lower activity than zones I and
II with the exception of a single destructive event in the mid-nineteenth
century (Figure 9) is virtually devoid of historical activity However
low-magnitude activity is common in this region (Figures 17 18)
Reservoir-induced activity at Monasavu Reservoir in central Viti Levu
attests to significant tectonic stress accumulation in that area The
maximum probable earthquake for this zone is Mmax - 65
Zone IV (northern and western Viti Levu Bligh Water Basin northern
Vanua Levu South Fiji Basin Lau Ridge) these areas have been virtually
devoid of seismic activity on all time scales Isolated microearthquakes
have occurred in this zone but no significant activity has been observed
These areas represent the most stable blocks within the broad
PacificIndo-Australian plate boundary and are not expected to generate
significant activity in the future Nonetheless because of its proximity to
the active zones of deformation earthquakes to magnitude Mmax shy 60 should
be considered possible for this area
Macroseismic Effects of Large Earthquakes
Expected values of strong ground motion are of prime engineering
interest However even if the recurrence interval of large earthquakes
near Fiji were reliably forec-ast a major difficulty arises in trying to
96 translate earthquake size into actual values of ground motion at a partishycular site To date amp relatively large number of strong-motion acceleroshygrams have been generated in the far field of large earthquakes especially in California and Japan The difficulty in using magnitude-acceleration
relations developed elsewhere lies in the extreme variability in attenuation of ground acceleration in various geologic environments (eg Hays 1980) The absence of ground acceleration data for Fiji makes direct predictions of structural effects of earthquakes difficult Hopefully the presence of strong-motion accelerographs distributed throughout Fiji (Figure 3) will
change this situation over the coming decades
Until that time we are altogether reliant on observations of intensity of ground shaking That is the large historical events in Fiji have been studied by their effects on cultural features (ie houses) rather than near-field seismological observations (ie strong-motion accelerograms) The magnitude-intensity relations observed for Fiji may then be used to predict the distribution of intensities that may be expected from large earthquakes along the major seismic zones close to the Fiji Islands (Figure 38) In some cases the predicted intensities can be translated (under rather questionable assumptions) to peak ground accelerations from intensity-acceleration relations obtained elsewhere (eg Hays 1980) For this study we have used only intensities to avoid the added complication of
intensity-acceleration conversion
Everingham (1984) has summarized the available information on observed intensities in Fiji based on six moderate to large events during this century Modified Mercalli intensities observed in Fiji as a function of magnitude and epicentral distance are shown in Figure 39 These relations
97
MS7
DEPTH 20KM
6 0
w
z 4
1979 MS 6-9 bull _
GO 0 53 675 x
3- X 19 69 0 75 52
DISTANCE KM
Figure 39 Earthquake intensities (Modified Mercalli Index) observed inFiji as a function of magnitude and epicentral distance (fromt gveringham1984)
98 were used to compute maximum intensities generated by design earthquakes
located along each of the seismic zones defined in the previous segment
These predicted maximum intensities given for population centers in Viti Levu and Vanua Levu and several of the outer islands are shown in Table 1 These predictions provide a basis for conservative engineering planning
and civil defense decisions that pertain to development in Fiji
Several important caveats however should be taken into consideration
in using these maximum intensities
(1) they are only estimates based on extrapolations from the brief
historical record of earthquakes in Fiji The design earthquakes for each
seismic zone are considered to be realistic upper bounds on the magnitudes
expected there However anomalous unpredictLd earLiiatiRkes tat exceed
that size are conceivable occurrences
(2) the estimates contain no information on recurrence of intensities
Thus the recurrence of a given intensity may be much higher for one site than another site depending on the return time for large earthquakes on the
neighboring seismic zones as well as the substrate of each site
(3) the estimates are based on far-field effects of earthquakes
Information on near-field effects of even moderate events in Fiji are
scanty and highly unpredictable Thus a magnitude 5 event directly
beneath a city may produce extremely high intensities in a very restricted
area close to the epicenter
Tsunami Hazard
In addition to the direct damage from groun shaking in the vicinity of
an earthquake large earthquakes in the southwest Pacific have been shown to cause considerable damage at both regional and global distances by
99
Table 1 Predicted maximum intensities of ground shaking (Modified Mercalli Index) generated by maximum probable earthquakes along the seismic zones shown in Figure 37
Zone I Zone II Zone III Zone IV Location Mmax - 75 Mmax shy 70 Mmax shy 65 Mmax shy 60
Suva 5-6 8-9 8 4-5 Lautoka 67 7 7-8 7 Nadi 6-7 8 7-8 7 Monasavu 6 8 8 6 Ba 6-7 6-7 7-8 7 Sigatoka 6 8-9 8 6-7 Labasa 8 8-9 6 7 Savusavu 8 8-9 6-7 6-7 Ovalau 6 8 8 4-5 Koro 7-8 8-9 6 4-5 Kadavu 5-6 8-9 5 3-4 Lakeb-a 6 5 3-4 7 Yasawa Group 9 6-7 5-6 7 Taveuni 9-10 8-9 5 6-7
100
earthquake-generated tsunamis Tsunamis (seismic sea waves) are caused by
displacements in submarine copography that are induced by earthquakes andor
volcanic activity occurring below or near the floor of the ocean Low-lying
areas near the coast are particularly vulnerable to damage by these waves
The shallow seismic zones of the Southwest Pacific have a history of
earthquakes-generated tsunamis (Figure 40) A few tsunamis have originated
in the Fiji region Two significant tsunamis occurred in 1881 and 1953 the
latter was associated with the 1953 Suva earthquake A smaller event
located southwest of Suva in 1975 generated a very small sea wave
(Everingham 1983b) Major Pacific-wide tsunamis such as those generated
along the South American or Alaskan plate margins apparently are not
generated near Fiji Significant local tsunamis however may be associated
with large shallow earthquakes in the immediate vicinity The potential for
tsunamis is of particular importance in view of the concentration of popushy
lation anamp development in low-lying coastal areas of Fiji
A tsunami education program for the residents of Fiji is recommended
(Appendix IV contains a listing of safety rules from the National Oceanic
and Atmospheric Administration (NOAA) which operates the Pacific tsunami
warning system in Hawaii USA)
Volcanic Hazard
Quaternary volcanic activity is far less prevalent in Fiji than elseshy
where in the Southwest Pacific Volcanism less than 2 million years old has
been reported in only six localities in Fiji (Naigani Kadavu Koro Moala
Mago and Taveuni Islands see Rodda and Kroenke 1984) There is no
historical record of volcanic activity in Fiji However Frost (1974)
reported evidence for a prehistoric eruption on Taveuni Island dated at
101
10 I1i
1967
-980
amp) C32
0
St 1905-11
15
1881 g1917
20
1878(2) 2 0 12 O~~
1976
Fiji
1953
1975 j
-
0
1977
~19 15 18 5
0- l948
~~853
000 1977
25 -r 0 198
0 00
1977
30
165deg 170 E 175 180
1917(2)
1976
W
0 0 200 400 Kilometers
175 170
Figure 40 Tsunami history of the Southwest Pacific Filled circles indicate locations of tsunamigenic events dashed circles indicate inferred locations of tsunamigenic events
102 2050 plusmn 150 years before present based on carbon dating Elsewhere there
is no evidence for volcanic activity younger than 250000 years and thus
volcanic activity presents little threat to the inhabitants of those
islands The recent activity on Taveuni warrants seismic monitoring in the
future
Eruptions elsewhere in the Pacific can also have significant effects on
Fiji The submarine eruptions at Home Reef Tonga during March 1984 proshy
duced large quantities of pumice which subsequently rafted across vast
areas of the Southwest Pacific The floating pumice piled ashore locally
and resulted in serious problems with shipping in the region (SEAN Bulletin
1984)
IMPLICATIONS FOR MITIGATION OF EARTHQUAKE RISK
Several significant steps may be taken that will significantly mitigate
the loss of life and property from future earthquakes in Fiji The
following five paragraphs provide suggestions for mitigation of the earthshy
quake risk
Earthquake Education
First an earthquake education program in Fiji should be strongly
encouraged At minimal cost to the Government such a program may be
mounted through the schools Red Cross programs and through the news media
In other countries earthquake education programs have taught simple methods
of strengthening house construction and minimizing hazardous conditions
within the home they have warned of tsunami hazards to coastal dwellers
they have instructed on proper behavior during an earthquake they have
helped to encourage storage of emergency food water and equipment in many
103
households and importantly they have helped avoid panic during an earthshy
quake and stimulated cooperation with government officials following such a
disaster Earthquake education programs are effectively combined with other
disaster preparedness programs (eg cyclones floods and so on)
Building Codes
Second adoption of stringent building codes for all of Fiji is impershy
ative The experience of the 1953 Suva earthquake (Houtz 1962a) demonshy
strates the severe effects of a moderate-sized earthquake near the capital
There is a very real danger of a larger earthquake occurring very close to
Suva the effects of such an event would be multiplied by the increased
development since 1953 In general the adequacy of construction is a major
factcr controlling the damage and loss of life brought on by such an earthshy
quake Building codes designed for areas of similar earthquake hazard such
as New Zealand Code A California Building Codes or Papua New Guinea
Codes 1 or 2 may be appropriate for the portions of Fiji at greatest risk
Certainly New Zealand Code B should be mandated for all public edifices
in Fiji Observation of such codes is most crucial for public multistory
buildings in the major towns of Viti Levu and Vanua Levu As important as
the design of such buildings is the construction methods and quality of
construction material used to implement building design Careful monitoring
of construction by competent engineers is important for critical facilities
Emergency Civil Defense Procedures
Third specific Civil Defense plans for emergency procedures following
an earthquake or tsunami should be developed Of course earthquake preshy
paredness plans have much in common with hurricane or other natural disaster
104
planning that has been implemented in Fiji but specific effects of earthshy
quake occurrence must be considered structural damage to multistory
buildings interruption of water supply disruption of electrical and gas
lines secondary geological effects such as ground liquefaction or landshy
slides in the near-source region complicating effects of aftershocks in the
days and weeks following a major earthquake The primary structure for such
civil defense plans already is in place in Fiji Programs specific to the
earthquake hazard may be added following similar programs in Papua New
Guinea and New Zealand
Long-term Seismicitv Observations
Fourth long-term seismicity and strong motion observations should be
continued and supported by both the Fiji government and overseas aid proshy
grams In the long-term such information will help to refine estimates of
seismic potential along the plate boundaries that surround Fiji they will
help to more directly and accurately assess the ground motion parameters of
direct concern to engineers for building design in Fiji--ground accelershy
ation frequency spectra horizontal and vertical components of ground
motion local amplification effects and so on Furthermore seismicity
patterns may provide a key to long-term forecasting and short-term predicshy
tion of the location and size of future earthquakes that may affect Fijis
population
International Cooperation
Fifth international cooperation among the island countries of the
Southwest Pacific may significantly help in Fijis earthquake preparedness
program All of the countries affected by earthquakes (Tonga Western
105
Samoa Fiji Vanuatu Solomon Islands Papua New Guinea and New Zealand)
have to varying degrees developed earthquake preparedness programs Fiji
may take advantage of the previous current and any future efforts of the
other countries in the region
106
REFERENCES
Band R B Geology of southern Viti Levu and Mbengga Bull Geol Surv Fii 15 1968
Barazangi M and B L Isacks Lateral variations of seismic waveattenuation in the upper mantle above the inclined zone of the Tonga island arc Deep anomaly in the upper mantle J Geophys Res 76 8493-8516 1971
Berryman K Seismotectonic zoning stud of the Fiji Islands EarthDeformation Section Report 70 Wellington NZ DSIR 40 pp 1979
Berryman K Retriangulation of Navua base net (across Suva-Mbenggaseismic zone) Fiji Islands August 1980 Earth Deformation Section Report Wellington NZ DSIR 26 pp 1981
Brocher T M and R Holmes The marine geology of sedimentary basinssouth of Viti Levu Fiji in Investigations of the Northern Melanesian Borderland edited by T M Brocher Circum-Pacific Council for Energy andMineral Resources Earth Science Series Tulsa Oklahoma Amer Assoc Petrol Geol pp 122-137 1985
Calder N The Restless earth A Report on the New Geology The VikingPress New York New York 1972
Carney J N and A Macfarlane Geological evidence bearing on the Miocene to Recent structural evolution of the New Hebrides Arc Tectonophysics 87 147-175 1982
Chase C G Tectonic history of the Fiji Plateau Geol Doc Amer Bull L2 3087-3110 1971
Chen W P and P Molnar Focal depths of intracontinental and intraplateearthquakes and their implications for the thermal and mechanical properties of the lithosphere J Geophys Res 88 4183-4215 1983
Circum-Pacific Council for Energy and Mineral Resources Plate tectonic mapof the circum-Pacific region southwest quadrant 110000000 Amer Assoc Petrol Geol Tulsa Oklahoma 1981
Colley H Metallogenic map of Viti Levu Min Resources Div Fiji Ma 552 1976
Corbett E J Seismicity and crustal structure studies in southernCalifornia Tectonic implications from improved earthquake locationsPhD thesis 231 pp California Institute of Technology 1984
Dickenson W R Dissected erosion surfaces in northwest Viti Levu FijiZ Geomorph N F 16 151-167 1972
107
Dickenson W R M J Rickard F I Coulson J G Smith and R L Lawrence Late Cenozoic shoshonitic lavas in northwestern Viti Levu Fiji Nature 219 148 1968
Draunidalo K B and M W Hamburger Seismicity of Fiji 1965-1969 Min Resources Dep Fiji Note BP 3014 7 pp 1984
Eden R A and R Smith Fiji as a Petroleum Prospect Suva Min Resources Dep 8 pp 1984
Everingham I B Focal mechanism for the 16 November 1979 earthquake near Taveuni Fiji Min Resources Dep Fiji Report 49 1982a
Everingham I B The 1932 Koro earthquake epicenter Mineral Resources Dep Fiji Note BP 331 14 pp 1982b
Everingham I B Reports of earthquakes felt in Fiji 1850-1940 Min Resources Dep Fiji Report 48 54 pp 1983a
Everingham I B The effects of the 16 December 1975 earthquake in Kadavu Passage Fiji Min Resources Dep Fiji Note BP337 16 pp 1983b
Everingham I B Magnitude determinations for shallow earthquakes in Fiji and their implications Min Resources Dep Fiji Rep 48 1983c
Everingham I B Preliminary report of seismic events in the Monasavu Dam area Min Resources Dep Fiji Note BP 332 14 pp 1983d
Everingham I B Provisional list of felt earthquakes reports in Fiji 1941-1981 Min Resources Dep Fiji Note BP 338 17 pp 1984
Everingham I B Focal mechanisms of earthquakes near Fiji Min Resources Dep Fiji Note 1985
Frost E L Archaeological excavations of fortified sites in Taveuni Fiji Asian Pacif Archaeol Ser Univ Hawaii 6 1974
Gill J B From island arc to oceanic islands Fiji southwestern Pacific Geology 4 122-126 1976
Gill J B Stork A L Whelan P M Volcanism accompanying back-arc basin development in the Southwest Pacific Tectonophysics 102 207-224 1984
Green D and D J Cullen The tectonic evolution of the Fiji region in The Western Pacific Island Arcs Marginal Seas Geochemistry edited byPJ Coleman Nedlands University of Western Australia Press pp 127-145 1973
Halunen A J Tectonic history of the Fiji Plateau PhD thesis 127 pp University of Hawaii Honolulu HI 1979
108
Hamburger M W Seismicity of the Fiji Islands and Tectonics of the Southwest Pacific PhD thesis 3i2 pp Cornell University Ithaca NY 1986
Hamburger M W and B L Isacks Seismicity and seismotectonic studies in the Southwest Pacific Min Resources Dep Fiji Note BP3015 50 pp 1983
Hamburger M W and Qiolevu S R The Kadavu earthquakes of July-August 1983 Min Rescurces Dep Fiji Note BP 337 15 pp 1983
Hamburger M W and B L Isacks Shallow seismicity of the North FijiBasin in Basin Formation Ridge Crest Processes and Metallogenesis in the North Fiji Basin edited by L W Kroneke and J V Eade Circum-Pacific Council for Energy and Mineral Resources Earth Science Series Tulsa Oklahoma Amer Assoc Petrol Geol in press 1986
Hamburger M W and I B Everingham Seismic and aseismic zones in the Fiji region in Proceedings of the International Symposium on Recent Crustal Movements of the Pacific Region edited by W I ReillyWellington NZ 9-14 Feb 1984 in press 1986
Hays W W Procedures for estimating earthquake ground motions US Geological Surv Prof Paper 1114 77 pp 1980
Hill D P A model for earthquake swarms J Geophys Res 82 1347-1352 1977
Hodgson J H Direction of faulting in some of the larger earthquakesof the southwest Pacific 1959-1954 Publ Dominion Observ Ottawa 18 171-216 1956
Houtz R E Submarine canyons near Suva as possible fault lineations Rep Geol Surv Fiji 51 3 pp 1959
Houtz R E The 1953 Suva earthquake and tsunami Bull Seismol Soc Amer 52 1-12 1962a
Houtz R Note on minor damage caused by the Suva earthquake of June 1961 Bull Seismol Soc Amer 52 13-16 1962b
Houtz R E and H W Wellman Turbidity current at Kandavu Passage Fiji Geol Mag 99 57-62 1962
Isacks B L L R Sykes and J Oliver Focal mechanisms of deep and shallow earthquakes in the Tonga-Kermadec region and the tectonics of island arcs Geol Soc Amer Bull 80 1443-1470 1969
109
Isacks B L R K Cardwell J L Chatelain M Barazangi J M Marthelot D Chinn and R Louat Seismicity and tectonics of the central New Hebrides island arc in Earthquake Prediction An International Review Maurice Ewing Ser edited by D W Simpson and P G Richards pp 93-116 1981
Iyer H M Geophysical evidence for the locations shapes and sizes and internal structures of magma chambers beneath regions of Quaternary volcanism Phil Trans Roy Soc Lond A310 473-510 1984
Karig D E Ridges and basins of the Tonga-Kermadec island arc system J Geophys Res 75 239-254 1970
Karig D E and G F Sharman III Subduction and accretion in trenches Geol Soc Amer Bull 86 377-389 1975
Kroenke L W C Jouannic and P Woodward Bathymetry of the Southwest Pacific Chart 1 of Geophysical Atlas of the Pacific CCOPSOPAC 1983
Lahr J C HYPOELLIPSEVAX A computer program for determining local earthquake hypocentral parameters magnitude and first-motion pattern US Geol Surv Open-File Rep 84-519 60 pp 1984
Larue B M J Y Collot A Malahoff A sedimentary structure southwest of Viti Levu Fiji The Baravi Basin in Symposium on Petroleum Potential in Island Arcs Small Ocean Basins Submerged Margins and Related Areas UN ESCAP CCOPSOPAC Tech Bull 3 Wellington NZ DSIR pp 77-83 1980
Launay J Morphologie et structure de larc insulaire des Nouvelles-Hebrides dans sa terminaison sud in Contribution a ]Etude Geodvnamigue du Sud-Ouest Pacifioue Travau et Documents de ]ORSTOM No 147 pp 163-178 1982a
Launay J Essai de schema tectonique de la terminaison sud de larc insulaire des Nouvelles-Hebrides In Contribution a 1Etude Geodynamique du Sud-Ouest Pacifique Travaux et Documents de lORSTOM No 147 pp 217-220 1982b
lee W H K and S W Stewart Principles and Applications of Microearthquake Networks New York Academic Press 292 pp 1981
Louat R Seismicite et subduction de la terminaison sud de larc insulaire des Nouvelles Hebrides in Contribution a lEtude Geodvnamique du Sud-Ouest Pacifique Travaux et documents de lORSTOM No 147 Paris ORSTOM p 179-185 1982
Maillet P and M Monzier Volcanisme et petrologie des iles Matthew et Hunter donnees preliminaires in Contribution a lEtude Geodvnamique du Sud-Ouest Pacifique Travaux et documents de lORSTOM No 147 Paris ORSTOM pp 187-216 1982
110
Malahoff A R H Feden and H S Fleming Magnetic anomalies and tectonic fabric of marginal basins north of New Zealand J Geophys Res 7 4109-4125 1982a
Minster J B and T H Jordan Present-day plate motions J Geophys Res 83 5331-5354 1978
Monzier M P Maillet J Foyo Herrera R Louat F Missegue and B Pontoise The termination of the southern New Hebrides subduction zone (southwestern Pacific) Tectonophvsics 101 177-184 1984
Nakamura K Volcanoes as possible indicators of tectonic stress orientation Principle and proposal J Volc Geoth Res 2 1-16 1977
Nakamura K K H Jacob and J N Davies Volcanoes as possibleindirators of tectonic stress orientation--Aleutians and Alaska Pure ApplGeophv 115 87-112 1977
Roca J L Essai de determination du champ de contraintes dans larchipeldes Nouvelles Hebrides Bull Soc Geol France 20 511-519 1978
Rodda P Outline of the geology of Viti Levu N Z J Geol Geophys I0 1260-1273 1967
Rodda P Fiji In Mesozoic-Cenozoic Orogenic Belts A M Spencer (ed)Spec Publ Geol Soc London 4 415-432 1974
Rodda P Geology of northern and central Viti Levu Bull Min Resources Div Fiji 3 1976
Rodda P and R B Band Geology of Viti Levu Fiji Geol Surv Map GS 432 1966
Rodda P and L W Kroenke Fiji A fragmented arc in L W Kroenke Cenozoic Tectonic Development of the Southwest Pacific UN ESCAP CCOPSOPAC Tech Bull 6 87-109 1984
Rodda P I McDougall R A Cassie D A Falvey R Todd T A Wilcoxon Isotopic ages magnetostratigraphy and biostratigraphy from the early Pliocene Suva Marl Fiji Geol Soc Amer Bull 96 529-538 1985
Sanford A R and P Einarsson Magma chambers in rifts in Continental and Oceanic Rifts Geodynamics Ser vol 8 edited by G Palmason Amer Geophys Un Washington DC pp 147-168 1982
Sclater J G and H W Menard Topography and heat flow of the Fiji Plateau Nature 216 991-993 1967
Sclater J G J W Hawkins J Mammerickx and C G Chase Crustal extension between the Tonga and Lau Ridges Petrologic and geophysical evidence Geol Soc Amer Bull 83 505-517 1972
Silverstein B Processed strong-motion records from Monasavu Dam Fiji Earthquakes of February 13 14 and 23 1983 US Geol Surv Open File Rep 85-375 85-375 1985
Smith R B and R L Bruhn Intraplate extensional tectonics of the eastern Basin-Range Inferences on structural style from seismic reflection data regional tectonics and thermal-ductile models of brittle-ductile deformation J Geophys Res 89 5733-5762 1984 Smith R and T Raicebe (comps) Bathymetric map of Fiji Multicolored scale 11000000 Suva Min Resources Dept Fiji 1984
Stuart D J Current status of the continuing investigation of seismicity in the Monasavu Dam area Viti Levu Min Resources Dep Fiji Note BP 3016 18 pp 1985
Sykes L R The seismicity and deep structure of island arcs J Geophys Res 71 p 2981-3006 1966
Sykes L R B L Isacks and J Oliver Spatial distribution of deep and shallow earthquakes of small magnitude in the Fiji-Tonga region Bull Seismol Soc Amer 59 1093-1113 1969
Taylor F W Quaternary tectonic and sea-level history of Tonga and FijiSouthwest Pacific PhD Thesis Cornell University Ithaca N Y 355 pp 1978
Turcotte D L and G Schubert Geodynamics John Wiley amp Sons New York 1982
Von Stackelberg U and Shipboard Scientific Party Hydrothermal sulfide deposits in back-arc spreading centers in the Southwest Pacific submitted to Nature 1985
Whelan P W J B Gill E Kollman R Duncan and R Drake Radiometric dating of magmatic stages in Geology and Offshore Resources of Pacific Island Arcs - Tonga Region edited by D W Scholl and T L Vallier Circum-Pacific Energy and Mineral Resources Council Am Assoc Petrol Geol Spec Publ 2 Earth Sci Ser Tulsa Oklahoma in press 1985
Woodhall D The geology of the Lau Ridge in Tonga Ridge Resource Studyand Tripartite Cruise Report edited by D S Scholl and T L Vallier Open-file Rep CCOPSOPAC Suva Fiji pp 277-300 1985a
Woodhall D Geology of Taveuni Island Min Resources Dep Fiji in prep 1985b
112
APPENDIX I DEFINITIONS
Two measures of the size of an earthquake are magnitude and intensity
Magnitude is a measure of the energy from an earthquake source to indicate the
strength of an earthquake In comparison intensity is a measure of the amount
of ground shaking caused by the earthquake at a particular site Thus an
earthquake of a given magnitude will produce a wide range of intensities
depending largely on distance from the source
In general a small earthquake with a magnitude less than 5 may be felt
only in the area near the source and a moderate earthquake with a magnitude
between 5 and 7 will be felt over a wider area and may produce significant
damage in the area very close to the source A large earthquake refers to an
earthquake with a magnitude greater than 7 Such events are often very desshy
tructive if they are located near population centers A major earthquake
refers to magnitudes between 7 and 7 34 and a great earthquake refers to
magnitudes greater than 7 34 These great earthquakes cause widespread desshy
truction and possible regional tsunamis Generally the potential damage from
earthquakes is multiplied by the secondary effects of earthquake occurrence
such as ground faulting generation of tsunamis landslides slumping or
liquefaction
The depth of earthquakes range from the surface to approximately 700 km
depth Shallow earthquakes refer to those with depths between the surface and
70 km Intermediate earthquakes refer to those with depths between 70 km and
300 km depth De earthquakes refer to those with depths greater than 300 km
(but less than 700 km) Intermediate depth earthquakes occasionally produce
damage at the earths surface only if the earthquake is very large Deep
events are generally not felt
113
The seismic (earthquake) potential of a particular region is defined as
the likelihood of that region to experience a (destructive) earthquake within a
particular magnitude range within a particular time period The seismic
(earthquake) hazard of a particular location refers to the amount of ground
motion that might be expected from an earthquake within or near that region
Adequate data on seismotectonic features instrumental (strong-motion) and
macroseismic (intensity) records of near-field effects of large earthquakes
source parameters of large earthquakes earthquake spectra and ground attenuashy
tion or amplification are necessary in order to reasonably evaluate earthquake
hazard for any region The seismic potential is the integration of all of
these bits of information The average length of time between earthquakes of a
particular size (recurrence interval) and the amount of time elapsed since the
last earthquake of that size help to define the probability of future earthshy
quake occurrence along a particular seismogenic zone hence the seismic
potential of that zone
Seismic risk of a particular region refers to the expected degree of
losses of people and their property which result from the seismic hazard and
the vulnerability in the region One method that has been widely used for this
risk determination (and is used here) involves the determination of a maximum
probable earthquake (design earthquake) that is likely to occur in the imshy
mediate region Calculations of seismic hazard which are based on design
earthquakes generally yield conservative estimates of risk
The most important conclusion of historical studies of seismicity is to
define the seismogenic zones of a region and extrapolate what the future earthshy
quake potential is for those zones Seismically quiescent regions refer to
regions with a lower level of seismic activity which are surrounded by more
114
active regions Portions of major plate boundaries that have not experienced a
major or great earthquake during a particular time interval are seismic gaps
This time interval is taken to be a significant portion of the earthquake
recurrence interval for a large earthquake An estimate to within several
decades of the location and size (magnitude) of a large earthquake constitutes
a forecast If a precise calculation of the time and probability of occurrence
can be added to the location and size information then the estimation is a
prediction
115 APPENDIX II MODIFIED MERCALLI INTENSITY SCALE (1956 VERSION)1
Masonry A B C D To avoid ambiguity of language the quality ofmasonry brick or otherwise is specified by the following lettering (whichhas no connection with the conventional Class A B C construction)
Masonry A Good workmanship mortar and design reinforced especiallylaterally and bound together by using steel concrete etc designed toresist lateral forces
Masonry B Good workmanship and mortar reinforced but not eesigned indetail to resist lateral forces
Masonry C Ordinary workmanship and mortar no extreme weaknesses likefailing to tie in at corners but neither reinforced nor designed againsthorizontal forces
Masonry D Weak materials such as adobe poor mortar low standards ofworkmanship weak horizontally
DESCRIPTION (INTENSITY VALUES RANGE FROM I TO XII)
I Not felt Marginal and long-period effects of large earthquakes
II Felt by persons at rest on upper floors or favorably placed
III Felt indoors Hanging objects swing Vibration like passing oflight trucks Duration estimated May not be recognized as an earthquake
IV Hanging objects swing Vibration like passing of heavy trucks orsensation of a jolt like a heavy ball striking the wallsStanding motor cars rock Windows dishes doors rattle Glassesclink Crockery clashes In the upper range of IV wooden walls and frames creak
V Felt outdoors direction estimated Sleepers wakened Liquidsdisturbed some spilled Small unstable objects displaced orupset Doors swing close open Shutters pictures movePendulum clocks stop start change rate
Original 1931 version in Wood H 0 and F Newmann 1931 ModifiedMercalli Intensity Scale of 1931 Bull Seis Soc Amer 53 979-9871956 version prepared by Charles F Richter in Elementary Seismology(1958) 137-138 W H Freeman and Company
116 VI Felt by all Many frightened and run outdoors Persons walk unsteadily Windows dishes glassware broken Knickknacks booksetc off shelves Pictures off walls Furniture moved or overshyturned Weak plaster and masonry D cracked Small bells ring(church school) Trees bushes shaken (visibly or heard to
rustle--CFR)
VII Difficult to stand Noticed by drivers of motor cars Hangingobjects quiver Furniture broken Damage to masonry D includingcracks Weak chimneys broken at roof line Fall of plasterloose bricks stones tiles cornices (also unbraced parapets andarchitectural ornaments--CFR) Some cracks in masonry C Waveson ponds water turbid with mud Small slides and caving in alongsand or gravel banks Large bells ring Concrete irrigationditches damaged
VIII Steering of motor cars affected Damage to masonry C partialcollapse Some damage to masonry B none to A Fall of stucco andsome masonry walls Twisting fall of chimneys factory stacksmonuments towers elevated tanks Frame houses moved onfoundations if not bolted down loose panel walls thrown outDecayed piling broken off Branches broken from trees Changes inflow or temperature of springs and wells Cracks in wet groundand steep slopes
IX General panic Masonry D destroyed masonry C heavily damagedsome times with complete collapse masonry B seriousiy damagedGeneral damage to foundations--CFR) Frame structures if notbolted shifted oft foundations Framed cracked Serious damageto reservoirs Underground pipes broken Conspicuous cracks inground In alluviated areas sand and mud ejected earthquakefountains sand craters
X Most masonry and frame structures and bridges destroyed Seriousdamage to dams dikes embankments Large landslides Waterthrown on banks of canals rivers lakes etc Sand and mudshifted horizontally on beaches and flat land Rails bent slightly
XI Damage nearly total Large rock masses displaced Lines of sightand level distorted Objects thrown into the air
117 APPENDIX III SEISMOLOGICAL FACILITIES AND EARTHQUAKE HAZARD PROGRAMS IN
THE SOUTHWEST PACIFIC
As part of our program of field investigations in Fiji Tonga andVanuatu our researcher was able to visit the neighboring island countriesof the Southwest Pacific region During these visits he was able to meetwith scientists and public officials involved with the earthquake hazardproblem fEcing each country In every case the governments are awareand have taken some action to ofmitigate the potential losses due to destrucshytive earthquakes but these governmental responses have varied widely fromcountry to country This report focusses on the seismological institutionsand facilities in each of the counltries and their capabilities in assessingand planning for earthquake hazards In the following sections weconsider each of the island countries of this area which face a severeearthquake risk Fiji Tonga Vanuatu Western Samoa Solomon IslandsPapua New Guinea and New Zealand
TONGA
Seismological Facilities Seismological observations in Tonga are the responsibility of theMinistry of Lands Surveys and Natural Resources Due to fiscal conshystraints however these efforts have in the past been entirely dependenton foreign assistance Seismological experiments began in Tonga in themid-1960s with Lamont-Dohertys Upper Mantle Project Seismic stationswere operated by Lamont-Doherty and subsequently by Cornell scientiststhrough the early 197 0 s when operations were suspended In late 1983 aspart of the present AID-supported seismic hazard program Cornell reinshystalled a three-component short-period seismograph in the capitalNukualofa The seismograph was installed upon the request of the governshyment geologist to be operated by the Tongan government with technicalassistance from Cornell Unfortunately after operation of the seismographfor eight months Tongas Cabinet decided that the drain on its resourcesand personnel was excessive and the instruments were disconnected in May1984 with the components transferred to Fiji and Vanuatu where they canbe utilized There are presently no plans to reinstall permanent seismoshy
graphs in Tonga
Strong Motion Accelerographs
Two strong-motion accelerographs provided by the AID seismic hazardprogram are presently operating in Tonga one in Nukualofa and one in thenorthern Vavau Islands They have been in operation for one year andhave not to date recorded any large earthquakes They require a minimum ofmaintenance and their operation will continue to be supen-sed by thegovernment geologists with assistance from Cornell A third accelerographmay be made available to tonga by the British Geological Survey and couldbe installed on Eua Island in a zone of high activity close to the TongaTrench
118 Related Research Programs
The Ministry of Lands Surveys and Natural Resources employs a singlegovernment geologist whose responsibilities include coordination of oilprospecting geological mapping of the islands and assessment of earthquakeand tsunami hazards There has been considerable scientific study of theTonga Trench subduction zone by research groups from the United StatesJapan New Zealand Australia Germany and the Soviet Union More detailedmarine geophysical data have been collected near Tongatapu Island byAmerican petroleum exploration groups
Critical Facilities
The capital city of Nukualofa has a population of only 20000 butdoes include several three- and four-story buildings The larger buildingshave in general been designed by foreign engineers and have includedearthquake-resistant design specifications Other significant developmentprojects include the expansion of the government wharf in Nukualofa anddevelopFnent of tourist resorts on Tongatapu and several of the outer islands
Earthquake Preparedness Programs
There are no building codes presently enforced in Tonga Howeverconstruction of public buildings must be approved by the Ministries ofWorks and Health The largest office buildings and hotels are designed byoverseas engineering firms and generally include some earthquake loadingcriteria The Land and Environment Act currently under consideration bythe Tongan government would require review of all development projects bythe government planner application of building codes largely adapted fromNew Zealand codes is expected to followDisaster preparedness programs are the responsibility of the CabinetsNational Disaster Committee including representatives from the relatedgovernment ministries and departments Subcommittees focus on disasterpreparedness action planning and long-term relief and rehabilitation
There is no earthquake education program in Tonga
VANUATU
Seismological Facilities
Seismic stations in Vanuatu were first established in the mid-1960sby the French Office de la Recherche Scientifique et Technique Outre-Mer(ORSTOM) Station PVC in Port Vila has operated continuously from 1964 tothe present while LUG in Luganville Santo operated through 1980 A thirdstation on Tanna Island (INH) operated through 1978 Cornells cooperativefield programs with ORSTOM began in 1976 with a microearthquake experimenton Santo Island an ocean-bottom seismograph experiment was carried out insouthern Vanuatu in 1977 and in central Vanuatu in 1978 The
119 Cornell-ORSTOM telemetered seismic network was established in 1978 and hasoperated continuously since that time The seismic network now includes 19telemetered stations (Figure Al) to date over 17000 earthquakes havebeen recorded by the network A permanent ORSTOM mission is now based inPort Vila and takes primary responsibility for day-to- day maintenance ofthe network These seismological facilities are complemented by studies ofground deformation using seven bubble-level tiltmeter a two-componentlong-baseline water tube tiltmeter and two levelling arrays
Strong Motion Accelerographs
As part of the present program of seismic hazard evaluation inVanuatu Cornell has installed five strong motion accelerographs on theislands of Efate Malekula and Santo (Figure Al) These instruments havealready been triggered by five moderate-sized shallow events and will beused to provide a basis for predicting local ground motion induced by largeinterplate earthquakes in Vanuatu The high level of seismicity along thisplate boundary suggests that a valuable baseline of strong motion data canbe collected in a relatively short period of time
Related Scientific Programs
The seismology program is carried out in cooperation with the VanuatuDepartment of Mines Geology and Rural Water Supplies They areresponsible for regional geology studies resource assessment detailedmapping and hydrological activities In addition ORSTOMs geology andgeophysics department based in New Caledonia carries out an extensiveprogram of investigations covering submarine morphology marine geologyand geophysics island geology and crustal structure Recently the USGeological Survey has undertaken a series of detailed marine studies in thecentral and northern portions of the island arc using the research vesselSP Lee A detailed hydrographic survey was carried out in coastal watersby Australian researchers In addition proton-precession magnetometersare maintained by Queensland University (Australia) researchers A tidegauge is maintained by the ORSTOM mission in Port Vila
Critical Facilities
Port Vila with a population of under 20000 is the administrativeand commercial center of the country There are a number of multistorybuildings in the capital and most of Vanuatus small tourist industry islocated in and near Port Vila A large shipping wharf is located near the center of the city on Vila Bay
Apart from Port Vila the only significant development in Vanuatu isat Luganville on Santo Island (pop 5000) It remains an importanteconomic center for the country with agricultural processing and shippingfacilities located there There are several three- and four-storybuildings in the center of Luganville There was significant damage to
120
14 o 166 deg 1670 1680 1690 1700
GAUA FIJI
150 0 PLATEAU
a ~ SANTO A013AoVAN CAAO 1
APENTECOST deg - STAMB16 aAMKs 160 AMBRYM 16
MALEKULA MML~DENTRECASTEAUX FRACTIURE ZONE
IEP
170- EM I-170
NGOUNANGA IN
S EFAT 180- oJ pV
0-180
mV
o ERROMANGO o -OAUSTRALIANR FUTUNAT ANN
19 6669190 o
-4 00 FUTUNA00AUSTRALIAN
0 0 N__
20ht PLAT E S I ANATOM l 0
165c 166deg 1670 degE 1680 169 1700
Figure Al Map showing the seismograph stations in Vanuatu Circles arestations telemetered to the base station PVC on Efate island andunderlined stations have two components--one horizontal and one verticalThe triangles are older ORSTOM stations INH and LUG are no longer operational Strong motion instruments are located at SWB and LMP onMalekula island DVP and PVC on Efate island and LUG on Santo island
121
buildings wharves and bridges in Luganville following the 1965 Santo earthquake
Earthquake Preparedness Programs
Disaster preparedness is the responsibility of the Ministry of Home Affairs a revised Rescue Plan has been adopted since independence They are responsible for damage assessment and coordination of emergency relief efforts by other ministries and public agencies
There are presently no building codes enforced in Vanuatu At present the government has requested the assistance of a consultant from New Zealand to help provide uniform building codes for the country The Public Works Department enforces New Zealand seismic zone B codes to construction of public buildings Large buildings for the most part are designed by overseas engineering firms and generally comply with their earthquake design standards Smaller buildings are generally designed close to the New Zealand loading specifications but there continues to be great difficulty in supervising construction projects
There is no large-scale earthquake education project in Vanuatu Materials have been prepared by ORSTOM seismologists for distribution to teachers public officials and planners involved in earthquake hazards
WESTERN SAMOA
Seismological Facilities
One of the earliest seismic stations in the Pacific was established at the Apia Observatory in 1902 during the German colonial period through the University of G6ttingen In 1921 control of the observatory was transshyferred to the New Zealand Government Weichert seismographs were operated continuously at Apia through 1957 when they were replaced by Benioff instruments at Afiamalu and by short-period Wood-Anderson instruments at Apia Since Samoan independence in 1963 the Observatory has been operated jointly by the Samoan Government and the Department of Scientific and Industrial Research (DSIR) New Zealand In 1963 a Worldwide Standard Seismograph Station was established at Afiamalu Operation of this six-component station is supported by the US Geological Survey In 1980 the station was upgraded to allow digital recording equipment was added to upgrade the statior co the status of a Global Digital Seismic Network station Seismic records are sent to DSIR in Wellington for permanent storage
Strong Motion Accelerographs
A simple strong motion instrument has been operating in Apia since 1979 It is an event-triggered low-gain seismograph recording on an ink-stylus recorder At the time of our visit to Western Samoa the instrument had been out of service for several months Only one event has to date triggered the instrument
122
Related Scientific Programs
The Apia Observatory has also made continuous magnetic field measureshyments since 1905 Measurements are currently made using a Schultze earth inductor an Askania declinometer and a proton magnetometer The observashytory maintains two tide gauges as part of the Pacific Tsunami Warning System Offshore resource studies have been carried out through CCOPSOPAC and by various international research groups Much of the reconnaissance geological work in Western Samoa has been carried out by DSIR in New Zealand
Critical Facilities
Like many -f the other island countries of the Pacific Western Samoas development has been concentrated around the capital Apia (pop34000) A major deep-water harbor and the countrys tourist industry are based in Apia Several multistory buildings have been erected in Apia in the past several years A hydroelectric dam on Upolu Island was completed in 1978
Earthquake Preparedness Programs
There is presently no disaster plan in effect in Western Samoa The various agencies involved with emergency action are coordinated through the Police Commissioner New Zealand seismic zone B codes are applied to construction in Western 5amoa Enforcement is handled by the Public Works Department Modest educational materials have been prepared by the ApiaObservatory staff in English and Samoan for distribution through schools and public agencies
SOLOMON ISLANDS
Seismological Facilities
Seismological Observatories in the Solomon Islands are conducted by the Ministry of Lands Energy and Natural Resources They have operated a Worldwide Standard Seismic Station in Honiara since 1962 operation of the station is supported by funds from the US Geological Survey The station was augmented by two short-period telemetered seismic stations in 1982 This three-station network was provided through the British GeologicalSurvey with the aim of identifying volcanic earthquakes associated with the active volcano Savo located close to the capital
In awareness of the high volcanic risk to population centers in the Solomon Islands the Ministry has drawn up plans for two three-station telemetered arrays to be deployed around the active volcanoes on Simbo Island (New Georgia Group) and on Tinakula Island (Santa Cruz Group) They are presently seeking foreign aid in the form of seismic instrumentation and technical assistance to establish the network
123
The Ministry also has responsibility for field surveys following majorearthquakes in the Solomon Islands Studies of ground deformation and cultural effects of the large 1977 and 1984 earthquakes were made by seisshymology officers
Strong Motion Accelerographs
Two strong motion accelerogaphs were installed on Guadalcanal by the Ministry in late 1984 They will be responsible for maintaining the instruments but have requested Cornells assistance in analyzingaccelerograms obtained during their operation The high level of shallow activity near Guadalcanal suggests that a significant number of strong-motion records will be obtained during the lifetime of the instruments
Related Scientific Programs
The Ministry also carries out related research programs in regionalgeology minerals assessment groundwater studies and so on Extensive marine surveys have been carried out in the Solomon Islands by the US Geological Surveys Resource Assessment Program Local offshore surveys have been carried out through CCOPSOPAC A tide gauge is maintained by the Solomon Islands Hydrographic Unit Six proton-precession magnetometers are operated in the Solomon Islands by the Queensland University (Australia)
Critical Facilities
Over 90 of the Solomon Islands population remains in rural areas The major development is in Honiara the administrative and commercial center of the country Honiara (pop 15000) is the major shipping center of the country and now includes several multistory buildings
Earthquake Preparedness Programs
The Solomon Islands implemented a National Disaster Plan in 1980 subsequently revised in 1982 The Plan gives the Ministry for Home Affairs and National Development overall responsibility for coordination of efforts in earthquake volcanic and tsunami disasters Operational relief efforts are carried out through the Disaster Operations Coordinator and the Provincial governments
The government has adopted the most stringent earthquake building code (Zone A) from New Zealand for multistory building construction in Honiara Implementation of these guidelines continues to be a problem One multi- story building in Honiara (Australian High Commission Building) was severely damaged during the 1984 earthquake Some efforts have been made to develop small-scale earthquake-resistant building techniques appropriate for rural areas The Pacific Islands Development Program organized a model
124
house constrtction and workshop during early 1984 A modest outreach program has developed through the school system adult education programsand the government broadcasting company
PAPUA NEW GUINEA
Seismological Facilities
The government of Papua New Guinea has made an extensive commitment to earthquake and volcanic hazard mitigation through construction of a national intLwor cif seisn graphs and accelerographs (Figure A2) Aten-station national network of seismographs is monitored by the Port Moresby Geophysical Observatory (Department of Minerals and Energy) Three of the remote stations are telemetered to Port Moresby via microwave linksfour stations operate as permanent field stations and two are operated at temporary sites on outlying islands Port Moresby is presently the site of a Worldwide Standard Seismic Station that has operated since 1958 The national network reports arrival times to the US Geological SurveysPreliminary Determination of Epicenters and the International SeismologicalCentre but does not routinely locate events independently
In addition t0 the national seismic network the Rabaul VolcanologicalObservatory operates seven seismic stations near active volcanoes around the country and a nine-station telemetry network around the Rabaul Caldera Bougainville Copper Limited operates a 5-station network on Bougainville Island (North Solomons Province)
Stronm Motion Accelerographs
The Port Moresby Geophysical Observatory maintains a national networkof thirteen strong motion accelerographs distributed in the highly seismic areas of the country (Figure A2) This includes a closely spacedfour-station network around the Rabaul Caldera A single strong motion accelerograph is situated on Bougainville Island and is maintained byBougainville Copper Limited The network uses Kinemetrics SMA-I and New Zealand DSIR MO-2 instruments and has recorded tens of accelerograms since its establishment in 1967 The Observatory is presently trying to establish an engineering seismologist position to analyze the accumulatingdata and to further upgrade the accelerograph network
Related Scientific Activities
In addition to the Geophysical Observatory the Department of Minerals and Energy includes the Geological Survey of Papua New Guinea The Surveyundertakes a wide range of geological investigations including regionalgeological mapping petroleum and mineral exploration engineering and environmental geology and energy resource development Offshore surveyshave been carried out through CCOPSOPAC as well as American and Australian research vessels Continuous monitoring of the magnetic field is carried out by the University of Queensland (Australia) Ten tiltmeters have been
CSA v~cwS~Ior m~ 16008 O
fR o- c ~ 1
a ~ 19CL SOewPV ftfa
b (b UACCO40 t wa aj
R~bOVIRAR AI
Ap~~ooj Toel Pbu IR TL
R (l
YOM~I -oob
vtvtOOalork Island WO)ISI
NETWORKS MARCH 1384
Figure A2 Panua New Guinea seismograph and accelerograph networks U
126 deployed by the Volcanological Observatory to monitor ground deformation near Papua New Guineas active volcanoes Four of these instruments aredeployed around Rabaul Caldera
Critical Facilities
Papua New Guinea is the most developed of the island countries of theSouthwest Pacific with a population of over 3000000 and extensive urbandevelopment The capital city of Port Moresby has a population of over130000 with major multistory construction in the downtown area a majordeep water harbor and significant commercial and industrial activity in thePort Moresby area There is significant development as well in the smallertowns of Rabaul Lae Madang Wewak Goroka Mount Hagen Wau BuloloDaru and Kerema Major hydroelectric schemes have been established on theRamu and Rouna rivers with additional hydroelectric plans at variousstages of evaluation and development Extensive mineral development hastaken place in the North Solomons Morobe and Western provinces of PapuaNew Guinea Extensive natural gas and limited oil deposits have beenlocated these may become commercially exploited in the near future
Earthquake Preparedness Programs
Papua New Guinea has a long history of earthquake and volcano-relateddisasters A national disaster program was established in 1981 and proshyvides for a National Disaster Emergency Committee which formulates emershygency government policy and a Disaster Civil Defence Committee which isresponsible for implementation of short-term relief effortsprovincial governments are
The given major responsibility for initialcoordination and assessment of disasters assistance is subsequently
requested from the federal government for major disasters Many of theprovincial governments have not revised preparedrcs plmns sLnce thecolonial period However particularly intense effort has been directed inEast New Britain province because of the imminence of a potentially desshytructive volcanic eruption in Rabaul Caldera
The town of Rabaul (pop 15000) is a major commercial center forPapua New Guinea and is situated directly within the caldera of an activevolcano A relatively small eruption took place at a secondary eruptivecenter near Rabaul in 1937 killing over five hundred nearby residents andforcing the evacuation of the town In order to avoid a repeat of such adisaster the government established the Volcanological Observatory withfour full-time volcanologists and real-time earthquake location andanalysis of tilt data A drastic increase in volcanic seismicity inmid-1983 led to a volcanic hazard alert and intensification ofseismological and ground deformation studies around Rabaul In additionthe alert allowed the provincial and national Disaster Emergency Committeesto make extensive evacuation and relief plans for a possible eruption atRabaul including preparation of a new airstrip improvement of roads andemergency water supplies communications systems detailed evacuationplans education programs and so on To date there has been remarkablecooperation of efforts by provincial national and overseas officials to
127
mitigate the potentially devastating effectq of a volcanic eruption at Rabaul
Papua New Guinea is the only country of the developing nations of the Southwest Pacific to have devised its own seismic zoning system(Figure A3) The Nationwide Housing Code for Papua New Guinea sets up a four-level system of seismic loading oriented toward moderate-sized (to 8 stories) buildings Major buildings require independent dynamic analysisusually carried out by overseas engineering firms Seismic Zone 1 of the Housing Code is among the most stringent earthquake loading codes in theworld and includes the town of Rabaul and much of the East New Britain and North Solomons provinces Seismic zone 2 includes the towns of LaeWewak and Madang and is approximately equivalent to New Zealand Zone A or California loading designs The capital Port Moresby is in the lowest seismic zone (4) but buildings constructed there still require designs allowing for significant lateral loadings
Earthquake education is handled through the National Radio Government Printing Office the Civil Defence Department and the school system withinformation supplied by the Geophysical and Volcanological Observatories A particularly intense education effort has been mounted in Rabaul where educational materials have been produced and distributed in three languages and public involvement in preparedness plans has been emphasized
NEW ZEALAND
While New Zealand cannot be considered one of the developing countries of the Southwest Pacific its seismology programs have been responsible for much of the observational data available for the entire region Because of its importance to the other national seismology programs we briefly review here the New Zealands observational facilities Its extensive programs in engineering seismology its critical facilities and its earthquake preparedness programs will not be covered here
National Seismic Network
Seismological facilities in New Zealand are maintained by the Geophysics Division of the Department of Scientific and Industrial Research (DSIR) in Wellington The national standard seismograph network presentlyconsisting of thirty short-period stations is shown in Figure A5 The network routinely locates all earthquakes of ML gt 38 within New Zealandand earthquakes with Ms gt 50 for the region within 100 of New Zealand Arrival time data are routinely transmitted to the US Geological Surveyand the International Seismological Centre The events located by the network are reported in the annual New Zealand Seismological ReportSeveral hundred earthquakes are located by the DSIR national network each year
The network is augmented by long-period instruments operating at Karopiro Roxburgh and Wellington DSIR also operates a three-componentborehole seismometer in Wellington as part of the Seismic Research Observatory network supported by the US Geological Survey
bull ------- - -- -shy - +----2
FIG 13
f 4tSEISMIC ZONES FOR BUILDING CONSTRUCTION IN PAPUA NEW GUINEA
4
7r
Zce CtASSIICION OF CITIEI Pr 3 12OI- ZO I Z7oE
Figure A3 Seismic zones for building construction in Papua New Guinea (Jury et al 1982)
129
CAPEREINGA
ONERAHI
0GREAT BARRIER
AUCVAND 0
WHITE ISLAND B OCT1914
KARAPIRO EASTCAPE
r WHAKATANE WAIRAKEI
PI5 SEP 13EARATA 0 TUAI 2BJUSBRNE21 CHATEAU MARADALE 4 2 FEJUL1931
90 MANGAHAD v5 MAR 19340 B8AUG 190A
CASTLEPOINT 4JUN 1942 COB ELLINGTON 2 A ~ C BB~3 A16
23 MAY 1968 JANa5
KAIMATA KAIKOURA 9 MAR 19 U 0
3 AUG 1999
CASHMERE lb NOVIqDMT JOHN
PUKA I24 MAR 1960MILFORD -SOUND ) MAY 1976Y
OAMARU ROXBURGH
BORLAND DUNEDIN MAGNITUDE7 OR GREATER 4LODGE 118 0O1019791MAGNITUDE6OR GREATER
OBAN 11940to 19791
Figure A5 Seismograph stations of the national network (left) and the distribution of large shallow earthquakes (right) in New Zealand (Seismological Observatory Wellington 1980)
130 Stations in Outlying Territories
New Zealand has also taken anstations in outlying areas
important lead in operating seismographof the Southwest -acific These stations havebeen extremely important in hypocentral control for the Tonga - Kermadecseismic zone and for nuclear event detection in the Pacificoperates three 6 DSIR-component Worldwide Standard Seismograph stations atAfiamalu (Western Samoa) Raratonga (Cook Islands) and Scott Base(Antarctica) Short-period stations operate at Apia (Western Samoa)Campbell Island (New Zealand) Chatham Islands (New Zealand) Nadi (Fiji)Nime and Raoul Island (Kermadec Island New Zealand) Readings from thesestations are routinely reported to PDE and ISC for global earthquakelocation
Wellington Network
A small-aperture high-gain seismic network is operated aroundWellington an area of greatest seismic risk in New Zealandare The stationstelemetered by radio or telephone link to the central recording siteThe network now consists of eleven stations Earthquakes are presentlydetected by a microprocessor-based Automatic Seismic Monitor and automatedlocation processing is expected to follow The network routinely locatesevents with ML gt 15
Pukaki Network
A second microeartlhquake network has operated around Lake Pukakihydroelectric project in the South Island New Zealand a
established in 1975 The network wasto monitor reservoir-induced seismicity associatedwith impoundment of the reservoir The network consisted of nine stationsand was intended to operate on a temporary basis It has been closed sinceearly 1984 with several of the stations continuing to support thenational network and to monitor any future reservoir-related activity
Related Seismolo Research
In addition to its regular observatory seismology the GeophysicsDivision has an active seismology research programfocussed on Their studies havetheoretical seismology earthquake prediction crustalstructure of New Zealand historical earthquake studies nuclear eventdetection seismic risk in New Zealand strong motion studies and volcanicseismology The monitoring of active volcanoes is closely coordinated withcrustal deformation monitoring conducteu by the Earth Deformation Sectionof the New Zealand Geological SurveyThe New Zealand strong motion accelerograph network now consists of225 instruments operated by the Physics and Engineering Laboratory ofDSIR Most of these instruments are of a New Zealand design (Mechanicaland Optical Accelerographs) and analog records
film are made on photographicThree digitally recording accelerographs are now in operation in
131
Stations in Outlying Territories
New Zealand has also taken an important lead in operating seismographstations in outlying areas of the Southwest Pacific These stations have been extremely important in hypocentral control for the Tonga - Kermadec seismic zone and for nuclear event detection in the Pacific DSIR operates three 6-component Worldwide Standard Seismograph stations at Afiamalu (Western Samoa) Raratonga (Cook Islands) and Scott Base (Antarctica) Short-period stations operate at Apia (Western Samoa)Campbell Island (New Zealand) Chatham Islands (New Zealand) Nadi (Fiji)Nime and Raoul Island (Kermadec Island New Zealand) Readings from these stations are routinely reported to PDE and ISC for global earthquake location
Wellington Network
A small-aperture high-gain seismic network is operated around Wellington an area of greatest seismic risk in New Zealand The stations are telemetered by radio or telephone link to the central recording site The network now consists of eleven stations Earthquakes are presentlydetected by a microproeszor-based Automatic Seismic Monitor and automated location processing is expected to follow The network routinely locates events with ML gt 15
Pukaki Network
A second microearthquake network has operated around Lake Pukaki a hydroelectric project in the South Island New Zealand The network was established in 1975 to monitor reservoir-induced seismicity associated with impoundment of the reservoir The network consisted of nine stations and was intended to operate on a temporary basis It has been closed since early 1984 with several of the stations continuing to support the national network and to monitor any future reservoir-related activity
Related Seismology Research
In addition to its regular observatory seismology the GeophysicsDivision has an active seismology research program Their studies have focussed on theoretical seismology earthquake prediction rustal structure of New Zealand historical earthquake studies nuclear event detection seismic risk in New Zealand strong motion studies amc volcanic seismology The monitoring of active volcanoes is closely coordinated with crustal deformation monitoring conducted by the Earth Deformation Section of the New Zealand Geological Survey
The New Zealand strong motion accelerograph network now consists of 225 instruments operated by the Physics and Engineering Laboratory of DSIR Most of these instruments are of a New Zealand design (Mechanicaland Optical Accelerographs) and analog records are made on photographicfilm Three digitally recording accelerographs are now in operation in
132
New Zealand and the MO records are digitized for computational analysisAnalysis of this empirical data is being used for a revision of New Zealands building codes
133
REFERENCES
Berryman K 1979 Seismotectonic zoning study of the Fiji Islands Earth Deformation Section Report 70 andWellington NZ Dept Sci Indust Research 40 pp
Everinghar IB 1983 Seismology section annual report 1983 Min Resources Dev Fiji Note 3310 Suva Fiji 46 pp
Franco AB MP Hamnett and J Makasiale 1982 Disaster Preparednessand Disaster Experience in the South Pacific Pacific Islands Developshymental Program Honolulu 380 pp
Geological Survey of Papua New Guinea 1979 Information Booklet Port Moresby Dept Minerals and Energy 12 pp
Government of Western Samoa 1977 Apia Observatory 1902-1977 Apia Apia Observatory 8 pp
Jury RD JP Hollings and IAN Fraser 1982 The development of seismic zones and the evaluation of lateral loadings for earthquakeresistant design of buildings in Papua New Guinea Bull NZ Nat Soc for Eartho Engr 15 123140
Lowenstein PL 1982 Problems of volcanic hazards in Papua New GuineaGeol Surv Papua New Guinea Rept 827 Port Moresby Papua New Guinea 62 pp
McCue KF and ID Ripper 1980 The Papua New Guinea Strong MotionAccelerograph Network Geol Surv Papua New Guinea Rept 807 Port Moresby Papua New Guinea 13 pp
Mineral Resources Department Seismology Section 1983 National activityreport Fiji Submitted to Session IX Intl Coord Group for TsunamiWarning System in the Pacific Min Resources Dept Fiji Note 333 Suva Fiji 4 pp
Parliament of Fiji 1984 Mineral Resources Department Annual Report for The Year 1982 Parliam Paper No 13 Suva Fiji 90 pp
Power CA 1978 Earthquake risk in Fiji and the problems of earthquakeengineering Presented to the Fiji Society 17 pp
Prdvot R and JL Chatelain 1983 Seismicity and Seismic Hazard in Vanuatu ORSTOM Rept 5-83 Noum~a 51 pp
Ripper ID 1982 Accelerogram library Geol Surv Papua New Guinea Rept 198211 Port Moresby Papua New Guinea 44 pp
Seismological Observatory Wellington 1980 The earthquake problem in NewZealand Alpha DSIR Extension Information Wellington NZ 4 pp
134
Smith WD 1979 Seismology and related research in New Zealand1975-1978 NZ DSIR Information Series No 140 30 pp
Smith WD 1983 Seismology and related research in New Zealand1979-1982 Seismol Observatory Wellington Bull 276 32 pp
Solomon Islands Government 1982 National Disaster Plan 1982 Honiara Solomon Is 14 pp
135
A Rahamin A Simpson R Holmes P Rodda R Singh I Everingham
K Draunidalo G Shorten M Mehrotra J Booth J Campbell
R Carter R Byrne G Gauss D Rubin
S Tongilava
D Tappin S Lemoto T Tukia
C Clarke
R Campillo R Foy L Mollard T Lee J Recy J Chatelain R Prdvot
L loane S losa A Titimaea
INFORMATION CONTACTS
FIJI
Director Mineral Resources Dept Asst Director (MRD) Princ Geol OffshoreSeismol (MRD) Princ Geol Inform Services (MRD) Principle Geophysicist (MRD) Senior Seismologist (KRD) Seismologist (MRD) Senior Engineering Geologist (MRD) Struc Engr Suva City Council Civil Engineer Su Engineering Geologit A Gibb amp Partners (Monasavu) Marine Geologist kCCOPSOPAC) Marine Geologist (CCOPSOPAC) Marine Geologist (CCOPSOPAC) Marine Geologist (CCOPSOPAC)
TONGA
Superintendent of Lands Surveys and Natural Resources Government Geologist (LSNR) Land Assessor (LSNR) Government Planner (LSNR)
VANUATU
Director Dept Mines Geology and Rural Water Supplies
Director ORSTOM Mission Engineer ORSTOM Engineer ORSTOM Civil Engineer Public Works Dept Director ORSTOM Dept Geol and Geophys (Nouma) Seismologist ORSTOM (Noumda) Seismologist ORSTOM (Noumda)
WESTERN SAMOA
Director Apia Observatory Senior Seismologist (AO) Geologist (AO)
136
SOLOMON ISLANDS
S Danitofea Chief Geologist Ministry of Lands Energy and Natural Resources
D Tuni Senior Seismologist (MLENR)R Walshaw Senior Geologist (MLENR)J Vunagi Ministry of Home Affairs and National DevelopmentD Gwynn Civil Engineer Public Works Department
PAPUA NEW GUINEA
K Doble Chief Geologist Geological SurveyI Ripper Chief Seismologist Geophysical ObservatoryC Seidel Information Officer Volcanological ObservatoryC Anderson Engineering Geologist Geological SurveyJ Wilkins Civil Engineer Dept of Works and Supply
NEW ZEALAND
W Smith Director Seismological Observatory Wellington
UNITED STATES
M Hamnett Pacific Islands Development ProgramG Burton Director Pacific Tsunami Warning Center R Sillcox Seismologist (PTJC)G Pararis-Corayannis Director International Tsunami Information CenterG Greene Branch of Pacific Marine Geology (USGS)
137 APPENDIX IV TSUNAMI SAFETY RULES
1 All earthquakes do not cause tsunamis but many do When you hearthat an earthquake has occurred stand by for a tsunami emergency
2 An earthquake in your area is a natural tsunami warning Do not stayin low-lying coastal areas after a local earthquake
3 A tsunami is not a single wave but a series of waves Stay out ofdanger areas until an all-clear is issued by competent authority
4 Approaching tsunamis are sometimes heralded by a noticeable rise orfall of coastal water This is natures tsunami warning and should be heeded
5 A small tsunami at one beach can be a giant a few miles away Dontlet the modest size of one make you lose respect for all
6 The Tsunami Warning System does not issue false alarms When anocean-wide warning is issued a tsunami exists When a regionalwarning is issued a tsunami probably exists The tsunami of May 1960killed 61 people in Hilo Hawaii who thought it was just another false alarm
7 All tsunamis--like hurricanes--are potentially dangerous even thoughthey may not damage every coastline they strike
8 Never go down to the beach to watch for a tsunami When you can seethe wave you are too close to escape it
9 Sooner or later tsunamis visit every coastline in the PacificWarnings apply to you if you live in any Pacific coastal area
10 During a tsunami emergency your local Civil Defense police andother emergency organizations will try to sdav your life Give them your fullest cooperation
Unless otherwise determined by competent scientists potential danger areasare those less than 50 feet above sea level and within 1 mile of the coastfor tsunamis of distant origin or ess than 100 feet above sea level andwithin 1 mile of the coast for tsunaois of local origin
4
10 deg1600 E 170 W 170 bull
20
20shy
-
0
at
4vkr 40v
30030 20IN W
170
the in
180 50)gt
(Ms40
170
earthquakes
2 I shallow
as large scale for1Bto sameat Councilis
Map Moderate Circum-Pacific
1964-1977from period taken
the arefor Data
Figure Pacific (1981)1Bcomparison
Southwest for Resources MineralFigure and
Energy
5
Past disaster associated loss of life in the Fiji has been relatively
limited but the increasing urban concentration and industrial development
raises the potential human and economic losses brought on by a large earthshy
quake occurring in the immediate vicinity These losses are usually the
result of the collapse of man-made structures and can be substantially
reduced by adequate engineering precautions
The 1953 Suva Earthquake
The most significant event in Fijis seismic history is the large 1953
Suva earthquake This event with a magnitude of Ms - 675 was the most
destructive in Fijis history The earthquake occurred within 30 km of the
capital city of Suva and produced extensive damage throughout southern Viti
Levu Intensities reach MM VII (Modified Mercalli Index see Appendices I
and II) along 40 km of the islands coast landslides were triggered over an
area of approximately 2380 km2 along the southern coast and extending nearly
20 km inland (Houtz 1962a) A major tsunami was triggered by the earthshy
quake reaching 43 meters height on the island of Kadavu 100 km south of
the epicenter The earthquake and tsunami resulted in 8 deaths 12 serious
injuries and over pound250000 in property damage The event also triggered
turbidity currents along the shelf south of Viti Levu that damaged communshy
ication cables at distances to 100 km from the epicenter (Houtz and Wellman
1962)
At the time of the earthquake Suvas population was only 35000 and
development consisted entirely of low-rise structures Since that time
Suva has grown to over 100000 population and has established itself as the
major regional center for commerce shipping tourism education and
administration Multistory building is widespread in the city and urban
development has rapidly extended to outlying areas Clearly a repetition
6
of the Suva earthquake is of major concern to Fijis Government planners
The seismic risk related to a recurrence of an event of this size (or
larger) far outweighs the potential effects of an earthquake along any of
the other seismogenic zones near Fiji
The earthquake has been of considerable interest from a seismotectonic
perspective as well it took plac3 like a small number of other historical
events directly within the platform on which the Fiji Islands reside Much
of the well-documented seismic activity has occurred along the boundaries of
the Fiji block (Hamburger and Everingham 1986) The cause of the large and
infrequent events that take place within the platform has remained a
tectonic enigma A major goal of these seismological investigations has
been to comprehend the tectonic causes for such unusual and extremely
hazardous earthquakes that occur close to and within the Fiji Islands
The major new data base that bears on this problem originates from the
new telemetered seismic network established in 1979 This network has
recorded several thousand earthquakes both within and along the margins of
the Fiji Platform Because the network can locate events as small as
magnitude -10 small earthquakes in less active seismic zones can be
examined Importantly the network located over 500 earthquakes within and
offshore southeastern Viti Levu near the source area for the 1953 Suva
earthquake In the following sections the distribution of earthquakes in
the Fiji region is analyzed in order to elucidate the nature of deformation
both within and along the boundaries of the Fiji Platform
A second important observation that bears on the Suva earthquake is the
examination of original records collected from over forty observatories
operating at the time Using these records we have obtained a new focal
7
mechanism for the 1953 event that places it in a clear tectonic context
one that proves to be closely linked to the deformation occurring on either
side of the Fiji Platform in the Lau and North Fiji basins
ACTIVITIES SUMMARY
Seismological Investigations
Reliable seismological observations are necessary for accurate
location study and ultimate prediction of earthquakes Seismological
observations in Fiji are conducted by the Mineral Resources Department a
subdivision of the Ministry of Energy and Mineral Resources The government
has made a major commitment to seismological work since the establishment of
a major US AID-supported seismic network in 1979 In fact seismological
observations in Fiji have been carried out since the early part of this
century supported at first by the New Zealand scientific organizations and
subsequently strengthened by Lamont Geological Observatorys Upper Mantle
Project in the 1950s and 1960s In late 1979 the 8-station US AID
network was established to complement three permanent stations in Viti Levu
The network was significantly expanded by installation of a five-station
telemetry network in 1981 supported by Japanese aid Additional stations
were installed in 1983 and 1984 the network has now expanded to a
nineteen-station national network with excellent coverage of the Fiji region
(see Figure 2) In addition MRD now has available five MEQ-800 portable
seismographs for occupation of temporary field sites telemetry station
testing and special refraction experiments While the Fiji network has
experienced considerable technical difficulties it has recorded some 5000
earthquakes since its installation and provides an invaluable basis for
seismological study of the Fiji region
8
15 FIJI SEISMIC NETWORK
)US AID (1979-1985)S A Japanese Aid (1981-1985)
16 A Fiji MRD (1983-1985)
E Temporary stations shy
17 A Taveuni
U ARKoro
Ovalau A UI 0
18 LEVU ~Gau Lakebae(J)Beqa
19 - a o_ Kadavu
20 I I I I 176 E 177 178 179 180 179 W178
Figure 2 Locations of seismic stations comprising the national seismic network of Fiji
9 The present OFDA-supported program has provided for three years of
field and laboratory research on the seismicity and tectonics of the Fiji
region and included approximately fifteen months of field work in Fiji
The field program resulted in substantial improvement of the Fiji seismic
network as well as in detailed studies of seismicity crustal structure
and tectonics of Fiji The work has already resulted in a number of
publications (Hamburger and Isacks 1983 Hamburger and Qiolevu 1983
Draunidalo and Hamburger 1984 Hamburger 1986 Hamburger and Isacks 1986
Hamburger and Everingham 1986) as well as several others in preparation
The scientific work summarized in this report represents a portion of those
studies
Strong Motion Accelerographs
The Mineral Resources Department also operates a network of strong
motion accelerographs now numbering ten Kinemetrics SMA-ls (Figure 3)
The initial six instruments of this network were granted to Fiji by AID the
remainder was purchased by the Fiji government Since establishment of the
SMA network three accelerogram records have been obtained from
moderate-sized earthquakes in Viti Levu The accelerograms are discussed in
detail in the following sections Records obtained from this network are
expected in the long run to provide the basis for ground accelerations
and thus for development of building codes specific to Fijis tectonic
setting and seismic regime
Related Scientific Programs
The Mineral Resources Department (MRD) includes an Offshore Geology
section which has an active program of marine geological and geophysical
- 1tEA 171 lT S Of GREENWICH 11W WEST OF OREENICN 17
NATIONAL NETWORK OF- STRONG MOTION ACCELEROGRAPHS
0 so 60 XLOUCTICI
LEGEND
LEVUE210 1--0VANUA
YASAWA I
Von boiftu
T
GAU
IT L LUTLAKEBA
I r r I I| 7~ WIiT OP SRZICI 360 WtST 0 pound[llUNWCHr 171
Figure 3 Location of strong-motion accelerographs in Fiji Some revision of these locations is likely within the next year
7
investigations in and around Fiji waters MRD also employs an engineering
geologist whose work includes microzonation of the Suva area mapping of
active faults in southeastern Viti Levu and investigation of soils subject
to earthquake-induced liquefaction An active program of geological mapping
and structural studies is also carried out by MRD They are supported by
personnel assistance from Australia and Great Britain
Suva is also the home of the United Nationij Committee for Coordination
of Offshore Prospecting in South Pacific Offshore Areas (CCOPSOPAC) This
organization coordinates much of the international marine research carried
on in the region and has been particularly helpful with Fijis investigashy
tion of its offshore waters
Critical Facilities
The major development in Fiji has been in and around the capital city
of Suva The population of the metropolitan area now exceeds 145000 and
most of the government commercial and industrial operations are concenshy
trated there The city has become a major comnercial transportation and
regional political center and has developed rapidly in the past ten years
Development in this period has incl ded construction of multistory
buildings a major electric power plant expansion of the Suva harbor and
most recently completion of the thirteen-story Central Monetary Authority
building in downtown Suva Much of this development has taken place on an
area of filled land close to sea level particularly vulnerable to earthshy
quake and tsunami damage This area was extensively damaged by the 1953
Suva earthquake and tsunami and is thus at significant risk from a repeat
occurrence of an event of comparable size
12
Other population centers with significant development include the towns
of Lautoka (pop 29000) Nadi (13000) and Ba (9000) on the island of
Viti Levu and Labasa (13000) on Vanua Levu The tourist industry which
is a major part of Fijis economy is concentrated on the southern and
western coasts of Viti Levu and is also vulnerable to earthquake and
tsunami damage The major development project in Fiji is the 82-meter high
Monasavu Dam in the interior of Viti Levu The earthfill dam was completed
in 1983 and is planned to provide most of the countrys electric power
needs through the end of the century
Earthquake Preparedness Programs
In awareness of the serious earthquake risk to development in Fiji the
government has adopted New Zealand earthquake design codes for most of the
urban areas of the country Seisric zone B codes applicable to areas of
moderate seismic activity in New Zealand have been chosen as appropriate
and are applied (in theory) to all domestic and commercial construction in
urban areas Considerable difficulty remains in enforcement of these
regulations particularly in construction of private dwellings Major
multistory building design is generally handled by overseas (Australia or
New Zealand) engineers and dynamic modelling tests are generally applied
for earthquake loadings at least as large as those required by the New
Zealand codes The Monasavu Dam underwent dynamic model testing by
Australian consulting engineers
Disaster preparedness is the responsibility of the Emergency Services
Committee (EMSEC) and the Prime Ministers Relief and Rehabilitation
Committee (PMRRC) EMSEC is responsible for coordination of disaster plans
maintenance of essential services advice to the Cabinet on emergency
13
measures and direction of relief work It is comprised of representatives
of the related ministries and public agencies PMRRC is chaired by the
Prime Minister of Fiji and has responsibility for long-term relief policy
and rehabilitation programs Fijis experience with recurrent weathershy
related disasters has spurred efforts for emergency communication systems
supply distribution temporary shelters and so on Much of this hurricane
disaster planning is applicable as well to earthquake and tsunami damage
Fiji is also a participant in the International Tsunami Warning System
Educational programs have been handled through the Fiji Broadcasting
System the Red Cross and the school system To a limited degree the
Public Works Department and the Mineral Resources Department have produced
educational materials related to earthquake hazards in Fiji
TECTONICS GEOLOGY AND PHYSIOGRAPHY
Plate Tectonic Setting
The theory of plate tectonics has provided a fundamental new undershy
standing of the distribution of earthquakes in the Fiji region This
section of the report is intended to briefly review the fundamental concepts
of plate tectonics and to establish the geologic and plate tectonic setting
of the Fiji Islands This information provides a basis for evaluating the
seismicity data presented in the following sections
Fiji is located along a portion of what is commonly called the Pacific
Ring of Fire The concentration of earthquakes (Figure 4a) and volcanoes
(Figure 4b) along this trend were used to establish the boundaries of the
lithospheric plates in the modern view of plate tectonic theory (Figure 4c)
These plates which are relatively rigid cover the surface of the earth
like a mosaic of rigid caps and move against each other by sliding (1) past
~ 14-
bull - bull-bull -
44
N
-V V r
0
t
for OrN rw Or r U wrr w I - I 4
configu
Figue Wrddsrbto f()erhuksad()vlaos (0) rto fte mjr tcoi lts o h at ufc fo Turctte a Scuet 1982 0
TuUote n Schubrt 982
15
at a transform fault (2) over at a convergent margin (such as subduction at
a deep sea trench) or (3) apart from one another at a divergent margin
(such as spreading at a mid-ocean rift) Figure 5 shows skematically the
spatial relationship of these different types of boundaries Convergent
plate boundaries are responsible for the majority of the worlds large
earthquakes and most of the worlds tsunamis Many volcanic arcs form
parallel to the deep-sea trenches above the point where the subducted plate
reaches about 100 km depth
The Fiji islands are a component of the Melanesian Borderlands that
form the boundary between the Pacific and Indo-Australian lithospheric
plates (Figure la) The entire Southwest Pacific region extending from the
Solomon Islands to New Zealand is dominated by plate convergence between
these two plates The present loci of convergence are the Solomon New
Hebrides Tonga Kermadec and Hikurangi trenches They are all characshy
terized by large shallow earthquakes inclined seismic (Benioff) zones and
Quaternary volcanism The present-day plate convergence vector is oriented
east-west over much of the region (Minster and Jordan 1978)
The Tonga-Fiji-New Hebrides segment of the plate boundary (the
Melanesian reentrant) is unusual in several respects (1) the convergent
boundary is discontinuous jumping from westward subduction at northern
Tonga to eastward subduction at the southern New Hebrides (2) it is one
portion of the convergent plate boundary that is not dominated by plate
subduction (3) the broad geologically complex Fiji Platform sits within
the plate boundary (4) two east-trending bathymetric deeps the Vitiaz
Trench and the Hunter Fracture Zone mark the sites of former subduction
zones
16
A ST H E N 0 3 P H ERE
M E S 0 S P H E R E
ridge
trench ALshy
transform fault
Figure 5 (A) Sketch of the different types of plate tectonic boundaries and their relationships (Isacks et al 1968) (B) Diagram of the three types of boundaries in three-dimensional view
16a
Four bathymetric trenches mark the sites of present or former plate
subduction (1) the Tonga and Kermadec trenches extend in a nearly linear
fashion from New Zealand to the northern end of the Tonga arc over 2000 km
in length Their depth reaches 11 km in southern Tonga (2) the New
Hebrides Trench extends from 110 to 23degS reaching 8 km depth in the north
The trench is interrupted in the central segment but plate convergence is
observed along its entire length (Isacks et al 1981) (3) the Vitiaz
Trench appears as a well defined bathymetric deep locally over 6 km in
depth that separates the Mesozoic Pacific Plate lithosphere from the young
back-arc basin lithosphere of the North Fiji Basin Its morphology is
similar to that of active trenches (11alunen 1979) but shallow seismicity
and Quaternary arc-related volcanism are absent (4) the Hunter Fracture
Zone is a well-defined curvilinear belt of ridgetrough topography extending
from Fiji to the southern New Hebrides arc At its western end it intershy
sects the southern termination of the New Hebrides Trench Bathymetric and
seismic reflection profiles across the Hunter Fracture Zone show that the
subduction margin morphology is preserved well into the Fiji Platform
(Brocher and Holmes 1985) The Koro Sea (between Fiji and the Lau Ridge)
represents its eastern termination
The island arcs stand out as bathymetric highs landward of the
trenches (1) the Tonga and Kermadec arcs form a linear bathymetric high
landward of the trenches Quaternary volcanic activity has taken place at
irregular intervals along its length (Figure la) (2) the New Hebrides arc
is a bathymetric high extending parallel to the New Hebrides Trench The
geology of the New Hebrides records an irregular history of arc volcanism
that has persisted over the last forty million years (3) the Lau Ridge is a
17
remnant arc isolated from the Tonga subduction zone by back-arc spreading
in the Lau Basin (Karig 1970) It previously formed part of the active
Tonga arc but is no longer volcanically active (Whelan et al 1985
Woodhall 1985a) (4) the Fiji Platform is delineated by a broad area of
shallow water depths separated from the Tonga and New Hebrides arcs by the
North Fiji and Lau basins The rocks exposed on the Fiji Islands record a
complex history of arc volcanism and deformation beginning in the Late
Eocene and extending into the Quatednary (Rodda 1967 1974 Gill et al
1984 Rodda and Kroenke 1984)
Active back-arc basin spreading has been identified in the North Fiji
Basin and Lau Basin based on shallow seismicity seismic wave velocities
and attenuation high heat flow magnetic anomalies and the presence of
tholeiitic basalts (Karig 1970 Chase 1971 Barazangi and Isacks 1971
Sclater et al 1972) These basins are marked by relatively uniform areas
of shallow water depths (-3 km) surrounding the Fiji Platform Inactive
back-arc basins have been identified in the Loyalty Basin (west of the New
Hebrides Trench) and the South Fiji Basin (south of the Hunter Fracture
Zone) They are marked by areas of relatively deep water that are separated
from the Southwest Pacific Basin by the active arcs and trenches Finally a
major regional scale transcurrent boundary in the interarc region is the
Fiji Fracture Zone (FFZ) The FFZ is most clearly evident as a continuous
belt of seismicity extending westward from the northern termination of the
Tonga Trench (Figure 6) Along several segments of the FFZ the belt of
seismicity coincides with rough seafloor morphology north of Fiji the FFZ
forms the well defined linear boundary of the Fiji Platform Strike-slip
focal mechanisms along its entire length confirm its identification as the
18
10 0 o0
S 0 ~ 0 C Cgt0
15 deg 0 0o 0 0 0 0
200 o 00
00
0 00C
coe20 ston L s 00
300 25 7 a e c th 165 B07 751017 7
dm 0 ( 0 0
165 E 170 175 180 175 W 170
Figure 6 Shallow earthquakes (depth _lt80 km) in the interarc region 1961-1984 Locations are from Preliminary Determination of Epicenters (PDE) constrained by _gt 20 stations Light shading indicates areas gt 2 km depth heavy shading shows areas gt 5 km depth for New Hebrides and Vitiaz trenches gt 75 km depth for Tonga and Kermadec trenches Bathymetric data from Kroenke et al (1983)
19
southern transcurrent boundary of the Pacific Plate in this area (Chase
1971 Isacks et al 1969 Green and Cullen 1973) However new seismoshy
logical and bathymetric observations require that the FFZ be a complex plate
boundary zone rather than a simple linear fault zone
Physiography and Submarine Morphology
The Fiji Platform is marked by the broad apostrophe-shaped shallow
platform at depths shallower than 2 km of which the islands of Fiji are a
small subaerial component (Figure 7) The main islands of Viti Levu and
Vanua Levu account for over 85 of the land mass of the country and are
among the largest of the Pacifics volcanic islands Topographic relief
reaches 1400 m in the interior of Viti Levu 1200 m on Taveuni and 1000 m
on Vanua Levu The islands of the Lau Group represent volcanic edifices
sitting atop the broad remnant arc platform (Karig 1970) forming the
tail of the apostrophe
The volcanic island of Kadavu sits on a separate elongated ridge
paralleling the deep trough of the Hunter Fracture Zone (HFZ) The fracture
zone is defined by an irregular series of deep basins marking the boundary
between the relatively deep Oligocene back-arc basin of the South Fiji Basin
and the shallow late Cenozoic North Fiji Basin A new bathynetric compilashy
tion by Smith and Raicebe (1984) shows the HFZ near Fiji to have a double
ridgetrough structure strikingly similar to the trenchstructural
highforearc basinvolcanic arc morphology conmonly observed in other
subduction zone settings The HFZ continues as a shallower trough into the
Koro Sea east of Viti Levu and its prominent structural signature is
preserved at least as far north as 185degS (Brocher and Holmes 1985)
NORTHCjv
~~ 0
UP
aen
Yadua
Tavun
au
Vau
FIJI ~ 1-BSNBARAVI
~ a ~
BASIN 0
30G
alulele
0 Gau
( 5 ) j
10 -1
OA L k
BASIN Lkb
e ~ aoa~ ~ 5
M a ukru
b t~ mGrou t )
tooa~
LA U
AI ASI
200
~ SOUTH~ 7 J ~Ono-I-L D
0
BASIN
1741E 176 1781W78 6-
Figure 7 Physiography of the seafloor in the Fiji region from Rodda and Kroenke (1984) Bathymetriccontours in hundreds of meters from Kroenke et al (1983) C
21
The Fiji Fracture Zone (FFZ) represents a complex morphological boundshy
ary of the Fiji Platform It is marked by an en echelon series of ridges
and troughs with over 3 km of relief in the portion of the FFZ north of the
Yasawa Group The FFZ is less evident as a morphological feature east of
1785degE north of Vanua Levu where its expression is masked by sedimentashy
tion from rivers draining the northern portion of the island Sharp changes
in strike of the FFZ are observed near 177degE 1788degE and 180 deg
A series of basins west of Viti Levu mark another tectonically active
boundary of the Fiji Platform Troughs up to 4 km depth are prominent along
the western margin of the platform Brocher and Holmes (1985) interpreted
these basins as the physiographic expression of rifting of the forearc
margin of the former Vitiaz arc convergent plate boundary The rough
topography in this area coincides with a belt of shallow seismicity evident
on teleseismic maps (Figure 6)
Within the platform extensive coral reef development is an important
morphological element Fringing reefs and lagoons are evident around most
islands and barrier reefs are developed around the major islands The
reefs are important in limiting the effect of tsunamis originating outside
the islands however in the case of the 1953 Suva earthquake tsunamis were
apparently generated by slumping off the barrier reefs (Houtz 1962a)
Geological Evolution of Fiji
The rocks exposed on the Fiji Islands are among the oldest observed in
the islands of the Southwest Pacific The geology is dominated by
arc-related volcanic and intrusive rocks and thick sequences of volcanoshy
clastic sediments The size of Fijis land mass combined with the presence
of felsic intrusives thick sediment sequences and major orogenic episodes
22
has led Fiji to be described as continental or quasi-continental in
character (Green and Cullen 1973 Eden and Smith 1984) However the Fiji
Platform differs from continental land masses in several important respects
(1) the average crustal thickness of 15-20 km is far les6 than normal
continental crust (2) low mantle velocities beneath the platform demonshy
strate a thermally attenuated lithosphere lacking the thick rigid mantle
lid that underlies most continental crust (3) the presence of ongoing
deformation and Neogene volcanism in the Fiji region observed both around
and within the Fiji Platform indicates a degree of crustal mobility that is
not expected of stable continental masses
Figure 8 presents a simplified geological map of Fiji from Rodda and
Kroenke (1984) The oldest known strata in Fiji are the Late Eocene rocks
of the Wainimala Group (Rodda 1976 Gill et al 1984 Rodda and Kroenke
1984) These strata were mildly deformed during the Wainimala Orogeny
during the middle Oligocene It is marked by a period of nondeposition
throughout Fiji that extends to the latest Oligocene Arc tholeiitic and
calc-alkaline magmatism occurred in Viti Levu throughout the Miocene (Gill
et al 1984 Rodda and Kroenke 1984)
The major orogenic episode in Fiji was the Colo Orogeny around 10 my
BP It is marked by (1) a prolonged gap in the stratigraphic record (2)
widespread folding and faulting accompanied by greenschist metamorphism
and (3) intrusion of tonalite gabbro and trondhjemite The Colo Orogeny
also coincides with a significant arc-deforming event in the New Hebrides
arc uplift and erosion of the Western Belt province at 11-8 my BP
(Carney and Macfarlane 1982)
160 1 1 i
S
VANUALV RAB
ax TAVEU-
17 Seatura V NAMENALALA U MIOCENE - HOLOCENE
_ O
B Rakiraki KORO
K
SEDIMENTARY ROCKS U OLIGOCENE - U MIOCENE UPPER WAINIMALA (includes someIgneous rocks) SIGATOKA (SI) and
SAVURA (Sa) GPS -~~~~ - MO~AKOGAI PLIOACAENE SHOHONITI OVROA
bull CALCALKALINE BASALTIC VOLCA-
Lautoka T Tavua V
NAIGANI Wand WAKAYA
NOES (includes Ba in part andesilic (B)Koroimavua (K) volcanic groups)
K -
ALAU 7BASALTS NA IR 2
BATIKI NAIRA__
JOVALAUMIOCENE HOLOCENE ALKALIC (I Mio on Vili Levu Plio on
Vanua Levu Plio-Pleist on Koro Pleist-Holo on Taveuni)
U MIOCENE - L PLIOCENEMACUADROVE SUPER GROUP
180 _(Vanua Levu) GAU U MIOCENE CALCALKALINE
ROCKS
MIOCENE STOCKS 010 LVPLUTONIC
(D BEOA OLIGOCENELGCN AUASOK SUITE(Tholeiitic )
177degE 178deg 179 deg 180
Figure 8 Simplified geology of Fiji from Rodda and Kroenke (1984) Blank areas within Viti Levu are known or likely Lower Wainimala Group (Late Eocene to Early Miocene rocks)
24
Following the Colo deformation a resurgence of volcanizm took place
throughout Fiji (Gill et al 1984 Woodhall 1985a) An unusual sequence
of thick rhyolitic volcanics were extruded at -7 my BP in northeastern
Vanua Levu that may be related to incipient fragmentation of the Fiji arc
(Gill et al 1984)
During the period 5-3 my BP magmatism in Fiji changed dramatically
to become dominated by transitionalshoshonitic volcanism in northern Viti
Levu and the Lomaiviti Group (Dickenson et al 1968 Gill 1976 Gill et
al 1984) After 3 my BP volcanic rocks in Fiji were dominated by
alkali basalts generated from a very different ocean island-like source
(Gill 1976 Gill et al 1984)
Through the period of arc modification an unusual remnant of
calc-alkaline iolcanism persisted on Kadavu Island at the southern edge of
the Fiji Platform Kadavu is on a major bathymetric ridge paralleling the
Hunter Fracture Zone The trench-like morphology of the fracture zone
(Launay 1982a) combined with the oblique truncation of linear magnetic
anomalies in the South Fiji Basin is indicative of subduction along this
boundary post-dating the Oligocene creation of the South Fiji Basin
Subduction-related andesites and dacites dated at 34 + 05 my BP
(Whelan et al 1985) document convergence along the Hunter Fracture Zone
extending into the Quaternary
Other documented Quaternary volcanism in Fiji is found in the alkali
basalts of the Lomaiviti and southern Lau Groups (Whelan et al 1985
Woodhall 1985a) and on Taveuni Island (Frost 1974) The Taveuni ash
eruption dated at 2050 years BP based on archaeological investigations
is the only documented Holocene activity in Fiji
25 Post-Colo structural deformation is evidenced by faulting of rocks
deposited above the Colo unconformity Many of these faults observed in
Viti Levu are near-vertical with significant stratigraphic throws (Band
1968 Rodda 1974) In many cases the post-Colo rocks are unaffected by
the faults in the underlying basement (Rodda 1974) From the Late
Pliocene the island of Viti Levu has been affected by rapid domal uplift
that has resulted in the abandonment and deformation of late Cenozoic
erosion surfaces in western Viti Levu (Dickenson 1972) Basaltic rocks of
the Ba Volcanic Group erupted as pillow lavas below sea level during the
Pliocene have subsequently been uplifted to over 1000 m elevation in
central Viti Levu (Rodda 1976) This uplift within the Fiji Platform
clearly post-dates the fragmentation of the Vitiaz arc and the establishment
of the present tectonic configuration The observation of anomalous
(low-velocity) mantle beneath the Fiji Platform (Hamburger 1986) reflects
thermal thinning of the Fiji lithosphere associated with the processes of
back-arc magmatism in the neighboring Lau and North Fiji basins The rapid
doming of Viti Levu then may be an isostatic response to the introduction
of low-density mantle material beneath the Fiji Platform
On a historical time scale geodetic observations in southeastern Viti
Levu by Berryman (1981) indicate rates of shear strain on the order of 06
pradyr accumulated over the period 1909-1980 The crustal seismicity that
is documented in the folowing section is the product of ongoing deformation
of the Fiji lithosphere
SPATIAL DISTRIBUTION OF EARTHQUAKES IN FIJI
A prodigious amount of seismicity data has been gathered for the Fiji
region including (1) the historical record of large earthquakes based on
26
macroseismic and instrumental observations (2) teleseismic earthquake
locations from the global seismic network (3) results from an early
three-station network operated in Fiji during 1965-1969 and (4) local and
regional earthquake locations from the telemetered network operated in Fiji
since 1979
The combination of all these data sources provides a composite picture
of the seismicity of Fiji over a wide range of spatial temporal and
magnitude scales each data source is limited by its magnitude threshold
duration of observation and degree of spatial resolution Together they
provide the state-of-the-art in our understanding of where and how earthshy
quakes occur within and around the Fiji Islands The important application
of this understanding is a more realistic assessment of seismic potential
along Fijis seismogenic zones and the seismic risk to major development
within the country
Historical Earthquakes
Fijis short written history prevents a complete reconstruction of the
recurrence cycles of major earthquakes throughout the Fiji region Nonetheshy
less the earthquake history for the past 1) years however incomplete
demonstrates aspects of Fiji seismicity not evident from an examination of
more uniform but shorter-term seismicity catalogs
Figure 9 shows the major historical earthquakes in the Fiji region
from Everingham (1983a 1984) Seventeen major earthquakes with magnitudes
greater than 65 have occurred close to the islands An additional fifteen
events with magnitudes greater than 60 are located in the same vicinity
The locations for these events are based on both macroseismic (intensity)
and teleseismic (instrumental) observations Those occurring before the
27
1971
01982 t1962
1950 a96oO-O a
974 O195760199 0A L9VU 1919 1)
1884 97 199574
0 06 1921 G151AWALEV
G1932
VITI LEVU t869
00 NIJON
195953 05
0934 01953 C5 omI 15
1950 o
01965 D LARGE SHALLOW EARTHOUAKES IN THE FIJI REGION
01955 0 Moviluot 60 - 64 195 IMS) 65 -70
1963 SC-Lt
II I I 1 I
Figure 9 Historical seismicity in the Fiji region Data are from Everingham (1983a 1984)
28
middle of this century must be regarded as approximate Errors of up to one
degree in instrumental locations result from inaccuracies in reporting of
arrival times uneven station distribution manual earthquake locations
etc Reporting of earthquake intensities is not altogether reliable
particularly before the beginning of the century Nonetheless the level of
development in Fiji since 1900 provides assurance that major events have not
been omitted from the catalogs
A large proportion of the major events around Fiji took place along the
microplate boundaries surrounding the platform As with the teleseismic and
microseismic events discussed below these earthquakes concentrate in the
northwestern Lau Basin (large events northeast of Vanua Levu) along the
Fiji Fracture Zone (seven events located north and west of Vanua Levu) and
along a zone of seismicity west of Viti Levu (five events near 176degE)
In contrast to the overall distribution of teleseismically located
earthquakes however several major events occurred within the Fiji
Platform These include the 1953 Suva earthquake (N - 675) the 1932 Koros
earthquake (Ms - 65) and the 1979 Taveuni earthquake (Ms - 69) discussed
in the following sections In addition Everingham (1983a 1984) reported
four significant events near Kadavu Island (1850 1935 and 1950) and one
within Viti Levu (1869) Two smaller but damaging earthquakes took place
near Kadavu (1918) and near Ovalau Island (1906) None of these events
exceeded magnitude (Ms) 71 however several had significant macroseismic
effects and are thus important for seismic hazard evaluation The occurshy
rence of large earthquakes within the platform confirms a conclusion that
emerges from the microearthquake observations intraplate deformation
within the Fiji Platform is a significant component of the regional deformashy
29
tion field but it occurs more infrequently and is separated by longer
periods of quiescence than that occurring along the interplate seismic zones
that bound the platform The obser7ation that earthquakes larger than
Ms - 71 are not recorded in a region characterized by high rates of relashy
tive plate motion suggests that the Fiji lithosphere is incapable of storing
sufficient stress to result in larger earthquakes Because of the brevity
of the seismological history of the Fiji region the occurrence of larger
prehistoric earthquakes cannot be ruled out
Teleseismicallv Located Earthquakes
Figure 10 shows in detail the teleseismically determined distribution
of shallow earthquakes around Fiji (depth lt 80 km) This map includes all
the events located by more than 15 stations of the global seismograph
network from 1961-1983 plus the better located of the earlier events
(1928-1960) that were relocated by Sykes (1966) and Sykes et al (1969)
The criteria used in compiling this catalog are described in detail by
Hamburger (1986) This data set provides generally higher precision
records lower magnitude activity (to mb gt 45) and a larger number of
events than the historical catalog The higher sensitivity improves the
resolution of finer scale spatial patterns Generally the events in this
data set are expected to have absolute errors under 20-25 km The overall
distribution of epicenters presented in this figure shows that on this
limited time and magnitude scale seismic deformation is largely confined to
active interplate zones surrounding the Fiji Platform
The detailed bathymetry in this area shows that the seismic zone north
of the Fiji Islands coincides with the rough topography of the Fiji Fracture
Zone The structural trends inferred from the elongation of the steep-sided
30
15
~ ~ 00
16 C lt -rdeg ro2 0
16 0pound0
~0017 shy
18 bull
00
20O
176 E 177 178 179 180 179 W 178
Figure 10 Teleseismically located earthquakes in the Fiji region Locations from Sykes (1966) and Sykes et al (1969) for 1928-1960 (A and B grades) from International Seismological Summary (ISS) and International Seismological Centre (ISC) catalogs for 1961-1980 and PreliminaryDetermination of Epicenters (PDE) Catalog for 1981-1984 Depth contours for 2 3 and 4 km depth are from Smith and Raicebe (1984)
31
ridges and basins are close to the regional strike of the earthquake belt
Over 3 km of relief is observed in these en echelon ridges and troughs The
nearby island of Cikobia situated northeast of Vanua Levu and directly
adjacent to the fracture zone (location shown in Figure 7) shows marked
Quaternary uplift (Berryman 1979) as additional support of active tecshy
tonism of the area
The seismic zone west of Viti Levu has been proposed as the location of
a North Fiji Basin spreading center (Sclater and Menard 1967 Chase 1971
Brocher and Holmes 1985) The earthquake belt coincides with a series of
Irregular basins with a marked north-northeast trend The basins coincide
with a north-trending free-air gravity low and high-amplitude magnetic
anomalies Seismic reflection profiles show little sediment cover in the
basins and document extensional deformation of the rifted arc margin at
the shelf edge of western Viti Levu (Brocher and Holmes 1985)
A few isolated epicenters are located within the Fiji Platform partishy
cularly in the area east of Vanua Levu A second group of events is located
sout of Viti Levu within and surrounding the Kadavu Island ridge A single
isolated event that appears within the island of Viti Levu is actually a
mislocated aftershock of the 1953 Suva earthquake which is located immedishy
ately south of the main island
Tripartite Seismic Network 1966-1969
Sykes et al (1969) first examined seismicity of the Fiji region using
a network of local seismic stations installed by B L Isacks in 1965 The
three-station network operated for nearly four years and included several
temporary sites throughout the Fiji Islands Locations from the first six
months of network operation were presented in their paper those from the
32
subsequent period were examined by Draunidalo and Hamburger (1984)
HYPOELLIPSE (Lahr 1984) relocations of these events were obtained using the
same velocity model used for telemetered network locations Hypocentral
parameters are given in Hamburger (1986) and the two sets of earthquake
locations are shown in Figure 11 These earthquake locations show the same
prominent seismic zones north and west of Viti Levu as the teleseismic data
shown in Figure 10 with a small number of shocks occurring south of that
island The large aperture of that network did not permit location of very
small events However Sykes et al did observe scattered seismicity in
areas previously thought to be aseismic east and northeast of Viti Levu
southwest of Viti Levu (near Kadavu Island) and in the seismic zone just
offshore southeastern Viti Levu In histograms of S-P intervals of earthshy
quakes recorded at the Fiji stations Sykes et al noted a continuum of
earthquakes with S-P intervals less than 10 sec at the southeastern Viti
Levu station Vunikawai These earthquakes few of which were located must
have occurred within the Fiji Platform rather than along its edges
Furthermore a prominent peak in activity was observed at VUN for S-P
intervals of 1-4 sec reflecting the high activity in the southeastern Viti
Levu seismic zone discussed in the following section
Fiji Telemetered Seismic Network 1979-1985
The seventeen-station national seismic network of Fiji is shown in
Figure 2 The network began operation with the establishment of the
eight-station US AID network in 1979 on the islands of Viti Levu Ovalau
and Beqa supplementing the three stations already operating at Vunikawai
Suva and Nadi
33
S1WRN I[A 41iI
S
2
176 E 177 178 179 180 179 W178
Figure 11 Microearthquakes in the Fiji region 1965-1969 Locations from 3-station seismic network operated by Sykes et al (1969) Triangles show locations of seismic stations Squares indicate locations obtained by Sykes et al for first 6 months of network operation Circles indicate relocations of events reported in subsequent 2 12 years by Draunidalo and Hamburger (1984) Depths constrained at 10 kin Bathymetry as in Figure 10
34
In December 1981 a five-station telemetered network was established
on the islands of Vanua Levu Koro and Taveuni through the Japanese aid
program From that time all the telemetered stations have been recorded on
a Japanese event-triggered 25-channel hot stylus pen recorder In early
1983 the Fiji Mineral Resources Department expanded the network by the
establishment of a three-station telemetry network around Monasavu Dam in
central Viti Levu Considerable technical difficulties have been encounshy
tered at many of the telemetered stations due to unreliable power supplies
degradation of electronic equipment weather-related interference and wind
and lightning damage Such problems have limited the operation of network
stations to some 50-75 of total operating time
The history of network operation is reflected in the histogram of
earthquakes located by the network (Figure 12) The system began recording
in November 1979 and was immediately inaugurated by the occurrence of two
major earthquake sequences the November 16 Taveuni earthquake (Ms - 69)
and its aftershocks and a prolonged swarm of moderate-sized events in
April-May 1980 including three events with ML gt 50 northeast of Vanua
Levu Two additional peaks in the histogram are associated with sequences
west of Viti Levu and along the Fiji Fracture Zone in September and
December 1980 respectively Through 1981 the network operated less
reliably debilitated by technical problems with field stations telemetry
and the recording system
The increase in activity in December 1981 reflected a period of
maintenance and repair of existing instruments and the establishment of the
Japanese aid network Through June 1983 the level of recorded seismicity
was to some degree limited by the operation of an event-triggered recording
120 1 1 1 1 1 1
C 100 Taveuni (65)
H
80 gtNE Vanua Levu
(5054 5051)
0 60
40 W Viii Levu (53)
Fiji Fracture Zone Baravi Basin swarm
Z (58 50)
~(51 KadaVU
51)
Fiji Fracture Zone (57 56 59)
20 1
0 1979 1980 1981 1982 1983 1984 1985
YEAR OF NETWORK OPERATION
Figure 12 Histogram of earthquakes recorded by the Fiji seismic network 1979-1985 Major earthquake sequences are noted with mainshock magnitudes (ML) given in parentheses See text for discussion
36
system The sudden increase in mid-1983 followed the reinstallation of a
continuous recording system and a second period of instrument maintenance
Subsequent peaks in the histogram are associated with major earthquake
sequences near Kadavu Island (July-August 1983) along the Baravi Basin
(June 1984) and along the western Fiji Fracture Zone (October 1984) The
major gap in recording at the beginning of 1985 follows the devastation of
network telemetry by Hurricanes Nigel and Eric The data available at the
time of this writing end in August 1985
Earthquake Locations
During the nearly six years of network operation over 5000 local
earthquakes were recorded by the Fiji seismic network Of these events
approximately 1800 were recorded with sufficient redundancy to provide
reliable earthquake locations Details of the earthquake location procedure
can be found in Hamburger (1986)
A grading scheme was designed to cull out the best locations within
each earthquake source region The earthquakes were first classified into
eight source regions based on the distribution of earthquake foci and their
relation to the seismic network (Figure 13) Grading criteria were applied
consistently within each seismic region but varied from region to region
The criteria used are based on the output parameters from the location
program HYPOELLIPSE number of recorded P- and S-arrivals RMS residuals
minimum epicenter-station distance azimuthal gap and the size of the error
ellipse for each event The grading criteria are summarized by Hamburger
(1986) These grading criteria provide a systematic means to compare
earthquake locations within each area
37
0100 Io15
S FFZ 0 S o TAV 0S
00 0 o o0 0o - 0
0 O 00 0 0 0POFF 0 U _
0 L 0 0
FEo 3 o o o o 0
0 0 o0
SVL o oo LAU 19 degVo o CC 1 0 00 0 0 11760 E 17 o 17 17 r10 17W7
00 0 D 000 0
0 0 0
000
WVL 0 0o KAD
21 1 1 ( - -a
176 E 177 178 179 180 179 W 178
Figure 13 Earthquake source regions near Fiji Regions are defined based
on distribution of earthquakes and relation to network geometry and are used in defining grading criteria See text for discussion
38
Depth Determinations
Determination of reliable earthquake depths is a function of the number
and accuracy of arrival time readings and of the geometry of the network
used for locating each event For earthquakes located within the dense
network of southeastern Viti Levu the pattern of arrival times (or
source-to-station distances) uniquely determines a particular depth at which
the RMS of the traveltime residuals is minimized On the other hand for an
earthquake in the Taveuni region far outside the seismic network the
arrival-time data can be matched by virtually any crustal depth
Because there is very little constraint on hypocentral depths outside
the seismic network the hypocenters of these earthquakes were simply fixed
at a midcrustal depth of 10 km consistent with the observed focal depths in
Viti Levu (see below) Depths were allowed to vary only for earthquakes
within and near Viti Levu and for the small number of events outside this
region recording both P- and S-arrivals at a station within 50 km
The distribution of earthquake depths in Fiji is given in Figure 14
Virtually all the well constrained depths fall within 20 km of the earths
surface and a ubstantial majority at depths lt 13 km A very small number
of earthquakes were located at depths exceeding 30 km but all of these
events are considered poorly constrained (grade D) From the network
locations there is no evidence of any intermediate-depth activity that
might be expected from the recent northward subduction of South Fiji Basin
lithosphere beneath the Fiji Platform (Malahoff et al 1982a Gill et al
1984) A single teleseismic event located south of the Platform at 73 km
depth was found to be a mislocated shallow event The best-constrained
hypocentral depths those located within the small-aperture network in
39
100
80
z ~60
20shy
o
0 10 20 30 40 50
DEPTH (KM) Figure 14 Histogram of hypocentral depths for all earthquakes located bythe Fiji seismic network classified by grade D - unfilled C - light shading B - dark shading A - black
40
southeastern Viti Levu cluster at midcrustal depths of 7-13 km The deepest
A-grade event is near the base of the crust at 18 km The B-grade events
extend to 20 km depth
In general the depth distribution is quite similar to that observed in
areas of continental extension and strike-slip deformation (Chen and Molnar
1983 Smith and Bruhn 1984) Corbett (1984) found earthquakes located by
the southern California seismic network to be limited to the upper 22 km of
crust A similar double-peaked histogram was observed with concentrations
of activity in the upper 4 km and between 10 and 16 km depth Chen and
Molnar ascribe the overall concentration of activity in the upper crust to
high geothermal gradients limiting the material strength in the mantle and
lower crust The observed concentration of seismic activity within the Fiji
crust and the sharp drop-off in activity near its base is consistent with
the observation of anomalous (low-velocity) upper mantle beneath Fiji
stresses sufficient to generate earthquakes can accumulate only in the thin
crust that forms a rigid cap on the relatively hot ductile mantle of the
Fiji Platform
Earthquake Magnitudes
When possible earthquake magnitudes have been assigned to all of the
newly located events in Fiji The magnitudes were computed from trace
amplitudes and coda durations recorded on instruments of the telemetered
network The development of a magnitude scale for the Fiji network is
described in detail by Hamburger (1986)
The distribution of magnitudes reported for all events during the
operation of the seismic network is shown in Figure 15 Magnitudes range
from local magnitude ML - -10 (microearthquakes in southeastern Viti Levu)
41
150
125
W
Z 100
75--shy
25-shy
mm4
62 0 2 4
MAGNITUDE
Figure 15 Histogram of magnitudes for all earthquakes located by the Fiji seismic network
42
to ML - 65 (the large November 1979 Taveuni earthquake) From the largest
events the number of earthquakes in each magnitude range steadily grows to
a maximum of 130 earthquakes in the range ML - 28 - 30 At smaller
magnitudes the number drops due to the networks loss of sensitivity to
small earthquakes outside the network In fact the magnitude threshold may
be somewhat lower due to systematic underreporting of magnitudes of small
events during the latter period of network operation The magnitude
threshold is also evident in the magnitude-frequency relation of Figure 16
This figure shows the log of the cumulative number of events as a function
of magnitude Again a change in character is evident near the threshold
magnitude of ML - 30 At larger magnitudes the curve may be approximated
by a linear slope given by the line
log N - 517 - 080 ML
following Richters formula log N - A shy bM where the A value describes
the level of seismic activity in a region and the b value describes the
recurrence relations for that region The b-value of 080 is in the range
of tectonically active regions throughout the world (see Lee and Stewart
1981) It contrasts with the b-value of 049 obtained for the instrumental
catalog based on magnitudes less than 60 by Everingham (1983c) His low
b-value is based on compilation of surface-wave magnitudes (Ms) and results
in part from underreporting of smaller magnitude events during the early
part of this century
Seismicity Maps
In the following section we present maps of earthquakes in the Fiji
region recorded by the telemetered seismic network As a result of the
improved spatial resolution provided by the telemetered network the maps
3-shy
+
+
2 ++++ ++++ + +++ ++ ++ ++ +++ +++ +++++++++++++ +
-gt 1 U
00
0 2 4 6
MAGNITUDE (ML)
Figure 16 Magnitude-frequency plot for all events located by the Fijiseismic network The portion of the curve above ML - 30 is approximatedby the straight line log N - 517 - 080 ML The maximum network threshold near ML - 30 is indicated by the falloff in the curve at smaller magnitudelevels
44
can be used to characterize the seismic regime along each of the seismic
zones in the Fiji region Space-time diagrams of the network seismicity are
used to elucidate temporal patterns of earthquake occurrence along the
seismic zones Gross sections are presented for the earthquakes located
within and around the island of Viti Levu where depth resolution is
greatest
The 1800 earthquakes located by the telemetered network are presented
in Figure 17 Hypocentral parameters for each event are given in Hamburger
(1986) Figure 18 shows all earthquakes classified by magnitude Detailed
maps of several major earthquake sequences are displayed in Figure 20
Figures 24 and 29 present larger-scale maps of the seismicity within the
island of Viti Levu
Compared to the historical and teleseismic data shown in Figures 9 and
10 these new seismicity maps provide a new detailed picture of the pattern
of deformation within and around the Fiji Platform Several initial obsershy
vations stand out First the pattern of activity is far from uniform
Earthquakes occur in concentrated zones both within and along the boundaries
of the platform large areas exist which are virtually aseismic
Second the major zones of activity along the platforms margins
coincide with those defined by the historical teleseismic and the triparshy
tite network data the northeastern edge of the platform the Fiji Fracture
Zone the basins west of Viti Levu and to a lesser extent the Hunter
Fracture ZoneKadavu region That is these zones are also active at higher
magnitude ranges within a time scale observable by instrumental observashy
tions The areas of high activity within the Fiji Platform are not well
populated in the teleseismic data This contrast between network and
bull bull
45
15 0
0
OO 0 0
0 ~ii
0 A 0f) 0
k 993_
20 0
176 o 07 P 8 7 7178 170
FigZr hwn l atqae 07 oae yteFj esi0a
newoDBahm r asi igr 0
46
15 1 1
+S o16 0 +Q 1
0
0 0 _to017 0o 4 A 0 0
4~0
0 + 0
1 0 0 o +0~ Oc
100 + + 00 00
1 P0 0 0 O 0 00
0 o4
00 + S0 0 + 0 O
D R 01 0
0 00
0 0
21 +0 + 0 I I 176 E 177 178 179 180 179 W178
Figure 18 Map showing all earthquakes located by the Fiji seismic network classified by magnitude Grosses ML lt 2 small open circles 2 lt ML lt 3 large open circles 3 _ltML lt 4 shaded circles 4 lt ML lt 5 filled circles ML gt 5 2-km contour as in Figure 10
47
S i I
t
16
WA
17
00
19 0
20
M~A
176 E 177 178 179 180 179 W 178
Figure 19 Location map for major earthquake sequences presented in Figure 20 Bathymetry as in Figure 10
48
17
0 A S VI VII S
180 E 179 W
A C
19
E 176177
19 V V
C
Figure 20 Maps of major earthquake sequences since establishment of the seismic network (A) November 1979 Taveuni earthquake (ML - 65)(B) December 1980 Fiji Fracture Zone earthquake (ML - 58) (C) October 1984 Fiji Fracture Zone swarm (ML 57 54 59) (D) September 1980 West Viti Levu swarm (ML - 57) (E) July 1983 Kadavu swarm (ML = 51 51 48) Mainshock locations shown by filled squares Focal mechanism(s) and isoseismal data (Roman numerals) shown where available Unshaded bathymetric contours are identical those shown in Figure 10 Earthquake grades D - small open circles C = large open circles B shyshaded circles A - filled circles Large historical earthquakes in the Taveuni area (A) are shown by filled triangles
49
teleseismic observations is fundamentally a sampling problem The intrashy
plate zones of activity are observed by the network because (1) the
intraplate seismic zones are very active at lower magnitude ranges and
(2) the network happened to catch several unusual major earthquake
sequences in areas of relatively low activity The distribution of earthshy
quake magnitudes (Figure 18) bears out both causes (1) the concentration
of activity in southeastern Viti Levu is almost entirely composed of small
events (ML lt 3) Of the 500 earthquakes located within Viti Levu none have
been large enough (mb gt 45) to have been located teleseismically (2) the
concentration of activity near Taveuni Island is the result of a fortuitous
earthquake sequence two weeks after the network began operation In the
following section each of the major earthquake source areas in the Fiji
region are considered in detail (shown in Figure 13)
1 Taveuni (TAV) This area is dominated by two major earthquake
sequences that occurred early in the networks operation The 16 November
1979 Taveuni earthquake (M - 69) is the largest event to occur in thes
region in over 30 years and the most destructive in Fiji since the 1953 Suva
earthquake The earthquake was strongly felt (MM VII in the closest
islands) throughout the islands of Taveuni Vanua Levu Rabi and Kioa
(Figure 20A) An intense aftershock sequence continued for several weeks
following the mainshock and isolated events continued for over a year
thereafter The probable mainshock location was constrained by the pattern
of macroseismic data as well as by S-P intervals at temporary seismic
stations occupying nearby sites in the days following the mainshock
(Everingham 1982a) The teleseismic solutions (PDE ISC locations) did not
utilize the local network observations and are positioned 20 km to the
50
southwest of the probable location In any case the mainshock and aftershy
shock locations indicate that the rupture occurred well within the thickened
crust of the Fiji Platform
The earthquake focal mechanism (Figure 21) was pure strike-slip with
fault planes oriented nearly north-south and east-west These orientations
coincide with neither the northeast-trending bathymetric fabric nor major
faults mapped onshore Vanua Levu or Taveuni But the NW-SE orientation of
the mechanisms T-axis is consistent with the sense of extension inferred
from the axial fissure zone and parallel normal faults that strike along
the axis of Taveuni (Woodhall 1985b) as well as the normal faults that
delimit the Natewa Bay graben separating the twin peninsulas of Vanua Levu
(Green and Cullen 1973) Taveuni is the one locality in Fiji where
Holocene volcanic activity has been documented (Frost 1974) and the alkalic
trend of Taveunis Quaternary lavas reflects this extensional character In
addition the elongation of the volcanic axis of the is]and reflects the
NE-SW direction of maximum compression as described in the Japanese
(Nakamura 1977) Alaska (Nakamura et al 1977) and the New Hebrides arcs
(Roca 1978) The axis of principal compression observed in the Taveuni
earthquake shows the same dominant stress field The historical record for
this region (Figure 9) indicates that major intraplate activity has occurred
near Taveuni throughout this century
A second major sequence of earthquakes occurred northeast of the island
of Vanua Levu (Figure 17) and constitutes a major swarm of activity in
April-May 1980 The sequence included three events with ML gt 5 and nine
events with 4 lt ML lt 5 Recordings from the earthquakes are characterized
by highly attenuated low-frequency P- and S-arrivals and contrast sharply
51
N
T o
0W- 0 shy
00
0
0 0
Figure 21 Focal mechanism for the 1979 Taveuni earthquake Equal-areaprojection of the lower hemisphere of the focal sphere Large open andfilled circles represent clear dilatational and compressional firstmotions respectively Less reliable first motions are shown as small openand filled circles Large and small X-marks indicate clear and uncertain P-wave arrivals respectively that are judged to be near a nodal planeArrows show directions of S-wave polarization The P (pressure) aizd T(tension) axes are located at the base of the letters P and T
52
with those associated with the nearby Taveuni aftershock sequence Because
the propagation path from the Vanua Levu swarm to the seismic network is
nearly identical to that followed by the Taveuni sequence the zone of
attenuation must be located close to the swarms source area In any event
the quality of the arrivals resulted in a generally poor location accuracy
which implies that the strong apparent northwesterly trend to the sequence
is simply an artifact of the poor constraint on station arrival times The
best constrained locations cluster near the northeastern tip of Vanua Levu
island the probable source area for the sequence Like the Taveuni earthshy
quakes this sequence is located within the margins of the Fiji Platform
The area is adjacent to a particularly complex confluence of tectonic
elements where the Fiji Fracture Zone intersects the margin of the Fiji
Platform and Lau Basin The influence of magmatic processes is suggested by
the swarmlike character of the sequence (eg Hill 1977) and the highly
attenuated waveforms (eg Sanford and Einarsson 1982 Iyer 1984) Other
than these two major earthquake sequences the Taveuni region appears to be
quiescent
The temporal distribution of earthquakes in the Taveuni area is shown
graphically in Figure 23E This figure demonstrates the dense clustering of
activity in the 1979 Taveuni mainshock-aftershock sequence and the 1980
swarm offshore Vanua Levu as well as the subsequent quiescence of the
region This pattern is characteristic of intraplate activity within the
platform and contrasts with the more continuous activity along the Fiji
Fracture Zone (Figure 23A) and the West Viti Levu seismic zone (Figure 23B)
Long-term aftershocks of the Taveuni event are recorded up to a year after
the mainshock subsequently the zone is entirely aseismic (at the magnitude
53
15 S 0 0 Ao
16o 0 00 0 0o0171
o o gt 17 B 0 o OoDC
9 00
17 r ef o 0o -- 0 0 D 930--o0
0 0 0 L) I_P
19degoO 0 o 0
00 020 B 0 oO 0o 0- oJ C o 0
0 V 0
21 III176 B 177 178 179 180 179 W178
Figure 22 Map showing locations of space-time diagrams presented in Figure 23 Brackets denote area included in diagrams
A 1 I8--
2993
109 0
S1982 1981 o
I 199
o
0
doo -0
0
bull
0
0
I
A I9s
-0
0
B -
19
MA0
0
0 1993 lt
-
1982
0
I
C0
i I
bO2
I I
0
B C
198
1
CC1913
rL19R7
0-shy
0lt
C
r 9 (
1950
Cb oS00 0
Q I
50 i0
0
0
150 200 70 30o
DISTANCE (KM)
0 bull
0 0
350 400 450
19 1
2920
0
0 = -
o 50
0
0 O0000
0
00 150
DISTANCE
200
(KM)
230 o
300
190
980
29790 0
ishy50 100 150
DISTANCE
0
200
(KM)
230 300
D
19
I
e
I I I D E
1985
I I I 0
I E
lt 0 0
--982
~~~~ P
o
-- A 198
22 S
2920
190
S1981 2
29S(0
1970
o
Oshy Q
0 50 1979
100 150
DISTANCE
200
(KM)
235 300
1~~979
0 30
-0
200 150
DISTANCE
200
(KM)
230 300
Figure 23 Space-time diagrams for main earthquake zones in Fiji Small open circles ML lt 3 large opencircles 3 lt ML lt 4 shaded circles 4 lt ML lt 5 filled circles ML gt 5 Locations shown in Figure 22
55
range to which the network is sensitive) Activity at very small magnishy
tudes like that observed in southeastern Viti Levu is probably charactershy
istic of the Taveuni area as well small events with S-P times less than
10 seconds are recorded on seismographs on Taveuni and Udu Point but are
seldom of sufficient size to be recorded by the remainder of the network
This sporadic nature of intraplate activity underscores the importance of
the network data (low magnitude threshold) and historical data (long time
scale) in evaluating intraplate activity within the Fiji Platform
2 Fiji Fracture Zone (FFZ) Through each period of observation the
area of rough topography north of the platform has been the most seismically
active area of the Fiji region This belt of earthquakes is part of a
larger seismogenic feature 2nd continues to the east as a complex but
continuous zone of seismic activity which extends to the northern end of the
Tonga Trench) Further west it continues as a linear belt of seismicity
into the center of the North Fiji Basin As such it represents the present
southern transform boundary of the Pacific Plate in this area and has been
termed the Fiji Fracture Zone (Green and Cullen 1973 Hamburger and
Everingham 1985) The concentration of large earthquakes along this belt
(Hamburger and Everingham 1985 Hamburger and Isacks 1985 see Figures 9
and 18) confirms the contention that a major portion of the interplate
deformation is taken up there The westward extent of the fracture zone is
more ambiguous as its topographic expression is not well preserved west of
Fiji Seismicity extends into the central portion of the North Fiji Basin
but rapidly drops off west of about 174degE
Within the FFZ the seismic activity is non-uniform At all time and
magnitude scales (Figures 9 10 11 17) the portion of the FFZ directly
56
north of Viti Levu (1765deg-1785degE) has been continuously active The
portions of the FFZ further west and that located north of Vanua Levu (east
of 1785degE) are far less active However the historical record of seismishy
city (Figure 9) shows that significant earthquakes have occurred in the
quiet zone north of Vanua Levu during the last century indicating that the
present quiescence reflects a temporary locking of the plate boundary during
the interseismic period
The difference in seismic regime along the adjacent segments of the FFZ
reflects differences in the dynamics of plate interaction along this
boundary The eastern zone is oriented close to the PacificIndo-Australian
plate motion vector in this area implying predominant strike-slip motion
along the FFZ A sharp kink in the strike of the fracture zone occurs at
1788degE where the seismic activity picks up It is in the portion of the
FFZ west of 1788degE where active rifting has been observed Von
Stackelberg et al (1985) reported minor north-trending bathymetric ridges
offsetting the FFZ bearing fresh hydrothermally altered pillow basalts
These observations indicate that plate motion in this area is accommodated
by extensional as well as strike-slip deformation The continuous
swarm-like activity of the western FFZ is typical of localized areas of
extension within strike-slip tectonic environments (Hill 1977)
The space-time diagram for the FFZ (Figure 23A) clearly demonstrates
this contrast in activity The portion of the FFZ west of 1788degE (lt 225 km
distance) is characterized by virtually continuous activity with larger
events occurring in swarm-like sequences The eastern FFZ is characterized
by more isolated individual small to moderate-sized events Despite the
lower level of activity this quiescent portion of the FFZ has the evenly
57
distributed occurrence of events that is characteristic of the interplate
seismic zones The two major sequences along the FFZ (December 1980 and
October 1984) occurred near the edges of the active zone
These two important sequences are shown in detail in Figure 20BC The
December 1980 cluster was a mainshock-aftershock sequence following a
ML - 58 mainshock The sequence occurred close to the eastern edge of the
fracture zones active belt and close to a pronounced change in strike of
the zone The aftershocks are generally not very well located due to the
limited number of stations operating at the time their distribution sugshy
gests a very small rupture area near 162degS 1785degE
The October 1984 sequence is somewhat more complex and involved three
major events with magnitudes of 57 54 and 59 Centroid moment-tensor
focal mechanism solutions for these three events were available from the
US Geological Surveys Preliminary Determination of Epicenters This
sequence took place on the western end of the active zone near a second
change in strike of the FFZ The mainshocks are all characterized by
strike-slip faulting with east-west nodal planes paralleling the western
segment of the fracture zone The third major event of the sequence occurshy
red 125 km north of the fracture zone in a normally quiet portion of the
North Fiji Basin While this event may be considered a coincidental occurshy
rence its proximity in time and the similarity of mechanism suggest that
the earthquake was triggered by the rupture along the fracture zone The
east-west trend of the mechanisms nodal planes implies that it was the
portion of the FFZ west of 1775degE that ruptured during the sequence rather
than the active ENE-trending segment
58
At moderate magnitudes (3 lt ML lt 4) the portion of the FFZ between
17680 and 1788degE is continuously active In contrast the same area is
devoid of major historical events (Figure 9) During the six years of
operation of the telemetered network the two major earthquake sequences
along the FFZ nucleated at the edges of the active zone These phenomena
indicate that slip occurs relatively freely along the ENE-trending active
segment accommodated by continuous occurrence of small earthquakes and by
possible aseismic slip The occurrence of back-arc extension within the
seismically active portion of the FFZ also indicates that normal stresses
acting along this portion of the FFZ are at a minimum Slip along the
east-trending relatively quiescent portion of the FFZ occurs in major
earthquake sequences such sequences may nucleate at the edges of the active
zone
3 West Viti Levu Zone (WVL) Some 200 earthquakes are located in the
seismic zone forming the western edge of the Fiji Platform Like the events
northeast of Vanua Levu many of the WVL earthquakes produce poorly
recorded low-frequency shear arrivals that degrade the location accuracy in
this area In general the epicenters coincide with a series of bathymetric
troughs that mark the extensionally deformed margin of a former forearc
terrane (Larue et al 1980 Brocher and Holmes 1985) While the activity
in this zone is considerably lower than that along the Fiji Fracture Zone
the character of earthquake occurrence (Figure 23B) is similar--earthquakes
occur irregularly throughout the network operation The WVL zone is marked
by relatively high activity on all time and magnitude scales (Figures 9 10
11)
59
The bathymetric troughs west of Viti Levu are part of an area of rough
seafloor morphology where the 4 km-deep troughs approach the shelf slope of
the Fiji Platform Parallel to and inland of the troughs an elongate
bathymetric ridge forms the outer edge of the Baravi Basin This basin is a
sediment-filled trough located west and south of Viti Levu interpreted by
Brocher and Holmes (1985) to represent the forearc basin of the active
pre-Late Miocene Fiji volcanic arc The bathymetric ridge was interpreted
to represent a structural high analogous to the trench slope break of active
convergent margins in the terminology of Karig and Sharman (1975)
Single-channel seismic reflection profiles are suggestive of extensional
deformation of basin sediments near this former arc margin (Figure 4 in
Brocher and Holmes 1985) This sediment deformation combined with high
heat flow (Sclater and Menard 1967) and high-amplitude magnetic anomalies
(Brocher and Holmes 1985) provides evidence for recent North Fiji Basin
extension that Brocher and Holmes attributed to the Neogene rotation of
Viti Levu If this process is continuing the associated deformation should
be reflected in the present-day seismicity
The most importaLlt sequence within the WVL zone took place in September
1980 and constituted a mainshock-aftershock sequence which followed a
magnitude 57 earthquake in the southern pcrtion of the seismic zone (Figure
20D) The mainshock located at 192degS 1765degE appears to have been
mislocated as the aftershock zone is positioned some 40 km or more to the
north extending no further than the area 184deg-189degS
The focal mechanism solution for the mainshock of this sequence indishy
cates strike-slip faulting with a significant normal component (from
Everingham 1985) The NNE strike of the sinistral plane of this mechanism
60
coincides with the strike of the seismic zone and also parallels the deep
basins west of Viti Levu This observation suggests that the basins forming
the western margin of the Fiji Platform are presently accommodating a
dominant component of left-lateral strike-slip faulting parallel to the
basins strike The sense of motion along this fault is close to that
observed throughout the eastern North Fiji Basin and within the Fiji
Platform
Thus the hypothesis of simple extensional deformation of the WVL zone
is not supported by the seismicity patterns associated with the 1980
sequence Rather they suggest that in its present configuration the
western margin of Fiji is accommodating a significant degree of strike-slip
motion Nonetheless the attenuation of seismic waves that originate in
this zone the high heat flow the recent extensional deformation of the
margin and the high-amplitude short wavelength magnetic anomalies suggest
that backarc rifting is a significant component of deformation in this area
However contrary to Brocher and Holmes simple model of mid-ocean
ridge-type extension this area like the Fiji Fracture Zone appears to be
characterized by a leaky transform-type extension dominated by strike-slip
deformation In this case the proposed transform faults offsetting the
west Viti Levu basins would become a series of left steps of a longer
sinistral strike-slip feature According to this model rifting is concenshy
trated along the shallower ridges separating the basins rather than within
the basins themselves
4 KadavuHunter Fracture Zone Region (KAD) This zone stands at the
intersection of a former convergent plate margin with the Fiji Platform
The Hunter Fracture Zone is a well-defined curvilinear belt of ridgetrough
61
topography extending from Fiji to the southern New Hebrides arc At its
western end it intersects the southern termination of the New Hebrides
Trench The transition between these two features is a morphologically
complex zone characterized by subduction-related volcanism on Matthew and
Hunter Islands irregular bathymetric features on the upper plate and
intense shallow seismic activity (Louat 1982 Maillet and Monzier 1982
Monzier et al 1984) In fact bathymetric and seismic reflection profiles
across the Hunter Fracture Zone show that the subduction margin morphology
is preserved well into the Fiji Platform The Koro Sea (east of Viti Levu
see Figure 7) represents its eastern termination Hinge-faulting focal
mechanism solutions at the western end of the HFZ document tearing of the
Indo-Australian Plate (Hamburger and Isacks 1985) Chase (1971) pointed
out that shallow seismicity along the Hunter Fracture Zone rapidly drops off
east of 174degE where it was hypothesized to intersect a major North Fiji
Basin spreading center East of this intersection the fracture zone may
simply mark a relict lithospheric scar tracing the westward migration of the
southern New Hebrides arc Malahoff et al (1982a) and Gill et al (1984)
however proposed that the fracture zone has accommodated oblique subduction
of South Fiji Basin lithosphere as recently as che early Quaternary In
fact Kadavu Island is the one area of Fiji where calc-alkaline volcanism
persisted beyond the Pliocene (Gill et al 1984 Whelan et al 1985)
Nonetheless the absence of an inclined seismic (Benioff) zone and shallow
thrust-type mechanisms suggests that the Hunter Fracture Zone is not accomshy
modating plate convergence at present however isolated earthquakes do
occur along the entire length of the Hunter Fracture Zone and major events
62
have occurred near its intersection with the Fiji Platform (Figures 9 and
10)
A significant number of earthquake recorded by the seismic network are
located in this region Virtually all of them are positioned landward of
the Fracture Zone and its continuation into the Koro Sea The depths of
these events are not well constrained but there is no evidence of any
intermediate-depth subduction-related seismicity in this zone
The major earthquake sequence in this zone is the Kadavu earthquake
swarm of July-August 1983 (Hamburger anO Qiolevu 1983) The swarm
included over 100 earthquakes and culminated in mainshocks of magnitude 51
51 and 48 The maximum intensitLes were reported in westernmost Kadavu
(MM V-VI) and several landslides were triggered by the largest of the
mainshocks The earthquakes occurred approximately 20 km offshore western
Kadavu (Figure 20E) along a submarine extension of the Kadavu ridge
The concentration of activity at shallow depths of the HFZ demonstrates
active deformation of the upper plate of this former subduction zone plate
kinematic arguments suggest that the HFZ is presently accommodating extenshy
sion between the South Fiji Basin (Indo-Australian Plate) and the Fiji
Platform The shallow activity is the manifestation of that deformation
5 Lau Ridge (LAU) This is the least active portion of the Fiji
region most of the earthquakes within this seismic region are in fact
located along the western edge of the ridge or within the eastern Koro Sea
One reliably located event however is positioned within the central
portion of the ridge it was recorded by the temporary station operating on
Lakeba Island (Figure 2) Tectonically the Lau Ridge is now part of the
stable Indo-Australian Plate and the major deformational areas are the
63
extensional centers of the Lau Basin to the East the Fiji Fracture Zone to
the North and the Hunter Fracture Zone to the west No major historical
earthquakes (Figure 9) are reported in this region Quaternary volcanism
has been reported at several localities in the Lau Group (Whelan et al
1985 Woodhall 1985a) and recent tilting of the islands was observed by
Taylor (1978) Teleseismically located earthquakes are reported from the
southern Lau Ridge This evidence of recent tectonism indicates that the
stability of the Lau Ridge is only relative and that there is potential for
moderate-sized earthquakes even within this relatively quiescent block of
the Fiji region
6 Offshore Viti Levu (OF0T This seismic region is characterized by
low activity relative to the active belts of seismicity surrounding this
region The low activity is reflected in a minimum in S-P intervals at
times of 6-20 seconds at seismic station Vunikawai in southeastern Viti Levu
(Sykes et al 1969) It is striking that the broad shallow shelf north of
Viti Levu (Bligh Water Basin) is virtually devoid of seismicity (for ML gt 3)
through the entire period of network observation Activity is observed only
near the 1 km-deep trough (Vatu-Ira Channel) separating the basin from the
western shelf of Vanua Levu This trough follows a major structural trend
controlling Pliocene volcanism in the Lomaiviti Group (Green and Cullen
1973) and has been proposed as an active transform fault terminating the
Hunter Fracture Zone (Rodda and Kroenke 1984) This corclusion is
certainly not warranted by the seismological data however the bathymetric
and structural trends combined with the concentration of activity here
indicate fault control
64
A second area of seismic activity is the area surrounding the island of
Koro near the termination of the Hunter Fracture Zone This zone has been
active at low magnitude levels during several brief periods of activity
(Figure 23E) It is clearly a zone of significant seismic potential
evidenced by the occurrence of a major historical event the Ms 65 Koro-
earthquake of 1932 (Everingham 1982b) The area is an important confluence
of major structures the western end of the Hunter Fracture Zone terminates
against the strong northeast-striking structural fabric of eastern Vanua
Levu and Taveuni (Green and Cullen 1973) There is evidence that convershy
gence along the HFZ has terminated (Hamburger 1986) but the Late Pliocene
and Quaternary volcanic activity landward of the fracture zone attests to
its recent activity Throughout the area south and east of Viti Levu
seismic activity is concentrated on the landward (north and west) side of
the bathymetric trough The extensional stresses deforming the Fiji
Platform do not appear to significantly deform the lithosphere of the
neighboring South Fiji Basin or its continuation into the arc complex the
Koro Sea However where the South Fiji Basin lithosphere meets the
deformed arc lithosphere south of Vanua Levu it becomes a zone of high
seismic activity and is capable of a damaging earthquake of the size of the
1953 Suva or 1979 Taveuni events
A third area of high activity is observed in the opposite corner of the
offshore region the Baravi Basin Here like other intra-platform seismic
zones activity is concentrated in several discrete periods of activity
separated by long periods of quiescence (Figure 23C) Activity is focussed
along the 2 km depth contour marking the edge of the Fiji shelf The
contour also marks the edge of a major sedimentary basin fed by the rivers
65
of southern and western Viti Levu (Larue et al 1980) It is characterized
by free-air gravity lows to -70 mgal that result from up to 3 km of sediment
fill in the basin Seismic reflection profiles across the basin (Brocher
and Holmes 1985) demonstrate significant post-Pliocene extensional deformashy
tion along the its seaward margin The high-angle faults show a significant
normal displacement but a strike-slip component is also suggested by
Brocher and Holmes based on the coincidence with structural trends in the
West Viti Levu zone In any case the major earthquake sequences in
1979-1980 and 1984 demonstrate ongoing deformation of the Baravi Basin
margin Like other actively deforming zones close to the Fiji Platform the
apparent quiescence of the Baravi Basin at larger magnitudes (Figures 9 and
10) is likely to be a temporary one reflecting a period of interseismic
strain accumulation
7 Central Viti Levu (CVL) Within the island of Viti Levu the
telemetered seismic network offers the best opportunity for evaluating the
detailed characteristics of crustal seismicity associated with deformation
within the Fiji Platform The island of Viti Levu is also the source area
for the most destructive earthquake in Fijis history the 1953 Suva earthshy
quake (Ms - 675) making it the critical focal point of seismic hazard
analysis for the country
The earthquakes within the island of Viti Levu (Figure 24) are concenshy
trated in two zones one a broad swath extending from central Viti Levu
across the island to Ovalau the second a dense concentration of earthshy
quakes within and offshore the southeastern portion of the main island
Cross sections AA and BB (Figure 26) taken across the entire island
demonstrate the relative quiescence of northern and western Viti Levu and
66
177 E 0
178 A+
179
Figure 24 Moip of earthquakes within and around the island of Viti Levu Earthquake grades D - crosses C - open circles B - shaded circles A - filled circles Light shading shows areas of relief gt 75 m dark shading emphases high inland Nadrau Plateau at elevation gt 750 m Topography from Dickenson 1972 Faults from Rodda and Band (1966) are shown by heavy lines 100 500 and 1000 m bathymetric contours are from Smith and Raicebe (1984) Seismic stations are shown as filled triangles
67
17
B 000
0 0
AI or o C oOOo deg0 0018 0
D0 n OC 0A 0 0 0
0 0 0
o1o r 0o c( (~ 0 0 0
177 E 178 179
Figure 25 Map showing locations of cross sections A-D within the islandof Viti Levu Brackets denote area included in sections
A B B0 00 0 DD B0
40 o6
0 0- 0 d 3020l -o 6 ~ deg0
0 0a
C CAR 0
40O-5~~ 30 0o6amp A0l0l0 0 0 0shy deg
20 - 0o e
2 0 0 4 0
100050 go000
012
50 4 00
0 20o
o oo0 o
bull bull
o A 25
D0 -
0 o
0
0
15shy
8 10 300 10 20 30 40 30 0 20 30 40
Figure 26 Cross sections within the island of Viti LevuFigure 18 Locations shown in Figure 25 Symbols denote earthquake grades as inTriangles at top of sections denote positions of seismic
stations along strike of the projections No vertical exaggeration Note that scales vary from section tosection
0
69 the dense concentrations of microearthquakes in the central and southeastern
portions of the island The sections also demonstrate graphically the confinement of seismicity to the upper 20 km of Fijis lithosphere The two subcrustal events at 42 and 45 km depth are poorly constrained (grade D) and are considered to be mislocations The limiting depth is close to the average crustal thickness of -19 km this coincidence of focal and crustal depths is unique in all other areas of extensional and strike-slip tecshytonism the seismicity does not extend deeper than midcrustal depth (Chen and Molnar 1983) Little information however is available from tectonic
settings comparable to Fiji The errors in hypocentral depth determinations and in crustal thickness estimates permit the existence of a relatively
thin aseismic lower crust In any case the crustal activity begins to taper off from 13 km depth the majority of the earthquakes take place in
the upper two-thirds of the crust
The cross sections CC and DD examine the earthquake clusters in central Viti Levu Two notable groupings stand out one near 178degS
1778degE which will be referred to as the Nadrau swarm and a second near 178degS 178degE which will be referred to as the Monasavu swarm Approxishymately fifty earthquakes occurred in clusters of activity from early 1980 to mid-1981 in the western or Nadrau swarm Because only the southshyeastern Viti Levu stations were operating at the time the swarm earthquake
depths in this area are poorly constrained they appear to correspond to those observed within the seismic network that is generally limited to the upper 20 km of crust (cross section CC Figure 26) A small number of deeper events are located in this area but these too probably remain
within the thickened crust beneath the axis of Viti Levu The swarm
70
included three events with magnitudes ML gt 3 The cause of the swarm is
unclear but it is located on the western flank of the large central uplift
at the core of Viti Levu Adjacent to the Nadrau Plateau is a broad upland
basin the Mbukuya-Nandrungu basin According to Dickenson (1972) this
heavily dissected inland valley of Pliocene age was rapidly deformed from a
gently graded concave stream valley to a convex plateau surface at 300-500 m
above sea level this uplifted valley surface has been deeply incised by
modern streams whose floors are 50-150 m below the plateau surface
Because of their posicion outside the seismic network focal mechanism
solutions for individual events are not available however a composite focal
mechanism for the Nadrau swarm indicates east-west extension but is comshy
patible with either a dip-slip (pure normal faulting) or strike-slip
solution In either case the direction of extension is compatible with the
regional direction of extension inferred from strike-slip focal mechanisms
in the North Fiji and Lau basins (Hamburger 1986) The crustal flexure
induced by the rapid domal uplift that is peculiar to central Viti Levu is
also likely to result in localized extensional stresses
The second concentration of activity in central Viti Levu is the
Monasavu swarm positioned atop the central uplift of Viti Levu (Figure 24)
This earthquake sequence presents a strong case for reservoir-induced
seismic activity The earthquakes also occur at crustal depths those well
constrained by the nearby Monasavu seismic station are shown to occur in the
upper 4 km of crust (cross section DD Figure 26) adjarent to the Monasavu
Reservoir The Monasavu Dam is an 82-meter high earthfiil dam on the Nanuku
Creek which impounds 133 x 106 metric tons of water it is designed to
provide hydroelectric power for the island of Viti Levu The dam is the
71
largest public works project in the countrys history and represents the
major critical structure from the standpoint of seismic risk Earthquakes
within Viti Levu were unknown during the planning for the project but a
subsequent historical study (Everingham 1983a) has uncovered at least one
major event during the last century of a size that could affect the dams
structure The dam was completed in April 1982 and rapidly filled to its
operating volume by February 1983 Three felt earthquakes shook the damsite
as the water first approached its spill level when the water weight in the
reservoir increased most rapidly (J Campbell pers comm 1984) The
three shocks of magnitude 33 27 and 28 were part of a sequence
including 14 recorded events several of the events were strongly felt in
the surrounding villages (Everingham 1983d) Each of the swarm
mainshocks triggered a strong-motion accelerograph atop the dam producing
peak accelerations of 013 g 007 g and 004 g all on the north-south
component of the accelerograph (Figure 27) A nearby accelerograph posishy
tioned on bedrock adjacent to the dam went untriggered demonstrating
considerable amplification of ground acceleration by the dam structure The
accelerograms are all extremely similar in character with large monoshy
frequency oscillations on the north-south component clearly shown by a
sharp peak in the Fourier amplitude spectra at a period of 02 sec
(Figure 28) This component is oriented transverse to the dams structure
and indicates probable resonant oscillation of the dam as a whole
The limited number of stations operating at the time of the swarm did
not permit very accurate locations of the mainshocks However the mainshy
shocks are shallow and positioned within 5 km of the dam and the deepest
part of the reservoir
-- -- -- -- ------- ------------ ----
----------------------------- ---
- -
--- -- -- -- -------------- -- -- -- -- --
-----------------------
72
MONASAVU r
FIJI MONASAVU DAM ___
13 February 1983 09 53 003 UTC
- - - - - - - - L - - - - - - - - - - -
FIJI MONASAVU DAM 14 February 1983 12 18 416 UTC
I - - - -
WEST
FIJI MONASAVU DAM U
23 February 1983 UP 15 17 303 UTC
SOUTH
I 5 sec -
Figure 27 Accelerograms from strong-motion accelerograph operating on Monasavu Dam Viti Levu from earthquakes of 13 14 and 23 February 1983 (ML- 33 27 and 29 respectively) North-south component is transverse to the dams structure Figure is from Silverstein 1985
I F I0
0C1)F
LUJ
(M(---Utj
CJ
CL 0_
2 CE
- I shy_
Cc =3
0 a a I I i p a a I I a
70 5 10 15 20 25
FREOUENCT HZ Figure 28 Fourier amplitude spectrum of acceleration from Monasavu Dam accelerograph earthquake of 13 February 1983 North-south component transverse to dams structure Note resonance at approximately 5 Hz
73
The area is one of significant background activity evidenced by nine
events located in the reservoirs vicinity prior to impoundment and numerous
reports of felt earthquakes in the area (Everingham 1983d) Nonetheless a
case for reservoir-induced activity can be made on several grounds (1) The
coIncidence of the February 1983 swarm with the peak in reservoir water
level (2) the proximity of these and subsequent events to the deepest
portion of the reservoir (3) the recording of 270 events at the Monasavu
seismic station with S-P intervals less than about 1 second during a
17-month recording period (Stuart 1985)
The third group of earthquakes in east-central Viti Levu follows the
trend of a belt of sediments of the Upper Wainimala Group (Early-Middle
Miocene) that separates the Pliocene Ba Volcanic Group in northern Viti Levu
from the Late Miocene to Recent deposits of the Rewa Basin in southeastern
Viti Levu (Verata Sedimentary Group see Figure 8) The basin is
fault-bounded on its western edge (Rodda 1967) the lineation of epicenters
along its northern edge suggests fault control along this margin as well
8 Southeastern Viti Levu (SVL) This seismic region is densely
populated by small-magnitude events (Figures 18 and 29) within the tightly
spaced US AID seismic network (see Figure 2) Many of the events in this
zone are very small (to ML - -10) and recorded only by 3 or 4 nearest
stations The apparent concentration of activity in this area is thus to a
large degree a product of the station distribution Nonetheless a real
concentration of activity does exist in the southeastern Viti Levu area
based on several observations (1) there is a concentration of earthquakes
of ML gt 2 for which uniform coverage is available for the entirety of Viti
Levu (Figure 15) (2) several earthquakes were located in this area by the
74
181
jS 0 711E) 0 0
186shy
178 E 1787
Figure 29 Map of earthquakes in southeastern Viti Levu Topographybathymetry faults and symbols as in Figure 24
74 a
tripartite network during 1965-1969 whereas the remainder of Viti Levu
appears to be altogether aseismic (Figure 11) (3) a peak in S-P intervals
was observed at times of 1-4 seconds at station Vunikawai corresponding to
earthquakes in the SVL zone (Sykes et al 1969) (4) several felt earthshy
quakes have originated in this portion of Viti Levu including the destrucshy
tive 1953 Suva earthquake (Houtz 1962ab Everingham 1983a 1984) Earthshy
quakes occur both on- and offshore southeastern Viti Levu They are concenshy
trated near the coast in the area extending from Suva to Navua that was
most severely affected by the 1953 Suva earthquake (Houtz 1962a) The
Houtz (1962a) H location of the 1953 mainshock based on macroseismic
data submarine cable breakage and tsunami traveltimes is directly within
the dense nest of activity offshore Viti Levu (Figure 29) The teleseismic
location by Sykes et al (1969) S is significantly offset from the main
zone of activity Based on Houtzs field observations and the microearthshy
quake activity recorded by the telemetered network the Houtz location is
accepted as the best estimate of the earthquake epicenter Houtz proposed a
normal (33 km) focal depth for the Suva earthquake while Sykes et al found
a 21 km depth The shallower depth is supported by the distribution of
earthquakes offshore Viti Levu and by the character of the P-waveform
recorded on long-period instrumeits at teleseismic distances Cross section
HH (Figure 31) shows that earthquake depths in the area like those within
Viti Levu are limited to the upper 22 km the best constrained events are
limited to the upper 15 km of crust The Suva earthquake is likely to have
occurred at a similar midcrustal depth this is also suggested by the
limited area from which maximum intensities were reported
75
o 0 C B E
18 1 E 1787 Vo s d oe i
Figure30 Map showing ~lcation Vitigt rces ahdlns
of crs etosEwihnsuhatr 0eun hdn eoeae nlddi
cross se1ins crs e sci 1
76 FE FE
0 0
5-o q o qo
o o obull7 o c o oo
0
T Vo Wq
15 V4 S0
C20 C 4
20- 0Io 10 o
25shy
30 IS 0-10 20 30 40 50
20
G G 0
25
bull I
o 301 LC 0 5 to 15 20 25
10 H H
o 0o10- c c qC
202
253
300 I 30 I- I0 5 10 15 20 25 0 10 20 30 40
J j 0 iI l i
0
bull o o
C o0Cc c b
o 4B
15- oC o o
0 5 1 5 20 25 30
Figure 31 Gross sections E-J within southeastern Viti Levu Locationsshown in Figure 30 Symbols as in Figure 24 No vertical exaggeration Note that scales vary from section to section
77 The well located events offshore Viti Levu fall into three groups two
north-trending belts of activity (near 178250 E and 17835degE) offset by an
east-trending segment near 183degS The epicentral pattern is suggestive of
small fault segments within a broad complex zone of deformation offshore
Viti Levu The north-south trends are close to the strike of a series of
submarine canyons that cut the shelf of Viti Levu as well as to important
structural trends in south-central Viti Levu (Houtz 1959) A subtle change
in actiriry occurs near the coast (cross section JJ Figure 31) where
activity wiuely distributed thrccent-haut the crust gives way to discrete nests
of fault-related activity within Viti Levu
On land the southeastern Viti Levu seismicity is located within an area
of faulting which disrupts the Oligocene to Pliocene strata exposed in the
southeastern portion of the island In only one case has an upper age limit
been placed on faulting in this area by the presence of a Miocene intrusion
post-dating the tectonism In all other cases faulting may have continued
into the Quaternary (P Rodda personal communication 1984) While
Tertiary faulting is documented elsewhere in Viti Levu faulting is particushy
larly evident in this portion of the island (Rodda and Band 1966) The
association with active shallow seismicity suggests that renewed (or conshy
tinuing) movement along these faults in southeastern Viti Levu is accomshy
modating the present stress system of the Fiji region That this portion of
Fiji is presently deforming is also corroborated by geodetic observations in
southeastern Viti Levu Berryman (1981) used retriangulation of six benchshy
marks in southeastern Viti Levu and one on Beqa Island to analyze shear
strain within the southeastern Viti Levu seismic zone Only by omitting the
Beqa benchmark and one of the Viti Levu benchmarks could a consistent strain
78
pattern be resolved With this correction Berryman determined a shear
strain rate of 06 pradyr accumulated over the period 1909-1980 The
direction of maximum compression determined was nearly east-west in
contrast with the east-west extension determined from focal mechanism
solutions However the area from which the data are taken (within southshy
eastern Viti Levu) is within the area strongly affected by the 1953 earthshy
quake Thus the deformation may be dominated by the coseismic movement
rather than continuously accumulating coseismic strain In any case the
data do suggest that significant hoLzontal deformation is taking place in
an area coinciding with the southeastern Viti Levu seismic zone
The earthquakes occur in discrete clusters within the seismic zone
Two densely populated centers of activity are located in southern Viti Levu
they are tightly clustered in space and time The Waidina swarm near
180-S 17825-E is characterized by low magnitude activity
(-09 _lt ML lt 29) occurring within a six-month period from late 1979 to
early 1980 In cross section (EE and FF Figure 31) the well located
earthquakes define a narrow cylindrical zone less than 15 km in width
extending from 3 to 14 km depth The swarm coincides with the eastern
termination of a major east-striking fault the Nakasu Fault (Colley
1976) which paralls the southern boundary of the large Middle Miocene
Wainivalu stock (Whelan et al 1985) At its eastern end the fault
terminates at a small intrusive body located along the western flank of the
Medrausucu Range Based on field observations this Miocene intrusion is
thought to post-date activity along the fault (P Rodda personal communicashy
tion 1984) in fact the high activity along its margin suggests a concenshy
79
tration of stress where movement along an active fault is limited by the
presence of this intrusion
The second major swarm in southeastern Viti Levu is the Waimanu swarm
located near 1815degS 17825degE The swarm had a magnitude range similar to
the Waidina swarm and was also clustered in time In cross section (G
JJ Figure 31) the well located events originate from a small volume
located at depths of 10-12 km The swarm is located along a 10 km-long
near-vertical normal fault that offsets a gabbro stock of probable Colo
(Middle Miocene) age (Band 1968) The northeast trend of the fault coincishy
des with that of a series of important post-Colo normal faults The trend
is also close to that defined by the new mechanism for the Suva earthquake
and indicates probable reactivation in a strike-slip sense
A secondary concentration of activity is observed along the
Wainivakidau Fault another of the northeast-striking faults that deform the
late Tertiary rocks of southeastern Viti Levu The sense of throw on this
fault is similar to that observed near the Waimanu swarm Earthquakes along
the fault are concentrated at midcrustal depths (cross section EE
Figure 31)
Earthquake Focal Mechanisms
Only a limited amount of information is available on the state of
stress and the nature of faulting within the Fiji Platform As described by
Hamburger and Isacks (1985) and Hanburger (1986) earthquakes in the intershy
arc region describe two basic fields of stress one associated with the
Fiji Fracture Zone characterized by strike-slip faulting along east- to
northeast-striking fault planes and a second found throughout the Lau
80
Basin and the eastern North Fiji Basin characterized by east-west extenshy
sion along northeast- and northwest-oriented strike-slip faults
The two teleseismic mechanisms within the platform are for the 1979
Taveuni earthquake (Figure 2i) and for the 1953 Suva earthquake (Figure 32)
The Taveuni earthquake revealed a mechanism of strike-slip faulting similar
to but rotated slightly from the mechanisms along the fracture zone
It is discussed in greater detail in the presentation of the Taveuni
earthquake
The Suva earthquake is important not only because of its destructive
effects but also because of its distance from the FFZ it reflects the
stress field within the interior of the Fiji Platform This earthquake will
thus shed light on the causes and the potential for large intraplate events
within the platform A mechanism -or this event was obtained by Hodgson
(1956) but is considered unreliable because of his reliance on reported
first motions use of reported motions for reflected phases (PP pP pP
PcP etc) and uncritical mixing of short- and long-period observations
In the case of the Suva earthquake the contradictory first motion reports
from stations within the western US and Europe forced him to fit a plane
through these fields Our analysis indicates that both areas are characshy
terized by dila-ional first motions significantly altering the earthquakes
focal mechanism
Analysis of the Suva earthquake is difficult because of the paucity of
high sensitivity long-period seismographs as well as the uneven
geographical distribution of stations In order to evaluate the focal
mechanism all available seismograms were gathered from stations cperating
at the time Intermediate- or long-period records were obtained from New
81
N
Qo
00
S
Figure 32 Focal mechanism for the 1953 Suva earthquake Equal-areaprojection of the lower hemisphere of the focal sphere Large open and filled circles represent clear dilatational and compressional first motions respectively from long-period instruments Moderate-sized circles are fom intermediate- or short-period instruments Small circles are less reliable first motions Small + and - symbols are reported first motions from Hodgson (1956) Solid lines show orientation of S-wave polarizations P- and T-axes as in Figure 21
82 Zealand Australia Japan the western US the eastern USSR and Europe
Short-period records were also examined but given less weight than reliable
long-period first motions S-wave polarizations were available only from
three short-period stations in Japan the eastern USSR and Indonesia but
were of considerable help in constraining the fault planes The best-fit
solution shown in Figure 32 indicates strike-slip faulting with a signishy
ficant but not very well constrained dip-slip component The east-west
extension shown by the position of the T-axis as well as the northwest and
northeast strikes of the nodal planes are remarkably similar to those
observed in the neighboring Lau and North Fiji basins While one mechanism
is not necessarily representative of the entire stress field in the platshy
form this earthquake demonstrates that a major part of the contemporary
deformation in the platform takes place by strike-slip faulting in response
to extensional stresses
Houtz (1962a) favored a northwesterly-striking fault plane for the Suva
earthquake based on the orientation of submarine canyons offshore southern
Viti Levu In fact the canyons strike in a north to north-northeast
direction (Houtz 1959) which parallels neither of the fault planes
Several major structural features cortenad the interpretation of the
northeast-striking fault plane (1) the Suva Peninsula (Figure 29) forms a
major northeast-trending promontory along the coast it is composed of
uplifted Pliocene marine sediments of the Medrausucu Group (Suva Marl Rodda
et al 1985) The western edge of the peninsula defines the deep-water
Suva Harbor dropping to over 20 m depth within 300 m from shore The edge
of the peninsula is marked by parallel lineaments recognized in airpilotos
and the sediments in the harbor are sharply truncated against the peninsula
83
suggesting active faulting along the basin edge (G Shorten personal
communication 1984) (2) the northeast trends are also important in the
faulting observed in southeastern Viti Levu (Band 1968 Figure 29) (3) a
major northeast-striking structural fabric is reflected in the unusual
submarine morphology near Beqa Island south of Viti Levu The barrier reef
has a pronounced nortneast-striking linear trend as does the scarp that
defines the Kadavu Passage to the south (Figure 29) (4) a major structural
high termed the Beqa-Vatulele Lineament separates the deep Suva and
Baravi sedimentary basins offshore southern Viti Levu (Brocher and Holmes
1985) This northeast-trending feature is marked by strong gravity and
magnetic anomalies (5) the overall trend of the seismicity offshore Viti
Levu is suggestive of a northeast-striking zone From the foregoing the
northeast-striking sinistral shear fault of the Suva earthquake focal
mechanism is chosen
Earthquakes located by he telemetered network provide additional
information on intraplate deformation in the platform The small number of
stations that record the microearthquakes in southeastern Viti Levu limits
the quality on individual focal mechanism solutions The first-motion
directions recorded on the network stations constrain but do not uniquely
determine earthquake fault planes Most events can be satisfied by a range
of solutions from pure strike-slip to nearly pure dip-slip Upper hemishy
sphere projections for six events in southeastern Viti Levu are shown in
Figure 33 with both strike-slip and dip-slip solutions where possible
Because of the dominance of strike-slip faulting throughout the region we
have chosen the strike-slip solution as primary However the first-motion
data alone do not demand this
84
A commonality to the southeastern Viti Levu focal mechanisms is docushy
mented in Figure 34 The earthquakes T-axes whether for strike-slip or
dip-slip mechanisms are dominated by an east-west orientation Similarly
the P-axes are generally oriented north-south The pattern of stress
orientation is very close to that observed in the 1953 Suva earthquake
(shown by the letters P and T in Figure 34) and coincides with the
stress field in the North Fiji and Lau basins
The focal mechanism for the 1953 earthquake is corroborated by a
composite focal mechanism for events located immediately offshore Viti Levu
shown in Figure 35 The first-motions for these events are consistent with
a strike-slip mechanism with fault planes oriented parallel to the fault
planes determined from the Suva earthquake A normal faulting solution is
equally possible (dashed lines in Figure 35) In either case the east-west
T-axis coincides with the regional direction of principal extension
The stress orientations within the Fiji Platform demonstrate that the
platform is not isolated in a plate tectonic sense from the interaction of
microplates along its boundaries The seismic deformation in the back-arc
basins east and west of Fiji is dominated by the east-west growth of the
interarc region Hamburger (1986) showed that this extension takes place
through strike-slip faulting along northeast- and northwest-trending fault
planes The same process is taking place in Fiji This former arc terrane
once deformed by major compressive stresses is now being extended by
ductile thinning of the lithosphere by creation of new oceanic crust around
its edges and by major strike-slip faulting both surrounding and within the
platform
85
N N
-_ o P
0 amp 7912-7 0618 80419 1921
073178-147 18 71 178-147
2 S
80619 1430 8600
Figure3m 33 Ffor et a18k27 178it152
o IT
0712 0222 84312 0041 deg D18 f 73 17 8deg013 9 163 17802511
Figure 33 Focal mechanisms for earthquakes in southeastern Viti LevL based on data obtained from the telemetered network Upper hemisphereprojections Syrrols as in Figure 21 Both strike-slip (solid lines) anddip-slip (dashed lines) solutions are compatible with first motion directions
86
N
0 00
0
00
T PS Strike-Slip S 0
Dip- Slip 0
Figure 34 Summary of P- and T-aes from network focal mechanisms shown on upper hemisphere projection P- and T-axes of the 1953 Suva earthquakeare given for comparison at base of letters P and T
87
0
0 0
0 0 0
0 P 0 0bull 0T
S
Figure 35 Composite focal mechanism for earthquakes located immediatelyoffshore Viti Levu Symbols as in Figure 21 lower hemisphere projectionBoth strike-slip (solid lines) and dip-slip (dashed lines) solutions arecompatible with first motion directions Large and small letters P and T represent P- and T-axes for strike-slip and dip-slip solutionsrespectively
88
CONCLUSIONS
Our seismicity studies in Fiji have led to several significant new
conclusions that bear directly on the earthquake hazard to Fijis populashy
tion
(1) Major earthquake zones are located along the edges of the Fiji
Platform where deformation is concentrated These zones are continuously
active at moderate magnitudes (ML 3-5) The seismic regime along one of
these zones (the Fiji Fracture Zone) varies as a function of the zones
orientation relative to the plate motion directions
(2) Secondary earthquake zones are located within the Fiji Platform
Large earthquakes occur more sporadically separated by long periods of
quiescence Many of these zones are active at low magnitudes (ML lt 3)
(3) Earthquake depths are shallow concentrated in the upper 18 km of
Fijis crust The distribution is similar to that in other areas of extenshy
sion and strike-slip deformation
(4) Earthquake magnitudes in the Fiji region have all been less than
71 Despite the large rates of relative plate motion in the area the thin
lithosphere may be incapable of storing large stresses to generate great
earthquakes (Ms gt 78)
(5) The large 1953 Suva earthquake occurred at 182degS 1783degE
(Houtzs location) at crustal depths by strike-slip faulting The stress
orientation from the focal mechanism is similar to that observed in the
North Fiji and Lau basins indicating that the platform is not isolated from
the regional tectonic stresses The nodal plane striking NSO0 E is chosen as
the probable fault plane
89
(6) Microearthquakes in Viti Levu occur as a result of extensional
stresses similar to those determined from the Suva earthquake
(7) Earthquakes in central Viti Levu may be related to the rapid
doming of the island A group of events near Monasavu Reservoir were
induced by rapid filling of a large artificial lake in the interior of the
island
(8) Earthquakes in southeastern Viti Levu occur in discrete nests that
are tightly clustered in space and time They are related to a series of
near-vertical east to northeast-striking faults that cut the Mio-Pliocene
rocks of southeastern Viti Levu
These empirical observations combined with the our regional studies of
the Southwest Pacific described by Hamburger (1986) permit several imporshy
tant tectonic conclusions to be drawn
(1) Fiji is part of a large shear system connecting the Tonga and New
Hebrides arcs extension is taking place throughout the region along short
irregular spreading centers and leaky transform faults involving both
strike-slip and extensional deformation
(2) While convergence appears to have taken place along the Hunter
Fracture Zone in the past there is no evidence for present-day convergence
Rather this plate boundary appears to be reactivated by extensional or
strike-slip deformation of the upper plate
(3) The Fiji Platform is rotating in a clockwise sense relative to
the tectonic blocks that form its northern western and southern boundshy
aries This rotation is interpreted as P relatively stable block resisting
more rapid counterclockwise rotational shear of the surrounding matrix
(4) The extension that produced the deep basins west of Viti Levu has
90
been replaced by strike-slip faulting that follows the basins strike
(5) Major iniraplate earthquakes occur throughout the southern Fiji
Platform but at longer recurrence intervals than the interplate events
that surround the platform
ASSESSMENT OF EARTHQUAKE HAZARD
Earthquake Recurrence Intervals
Evaluation of the recurrence history of a particular region can be
investigated using (1) teleseismically recorded instrumental history of
earthquakes (2) recu-rence relations of smaller earthquakes recorded by
seismograph networks (3) pre-instrumental historical records of large
earthquakes and (4) evidence of prehistoric large earthquakes observable in
the geological record
Instrumental historical records exist from the late 19th century to the
present as indicated elsewhere in this report From this data set shown in
Figure 9 it is evident that the recurrence intervals along even the most
active seismic belts surrounding the Fiji Islands exceed the historical
records Thus the repetition of events along say the Fiji Fracture Zone
cannot be resolved Nonetheless the data do help constrain the overall
recurrence of large earthquakes in the entire Fiji region This problem is
addressed by the frequency-magnitude relation observed by Everingham (1983c)
for the period 1918-1960 as shown in Figure 36 This period of observation
suggests that earthquakes of magnitude Ms 7 or greater occur= at the rate
of 48 eventsl0O yrs (or every 21 years) while earthquakes of magnitude
65 or greater occur at the rate of 429 events100 yrs or every 2 12
years A similar relation was obtained from network studies by Hamburger
(1986) and is shown in Figure 15 This magnitude-frequency relation sugshy
91
I I I
000
z
Z-10
w
D z~1o
Ushy
w L10
0 b=0 50
b=097
()0111
-1
I SOOO 1900-1973
5 6 MAGNITUDE M
IS
7 8
b16
50 I I
60 A
MAGNITUDE MS
70
Figure 36 Magnitude frequency plot for all earthquakes in the Fijiregion 1918-1960 (from Everingham 1983c)
92
gests recurrence of magnitude ML - 7 or greater at the rate of 65
eventsl0O years or every 15 years Magnitude 65 earthquakes according
to this relation would be expected at a rate of 162 eventsl00 years or
every 6 years In view of the differences in time sampled magnitude scale
used and area included in the two studies the agreement is remarkably
good The studies indicate that large potentially destructive earthquakes
are expected to occur in the Fiji region within the lifetime of critical
engineering structures
Earthquake Potential
An estimate of the maximum potential earthquake in this area has been
considered by Everingham (1983c) and is shown graphically in Figure 37 In
compiling this graph Everingham computed annual energy release based on a
magnitude-energy reiation for the period 1918-1982 The avcrage rate of
energy release for the region is equivalent to that produced by a single
yearly earthquake with magnitude Ms - 65 However the rate of energy
release is not constant and is marked by periods of activity and
quiescence The range of energy release is shown by the two dashed lines in
Figure 37 and the maximum likely energy release may be expected to fall
within the bounding curve Should this energy release be concentrated in a
single large event its magnitude would be approximately 75 This is
slightly larger than the maximum observed historical event in Fiji but is a
realistic design earthquake for the most active zones surrounding the Fiji
Islands From this relation Everingham also noted a 30-year cyclicity to
the energy release in Fiji Periods of high activity occurred in 1923-32
and 1952-60 A third period of high activity may be expected in the coming
93
- I
-2 -
m -
0
L1
3400 60 70 19
Figure 37 Cumulative energy release in the Fiji region 1918-1982 (fromEveringham 1983c)
94 few years terminating a relatively quiescent period for the period
1961-1982
Clearly the earthquake potential is not uniform throughout the Fiji
region Historically large earthquakes have concentrated in zones surshy
rounding the Fiji Platform with isolated large events occurring within the
platform itself In Figure 38 we separate the Fiji region into zones of
seismic potential based on the available seismicity data summarized in the
previous section
Zone I (Fiji Fracture Zone Taveuni-northeast Vanua Levu region West
Viti Levu zone western Lau Basin) This seisinic region is characterized by
high levels of seismicity on all time and magnitude scales (Figures 9 10
11 17 18) These belts apparently accommodate a large portion of the
PacificJndo-Australian plate motion The largest recorded earthquake in
this belt was a magnitude 71 event that occurred northeast of Vanua Levu in
1949 Considering the history of earthquake energy release discussed above
a conservative estimate of Mmax along these active zones is Mmax - 75
Zone II (Kadavu region Hunter Fracture Zone Baravi and Suva Basins
Koro Sea) this area is one of moderately high seismic potential with a
history of occasional large earthquakes separated by long periods of
quiescence This zone includes large events near Kadavu in 1850 1950 and
1963 the 1932 Koro earthquake and the 1953 Suva quake The largest of
these events was the magnitude 67 Suva earthquake This zone has been much
less active at moderate magnitudes than zone I (Figures 10 11 18) but is
clearly capable of large and potentially destructive events We have
included southern and eastern Vanua Levu in zone II based on evidence for
small-magnitude activity near southern Vanua Levu (Figure 18) structural
95
15
PCJi iii~l~ii~i~rIN
16
177
200
I N - s
2 1 ____
176 E 177 178 179 180 179 W 178
Figure 38 Seismic zoning of the Fiji region See text for discussion
95a disruption of the CaukandroveNatewa Bay region (Green and Cullen 1973) and
the confluence of the Hunter Fracture Zone with the Fiji Platform A
reasonable maximum design earthquake for this zone is Mmax - 70 A larger
event is possible but is considered less likely here based on the hisshy
torical record of seismicity in this zone
Zone III (central and eastern Viti Levu Ovalau Island Vatu-Ira
Channel this zone is characterized by far lower activity than zones I and
II with the exception of a single destructive event in the mid-nineteenth
century (Figure 9) is virtually devoid of historical activity However
low-magnitude activity is common in this region (Figures 17 18)
Reservoir-induced activity at Monasavu Reservoir in central Viti Levu
attests to significant tectonic stress accumulation in that area The
maximum probable earthquake for this zone is Mmax - 65
Zone IV (northern and western Viti Levu Bligh Water Basin northern
Vanua Levu South Fiji Basin Lau Ridge) these areas have been virtually
devoid of seismic activity on all time scales Isolated microearthquakes
have occurred in this zone but no significant activity has been observed
These areas represent the most stable blocks within the broad
PacificIndo-Australian plate boundary and are not expected to generate
significant activity in the future Nonetheless because of its proximity to
the active zones of deformation earthquakes to magnitude Mmax shy 60 should
be considered possible for this area
Macroseismic Effects of Large Earthquakes
Expected values of strong ground motion are of prime engineering
interest However even if the recurrence interval of large earthquakes
near Fiji were reliably forec-ast a major difficulty arises in trying to
96 translate earthquake size into actual values of ground motion at a partishycular site To date amp relatively large number of strong-motion acceleroshygrams have been generated in the far field of large earthquakes especially in California and Japan The difficulty in using magnitude-acceleration
relations developed elsewhere lies in the extreme variability in attenuation of ground acceleration in various geologic environments (eg Hays 1980) The absence of ground acceleration data for Fiji makes direct predictions of structural effects of earthquakes difficult Hopefully the presence of strong-motion accelerographs distributed throughout Fiji (Figure 3) will
change this situation over the coming decades
Until that time we are altogether reliant on observations of intensity of ground shaking That is the large historical events in Fiji have been studied by their effects on cultural features (ie houses) rather than near-field seismological observations (ie strong-motion accelerograms) The magnitude-intensity relations observed for Fiji may then be used to predict the distribution of intensities that may be expected from large earthquakes along the major seismic zones close to the Fiji Islands (Figure 38) In some cases the predicted intensities can be translated (under rather questionable assumptions) to peak ground accelerations from intensity-acceleration relations obtained elsewhere (eg Hays 1980) For this study we have used only intensities to avoid the added complication of
intensity-acceleration conversion
Everingham (1984) has summarized the available information on observed intensities in Fiji based on six moderate to large events during this century Modified Mercalli intensities observed in Fiji as a function of magnitude and epicentral distance are shown in Figure 39 These relations
97
MS7
DEPTH 20KM
6 0
w
z 4
1979 MS 6-9 bull _
GO 0 53 675 x
3- X 19 69 0 75 52
DISTANCE KM
Figure 39 Earthquake intensities (Modified Mercalli Index) observed inFiji as a function of magnitude and epicentral distance (fromt gveringham1984)
98 were used to compute maximum intensities generated by design earthquakes
located along each of the seismic zones defined in the previous segment
These predicted maximum intensities given for population centers in Viti Levu and Vanua Levu and several of the outer islands are shown in Table 1 These predictions provide a basis for conservative engineering planning
and civil defense decisions that pertain to development in Fiji
Several important caveats however should be taken into consideration
in using these maximum intensities
(1) they are only estimates based on extrapolations from the brief
historical record of earthquakes in Fiji The design earthquakes for each
seismic zone are considered to be realistic upper bounds on the magnitudes
expected there However anomalous unpredictLd earLiiatiRkes tat exceed
that size are conceivable occurrences
(2) the estimates contain no information on recurrence of intensities
Thus the recurrence of a given intensity may be much higher for one site than another site depending on the return time for large earthquakes on the
neighboring seismic zones as well as the substrate of each site
(3) the estimates are based on far-field effects of earthquakes
Information on near-field effects of even moderate events in Fiji are
scanty and highly unpredictable Thus a magnitude 5 event directly
beneath a city may produce extremely high intensities in a very restricted
area close to the epicenter
Tsunami Hazard
In addition to the direct damage from groun shaking in the vicinity of
an earthquake large earthquakes in the southwest Pacific have been shown to cause considerable damage at both regional and global distances by
99
Table 1 Predicted maximum intensities of ground shaking (Modified Mercalli Index) generated by maximum probable earthquakes along the seismic zones shown in Figure 37
Zone I Zone II Zone III Zone IV Location Mmax - 75 Mmax shy 70 Mmax shy 65 Mmax shy 60
Suva 5-6 8-9 8 4-5 Lautoka 67 7 7-8 7 Nadi 6-7 8 7-8 7 Monasavu 6 8 8 6 Ba 6-7 6-7 7-8 7 Sigatoka 6 8-9 8 6-7 Labasa 8 8-9 6 7 Savusavu 8 8-9 6-7 6-7 Ovalau 6 8 8 4-5 Koro 7-8 8-9 6 4-5 Kadavu 5-6 8-9 5 3-4 Lakeb-a 6 5 3-4 7 Yasawa Group 9 6-7 5-6 7 Taveuni 9-10 8-9 5 6-7
100
earthquake-generated tsunamis Tsunamis (seismic sea waves) are caused by
displacements in submarine copography that are induced by earthquakes andor
volcanic activity occurring below or near the floor of the ocean Low-lying
areas near the coast are particularly vulnerable to damage by these waves
The shallow seismic zones of the Southwest Pacific have a history of
earthquakes-generated tsunamis (Figure 40) A few tsunamis have originated
in the Fiji region Two significant tsunamis occurred in 1881 and 1953 the
latter was associated with the 1953 Suva earthquake A smaller event
located southwest of Suva in 1975 generated a very small sea wave
(Everingham 1983b) Major Pacific-wide tsunamis such as those generated
along the South American or Alaskan plate margins apparently are not
generated near Fiji Significant local tsunamis however may be associated
with large shallow earthquakes in the immediate vicinity The potential for
tsunamis is of particular importance in view of the concentration of popushy
lation anamp development in low-lying coastal areas of Fiji
A tsunami education program for the residents of Fiji is recommended
(Appendix IV contains a listing of safety rules from the National Oceanic
and Atmospheric Administration (NOAA) which operates the Pacific tsunami
warning system in Hawaii USA)
Volcanic Hazard
Quaternary volcanic activity is far less prevalent in Fiji than elseshy
where in the Southwest Pacific Volcanism less than 2 million years old has
been reported in only six localities in Fiji (Naigani Kadavu Koro Moala
Mago and Taveuni Islands see Rodda and Kroenke 1984) There is no
historical record of volcanic activity in Fiji However Frost (1974)
reported evidence for a prehistoric eruption on Taveuni Island dated at
101
10 I1i
1967
-980
amp) C32
0
St 1905-11
15
1881 g1917
20
1878(2) 2 0 12 O~~
1976
Fiji
1953
1975 j
-
0
1977
~19 15 18 5
0- l948
~~853
000 1977
25 -r 0 198
0 00
1977
30
165deg 170 E 175 180
1917(2)
1976
W
0 0 200 400 Kilometers
175 170
Figure 40 Tsunami history of the Southwest Pacific Filled circles indicate locations of tsunamigenic events dashed circles indicate inferred locations of tsunamigenic events
102 2050 plusmn 150 years before present based on carbon dating Elsewhere there
is no evidence for volcanic activity younger than 250000 years and thus
volcanic activity presents little threat to the inhabitants of those
islands The recent activity on Taveuni warrants seismic monitoring in the
future
Eruptions elsewhere in the Pacific can also have significant effects on
Fiji The submarine eruptions at Home Reef Tonga during March 1984 proshy
duced large quantities of pumice which subsequently rafted across vast
areas of the Southwest Pacific The floating pumice piled ashore locally
and resulted in serious problems with shipping in the region (SEAN Bulletin
1984)
IMPLICATIONS FOR MITIGATION OF EARTHQUAKE RISK
Several significant steps may be taken that will significantly mitigate
the loss of life and property from future earthquakes in Fiji The
following five paragraphs provide suggestions for mitigation of the earthshy
quake risk
Earthquake Education
First an earthquake education program in Fiji should be strongly
encouraged At minimal cost to the Government such a program may be
mounted through the schools Red Cross programs and through the news media
In other countries earthquake education programs have taught simple methods
of strengthening house construction and minimizing hazardous conditions
within the home they have warned of tsunami hazards to coastal dwellers
they have instructed on proper behavior during an earthquake they have
helped to encourage storage of emergency food water and equipment in many
103
households and importantly they have helped avoid panic during an earthshy
quake and stimulated cooperation with government officials following such a
disaster Earthquake education programs are effectively combined with other
disaster preparedness programs (eg cyclones floods and so on)
Building Codes
Second adoption of stringent building codes for all of Fiji is impershy
ative The experience of the 1953 Suva earthquake (Houtz 1962a) demonshy
strates the severe effects of a moderate-sized earthquake near the capital
There is a very real danger of a larger earthquake occurring very close to
Suva the effects of such an event would be multiplied by the increased
development since 1953 In general the adequacy of construction is a major
factcr controlling the damage and loss of life brought on by such an earthshy
quake Building codes designed for areas of similar earthquake hazard such
as New Zealand Code A California Building Codes or Papua New Guinea
Codes 1 or 2 may be appropriate for the portions of Fiji at greatest risk
Certainly New Zealand Code B should be mandated for all public edifices
in Fiji Observation of such codes is most crucial for public multistory
buildings in the major towns of Viti Levu and Vanua Levu As important as
the design of such buildings is the construction methods and quality of
construction material used to implement building design Careful monitoring
of construction by competent engineers is important for critical facilities
Emergency Civil Defense Procedures
Third specific Civil Defense plans for emergency procedures following
an earthquake or tsunami should be developed Of course earthquake preshy
paredness plans have much in common with hurricane or other natural disaster
104
planning that has been implemented in Fiji but specific effects of earthshy
quake occurrence must be considered structural damage to multistory
buildings interruption of water supply disruption of electrical and gas
lines secondary geological effects such as ground liquefaction or landshy
slides in the near-source region complicating effects of aftershocks in the
days and weeks following a major earthquake The primary structure for such
civil defense plans already is in place in Fiji Programs specific to the
earthquake hazard may be added following similar programs in Papua New
Guinea and New Zealand
Long-term Seismicitv Observations
Fourth long-term seismicity and strong motion observations should be
continued and supported by both the Fiji government and overseas aid proshy
grams In the long-term such information will help to refine estimates of
seismic potential along the plate boundaries that surround Fiji they will
help to more directly and accurately assess the ground motion parameters of
direct concern to engineers for building design in Fiji--ground accelershy
ation frequency spectra horizontal and vertical components of ground
motion local amplification effects and so on Furthermore seismicity
patterns may provide a key to long-term forecasting and short-term predicshy
tion of the location and size of future earthquakes that may affect Fijis
population
International Cooperation
Fifth international cooperation among the island countries of the
Southwest Pacific may significantly help in Fijis earthquake preparedness
program All of the countries affected by earthquakes (Tonga Western
105
Samoa Fiji Vanuatu Solomon Islands Papua New Guinea and New Zealand)
have to varying degrees developed earthquake preparedness programs Fiji
may take advantage of the previous current and any future efforts of the
other countries in the region
106
REFERENCES
Band R B Geology of southern Viti Levu and Mbengga Bull Geol Surv Fii 15 1968
Barazangi M and B L Isacks Lateral variations of seismic waveattenuation in the upper mantle above the inclined zone of the Tonga island arc Deep anomaly in the upper mantle J Geophys Res 76 8493-8516 1971
Berryman K Seismotectonic zoning stud of the Fiji Islands EarthDeformation Section Report 70 Wellington NZ DSIR 40 pp 1979
Berryman K Retriangulation of Navua base net (across Suva-Mbenggaseismic zone) Fiji Islands August 1980 Earth Deformation Section Report Wellington NZ DSIR 26 pp 1981
Brocher T M and R Holmes The marine geology of sedimentary basinssouth of Viti Levu Fiji in Investigations of the Northern Melanesian Borderland edited by T M Brocher Circum-Pacific Council for Energy andMineral Resources Earth Science Series Tulsa Oklahoma Amer Assoc Petrol Geol pp 122-137 1985
Calder N The Restless earth A Report on the New Geology The VikingPress New York New York 1972
Carney J N and A Macfarlane Geological evidence bearing on the Miocene to Recent structural evolution of the New Hebrides Arc Tectonophysics 87 147-175 1982
Chase C G Tectonic history of the Fiji Plateau Geol Doc Amer Bull L2 3087-3110 1971
Chen W P and P Molnar Focal depths of intracontinental and intraplateearthquakes and their implications for the thermal and mechanical properties of the lithosphere J Geophys Res 88 4183-4215 1983
Circum-Pacific Council for Energy and Mineral Resources Plate tectonic mapof the circum-Pacific region southwest quadrant 110000000 Amer Assoc Petrol Geol Tulsa Oklahoma 1981
Colley H Metallogenic map of Viti Levu Min Resources Div Fiji Ma 552 1976
Corbett E J Seismicity and crustal structure studies in southernCalifornia Tectonic implications from improved earthquake locationsPhD thesis 231 pp California Institute of Technology 1984
Dickenson W R Dissected erosion surfaces in northwest Viti Levu FijiZ Geomorph N F 16 151-167 1972
107
Dickenson W R M J Rickard F I Coulson J G Smith and R L Lawrence Late Cenozoic shoshonitic lavas in northwestern Viti Levu Fiji Nature 219 148 1968
Draunidalo K B and M W Hamburger Seismicity of Fiji 1965-1969 Min Resources Dep Fiji Note BP 3014 7 pp 1984
Eden R A and R Smith Fiji as a Petroleum Prospect Suva Min Resources Dep 8 pp 1984
Everingham I B Focal mechanism for the 16 November 1979 earthquake near Taveuni Fiji Min Resources Dep Fiji Report 49 1982a
Everingham I B The 1932 Koro earthquake epicenter Mineral Resources Dep Fiji Note BP 331 14 pp 1982b
Everingham I B Reports of earthquakes felt in Fiji 1850-1940 Min Resources Dep Fiji Report 48 54 pp 1983a
Everingham I B The effects of the 16 December 1975 earthquake in Kadavu Passage Fiji Min Resources Dep Fiji Note BP337 16 pp 1983b
Everingham I B Magnitude determinations for shallow earthquakes in Fiji and their implications Min Resources Dep Fiji Rep 48 1983c
Everingham I B Preliminary report of seismic events in the Monasavu Dam area Min Resources Dep Fiji Note BP 332 14 pp 1983d
Everingham I B Provisional list of felt earthquakes reports in Fiji 1941-1981 Min Resources Dep Fiji Note BP 338 17 pp 1984
Everingham I B Focal mechanisms of earthquakes near Fiji Min Resources Dep Fiji Note 1985
Frost E L Archaeological excavations of fortified sites in Taveuni Fiji Asian Pacif Archaeol Ser Univ Hawaii 6 1974
Gill J B From island arc to oceanic islands Fiji southwestern Pacific Geology 4 122-126 1976
Gill J B Stork A L Whelan P M Volcanism accompanying back-arc basin development in the Southwest Pacific Tectonophysics 102 207-224 1984
Green D and D J Cullen The tectonic evolution of the Fiji region in The Western Pacific Island Arcs Marginal Seas Geochemistry edited byPJ Coleman Nedlands University of Western Australia Press pp 127-145 1973
Halunen A J Tectonic history of the Fiji Plateau PhD thesis 127 pp University of Hawaii Honolulu HI 1979
108
Hamburger M W Seismicity of the Fiji Islands and Tectonics of the Southwest Pacific PhD thesis 3i2 pp Cornell University Ithaca NY 1986
Hamburger M W and B L Isacks Seismicity and seismotectonic studies in the Southwest Pacific Min Resources Dep Fiji Note BP3015 50 pp 1983
Hamburger M W and Qiolevu S R The Kadavu earthquakes of July-August 1983 Min Rescurces Dep Fiji Note BP 337 15 pp 1983
Hamburger M W and B L Isacks Shallow seismicity of the North FijiBasin in Basin Formation Ridge Crest Processes and Metallogenesis in the North Fiji Basin edited by L W Kroneke and J V Eade Circum-Pacific Council for Energy and Mineral Resources Earth Science Series Tulsa Oklahoma Amer Assoc Petrol Geol in press 1986
Hamburger M W and I B Everingham Seismic and aseismic zones in the Fiji region in Proceedings of the International Symposium on Recent Crustal Movements of the Pacific Region edited by W I ReillyWellington NZ 9-14 Feb 1984 in press 1986
Hays W W Procedures for estimating earthquake ground motions US Geological Surv Prof Paper 1114 77 pp 1980
Hill D P A model for earthquake swarms J Geophys Res 82 1347-1352 1977
Hodgson J H Direction of faulting in some of the larger earthquakesof the southwest Pacific 1959-1954 Publ Dominion Observ Ottawa 18 171-216 1956
Houtz R E Submarine canyons near Suva as possible fault lineations Rep Geol Surv Fiji 51 3 pp 1959
Houtz R E The 1953 Suva earthquake and tsunami Bull Seismol Soc Amer 52 1-12 1962a
Houtz R Note on minor damage caused by the Suva earthquake of June 1961 Bull Seismol Soc Amer 52 13-16 1962b
Houtz R E and H W Wellman Turbidity current at Kandavu Passage Fiji Geol Mag 99 57-62 1962
Isacks B L L R Sykes and J Oliver Focal mechanisms of deep and shallow earthquakes in the Tonga-Kermadec region and the tectonics of island arcs Geol Soc Amer Bull 80 1443-1470 1969
109
Isacks B L R K Cardwell J L Chatelain M Barazangi J M Marthelot D Chinn and R Louat Seismicity and tectonics of the central New Hebrides island arc in Earthquake Prediction An International Review Maurice Ewing Ser edited by D W Simpson and P G Richards pp 93-116 1981
Iyer H M Geophysical evidence for the locations shapes and sizes and internal structures of magma chambers beneath regions of Quaternary volcanism Phil Trans Roy Soc Lond A310 473-510 1984
Karig D E Ridges and basins of the Tonga-Kermadec island arc system J Geophys Res 75 239-254 1970
Karig D E and G F Sharman III Subduction and accretion in trenches Geol Soc Amer Bull 86 377-389 1975
Kroenke L W C Jouannic and P Woodward Bathymetry of the Southwest Pacific Chart 1 of Geophysical Atlas of the Pacific CCOPSOPAC 1983
Lahr J C HYPOELLIPSEVAX A computer program for determining local earthquake hypocentral parameters magnitude and first-motion pattern US Geol Surv Open-File Rep 84-519 60 pp 1984
Larue B M J Y Collot A Malahoff A sedimentary structure southwest of Viti Levu Fiji The Baravi Basin in Symposium on Petroleum Potential in Island Arcs Small Ocean Basins Submerged Margins and Related Areas UN ESCAP CCOPSOPAC Tech Bull 3 Wellington NZ DSIR pp 77-83 1980
Launay J Morphologie et structure de larc insulaire des Nouvelles-Hebrides dans sa terminaison sud in Contribution a ]Etude Geodvnamigue du Sud-Ouest Pacifioue Travau et Documents de ]ORSTOM No 147 pp 163-178 1982a
Launay J Essai de schema tectonique de la terminaison sud de larc insulaire des Nouvelles-Hebrides In Contribution a 1Etude Geodynamique du Sud-Ouest Pacifique Travaux et Documents de lORSTOM No 147 pp 217-220 1982b
lee W H K and S W Stewart Principles and Applications of Microearthquake Networks New York Academic Press 292 pp 1981
Louat R Seismicite et subduction de la terminaison sud de larc insulaire des Nouvelles Hebrides in Contribution a lEtude Geodvnamique du Sud-Ouest Pacifique Travaux et documents de lORSTOM No 147 Paris ORSTOM p 179-185 1982
Maillet P and M Monzier Volcanisme et petrologie des iles Matthew et Hunter donnees preliminaires in Contribution a lEtude Geodvnamique du Sud-Ouest Pacifique Travaux et documents de lORSTOM No 147 Paris ORSTOM pp 187-216 1982
110
Malahoff A R H Feden and H S Fleming Magnetic anomalies and tectonic fabric of marginal basins north of New Zealand J Geophys Res 7 4109-4125 1982a
Minster J B and T H Jordan Present-day plate motions J Geophys Res 83 5331-5354 1978
Monzier M P Maillet J Foyo Herrera R Louat F Missegue and B Pontoise The termination of the southern New Hebrides subduction zone (southwestern Pacific) Tectonophvsics 101 177-184 1984
Nakamura K Volcanoes as possible indicators of tectonic stress orientation Principle and proposal J Volc Geoth Res 2 1-16 1977
Nakamura K K H Jacob and J N Davies Volcanoes as possibleindirators of tectonic stress orientation--Aleutians and Alaska Pure ApplGeophv 115 87-112 1977
Roca J L Essai de determination du champ de contraintes dans larchipeldes Nouvelles Hebrides Bull Soc Geol France 20 511-519 1978
Rodda P Outline of the geology of Viti Levu N Z J Geol Geophys I0 1260-1273 1967
Rodda P Fiji In Mesozoic-Cenozoic Orogenic Belts A M Spencer (ed)Spec Publ Geol Soc London 4 415-432 1974
Rodda P Geology of northern and central Viti Levu Bull Min Resources Div Fiji 3 1976
Rodda P and R B Band Geology of Viti Levu Fiji Geol Surv Map GS 432 1966
Rodda P and L W Kroenke Fiji A fragmented arc in L W Kroenke Cenozoic Tectonic Development of the Southwest Pacific UN ESCAP CCOPSOPAC Tech Bull 6 87-109 1984
Rodda P I McDougall R A Cassie D A Falvey R Todd T A Wilcoxon Isotopic ages magnetostratigraphy and biostratigraphy from the early Pliocene Suva Marl Fiji Geol Soc Amer Bull 96 529-538 1985
Sanford A R and P Einarsson Magma chambers in rifts in Continental and Oceanic Rifts Geodynamics Ser vol 8 edited by G Palmason Amer Geophys Un Washington DC pp 147-168 1982
Sclater J G and H W Menard Topography and heat flow of the Fiji Plateau Nature 216 991-993 1967
Sclater J G J W Hawkins J Mammerickx and C G Chase Crustal extension between the Tonga and Lau Ridges Petrologic and geophysical evidence Geol Soc Amer Bull 83 505-517 1972
Silverstein B Processed strong-motion records from Monasavu Dam Fiji Earthquakes of February 13 14 and 23 1983 US Geol Surv Open File Rep 85-375 85-375 1985
Smith R B and R L Bruhn Intraplate extensional tectonics of the eastern Basin-Range Inferences on structural style from seismic reflection data regional tectonics and thermal-ductile models of brittle-ductile deformation J Geophys Res 89 5733-5762 1984 Smith R and T Raicebe (comps) Bathymetric map of Fiji Multicolored scale 11000000 Suva Min Resources Dept Fiji 1984
Stuart D J Current status of the continuing investigation of seismicity in the Monasavu Dam area Viti Levu Min Resources Dep Fiji Note BP 3016 18 pp 1985
Sykes L R The seismicity and deep structure of island arcs J Geophys Res 71 p 2981-3006 1966
Sykes L R B L Isacks and J Oliver Spatial distribution of deep and shallow earthquakes of small magnitude in the Fiji-Tonga region Bull Seismol Soc Amer 59 1093-1113 1969
Taylor F W Quaternary tectonic and sea-level history of Tonga and FijiSouthwest Pacific PhD Thesis Cornell University Ithaca N Y 355 pp 1978
Turcotte D L and G Schubert Geodynamics John Wiley amp Sons New York 1982
Von Stackelberg U and Shipboard Scientific Party Hydrothermal sulfide deposits in back-arc spreading centers in the Southwest Pacific submitted to Nature 1985
Whelan P W J B Gill E Kollman R Duncan and R Drake Radiometric dating of magmatic stages in Geology and Offshore Resources of Pacific Island Arcs - Tonga Region edited by D W Scholl and T L Vallier Circum-Pacific Energy and Mineral Resources Council Am Assoc Petrol Geol Spec Publ 2 Earth Sci Ser Tulsa Oklahoma in press 1985
Woodhall D The geology of the Lau Ridge in Tonga Ridge Resource Studyand Tripartite Cruise Report edited by D S Scholl and T L Vallier Open-file Rep CCOPSOPAC Suva Fiji pp 277-300 1985a
Woodhall D Geology of Taveuni Island Min Resources Dep Fiji in prep 1985b
112
APPENDIX I DEFINITIONS
Two measures of the size of an earthquake are magnitude and intensity
Magnitude is a measure of the energy from an earthquake source to indicate the
strength of an earthquake In comparison intensity is a measure of the amount
of ground shaking caused by the earthquake at a particular site Thus an
earthquake of a given magnitude will produce a wide range of intensities
depending largely on distance from the source
In general a small earthquake with a magnitude less than 5 may be felt
only in the area near the source and a moderate earthquake with a magnitude
between 5 and 7 will be felt over a wider area and may produce significant
damage in the area very close to the source A large earthquake refers to an
earthquake with a magnitude greater than 7 Such events are often very desshy
tructive if they are located near population centers A major earthquake
refers to magnitudes between 7 and 7 34 and a great earthquake refers to
magnitudes greater than 7 34 These great earthquakes cause widespread desshy
truction and possible regional tsunamis Generally the potential damage from
earthquakes is multiplied by the secondary effects of earthquake occurrence
such as ground faulting generation of tsunamis landslides slumping or
liquefaction
The depth of earthquakes range from the surface to approximately 700 km
depth Shallow earthquakes refer to those with depths between the surface and
70 km Intermediate earthquakes refer to those with depths between 70 km and
300 km depth De earthquakes refer to those with depths greater than 300 km
(but less than 700 km) Intermediate depth earthquakes occasionally produce
damage at the earths surface only if the earthquake is very large Deep
events are generally not felt
113
The seismic (earthquake) potential of a particular region is defined as
the likelihood of that region to experience a (destructive) earthquake within a
particular magnitude range within a particular time period The seismic
(earthquake) hazard of a particular location refers to the amount of ground
motion that might be expected from an earthquake within or near that region
Adequate data on seismotectonic features instrumental (strong-motion) and
macroseismic (intensity) records of near-field effects of large earthquakes
source parameters of large earthquakes earthquake spectra and ground attenuashy
tion or amplification are necessary in order to reasonably evaluate earthquake
hazard for any region The seismic potential is the integration of all of
these bits of information The average length of time between earthquakes of a
particular size (recurrence interval) and the amount of time elapsed since the
last earthquake of that size help to define the probability of future earthshy
quake occurrence along a particular seismogenic zone hence the seismic
potential of that zone
Seismic risk of a particular region refers to the expected degree of
losses of people and their property which result from the seismic hazard and
the vulnerability in the region One method that has been widely used for this
risk determination (and is used here) involves the determination of a maximum
probable earthquake (design earthquake) that is likely to occur in the imshy
mediate region Calculations of seismic hazard which are based on design
earthquakes generally yield conservative estimates of risk
The most important conclusion of historical studies of seismicity is to
define the seismogenic zones of a region and extrapolate what the future earthshy
quake potential is for those zones Seismically quiescent regions refer to
regions with a lower level of seismic activity which are surrounded by more
114
active regions Portions of major plate boundaries that have not experienced a
major or great earthquake during a particular time interval are seismic gaps
This time interval is taken to be a significant portion of the earthquake
recurrence interval for a large earthquake An estimate to within several
decades of the location and size (magnitude) of a large earthquake constitutes
a forecast If a precise calculation of the time and probability of occurrence
can be added to the location and size information then the estimation is a
prediction
115 APPENDIX II MODIFIED MERCALLI INTENSITY SCALE (1956 VERSION)1
Masonry A B C D To avoid ambiguity of language the quality ofmasonry brick or otherwise is specified by the following lettering (whichhas no connection with the conventional Class A B C construction)
Masonry A Good workmanship mortar and design reinforced especiallylaterally and bound together by using steel concrete etc designed toresist lateral forces
Masonry B Good workmanship and mortar reinforced but not eesigned indetail to resist lateral forces
Masonry C Ordinary workmanship and mortar no extreme weaknesses likefailing to tie in at corners but neither reinforced nor designed againsthorizontal forces
Masonry D Weak materials such as adobe poor mortar low standards ofworkmanship weak horizontally
DESCRIPTION (INTENSITY VALUES RANGE FROM I TO XII)
I Not felt Marginal and long-period effects of large earthquakes
II Felt by persons at rest on upper floors or favorably placed
III Felt indoors Hanging objects swing Vibration like passing oflight trucks Duration estimated May not be recognized as an earthquake
IV Hanging objects swing Vibration like passing of heavy trucks orsensation of a jolt like a heavy ball striking the wallsStanding motor cars rock Windows dishes doors rattle Glassesclink Crockery clashes In the upper range of IV wooden walls and frames creak
V Felt outdoors direction estimated Sleepers wakened Liquidsdisturbed some spilled Small unstable objects displaced orupset Doors swing close open Shutters pictures movePendulum clocks stop start change rate
Original 1931 version in Wood H 0 and F Newmann 1931 ModifiedMercalli Intensity Scale of 1931 Bull Seis Soc Amer 53 979-9871956 version prepared by Charles F Richter in Elementary Seismology(1958) 137-138 W H Freeman and Company
116 VI Felt by all Many frightened and run outdoors Persons walk unsteadily Windows dishes glassware broken Knickknacks booksetc off shelves Pictures off walls Furniture moved or overshyturned Weak plaster and masonry D cracked Small bells ring(church school) Trees bushes shaken (visibly or heard to
rustle--CFR)
VII Difficult to stand Noticed by drivers of motor cars Hangingobjects quiver Furniture broken Damage to masonry D includingcracks Weak chimneys broken at roof line Fall of plasterloose bricks stones tiles cornices (also unbraced parapets andarchitectural ornaments--CFR) Some cracks in masonry C Waveson ponds water turbid with mud Small slides and caving in alongsand or gravel banks Large bells ring Concrete irrigationditches damaged
VIII Steering of motor cars affected Damage to masonry C partialcollapse Some damage to masonry B none to A Fall of stucco andsome masonry walls Twisting fall of chimneys factory stacksmonuments towers elevated tanks Frame houses moved onfoundations if not bolted down loose panel walls thrown outDecayed piling broken off Branches broken from trees Changes inflow or temperature of springs and wells Cracks in wet groundand steep slopes
IX General panic Masonry D destroyed masonry C heavily damagedsome times with complete collapse masonry B seriousiy damagedGeneral damage to foundations--CFR) Frame structures if notbolted shifted oft foundations Framed cracked Serious damageto reservoirs Underground pipes broken Conspicuous cracks inground In alluviated areas sand and mud ejected earthquakefountains sand craters
X Most masonry and frame structures and bridges destroyed Seriousdamage to dams dikes embankments Large landslides Waterthrown on banks of canals rivers lakes etc Sand and mudshifted horizontally on beaches and flat land Rails bent slightly
XI Damage nearly total Large rock masses displaced Lines of sightand level distorted Objects thrown into the air
117 APPENDIX III SEISMOLOGICAL FACILITIES AND EARTHQUAKE HAZARD PROGRAMS IN
THE SOUTHWEST PACIFIC
As part of our program of field investigations in Fiji Tonga andVanuatu our researcher was able to visit the neighboring island countriesof the Southwest Pacific region During these visits he was able to meetwith scientists and public officials involved with the earthquake hazardproblem fEcing each country In every case the governments are awareand have taken some action to ofmitigate the potential losses due to destrucshytive earthquakes but these governmental responses have varied widely fromcountry to country This report focusses on the seismological institutionsand facilities in each of the counltries and their capabilities in assessingand planning for earthquake hazards In the following sections weconsider each of the island countries of this area which face a severeearthquake risk Fiji Tonga Vanuatu Western Samoa Solomon IslandsPapua New Guinea and New Zealand
TONGA
Seismological Facilities Seismological observations in Tonga are the responsibility of theMinistry of Lands Surveys and Natural Resources Due to fiscal conshystraints however these efforts have in the past been entirely dependenton foreign assistance Seismological experiments began in Tonga in themid-1960s with Lamont-Dohertys Upper Mantle Project Seismic stationswere operated by Lamont-Doherty and subsequently by Cornell scientiststhrough the early 197 0 s when operations were suspended In late 1983 aspart of the present AID-supported seismic hazard program Cornell reinshystalled a three-component short-period seismograph in the capitalNukualofa The seismograph was installed upon the request of the governshyment geologist to be operated by the Tongan government with technicalassistance from Cornell Unfortunately after operation of the seismographfor eight months Tongas Cabinet decided that the drain on its resourcesand personnel was excessive and the instruments were disconnected in May1984 with the components transferred to Fiji and Vanuatu where they canbe utilized There are presently no plans to reinstall permanent seismoshy
graphs in Tonga
Strong Motion Accelerographs
Two strong-motion accelerographs provided by the AID seismic hazardprogram are presently operating in Tonga one in Nukualofa and one in thenorthern Vavau Islands They have been in operation for one year andhave not to date recorded any large earthquakes They require a minimum ofmaintenance and their operation will continue to be supen-sed by thegovernment geologists with assistance from Cornell A third accelerographmay be made available to tonga by the British Geological Survey and couldbe installed on Eua Island in a zone of high activity close to the TongaTrench
118 Related Research Programs
The Ministry of Lands Surveys and Natural Resources employs a singlegovernment geologist whose responsibilities include coordination of oilprospecting geological mapping of the islands and assessment of earthquakeand tsunami hazards There has been considerable scientific study of theTonga Trench subduction zone by research groups from the United StatesJapan New Zealand Australia Germany and the Soviet Union More detailedmarine geophysical data have been collected near Tongatapu Island byAmerican petroleum exploration groups
Critical Facilities
The capital city of Nukualofa has a population of only 20000 butdoes include several three- and four-story buildings The larger buildingshave in general been designed by foreign engineers and have includedearthquake-resistant design specifications Other significant developmentprojects include the expansion of the government wharf in Nukualofa anddevelopFnent of tourist resorts on Tongatapu and several of the outer islands
Earthquake Preparedness Programs
There are no building codes presently enforced in Tonga Howeverconstruction of public buildings must be approved by the Ministries ofWorks and Health The largest office buildings and hotels are designed byoverseas engineering firms and generally include some earthquake loadingcriteria The Land and Environment Act currently under consideration bythe Tongan government would require review of all development projects bythe government planner application of building codes largely adapted fromNew Zealand codes is expected to followDisaster preparedness programs are the responsibility of the CabinetsNational Disaster Committee including representatives from the relatedgovernment ministries and departments Subcommittees focus on disasterpreparedness action planning and long-term relief and rehabilitation
There is no earthquake education program in Tonga
VANUATU
Seismological Facilities
Seismic stations in Vanuatu were first established in the mid-1960sby the French Office de la Recherche Scientifique et Technique Outre-Mer(ORSTOM) Station PVC in Port Vila has operated continuously from 1964 tothe present while LUG in Luganville Santo operated through 1980 A thirdstation on Tanna Island (INH) operated through 1978 Cornells cooperativefield programs with ORSTOM began in 1976 with a microearthquake experimenton Santo Island an ocean-bottom seismograph experiment was carried out insouthern Vanuatu in 1977 and in central Vanuatu in 1978 The
119 Cornell-ORSTOM telemetered seismic network was established in 1978 and hasoperated continuously since that time The seismic network now includes 19telemetered stations (Figure Al) to date over 17000 earthquakes havebeen recorded by the network A permanent ORSTOM mission is now based inPort Vila and takes primary responsibility for day-to- day maintenance ofthe network These seismological facilities are complemented by studies ofground deformation using seven bubble-level tiltmeter a two-componentlong-baseline water tube tiltmeter and two levelling arrays
Strong Motion Accelerographs
As part of the present program of seismic hazard evaluation inVanuatu Cornell has installed five strong motion accelerographs on theislands of Efate Malekula and Santo (Figure Al) These instruments havealready been triggered by five moderate-sized shallow events and will beused to provide a basis for predicting local ground motion induced by largeinterplate earthquakes in Vanuatu The high level of seismicity along thisplate boundary suggests that a valuable baseline of strong motion data canbe collected in a relatively short period of time
Related Scientific Programs
The seismology program is carried out in cooperation with the VanuatuDepartment of Mines Geology and Rural Water Supplies They areresponsible for regional geology studies resource assessment detailedmapping and hydrological activities In addition ORSTOMs geology andgeophysics department based in New Caledonia carries out an extensiveprogram of investigations covering submarine morphology marine geologyand geophysics island geology and crustal structure Recently the USGeological Survey has undertaken a series of detailed marine studies in thecentral and northern portions of the island arc using the research vesselSP Lee A detailed hydrographic survey was carried out in coastal watersby Australian researchers In addition proton-precession magnetometersare maintained by Queensland University (Australia) researchers A tidegauge is maintained by the ORSTOM mission in Port Vila
Critical Facilities
Port Vila with a population of under 20000 is the administrativeand commercial center of the country There are a number of multistorybuildings in the capital and most of Vanuatus small tourist industry islocated in and near Port Vila A large shipping wharf is located near the center of the city on Vila Bay
Apart from Port Vila the only significant development in Vanuatu isat Luganville on Santo Island (pop 5000) It remains an importanteconomic center for the country with agricultural processing and shippingfacilities located there There are several three- and four-storybuildings in the center of Luganville There was significant damage to
120
14 o 166 deg 1670 1680 1690 1700
GAUA FIJI
150 0 PLATEAU
a ~ SANTO A013AoVAN CAAO 1
APENTECOST deg - STAMB16 aAMKs 160 AMBRYM 16
MALEKULA MML~DENTRECASTEAUX FRACTIURE ZONE
IEP
170- EM I-170
NGOUNANGA IN
S EFAT 180- oJ pV
0-180
mV
o ERROMANGO o -OAUSTRALIANR FUTUNAT ANN
19 6669190 o
-4 00 FUTUNA00AUSTRALIAN
0 0 N__
20ht PLAT E S I ANATOM l 0
165c 166deg 1670 degE 1680 169 1700
Figure Al Map showing the seismograph stations in Vanuatu Circles arestations telemetered to the base station PVC on Efate island andunderlined stations have two components--one horizontal and one verticalThe triangles are older ORSTOM stations INH and LUG are no longer operational Strong motion instruments are located at SWB and LMP onMalekula island DVP and PVC on Efate island and LUG on Santo island
121
buildings wharves and bridges in Luganville following the 1965 Santo earthquake
Earthquake Preparedness Programs
Disaster preparedness is the responsibility of the Ministry of Home Affairs a revised Rescue Plan has been adopted since independence They are responsible for damage assessment and coordination of emergency relief efforts by other ministries and public agencies
There are presently no building codes enforced in Vanuatu At present the government has requested the assistance of a consultant from New Zealand to help provide uniform building codes for the country The Public Works Department enforces New Zealand seismic zone B codes to construction of public buildings Large buildings for the most part are designed by overseas engineering firms and generally comply with their earthquake design standards Smaller buildings are generally designed close to the New Zealand loading specifications but there continues to be great difficulty in supervising construction projects
There is no large-scale earthquake education project in Vanuatu Materials have been prepared by ORSTOM seismologists for distribution to teachers public officials and planners involved in earthquake hazards
WESTERN SAMOA
Seismological Facilities
One of the earliest seismic stations in the Pacific was established at the Apia Observatory in 1902 during the German colonial period through the University of G6ttingen In 1921 control of the observatory was transshyferred to the New Zealand Government Weichert seismographs were operated continuously at Apia through 1957 when they were replaced by Benioff instruments at Afiamalu and by short-period Wood-Anderson instruments at Apia Since Samoan independence in 1963 the Observatory has been operated jointly by the Samoan Government and the Department of Scientific and Industrial Research (DSIR) New Zealand In 1963 a Worldwide Standard Seismograph Station was established at Afiamalu Operation of this six-component station is supported by the US Geological Survey In 1980 the station was upgraded to allow digital recording equipment was added to upgrade the statior co the status of a Global Digital Seismic Network station Seismic records are sent to DSIR in Wellington for permanent storage
Strong Motion Accelerographs
A simple strong motion instrument has been operating in Apia since 1979 It is an event-triggered low-gain seismograph recording on an ink-stylus recorder At the time of our visit to Western Samoa the instrument had been out of service for several months Only one event has to date triggered the instrument
122
Related Scientific Programs
The Apia Observatory has also made continuous magnetic field measureshyments since 1905 Measurements are currently made using a Schultze earth inductor an Askania declinometer and a proton magnetometer The observashytory maintains two tide gauges as part of the Pacific Tsunami Warning System Offshore resource studies have been carried out through CCOPSOPAC and by various international research groups Much of the reconnaissance geological work in Western Samoa has been carried out by DSIR in New Zealand
Critical Facilities
Like many -f the other island countries of the Pacific Western Samoas development has been concentrated around the capital Apia (pop34000) A major deep-water harbor and the countrys tourist industry are based in Apia Several multistory buildings have been erected in Apia in the past several years A hydroelectric dam on Upolu Island was completed in 1978
Earthquake Preparedness Programs
There is presently no disaster plan in effect in Western Samoa The various agencies involved with emergency action are coordinated through the Police Commissioner New Zealand seismic zone B codes are applied to construction in Western 5amoa Enforcement is handled by the Public Works Department Modest educational materials have been prepared by the ApiaObservatory staff in English and Samoan for distribution through schools and public agencies
SOLOMON ISLANDS
Seismological Facilities
Seismological Observatories in the Solomon Islands are conducted by the Ministry of Lands Energy and Natural Resources They have operated a Worldwide Standard Seismic Station in Honiara since 1962 operation of the station is supported by funds from the US Geological Survey The station was augmented by two short-period telemetered seismic stations in 1982 This three-station network was provided through the British GeologicalSurvey with the aim of identifying volcanic earthquakes associated with the active volcano Savo located close to the capital
In awareness of the high volcanic risk to population centers in the Solomon Islands the Ministry has drawn up plans for two three-station telemetered arrays to be deployed around the active volcanoes on Simbo Island (New Georgia Group) and on Tinakula Island (Santa Cruz Group) They are presently seeking foreign aid in the form of seismic instrumentation and technical assistance to establish the network
123
The Ministry also has responsibility for field surveys following majorearthquakes in the Solomon Islands Studies of ground deformation and cultural effects of the large 1977 and 1984 earthquakes were made by seisshymology officers
Strong Motion Accelerographs
Two strong motion accelerogaphs were installed on Guadalcanal by the Ministry in late 1984 They will be responsible for maintaining the instruments but have requested Cornells assistance in analyzingaccelerograms obtained during their operation The high level of shallow activity near Guadalcanal suggests that a significant number of strong-motion records will be obtained during the lifetime of the instruments
Related Scientific Programs
The Ministry also carries out related research programs in regionalgeology minerals assessment groundwater studies and so on Extensive marine surveys have been carried out in the Solomon Islands by the US Geological Surveys Resource Assessment Program Local offshore surveys have been carried out through CCOPSOPAC A tide gauge is maintained by the Solomon Islands Hydrographic Unit Six proton-precession magnetometers are operated in the Solomon Islands by the Queensland University (Australia)
Critical Facilities
Over 90 of the Solomon Islands population remains in rural areas The major development is in Honiara the administrative and commercial center of the country Honiara (pop 15000) is the major shipping center of the country and now includes several multistory buildings
Earthquake Preparedness Programs
The Solomon Islands implemented a National Disaster Plan in 1980 subsequently revised in 1982 The Plan gives the Ministry for Home Affairs and National Development overall responsibility for coordination of efforts in earthquake volcanic and tsunami disasters Operational relief efforts are carried out through the Disaster Operations Coordinator and the Provincial governments
The government has adopted the most stringent earthquake building code (Zone A) from New Zealand for multistory building construction in Honiara Implementation of these guidelines continues to be a problem One multi- story building in Honiara (Australian High Commission Building) was severely damaged during the 1984 earthquake Some efforts have been made to develop small-scale earthquake-resistant building techniques appropriate for rural areas The Pacific Islands Development Program organized a model
124
house constrtction and workshop during early 1984 A modest outreach program has developed through the school system adult education programsand the government broadcasting company
PAPUA NEW GUINEA
Seismological Facilities
The government of Papua New Guinea has made an extensive commitment to earthquake and volcanic hazard mitigation through construction of a national intLwor cif seisn graphs and accelerographs (Figure A2) Aten-station national network of seismographs is monitored by the Port Moresby Geophysical Observatory (Department of Minerals and Energy) Three of the remote stations are telemetered to Port Moresby via microwave linksfour stations operate as permanent field stations and two are operated at temporary sites on outlying islands Port Moresby is presently the site of a Worldwide Standard Seismic Station that has operated since 1958 The national network reports arrival times to the US Geological SurveysPreliminary Determination of Epicenters and the International SeismologicalCentre but does not routinely locate events independently
In addition t0 the national seismic network the Rabaul VolcanologicalObservatory operates seven seismic stations near active volcanoes around the country and a nine-station telemetry network around the Rabaul Caldera Bougainville Copper Limited operates a 5-station network on Bougainville Island (North Solomons Province)
Stronm Motion Accelerographs
The Port Moresby Geophysical Observatory maintains a national networkof thirteen strong motion accelerographs distributed in the highly seismic areas of the country (Figure A2) This includes a closely spacedfour-station network around the Rabaul Caldera A single strong motion accelerograph is situated on Bougainville Island and is maintained byBougainville Copper Limited The network uses Kinemetrics SMA-I and New Zealand DSIR MO-2 instruments and has recorded tens of accelerograms since its establishment in 1967 The Observatory is presently trying to establish an engineering seismologist position to analyze the accumulatingdata and to further upgrade the accelerograph network
Related Scientific Activities
In addition to the Geophysical Observatory the Department of Minerals and Energy includes the Geological Survey of Papua New Guinea The Surveyundertakes a wide range of geological investigations including regionalgeological mapping petroleum and mineral exploration engineering and environmental geology and energy resource development Offshore surveyshave been carried out through CCOPSOPAC as well as American and Australian research vessels Continuous monitoring of the magnetic field is carried out by the University of Queensland (Australia) Ten tiltmeters have been
CSA v~cwS~Ior m~ 16008 O
fR o- c ~ 1
a ~ 19CL SOewPV ftfa
b (b UACCO40 t wa aj
R~bOVIRAR AI
Ap~~ooj Toel Pbu IR TL
R (l
YOM~I -oob
vtvtOOalork Island WO)ISI
NETWORKS MARCH 1384
Figure A2 Panua New Guinea seismograph and accelerograph networks U
126 deployed by the Volcanological Observatory to monitor ground deformation near Papua New Guineas active volcanoes Four of these instruments aredeployed around Rabaul Caldera
Critical Facilities
Papua New Guinea is the most developed of the island countries of theSouthwest Pacific with a population of over 3000000 and extensive urbandevelopment The capital city of Port Moresby has a population of over130000 with major multistory construction in the downtown area a majordeep water harbor and significant commercial and industrial activity in thePort Moresby area There is significant development as well in the smallertowns of Rabaul Lae Madang Wewak Goroka Mount Hagen Wau BuloloDaru and Kerema Major hydroelectric schemes have been established on theRamu and Rouna rivers with additional hydroelectric plans at variousstages of evaluation and development Extensive mineral development hastaken place in the North Solomons Morobe and Western provinces of PapuaNew Guinea Extensive natural gas and limited oil deposits have beenlocated these may become commercially exploited in the near future
Earthquake Preparedness Programs
Papua New Guinea has a long history of earthquake and volcano-relateddisasters A national disaster program was established in 1981 and proshyvides for a National Disaster Emergency Committee which formulates emershygency government policy and a Disaster Civil Defence Committee which isresponsible for implementation of short-term relief effortsprovincial governments are
The given major responsibility for initialcoordination and assessment of disasters assistance is subsequently
requested from the federal government for major disasters Many of theprovincial governments have not revised preparedrcs plmns sLnce thecolonial period However particularly intense effort has been directed inEast New Britain province because of the imminence of a potentially desshytructive volcanic eruption in Rabaul Caldera
The town of Rabaul (pop 15000) is a major commercial center forPapua New Guinea and is situated directly within the caldera of an activevolcano A relatively small eruption took place at a secondary eruptivecenter near Rabaul in 1937 killing over five hundred nearby residents andforcing the evacuation of the town In order to avoid a repeat of such adisaster the government established the Volcanological Observatory withfour full-time volcanologists and real-time earthquake location andanalysis of tilt data A drastic increase in volcanic seismicity inmid-1983 led to a volcanic hazard alert and intensification ofseismological and ground deformation studies around Rabaul In additionthe alert allowed the provincial and national Disaster Emergency Committeesto make extensive evacuation and relief plans for a possible eruption atRabaul including preparation of a new airstrip improvement of roads andemergency water supplies communications systems detailed evacuationplans education programs and so on To date there has been remarkablecooperation of efforts by provincial national and overseas officials to
127
mitigate the potentially devastating effectq of a volcanic eruption at Rabaul
Papua New Guinea is the only country of the developing nations of the Southwest Pacific to have devised its own seismic zoning system(Figure A3) The Nationwide Housing Code for Papua New Guinea sets up a four-level system of seismic loading oriented toward moderate-sized (to 8 stories) buildings Major buildings require independent dynamic analysisusually carried out by overseas engineering firms Seismic Zone 1 of the Housing Code is among the most stringent earthquake loading codes in theworld and includes the town of Rabaul and much of the East New Britain and North Solomons provinces Seismic zone 2 includes the towns of LaeWewak and Madang and is approximately equivalent to New Zealand Zone A or California loading designs The capital Port Moresby is in the lowest seismic zone (4) but buildings constructed there still require designs allowing for significant lateral loadings
Earthquake education is handled through the National Radio Government Printing Office the Civil Defence Department and the school system withinformation supplied by the Geophysical and Volcanological Observatories A particularly intense education effort has been mounted in Rabaul where educational materials have been produced and distributed in three languages and public involvement in preparedness plans has been emphasized
NEW ZEALAND
While New Zealand cannot be considered one of the developing countries of the Southwest Pacific its seismology programs have been responsible for much of the observational data available for the entire region Because of its importance to the other national seismology programs we briefly review here the New Zealands observational facilities Its extensive programs in engineering seismology its critical facilities and its earthquake preparedness programs will not be covered here
National Seismic Network
Seismological facilities in New Zealand are maintained by the Geophysics Division of the Department of Scientific and Industrial Research (DSIR) in Wellington The national standard seismograph network presentlyconsisting of thirty short-period stations is shown in Figure A5 The network routinely locates all earthquakes of ML gt 38 within New Zealandand earthquakes with Ms gt 50 for the region within 100 of New Zealand Arrival time data are routinely transmitted to the US Geological Surveyand the International Seismological Centre The events located by the network are reported in the annual New Zealand Seismological ReportSeveral hundred earthquakes are located by the DSIR national network each year
The network is augmented by long-period instruments operating at Karopiro Roxburgh and Wellington DSIR also operates a three-componentborehole seismometer in Wellington as part of the Seismic Research Observatory network supported by the US Geological Survey
bull ------- - -- -shy - +----2
FIG 13
f 4tSEISMIC ZONES FOR BUILDING CONSTRUCTION IN PAPUA NEW GUINEA
4
7r
Zce CtASSIICION OF CITIEI Pr 3 12OI- ZO I Z7oE
Figure A3 Seismic zones for building construction in Papua New Guinea (Jury et al 1982)
129
CAPEREINGA
ONERAHI
0GREAT BARRIER
AUCVAND 0
WHITE ISLAND B OCT1914
KARAPIRO EASTCAPE
r WHAKATANE WAIRAKEI
PI5 SEP 13EARATA 0 TUAI 2BJUSBRNE21 CHATEAU MARADALE 4 2 FEJUL1931
90 MANGAHAD v5 MAR 19340 B8AUG 190A
CASTLEPOINT 4JUN 1942 COB ELLINGTON 2 A ~ C BB~3 A16
23 MAY 1968 JANa5
KAIMATA KAIKOURA 9 MAR 19 U 0
3 AUG 1999
CASHMERE lb NOVIqDMT JOHN
PUKA I24 MAR 1960MILFORD -SOUND ) MAY 1976Y
OAMARU ROXBURGH
BORLAND DUNEDIN MAGNITUDE7 OR GREATER 4LODGE 118 0O1019791MAGNITUDE6OR GREATER
OBAN 11940to 19791
Figure A5 Seismograph stations of the national network (left) and the distribution of large shallow earthquakes (right) in New Zealand (Seismological Observatory Wellington 1980)
130 Stations in Outlying Territories
New Zealand has also taken anstations in outlying areas
important lead in operating seismographof the Southwest -acific These stations havebeen extremely important in hypocentral control for the Tonga - Kermadecseismic zone and for nuclear event detection in the Pacificoperates three 6 DSIR-component Worldwide Standard Seismograph stations atAfiamalu (Western Samoa) Raratonga (Cook Islands) and Scott Base(Antarctica) Short-period stations operate at Apia (Western Samoa)Campbell Island (New Zealand) Chatham Islands (New Zealand) Nadi (Fiji)Nime and Raoul Island (Kermadec Island New Zealand) Readings from thesestations are routinely reported to PDE and ISC for global earthquakelocation
Wellington Network
A small-aperture high-gain seismic network is operated aroundWellington an area of greatest seismic risk in New Zealandare The stationstelemetered by radio or telephone link to the central recording siteThe network now consists of eleven stations Earthquakes are presentlydetected by a microprocessor-based Automatic Seismic Monitor and automatedlocation processing is expected to follow The network routinely locatesevents with ML gt 15
Pukaki Network
A second microeartlhquake network has operated around Lake Pukakihydroelectric project in the South Island New Zealand a
established in 1975 The network wasto monitor reservoir-induced seismicity associatedwith impoundment of the reservoir The network consisted of nine stationsand was intended to operate on a temporary basis It has been closed sinceearly 1984 with several of the stations continuing to support thenational network and to monitor any future reservoir-related activity
Related Seismolo Research
In addition to its regular observatory seismology the GeophysicsDivision has an active seismology research programfocussed on Their studies havetheoretical seismology earthquake prediction crustalstructure of New Zealand historical earthquake studies nuclear eventdetection seismic risk in New Zealand strong motion studies and volcanicseismology The monitoring of active volcanoes is closely coordinated withcrustal deformation monitoring conducteu by the Earth Deformation Sectionof the New Zealand Geological SurveyThe New Zealand strong motion accelerograph network now consists of225 instruments operated by the Physics and Engineering Laboratory ofDSIR Most of these instruments are of a New Zealand design (Mechanicaland Optical Accelerographs) and analog records
film are made on photographicThree digitally recording accelerographs are now in operation in
131
Stations in Outlying Territories
New Zealand has also taken an important lead in operating seismographstations in outlying areas of the Southwest Pacific These stations have been extremely important in hypocentral control for the Tonga - Kermadec seismic zone and for nuclear event detection in the Pacific DSIR operates three 6-component Worldwide Standard Seismograph stations at Afiamalu (Western Samoa) Raratonga (Cook Islands) and Scott Base (Antarctica) Short-period stations operate at Apia (Western Samoa)Campbell Island (New Zealand) Chatham Islands (New Zealand) Nadi (Fiji)Nime and Raoul Island (Kermadec Island New Zealand) Readings from these stations are routinely reported to PDE and ISC for global earthquake location
Wellington Network
A small-aperture high-gain seismic network is operated around Wellington an area of greatest seismic risk in New Zealand The stations are telemetered by radio or telephone link to the central recording site The network now consists of eleven stations Earthquakes are presentlydetected by a microproeszor-based Automatic Seismic Monitor and automated location processing is expected to follow The network routinely locates events with ML gt 15
Pukaki Network
A second microearthquake network has operated around Lake Pukaki a hydroelectric project in the South Island New Zealand The network was established in 1975 to monitor reservoir-induced seismicity associated with impoundment of the reservoir The network consisted of nine stations and was intended to operate on a temporary basis It has been closed since early 1984 with several of the stations continuing to support the national network and to monitor any future reservoir-related activity
Related Seismology Research
In addition to its regular observatory seismology the GeophysicsDivision has an active seismology research program Their studies have focussed on theoretical seismology earthquake prediction rustal structure of New Zealand historical earthquake studies nuclear event detection seismic risk in New Zealand strong motion studies amc volcanic seismology The monitoring of active volcanoes is closely coordinated with crustal deformation monitoring conducted by the Earth Deformation Section of the New Zealand Geological Survey
The New Zealand strong motion accelerograph network now consists of 225 instruments operated by the Physics and Engineering Laboratory of DSIR Most of these instruments are of a New Zealand design (Mechanicaland Optical Accelerographs) and analog records are made on photographicfilm Three digitally recording accelerographs are now in operation in
132
New Zealand and the MO records are digitized for computational analysisAnalysis of this empirical data is being used for a revision of New Zealands building codes
133
REFERENCES
Berryman K 1979 Seismotectonic zoning study of the Fiji Islands Earth Deformation Section Report 70 andWellington NZ Dept Sci Indust Research 40 pp
Everinghar IB 1983 Seismology section annual report 1983 Min Resources Dev Fiji Note 3310 Suva Fiji 46 pp
Franco AB MP Hamnett and J Makasiale 1982 Disaster Preparednessand Disaster Experience in the South Pacific Pacific Islands Developshymental Program Honolulu 380 pp
Geological Survey of Papua New Guinea 1979 Information Booklet Port Moresby Dept Minerals and Energy 12 pp
Government of Western Samoa 1977 Apia Observatory 1902-1977 Apia Apia Observatory 8 pp
Jury RD JP Hollings and IAN Fraser 1982 The development of seismic zones and the evaluation of lateral loadings for earthquakeresistant design of buildings in Papua New Guinea Bull NZ Nat Soc for Eartho Engr 15 123140
Lowenstein PL 1982 Problems of volcanic hazards in Papua New GuineaGeol Surv Papua New Guinea Rept 827 Port Moresby Papua New Guinea 62 pp
McCue KF and ID Ripper 1980 The Papua New Guinea Strong MotionAccelerograph Network Geol Surv Papua New Guinea Rept 807 Port Moresby Papua New Guinea 13 pp
Mineral Resources Department Seismology Section 1983 National activityreport Fiji Submitted to Session IX Intl Coord Group for TsunamiWarning System in the Pacific Min Resources Dept Fiji Note 333 Suva Fiji 4 pp
Parliament of Fiji 1984 Mineral Resources Department Annual Report for The Year 1982 Parliam Paper No 13 Suva Fiji 90 pp
Power CA 1978 Earthquake risk in Fiji and the problems of earthquakeengineering Presented to the Fiji Society 17 pp
Prdvot R and JL Chatelain 1983 Seismicity and Seismic Hazard in Vanuatu ORSTOM Rept 5-83 Noum~a 51 pp
Ripper ID 1982 Accelerogram library Geol Surv Papua New Guinea Rept 198211 Port Moresby Papua New Guinea 44 pp
Seismological Observatory Wellington 1980 The earthquake problem in NewZealand Alpha DSIR Extension Information Wellington NZ 4 pp
134
Smith WD 1979 Seismology and related research in New Zealand1975-1978 NZ DSIR Information Series No 140 30 pp
Smith WD 1983 Seismology and related research in New Zealand1979-1982 Seismol Observatory Wellington Bull 276 32 pp
Solomon Islands Government 1982 National Disaster Plan 1982 Honiara Solomon Is 14 pp
135
A Rahamin A Simpson R Holmes P Rodda R Singh I Everingham
K Draunidalo G Shorten M Mehrotra J Booth J Campbell
R Carter R Byrne G Gauss D Rubin
S Tongilava
D Tappin S Lemoto T Tukia
C Clarke
R Campillo R Foy L Mollard T Lee J Recy J Chatelain R Prdvot
L loane S losa A Titimaea
INFORMATION CONTACTS
FIJI
Director Mineral Resources Dept Asst Director (MRD) Princ Geol OffshoreSeismol (MRD) Princ Geol Inform Services (MRD) Principle Geophysicist (MRD) Senior Seismologist (KRD) Seismologist (MRD) Senior Engineering Geologist (MRD) Struc Engr Suva City Council Civil Engineer Su Engineering Geologit A Gibb amp Partners (Monasavu) Marine Geologist kCCOPSOPAC) Marine Geologist (CCOPSOPAC) Marine Geologist (CCOPSOPAC) Marine Geologist (CCOPSOPAC)
TONGA
Superintendent of Lands Surveys and Natural Resources Government Geologist (LSNR) Land Assessor (LSNR) Government Planner (LSNR)
VANUATU
Director Dept Mines Geology and Rural Water Supplies
Director ORSTOM Mission Engineer ORSTOM Engineer ORSTOM Civil Engineer Public Works Dept Director ORSTOM Dept Geol and Geophys (Nouma) Seismologist ORSTOM (Noumda) Seismologist ORSTOM (Noumda)
WESTERN SAMOA
Director Apia Observatory Senior Seismologist (AO) Geologist (AO)
136
SOLOMON ISLANDS
S Danitofea Chief Geologist Ministry of Lands Energy and Natural Resources
D Tuni Senior Seismologist (MLENR)R Walshaw Senior Geologist (MLENR)J Vunagi Ministry of Home Affairs and National DevelopmentD Gwynn Civil Engineer Public Works Department
PAPUA NEW GUINEA
K Doble Chief Geologist Geological SurveyI Ripper Chief Seismologist Geophysical ObservatoryC Seidel Information Officer Volcanological ObservatoryC Anderson Engineering Geologist Geological SurveyJ Wilkins Civil Engineer Dept of Works and Supply
NEW ZEALAND
W Smith Director Seismological Observatory Wellington
UNITED STATES
M Hamnett Pacific Islands Development ProgramG Burton Director Pacific Tsunami Warning Center R Sillcox Seismologist (PTJC)G Pararis-Corayannis Director International Tsunami Information CenterG Greene Branch of Pacific Marine Geology (USGS)
137 APPENDIX IV TSUNAMI SAFETY RULES
1 All earthquakes do not cause tsunamis but many do When you hearthat an earthquake has occurred stand by for a tsunami emergency
2 An earthquake in your area is a natural tsunami warning Do not stayin low-lying coastal areas after a local earthquake
3 A tsunami is not a single wave but a series of waves Stay out ofdanger areas until an all-clear is issued by competent authority
4 Approaching tsunamis are sometimes heralded by a noticeable rise orfall of coastal water This is natures tsunami warning and should be heeded
5 A small tsunami at one beach can be a giant a few miles away Dontlet the modest size of one make you lose respect for all
6 The Tsunami Warning System does not issue false alarms When anocean-wide warning is issued a tsunami exists When a regionalwarning is issued a tsunami probably exists The tsunami of May 1960killed 61 people in Hilo Hawaii who thought it was just another false alarm
7 All tsunamis--like hurricanes--are potentially dangerous even thoughthey may not damage every coastline they strike
8 Never go down to the beach to watch for a tsunami When you can seethe wave you are too close to escape it
9 Sooner or later tsunamis visit every coastline in the PacificWarnings apply to you if you live in any Pacific coastal area
10 During a tsunami emergency your local Civil Defense police andother emergency organizations will try to sdav your life Give them your fullest cooperation
Unless otherwise determined by competent scientists potential danger areasare those less than 50 feet above sea level and within 1 mile of the coastfor tsunamis of distant origin or ess than 100 feet above sea level andwithin 1 mile of the coast for tsunaois of local origin