Embed Size (px)
Citation preview

1
EVALUATION OF SLOPE STABILITY FOR WASTE ROCK DUMPS IN A MINE
A THESIS SUBMITTED IN PARTIAL FULFILLMENT OF THE
REQUIREMENTS FOR THE DEGREE OF
Bachelor of Technology
In
Mining Engineering
By
CHARANPREET SINGH FLORA
10505021
Department of Mining Engineering
National Institute of Technology Rourkela-769008
2009
2
EVALUATION OF SLOPE STABILITY FOR WASTE ROCK DUMPS IN A MINE
A THESIS SUBMITTED IN PARTIAL FULFILLMENT OF THE
REQUIREMENTS FOR THE DEGREE OF
Bachelor of Technology
In
Mining Engineering
By
CHARANPREET SIGH FLORA
Under the Guidance of Dr. MANOJ KUMAR MISHRA
Department of Mining Engineering
National Institute of Technology Rourkela-769008
2009
3
National Institute of Technology
Rourkela
CERTIFICATE
This is to certify that the thesis entitled “EVALUATION OF SLOPE STABILITY FOR
WASTE ROCK DUMPS IN A MINE ” submitted by Sri Charanpreet Singh Flora, Roll No.
10505021 in partial fulfillment of the requirements for the award of Bachelor of Technology
degree in Mining Engineering at the National Institute of Technology, Rourkela (Deemed
University) is an authentic work carried out by him under my supervision and guidance.
To the best of my knowledge, the matter embodied in the thesis has not been submitted to any
other University/Institute for the award of any Degree or Diploma.
Date: (Dr. MANOJ KUMAR MISHRA)

4
ACKNOWLEDGEMENT
My heart pulsates with the thrill for tendering gratitude to those persons who helped me in
completion of the project.
The most pleasant point of presenting a thesis is the opportunity to thank those who have contributed
to it. Unfortunately, the list of expressions of thank no matter how extensive is always incomplete
and inadequate. Indeed this page of acknowledgment shall never be able to touch the horizon of
generosity of those who tendered their help to me.
First and foremost, I would like to express my gratitude and indebtedness to Dr. Manoj Kumar
Mishra, for his kindness in allowing me for introducing the present topic and for his inspiring
guidance, constructive criticism and valuable suggestion throughout this project work. I am sincerely
thankful to him for his able guidance and pain taking effort in improving my understanding of this
project.
I am also grateful to Prof. S Jayanthu (Head of the Department) for assigning me this interesting
project and for his valuable suggestions and encouragements at various stages of the work.
An assemblage of this nature could never have been attempted without reference to and inspiration
from the works of others whose details are mentioned in reference section. I acknowledge my
indebtedness to all of them.
Last but not least, my sincere thanks to all my friends who have patiently extended all sorts of help
for accomplishing this undertaking.
Charanpreet Singh Flora DATE:
PLACE:
Dept. of Mining engineering
National Institute of Technology
Rourkela – 769008
5
1. ABSTRACT……………………………………………………………………………….i
2. LIST OF TABLES………………………………………………………………………...ii
3. LIST OF FIGURES………………………………………………………………………iii
4. CHAPTER: 01 INTRODUCTION……………………………………………………….1
1.1 INTRODUCTION…………………………………………………………………….2
1.2 AIM OF THE STUDY………………………………………………………………..2
1.3 METHODOLOGY…………………………………………………………………..2
1.4 LAYOUT………………………………………………………………………….....5
5. CHAPTER: 02 LITERATURE REVIEW………………………………………………..6
2.1 BACKGROUND INFORMATION ………………………………………………...11
2.2 METHODS OF STABILITY ANALYSIS…………………………………………..20
2.3 TRIAXIAL TESTING……………………………………………………………….26
2.4 COMPUTER APPLICATIONS……………………………………………………..31
6. CHAPTER: 03 MATERIALS AND METHODS……………………………………….32
3.1 DATA COLLECTION……………………………………………………………....32
3.2 DATA ANALYSIS………………………………………………………………....34
7. CHAPTER: 04 TEST RESULTS AND DISCUSSIONS………………………………..42
8. CONCLUSIONS AND RECOMMENDATIONS………………………………………43
5.1 CONCLUSION……………………………………………………………………...43
5.2 RECOMMENDATIONS…………………………………………………………...43
9. REFERENCES…………………………………………………………………………...45
Contents
6
ABSTRACT
The growing needs have been pushing the limits, to which the mining industry has to reach to lift
itself to fulfill the demand. The effect can be seen from the methods of mining that have evolved
over the years. The heavy machinery adopted for the extraction has been producing wastes in the
form of waste rocks whose management is again of prime importance. The issues relating to the
stability of these overburden dumps is catching attention worldwide from quite some time, which
is quite important for the safe working in and around these monstrous structures as well as
restricted availability of land. This paper deals with the stability issues of dumped slopes for a
local chromite mine. The analysis cover analysis of various sections of the waste dumps from the
mine including material properties, strength values, bench height and angle.
7
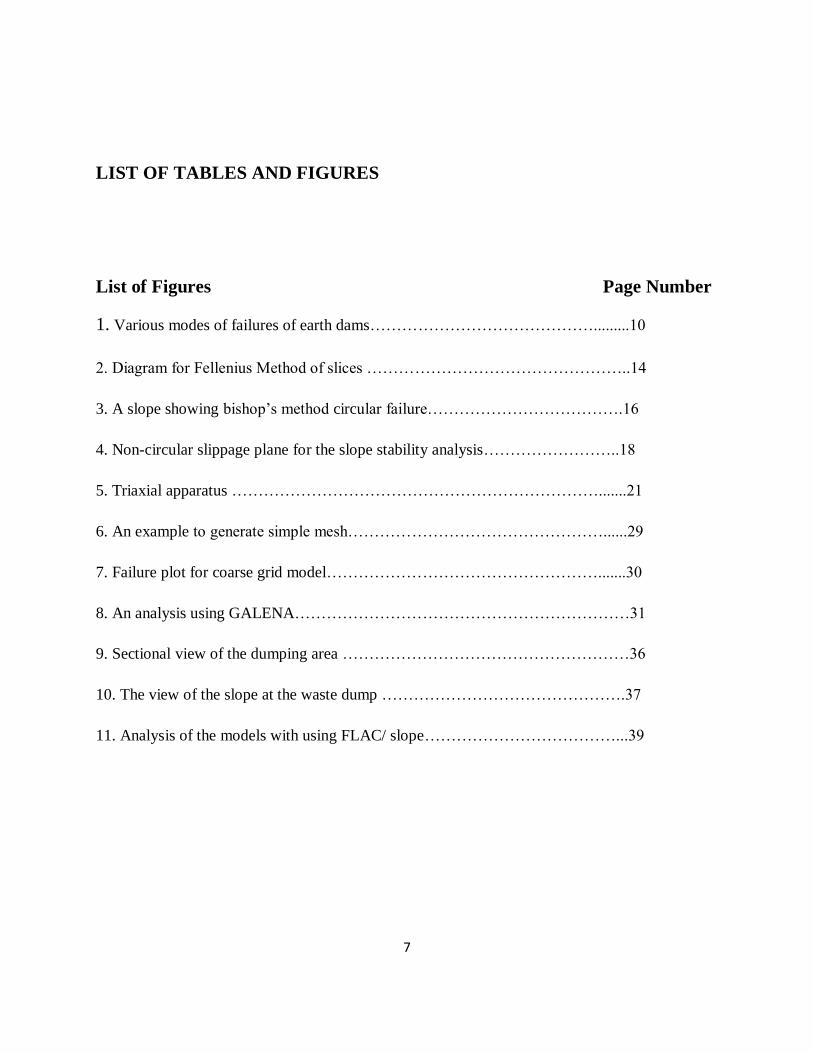
LIST OF TABLES AND FIGURES
List of Figures Page Number
1. Various modes of failures of earth dams…………………………………….........10
2. Diagram for Fellenius Method of slices …………………………………………..14
3. A slope showing bishop’s method circular failure……………………………….16
4. Non-circular slippage plane for the slope stability analysis……………………..18
5. Triaxial apparatus …………………………………………………………….......21
6. An example to generate simple mesh…………………………………………......29
7. Failure plot for coarse grid model…………………………………………….......30
8. An analysis using GALENA………………………………………………………31
9. Sectional view of the dumping area ………………………………………………36
10. The view of the slope at the waste dump ……………………………………….37
11. Analysis of the models with using FLAC/ slope………………………………...39
8
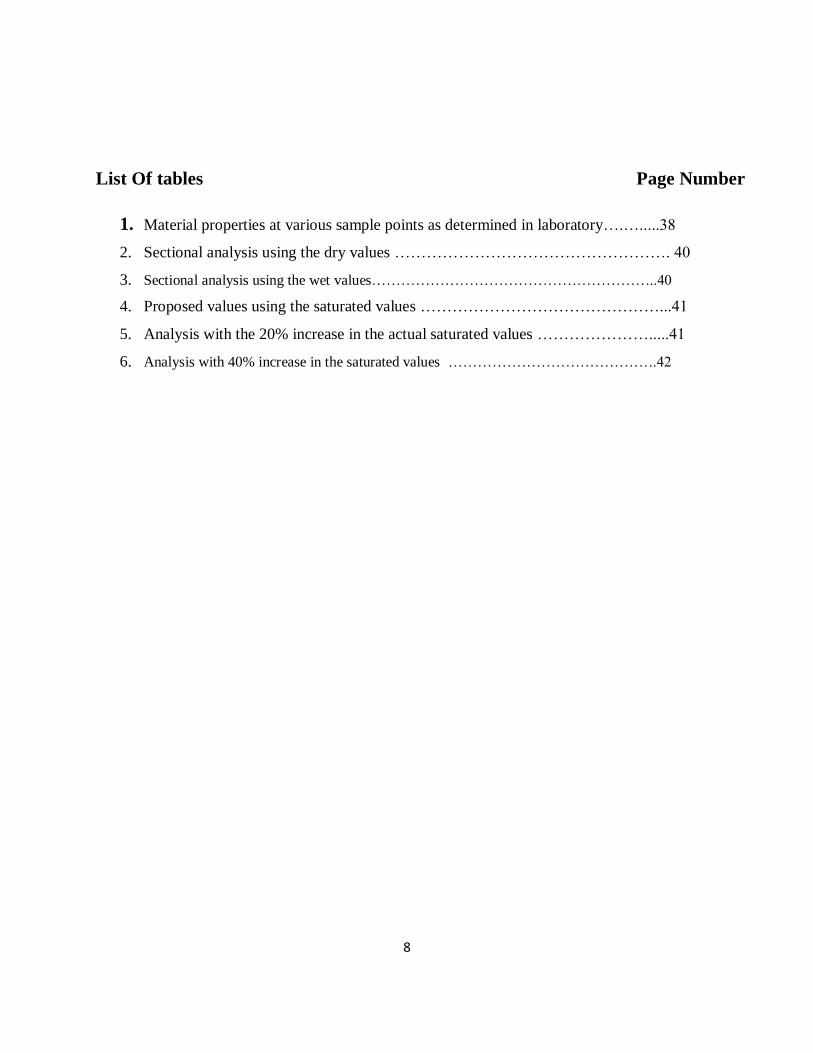
List Of tables Page Number
1. Material properties at various sample points as determined in laboratory….….....38
2. Sectional analysis using the dry values ……………………………………………. 40
3. Sectional analysis using the wet values…………………………………………………..40
4. Proposed values using the saturated values ………………………………………...41
5. Analysis with the 20% increase in the actual saturated values ………………….....41
6. Analysis with 40% increase in the saturated values …………………………………….42

9

10

11
CHAPTER: 01
12
INTRODUCTION
Aim of the Study
Methodology
Layout
CHAPTER - 1
1.0 INTRODUCTION
In recent years, there are numbers of landslide occur everywhere. Most of the landslide happens
on the cut slopes or embankment along roads, highway and sometimes within the vicinity of
highly populated residential area especially those in the highly terrain. Thus, a proper
understanding, monitoring and management of slope stability are essentially important to
minimize the severity or casualty in any landslide.
13
The growing needs have been pushing the limits, to which the mining industry has to reach to lift
itself to fulfill the demand. The effect can be seen from the methods of mining that have evolved
over the years. The heavy machinery adopted for the extraction of the minerals has been
producing huge wastes in the form of waste rocks, the management of which is again of prime
importance. The issues relating to the stability of these overburden dumps is catching attention
worldwide from quite some time, which is quite important for the safe working in and around
these monstrous structures.
The various techniques are applied for the extraction of the minerals, but mostly the most
common practice has been the drilling and blasting. This practice produces the overburden or
waste rocks. These waste rocks are transported from the mines to the waste rock dumping sites
As the mine expands over a period of time, so do these waste dumps and the issues regarding
their stability become important. To deal with these slope stability issues various approaches
have been adopted and developed over the years. The approaches now have been more of
computational rather than the manual .Various softwares are available to analyse the slopes that
are liable to failure by the calculating the factor of safety.
Generally, there are a numbers of on the shelf slope stability analysis software available in the
market. Although, all of them are capable to analyze the stability of slope, their user friendliness
and the accuracy of the result will varies from each other. In this project, FLAC/SLOPE and
GALENA Software will be use to analyze a numbers of complex slope.
1.1 Aim of the Study: The goal of the present investigation is to achieve safe operation of the
opencast mine. This is achieved by addressing the following specific objectives.
1.1.1 Specific Objectives:
The primary objective of this project is to comment on the stability of the slopes constructed due
to dumping of the overburden matter during removal process. This aspect has the following
specific objectives:
Collection of the samples from the field
14
The analysis of these samples to find out parametric variations affecting the slope
stability as the cohesion, angle of friction, density and other parameters.
Utilisation of the results of sample collected to predict the stability in terms of safety
factor
Determination of the factor of safety of the various slopes using the mine plans and
sections
Valuation of the safety factors and suggest corrective measures
The above goal and specific objectives are achieved by adopting the methodology as outlined in
the next session.
1.2 Methodology
The above objectives could only be reached if acted upon with a planned approach. The first step
towards a goal always starts with knowing everything about it. Thus I began with the literature
review. The books, journals, papers proved a rich source of knowledge in this regard and were
thoroughly studied and learned.
This was followed by collection of the data from the field. Samples from many sample points
were collected and carefully packed and sent to the laboratory for the analysis. Various field
visits were also made to know about the actual conditions that exist in the working conditions
and which could be included in the study, during the analyses.
The collected samples were undertaken various analysis to know about the sample properties like
cohesion, angle of internal friction, density , angle of repose etc. then these sample properties
were used in the analyses during the analysis using the software. The factor of safety was
determined for different sections of the overburden dump. Some of the slopes were self designed
extrapolating the field values and safe workable angle and height of the benches were proposed.
1.3 Layout
This project report is divided into four chapters. Chapter one gives the general introduction, goal
and objectives of the report. A critical review of the available literature has been done in chapter

15
2 followed by tests, analysis and discussions in chapter three. Chapter four concludes the work
with further scope.
16
CHAPTER: 02
LITERATURE REVIEW
Background information
Methods of Stability Analysis
Triaxial Testing
Computer Applications
17
CHAPTER 2 LITERATURE REVIEW
2.1 BACKGROUND INFORMATION ON SLOPE PROBLEMS
2.1.1 Introduction
In natural, surface topography have never exists in stable stage. By aided of wind and rain, the
gravity force moves the hills into the valleys and the valleys into the oceans. Continuous tectonic
and intermittent seismic action forms new hills and the cycle of change is continues. However,
the construction works locally interrupt the natural cycle of change by excavating into the ground
with slope in the natural soil, by filling on top of the ground with slopes outlining the
embankment, by covering the ground with impervious blankets, by stepping the surfaces and
holding the upper levels with retaining walls, by modifying the groundwater content or level, by
storing soil-like materials with bins and so on. In some of these construction works, the strength
of natural soil is degraded or the necessary strength of the soil in the relocated position is not
provided. Consequently, this failure will lead to a landslide.
The slopes are of two types
1. Natural slopes
2. Man-made slopes
The natural slopes are those that exist in nature and are formed by natural causes. Such slopes
exist in hilly areas. The sides of cuttings, the slopes of embankments constructed for taking
roads, railway canals etc. and the slopes of the earth dams are examples of finite slopes. The
slope length depends on the height of the dam or the embankment.
Slope stability: slope stability is an extremely important consideration in the design and the
construction of the earth dam. The stability of natural slope is also important. The result of the
slope failure can be catastrophic, including the loss of considerable property and many lives.
18
Causes of slope failure: The important factors that cause instability in a slope lead to failure are:
1. Gravitational Force
2. Force Due To Seepage of Water
3. Erosion of the Surface of the Slopes Due To Flowing Water
4. The Sudden Lowering Of Water Due To a Slope
5. Forces Due To Earthquakes
The effect of all these movements causes the soil to move from high points to low points. The
most important of these forces is the component of gravity that acts in the direction of probable
motion.
The effects of flowing or seeping water are generally recognized as very important in stability
problems, but often these problems have not been properly identified. It is a fact that seepage
occurring within a soil mass causes seepage forces, which have much greater effect than is
commonly realized.
Erosion on the surface of the slope may be the cause of the removal of a certain weight, of soil,
and may thus lead to an increased stability as far as mass movement is concerned. On the other
hand, erosion in the form of undercutting at the toe may increase the height of the slope or
decrease the length of the incipient failure surface thus decreasing the length of the incipient
failure surface, thus decreasing the stability.
When there is lowering of the ground water or of a free water surface adjacent to the slope , for
example in a sudden draw-down of the water surface in a reservoir there is a decrease in the
buoyancy of the soil which is in the effect an increase in the weight . this increase in weight
causes increase in the shearing stresses, that may or may not be in part counteracted by increase
in the shearing strength, whether or not the soil is of low permeability, practically no volume
changes will be able to occur except at a slope rate, and in spite of the increase of the load the
strength increase may be inappreciable
19
Shear at a constant volume may be accompanied by a decrease in the intergranular pressure and
increase in the neutral pressure. A failure may be cause by such a condition in which the entire
soil mass passes into a state of liquefaction and flows like a liquid .a condition of this type may
be developed if the mass of the soil is subject to vibration, for example due to earthquake forces.
General considerations and assumptions in the analysis:
There are three distinct parts in an analysis of the stability. They are:
1. Testing of samples to determine the cohesion and angle of internal friction.
If the analysis is for a natural slope, it is essential that the sample be undisturbed. In such
important respects as the rate off shear application and state of initial consolidation, the
condition of testing must represent as closely as possible the most unfavorable conditions
ever likely to occur in the actual slope.
2. The study of the items which are known to enter but which cannot be accounted for
in the computations.
The most important of such items is the progressive cracking that will start at top of the slope
where the soil is in tension, and aided by water pressure, may progress to considerable depth. In
addition, there are effects of on-homogeneous nature of the typical soil and other variations of
the from the ideal conditions which might be assumed.
3. Computation
if a slope is to fail along a surface , all the shearing strength must overcome along the surface
which then becomes the surface of rupture.
2.1.2 Cause of slope failures
The cause of slope failures may be divided into two categories, which are external and internal
failures.
20
2.1.2.1 External
The external causes of failures are those which produce an increase in the shearing stresses at
unaltered shearing resistance of the material. They included steepened of the slope, deposition of
material along the edge of slopes, removal of lateral support through the erosive power of
streams, glaciers, waves, and long-shore and tidal current, through weathering, wetting, drying
and freeze-thaw cycles in surface materials, and earthquake forces.
2.1.2.2 Internal
The internal causes of failures are those which lead to a slide without any change in surface
conditions which involve unaltered shearing stresses in the slope material. Such a condition is
the decrease in shearing resistance brought about by excess pore water pressure, leaching of
salts, softening, breakage of cementation bonds and ion exchange.
2.1.3 Short and long term failures
The study of the stability of natural slope and cuts may be divided into two conditions namely,
short and long term conditions. The short term instability is due to non-availability of sufficient
time for the dissipation of pore water pressure. However, the long term condition is one in which
the pore water pressure gradually adjusts itself in the long run and shows values corresponding to
a certain ground water condition.
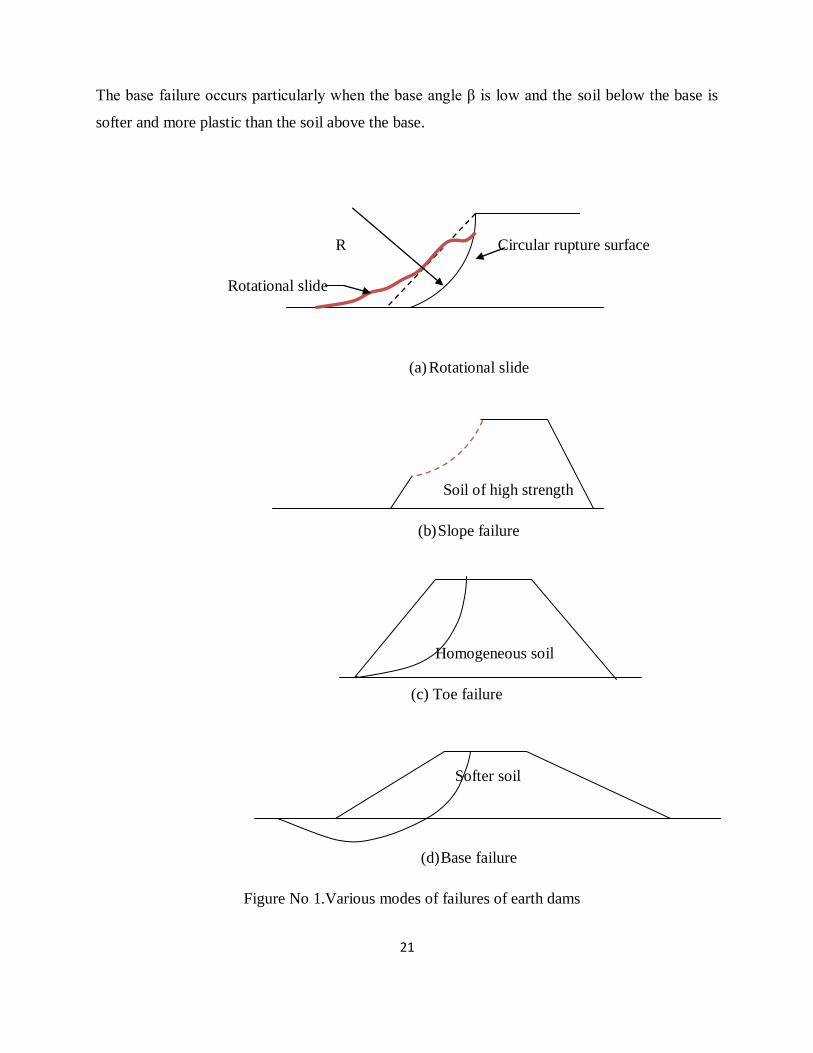
2.1.4 Types of Landslides and Slope Movements
The types of failure that basically occur can be classified as:
1. Slope failure
2. Toe failure
3. Base failure
In the slope failure, the arc of rupture surface meets the slope above the toe. This can happen
when the sloe angle β is quite high and the soil close to the toe possesses high strength. Toe
failure occurs when the soil mass of the dam above the base and below the base is homogeneous.
21
The base failure occurs particularly when the base angle β is low and the soil below the base is
softer and more plastic than the soil above the base.
R Circular rupture surface
Rotational slide
(a) Rotational slide
Soil of high strength
(b) Slope failure
Homogeneous soil
(c) Toe failure
Softer soil
(d) Base failure
Figure No 1.Various modes of failures of earth dams
22
2.2 METHODS OF STABILITY ANALYSIS OF SLOPES
The most common type of problem that is encountered widely been the one in which the failure
occurs on the curved surfaces. The most commonly used method for the analysis of the
homogeneous, isotropic, finite slopes is the Swedish method based on the circular failure
surfaces. K.E Petterson first applied the circle method to the analysis of a soil failure in
connection with the failure of a quarry wall in Goetberg, Sweden in 1916. A Swedish national
commission, after studying a large number of failures, published a report in 1922 showing the
lines of failure of most such slides roughly approached the circumference of a circle. It is
possible to locate the circle which gives the lowest resistance to shear. This general method has
been quite widely accepted as an offering an approximately correct solution for the
determination of factor safety of the slope of an embankment and of its foundation.
Developments in the method of analysis have been made by many researchers with the result that
the satisfactory analysis of the stability of slopes, embankments and foundation by the means of
a dangerous circle method is no longer an unduly tedious procedure.
There are several methods based on the method of stability analysis based on the circular arc
surface of the failure: The following sections 2.2.1 to 2.2.4 have been taken from (Murthy,
V.N.S), 2001.
2.2.1 Method of slices
This method was advanced by the Swedish geotechnical commission and was developed by W.
Fellenius. By dividing the mass above an assumed rupture surface of failure into vertical slices
and assuming the forces on the opposite sides of each slice are equal and opposite, a statistically
determinate problem is obtained, and semi graphical methods have been devised, by which the
stability of the mass may be analysed for any given circle. The main objection to this method
rests on the fact that most dangerous of the infinite number of possible circles must be found, and
thus the graphical procedure must be repeated for a number of circles.
2.2.2 Simplified Bishop’s Method of Slices-
This method takes into account the forces acting on the vertical sides of slices in the
development of an equation for determining the factor of safety. However, the simplified
23
equation proposed by bishop does not contain the forces acting on the vertical sides and therefore
simplifies the calculations numerous examples have illustrated that this method gives the factor
of safety Fs which fall in the range of equally correct values as determined by the exact methods
2.2.3. Friction Circle Method
It is a very convenient method which takes into account the total forces acting on the whole mass
lying above the assumed circular surface of failure. This method eliminates the indeterminate
forces that are inherent in the method of slices such as the forces acting on the vertical side of
slices.
2.2.4. Taylor’s stability numbers
A general solution based on the friction circle method, using a mathematical trial method, was
made by Taylor. Stability numbers were obtained from the analysis of friction circle method.
Charts have also been prepared giving relationship between stability numbers and the slope angle
for various angles of friction. The method is applicable to homogeneous simple slopes without
seepage and factor of safety with respect to cohesion has been in the analysis. However, the
factor safety with respect to strength may be obtained by trial and error method.
2.2.1 Circular surface of failure
The investigations carried out in Sweden at the beginning of this century have clearly confirmed
the surfaces of failure of earth slopes resemble the shape of a circular arc.
When the soil slips along a circular surface such a slide may be termed as a rotational slide. It
involves downward and outward movement of the slice of the earth .and sliding occurs along the
entire surface of contact between the slice and its base.
2.2.1.1 Method of slices Fellenius Methods.
Where the slip surface under the study for a slope passes through soil materials whose shear
strength is based upon internal friction and effective stress, the method of slices is recognized as
a practical means to account for the expected variation in shearing resistance that develops along

24
the different portions of the assumed slippage arc. The procedure is applicable to slopes in
isotropic soils, layered soils and non-isotropic soils.
The procedure involves dividing a mass assumed to be involved in a slope slide into vertical
slices. The width for each slide is arbitrarily selected and the slices do not have to be of equal
width. For practical convenience, the section of base arc for each slide should pass through
across only one soil type and the slice width have to small such that the curve base can be
approximated as a straight line.
Figure 2 below shows the free body diagram of the representative slices, serves as a basis for
arriving at an expression for determining a slope’s factor of safety.
Figure No 2. Free body diagram and mathematical approach for the Fellenius Method of Slices
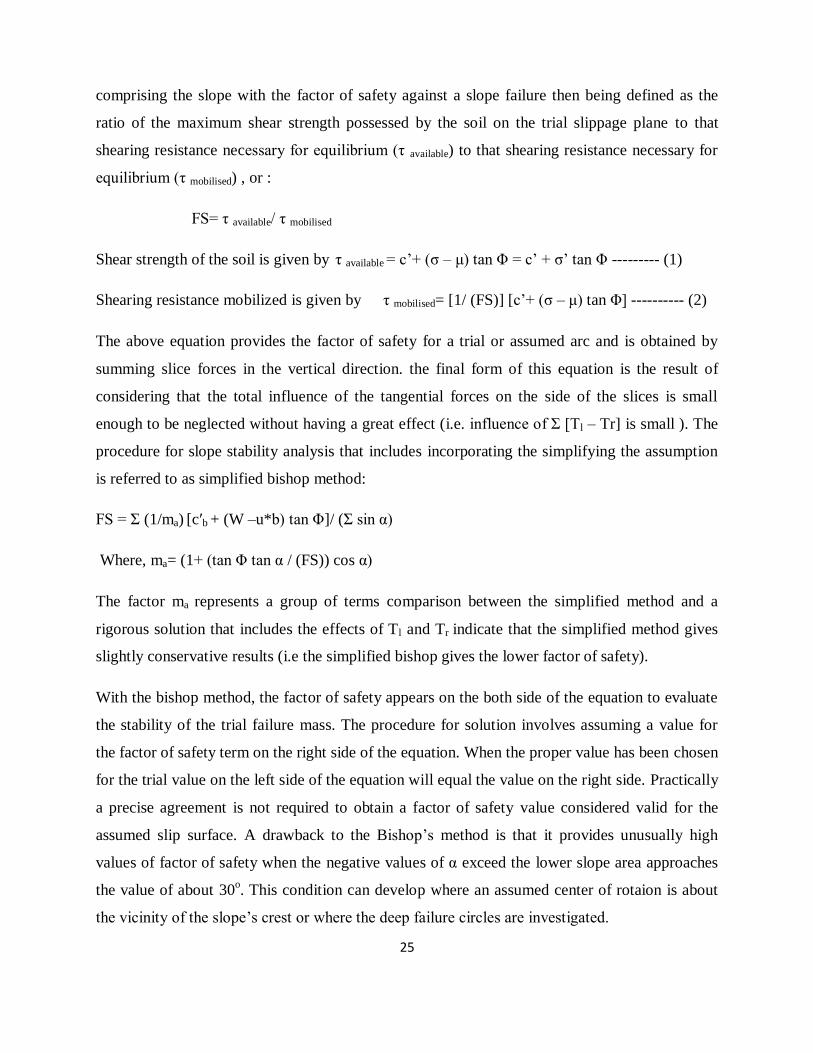
2.2.1.2 Bishop’s Method
A method presented by Bishop utilises method of slices and considers forces to be acting on each
slices, as shown in the figure. The requirements of equilibrium are applied to the slices
25
comprising the slope with the factor of safety against a slope failure then being defined as the
ratio of the maximum shear strength possessed by the soil on the trial slippage plane to that
shearing resistance necessary for equilibrium (τ available) to that shearing resistance necessary for
equilibrium (τ mobilised) , or :
FS= τ available/ τ mobilised
Shear strength of the soil is given by τ available = c’+ (σ – μ) tan Φ = c’ + σ’ tan Φ --------- (1)
Shearing resistance mobilized is given by τ mobilised= [1/ (FS)] [c’+ (σ – μ) tan Φ] ---------- (2)
The above equation provides the factor of safety for a trial or assumed arc and is obtained by
summing slice forces in the vertical direction. the final form of this equation is the result of
considering that the total influence of the tangential forces on the side of the slices is small
enough to be neglected without having a great effect (i.e. influence of Σ [Tl – Tr] is small ). The
procedure for slope stability analysis that includes incorporating the simplifying the assumption
is referred to as simplified bishop method:
FS = Σ (1/ma) [c′b + (W –u*b) tan Φ]/ (Σ sin α)
Where, ma= (1+ (tan Φ tan α / (FS)) cos α)
The factor ma represents a group of terms comparison between the simplified method and a
rigorous solution that includes the effects of Tl and Tr indicate that the simplified method gives
slightly conservative results (i.e the simplified bishop gives the lower factor of safety).
With the bishop method, the factor of safety appears on the both side of the equation to evaluate
the stability of the trial failure mass. The procedure for solution involves assuming a value for
the factor of safety term on the right side of the equation. When the proper value has been chosen
for the trial value on the left side of the equation will equal the value on the right side. Practically
a precise agreement is not required to obtain a factor of safety value considered valid for the
assumed slip surface. A drawback to the Bishop’s method is that it provides unusually high
values of factor of safety when the negative values of α exceed the lower slope area approaches
the value of about 30o. This condition can develop where an assumed center of rotaion is about
the vicinity of the slope’s crest or where the deep failure circles are investigated.
26
+α
-α
Figure No 3. A slope showing how the circular failure analysis in bishop’s method is done.
2.2.1.3 Other methods of circular arc analysis
A number of investigations have been developed regarding analytical procedures for slope
analyses that are similar in basic approach to the bishop method but differ in handling the inter-
slice forces. The two works that are widely referred to are the work of Spencer and Morgenstern-
price. The Spencer’s analysis assumes that the forces on the sides are parallel. The Morgenstern-
price analysis imposes a normal shear and shear forces on the slice sides and also includes the
water pressure effects. Both methods satisfy the requirements of equilibrium in regard to the
forces and moments that act on the slice. Slope stability evaluations utilizing the mathematically
rigorous Spencer and Morgenstern-Price methods retains a practical importance for performing
independent checks on the results from complex programs, for use when computer is not
available, and for preliminary evaluations or routine checks to determine if a slope requires a
regular study.
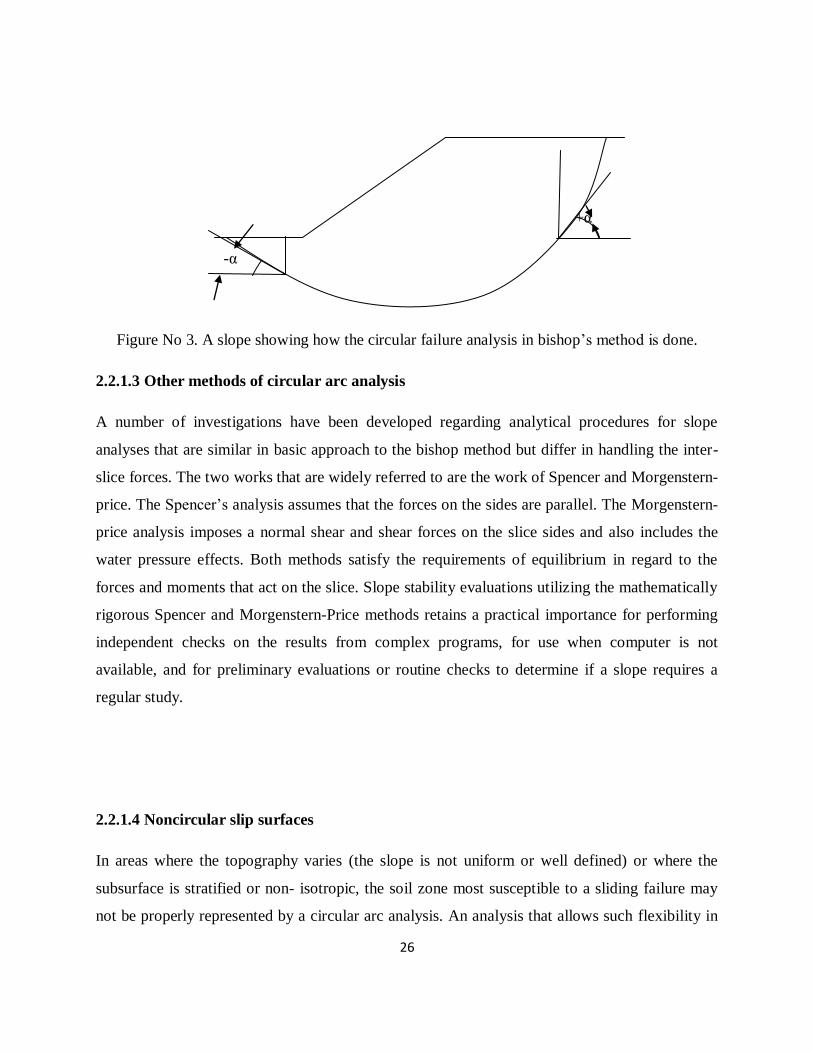
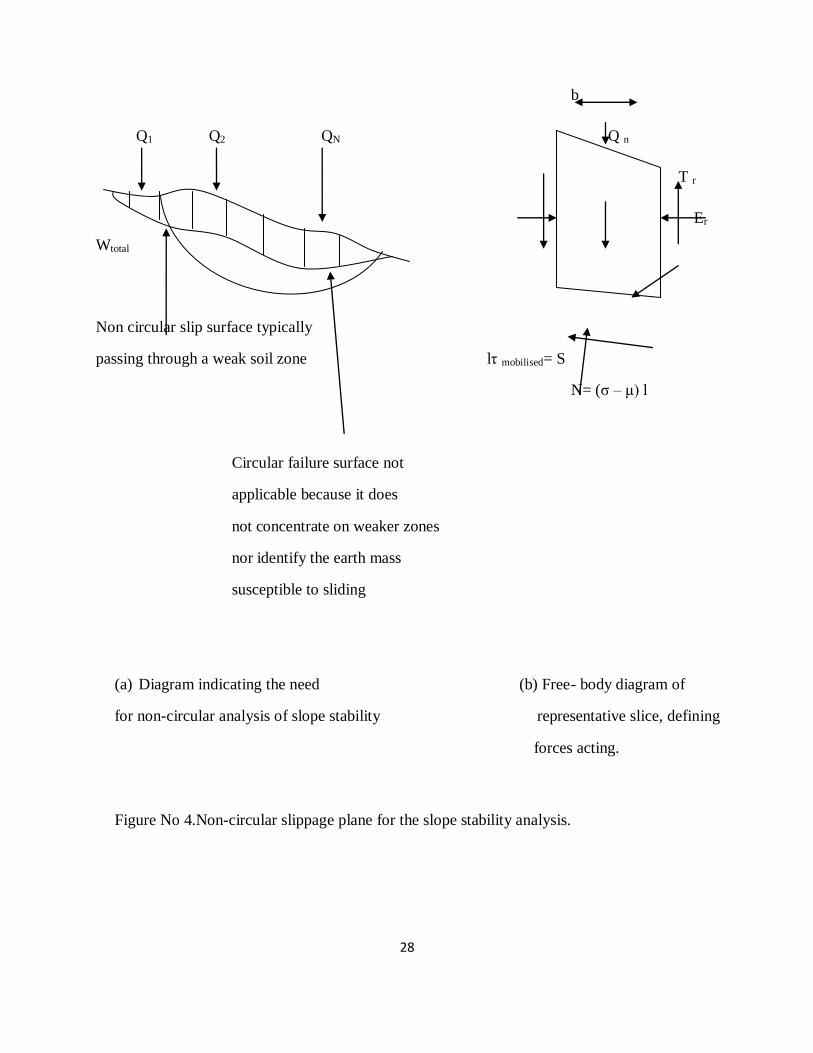
2.2.1.4 Noncircular slip surfaces
In areas where the topography varies (the slope is not uniform or well defined) or where the
subsurface is stratified or non- isotropic, the soil zone most susceptible to a sliding failure may
not be properly represented by a circular arc analysis. An analysis that allows such flexibility in
27
locating the plane of failure is required. The Spencer and the Morgenstern-price methods referred
for the circular slips can also be used for the non-circular slip but need a solution by a computer.
A generalized method for the analysis of the non- circular slip surface advanced by janbu is for
the computer solution, but the method is also adaptable for the hand calculated solutions when
the simplified procedure is utilized. The Janbu method assumes that the forces acting on each of
the slice will be as shown in the figure. By applying the requirements of the moment equilibrium
and force equilibrium in the vertical and the horizontal directions to each slice and imposing the
necessary equilibrium in the horizontal and the vertical directions to each slice and imposing the
necessary equilibrium in the horizontal direction to the entire assumed failure mass, an
expression for slope factor of safety is written:
FS= Σ (br sec2 α)/ (Σ [W + (Tl – Tr)] tan α)
28
b
Q1 Q2 QN Q n
T r
Er
Wtotal
Non circular slip surface typically
passing through a weak soil zone lτ mobilised= S
N= (σ – μ) l
Circular failure surface not
applicable because it does
not concentrate on weaker zones
nor identify the earth mass
susceptible to sliding
(a) Diagram indicating the need (b) Free- body diagram of
for non-circular analysis of slope stability representative slice, defining
forces acting.
Figure No 4.Non-circular slippage plane for the slope stability analysis.
29
The FS term appears on the both sides of the equation. Trail values are selected and as with the
bishop method, the factor of safety has been properly determined when the both sides are in
practical agreement.
2.2.1.5 Effect of the Tension Cracks
Tension cracks developing along the crest or face of a slope (a condition most commonly
anticipated where the cohesive soils exist) can influence the slope stability. In an analysis, zero soil
shearing resistance is assigned to the section of the slippage plane affected by the tension cracks. If
the tension cracks could be filled with water, a hydrostatic pressure distribution assumed to exist in
the crack, and this pressure continues to those forces and moments acting to cause slope
movement. Frequently, however tension cracks only have a minor influence on the slope’s
computed factor of safety, but these cracks may provide the opportunity for water to reach
otherwise buried earth layers whose strength may be weakened by such exposure, an effect
requiring consideration in the slope analysis.
2.2.1.6 Sliding block analysis
Natural earth slopes consisting of the stratified materials and earth embankment structures on the
constructed on the stratified soil foundations can experience failure due to sliding along one or
more of weaker layers. Failures of this type often occur when changed conditions in an area cause
susceptible layers to become exposed to, or saturated by, water. Exposure to moisture can cause
physical breakdown and weakening of some earth materials, such as fine grained sedimentary
deposits, and saturation may cause stratum’s shear strength to be reduced because of increased
pore water pressures.
Where the potential for the occurrence of a block slide is under study, the factor of safety with
regard to the shear strength of the soil on the assumed sliding plane is, with no pore pressure
effects on the block,
30
FS= (cL + (W cos α + E sin α) tan Φ)/ (w sin α + E cos α)
Where E can be approximated as 0.25γsoil Z2
for cohesion less soil and 0.5 γsoil Z2 for cohesive soil
if the formation of a tension crack along the top of the slope permits the development of water
pressure in the crack and the slippage zone, can be described as:
FS = (cL + (W cos α – Fu + Fw sin α) tan Φ) / (W sin α + Fw cos α)
Where Fw is the force due water pressures in the tension crack, equal to 0.5γwater Z2
water and Fu =
0.5γwater Water L.
Sections of soil embankments have known to fail by translation along a weak foundation zone or
layer, the force responsible for movement responsible for movement resulting from lateral soil
pressure developed within the embankment itself. In the case of the earth dams, the zone of the
slippage may develop only after the dam has impounded water for a period, with seepage through
the eventual slippage zone being responsible for weakening to the extent that a failure can occur.
The upstream as well as the downstream zones could be studied for stability. though the effect of
water on the upstream embankment increases the weight W , and the lateral pressure of the
impounded water for a period oppose block translation the uplift force is considerably greater for
upstream zones. As with other categories of sliding failures, determine the size and location of the
section most susceptible to movement is typically a trial and error procedure, because the most
critical zone is not always obvious.
31
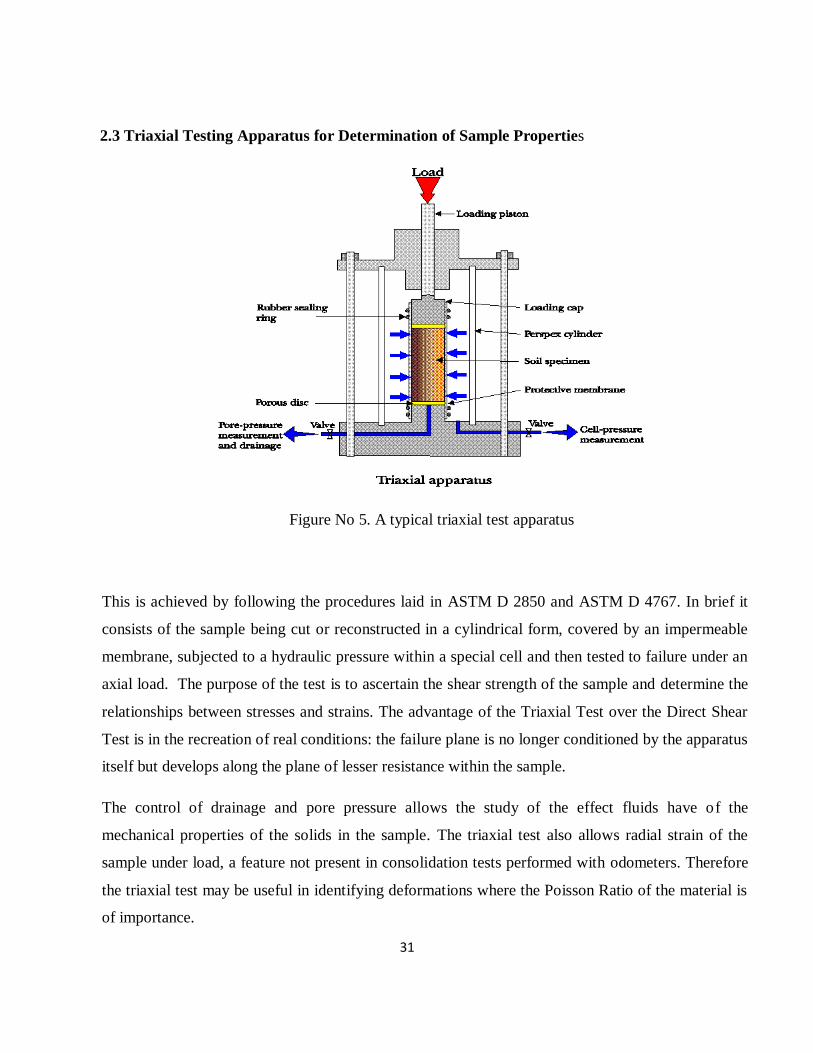
2.3 Triaxial Testing Apparatus for Determination of Sample Properties
Figure No 5. A typical triaxial test apparatus
This is achieved by following the procedures laid in ASTM D 2850 and ASTM D 4767. In brief it
consists of the sample being cut or reconstructed in a cylindrical form, covered by an impermeable
membrane, subjected to a hydraulic pressure within a special cell and then tested to failure under an
axial load. The purpose of the test is to ascertain the shear strength of the sample and determine the
relationships between stresses and strains. The advantage of the Triaxial Test over the Direct Shear
Test is in the recreation of real conditions: the failure plane is no longer conditioned by the apparatus
itself but develops along the plane of lesser resistance within the sample.
The control of drainage and pore pressure allows the study of the effect fluids have of the
mechanical properties of the solids in the sample. The triaxial test also allows radial strain of the
sample under load, a feature not present in consolidation tests performed with odometers. Therefore
the triaxial test may be useful in identifying deformations where the Poisson Ratio of the material is
of importance.
32
2.3.1.1 Composition of the Apparatus
The Triaxial Test Apparatus may be composed in various ways, in order to ensure the most rational
choice of component parts we recommend that the following guide is followed step by step so as to
identify the apparatus which most fully satisfies all tests likely to be encountered.
2.3.1.2 Sample Dimensions
The most frequent sample diameter is 38.1 mm (1.5 inch). Larger diameters may be necessary if the
sample contains coarse grains. Small diameter samples are preferred with fine grained soils so as to
reduce the time needed for drainage and consolidation.
2.3.1.3 Sample Preparation
Samples of cohesive soil are normally taken from undisturbed specimens by either boring or turning
on a lathe. The former method is acceptable in soils of medium consistency whilst the latter is
preferred for soft or hard material. With the boring method, as well as a Sampling Tube of suitable
diameter with relative accessories, it is advisable to have a Hand Extruder to extrude the sample
from the tube. A special Electric Lathe is available for turning samples to the required diameter.
Naturally, the lathe must be equipped with Support Platens of the same diameter as that of the
required sample. Once the sample has been turned or bored it can be cut to its correct length (two
times its diameter) with level and parallel faces by placing it in a Two-Part Split Mould and
trimming the ends with a trimming knife or wire saw. To reconstruct sand samples a Three-Part
Split Former of suitable diameter is used.
2.3.1.4 ELEMENTS USED WITHIN THE TRIAXIAL CELL
The Triaxial Test may be programmed so as to allow or exclude the hydraulic connection between
the inside of the sample with the ambient outside the triaxial cell or with special measuring
instruments. Such connections require the use of special drainage mediums around the sample, in
particular: Porous Discs on the top and bottom of the sample and Filter Drains around its sides.
However, if the sample must be isolated, the bottom porous disc is replaced by an impermeable Base
Disc whilst the upper porous disc is removed. In each case the sample is placed on a Pedestal and a
33
Top Cap is placed on top of the sample. These elements will have the same diameter as the sample.
To isolate the sample from the water within the triaxial cell, it is covered with a very thin Membrane
made of natural rubber (of appropriate diameter) which is placed over the sample using a Suction
Membrane Stretcher and a water-tight fit is guaranteed at the junction with the pedestal and top cap
by using Sealing Rings of appropriate diameter.
2.3.2 TRIAXIAL CELLS
The triaxial cell is a water-tight container with hydraulic connections at the base and sliding load
piston in the top. The cell can be readily opened to allow the positioning of samples and cell
accessories. The pedestal on which the sample sits is interchangeable with pedestals of different
diameter provided that these are compatible with the cell itself. Three different cell sizes are
available; the choice of cell is determined by the size of sample to be tested. The Triaxial Apparatus
may include one or more cells (normally three). Multiple cell system is justified inasmuch that a
complete Triaxial Test normally requires three samples to be tested under different confining
pressures. Therefore, considerable time savings can be achieved by using three cells in series,
particularly if the test includes sample saturation and long consolidation times before the samples are
subjected to axial loading.
2.3.3 CONSTANT PRESSURE SOURCES
Normally, the confining pressure around the sample is furnished by pressurised water, thus the
triaxial cell must be connected to a system capable of providing pressurized water. This system must
also be capable of compensating for eventual volume changes of the sample by providing or
receiving the corresponding volume of water without change in water pressure. The system must
also be capable of controlling the water pressure to a high degree of accuracy. These systems are
commonly known as Constant Pressure Sources and are available in various forms based on different
working principles and thus have differing characteristics.
The Bladder Air-Water System more modern and efficient. This system envisages the use of a
normal Air Compressor and an Interface Cylinder where a thin rubber membrane separates the air
and water and prevents their mixture whilst allowing both mediums to maintain equal pressures.

34
The pressure is controlled by a special valve on the compressed air feed line, whilst it is read by a
Manometer on the line of compressed water. The accuracy and response of this system depends upon
the quality of the pressure regulating valve; long term reliability is achieved by ensuring the supply
of clean dry air to the valve, therefore it is advisable to provide an Air Filter and Dehumidifier
with Refrigerator Cycle to the air supply line.
The advantages of the Bladder Air-Water system are many; it is compact, extremely easy to use,
readily expandable, and able to compensate for large volume changes. It should be noted that long
interruptions to electric mains supply can cause problems to this system; indeed if the tank of the
compressor is allowed to discharge there will inevitably be a decompression of the system as a
whole. A simple and economic pressure source is provided by the Air-Water Cylinder and Foot
Pump System. In reality this system should not be considered as a serious alternative to the afore-
mentioned system due to the fact that its limited capacity of compensation demands frequent
adjustments to be made by the operator. However, this system may prove valid if only rapid tests are
to be performed (Unconsolidated, Undrained). The apparatus consists of an Air-Water Cylinder
which acts in the same way as an autoclave, a Foot Pump to pressurize the cylinder, a Pressure
Gauge with relative mounting Bracket and Clamp and a set of Flexible Nylon Hoses for
connection to the triaxial cell. The number of independent constant pressure sources required in a
triaxial system may vary and will depend upon the number of triaxial cells in use, the type of tests to
be performed, the degree of flexibility of the system and the amount of money to be invested.
In all cases each cell will require at least one independent constant pressure source to pressurise the
water which surrounds the sample in the triaxial cell.
However, it is advisable to provide the cell with a second independent pressure source so as to
furnish back pressure. In a relatively modest system with limited flexibility, one source of back
pressure may be sufficient, this being connected to each cell as the need arises. More refined systems
will require separate back pressure sources for each cell in use. The need for back pressure is due to
the frequent necessity to saturate samples and eliminate even the smallest air bubbles trapped within
the hydraulic circuit connected to the inside of the sample. In practice the technique used is to
increase the back pressure and cell pressure appropriately so as to force any air to dissolve into the
water without creating a difference in pressure between the inside and outside of the membrane
35
surrounding the sample. In this way it is possible to saturate the sample without giving act to the
consolidation of the sample itself. Once saturation has been achieved variations in pore pressure may
be accurately monitored during the axial loading of undrained tests, thus providing data for the
correct interpretation of the test. Naturally, back pressure should not be provided by the air-water
cylinder and foot pump system because the process of air dissolving into the water will occur within
the cylinder and not where it is necessary, that is within the sample.
2.3.4 LOAD FRAME
Once the operations of hydraulic pressurisation and consolidation have been completed, the triaxial
cell is placed under a Load Frame which has the function of applying an increasing axial load on the
sample up to sample failure. The characteristics of the load frame are very demanding unless only
rapid tests (unconsolidated, undrained) are to be made. In fact, the increase in strain in certain slow
tests is minimal and expressed in terms of micro-meters per minute. On the other hand, it is
necessary to be able to regulate the rate of strain applied to the sample within a very large range and,
ideally, fully variable so as to allow the correct selection of strain for each particular test. Another
requisite of the load frame is the accuracy and continuity of strain rate independently of the forces
encountered. The load frame should be selected in function of the maximum load force required
which in turn will depend upon the consistency of the material to be tested and sample diameter. A
10 kN Load Frame is more than sufficient for 1.5” samples. The 50 kN Load Frame is recommended
for larger diameter samples or if the load frame is to be used for other laboratory tests (e.g. C.B.R.).
The 100 kN Load Frame is used for large triaxial cells and special tests. Three-place version (50 kN)
is particularly interesting: it allows simultaneous testing of 3 samples, thus saving time.
2.3.4 MEASURING INSTRUMENTS
Instruments for measuring load and axial strain will need to be applied to the load frame; if analog
readings are sufficient for these two parameters then normally a Load Ring and Dial Gauge are used.
If digital readings are required, Electronic Sensors described elsewhere in this catalogue are used.
The capacity of the load measuring instrument should be compatible with the loads to be measured
which will depend upon the resistance and diameter of the sample. It may well be necessary to
purchase various capacity load measuring instruments.
36
As a general rule, if only 1.5” samples are to be tested, a load measuring instrument with a capacity
of 200 kgf is normally sufficient. The travel of the axial strain measuring instrument is also
dependent on the diameter of the sample and should not be less than 20% of said diameter.
Other measuring instruments may be connected to the triaxial cell, these include:
Pressure Sensors
Volume Change Sensors
The former are used to measure pore pressure during sample saturation and during axial loading in
undrained tests. The latter are used to measure volume changes of the sample during consolidation or
during axial loading in drained tests. For rapid unconsolidated undrained tests on clay samples these
instruments are not normally used. In the past, pressure measurements were normally made within
instruments known as “Null Indicators” which consisted of small transparent siphons containing
mercury. One side of the null indicator is connected to the triaxial cell whilst the other side is
connected to manometers and a volumetric pump.
This pump is used to form a back pressure to equalise the pressure from the triaxial cell, the correct
pressure is that which keeps the mercury in the correct position within the siphon, the resultant back
pressure, which equals the pore pressure, is read on the manometers. In practice the use of this
instrument demands great care and lack of attention by the operator or misuse can easily lead to the
loss of important test data and the annulment of the test. For this reason, nowadays preference is
given to Electronic Pressure Transducers connected to Digital Displays. The transducer is fitted to
the triaxial cell via a De-airing Block, and the pressure is expressed in engineering units directly on
the display. When the triaxial apparatus is connected to a Data Acquisition System, the use of these
electronic transducers is compulsory. The number of transducers necessary is normally one per each
cell in use; however one transducer with relative de-airing block may be transferred from one cell to
another.
37
2.4 COMPUTER APPLICATIONS IN SLOPE STABILITY ANALYSIS
2.4.1 Introduction
As computer applications are gradually become common in many fields, engineers also keep track to
take advantage of computer to solve engineering problems. There are several advantages of using
computerized solution for engineering problems, there are as below:
The amount of time to perform an analysis can be greatly reduced.
Computer solutions can be more detailed than hand calculations. Performing a solution
manually often requires many simplifying assumptions.
The solution process may be less error-prone. For example, unit conversion and the rewriting
of equations to solve for any variable, where hand calculation often tend to have mistakes,
while a well-tested computer program can be avoid these error.
The solution is easily documented and reproducible.
Because of the speed and accuracy of a computer model, more comparisons and design trials
can be performed in less time than a single computation done by hand. This results in the
exploration of more options, which eventually leads to better and more efficient designs.
This part of literature review presents the review of several on the shelf software for slope stability
analysis. There are Slope/w and T/slope.
2.4.2 Slope/w Software
Slope/W is the leading software product that used for computing the factor of safety of earth and
rock slopes. With Slope/W, engineer can analyze both simple and complex problems for a variety of
slop surface shape, pore-water pressure conditions, soil properties, analysis methods and loading
conditions. Besides that, by using limit equilibrium, Slope/W can model heterogeneous soil types,
complex stratigraphic and slip surface geometry, and variable pore-water pressure condition using a
large selection of soil models. Analyses can be performed using deterministic or probabilistic input
parameters. Stresses computed by a finite element stress analysis may be used in addition to the limit
equilibrium computation for the most complete slope stability analysis available.
38
2.4.3 T/Slope
T/Slope is an easy-to-use program that helps civil engineers with the slope stability analysis. This
software is designed for limit equilibrium slope stability analyses of noncircular slip surfaces by
either the Spencer or Morgenstern and Price Method. In order to start analysis, the user only needs to
specify the potential slip surface and soil properties along that slip surface, than the program will
search for the critical seismic coefficient in which this seismic coefficient is reduces the factor of
safety to unity.
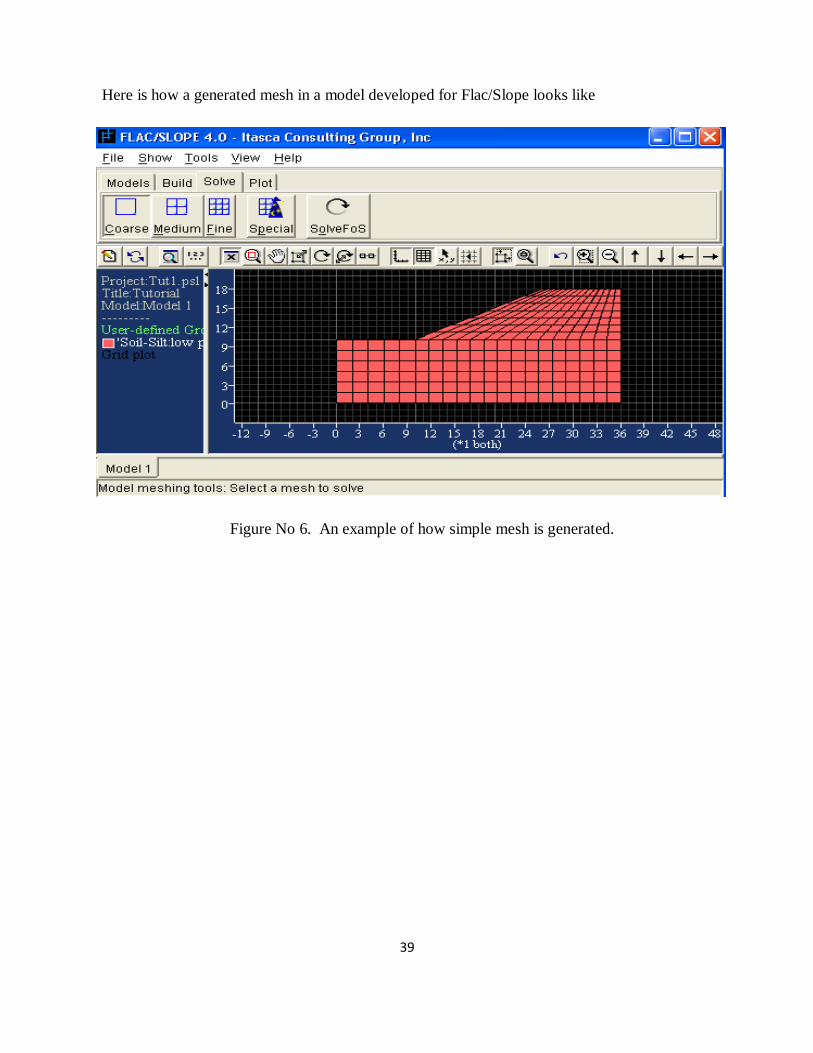
2.4.4 Overview of FLAC/SLOPE
FLAC/SLOPE is a program that designed specifically to perform factor of safety calculation for
slope stability analysis. This program is a mini version of FLAC and operated entirely from FLAC’s
graphical interface (the GIIC). It also provides rapid creation of model for soil and/or rock slope and
solution of their stability condition.
FLAC/SLOPE also provides a full solution of the coupled stress/displacement, equilibrium and
constitutive equation. Given slope geometry and a set of material properties, the system is
determined to be stable or unstable. By automatically performing a series of calculations with
different properties, the factor of safety is found corresponding to the point of instability and the
critical failure surface can be located.
39
Here is how a generated mesh in a model developed for Flac/Slope looks like
Figure No 6. An example of how simple mesh is generated.
40
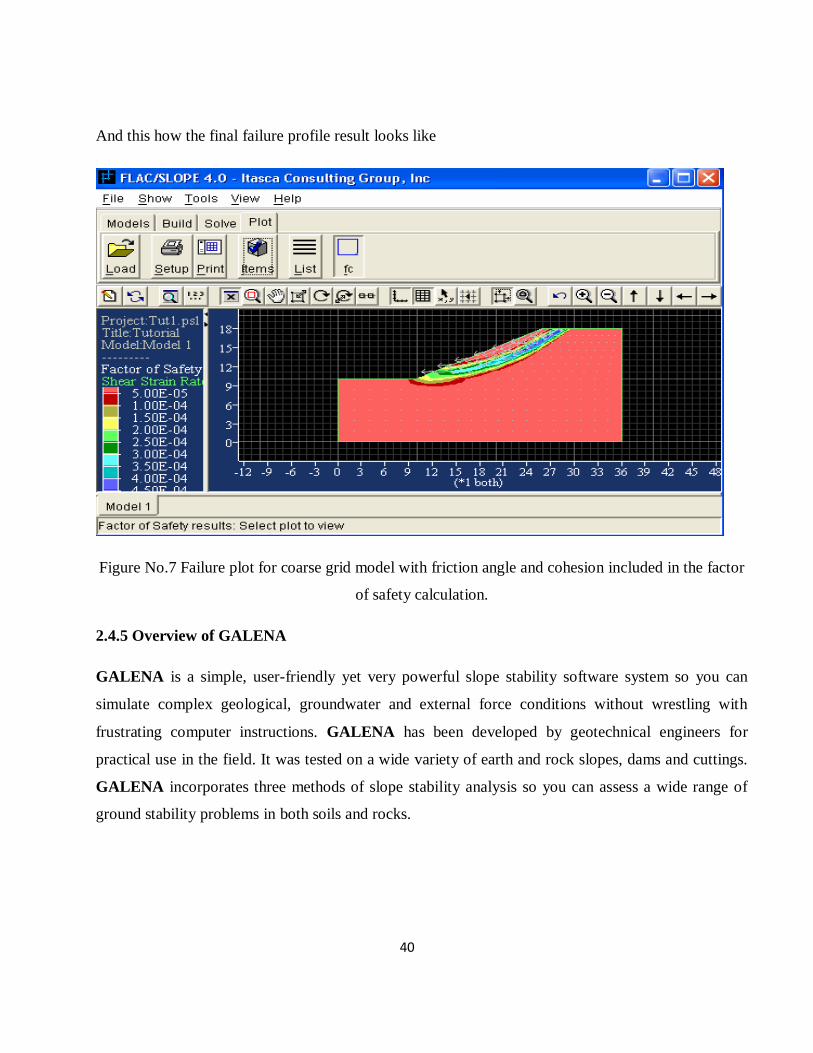
And this how the final failure profile result looks like
Figure No.7 Failure plot for coarse grid model with friction angle and cohesion included in the factor
of safety calculation.
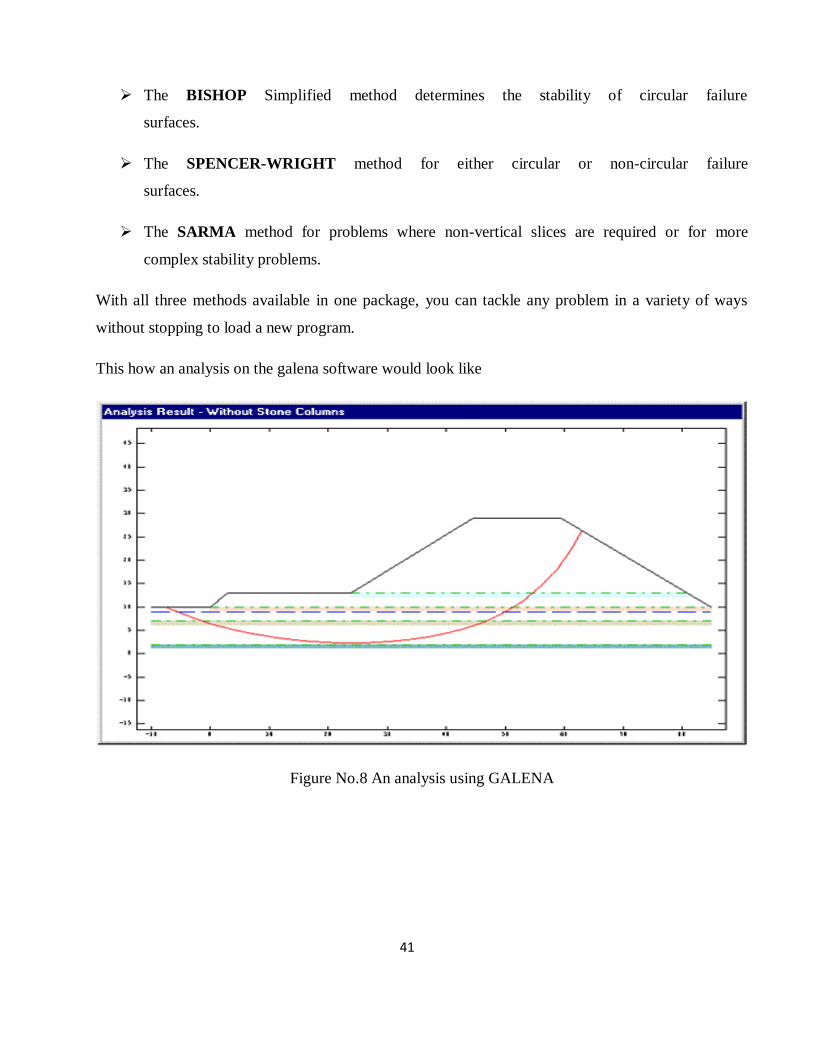
2.4.5 Overview of GALENA
GALENA is a simple, user-friendly yet very powerful slope stability software system so you can
simulate complex geological, groundwater and external force conditions without wrestling with
frustrating computer instructions. GALENA has been developed by geotechnical engineers for
practical use in the field. It was tested on a wide variety of earth and rock slopes, dams and cuttings.
GALENA incorporates three methods of slope stability analysis so you can assess a wide range of
ground stability problems in both soils and rocks.
41
The BISHOP Simplified method determines the stability of circular failure
surfaces.
The SPENCER-WRIGHT method for either circular or non-circular failure
surfaces.
The SARMA method for problems where non-vertical slices are required or for more
complex stability problems.
With all three methods available in one package, you can tackle any problem in a variety of ways
without stopping to load a new program.
This how an analysis on the galena software would look like
Figure No.8 An analysis using GALENA
42
CHAPTER: 03
MATERIALS AND METHODS
Data Collection
Data Analysis
43
CHAPTER 3
3.0 MATERIALS AND METHODS
3.1 Data Collection
The objective of the investigation was to stabilize the dump slope so that it facilitates safe operations.
The typical analysis ingredients are cohesion, angle of internal friction and density. These data
represent the engineering properties of the area under investigation. In this study pertinent data from
the area were so collected that they represent the whole area. The samples were taken from 32
locations. Samples were collected so as to represent the worst environmental conditions i.e. rainy and
summer season when the moisture % keeps on varying. This affects the stability of the dumps. The
samples were taken at about depth of 3 mts from the surface of the dumps. Firstly, a cylindrical
structure is hammered into the surface up to the stipulated depth and then the container with soil
sample was carefully taken out, immediately packed into a plastic gunny bag so as to avoid
interference of atmospheric conditions and brought to the laboratory. It was ensured that the sample
preserved its virgin state.
In the laboratory the triaxial tests are carried out on the samples and then the important parameters
such as cohesion and angle of internal friction are analyzed from these tests. The density and the
moisture contents are also calculated. These values are grouped into dry values (devoid of moisture),
and saturated values (containing moisture). The analysis is done separately for the dry and the
saturated samples as the moisture causes reduction in the strength and that factor of safety has to be
studied.
3.2 Data Analysis
There are many dedicated softwares available for the analysis of the slope stability. But two of the
more acclaimed softwares in this field were used i.e. GALENA and FLAC/Slope for the analysis of
the various sections. Flac/Slope was more useful taking into account the overall stability. The
GALENA was more useful taking into account individual bench stability as well non- homogeneous
terrain.

44
FLAC/Slope gives the flexibility in choosing the various modes of failure like the Mohr-Coulomb
failure, Hoek and Brown Failure, whereas the GALENA is flexible in choosing the type of analysis
that has to be taken i.e. bishop’s method, Spencer’s method, Sarma’s method.
Both these softwares were used simultaneously for analysis and the results were obtained.

45
CHAPTER: 04
TEST RESULTS AND DISCUSSIONS
46
CHAPTER 4
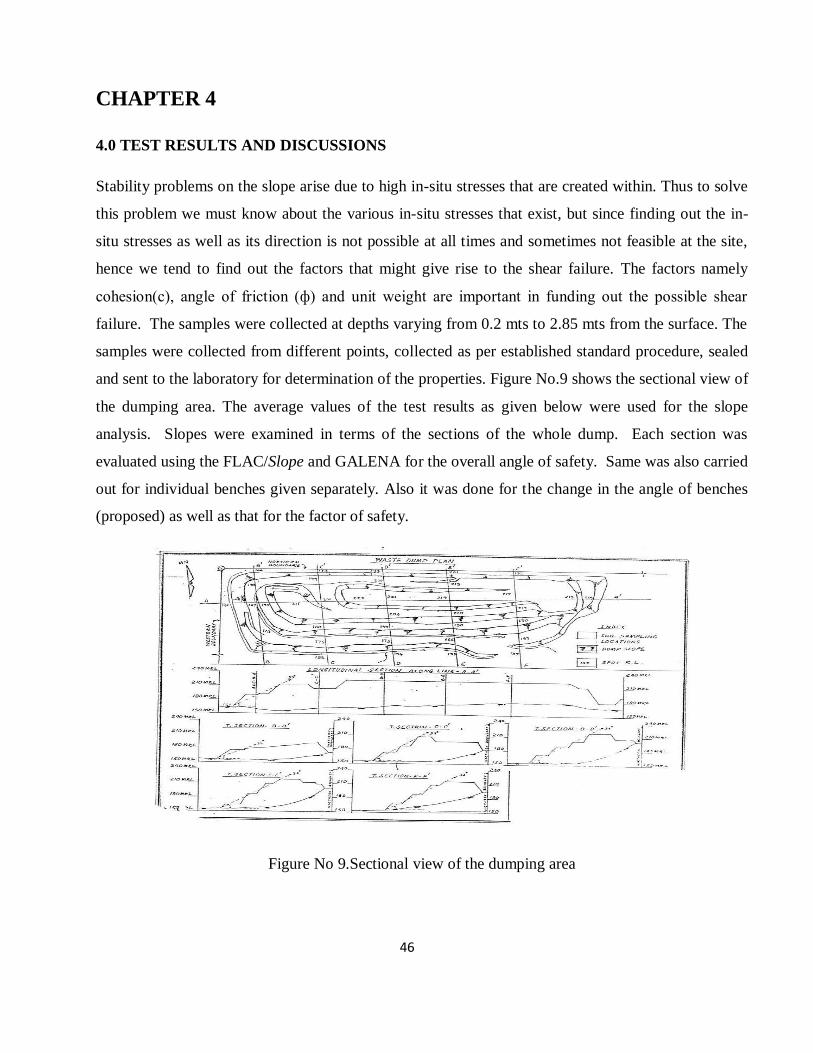
4.0 TEST RESULTS AND DISCUSSIONS
Stability problems on the slope arise due to high in-situ stresses that are created within. Thus to solve
this problem we must know about the various in-situ stresses that exist, but since finding out the in-
situ stresses as well as its direction is not possible at all times and sometimes not feasible at the site,
hence we tend to find out the factors that might give rise to the shear failure. The factors namely
cohesion(c), angle of friction (ф) and unit weight are important in funding out the possible shear
failure. The samples were collected at depths varying from 0.2 mts to 2.85 mts from the surface. The
samples were collected from different points, collected as per established standard procedure, sealed
and sent to the laboratory for determination of the properties. Figure No.9 shows the sectional view of
the dumping area. The average values of the test results as given below were used for the slope
analysis. Slopes were examined in terms of the sections of the whole dump. Each section was
evaluated using the FLAC/Slope and GALENA for the overall angle of safety. Same was also carried
out for individual benches given separately. Also it was done for the change in the angle of benches
(proposed) as well as that for the factor of safety.
Figure No 9.Sectional view of the dumping area

47
.
Figure No 10.The view of the slope at the waste dump (water seepage related sliding observed at few
locations)
Analyses were also carried out using the least values regarding the maximum height, no of benches
and slope of the individual bench. Bench height was taken to be 30 mts. in the proposed design. It
was found out that the factor of safety for the current sections were in the range of 1.75 to 2.0. And
the factor of safety for the average values of material properties with the proposed dimension would
be in the range 1.3 to 1.6.
The values of the dry and the wet samples after the analysis were as follows:
Drained Samples:
c= 46.3 kN/m2, Ø= 31.48, ρ= 1578.48 kg/ m2
Saturated/ Undrained Samples :
c= 11.9 kN/m2, Ø= 16.6, ρ= 2077 kg/ m
2

48
Table No.1 Material properties at various sample points as determined in laboratory
Sl. No Section Density
(kg/m3)
Cohesion(c)
(Pa)
Internal friction Angle (ф)
I A-A′ 1480 30000 32.7
1400 70000 33.6
II B-B′ 1470 76000 23.6
1710 91000 31.7
1590 64000 33.9
The figure numbers give the details of the analysis done using the software FLAC/slope. The various
zones marked with different colors symbolise surfaces that are weak and are prone to failure.
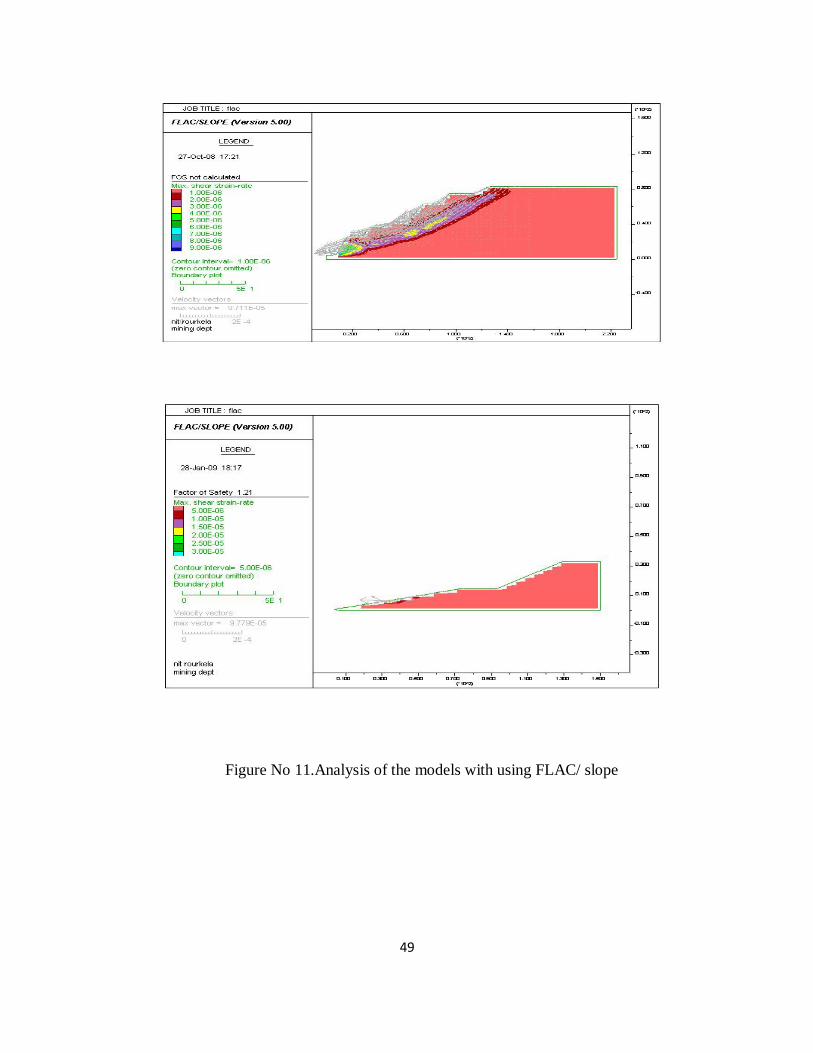
49
Figure No 11.Analysis of the models with using FLAC/ slope
50
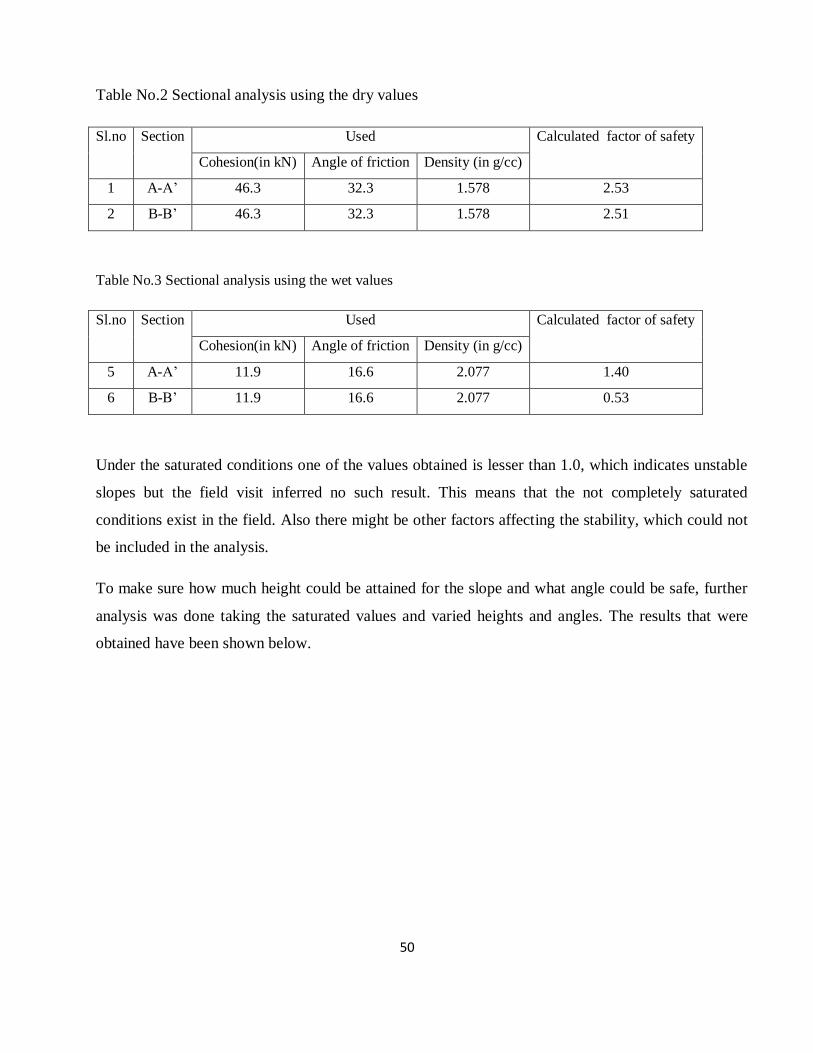
Table No.2 Sectional analysis using the dry values
Sl.no Section Used Calculated factor of safety
Cohesion(in kN) Angle of friction Density (in g/cc)
1 A-A’ 46.3 32.3 1.578 2.53
2 B-B’ 46.3 32.3 1.578 2.51
Table No.3 Sectional analysis using the wet values
Sl.no Section Used Calculated factor of safety
Cohesion(in kN) Angle of friction Density (in g/cc)
5 A-A’ 11.9 16.6 2.077 1.40
6 B-B’ 11.9 16.6 2.077 0.53
Under the saturated conditions one of the values obtained is lesser than 1.0, which indicates unstable
slopes but the field visit inferred no such result. This means that the not completely saturated
conditions exist in the field. Also there might be other factors affecting the stability, which could not
be included in the analysis.
To make sure how much height could be attained for the slope and what angle could be safe, further
analysis was done taking the saturated values and varied heights and angles. The results that were
obtained have been shown below.
51
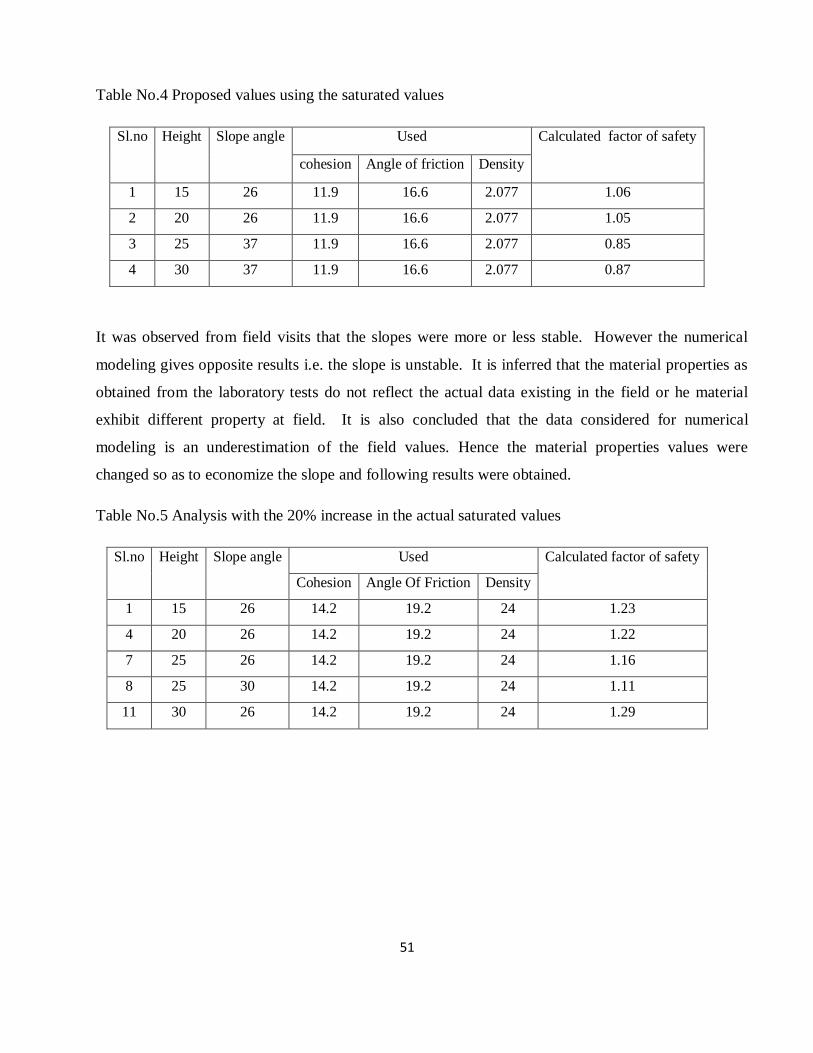
Table No.4 Proposed values using the saturated values
Sl.no Height Slope angle Used Calculated factor of safety
cohesion Angle of friction Density
1 15 26 11.9 16.6 2.077 1.06
2 20 26 11.9 16.6 2.077 1.05
3 25 37 11.9 16.6 2.077 0.85
4 30 37 11.9 16.6 2.077 0.87
It was observed from field visits that the slopes were more or less stable. However the numerical
modeling gives opposite results i.e. the slope is unstable. It is inferred that the material properties as
obtained from the laboratory tests do not reflect the actual data existing in the field or he material
exhibit different property at field. It is also concluded that the data considered for numerical
modeling is an underestimation of the field values. Hence the material properties values were
changed so as to economize the slope and following results were obtained.
Table No.5 Analysis with the 20% increase in the actual saturated values
Sl.no Height Slope angle Used Calculated factor of safety
Cohesion Angle Of Friction Density
1 15 26 14.2 19.2 24 1.23
4 20 26 14.2 19.2 24 1.22
7 25 26 14.2 19.2 24 1.16
8 25 30 14.2 19.2 24 1.11
11 30 26 14.2 19.2 24 1.29
52
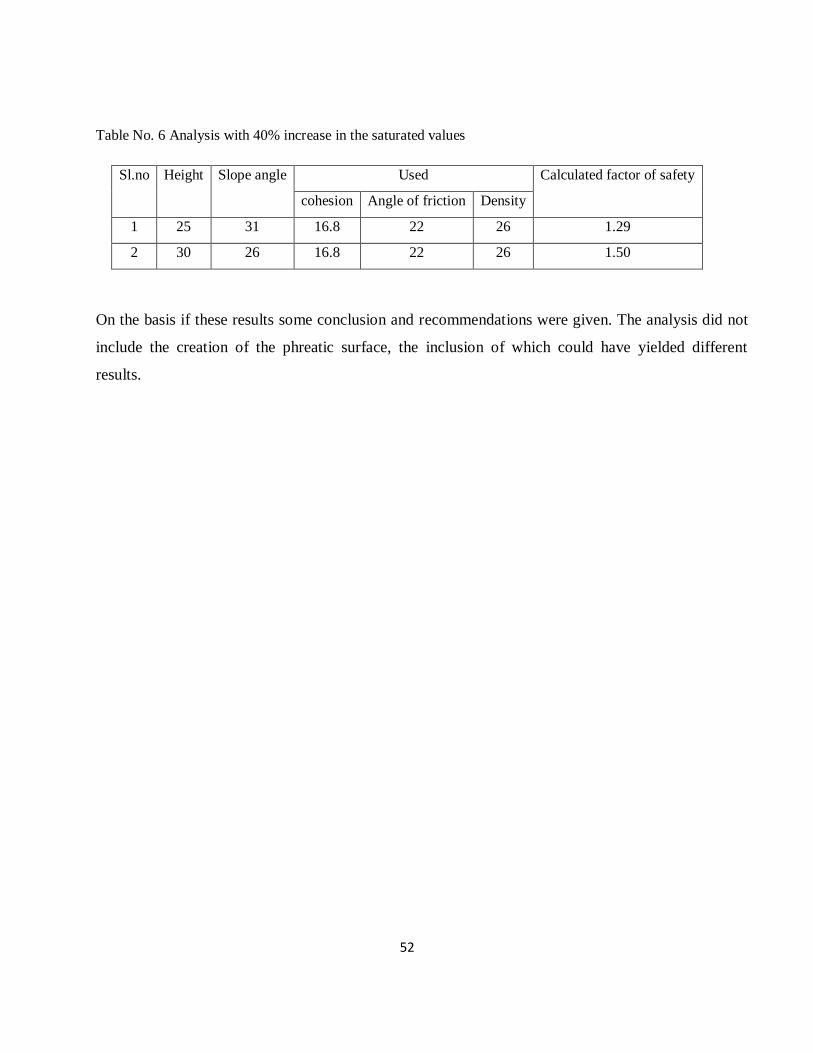
Table No. 6 Analysis with 40% increase in the saturated values
Sl.no Height Slope angle Used Calculated factor of safety
cohesion Angle of friction Density
1 25 31 16.8 22 26 1.29
2 30 26 16.8 22 26 1.50
On the basis if these results some conclusion and recommendations were given. The analysis did not
include the creation of the phreatic surface, the inclusion of which could have yielded different
results.
53
CHAPTER: 05
CONCLUSION AND RECOMMENDATION
Conclusion
Recommendation
54
CHAPTER 5
CONCLUSION AND RECOMMENDATIONS
5.1 Conclusion
Based on the various analyses available following recommendations have been made to ensure
stability of the slope
a) The slope of the existing dumping yard do not exhibit any major failure except in cases where
water seepage or presence of boulders. Those cases are also observed to be at a few locations
and do not cover a large area.
b) The existing slope have safety factor in the range of 1.75 to 2.00 with slope angles between
250 and 35
0.
c) The safety factor with the proposed angle of slope of 370 is 1.3.
5.2 Recommendation
In this investigation a few aspects of slope stability as slope of the bench, height of bench as well
as angle of internal friction, cohesion and density of the material has been determined. However
there are many factors that affect the slope stability such as ground water table, grain size of the
dumped material, etc. So it is strongly recommended that the following may be taken into
consideration in future.
a) The samples have not been taken to the complete depth; the samples have been taken just
from 3 mts depth and are not exact simulation of the field conditions.
b) Proper provisions have to be made to channelize the rain water by construction of the suitable
drains surrounding the dump yard.
c) The dumps have to be segregated properly i.e. according to the size of the disposed material.
The fines being dumped separately, and the boulders separately.
d) The inclusion of the phreatic surface should have been done.

55
e) Slope monitoring should be carried out regularly to predict the slope angle and height with
variation in material properties.
56
REFERENCES
Murthy, V.N.S, Principles of Soil Mechanics and Foundation Engineering, Fifth Edition,
UBS Publisher’s Ltd, 2001.
McCarthy, David F, Essentials of Soil Mechanics and Foundations, Pearson Prentice Hall
publication, pp 657-718, (2007).
Das, B. M, Principle of Geotechnical Engineering, (Fifth edition), Thompson Learning,
United State, (2002).
Itasca, FLAC/Slope User’s Guide, Itasca Consulting Group Inc, 2002
Stanciucu, Mihaela, Evaluation of waste embankment slope stability: Valea Manastirii, Gorj,
Romania, 2005.
Omraci, Kamel et.al, Stability analysis of lateritic waste deposits,2003
Tesarik D.R and McKibbin R.W, Material Properties Affecting the Stability of a 50-Year-Old
Rock Dump in an Active Mine, 2009.
Stead, Douglas et al, Developments in the analysis of footwall slopes in surface coal mining,
2007.
Kvalstad, J. Tore et al, Soil conditions and slope stability in the Ormen Lange area, 2007.