Embed Size (px)
Citation preview
J. Adv. Agric. Res. (Fac. Agric. Saba Basha)
ـــــــــــــــــــــــــــــــــــــــــــــــــــــــــــــــــــــــــــــــــــــــــــــــــــــــــــــــــــــــــــــــــــــــــــــــــــــــــــــــــــــــــــــ 382 Vol. 24 (3), 2019
Evaluation of Some Clones Derived from Two Sweet Potato Cultivars Under Water Deficit Conditions
Mohamed O. E. Gharib1, Aly I. A. Abido2, G. Abdel-Nasser3, Sameh A. M. Moussa4, Mona M.Yousry2
1Postgraduate student 2 Plant Production Dept., Faculty of Agric., Saba Basha, Alexandria Univ.
3Soil and Agricultural Chemistry Dept., Faculty of Agric., Saba Basha, Alexandria Univ. 4Potato and Vegetative Reproduction Res. Dept., Horticulture Res. Inst., ARC.
ABSTRACT: Sweet potato (Ipomoea batatas, L.) is one of the root crops worldwide
especially developing countries as a popular staph food, but due to its highly heterozygosity as cross-pollinated crop wherein many of its traits exhibit constant variation. Also, sweet potato is sensitive to water deficits especially during its formation stage including vine development and storage root induction. Therefore, this study was undertaken in corporation between El-Sabaheya Horticultural Research Station and the Experimental and Research Farm of The Faculty of Agriculture (Saba-Basha), Alexandria University, Alexandria governorate, Egypt, to develop distinct sweet clones. Stem cuttings of both Abees and Mabrouka cultivars were exposed to gamma ray radiation or immersed in colchicine or sodium azide solutions. 8 promising clones were selected to be evaluated under water deficit conditions in two field trials in comparison with their mother plants during the summer seasons of 2017 and 2018. Four irrigation levels (100, 75, 50 and 25% of ET0) were applied. The gained results revealed that the best results for the vegetative growth characters were achieved with the treatment of 100 % of evapotranspiration, except for number of main branches / plant which possessed the highest mean values with the treatment 25 % of evapotranspiration. Tuber root yield character and its component traits were significantly affected by both studied variables (sweet potato genotypes and irrigation levels). As for the main effect of irrigation levels on tuber root yield/feddan and its component characters, there are significant and direct proportional relationship between the independent variable (irrigation levels) and dependent one (studied traits).The highest average values for tuber root yield/feddan were scored at 100 % of irrigation level during the two seasons, followed with the treatment 75 % of irrigation level; while 25 % of irrigation treatment possessed the lowest mean values. The highest average values were recorded for marketable tuber root yield (%) were recorded at 100 % of irrigation level; while the lowest mean values were scored at 25 % of irrigation treatment. Carotene content and percentages of total sugar and starch were not significantly affected by different levels of irrigation from 100% down to 50% except for starch percentage during the second season. The obtained results, clearly demonstrated that there are large and mainly positive direct effects of both average tuber root weight (g) and number of tuber roots/plant on sweet potato yield (ton/fed.). In briefly, It is recommended to select clone A1 (It was developed as a mutation resulting from the exposure of Abees cv. to gamma ray) because it is characterized by a high productivity (ton / fed.) at 100% irrigation level or when there is a shortage of water supply (75% of evapotranspiration) compared with other tested sweet potato genotypes. Also, clone M1 (It was developed as a mutation resulting from immerging of Mabrouka cv. in colchicine solution) could be selected because of its high productivity, suitable for starch extraction, both when irrigation water is available or even when there is a shortage of irrigation water up to 75% of evapotranspiration. Clone M2 (It was developed as a mutation resulting from immerging of Mabrouka cv. in colchicine solution) could be the best choice where severe water shortage conditions (50% and 25% of evapotranspiration) are found. Keywords: sweet potato, Ipomoea batatas, L., mutations, water stress, correlation coefficients
and path analysis.

J. Adv. Agric. Res. (Fac. Agric. Saba Basha)
ـــــــــــــــــــــــــــــــــــــــــــــــــــــــــــــــــــــــــــــــــــــــــــــــــــــــــــــــــــــــــــــــــــــــــــــــــــــــــــــــــــــــــــــ 383 Vol. 24 (3), 2019
INTRODUCTION
Sweet potato (Ipomoea batatas, L.) is a perennial plant, dicotyledonous, belongs to the family convolvulacea and counted as one of the essential crops in many developing nations; specifically, in Africa and Asia. Sweet potato ranks seventh among the world's most important crops and the fifth ranking in developing countries (Loebenstein et al., 2003 and Hironori et al. 2007). Moreover, it ranked the second important tuber root crop after cassava in many tropical countries (FAOSTAT, 2006). In 2014, sweet potatoes production quantity for Egypt was 339049 tonnes (FAOSTAT, 2014). Sweet potato is significant sources of carbohydrates, vitamins A and C, fiber, iron, potassium, and protein.
Self- and cross-incompatibilities are a major challenge for sexual reproduction, seed production, and genetic improvement in sweet potatoes (Vimala and Hariprakash, 2011). Self- or cross-incompatibility in sweet potatoes inhibits breeding progress because parents with desirable traits may belong to the same group of incompatibilities (Wang, 1964; Charles et al., 1973; Vimala, 1989). Mutation breeding has been one of the alternative ways for breeders because it provides the opportunity for some desirable features that are not found in nature or lost during development (Kamile and Ayse, 2015).
Stress caused by water stress is one of the most important
environmental stresses that cause heavy losses to the agriculture worldwide (Kumar et al., 2012). The researchers illustrated that vegetables are more sensitive to drought compared to many other crops. Improving the yield under water pressure is a major goal of the plant breeding program. Water stress is often accompanied by relatively high temperatures, which increases evapotranspiration and affects the mobility of photosynthesis, all of which increases the effect of drought and significantly reduces crop yields. Selection for drought tolerant (water stress) varieties involves a choice to select for reduce the non-transpiration uses of water, reduce transpiration without reducing productivity, increase yields without increased transpiration and salinity variability lead to increased water use efficiency (WUE) (Sorrells et al., 2000; Bennett, 2003 and Anjum et al., 2011). Sweet potato is sensitive to water deficits predominantly during the formation period including vine development and storage root induction. Its production is still constrained by water stress which is presently a worldwide problem limiting crop production (Perey, 2015). Then, selection for suitable cultivar performance under water stress conditions is therefore considered to be of foremost importance (Simion, 2018). However, climate variations have resulted in drought or water shortage or water deficit conditions (Rockström, 2003, Blum et al., 2009, Neumann, 2008 and Falkenmark, 2013). Under these circumstances, crop water use efficiency, crop water content are sincerely affected, leading to low net photosynthetic rate, growth decline, and storage root yield lack (Van Heeden and Laurie, 2008; and Yooyongwech et al., 2016). Sweet potatoes are sensitive to water shortages, especially during the foundation period, including the development of vine and the initiation of root storage. However, drought is often a major environmental constraint for the production of sweet potatoes in areas where it is grown under rain-fed conditions. Different varieties may respond differently to limited
J. Adv. Agric. Res. (Fac. Agric. Saba Basha)
ـــــــــــــــــــــــــــــــــــــــــــــــــــــــــــــــــــــــــــــــــــــــــــــــــــــــــــــــــــــــــــــــــــــــــــــــــــــــــــــــــــــــــــــ 384 Vol. 24 (3), 2019
quantities of soil water. Therefore, selecting the performance of a good variety under drought conditions is of great importance (Ozias and Jarret 2013).
This study concerned to evaluate new sweet potato clones, aiming at the possibility of expanding sweet potato cultivation in low-water areas capable of meeting the needs of both domestic and foreign markets.
MATERIALS AND METHODS
This investigation was conducted over four consecutive years of 2015, 2016, 2017 and 2018 at each of El-Sabaheya Horticultural Research Station farm and the Experimental and Research Farm of The Faculty of Agriculture (Saba-Basha), Alexandria University, at Abees area, Alexandria governorate, Egypt.
Soil of the experimental site
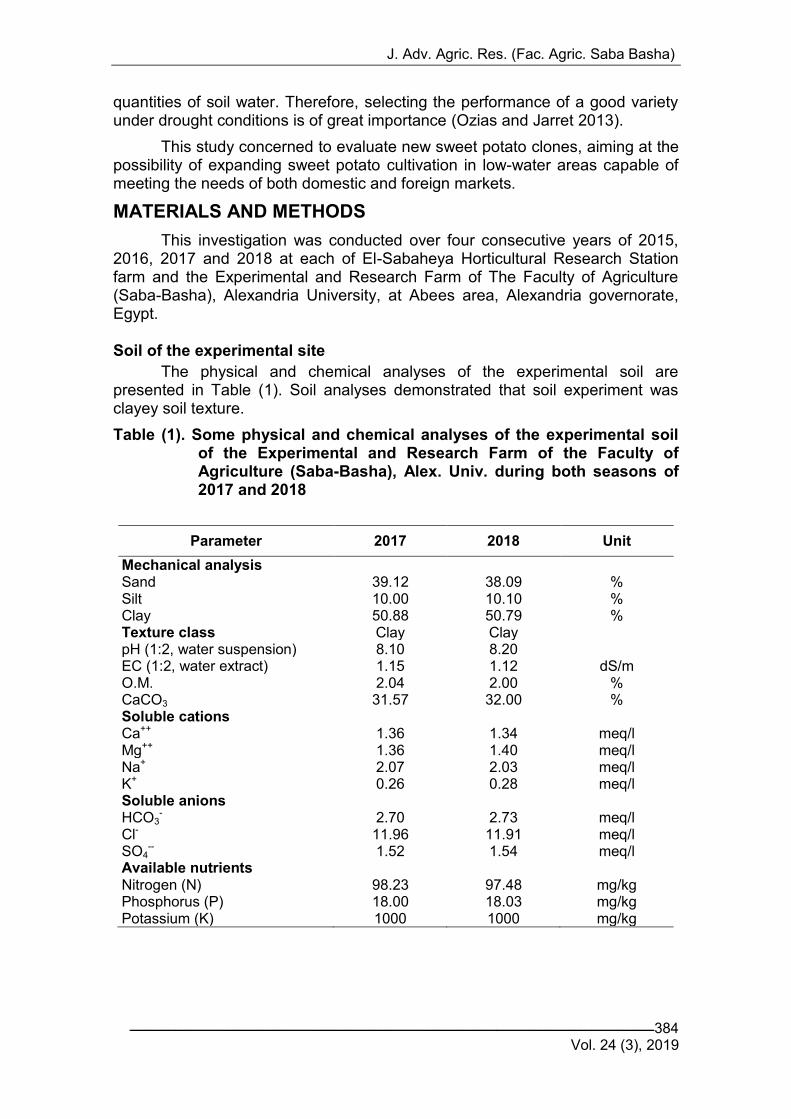
The physical and chemical analyses of the experimental soil are presented in Table (1). Soil analyses demonstrated that soil experiment was clayey soil texture.
Table (1). Some physical and chemical analyses of the experimental soil of the Experimental and Research Farm of the Faculty of Agriculture (Saba-Basha), Alex. Univ. during both seasons of 2017 and 2018
Parameter 2017 2018 Unit
Mechanical analysis Sand 39.12 38.09 % Silt 10.00 10.10 % Clay 50.88 50.79 % Texture class Clay Clay pH (1:2, water suspension) 8.10 8.20 EC (1:2, water extract) 1.15 1.12 dS/m O.M. 2.04 2.00 % CaCO3 31.57 32.00 % Soluble cations Ca++ 1.36 1.34 meq/l Mg++ 1.36 1.40 meq/l Na+ 2.07 2.03 meq/l K+ 0.26 0.28 meq/l Soluble anions HCO3
- 2.70 2.73 meq/l Cl- 11.96 11.91 meq/l SO4
-- 1.52 1.54 meq/l Available nutrients Nitrogen (N) 98.23 97.48 mg/kg Phosphorus (P) 18.00 18.03 mg/kg Potassium (K) 1000 1000 mg/kg
J. Adv. Agric. Res. (Fac. Agric. Saba Basha)
ـــــــــــــــــــــــــــــــــــــــــــــــــــــــــــــــــــــــــــــــــــــــــــــــــــــــــــــــــــــــــــــــــــــــــــــــــــــــــــــــــــــــــــــ 385 Vol. 24 (3), 2019
Genetic material source and procedures Stem cuttings of 20-25 cm length, were taken from two common
Egyptian sweet potato cultivars (Abees and Mabrouka). The cuttings were exposed to gamma radiation, or immerged in colchicine or sodium azide solutions in order to generate mutations that result in genetic variations through which the best clones tolerant to water shortage conditions can be selected. The treated cuttings were planted on 1st March 2015 into pots with diameter of 10 cm filled with soil composed of clay, sand and peat moss at 1: 1: 1. After a month of planting, the cuttings were transplanted to the in vivo soil where they were planted in rows at El-Sabaheya Horticultural Research Station farm, Alexandria governorate. By the end of October, plants were covered with plastic sheets under low tunnels. The tunnels were removed at April 2016. By the end of July 2016, the growing clones were harvested. Only 8 new clones were selected for evaluation. Stem cuttings of 25 cm length of each selected clone were made. Abees and Mabrouka cultivars were planted in addition to the 8 clones, 6 clones were selected as Abees mutations; i.e., A1, A2, A3, A4, A5 and A6 and 2 clones were selected as Mabrouka mutations; i.e., M1 and M2 for the evaluation at the Experimental and Research Farm of The Faculty of Agriculture (Saba-Basha), Alexandria University, at Abees area, Alexandria governorate, Egypt. Four irrigation treatments were applied during two successive summer seasons of 2017 and 2018. Irrigation treatments were at the rate of 25, 50, 75 and 100% of potentional evapotranspiration (ET0).
Measurements
The recorded measurements were assigned as follows: Vegetative growth parameters: A random sample of 3 plants from each genotype per plot was selected after 90 days of planting and tagged for determination the vegetative growth; i.e., plant length (cm), number of main branches/plant and average fresh foliage weight/plant (g). Yield Parameters: Ten randomly plants per plot were taken for determining yield component characters (number of tuber roots/plant, average tuber root weight (g) and the percentages of both weight of marketable tuber root yield and marketable tuber root number). Tuber root number was calculated by counting the total tuber root number per sub-plot then divided by its plant number. Average tuber root weight (g) was calculated by dividing tuber root yield of each sub-plot by its tubers′ number. Tuber root yield trait was calculated for a sub-plot and then attributed to yield per feddan (ton). The percentage of the marketable tuber root yield was calculated by dividing total marketable yield per sub-plot by its total tuber yield then multiplies by 100. Similarly, the percentage of the marketable tuber root number was calculated by dividing total marketable tuber number per sub-plot by its total tuber yield then multiply by 100. Tuber root quality characters: Include the following traits:
Carotene Content (mg/100 g) was determined using the method described by Umiel and Gabelman (1971), using a Milton Roy, spectrophotometer-601 at 440 nm.
Determination of total Sugars Percentages (%) was done according to the method of Malik and Singh (1980).
J. Adv. Agric. Res. (Fac. Agric. Saba Basha)
ـــــــــــــــــــــــــــــــــــــــــــــــــــــــــــــــــــــــــــــــــــــــــــــــــــــــــــــــــــــــــــــــــــــــــــــــــــــــــــــــــــــــــــــ 386 Vol. 24 (3), 2019
Determination of Starch (%) was determined according to the method described in AOAC (1985).
Experimental layout The experimental layout was presented as a split-plot design with three
replicates. Four irrigation rates (25, 50, 75 and 100% of ET0) were assigned in the main plots, whereas, ten sweet potato genotypes were, randomly, distributed in the sub-plots. The stem cuttings were planted in rows, 70 cm apart and at spacing of 25 cm within rows. The experimental unit consisted of two rows (10.0 m long and 0.70 m wide) making an area of 14 m2. Planting took place during the seasons of 2017 and 2018 on 1st of April and harvested on 30th of July in the two seasons. All the agricultural practices used for commercial sweet potato production, as common in the area, were followed. Collected data from the experiments were statistically analyzed, using the analysis of variance method. Comparisons among the means of different clones were carried out, using least significant differences (L.S.D) test procedure at p ≤ 0.05 level of probability, as explained by Snedecor and Cochran (1980) using Co-Stat software program. Simple correlation coefficients (r) were calculated for different pairs of the studied characters as reported by Dospekhove (1984). Path-coefficient was calculated as initially proposed by Wright (1921 and 1934) and later described by Dewey and Lu (1959); Li (1975); Williams et al. (1990).
RESULTS AND DISCUSSION Mean performances of the vegetative growth parameters of sweet potato genotypes
The results presented in Table (2) are the averages of plant length, number of main branches/plant and fresh foliage weight/plant as affected by sweet potato genotypes, irrigation levels (% ET0) and their combinations during the first and second seasons (2017 and 2018).
Regarding the effect of irrigation levels on the studied vegetative
characters; the results of Table (2) showed significant (p ≤ 0.05) effect on all various studied characters during the two seasons. In general, the values for the traits of length and foliage weight/plant were proportional and gradually decreased due to the low level of irrigation from 100% to 25% of irrigation levels during the two experimental seasons. The lowest mean values for plant length and for foliage weight/plant were scored at 25 % of irrigation level (25 % ET0) during the two seasons. On the contrary, the highest mean values for the number of main branches/plant were given with 25 % of irrigation level, while the lowest mean values for the averages were given with 100 % of irrigation levels. This finding can be explained by the fact that sweet potato plants have produced more number of stems per plant with lower level of irrigation water (25 % ET0) for fear of ending plant life early. The results of Table (2) showed that the studied vegetative traits were significantly (p ≤ 0.05) affected by different tested sweet potato genotypes, indicating significant genetic differences among these genotypes for the vegetative traits over the two experimental seasons. In this respect, Mabrouka cv. and clone M1 significantly possessed the highest mean values for plant length trait during the first and second seasons. As for
J. Adv. Agric. Res. (Fac. Agric. Saba Basha)
ـــــــــــــــــــــــــــــــــــــــــــــــــــــــــــــــــــــــــــــــــــــــــــــــــــــــــــــــــــــــــــــــــــــــــــــــــــــــــــــــــــــــــــــ 387 Vol. 24 (3), 2019
number of main branches / plant, the scored values clearly appeared that Abees cv. and clone A1 were significantly superior to the other tested genotypes during the two study seasons. For the results of fresh foliage weight / plant (g), the results of the first season showed that both the clones M1 and A1 were significantly higher than the other tested genotypes, while the results of the second season showed that the clones M1, A2, A1 and A3 significantly gave the highest mean values.
In terms of the interaction between the two studied independent variables
on the vegetative growth traits, the data of Table (2) significantly affected (p ≤ 0.05) plant length, number of main branches/plant and fresh foliage weight/plant. As for the first season, the significantly highest mean values for plant length were recorded in terms of Mabrouka cv. with 50 % and clone M1 with 100 % irrigation levels, respectively. Abees cv. significantly recorded the highest mean value for number of main branches/plant with 50 % irrigation level. With regard to the second season, the results showed that clone M1 significantly recorded the highest mean value for plant length with 100 % irrigation level. Each of the clones A1, A2 and A4 gave the highest mean performances for number of main branches/plant with 25 % irrigation level. The data of fresh foliage weight/plant appeared that clone M1 significantly gave the highest mean values with 100 % irrigation level and 75 % irrigation level during the first and second seasons respectively. The previous results showed that clone M1 could be highly sustainable to water stress conditions as it gave the best results in terms of fresh foliage weight/plant during the two study seasons. In addition, the same clone also gave the best results for plant length trait with 75 % irrigation level during the two seasons.
It is well-known that sweet potato is sensitive to water shortages,
especially during the foundation period, including the development of vine and the initiation of root storage (Ozias and Jarret 2013). However, drought is often a major environmental constraint for the production of sweet potatoes in areas where it is grown under rain-fed conditions. Maintenance of photosynthetic activity under water stress is a key factor of plant drought tolerance. Under water stress, photosynthesis per leaf area is mainly restricted by stomatal and mesophyll limitations, i.e., carbon dioxide (CO2) remains available for the photosynthetic apparatus, when stomata and mesophyll conductance is kept low to avoid excessive transpiration. Only at high stress levels non-stomatal metabolically limitations, such as reduced ribulose bio-phosphate carboxylase (RuBp) regeneration and adenine tri-phosphate (ATP) synthesis inflict carbon assimilation under drought. However, at high irradiances, RuBp is presented in excess and CO2 should remain the limiting factor for photosynthetic rate (Paryy et al., 2007). The adverse effect of drought on plant growth may be taken place due to the stomata closure, which lower or prevent water loss, and reduce CO2 availability for the chloroplast (Flexas et al., 2004). The growth reduction that followed drought stress may be taken place to a massive and irreversible expansion of stomatic cells produced by less meristematic divisions, inhibition of cell expansion. It is well known water stress resulted in less water content in tissues, which reduce the turgor pressure of the cell, and the enlargement of the cell, causing a reduction in plant growth (Shao et al., 2007).
J. Adv. Agric. Res. (Fac. Agric. Saba Basha)
ـــــــــــــــــــــــــــــــــــــــــــــــــــــــــــــــــــــــــــــــــــــــــــــــــــــــــــــــــــــــــــــــــــــــــــــــــــــــــــــــــــــــــــــ 388 Vol. 24 (3), 2019
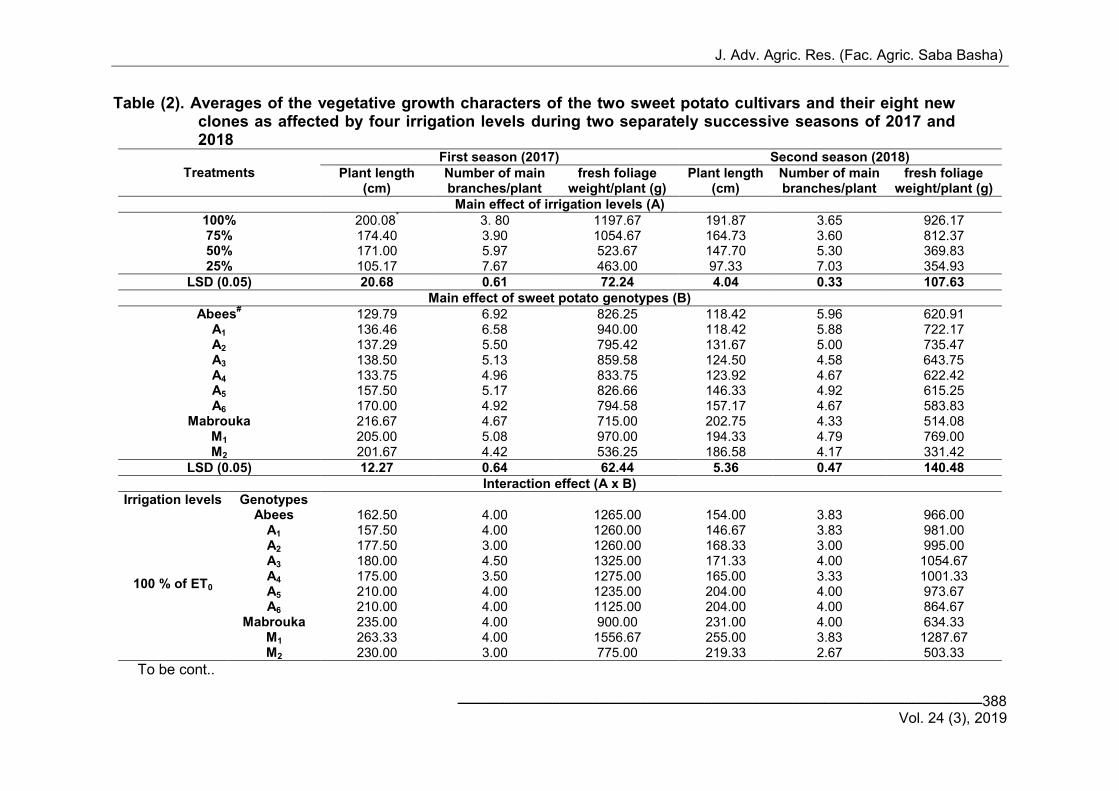
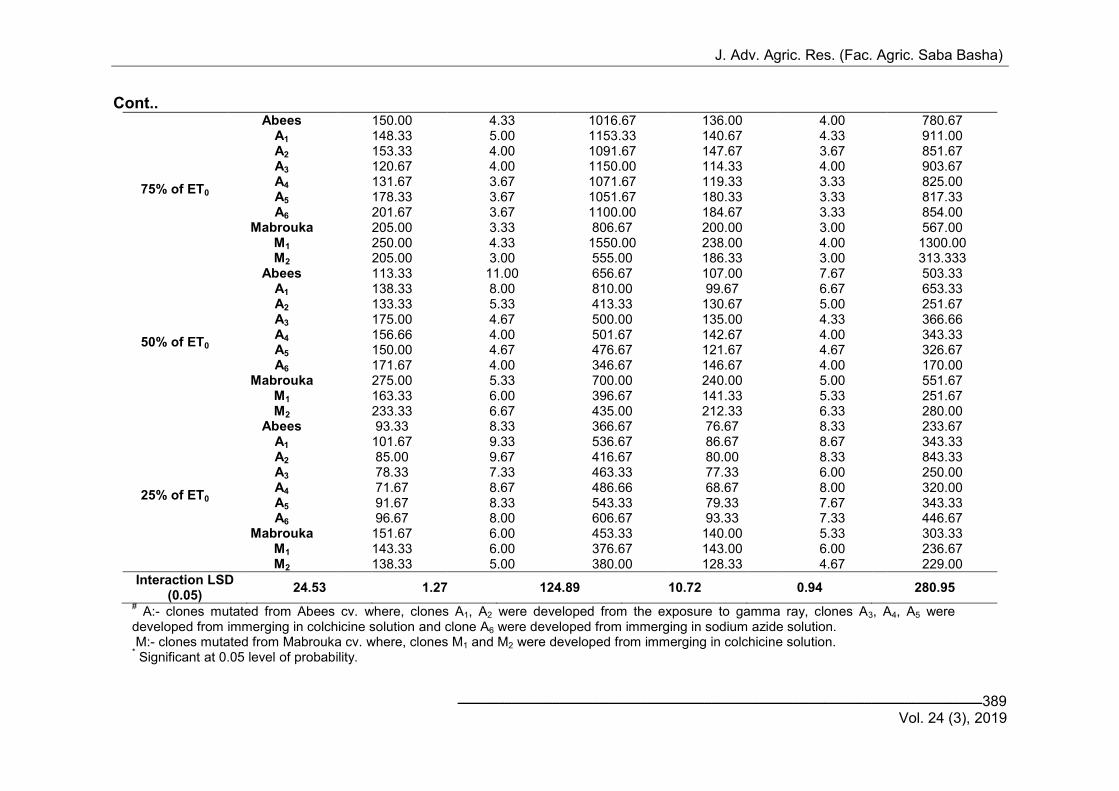
Table (2). Averages of the vegetative growth characters of the two sweet potato cultivars and their eight new clones as affected by four irrigation levels during two separately successive seasons of 2017 and 2018
Treatments
First season (2017) Second season (2018)
Plant length (cm)
Number of main branches/plant
fresh foliage weight/plant (g)
Plant length (cm)
Number of main branches/plant
fresh foliage weight/plant (g)
Main effect of irrigation levels (A)
100% 200.08*
3. 80 1197.67 191.87 3.65 926.17 75% 174.40 3.90 1054.67 164.73 3.60 812.37 50% 171.00 5.97 523.67 147.70 5.30 369.83 25% 105.17 7.67 463.00 97.33 7.03 354.93
LSD (0.05) 20.68 0.61 72.24 4.04 0.33 107.63
Main effect of sweet potato genotypes (B)
Abees# 129.79 6.92 826.25 118.42 5.96 620.91
A1 136.46 6.58 940.00 118.42 5.88 722.17 A2 137.29 5.50 795.42 131.67 5.00 735.47 A3 138.50 5.13 859.58 124.50 4.58 643.75 A4 133.75 4.96 833.75 123.92 4.67 622.42 A5 157.50 5.17 826.66 146.33 4.92 615.25 A6 170.00 4.92 794.58 157.17 4.67 583.83
Mabrouka 216.67 4.67 715.00 202.75 4.33 514.08 M1 205.00 5.08 970.00 194.33 4.79 769.00 M2 201.67 4.42 536.25 186.58 4.17 331.42
LSD (0.05) 12.27 0.64 62.44 5.36 0.47 140.48
Interaction effect (A x B)
Irrigation levels Genotypes
100 % of ET0
Abees 162.50 4.00 1265.00 154.00 3.83 966.00 A1 157.50 4.00 1260.00 146.67 3.83 981.00 A2 177.50 3.00 1260.00 168.33 3.00 995.00 A3 180.00 4.50 1325.00 171.33 4.00 1054.67 A4 175.00 3.50 1275.00 165.00 3.33 1001.33 A5 210.00 4.00 1235.00 204.00 4.00 973.67 A6 210.00 4.00 1125.00 204.00 4.00 864.67
Mabrouka 235.00 4.00 900.00 231.00 4.00 634.33 M1 263.33 4.00 1556.67 255.00 3.83 1287.67 M2 230.00 3.00 775.00 219.33 2.67 503.33
To be cont..
J. Adv. Agric. Res. (Fac. Agric. Saba Basha)
ـــــــــــــــــــــــــــــــــــــــــــــــــــــــــــــــــــــــــــــــــــــــــــــــــــــــــــــــــــــــــــــــــــــــــــــــــــــــــــــــــــــــــــــ 389 Vol. 24 (3), 2019
Cont..
75% of ET0
Abees 150.00 4.33 1016.67 136.00 4.00 780.67 A1 148.33 5.00 1153.33 140.67 4.33 911.00 A2 153.33 4.00 1091.67 147.67 3.67 851.67 A3 120.67 4.00 1150.00 114.33 4.00 903.67 A4 131.67 3.67 1071.67 119.33 3.33 825.00 A5 178.33 3.67 1051.67 180.33 3.33 817.33 A6 201.67 3.67 1100.00 184.67 3.33 854.00
Mabrouka 205.00 3.33 806.67 200.00 3.00 567.00 M1 250.00 4.33 1550.00 238.00 4.00 1300.00 M2 205.00 3.00 555.00 186.33 3.00 313.333
50% of ET0
Abees 113.33 11.00 656.67 107.00 7.67 503.33 A1 138.33 8.00 810.00 99.67 6.67 653.33 A2 133.33 5.33 413.33 130.67 5.00 251.67 A3 175.00 4.67 500.00 135.00 4.33 366.66 A4 156.66 4.00 501.67 142.67 4.00 343.33 A5 150.00 4.67 476.67 121.67 4.67 326.67 A6 171.67 4.00 346.67 146.67 4.00 170.00
Mabrouka 275.00 5.33 700.00 240.00 5.00 551.67 M1 163.33 6.00 396.67 141.33 5.33 251.67 M2 233.33 6.67 435.00 212.33 6.33 280.00
25% of ET0
Abees 93.33 8.33 366.67 76.67 8.33 233.67 A1 101.67 9.33 536.67 86.67 8.67 343.33 A2 85.00 9.67 416.67 80.00 8.33 843.33 A3 78.33 7.33 463.33 77.33 6.00 250.00 A4 71.67 8.67 486.66 68.67 8.00 320.00 A5 91.67 8.33 543.33 79.33 7.67 343.33 A6 96.67 8.00 606.67 93.33 7.33 446.67
Mabrouka 151.67 6.00 453.33 140.00 5.33 303.33 M1 143.33 6.00 376.67 143.00 6.00 236.67 M2 138.33 5.00 380.00 128.33 4.67 229.00
Interaction LSD (0.05)
24.53 1.27 124.89 10.72 0.94 280.95
# A:- clones mutated from Abees cv. where, clones A1, A2 were developed from the exposure to gamma ray, clones A3, A4, A5 were
developed from immerging in colchicine solution and clone A6 were developed from immerging in sodium azide solution. M:- clones mutated from Mabrouka cv. where, clones M1 and M2 were developed from immerging in colchicine solution. * Significant at 0.05 level of probability.
J. Adv. Agric. Res. (Fac. Agric. Saba Basha)
ـــــــــــــــــــــــــــــــــــــــــــــــــــــــــــــــــــــــــــــــــــــــــــــــــــــــــــــــــــــــــــــــــــــــــــــــــــــــــــــــــــــــــــــ 390 Vol. 24 (3), 2019
Mean performances of the yield and its component characters of sweet potato genotypes
The data shown in Tables (3 and 4) indicated that tuber root yield character and its component traits were significantly affected (p ≤ 0.05) by the two studied variables (sweet potato genotypes and irrigation level) during the two study seasons.
With respect to the main effect of irrigation levels, there are significant (p
≤ 0.05) and direct proportional relationship between the independent variable (irrigation levels) and dependent one (studied traits) during the two study seasons (Tables 3 and 4). The results of the first season appeared that, at 100 % of irrigation level, the highest average values were scored for number of tuber roots / plant, tuber root yield / feddan and for marketable tuber root number. The data of the second season showed that, at 100 % of irrigation level the highest average values were recorded for number of tuber roots / plant, tuber root yield / feddan, marketable tuber root number and for marketable tuber root yield. The obtained results showed that the lowest values recorded for all the studied traits were at 25 % of irrigation level during the two seasons of the study.
The results of Sokoto and Sadiq (2016) showed that the effect of water
stress showed significant effects on the number of tuber roots per plant, the number of marketable tuber root per plant, the number of non-marketable tuber roots per plant, the average weight of marketable tuber roots and tuber root yield /hectare. In his study on potato, Levy (1983) clarified that of tubers' number / plant lean towards to decrease in response to water stress. However, Haverkort et al. (1990) supposed that the number of tubers / plant had significantly increased or remained unchanged due to soil moisture stress. These results agreed with the reports by Mackerron and Jefferies (1986). The authors illustrated that water stress occurring before the period of tuber initiation effectively reduced tuber numbers and weights. Beukema and van der Zaag (1990) reported that marketable tuber yield adversely affected as a result of over irrigation; as well as by water stress (lynch and Tai, 1979).
As for the main effect of sweet potato genotypes, the recorded data
cleared that the clones A1, A3, A4 and A5 significantly gave the highest mean values for number of tubers/ plant trait during the two seasons (Tables, 3 and 4). The results for the average tuber root weight appeared that each of the two clones M1 and M2 significantly gave the highest mean values in this respect during the first season (Table, 3). The data of the second season showed that the clones M2, M1, A6, A2 and A1 significantly gave the highest mean performance for the average tuber root weight character (Table, 4). With respect to tuber root yield/feddan, the data of Table (3) showed that each of the clones A1 and M1 significantly possessed the highest mean values during the first season. Clone A1 significantly gave the highest mean value for tuber root yield/feddan during the second season (Table, 4). As for marketable tuber root number (%), the scored data in Table (3) showed that the clones M2 and M1 significantly expressed the highest percentages during the first season. On the other hand, there were no significant differences among most tested genotypes except for Mabrouka cv. and clone M1 which possessed the lowest values during the second season (Table, 4). The data regarding marketable tuber root yield
J. Adv. Agric. Res. (Fac. Agric. Saba Basha)
ـــــــــــــــــــــــــــــــــــــــــــــــــــــــــــــــــــــــــــــــــــــــــــــــــــــــــــــــــــــــــــــــــــــــــــــــــــــــــــــــــــــــــــــ 391 Vol. 24 (3), 2019
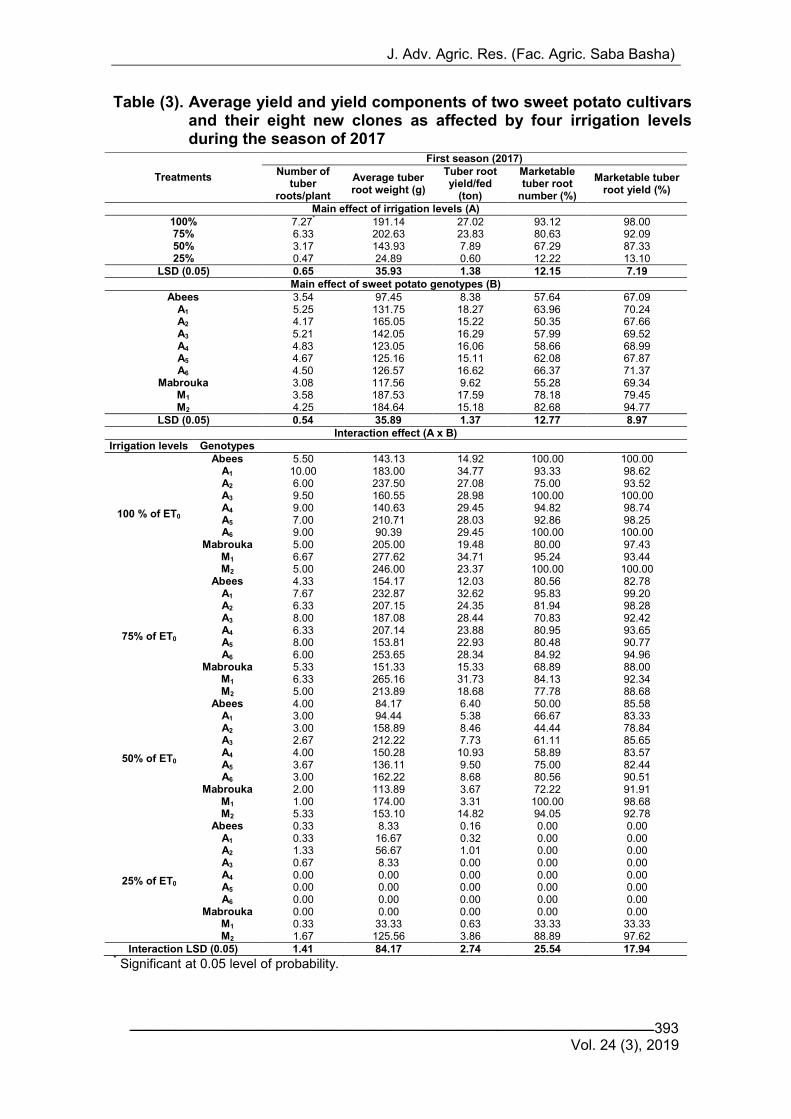
(%), the data of the first season (Table, 3) showed that the clone M2 significantly scored the highest percentage; while the data of the second season (Table, 4) appeared that the most tested genotypes significantly gave highest mean percentages except for Mabrouka cv. and clone M1 which significantly possessed the lowest percentages in this respect. The obvious differences between the tested sweet potato genotypes with respect to the studied traits indicated that there are genetic variances among the tested genotypes.
Respecting the interaction between the two studied independent
variables on the tuber root yield and its component characters, the data of Tables (3 and 4) significantly affected (p ≤ 0.05) number of tuber roots/plant, average tuber root weight (g), tuber root yield (ton/fed.), marketable root number (%) and marketable tuber root yield (%). As for the first season, the obtained data for number of tuber roots/plant cleared that the clone A1 possessed the highest mean value with 100 % irrigation level without significant differences with the clones A3, A4 and A6 at 100 % irrigation level. The data for average tuber root weight (g) showed that the clone M1 gave the highest mean value at 100 % irrigation level followed by the clone M1 at 75 % irrigation level without significant differences with the clones M2, A2 and A5 at 100 % irrigation level and with the clones A1, A6, and M2 with 75 % irrigation level. The results of tuber root yield (ton/fed.) illustrated that the clone A1 gave the highest mean value at 100% irrigation level without significant differences with the clone M1 at 100% irrigation level and the clone A1 at 75% irrigation level. The obtained interaction data were also fairly close for marketable tuber root number (%) at irrigation level 100 and 75% irrigation levels. The lowest ratios for marketable tuber root number (%) were obtained at 25 % irrigation level except with the clone M2 where it was significantly given a high percentage. The results showed that there were no clear differences due to the interaction between the tested sweet potato genotypes and irrigation treatments at irrigation levels 100, 75 and 50% regarding marketable tuber root yield trait (%), while the interaction between tested genotypes and irrigation level 25% had significantly given the lowest percentages with exception of clone M2 which possessed highly percentage (Table, 3).
The obtained data of the second season regarding the interaction
between the two independent variables (irrigation levels and sweet potato genotypes) generally revealed that the majority of superior results were obtained at irrigation level 100 % followed with the irrigation levels 75 and 50 %. The lowest mean values were obtained at irrigation level 25 % (Table, 4). Clone A1 possessed the highest mean value regarding number of tuber roots/plant at 100% irrigation level without significant differences with the clones A3, A4 and A6 at 100% irrigation level. As for Average tuber root weight (g) trait, the presented data showed that the clone M1 gave the highest mean value at 100% irrigation level without significant differences with clone M2 at 100% irrigation level and clones A1 and A6 at 75% irrigation level.
The data of tuber root yield (ton/fed.) trait showed that the clone A1 gave
the highest mean value at 100% irrigation level without significant differences with the clone M1 at 100% irrigation level and clone A1 at 75% irrigation level. In terms of marketable tuber root number (%), it was found that Abees cv. and

J. Adv. Agric. Res. (Fac. Agric. Saba Basha)
ـــــــــــــــــــــــــــــــــــــــــــــــــــــــــــــــــــــــــــــــــــــــــــــــــــــــــــــــــــــــــــــــــــــــــــــــــــــــــــــــــــــــــــــ 392 Vol. 24 (3), 2019
clone A1 gave the highest percentage without significant differences with most tested genotypes at 100% irrigation level and with the clone A6 at 50% irrigation level (Table, 4). Somewhat similar results were obtained for marketable tuber root yield (%) characteristic, where it was found from the data of Table (4) that Abees cv. and clone A1 gave the highest percentage without any significant differences with the tested genotypes at 100% and with most of the tested genotypes at 75% irrigation levels. The lowest ratios were achieved at 25% irrigation level. The data of Tables (3 and 4) illustrated that the clone M2, under the circumstances of 25 % irrigation level, gave a good response, especially during the first season, compared with the other tested genotypes under the same level of irrigation in most studied characters.
The optimistic effect of 100% or 75% field capacity on the tuber root yield
and its component characters could be attached to the moderate soil moisture content, which led to increase in nutrient availability and its uptake; as well as, a decrease in soil salinity compared to low field capacity. Higher values of field capacity increased growth parameters, which reflected as higher rates of photosynthetic processes and carbohydrates production which accordingly increased final production (tuber root yield/fed.). However, the reduction happened in total tuber root yield due to water stress may be attributed to the reduction in leaf area due to fewer and small leaves, and the increase in stomatal resistance and gas exchange; as well as, the reduction in transpiration rate, which all resulting in a decline in photosynthesis, as explained by Ghosh et al. (2000).
J. Adv. Agric. Res. (Fac. Agric. Saba Basha)
ـــــــــــــــــــــــــــــــــــــــــــــــــــــــــــــــــــــــــــــــــــــــــــــــــــــــــــــــــــــــــــــــــــــــــــــــــــــــــــــــــــــــــــــ 393 Vol. 24 (3), 2019
Table (3). Average yield and yield components of two sweet potato cultivars and their eight new clones as affected by four irrigation levels during the season of 2017
* Significant at 0.05 level of probability.
Treatments
First season (2017)
Number of tuber
roots/plant
Average tuber root weight (g)
Tuber root yield/fed
(ton)
Marketable tuber root
number )%(
Marketable tuber root yield )%(
Main effect of irrigation levels (A)
100% 7.27*
191.14 27.02 93.12 98.00 75% 6.33 202.63 23.83 80.63 92.09 50% 3.17 143.93 7.89 67.29 87.33 25% 0.47 24.89 0.60 12.22 13.10
LSD (0.05) 0.65 35.93 1.38 12.15 7.19
Main effect of sweet potato genotypes (B)
Abees 3.54 97.45 8.38 57.64 67.09 A1 5.25 131.75 18.27 63.96 70.24 A2 4.17 165.05 15.22 50.35 67.66 A3 5.21 142.05 16.29 57.99 69.52 A4 4.83 123.05 16.06 58.66 68.99 A5 4.67 125.16 15.11 62.08 67.87 A6 4.50 126.57 16.62 66.37 71.37
Mabrouka 3.08 117.56 9.62 55.28 69.34 M1 3.58 187.53 17.59 78.18 79.45 M2 4.25 184.64 15.18 82.68 94.77
LSD (0.05) 0.54 35.89 1.37 12.77 8.97
Interaction effect (A x B)
Irrigation levels Genotypes
100 % of ET0
Abees 5.50 143.13 14.92 100.00 100.00 A1 10.00 183.00 34.77 93.33 98.62 A2 6.00 237.50 27.08 75.00 93.52 A3 9.50 160.55 28.98 100.00 100.00 A4 9.00 140.63 29.45 94.82 98.74 A5 7.00 210.71 28.03 92.86 98.25 A6 9.00 90.39 29.45 100.00 100.00
Mabrouka 5.00 205.00 19.48 80.00 97.43 M1 6.67 277.62 34.71 95.24 93.44 M2 5.00 246.00 23.37 100.00 100.00
75% of ET0
Abees 4.33 154.17 12.03 80.56 82.78 A1 7.67 232.87 32.62 95.83 99.20 A2 6.33 207.15 24.35 81.94 98.28 A3 8.00 187.08 28.44 70.83 92.42 A4 6.33 207.14 23.88 80.95 93.65 A5 8.00 153.81 22.93 80.48 90.77 A6 6.00 253.65 28.34 84.92 94.96
Mabrouka 5.33 151.33 15.33 68.89 88.00 M1 6.33 265.16 31.73 84.13 92.34 M2 5.00 213.89 18.68 77.78 88.68
50% of ET0
Abees 4.00 84.17 6.40 50.00 85.58 A1 3.00 94.44 5.38 66.67 83.33 A2 3.00 158.89 8.46 44.44 78.84 A3 2.67 212.22 7.73 61.11 85.65 A4 4.00 150.28 10.93 58.89 83.57 A5 3.67 136.11 9.50 75.00 82.44 A6 3.00 162.22 8.68 80.56 90.51
Mabrouka 2.00 113.89 3.67 72.22 91.91 M1 1.00 174.00 3.31 100.00 98.68 M2 5.33 153.10 14.82 94.05 92.78
25% of ET0
Abees 0.33 8.33 0.16 0.00 0.00 A1 0.33 16.67 0.32 0.00 0.00 A2 1.33 56.67 1.01 0.00 0.00 A3 0.67 8.33 0.00 0.00 0.00 A4 0.00 0.00 0.00 0.00 0.00 A5 0.00 0.00 0.00 0.00 0.00 A6 0.00 0.00 0.00 0.00 0.00
Mabrouka 0.00 0.00 0.00 0.00 0.00 M1 0.33 33.33 0.63 33.33 33.33 M2 1.67 125.56 3.86 88.89 97.62
Interaction LSD (0.05) 1.41 84.17 2.74 25.54 17.94

J. Adv. Agric. Res. (Fac. Agric. Saba Basha)
ـــــــــــــــــــــــــــــــــــــــــــــــــــــــــــــــــــــــــــــــــــــــــــــــــــــــــــــــــــــــــــــــــــــــــــــــــــــــــــــــــــــــــــــ 394 Vol. 24 (3), 2019
Table (4). Average yield and yield components of two sweet potato cultivars and their eight new clones as affected by four irrigation levels during the season of 2018
Treatments
Second season (2018)
Number of tuber
roots/plant
Average tuber root weight (g)
Tuber root yield/fed
(ton)
Marketable tuber root
number )%(
Marketable tuber root yield )%(
Main effect of irrigation levels (A)
100% 5.43*
208.84 20.69 85.02 96.73 75% 4.68 208.18 18.15 74.78 91.10 50% 2.88 105.15 5.95 53.68 64.36 25% 0.20 7.57 0.25 0.00 0.00
LSD (0.05) o.27 35.82 1.55 6.53 2.02
Main effect of sweet potato genotypes (B)
Abees 2.54 81.46 4.94 52.82 66.18 A1 3.96 135.93 14.80 55.14 67.52 A2 2.92 151.71 11.57 54.05 66.91 A3 4.21 114.86 12.89 54.27 67.42 A4 3.96 128.31 12.67 58.10 67.29 A5 3.71 123.55 11.72 61.08 67.02 A6 3.46 155.25 13.22 65.37 68.06
Mabrouka 2.08 106.83 6.22 34.43 45.14 M1 2.67 162.02 13.12 39.47 46.76 M2 3.63 164.44 11.46 58.98 68.18
LSD (0.05) 0.54 29.36 1.26 8.70 3.02
Interaction effect (A x B)
Irrigation levels Genotypes
100 % of ET0
Abees 4.00 113.46 8.588 100.00 100.00 A1 8.00 187.13 28.443 100.00 100.00 A2 4.33 253.47 20.748 80.56 95.92 A3 7.83 152.10 22.648 80.83 95.28 A4 7.17 170.59 23.123 85.94 96.70 A5 5.17 221.48 21.698 84.24 96.37 A6 7.00 173.86 23.123 85.71 96.11
Mabrouka 3.33 209.89 13.148 69.84 94.48 M1 4.83 321.23 28.380 78.94 95.23 M2 3.17 285.24 17.043 84.13 97.22
75% of ET0
Abees 2.67 144.33 6.713 58.89 82.39 A1 5.33 283.06 27.297 80.56 97.07 A2 4.50 229.56 19.032 76.59 94.11 A3 6.17 197.35 23.117 70.51 91.16 A4 4.83 218.10 18.557 81.39 94.61 A5 6.50 146.67 17.607 81.10 94.63 A6 4.33 290.011 23.022 76.08 93.26
Mabrouka 3.67 143.10 10. 007 67.86 86.09 M1 4.83 253.83 22.74 78.94 91.81 M2 4.00 175.83 13.36 75.00 85.87
50% of ET0
Abees 3.50 67.05 4.46 52.38 82.35 A1 2.50 72.53 3.45 40.00 73.03 A2 2.83 122.80 6.52 59.05 77.61 A3 2.83 108.99 5.79 65.71 83.24 A4 3.83 123.55 8.99 65.08 77.86 A5 3.17 125.07 7.56 78.10 77.07 A6 2.50 156.11 6.74 99.68 82.88
Mabrouka 1.33 73.33 1.74 0.00 0.00 M1 1.00 72.00 1.37 0.00 0.00 M2 5.33 130.03 12.88 76.81 89.61
25% of ET0
Abees 0.00 1.00 0.00 0.00 0.00 A1 0.00 1.00 0.00 0.00 0.00 A2 0.00 1.00 0.00 0.00 0.00 A3 0.00 1.00 0.00 0.00 0.00 A4 0.00 1.00 0.00 0.00 0.00 A5 0.00 1.00 0.00 0.00 0.00 A6 0.00 1.00 0.00 0.00 0.00
Mabrouka 0.00 1.00 0.00 0.00 0.00 M1 0.00 1.00 0.00 0.00 0.00 M2 2.00 66.67 2.53 0.00 0.00
Interaction LSD (0.05) 1.075 58.72 2.52 17.40 6.03 * Significant at 0.05 level of probability.
J. Adv. Agric. Res. (Fac. Agric. Saba Basha)
ـــــــــــــــــــــــــــــــــــــــــــــــــــــــــــــــــــــــــــــــــــــــــــــــــــــــــــــــــــــــــــــــــــــــــــــــــــــــــــــــــــــــــــــ 395 Vol. 24 (3), 2019
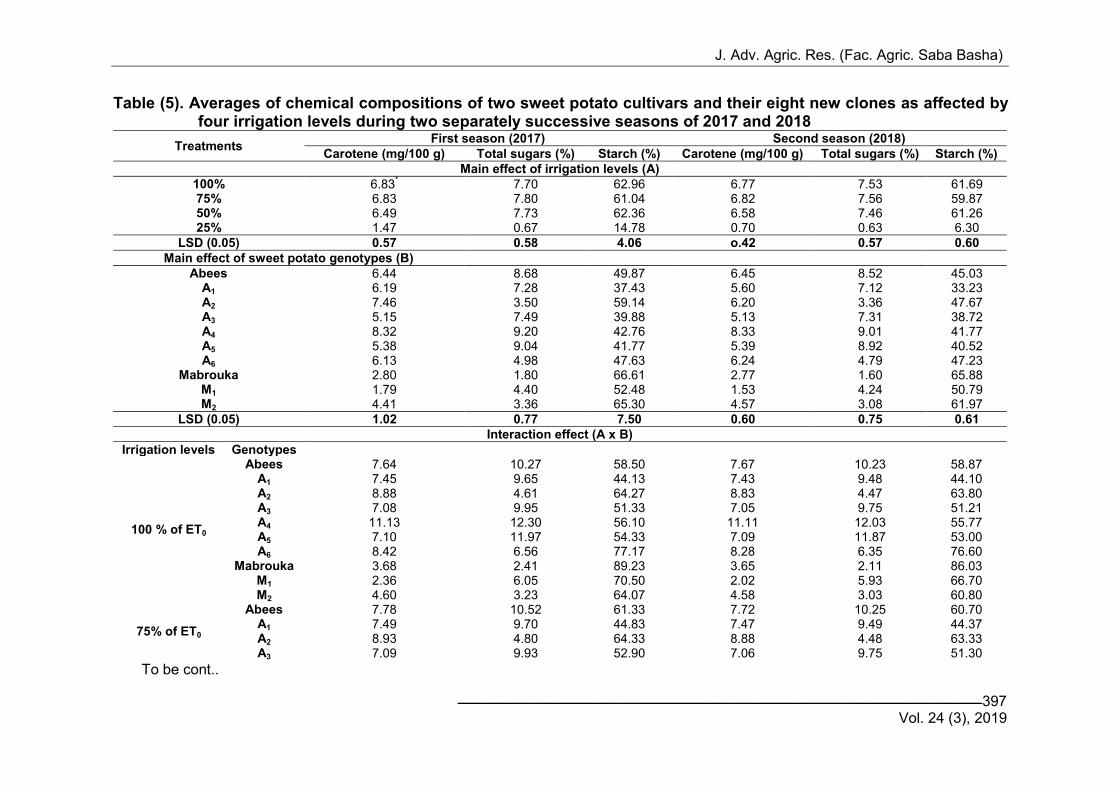
Mean performances of the chemical compositions of sweet potato genotypes
As for the tested irrigation levels; the data of Table (5) clearly showed that the chemical compositions of sweet potato tuber roots (carotene content and percentages of total sugar and starch) were not significantly affected by different levels of irrigation from 100% down to 50%, while these chemical compositions were negatively affected at the irrigation level of 25 % during the first season. The results of the second season were in the same direction as the results of the first season for both carotene content and total sugars, where these two characters were not significantly affected by the change of irrigation level from 100% to 50%. On the other hand, the results of the second season for starch percentage showed that the highest percentage was at irrigation levels of 100% and 50%, while the lowest percentage was at 25 % of irrigation level.
Results presented in Table (5) clearly showed that there were significant
differences among the tested sweet potato genotypes regarding the determined chemical compositions (carotene (mg/100g), total sugars (%) and starch (%)) during the two seasons. This result clearly indicated that the evaluated sweet potato genotypes differed in their genetic potential regarding to its chemical compositions. In this respect, the data of the first season showed that the clones A4 and A2 significantly gave the highest mean values for carotene content. As for total sugars percentage, the following genotypes (A4, A5 and Abees cv.) significantly possessed the highest percentages. Regarding starch percentage, each of sweet potato genotypes Mabrouka cv., M2 and A2 were the starchiest. The data of the second season showed that; clone A4 significantly gave the highest mean performance for carotene content.
The results for total sugars percentage demonstrated that each of the
following genotypes A4, A5 and Abees cv. significantly gave the highest mean values for total sugars percentage. These results showed that three mentioned sweet potato genotypes (A4 , A5 and Abees cv. ) could be considered more suitable than the other tested genotypes for cooking because of the sweetness of taste. In this respect Kohyama and Nishinari (1991) illustrated that sweetness is considered one of the important characteristics of sweet potato in food processing and cooking. As for starch percentage, Mabrouka cv. significantly possessed the highest mean value followed with the clones M2 and M1. Starch content plays important roles in sweet potato quality whereas, sweet potatoes having high starch percentages are well suited for starch manufacture. So, these three previous sweet potato genotypes (Mabrouka cv., clones M2 and M1) could be suitable for starch manufacture.
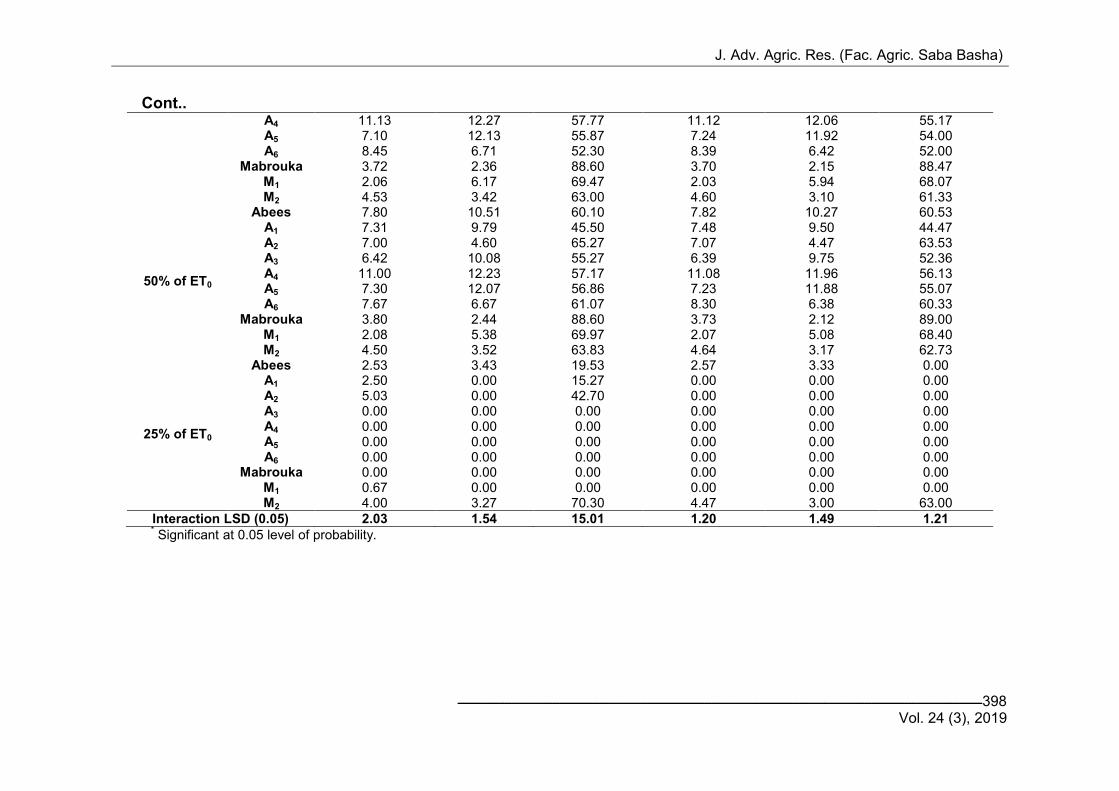
Regarding the interaction between the two studied independent variables
on the chemical composition traits, the data of Table (5) significantly affected (p ≤ 0.05) carotene content, total sugars and starch percentages. As for the first season, the significantly highest mean values recorded for carotene content in terms of clone A4 with each of 100 %. 75 % and 50 % irrigation levels, respectively. The results of the second season regarding carotene content followed the same approach as the results of the first season, where clone A4 significantly gave the highest mean values at 100%, 75% and 50%irrigation levels. With regard to the results of total sugars, over the course of two seasons
J. Adv. Agric. Res. (Fac. Agric. Saba Basha)
ـــــــــــــــــــــــــــــــــــــــــــــــــــــــــــــــــــــــــــــــــــــــــــــــــــــــــــــــــــــــــــــــــــــــــــــــــــــــــــــــــــــــــــــ 396 Vol. 24 (3), 2019
the experiment proved superior to each of the clones A4 and A5 at irrigation levels 100 %, 75 % and 50 %. Mabrouka cv. overcame the other tested genotypes in the percentage of starch at different levels of irrigation (100%, 75% and 50%) during the two experience seasons.
The results of Abou El-Khair et al. (2011) on potato crop showed that
irrigation water quantity of 1250 or 1750 m3 / fed. gave the maximum values for the averages of carbohydrates and starch contents in tuber tissues. The authors illustrated that bound water, cell sap, osmotic pressure and proline amino acid in tissues of leaves as well as water use efficiency (WUE) by growing plants were significantly increased with decreasing irrigation level up to 750 m3 / fed. The authors added that reducing irrigation level to 25% gave the lowest mean values for the chemical compositions during the two seasons of their study. Davies et al. (1989) mentioned that tubers water stress during drought periods had lower reducing sugars contents. The authors observed a significant relationship between hexose accumulation and invertase activity in water stress tubers. As for starch content, Ballmer et al. (2012) indicated that in two out of three years potato irrigation contributed to a higher content of starch in tubers, as compared with plantations not irrigated.
J. Adv. Agric. Res. (Fac. Agric. Saba Basha)
ـــــــــــــــــــــــــــــــــــــــــــــــــــــــــــــــــــــــــــــــــــــــــــــــــــــــــــــــــــــــــــــــــــــــــــــــــــــــــــــــــــــــــــــ 397 Vol. 24 (3), 2019
Table (5). Averages of chemical compositions of two sweet potato cultivars and their eight new clones as affected by four irrigation levels during two separately successive seasons of 2017 and 2018
To be cont..
Treatments First season (2017) Second season (2018)
Carotene (mg/100 g) Total sugars (%) Starch (%) Carotene (mg/100 g) Total sugars (%) Starch (%)
Main effect of irrigation levels (A)
100% 6.83* 7.70 62.96 6.77 7.53 61.69
75% 6.83 7.80 61.04 6.82 7.56 59.87 50% 6.49 7.73 62.36 6.58 7.46 61.26 25% 1.47 0.67 14.78 0.70 0.63 6.30
LSD (0.05) 0.57 0.58 4.06 o.42 0.57 0.60
Main effect of sweet potato genotypes (B)
Abees 6.44 8.68 49.87 6.45 8.52 45.03 A1 6.19 7.28 37.43 5.60 7.12 33.23 A2 7.46 3.50 59.14 6.20 3.36 47.67 A3 5.15 7.49 39.88 5.13 7.31 38.72 A4 8.32 9.20 42.76 8.33 9.01 41.77 A5 5.38 9.04 41.77 5.39 8.92 40.52 A6 6.13 4.98 47.63 6.24 4.79 47.23
Mabrouka 2.80 1.80 66.61 2.77 1.60 65.88 M1 1.79 4.40 52.48 1.53 4.24 50.79 M2 4.41 3.36 65.30 4.57 3.08 61.97
LSD (0.05) 1.02 0.77 7.50 0.60 0.75 0.61
Interaction effect (A x B)
Irrigation levels Genotypes
100 % of ET0
Abees 7.64 10.27 58.50 7.67 10.23 58.87 A1 7.45 9.65 44.13 7.43 9.48 44.10 A2 8.88 4.61 64.27 8.83 4.47 63.80 A3 7.08 9.95 51.33 7.05 9.75 51.21 A4 11.13 12.30 56.10 11.11 12.03 55.77 A5 7.10 11.97 54.33 7.09 11.87 53.00 A6 8.42 6.56 77.17 8.28 6.35 76.60
Mabrouka 3.68 2.41 89.23 3.65 2.11 86.03 M1 2.36 6.05 70.50 2.02 5.93 66.70 M2 4.60 3.23 64.07 4.58 3.03 60.80
75% of ET0
Abees 7.78 10.52 61.33 7.72 10.25 60.70 A1 7.49 9.70 44.83 7.47 9.49 44.37 A2 8.93 4.80 64.33 8.88 4.48 63.33 A3 7.09 9.93 52.90 7.06 9.75 51.30
J. Adv. Agric. Res. (Fac. Agric. Saba Basha)
ـــــــــــــــــــــــــــــــــــــــــــــــــــــــــــــــــــــــــــــــــــــــــــــــــــــــــــــــــــــــــــــــــــــــــــــــــــــــــــــــــــــــــــــ 398 Vol. 24 (3), 2019
Cont..
* Significant at 0.05 level of probability.
A4 11.13 12.27 57.77 11.12 12.06 55.17 A5 7.10 12.13 55.87 7.24 11.92 54.00 A6 8.45 6.71 52.30 8.39 6.42 52.00
Mabrouka 3.72 2.36 88.60 3.70 2.15 88.47 M1 2.06 6.17 69.47 2.03 5.94 68.07 M2 4.53 3.42 63.00 4.60 3.10 61.33
50% of ET0
Abees 7.80 10.51 60.10 7.82 10.27 60.53 A1 7.31 9.79 45.50 7.48 9.50 44.47 A2 7.00 4.60 65.27 7.07 4.47 63.53 A3 6.42 10.08 55.27 6.39 9.75 52.36 A4 11.00 12.23 57.17 11.08 11.96 56.13 A5 7.30 12.07 56.86 7.23 11.88 55.07 A6 7.67 6.67 61.07 8.30 6.38 60.33
Mabrouka 3.80 2.44 88.60 3.73 2.12 89.00 M1 2.08 5.38 69.97 2.07 5.08 68.40 M2 4.50 3.52 63.83 4.64 3.17 62.73
25% of ET0
Abees 2.53 3.43 19.53 2.57 3.33 0.00 A1 2.50 0.00 15.27 0.00 0.00 0.00 A2 5.03 0.00 42.70 0.00 0.00 0.00 A3 0.00 0.00 0.00 0.00 0.00 0.00 A4 0.00 0.00 0.00 0.00 0.00 0.00 A5 0.00 0.00 0.00 0.00 0.00 0.00 A6 0.00 0.00 0.00 0.00 0.00 0.00
Mabrouka 0.00 0.00 0.00 0.00 0.00 0.00 M1 0.67 0.00 0.00 0.00 0.00 0.00 M2 4.00 3.27 70.30 4.47 3.00 63.00
Interaction LSD (0.05) 2.03 1.54 15.01 1.20 1.49 1.21

J. Adv. Agric. Res. (Fac. Agric. Saba Basha)
ـــــــــــــــــــــــــــــــــــــــــــــــــــــــــــــــــــــــــــــــــــــــــــــــــــــــــــــــــــــــــــــــــــــــــــــــــــــــــــــــــــــــــــــ 399 Vol. 24 (3), 2019
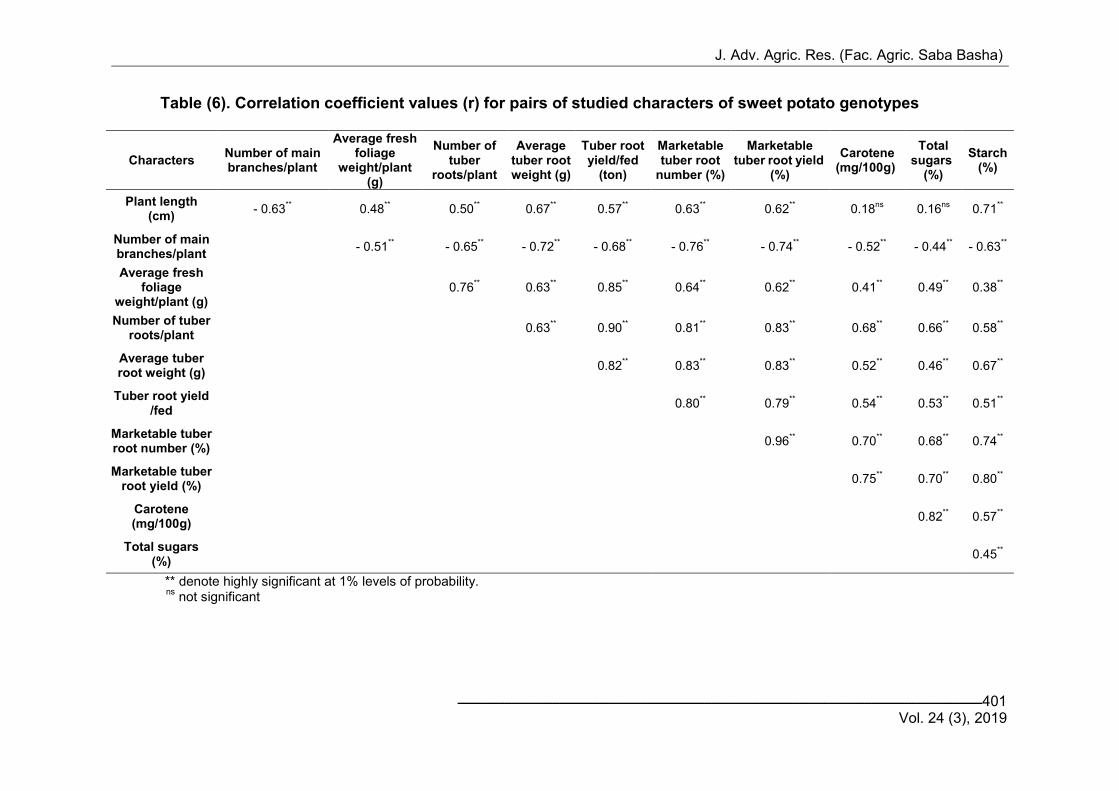
Phenotypic correlation coefficients estimates The data of Table (6) showed that correlation coefficient values were
positive and significant or highly significant correlation with the following pairs of characteristics: - Plant length (cm) with each of average fresh foliage weight/plant (g), No. of
tuber roots/plant, average tuber root weight (g), Tuber root yield/fed. (ton), marketable root number/plant (%),marketable yield/plant (%) and starch (%).
- Average fresh foliage weight/plant (g) with each of No. of tuber roots/plant, average tuber root weight (g), Tuber root yield/fed. (ton), marketable root number/plant (%), marketable yield/plant (%),carotene (mg/100g), total sugars (%) and starch (%).
- Numbers of tuber roots/plant with each of average tuber root weight (g), Tuber root yield/fed. (ton), marketable root number/plant (%), marketable yield/plant (%),carotene (mg/100g), total sugars (%)and starch (%).
- Average tuber root weights (g) with each of Tuber root yield/fed. (ton), marketable root number/plant (%), marketable yield/plant (%),carotene (mg/100g), total sugars (%)and starch (%).
- Tuber root yield/fed. (ton) with each of marketable root number/plant (%), marketable yield/plant (%),carotene (mg/100g), total sugars (%)and starch (%).
- Marketable root number/plant (%) with each of marketable yield/plant (%), carotene (mg/100g), total sugars (%) and starch (%).
- Marketable yield/plant (%) with each of carotene (mg/100gm), total sugars (%)and starch (%).
- Carotene (mg/100g) with each of total sugars (%) and starch (%). - Total sugars (%) with starch (%).
The data of Table (6) showed that each pair of the following characters
was significantly and negatively correlated: - Plant length (cm) with No. of main branches/plant. - No. of main branches/plant with each of average fresh foliage weight/plant
(g), No. of tuber roots/plant, average tuber root weight (g), Tuber root yield/fed. (ton), marketable root number/plant (%),marketable yield/plant (%),carotene (mg/100g), total sugars (%) and starch (%).
It points out that the absence of a significant correlation between any pair
of characters indicates that the selection of any of these characters is largely independent of the other character. The correlations among yield and its components and other economic characteristics are important for selection in the breeding program. Correlation analysis measures the interrelationship between different plant characteristics and determines the properties of the component on which the selection can be based to improve yield. Knowledge of relationships between different traits is important in education for the direct and indirect selection of characters that cannot be easily measured and those with low genetic potential (Patil et al., 1981).Selection the root crop, a polygenic trait, often leads to changes in other characters. Thus, knowledge of the relationship between root productivity and other characters, as well as relationship between different characters, is necessary to be able to design appropriate selection criteria in sweet potato breeding program (Engida et al., 2006). Fongod et al. (2012) showed that there was a positive correlation between most of the
J. Adv. Agric. Res. (Fac. Agric. Saba Basha)
ـــــــــــــــــــــــــــــــــــــــــــــــــــــــــــــــــــــــــــــــــــــــــــــــــــــــــــــــــــــــــــــــــــــــــــــــــــــــــــــــــــــــــــــ 400 Vol. 24 (3), 2019
agricultural and morphological parameters of sweet potato. Results of Gedamu et al. (2010) noted that phenotypic correlation analysis provides a very important correlation between root diameter and root yield. There is also a significant correlation between mean root weight and total root yield. The total yield of the root was also significant and was negatively correlated with root length and dry matter content of the root.
Therefore, more attention should be given to the components of the yield
during selection. Moussa and Gomaa (2017) reported that the tuber root yield per feddan was positively correlated with foliage weight, plant length, number of tuber roots per plant and average tuber root weight. The result of Mekonnen et al. (2015) cleared that both root diameter and number of tuberous roots per plant were significantly and positively correlated with marketable and total tuberous root yield. Likewise marketable tuberous root yield was also significantly and positively correlated with total tuberous root yield. This result indicated that sweet potato producers targeting tuberous roots should use root diameter, number of tuberous roots per plant and marketable tuberous root yield as selection criteria. Likewise, these yield and yield contributing parameters are important selection parameters which can serve as indicators of adaptability of the sweet potato to the study area and can also be utilized for improving in tuberous root yield of sweet potato. Shin et al. (2011) showed in their study that there was a negative relationship between the content of sugars and starch content in the tuber roots of sweet potato.
J. Adv. Agric. Res. (Fac. Agric. Saba Basha)
ـــــــــــــــــــــــــــــــــــــــــــــــــــــــــــــــــــــــــــــــــــــــــــــــــــــــــــــــــــــــــــــــــــــــــــــــــــــــــــــــــــــــــــــ 401 Vol. 24 (3), 2019
Table (6). Correlation coefficient values (r) for pairs of studied characters of sweet potato genotypes
Starch (%)
Total sugars
)%(
Carotene (mg/100g (
Marketable tuber root yield
()%
Marketable tuber root
number )%(
Tuber root yield/fed
(ton)
Average tuber root weight (g)
Number of tuber
roots/plant
Average fresh foliage
weight/plant (g)
Number of main branches/plant
Characters
0.71** 0.16
ns 0.18
ns 0.62
** 0.63
** 0.57
** 0.67
** 0.50
** 0.48
** - 0.63
**
Plant length (cm)
- 0.63** - 0.44
** - 0.52
** - 0.74
** - 0.76
** - 0.68
** - 0.72
** - 0.65
** - 0.51
**
Number of main branches/plant
0.38** 0.49
** 0.41
** 0.62
** 0.64
** 0.85
** 0.63
** 0.76
**
Average fresh foliage
weight/plant (g)
0.58** 0.66
** 0.68
** 0.83
** 0.81
** 0.90
** 0.63
**
Number of tuber roots/plant
0.67** 0.46
** 0.52
** 0.83
** 0.83
** 0.82
**
Average tuber root weight (g)
0.51** 0.53
** 0.54
** 0.79
** 0.80
**
Tuber root yield /fed
0.74** 0.68
** 0.70
** 0.96
**
Marketable tuber root number (%)
0.80** 0.70
** 0.75
**
Marketable tuber root yield (%)
0.57** 0.82
**
Carotene (mg/100g)
0.45**
Total sugars (%)
** denote highly significant at 1% levels of probability. ns
not significant
J. Adv. Agric. Res. (Fac. Agric. Saba Basha)
ـــــــــــــــــــــــــــــــــــــــــــــــــــــــــــــــــــــــــــــــــــــــــــــــــــــــــــــــــــــــــــــــــــــــــــــــــــــــــــــــــــــــــــــ 402 Vol. 24 (3), 2019
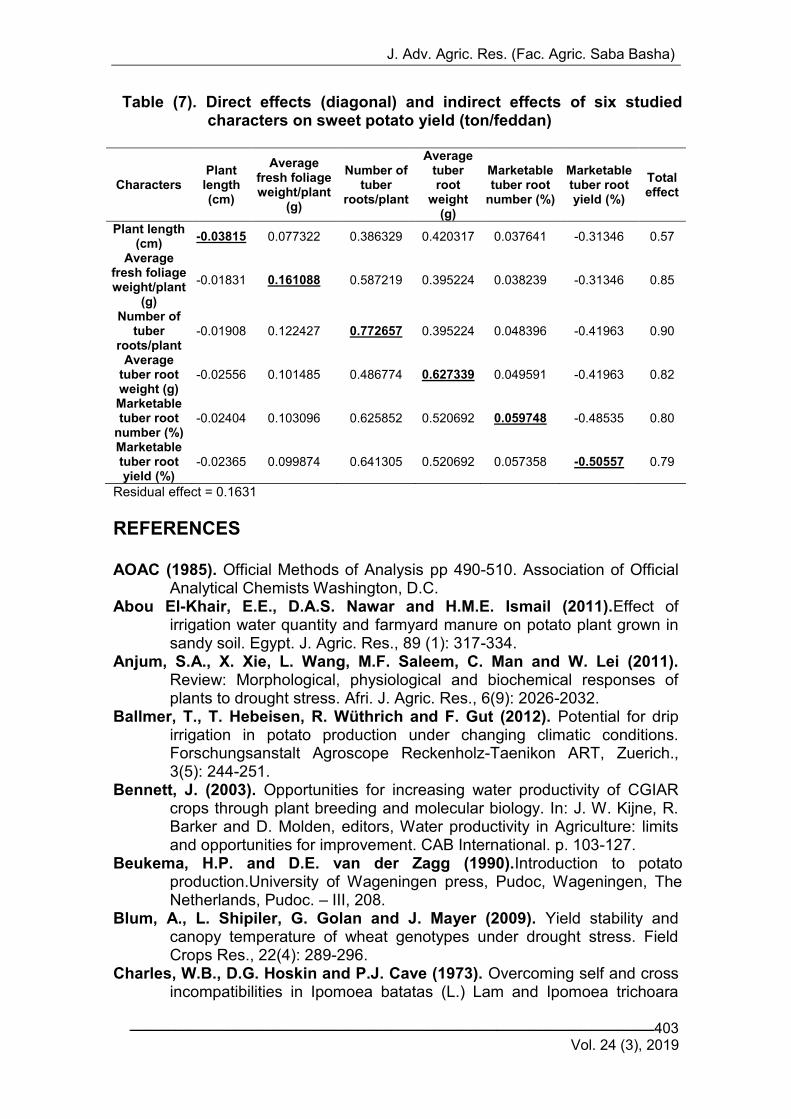
Path Coefficients Analysis Data presented in Table (7) were calculated for determining the direct
and indirect effects of six characters; plant length (cm), average fresh foliage weight/plant (g), number of tuber roots/plant, average tuber root weight (g), marketable tuber root number and (%) marketable tuber root yield (%). The obtained results, clearly demonstrated that there are large and mainly positive direct effects of both number of tuber roots/plant and average tuber root weight (g) on sweet potato yield (ton/fed.). These direct effects reached (0.7726) for number of tuber roots/plant and (0.6273) for average tuber root weight (g). As shown previously in Table (6); both of number of tuber root/plant and average tuber root weight (g) traits seemed to be closely and highly positive correlated with sweet potato yield (ton/fed.) trait. It could be concluded from the previous results that direct selection for the largest number of tuber roots/plant and or the highest average weight for tuber roots might be effective to induce highly sweet potato yield/fed. As for indirect effects, the data of Table (7) showed that the following characters: plant length (cm), average fresh foliage weight/plant (g), average tuber root weight (g), marketable tuber root yield (%) and marketable tuber root number (%) have indirect positive effects on sweet potato yield (ton/fed.) through its positive relations with number of tuber roots/plant (0.3863, 0.5872, 0.4867, 0.6258 and 0.6413, respectively). The presented data also demonstrated that plant length (cm), average fresh foliage weight/plant (g), number of tuber roots/plant, marketable tuber root number (%) and marketable tuber root yield (%) have indirect positive effects on sweet potato yield (ton/fed.) through its positive relations with average tuber root weight (g) character (0.4203, 0.3952, 0.3952, 0.5206 and 0.5206, respectively). The residual effect determines how best the casual factors account for the variability of the dependent factor, the yield (ton/fed.) in this case. It is estimate being 0.1631. The variables plant length (cm), average fresh foliage weight/plant (g), number of tuber roots/plant, average tuber root weight (g), marketable tuber root number (%), and marketable tuber root yield (%) explain 83.69 % of the variability in the yield. In other words, that means that 83.69 % of variations for sweet potato yield/fed. are indicated in this study. Besides, some other factors which have not been considered here need to be included in this analysis to account fully for the variation in yield. It could be concluded from the findings of the path analysis that the main factors affecting the high tuber root production per feddan are number of tuber roots/plant and average tuber root weight. Similar findings were also detected by Mansour (2018) in his study on sweet potato where the author proved that each of number of tuber roots/plant and the average tuber root weight traits had the main factors in affecting the sweet potato productivity. The author findings proved that fresh foliage weight and plant length characters had positive indirect effects on sweet potato productivity through its positive relations with number of tuber roots/plant. Also, the author found that each of fresh foliage fresh weight, plant length, number of main branches per plant and marketable tuber root yield per plant traits had indirect positive effects on sweet potato productivity through its positive relations with average tuber root weight. The results of Mohanty et al. (2016) showed that the following traits: number of branches/plant, tuber root length, tuber root yield per plant and starch content had direct positive effects on sweet potato productivity/hectare.
J. Adv. Agric. Res. (Fac. Agric. Saba Basha)
ـــــــــــــــــــــــــــــــــــــــــــــــــــــــــــــــــــــــــــــــــــــــــــــــــــــــــــــــــــــــــــــــــــــــــــــــــــــــــــــــــــــــــــــ 403 Vol. 24 (3), 2019
Table (7). Direct effects (diagonal) and indirect effects of six studied characters on sweet potato yield (ton/feddan)
Characters Plant length (cm)
Average fresh foliage weight/plant
(g)
Number of tuber
roots/plant
Average tuber root
weight (g)
Marketable tuber root
number )%(
Marketable tuber root yield )%(
Total effect
Plant length (cm)
-0.03815 0.077322 0.386329 0.420317 0.037641 -0.31346 0.57
Average fresh foliage weight/plant
(g)
-0.01831 0.161088 0.587219 0.395224 0.038239 -0.31346 0.85
Number of tuber
roots/plant -0.01908 0.122427 0.772657 0.395224 0.048396 -0.41963 0.90
Average tuber root weight (g)
-0.02556 0.101485 0.486774 0.627339 0.049591 -0.41963 0.82
Marketable tuber root
number )%( -0.02404 0.103096 0.625852 0.520692 0.059748 -0.48535 0.80
Marketable tuber root yield )%(
-0.02365 0.099874 0.641305 0.520692 0.057358 -0.50557 0.79
Residual effect = 0.1631
REFERENCES AOAC (1985). Official Methods of Analysis pp 490-510. Association of Official
Analytical Chemists Washington, D.C. Abou El-Khair, E.E., D.A.S. Nawar and H.M.E. Ismail (2011).Effect of
irrigation water quantity and farmyard manure on potato plant grown in sandy soil. Egypt. J. Agric. Res., 89 (1): 317-334.
Anjum, S.A., X. Xie, L. Wang, M.F. Saleem, C. Man and W. Lei (2011). Review: Morphological, physiological and biochemical responses of plants to drought stress. Afri. J. Agric. Res., 6(9): 2026-2032.
Ballmer, T., T. Hebeisen, R. Wüthrich and F. Gut (2012). Potential for drip irrigation in potato production under changing climatic conditions. Forschungsanstalt Agroscope Reckenholz-Taenikon ART, Zuerich., 3(5): 244-251.
Bennett, J. (2003). Opportunities for increasing water productivity of CGIAR crops through plant breeding and molecular biology. In: J. W. Kijne, R. Barker and D. Molden, editors, Water productivity in Agriculture: limits and opportunities for improvement. CAB International. p. 103-127.
Beukema, H.P. and D.E. van der Zagg (1990).Introduction to potato production.University of Wageningen press, Pudoc, Wageningen, The Netherlands, Pudoc. – III, 208.
Blum, A., L. Shipiler, G. Golan and J. Mayer (2009). Yield stability and canopy temperature of wheat genotypes under drought stress. Field Crops Res., 22(4): 289-296.
Charles, W.B., D.G. Hoskin and P.J. Cave (1973). Overcoming self and cross incompatibilities in Ipomoea batatas (L.) Lam and Ipomoea trichoara
J. Adv. Agric. Res. (Fac. Agric. Saba Basha)
ـــــــــــــــــــــــــــــــــــــــــــــــــــــــــــــــــــــــــــــــــــــــــــــــــــــــــــــــــــــــــــــــــــــــــــــــــــــــــــــــــــــــــــــ 404 Vol. 24 (3), 2019
Elliot. In: 3rd International Symposium on Tropical Root Crops, Ibadan, Nigeria. IITA. p. 17.
Davies, H.V., R.A. Jefferies and L. Scobie (1989). Hexose accumulation in cold stored tubers of potato (Solanum tuberosum L.): The effect of water stress. J. Plant Phys., 134: 248-254.
Dewey, D.R. and N.H. Lu (1959). A correlation and path-coefficient analysis of components of crested wheat grass seed production. Agron. J. Sci. 515-518.
Dospekhove, B.A. (1984). Field experimental statistical procedures. Mir Publishers pp 349.
Engida, T.E.V., D. Sastry and D. Nigussie (2006).Correlation and Path Analysis in Sweet Potato and Their Implications for Clonal Selection. J. Agron., 5(3): 391-395.
Falkenmark, M. (2013). Growing water scarcity in agriculture: future challenge to global water security. Philos. Trans. R. Soc. A 371:201-204.
FAOSTAT (2006).FAO database. (http://faostat.fao.org/site/567/default.aspx). (http:/www.ars-grin.gov/)
FAOSTAT (2014). FAO database. (http://www.fao.org/faostat/en/#data/QC) Flexas, J., J. Bota, F. Loreto, G. Coranic and T.D. Shakey (2004).Diffusive
and metabolic limitation to photosynthesis under drought and salinity in C3 plants. J. Pl. Biol., 6: 269-279.
Fongod, A.G.N., A.M. Mih and T.N. Nkwatoh (2012). Morphological and agronomical characterization of different accessions of sweet potato (Ipomoea batatas) in Camiron. International Research J. of Agric. Sci. and Soil Sci., (2): 234-245.
Gedamu, Y., G. Belay and N. Dechassa (2010).Genotypic and phenotypic correlations of root yield andother traits of orange fleshed sweet potatoes [Ipomoea batatas(L.) Lam.]. J. Dry lands., 3(2): 208-213.
Ghosh, S.G., K. Asanuma, A. Kusutani and M. Toyota (2000).Effect of moisture stress at different growth stages on the amount of total nonstructural carbohydrate, nitrate reductase activity and yield of potato. Japanese J. Trop. Agric., 44(3): 158-166.
Haverkort, A.J., M. Van de Waart and K.B.A. Bodiaender (1990).The effect of early drought stress on numbers of tubers and stolons of potato in controlled and field conditions. Potato Res., 33: 89-96 .
Hironori, M., F. Ogasawara, K. Sato, H. Higo and Y. Minobe (2007).Isolation of a regulatory gene of anthocyanin biosynthesis in tuberous roots of purple-fleshed sweet potato.Plant Physiology143: 1252-1268.
Kamile, U. and G.N. Ayse (2015). Developments of Gamma Ray Application on Mutation Breeding Studies in Recent Years. International Conference on Advances in Agricultural, Biological & Environmental Sciences (AABES-2015) July 22-23, 2015 London (UK).
Kohyama, K. and K. Nishinari (1991).Effect of soluble sugars on gelatinization and retrogradation of sweet potato starch. J. Agric. Food Chem., 39: 1406-1410.
Kumar, R., S. S. Solankey and M. Singh (2012). Breeding for drought tolerance in vegetables. Vegetable Sci., 39 (1): 1-15.
Levy, D. (1983).Varietal differences in the response of potatoes to repeated short periods of water stress in hot climates. II. Tuber yield and dry
J. Adv. Agric. Res. (Fac. Agric. Saba Basha)
ـــــــــــــــــــــــــــــــــــــــــــــــــــــــــــــــــــــــــــــــــــــــــــــــــــــــــــــــــــــــــــــــــــــــــــــــــــــــــــــــــــــــــــــ 405 Vol. 24 (3), 2019
matter accumulation and other tuber properties. Potato Res., 26: 315-321 .
Li, C.C. (1975). Path-analysis primer. Boxwood Press Pacific Grove Calif (C.F. Ragheb, 1995).
Loebenstein, G., S. Fuentes, J. Cohen and L.F. Salazar (2003). Sweet potato: Virus and Virus-Like Diseases of Major Crops in Developing Countries. Kluwer Academic Publishers, Dordrecht, The Netherlands, 223–248.
Lynch, D.R. and G.C.C. Tai (1979). Yield and yield components response of eight potato genotypes to water stress. Crop Sci., 29 (5): 1207-1211.
MacKerron, D.K.L. and R.A. Jefferies (1986). The influence of early soil moisture stress on tuber numbers in potato. Potato Res., 29: 299-312.
Malik, C.P. and M.P. Singh (1980). Plant enzymology and histoenzymology. A text manual, Kalyani Publishers, New Delhi.
Mansour, M. K. M. (2018). Production of new distinct clones of sweet potato (Ipomoea batatas, L.) using mutagenic substances and gamma-ray radiation. M.Sc. thesis, Fac. Agric. (Saba Basha), Alexandria Univ. Egypt. Pp. 62.
Mekonnen, B., S. Tulu and J. Nego (2015). Evaluation of Orange Fleshed Sweet Potato (Ipomoea batatas L.)Varieties for Yield and Yield Contributing Parameters in the Humid Tropics of Southwestern Ethiopia.J. Pl. Sci., (10)5: 191-199.
Mohanty, P., P. Ashok, K. Sasikala and D.V. Swami (2016).Character Association and Path Analyses in Sweet Potato. International J. of Vegetable Sci.Vol.22:514-554.
Moussa, S.A.M. and S.E. Gomaa (2017). Mutation breeding and assessment of clones induced through gamma radiation of the sweet potato cultivar (Abees). Egypt. J. Plant Breed. 21(2):312 – 338.
Neumann, P. M. (2008). Coping mechanisms for crop plants in drought-prone environments. Ann. Bot., 101: 901–907.
Ozias, A. P. and R.L. Jarret (2013). Nuclear DNA content and ploidy levels in the genus Ipomoea. JASHS 119(1): 110-115.
Paryy, M.A.J., P.J. Madgwick, J.F.C. Carvalho and P.J. Andralogic (2007). Prospects for increasing photosynthesis by overcoming the limitations of Rubisco. J. Agric. Sci., 45: 31-43.
Patil, V.D., V.G. Makane and P.R. Chopde (1981).Genetic variability and character association in intervarietal crosses of linseed. Ind. J. Agric. Sci.,51: 631-633.
Perey, A. C. (2015).Evaluation of selected sweet potato genotypes for drought resistance under greenhouse condition. Int. J. Curr. Res. Biosci. Plant Biol., 2(9): 104-114.
Rockström, J. (2003). Resilience building and water demand management for drought mitigation. Physics and Chemistry of the Earth, Parts A/B/C 28(20): 869–877.
Shao, H., S. Jiang, F.Li, L. Chu, C. Zhao, M. Shao and X. Zhao (2007). Some advances in plant stress physiology and their implications in system biology era. Biointerafaces, 54: 33-36.
Shin, J.M., K. Bong-Kyu, S. Sang-Gyu, B.J. Seo, K. Ji-Seong, K. Byung, K. Si-Yong, L.S. Joon, C. Mi-Nam and K. Sun-Hyung (2011). Mutation

J. Adv. Agric. Res. (Fac. Agric. Saba Basha)
ـــــــــــــــــــــــــــــــــــــــــــــــــــــــــــــــــــــــــــــــــــــــــــــــــــــــــــــــــــــــــــــــــــــــــــــــــــــــــــــــــــــــــــــ 406 Vol. 24 (3), 2019
breeding of sweet potato by gamma-ray radiation. Afri. J. Agric. Res., 6 (6): 1447-1454.
Simion,T. (2018). Breeding Sweet potato [Ipomoeae batatas (L.)Lam] For Low Moisture Stress Tolerance. Ann. Rev. & Res., 3(1):1-6.
Snedecor, G. H. and W. C. Cochran (1980). Statistical Methods. 7th ed. Iowa State University press, Ames., Iowa, U.S.A.
Sokoto, M. B. and K. A. Sadiq (2016). Science domain internationalproductivity of sweet potato (Ipomoea batatas, L.) as influenced by water stress and variety in sokoto sudan savannah, Nigeria. Int. J. Plant & Soil Sci., 12(1): 1-9.
Sorrells, M.E., A. Diab and M. Nachit (2000).Comparative genetics of drought tolerance.In : Royo C. (ed.), Nachit M. (ed.), Di Fonzo N. (ed.), Araus J.L. (ed.). Durum wheat improvement in the Mediterranean region: New Challenges, Zaragoza (Spain): CIHEAM, 2000. p. 191-201.
Umiel, N. and W.H. Gabelman (1971). Analytical procedures for detecting carotenoids of carrot (Daucus carota L.) roots and tomato (Lycopersicone sculentum) fruits. J. Amer. Soc. Hort. Sci. 96: 702-704.
Van Heeden, P. D. R. and R. Laurie (2008). Effects of prolonged restriction in water supply on photosynthesis shoot development and storage root yield in sweet potato. Physiol. Plant, 134: 99-109.
Vimala, B. (1989).Fertility and incompatibility in sweet potato (Ipomoea batatas L.). Ann. Agr. Res. 10: 109-114.
Vimala, B. and B. Hariprakash (2011).Variability of morphological characters and dry matter content in the hybrid progenies of sweet potato [Ipomoea batatas (L.) Lam.]. Gene Conserve Vol. 10: 65-86.
Wang, H. (1964).A study on the self and cross incompatibilities in the sweet potato in Taiwan. Proc. Amer. Soc. Hort. Sci. 84: 424-430.
Williams, W.A, M.B. Jones and M.W. Demment (1990). A concise table for path analysis statics. Agron. J. 82:1022-1024.
Wright, S. (1921). Correlation and causation. J. of Agric. Res. 20: 202-209. Wright, S. (1934). The method of path coefficient. Ann. Stat. 5: 161-215. Yooyongwech, S., T. Samphumphuang, R. Tisarum, C. Theerawitaya and
S. Chaum (2016). Arbuscular mycorrhizal fungi (AMF) improved water deficit tolerance in two different sweet potato genotypes involves osmotic adjustment via soluble sugar and free proline. Sci. Hort., 198, 107–117.
J. Adv. Agric. Res. (Fac. Agric. Saba Basha)
ـــــــــــــــــــــــــــــــــــــــــــــــــــــــــــــــــــــــــــــــــــــــــــــــــــــــــــــــــــــــــــــــــــــــــــــــــــــــــــــــــــــــــــــ 407 Vol. 24 (3), 2019
الملخص العربي يظروف الإجهاد المائتحت البطاطا تقييم بعض السلالات الناتجة من صنفين من
جمال عبد الناصر خليل 3على إبراهيم على حسن عبيدو 2محمد عثمان السيد غريب 1
منى محمد يسرى جابر 2سامح عبد المنعم محمد موسى 4 ماجستيرطالب 1
جامعة الإسكندرية –سابا باشا –كمية الزراعة –قسم الإنتاج النباتى 2 جامعة الإسكندرية –سابا باشا – كمية الزراعة -قسم الأراضى والكيمياء الزراعية 3
مركز البحوث الزراعية –قسم بحوث البطاطس والخضر خضرية التكاثر 4
واحدة من المحاصيل الجذرية المنتشرة عالميا خاصة فى الدول النامية كغذاء شعبى ، لكن بسبب عدم تعد البطاطا ومن ىنا فإن العديد من صفاتو تظير تباين واضح . كما أن البطاطا كونو محصول مفتوح التمقيح التجانس الشديد
محصول حساس للإجياد المائى وخاصة أثناء تكوين الجذور بما فييا مراحل تطور العرش وتشجيع التخزين أجريت بالتعاون بين محطة بحوث البساتين بالصبحية بالإسكندرية وكذلك لذلك ، فإن ىذه الدراسة بالجذور .
جامعة الإسكندرية ، مصر لتطوير سلالات بطاطا متميزة –سابا باشا –طة التجريبية والبحثية لكمية الزراعة المح، حيث العقل الساقية لصنفى البطاطا تواجو المعوقات السابق الإشارة إلييا بعاليو من خلال استخدام عوامل مطفرة
إنتخابتم . أزيد مأو محمول الصوديو ل الكولشيسينمحمو و الغمس فىأ، لآشعة جاماأبيس و مبروكة قد عرضت ، مع أربعة 2118و كذلك 2117ليتم تقييميا مع النباتات الأم خلال موسمى الصيف لعامى واعدةسلالات 8
( كانت قد أستخدمت لدراسة لمنبات نتح -بخرمن ال ٪ 25٪ ، 51٪ ، 75٪ ، 111مستويات من الرى ) استجابة النباتات تحت الإختبار للإجياد المائى .
يمكن تمخيص النتائج التي تم الحصول عمييا في النقاط التالية:٪ من 111فيما يتعمق بالصفات الخضرية المدروسة ، فقد تم الوصول لأفضل النتائج من خلال المعاممة .1
٪ 25فروع الرئيسية / النبات و التي أعطت أعمى متوسطات قيم مع المعاممة نتح ، باستثناء صفة عدد ال -البخر نتح. -من البخر
أشارت النتائج التي تم الحصول عمييا إلى أن صفة المحصول الكمى من جذور البطاطا )طن / فدان( وصفات .2ن البطاطا ، و معاملات مكونات المحصول تأثرت بشكل كبير بكل من المتغيرين المدروسين )التراكيب الوراثية م
الرى( خلال موسمي الدراسة.وصفات (/ فدان)طنبالنسبة لمتأثير الرئيسي لمستويات الري عمى صفة المحصول الكمى من جذور البطاطا .3
مكونات المحصول ، فيناك علاقة تناسبية مباشرة بين المتغير المستقل )مستويات الري( و المتغير التابع )الصفات المدروسة( خلال موسمى الدراسة.
-٪ من البخر111سجمت أعمى قيم لمتوسط المحصول الكمى من جذور البطاطا )طن / فدان( عند مستوى .4نتح -البخر٪ من 25نتح ؛ في حين أن الرى عند -٪ من البخر75ا الرى عند نتح خلال الموسمين ، تلاى
أعطى أقل القيم في ىذا الصدد.
J. Adv. Agric. Res. (Fac. Agric. Saba Basha)
ـــــــــــــــــــــــــــــــــــــــــــــــــــــــــــــــــــــــــــــــــــــــــــــــــــــــــــــــــــــــــــــــــــــــــــــــــــــــــــــــــــــــــــــ 408 Vol. 24 (3), 2019
أعمى متوسط لقيم المحصول قد سجمت، نتح -البخر% من 111أن المعاممة أظيرت بيانات الموسمين .5 .نتح -البخر٪ من 25القابل لمتسويق )%(؛ بينما سجمت أدنى القيم عند مستوى
بالنسبة لمستويات الري المختبرة ؛ أظيرت البيانات بوضوح أن المكونات الكيميائية لمجذور التخزينية البطاطا .6٪ إلى 111)محتوى الكاروتين والنسب الكمية من السكر والنشا( لم تتأثر بشكل معنوى بمستويات الري المختمفة من
٪ باستثناء نسبة النشا خلال الموسم الثاني.51يجابية بشكل رئيسي لكل من أظيرت .7 النتائج التي تم الحصول عمييا بوضوح وجود تأثيرات مباشرة كبيرة وا
متوسط وزن الجذر )جم( ، عدد الجذور التخزينية / نبات عمى محصول الجذور )طن / فدان(.
بإنتاجية تميزتلأنيا من تعرض الصنف أبيس لآشعة جاما( كطفرة ) نتجت A1يوصى البحث باختيار السلالة -٪ من البخر75٪ أو عندما يكون ىناك نقص في إمدادات المياه )111عالية )طن / فدان( عند مستوى الري
منكطفرة ) نتجت M1السلالة اختيار نتح( مقارنة بالتراكيب الوراثية الأخرى المختبرة من البطاطا. أيضا ، يمكن توفر عند لاستخراج النشا ، سواء تيامناسبو العالية ، اجيتيبسبب إنتا فى محمول الكولشيسين( الصنف مبروكة نقع
كطفرة )نتجت M2 السلالة .نتح -٪ من البخر 75وحتى مياه الري أو حتى عندما يكون ىناك نقص في مياه الري حاد في مياهالنقص ال تحت ظروفر الأفضل خياتكون ىى ال قد( محمول الكولشيسينمن نقع الصنف مبروكة فى
(.نتح –البخر٪ من 25و ،٪ 51) الرى

J. Adv. Agric. Res. (Fac. Agric. Saba Basha)
ـــــــــــــــــــــــــــــــــــــــــــــــــــــــــــــــــــــــــــــــــــــــــــــــــــــــــــــــــــــــــــــــــــــــــــــــــــــــــــــــــــــــــــــ 409 Vol. 24 (3), 2019