Embed Size (px)
Citation preview
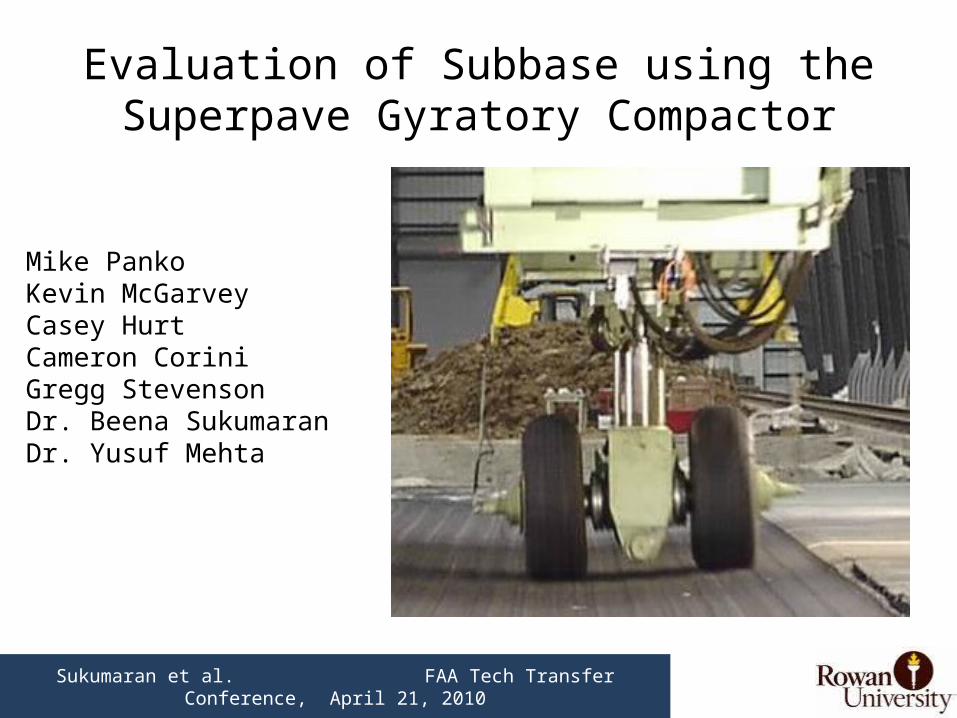
Evaluation of Subbase using the Superpave Gyratory Compactor
Mike PankoKevin McGarveyCasey HurtCameron CoriniGregg StevensonDr. Beena SukumaranDr. Yusuf Mehta
Sukumaran et al. FAA Tech Transfer Conference, April 21, 2010
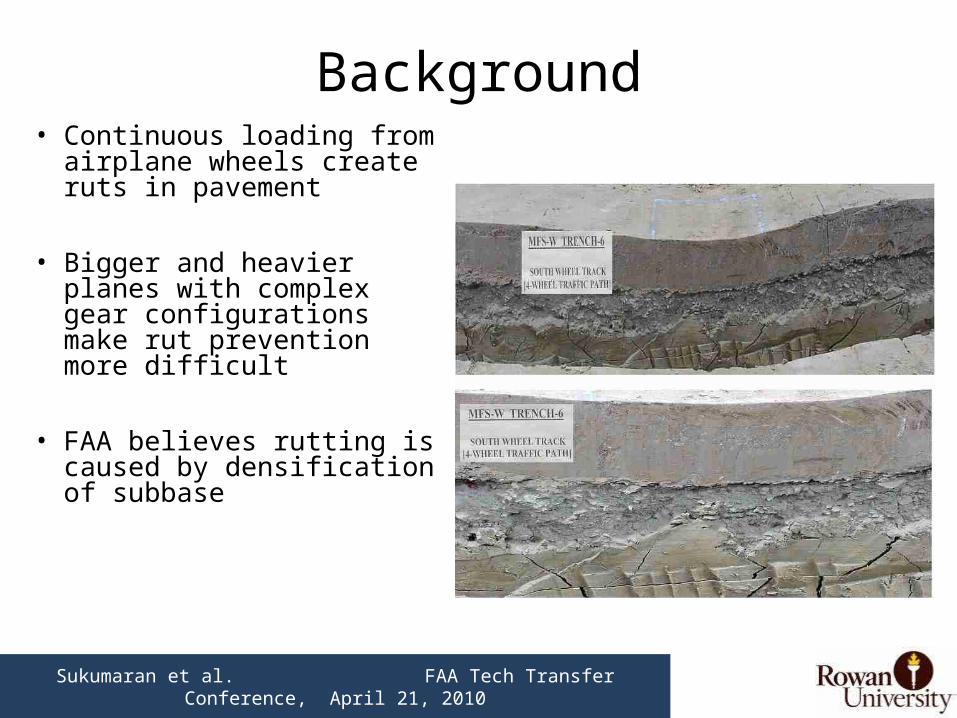
Background• Continuous loading from
airplane wheels create ruts in pavement
• Bigger and heavier planes with complex gear configurations make rut prevention more difficult
• FAA believes rutting is caused by densification of subbase
Sukumaran et al. FAA Tech Transfer Conference, April 21, 2010
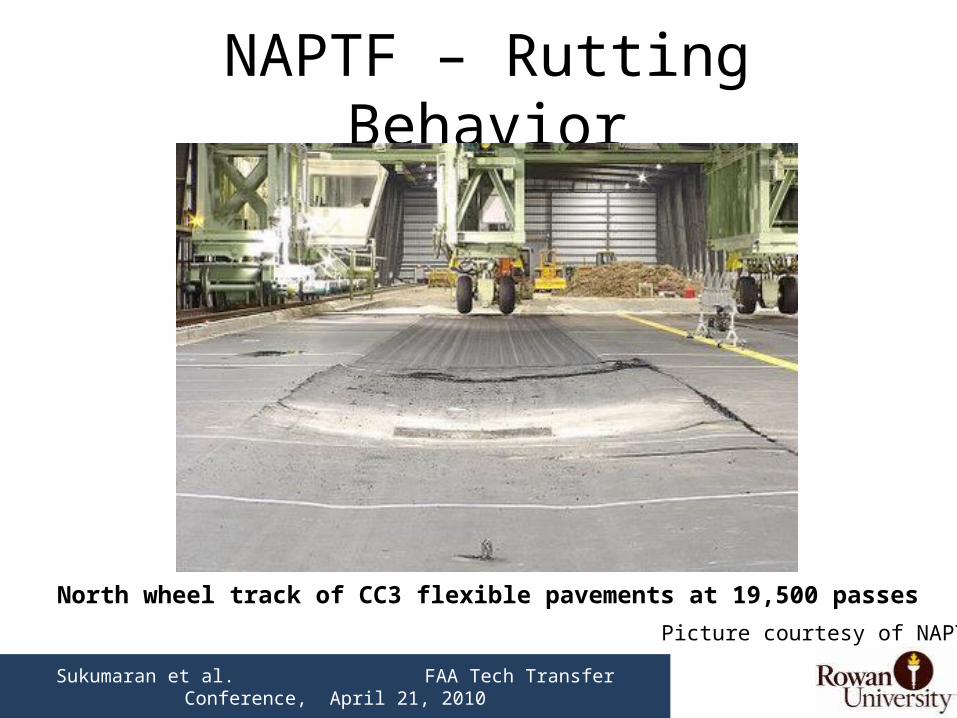
NAPTF – Rutting Behavior
North wheel track of CC3 flexible pavements at 19,500 passes
Picture courtesy of NAPTF
Sukumaran et al. FAA Tech Transfer Conference, April 21, 2010
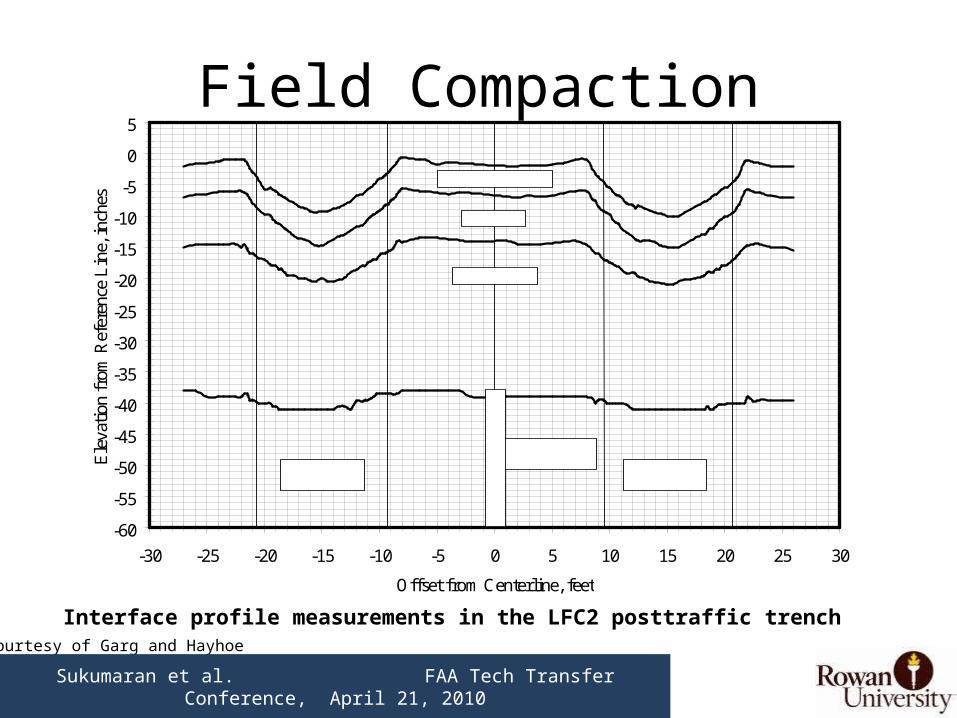
Field Compaction
-60
-55
-50
-45
-40
-35
-30
-25
-20
-15
-10
-5
0
5
-30 -25 -20 -15 -10 -5 0 5 10 15 20 25 30
Offset from Centerline, feet
Ele
vati
on f
rom
Ref
eren
ce L
ine,
inch
es
LOW-STRENGTHSUBGRADE
SIX-WHEELTRAFFIC PATH
FOUR-WHEELTRAFFIC PATH
PA
VE
ME
NT
CE
NT
ER
LIN
E
P-401 AC SURFACE
P-209 BASE
P-154 SUBBASE
Interface profile measurements in the LFC2 posttraffic trench Courtesy of Garg and Hayhoe
Sukumaran et al. FAA Tech Transfer Conference, April 21, 2010
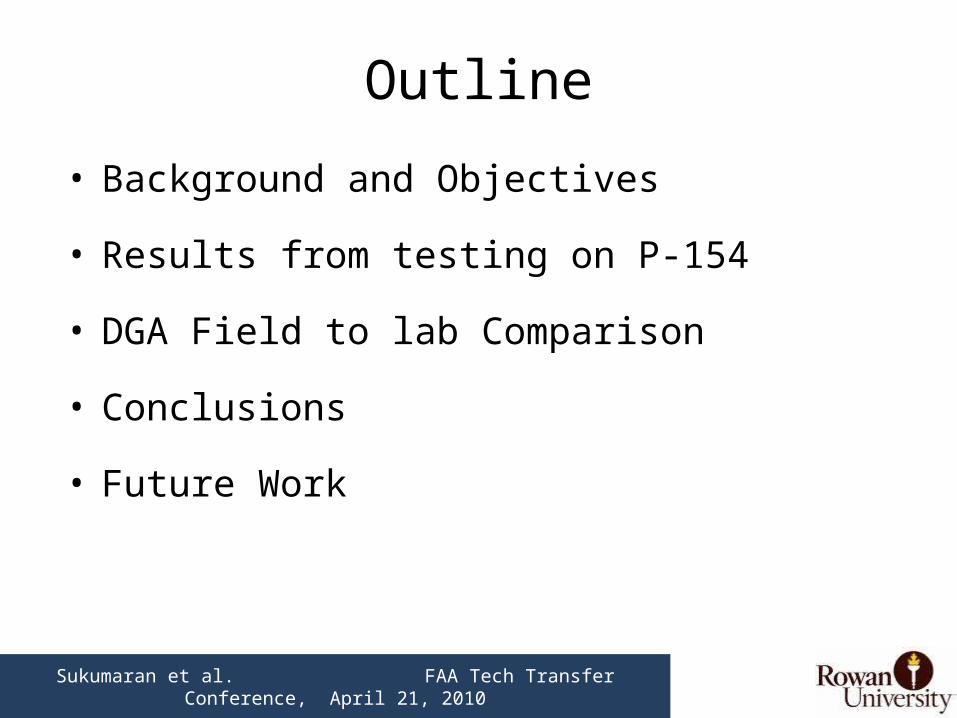
• Background and Objectives
• Results from testing on P-154
• DGA Field to lab Comparison
• Conclusions
• Future Work
Outline
Sukumaran et al. FAA Tech Transfer Conference, April 21, 2010
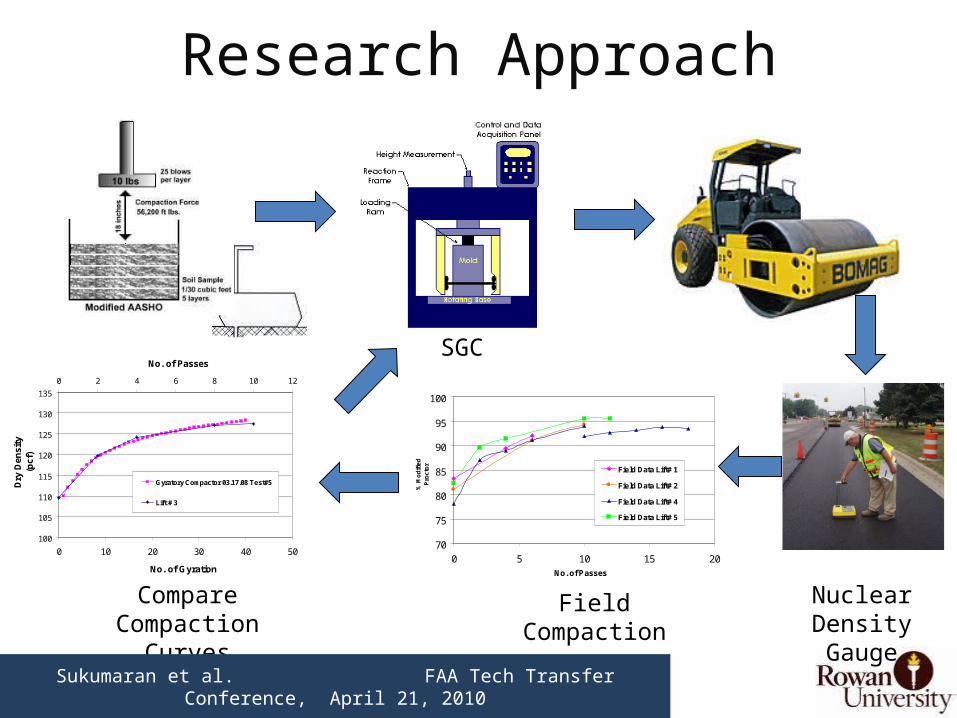
Research Approach
70
75
80
85
90
95
100
0 5 10 15 20No. of Passes
% M
od
ifie
d
Pro
cto
r
Field Data Lift# 1
Field Data Lift# 2
Field Data Lift# 4
Field Data Lift# 5
SGC
Nuclear Density Gauge
Field Compaction
100
105
110
115
120
125
130
135
0 10 20 30 40 50
No. of Gyration
Dry
Den
sity
(p
cf)
0 2 4 6 8 10 12
No. of Passes
Gyratory Compactor 03.17.08 Test#5
Lift # 3
Compare Compaction
CurvesSukumaran et al. FAA Tech Transfer Conference, April 21,
2010
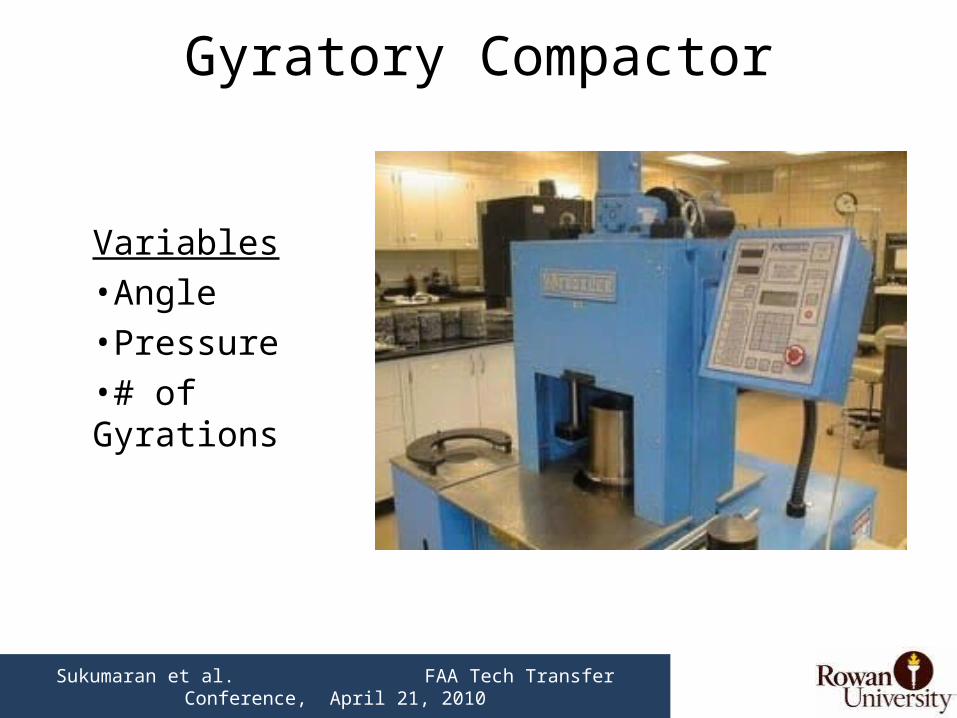
Variables•Angle•Pressure•# of Gyrations
Gyratory Compactor
Sukumaran et al. FAA Tech Transfer Conference, April 21, 2010
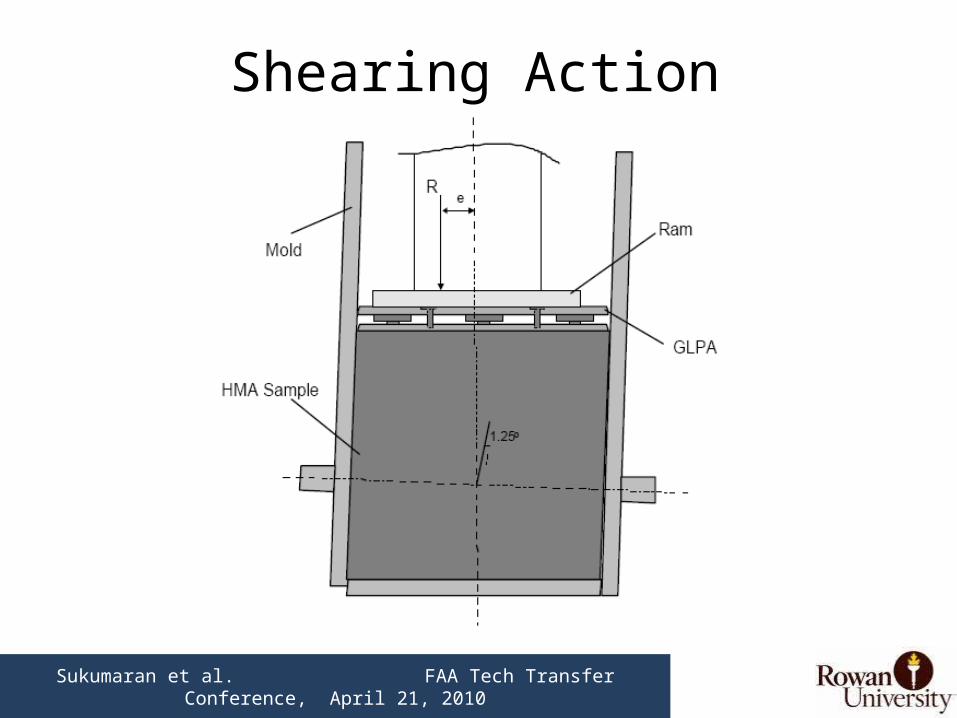
Shearing Action
Sukumaran et al. FAA Tech Transfer Conference, April 21, 2010
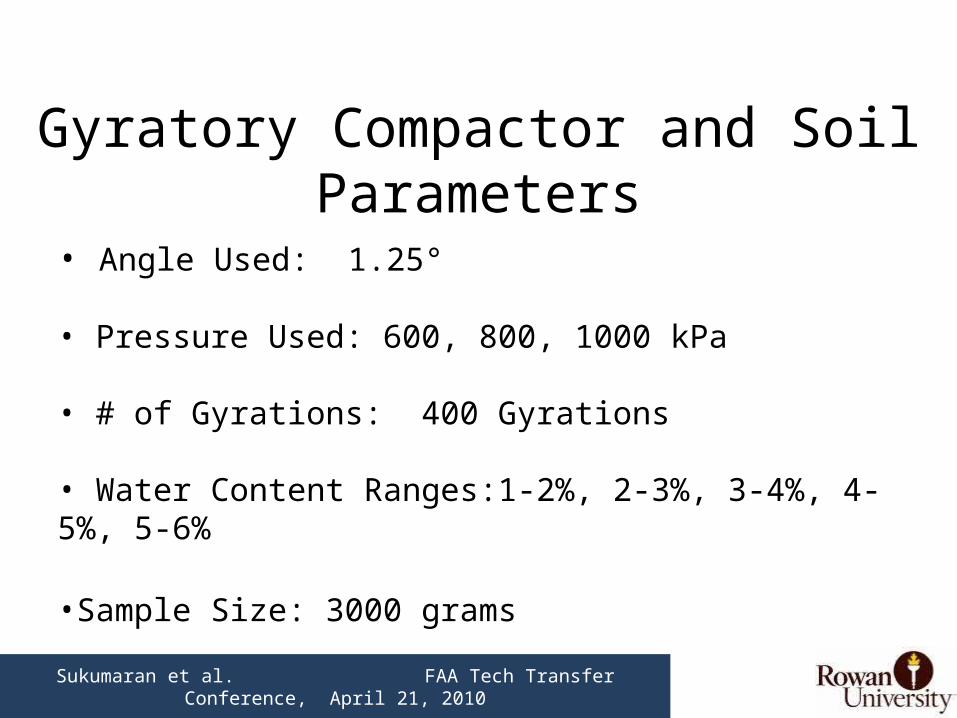
• Angle Used: 1.25°
• Pressure Used: 600, 800, 1000 kPa
• # of Gyrations: 400 Gyrations
• Water Content Ranges:1-2%, 2-3%, 3-4%, 4-5%, 5-6%
•Sample Size: 3000 grams
Gyratory Compactor and Soil Parameters
Sukumaran et al. FAA Tech Transfer Conference, April 21, 2010
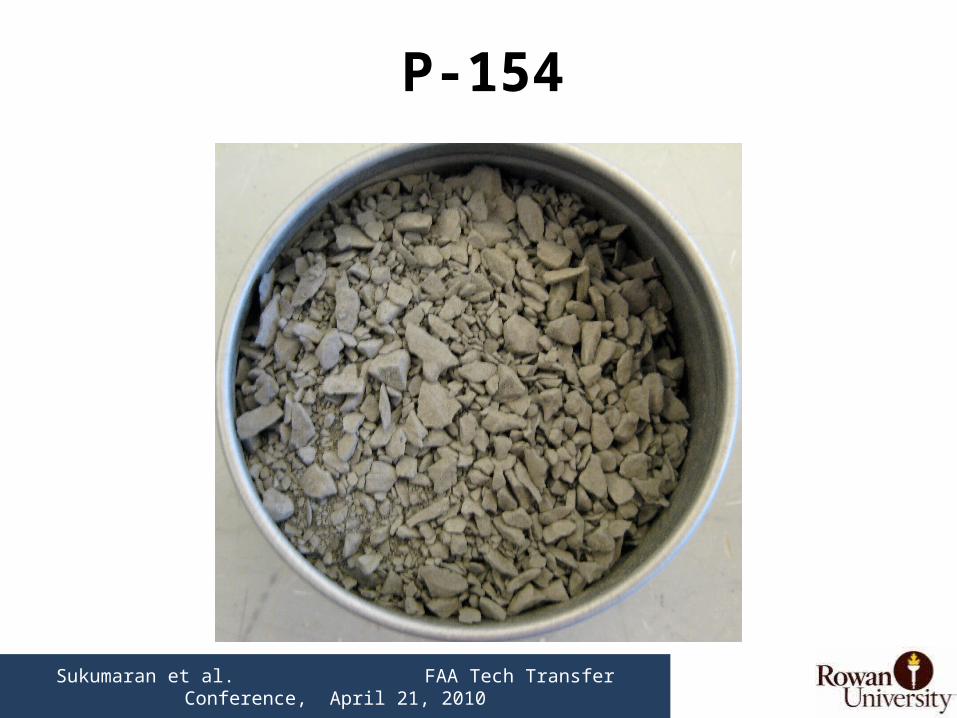
P-154
Sukumaran et al. FAA Tech Transfer Conference, April 21, 2010
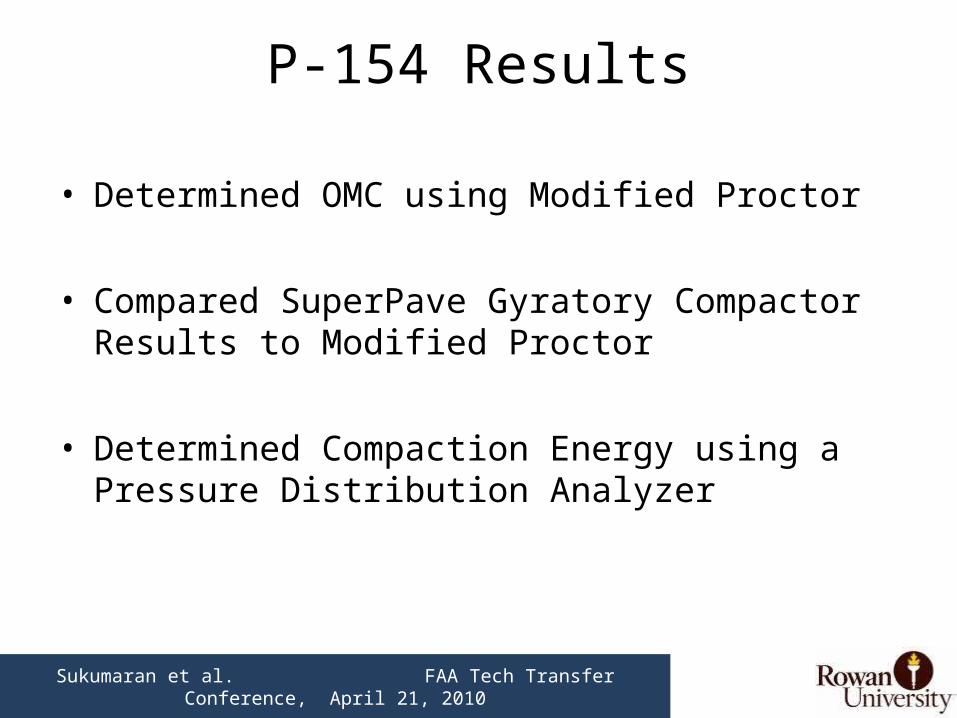
• Determined OMC using Modified Proctor
• Compared SuperPave Gyratory Compactor Results to Modified Proctor
• Determined Compaction Energy using a Pressure Distribution Analyzer
P-154 Results
Sukumaran et al. FAA Tech Transfer Conference, April 21, 2010
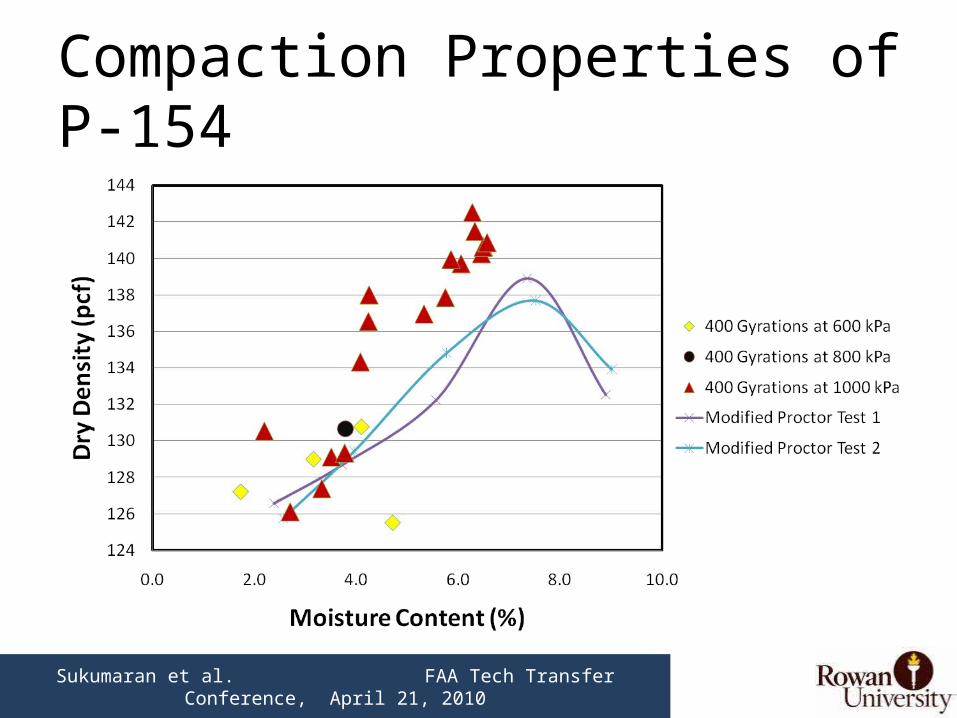
Compaction Properties of P-154
Sukumaran et al. FAA Tech Transfer Conference, April 21, 2010
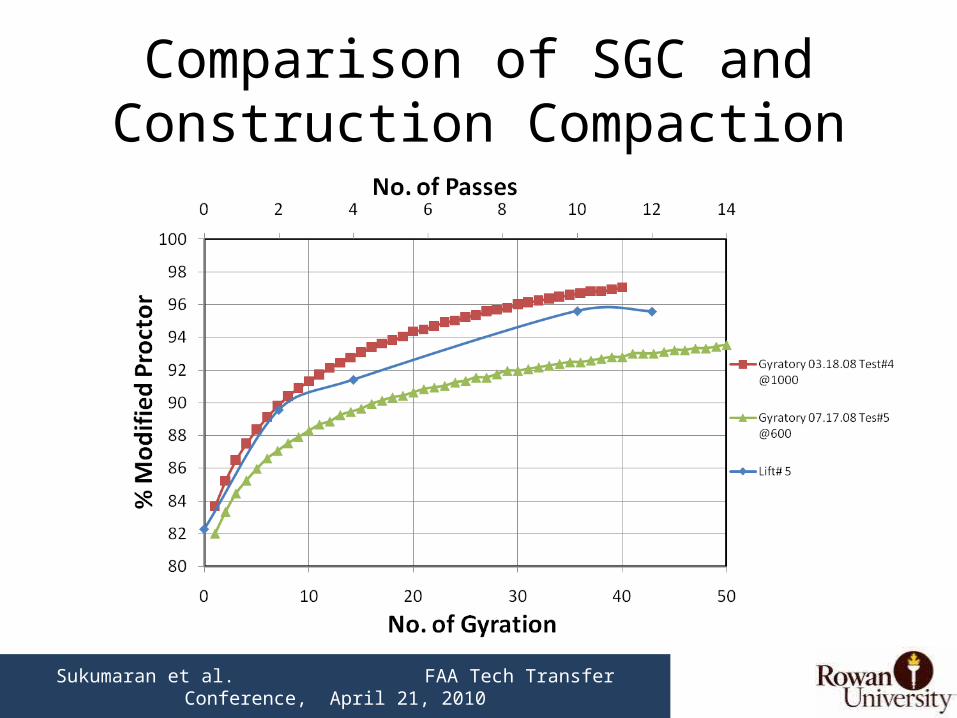
Comparison of SGC and Construction Compaction
Sukumaran et al. FAA Tech Transfer Conference, April 21, 2010
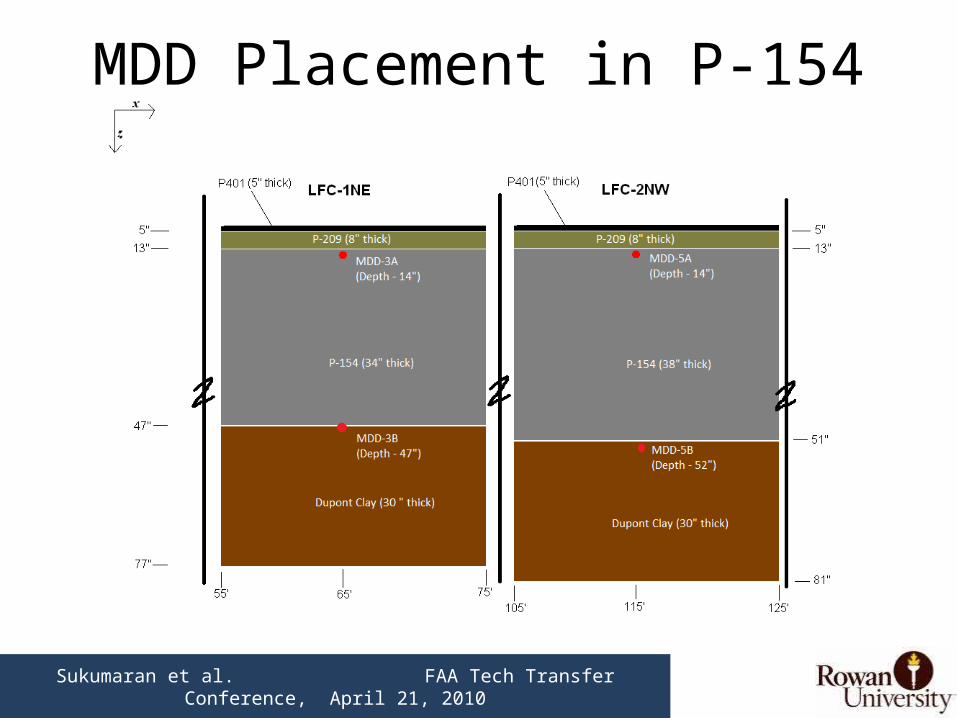
MDD Placement in P-154
Sukumaran et al. FAA Tech Transfer Conference, April 21, 2010
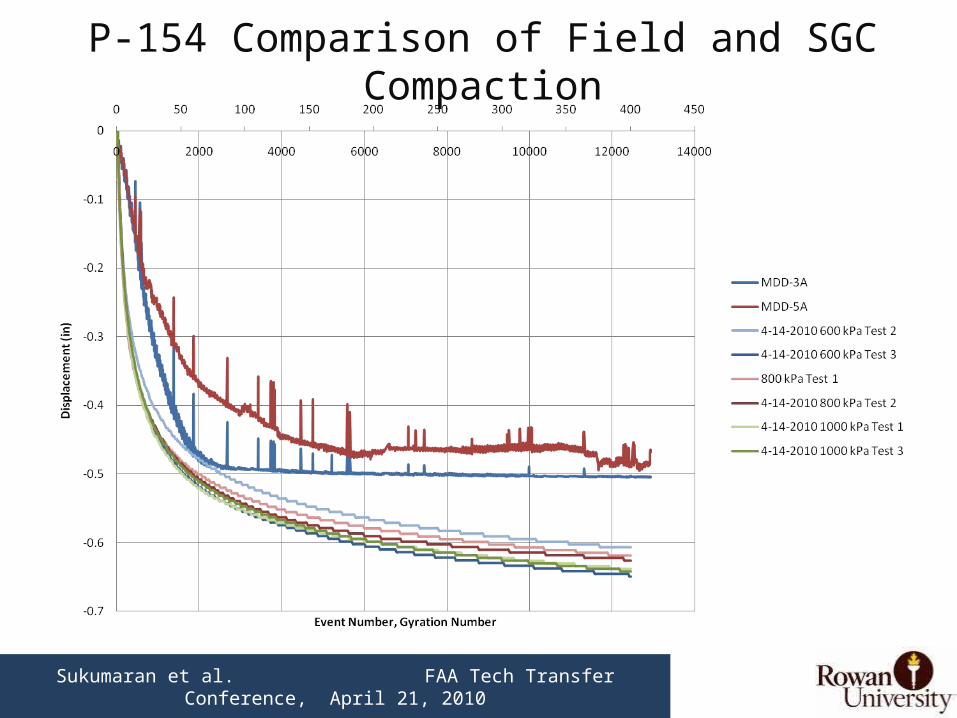
P-154 Comparison of Field and SGC Compaction
Sukumaran et al. FAA Tech Transfer Conference, April 21, 2010
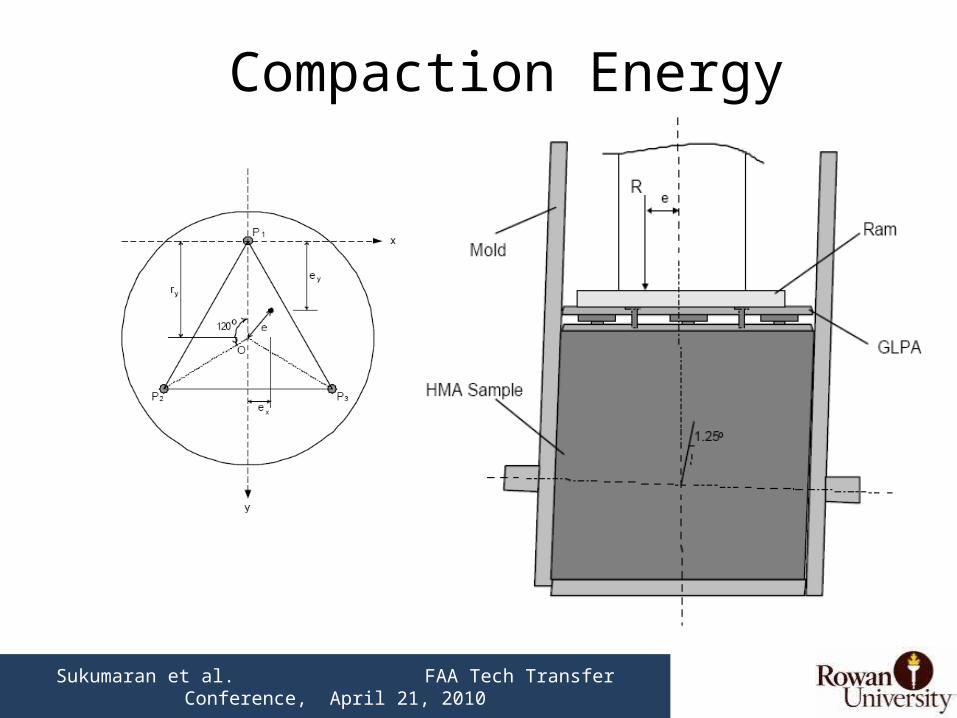
Compaction Energy
Sukumaran et al. FAA Tech Transfer Conference, April 21, 2010
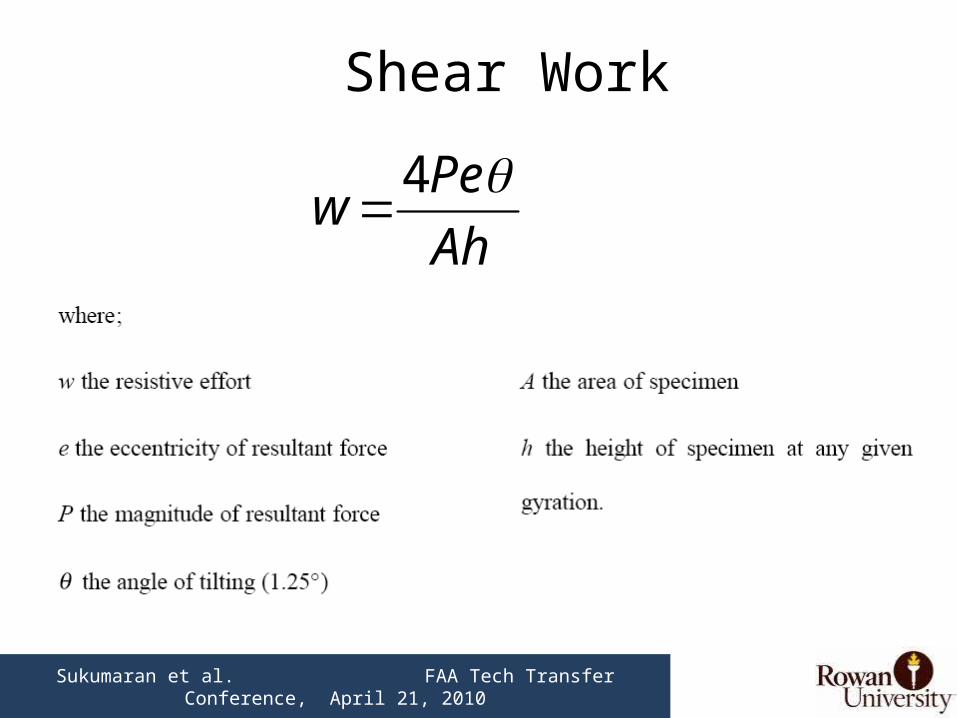
Shear Work
Ah
Pew
4
Sukumaran et al. FAA Tech Transfer Conference, April 21, 2010
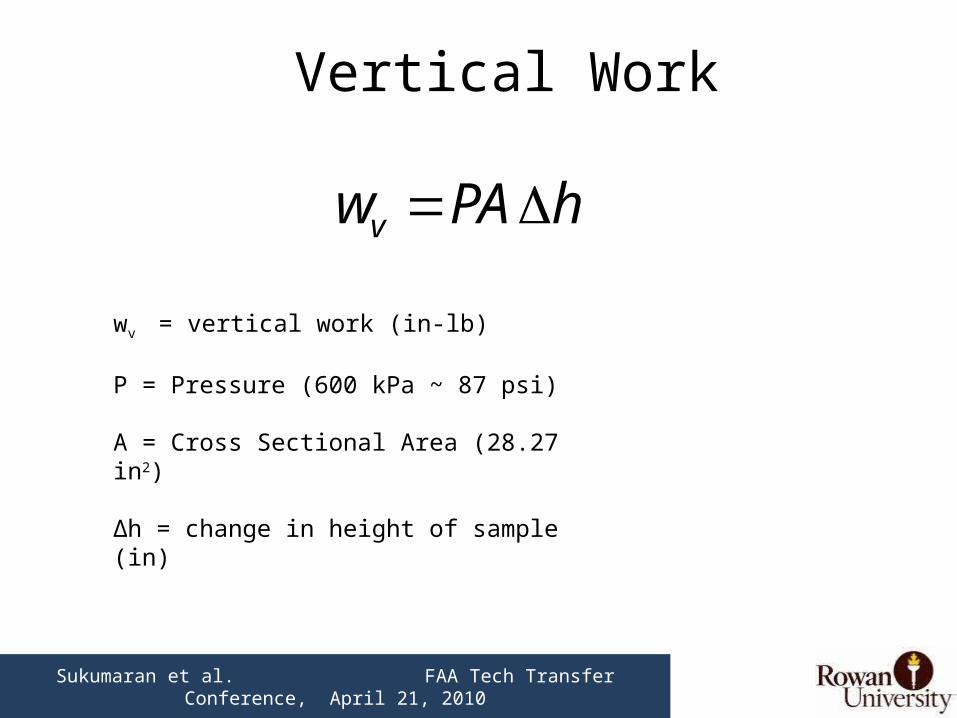
Vertical Work
hPAwv
wv = vertical work (in-lb)
P = Pressure (600 kPa ~ 87 psi)
A = Cross Sectional Area (28.27 in2)
∆h = change in height of sample (in)
Sukumaran et al. FAA Tech Transfer Conference, April 21, 2010
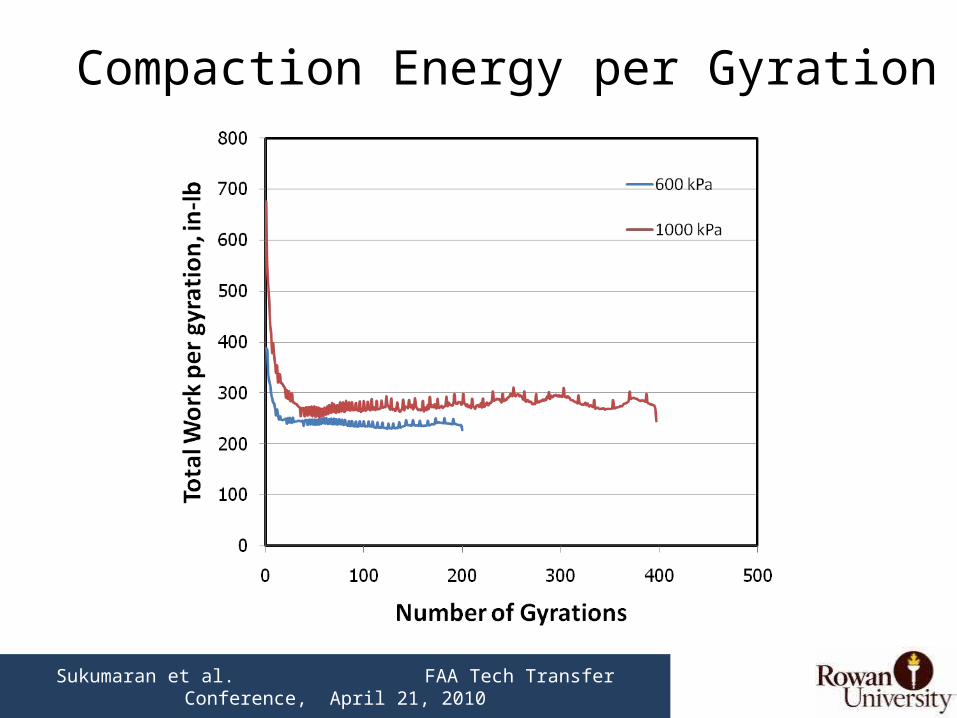
Compaction Energy per Gyration
Sukumaran et al. FAA Tech Transfer Conference, April 21, 2010
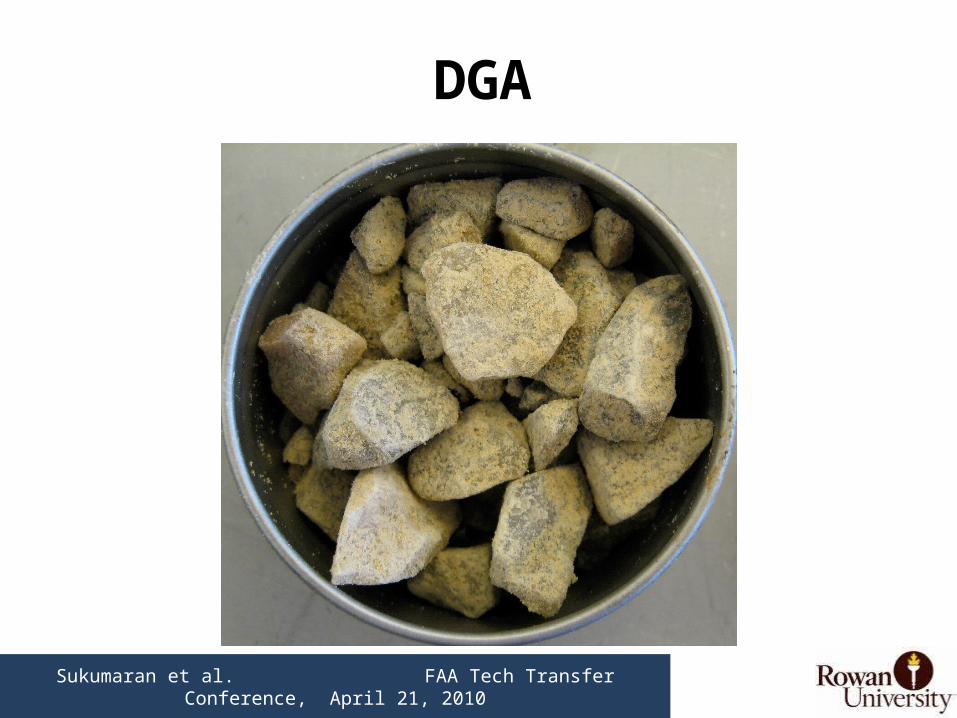
DGA
Sukumaran et al. FAA Tech Transfer Conference, April 21, 2010
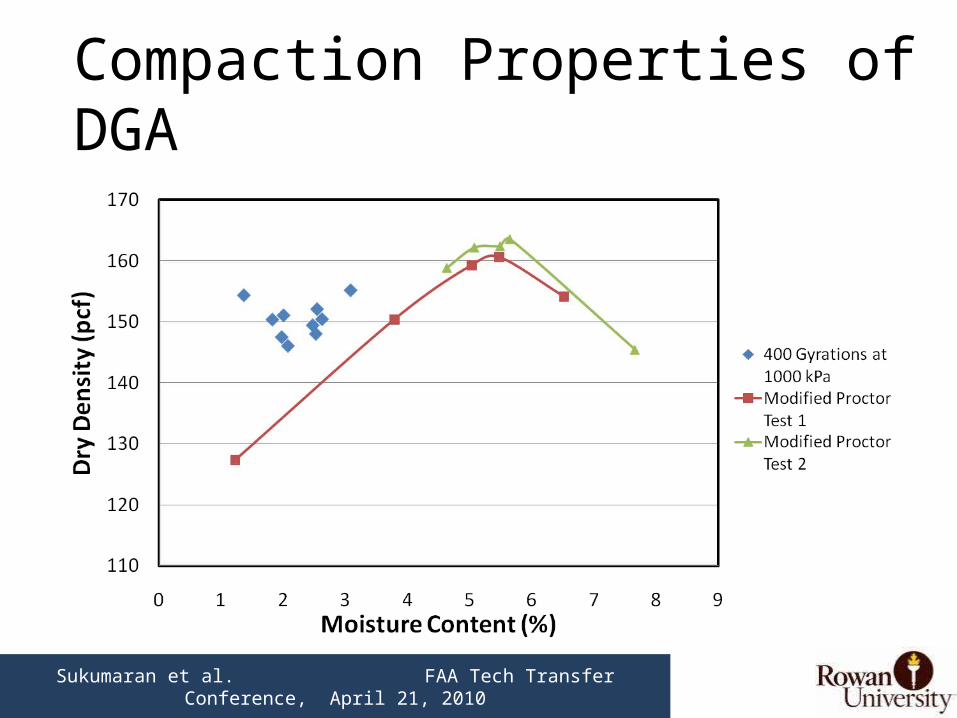
Compaction Properties of DGA
Sukumaran et al. FAA Tech Transfer Conference, April 21, 2010
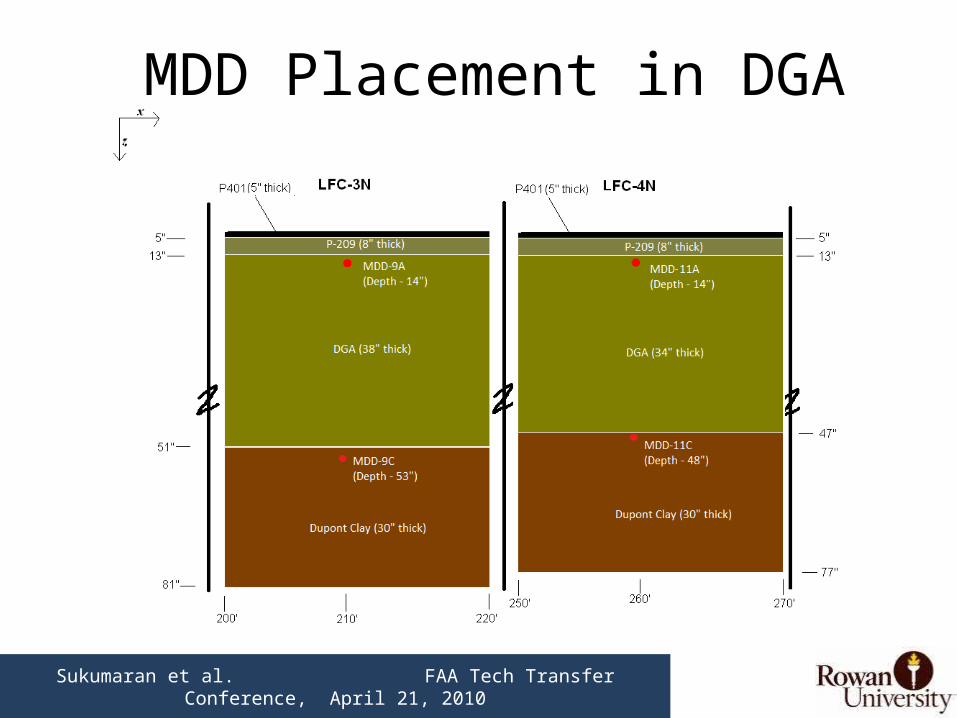
MDD Placement in DGA
Sukumaran et al. FAA Tech Transfer Conference, April 21, 2010
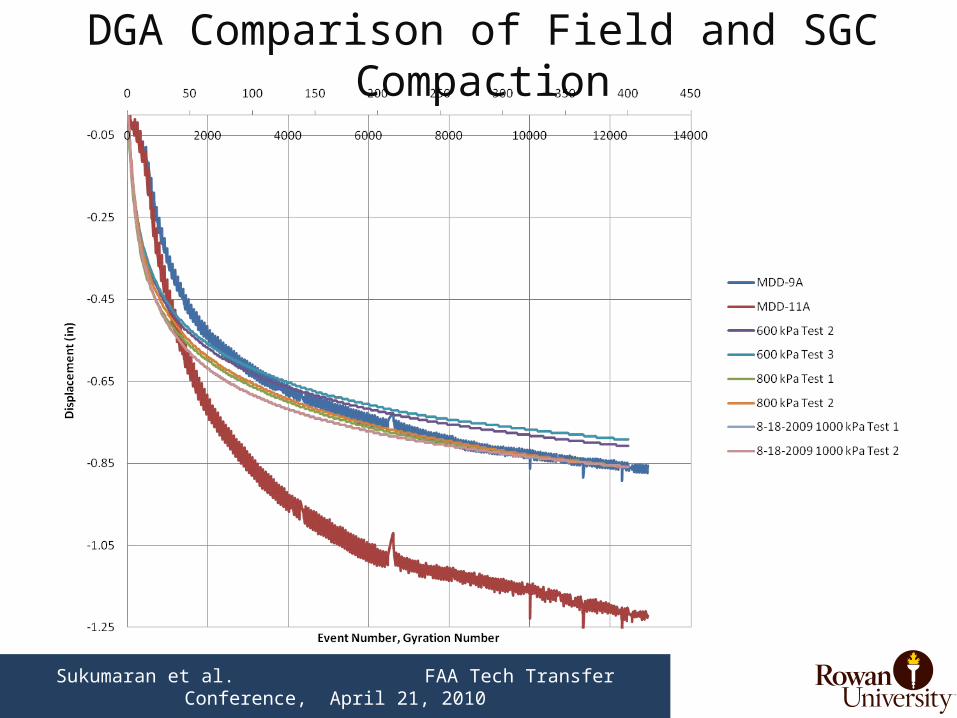
DGA Comparison of Field and SGC Compaction
Sukumaran et al. FAA Tech Transfer Conference, April 21, 2010
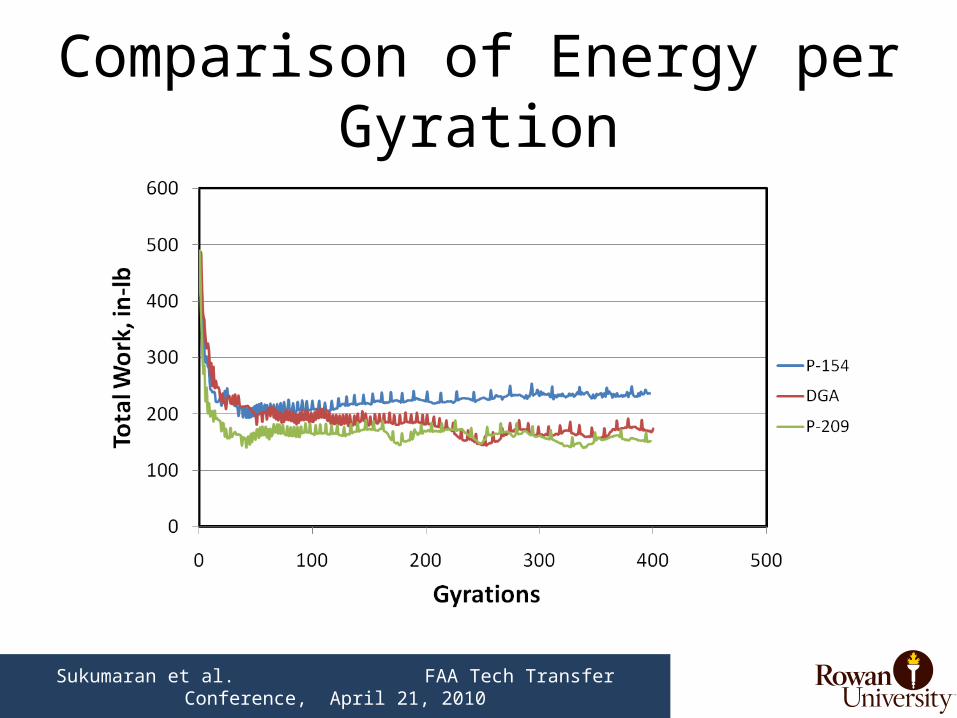
Comparison of Energy per Gyration
Sukumaran et al. FAA Tech Transfer Conference, April 21, 2010
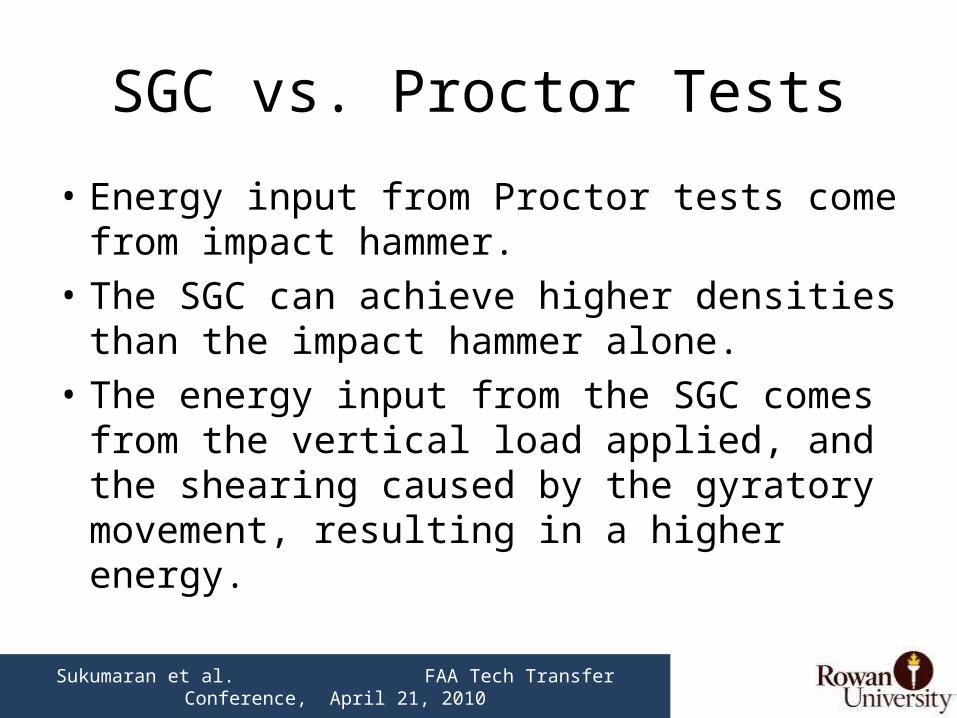
SGC vs. Proctor Tests
• Energy input from Proctor tests come from impact hammer.
• The SGC can achieve higher densities than the impact hammer alone.
• The energy input from the SGC comes from the vertical load applied, and the shearing caused by the gyratory movement, resulting in a higher energy.
Sukumaran et al. FAA Tech Transfer Conference, April 21, 2010
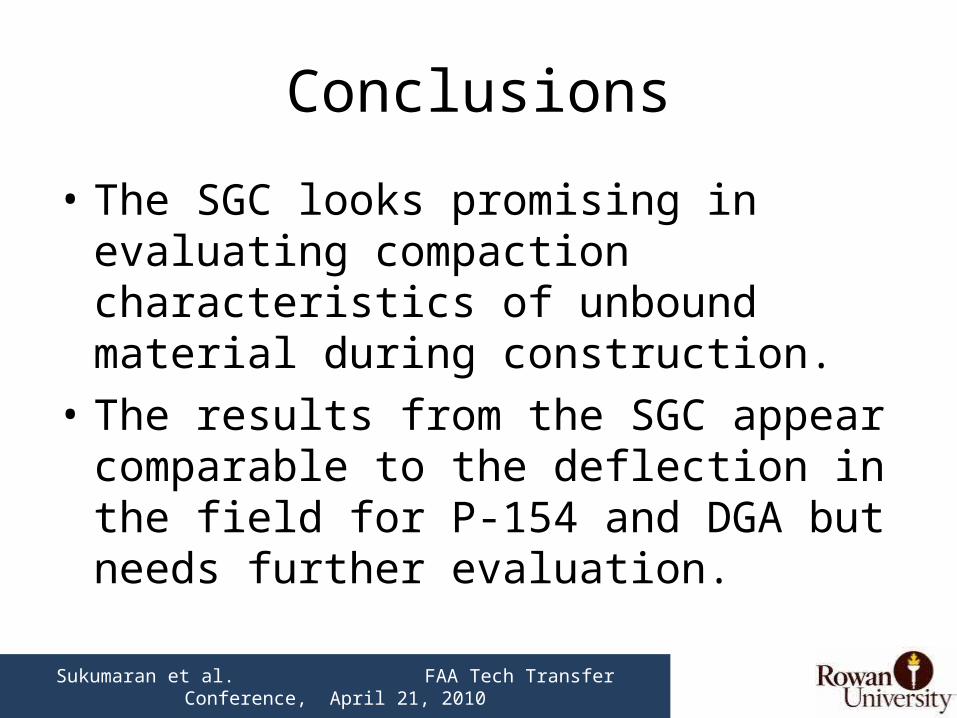
Conclusions
• The SGC looks promising in evaluating compaction characteristics of unbound material during construction.
• The results from the SGC appear comparable to the deflection in the field for P-154 and DGA but needs further evaluation.
Sukumaran et al. FAA Tech Transfer Conference, April 21, 2010
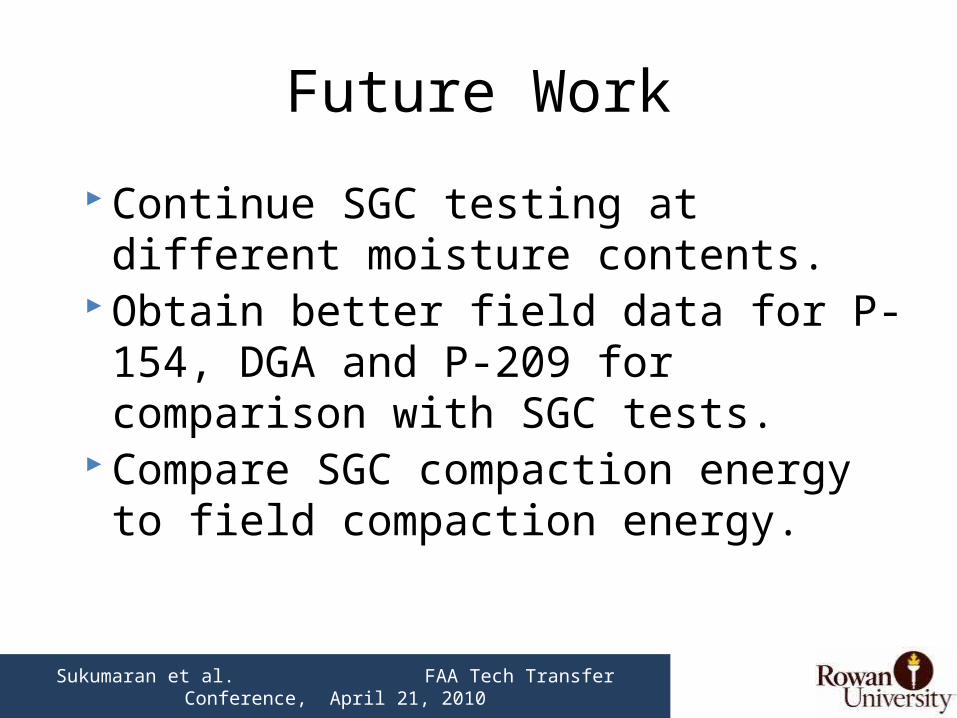
Future Work
Continue SGC testing at different moisture contents.
Obtain better field data for P-154, DGA and P-209 for comparison with SGC tests.
Compare SGC compaction energy to field compaction energy.
Sukumaran et al. FAA Tech Transfer Conference, April 21, 2010
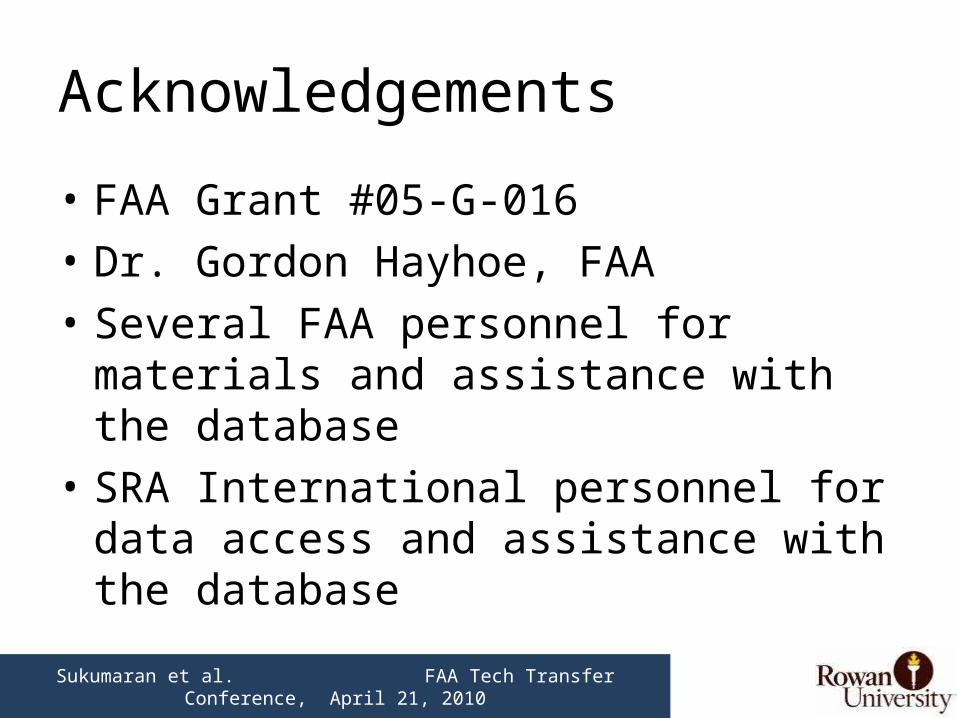
Acknowledgements
• FAA Grant #05-G-016• Dr. Gordon Hayhoe, FAA• Several FAA personnel for materials and
assistance with the database• SRA International personnel for data access
and assistance with the database
Sukumaran et al. FAA Tech Transfer Conference, April 21, 2010
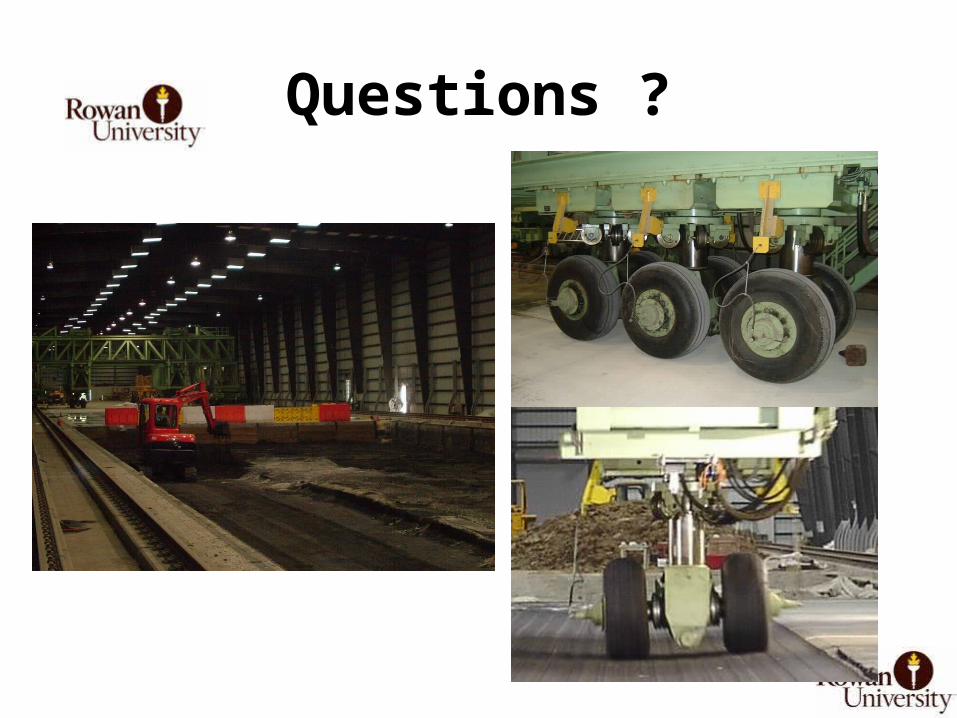
Questions ?

Date Test GyrationsPressure
(kPa)
% WaterAdded
byweight
MoistureContent% (Top)
Moisture Content %
(Bottom)
Avg. Moisture
(%)
MoistureDifference
(%)
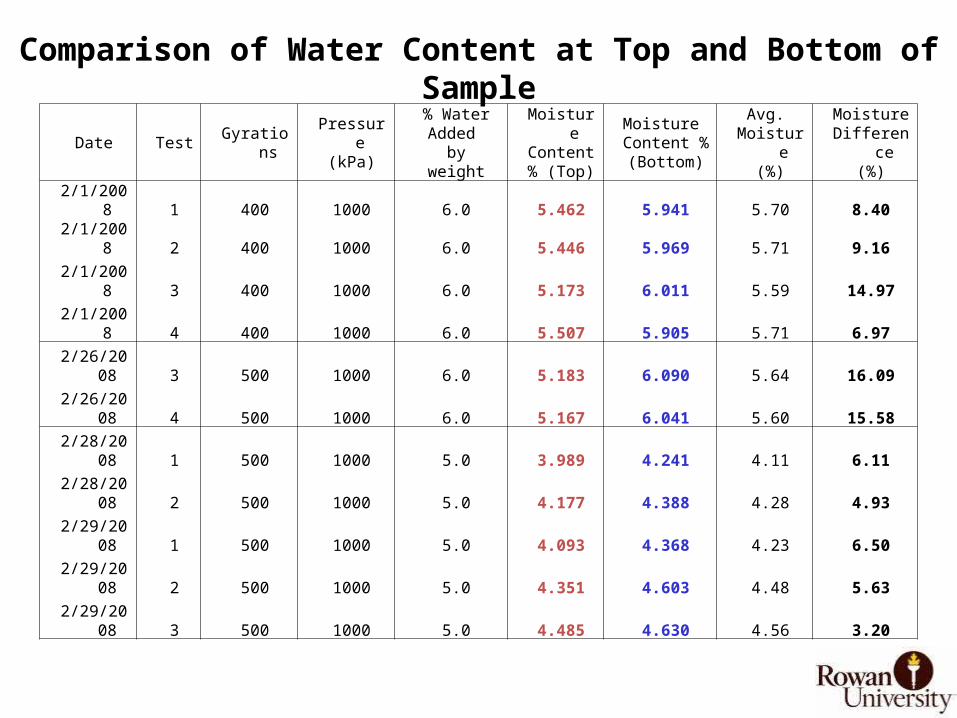
2/1/2008 1 400 1000 6.0 5.462 5.941 5.70 8.40
2/1/2008 2 400 1000 6.0 5.446 5.969 5.71 9.16
2/1/2008 3 400 1000 6.0 5.173 6.011 5.59 14.97
2/1/2008 4 400 1000 6.0 5.507 5.905 5.71 6.97
2/26/2008 3 500 1000 6.0 5.183 6.090 5.64 16.09
2/26/2008 4 500 1000 6.0 5.167 6.041 5.60 15.58
2/28/2008 1 500 1000 5.0 3.989 4.241 4.11 6.11
2/28/2008 2 500 1000 5.0 4.177 4.388 4.28 4.93
2/29/2008 1 500 1000 5.0 4.093 4.368 4.23 6.50
2/29/2008 2 500 1000 5.0 4.351 4.603 4.48 5.63
2/29/2008 3 500 1000 5.0 4.485 4.630 4.56 3.20
Comparison of Water Content at Top and Bottom of Sample


![A Selection of Sermon Outlines from John W. McGarvey · A Selection of Sermon Outlines from John W. McGarvey ... of sermon outlines and outlines of other lectures on the ... Rev[elation]](https://img.pdfslide.net/doc/110x75/5b3d1c347f8b9a0e628e05ab/a-selection-of-sermon-outlines-from-john-w-mcgarvey-a-selection-of-sermon-outlines.jpg)
![Key To Successful Tower Installations: Under Stack …1].pdf5/20/2005 J. F. Corini KE1IH-YCCC 1 John Corini - PE Key To Successful Tower Installations: Under Stack And Over Guy Tom](https://img.pdfslide.net/doc/110x75/5add63c77f8b9a4a268d7dbd/key-to-successful-tower-installations-under-stack-1pdf5202005-j-f-corini.jpg)


![COMENTARIO AL LIBRO DE HECHOS DE W. McGarvey, Traducido[1]](https://img.pdfslide.net/doc/110x75/5571ffaf49795991699dd8f8/comentario-al-libro-de-hechos-de-w-mcgarvey-traducido1.jpg)
