Embed Size (px)
Citation preview

EVALUATION OF SUGARCANE PRESS RESIDUE (SPR) IN TERMS OF ITS METABOLIZABLE ENERGY AND OTHER
NUTRIENTS IN BROILERS AND LAYERS
SURESH, B.N.
DEPARTMENT OF ANIMAL NUTRITION VETERINARY COLLEGE, HEBBAL, BANGALORE
KARNATAKA VETERINARY, ANIMAL AND FISHERIES SCIENCES UNIVERSITY, BIDAR
2007 EVALUATION OF SUGARCANE PRESS RESIDUE (SPR) IN
TERMS OF ITS METABOLIZABLE ENERGY AND OTHER NUTRIENTS IN BROILERS AND LAYERS
SURESH, B.N.
Thesis submitted to the
Karnataka Veterinary, Animal And Fisheries Sciences University, Bidar
in partial fulfillment of the requirements
for the award of the degree of
Doctor of Philosophy
in
ANIMAL NUTRITION

Bangalore August,
2007
Sincerely Dedicated To
My Beloved Mentor
Prof. B.S.Venkatarami Reddy

DEPARTMENT OF ANIMAL NUTRITION VETERINARY COLLEGE, BANGALORE
KARNATAKA VETERINARY, ANIMAL AND FISHERIES SCIENCES UNIVERSITY, BIDAR.
Certif icate
This is to certify that the thesis entitled "EVALUATION OF SUGARCANE PRESS RESIDUE (SPR) IN TERMS OF ITS METABOLIZABLE ENERGY AND OTHER NUTRIENTS IN BROILERS AND LAYERS" submitted by Mr.SURESH,B.N., in partial fulfillment of the requirements for the award of DOCTOR OF PHILOSOPHY in ANIMAL NUTRITION of the Karnataka Veterinary, Animal and Fisheries Sciences University, Bidar is a record of bonafide research work carried out by him during the period of his study in this University under my guidance and supervision and the thesis has not previously formed the basis for the award of any degree, diploma, associationship, fellowship or other similar titles. Bangalore-560 024. 31st August, 2007
(B.S. VENKATARAMI REDDY) Dean
Veterinary College, K.V.A.F.S.U., Hebbal, Bangalore-560 024.
Approved By: Chairman: B.S.VENKATARAMI REDDY
Members: 1. R.GIDEON GLORI DOSS
2. T.M.PRABHU
3. M.L.SATHYANARAYANA

4. N.K.SHIVAKUMAR GOWDA

ACKNOWLEDGEMENT At the outset, I place my deep sense of gratitude with heartfelt respect
to Prof. B.S. Venkatarami Reddy, Dean, Veterinary College, Hebbal,
Bangalore and Chairperson of my Advisory Committee, for his expert
guidance, constant encouragement, constructive suggestions, kindness and
the immense care and concern he bestowed on me throughout the course of
my study. I feel fortunate to have worked under such a elegant mentor and I
will remain faithful to him and his family members for their loving and caring
nature.
I am grateful to Dr. R. Gideon Glori Doss, Professor, Department of
Animal Nutrition, Veterinary College, Bangalore, for his suggestions and for
serving as member of my Advisory Committee.
I owe my thanks to Dr. T.M. Prabhu, Assistant Professor (Sr. Scale),
Department of Animal Nutrition, Veterinary College, Bangalore, for his
constructive criticism, valuable suggestions and for serving as member of my
Advisory Committee.
My Sincere thanks to Dr. M.L. Sathyanarayana, Professor and Head,
Department of Vety. Pathology, Veterinary College, Bangalore, for his
constant vigil on my research and for serving as member of my Advisory
Committee.
I wish to extend my sincere thanks to Dr. N. K. Shivakumar Gowda,
Senior Scientist, NIANP (ICAR), Adugodi, Bangalore-560 030 for his regular
and sincere enquiries, concern, gentle appreciation and suggestion during
early stages of my study and for having served as member of my Advisory
Committee.
It is indeed, an immense pleasure to express my sincere gratitude to
Prof. K. Chnadrapal Singh, Head, Dept. of Animal Nutrition, Veterinary
College, Bangalore, for his gentleness, generous interest, deep concern and
undeterred faith.
Special thanks to Dr. A.S. Rajendiran, Senior Scientist, CSWRI (SRS), Kodaikanal for his immensely priced appreciation during my Masters’ degree programme, have academically and emotionally kindled and sustained my devotion and enthusiasm during later stages of my study.

My sincere thanks to Dr. U. Krishnamoorthy (Head, Division of Animal Science) and Dr. B. Umakanth (Former Head, Dept. of Poultry Science), for their goodwill, moral support and encouragement.
I gratefully acknowledge the contribution / assistance received from the
following organizations / dept. for making this study a success
Sri Venkateshwara Poultry Farm, Bangalore …..for provide all the necessary facilities to conduct trials involving
layers M/s KPS Biotech Pvt. Ltd., Mysore
…..for supplying enzyme preparations M/s Sujay Feeds and Sapna Hatcheries, Bangalore
…..for supplying feed ingredients and broiler chicks M/s Degussa-Huls-AG, Germany
…..for analyzing the amino acid profile of SPR samples M/s Mysore Sugars Ltd., Mandya
…..for sparing SPR sample for conducting biological trials National Institute of Animal Nutrition and Physiology, Bangalore
…..for providing facilities to analyze mineral constituents of SPR samples
Dept. of Animal Nutrition, VCRI, Namakkal …..for providing laboratory facilities to analyze gross energy of
samples Dept. of Poultry Science, Bangalore
…..for sparing materials to conduct birds’ trials Dept. of Livestock Production and Management, Bangalore
…..for providing laboratory facilities to analyze P and Cr of samples Dept. of Pharmacology and Toxicology, Bangalore
…..for providing facilities to analyze blood mineral profiles Dept. of Vet. Pathology, Bangalore
…..for conducting Post Mortem Examination of dead birds I sincerely express my deep cordial gratitude to my colleague Dr. T.
Thirumalesh (Assistant Professor, College of Agriculture, Bijapur) for having stood with me always. I lovingly thank all the PhD Scholars of Dept. of Animal Nutrition: Mrs. Deepa Ananth, Ms. N. Suma, Dr. P.C. Bolka, Dr. Avinash Nirmale and Dr. B. Ramachanrda.

I sincerely express my loving gratitude to all my fellow PG students, colleagues and friends: Drs. Bhavisya, Pasha, Nagaraj, Ramesh (400 series), Aniket, Nagesh, Madhu, Hebbali (500 series), Devraj, Keshava, Ramu and Vishwanath (600 series).
I am highly grateful to Dr. C. Basavanth Kumar, for sharing his
knowledge in poultry husbandry related matter and for critical scrutiny of
manuscript. I also thank Mr. Basavaraju, Statistician and Dr. K. Venkata
Reddy, Assoc. Prof. (APM) for their needy help.
I am also grateful to Mr. Prakash of Proland Computers for his skillful
typing and alignment of the thesis in time.
I also express my memorable thanks without fail to non-teaching staff
members of Dept of Animal Nutrition: Mr. Rangaswamy, Swamy Gowda, Munirathnaiah and staff members of Dean’s Office, Mr. Chandrashekar,
Prabhakar and Mrs. Rosaline for their co-operation and help.
I am highly grateful to the Secretariat, Dept. of Animal Husbandry and
Fisheries, Govt. of Karnataka for extending my joining date for the post of
Veterinary Officer, to pursue the PhD course at KVAFSU.
I cannot find words of enough power to express my love and gratitude
to my parents who were not only understanding and tolerant but with open
heartedly allowing me to take any decision regarding my career. I also
express thanks to all my relatives for their moral support.
Lastly, I submit my record of gratitude to all my teachers who have
shaped my life and also to all the persons who involved in one way or the
other for the successful completion of this piece of work.
Bangalore (Suresh, B.N.) 31st August, 2007
C O N T E N T
CHAPTER TITLE
I. INTRODUCTION
II. REVIEW OF LITERATURE
III. MATERIALS AND METHODS
IV. RESULTS AND DISCUSSION
V. SUMMARY AND CONCLUSION
VI. REFERENCES
VII. APPENDICES

LIST OF TABLE
Table No.
Particulars
2.1 Exclusive sources of minerals 2.2 Recommended nutrient specification for different classes of poultry
by various agencies 3.1 Ingredient and calculated nutrient composition of experimental
diets used in metabolism trial of broilers 3.2 Ingredient and calculated nutrient composition of experimental
diets used in metabolism trial of layers 3.3 Ingredient composition of experimental diets compounded for
different phases during performance trial of broilers 3.4 Calculated nutrient composition of experimental diets compounded
for different phases during performance trial of broilers 3.5 Ingredient and calculated nutrient composition of experimental
diets compounded during performance trial of layers 4.1 Per cent proximate composition of differentially dried SPR samples
from different factories 4.2 Fiber fractions (%) of sun-dried SPR samples from different factories 4.3 Mineral constituents of sun-dried SPR samples from different
factories 4.4 Amino acid profile of SPR samples from different factories 4.5 Fatty acids profile of SPR sample selected for biological trial 4.6 Proximate composition and gross energy of experimental diets used
in metabolism trial of broilers 4.7 Metabolizability coefficient of various nutrients of experimental
diets used in metabolism trial of broilers 4.8 Metabolizability coefficient of various nutrients of sun-dried SPR
sample employed for metabolism trial of broilers 4.9 Performance of birds under different treatments during different
weeks (2nd and 3rd week) of metabolism trial of broilers 4.10 Proximate composition and gross energy of experimental diets used
in metabolism trial of layers 4.11 Metabolizability coefficient of various nutrients of experimental
diets used in metabolism trial of layers 4.12 Metabolizability coefficient of various nutrients of sun-dried SPR as
determined by difference method in metabolism trial of layers 4.13 Performance of birds under different treatments during 14-day
metabolism period of layers 4.14 Analyzed chemical composition of experimental diets compounded
for different phases during performance trial of broilers 4.15 Weekly average body weight gain of birds as influenced by different

treatments and main factors during performance trial of broilers

Table No. Particulars
4.16 Phase wise and cumulative average body weight gain of birds as influenced by different treatments and main factors during performance trial of broilers
4.17 Weekly average feed consumption of birds as influenced by different treatments and main factors during performance trial of broilers
4.18 Phase wise and cumulative average feed consumption of birds as influenced by different treatments and main factors during performance trial of broilers
4.19 Weekly average feed conversion ratio of birds as influenced by different treatments and main factors during performance trial of broilers
4.20 Phase wise and cumulative average feed conversion ratio of birds as influenced by different treatments and main factors during performance trial of broilers
4.21 Metabolizability of various nutrients of experimental diets as influenced by different treatments and main factors during performance trial of broilers
4.22 Calcium and phosphorus retention of experimental diets as influenced by different treatments and main factors during performance trial of broilers
4.23 Carcass characteristic of birds as influenced by different treatments and main factors at the end of 42-day performance trial of broilers
4.24 Relative weight of vital organs of experimental birds as influenced by different treatments and main factors at the end of 42-day performance trial of broilers
4.25 Relative length of intestinal segments of experimental birds as influenced by different treatments and main factors at the end of 42-day performance trial of broilers
4.26 Bone mineralization of experimental birds as influenced by different treatments and main factors at the end of 42-day performance trial of broilers
4.27 Blood mineral profile of experimental birds as influenced by different treatments and main factors at different intervals of 42-day performance trial of broilers
4.28 Net returns and performance scores of broiler birds as influenced by different treatments and main factors
4.29 Analyzed chemical composition of experimental diets compounded during performance trial of layers
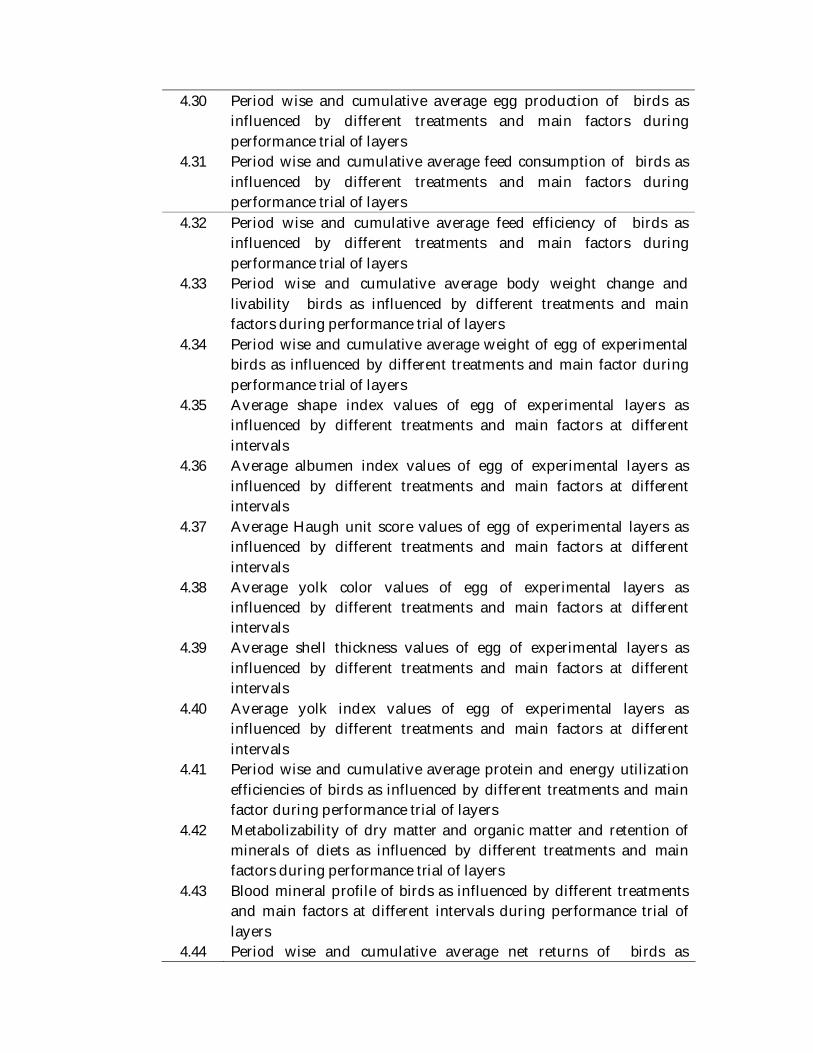
4.30 Period wise and cumulative average egg production of birds as influenced by different treatments and main factors during performance trial of layers
4.31 Period wise and cumulative average feed consumption of birds as influenced by different treatments and main factors during performance trial of layers
4.32 Period wise and cumulative average feed efficiency of birds as influenced by different treatments and main factors during performance trial of layers
4.33 Period wise and cumulative average body weight change and livability birds as influenced by different treatments and main factors during performance trial of layers
4.34 Period wise and cumulative average weight of egg of experimental birds as influenced by different treatments and main factor during performance trial of layers
4.35 Average shape index values of egg of experimental layers as influenced by different treatments and main factors at different intervals
4.36 Average albumen index values of egg of experimental layers as influenced by different treatments and main factors at different intervals
4.37 Average Haugh unit score values of egg of experimental layers as influenced by different treatments and main factors at different intervals
4.38 Average yolk color values of egg of experimental layers as influenced by different treatments and main factors at different intervals
4.39 Average shell thickness values of egg of experimental layers as influenced by different treatments and main factors at different intervals
4.40 Average yolk index values of egg of experimental layers as influenced by different treatments and main factors at different intervals
4.41 Period wise and cumulative average protein and energy utilization efficiencies of birds as influenced by different treatments and main factor during performance trial of layers
4.42 Metabolizability of dry matter and organic matter and retention of minerals of diets as influenced by different treatments and main factors during performance trial of layers
4.43 Blood mineral profile of birds as influenced by different treatments and main factors at different intervals during performance trial of layers
4.44 Period wise and cumulative average net returns of birds as

influenced by different treatments and main factor during performance trial of layers
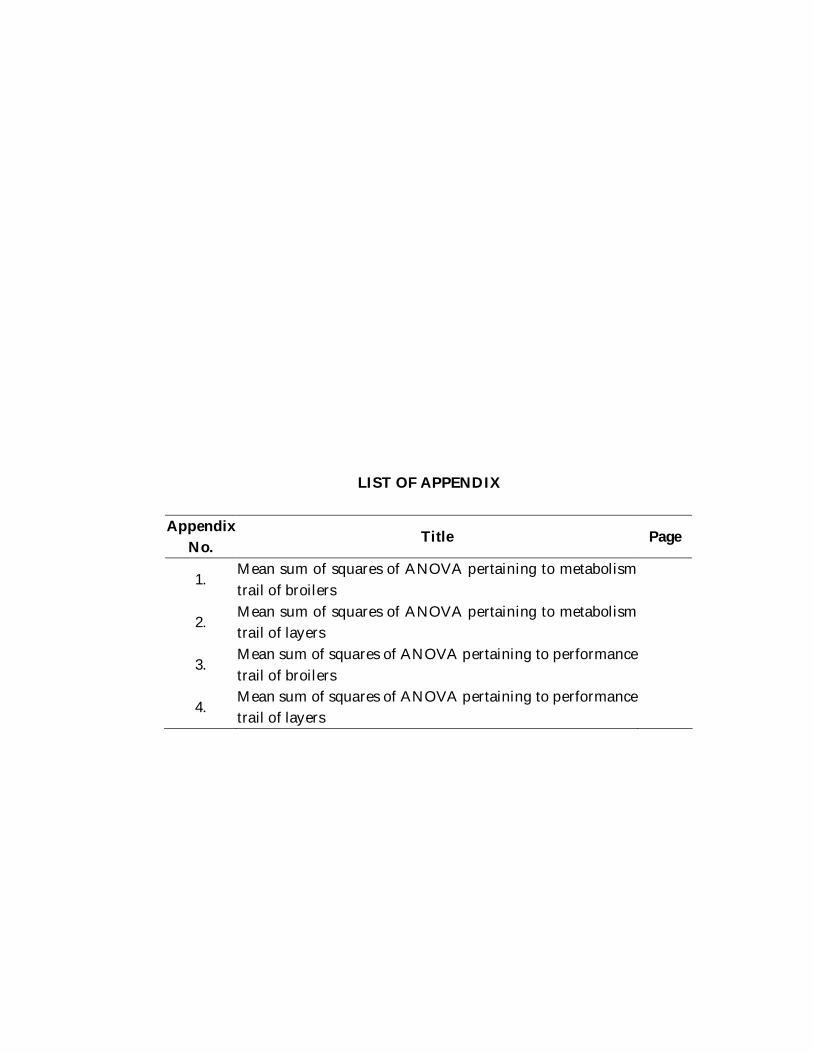
LIST OF APPENDIX
Appendix No.
Title Page
1. Mean sum of squares of ANOVA pertaining to metabolism trail of broilers
2. Mean sum of squares of ANOVA pertaining to metabolism trail of layers
3. Mean sum of squares of ANOVA pertaining to performance trail of broilers
4. Mean sum of squares of ANOVA pertaining to performance trail of layers

LIST OF ABBREVIATION AME : Apparent Metabolizable Energy ANF : Anti Nutritional Factors AOAC : Association of Official Analytical Chemists BIS : Bureau of Indian Standards Ca : Calcium CD : Critical Difference CF : Crude Fiber CP : Crude Protein DCP : Dicalcium Phosphate DM : Dry matter EE : Ether Extract EEU : Efficiency of Energy Utilisation EIS : Economic Index Score EPU : Efficiency of Protein Utilisation FCR : Feed Conversion Ratio g : Gram iP : Inorganic Phosphorus Kg : Kilogram LUA : Lipid Utilizing Agents ME : Metabolisable Energy NDE : NSP Degrading Enzymes NFE : Nitrogen Free Extractives NRC : National Research Council OM : Organic Matter P : Phosphorus Pav : Available Phosphorus PIS : Performance Index Score SEm : Standard Error of Means SPR : Sugarcane Press Residue TA : Total Ash

tP : Total Phosphorus

I. INTRODUCTION
Poultry industry as one of the most profitable sectors of business of agriculture provides
nutritious meat and eggs for human consumption within the shortest possible time. In India,
poultry production has emerged as the most dynamic and fastest expanding segment in agricultural
sector with an annual growth rate (1997-2002) of 19 per cent in the broiler chicken and 5 per cent
in egg production. On the global arena, India is the fourth largest producer of eggs with an annual
production of 37 million eggs and ranked fifth in respect of poultry meat production with an
output of 1.44 million ton meat per year. Presently, Indian poultry sector is worth Rs. 24,000
crores contributing Rs. 33, 000 crores to national GNP (approx. 2.5% of total GDP) and is all set
to increase to Rs. 60, 000 crores in the next 5 years (Mahapatra, 2005).
Poultry and poultry products at present command a major share of food of animal origin
being produced and consumed in the country because of their cost effectiveness, easy availability,
superior protein quality and order of acceptance by all sections of the society. However, the per
capita availability is only 37 eggs or 1.5kg of egg mass and 1.2 kg of poultry meat which are quite
lower than the ICMR (1995) recommended requirements of 180 eggs and 9.5 kg of poultry meat.
The high biological value of egg and meat have nevertheless resulted in an increasing demand for
these products (Mahapatra, 2005).
Feed resource is a major constraint confronting the poultry industry as the feed alone
accounts for 65-70 and 75-80 per cent of the cost of production of broilers and layers, respectively.
Maize and soybean meal are the predominant energy and protein sources, respectively, in poultry
diets. Energy sources (cereal and cereal by-products) available at present are just sufficient enough
to meet the 70 per cent of requirement of animal feed while the vegetable protein sources (oil cakes
and meals) are just sufficient. However, the growth in oilseed production does not commensurate
with the anticipated requirement for animal feeding, their availability will be a major issue in
future. Hence, the unprecedented demand for cereal and protein sources has resulted in escalation
of feed costs which might marginalize the survival and growth of poultry industry (Chadha, 2005).

While computation of poultry diets orient around energy and protein, yet certain portion
of the broiler (3-4%) and layer diet (9-12%) indeed needs to be made up with mineral supplements
to accomplish proper growth and production. Marginal deficiencies of both major and trace
mineral elements cause significant reduction in the birds’ performance (Leeson and Summers,
2001). For this purpose, invariably addition of mineral supplements such as di-calcium phosphate,
calcite powder, shell grit, etc., are mandatory. Although shortage is not expected, in view of the
periodical scarcity as well as cost of mineral salts, alternate sourcing of minerals also assumes
significance (Reddy, 2005).
Thus, the ever increasing demand for quality foods by humans has intensified the efforts
of increasing the productivity of livestock and poultry which is already constrained due to many
reasons. The disparity between the two can only be addressed through significant gains in
efficiency in utilizing non-conventional feed ingredients and by-products. Prevalence and
acceptance of poor quality feed resources for such an activity not withstanding, yet the utilization
of certain agro-industrial by-products / waste products offers an opportunity to sustain the
livestock productivity (Reddy, 2005). The search for alternate feed ingredients is also driven
directly by the economics of the industry to find nutrient sources at lower costs than those
currently in use. Sugarcane press residue is one such by-product from sugar industry, which is
available abundantly in sugarcane growing areas, has to be exploited for economical poultry
production.
Sugarcane press residue (SPR), also known as filter cake / press mud, is obtained during
the process of precipitation of cane juice. It is a soft, spongy, amorphous dark brown material
containing sugars, fiber, coagulated colloids including wax, apart from containing albuminoids,
organic salts, etc. and rich in organic carbon and inorganic elements. It constitutes to about 3 to 5
per cent of cane crushing and the current annual production in India ranges from 3.3 to 3.6 million
tons as against the global production of 17 million tons (Singh and Solomon, 1995). However, only
fraction of this is used as soil conditioner for enhancing crop productivity and majority of it
remains unrecycled due to lack of proper technology.

Recent attempts carried out at this Institute have revealed that the SPR can be a
potential alternative source of both organic and inorganic nutrients for livestock and poultry. The
chemical analysis indicated that the SPR comprised of CP-9.96, EE-11.37, CF-17.67, Ca-2.40 and
total P-1.20% and Mn-228, Zn-36.5, Cu-22.6 and Co-236.7 ppm (Reddy et al., 2004). A
preliminary trial on magnitude of utilization of SPR in broiler birds (up to 4%) showed that SPR
can be a valuable non-conventional feedstuffs for poultry (Budeppa, 2004). An another trial
conducted in laying hens also revealed that there is a potential for use of SPR up to 10% as a
source of both organic and inorganic nutrients excepting energy (because of unavailable data) in
layer rations (Suma, 2005; Suma et al., 2007). In growing sheep, Suresh (2004) demonstrated that
SPR can serve as a valuable ingredient in the concentrate for stall fed sheep up to 3%.
The results of the aforementioned studies do encourage the use of SPR in livestock rations
at reasonably higher inclusion levels. Yet, the magnitude of utilization of energy from the SPR-
based diets and obviously that of SPR as well, has not yet been accomplished. Since energy is the
important deciding factor for animals to perform, it is therefore necessary to establish the energetic
worth of SPR-based diets and that of SPR. Hence, a holistic study is essential in this direction
and that the positive outcome from the study may render the SPR as a valuable feed ingredient,
which is currently posing the proper disposal and environmental problems.
Application of biotechnological tools in the feed industry such as usage of exogenous feed
enzymes has been adopted, especially when the diet comprises of unconventional feedstuffs. The
concept of using feed enzymes in poultry is well accepted and found to be economical (Reddy,
2005). Exogenous enzymes in feed endows animals with additional metabolic arsenal to fight
undigestible feed components as well as ANFs. Use of specific enzymes like xylanase, pectinase
and cellulase could breakdown plant fiber releasing energy as well as increasing the protein
digestibility due to better accessibility of protein when the fiber gets broken down (Saxena et al.,
2006).
Recently, Meng et al. (2004) reported that the dietary supplementation of bacterial lipase
improved fat utilization as the young birds have insufficient secretion of endogenous lipase.
Lecithin, an excellent source of phospholipids has the ability to promote fat absorption in the

digestive system as the birds’ cannot synthesize this component and thereby increases energy
efficiency of feed. Addition of lipase and lecithin may enhance the nutritive value of SPR.
In this context, a comprehensive study to evaluate the possibility of use of SPR as a feed
ingredient for poultry with biotechnological interventions was attempted to accomplish the
following objectives:
1. To evaluate the dried Sugarcane Press Residue (SPR) samples from
different sources by suitable chemical methods.
2. To determine the metabolizable energy and digestibility coefficients of
various nutrients of SPR in both broilers and layers by metabolic trials.
3. To identify proper biotechnological tool for efficient utilization of SPR
in poultry.
4. To assess the effect of inclusion of processed SPR at different levels on
the growth performance of broilers and production performance of
layers.
5. To observe the cost effectiveness of SPR inclusion in the diets of
poultry.

II. REVIEW OF LITERATURE
The literature relating to sugarcane press residue including the
importance of some major nutrients in poultry production is briefly reviewed
under the following headings:
2.1 Alternate Feed Resources for Poultry
2.2 Importance of Various Nutrients in Poultry Diets
2.2.1 Energy 2.2.2 Protein
2.2.3 Minerals 2.2.4 Nutrient Specification for Various Classes of Poultry 2.2.5 Performance of Birds on High Fiber Diets 2.2.6 Other Dietary Factors Influencing the Performance of Birds
2.3 Biotechnological Approaches for Optimizing Birds’ Performance
2.3.1 NSP Degrading Enzymes 2.3.2 Lipid Utilizing Agents
2.4 Sugarcane in Agriculture and Industry
2.4.1 General 2.4.2 Sugarcane Press Residue (SPR)
2.5 Chemical Composition of SPR
2.6 Effect of SPR Based Diets on Broilers’ Performance
2.6.1 Growth Rate and Livability 2.6.2 Feed Consumption and Feed Efficiency 2.6.3 Carcass Characteristics and Organometry
2.7 Effect of SPR Based Diets on Layers’ performance
2.7.1 Egg Production 2.7.2 Feed Consumption and Feed Efficiency 2.7.3 Body Weight Change 2.7.4 Egg Characteristics 2.7.5 Efficiency of Nutrient Utilization
2.8 SPR as a Feed Ingredient in Other Farm Animals
2.9 Effect of Inclusion of SPR on Utilization of Nutrients

2.10 Effect of Inclusion of SPR on Mineral Status of Birds/Animals
2.11 Economics of SPR Supplementation

2.1 Alternate Feed Resources for Poultry
The spiraling cost of feed ingredients is causing a steep increase in the
prices of compounded poultry diets leading to a corresponding raise in
production costs with the resultant low marginal profit for the poultry farmer.
Hence, it is imperative to resort to other means for alleviating the problem of
high feed cost without impairing the performance of the chickens. In this
direction, utilization of cheap and locally available non-conventional feed
resources, not directly utilized for human food appears to be the most
practical and economic approach to this problem (Reddy, 2005).
India, due to its highly variable landscape, rainfall and agro-climate,
produce large number and quantities of agro-industrial by-products for
livestock feeding. However, only a narrow range of these raw materials are
used in poultry feed formulations because of:
1. problem of collection, transportation, processing and storage
2. higher fiber content or low energy value
3. presence of certain anti-nutritional or toxic factors
4. seasonal availability and hence irregular supply
5. variability in nutrient quality
Added to the above constraints, more importantly there is a lack of
reliable data on their nutritive quality, feeding value and safe or effective
levels of inclusion. Only conventional feed ingredients such as maize, soybean
meal, groundnut extractions and fish meal have bean evaluated with a fair
degree of accuracy and reliability but database is limited for other ingredients.
Hence, there is always a urgent need to develop database for conventional
feed ingredients on nutrient contents, digestibility/availability of different
nutrients and safe/effective level of inclusion and the presentation form of
feed for feeding (Mandal et al., 2006).

In last two decades there were occasions when India was facing the
shortage of food grains for human beings. During such situations poultry
industry is the first to be affected and this led many nutritionists in India to
depend on the agro industrial by-products, as a component of poultry rations
and as a result several potential sources of feed have come to the light.
The agro-industrial by-products are of primary importance in poultry
feeding in view of their availability in quantities sufficient for small farm and
commercial use. However, most of them are seldom able to meet the required
nutritive value and moreover almost all of these are plagued by the presence
of anti-nutritive factors like mycotoxins, phytate, oxalate, tannins and others
including high fiber and lignin apart from low nutrient profile (Saxena et al.,
2006).
Although their feeding values are known to be poorer than that of
conventional feed ingredients, yet when the price of conventional feed
ingredients particularly maize is very high, then the compensation in terms of
feeding cost may be more than the loss in production while using non-
traditional feed ingredients together with biotechnological approaches in
formulations.
2.2 Importance of Various Nutrients in Poultry Diets
Among the various nutrients, the role of energy, protein and minerals
is of great significance in poultry, because of the exclusive function of each
such nutrient. Compounding of poultry diets is being normally done
primarily to meet these requirements. Since SPR appears to be a poor source
of energy and protein but a good non-traditional source of minerals, it is
pertinent to review the literature related to influence of different nutrients on

the performance of birds. The role of crude fiber is also considered because of
its anti-nutritive properties.
2.2.1 Energy
Energy, described by Kleiber as the fire of life, is of utmost importance
because in the diets containing adequate amounts of all required nutrients,
the efficiency of feed utilization nearly depends upon the available energy
content of the diet (Leeson and Summers, 2001).
The energy required by the chickens for growth of body tissues,
production of egg, carrying out of vital physical activities and maintenance of
normal body temperature, is derived from organic compounds viz.,
carbohydrates, protein and fats in the diets (McDonald et al., 2002).
a) Procedures for measuring metabolizable energy
Various bioassay procedures are available for determination of
metabolizable energy (ME) of feed ingredients wherein feed intake and
excreta output are measured over a 2 to 5-day test period. In the method of
Sibbald and Slinger (1963), the test ingredient is substituted essentially for
part of the complete basal diet. However, to avoid mineral and vitamin
deficiencies, the components of the diets containing these nutrients are left
intact.
Hill and Anderson (1958), assuming that if nitrogen is not retained it
will appear as uric acid, proposed a correction value of 8.22 kcal/g nitrogen
retained because this is the energy obtained when uric acid is completely
oxidized.

Several researchers have also developed prediction equations to
estimate the energy content of feed ingredients from their proximate
components. Janssen et al. (1979) conducted a series of studies to correlate the
chemical composition of different types of feed ingredients to the ME value.
By using multiple regression analysis, equations were derived to estimate
MEn (kcal/kg dry matter) from chemical composition. A subcommittee of
European Federation of the World’s Poultry Science Association (1989)
developed a set of equations to estimate the energy value of ingredients. Dale
et al. (1990) developed an equation to estimate the TMEn value of dried
bakery products, a blend of various by-products produced from the baking
industry.
The ME values obtained by predication equations are highly variable.
For example, the ME value of grain sorghums is known to be influenced by
tannin content. Sibbald (1977) reported TME values of 3300 and 3970 kcal/kg
for high and low-tannin grain sorghums, respectively.
Employing high levels of added fat often leads to more MEn than can
be accounted for from the summation of ingredients. Several literature
(Mateos and Sell, 1981; Mateos et al., 1982; Sell et al., 1983) reported that the
high level fat feeding evidently increases the intestinal retention time of feed
and so allows for more complete digestion and absorption of the non-lipid
constituents.
Factors influencing the MEn value of fat that are not directly associated
with fat quality are age of poultry and method of measurement. Renner and
Hill (1961), Sibbald and Karmer (1978) and Lessire et al. (1982) reported that
an improved utilization of dietary fat occurs after 2 to 6 weeks of age in case
of chickens. Such type of improvement, according to Young and Garrett

(1963) and Sell et al. (1986) was evident with long chain saturated fatty acids
and fats containing substantial proportions of these fatty acids. A synergism
in the absorption of the saturated fatty acids (tallow) related to the added
amounts of unsaturated fatty acids (vegetable oil) was also reported (Ketels et
al., 1986; Ketels and DeGroote, 1987).
b) Low energy density diets
A series of experiments were conducted by Leeson et al. (1996) to
demonstrate the effect of broiler response to variable dietary energy. In the
first experiment where the chickens were offered corn-soy diets providing
2700, 2900, 3100 and 3300 kcal ME/kg ad libitum, showed no effect on growth
rate and energy intake was constant. In second experiment when the feed
intake was restricted, there was reduced growth rate as the energy level
decreased from 3300 to 2700 kcal ME/kg. In third experiment, when the
broilers offered a choice of diets (3300 kcal diet and either 3100, 2900 or 2700
kcal diet separately), they showed remarkably precise control of intake, such
that energy intake was gain constant across all treatments. They also
concluded that the broilers possess a good ability to control their feed intake
based on desire to normalize energy intake.
Recently, Nagaraju (2006) reported that the broilers consumed a
relatively higher amount of feed (3619g/bird) when fed with low nutrient
density diet containing 3.5% lesser ME and protein as against the moderate
nutrient density diet (3132g/bird) while the body weight gain (2020 and
2055g, respectively) and FCR (1.99 and 2.00 g feed/g weight gain) remained
almost similar during 42-day experimental period.
Savory and Gentle (1976a), in studying feeding pattern of quail fed
diets diluted with 20% showed that normalization of energy intake had

occurred at 8 to 10 days. In this study with quail, birds were able to normalize
their nutrient intake, although growth rate was not maintained suggesting
that the diet dilution with fiber in some way influenced energy portioning.
However, Savory and Gentle (1976b) measured ME of their diluted quail diets
and showed that the fiber per se had no effect on utilization of other feed
components.
Since chickens increase their feed consumption as the energy content of
the diet reduced, a deficiency of energy can be produced only by using very
low energy diets which are usually quite bulky surpassing the capacity of the
crop and digestive system (Leeson and Summers, 2001) to hold the ingested
feed.
As the energy content of the diet of growing chickens drops below the
critical value (2600 kcal/kg), growth is reduced and the amount of fat
deposited in carcass decreased. However, as long as the energy content of the
diet is adequate for maintenance, no other deficiency systems were observed
(Leeson and Summers, 2001).
If the diet is so low in energy that it entails a feed intake which exceeds
the physical capacity of the bird, energy intake will then be inadequate to
support normal egg production. From the evidence reviewed by (Morris,
1968) it would seem that the lower limit to dietary energy concentration is
about 2300 kcal ME/kg. Below this level one can expect reduced rates of the
lay if mash diets are fed. The exact limiting value in mash diets is probably
determined more by energy per unit volume than energy per unit weight.
As and when sunflower meal was incorporated at higher levels,
nutrient and energy densities of the resulting diet may be significantly diluted

and growth being retarded (Senkoylu and Dale, 1999). Fat can be a good way
of fortifying the energy density of the diets (Zatari and Sell, 1990).
c) Factors affecting utilization of dietary energy
Feedstuffs containing high amounts of fiber possess relatively low
energy values for poultry unless they are also high in fat content (Leeson and
Summers, 2001). Variation in available energy and protein content of
feedstuffs can be attributed to wide range of anti-nutritive factors such as
non-starch polysaccharides (NSP), tannins, protease inhibitors, alkaloids,
saponins etc. (Hughes and Choct, 1999).
Of the known anti-nutritive components of poultry feedstuffs, soluble
NSP stand out as a major determinant of the available energy and other
nutrients for poultry (Hughes et al., 2001). One of the modes of action of
soluble NSP is to form a viscous gel in the gut which in turn affects the rates
of digestion and absorption of nutrients (Choct, 1999).
Among the bird-related factors influencing energy metabolism,
capacity to digest and absorb carbohydrates develops during incubation,
providing the newly hatched chick with a relatively mature system for
utilization of starch, the main carbohydrates in the diet of poultry (Moran,
1985). On the other hand, the capacity to utilize fat can take 10 days or so to
develop in broiler chickens due to lag in lipase secretion by the pancreas (Jin
et al., 1998).
2.2.2 Protein
Protein, being the premier nutrient, is always judiciously maintained at
certain specified optimum level for different classes of poultry. In general, as
the age advances, the level of protein suggested invariably declines (BIS, 1992;

NRC, 1994). Correspondingly the concentration of energy in the diets is
increased with the age of the broilers.
Bedford and Summers (1985) found that as long as the essential amino
acids comprised 55 per cent CP, then the level of dietary CP was not a factor
affecting the growth and feed intake. Han et al. (1992) observed that the amino
nitrogen itself can be a limiting factor in low protein diets.
Edward and Campbell (1991) emphasized the importance of dietary
energy in determining the limit response to protein. A small decrease in net
energy yield resulting from large dietary inclusions of poor-quality protein is
sufficient to explain the impairment of maximum response.
Boorman and Ellis (1996) confirmed that it was impossible to elicit
maximum response to the limiting amino acid by feeding large amounts of
poor quality protein.
Ferguson et al. (1998) reported that there is a critical dietary CP level
below which the birds’ performance will decline. Reducing CP content below
18.8 per cent in the diet fed from 3 to 6 weeks of age would adversely affect
performance parameters.
2.2.3 Minerals
a) Role of Minerals
Minerals are the inorganic part of feeds or tissue. They fulfill
physiological, structural and regulatory functions as mentioned below:
Role of individual mineral elements and the effects of their deficiency
Element Role / functions Deficiency symptoms Calcium Bone and egg shell, Growth retardation, decreased

transmission of nerve impulse
feed consumption, rickets, osteomalacia, thin egg shells
Phosphorus Bone, energy metabolism Rickets, osteomalacia, depraved appetite, poor fertility
Potassium Osmoregulation, acid-base balance, nerve and muscle excitation
Retarded growth, weakness
Sodium Acid-base balance, osmoregulation
Reduced egg production, poor growth, cannibalism, soft bones, low body weight gains and high mortality
Chloride Acid-base balance, osmoregulation, gastric secretion
Alkalosis, poor growth, high mortality, nervous trouble
Sulfur Structure of amino acids, vitamins. Hormones, chondrotin
-
Magnesium Bone, activator of enzymes for carbohydrate and lipid metabolism
Nervous irritability and convulsion
Iron Haemoglobin, enzymes of electron transport
Anemia, depigmentation of red and block feathers
Copper Haemoglobin synthesis, enzyme systems, pigments
Anemia, poor growth, depigmentation, sway back
Cobalt Component of vitamin B12 Iodine Thyroid hormones Goiter, drop in production,
lacy feathers, weak or dead young ones
Manganese Enzyme activation Perosis, retarded growth, reduced egg production, weak egg shell, skeletal abnormality, atoxia
Zinc Enzyme component and activator
Poor growth, depressed appetite
Selenium Component of glutathione peroxidase, iodine metabolism, immune function
Myopathy, exudative diathesis, encephalomalacia
(Source: McDonald et al., 2002)

b) Sources of Minerals
Most of the feed ingredients that are used as the energy and protein
sources in poultry diets invariably also provide minerals in addition to basic
organic nutrients. Hence, whenever possible or practicable the mineral
requirements should be met by selection or combination of available
feedstuffs which supply energy and protein. The amount of different minerals
present in commonly used poultry feed ingredients is given below:
Major minerals, % Trace minerals, mg/kg Ingredients
Ca Pav Cl Mg Na K Fe Mn Cu Zn Se Maize 0.01 0.13 0.04 0.15 0.05 0.38 100 4 3 29 0.04
Wheat 0.05 0.20 0.08 0.16 0.09 0.52 100 48 7 40 0.51
Wheat bran 0.10 0.65 0.30 0.15 0.06 1.24 200 115 12 86 0.95
Rice polish 0.06 0.18 0.10 0.65 0.11 1.17 200 30 7 41 0.30 Soybean meal 0.20 0.33 0.05 0.27 0.05 2.54 100 27 36 52 0.11
Sunflower extr. 0.30 0.75 0.03 0.75 0.02 1.00 100 70 4 30 0.18
Fish meal 6.50 4.00 0.55 0.21 0.47 0.32 600 25 8 119 1.83
Meat meal 8.00 0.17 0.90 1.00 0.55 1.23 400 16 8 98 0.40 Source: Leeson and Summers, 2001
The minerals present in commonly used feedstuffs of poultry rations
may not be sufficient to meet the requirements for high yielding modern
birds. In addition, there is a considerable variability in their availability across
various feed ingredients since some of the mineral elements are present in
chelated forms, which are largely unavailable for absorption. For example, P
from plant sources is only 30 to 45 per cent available (Perney et al., 1993),
because much of the P is in the form of phytate (myo-inositol hexaphosphate)
and is poorly utilized in poultry. Further, phytate P can complex with several
cations such as Ca, Mg, Zn, Fe, K and Cu, as well as amino acids (Ravindran
et al., 1998). Hence, the availability of minerals, particularly P in feedstuffs of
plant origin is the key issue in poultry nutrition.

Hence, although considerable opportunity exists to provide most of the
mineral needs from basal feedstuffs, the flexibility needed in formulating
diets often requires concentrated sources of one or more mineral elements
sources. The supplementation of inorganic salts is not only expensive but also
fails to address the problem of over supplementation, especially in case of P
leading to potential environmental pollution in soil and ground water.
Specific and exclusive sources of some minerals are given in Table 2.1.
2.2.4 Nutrient Specification for Various Classes of Poultry
The requirement of various nutrients for broilers at different age and
for laying hens is presented in Table 2.2. The standards show considerable
variation in the specifications for all the nutrients. In view of the faster growth
observed in the present day broiler genotype and higher egg production rate
in layers, the levels recommended by the Governmental agencies (BIS, 1992;
NRC, 1994) is lower than the ones followed in the filed particularly for broiler
finishers. Current practice is to supply nutrients some what excess of the
accepted requirements.
2.2.5 Performance of Birds on High Fiber Diets
Crude fiber is known to increase the passage rate in the gut and
bringing physicochemical changes in the ingesta due to its hydrophilic
property (Southgate, 1973) there by affecting the performance.
Several reports available show the adverse effect of high dietary crude
fiber on the digestibility of poultry diets.
Deaton et al. (1979) and Mandelkar (1992) found that using high fiber
sunflower meal (36% CP and 24% CF) up to 30 per cent in a layer diet
significantly decreased feed efficiency while egg production, egg weight and
egg shell strength and mortality remained unchanged.

Chaturvedi and Singh (2000) reported that the correlation coefficient
between the crude fiber and feed intake on rice bran based diets (9.87, 10.87,
11.48 and 11.57 % CF) has followed the generally accepted concept that on
high fiber (low energy) diets, feed intake is relatively higher. They also
noticed that the severe deficiency of nutrient (energy) (15.58 to 16.00% CF)
lowered feed intake and the degree of reduction in feed intake was governed
by the severity of the deficiency.
2.2.6 Other Dietary Factors Influencing Performance of Birds
An important nutritional factor, in addition to the composition of the
diet and its caloric value, is the structure of the food, which induces marked
changes in behavioral and metabolic parameters. Physical texture and
appearance have some effect on the willingness of the birds to approach and
consume feed and this is particularly important with young birds.
a) Particle size
Portella et al. (1988) concluded that birds select feed material on the
basis of particle size. Further, he observed that the juvenile meat type chick
was able to distinguish small differences in food particle size.
The intake of very finely ground or dusty feeds is often a little lower
than that of a coarsely ground mash. Reece et al. (1985) reported that the
broiler chicks performed better with a mash containing coarse rather than fine
particles. Further, the propensity to consume more feed containing coarse vs.
fine particles when given the choice is associated with improved performance
(Nir et al., 1990).
Leghorn type cockerels are less susceptible to diet particle size than the
broiler type cockerels. Nir et al. (1990) showed that the preference for particle

size vary with age. The disappearance of large particle from the feed is most
pronounced as birds become older.
Nir et al. (1994) also reported that the particle size uniformity has a
positive effects on performance.
As birds age, their preference for larger particles increases. In choice
situations, the refusal of the fine grind was obvious at all ages and was more
pronounced as birds got older (Nir and Ptichi, 2001).
When fed a diet in mash form, the weight of the gizzard and its
contents are positively related to the size of the feed particle, where as the pH
of its contents is negatively related (Nir et al., 1994; Nir et al., 1995).
Nir and Ptichi (2001) opined that the passage rate of smaller particles
through the gizzard of young chicks is faster than that of large particles,
resulting in marked atrophy of stomachs (proventriculus and gizzard) and the
hypertrophy of the small intestine, and lower pH of the intestinal chyme. The
later could be result in excessive bacterial fermentation, producing volatile
fatty acids.
b) Density
The physical form of a diet has a substantial influence on the resulting
physical density and on growth. Although the dietary energy concentration is
normally expressed as energy per unit weight there is some evidence to
suggest that energy per unit volume may be a value in defining the energy
content of a diet, particularly at the lower end of the scale. Martz et al. (1957)
observed that neither energy concentration nor physical density alone was
satisfactory for measuring the adequacy of a diet fro rapid chick growth and
they preferred to use an energy / volume measurement.

Sibbald et al. (1960) also observed that for young chicks nutrient
concentration expressed as a gravimetric basis was not as satisfactory as
nutrient concentration expressed on a volumetric basis.
c) Palatability
Apart from particle size, the other major dietary factors which affects
the feed intake and growth rate is palatability of the diet. The acceptability of
the feed is a less important factor with poultry than with other classes of farm
livestock, probably because the senses of taste and smell are not developed in
birds.
The sense of the taste and smell in birds is less developed than
mammalian species (Lindenmaier and Kare, 1959), but this is compensated by
mechanoreceptors located in the beak. Mechanoreceptors have been described
in chicken beaks (Roumy and Leitner, 1973).
Feed refusal is generally attributed to the presence of mycotoxins in the
diets. However, quite often the diet’s texture is responsible for this
phenomenon. The past-ingestive nutritional effects of the feed are memorized
and coupled with sensorial cues to build feed identification.
As stated earlier, high amount of fines in the diets cause an
agglomeration of pasty material on the beak, reduce feed intake, increase
water consumption and waste feed in the water trough.
2.3 Biotechnological Approaches for Optimizing Birds’ Performance
Biotechnology is a wide discipline incorporating applied biosciences
and technology and involving practical application of microorganisms or
their sub-cellular components to the manufacturing and service industry. It is
an exciting filed offering tremendous scope for more control over biochemical

activities with in the body and also helping dietary nature or the nutritive
quality of feedstuffs and feeds.
Application of biotechnological tools in the feed industry such as usage
of exogenous feed enzymes has been found to be logical, especially when the
diet comprises of unconventional feedstuffs. The concept of using feed
enzymes in poultry is well accepted and found economical (Reddy, 2005).
2.3.1 NSP Degrading Enzymes
Poultry, being a simple stomach creature, has a very limited ability to
cope up with toxic and anti-nutritive substances if present in any significant
amount in their diet. Crude fiber and non-starch polysaccharides are the most
important anti-nutrients in the poultry feeds which hamper productivity
either through exerting direct effects in the system or by way of lowering
digestion and / or absorption of dietary nutrients in birds. These negative
effects get further aggravated by inclusion of non-conventional feed
ingredients as they are rich in these components in addition to gum and
mucilages. Enzymes possessing cellulolytic and hemicellulolytic activity have
been found useful in hydrolyzing such components in feeds.
Choct et al. (1995) stated that suitable enzyme combination strategies
for different feed ingredients might result in an increase in feed intake,
stimulation of growth, improvement of feed conversion and would overcome
the problem of wet litter, all of which ultimately would culminate in the cost
effectiveness of diets. Enzyme supplementation not only enhances bird
performance and feed conversion, but also lessens the environmental
problems (Yi et al., 1996).

Rajeshwara Rao and Devegowda (1996) reported that supplementation
of enzymes to diets based on SFE and DORB improved the performance of
broilers which was attributed to improved nutrient digestibility.
However, Chennegowda et al. (2001) showed a marginal (non-
significant) improvement in weight gain by 3.6 to 4.2 per cent in the groups
fed 20 % sunflower extraction with commercial enzyme preparations
(xylanase and pectinase or xylanse and cellulase) which was attributed to
improved digestibility of NSPs by enzyme supplementation only at sufficient
levels of substrate (20% SFE) as feed enzymes have higher Km.
In layers, Sharma and Katoch (1993) observed a numerical increase in
egg production when a fiber degrading enzyme was supplemented in a diet
of 26 weeks old birds. Similar observations were also made by Jayanna and
Devegowda (1993) and Mohandas and Devegowda (1993).
Zang Sumin et al. (1996) reported that addition of 0.5% compounded
enzyme to the basal diets significantly (p<0.01) decreased the feed intake in
layers. The improvement in the feed efficiency due to addition of single or
compound enzyme was also reported by Francesh et al. (1995).
Ponnuvel et al. (2001) observed that the per cent hen-day and hen-
housed egg production, egg weight and feed efficiency were statistically
comparable among groups fed standard layer diet and high fiber diets
supplemented with cellulase at different levels (0.06, 0.12 and 0.18%).
However, numerically better egg production and feed efficiency were noticed
when high fiber diet supplemented with cellulase. Further, they also noticed
that the average daily feed intake was significantly lower in all the enzyme
supplemented diets and standard layer diet fed groups when compared with
unsupplemented high fiber ration fed group.

Exogenous enzymes in feed endows animals with additional metabolic
arsenal to fight undigestible feed components as well as ANFs. Use of specific
enzymes like xylanase, pectinase and cellulase could breakdown plant fiber
releasing energy as well as increasing the protein digestibility due to better
accessibility of protein when the fiber gets broken down (Saxena et al., 2006).
2.3.2 Lipid Utilizing Agents
In addition to simple nature of stomach, birds also have low level of
natural lipase production during early ages. Hence, young birds do not utilize
and absorb fat effectively.
Sell et al. (1986) reported that fat retention improved with age in poults,
regardless of fat source or fat level. In their study, fat retention ranged from
66.4 to 83.7% and from 90.8 to 96.5% at 2 and 8wk age, respectively.
Korgdhal and Sell (1989) found that dietary fat (animal or vegetable
origin) was not effectively utilized until the time that lipase activity reached
maximum levels between 40 to 56 days of age. Similarly, Wiseman et al. (1991)
also observed a marked reduction in overall AME of fats linearly with
increasing free fatty acids; the effect was more pronounced with young birds.
Noy and Sklan (1995) reported that net duodenal secretion of amylase,
trypsin, and lipase were low at 4 days of age and increased 100, 50 and 20-
fold, respectively. Leeson and Attech (1995) also concluded that turkey poults,
similar to chicks, have an age-related depression in fat utilization that is
undoubtedly related to the saturated fatty acids found predominately in
animal fats.

Al-Marzooqui and Leeson (2000) found that the supplemental lipase
enzymes (Pancreatin® and Pancreatic®) increased (p<0.01) the diet ME and
apparent fat digestibility. However, both enzymes caused lower feed intake
and lower body weight gain (p<0.01) of male broilers chicks and such a trend
was not noticed in feeding crude porcine pancreas. Further, they also
observed that the ME values of the diets were greater as the enzyme levels
increased.
Recently, Meng et al. (2004) reported that the dietary supplementation
of bacterial lipase improved fat use as the young birds have insufficient
secretion of endogenous lipase.
In addition to age related effect, fat utilization is also correlated with
less efficient bile salts in very young chicks (Serafin and Nesheim, 1970).
Several studies have shown that supplementing the diet with bile salts
improves the utilization of dietary fat by chicks (Polin and Hussein, 1982;
Attech and Leeson, 1985).
Since the synthetic bile salts are expensive, the cheaper alternative
emulsifying agents or detergents that have the ability to transform a
hydrophobic surface into a hydrophilic surface were tried by several
researchers. For example, Jones et al. (1992) showed that the addition of
emulsifier increased digestibility of tallow (p<0.01). However, Al-Marzooqui
and Leeson (2000) did not observe any improvement in fat utilization upon
supplementing a detergent mixture of 95% sorbitan monstearate and 5%
polyoxyethylene sorbitan monstearate (Tween-80). Furthermore, other
researchers (Agur et al., 1974; Polin et al., 1980) reported that the addition of
lecithin, an emulsifier, increased the digestibility of fats containing long chain
saturated fatty acids.

Lecithin, an excellent source of phospholipids has the ability to
promote fat absorption in the digestive system as the birds’ cannot synthesize
this component and thereby increases energy efficiency of feed. Soybeans are
the most common source for commercial lecithin. Soy oil has the greatest
lecithin and phospholipids content. Lecithin contains about 50%
phospholipids and 25-30% unrefined soy oil (Meng et al., 2004).
In general, enzymes such as pentosanases and beta-glucanases
hydrolyze the non-starch polysaccharides. A recognized benefit of enzyme
usage is a better litter quality which itself is indicative of better poultry health
and lysophospholipids can improve digestion and absorption of nutrients
(Reddy, 2006). Further, the lysophospholipids are powerful surfactants and
can improve the mixing of digesta and facilitate the enzyme access to
nutrients in the GIT.
2.4 Sugarcane in Agriculture and Industry
2.4.1 General
Sugarcane is one of the most important commercial crops that plays a
key role in the Indian economy. Indian sugar industry with 480 sugar
factories located at rural areas through out the country is a prime catalyst in
economically strengthening the potential agro-industrial rural sector
(Hunsigi, 2001).
The cultivation of sugarcane crop generates huge quantities of varied
by-products viz., sugarcane tops, filter cake/ press residue, bagasse and
molasses as renewable resources. However, only limited fractions of total

produce are utilized as feed for livestock and much of sugarcane by-products
is wasted.
The by-product availability in India and the World (1997-98) is given
below:
Availability in million tons By-product Yield (as % of sugarcane) India World
Bagasse 30 52 150 Filter cake 3 5 16 Molasses 4 6.9 18 Cane tops 7 75 130
(Hunsigi, 2001)
The efficient utilization of these agro-industrial by-products assume
significance due to a chronic shortage of feedstuffs for animal feeding. The
sugarcane press residue that accounts for 3% of sugarcane is one such by-
product but most of it being wasted.
2.4.2 Sugarcane Press Residue (SPR)
Sugarcane Press Residue (SPR), also known as filter cake, is a by-
product of sugar industry obtained during the process of precipitation of cane
juice. It is a soft, spongy, amorphous dark brown material containing sugars,
fiber, coagulated colloids including wax, apart from containing albuminoids,
organic salts, etc., and is a rich source of organic carbon and minerals with
good proportion of N, P, Ca, Fe and Mn (Singh and Solomon, 1995).
The quantity of SPR obtained in any sugar factory depends on the
extent of impurities (non-sugars) present in cane juice and the process of
clarification adopted. In carbonation process, a large quantity of milk of lime

used is neutralized by passing carbon dioxide and the precipitate formed is
mostly calcium carbonate. In sulphitation process, the little quantity of milk of
lime is used which is neutralized by sulfur dioxide gas and the precipitate
formed is mainly calcium sulphite. The weight of the carbonation press cake
(on wet basis) is about 8 to 10% of the cane crushed while the sulphitation
press cake is about 3 to 4 % (Hunsigi, 2001).
The current production of SPR in India amounts to be more than 3.6
million tons annually (Singh and Solomon, 1995) which is roughly 23% of
world’s production. The SPR is normally considered as a waste and only
fraction of this is used as a soil conditioner or as an ameliorating agent as
manure for enhancing soil productivity. A large quantity of it remains
unrecycled or partly utilized due to lack of proper technology and thus
causing environmental pollution as well.
Ranjhan (2001) reported that the organic matter content in the SPR is
about 64 percent of dry weight and is a rich source of calcium and further
recommended that it can be used for feeding ruminants in combination with
other ingredients.
2.4 Chemical Composition of SPR
The chemical composition of any feedstuff is subjected to variation
with respect to variety, stage of maturity and agro-climatic conditions under
which it is grown, besides the methods of analysis (Lodhi et al., 1976).
The chemical composition of SPR is highly variable depending on the
quality of cane crushed and the process followed for clarification of cane juice
(Yadav, 1995).

The chemical composition (%) of sugarcane press residue obtained in
the sugar mills of different countries are as follows:
Countries Ash Organic matter
Lipids Protein CaO MgO P2O5
Argentina 26.7 73.3 6.6-13.7 8.4-14.6 6.2-7.7 - 5.3-6.3 Brazil 14.9-22.3 77.7-85.1 - 6.9-8.8 4.8-5.5 0.2-0.6 0.7-1.0 South Africa
- - - 9.5-12.0 2.1-3.1 0.6-0.8 1.7-1.3
Mauritius 12.0 87.3 9.4-16.5 11.4-12.0 2.8-3.6 0.6 1.8-2.0 Jamaica - - - 8.8 3.8 1.1 2.8 Trinidad - - - 7.1 3.2 0.6 2.9 Puerto Rico - - - 13.7 3.0 0.5 2.8 Philippines 16.2 83.7 11.2 7.0 4.6 - 32.6 Santo Domingo
14.9-31.0 - 10.7-16.9 - 1.4-2.5 0.3-06 -
Taiwan - 27.4-74.0 - - 1.2-3.9 0.6-1.2 0.7-2.5 India1 9.0-20.0 - 5.0-14.0 5.0-15.0 1.0-
14.0 0.5-1.5 1.0-3.0
1Singh and Solomon (1995) Source:
ICIDCA, 1988
Gupta and Ahuja (1998) reported that the SPR contained organic
matter–80.0,crude protein-6.0 and ether extract–4.7 % and the fiber fractions
viz, neutral detergent finer, acid detergent fiber, hemi cellulose and cellulose
were 66.5, 51.3, 15.2, and 24.7%, respectively. The AIA and lignin contents
were found to be 11.4 and 17.2 %, respectively.
Reddy et al. (2003) revealed that the sun dried SPR comprised (%) of
CP-9.69, EE–11.37, CF–17.67, TA-13.42 and NFE–47.85. The mineral profile of
SPR was of Calcium–2.40, phosphorus–1.20, magnesium–1.28, potassium-1.81,
sulfur-2.62% and Iron-2042, manganese–228, Zinc-36.5, copper-22.6 and cobalt
–236.7 ppm. The acid insoluble ash and lignin contents of same sample were
found to be 4.04 and 15.97 %, respectively (Suresh, 2004; Suresh, 2006). Where
as Suma (2005) reported that the sun dried SPR contained CP-12.67, EE– 7.5,

CF–17.5, TA-24.62 and NFE-37.71%. She also reported that SPR contains 4.52%
Ca and 1.25% P.
The content of amino acids (% on air dry basis) that have been
identified in the gross protein portion of the press residue obtained in the
Cuban sugar mills has been reported as: Aspartic acid-4.4, threonine-2.8,
glutamic acid-3.7, methionine-0.5, isoleucine- 2.1, alanine-5.8, valine- 3.5,
leucine-3.6, tyrosin-0.6, phenylalanine–1.3, tryptophan-1.2, histidine-2.2,
lysine-2.1 and arginine–0.9 (ICIDCA, 1988).
2.4 Effect of SPR Based Diets on Broilers’ Performance
Only a scanty information is available regarding the utilization of SPR
in animal feeding. A study conducted in commercial broilers where in SPR
was included up to 4% level as a source of minerals in their diets is briefly
mentioned hereunder:
2.4.1 Growth Rate and Livability
Budeppa (2004) demonstrated that the inclusion of SPR at 1, 2, 3 and
4% in either the soy based or fish based broiler diets at the expense of
sunflower extractions, rice polish and relevant mineral contributing salts
affected the growth rate significantly during 3rd and 6th week of age as well as
during starter phase (0- 21days) and cumulatively (0-42 days). The trial also
indicated that the cumulative weight gains (1777, 1721, 1713, 1568 and 1664
g/bird) were tended to decrease gradually in accordance with the inclusion
level of SPR (0, 1, 2, 3 and 4 %, respectively) in fish based diets. However,
such a trend was not evident with the soy based diets (1851, 1749, 1699, 1731
and 1840 g/bird, respectively). He concluded that there was a non significant
(P>0.05) inconsistent decline in body weight gain of broilers as the level of
SPR increased in test diets irrespective of protein sources (Budeppa, 2004). He

further reported that the inclusion of SPR up to 4% either in fish based or soy
based diets has no significant effect on livability of birds (80.0 to 96.7%)
(Budeppa, 2004).
2.4.2 Feed Consumption and Feed Efficiency
Budeppa (2004) noticed that there was an inconsistent and significant
(p<0.05) difference in feed consumption among different dietary treatments
during starter phase (0-21 days) with the values being 912, 981, 1099, 983 and
919 g/bird in fish based diets and 973, 900, 872, 956 and 937 g/bird in soy
based diets at 0, 1, 2, 3 and 4% SPR inclusion levels, respectively, where as
values during grower phase (22-42 days) as well as cumulatively were similar
(p>0.05) among different groups with the cumulative values ranging from
3266 (soy:2%SPR) to 3722 g/bird (fish:3%SPR).
Budeppa (2004) reported that the inclusion of SPR has significantly
(p<0.05) affected the feed conversion ratio during both starter (0-21 days) and
finisher phases (22-42 days) as well as cumulatively with the cumulative FCR
values 1.85, 2.04, 2.17, 2.04 and 1.99 for fish based diets and 1.70, 1.93, 1.92,
2.06 and 1.89 for soy based diets that were incorporated with 0, 1, 2, 3 and 4 %
SPR, respectively indicating that the FCR tended to be affected with the
inclusion of SPR.
2.4.3 Carcass Characteristics and Organometry
Budeppa (2004) reported that the dressing percentage (71.31 to 72.93),
meat to bone ratio (2.91 to 3.27) and relative weights (g/100g live weight) of
giblet organs viz. liver (2.19 to 2.39), heart (0.38 to 0.48) and gizzard (2.16 to
2.42) remained statistically similar among the groups fed diets with either 0, 1,
2, 3 or 4% SPR either soy or fish based protein source. However, with regards

to protein source as main factor, he noticed a significant difference in relative
weight of heart (soy- 0.42 and fish-0.45%).
In general, it was opined that SPR can be a valuable non-conventional
feedstuff for broilers and it might prove still better than being observed in the
above study, if energy and protein in the diets are optimally appropriated
(since non-isonitrogenous and non-isocaloric diets used in that trial) beyond
the level of 4 % that has been tested.
2.5 Effect of SPR Based Diets on Layers’ Performance
In layers also, the literature is quite limited. An experiment conducted
in layers where in SPR was included up to 15% level at the expense of DORB
and mineral contributing salts in their diets is briefly reviewed hereunder:
2.5.1 Egg Production
Suma (2005) reported that the 84-day average egg production was
93.33, 91.25, 87.14 and 90.71 % in birds fed 0, 5, 10 and 15 % SPR included soy-
based diets, respectively and the values in fish based diets were 91.13, 92.08,
92.38 and 83.93 %, respectively. The corresponding egg production values
were 92.33, 91.67, 89.76 and 87.32% irrespective of the protein source, a non-
significant decrease as the level of SPR inclusion increased.
2.5.2 Feed Consumption and Feed Efficiency
Suma (2005) reported an inconsistent trend in feed consumption values
(g/hen/day) of 119.1, 118.1, 117.4 and 120.3 in soy diets and 120.6, 121.7, 121.7
and 119.9 in fish based diets at 0,5,10 and 15% SPR inclusion, respectively. She
also reported that the corresponding feed consumption values were 119.9,
119.9, 119.6 and 121.7 g/hen/day irrespective of the protein source.

Suma (2005) demonstrated that the 84-day cumulative feed efficiencies
in 5, 10 and 15 % SPR based soy diets (1.56, 1.65 and 1.62 respectively) were
poorer when compared to soy control group (1.53) while it was not consistent
with the level of SPR inclusion (1.59, 1.58, and 1.74, respectively) in fish based
diets against the fish control (1.61). Further, considering SPR and protein
source as main factors, the average values were found to be 1.57, 1.57, 1.61
and 1.68 in 0, 5, 10 and 15% SPR included diets, respectively while the soy
based diets (1.59) showed better FCR when compared to fish based diets
(1.63). Similar trend was persistent when the feed efficiency was expressed in
terms of egg mass ( 2.33 to 2.75 g/g).
2.5.3 Body Weight Change
Suma (2005) noticed a general loss in body weight in all the groups at
the end of 84-days with the values ranging from as low as 10.05 to as high as
118.5g in the birds fed on diets containing 0, 5, 10 and 15% SPR incorporated
soy or fish based diets excepting only soy control group (0 % SPR) which
showed slight gain in body weight (4.45g).
2.5.4 Egg Characteristics
Suma (2005) observed that the inclusion of SPR at 0, 5,10 and 15 % does
not affect the egg weight with the non-significant values of 54.39, 53.90, 52.84,
and 53.66 g, respectively at the end of 84 days experimental period. However,
a numerically increased egg weight in the group fed diet containing 15 % SPR
was noticed when compared to 10% SPR on different (28th, 56th and 84th day)
days (Suma, 2005).
Contrarily, the birds fed with 10% SPR showed numerically better
percent shape index (77.10) when compared to 5% (76.97) and 15% SPR
dietary groups (76.78) barring the source of protein i.e., either soybean meal

or fish meal. She also noticed a non-significantly higher egg weight in birds
fed soy based diets while a better shape index prevailed in birds fed fish
based diets.
Suma (2005) observed a significantly (p<0.05) lowest yolk index values
of 0.355 (15% SPR) and 0.368 (10% SPR) in fish based diets against the
corresponding highest values on 0.390 and 0.401 on 28th and 56th day of
experiment, respectively and concluded that a particular type of protein
source has got significant influence on the yolk index rather than the SPR
level. However, the yolk colour remained unaffected with the values ranging
from 6.75 to 6.94 during the 84-day experimental period Suma (2005).
Suma (2005) reported that the shell quality was not affected by the
inclusion of SPR up to 15% in either soy or fish based diets. She also noticed
an increasing trend in shell thickness values during initial stages (0.365, 0.368,
0.373 and 0.374 mm on 28th day) but a reducing trend was observed on 56th
day (0.319, 0.316, 0.305 and 0.305mm) and 84th day (0.297, 0.295, 0.279 and
0.294mm) of experiment with incremental level of SPR at 0, 5, 10 and 15%,
respectively.
Suma (2005) noticed an non-significant increase in albumen index
values as the SPR level in diets increased from 0 to 15% during the 84-day
experiment excepting on terminal day (84th day) with the significant different
values of 0.033 and 0.053 in 0 and 10% SPR included soy based diets.
However, such trend was not noticed when albumen height expressed in
relation with egg weight i.e., Haugh unit score with the mean values ranging
from 49.17 to 59.34 during the entire experiment.

Based on the different egg characteristics parameters studied, Suma
(2005) concluded that the inclusion of SPR up to 15 % either in soy or fish
based diets did not affect the quality of egg including its weight.
In general, there was no difference in egg production performance as
well as egg characteristics between test and control diets when the layers were
fed diets containing several non-conventional feedstuffs such as dried poultry
manure, rice polishing , cassava leaf meal, rubber seed cake and ragi (
Ravindran, 1995)
2.6 SPR as a feed Ingredient in Other Farm Animals
Experiments conducted in Mauritius, one of the main sugarcane
producing countries, have suggested direct utilization of dried SPR as animal
feed. Parish (1962) observed that air-dried SPR along with molasses and green
cane tops (in the ratio of 38:14:48) had an apparent digestibility of about 33
per cent in experimental sheep.
Staub and Drane (1965) observed that the experimental cows fed a diet
incorporated with SPR/molasses/fish meal (in the ratio of 50:35:15) showed
better response to milk yield and cost of production as compared to those fed
control diets.
Efforts have been made at the Institute of Animal Science, Cuba, to
incorporate pressmud in animal feed along with preheated straw or cellulosic
residues from cane cleaning centre (Singh and Solomon, 1995).
A trial conducted at this Institute where SPR was evaluated at 1, 2 and
3% of concentrate mixtures which were offered to meet 50% dry matter
requirement of lambs, Suresh (2004) demonstrated that the dry matter intake,

average daily body weight gain and feed conversion ratio were uniform
among different treatment groups including that of the control (0% SPR)
group. He concluded that the stall fed sheep can tolerate the inclusion of SPR
up to 3% in concentrate mixtures.
2.7 Effect of Inclusion of SPR on Utilization of Nutrients
From a metabolism trial involving 4 laying hens per treatment, Suma
(2005) concluded that the percent metabolizability of various proximate
principles viz., dry matter (52.71 to 55.46), organic matter (58.91 to 63.29),
ether extract (69.01 to 75.14), crude fiber (63.18 to 71.35) and NFE (52.47 to
57.93) with exception of crude protein (70.10 to 73.72) varied significantly
(p<0.05) with out showing any definitive trend among different groups fed
diets prepared by incorporating SPR at 0, 5, 10 and 15% with either soy or fish
meal as protein source.
Similarly, the retention of calcium by layer birds under different
dietary treatments ranged significantly (p<0.05) from 90.43 to 92.31 % while
phosphorous retention values ranged non-significantly from 61.33 to 63.99%
(Suma, 2005). Further, it was concluded that although there was a significant
variation in the metabolizability values of various nutrients and calcium
retention, birds did tolerate SPR inclusion up to 15% in their diets. Thus, the
results indicated that SPR can be incorporated in layers’ rations effectively as
a source of organic and inorganic nutrients (Suma, 2005).
In sheep, Suresh (2004) found that the digestibility coefficients of
proximate principles and fiber fractions were similar among diets prepared
with 0, 1, 2 and 3% SPR and so was the balance of nitrogen and calcium.

In general, Basavaraja Reddy (1984) reported that the dry matter
metabolizability values ranged from 85 to 95 per cent for cereals such as
maize, jowar, broken rice and bajra, while the range was from 50 to 70 per
cent for protein sources such as groundnut cake and fish meal and 15 to 30
per cent for by-products such as wheat bran and rice bran. He further
reported that the DMM of the diet was inversely related to the amount of
crude fiber and inorganic matter in the diets.
Han et al. (1976) using total collection method, suggested that dry
matter metabolizability of individual feedstuffs is a significant measuring
index for assessing the quality of the feeds or feedstuffs. Although Hartel et al.
(1977) explained that almost at the same time the digestibility co-efficient of
individual nutrients differed between feedstuffs.
2.8 Effect of Inclusion of SPR on Mineral Status of Birds/Animals
Bone ash contents viz., tibial ash and toe ash are shown to be the good
indicators of Ca and P status of birds and toe ash is reasonably accurate in
determining the extent of P availability from diet of poultry (Potter, 1988).
Budeppa (2004) noticed that a non-significant increase in tibial ash
content (30.63, 31.25, 32.69 %) with increased level of SPR inclusion (0, 1, 2
and 3%) with an exception of unreasonably lower value at 4% inclusion
(29.52%), irrespective of protein source. He also noticed a similar trend with
toe ash content (18.77, 19.36, 20.17, 22.10 and 19.81%, respectively).
Similarly, in an attempt to incorporate dried yeast sludge (DYS) in
broiler diets, Senthilkumar et al. (1997) reported a significantly higher tibial
ash content in the 5% DYS included diets (39.24%) when compared to that of
basal (34.50%) and 10% DYS dietary groups (33.68%). They also noticed that

the level of calcium (29.98 to 31.50%) and phosphorous (12.38 to 14.00%) were
nearly same in all the treatments.
The serum calcium and plasma inorganic phosphorous levels among
the broiler birds fed diets containing 0, 1, 2, 3 and 4% SPR were well with in
the normal physiological range suggesting that the bone mineralization was
quite effective by dietary SPR supplementation (Budeppa, 2004). In his study,
serum calcium ranged from 9.8 to 11.2 mg/dl on 21st day and from 8.5 to 11.4
mg/dl on 42nd day and plasma inorganic phosphorous ranged from 6.67 to
8.70 mg/dl on 21st day and 6.69 to 8.30 mg/dl on 42nd day of experiment.
Similarly in laying hens, Suma (2005) observed that the average serum
calcium and plasma inorganic phosphorous concentration values ranged non-
significantly (p>0.05) from 13.85 to 25.58 and 3.82 to 6.37 mg/dl, respectively
among groups fed with either soy or fish based diets incorporated with SPR at
0, 5, 10 and 15% levels. However, elevated and significantly different values
of plasma phosphorous (5.03 to 9.32 mg/dl) were observed on 56th day of
experiment (Suma, 2005).
In sheep, Suresh (2004) reported that the calcium, magnesium and
phosphorous status in blood of SPR based groups were comparable to those
of control (serum Ca: 8.20 to 11.36 mg/dl, serum Mg: 1.43 to 3.40 mg/dl and
plasma iP: 5.04 to 9.62 mg/dl) at different stages of experimental period.
2.9 Economics of SPR Supplementation
Budeppa (2004) observed that as the SPR level increases, the cost of
both soy and fish based starter and finisher diets got reduced while the mean
net returns from groups fed diets with increasing levels of SPR showed an
inconsistent decreasing trend.

Suma (2005) noticed that the cost of the soy and fish based diets
reduced by 25 and 23 paise per kg, respectively as the SPR level increased
from 0 to 15 %, which was partly due to the progressive decreasing cost of
mineral salt at the expense of SPR as mineral source. However, the
cumulative net returns per bird decreased from Rs. 7.88 to 6.76 with
incremental level of SPR from 5 to 15%, respectively irrespective of protein
source.
Similarly, Ravindran (1995) reported that the cost to produce a dozen
eggs was decreased by feeding layers with diet containing several non-
conventional feedstuffs such as dried poultry manure, rice polishing, cassava
leaf meal, ipil ipil leaf meal, rubber seed cake and ragi and attributed the
benefit to the price structure of such feedstuffs.
In general, Reddy (2005) reported that the reduction in feed cost by
incorporating locally available unconventional feed ingredients may appear
advantageous but the resulting loss in performance may have negative effects
on economics.

III. MATERIALS AND METHODS
The materials and methods adopted for the present study are described under the following headings: 3.1 PROCUREMENT AND ANALYSIS OF SPR SAMPLES
3.1.1 Collection, Processing and Preservation 3.1.2 Chemical Evaluation
3.1.2.1 Proximate Principles 3.1.2.2 Fiber Fractions 3.1.2.3 Mineral Constituents 3.1.2.4 Amino Acids Profile 3.1.2.5 Fatty Acids Profile 3.1.2.6 Gross Energy Values
3.2 BIOLOGICAL EVALUATION OF SPR BY METABOLISM TRIALS 3.2.1 Metabolism Assay in Broilers
3.2.1.1 Experimental Diets, Birds and Management 3.2.1.2 Sample Collection and Analytical Procedure 3.2.1.3 Determination of Metabolizability of Energy and other
Nutrients of SPR and Ileal Nitrogen Absorbability 3.2.1.4 Other Observations
3.2.2 Metabolism Assay in Layers 3.2.2.1 Experimental Diets, Birds and Management 3.2.2.2 Sample Collection and Analytical Procedure 3.2.2.3 Determination of Metabolizability of Energy and other
Nutrients of SPR 3.2.2.4 Other Observations
3.3 BIOLOGICAL EVALUATION OF SPR BY FEEDING TRIALS 3.3.1 Growth Performance in Broilers
3.3.1.1 Experimental Diets, Birds and Management 3.3.1.2 Growth Performance Parameters 3.3.1.3 Metabolizability of Various Nutrients 3.3.1.4 Blood Biochemical Profile 3.3.1.5 Carcass Characteristics and Organometry 3.3.1.6 Bone Mineralization 3.3.1.7 Performance Indices
3.3.2 Production Performance in Layers 3.3.2.1 Experimental Diets, Birds and Management 3.3.2.2 Egg Production Parameters 3.3.2.3 Egg Characteristics 3.3.2.4 Metabolizability of Various Nutrients 3.3.2.5 Blood Biochemical Profile 3.3.2.6 Efficiency of Utilization of Protein and Energy
3.4 ECONOMICS 3.5 STATISTICAL ANALYSIS

A series of biological trials were conducted to evaluate the sugarcane press residue (SPR) (Plate-1, 2 and 3) as a possible alternate feed ingredient for
broilers and layers. A metabolism assay was performed to determine the metabolizable energy (ME) content of SPR followed by a feeding trial to asses the effect of dietary inclusion of SPR on growth performance of broilers at the Animal Nutrition Experimental Unit, Main Research Station, UAS/KVAFSU,
Hebbal, Bangalore – 560 024. Parallely, a metabolism assay to arrive at ME content of SPR in layers and subsequently, a feeding trial to asses the effect of
inclusion of SPR on egg production performance of layers were also carried out at Sri Venkateshwara Poultry Farm, Srirampura, Bangalore North Taluk, where
all facilities for the purpose existed.
3.1 PROCUREMENT AND ANALYSIS OF SPR SAMPLES
3.1.1 Collection, Processing and Preservation
For initial screening, the fresh samples of SPR of about 5 kg each were
collected from different sugar factories namely 1) Mysore Sugars Ltd., Mandya; 2) Sri
Chamundeshwari Sugars Ltd., K.M.Doddi; 3) SCM Sugars Ltd., Koppa; 4) Mysore
Paper Mills Ltd., Bhadravathi; 5) Davangere Sugar Company Ltd., Kukkawada
(Davanagere) and 6) Bidar Sahakari Sakhare Karkhane, Hallikhed, located at different
regions of sugarcane growing areas of Karnataka. About each 1kg of SPR sample was
preserved in fresh form in a deep freezer at -200C, while the remaining quantity was
divided into two equal parts and dried separately either under sun till to became air
dried or in hot air oven at 1000C for 48 hrs making it moisture free. Then the dried
samples were ground to pass 1mm sieve and stored in plastic containers for further
chemical evaluation.
Following the chemical analysis, a sugar factory was identified for
procurement of SPR sample in bulk quantum for experimental purpose. The selection
of sugar factory for this purpose was done mainly on the basis of chemical
composition especially the crude protein and acid insoluble ash (AIA) contents of
different SPR samples as well as on the proximity of the sugar plant to the research
station i.e. Bangalore. Sufficient amount of SPR (about 1.5 tons) was procured from
the identified sugar factory (M/s My Sugars Ltd., Mandya), dried under sun till it
became air dried (Fig. 3.1) and then stored in air tight polythene bags for further
usage during biological trials. A representative sample was also drawn from the SPR

so obtained for experimental purpose, processed and preserved in a similar manner as
described previously for further chemical analysis.
3.1.2 Chemical Evaluation
The SPR samples collected from different sugar factories for initial screening
and the samples collected form the subsequently selected and procured SPR for
experimental purpose were subjected for chemical analysis (Plate-5) for the following
constituents.
3.1.2.1 Proximate Principles
The SPR samples dried in sun or in oven were analyzed for their proximate
principles namely dry matter, crude protein, ether extract and crude fiber as per the
methods described by AOAC (2005) while the nitrogen free extract was calculated as
the difference.
3.1.2.2 Fiber Fractions
Different fiber fractions of the sun-dried SPR samples viz., neutral detergent
fiber, acid detergent fiber and acid detergent lignin were determined as per the
procedures described by Van Soest et al. (1991) using Fibertec 2010 hot extractor
(M/s. Foss Instruments, Sweden). The hemicellulose and cellulose contents were
estimated analogously.
3.1.2.3 Mineral Constituents
The calcium content of sun-dried SPR samples was determined by titration as
explained by Talapatra et al. (1940) and the total phosphorous was analyzed
spectrophotometrically (UV-visible Spectrophotometer, M/s Jenway) after
ammonium-vanadium-molybdate pretreatment (AOAC, 2005). Other mineral
constituents: magnesium, copper, iron, zinc, manganese and cobalt in sun-dried SPR
samples were estimated by using Atomic Absorption Spectrophotometer AA 300
(M/s. Perkin Elmer) at National Institute of Animal Nutrition and Physiology,
Adugodi, Bangalore – 30.
3.1.2.4 Amino Acids Profile

Three representative sun-dried SPR samples were sent to M/s Degussa Huls-
AG, Hanau-Wolfgang, Germany and the amino acid profile of SPR samples were
obtained.
3.1.2.5 Fatty Acids Profile
The ether extract (fat) component of the SPR sample procured for biological
trials was further subjected for assay of different fatty acid components in gas
chromatography at M/s Bangalore Test House, Vijayanagar, Bangalore.
3.1.2.6 Gross Energy Values
The gross energy worth of sun-dried SPR samples were estimated using
adiabatic bomb calorimeter (AOAC, 2005) employing benzoic acid as the standard.
3.2 BIOLOGICAL EVALUATION OF SPR BY METABOLISM TRIALS
An important measure of the relative usefulness of a feed ingredient is its
metabolizable energy (ME). Since no data is currently available as regards the
energetic value of SPR in poultry, an earnest effort was made to determine the ME
value of SPR for broilers and layers separately. The procedures adopted to determine
metabolizabilty of energy in SPR are explained hereunder:
3.2.1 Metabolism Assay In Broilers
3.2.1.1 Experimental Diets, Birds and Management
a) Experimental Diets: The experimental diets were prepared based on
conventional system of replacing varying level of basal diet by test ingredient
as described by Sibbald and Slinger (1963). A practical starter type of diet of
comprising maize and soybean meal was prepared to serve as a basal mixture.
The test diets were prepared by replacing 10 per cent, 20 per cent and 30 per
cent of the basal ration by the sun-dried SPR i.e., basal mixture and test
ingredient (sun-dried SPR) in the ratios of 90:10, 80:20 and 70:30,
respectively.
Further, the basal and test diets were supplemented with either lipid utilizing
agents (lipase 0.2 g + soy lecithin @ 2g/kg) or NSP degrading enzyme
preparation @ 0.4g /kg or their combination to result in another set of 12 diets.
The tailor made enzyme preparations employed were sourced from M/s

KayPeeYess Biotech Pvt. Ltd., Hebbal Industrial Area, Mysore. The supplier
reported that the NSP degrading enzyme preparation was derived from
Asperigillus species and claimed to contain NSP degrading enzymes viz.,
xylanase-2500, beta-glucanase–1000, cellulase–500 and pectinase–250 units/g
while that the second enzyme preparation was an experimental lipase and
claimed to contain mainly lipase – 500 units/g. The description of diets
formulated is:
Biotechnological tool Basal Mix
10 % SPR
20 % SPR
30 % SPR
No supplement T1 T5 T9 T13 Lipase + Lecithin T2 T6 T10 T14 NSPases T3 T7 T11 T15 Lipase + Lecithin + NSPases T4 T8 T12 T16
The mineral sources (Plate-6) and other additives were added over and above
100 % to all the diets, so that a uniform supply of these was ensured after
substitution of the test ingredient SPR in the basal mixture. The chromic oxide
(Cr2O3) as an inert indicator was added to all the diets at 0.5 per cent level to
observe the ileal nitrogen absorbability. The detailed ingredient and chemical
composition of experimental diets is given in Table 3.1.
b) Experimental Birds: Three hundred and twenty, one-day-old straight-run
commercial broiler chicks (Hubbard strain) were distributed into 32 replicate
groups of 10 chicks each. The birds were reared on raised wire floor battery
brooders (Plate-7) kept in a well-ventilated and hygienic house. Ground maize
was offered on 1st day while a corn-soy type starter diet was prepared and
offered to all the chicks uniformly for the next 6 days. From 8th day onwards,
the experimental diets were assigned randomly to two replicates of such
groups. The diets were offered ad libitum to the respective groups of birds in
colony feeders and potable water in PVC fountains for initial 2 weeks and in a
continuous channel from the next week (3rd week). During the course of the
experiment, standard vaccination and managemental practices including
brooding were uniformly followed as per the commercial practice.
3.2.1.2 Sample Collection and Analytical Procedure
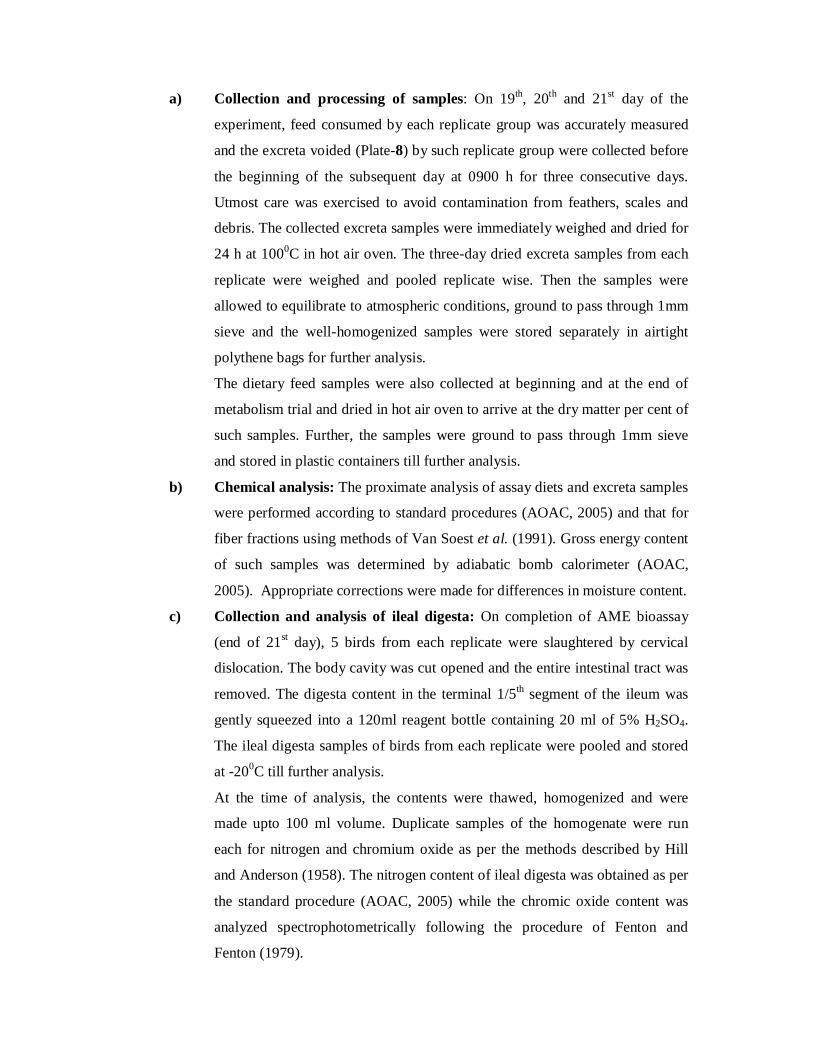
a) Collection and processing of samples: On 19th, 20th and 21st day of the
experiment, feed consumed by each replicate group was accurately measured
and the excreta voided (Plate-8) by such replicate group were collected before
the beginning of the subsequent day at 0900 h for three consecutive days.
Utmost care was exercised to avoid contamination from feathers, scales and
debris. The collected excreta samples were immediately weighed and dried for
24 h at 1000C in hot air oven. The three-day dried excreta samples from each
replicate were weighed and pooled replicate wise. Then the samples were
allowed to equilibrate to atmospheric conditions, ground to pass through 1mm
sieve and the well-homogenized samples were stored separately in airtight
polythene bags for further analysis.
The dietary feed samples were also collected at beginning and at the end of
metabolism trial and dried in hot air oven to arrive at the dry matter per cent of
such samples. Further, the samples were ground to pass through 1mm sieve
and stored in plastic containers till further analysis.
b) Chemical analysis: The proximate analysis of assay diets and excreta samples
were performed according to standard procedures (AOAC, 2005) and that for
fiber fractions using methods of Van Soest et al. (1991). Gross energy content
of such samples was determined by adiabatic bomb calorimeter (AOAC,
2005). Appropriate corrections were made for differences in moisture content.
c) Collection and analysis of ileal digesta: On completion of AME bioassay
(end of 21st day), 5 birds from each replicate were slaughtered by cervical
dislocation. The body cavity was cut opened and the entire intestinal tract was
removed. The digesta content in the terminal 1/5th segment of the ileum was
gently squeezed into a 120ml reagent bottle containing 20 ml of 5% H2SO4.
The ileal digesta samples of birds from each replicate were pooled and stored
at -200C till further analysis.
At the time of analysis, the contents were thawed, homogenized and were
made upto 100 ml volume. Duplicate samples of the homogenate were run
each for nitrogen and chromium oxide as per the methods described by Hill
and Anderson (1958). The nitrogen content of ileal digesta was obtained as per
the standard procedure (AOAC, 2005) while the chromic oxide content was
analyzed spectrophotometrically following the procedure of Fenton and
Fenton (1979).

3.2.1.3 Determination of metabolizability of energy and other nutrients of
SPR and ileal nitrogen absorbability
The metabolizability of various nutrients of assay diets including gross energy
were calculated and then the metabolizability of energy and other components of SPR
were arrived at by using simultaneous equations.
a) Dry matter and other nutrients: The group wise dry matter metabolizability
(DMM) of diets was determined using the following formula (Han et al.,
1976).
Weight of the dry feed consumed (g)
Weight of the dried excreta voided (g) DMM (%) =
Weight of dry feed consumed (g) X 100
Similarly, the metabolizability of organic matter (OM) and other nutrients viz.,
crude protein (CP), ether extract (EE), nitrogen free extractives (NFE), neutral
detergent fiber (NDF) and acid detergent fiber (ADF) were also determined
using the formula given below.
Unit nutrient intake - Unit nutrient outgo Metabolizability coefficient of nutrient (%)
= Unit nutrient intake
X 100
b) Metabolizable energy: Based on the gross energy (GE) values of assay diets
and the excreta samples determined by bomb calorimetry, the apparent ME
(AME) values of the diets were calculated by subtracting the GE of the excreta
from GE intake divided by total dry matter intake using the following formula:
(Feed intake x GEdiet)-(Excreta output x GEexcreta) AMEdiet (kcal/kg) = Feed intake
The nitrogen corrected AME (AMEn) values were calculated using a factor of
8.22 kcal per g of nitrogen retained in the body (Hill and Anderson, 1958).
c) Ileal nitrogen absorbability: The ileal nitrogen digestibility (IND) of assay
diets were calculated using Cr as a marker as follows:

[(N/Cr)d – (N/Cr)i] IND (%) = (N/Cr)d X 100
Where (N/Cr) d = the ratio of nitrogen to Cr in diet and
(N/Cr) i = the ratio of nitrogen to Cr in ileal digesta
d) Meabolizabile energy content of SPR: The ME content of the test SPR was
arrived at by using simultaneous equation methods i.e., the difference between
measured digestibility or the calorific value for basal and test diets. AME of
the test material (kcal/kg) =
% of basal in test diet AME of the test diet-
{AME of reference diet x % of basal in the reference
diet % of the test material in test diet
x100
Similarly, metabolizability / digestibility coefficient of other nutrients were
also arrived at.
e) Regression analysis: Linear regression equations were derived to predict the
ME value of diets based on the digestibility coefficient of dry matter and
organic matter. The formula for linear regression is:
y = a + bx Where, ‘y’ is the predicted ME value
‘a’ is the intercept ‘b’ (slope) is the simple regression coefficient and ‘x’ is per cent digestibility coefficient of DM
3.2.1.4 Other Observations
During the 21 day experimental period, growth performance parameters of
birds under assay diets such as the daily feed intake of each replicate and weekly body
weight gain of individual bird were also recorded and from such data, the feed
efficiency was arrived at.
3.2.2 Metabolism Assay In Layers
Since there are differences with in type of birds with respect to ability to
metabolize energy or digest other nutrients, a metabolism trial was also conducted
with egg type chicken to arrive at ME worth of SPR in layers as well.
3.2.2.1 Experimental Diets, Birds and Management

a) Experimental Diets: The dietary design employed was very much similar to
that described under Sec 3.2.1.1. A conventional practical type layer diet
comprising maize, soybean meal, groundnut extraction and sunflower
extraction was prepared to serve as basal mixture (T1). The test diets viz., T5,
T9 and T13 were prepared by incorporating sun dried SPR at 10, 20 and 30 %,
respectively replacing the corresponding proportion of basal mixture. Further,
a parallel set of another 12 diets were prepared by supplementing the basal
mixture-T1 and test diets – T5, T9 and T13 with either lipid utilizing agents
(lipase 0.2 g + soy lecithin @ 2g/kg) or NSP degrading enzyme preparation @
0.5g /kg or their combination to result in diets T2 to T4; T6 to T8, T10 to T12 and
T14 to T16, respectively. The enzyme preparations added were the same as
those employed in broiler metabolism trial. The rest of the components in the
diets namely shell grit, mineral mixture, common salt and vitamin premix
were maintained in all diets at uniform level. The chromic oxide (Cr2O3) as an
external indicator was added to all diets at 0.5 per cent level. The detailed
ingredient composition of each diet is given in Table 3.2.
b) Experimental Birds: A total of one hundred forty four BV-300 commercial
layers of about 35 weeks age and uniform body weight with proper history
were selected and randomly divided into 48 groups of 3 birds each in a
commercial poultry farm (Sri Venkateshwara Poultry Farm). The replicate
groups were housed alternatively in colony cages with each cage unit
measuring 15’’x15’’x18” size (Plate-9). Each of the 16 diets described earlier
(Sec. 3.2.2.1a) were offered to three such replications of 3 birds each. A
continuous feed trough was partitioned with a partition material to avoid
mixing up of test diets, if any. The rest of the managemenatal practices was
essentially uniform.
3.2.2.2 Sample Collection and Analytical Procedure
After conditioning the laying hens with their corresponding experimental diets
for 11 days, a conventional metabolism trial for 3 days was carried out, during which
the feed intake and excreta output (Plate-10) from each group of birds was measured
quantitatively to obtain the AME data. The procedure adopted for collection and

processing and chemical analysis of excreta and diet samples were by and large
similar to that of broilers’ metabolism trial as described under section 3.2.1.2.
3.2.2.3 Determination of Metabolizability of Energy and other Nutrients
The metabolizable energy and other components of SPR in layers were arrived
at by methods which are very much similar that of broilers’ metabolism study
(Section 3.2.1.3).
3.2.2.4 Other Observations
In addition to metabolism trial, the daily group-wise feed consumption and
egg production including egg weight under each treatment were recorded. The body
weight of individual bird at the beginning and at the end of experimental period of 14
days was also studied.
3.3 BIOLOGICAL EVALUATION OF SPR BY FEEDING TRIALS
Previous reports (Budeppa, 2004) indicated that young birds such as broilers
tolerated low levels of SPR (up to 3%) while that of adults such as layers (Suma,
2005) tolerated reasonably higher SPR (up to 15%) levels in their diets. Yet, the
information available in both broilers and layers is not sufficient to include SPR at
safe / economic level in practical poultry diets. Therefore, separate feeding cum
performance trials were conducted in meat type chicken i.e., broilers and in egg type
chicken i.e., layers by making use of the results of recently concluded metabolism
trials i.e., mainly energetic worth of SPR.
3.3.1 Growth Performance in Broilers
A feeding trial was conducted in broilers to asses the effect of inclusion of
SPR at different levels in broiler diets on performance parameters such as body
weight gain, feed consumption and feed efficiency, carcass characteristics and
organometry, biochemical profiles in blood, nutrient utilization and cost effectiveness
of SPR inclusion. A brief account about the performance trial in broilers is presented
hereunder:
3.3.1.1 Experimental Diets, Birds and Management

a) Experimental Diets: Three iso-nitrogenous and iso-caloric diets were
prepared by incorporating sun dried SPR at 0, 5 and 10 % levels to meet or
exceed the nutrient requirements specified by Bureau of Indian Standards
(BIS, 1992). The sun dried SPR was included at the expense of the
conventional organic as well as inorganic nutrient sources. Further, the diets
were supplemented with either lipid utilizing agents (lipase 0.2 g + soy
lecithin @ 2g/kg) or NSP degrading enzyme preparation @ 0.4g /kg or their
combination to result in another set of nine iso-nitorgenous and iso-caloric
diets. Like wise, the diets were prepared separately for each phase i.e., starter
(0-14 days), grower (15-28 days) and finisher (29 to 42 days) phases. The
ingredient and calculated nutrient composition of starter, grower and finisher
diets are detailed in Tables 3.3 and 3.4, respectively. The design was aimed to
study the influence of inclusion of SPR at different levels on broiler
performance as well as for increasing the efficiency of SPR utilization through
biotechnological approaches and the dietary design is described as follows:
Biotechnological Tool 0 % SPR 5 % SPR 10 % SPR No supplement T1 T5 T9 Lipase + Lecithin T2 T6 T10 NSPases T3 T7 T11 Lipase + Lecithin + NSPases T4 T8 T12
b) Experimental Birds: A total of 360 one-day-old straight-run commercial
chicks (Hubbard) were randomly divided into 36 groups of 10 chicks each.
The birds were housed in raised wire floor battery brooders of single tier
system (Plate-11), which were kept in a well-ventilated hygienic house. The
brooding was done up to 2 weeks of age as per the standard practice and all
the birds were vaccinated against New Castle disease and Infectious Bursal
disease on 8th and 14th day of age, respetively. Each of the 12 diets (section
3.3.1.1a) were offered randomly to triplicate groups of 10 chicks each. The
diets in colony feeders were provided to the corresponding birds ad libitum
and the potable water was provided in PVC fountains (initial 2 weeks) or in a
continuous channel (3rd week onwards) was made available round the clock.
The rest of the managemental practices were applied uniformly to all the birds
during the 42-day experimental period.
3.3.1.2 Growth Performance Parameters

Several parameters were studied to observe the effect of inclusion of SPR in
broiler diets with biotechnological approaches and are described hereunder:
a) Body Weight Gain: The weekly individual body weights of birds were
recorded and the body weight gains were arrived at for each week. The body
weight gain was also calculated for each phase (starter, grower and finisher)
and on a cumulative basis. Accordingly, the body weight gains in different
dietary groups were compared as per treatment wise and main factors (SPR
levels and Biotechnological tools) wise.
b) Feed Consumption: The daily feed offered to any individual group was
accurately recorded and at the end of each week, the residual feed, as well as
spilled over feed from that group was accounted. Care was taken to delete the
amount of feed consumed by the birds that died during a particular week by
calculating the daily feed consumption during that week. Thus the average
feed consumption in different groups was calculated during each week as well
as during starter phase (0 to 14 days), grower phase (15 to 28 days) and
finisher phase (29 to 42 days) and cumulatively (0 to 42 days).
c) Feed Conversion Ratio: The feed conversion ratio (FCR) expressed as the
ratio of amount of feed consumed to the body weight gained under each group
of birds arrived at each week and each phase wise as well as cumulatively.
d) Mortality: Mortality in respective groups was recorded as and when the birds
died. The dead birds were necropsied to identify the dietary cause, if any. The
physical consistency and the colour of fecal droppings of various groups was
under observation from time to time.
3.3.1.3 Metabolizability of Various Nutrients
A conventional 3-day metabolism trial involving all the replicates was
conducted from 19th to 21st day of experiment, during which the amount of feed
consumed and the excreta voided by the birds were recorded. Based on such data,
metabolizability of different dietary components as well as retention of certain
minerals were arrived.

a) Metabolizability of various Nutrients : The procedures adopted for
obtaining the metabolizability coefficient of various nutrients of experimental
diets were same as described under section 3.2.1.3.
b) Calcium and Phosphorous Retention: The calcium and phosphorus contents
of feed and fecal samples were estimated using procedures described by
Talapatra et al. (1940) and Ger and Kurmies (1952), respectively. Calcium and
phosphorus retentions were worked out using the following formulae.
Calcium intake (g) - Calcium out go (g) Calcium retention (%) =
Calcium intake (g) X 100
Phosphorus intake (g)
- Phosphorus out go (g) Phosphorus
retention (%) = Phosphorus intake (g)
X 100
3.3.1.4 Blood Biochemical Profiles
On 21st day of the experiment (mid way), blood was collected replicate wise
from randomly selected birds (one male and one female bird per replicate) by
puncturing the brachial vein of the bird (Plate-12) and collecting the blood in 10ml
glass test tubes. After 8 to 10 hours, serum was collected as per the standard
procedures (Calnek et al., 1992) and was stored at –200C till subsequent analysis.
Again on 42nd day (terminal day), blood samples were collected in a similar way form
the same birds.
The individual serum samples were analyzed for mineral profile viz., calcium
and inorganic phosphorous using auto-analyzer (M/s Span Diagnostics Ltd., Surat) as
per the procedures described by the manufactures.
3.3.1.5 Carcass Characteristics and Organometry
At the end of the experiment (42nd day), the birds (1 male and 1 female) which
were earlier selected for blood collection (section 3.3.1.4) on 21st day were separated
and starved for 12 hrs however with a provision of plenty of water. Then immediately
after recording their live body weights (pre-slaughter bird weight), the birds were

sacrificed by cervical dislocation and the carcasses (Plate-13) were subjected for the
study of following parameters:
a) Dressing Percentage: The slaughtered birds were defeathered, denecked and
eviscerated along with two legs beneath the hock joint to observe the effect of
various experimental diets on the dressing percentage. The dressing
percentage was calculated as the percent of the carcass weight obtained after
removing the feathers, neck, legs and internal viscera, to its live body weight.
b) Meat to bone ratio: A specific portion of the carcass viz., thigh from all the
72 carcasses were separated, weighed and preserved under frozen conditions.
Later, the thigh portions were thawed and the bone and muscles were
separated manually from each other and their individual weights were
recorded to arrive at meat: bone ratio as:
Weight of the meat (g) Meat : Bone ratio = Weight of bone (g) c) Organometry: From the sacrificed birds, different organs viz., heart, liver,
gizzard, spleen and bursa as well as abdominal fat were carefully separated
and weighed to observe the effect of different dietary treatments on growth
and development of certain organs. The procedure followed are briefed here
under:
Giblets: The weight of the giblet organs viz., heart without pericardium, liver
with out gall bladder and gizzard with out the food contents and internal
lining membrane from each sacrificed bird were recorded and expressed as the
per cent of pre-slaughter bird weight as follows:
Relative heart percentage = [heart weight (g)/live weight (g)]*100
Relative liver percentage = [heart weight(g)/live weight (g)]*100
Relative gizzard weight = [heart weight (g)/live weight (g)]*100
Lymphoid organs: The weights of the lymphoid organs viz., bursa and
spleen from each sacrificed bird were recorded and expressed as the percent of
pre-slaughter bird weight (g/100g).
Abdominal fat weight: The weight of the fat present in abdomen including
the fat surrounding gizzard, bursa, cloaca and adjacent muscles of each bird
was recovered and expressed as percent of concerned pre-slaughter bird
weight.

d) Intestinal tract measurements: Along with other parameters of organometry
study, the digestive tract of the all sacrificed birds were carefully removed and
the length of different segments of intestine viz., duodenum, jejunum, ileum
and caeca were measured as follows:
Length of duodenum = the length of pancreatic loop
Length of jejunum = from pancreatic loop to Meckel’s diverticulum
Length of ileum = from Meckel’s diverticulum to ileocaecal junction
Length of caeca = average of the lengths of left and right caecum.
The length of each segment was expressed in terms of percentage of pre-
slaughter body weight (cm/100g)
3.3.1.6 Bone Mineralization
From the same birds which were sacrificed on 42nd day for carcass
characteristic studies (Section 3.3.1.5), apart from left thighs, the left leg portions
(Plate-14) were also collected and were preserved in deep freezer at -200C to observe
the effect of dietary inclusion of SPR (availability of minerals in SPR) on bone
mineralization, if any.
a) Tibial ash: From the thigh portion which was earlier used for the meat: bone
ratio study, the tibial bone was speared by stripping off all the adhering soft
tissue. The tibial bones from each replicate were polled and dried at 1000C for
48 hrs and weighed. Then the dried tibial bones were soaked in petroleum
ether for 48 hrs followed by ashing at 6000C for 6 hrs. The tibial ash so
obtained were expressed as percent of dried tibial bone mass.
b) Toe ash: Toe samples were obtained from severing the left middle toe through
the joint between the second and third tarsal bones from distal end. The toes of
all the birds within a replicate were pooled, and the composite samples were
dried to a constant weight at 1000C and then subjected for ashing in a muffle
furnace at 6000C for 6h. The content of toe ash was also expressed in terms of
percentage of dry weight.

c) Tibial calcium and phosphorous: The tibial ash samples (section 3.3.1.6a)
were further subjected for estimation of calcium and phosphorous content as
per the procedures described under section 3.1.2.3. The calcium and
phosphorus values obtained were expressed as percent of tibial ash.
3.3.1.7 Performance Indices
The cost of the starter, grower and finisher types of all the experimental diets
was arrived at by considering the prevailing prices of the constituent feed ingredients
and feed additives including that of enzymes and lecithin. The relative cost
effectiveness of each diet was thus assessed. Further, by considering the prevailing
sale price of the broiler bird, the Performance Index Score (PIS) and the Economic
Index Score (EIS) were arrived at i.e.
Gram average body weight x % livability 1) PIS = FCR x No. of days reared x 10
PIS 2) EIS = Cost of diet (Rs./kg)
3.3.2 Production Performance in Layers
By making use of the ME value of SPR so obtained from layers’ metabolism
trial, SPR was included at 0, 5 and 10 % levels in layers diets and evaluated in terms
of egg production, feed consumption, feed conversion efficiency, egg characteristics
(egg weight, Haugh unit, shell thickness etc.), nutrient utilization, calcium and
phosphorus status in blood and efficiency of utilization of energy and protein. At the
end, the cost effectiveness of SPR was also assessed. The 84-day layer production
performance trial was conveniently divided into 3 periods of 28 days duration each. A
brief description about the materials and methods adopted for feeding cum production
performance trial in layers are presented hereunder:
3.3.2.1 Experimental Diets, Birds and Management
a) Experimental dietary design : The practical type layer diet (control)
involving maize as the main energy source and soybean meal, groundnut
extraction and sunflower extraction as the protein sources with shell grits,

calcite powder, di-calcium phosphate and salts of pertinent trace minerals was
prepared to meet or exceed the nutrient specification of Bureau of India
Standards (BIS, 1992). In the test diets, the sun dried SPR was included at 2
different levels (5 and 10 per cent, respectively) to cater to organic and
inorganic nutrients at the expense of relevant organic nutrients and mineral
contributing salts.
Further, such three iso-nitrogenous and iso-caloric diets were supplemented
with either lipid utilizers (lipase @ 0.2g and lecithin 2g/kg diet) or NSP
degrading enzyme preparation @ 0.5g/kg diet or their combination to result in
another set of 9 test diets, a design similar to that described under section
3.3.1.1a, was aimed to study the effect of inclusion of SPR at different levels
as well as increasing the efficiency of SPR utilization through
biotechnological approaches. The detailed ingredient and calculated nutrient
composition of each diet are given in Table 3.5.
b) Experimental birds: After a gap of one month following a metabolism trial,
the same birds were used for production trial. Infact all the birds were on a
common practical standard layer diet so as to nullify any variable effect if any,
due to previous metabolism study diets. One hundred forty four BV-300
commercial layers of about 40 weeks age were redistributed randomly into 36
replicate of 4 birds each. The birds were housed (Plate-15 and 16) in two tier
colony cages. Four birds were housed in each cage measuring 15’’x15’’x18”
size to serve as a replication. Each of the 12 diets (Sec. 3.3.2.1a) was offered
to four such replications of 4 birds each in colony cage units. The birds were
placed in cages in such a way that there was one empty cage between the two
groups to prevent the access of other diet in adjacent cage. Added to it, the
continuous feed trough was partitioned with a partition material to avoid
mixing up of test diets, if any. By and large, the distribution of replications of
treatments was essentially uniform.
The birds were maintained under standard managemental conditions including
periodical deworming, preventive or therapeutic disease control, lighting programme,
feeding frequency, watering methods and other routine bio-security aspects. The

experiment lasted for 84 days which was conveniently divided into three 28-day
interval periods.
3.3.2.2 Egg Production Parameters
Various egg production performance parameters were considered to critically
evaluate the scope of inclusion of SPR in layer diets in combination with
biotechnological approaches for enhancing its nutritive value and are described
hereunder:
a) Body weights: Individual body weights of birds were recorded at beginning of the experiment as well as at every 28-day interval to monitor the pattern of body weight changes, if any, due to dietary regimen. Group wise average weights under different treatments were calculated and the
period wise changes (loss / gain) in body weight were arrived at. The weighing of the birds was done in the early hours of the day before
feeding and oviposition.
b) Egg production: Every day in late hours, the number of eggs produced in a particular replicate group was recorded and the hen day egg production
was arrived at on the basis of three 28-day periods as per various treatments for further statistical analysis. The rate of egg production was calculated both for the individual periods and on the basis of cumulative
period as well.
c) Daily feed consumption: An amount of 120 g feed per bird per day was
collectively offered to the four bird replicate group during the initial few
days of experiment. Subsequently, the daily required amount of
concerned diet was adjusted based on the pattern of feed being consumed
by the particular group of birds. The diets were offered in divided doses
of about 50 per cent in morning and the remaining 50 per cent in the
afternoon hours. The feed residue, if any was recorded in each replicate
group at end of every week.
d) Feed efficiency: The amount of feed consumed to produce one kg egg
mass and/or a dozen eggs in each dietary replication was calculated. Such
feed efficiency values (kg feed/kg egg mass or kg feed/dozen eggs) were
calculated both period-wise (28-day) and cumulatively.

e) Mortality: The health status of the birds of various groups was under
constant observation from time to time. The dead birds were subjected
for post mortem examination to identify the dietary cause, if any. The
physical consistency of fecal droppings of various groups was under
periodical observation.
3.3.2.3 Egg Characteristics
On the terminal day of every 28-day interval, all the eggs produced from
different replicate groups were collected and were weighed individually during
the experimental period of 84 days. Further, on the immediate next day, each egg
was broken and the entire contents were carefully placed on a glass slab for
measurement of albumen and yolk indices (Plate-17 and 18). The values were
then arranged according to treatments and main factors wise under each 28-day
period as well as cumulatively.
a) Egg weight : Egg weights were recorded twice a week on two days i.e.,
Tuesday and Friday of every week and in addition, egg weights were also
taken at the end of 28-day periods. The weights so obtained on eight
occasions during a particular 28-day (4-week) period were averaged and
the data were arranged as per treatments and main factors.
b) Egg shape index: The width and length of an each egg (unbroken) was measured by using Vernier Calipers as described by Reddy (1979) and
egg shape index (ESI) was calculated as: Horizontal diameter (breadth) in cm ESI (%) = Vertical diameter (length) in cm X 100
c) Albumen index : The height and diameter of egg albumen were obtained
using Ames Haugh Unit Spherometer and Vernier Caliper, respectively and the albumen index (AI) was calculated as:
Albumen height in mm AI= Albumen diameter* in mm X 100
*Average of albumen length (mm) and albumen width (mm)
d) Haugh unit score: After recording the height of albumen at two places (one near to yolk and the other at the end of dense albumen) by using Ames Haugh unit meter, the relationship between egg weight and albumen

height for each egg was calculated as Haugh unit score (Haugh, 1937) as follows:
Haugh unit = 100 x log (H + 7.57 – 1.7 x W0.37) Where H= albumen height (mm) and W= egg weight (g)
e) Egg yolk colour : The colour of yolk of every broken open egg was scored
by matching (contrast) technique using Roche yolk colour fan (Roche Company, 1969). Its colour value denotes the colour intensity from 1 to 14
scale according to the degree of yolk colour.
f) Yolk index: The height (at centre place) and diameter of the yolk was measured using Ames Haugh Unit Spherometer and Vernier Calipers and
the yolk index (YI) was calculated as: Yolk height in mm
YI (%) = Yolk diameter in mm X 100
g) Shell thickness: Following the breaking of egg, the shell pieces devoid of
shell membranes at broad end, narrow end and middle band were carefully selected and their thickness were measured using a digital
calipers as described by Ogunmodde and Oguntella (1971). The average of all the three pieces was represented as shell thickness.
3.3.2.4 Metabolizability of Various Nutrients
Towards the end of the experimental period (on 75th, 76th and 77th day), a
three-day metabolic trial involving all the replicates (4 birds each) under each diet
was carried out. The total collection method was adopted to study nutrient
metabolizability and the retention of calcium and phosphorus. The procedure
followed was similar to that described under section 3.2.1.3.
The analytical procedure and calculations followed for arriving
metabolizability of different proximate and fiber constituents as well as retention of
calcium and phosphorus was similar to that being described under section 3.3.1.4.
3.3.2.5 Blood Biochemical Profiles
By selecting one bird from each replication, about 2 ml of blood was collected
from it’s wing vein and was transferred into a clean, sterilized and labeled test tube.
The test tube was held in a slanting position to facilitate serum separation. The clear
non-haemolysed serum was then transferred into a clean, sterilized and labeled vial.
Every 28-day, the same birds were bled to collect the serum. The calcium and

inorganic phosphorus content of serum samples were analyzed using auto-analyzer
(BT-224 photometer) as described by commercial supplier (M/s.Span Diagnostics).
3.3.2.6 Efficiency of Utilization of Protein and Energy
The gross efficiency of converting dietary protein and metabolisable
energy to those of eggs under all treatments and during different periods was
calculated based on intake and transfer of the said nutrients as described below:
a) Protein utilization: Gross efficiency of protein utilization (EPU) was
calculated as follows:
Total egg mass produced X 0.12 EPU (%) =
Total dietary protein intake X 100
Where, 0.12 represents the unit of protein present in one unit of egg.
b) Energy utilization: Gross efficiency of energy utilization (EEU) was
calculated as follows: Total egg mass produced X 1.6 EEU (%) = Total dietary ME intake X 100
Where, 1.6 represents the amount of kcal per every gram of egg mass as
described by Reddy (1979).
3.4 ECONOMICS
The cost of each diet prepared during both broilers’ and layers’ feeding trial
was arrived at by considering the prevailing prices of the constituent feed ingredients,
mineral salts and other additives including that of enzymes and lecithin. The relative
cost effectiveness of each diet was thus assessed. Further, by considering the sale
price of broiler chicken including the expenditure on chicks or laying hens and their
eggs, labor, medicine etc., the net profit for each treatment was calculated separately
for broilers and layers under different treatment.
3.5 STATISTICAL ANALYSIS
The data generated during all the trials in broilers and layers involving SPR were analyzed manually using Microsoft excel based one way ANOVA (CRD) for the treatments and the main effect of dietary regimen (SPR level and Biotechnological tool) according to the procedures described by Snedecor and Cochran (1989). All the

percentage values were transformed into arc sign value before analysis. The differences in means were tested by using Duncan’s Multiple Range Test (Duncan, 1955) when significant.

IV. RESULTS AND DISCUSSION
The results of the present study have been presented and discussed under the following headings:
4.1 CHEMICAL COMPOSITION OF SUGARCANE PRESS RESIDUE (SPR)
4.1.1 Proximate Principles
4.1.2 Gross Energy Content
4.1.3 Fiber Fractions
4.1.4 Mineral Constituents
4.1.5 Amino Acid Composition
4.1.6 Fatty Acids Profile 4.2 METABOLIZABILITY OF ENERGY AND OTHER NUTRIENTS OF SPR IN BROILERS
4.2.1 Chemical Composition of Experimental Diets 4.2.2 Metabolizability of various Nutrients and Energy of Experimental Diets 4.2.3 Ileal Nitrogen Absorbability 4.2.4 Metabolizability of Energy and other Nutrients of SPR 4.2.5 Growth Performance of Birds
4.3 METABOLIZABILITY OF ENERGY AND OTHER NUTRIENTS OF SPR IN LAYERS 4.3.1 Chemical Composition of Experimental Diets 4.3.2 Metabolizability of various Nutrients and Energy of Experimental Diets 4.3.3 Metabolizability of Energy and Other Nutrients of SPR 4.3.4 Production Performance of Birds
4.4 PERFORMANCE OF BROILER BIRDS FED SPR BASED DIETS 4.4.1 Chemical Composition of Experimental Diets 4.4.2 Body Weight Gain and Livability 4.4.3 Feed Consumption and Feed Efficiency 4.4.4 Metabolizability of Various Nutrients and Balance of Minerals 4.4.5 Carcass Characteristics and Organometry 4.4.6 Bone Mineralization 4.4.7 Blood Biochemical Profile 4.4.8 Economics

4.5 PERFORMANCE OF LAYER BIRDS FED SPR BASED DIETS 4.5.1 Chemical Composition of Experimental Diets 4.5.2 Egg Production 4.5.3 Feed Consumption and Feed Efficiency 4.5.4 Body Weight Changes and Livability 4.5.5 Egg Characteristics 4.5.6 Efficiency of Utilization of Energy and Protein 4.5.7 Metabolizability of Various Nutrients 4.5.8 Blood Biochemical Profile 4.5.9 Economics
4.6 GENERAL DISCUSSION

4.1 CHEMICAL COMPOSITION OF SUGARCANE PRESS RESIDUE
(SPR)
4.1.1 Proximate Principles
The values of proximate constituents of sun-dried and oven-dried SPR
samples including acid insoluble ash and gross energy content of only sun-
dried SPR samples from different sugar factories are presented in Table 4.1.
The moisture content of freshly obtained SPR samples ranged between 76.53
to 86.46 per cent with an average value of 79.6 per cent. The dry matter (DM)
content of sun-dried SPR samples ranged form 91.71 to 92.95 per cent while
that of air-equilibrated oven-dried SPR samples ranged from 91.18 to 94.23
per cent. On an average, sun-dried dried SPR samples contained 92.30 and
93.10 per cent DM, respectively.
The organic matter (OM) content of sun-dried and oven-dried SPR
samples ranged from 74.22 to 80.03 and 76.07 to 84.70 per cent, respectively.
The corresponding total ash (TA) values were between 19.97 to 25.78 and
17.91 to 23.93 per cent with average values of 21.94 and 18.91 per cent,
respectively.
The crude protein (CP), crude fiber (CF), ether extract (EE) and
nitrogen free extractives (NFE) contents of sun-dried and oven-dried SPR
samples ranged from 9.18 to 14.11 and 8.62 to 12.19; 3.60 to 12.24 and 4.28 to
11.41; 4.64 to 9.98 and 4.50 to 9.00 per cent; from 38.57 to 54.84 and 49.26 to
58.64 per cent, respectively. The average CP, CF, EE and NFE values of sun-
dried and oven-dried SPR samples were 11.76 and 10.34; 10.08 and 9.06; 7.87
and 6.91; 48.35 and 54.78 per cent, respectively.

In general, the TA content of sun-dried SPR samples were marginally
higher than that of oven-dried samples while CP values were lower in oven-
dried SPR samples compared to sun-dried samples. The variation in other
proximate constituents between sun-dried and oven-dried SPR samples were
inconsistent with no definite trend. These results indicate that the method of
processing has little impact on the proximate composition of SPR samples.
The higher TA in sun-dried SPR samples may be due to the possible
contamination of samples with soil / sand or due to loss of some organic
matter via wind / aerial route during the process of drying under sun.
Similarly, the lower CP in dried SPR samples might be due to the loss of
volatile nitrogen during drying process in the oven at 1000C.
The proximate composition of SPR samples obtained were well within
the range of values reported by Singh and Solomon (1995). The observations
were also close to the values reported by Suma (2005) but however with a
marginally lower CF and TA and higher EE and NFE values. On contrary, the
average CP, CF and TA content of SPR samples obtained were higher with
lower EE content than the values reported by Budeppa (2004) and Suresh
(2004). Such a variation in chemical composition of SPR samples could be due
to differences in agro-climatic conditions, quality of the cane crushed
including variety and the method employed for clarification of cane juice in
the sugar factory including the quantity of chemical added.
The proximate composition of sun-dried SPR (The Mysore Sugars Ltd.,
Mandya) procured in bulk for conducting biological trials (Table 4.1 and Fig
1A) comprised of: DM-92.83, TA-23.95, CP-11.80, CF-13.73, EE-11.95 and NFE-
38.57 per cent with the AIA of 4.93 per cent. The TA and NFE content were
comparable to the values reported by Suma (2005) while the EE content was

similar to the value reported by Suresh (2004). The CP content was
intermediate to the values reported by Suma (2005), Budeppa (2004) and
Suresh (2004). Further, these values were different from the earlier analyzed
values for the SPR sample obtained from same factory (A) indicating that the
SPR composition was quite variable depending on the season as well.
Further, from the proximate analysis data, it is evident that the SPR
resembles certain cereal by-products and as far as protein and crude fiber
contents are concerned, SPR is quite similar to brans (DORB).
4.1.2 Gross Energy Content
The gross energy (GE) content of sun-dried SPR samples obtained from
various factories together with the predicted metabolizable energy (ME)
values using prediction equation (NRC, 1994; Janssen and Carre, 1989) are
presented in Table 4.1. The GE values of different sun-dried SPR samples
ranged from 3719 to 4310 kcal/kg with an average value of 4083 kcal/kg. The
SPR used for biological trials contained 4068 kcal/kg GE. The variation in GE
content of SPR samples was attributed to the differences in the amount of OM
(74.22 to 80.33 per cent) and its components particularly that of CF (7.94 to
13.73 per cent) and EE (4.64 to 11.95 per cent) content. However, at the best
the GE values indicate a balance of organic vs. inorganic components only.
The calculated ME values of sun-dried SPR samples ranged from 1534
to 2530 kcal/kg with an average value of 1980 kcal/kg dry matter. The
predicted ME content of SPR used for biological trials was 1784 kcal/kg DM.
The ME content of SPR was comparable to that of certain feedstuffs e.g. DORB

– 1900 kcal/kg, fish meal - 1800 kcal/kg (NRC, 1994). However, these values
were also just an approximation because this type of predication equation is
not accurate (±500 kcal/kg). Furthermore, a number of dietary factors per se
(e.g. anti-nutritional factors, protein quality, and effect of processing and
storing) which are not determined by chemical characterization and animal
factors may influence the biologically available energy value (ME) of feed
ingredient (Leeson and Summers, 2001).
4.1.3 Fiber Fractions
The values of fiber factions of the sun-dried SPR samples obtained
from different sugar factories including the SPR employed in biological trial
are given in Table 4.2. The neutral detergent fiber (NDF), acid detergent fiber
(ADF) and AD-lignin content ranged from 47.37 to 59.42, 20.92 to 33.70 and
from 5.93 to 17.78 per cent, respectively. The hemicellulose and cellulose
contents were between 17.77 to 32.36 and 14.99 to 18.84 per cent, respectively.
The average NDF, ADF, AD-lignin, hemicellulose and cellulose values were
found to be 55.01, 28.84, 11.69, 29.17 and 17.14 per cent, respectively. The
NDF, ADF, AD-lignin, hemicellulose and cellulose contents of sun-dried SPR
employed in biological trial (Table 4.2 and Fig 1B) were 55.80, 29.42, 11.13,
26.38 and 18.29 per cent, respectively.
The average values of different fiber fractions viz. NDF, hemicellulose
and cellulose obtained in the present study were higher than the values
reported by Suresh (2004), however, the ADF value was comparable and AD-
lignin value was slightly lower. The NDF and ADF values were lower than
the values reported by Gupta and Ahuja (1998). In general, the differences in
fiber fractions were mainly attributed to the quality of cane and in particular
due to the maturity of plant at harvesting time.

4.1.4 Mineral Constituents
The mineral composition of sun-dried SPR samples was (Table 4.3)
determined by atomic absorption spectroscopy and the values ranged from:
2.80 to 4.90 per cent for Ca, 0.75 to 1.35 per cent for total P, 0.63 to 1.35 per
cent for Mg, 37.0 to 140.0 ppm for Cu, 65.0 to 210.0 ppm for Zn, 2100 to 4300
ppm for Fe, 250.0 to 330.0 ppm for Mn and 1.8 to 9.7 ppm for Co. The
corresponding average values were 3.87, 1.10, 0.95 per cent, 61.5, 112.6, 3500,
284.3 and 5.0 ppm, respectively. The mineral profile of SPR used in biological
evaluation (Table 4.3 and Fig 1C) comprised of: Ca-4.90, total P – 1.25, Mg –
1.35 per cent, Cu – 58.5, Zn – 86.5, Fe – 4300, Mn – 260.0 and Co – 6.4 ppm.
The mineral profile of SPR samples obtained in the present study were
well within the range reported by Singh and Solomon (1995). However, the
average values appeared to be higher than the values reported by Budeppa
(2004) and Suresh (2004). Contrarily, the Ca and total P values of SPR
obtained by Suma (2005) were higher than the average values obtained in the
present study. The wide variation in mineral composition of SPR samples
procured from different sugar factories located in different parts of Karnataka
was again attributed to the differences in agro-climatic conditions and
particularly to the mineral status of soil on which the sugarcane plant was
grown and also due to the procedural differences in the clarification of cane
juice at the sugar factory.
The mineral analysis indicated that the SPR contains substantial
amount of inorganic nutrients and was found to be superior (except iron) in

comparison to other conventional feed ingredients used in poultry rations,
such that it can alternatively conserve the mineral supplements.
4.1.5 Amino Acid Composition
Amino acid profile of selected SPR samples obtained from the analysis
carried out by M/s. Degussa-Huls AG, Germany (2006) is presented in Table
4.4. The profile of all the essential amino acids except tryptophan and some
non essential amino acids in the SPR samples were compared to that of the
amino acid profile of maize and de-oiled rice bran, the ingredients whose CP
contents are very much comparable to that of SPR samples.
The amino acid profile (% of CP) of SPR samples obtained from
different sources were comparable among each others except lysine. The
average essential amino acids content of SPR was: methionine – 2.21, cysteine
– 1.05, lysine – 4.56, threonine – 5.48, arginine – 4.10, isoleucine – 4.77, leucine
– 8.72, valine – 6.27, histidine – 2.44, phenylalanine- 4.90 and glycine – 5.95
g/16g N and that of non essential amino acids was: serine – 4.76, proline –
4.83, alanine – 6.44, aspartic acid – 10.28, glutamic acid – 12.45 g/16g N.
The ratio of essential to non essential amino acid in SPR was
approximately 1:1. The asparatic acid content was in highest amount followed
by glutamic acid, both are non essential amino acids. Among the essential
amino acids, the leucine content was highest followed by valine and threonine
with cystine content being the lowest.
When expressed as percentage of protein content, essential amino acid
composition of SPR was found to be different than that of corn and DORB.
With respect to the limiting amino acids, sulfur containing amino acids
(methionine + cysteine) were lower in SPR samples when compared to maize

and DORB whereas the lysine and threonine contents were higher in SPR. The
concentration of rest of the essential amino acids in SPR were more or less
similar to that of maize and DORB except arginine which was lower in SPR.
The amino acid content of SPR obtained in the present study were higher than
the values reported by ICIDCA (1988). The total sulfur containing amino acids
of SPR were proportionately lower in SPR compared to maize and DORB
however with the substantially higher arginine.
The results reveal that the amino acid profile of SPR notwithstanding
its mineral value, is a significant attribute of SPR.
4.1.6 Fatty Acids Profile
In addition to its major role in providing energy, the dietary fat has a
role in providing individual fatty acids which have specific nutritional roles
within the animal body. Hence, information on quality of the fat i.e., fatty acid
composition is of prime importance in any nutritional investigation.
The fatty acid profile of the fat component of SPR sample analyzed by
chromatography is presented in Table 4.5 and also pictorially represented in
Fig 1D. The analysis revealed that in general, among the constituent fatty
acids, the linoleic acid was found in highest concentration (4.541%) and least
being caprylic and capric acid (0.2% each).
With regard to the presence of double bonds in fatty acids, the ratio of
unsaturated (with at least one double bond) to saturated fatty acids in SPR is
about 3:2. Among the unsaturated fatty acids, linoleic acid was in highest
concentrations (4.541%) followed by oleic acid and linolenic acid with no

palmitoleic or arachidonic acid, while palmitic acid was in highest
concentration (3.621%) among saturated fatty acids followed by lauric acid
(0.167%) with no caproic acid. As far as the chain length of fatty acid is
concerned, more than 95% of fatty acids were of long chain (C>16) type.
The quality assessment of ether extract fraction of SPR revelead that
like oils of plant and marine origin, SPR fat contains more unsaturated fatty
acids particularly linolenic acid, an important essential fatty acid. However,
SPR also contains good amount of saturated long chain fatty acid (palmitic
acid).
In general, the by-product obtained from various sources may vary
widely in their nutritional composition. In this particular case, the nutritional
composition of SPR varied in comparison with SPR samples used in previous
studies. Crude protein levels of SPR in this study were 3 to 5% lower than
levels previously reported. The level of ether extract was 8 to 10% higher than
the levels typically reported in literature. As far the remaining nutritional
components are concerned, slight variations were obvious with by-products
of such origin.
The chemical composition of SPR in general revealed that the SPR is a
valuable source of both organic and inorganic nutrients. Its nutrient
composition is comparable to that of cereal grains, their by-products and
appeared to be a potential feed ingredient for poultry.

4.2 METABOLIZABILITY OF ENERGY AND OTHER NUTRIENTS OF SPR IN BROILERS Since the metabolizable energy (ME) content of a feed ingredient is a
prerequisite for its inclusion in the practical diet formulated with precision, an
earnest effort was made to determine the ME value of SPR for young birds i.e.,
broilers. The results including the growth performance of broilers during 14-day
metabolism trial (7-21days of age) are discussed here under.
4.2.1 Chemical Composition of Experimental Diets
The proximate composition and gross energy content of the experimental diets
compounded during the metabolism trial in broilers is given in Table 4.6. The dry
matter content was more or less consistent in all the diets and ranged from 90.23 (T1)
to 91.85 per cent (T8). The total ash, crude protein, ether extract, crude fiber and NFE
contents ranged from 7.76 (T1) to 13.47 (T16), 18.34 (T14) to 23.40 (T1), 3.61 (T1) to
4.96 (T16), 6.12 (T4) to 11.36 (T13) and from 50.97 (T12) to 59.44 per cent (T4),
respectively. The gross energy values ranged from as high as 4250 kcal/kg (T1) and as
low as 3814 kcal/kg (T15). The basal diets (T1 to T4) contained all the nutrients similar
to that of a practical type broiler starter diet (BIS, 1992) while the test diets (T5 to
T16) were different depending on the level of substitution of basal diet (T1) with SPR.
As expected, the contents of crude fiber, ether extract and total ash in the
experimental diets increased with the incremental level of SPR (0, 10, 20 and 30%)
while the trend was declining for rest of the nutrients i.e. NFE and crude protein.
Such a pattern was obviously due to the chemical composition of SPR per se. The
higher amounts of crude fiber (13.73%), ether extract (11.95%) and total ash
(19.97%) of SPR and with lower crude protein (11.80%) and NFE (38.57%) than that
of the basal diets was responsible for such a variation. Other important nutrient i.e.,
gross energy content decreased progressively with the incremental level of SPR which
was again due to the reduced organic matter content of SPR diets. However, with in
the groups i.e., 0, 10, 20 or 30% SPR included diets, the proximate constituents and
gross energy contents remained by and large similar to each other. The marginal
variation in diets belonging to the same group (SPR level) was due to the addition of
biotechnological products to the basic ingredient composition which remained same
for such diets.

4.2.2 Metabolizability of various Nutrients and Energy of Experimental Diets
The metabolizability coefficient of dry matter, organic matter, ether extract,
crude fiber and gross energy including the ileal nitrogen digestibility of all the
experimental diets employed for metabolism trial in broilers is presented in Table 4.7.
a) Dry matter and other proximate constituents
The metabolizability of dry matter, organic matter, ether extract and crude
fiber of experimental diets (Table 4.7) ranged from 58.67 (T14) to 71.29 (T2), 61.61
(T16) to 74.65 (T2), 53.04 (T14) to 66.75 (T2) and from 45.55 (T7) to 54.50 per cent
(T1), respectively. The variation among different treatments was highly significant
(P<0.01) for dry matter, organic matter and ether extract metabolizability and
significant (P<0.05) for metabolizability of crude fiber. In general, the better
metabolizability values for different nutrients were observed in the reference / basal
diets (0% SPR) when compared to that of SPR based test diets.
With regard to the main factor SPR, the average metabolizability coefficient
values ranged between 59.80 (30% SPR) and 70.59 per cent (0% SPR) for dry matter,
62.58 (30% SPR) and 73.98 per cent (0% SPR) for organic matter, 56.59 (30% SPR)
and 66.28 per cent (0% SPR) for ether extract and between 49.54 (20% SPR) and
53.34 per cent (0% SPR) for crude fiber. The differences among different groups were
highly significant (P<0.01) for dry matter, organic matter and ether extract
metabolizability while that of crude fiber was significant at p<0.05.
With regard to the main factor biotechnological tool, the metabolizability
coefficients of dry matter, organic matter and crude fiber were statistically similar
(P>0.05) among different groups. However, the metabolizabilty coefficient values of
ether extract were significant (P<0.05) and the diets supplemented with lipid utilizing
agent showed the lowest value (57.63 %) when compared to rest of the groups (59.58
to 60.42 %).
The results indicated that the metabolizability of different components of
experimental diets decreased with the incremental level of SPR (0, 10, 20 and 30%).

The marginally improved metabolizability values for dry matter and organic matter
was observed in diets supplemented with combination of biotechnological agents.
The higher dry matter outgo and in turn, the poor metabolizability of SPR
based diets was due to the relatively higher amount of crude fiber and inorganic
matter coupled with poor utilization of ether extract fraction. The crude fiber is
poorly digested by the poultry and thus the higher crude fiber in the diet may lead to
low DM metabolizability. Also is the fact that the crude fiber increases the rate of
passage in the gut and brings about physico-chemical changes in the ingesta due to
its hydrophilic property (Southgate, 1973). Higher levels of inorganic matter are also
known to reduce the DM metabolizability (Scott et al., 1989). Similar observations
were made on studies with dried poultry manure (Scott et al., 1989), wheat barn and
rice bran (Basavaraja Reddy, 1984) and dried silk worm excreta (Narayanaswamy,
1984) in broiler chicks.
The other reason for reduced nutrient metabolizability of SPR based diets with
higher level of SPR inclusion was due to suboptimal development of the gastro-
intestinal tract during 0 to 3 weeks of age which could not cope with the high fiber
and total ash content of such diets. Hence, the incomplete development of digestive
cum secretary organs might have resulted in insufficient production of endogenous
enzymes such as lipase, carbohydrases and proteases which were responsible to
reduced ether extract and NFE metabolizability of SPR based diets.
Among the diets compared for biotechnological factors as the main factor,
there was no statistical difference observed for different nutrients metabolizability
except for EE metabolizability. Addition of lipase and lecithin or lipase, lecithin and
NSP degrading enzymes together could not improve the metabolizability of EE for
which the reason is unknown. Also addition of NSP enzymes has no additional
beneficial effects on nutrient metabolizability which indicates that the presence of
different type of NSPs in SPR based diets.
b) Gross Energy
The metabolizability coefficient of gross energy content of different
experimental diets (Table 4.7) employed in the metabolism trial in broilers ranged

from 68.90 (T10) to 78.11 per cent (T3). There was a significant difference (P<0.01) in
metabolizability of gross energy values among dietary treatments.
With regard to SPR as the main factor, the average metabolizability values of
gross energy were 77.67, 74.84, 69.98 and 69.85 per cent in diets containing with 0,
10, 20 and 30% SPR, respectively. The values were highly significantly (P<0.01)
different with the highest value in control diets (0% SPR) and lowest value in 20 and
30% SPR diets.
With regard to biotechnological tool as the main factor, the average values of
gross energy metabolizability values were 73.58, 72.29, 73.65 and 73.62 per cent in
diets fortified with no supplement or with lipid utilizing agent or with NSP degrading
enzymes or both, respectively. The values were statistically similar (P<0.05).
Based on their gross energy content and its metabolizability, the
metabolizable energy (ME) content of all the experimental diets employed in the
broilers’ trial was also arrived at. The values were found to be statistically similar
and ranged between 2682 (T15) and 3303 kcal/kg (T4) among different diets. The
average ME values for 0, 10, 20 and 30% SPR substituted diets were 3293, 3039,
2803 and 2686 kcal/kg, respectively and the values were significantly (P<0.01)
different from one another. The average values irrespective of SPR inclusion were
2964, 2955, 2948 and 2953 kcal/kg in diets with no supplement, with lipid utilizing
agent or with NSP degrading enzymes or both, respectively and the values were
statistically similar (P>0.05).
It was clearly evident that the ME content of SPR based diets was significantly
lower (P<0.01) and there was a linear reduction in ME content of the diets with the
incremental level of SPR (0, 10, 20 and 30%). There was no improvement in ME
content with dietary fortification with either lipid utilizing agents or NSP degrading
enzymes or both their combination indicating the ineffectiveness of biotechnological
tools in improving ME.
The progressive decrease in ME content of SPR based diets with the
incremental level of SPR was due to the decrease in the metabolizability of dry matter

and other organic nutrients particularly crude protein, ether extract and NFE on one
hand and due to progressive increasing levels of CF and total ash on the other hand.
Similar relationship with ME was also observed by Scott et al. (1989), Basavaraja
Reddy (1984) and Narayanaswamy (1984) with different feed ingredients in broiler
chicks.
c) Regression equations for prediction of energy values of diets
The simple regression equations for the prediction of energy values of
experimental diets used in the metabolism trial were derived wherein the ME was
regressed on the metabolizability coefficients of DM and OM and are given below:
Classical ME (kcal/kg) = -(48.77 x DMM %) -163.1 R2 = 0.94 r = 0.97** Classical ME (kcal/kg) = (47.69 x OMM %) -248.6 R2 = 0.95 r = 0.97**
Where **Significant (P<0.01) DMM = Dry matter metabolizability coefficient OMM = Organic matter metabolizability coefficient
The correlation between the metabolizability coefficient of DM and OM to
that of ME values was highly significant (P<0.01). The predicted values are in close
association with the assayed values. However, the relationship between the
metabolizability of individual nutrients to that of ME values was not significant
(P>0.05). The results indicated that the energy content (ME) of a broiler diet can be
predicted based on DM or OM metabolizability with greater accuracy.
4.2.3 Ileal nitrogen absorbability
The ileal digestibility values provide a sensitive index of protein quality that is
not confounded by caecal bacteria. The average ileal nitrogen absorbability (Table
4.7) values of experimental diets were statistically different (P<0.01) among different
treatments and the values varied from as low as 69.14 (T16) to as high as 91.45 per
cent (T4).
With regard to SPR as the main factor, the ileal nitrogen absorbability values
were highly significant (P<0.01) the values being 83.67, 76.17, 79.94 and 70.55 per
cent for 0, 10, 20 and 30% SPR included dietary groups, respectively. However, with
regard to biotechnological tool as the main factor, the nitrogen absorbability values

were statistically similar (P>0.05) and were 75.44, 77.54, 76.44 and 80.94 per cent for
diets with no supplement or with lipid utilizing agent or NSP degrading enzymes or
both, respectively.
Nitrogen absorbability in general, was significantly decreased as the level of
incorporation of SPR increased from 0 to 30% with an atypical value at 20%
inclusion. However, non-significantly (P>0.05) better ileal nitrogen absorbability
values were observed with supplementation of biotechnological agents, where in the
diets supplemented with both lipid utilizing agents and NSP degrading enzymes
showing the highest value.
The results were contrary to the findings of Li et al. (1993) who reported that
the apparent ileal amino acid digestibility decreased as the dietary protein increased.
Since the experimental diets were of non-equinitrogenous, the better nitrogen
absorbability found in diets devoid of SPR was attributed to the effect of type of
dietary protein that influences the amino acid composition of ileal contents as
observed by Varnish and Carpenter (1975). In basal diets, maize and soybean meal
were the major feed ingredients and their combination was regarded as ideal protein
source for poultry while the inclusion of SPR, an ingredient containing comparatively
low crude protein and different amino acid profile, to such diets part by part resulted
in deviation from the ideal protein concept. Hence, significantly lower ileal nitrogen
absorbability obtained in SPR based diets with the incremental level of SPR. The
results obtained were also similar to the report of Green (1987) who observed a
numerically lower nitrogen digestibility when soybean meal was substituted by other
protein sources such as groundnut cake and sunflower extractions in broiler diets.
4.2.4 Metabolizability of Energy and other Nutrients of SPR
The absolute metabolizability values of experimental diets presented so far has
enabled to arrive at the metabolizability coefficient of various nutrients present in the
test feed ingredient (SPR) by applying simultaneous equations. The metabolizability
coefficient of different nutritional components of SPR including its ileal nitrogen
digestibility is presented in Table 4.8.

The metabolizability of dry matter and organic matter of SPR under different
treatments ranged from 11.81 to 39.19 and from 15.43 to 40.11 per cent, respectively.
Considering SPR as the main factor, the average metabolizability of dry matter
content of SPR at 10, 20 and 30% inclusion were 27.34, 21.32 and 34.64 per cent,
respectively and that of organic matter was 30.03, 25.36 and 35.99 per cent,
respectively. The values were found to be statistically similar (P>0.05) for all the
parameters.
The metabolizability coefficient values for crude fiber were highly significant
(P<0.01) among different treatments with the values ranging from 15.42 to 53.45 per
cent. The average metabolizability of crude fiber content of SPR at 10, 20 and 30%
inclusion were 18.78, 34.75 and 47.44 per cent, respectively.
The metabolizability coefficient values of ether extract were highly significant
(P<0.01) with the values ranging from -2.37 to 44.27 per cent. The average
metabolizability values of ether extract content of SPR at 10, 20 and 30% inclusion
were 12.09, 15.90 and 33.97 per cent, respectively.
The absorbability of nitrogen content of SPR in the ileum was found to be
highly significant (P<0.01) among different treatments with the values ranging
between a negative value of (-) 8.68 and a high positive value of 82.95 per cent. The
average ileal absorbability of SPR nitrogen were 8.63, 65.03 and 39.93 per cent at 10,
20 and 30% inclusion, respectively.
The metabolizability of gross energy content of SPR was found to be
statistically similar (P>0.05) among different treatments with the values ranging from
35.53 to 56.68 per cent. The average metabolizability of gross energy content of SPR
at 10, 20 and 30% inclusion level were significantly different (P<0.01) and the values
were 53.03, 39.19 and 53.00 per cent, respectively. The absolute ME values of SPR
varied non-significantly (P>0.05) from 683.2 and 1626.6 kcal/kg among different
treatments. The average values were 1035.7, 842.3 and 1437.9 kcal/kg and the values
were found to be significantly different (P<0.01).

With regard to the main factor biotechnological tools, the dry matter, organic
matter and gross energy metabolizability of SPR were found to be statistically
(P>0.01) similar among different treatments while that of crude fiber and ether extract
showed highly significant differences (P<0.01). The ileal absorbability of SPR
nitrogen were also highly significantly(P<0.01) different among different groups. The
absolute ME content of diets irrespective of the SPR inclusion were found to be non-
significantly varied between 2955 and 3013 kcal/kg.
Irrespective of its level of inclusion and supplementation of biotechnological
products, on an average the metabolizabiliy of different component of SPR was as
follows: Dry matter – 27.77, organic matter - 30.46, crude fiber – 33.52, ether extract
– 12.59 and gross energy – 48.40 per cent. The absorbability of its nitrogen in the
ileum was about 37.86 per cent. The average ME content of SPR was arrived to be
1105.3 kcal/kg.
The metabolizability of SPR dry matter tended to be higher with the higher
level of its inclusion. Similarly, the organic matter metabolizability of SPR was also
lower at higher level of inclusion. This confirms that the dry matter metabolizability
had a positive correlation with that of organic matter.
The metabolizability of crude fiber content of SPR was found to be better at
higher level of inclusion. Such trend was in confirmation with the findings of Pal and
Singh (1998) who observed a maximum digestibility of crude fiber occurred on the
diets containing 14.40% CF (due to addition of soybean husk) while the lowest value
on the husk free diet (2.50% CF).
Interestingly, the metabolizability co-efficient of ether extract component of
SPR showed negative values. Such an observations are not uncommon to biological
experimentations of the kind wherein experimental error at several points is
unavoidable.
The ileal nitrogen absorbability values obtained for SPR were highly variable
and lower than the reported values for other feed ingredients. The possible reason
could be destruction of amino acids during the process of obtaining SPR, a residue

left after precipitation of cane juice which involves boiling. Such results conforms to
the findings of Zhang and Parsons (1994) who reported that the over cooking leads to
reduced amino acid availability and therefore, reduced nutritive value of processed
sunflower meal for broiler chickens.
The maximum metabolizability coefficient values for various nutrients of SPR
(Table 4.8) obtained when SPR was included at 30% level and hence the maximum
ME values were obtained at that level.
The ME value of SPR was significantly (P<0.01) higher at 30% level of
substitution as compared to that at 10% level. The ME value of SPR at 20% level of
substitution was tended to be midway as compared to that at either 10% or at 30%,
the difference being statistically non-significant. The observation was in conformity
with that of Bhatia (1969) who found that ME value of most of the ingredients at
lower level of inclusion was lower and indicated that incorporation at a higher level
of test ingredient would provide a more reliable appraisal of the ME value of the
feedstuff. Similar conclusion was made by Podder and Biswas (1991) while
evaluating metabolizability of rice bran at 20 and 40% levels of inclusion.
The ME value of SPR resembles that of some of the feed ingredients such as
dried leaf meals (Reddy, 1979) which is attributed to its chemical composition i.e.,
exceptionally high total ash content and moderate crude fiber content. The higher
amount of ash and fiber adversely affected the digestibility of SPR lowering its ME
value. Besides, the ash component does not contribute to any energy. The ME value of
SPR was also lower than the ME value reported for coarse rice bran which was 1,933
kcal/kg (Zablan et al., 1963).
The results revealed that the metabolizability coefficient of various
components of SPR was poor. The biological worth of SPR protein was also inferior
compared to commonly used feed ingredients in poultry.
No literature report is available to confirm the obtained ME value of SPR.
Earlier researchers, Suma (2005) and Budeppa (2004) used an approximate ME value
of 1,200 kcal/kg which is close to the arrived value of the present study.

4.2.5 Growth Performance of birds
The performance of birds in terms of body weight gain, feed consumption and
feed efficiency during different weeks of metabolism trial with their cumulative values
along with their survivability values are presented in Table 4.9.
The total average body weight gain among different treatments ranged from
109.6 (T16) to 219.9 (T2) during 2nd week, 200.2 (T13) to 421.5 (T3) during 3rd week
and from 327.3 (T14) to 637.2 (T3) on cumulative basis. The total feed consumption
values (g/bird) on an average ranged from 303.2 (T16) to 333.7 (T1) during 2nd week,
486.7 (T16) to 636.1 (T3) during 3rd week and from 784.7 (T15) to 929.2 (T2) on
cumulative basis. The FCR values ranged from 1.32 (T2) to 2.68 (T15) during 2nd week
and from 1.31 (T4) to 2.24 (T15) during 3rd week where as the cumulative values
ranged from as better as 1.29 (T4) to as poorer as 2.38 (T15). The differences in all the
above said performance parameters among various treatments were highly significant
(P<0.01) for both the weeks of metabolism trial as well as cumulatively. The average
livability of birds during metabolism trial period (2nd and 3rd week) was 100% in all
the groups excepting in T6 group which had a livability of 90% (P>0.05).
The cumulative (2nd and 3rd week) body weight gain and feed consumption
decreased linearly with the increasing level of substitution of test ingredient (SPR)
(P<0.01). The rate of decrease in body weight gain was much more when compared
to feed consumption which eventually resulted in poorer FCR with incremental level
of SPR.
Although the general concept is that voluntary feed intake of chicken varies to
keep the their energy intake almost constant (Mayer and Garrcet, 1969), yet the feed
intake of SPR based diets were lower compared to control which was mainly due to
substantially lower caloric and protein content in them. Thus the results followed the
statement that if the deficiency of nutrients is severe, feed intake is lowered and the
degree of reduction in feed intake is governed by the severity of the deficiency.
Similar results were observed by Pal and Singh (1998) who reported that the
voluntary feed intake was reduced with the addition of soybean husk (a by-product
resembling SPR with respect to certain nutrients) to growing chick diets. Further, the

development and functioning of the gastrointestinal tract of birds under SPR based
diets was also hindered due to higher crude fiber content of PSR based diets with the
incremental level of SPR. Hence, the suboptimal nutrient profile of SPR based diets
mainly energy and protein coupled with poor digestion and absorption efficiency of
birds on such diets resulted in linear decline in growth rate (P<0.01) of birds with the
incremental level of SPR inclusion.
Thus, it was inferred that the energy and crude protein content of test diets
(SPR based diets) was not sufficient to meet the nutrient requirement of the broiler
chicks, hence the lower feed intake and consequently reduced body weight gain with
the poorer FCR values. However, since this trial was conducted with an objective to
establish bioavailability of various nutrients of SPR, the results of metabolizability
values namely DM of 27.77, OM of 30.46, GE of 48.40 per cent and ME of 1105
kcal/kg can be considered as and when the dried SPR can be included in broiler diets.
4.3 METABOLIZABILITY OF ENERGY AND OTHER NUTRIENTS OF SPR IN
LAYERS
The efficiency with which the adult birds (laying hens) metabolize different
components of diets containing SPR at different levels and in turn that of the SPR was
also attempted. The results including the egg production performance of birds
obtained during the 14-day metabolism trial are discussed here under.
4.3.1 Chemical Composition of Experimental Diets
The proximate composition and gross energy content of the experimental diets
used in the metabolism trial of layers is given in Table 4.10. The dry matter content of
the diets ranged from 90.39 (T1) to 93.07 per cent (T15) to), while crude protein, ether
extract and crude fiber contents ranged between 15.98 (T13 to T16) to 17.85 (T1 to T4),
2.74 (T4) to 4.22 (T15) and from 6.39 (T4) to 9.56 (T14), respectively while the NFE
ranged from 47.14 (T14) to 59.95 (T4) per cent. The gross energy content was highest
in T4 (3893 kcal/kg) and lowest in T15 (3554 kcal/kg).
The nutrient composition of all the basal diets (T1 to T4) was more or less
similar to that of BIS (1992) specification. However, the crude protein, NFE and
gross energy of the experimental diets decreased gradually as the level of SPR
increased from 10 to 30 per cent in diets. On the other hand the crude fiber, ether

extract and total ash contents in test diets gradually increased with the higher level of
SPR substitution (0, 10, 20 and 30%), a pattern similar to those diets employed in
broilers’ metabolism trial. Such variation was obviously due to nutrient profile of
SPR per se. The gross energy content decreased linearly as the inclusion level of SPR
increased in the diet which was due to the reduced organic matter content of such
diets. The variation between different diets was less when compared to broiler
experimental diets. Within the SPR groups i.e., 0, 10, 20 and 30% SPR included diets,
the chemical composition and gross energy was by and large similar.
4.3.2 Metabolizability of various Nutrients and Energy of Experimental Diets
The percent metabolizability coefficients of proximate principles and gross
energy including their metabolizable energy of the experimental diets employed in
metabolism trial of layers are presented in Table 4.11.
a) Proximate constituents
The metabolizability coefficient of proximate constituents of experimental diets
(Table 4.11) namely dry matter, organic matter, crude protein, ether extract, crude
fiber and NFE contents ranged from 55.52 (T14) to 69.79 (T2), 60.22 (T14) to 74.53
(T2), 59.40 (T13) to 84.43 (T2), 41.78 (T12) to 64.91 (T2), 8.02 (T12) to 26.76 (T13) and
from 70.64 (T14) to 83.38 (T4) per cent, respectively. The variation among different
treatments for all the proximate principles except crude fiber metabolizability were
highly significant (P<0.01). In general, a decreased metabolizability coefficient of
different components of experimental diets was observed with the incremental level of
SPR.
With regard to the main factor SPR, the metabolizability coefficient values
ranged between 56.45 to 67.95 per cent for dry matter, 59.21 to 72.99 per cent for
organic matter, 62.02 to 73.68 per cent for ether extract, 16.20 to 24.81 per cent for
crude fiber and between 74.19 to 82.73 per cent for NFE. In all the cases, the
metabolizability coefficient values differed highly significantly (P<0.01) with the
highest value in control group (0% SPR) and the lowest value in 30% SPR based
diets. However, in case of crude fiber, it was the converse.

With regard to the main factor biotechnological tool, the metabolizablity
coefficients of proximate principles excepting ether extract were statistically similar
(P>0.05) among different groups. The metabolizability coefficient of ether extract was
significantly (P<0.01) low in diets supplemented with lipase and lecithin (49.37%)
when compared to those of remaining groups (55.02 to 57.51%). In case of crude
fiber, the metabolizability coefficient values were numerically lower in diets
supplemented with biotechnological agents particularly with both lipid utilizing agent
and NSP degrading enzymes (14.84%). However, for rest of the nutrients, by and
large, the metabolizability coefficient values were close to each other.
A linear decrease in metabolizability of crude protein, ether extract and NFE
and an increase in the crude fiber metabolizability were observed with increasing
levels of substitution of SPR. Such a trend in metabolizability coefficient values for
various proximate principles was very much similar to those obtained with
metabolism trial in broiler birds. Although the gastro-intestinal system of laying hen
is relatively well equipped for efficient digestion of nutrients particularly that of crude
fiber when compared to broilers, yet the reasons for such a variation between
metabolizability coefficient of basal diets and SPR based diets are the same as
explained in case of broilers’ metabolism trial. No significant improvement in
metabolizability values was evident with supplementation of biotechnological agents
particularly in NSP degrading enzyme supplemented diets even in layers.
The lower metabolizability of diets substituted with SPR at different levels was
due to the higher crude fiber and total ash content of such diets. The results confirm
the earlier report on the adverse effects of high dietary crude fiber on the digestibility
of rations i.e., the high crude fiber diets had faster transit time and lower digestibility
(Southgate, 1973). Similar observations were made on dried silk worm excreta in
broiler breeders (Jayanaik, 1989) and on rice bran in pullets (Chatrurvedi and Singh,
2000). However, the results are contrary to the reports that the higher feed intake is
generally associated with lower digestibility (McDonald et al., 2002).
Suma (2005) observed an inconsistently significant difference in dry matter,
organic matter, ether extract and crude fiber metabolizability and highly significant
differences in NFE metabolizability of the iso-nitrogenous and iso-caloric diets
incorporated with SPR at 0, 5, 10 and 15% level in laying hens.

b) Gross energy
The percent metabolizability coefficient of gross energy content of different
experimental diets (Table 4.11) ranged from as low as 62.40 (T14) to as high as 75.07
(T2). There was a highly significant difference (P<0.01) in metabolizability of gross
energy values among dietary treatments.
With regard to SPR as the main factor, the metabolizability of gross energy of
SPR based diets was 74.69, 77.67, 80.97 and 72.58 per cent in diets substituted with
0, 10, 20 and 30% SPR, respectively. The values was significantly (P<0.01) different
with the highest value in 20% SPR included diets and least in 30% SPR diets.
With regard to biotechnological tool as the main factor, the metabolizability of
gross energy was 68.89, 78.43, 78.33 and 81.72 per cent in diets fortified with no
supplement or with lipid utilizing agent or with NSP degrading enzymes or both,
respectively. Although no improvement were noticed in metabolizability of various
proximate constituents, the metabolizability coefficient of gross energy was
numerically higher in diets supplemented with lipid utilizing agent or NSP degrading
enzymes or both, yet the values were statistically similar (P<0.05).
The metabolizable energy content of all the experimental diets employed
during metabolism trial in layers were arrived at using the dry matter intake, dry
matter out go and their gross energy values. The values were statistically different
(P<0.01) among different treatments and ranged between 2243 (T14) and 2883
kcal/kg (T4). The average ME values for 0, 10, 20 and 30% SPR substituted diets were
2848, 2648, 2466 and 2303 kcal/kg, respectively and the values were significantly
(P<0.01) different from one another. The average values irrespective of SPR
inclusion, were 2562, 2542, 2552 and 2609 kcal/kg in diets with no supplement, with
lipid utilizing agent or with NSP degrading enzymes or both, respectively which were
statistically not different (P>0.05) from each other.
It was clearly evident that the ME content of SPR included diets was
significantly lower (P<0.01) and there was a linear decrease in ME content of the
diets with the incremental level of SPR (0, 10, 20 and 30%). The lower ME values for

SPR based diets was due to the higher amount of total ash in such diets as the SPR
contained 23.95 % total ash. There was no improvement in ME content with dietary
fortification with lipid utilizing agents or NSP degrading enzymes or both together.
Similar observations were also recorded during metabolism trial with broilers in the
present study.
As observed in metabolism trial involving broilers, a direct relationship
between the metabolizability of DM and other organic nutrients and ME values were
observed in case of layers also. Thus, the significantly (P<0.01) lower DM, OM, CP
and EE metabolizability coefficient values in SPR incorporated diets were responsible
for decreased ME contents.
c) Regression equations for prediction of energy values of diets
The simple regression equations for the prediction of energy values of
experimental diets used in the metabolism trial were derived wherein the ME were
regressed on the metabolizability coefficients of DM and OM and are given below:
Classical ME (kcal/kg) = (42.79 x DMM %) - 62.87 R2 = 0.93 r = 0.96** Classical ME (kcal/kg) = (43.49 x OMM %) - 337.2 R2 = 0.95 r = 0.95** Classical ME (kcal/kg) = (21.34 x CPM %) + 1086 R2 = 0.50 r = 0.71** Classical ME (kcal/kg) = (25.04 x EEM %) + 1240 R2 = 0.77 r = 0.88** Classical ME (kcal/kg) = (53.96 x NFEM %) -1651 R2 = 0.90 r = 0.95**
Where **Significant (P<0.01) DMM = Dry matter metabolizability coefficient OMM = Organic matter metabolizability coefficient CPM = Crude protein metabolizability coefficient EEM = Ether extract metabolizability coefficient NFEM = NFE metabolizability coefficient
The correlation between the metabolizability coefficient of DM and OM to
that of ME values was highly significant (P<0.01). From R2 value it is clear that the
dependent variable (ME) can sufficiently be predicted by the independent variable
(DMM or OMM). The predicted values are in close association with the assayed
values.
The prediction equation derived from this study was different from that
reported by Suma (2005) [ME (kcal/kg) = 442.9 + 35.85xDMM%] wherein the

prediction was done using the calculated ME values obtained by taking the ME value
of SPR as approximately 1200 kcal/kg, which was included up to 15% in the layer
diets..
4.3.3 Metabolizability of Energy and other Nutrients in SPR
By employing simultaneous equations, the metabolizability coefficient of
various nutrient components of SPR was derived from those of the assay diets. This
was done at different levels of SPR inclusion and with different combinations of
biotechnological agents. Such average values are represented in Table 4.12.
The metabolizability coefficient of dry matter, organic matter, crude protein,
ether extract, crude fiber and NFE of SPR under different treatments ranged from 4.36
to 34.03, 13.05 to 41.89, -36.92 to 80.34, -42.96 to 29.07 and -30.90 to 60.66 per cent,
respectively. The metabolizability coefficient of gross energy content of SPR ranged
between 41.72 and 62.39 per cent. The metabolizable energy content of SPR under
different treatments was obtained to be between 780 to 1133 kcal/kg. The analysis of
variance showed significant differences in crude protein (P<0.05) and NFE
metabolizability values (P<0.01) while for rest of the nutrients the variation remained
statistically similar (P>0.05).
Pertaining to SPR as the main factor, the average metabolizability of dry
matter content of SPR was 21.67, 18.46 and 29.63 per cent at 10, 20 and 30%
inclusion levels, respectively. The corresponding values were for organic matter:
30.21, 23.56 and 37.14 per cent, for crude protein: 60.35, 24.71 and 33.31 per cent,
for ether extract: 1.21, -17.18 and 8.58 per cent, for crude fiber: 53.09, 48.97 and
54.24 per cent and for gross energy: 42.92, 40.30 and 38.93 per cent, respectively.
The corresponding absolute ME values were 845, 937 and 1031 kcal/kg. The
metabolizability coefficient values for all the nutrients of SPR was found to be
statistically similar (P>0.05) except for NFE which showed significantly different
(P<0.05) values at different levels of SPR inclusion.
Regarding the biotechnological tools as the main factor, the dry matter,
organic matter, ether extract, crude fiber and gross energy metabolizability of SPR
were found to be statistically similar (P>0.05) among different treatments. However,

the metabolizability coefficient of crude protein and NFE content was significantly
(P<0.01) low in SPR supplemented with lipid utilizing agents. The ME content of SPR
was found to be statistically (P>0.05) unaffected by biotechnological agents, yet
numerically better values were obtained when supplemented with NSP degrading
enzymes either alone (943) or in combination with lipid utilizing agents (1028) when
compared to no supplement (918 kcal/kg).
The mean dry matter, organic matter, crude protein, ether extract, crude fiber
and NFE metabolizability of SPR irrespective of its inclusion level were 23.25, 30.30,
39.46, -2.46, 23.28 and 52.01 per cent, respectively. The average gross energy
metabolizability of SPR was found to be 40.72 per cent and thus overall ME content
of 937 kcal/kg was obtained.
Although the ME value of SPR appeared to increase slightly with an increase
level of its inclusion in the diet, the differences did not reach significant level. The
ME value of SPR obtained for layers (973) was lower than that of 1105 kcal/kg
determined for young birds (3wk age) in the metabolism trial conducted with broilers.
4.3.4 Production Performance of Birds
The production performance of laying hens such as egg production, feed
consumption, feed conversion ratio (FCR), egg weight and body weight changes
recorded during the metabolism trial of 14 days is presented in Table 4.13.
All the parameters excepting FCR showed highly significant difference among
the different treatments. The mean daily feed consumption was highest in T7 (117.7 g)
and the lowest in T13 (106.9 g). The highest egg production was noticed in T2 (93.65
per cent) and the lowest in T13 (68.25 per cent). The FCR values ranged non-
significantly (P>0.05) between 2.113 (T2) and 2.958 g feed/g egg mass (T15). The
birds in groups T1 gained 113 g during 14 day interval while the loss of 19.33 g body
weight was noticed in T1 group. The average egg weights ranged from 51.44 (T15) to
57.93 g (T6). All the birds under different treatments survived during the course of
metabolic period.
As regards the main factors, all the production parameters namely per cent egg
production, feed consumption, FCR, egg weight and body weight changes showed

highly significant (P<0.01) differences for the main factor SPR. The highest egg
production was noticed in birds fed diet substituted with 30% SPR (92.06 per cent)
and the lowest in control group (71.83 per cent) while the feed consumption was
highest in 10% SPR included group (117.2 g) and lowest in 30 % SPR groups (108.9
g). The decrease in egg production was not statistically significant up to 20% SPR
inclusion in the diet when compared with that of the control. The average egg weight
was highest in control groups (57.89g) with better FCR value (2.205) as against the
lowest in 30% SPR group (53.67g) with the poorer FCR value (2.848 g feed/g egg
mass). The groups fed diet substituted with 30% SPR showed the lowest body weight
change (+17.39g) when compared to other groups (+57.25 to +68.61g).
With regard to the main factor biotechnological tool, all the production
parameters showed non-significant (P>0.05) differences among different groups.
However, numerically better egg production, feed consumption, FCR and egg weight
were noticed group fed in diets supplemented with lipid utilizing agents (lipase and
lecithin) while those for diets supplemented with both lipid utilizing agents and NSP
degrading enzymes showed lowest values.
Absence of any significant improvement in egg production, feed intake and
feed efficiency among the diets supplemented with biotechnological products was
either due to very high fiber content of SPR based diets which interfere with
utilization of other nutrients or due to nature of fiber in the diet for which the
combination of individual enzymes used appears to be inappropriate.
With the findings of metabolism of layers trial, the metabolizability values
namely DM of 23.25, OM of 30.30, GE of 40.72 per cent and ME of 937 kcal/kg can
be attributed to SPR since there was no statistical difference for these parameters
under different treatments.
As such the metabolism trials were aimed to determine the ME value of the
SPR in broilers and layers. From the results, it was concluded that the ME content of
the SPR having the nutrient contents similar to that evaluated in the present study
could well be taken around 1000 kcal/kg for broilers and 950 kcal/kg for laying hens
for all practical purposes.

The results also revealed that SPR is a low energy feedstuff with substantially
lower ME value less than that of conventional cereals such as maize and also slightly
lesser than many agro-industrial by-products such as rice bran and wheat bran.
4.4 PERFORMANCE OF BROILER BIRDS FED SPR BASED DIETS
4.4.1 Chemical Composition of Experimental Diets
The analyzed percent chemical composition of the experimental diets
compounded for different phases viz., starter, grower and finisher phases during the
performance trial in broilers is presented in Table 4.14.
The analyzed crude protein (CP) content of starter, grower and finisher diets
were 22.67, 21.86 and 21.25 %; 21.44, 20.95 and 20.93 %; 19.80, 19.54 and 19.47 %,
respectively in 0, 5 and 10% SPR incorporated diets in that order. The corresponding
ether extract (EE) contents were 3.16, 3.87 and 4.77 %; 4.85, 5.39 and 6.04 %; 4.62,
6.03 and 6.42 %. The total ash (TA) content ranged between 6.84 to 7.74 %.
Similarly, the ranges for crude fiber (CF) content were from 5.50 to 6.25 %, the NFE
content from 59.99 to 62.68 %, calcium content from 1.76 to 1.11 % and total
phosphorous content from 1.18 to 0.77 % for different diets prepared for different
phases.
In all the cases, the analyzed values were fairly in close agreement with the
calculated values, based on which the formulation of diets was attempted. However,
the analyzed CP values of 5 and 10% SPR based diets were slightly lower than the
calculated values and the calcium content were generally higher than the calculated
values in all the diets. As expected, the higher EE values in 5 and 10% SPR
incorporated diets compared to that of control was obviously due to addition of higher
levels of vegetable oil to make up poor energy status of SPR as well as due to the high
EE content of SPR per se (11.95%). The CF content of SPR based test diets were
similar or marginally lower than that of corresponding control diets prepared during
starter, grower and finisher phases. Such a trend was mainly because of inclusion of
SPR (CF- 13.73%) at the expense of sunflower extractions, an ingredient containing
relatively higher amount of CF (24%) than SPR.

The calculated metabolisable energy (ME) value was 2822 kcal/kg in the
starter diets. In grower diets, the values were 2909, 2910 and 2910 kcal/kg for 0, 5
and 10% SPR based diets, respectively. The corresponding values were 3000, 3004
and 3004 kcal/kg for finisher diets. The differences existed within the 3 treatments of
either starter, grower or finisher treatment diets were negligible and thus the diets
were regarded as iso-calorific.
4.4.2 Body Weight Gain and Livability
a. Body weight gain
The pattern of mean body weight gains of broilers under different dietary
groups during different weeks is presented treatment wise and main factor wise in
Table 4.15 and that of different phases (starter, grower and finisher) as well as
cumulatively in Table 4.16. The average cumulative body weight gains of birds under
different treatments and main factors are also graphically represented in Fig. 2.
The weekly average body weight gains (g/bird) among various treatments
ranged from 58.8 (T6) to 70.5 (T8) during 1st week; 175.3 (T12) to 226.3 (T1) during
2nd week; 336.2 (T3) to 373.9 (T8) during 3rd week; 375.5 (T11) to 457.5 (T1) during 4th
week; 417.3 (T11) to 544.5 (T5) during 5th week and from 285.3 (T1) to 482.7 (T8)
during 6th week. The differences in body weight gains among different treatments
were statistically significant (P<0.05) during 1st and 3rd week and highly significant
(P<0.01) during the 2nd, 4th, 5th and 6th weeks of the trial. In general, the groups fed
diets containing 10% SPR showed least body weight gains when compared to those
fed 5% SPR based diets which in turn were lower compared to those of control
groups.
The phase wise average body weight gains among various treatments ranged
from 236.6 (T12) to 296.1 (T1), 734.7 (T7) to 830.4 (T1) and from 743.0 (T11) to
1020.3 g/bird (T2) during starter, grower and finisher phases, respectively. The
variation among different treatments were statistically significant (P<0.05) during
starter phase and highly significant (P<0.01) during grower and finisher phases. The
cumulative average body weight gains among different treatments also varied highly
significantly (P<0.01) with the values ranging from as low as 1737.7 (T11) to as high
as 2081.1 g/bird (T2).

With regard to the effect of main factor SPR, the inclusion of SPR at 5 and
10% levels in broiler diets resulted in significantly (P<0.05) lower body weight gain
during 1st and 4th week and such a reduction was highly significant (P<0.01) during
2nd, 5th and 6th week (Table 4.15). The influence of SPR on body weight gain was also
highly significant (P<0.01) during finisher phase and cumulatively (Table 4.16).
However, no such statistical differences (P>0.05) were observed during 3rd week as
well as during starter and grower phases. The cumulative values were 1999.7, 1924.1
and 1803.8 g/bird for 0, 5 and 10% SPR included diets, respectively.
With regard to the influence of main factor biotechnological tool, the average
body weight gains were highly significant (P<0.01) during last three weeks of the trial
(4th to 6th week) (Table 4.15). Such highly significant differences (P<0.01) were also
manifested during grower and finisher phases as well as cumulatively (Table 4.16).
However, no such significant (P>0.05) differences were evident during initial three
weeks of trial including starter phase. The lowest cumulative value was noticed in
birds fed diets supplemented with NSP degrading enzymes (1833.9 g) and highest in
diets supplemented with both lipid utilizing agents and NSP degrading enzymes
(1974.3 g).
It is clearly evident from the results that the groups fed diets incorporated
with either 5 or 10 % SPR tended to gain less body weight when compared to the
birds fed control diet devoid of SPR. The results are in accordance with Budeppa
(2004) who observed inconsistent, but non-significant (P>0.05) decline in the
cumulative weight gains of broilers as the level of SPR increased in their diets from 0
to 4%. However, the test diets employed by him (Budeppa, 2004) were of non iso-
nitrogenous and non iso-caloric. The SPR level included in the present study was
wide enough to show the significant difference and no literature regarding inclusion
of SPR as feed ingredient beyond 4 % level in diets of broilers is available to
substantiate these findings.
The decreased body weight gain in broilers fed SPR based diets particularly at
10% inclusion level was mainly attributed to the reduced feed consumption (Sec
4.4.3). Further, due to the reduced feed consumption by the 2nd week of the feeding
trial itself, it can speculated that the development of gastro intestinal tract was not

complete during initial weeks of age and hence the lower digestion and absorption
efficiency might have resulted in a linear decline in growth rate with increasing
inclusion levels. However, the compensatory growth rate which was expected at the
later phase of growth was also not evident especially in groups fed 10% SPR diets.
This might have been due to initial lower body weight gains which were subsequently
surfaced during later stages. The inclusion of higher amount of vegetable oil, a
concentrated source of energy to adjust SPR based diets to be iso-caloric with that of
the control was also failed to yield the results particularly at 10% SPR inclusion
level.
It was also evident that the fortification of SPR based diets with
biotechnologically derived products such as lipase with lecithin, NSP degrading
enzymes and their combination failed to show any definitive trend in body weight
gain of broilers during different individual weeks. However, on cumulative basis, the
significantly (P<0.01) higher body weight was observed in groups fed diets
supplemted with either lipid utilizing agents alone or in combination with NSP
degrading enzymes, but not with NSP degrading enzymes alone. Although Swain et
al. (1994), Babu and Devegowda (1997) and Kumar et al. (2007) reported a
moderate improvement in weight gains in broilers fed diets fortified with NSP
degrading enzymes, but no such beneficial effects were noticeable in the present
study. Other reports (Kumar et al., 2007) also indicated that the supplementation of
commercial enzyme preparation containing NSP degrading enzymes to palm kernel
cake containing diets yielded inconsistent results. Further, there was no consistent
trend in weight gains among the control diets (0% SPR) during different weeks, yet
numerically better values were observed in groups supplemented with
biotechnological agents. The results conform the observations made by de Koning and
van der Wel (1996) and Swift et al. (1996) that significant improvement in weight
gains in broilers fed maize-soy based diets supplemented with NSP degrading
enzymes. However, Rama Rao et al. (2006) reported that the supplemental NSP
hydrolyzing enzymes to corn-soybean meal or corn-sunflower extractions based diets
did not yield any beneficial effect on growth and feed efficiency in commercial
broilers, a trend similar to current results. With regard to lipid utilizing agents, the
reduced growth rate caused by various supplemental lipase enzyme was noticed by
Al-Marzooqui and Lesson (2000) while Meng et al. (2004) reported no effect of

addition of lipase on chicken performance, the results contrary to the present finding
that the inclusion of both lipase and lecithin improved the growth rate at several
occasions of experiment as well as cumulatively.
The results indicated that the body weight gains in birds fed 10% SPR based
diets were significantly lower than those of 5% SPR based groups which however
were comparable to those of control (0% SPR) groups. Thus it can be inferred that
the inclusion of SPR up to 5% in broiler diets, the minimum level which was tried in
the present study, was able to support the optimal growth rate. The supplementation
of biotechnological agents particularly the lipid utilizing agents to such diets did
improve the body weight gain of the broiler birds.
b. Livability
Also presented in Table 4.16 is the percent livability of birds under different
treatments during the 42-day experimental period as per the treatment wise and main
factor wise. The percent livability of birds among different treatments was statistically
(P>0.05) similar. The livability values were 93.33 % in T8, 96.67 % in T5, T7 and T12
and 100% in the remaining groups. The higher livability / survivability (average of
98.61%) values recorded in the experiment besides due to the better management and
biosecurity measures, also could be due to the quality of the diets per se.
With regard to the effect of main factors, SPR inclusion and biotechnological
tools, it was evident that neither of the main factor’s effect was significant (P>0.05)
on livability of birds. However, groups fed diets containing SPR particularly at 5%
level showed numerically lower livability value (96.7%) compared to 99.20% in 10%
SPR group and 100% in control.
The results indicated that the inclusion of SPR caused the mortality non-
significantly. The findings were contrary to the observations of Budeppa (2004) who
reported that the inclusion of SPR up to 4% in broiler diets did not have any
significant (P>0.05) effect on livability of birds. Similarly, Suma (2005) also reported
that the inclusion of SPR up to 15% in layer diets did not affect the livability of layer
birds between 18 to 35 weeks of age. It appears that the mortality in the 5% SPR
groups might have been due to chance factor since such an effect was not evident in

the 10% SPR groups. The livability percentage among the groups fed diets with or
with out biotechnological derived product(s) was uniform implying their minimum
role in immune system of birds. No clear cut reason could be reflected even upon
post mortem examination of dead birds.
4.4.3 Feed Consumption and Feed Efficiency
a. Feed consumption
The treatment wise and main factor wise data on average feed consumption of
birds under various dietary groups during different weeks and different phases of the
experiment including cumulative values are presented in Tables 4.17 and Table 4.18,
respectively. The pattern of cumulative average feed consumption values under
different treatments and main factors are graphically represented in Fig. 3.
The weekly average feed consumption values (g/bird) among different
treatments ranged form 104.8 (T10) to 109.4 (T1, T2 and T4) for 1st week; 291.4 (T10)
to 343.1 (T1) for 2nd week; 508.0 (T12) to 561.4 (T8) for 3rd week; 764.2 (T12) to 821.5
(T8) for 4th week; 888.0 (T9) to 1021.1 (T2) for 5th week and from 724.5 (T12) to 858.3
(T2) for 6th week (Table 4.17). The differences among various treatments were highly
significant (P<0.01) during the first three weeks of the trial (1st, 2nd and 3rd week).
However, the differences in feed consumption during subsequent weeks (4th week
onwards) were non-significant (P>0.05).
The phase wise (Table 4.18) average feed consumption (g/bird) during starter,
grower and finisher phases ranged between 396.2 (T10) and 452.5 (T1), 1272.2 (T12)
and 1382.9 (T8) and between 1625.5 (T7) and 1879.5 (T2), respectively. The
cumulative average feed consumption was found to range from as low as 3317.6
g/bird (T12) to as high as 3678.0 g/bird (T2) during 42-day experimental period. The
variation in feed consumption among different treatments were highly significant
(P<0.01) during starter phase of the trial. However, the differences were non-
significant (P>0.05) during other two phases of the experiment i.e. grower and
finisher phases as well as cumulatively.

As regard to the main factor SPR, the incorporation of SPR at different levels
in broiler diets showed highly significant (P<0.01) differences in feed consumption
during 1st, 2nd and 3rd week and during starter and grower phases (P<0.01) and
significant (P<0.05) differences were evident during 5th week and cumulatively
whereas, the differences during 4th and 6th week of the experimental period were non-
significant (P>0.05). In general, the feed consumption was lower in birds fed diets
incorporated with SPR (either 5 or 10 %) compared control.
The main factor, biotechnological tool showed non-significant (P>0.05)
difference in feed consumption during all the weeks except 1st week and all the phases
as well as cumulatively. The cumulative values were 3501.0, 3530.8, 3409.2 and
3493.6 g/bird for diets without supplement or with lipid utilizing agents or NSP
degrading enzymes or both, respectively (Table 4.18).
Although the diets were calculated to be iso-caloric with the addition of
vegetable oil, it was observed that the feed consumption in groups fed SPR based
diets were significantly (P<0.05 or p<0.01) lower than that of control (Table 4.17).
The results are contrary to the findings of Budeppa (2004) and Suma (2005) who
reported non-significant (P>0.05) differences in feed consumption with the inclusion
of SPR up to 4 % in broiler diets and up to 10 % in layers diets, respectively. As
stated earlier, the suboptimal development of gastro-intestinal tract might be the
factor responsible for reduced feed intake. Since, the gastro-intestinal tract function
of the chickens is expected to be developed more potential to digest and absorb the
crude fiber and fat during later stages of growth, the consumption of SPR based diets
was rather in tune with the level of SPR inclusion in the diets, on cumulative basis.
In addition to the composition of the diet and its caloric value, another
important nutritional factor which induces marked changes in behavioral and
metabolic parameters is the structure of the food. In the present experiment, the test
ingredient (SPR) was ground through 2mm mesh (hammer mill) to break lumps that
were formed during sun drying, thus resulting in higher degree of fineness (dusty
nature). Such finer particles (powder) in the diet might have caused an agglomeration
of pasty material on the beak thereby reducing the feed intake. This postulate was

also supported by the observations made during the trial regarding the behavior of the
birds such as increased water consumption and wastage of feed in water trough.
Furthermore, the reduced consumption of SPR based diets was also due to
marked increase in bulkiness of such diets with addition of SPR. Although the SPR
was substituted against the relatively fiber-rich ingredient (sunflower cake), the
increase in bulkiness with the addition of SPR was due to the higher amount of fines
in sun-dried SPR. The difference in nature of crude fiber particle in SPR compared to
sunflower cake could also be responsible for such bulkiness. In the later ingredient
the CF particles were in compressed form as against the loose finely powdered
particles in SPR, which contributed for nutrient dilution in such diets.
Pertaining to the supplementation of biotechnologically derived feed additives,
no significant differences were observed. Such findings are in agreement with that of
Rama Rao et al. (2006) who reported that the supplemental NSP hydrolyzing
enzymes to corn-soybean meal or corn-sunflower extractions based diets do not alter
the feed consumption. Contrary to the present results, Al-Marzooqui and Lesson
(2000) noticed a clear pattern of reduced feed intake due to supplemental lipase.
The results signified that the inclusion of SPR in diets of broilers did affect
their appetite. Thus, it can be inferred that the feed consumption was moderately
affected by incorporation of SPR as feed ingredient at 5% level and substantially at
10% level.
b. Feed conversion ratio (FCR)
The efficiency of the birds to convert ingested feed into body weight was
arrived at and the data as per treatment and main factor wise for different weeks is
presented in Table 4.19 and that for different phases with cumulative values in Table
4.20. The cumulative FCR among different treatments and main factors is also
graphically represented in Fig. 4.
The weekly average FCR values expressed as kg feed consumed to kg live
body weight gain among different treatment groups during different weeks of
experimental trial ranged form 1.565 (T8) to 1.793 (T5) for 1st week; 1.517 (T1) to
1.742 (T12) for 2nd week; 1.425 (T12) to 1.577 (T3) for 3rd week; 1.787 (T1) to 2.062
(T11) for 4th week; 1.793 (T5) to 2.247 (T11) for 5th week and from 1.580 (T8) to 2.856
(T12) for 6th week (Table 4.19). The differences among different treatments were
statistically non-significant (P>0.05) during all the weeks. In general, the poorer FCR
values were recorded in birds fed with diets containing SPR at either 5 or 10%.
The phase wise average FCR values (kg feed/kg weight gain) among different
treatments during starter, grower and finisher phases ranged between 1.529 (T1) and
1.758 (T6), 1.644 (T1) and 1.794 (T7) and from 1.789 (T8) and 2.341 (T11),
respectively (Table 4.20). The cumulative average FCR was better in T4 (1.753) and
poorer in T11 (1.977) during 42 days experimental period. Unlike weekly average
FCRs, the values were significant (P<0.05) among different treatments during finisher
phase and highly significant (P<0.01) during starter phase. However, the grower
phase and cumulative FCR values remained statistically similar (P>0.05).
As regards the main factor SPR, its inclusion showed highly significant
(P<0.01) difference during starter and finisher phases and significant (P<0.05)
differences during 3rd week and cumulatively. The cumulative average FCR values
were 1.771, 1.837 and 1.908 for 0, 5 and 10 % SPR based diets, respectively i.e., the
poorest FCR in 10 % SPR (Table 4.20). In general, the diets incorporated with SPR
showed numerically inferior FCR when compared to that of control during all the
weeks, phases as well as cumulatively.
As regards the main factor biotechnological tool, none of the approaches
showed statistical significance (P>0.05) during different weeks and different phases
except for 5th week (P<0.05). The cumulative FCR values were 1.853 (no
supplement), 1.807 (lipid utilizing agents), 1.876 (NSP degrading enzymes) and 1.819
(both lipid utilizing agents and NSP degrading enzymes) and the values were
statistically similar (P>0.05) when compared to each other (Table 4.20).
The results revealed that the feed conversion ratio was tended to decline with
inclusion level of SPR. However, it was inconsistent with the level of SPR inclusion
either at 5 or 10%. Contrary to the findings, Budeppa (2004) observed that the dietary
inclusion of SPR up to 4% did not affect the FCR in broilers. His conclusion was also

supported by Suma (2005) who reported non-significant differences in FCR in layers
fed diets incorporated with SPR up to 15%.
During finisher phase as well as cumulatively, a non-significant improvement
in feed conversion efficiency in 5% SPR based diets was observed with either lipid
utilizing agents or NSP degrading enzymes or both. However, the lack of
improvement in feed conversion efficiency at higher level of SPR (10%) might be due
to inadequacy of the enzyme concentration in proportion to the amount of substrate or
insufficient specific substrate for enzyme hydrolysis, since the nature of fiber in SPR is
unknown.
Taking into account of all the above discussed results of growth performance
parameters viz., body weight gain, feed consumption and its efficiency, it was
concluded that the inclusion of SPR at 5 or 10% level affects the growth performance
of the broiler birds. Hence, the substitution of SPR beyond 5%, the minimum level
that was tested is not practically feasible. Further, it can be inferred that the
enzyme/s supplementation was beneficial in improving the utilization of SPR
incorporated at 5% level in broiler diets, but did not accrue beneficial response when
supplemented in the diets containing 10% SPR.
4.4.4 Metabolizability of various Nutrients and Balance of Minerals
i) Metabolizability of Various Nutrients: The percent metabolizability of various
proximate principles (except crude fiber) of experimental diets are presented as per
the treatment wise and main factor wise effects in Table 4.21, while the treatment
wise values are graphically represented in Fig. 5.
a. Dry matter metabolizability
The treatment-wise average dry matter metabolizability coefficient of different
diets varied from 68.33 (T11) to 74.44 per cent (T7). The variation in dry matter
metabolizability coefficient of consumed dry matter was highly significant (P<0.01).
Similarly, highly significant (P<0.01) dry matter metabolizability values were
observed as affected by the main factor SPR. The dry matter metabolizability values
of 10 % SPR included diets (69.34 per cent) was significantly (P<0.01) lower than
that of 0 and 5% SPR incorporated diets (71.58 and 73.15 per cent, respectively).

However, with regard to the main factor biotechnological approaches, the dry matter
metabolizability values ranged non-significantly (P>0.05) from 70.66 (lipid utilizing
agents) to 72.29 per cent (both lipid utilizing agent and NSP degrading enzymes).
The results indicated that the inclusion of SPR at 5% level has no adverse
effect on metabolizability of dry matter whereas its inclusion at 10% level,
significantly reduced the overall dietary dry matter metabolozability. Although the
effect of supplementation of biotechnologically derived products was non-significant
(P>0.05), yet the numerical improvement was noticed in dry matter metabolizability
of diets prepared with SPR inclusion.
b. Organic matter metabolizability
Among the different treatments, the organic matter metabolizability values
ranged from 83.94 (T8) to 85.30 per cent (T3). The differences among different
treatments were highly significant (P<0.01). With SPR as the main factor, the organic
matter metabolisability values were though significantly (P<0.05) lower in 5 %
(84.10) and 10% SPR incorporated diets (84.29 per cent) compared to the control
(84.68), yet were far from distinctive numerical differences. While for the main factor
biotechnological tools, the values were non-significant (P>0.05) and varied in a
narrow range from 84.18 per cent in unsupplemented diets to 84.53 per cent in NSP
degrading enzymes supplemented diets.
c. Crude protein metabolizability
The values for crude protein metabolizability among different treatments
ranged between 67.36 (T1) and 76.89 (T6). The analysis of variance of the same
revealed highly significant (P<0.01) differences among different treatment groups.
With regard to the influence of main factor SPR, the crude protein
metabolizability of diets containing SPR at 5 % was significantly (P<0.01) higher
than that of 0 or 10% SPR groups indicating that the protein digestibility is well
tolerated by SPR inclusion.
As regards the main factor biotechnological tool, the crude protein
metabolizability values were significantly (P<0.05) higher (71.10, 72.80 and 71.97 in

groups supplemented with either lipid utilizing agents or NSP degrading enzymes or
together, respectively) than that of control group (67.76%) which may be mainly due
to the action of enzymes..
The results indicated that the SPR inclusion beyond 5% level in the diets did
not affect the protein metabolisability. But however, high dietary fiber can provoke
increased sloughing of intestinal epithelial cells, causing an increase in secretion of
the mucosa into the intestine, which leads to losses of endogenous amino acids
(Parsons, 1985). Thus the endogenous losses and gut microflora together contributing
nitrogen to content of excreta, might have masked apparent protein metabolizability
and hence the protein metabolizability may not represent the actual nitrogen
utilization and thus it can only be better inferred using ileal nitrogen digestibility
values.
d. Ether extract metabolizability
The metabolizability of ether extract (crude fat) among different treatments
varied from 59.30 (T12) to 73.49 (T3) and the variation was highly significant
(P<0.01). With regard to SPR as the main factor, the fat metabolisability values
among different groups were statistically similar (P>0.05) but however, the values
were numerically lower in both 5 % SPR (63.64%) and 10% SPR based diets
(63.78%) when compared to control (67.12%). With regard to biotechnological tool as
the main factor, the fat metabolizability values were significantly (P<0.05) higher in
diets supplemented with lipid utilizing agents (68.21%) and NSP degrading enzymes
(68.96%) individually when compared to the diets unsupplemented (62.01%) or
supplemented with both agents (60.21%).
The reduced fat digestibility in 5 and 10% SPR based diets might be attributed
to the higher crude fat content of SPR per se and also to the inclusion of higher level
of vegetable oil in such diets to compensate low energy status of SPR, which gone
unutilized due to failure of physiological make up to digest higher amount of fat.
In general, a linear decrease in digestibility of nutrients was observed with
incremental level of SPR. The digestibility of dry matter, organic matter and crude
protein at 5 % or 10 % inclusion levels were significantly (P<0.05 or p<0.01) lower

than those of the control group. However, the dry matter, organic matter, crude
protein, ether extract, crude fiber and NFE digestibility values reported by Suma
(2005) for layers fed SPR up to 15% were not significantly different from those fed a
soy or fish based control diets free from SPR. The relatively higher fine particles of
the test ingredient, which increase the rate of feed passage through the gastro-
intestinal tract, was suspected to have decreased the digestibility of several nutrients.
The current results also failed to confirm the theory that the supplementation of
exogenous enzymes to the poultry diets improves nutrient digestibility (Choct et al.,
1995; Yi et al., 1996).
ii) Balance of minerals: The treatment wise and main factor wise pattern of
retention of calcium and phosphorous (% and g/d/bird) is presented in Table 4.22 and
also graphically represented in Fig. 6.
a. Calcium retention
With regards to the treatment wise calcium retention, T7 recorded the highest
calcium retention (75.29 %) while T4 recorded the lowest (50.05%) and the
differences were highly significant (P<0.01). similarly, the g calcium retained per bird
per day ranged from 0.50 (T4) to 0.88 (T7). The main factors, SPR and
biotechnological tools exerted highly significant (P<0.01) influences on the retention
of dietary calcium. The calcium retention values for 0, 5 and 10% SPR included diets
were 59.19, 68.02 and 67.50 % of calcium intake, respectively and the amount of
daily calcium retrained was 0.57, 0.83 and 0.74 g/bird/day, respectively. Among the
biotechnological approaches, the highest (P<0.05) calcium retention was recorded in
diets supplemented with NSP degrading enzymes (70.04 % or 0.75 g/day) as against
the lowest in diets fortified with both lipid utilizing agents and NSP degrading
enzymes (59.45 % or 0.66 g/day).
The results implied that a numerically higher Ca retention value observed at
higher level of SPR inclusion in the diets is a reflection of SPR as a valuable source of
calcium.
Such results also support previous findings that the incorporation of SPR has a
beneficial effect on calcium retention in growing sheep (Suresh, 2004) and in laying
hens (Suma, 2005). The reason for better calcium absorption and retention of SPR

based diets might be the acidic pH of the SPR at which, calcium salts particularly
phosphates and carbonates are quite soluble.
b. Phosphorous retention
With regard to phosphorous retention (Table 4.22), T10 recorded the highest
phosphorous retention value (50.81 %) while T8 recorded the lowest (29.80 %) and
the differences among the treatments were highly significant (P<0.01). Unlike
calcium, the main factor SPR showed non-significant (P>0.05) differences in
phosphorous retention with the values 41.23, 41.12 and 40.54 % or 0.32, 0.31 and
0.30g/bird/day for 0, 5 and 10% SPR based diets, respectively. However, the main
factor biotechnological tool showed highly significant (P<0.01) differences with the
values 40.98, 46.78, 45.00 and 31.09% for no supplement, lipid utilizing agents, NSP
degrading agents and their combination, respectively.
As that of calcium, there was no significant difference in P retention also
between control and SPR based diets, but marginally lower phosphorous retention
values were observed as the level of SPR increased in the diets. Similar observations
were reported by Suma (2005) who stated that the incorporation of SPR at higher
levels (15%) reduced the phosphorous retention in laying hens.
The better calcium and phosphorous retention was observed in diets
supplemented with either lipid utilizing agents or NSP degrading enzymes. However,
antagonistic effect was observed when they were supplemented together for which no
substantial explanation could be given.
Even though incorporation of SPR reduced the phosphorous retention at
higher levels, results of the test groups were yet comparable to the control groups
(o% SPR). These findings also support the earlier statement that the minerals present
in SPR particularly calcium and phosphorous were optimally available.
4.4.5 Carcass characteristics and organometry
The treatment wise and main factor wise average dressing percentage, meat to
bone ratio and abdominal fat content values (g/bird or % of body weight) of broilers

under different dietary groups at the end of 42-day experimental period are presented
in Table 4.23.
a. Dressing percentage
Among different treatments, the dressing percentage value was highest in T7
(79.61) and lowest in T5 (75.58). However, no significant differences were observed
among different treatments. Better dressing percentage values obtained in the study
may be due to less feathering status of the birds.
As regards the SPR and biotechnological tools as the main factors, the
dressing percentage values were statistically similar for both the main factors. The
average dressing percentages of the birds were 78.33, 78.44 and 77.87 % for 0, 5 and
10% SPR based diets, respectively while the values were 91.71, 91.56 and 91.00 %
for lipid utilizing agents, NSP degrading enzymes and their combinations respectively
as against value of the 76.80 % in the unsupplemented diets.
The results implied that the inclusion of SPR up to 10 % in broiler diets has no
influence on dressing percentage, which was in conformation with the findings of
Budeppa (2004) who reported no significant (P>0.05) differences in dressing
percentage among the broiler birds fed diets containing SPR up to 4%.
b. Meat to bone ratio
The meat to bone ratio among different treatments ranged from 2.98 (T2) to
3.98 (T11) and the values were statistically similar (P>0.05).
With regard to SPR as the main factor, the meat to bone ratio was statistically
similar (P>0.05) with the values 3.50, 3.60 and 3.54 for 0, 5 and 10 % SPR inclusion,
respectively. For the main factor biotechnological tool, the values were 3.50, 3.73 and
3.62 for lipid utilizing agents, NSP degrading enzymes and their combinations,
respectively as against the value 3.34 in unsupplemented group. Although the
differences were non-significant, numerically better meat to bone ratios were
observed in groups supplemented with biotechnologically derived feed supplements
compared to unsupplemented groups.

The results indicate that the inclusion of SPR up to 10 % in broiler diets has no
influence on meat to bone ratio, which is in conformation with the findings of
Budeppa (2004) who observed non-significant (P>0.05) differences in meat to bone
ratio values among the broiler birds fed diets containing SPR up to 4%.
c. Abdominal fat
The abdominal fat content of birds fed different diets were significantly
different (P<0.05) and that the values ranged from as low as 15.20 (T12) to 36.00
g/bird (T4). However, when the abdominal fat content values expressed in terms of
per cent post-fast body weight, the differences among different treatments became
statistically non-significant (P>0.05) with the values ranging from 1.54 (T12) to 2.41
% (T4). Compared with the control group, the 10% SPR group which showed lowest
relative abdominal fat weight (P<0.05).
With regard to SPR as the main factor, the abdominal fat content (g/bird) were
27.79, 22.60 and 19.13 g for birds fed diets formulated with 0, 5 and 10% SPR,
respectively and the values were statistically different (P<0.05). The corresponding
values when expressed as per cent pos-fast body weight were 1.81, 1.47 and 1.33%
and were also significantly different (P<0.05).
With regard to biotechnological tool as the main factor, the abdominal fat
content values ranged non-significantly (P>0.05) from 21.56 (lipid utilizing agents) to
24.15 g/bird (lipid utilizing agents + NSP degrading enzymes) and correspondingly
from 1.40 to 1.61 % on the basis of post-fast body weight.
The results indicates that the abdominal fat pad of broilers was affected by the
SPR inclusion in their diets. Higher the level of SPR in the diet, lesser was the
abdominal fat deposition in broilers. The lower amount of abdominal fat accumulation
in birds fed SPR based diets implied that the energy available in such diets was poorer
as reflected by lower body weight gain in such groups or that the SPR has the ability
to decrease abdominal fat accretion. The former statement is in conformation with the
recent findings that the lesser fat deposition in birds on low energy (Leeson et al.,
1996; Nagaraju, 2006) and / or protein/ amino acid diets (Jaishankar, 2006).

From the study, it was inferred that the inclusion of SPR up to 10 % in broiler
diets has no influence on carcass characteristic parameters namely dressing
percentage and meat to bone ratio besides substantially decreasing the abdominal fat
pad deposition. Similar findings were made by Budeppa (2004) with regard to
dressing percentage and meat to bone ratio. No literature is available to conform the
effect of inclusion of SPR on the abdominal fat deposition.
d. Organometry
The relative weight of giblet organs (liver, heart and gizzard) and lymphoid
organs (spleen and bursa) as well as proventriculus under different treatments and
main factors are presented in Table 4.24 and are represented graphically in Fig. 7.
The relative weights of liver among different treatments were found to be
statistically (P>0.05) similar with values ranging from 2.41 (T5) to 3.07 g/100 g post-
fast body weight (T4). Similarly, the relative liver weight values also differed non-
significantly (P>0.05) for the main factors, SPR and biotechnological tool.
The percent weights of heart under different treatments varied non-
significantly (P>0.05) with values ranging from 0.55 (T5) to 0.68% (T10) g/100 g post-
fast body weight. With regard to the SPR and biotechnological tool as the main
factors, the relative heart weight values were statistically (P>0.05) similar among
different groups. The values ranged from 0.61 to 0.63 % for SPR and from 0.59 (No
supplement) to 0.64% (NSP degrading enzymes) for biotechnological tools.
In case of gizzard, the relative weights under different treatments were
statistically (P>0.05) similar with values ranging from 2.22 (T1) to 2.79 % (T12). With
regard to SPR as the main factor, the relative gizzard weight values were 2.35 (0%
SPR), 2.41 (5% SPR) and 2.58 % (10% SPR) which were statistically (P<0.05)
different. Where as the biotechnological to as the main factor showed non-significant
(P>0.05) variation ranging from 2.37 (unsupplemented group) to 2.53 % (lipid
utilizing agents).

As far as the proventriculus was concerned, the relative organ weight ranged
non-significantly (P>0.05) from 0.45 (T8) to 0.57% (T3 and T10). Even when data was
arranged as per the main factors SPR and biotechnological tool, the differences were
non-significant (P>0.05). However, the relative proventriculus weight was higher in
10% SPR based groups when compared to that of control and 5% SPR groups.
In case of spleen, the relative weights under different treatments were
statistically (P>0.05) similar with values ranging from 0.16 (T7) to 0.28% (T4). With
regard to the main factor SPR, the values were 0.23, 0.20 and 0.22 % for 0, 5 and 10%
SPR, respectively and they were statistically similar (P>0.05). However, with regards
the main factor biotechnological tool, the relative weight of spleen was significantly
(P<0.05) higher in groups supplemented with both lipid utilizing agents and NSP
degrading enzymes when compared to the groups supplemented with or with out lipid
utilizing agents and NSP degrading enzymes separately.
With respect to Bursa, the relative weights among different treatments varied
significantly (P<0.01) ranged from 0.16 (T7) to 0.32 % (T8) without any noticeable
definite trend. Such a variation was nullified when data was arranged as per the main
factors, SPR and biotechnological tool (P>0.05).
The relative gizzard weight was numerically higher in 10% SPR based group
compared to 5% SPR group which in turn higher than that of control. The relative
higher bulkiness (crude fiber) of SPR based diets might be responsible for
numerically higher relative gizzard weight in such groups (Scheideler et al.,1998). Nir
et al. (1995) observed that weight of gizzard and its contents are positively related to
the size of the feed particle, which incidentally was more fines in SPR based diets.
With increasing inclusion level of SPR, the relative proventriculus weight was
also linearly increased (P<0.05) and was accompanied by a linear decrease in the
relative abdominal fat weight (P<0.05). These results are in conformation with the
findings that higher fiber content decreased the absorption and retention of fat in
poultry (Janssen and Carr’e, 1989; Longstaff and Mc Nab, 1991) and enhanced the
development of proventriculus and gizzard in pullets (Scheideler et al., 1998).

In the present study, weight of the organs viz., liver, heart and gizzard was not
influenced by either various treatments or the main factors excepting the main factor
SPR on gizzard weight. The results confirmed the earlier findings of Budeppa (2004)
who reported that the weight of liver, heart and gizzard remains statistically similar
(P>0.05) among the broiler birds fed with either 0, 1, 2, 3 and 4% SPR included diets.
The results also indicated that the weight of the lymphoid organs spleen and bursa
were not influenced by inclusion of SPR and no literature is available to confirm the
same. Thus it was implied that the development of gizzard and proventriculus were
slightly affected by SPR inclusion at 5 and 10%. However, several vital organs
remained unaffected by SPR inclusion up to 10%.
e. Digestive tract measurements
The relative length of different segments of small intestine to 100g post-fast
body weight of birds under different dietary groups is presented in Table 4.25 as per
the treatment and main factors.
In case of duodenum, the relative length under different treatments were
statistically (P>0.05) similar with values ranging from 1.20 (T10) to 1.89 (T9) cm/100g
body weight. Similarly, the relative length of duodenum also differed non-
significantly (P>0.05) for both the main factors, SPR and biotechnological tool.
Pertaining to the jejunum, the relative length of jejunum under different
treatments varied significantly (P<0.05) and the values ranged from 3.86 (T7) to 4.72
cm/100g (T11). With regard to the SPR as the main factor, the relative jejunal length
was significantly (P>0.05) different between 5% SPR (4.09) and 10% SPR included
groups (4.50 cm/100g). For the main factor biotechnological tools, the measurements
were non-significant (P>0.05).
As regards the ileum, its relative length under different treatments was
statistically (P<0.05) different with the values ranging from 4.10 (T2) to 4.82 cm/100g
(T12). As regard to the main factors, the SPR inclusion showed significant (P<0.05)
differences in relative length of ileum among different groups whereas non-significant

differences were observed for the main factor biotechnological tool. Like jejunum the
longest ileal segment was found in birds fed 10% SPR based diets (4.57 cm/100g)
when compared to the shortest in 5% SPR based diets (4.26 cm/100g).
The total relative length of small intestine of birds under different treatments
was found to be statistically significant (P<0.05) with the values ranging from 9.64
(T8) to 11.13 cm/100g (T12). When data was arranged as per main factors, the SPR
inclusion showed highly significant (P<0.01) differences in relative lengths of small
intestine (9.86 in 5% SPR to 10.78 cm/100g in 10% SPR) but not for the main factor
biotechnological tool.
The length of different segments of small intestine viz., jejunum and ileum
excluding duodenum of birds was found to be influenced by the SPR inclusion at 10%
level but however such an effect was not evident at 5% SPR level when compared to
control for which no explanation can be given.
4.4.6 Bone mineralization
Although live performance is an important measure of dietary changes and
since SPR is also a contributing source of minerals, the bone parameters which are
generally more sensitive and reliable than performance might have been influenced by
SPR diets. The influence of various treatments and main factors on bone
mineralization of birds viz., toe ash, tibia ash and its calcium and phosphorous content
is presented in Table 4.26.
a. Toe ash
The treatment wise total ash content of toes obtained from the slaughtered
birds under different treatments was statistically different (P<0.05) with the values
varying from 32.25 (T2) to 41.42 (T7). As regards the main factors, the toe ash values
were found to be highly significant (P<0.01) for both the SPR inclusion and
biotechnological tools. The toe ash contents were 35.55, 38.24 and 37.66 % in birds
fed diets incorporated with 0, 5 and 10 % SPR, respectively. The values were 36.60,
39.65 and 39.34 % in birds fed diets supplemented with lipid utilizing agents, NSP

degrading enzymes and their combination, respectively as against the value of 33.01%
in diets with no supplement.
b. Tibia ash
The ash content of tibia from the slaughtered birds under different treatments
were statistically similar (P>0.05) with the values ranging between 43.50 (T5) to
50.50 % (T8). With regard to the main factors, both SPR inclusion and
biotechnological tool showed non-significant differences (P>0.05). The values ranged
between 45.04 (10% SPR) to 47.16 % (5% SPR) for the main factor SPR. The
numerically better tibia ash contents were noticed in diets supplemented with
biotechnological products when compared to un-supplemented diets.
c. Calcium and phosphorous status of tibia
The calcium content of tibia obtained from slaughtered birds was statistically
significant (P<0.05) among different treatments ranging from as low as 33.15 (T4) to
high as 45.58 % (T11). Whereas the mean tibial phosphorus contents were non-
significantly (P>0.05) ranging between 13.19 (T4) and 19.19 % (T8).
Considering SPR as the main factor, the mean tibial calcium and phosphorus
content was found to be statistically similar (P>0.05) with the values being 37.22,
39.01 and 39.93 per cent for 0, 5 and 10% SPR based diets, respectively. The
corresponding phosphorus values were 15.18, 16.62 and 16.24 per cent. The close
observation revealed that the inclusion of SPR has numerically enhanced the
mineralization of tibial bone.
With regard to biotechnological tool as the main factor, the mean calcium
content of tibia varied significantly (P<0.05). The values were 38.45, 42.86 and 37.61
per cent for lipid utilizing agents, NSP degrading enzymes and their combination,
respectively when compared to 35.95 per cent in unsupplemented diets. Whereas the
phosphorus content of tibial bones was statistically (P>0.05) similar with the values
ranging between 15.55 and 16.64 per cent.
The results implied that the bone mineralization was influenced by SPR
inclusion in the diets as well as by biotechnological tools that were tested.

Interestingly, the P retention (tibial P) in broilers fed SPR based diets was higher than
those of control diets. The most sensitive measure of P utilization, toe ash was also
significantly (P<0.01) greater in birds fed SPR based diets. It is difficult to provide a
plausible explanation for these findings despite the possibility of presence of
endogenous phytase activity in SPR that might have enhanced the available
phosphorus content in the gut. That apart, it might be due to presence of calcium and
phosphorous in an easily available form in the SPR per se.
The data demonstrated that the bone mineralization of birds fed diets
incorporated with SPR was quite optimum and hence, the minerals present in SPR
particularly calcium and phosphorous are of significance and bioavailable.
4.4.7 Blood biochemical constituents
Blood biochemical factors are important for assessing the nutritional and
metabolic status of birds. The status of calcium and inorganic P in serum of birds
under different treatments at the mid way (21st day) and at the end of the experiment
(42nd day) are presented in Table 4.27 and their profile is also graphically represented
in Fig. 8.
a. Serum Calcium
The treatment wise differences in the values of serum calcium at the mid way
and at the end of the 42-day experimental period were not significant (P>0.05). The
concentrations among different treatments ranged from 11.51 (T11) to 13.53 mg/dl
(T6) on 21st day and from 12.61 (T5) to 14.63 mg/dl (T4) on 42nd day. The serum
calcium levels on 21st and 42nd day were also found to be statistically similar (P>0.05)
when the data was arranged as per the main factors, SPR and biotechnological tools.
b. Serum inorganic phosphorous
Similar to serum calcium, the differences in serum inorganic P values among
different treatments at the mid way and at the end of the 42-day experimental period
were not significant (P>0.05). The values among different treatments ranged from
6.00 (T9) to 7.12 mg/dl (T10) on 21st day and from 5.56 (T2) to 7.32 mg/dl (T10) on
42nd day. Further, the serum inorganic P levels on 21st and 42nd day were also
statistically similar (P>0.05) for both the main factors, SPR and biotechnological tool.

Although there appeared to be better tibial calcium and phosphorus reservoir
in the bird fed SPR based diets when compared to control, the serum failed to show
any such status for calcium and inorganic phosphorous levels. The values remained
uniform among all the treatments and the values were well with in the normal
physiological values reported by Benzamin (1985). The results were also in
conformation with the findings of Budeppa (2004) who noticed similar serum calcium
and plasma inorganic P status among birds fed diets prepared with 0, 1, 2, 3 and 4 %
SPR.
The blood biochemical measurements clearly demonstrate that there were no
differences in serum calcium and phosphorous values during the broiler growth
period.
4.4.8 Economics
a. Net returns
Since the inclusion of SPR has influenced the body weight gain and feed
consumption, its economic proposition in terms of cost per kg live weight gain is
relevant.
Based on the prevailing prices of the constituent feed ingredients and feed
additives including that of lecithin, lipase and NSP degrading enzymes, the cost of the
diets prepared for starter, grower and finisher phases was arrived at. The cost of the
starter diets ranged from Rs. 9.91/kg (T9) to 11.01/kg (T4). The corresponding cost of
grower and finisher diets ranged from Rs. 10.34 to 11.35 and from Rs. 10.50 to
Rs.11.43 per kg, respectively. In all the cases, the cost of the SPR incorporated diets
was lower than corresponding control diets since SPR is available at cheaper prices.
The net returns calculated as the difference of the cost of broiler starter,
grower and finisher diets, as well as that of chicks, medicines, labour and brooding
charges on one hand and the sale price of live birds on the other hand from different
treatments were arrived at and are presented in Table 4.28 and the treatment wise
values are also graphically represented in Fig. 9. The net profits per bird among
different treatment groups were statistically non significant (P>0.05) and ranged from
Rs 6.13 in T10 to Rs.13.51 in T8.

With regard to SPR as the main factor, the relative net profit value per bird
under different treatments decreased non-significantly (P>0.05) in SPR based diets
(Rs. 7.77 in 10% SPR based diets) as compared to the control diets (Rs. 11.12).
With regard to biotechnological tool as the main factor, the relative net profit
value per bird differed non-significantly (P>0.05) in inconsistent manner and the
values ranged from Rs. 8.20 in NSP degrading enzymes supplemented diets to that of
Rs. 10.62 in diets supplemented with lipid utilizing agents.
In general, the SPR incorporated diets showed poorer net profit when
compared to the control groups and in many cases, the diets fortified with
biotechnological products failed to improve the net returns. Hence, it was inferred that
the preparation of diets using SPR as a feed ingredient replacing the conventional feed
ingredients was not economical.
b. Performance Scores
The performance index score (PIS) as the relationship of weight gain, percent
livability, FCR and number of days reared under each dietary group and the PIS’s
relationship with cost of each diet as economic index score (EIS) was worked out and
the treatment wise and main factors wise values are presented in Table 4.28.
The PIS values were statistically similar (P>0.05) among different treatments
and the values ranged from 198.9 (T11) to 278.8 (T4). With regard to SPR as the main
factor, the relative PISs decreased significantly (P<0.01) with incremental level of
dietary inclusion of SPR. The values were 272.1, 250.9 and 226.7 for 0, 5 and 10%
SPR based diets, respectively. However, with regard to biotechnological tool as the
main factor, the relative PIS values varied non significantly (P>0.05) from 230.8
(NSP degrading enzymes) to 257.3 (lipid utilizing agents and NSP degrading
enzymes).

As regards the EIS, the values were statistically (P>0.05) similar among
different treatments and ranged between 19.04 in T11 and 25.01 in T8. With regard to
main factors, the SPR showed significant differences (P<0.01) in the relative EIS
values while biotechnological tool remained statistically uniform.
The production performance index scores in terms of both PIS and EIS were
better in control diets when compared to diets prepared with SPR either at 5% or 10%
inclusion.
Considering the pattern of parameters of economic importance, it is possible to
include SPR at level up to 5%.
4.5 PERFORMANCE OF LAYER BIRDS FED SPR BASED DIETS
Consequent to the metabolism trial in layers, an effort was also made to
include sun-dried SPR in layer bird rations to asses its effect on their production
performance.
4.5.1 Chemical Composition of Experimental Diets
The analyzed percent proximate composition including that of calcium and
phosphorus of the experimental layer diets compounded on different occasions of the
84-day experimental period is presented in Table 4.29.
The dry matter content was more or less consistent in all the diets and ranged
from 88.99 (T9) to 90.25 per cent (T2). The total ash, crude protein, ether extract,
crude fiber and NFE contents ranged from 18.01 (T10) to 21.04 (T2), 17.31 (T9) to
17.92 (T2), 2.21 (T1 and T2) to 3.96 (T10), 7.60 (T11) to 8.10 (T1) and from 51.09 (T2) to
54.27 per cent (T8), respectively.
The results revealed that the proximate constituents of experimental diets were
almost similar to each other and such values were by and large in conformation with
BIS (1992) recommendations. However, the ether extract content was generally
higher in 10% SPR incorporated diets when compared to control which was

essentially due to EE content of SPR per se. As far as the crude fiber is concerned,
there was no much difference between control and SPR based test diets. Such values
were due to similar CF content of SPR (13.93 %) and DORB (14.00%), a major
ingredient which was substituted by SPR in test diets.
The calculated metabolizable energy (Table 3.4) values of 0, 5 and 10% SPR
based layer diets were 2433, 2410 and 2386 kcal/kg, respectively. The marginal
differences were presumed to be negligible and such diets were considered as iso-
caloric.
4.5.2 Egg production
The percent hen day egg production under different treatment groups recorded
during different periods as well as cumulatively are presented together with main
factor values in Table 4.30 and the values are also graphically presented in Fig. 10.
The egg production values among different treatments ranged from 78.57 (T7)
to 85.95 per cent (T2) during Period I, from 73.81 (T12) to 84.49 per cent (T4) during
Period II and from 74.14 (T8) to 83.94 per cent (T1) during Period III. The cumulative
average egg production values ranged from 76.03 (T8) to 84.50 (T4) per cent. The
differences among different treatments were statistically similar (P>0.05) during
Period I while the values differed significantly (P<0.05) during Period II and highly
significantly (P<0.01) during Period III as well as cumulatively.
As regards the SPR factor as the main factor, the percent egg production
during the 28-day periods were highly significant (P<0.01) during all the three
individual periods as well as cumulatively. The cumulative egg production was 83.61,
80.11 and 78.11 per cent for 0, 5 and 10% SPR based dietary groups, respectively.
As regards the biotechnological tool as the main factor, the egg production
values were statistically similar (P>0.05) during all the periods. However, the
cumulative egg production values were significantly different (P<0.05) and the
highest value was observed in diets supplemented with NSP degrading enzymes
(81.87%) and lowest in diets supplemented with both lipid utilizing agents and NSP

degrading enzymes (79.07%). The values for groups fed diets with no supplement and
with lipid utilizing agent were 80.97 and 80.54 per cent, respectively.
The egg production data was also presented on the basis of total number of
eggs produced over each period of 28 days (Table 4.30).The 28-day average egg
number values ranged from 22.0 (T9) to 24.1 (T2) during Period I; from 20.7 (T12) to
23.7 (T4) during Period II; from 20.8 (T8) to 23.5 (T1) during Period III and from 21.3
(T8) to 23.7 (T4) on cumulative basis. The differences among different treatments
were statistically similar (P>0.05) during Period I while the values differed
significantly (P<0.05) during Period II and highly significantly (P<0.01) during
Period III as well as cumulatively.
In general, the birds fed diets containing either 5 or 10% SPR showed
significantly (P<0.01) lower egg production when compared to that of control diets
devoid of SPR. Intensity of such trend was low during initial period while the effects
were much more pronounced during later stages of experimental period as well as
cumulatively.
Thus, it was clearly evident that higher the SPR inclusion level, lower was the
egg production percentage. The results were in accordance with that of the experiment
conducted by Suma (2005) where in, a non-significant reduction in percent egg
production with the incremental level of SPR from 0 to 15% was observed. The
reduction in feed consumption (section 4.4.3) with the incremental level of SPR in
their diets was responsible for decreased egg production, since the quantum of
nutrients per se available became limiting for egg production over and above the
maintenance.
As regards the biotechnological tool, results are in agreement with the findings
of Ponnuvel et al. (2001) who observed a numerical increase in egg production when
fiber degrading enzymes was supplemented in the fiber-rich diets of layers. Similar
observations were also made by Sharma and Katoch (1993), Jayanna and Devegowda
(1993) and Mohandas and Devegowda (1993). However, no literature is available to
confirm the numerically reduced egg production in birds supplemented with lipid
utilizing agents and its antagonistic effect with NSP degrading enzymes.

The results clearly indicated that the egg production declined with the
inclusion of SPR even at 5%, the minimum level that was tested. Thus, it was inferred
that the egg production may be optimally maintained only when SPR level is below 5
per cent in layer diets.
4.5.3 Feed Consumption and Feed Efficiency
a. Feed consumption
The daily average feed consumption values under various treatments during
different periods as well as cumulatively and along with main factor wise values are
presented in Table 4.31 and the values are also graphically presented in Fig. 11.
The average feed consumption values (per bird) among different treatments
ranged from 115.0 (T8) to 116.8 g (T2) during Period I, from 115.1 (T12) to 119.1 (T3)
during Period II and from 114.2 (T12) to 119.0 g (T2) during Period III. The highest
cumulative feed consumption of 117.9 g/hen/day was recorded in T2 as against the
lowest of 115.0 g in T12. Analysis of variance showed non-significant differences in
feed consumption during first period. But however, this pattern of non-significance
did not persist during the subsequent periods. During Periods II and III as well as
cumulatively, highly significant (P<0.01) differences were noticed among different
treatments.
When the data was analyzed for the effect of main factors, the feed
consumption was significantly (P<0.01) affected by SPR inclusion at 10% during
periods II and III as well as cumulatively. The cumulative average feed consumption
was 117.1, 116.9 and 115.6 g/day/bird for diets containing 0, 5 and 10% SPR based
diets, respectively. With regard to the other main factor biotechnological tool,
significant differences (P<0.05) were noticed only during period II but not either
during periods I and III or cumulatively.
The results revealed that the inclusion of SPR at 10% level affected the birds’
appetite. Such type of results are in agreement with the findings of Suma (2005) who
observed that inclusion of SPR beyond 10% level in layer diets considerably reduces
the feed consumption. These observations are also supported by our earlier findings
(section 4.3.3) that the broilers consumed significantly (P<0.01) lesser amount of SPR

based diets compared to control. However, the results were not in compliance with the
findings of Budeppa (2004) who observed non-significant differences in feed
consumption of broilers fed diets containing SPR at 1, 2, 3 and 4 per cent levels.
The changes in physical characteristics of SPR based diets might account for
the observed changes. Unlike that of broilers, the possibility of interference of crude
fiber is minimum because there were only marginal differences between crude fiber
content of SPR based diets and that of control. Deaton et al. (1979) showed that diets
with a crude fiber content as high as 8.07% did not affect the layer performance.
It was also observed that fortification of diets with either lipid utilizing agents
or NSP degrading enzymes numerically increased the feed consumption while
decreased trend was noticed when both biotechnological agents were supplemented
together. Contrary to these results, Ponnuvel et al. (2001) reported that addition of
cellulase enzyme to fiber-rich diet (12.10% crude fiber) significantly (P<0.01)
decreased the feed intake. Similar observation was made by Zang Sumin et al. (1996)
using 0.5% compound enzyme. They presumed that cellulase supplementation in high
fiber layer diet reduces the feed intake by improving the availability and utilization of
nutrients possibly by acting on the non-starch polysaccharides present in feed.
However, the maximum crude fiber level of diets in the present experiment was
around 7.00%. No reports are available to confirm the results related to lipid utilizing
agents or its combination with NSP degrading enzymes.
The results reflected that adult birds too failed to adopt for the diets containing
SPR particularly at 10% level. Thus, the effective acceptability of SPR by the birds
was questionable when included as an ingredient in their diets.
b. Feed efficiency
The efficiency of the birds to convert ingested food into eggs either as dozen
egg basis or kg egg mass basis was arrived at and the treatment wise and main factor
wise data is presented in Table 4.32 and the values are also graphically presented in
Fig. 12.
The average feed efficiency (FE) expressed as kg feed / dozen eggs among
different groups was highly significant (P<0.01) during all the periods as well as
cumulatively. The cumulative FE was better in T4 (1.664) while poorer in T8 (1.844
kg feed /kg egg mass). Similarly, the FE when expressed as kg feed / kg egg mass
also differed significantly (P<0.01) among different treatments with the values
between 2.375 (T4) and 2.602 (T8).
With regard to the main factors, the cumulative average FE values as affected
by SPR factor were highly significant (P<0.01) in that both 5 and 10 per cent SPR
included groups (1.757 and 1.778 kg feed/dozen eggs, respectively) were poorer than
that observed for control group (1.689 kg feed/dozen eggs). Such pattern of
significance was also persisted during all the periods. As regards the biotechnological
tool, highly significant (P<0.01) differences were observed in FE (kg feed/dozen
eggs) through all periods of the experimental period as well as cumulatively. The
cumulative pooled over values were 1.728, 1.741, 1.723 and 1.769 kg feed/dozen eggs
in no supplement, lipid utilizing agents, NSP degrading enzymes and both lipid
utilizing agents and NSP degrading enzymes supplemented groups. These trends were
also persisted when FE expressed as kg feed / kg egg mass except for the main factor
biotechnological tool during period I.
In general, the feed efficiency was poor in birds fed diets containing 5 and
10% SPR when compared to control. Hence, it was inferred that performance of birds
was inferior in diets prepared with 5 and 10 per cent SPR. The results also indicated
that feed efficiency can be improved by supplementing lipid utilizing agents either
alone or with NSP degrading agents but such an improvement was not noticed when
NSP degrading enzymes alone was supplemented.
The FE in terms of both egg number as well as egg mass revealed that the
energy limitation with the incremental levels of ash-rich (AIA-rich) SPR might explain
for poorer (P<0.01) FE of SPR based diets.
4.5.4 Body Weight Changes and Livability
During the course of the experiment, the dietary variables might exert their
influence on the body weight of hens for which the average body weights at initial,
28th day, 56th day and 84th day were recorded and the data pertaining to body weight
changes of birds both period wise and cumulatively are presented in Table 4.33.

The average body weights of birds in different dietary groups at the start of the
experiment ranged from 1493 (T12) to 1573 g (T8) which were statistically similar
(P>0.05). At the termination of the experiment also, the body weights ranged non-
significantly (P>0.05) from as low as 1465 (T12) to as high as 1584 g (T8). The change
(gain/loss) in body weight during different periods except period III, were also non-
significant (P>0.05). All the birds lost their body weight during period I. The
cumulative body weight change ranged from a loss of 35.3 g/bird in T7 to a gain of
119.4g/bird in T9, yet the values were statistically similar (P>0.05). When data was
categorized as per the main factors, the body weight changes showed non-significant
(P>0.05) differences for both the main factors, SPR and biotechnological tool.
Also presented in Table 4.33 is the percent livability of birds under different
treatments during the 84-day experimental period. The percent livability values of
birds among different treatments were statistically (P>0.05) similar. The livability
value was 91.67 % in T4 and T9 and the remaining groups showed 100% livability.
When data was arranged as per the main factors, the livability values remained
statistically similar (P>0.05) for both the main factors (SPR and biotechnological
tool).
From the results, it was evident that there was a non-significant (P>0.05)
inconsistent variation in body weight change and livability of the birds in different
groups. It was inferred that the body weight changes and livability percentage were
not influenced by any dietary treatment or main factors. The results are in
conformation with the findings of Suma (2005) who noticed non-significant (P>0.05)
loss in body weights of layers as the level of SPR increased in the diets.
4.5.5 Egg Characteristics
a) Egg weight
The influence of different treatments and main factors on the average egg
weight under different dietary groups is presented in Table 4.34 and the values are
also graphically presented in Fig. 13.

The treatment wise average egg weight values during 24-day periods
(averaged over eight occasions during each period) ranged from 57.5 (T3) to 59.4 g
(T11) for period I, 57.8 (T1) to 59.8 g (T7) for period II, 58.7 (T1) to 60.4 g (T7) for
period III and from 58.1 (T1) to 59.9 g (12) on cumulative basis. From the analysis of
variance, it was evident that the mean egg weights during the periods I and III were
statistically significant (P<0.05 and p<0.01, respectively) but not during period II.
However, the cumulative egg weight differed significantly (P<0.01) among different
treataments.
As far as the main factors were concerned, SPR inclusion showed significant
differences in egg weights during periods I and II and highly significant values on
cumulative basis. Close observation revealed that during all periods, 5 per cent SPR
tended to increase the egg weights when compared to 10 per cent SPR which in turn
was more than that of the control (0% SPR). Similarly, average egg weight values
were significantly (P<0.05) higher in birds fed diets supplemented with lipid utilizing
agents or NSP degrading enzymes but not their combination during period II as well
cumulatively. The cumulative average egg weight values were 59.2 and 59.4 g
observed in diets supplemented with lipid utilizing agents and NSP degrading
enzymes as against 58.8 and 58.7 g in diets with no supplement and with both lipid
utilizing agents and NSP degrading enzymes, respectively.
The results conformed the reports of Suma (2005) who indicated non-
significant (P>0.05) increase in egg weights with incremental level of SPR from 0 to
15% in layer diets. The results were also in confirmation with findings of (Ousterhout,
1980) who reported that the egg weight was highly significantly and inversely related
to the dietary calcium level.
In general, the egg weights under SPR based dietary groups are higher than
those of control and that they further indicate that inclusion of SPR up to 10 per cent
does influence the egg weights. As egg weights are influenced by energy, protein and
linoleic acid (Leeson and Summers, 2001), it appears that SPR inclusion might not
have enhanced the availability of the nutrients and instead of lower egg production in
SPR diets may be a reason.

b) Egg shape index
The values Egg Shape Index (ESI) as one of the indices of egg quality being
influenced by various treatments and main factors are presented in Table 4.35 and
graphically in Fig 14(a). The average ESI values ranged from 74.35 (T10) to 84.52
(T4) on 1st day, from 74.07 (T8) to 80.29 (T2) on 28th day, from 74.67 (T10) to 82.98
(T11) on 56th day and from 75.64 (T10) to 79.87 (T9) on 84th day. Statistical analysis
did not reveal any significant (P>0.05) differences during different periods of the
experiment nor for that matter cumulatively.
As regards the main factors, both SPR and biotechnological tool showed non-
significant (P>0.05) variation among different groups. The values with reference to
the SPR level ranged from as low as 77.22 (10% SPR group) to as high as 78.05 (0%
SPR group) on cumulative basis. As far as the biotechnological tools were concerned,
NSP degrading enzymes supplemented diets produced better shape index (78.32) than
with lipid utilizing agents (76.71).
The results suggested that the SPR at any given level in the diets did not affect
the shape index of the eggs and thus hatchability also. Such results was also observed
by Suma (2005).
c) Albumen Index
The average albumen index scores of eggs of experimental hens fed different
diets during different periods of the experiment are presented as per treatment wise
and main factor wise in Table 4.36 and graphically in Fig 14(b).
The average values ranged from 2.76 (T5) to 3.38 (T4) on 1st day, from 6.07
(T12) to 7.11 (T6) on 28th day, from 4.357 (T12) to 4.70 (T5) on 56th day and from 3.77
(T2) to 4.42 (T7) on 84th day of the experimental period. All the values were found to
be non non-significant (P>0.05). The mean albumen index values pooled over the
periods ranged from 4.36 (T9 and T3) to 4.71 (T7), which again were non-significantly
(P>0.05) different from each other.
As regards the main factors, the albumen index scores were found to be not
significantly (P>0.05) influenced by the SPR level or biotechnological tools. Both the

main factors, SPR and biotechnological tools showed inconsistent trends throughout
the experimental period.
d) Haugh unit score
An interrelationship between egg weight and albumen height in terms of
Haugh unit (HU) score, is an important egg quality measure for shelf life of eggs. The
average Haugh unit scores under different dietary groups as per treatment and main
factor wise are presented in Table 4.37 and graphically in Fig 14(c).
The average values ranged from 51.42 (T8) to 58.15 (T3) on 1st day, from
66.26 (T12) to 71.81 (T6) on 28th day, from 54.28 (T3) to 60.20 (T5) on 56th day and
from 45.72 (T8) to 56.14 (T7) on 84th day. The average values at any particular
interval were statistically non-significant (P>0.05). The pooled over (periods) average
values ranged non-significantly (P>0.05) from 57.01 (T8) to 60.20 (T7).
As regards the main factors, the Haugh unit score values were non-
significantly (P>0.05) influenced by both the main factors, SPR level and
biotechnological tool. Similar to albumen index, there was no definitive trend in either
SPR and biotechnological tool.
The non-significant (P>0.05) differences observed between different
treatments during different time intervals revealed that Haugh unit scores were not
affected by the inclusion of SPR. Further, none of the biotechnological additives
improved the HUS. The Haugh unit values observed under all groups of present study
are in the range of 52-59, which are quite lower than the normal values in the range of
75-85 (Jayanaik, 1989; Umashankar, 1998). Though there appeared to be certain
uniform low recording of the height of dense albumen by Ames Spherometer (Section
3.3.2.3d) and hence lower HUSs, yet the observed data did still allow the dietary
comparisons.
e) Yolk colour
Egg yolk colour is an important quality characteristic from the consumer point
of view. The period wise and cumulative average yolk colour scores of eggs of

experimental birds fed different diets were arranged as per treatment and main factor
wise basis and are presented in Table 4.38 and Fig 14(d).
The Roche yolk colour fan values ranged from 7.17 (T1 and T11) to 7.60 (T9)
on 1st day, from 6.61 (T1) to 7.45 (T10) on 28th day, from 6.09 (T2) to 7.18 (T5) on 56th
day and from 6.09 (T12) to 6.64 (T11) on 84th day of the experimental period. The
influence of different treatment diets in imparting colour to the yolks was found to be
non-significant (P>0.05) at 28th day and 56th day of experiment.
As regards main factors, the yolk colour scores were significantly (P<0.01)
affected by the SPR factor on the 56th day with a highest value being 6.78 (5% SPR)
as against lowest value of 6.20 (control) and significantly (P<0.05) on cumulative
basis (6.73-0% SPR to 6.93-5% SPR). Infact such trend might be due to the chance
factor as evident by the fact that during preceding and successive 28-day intervals as
well as between control and 10% SPR based diets, no significant (P>0.05) differences
were surfaced. For the biotechnological tool factor, no significant (P>0.05)
differences were observed during all the periods as well as cumulatively.
The results were in conformation with the findings of Suma (2005) who
reported non-significant (P>0.05) differences in yolk colour between control and SPR
included diets. Also observed was the fact that the SPR based diets did not enhance
the yolk colour intensity which otherwise would have been possible in view of the
fact that the SPR per se appears to be rich in colouring pigments as that with forages
(Reddy, 1979).
f) Yolk index
The treatment and main factor wise average yolk index values of eggs of
experimental birds fed different diets during different periods are presented in Table
4.39 and graphically in Fig 14(e).
The treatment wise average yolk index values ranged from 29.92 (T5) to 31.57
(T12) on 1st day, 34.80 (T10) to 36.55 (T5) on 28th day, 32.33 (T1) to 34.01 (T6) on 56th
day, 2.42 (T7) to 34.99 (T3) on 84th day and from 32.82 (T7) to 33.80 (T2) on
cumulative basis. The values at different intervals differed non-significantly (P>0.05).

The effect observed when the data was analyzed on the basis of main factors
was found to be non significant (P>0.05) as regards the SPR factor was concerned,
while the biotechnological tool revealed significant (P<0.05) differences only on 1st
day of experiment which was obviously not due to lipid utilizing agents, NSP
degrading agents or their combinations. Stability of yolk as reflected by higher yolk
index scores is important from the point of shelf life of eggs as well as the
hatchability. Since SPR contains large amount of lipid portion (11.95 %), it might
cause mottling of yolks and affect yolk index, which however did not occur in the
study even at 10 per cent inclusion of SPR.
The results obtained were in agreement with the findings of Suma (2005) who
observed no significant (P>0.05) difference in yolk indices between diets containing
SPR at 0, 5, 10 and 15% level. Thus, it was inferred that egg quality is sustainable
with SPR even up to 10 per cent in layer diets.
g) Egg shell thickness
Shell thickness is also an important egg quality factor, which is dependent on
dietary regimen amongst many factors. The treatment and main factor wise average
shell thickness values of eggs of experimental birds fed different diets during different
periods are presented in Table 4.40 and graphically represented in Fig 14(f).
The treatment wise egg shell thickness values among different groups ranged
from 0.344 (T10) to 0.371 mm (T2) on 1st day, 0.310 (T1) to 0.366mm (T10) on 28th
day, 0.302 (T6) to 0.347 mm (T4) on 56th day and from 0.325 (T8) to 0.347 mm (T10)
at the end of experiment and on cumulative basis, the values ranged from 0.329 (T1)
to 0.350 mm (T11). Analysis of variance revealed that the differences among different
treatments were statistically (P>0.05) similar except for the values on 28th day of the
experiment. No definitive trend was observed among dietary treatments.
Amongst the main factor effects, cumulative average egg shell thickness
values were 0.337, 0.338 and 0.342 mm at 0, 5 and 10 per cent SPR inclusion levels.
The average values were statistically similar (P>0.01) during all the periods except on
28th day. A close observation indicated that the mean cumulative egg shell thickness
values were slightly higher in 10% SPR group when compared to control.

For the main factor biotechnological tool, the egg shell thickness values
differed significantly (P<0.01) on 28th and 56th days of experiment. The cumulative
values varied significantly (P<0.05) from 0.332 (no supplement) to 0.344 mm (lipid
utilizing agents + NSP degrading agents) However, no definitive trend could be traced
at all the time intervals.
Egg shell thickness is largely affected by calcium assimilation, under the
influence of vit. D3 as well as by minerals namely zinc and manganese (Leeson and
Summers, 2001). Inclusion of SPR appeared to have effectively contributed the said
nutrients to support optimal shell thickness since they were quantitatively replaced to
the extent that could be contributable from SPR even at 10 per cent level of inclusion.
Similar observations were also made Suma (2005).
4.5.6 Efficiency of utilization of energy and protein
Protein and energy levels in the diets are by far the most important nutrients
for birds whose efficiency to utilize them under varied dietary profile are rather
important.
a) Efficiency of Protein utilization (EPU)
The average values of efficiency of utilization of dietary protein are presented
as per treatments and main factors in Table 4.41 and graphically in Fig 15. The
treatment wise results revealed that the per cent EPU was highly significant (P<0.01)
during all the periods. The average values ranged from 27.61 (T10) to 29.69 (T5)
during Period I; 26.01 (T12) to 28.44 (T4) during Period II and from 26.11 (T8) to
29.62 per cent (T11) during Period III. So also, the cumulative values ranged
significantly (P<0.01) from 26.52 (T8) to 29.13 per cent (T11).
As regards the main factor SPR, the effects were significant (P<0.05) during
Periods I and II but not during Period III (P>0.05). However, on cumulative basis, the
values were found to be highly significant and were 28.50, 27.95 and 27.81 per cent
for 0, 5 and 10 % SPR based diets. In general, the EPU values were better in control
group (0 % SPR) when compared to SPR based groups. The main factor
biotechnological tool also showed highly significant (P<0.01) differences during
Period II and cumulatively and significant (P<0.05) during Period III. The better

cumulative value was observed in diets supplemented with NSP degrading enzymes
(28.52%) and was poorer in diets with both lipid utilizing agents and NSP degrading
enzymes (27.49%).
The results of the present study were different from those obtained by Suma
(2005) who noticed non-significant (P>0.05) differences in EPU of hens fed diets
containing 0, 5, 10 and 15% SPR.
b) Efficiency of ME utilization (EEU)
The data pertaining to the efficiency of energy utilization as analyzed on the
basis of total treatments as well as main factors is presented in Table 4.41 and
graphically in Fig 15. As that of efficiency of protein utilization, the efficiency of
energy utilization was also found to be highly significant (P<0.01) during all the
periods as well as cumulatively. The average values ranged from 26.57 (T10) to 28.60
(T5), 25.03 (T12) to 27.38 (T4) and from 25.15 (T8) to 28.50 per cent (T11) for period I,
II and III, respectively. On cumulative basis, the EPU was as low as 25.55 (T8) to as
high as 28.04 (T11).
The effects of main factors on EEU also followed similar trend as that of EPU.
As regards the main factor SPR, the EEU values were significant (P<0.05) during
Periods I and II but not during Period III (P>0.05). However, on cumulative basis, the
values were found to be highly significant and were 27.44, 26.92 and 26.76 per cent
for 0, 5 and 10 % SPR based diets. In general, the EEU values were better in control
group (0 % SPR) when compared to SPR based groups. The main factor
biotechnological tool also showed highly significant (P<0.01) differences during
Period II and cumulatively and while it was significant (P<0.05) during Period III. A
better cumulative value was observed in diets supplemented with NSP degrading
enzymes (27.47%) while it was poorer in diets with both lipid utilizing agents and
NSP degrading enzymes (26.47%).
Similar to EPU, the results obtained were different from those obtained by
Suma (2005) who noticed non-significant (P>0.05) differences in EEU of hens fed
diets containing 0, 5, 10 and 15% SPR. the trend were similar to that for EEU.

Results indicated that efficiency of protein and energy utilization was not
uniform among different dietary treatment groups and even when the data was
analyzed on the basis of main factors. However, the inclusion of SPR either at 5 or 10
per cent level in the diets did affect the ability of birds to transfer dietary protein and
energy to the egg not withstanding the apparently low nutritive value of SPR.
4.5.8 Metabolizability of various nutrients
a) Metabolizability of dry matter and organic matter
The pattern of metabolizability of dry matter and organic matter of different
experimental diets arranged as per the treatment wise and main factor wise is
presented in Table 4.42 and graphically in Fig 16. The metabolizability coefficient of
dry matter ranged non-significantly (P>0.05) from 68.19 (T9) to 72.54 (T8) and that
of organic matter varied highly significantly (P<0.01) from 67.97 (T11) to 72.38 (T1)
among different treatments.
As regards the main factors, the metabolizability of dry matter (68.94 to
70.77%) was statistically similar (P>0.05) and that of organic matter was highly
significant (P<0.01) for the main factor SPR. The metabolizability of organic matter
was 71.83, 69.51 and 68.47 per cent for diets containing 0, 5 and 10% SPR,
respectively. However, the metabolizability coefficients for dry matter (69.60 to 71.43
%) and organic matter (69.73 to 70.15%) were statistically similar for the main factor
biotechnological tool.
The results indicated that the metabolizability of organic matter was
significantly (P<0.01) lower in both 5% and 10% SPR based diets when compared to
control diets. There was no significant improvement in metabolizability of dry matter
of different diets upon supplementation of biotechnological products while the
numerically better values were observed with diets supplemented with both lipid
utilizing agents and NSP degrading agents.
b) Calcium and Phosphorus retention
The pattern of retention of calcium and phosphorus is presented in Table 4.42
and graphically represented in Fig 17. The calcium retention showed non-significant
(P>0.05) differences among different dietary treatments. The values ranged from 4.04

g (T12) to 4.38 (T10) g/h/d and on per cent basis, the values ranged from 75.25 (T9) to
78.06 per cent (T8). The values were also found to be statistically similar (P>0.05)
when arranged as per the main factors, SPR and biotechnological tool. However,
marginally higher per cent of calcium retention (% of intake) but with a lower amount
of absolute calcium retention (g/h/d) were seen with the incremental levels of
inclusion of SPR particularly at 5 % (76.86 g).
The retention of phosphorus was not significant (P>0.05) between different
treatments. The values ranged from as low as 0.62 (T9 and T10) to as high as 0.72 (T3
and T4) g/h/d whereas the per cent values ranged from 58.34 (T9) to 63.25 (T12).
However, considering SPR as the main factor, the P retention (g/h/d) was significantly
lower in 10% SPR incorporated diets (0.64g) when compared to that of control (0.69
g), while no such statistical difference between control and 5% SPR incorporated
diets (0.66g) was evident. The values were statistically similar (P>0.05) for the main
factor biotechnological tool, yet numerically better P retention values were obtained
for diets fortified with lipid utilizing agents or NSP degrading enzymes or both.
The results indicated that the retention of calcium and phosphorous was
significantly (P<0.01) lower in 10% SPR based diets when compared to control diets
but however the difference between that of 5% SPR based diets and control diets was
not significant. There was no significant improvement in metabolizability of
different diets upon supplementation of biotechnological products, yet the numerically
better values were observed with diets supplemented with both lipid utilizing agents
and NSP degrading agents.
The numerically better calcium retention (% of intake) in SPR based diets was
essentially due to production of heavier egg which demanded for the higher amount of
calcium for shell formation. However, decreased amount of calcium retained per day
observed in such diets was because of the lower rate of egg production.
The results obtained are in conformation with the findings of Suma (2005)
who observed a marginal decrease in retention of P with the increasing levels of
inclusion of SPR. However, she noticed the beneficial effect on calcium retention (%
of intake) as marginal increases with the increasing levels of inclusion of SPR were
seen.
Thus, based on the metabolizability of various nutrients, it was opined that the
SPR can be incorporated up to 5 per cent in layer rations effectively as a source of
organic nutrients as well as some of the minerals substituting the expensive
conventional feed ingredients.
4.5.9 Blood Biochemical Profile
Influence of SPR as a mineral source on profile of serum calcium and plasma
inorganic phosphorus has been studied and the results of which are presented here
under.
a) Serum calcium
The average values of concentration of calcium in serum of layers as
influenced by various treatments and main factors at different intervals as well as
cumulatively are presented in Table 4.43. Also given in the same table are the values
relating to plasma inorganic phosphorus levels. Both are graphically represented in
Fig 18.
The average values of serum calcium were statistically (P>0.05) similar
among all dietary groups during all the periods of the experiment. The values ranged
from 17.30 (T5) to 18.13 (T3) mg/dl on 28th day; from 18.53 (T7) to 19.20 (T9) mg/dl
on 56th day and from 18.73 (T12) to 19.20 (T2, T3 and T11) mg/dl on 84th day. The
serum calcium level got marginally elevated with the age of the birds. The mean
values also varied non-significantly (P>0.05) from 18.36mg/dl (T7) to 18.83 (T3).
As regards the main factors, both SPR and biotechnological tool exerted non-
significant (P>0.05) influence on serum calcium levels.
Serum calcium levels of birds at different time intervals were within the
normal blood serum concentrations in layers (Benzamin, 1985) and these results are
in accordance with those of Roush et al. (1986) and Robertson and Edwards (1994).

Keshavarz and Nalajima (1993) also reported that the plasma calcium was not
influenced by dietary calcium level.
Thus, the results indicate that SPR has been effectively utilized as a source of
calcium and has maintained the serum calcium concentration well within the range.
The results of present study are similar to those obtained by Budeppa (2004) and
Suma (2005) who fed different levels of SPR in diets of broilers and layers,
respectively and reported normal range of serum calcium values. Similar results were
also obtained by Suresh (2004) in growing lambs. Hence, no adverse effects are seen
when SPR is being used up to 10 per cent in layer diets as far as the calcium
metabolism is concerned.
b) Serum inorganic phosphorus
From Table 4.43, it can be observed that serum inorganic phosphorus at 28th
day, 56th day and 84th days of the trial ranged respectively, from 6.20 (T6) to 7.17
(T10); from 7.70 (T2 and T3) to 8.47 (T11) and from 8.63 (T2 and T10) to 8.90 (T3)
mg/dl. The mean values ranged from 7.63 (T6) to 7.97 (T10 and T11) mg/dl. There was
no significant (P>0.05) difference in plasma inorganic phosphorus levels of the layers
receiving different treatments at different intervals except at 56th day.
With regard to the main factor effects, both SPR and biotechnological tool did
not affect the plasma inorganic phosphorus levels at any interval or cumulatively.
Results indicate that the birds fed different test diets could maintain normal
plasma inorganic phosphate concentration during different time intervals and the
results obtained in this study do conform with results obtained by Budeppa (2004) and
Suma (2005) who reported normal range of plasma inorganic phosphorus levels in
SPR fed broilers and layers, respectively. Thus the SPR has been used effectively as a
source of phosphorus, which is quite comparable with that of control groups.
The results of the present study are however not in agreement with the
findings of Mangle et al. (1979) who observed a positive correlation between the egg
production and serum calcium phosphorous levels. Prasad and Reddy (1990) also
reported a positive correlation between serum calcium and phosphorus levels and egg
production in birds fed diets containing hatchery by-product meal. The reason for

such a deviation was due to the possibility of limitation of some major nutrients in
SPR based diets.
4.5.10 Economics
a) Net returns
The net returns obtained as the difference between the cost of feed only as the
input factor and the sale price of eggs as the output factor during different periods as
well as cumulatively, have been worked out and are presented in Table 4.44 as per the
treatment wise and main factor wise.
The cost of control diet (T1) was Rs. 7.13/kg which got reduced to Rs. 6.88/kg
as the SPR level got increased to 15 per cent (T9), which was partly due to the
progressive decreasing cost of mineral salts at the expense of SPR as mineral source.
The cost of the diets supplemented with biotechnological products were relatively
higher when compared to the corresponding diets with no supplement, depending on
the cost of biotechnological product/s.
The mean net returns ranged significantly (P<0.01) from Rs. 9.83 (T8) to 13.20
(T5); from 7.62 (T8) to 11.19 (T5); from 7.23 (T8) to 12.25 (T11) and from 8.23 (T8) to
12.12 (T5), respectively, during Period I, Period II, Period III and Cumulatively.
The effect of main factors revealed that throughout the experimental period,
the net returns were significantly (P>0.05) affected by both the main factors.
Cumulatively, the incremental levels of SPR gradually reduced the net returns (from
Rs. 11.39 in control diets to 10.27 in 10% SPR diets). With regard to the
biotechnological tool as the main factor, the returns from lipid utilizing agents
supplemented diets were quite lower than those from control or NSP degrading
enzyme fortified diets. The cumulative average values of net returns from hens fed
different diets are graphically represented in Fig. 19.
4.6 GENERAL DISCUSSION
Sugarcane press residue (SPR) is a byproduct of sugar industry constituting
about 3 per cent of cane crushing and available to the tune of 5 million tons annually
in India. It is a soft, spongy, amorphous dark material containing sugars, fiber,
coagulated colloids including wax, apart from containing albuminoids, organic salts,

etc. and rich in N, P, Ca, Fe and Mn (Singh and Solomon, 1995). Currently SPR is
used as a manure for enhancing crop productivity and majority of it remains
unutilized due to lack of proper technology. Preliminary studies conducted at this
Institute proved that the incorporation of sun-dried SPR up to 10% in layer rations
(Suma, 2005) and up to 4 % in broiler rations (Budeppa, 2004) is economical to
minimize the feed costs. Considering the above facts, a holistic approach was made to
include SPR as a source of feed ingredients in both broilers and layers. The primary
objective of the present study is to obtain precise knowledge of the nutrient contents
and the energy value of the SPR and then to test this novel stuffs for possible utility in
poultry with appropriate feed formulae.
At the outset, detailed chemical evaluation of the SPR samples from different
factories was carried out to asses the nutrient worth of SPR interms of proximate
principles, fiber fractions, minerals, amino acids and fatty acids. The chemical
composition of SPR appears to be similar to that of cereal byproducts (brans) in terms
of crude protein (11.80%) and crude fiber content (13.73%). Additionally it contains
higher amount of fat (11.95%) which is unique to itself and the linoleic acid, one of
essential fatty acid constitutes about 38.0% of fat. Besides organic nutrients, SPR
contains substantial amount of both macro and micro minerals especially calcium
(4.90%), phosphorus (1.25%), iron (4300ppm) and manganese (260ppm). The
chemical composition of SPR from different sources is variable and such variations
are mainly attributable to the differences in agro-climatic conditions, quality of the
cane and clarification method followed at sugar plant. The results indicated that there
is a potential for use of SPR as a source of both organic and inorganic nutrients. Thus
the sun-dried SPR appears to have the ability to substitute the costly and scarce
conventional feed ingredients such as DORB, etc. and also mineral sources
particularly that of di-calcium phosphate and certain trace mineral salts that are
mandatorily included in the poultry rations. Hence, from the initial screening sun-
dried SPR appeared to be the potential prospective feed ingredient in the rations of
poultry.
As either too much or too little energy leads to less than the optimal
performance, it is essential for the nutritionist to have an accurate knowledge of the
energy value of each feed ingredient incorporated in to poultry rations. Hence, the

sun-dried SPR after having been subjected to screening for chemical constituents have
been further subjected for determination of metabolizable energy in both broilers and
layers. The results revealed that about 40 per cent of the gross energy of sun-dried
SPR can be metabolized in both younger (broilers) and mature birds (layers). The
average ME value of SPR included at 10, 20 and 30% of basal diets was observed to
be 1130 and 937 kcal/kg in broilers and layers, respectively. The values appear to be
inferior when compared to that of other conventional feed ingredients (eg. DORB –
2200 kcal/kg). Important factors that could have rendered such a low ME of SPR
include:
1. Higher amounts of inorganic matter and crude fiber 2. Poor digestibility of crude fiber in poultry 3. Poor metabolizability of ether extract fraction of SPR 4. The digestibility and absorbability of other nutrients may be indirectly affected by
crude fiber by trapping them 5. Since SPR is the residue left during boiling of cane juice, it may contain lot of
impurities including sand and silica which might affect the utilization of nutrients accounting for low ME.
The effect of afore mentioned factors is more predominant in young birds as
suggested by our results. Hence, the separate ME value for sun-dried SPR were taken
for broiler chicks and laying hens during subsequent feeding cum performance trials.
It is also important to note that the nutrient metabolizability of the diet is
estimated with a greater degree of precision, than that of a test ingredient. This view
was supported on the grounds that any error introduced in determination of
metabolizability of different components of diets would magnify while the nutrient
metabolizability of value of a test ingredient is being estimated in accordance with the
level of test ingredient added to the basal diet. For example, one unit error in DM
metabolizability determination of a diet containing 10 per cent of test ingredient
would magnify any error to ten units in estimating the DM metabolizability of the
latter. Thus the error magnifying unit became small with the higher inclusion level of
the test ingredient in the basal diet. This would party explain the difference in
precision of metabolizability determination at different levels. Thus, metabolizability
of sun-dried SPR at 30 per cent inclusion level seemed appropriate in the present
study also. However, as the possibility of inclusion of SPR beyond 10% was not

practicable, the ME values obtained at 10% inclusion level were considered during
further studies.
From the results, it was concluded that the ME content of the SPR having the
nutrient contents similar to that evaluated in the present study could well be taken
around 1000 kcal/kg for broilers and 950 kcal/kg for laying hens for all practical
purposes. It was also evident that the fortification of SPR based diets with
biotechnologically derived products such as lipase with lecithin, NSP degrading
enzymes and their combination failed to enhance its’ nutritive value.
The results also being revealed that SPR is a low energy feedstuff with the
substantially lower ME value less than that of conventional cereals such as maize and
also slightly lesser than many agro-industrial by-products such as rice bran, wheat
bran. It was, therefore viewed that the SPR is a very poor source of energy and can
only be included along with concentrated source of energy such as oils and fats in
poultry feed formulations as a filler material whenever the scarcity of conventional
feed ingredients occurs.
After assessing the nutrient composition and energetic worth of SPR, attempt
to include sun-dried SPR in the rations of poultry was undertaken with an objective to
determine safe and economical level of inclusion of SPR. For that purpose, two
feeding trials, on each in broilers and layers were conducted. In both the cases, the
sun-dried SPR was included as the source of both organic nutrients as well as
minerals at the expense of other feed ingredients and mineral sources particularly
DORB, sunflower extraction, di-calcium phosphate and other pertinent mineral salts.
In the performance trial involving broilers, the sun-dried SPR was included at
5 and 10% levels in iso-nitrogeous and iso-caloric diets including calcium,
phosphorus and other minerals. Each of such diets was further fortified with no
supplement, lipid utilizing agents or NSP degrading agents or both and offered to
triplicate groups of 30 day old commercial chicks for the duration of 42 days. The
results clearly indicated that the groups of birds fed diets incorporated with either 5 or
10 % SPR tended to consume less feed and gained less body weight compared to
control diet devoid of SPR. The feed conversion ratio was also declined with
inclusion of SPR but however, inconsistent with the level of SPR inclusion either at 5

or 10%. The reduced feed consumption of SPR based diets was mainly attributable to
the dusty nature of such diets caused due to finer particle size of SPR. The reduced
feed consumption occurred at the beginning of the feeding trial itself, which resulted
in improper development of gastro intestinal tract and hence the lower digestion and
absorption efficiency resulted in a linear decline in growth rate with increasing
inclusion levels. Pertaining to the supplementation of biotechnological derived feed
additives, no significant differences were observed. These are against the results of
Budeppa (2004) who observed non significant differences in feed consumption, body
weight gain and FCR of broilers fed both fish-based and soy-based diets containing
SPR at 1, 2, 3 and 4 per cent levels.
A metabolism trial conducted between 19th to 21st day of trial indicated that
the metabolizability of dry matter, organic matter and crude protein at 5 % or 10 %
inclusion levels were significantly (P<0.05 or p<0.01) lower than those of the control
group. The data reveals that there was a progressive decrease in average
metabolizability of various nutrients with the incremental level of SPR. However, a
balance of minerals indicated a non-significantly (P>0.05) better Ca retention value at
higher level of SPR inclusion in the diets. The better mineral status might be due to
presence of calcium and phosphorous in an easily available form in the SPR per se.
A slaughter study conducted at the termination of the experiment (42nd day)
implied that the inclusion of SPR up to 10 % in broiler diets has no influence on
dressing percentage, meat to bone ratio, relative weight of vital organs and length of
intestinal segments. However, broilers fed 10% SPR based diets showed lowest
relative abdominal fat weight compared to control. The inclusion of SPR has also
numerically enhanced the mineralization of tibial bone. However, such effect was not
noticed in calcium and phosphorus profile of blood during different stages of trial.
A carcass evaluation carried at the terminal day of performance trial of
broilers indicated that the inclusion of SPR does not affect the carcass characteristics
of the birds like dressing percentage and meat to bone ratio. The developmental of
vital organs was unaffected with incorporation of SPR in broilers diets. The bone
mineralization and blood mineral profile of birds under SPR based diets were also
comparable to that of control.

The results pertaining to economics of SPR inclusion in broiler diets indicated
that the inclusion of SPR at either levels (5 or 10% ) is not economically feasible.
Although the inclusion of SPR reduced the cost of the diets, the net profit and
performance indices were poorer in SPR diets when compared to the control groups
and fortification of diets with biotechnological products failed to improve the net
returns. Considering the parameters of economic importance, it can be inferred that
the inclusion of SPR as feed ingredient in broiler diets at 5% level or above is not
practicable.
The effect of inclusion of SPR on the production performance of layers was
also attempted. When sun-dried SPR was included at 5 and 10 per cent in layer diets,
the feed consumption and egg production were significantly lower in both 5 and 10%
SPR based groups when compared to control group. The feed efficiency of SPR based
diets was also inferior compared to control diets. The reason for reduced performance
was again attributable to dusty nature of SPR based diets which resulted in reduced
feed intake that culminated in decreased egg production and feed efficiency. Contrary
to the present findings, Suma (2005) reported non-significant (P>0.05) differences in
feed consumption, egg production and feed efficiency in layers fed soy-based or fish-
based diets containing SPR up to 15% when compared to control.
The egg characteristics studied at 28-day intervals of the layer’s experiment
revealed that the inclusion of SPR up to 10% in layer diets does not alter the egg
quality parameters such as egg shape index, albumen index, yolk index, yolk colour,
Haugh unit score and shell thickness. However, the weight of eggs obtained from
birds fed SPR based diets were numerically heavier when compared to that from
control groups. The results are in agreement with the findings of Suma (2005). Thus,
it can be inferred that the egg quality is sustainable with SPR even up to 10 per cent in
the layer diets.
The mineral status of layers under SPR based diets was comparable to that of
control during different intervals. However, the balance of mineral indicated that the

per cent retention of calcium intake was better in SPR based diets. The minerals in
SPR might exist in the chelated (organic) form as the SPR allows certain microbial
fermentation during it’s procurement stage and thus allowing better utilization of
minerals.
The results pertaining to cost effectiveness of SPR inclusion in layer diets
indicated that the inclusion of SPR at either level (5 or 10% ) is not economical.
Although the inclusion of SPR reduced the cost of the diets, the net returns per bird
was poorer in SPR diets when compared to the control groups. Hence, by taking into
account of the parameters of economic importance, it can be inferred that the
inclusion of SPR as feed ingredient in layer diets at 5% level or above is not
practically feasible.
Contrary to the earlier reports (Budeppa, 2004; Suma, 2005) and expectations,
it is inferred that carcass characteristics of broiler birds can be maintained when SPR
is included up to 10% in their diets, but not the growth performance traits even at 5%
SPR inclusion. Similarly, the egg quality traits of laying hens can be sustainable with
inclusion of SPR even up to 10 per cent in the layer diets. Thus, the usefulness of SPR
as a feed ingredient in poultry diets is feasible only when the nutritional responses are
looked beyond the usual criteria of body weight gain in broilers and egg production in
layers as they tended to get negatively affected by SPR inclusion. The
supplementation of combination of biotechnological agents namely lipid utilizing
agents (lipase and lecithin) and NSP degrading enzymes shown occasional beneficial
effect in improving performance of broilers and layers.

V. SUMMARY AND CONCLUSION
A comprehensive attempt was made to assess the possibility / feasibility of
inclusion of sugarcane press residue (SPR) at different levels in poultry diets. A
detailed chemical evaluation of SPR comprising proximate principles, fiber fractions,
mineral constituents, amino acid composition and fatty acid profile was performed
followed by a series of biological trials in broilers and layers to determine nutritional
worth and safe/economic inclusion level of sun-dried SPR. Two metabolism trials
(one each in broilers and layers) were performed to arrive at the metabolizable energy
of SPR and using such values, the performance trials of independent nature, one in
broilers to asses the growth performance and carcass characteristic of young growing
birds and another in layers to asses the production performance and egg
characteristics of post-peak laying hens, both fed diets containing SPR at different
levels were conducted. All the experiments were conducted at the Dept. of Animal
Nutrition, Veterinary College, KVAFSU, Hebbal, Bangalore.
The results of the said experiments are summarized below:
A. Chemical evaluation
1. The crude protein, crude fiber, ether extract and nitrogen free extractives of
sun-dried SPR samples from different sugar factories ranged from 9.18 to
14.11, 3.60 to 12.24, 4.64 to 9.98 and 38.57 to 54.84 per cent, respectively and
the gross energy from 3719 to 4310 kcal/kg. The neutral detergent fiber, acid
detergent fiber and AD-lignin of sun-dried SPR samples ranged from 47.37 to
59.42, 20.92 to 33.70 and 5.93 to 17.78 per cent, respectively.
2. The mineral profile of SPR samples was: Calcium-3.87, total phosphorus –
1.10, magnesium – 0.95 per cent, copper – 61.5, zinc – 112.6, iron – 3500,
manganese – 284.3 and cobalt – 5.0 ppm.
3. The average essential amino acids (% of CP) of selected dried SPR was:
methionine – 2.21, cysteine – 1.05, lysine – 4.56, threonine – 5.48, arginine –
4.10, isoleucine – 4.77, leucine – 8.72, valine – 6.27, histidine – 2.44, and
phenylalanine- 4.90.
4. The fatty acid profile of ether extract component of SPR reveled that it a rich
source of linoleic acid (4.541%).

The chemical analysis indicated that SPR is a valuable source of both
organic nutrients and inorganic nutrients and comparable to that of cereal by-
products.
B. Metabolism trial in broilers
5. A total of sixteen diets were prepared by replacing basal mixture (T1) with
sun-dried SPR at 10 (T5), 20 (T9) and 30% (T13) levels and each such diet was
further supplemented with either lipid utilizing agents (T2, T6, T10 and T14) or
NSP degrading enzymes (T3, T7, T11 and T15) or their combination (T4, T8, T12
and T16, respectively). Each diet was offered to duplicate groups of 10 chicks
each for a period of 14 days (7 to 21 day of age) which included terminal 3
days collection period.
6. The metabolizability coefficient of dry matter, organic matter, ether extract
and crude fiber of experimental diets ranged significantly (p<0.01) from 58.67
(T14) to 71.29 (T2), 61.61 (T16) to 74.65 (T2), 53.04 (T14) to 66.75 per cent
(T2) and from 45.55 (T7) to 54.50 (T1), respectively.
7. The ME content of experimental diets were between 2680 (T16) and 3303
kcal/kg (T4) with the gross energy metabolizability coefficient ranged
significantly (p<0.01) from 68.90 (T10) to 78.11 per cent (T3) among different
treatments.
8. The average ileal nitrogen absorbability of birds differed significantly
(p<0.01) among different treatments and the values varied from as low as
69.14 (T16) to as high as 91.45 per cent (T4).
9. The metabolizability coefficient of various nutrients of test ingredient (SPR)
arrived by applying simultaneous equations were: dry matter - 11.81 to 39.19,
organic matter - 15.43 to 40.11, crude fiber-15.42 to 53.45 and ether extract-(-
)2.37 to 44.27 per cent. The absorbability of SPR nitrogen in the ileum varied
between a negative value of (-) 8.68 to 82.95 per cent.
10. The gross energy metabolizability of SPR among different treatments was
statistically similar (p>0.05) with the values ranging from 35.53 to 56.68 per
cent and the absolute ME values ranged between 683.2 and 1626.6 kcal/kg.
The ME of SPR at 10, 20 and 30% inclusion level were 1035.7, 842.3 and
1437.9 kcal/kg, respectively. No improvement in ME value of SPR upon
supplementation of biotechnological products was observed.

C. Metabolism trial in layers
11. In total, sixteen diets were prepared by replacing basal mixture (T1 to T4) with
sun-dried SPR at 10 (T5 to T8), 20 (T9 to T12) and 30% (T13 to T16) fortified
without supplement or with lipid utilizing agents or NSP degrading enzymes
or both in that order. Each diet was offered to triplicate groups of 3 laying
hens (45 week old) for a period of 14 days which included terminal 3 days
collection period.
12. The metabolizability of dry matter, organic matter, crude protein, ether extract,
crude fiber and NFE of experimental diets ranged significantly (p<0.01 or
p<0.05) from 55.52 (T14) to 69.79 (T2), 60.22 (T14) to 74.53 (T2), 59.40 (T13)
to 84.43 (T2), 41.78 (T12) to 64.91 (T2), 8.02 (T12) to 26.76 (T13) and from
70.64 (T14) to 83.38 (T4) per cent, respectively. In general, a decreased
metabolizability coefficient values with the incremental level of SPR was
noticed.
13. The gross energy metabolizability of experimental diets ranged significantly
(p<0.01) from 62.40 (T14) to 75.07 per cent (T2) with the ME content between
2243 (T14) and 2883 kcal/kg (T4).
14. Employing simultaneous equations, the metabolizability coefficient of dry
matter, organic matter, crude protein, ether extract, crude fiber and NFE of
SPR were found to be ranged from 4.36 to 34.03, 13.05 to 41.89, -36.92 to
80.34, -42.96 to 29.07 and -30.90 to 60.66 per cent, respectively. The
metabolizability value for gross energy of SPR was ranged from 41.72 to
62.39 per cent. The ME of SPR was found to be between 780 and 1133
kcal/kg. The significant differences observed only for crude protein (p<0.05)
and NFE metabolizability values (p<0.01).
15. The average dry matter metabolizability of SPR was 21.67, 18.46 and 29.63
per cent at 10, 20 and 30% inclusion level, respectively. The corresponding
values for organic matter: 30.21, 23.56 and 37.14 per cent, crude protein:
60.35, 24.71 and 33.31 per cent, ether extract: 1.21, -17.18 and 8.58 per cent,
crude fiber: 53.09, 48.97 and 54.24 per cent, gross energy: 42.92, 40.30 and
38.93 per cent, respectively. The corresponding absolute ME content was 845,
937 and 1031 kcal/kg. The differences were found to be statistically similar
(p>0.05) excepting for NFE (p<0.05).

16. The fortification of diets with biotechnological agents on nutrient
metabolizability of SPR was found to be statistically (p>0.05) not beneficial.
However, numerically better values were obtained in diets supplemented with
NSP degrading enzymes.
C. Performance trial in broilers
17. By making use of the ME value of SPR obtained from metabolism trial
involving broilers, test diets were prepared by incorporating sun-dried SPR at
5 and 10 per cent SPR replacing the relevant organic nutrients as well as
mineral sources of the control. The diets containing 0 (control; T1), 5 (T5) and
10% SPR (T9) were supplemented with lipid utilizing agents (T2, T6 and T10)
or NSP degrading enzymes (T3, T7 and T11) or their combination (T4, T8 and
T12, respectively) to result in a set of 12 iso-nitrogenous and iso-caloric diets.
Each such diet was prepared for starter (0-14 days), grower (15-28 days) and
finisher (29-42days) and phases were offered to triplicate groups of 10 chicks
each.
18. The cumulative average body weight gains (1737.7-T11 2081.1 g/bird-T2), and
feed consumption (3317.6-T12 to 3678.0 g/bird-T2) varied significantly
(p<0.01) among different treatments during 42 days experimental period. The
main factor SPR showed significant (p<0.01) differences in cumulative body
weight gain (1999.7, 1924.1 and 1803.8 g/bird for 0, 5 and 10% SPR included
diets, respectively) and feed consumption while no such variation was
observed with regard to the main factor biotechnological tool. The cumulative
average FCR (kg feed/kg weight gain) was non-significantly (p>0.05) better in
T4 (1.753) and poorer in T11 (1.977) and the values remained non-significant
(p>0.05) for the main factors, SPR (1.771, 1.837 and 1.908 for 0, 5 and 10 %
SPR based diets, respectively) and biotechnological tool. The livability of
birds under different treatments and main factors were statistically (P>0.05)
similar.
19. The variations in dry matter, organic matter, crude protein and ether extract
metabolizability coefficient values of experimental diets were significantly
(p<0.01) different among different treatments and as with the case of retention
of calcium and phosphorus. Similarly, significant (p<0.01) variation among

various nutrients metabolizability and mineral retention was observed for the
main factors, SPR and biotechnological tool with no definitive trend.
20. At the termination of the experiment (42nd day), no significant (p>0.05)
differences in dressing percentage (75.58-T11 to 79.61-T7), meat to bone ratio,
abdominal fat (15.20 -T12 to 36.00 g/bird-T4 or 1.54-T12 to 2.41 % of live
weight -T4), relative weights of giblet organs (liver, heart and gizzard),
proventriculus, lymphoid organs (spleen) excepting bursa (p<0.01) among
different treatments. The main factor SPR showed significant (p<0.01)
differences only in abdominal fat (27.79, 22.60 and 19.13 g/bird or 1.81, 1.47
and 1.33% in 0, 5 and 10% SPR based groups) and biotechnological tool in
relative weight of spleen. The relative length of different segments of small
intestine viz., duodenum, jejunum and ileum of birds under different
treatments were also statistically (p>0.05) similar.
21. The toe ash of birds was found to be statistically different (p<0.05) among
different treatments and main factors (SPR inclusion and biotechnological
tools) while the tibial ash contents remained statistically similar (p>0.05)
among different treatments and main factors. The tibial calcium and
phosphorus contents were statistically similar (p>0.05) among different
treatments. The main factor biotechnological tool showed significant
differences (p<0.05) (35.95, 38.45, 42.86 and 37.61 % for no supplement,
lipid utilizing agents, NSP degrading enzymes and their combination,
respectively), but not for the phosphorus content of tibia.
22. The profile of serum calcium and inorganic phosphorous in birds under
different groups were comparable to each other at 21st and 42nd day of
experiment and the values were well with in the physiological range.
23. In all the cases (starter, grower and finisher diets), the cost of the SPR
incorporated diets were lower than corresponding control diets. The
differences in net returns and performance indices were non-significant
among different treatments. Considering the main factor SPR, the relative net
profit values differed significantly (p<0.01) from as low as Rs. 7.77 in 10%
SPR based diets to as high as Rs. 11.12 in diets devoid of SPR (control).
However, non significant (p>0.05) differences were observed with regard to
the main factor biotechnological tool.

D. Performance trial in layers
24. Using the ME value of SPR obtained from metabolism trial in layers, three
iso-nitrogenous and iso-caloric experimental diets including calcium and
phosphorous were prepared by incorporating sun-dried SPR at 0 (T1), 5 (T4)
and 10 per cent (T9). Further, each diet was supplemented with lipid utilizing
agents (T2, T6 and T10) or NSP degrading enzymes (T3, T7 and T11) or their
combination (T4, T8 and T12, respectively) to result in another set of 8 diets.
Each such diet was offered to triplicate groups of 4 laying hens each. The
feeding trial was carried for 84 days, which was divided into three periods of
28-days each.
25. The cumulative average egg production (76.03-T8 to 84.50 per cent-T4), feed
consumption (117.9-T2 to 115.0 g/hen/day-T12) and feed efficiency (1.664-T4
to 1.844 kg feed /kg dozen egg-T8) showed significant (p<0.01) differences
among different treatments. As per the main factor wise, the values were also
found to be significant for both SPR (p<0.01) and biotechnological tool
(p<0.05) excepting feed consumption. The cumulative body weight changes (a
loss of 35.3 g/bird in T7 to a gain of 119.4g/bird in T9) were statistically
similar (p>0.05) among different treatments and no significant (p>0.05)
effects was noticed due to main factors.
26. The treatment wise average egg weight values ranged significantly (p<0.01)
from 58.12 (T1) to 59.89 g (T11) on cumulative basis. Such a differences were
also observed for the main factor SPR in which 5 per cent SPR incorporated
diets showed higher egg weights (59.32g) when compared to 10 per cent SPR
(59.05g) and control (58.62 g). The cumulative average egg weight values
were 59.2 and 59.4 g in diets supplemented with lipid utilizing agents and
NSP degrading enzymes as against 58.8 and 58.7 g in diets with no
supplement and both lipid utilizing agents and NSP degrading enzymes,
respectively.
27. The egg quality characteristics such as Egg Shape Index (ESI) (75.64-T10 to
79.87-T9), albumen index (4.36-T9 and T3 to 4.71-T7), Haugh unit scores
(HUS) (57.01-T8 to 60.20-T7), yolk index (32.82-T7 to 33.80-T2) and yolk
colour was found to be statistically similar (p>0.05) among different
treatments at different stages of experiment. However, the influence of
different treatment diets on egg shell thickness was significant (P<0.01) on

28th and 56th day of trial. No significant differences could surface at different
levels of SPR and between combinations of biotechnological tools excepting
for shell thickness and yolk colour.
28. The efficiencies of protein (26.52-T8 to 29.13 per cent-T11) and energy
utilization (25.55-T9 to 28.04-T11) among different treatments were highly
significant (p<0.01) during all the periods as well as on cumulative basis. As
regards the main factors, both the SPR and biotechnological tool showed
significant (p<0.01) differences in protein and energy utilization efficiency on
cumulative basis.
29. The metabolizability coefficient of dry matter ranged non-significantly
(p>0.05) from 68.19 (T9) to 72.54 (T8) and that of organic matter varied highly
significantly (p<0.01) from 67.97 (T11) to 72.38 (T1) among different
treatments. The metabolizability of dry matter (68.94 to 70.77%) was
statistically similar (p>0.05) and that of organic matter was highly significant
(p<0.01) for the main factor SPR.
30. The calcium (4.04-T12 to 4.38g/h/d-T10 or 75.25-T9 to 78.06%-T8) and The
phosphorus retention (0.62-T9 and T10 to 0.72g/h/d -T3 and T4) of birds showed
non-significant (p>0.05) differences among different dietary treatments and
the values ranged from. The values were also found to be statistically similar
(p>0.05) when arranged as per the main factors, SPR and biotechnological
tool excepting the P retention showing significantly (p<0.01) lower in 10%
SPR incorporated diets (0.64g) when compared to that of control (0.69 g).
31. The serum calcium values of birds ranged from 17.30 (T5) to 18.13 (T3) mg/dl
on 28th day; from 18.53 (T7) to 19.20 (T9) mg/dl on 56th day and from 18.73
(T12) to 19.20 (T2, T3 and T11) mg/dl on 84th day. The serum inorganic
phosphorus of birds at 28th day, 56th day and 84th days of the experimental
period ranged from 6.20 (T6) to 7.17 (T10); from 7.70 (T2 and T3) to 8.47
(T11), 8.63 (T2 and T10) to 8.90 (T3) mg/dl, respectively and no significant
(p>0.05) difference were evident during all the intervals except at 56th day.
32. The cost of control diet (T1) was Rs. 7.13/kg which got reduced to Rs. 6.88/kg
as the SPR level increased to 10 per cent (T9), which was partly due to the
progressive decreasing cost of mineral salts at the expense of SPR as mineral
source. The cumulative net returns ranged significantly (p<0.01) from 8.23
(T8) to 12.12 (T5) among different treatments. The values were significantly

(p>0.05) affected by both the main factors, SPR (from Rs. 11.39 in control
diets to 10.27 in 10% SPR diets) and biotechnological tool (lower lipid
utilizing agents supplemented group when compared to those from control or
NSP degrading enzyme fortified diets).
CONCLUSION
Sugarcane press residue (SPR), a by-product of sugar industry is a potential
source due to availability and unique nutrient composition. Though the chemical
analysis of SPR reflects it as a good source of both organic and inorganic nutrients,
yet the biological experiments revealed that the nutritive value of SPR is poor.
To conclude, the possibility of inclusion of SPR as an unconventional feed
resource in diets for non-ruminants particularly in poultry diets beyond 5% level, the
minimum level that was tested appears to be remote. If the nutritional responses are
looked beyond the usual criteria of weight gain in broilers and egg production in
layers to parameters such as birds’ optimal health and consumers’ preference for lean
meat, SPR appears to be a optional ingredient in poultry rations. However, since
limited reports available on the utilization of SPR in both broilers and layers, it is
rather inferred that some more research is required to confirm the present findings.

VI. REFERENCES Al-Marzooqui, W. and S. Leeson, 2000. Effect of dietary lipase enzyme on gut
morphology, gastric motility, and long term performance of broiler chicks. Poult. Sci., 79: 956-960.
Ammerman, C.B., P.R. Henry and R.D. Miles, 1998. Supplemental organically
bound mineral compounds in livestock nutrition. In: Garnsworthy, P.C. and J. Wiseman (Eds) Recent Advances in Animal Nutrition, Nottingham, Nottingham University Press, pp 67-91.
AOAC. 2005. Official Methods of Analysis. Association of Official Analytical
Chemists. 18th Ed., Washington, D.C. Attech, J.O. and S. Leeson, 1985. Response of laying hens to dietary saturated
and unsaturated fatty acids in the presence of varying dietary calcium levels. Poult. Sci., 64: 520-528.
Augur, H.S., H.S. Rollman and H.J. Deuel, 1974. The effect of crude lecithin on
the coefficient of digestibility and the rate of absorption of fat. J. Nutr., 33: 177-186.
Babu, A.M.P. and G. Devegwoda, 1997. Effect of fiber degrading enzymes in
diet on performance of broilers. Indain J. Poult. Sci., 32(3): 207-211. Basavaraja Reddy, A.I., 1984. Prediction of metabolizable energy based on dry
matter metabolizability. MVSc Thesis, University of Agricultural Sciences, Bangalore.
Bedford, M.R. and J.D. Summers, 1985. Influence of ratio of essential to non-
essential amino acids on the performance and carcass composition of the broiler chick. Br. Poult. Sci., 26: 483-491.
Benzamin, M.M. 1985. Outlines of Veterinary Clinical Pathology. III Edn.,
Kalyani Publishers, New Delhi – Ludhiana. Bhatia, I.S. 1969. Evaluation of feedstuffs available in India for protein quality
and energy value. Final report (1964-1969), PAU, Ludhiana. BIS, 1992. Bureau of Indian Standards, Poultry Feed Specifications, 4th Review,
Manak Bhavan, New Delhi.

Boorman, K.N. and G.M. Ellis, 1996. Maximum nutritional response to poor-quality protein and amino acid utilization. Br. Poult. Sci., 37: 145-156
Budeppa, H.B., 2004. Sugarcane Pressmud as a source of minerals for broilers.
M.V.Sc. Thesis submitted to U.A.S., Bangalore. Calneck, B.W., H.J. Barnes, C.W. Beard, W.M. Reid and H.W. Yoder. 1992.
Diseases of Poultry. 9th Edn. Wolf Publishing Ltd., USA. Chadha, R.C., 2005. Indian feed industry scenario vis-à-vis World. In: Proc.
XXIII Indian Poult. Sci. Assoc. Conf. held on 2-4 February, 2005, Hyderabad. Pp92-109
Chaturvedi, V.B. and K.S. Singh, 2000. Intake and digestibility of nutrients in
chickens fed diets based on rice bran. Indian J. Poult. Sci., 35(3): 318-321. Chennegowda, H.K., C.V. Gowda and G. Devegowda, 2001. Efficacy of
enzyme mixture to improve performance of broilers fed sunflower extraction rich diets. Indian J. Poult. Sci., 36(3):256-259.
Choct, M. 1999. Soluble non-starch polysaccharides affect net utilization of
energy by chickens. In: Recent Advances in Animal Nutrition in Australia. 12: 211.
Choct, M., R. J. Hughes, R.P. Tremble, K. Angkanaporn and G. Annison. 1995.
Non-starch polysaccharide degrading enzymes increase the performance of broiler chickens fed wheat of low apparent metabolizable energy. J. Nutri., 125 (3): 485-492.
Dale, N.M., G.M. Pesti and S.R. Rogers, 1990. True metabolizable energy of
dried bakery product. Poult. Sci., 69: 72. de Koning, W. and C. Van der Wel, 1996. Effect of inclusion of vegetable
protein enzyme in broiler starter diets. In: Proc. World’s Poult. Sci. Conf., 3-5 September 1996. New Delhi, India Vol IV, p250.
Deaton, J.W., J.L. McNaughton and D. Burdiuk, 1979. High fiber sunflower
meal as replacement for soybean meal in layer diets. Br. Poult. Sci., 20: 159-132
Degussa Corporation, 2001. Amino Dat 2.0 Interactive software. Degussa AG. Hanau-Wolfgang, Germany.

Degussa Huls A.G. 2006. Feed Additives Division., Applied Technology. D-63403 Hanau, Germany.
Duncan, D.B., 1955. Multiple range and multiple F test. Biometrics. 11: 1-42. Edward, A.G and R.G. Campbell, 1991. Energy-protein interactions in pigs:
Recent Advances in Animal Nutrition-1991 pp-3-19 (Oxfard, Butterworth-Heineinan).
Fenton, T.W. and M. Fenton, 1979. An improved procedure for the
determination of chronic oxide in feed and faeces. Can. J. Anim. Sci. 59: 631-634.
Ferguson, N.S., R.S. Gates,, J.L. Taraba, A.H. Cantor, A.J. Pescatore, M.J. Ford
and Burnhams, 1998. The effect of dietary crude protein on growth, ammonia concentration and litter composition of broilers. Poult. Sci., 77: 1481-1487.
Francesh, M., A.M. Perezvedrell, E. EsteveGracia and J. Brufau, 1995. J. Appl.
Poult. Res., 4(1):32-40. Green, S. 1987. Digestibility of Amino Acids in Feedstuffs for Poultry and Pig’
Digestibility Report 8/87, A.E.C. Rhone-Poulenc, Commentry, France, pp-34.
Gupta, B.K. and A.K. Ahuja. 1998. Use of sugarcane press mud as cattle feed.
Feed trends, 15(2): 6. Han, I.K., H.W. Hochstiter and M.L Scot, 1976. Metabolizable energy values of
some poultry feeds determined by various methods and their estimation using metabolizability of the dry matter. Poult. Sci., 55: 1335-1342.
Han, Y., H.Suzuki, C.M. Parsons and D.H. Baker, 1992. Amino acid
fortification of low protein corn and soybean meal diets for chicks. Poult. Sci., 71: 1168-1178.
Hartel, H., R. Schneider, Seibold and H.J. Lantzsch, 1977. Belgichungon
zwischen der M. Komigeierten unsetabaren energic and day Nahrstaff gehaltin des furthers brim huch. Arch. Geflugelk 41: 52-81.C.F. Poult. Sci., 59:808-811, 1980.

Haugh, R.R., 1937. The Haugh unit for measuring egg quality. U.S. Poult. Mg., 43: 552. cited by Eisen et al., 1992. Poult. Sci., 41: 1461.
Hill, F.W. and D.A. Anderson, 1958. Comparison of ME and productive
energy determinations with chicks. J. Nutr., 64: 587-603. Hughes, R.J. and M. Choct, 1999. Chemical and physical characteristics of
grains that are related to variability in energy and amino acid availability in poultry. Austr. J. Agri. Res., 50: 689-701.
Hughes, R.J., M. Choct and van Barnevld, 2001. Factors affecting energy
values of Australian cereal grains fed to broilers. Australian Poultry Science Symposium. 13: 30-38.
Hunsigi, G. 2001. Sugarcane in Agriculture and Industry. Prism Books Pvt. Ltd.,
Bangalore-70. ICIDCA. 1988. Hand Book of Sugar Cane Derivatives. A publication of Cuban
Research Institute of Sugar Cane Derivatives (ICIDCA)-GEPLACEA-UNDP. pp 43-44.
ICMR, 1995. Nutrient requirements and recommended dietary allowances for
Indians. New Delhi P: 14-21. Jaishakar, N. 2006. Influence of lysine producing probiotics vis-à-vis type of
protein source on performance of broilers. M.V.Sc. Thesis submitted to K.V.A.F.S.U., Bidar.
Janssen, W.M. and B. Carre. 1989. Influence of fiber on the digestibility of
poultry feeds. Pages 78-96 in Recent advances in Poultry Nutrition. Ed: D. Cole, Butterworths, London.
Janssen, W.M., A.K. Terpstra, F.E.E. Beeking and A.N.J. Bisalsky, 1979.
Feeding value for poultry. 2nd edn. Beekelbergen, Netherlands. Jayanaik. 1989. Nutritive value of silk worm (Bombyx mori. L.) excreta in
broiler breeders. M.V.Sc. Thesis submitted to U.A.S., Bangalore. Jayanna, H.S. and G. Devegowda. 1993. Proc. Karnataka Vet. Assoc. Scientific
meet. 13-14th March, 1993 Jin, S., A. Coreless, J.L. Sell and S.H. Jin. 1998. Digestive system development
in post-hatch poultry. World’s Poult. Sci. J., 54: 335-345.

Jones, D.B., J.D. Hancock, D.I. Harmon and C.E. Walker. 1992. Effect of
exogenous emulcifiers and fat sources on nutrient digestibility, serum lipids, and growth performance in weaning pigs. J. Anim. Sci. 70: 3473-3482.
Keshavarz, K and S. Nakajima. 1993. Reevaluation of calcium and phosphorus
requirements of laying hens for optimum performance and egg shell quality. Poult. Sci., 72: 144-153
Ketels, E. and G. DeGroote, 1987. Effect of fat source and level of aft inclusion
on the utilization of fatty acids in broiler diets. Arch. Gefluegelkd, 51: 127.
Ketels, E., G. Huyghebaert and DeGroote, 1986. The nutritional value of
commercial fat blends in broiler diets. 2. effect of incorporation level on the fatty acid utilization. Arch. Gefluegelkd, 51: 59.
Korgdhal, A. and J.L. Sell. 1989. Influence of age on lipase, amylase, and
protease activities in pancreatic tissue and intestinal contents of young turkeys. Poult. Sci., 68:1561-1568.
Kumar, P.V., R. Ravi, M. Purushothaman and B. Mohan. 2007. Performance of
broilers fed graded levels of mango (Mangifera indica) seed kernel during finisher phase. Anim. Nutr. Feed Tech., 7: 21-28.
Leeson, S. and J.D. Summers, 2001, Nutrition of the Chicken. 4th Edn.,
University Books, Canada, NIH6N8, Publications. Leeson, S. and J.D. Summers, 2002, Commercial Poultry Nutrition.
International Book Distributing Co., Lucknow. Leeson, S. and J.O. Attech. 1995. Utilization of fats and fatty acids by turkey
poult. Poult. Sci., 74: 2003-2010 Lesson, S., L.J. Caston and J. D. Summers, 1996. Broiler response to diet
energy. Poult. Sci., 75: 529-535. Lessire, M., B. Leclercq and L. Conana, 1982. Metabolizable energy value of
fats in chicks and adult cockerels. Anim. Feed Sci. Tech., 7: 365-374

Li, S., W.C. Sauer and M.Z. Fan, 1993. The effect of dietary crude protein level on amino acid digestibility in early weaned pigs. J. Anim. Physio. Anim. Nutr., 70: 26-37.
Lindenmaier, P. and M.R. Kare, 1959. The taste end-organs of the chicken.
Poult. Sci., 38: 545-550 Lodhi, G.N., Daulat Singh and J. S. Ichhponani., 1976. Variation in nutrient
content of feeding stuff rich in protein and reassement of the chemical method for metabolizable energy estimation for poultry. J. Agric. Sci., Com. 8: 293
Longstaff, M and J.M. McNab. 1991. The inhibitory effect of hull
polysaccharides and tannins of filed beans on the digestion of amino acid, starch and lipid and on digestive enzyme activities in young chickens. Br. J. Nutr., 65: 119-126.
Mahapatra, S.C., 2005. Poultry production in India in the changed global
scenario: Opportunities and challenges. In: Proc. XXIII Indian Poult. Sci. Assoc. Conf. held on 2-4 February, 2005, Hyderabad. Pp3-11
Mandal, A.B., P.K. Tyagi and A.K. Shrivatsav. 2006. Research Priorities in
Poultry Nutrition and Feed Technology to 2020. In: Research Priorities to 2020. pp-97-112
Mangle, N.S., A.G. Khan, M.A. Quadri and I.C. Dutta. 1979. Association of
certain inorganic elements in blood plasma with production traits in the WLH pullets. Indian J. Poult. Sci., 14: 165-168.
Martz, F.R., R.V. Boucher and M.G. McCartney. 1957. The influence of dietary
productive energy and fiber on growth response in chickens. Poult. Sci., 36: 1217-1220.
Mateos, G.G. and J.L Sell, 1981. Nature of the extrametabolic effect of
supplemental fat used in semi-purified diets for laying hen. Poult. Sci., 60:1925.
Mateos, G.G., J.L. Sell and J.A. Eastwood. 1982. Rate of food passage (transit
time) as influenced by level of supplemental fat. Poult. Sci., 61: 94. Mayer, J.H. and W.H. Garret. 1969. Techniques and procedure in animal
science research. American Society of Animal Science. C/o Corporation 49, Sheridan Avenue, Albany. N.Y. 12210.

McDonald, P., R.A. Edwards, J.F.D. Greenhalgh and C.A. Morgan, 2002,
Animal Nutrition. 6th Edn., Pears Education (Singapore) Pvt. Ltd. Publishing.
Mendelkar, S.M., 1992. Influence of dietary protein and amino acid
supplementation on the laying performance of egg type chickens. Poultry Advisor. 25 (10):33-38.
Meng, X., B.A. Slominski and W. Guenter. 2004. The effect of fat type,
carbohydrase, and lipase addition on growth performance and nutrient utilization of young broilers fed wheat-based diets. Poult. Sci., 83: 1718-1727.
Mohandas and G. Devegowda. 1993. Proc. Karnataka Vet. Assoc., Scientific
meet. 13-14th March, 1993. Moran, E.T. 1985. Digestion and absorption of carbohydrates in fowl and
events through perinatal development. J. Nutr., 115: 665. Morris, T.R. 1968. The dietary energy level on the voluntary caloric intake of
laying birds. Br. Poult. Sci., 9: 2519. Nagaraju, R. 2006. Prospects of humic acid based product in broiler rations.
M.V.Sc. Thesis submitted to K.V.A.F.S.U., Bidar. Narayana Swamy, T., 1986. Nutritive value of silkworm (Bombyx mori L.)
excreta in broilers. MSc thesis, University of Agricultural Science., Bangalore.
Nir, I. and I. Ptichi. 2001. Feed particle size and hardness: Influence on
performance, nutritional, behavioral and metabolic aspects. In: Advances in Nutritional Technology-2001 (Eds. A.F.B. van der Poel, J.L. Vahl and R.P. Kwakkel). Wagningen Pers, Wageningen, The Netherlands.
Nir, I., G. Shefet and Y. Aroni.1994. Effect of particle size on the performance
1. Corn. Poult. Sci., 73: 45-49. Nir, I., J.P. Melcion and M. Picard. 1990. Effect of particle size of the sorghum
grains on feed intake and performance of young broilers. Poult. Sci., 73:2177-2184.

Nir, I., R. Hillel, G. Shefet and Z. Nitsan.1994. Effect of particle size on the performance 1. Grain texture interaction. Poult. Sci., 73: 781-791
Nir, I., R. Hillel, I. Ptichi and G. Shefet.1995. Effect of particle size on the
performance 1. Grinding pelleting interaction. Poult. Sci., 74: 771-783 Noy, Y. and D. Sklan. 1995. Digestion and absorption on young chick. Poult.
Sci., 74: 366-373. NRC (National Research Council). 1994. Nutrient Requirement of Poultry, 9th
Revised Edition., National Academy Press, Washington, D.C. Ogunmodde, K.T. and B. Oguntela. 1971. Utilization of palm, groundnut and
melson seed oils by pullets. Br. Poult. Sci., 12:187. Ostterhout, L.E. 1980. Poult. Sci., 59: 1480-1484. Pal, R.S. and K.S. Singh. 1998. Effect of soybean husk in the wheat soybean
diets on eh voluntary feed intake and digestibility of nutrients in growing chickens. Indain J. Poult. Sci., 33(1): 92-96.
Parsons, C.M., 1985. Influence of caecectomy on digestibility of amino acids by
roosters fed distillers’ dried grains with soluble. J. Agri. Sci. Comb. 104: 469-472.
Parish, D.H., 1962. Ann. Rep. Mauritius Sugar Ind. Res. Inst., pp105-110. Pathak, N.N., D.N. Kamra and N. Agarwal. 1996. Analytical Techniques in
Animal Nutrition Research. International Book Distributing Co., Lucknow.
Perney, K.A., A.H.Canton, M.L.Straw and K.L.Herkelman, 1993. The effect of
dietary phytase on growth performance and phosphorus utilization of broiler chicks. Poult. Sci. 72: 2106-2114.
Poddar, K and S. Biswas. 1991. Metabolizable energy value of two rice bran
samples differing in proximate composition. Indian J. of Poult. Sci., 26(2): 84-88.
Polin, D. and T.H. Hussein, 1982. The effect of bile acids on lipid and nitrogen
retention, carcass composition, and dietary metabolizable energy in very young chicks. Poult. Sci., 61: 1697-1707.

Polin, D., T.L. Wing, P.Ki and K.E. Pell. 1980. The effect of bile acids and lipase on absorption of tallow in young chicks. Poult. Sci., 59: 2738-2743.
Ponnuvel, P., A. Jalaludeen and A. Ramakrishnan. 2001. Influence of cellulase
enzyme supplementation in high fiber diet on the production performance of layer chicken. Indian J. Poult. Sci., 36:93-95.
Portella, F.J., L.J. Caston and S. Leeson. 1988. Apparent feed particle size
preference by broilers. Can. J. Anim. Sci., 68: 923-930. Potter, L.M. 1988. Bioavailability of phosphorus from various phosphates
based on body weight and toe ash measurements. Poult. Sci., 67:96-102. Prasad, N.V.K.S. and S.J. Reddy. 1990. Hatchery by-product meal as protein
supplement for laying chicken. Indain J. Poult. Sci., 25(2): 88-92. Rajeshwara Rao, N. and G. Devegowda. 1996. Study on dietary
supplementation of enzymes on broiler performance. In: Proc. XX World’s Poult. Conf., New Delhi, 218pp
Ranjhan, S.K. 2001. Animal Nutrition and Feeding Practices. 6th Revised Edn.,
Vikas Publishing House Pvt. Ltd., New Delhi. Rama Rao, S.V., M.V.L.N. Raju, A.K. Panda, G. S. Sunder and R.P. Shrama.
2006. Effect of supplementing NSP hydrolyzing enzymes on the performance of broiler chickens. Indian J. Anim. Nutri., 23(1): 41-46.
Ravindran, V. 1995. Evaluation of a layer diet formulated from non-
conventional feeding stuffs. Br. Poult. Sci., 36(1):165-170. Ravindran, V., L.I. Hew and W.L. Bryden. 1998. Influence of gunanidination
on apparent ileal amino acid digestibility as some proteins sources for broilers. Poult. Sci., 77: 873-877.
Reddy, B. S.V., 1979. Feeding value of forages in poultry. PhD thesis, Punjab
Agricultural University, Ludhiana. Reddy, B.S.V., 2005. Personnel Communication. Reddy, B.S.V., Suresh, B.N., Jagadish, B., Singh, K.C. and M.M. Kailas (2004).
Sugarcane pressmud as a non-conventional source of minerals for livestock. Proc. of V Biennial Conf. of Animal Nutrition Association

held at National Institute of Animal Nutrition and Physiology, Bangalore, 24-26 November 2004, Abstr. No.216, pp151.
Reddy, D.V. 2006. Emerging role of nutraceuticals in animal nutrition
research: some thoughts. In: Proc. of VI Biennial Conf. of Anim. Nutr. Assoc. Sep 15-17, Jammu, India, 84 pp
Reece, E.N. B.D. Lott and J.W. Deaton. 1985. The effect of feed form, grinding
method, energy level, and gender on broiler performance in moderate (210C) environment. Poult. Sci., 64: 1834-1839.
Renner, R. and F.W. Hill. 1961. Utilization of fatty acids by chicken. J. Nutr.,
74: 259-269. Robertson, K.D. and H.M. Edwards. 1994. Effect of 1, 25-Dihydroxy chole
calciferol and phytase on growth performance of broiler chicks. Poult. Sci. 73: 312-319.
Roche company, 1969, Roche yolk colour Fan no. 1155 printed in Switzerland, DF, Bornstein and Bartov, 1966.
Roumy, M. and L.M. Leitner. (1973). Activites afferntes provenant du bec
superieur de la poule domestique. Centre de Recherche de l’Academie des Sciences. Paris. Serie D 277. 1791-1794
Roush, W.B., J. Mylet, J.L. Rosenbeyer and J. Derr. 1986. Investigation of
calcium and availability phosphorus requirements of laying hens. Poult. Sci. 65: 964-970.
Savory, C.J. and M.J. Gentle. 1976a. Effect of dietary dilution with fiber on the
food intake and gut dimensions of Japanese quail. Br. J. Poult. Sci., 17: 561-570.
Savory, C.J. and M.J. Gentle. 1976b. Changes in food intake and gut size in
Japanese quail in response to manipulation of dietary fiber content. Br. J. Poult. Sci., 17: 571-583.
Saxena, M.J., A. Karla and M. Sharma. 2006. Feed fortification- Drivers for the
decade. In: Proc. of VI Biennial Conf. of Anim. Nutr. Assoc. Sep 15-17, Jammu, India, 89 pp.
Scheideler, S.E., D. Aroni and U. Puthpongsiriporn. 1998. Strain, fiber source,
and enzyme supplementation effects on pullet growth, nutrient
utilization, gut morphology, and subsequent layer performance. J. Appl. Poult. Res., 7: 69-74.
Sell, J.L., A. Kroddahl and N. Hanyu. 1986. Influence of age on utilization of
supplemental fats by young turkeys. Poult. Sci., 65: 546. Sell, J.L., J. A. Eastwood and G.G. Mateos. 1983. Influence of supplemental fat
on diet metabolizable energy and digesta transit time in laying hens. Nutr. Rep. Int., 28: 487.
Senkoylu, N. and N. Dale. 1999. Sunflower meal in poultry diets: a review.
World’s Poult. Sci. J., 55: 153-174. Serafin, J.A. and M.C. Nesheim, 1970. Influence of dietary heat labile factors in
soybean meal upon bile acid pools and turn over in the chick. J. Nutr., 100: 786-795.
Sharma, M. and B.S. Katoch. 1993. Indian J. Anim. Nutri., 10(4):247-250 Sibbald, I.R. 1977. The true metabolizable energy values of some feeding
stuffs. Poult. Sci. 68:668-673. Sibbald, I.R. and J.K.G. Karmer, 1978. The effect of the basal diet on the true
metabolizable energy value of fat. Poult. Sci., 57: 685-691. Sibbald, I.R. and S.J. Slinger, 1963. A biological assay for ME in poultry feed
ingredients together findings which demonstrate some of the problems associated with the evaluation of fats. Poultry Science 42: 313-325.
Sibbald, I.R., S.J. Slinger and G.C. Ashton. 1962. Factors affecting the
metabolizable energy content of poultry feeds 5. The level of protein and test materials in diets. Poult. Sci. 41: 107-116.
Singh, B.G. and S. Solomon. 1995. Alternative products form sugarcane:
Industrial and agricultural uses. In: Sugarcane Agro-Industrial Alternatives (Eds. Singh, B.G. and S. Solomon). Vijay Pimlani for Oxford and IBH Pub. Co. Pvt. Ltd., New Delhi.
Snedecor, G.W. and W.G. Cochran. 1989, Statistical Methods. 9th Edn., The
Iowa State University Press, Ames, Iowa. Southgate, D.A.T. 1973. Fiber and other unavailable carbohydrates and their
effects on the energy value of the diet. Proc. Nutr. Soc. 32:131.

Staub, S. and A. Drane, 1965. Proc. 12th Cong. ISSCT, pp. 1865-1885. Suma, N., 2005. Effect of inclusion of sugarcane press residue in soy-based
and fish-based diets for layers. M.V.Sc. Thesis submitted to K.V.A.F.S.U., Bidar.
Suma, N., B.S.V. Reddy, R.G. Gloridoss, R. Rao, K.C. Singh, M.T. Rekha and
A. R. Gomes. 2007. Egg quality traits of layers influenced by supplementation of different levels of sugarcane press residue. Inter. J. Poult. Sci., 6(2):102-106.
Suresh, B.N. 2004. Preliminary study on utilization of sugarcane pressmud in
growing sheep. M.V.Sc. Thesis submitted to U.A.S., Bangalore. Suresh, B.N., B. S. V. Reddy, T.M. Prabhu, R.G. Gloridoss and B. Jagadish.
2006. Nutritional evaluation of sugarcane pressmud in lambs. Indian J. Anim. Nutri., 23(1): 47-49.
Swain, B.K., T.S. Joshi, A.K. Shrivastav and S. Majumdar, 1994. Indian J. Poult.
Sci., 29: 49. Swift, M.L., M.A.G. van Keyserlingk, A. Leslie and D. Teltge. 1996. The effect
of Allzyme Vegpro supplementation and expander processing on nutrient digestibility and growth of broilers. 12th Annual Symp. Biotech. in Feed Industry, Lexington, Kentucky, Supplement 1, enclosure code UL 2.1.
Talapatra, S.K., S.C. Roy and K.C. Sen. 1940. The analysis of mineral
constituents in biological materials. Part I: Estimation of phosphorus, chlorine, calcium, magnesium, sodium and potassium in feeding stuffs. Indian J. Vet. Sci. Anim. Husb.,10: 283-296.
Umashankar, B.C. 1998. Influence of different levels of ragi (Eleusine coracana)
grain varieties in layer diets on their performance. M.V.Sc. Thesis submitted to U.A.S., Bangalore.
Van Soest, P.J., J.B. Robertson and B.A. Lewis. 1991. Methods for dietary fiber,
neutral detergent fiber and non-starch polysaccharides in relation to animal nutrition. Symposium on Carbohydrate methodology, metabolism and nutritional implications in dairy cattle. J. Dairy Sci., 74: 3563-3597.
Varnish, S.A. and K. J. Carpenter. 1975. Mechanisms of heat damage in protein. The digestibility of individual amino acids in heated prolonylated proteins. Br. J. Nutr., 34: 339-349.
Wiseman, J., F. Salvador and J. Craigon. 1991. Prediction of apparent
metabolizable energy content of fats fed to broiler chickens. Poult. Sci., 70: 1527-1532.
Yadav, D.V., 1995. Recent trends in the utilization of pressmud cake in Indian
agriculture. In: Sugarcane Agro-Industrial Alternatives. Eds. Singh, G.B. and Solomon, S. pp: 371-386.
Yi, Z., E.T. Kornegay, V. Ravindran and D.M. Denbow. 1996. Improving
phosphorus availability in corn and soybean meal for broilers using microbial phytase and calculations of phosphorus equivalency values for phytase. Poult. Sci., 75: 386-390.
Young, R.J. and R.L. Garrett. 1963. Effect of oleic and linolenic acid on the
absorption of saturated fatty acids in the chicken. J. Nutr., 81: 321-329. Zablan, T.A., M. Griffith, M.C. Neshein, R.J. Young and M.L. Scott. 1963. ME
of some oilmeals and some unusual feedstuffs. Poult. Sci., 43(3): 619-625.
Zang Sumin, Guokia, Zhang Boaging and Li Tongzhou. 1996. Poult. Abstr.
22(3):107. Zatari, I.M. and J.L. Sell. 1990. Effect of pelleting diets containing sunflower
meal on the performance of broiler chickens. Anim. Feed Sci. Tech. 30:121-129.
Zhang, Y. and C.M. Parsons, 1994. Effects of over processing on the
nutritional quality of sunflower meal. Poult. Sci., 73:436-442.


Appendix-1: Mean sum of squares of ANOVA pertaining to metabolism trail of broilers Mean Sum of Squares
Source of Variation df Metabolizable
Energy Dry matter Organic
matter Crude fiber Ether
extarct Gross
energy
Ileal Nitrogen
digestibility
Treatments 15 106441.113 ** 42.104 ** 44.356 ** 45.750 * 12.394 ** 23.817 ** 78.116 * Biotech Tool 3 5453.322 0.667 0.617 102.785 11.150 * 3.522 45.520 SPR 3 523072.386 ** 203.483 ** 215.983 ** 47.291 * 24.383 * 114.670 ** 250.958 **
Metabolisability of experimental
diets Error 16 4974.509 2.371 1.951 6.064 5.175 3.034 23.895
Treatments 11 194343.878 138.147 96.778 1176.590 ** 1300.476 ** 115.622 3018.154 Biotech Tool 3 166721.522 168.270 109.726 1888.934 ** 1098.078 ** 66.528 4374.526 SPR 2 738512.521 * 355.963 227.028 1646.806 * 4308.174 ** 509.722 ** 6387.349 *
Metabolisability of SPR
Error 12 117434.627 173.021 143.225 245.231 138.092 72.643 444.436 I Week II Week Cumulative
Treatments 15 27309.513 ** 98012.897 ** 246471.790 ** Biotech Tool 3 5480.819 ** 17055.663 ** 7507.969 SPR 3 128775.694 ** 466990.080 ** 1215763.846 **
Body weight gain
Error 304 834.944 3714.664 6041.841 I Week II Week Cumulative I Week II Week Cumulative
Treatments 15 172.041 ** 4424.070 ** 6147.903 ** 0.309 ** 0.158 ** 0.192 ** Biotech Tool 3 107.390 908.359 1297.365 0.100 0.138 0.106 SPR 3 509.002 ** 19811.325 ** 27100.498 ** 1.309 ** 0.559 ** 0.767 **
Feed Consumption
Error 16 42.655 641.197 759.418
Feed Conversion
Ratio 0.054 0.043 0.037
*Significant at P<0.05 **Significant at P<0.01

Appendix-2: Mean sum of squares of ANOVA pertaining to metabolism trail of layers
Mean Sum of Squares
Source of variation df Dry matter
Organic matter
Crude protein
Ether extract
Crude fiber NFE
Gross energy ME
Treatments 15 68.4425 ** 64.8543 ** 147.8707 ** 166.5873 ** 99.6454 ** 41.7721 ** 147.8707 ** 135040.8452 ** Biotech Tool 3 0.1013 2.2103 95.5251 20.6905 ** 114.9255 11.4808 3.4829 10464.3296 SPR 3 329.0773 ** 305.9757 ** 469.3409 ** 751.2701 ** 190.0802 ** 176.1359 ** 258.1633 ** 662042.3528 **
Metabolisability of experimental
diets Error 32 6.4182 5.5255 29.6789 24.6129 41.0054 6.5897 5.9361 8044.3079
Dry matter Organic matter
Crude protein
Ether extract
Crude fiber NFE
Gross energy ME
Treatments 11 322.5627 264.9462 1573.5640 * 1573.5640 2151.6398 148.7703 ** 126.4219 38872.8254 Biotech Tool 3 606.6870 407.4054 3129.0146 * 3129.0146 1818.2980 160.3395 ** 312.8960 43395.4650 SPR 2 396.3936 553.4959 2111.6413 2111.6413 3289.7218 92.2921 ** 49.5259 104362.0585
Metabolisability of SPR
Error 24 217.0554 163.9291 1780.5288 1780.5288 1426.3581 403.0654 189.5293 255469.5135
Body weight change
Egg production
Feed consumption FCR
Egg weight
Treatments 15 8477.5255 ** 38.4572 ** 207.6011 ** 12.2069 * 0.2161 Biotech Tool 3 2250.0440 0.1566 46.4144 4.7720 0.0674 SPR 3 19280.8588 ** 182.0424 ** 933.6026 ** 35.6803 ** 0.8612 **
Production performance
Error 128 2202.4340 2.7615 74.8772 5.8021 0.1105 *Significant at P<0.05 **Significant at P<0.01

Appendix-3: Mean sum of squares of ANOVA pertaining to performance trail of broilers
Mean sum of squares
Source of Variation df I wk II wk III wk IV wk V wk VI wk Starter Grower Finisher Cumulative
Treatments 11 415.14 * 6305.21 ** 5290.58 * 20710.23 ** 37264.66 ** 179085.22 ** 9079.01 ** 34521.22 ** 223181.09 ** 398824.51 ** Biotech Tool 3 263.83 1615.73 5898.39 46773.82 ** 34820.79 ** 377058.17 ** 2827.40 73413.37 ** 253466.83 ** 253466.83 ** SPR 2 609.94 * 27910.42 ** 1242.30 15609.93 ** 110933.59 ** 187899.04 ** 35733.58 ** 26594.80 539634.74 ** 539634.74 **
Body weight gain
Error 348 189.79 790.59 2579.58 4919.30 8281.74 24491.16 1199.69 10067.81 34840.19 34840.19
Treatments 11 6.01 ** 847.51 ** 943.39 ** 1702.55 4334.38 5753.44 1013.21 ** 4250.44 15919.49 35162.18 Biotech Tool 3 6.71 ** 82.83 176.50 1871.57 4489.32 5961.30 140.08 1871.29 18550.43 24477.96 SPR 2 16.60 ** 3905.87 ** 2862.32 ** 4122.11 7919.39 * 15899.96 4628.38 ** 12968.79 ** 40255.13 103005.84 *
Feed consumption
Error 24 0.25 104.90 225.26 1549.76 2156.96 5749.84 135.67 2239.91 13036.86 24576.57
Treatments 11 0.02383 0.01526 0.00623 0.02144 0.05588 0.60808 0.01492 ** 0.00732 0.09274 * 0.01522 Biotech Tool 3 0.01150 0.00837 0.00668 0.04899 0.06079 * 1.06195 0.00512 0.01844 0.07856 0.00893 SPR 2 0.02633 0.03102 * 0.01518 0.00338 0.14331 0.75321 0.02746 ** 0.00460 0.26068 ** 0.05597
Feed conversion
ratio Error 24 0.02255 0.00710 0.00652 0.02217 0.03575 0.36189 0.00272 0.00817 0.03749 0.01122
*Significant at P<0.05 **Significant at P<0.01

Appendix-3: (Contd…) Mean sum of squares
Source of Variation df Dry matter
Organic matter
Ether extarct Crude protein
Treatments 11 11.03398 * 0.55361 ** 76.23650 ** 32.68185 *
Biotech Tool 3 5.92543 0.20405 173.14245 ** 43.94816
SPR 2 43.81025 ** 1.05072 ** 46.66016 62.33470 **
Metabolizability of various nutrients
Error 24 2.90794 0.13093 21.80568 6.82835 Ca-% Ca-g/day P-% P-g/day
Treatments 11 126.99037 ** 0.04183 ** 149.41626 ** 0.00843 **
Biotech Tool 3 171.40334 ** 0.01346 * 442.60816 ** 0.02269 **
SPR 2 294.13263 ** 0.19710 ** 1.67195 ** 0.00191 ** Balance of minerals
Error 24 28.88759 0.00407 30.53516 0.00163
Dressing
Percentage Meat to
bone ratio Abdominal fat g/bird Abdominal fat %
Treatments 11 12.53471 0.61408 171.92499 0.74784
Biotech Tool 3 22.93517 0.50216 22.70681 0.17549
SPR 2 7.09079 0.05591 455.69431 * 1.47470 *
Carcass charecteristics
Error 60 10.36204 0.34870 96.49250 0.46413
Liver Heart Gizzard Proventriculus
Treatments 11 0.40762 0.00778 0.14773 0.00785
Biotech Tool 3 0.27586 0.00744 0.07800 0.01605
SPR 2 0.92880 0.00421 0.33355 * 0.00310 Organometry
Error 60 0.31041 0.00802 0.09150 0.01164
Duodenum Jejunum Ileum Small Intestine
Treatments 11 0.07495 0.45266 * 0.34361 * 1.85276 *
Biotech Tool 3 0.05075 0.11357 0.30649 0.15217
SPR 2 0.01665 1.00825 * 0.61438 * 5.06177 **
Intestinal measurements
Error 60 0.11077 0.20731 0.14890 0.92099 Toe Ash Tibia Ash Tibia-Ca Tibia-P
Treatments 11 33.6592 ** 13.6044 39.3526 * 6.4711
Biotech Tool 3 85.5841 ** 13.1909 78.1890 * 2.0703
SPR 2 23.9083 ** 15.9362 22.7180 6.7436 Bone mineralization
Error 24 1.7973 10.5161 17.4447 6.4659 Calcium Phosphorus 21st day 42nd day 21st day 42nd day
Treatments 11 1.36067 1.34383 0.58862 0.94429
Biotech Tool 3 0.49688 0.67446 0.27880 1.04107
SPR 2 0.62550 1.85836 0.08920 0.92640
Blood mineral profile
Error 24 0.74281 2.08187 0.62400 0.48040 Net returns PIS EIS Livability
Treatments 11 13.7850 1979.3004 11.8794 14.8990
Biotech Tool 3 10.7943 1388.0955 8.1316 17.5926
SPR 2 35.4392 7088.0040 38.6291 36.1111 Economics
Error 24 11.4351 1020.6597 8.9026 11.1111 *Significant at P<0.05 **Significant at P<0.01
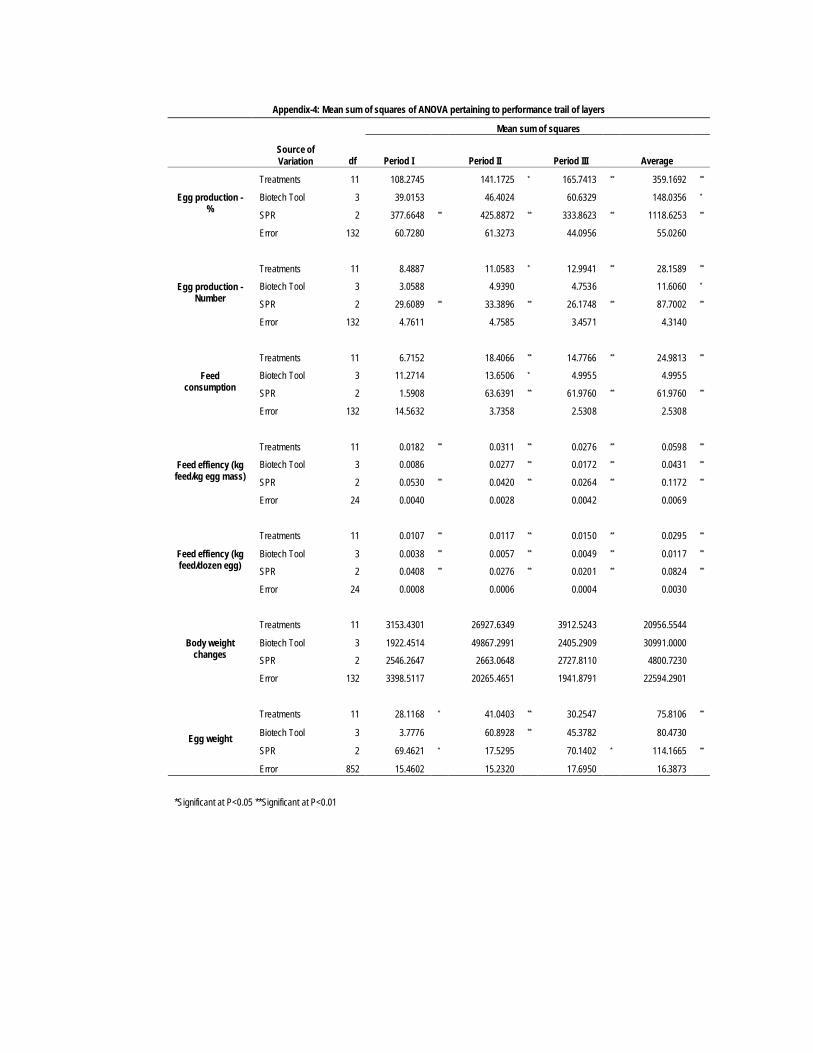
Appendix-4: Mean sum of squares of ANOVA pertaining to performance trail of layers
Mean sum of squares
Source of Variation df Period I Period II Period III Average
Treatments 11 108.2745 141.1725 * 165.7413 ** 359.1692 **
Biotech Tool 3 39.0153 46.4024 60.6329 148.0356 *
SPR 2 377.6648 ** 425.8872 ** 333.8623 ** 1118.6253 **
Egg production - %
Error 132 60.7280 61.3273 44.0956 55.0260
Treatments 11 8.4887 11.0583 * 12.9941 ** 28.1589 **
Biotech Tool 3 3.0588 4.9390 4.7536 11.6060 *
SPR 2 29.6089 ** 33.3896 ** 26.1748 ** 87.7002 **
Egg production - Number
Error 132 4.7611 4.7585 3.4571 4.3140
Treatments 11 6.7152 18.4066 ** 14.7766 ** 24.9813 **
Biotech Tool 3 11.2714 13.6506 * 4.9955 4.9955
SPR 2 1.5908 63.6391 ** 61.9760 ** 61.9760 **
Feed consumption
Error 132 14.5632 3.7358 2.5308 2.5308
Treatments 11 0.0182 ** 0.0311 ** 0.0276 ** 0.0598 **
Biotech Tool 3 0.0086 0.0277 ** 0.0172 ** 0.0431 **
SPR 2 0.0530 ** 0.0420 ** 0.0264 ** 0.1172 **
Feed effiency (kg feed/kg egg mass)
Error 24 0.0040 0.0028 0.0042 0.0069
Treatments 11 0.0107 ** 0.0117 ** 0.0150 ** 0.0295 **
Biotech Tool 3 0.0038 ** 0.0057 ** 0.0049 ** 0.0117 **
SPR 2 0.0408 ** 0.0276 ** 0.0201 ** 0.0824 **
Feed effiency (kg feed/dozen egg)
Error 24 0.0008 0.0006 0.0004 0.0030
Treatments 11 3153.4301 26927.6349 3912.5243 20956.5544
Biotech Tool 3 1922.4514 49867.2991 2405.2909 30991.0000
SPR 2 2546.2647 2663.0648 2727.8110 4800.7230
Body weight changes
Error 132 3398.5117 20265.4651 1941.8791 22594.2901
Treatments 11 28.1168 * 41.0403 ** 30.2547 75.8106 **
Biotech Tool 3 3.7776 60.8928 ** 45.3782 80.4730
SPR 2 69.4621 * 17.5295 70.1402 * 114.1665 ** Egg weight
Error 852 15.4602 15.2320 17.6950 16.3873
*Significant at P<0.05 **Significant at P<0.01

Appendix-4: (Contd…)
Mean sum of squares
Source of Variation df 1st day 28th
day 56th day 84th
day Average
Treatments 11 71.3936 33.5725 50.4896 14.7111 48.9149 Biotech Tool 3 66.5331 29.5761 20.0711 20.0711 68.9785 SPR 2 132.3835 15.4668 5.7396 5.7396 59.1443
Egg Shape Index
Error 132 71.2319 18.3189 10.1715 10.1715 34.1655
Treatments 11 0.3233 0.8672 0.3293 0.4499 0.5717 Biotech Tool 3 0.5961 0.6957 0.5373 0.1678 0.1597 SPR 2 0.2917 1.5831 0.3984 0.1273 0.6206
Albumen Index
Error 132 0.2467 0.6976 0.3463 0.5772 2.1174
Treatments 11 56.3383 24.5698 26.7459 68.7522 31.5145 Biotech Tool 3 48.4068 13.0392 48.2759 56.3725 9.5623 SPR 2 137.4325 76.7113 42.0073 5.8895 17.8884
Haugh Unit
Score Error 132 37.4346 25.2801 27.0899 54.7456 102.0727
Treatments 11 0.4132 0.8379 1.3016 0.2420 0.4976 Biotech Tool 3 0.6116 0.6311 0.9084 0.3145 0.0696 SPR 2 0.0751 1.0034 3.8025 0.0594 1.8510
Yolk Index
Error 132 0.3609 0.3809 0.4613 0.3354 0.5796
Treatments 11 6.2535 4.3824 3.2906 8.4226 5.9259 Biotech Tool 3 19.3176 7.9829 4.4789 9.4852 3.5509 SPR 2 1.7094 1.4681 1.6085 4.1503 1.4513
Yolk colour
Error 132 3.5373 2.6688 2.0302 4.1918 7.2898
Treatments 11 0.0007 0.0044 0.0025 0.0004 0.0017 Biotech Tool 3 0.0003 0.0108 ** 0.0076 ** 0.0006 0.0045 * SPR 2 0.0014 0.0050 ** 0.0008 0.0013 0.0013
Shell Thickness
Error 132 0.0008 0.0009 0.0008 0.0014 0.0012 *Significant at P<0.05 **Significant at P<0.01

Appendix-4: (Contd…)
Mean sum of squares Source of Variation df Period I Period II Period III Cumulative Treatments 11 1.637134 2.701403 2.772828 5.226421 Biotech Tool 3 1.054697 2.749795 1.990679 4.705951 SPR 2 2.875221 1.537721 0.815736 4.619664
Efficiency of Energy
Utilization
Error 24 0.522022 0.288119 0.481748 0.805892
Treatments 11 1.749607 2.906008 2.992263 5.614225 Biotech Tool 3 1.137961 2.966821 2.147183 5.077148 SPR 2 3.010559 1.612070 0.885718 4.852000
Efficiency of Protein
Utilization Error 24 0.563176 0.310910 0.519873 0.869462
Treatments 11 3.890146 4.308954 6.179917 11.398514 Biotech Tool 3 4.599068 5.345000 5.282166 14.339771 SPR 2 8.061498 4.202856 3.703284 13.904121
Net returns
Error 24 0.181810 0.105903 0.069227 1.040257 1st day 28th day 56th day 84th day
Treatments 11 0.286263 0.139394 0.087778 0.198552 Biotech Tool 3 0.037778 0.076296 0.081852 0.071235 SPR 2 1.338611 0.180833 0.101944 0.643426
Serum calcium profile
Error 24 0.766944 0.352778 0.405278 0.744884
Treatments 11 0.220505 0.161414 0.015429 0.154032 Biotech Tool 3 0.104074 0.138519 0.009907 0.069722 SPR 2 0.141944 0.474444 0.018611 0.241759
Serum phosphorus
profile Error 24 0.393056 0.255556 0.107500 1.087940
Dry matter
Organic matter
Treatments 11 6.114714 6.961792 Biotech Tool 3 10.622557 0.271819 SPR 2 10.068693 35.499863
Metabolizability of nutrients
Error 24 14.947522 1.291346
Ca-% of intake Ca-g/day
P-% of intake P-g/day
Treatments 11 3.682619 0.016333 7.791904 0.003151 Biotech Tool 3 5.248542 0.017947 21.514053 0.003554 SPR 2 8.416048 0.023832 1.463866 0.008563
Balance of minerals
Error 24 7.775245 0.024818 14.671091 0.001521 *Significant at P<0.05 **Significant at P<0.01


Table 2.1: Exclusive sources of minerals
Major mineral1 Trace mineral2
Source Ca % P %
Ava. P % Na % Source Element % Source Element %
Limestone 38.0 - - Cobalt oxide 71.0 Manganese oxide 77.0
Oyster shell 38.0 - - chloride 24.0 chloride 27.5
Calcium carbonate 40.0 - - sulphate 21.0 sulphate 32.5
Bone meal 26.0 13.0 carbonate 46.0 carbonate 47.0
Monocalcium PO4 17.0 23.0 98 0.10 Copper oxide3 79.0 Zinc oxide 78.0
Dicalcium PO4 25.0 18.0 97 0.02 chloride 37.0 chloride 48.0
Deflurinated rock PO4 32.0 18.0 95 5.50 sulphate 25.5 sulphate 36.0
Monosodium PO4 - 20.0 95 15.0 carbonate 55.0 carbonate 52.0
Disodium PO4 - 22.0 98 29.0 Iron oxide4 77.0 Selenium Sodium selenite 46.0
Meat and bone meal 11.0 6.0 90 0.60 chloride5 34.0 Sodium selenate 42.0
Fish meal (60%CP) 6.5 3.5 92 0.50 sulphate4 32.0 Iodine Potassium iodine 77.0
Common salt - - - 39.0 carbonate4 40.0 Calcium iodate 65.0
Sodium bicarbonate - - - 27.0 Magnesium oxide 56.0
carbonate 30.0 1Leeson and Summers (2002); zAmmerman et al. (1998) 3Cupric; 4Ferrous; 5Ferric

Table 2.2: Recommended nutrient specification for different classes of poultry by various agencies Broiler birds Laying hens
BIS (1992) NRC (1994) Hubbard manual BIS (1992) NRC (1994)1 BV-300 manual Nutrients Starter
0-5 wk Finisher 5-8 wks 0-3 wks 3- 6 wks 6-8
wks 0-10 days 11-25 days +26 days > 20wks 28-50 wks
ME, kcal/kg 2800 2900 3200 3200 3200 2900 3050 3100 2600 2500 2450 Crude protein, % 23 20 23 20 18 21-23 20-22 18-20 18 18 16 Crude fiber, % max 6 6 - - - - - - 8 - - Lysine, % 1.2 1.0 1.1 1.0 0.85 1.2 1.1 1.0 - 0.65 0.88 Methionine, % 0.50 0.35 0.50 0.38 0.32 0.52 0.49 0.47 0.65 0.30 0.34 Met+Cyst 0.90 0.70 0.90 0.72 0.60 0.90 0.86 0.84 0.30 0.55 0.62 Threonine, % - - 0.80 0.74 0.68 0.78 0.75 0.71 - 0.51 Trptophan, % - - 0.20 0.18 0.16 0.22 0.20 0.18 - 0.15 Linoleic acid, % 1 1 1 1 1 1 1 1 1 1 1.2 Calcium, % 1.2 1.2 1.00 0.90 0.80 1.03 0.97 0.87 3.00 3.25 3.80 Available P, % 0.5 0.5 0.45 0.35 0.30 0.50 0.45 0.40 0.50 0.40 0.42 Magnesium, ppm - - 600 600 600 - - - - - 900 Chlorine, % - - 0.20 0.15 0.12 0.17 0.17 0.17 - - 0.18 Sodium, % - - 0.20 0.15 0.12 0.17 0.18 0.17 - - 0.18 Potassium, % - - 0.30 0.30 0.30 0.80 0.80 0.75 - - - Copper, ppm 12 12 8 8 8 10 10 10 9 30 5 Iodine, ppm 1 1 0.35 0.35 0.35 1 1 1 1 0.6 0.30 Iron, ppm 120 120 80 80 80 60 60 60 75 60 20 Manganese, ppm 90 90 60 60 60 80 80 80 55 50 35 Selenium, ppm - - 0.12 0.15 0.15 0.2 0.2 0.2 - - 0.30 Zinc, ppm 60 60 40 40 40 80 80 80 75 60 35 1Assumes an average daily intake of 100g/hen Note: Under practical conditions, the level of requirement of various nutrients may vary quite widely.

Table 3.1: Ingredient and calculated nutrient composition of experimental diets used in metabolism trial of broilers Ingredients, Kg T1 T2 T3 T4 T5 T6 T7 T8 T9 T10 T11 T12 T13 T14 T15 T16
Basal mix1 100 100 100 100 90 90 90 90 80 80 80 80 70 70 70 70 Sugarcane press residue - - - - 10 10 10 10 20 20 20 20 30 30 30 30 Total 100 100 100 100 100 100 100 100 100 100 100 100 100 100 100 100 Di-calcium phosphate 2.05 2.05 2.05 2.05 2.05 2.05 2.05 2.05 2.05 2.05 2.05 2.05 2.05 2.05 2.05 2.05 Calcite powder 1.20 1.20 1.20 1.20 1.20 1.20 1.20 1.20 1.20 1.20 1.20 1.20 1.20 1.20 1.20 1.20 Salt 0.35 0.35 0.35 0.35 0.35 0.35 0.35 0.35 0.35 0.35 0.35 0.35 0.35 0.35 0.35 0.35 Trace mineral premix2 0.10 0.10 0.10 0.10 0.10 0.10 0.10 0.10 0.10 0.10 0.10 0.10 0.10 0.10 0.10 0.10 Vitamin and additive mix3 1.04 1.04 1.04 1.04 1.04 1.04 1.04 1.04 1.04 1.04 1.04 1.04 1.04 1.04 1.04 1.04 Chromic oxide 0.50 0.50 0.50 0.50 0.50 0.50 0.50 0.50 0.50 0.50 0.50 0.50 0.50 0.50 0.50 0.50 Lipid utilizing agents4 - 0.22 - 0.22 - 0.22 - 0.22 - 0.22 - 0.22 - 0.22 - 0.22 NSP degrading enzymes5 - - 0.40 0.40 - - 0.40 0.40 - - 0.40 0.40 - - 0.40 0.40
Calculated composition ME. Kcal/kg 2864 2692 2521 2349
CP, % 21.62 20.69 19.75 18.82 EE, % 3.25 3.91 4.57 5.23 CF, % 3.93 5.43 6.94 8.44 Ca, % 1.02 1.25 1.48 1.71 TP, % 0.79 0.86 0.94 1.01 Pav, % 0.53 0.55 0.58 0.60
1 Basal mix consisted of 61% maize, 38% soybean meal and 1% soya oil 2 Trace mineral premix contained Fe-90000, I-2000, Cu-15000, Mn-90000, Zn-80000 and Se-300ppm 3 Vitamin and additive mix contained vitamin premix 0.05kg (each 500g contained vit A–12.5MIU, vit D3-2.8MIU, vit E-30g, vit K-2g, vit B1-2g, vit B2-5g, vit B6-3g, vit B12-0.015g, niacin-40g, Cal-d-pantothenate-15g, folic acid-1g, biotin-0.08g, organic nutritive carrier-q.s.), Hepatocare 0.5kg, Tylosin phosphate 0.05kg, Curotox 0.05kg, Choline chloride 0.05kg, DL-methionine 0.195 kg and L-lysine 0.094kg 4 Lipid utilizing agents comprised of lipase-0.02kg (lipase - 500 units/g) and lecithin - 0.2kg 5 NSP degrading enzymes contained xylanase-2500, beta-glucanase–1000, cellulase–500 and pectinase–250 units/g

Table 3.2: Ingredient and calculated nutrient composition of experimental diets used in metabolism trial of layers Ingredients, Kg T1 T2 T3 T4 T5 T6 T7 T8 T9 T10 T11 T12 T13 T14 T15 T16
Basal mix1 100 100 100 100 90 90 90 90 80 80 80 80 70 70 70 70 Sugarcane press residue - - - - 10 10 10 10 20 20 20 20 30 30 30 30 Total 100 100 100 100 100 100 100 100 100 100 100 100 100 100 100 100 Shell grit 8.96 8.96 8.96 8.96 8.96 8.96 8.96 8.96 8.96 8.96 8.96 8.96 8.96 8.96 8.96 8.96 Mineral mixture2 3.92 3.92 3.92 3.92 3.92 3.92 3.92 3.92 3.92 3.92 3.92 3.92 3.92 3.92 3.92 3.92 Salt 0.39 0.39 0.39 0.39 0.39 0.39 0.39 0.39 0.39 0.39 0.39 0.39 0.39 0.39 0.39 0.39 Vitamin and additive mix3 0.28 0.28 0.28 0.28 0.28 0.28 0.28 0.28 0.28 0.28 0.28 0.28 0.28 0.28 0.28 0.28 Chromic oxide 0.56 0.56 0.56 0.56 0.56 0.56 0.56 0.56 0.56 0.56 0.56 0.56 0.56 0.56 0.56 0.56 Lipid utilizing agents4 - 0.22 - 0.22 - 0.22 - 0.22 - 0.22 - 0.22 - 0.22 - 0.22 NSP degrading enzymes5 - - 0.56 0.56 - - 0.56 0.56 - - 0.56 0.56 - - 0.56 0.56 Calculated composition
ME. Kcal/kg 2608 2454 2301 2147 CP, % 17.53 16.92 16.32 15.71 EE, % 2.36 3.04 3.73 4.41 CF, % 5.41 6.64 7.88 9.11 Ca, % 3.30 3.51 3.71 0.92 TP, % 0.56 0.63 0.69 0.76 Pav, % 0.31 0.33 0.35 0.38
1Basal mix consisted of 65% maize, 10% soybean meal, 15% groundnut extractions and 10% sunflower extractions 2Mineral mixture contained: Calcium -32, phosphorus – 6% and other trace elements 3Vitamin and additive mix contained AB2D3K -0.1 kg (each 500g contained vit A-12.5 MIU, vit D3-2.8 MIU, vit E-30g, vit K-2g), B-complex-0.2 kg (vit B1-2g, vit B2-5g, vit B6-3g, vit B12-0.015g, niacin-40g, Cal-d-panthothenate-15g, folic acid-1g, biotin-0.08g, organic nutritive Carrier- q.s.), lysine - 0.13kg, DL-methionine 0.07kg 4Lipid utilizing agents comprised of lipase-0.02kg (lipase - 500 units/g) and lecithin - 0.2kg 5NSP degrading enzymes contained xylanase-2500, beta-glucanase–1000, cellulase–500 and pectinase–250 units/g

Table 3.3: Ingredient composition of experimental diets compounded for different phases during performance trial of broilers Starter phase Grower phase Finisher phase Ingredients, Kg 0% SPR 5% SPR 10% SPR 0% SPR 5% SPR 10% SPR 0% SPR 5% SPR 10% SPR
Maize 528.5 513.4 494.6 554.5 523.0 484.0 621.0 584.0 536.0 Soybean meal 311.5 336.0 359.0 311.0 323.2 331.7 275.0 285.0 288.0 Sunflower extractions 112.0 55.0 2.0 78.0 46.0 23.0 44.3 18.4 7.9 Soya oil 10.0 15.0 21.1 18.0 27.0 38.0 21.6 32.4 45.6 Di-calcium phosphate 20.2 19.3 18.2 20.2 18.8 17 20 18 16 Calcite powder 14.5 8.3 2.2 14.5 8.5 2.8 14 8.5 2.8 Salt 3.5 3.5 3.5 3.5 3.5 3.5 3.5 3.5 3.5 Sugarcane press residue 0.0 50.0 100.0 0.0 50.0 100.0 0.0 50.0 100.0 FeSO4, g 274.0 0.0 0.0 274.0 0.0 0.0 274.0 0.0 0.0 ZnSO4, g 79.0 79.0 79.0 79.0 79.0 79.0 79.0 79.0 79.0 CuSO4, g 18.0 13.5 8.9 19.0 13.5 8.9 22.0 16.0 10.0 CoSO4, g 9.5 7.9 6.4 9.8 7.9 6.4 9.8 8.3 6.8 KI, g 3.4 3.4 3.4 3.4 3.4 3.4 3.4 3.4 3.4 Na2SeO3, g 0.6 0.6 0.6 0.6 0.6 0.6 0.6 0.6 0.6 MnSO4, g 220.0 190.0 159.0 223.0 191.0 158.0 223.0 191.0 158.0 DL-Methionine, g 2000 2010 2020 2000 2050 2100 1800 1940 2000 L-Lysine, g 1000 1000 1000 1000 950 900 1200 1100 1000 Additives1 + + + + + + + + +
TOTAL 1004.8 1004.8 1004.9 1004.3 1004.3 1004.3 1004.0 1004.1 1004.1 1Additives contained Brovit plus-0.5kg (each 500g contained vit A-12.5 MIU, vit D3-2.8 MIU, vit E-30g, vit K-2g, vit B1-2g, vit B2-5g, vit B6-3g, vit B12-0.015g, niacin-40g, Cal-d-panthothenate-15g, folic acid-1g, biotin-0.08g, organic nutritive carrier.-q.s), Tylosine phosphate-0.5kg; Hepatocare-1.0kg; Choline chloride-0.5kg; Curotox-0.5kg Note: Parallely, another set of 9 diets with SPR at 0, 5 and 10% were also prepared using either lipase and lecithin (three) or NSP degrading enzymes (three) or their combination (three).

Table 3.4: Calculated nutrient composition of experimental diets* compounded for different phases during performance trial of broilers Starter phase Grower phase Finisher phase Nutrients 0% SPR 5% SPR 10% SPR 0% SPR 5% SPR 10% SPR 0% SPR 5% SPR 10% SPR
Cost Rs/kg 10.47 10.18 9.91 10.81 10.56 10.34 10.89 10.70 10.50 ME kcal/kg 2822 2822 2822 2909 2910 2910 3000 3004 3004
CP, % 22.22 22.23 22.24 21.48 21.47 21.48 19.48 19.49 19.51 EE, % 3.19 3.88 4.67 4.02 5.06 6.27 4.54 5.73 7.14 LA, % 1.63 1.86 2.13 1.86 2.19 2.57 2.04 2.42 2.85 CF, % 6.12 5.59 5.13 5.36 5.30 5.41 4.44 4.49 4.84 Ca, % 1.16 1.16 1.16 1.15 1.14 1.15 1.10 1.10 1.10 TP, % 0.86 0.88 0.89 0.85 0.88 0.90 0.82 0.84 0.87
Pav, % 0.53 0.53 0.53 0.54 0.54 0.54 0.53 0.53 0.53 Na, % 0.15 0.15 0.15 0.15 0.15 0.15 0.15 0.15 0.14 Cl, % 0.26 0.26 0.26 0.26 0.26 0.26 0.26 0.26 0.26 K, % 1.08 1.09 1.10 1.06 1.06 1.06 0.96 0.97 0.96
Mg, % 0.21 0.25 0.29 0.20 0.24 0.29 0.17 0.22 0.28 S, % 0.24 0.36 0.49 0.23 0.36 0.48 0.22 0.34 0.46
Fe, ppm 120.08 277.30 486.72 117.67 275.57 485.85 113.21 271.43 482.05 I, ppm 2.01 2.01 2.01 2.01 2.01 2.01 2.01 2.01 2.01
Cu, ppm 25.53 25.55 25.59 25.10 25.16 25.54 25.25 25.24 25.40 Co, ppm 2.00 1.98 1.98 2.06 1.98 1.98 2.06 2.06 2.07 Mn, ppm 90.67 90.83 90.76 90.64 90.62 90.53 88.84 89.08 89.20 Zn, ppm 60.56 60.48 60.65 57.52 58.93 60.90 52.92 54.72 57.46 Se, ppm 0.32 0.32 0.32 0.32 0.32 0.32 0.32 0.32 0.31 Lys, % 1.20 1.20 1.21 1.09 1.10 1.10 1.00 1.00 1.00 Arg, % 1.41 1.36 1.31 1.34 1.31 1.28 1.20 1.16 1.14 Met, % 2.32 2.32 2.32 0.51 0.51 0.51 0.46 0.47 0.48 Cys, % 0.28 0.26 0.25 0.26 0.25 0.24 0.24 0.23 0.22
Met+Cyst, % 2.59 2.58 2.57 0.77 0.76 0.75 0.70 0.70 0.70 Try, % 0.29 0.29 0.28 0.28 0.27 0.27 0.25 0.24 0.24 Thr % 0.83 0.83 0.83 0.80 0.80 0.80 0.73 0.73 0.74
*Similar nutrient composition prevailed in rest of the each of the 3 types of the nine diets as the basic dietary variation was due to addition of biotechnological product

Table-3.5: Ingredient and nutrient composition of experimental diets compounded during performance trial of layers
A. Ingredient composition B. Calculated nutrient composition
Ingredients, kg 0 % SPR 5% SPR 10% SPR Nutrient 0 % SPR 5% SPR 10% SPR Maize 43.55 45.30 46.91 Cost(Rs/kg) 7.13 7.01 6.88 De-oiled rice bran 17.00 11.00 5.40 ME, kcal/kg 2433 2410 2386 Soybean meal 12.90 12.90 12.90 CP, % 17.57 17.41 17.22 Groundnut extractions 5.00 5.00 5.00 EE, % 1.97 2.48 3.00 Sunflower extractions 10.00 9.98 9.70 LA, % 1.08 1.29 1.50 Di-calcium phosphate 1.25 1.18 1.10 CF, % 7.18 7.06 6.93 Calcite powder 3.00 2.35 1.69 Ca, % 3.93 3.93 3.93 Shell grit 7.00 7.00 7.00 TP, % 0.80 0.76 0.73 Salt 0.30 0.30 0.30 Pav, % 0.35 0.35 0.35 SPR1 0.00 5.00 10.00 Na, % 0.15 0.15 0.14 FeSO4 0 0 0 Cl, % 0.23 0.22 0.21 ZnO 10 9.64 9.27 K, % 0.75 0.70 0.65 CuSO4 8 6.94 5.81 Mg, mg 0.28 0.31 0.33 CoSO4 0 0 0 S, % 0.17 0.29 0.41 KI 0.34 0.34 0.34 Fe, ppm 205.95 416.15 626.59 Na2SeO3 0.44 0.44 0.44 I, ppm 2.01 2.01 2.01 MnSO4 25 21.15 17.28 Cu, ppm 25.47 25.60 25.56 DL-methionine 49.8 50 50 Co, ppm 0.00 0.32 0.64 L-Lysine 20 21.3 22.4 Mn, ppm 89.68 89.63 89.57 Additives2 + + + Zn, ppm 93.94 93.76 93.60 Se, ppm 2.02 2.02 2.02 TOTAL 100.11 100.11 100.11 Met, % 0.27 0.27 0.27
Met+Cyst, % 0.50 0.50 0.50 Lys, % 0.73 0.71 0.70 Arg, % 1.24 1.21 1.18 C/P 138.46 138.45 138.55 Ca/Pav 11.22 11.23 11.22
Arg/Lys 1.71 1.70 1.69 1Sugarcane press residue 2Additives contained AB2D3K - 100g (each 500g contained vit A-12.5 MIU, vit D3-2.8 MIU, vit E-30g, vit K-2g), B-complex-200g (vit B1-2g, vit B2-5g, vit B6-3g, vit B12-0.015g, niacin-40g, Cal-d-panthothenate-15g, folic acid-1g, biotin-0.08g, Organic Nutritive Carrier.Q.S), Oxymycin-500g, toxin binder - 750g, choline chloride - 500g and hepatocaare-100g Note: Parallely, another set of 9 diets with SPR at 0, 5 and 10% were also prepared using either lipase and lecithin (three) or NSP degrading enzymes (three) or their combination (three).

Table 4.1: Per cent proximate composition of differentially dried SPR samples from different factories
Sugar factories1
Constituent A B C D E F
Bulk
SPR2 Mean ±SE
Fresh SPR
Moisture 77.28 76.95 82.31 76.53 77.67 86.46 - 79.61±3.64
Sun dried SPR
Dry matter 91.71 91.93 92.64 92.09 92.95 91.96 92.83 92.30±0.19
Organic matter 79.16 79.84 74.22 79.82 77.28 80.03 76.05 78.06±0.86
Total ash 20.84 20.16 25.78 20.18 22.72 19.97 23.95 21.94±0.86
Crude protein 9.18 11.81 11.01 14.11 11.54 12.87 11.80 11.76±0.58
Crude fiber 10.50 7.94 13.50 12.24 9.04 3.60 13.73 10.08±1.38
Ether extract 4.64 6.70 6.61 6.81 9.98 8.35 11.95 7.87±0.92
NFE 54.84 53.39 43.10 46.66 46.72 55.20 38.57 48.35±2.41
AIA 5.37 3.64 10.63 7.56 8.17 4.38 4.93 6.38±0.94
Oven dried SPR
Dry matter 94.23 94.05 92.63 92.99 93.52 91.18 - 93.10±0.46
Organic matter 82.09 84.70 76.07 81.09 80.30 82.28 - 81.09±1.17
Total ash 17.91 15.30 23.93 18.91 19.70 17.72 - 18.91±1.17
Crude protein 8.62 10.75 8.89 12.08 9.53 12.19 - 10.34±0.64
Crude fiber 10.34 9.38 11.41 10.42 8.52 4.28 - 9.06±1.04
Ether extract 4.50 6.35 6.51 6.80 9.00 8.30 - 6.91±0.65
NFE 58.64 58.21 49.26 51.79 53.25 57.51 - 54.78±1.59
Energy worth of sun-dried SPR
GE, kcal/kg 4310 4250 3962 4251 4019 3719 4068 4083±78.5
ME3, kcal/kg 2010 2167 1534 1666 2165 2165 2530 1980±130
1 Source of SPR: A- The Mysore Sugars Pvt. Ltd., Mandya B - Sri Chamundeshwari Sugars Ltd., K.M.Doddi C- SCM Sugars Ltd., Koppa D- Mysore Paper Mills Ltd., Bhadravathi

E- Davangere Sugar Company Ltd., Kukkawada, Davanagere
F- Bidar Sahakari Sakhare Karkhane, Hallikhed, 2 Sample procured for biological trials 3 Calculated values

Table 4.2: Fiber fractions (%) of sun-dried SPR samples from different factories
Sugar factories1 Constituent
A B C D E F
Bulk
SPR2 Mean ±SE
Cell contents 42.33 43.71 42.54 40.58 48.95 52.63 44.20 44.99±1.61
Neutral detergent fiber 57.67 56.29 57.46 59.42 51.05 47.37 55.80 55.01±1.61
Acid detergent fiber 30.43 23.94 30.15 33.70 33.28 20.92 29.42 28.84±1.79
Acid detergent lignin 11.59 7.66 12.72 17.78 15.05 5.93 11.13 11.69±1.54
Hemicellulose 27.23 32.36 27.30 25.72 17.77 26.45 26.38 26.17±1.63
Cellulose 18.84 16.28 17.43 15.92 18.23 14.99 18.29 17.14±0.54
1 Source of SPR: A- The Mysore Sugars Pvt. Ltd., Mandya; B - Sri Chamundeshwari Sugars Ltd., K.M.Doddi; C- SCM Sugars Ltd., Koppa; D- Mysore Paper Mills Ltd., Bhadravathi; E- Davangere Sugar Company Ltd., Kukkawada (Davanagere) and F- Bidar Sahakari Sakhare Karkhane,
Hallikhed, 2 Sample procured for biological trials

Table 4.3: Mineral constituents of sun-dried SPR samples from different factories
Sugar factories1 Constituent
A B C D E F
Bulk
SPR2 Mean ±SE
Major minerals, %
Calcium 2.80 4.40 3.90 4.20 3.60 3.30 4.90 3.87±0.27
Phosphorous 0.75 1.35 0.98 1.07 1.16 1.12 1.25 1.10±0.07
Magnesium 0.63 0.80 0.81 0.99 1.30 0.79 1.35 0.95±0.10
Trace minerals, ppm
Copper 39.0 140.0 55.0 37.0 48.0 53.0 58.5 61.5±13.43
Zinc 65.0 130.0 89.0 88.0 120.0 210.0 86.5 112.6±18.23
Iron 2100 3500 4100 4000 3700 2800 4300 3500±298.4
Manganese 320 250 330 290 310 230 260 284.3±14.46
Cobalt 3.50 9.70 1.80 4.30 3.30 6.30 6.40 5.0±1.00
1 Source of SPR: A- The Mysore Sugars Pvt. Ltd., Mandya; B - Sri Chamundeshwari Sugars Ltd., K.M.Doddi; C- SCM Sugars Ltd., Koppa; D- Mysore Paper Mills Ltd., Bhadravathi; E- Davangere Sugar Company Ltd., Kukkawada and F- Bidar Sahakari Sakhare Karkhane, Hallikhed,
2 Sample procured for biological trials

Table 4.4: Amino acid profile of SPR samples from different factories
Sugar factories MSL, Mandya MPML, Bhadravati BSSK, Hallikhed Average Maize1 De-oiled rice bran1 Constituent
% as is % of CP % as is % of CP % as is % of CP % of CP % as is % of CP % as is % of CP Crude Protein 11.33 - 12.38 - 9.43 - - 8.6 - 13.0 - Methionine 0.23 2.03 0.26 2.10 0.19 2.01 2.21 0.18 2.09 0.31 2.38 Cystine 0.11 0.97 0.11 0.89 0.10 1.06 1.05 0.19 2.21 0.28 2.15 Meth + Cyst. 0.34 3.00 0.37 2.99 0.29 3.08 3.27 0.37 4.30 0.59 4.54 Lysine 0.44 3.88 0.62 5.01 0.43 4.56 4.85 0.26 3.02 0.44 3.38 Threonine 0.59 5.21 0.62 5.01 0.47 4.98 5.48 0.31 3.60 0.43 3.31 Arginine 0.37 3.27 0.48 3.88 0.40 4.24 4.10 0.43 5.00 1.02 7.85 Isoleucine 0.50 4.41 0.53 4.28 0.43 4.56 4.77 0.28 3.26 0.51 3.92 Leucine 0.90 7.94 0.99 8.00 0.78 8.27 8.72 0.99 11.51 1.00 7.69 Valine 0.65 5.74 0.71 5.74 0.56 5.94 6.27 0.39 4.53 0.72 5.54 Histidine 0.25 2.21 0.29 2.34 0.21 2.23 2.44 0.26 3.02 0.37 2.85 Phenylalanine 0.51 4.50 0.55 4.44 0.44 4.67 4.90 0.45 5.23 0.67 5.15 Glycine 0.63 5.56 0.66 5.33 0.53 5.62 5.95 0.45 5.23 0.67 5.15 Serine 0.48 4.24 0.56 4.52 0.42 4.45 4.76 Proline 0.50 4.41 0.55 4.44 0.43 4.56 4.83 Alanine 0.66 5.83 0.73 5.90 0.58 6.15 6.44 Aspartic Acid 1.07 9.44 1.17 9.45 0.91 9.65 10.28 Glutamic Acid 1.33 11.74 1.42 11.47 1.07 11.35 12.45 Total (without NH3) 9.22 81.38 10.25 82.79 7.95 84.31 89.51 Ammonia 0.19 1.68 0.17 1.37 0.16 1.70 1.71 Total 9.41 83.05 10.42 84.17 8.11 86.00 91.22 Dry Matter 92.54 92.59 92.46 100.00 88.00 88.00 1Degussa Huls, 2001

Table 4.5: Fatty acid profile of SPR sample selected for biological trials
Constituent Formula % as is % of EE
Crude fat - 11.95 -
Caproic acid C5H11∙COOH 0.000 0.0
Caprylic acid C7H15∙COOH 0.024 0.2
Capric acid C9H19∙COOH 0.024 0.2
Lauric acid C11H23∙COOH 0.167 1.4
Myristic acid C13H27∙COOH 0.108 0.9
Palmitic acid C15H31∙COOH 3.621 30.3
Stearic acid C17H35∙COOH 0.490 4.1
Oleic acid C17H33∙COOH 2.055 17.2
Linoleic acid C17H31∙COOH 4.541 38.0
Linolenic acid C17H29∙COOH 0.645 5.4

Table 4.6: Proximate composition and gross energy of experimental diets used in metabolism trail of broilers
Dietary Description Proximate Composition (%)
SPR % Biotechnological Tool
Treatment
No. Dry
Matter
Total
Ash Crude Protein
Ether Extract
Crude Fiber NFE
Gross Energy Kcal/kg
No supplement T1 90.23 7.76 23.40 3.61 6.96 58.27 4247
Lipase+Lecithin T2 90.27 8.01 22.83 3.68 6.81 58.67 4243
NSPases T3 90.45 7.95 20.92 3.95 6.71 60.47 4218 0
Lipase+Lecithin+NSPases T4 90.34 8.28 22.14 4.02 6.12 59.44 4250
No supplement T5 91.21 9.54 22.18 4.13 8.56 55.59 4102
Lipase+Lecithin T6 91.20 9.70 21.93 3.78 8.57 56.02 4106
NSPases T7 90.70 10.00 19.63 3.99 8.64 57.74 4054 10
Lipase+Lecithin+NSPases T8 91.85 10.79 21.60 3.97 7.93 55.71 4052
No supplement T9 91.14 10.73 21.53 4.33 10.55 52.86 4079
Lipase+Lecithin T10 90.69 11.86 19.43 4.39 10.74 53.58 4032
NSPases T11 91.33 10.67 19.69 3.98 9.86 55.80 3977 20
Lipase+Lecithin+NSPases T12 91.04 11.05 20.29 4.64 10.05 53.97 39.34
No supplement T13 91.65 12.60 19.56 4.61 11.36 51.87 39.38
Lipase+Lecithin T14 91.13 12.84 18.34 4.18 11.25 53.39 3950
NSPases T15 91.71 12.95 18.92 4.62 11.14 52.37 3814 30
Lipase+Lecithin+NSPases T16 91.81 13.47 19.20 4.96 11.40 50.97 3875

Table 4.7: Metabolizability coefficient of various nutrients of experimental diets used in metabolism trial of broilers
Dietary Description Metabolizability Coefficients (%)
SPR % Biotechnological Tool
Tr.
No. DM OM EE CP GE
ME
Kcal/kg
Ileal Nitrogen Digestibility (%)
No supplement T1 69.88 0.29 ab 73.04 0.26 ab 66.31 0.36 a 54.50 1.17 a 77.63 6.23 a 3297 16.11 a 83.16 6.45 ab
Lipase+Lecithin T2 71.29 0.15 a 74.65 0.14 a 66.75 0.90 a 54.32 0.11 ab 77.25 6.21 a 3277 101.76 ab 78.11 6.28 bcd
NSPases T3 70.83 0.38 ab 74.23 0.34 ab 66.74 0.09 a 54.28 2.16 ab 78.11 6.25 a 3295 13.37 a 81.98 6.40 ab 0
Lipase+Lecithin+NSPases T4 70.34 1.80 ab 73.98 1.58 ab 65.30 2.05 ab 50.25 3.39 abc 77.70 6.23 a 3303 49.82 a 91.45 6.76 a
No supplement T5 66.27 2.72 bcde 69.21 2.49 bcde 61.27 0.08 bc 52.38 3.36 ab 75.54 6.15 abc 3098 24.52 c 69.66 5.90 cd
Lipase+Lecithin T6 66.41 1.36 abcd 69.92 1.22 abc 55.65 1.90 bcd 51.03 1.04 abc 74.08 6.09 abc 3042 39.94 bc 77.15 6.21 bcd
NSPases T7 65.80 0.40 abcd 69.09 0.36 abcd 58.31 0.38 bcd 45.55 0.13 d 75.92 6.16 ab 3077 22.40 abc 76.43 6.18 bcd 10
Lipase+Lecithin+NSPases T8 66.58 0.20 abc 70.10 0.18 abc 58.53 1.62 bcd 50.57 0.72 abc 75.30 6.14 ab 3051 20.32 bc 81.44 6.38 ab
No supplement T9 60.99 0.76 cdef 64.15 0.69 cdef 57.37 1.33 bcd 50.35 1.46 abcd 70.13 5.92 bc 2860 61.46 cd 80.56 6.35 b
Lipase+Lecithin T10 59.40 0.31 def 62.80 0.28 def 55.10 1.34 bcd 51.71 1.18 ab 68.90 5.87 c 2779 41.36 d 79.08 6.29 bc
NSPases T11 60.22 1.02 cdef 64.53 0.91 cdef 53.45 1.28 cd 46.51 0.81 cd 70.24 5.93 bc 2794 46.03 d 78.49 6.26 bcd 20
Lipase+Lecithin+NSPases T12 62.33 0.22 cdef 65.53 0.20 cdef 58.89 0.56 bc 49.59 0.45 bcd 70.63 5.94 bc 2779 44.73 d 81.66 6.39 ab
No supplement T13 60.20 1.42 cdef 63.16 1.32 cdef 56.73 1.05 bcd 50.39 0.30 abc 71.00 5.96 bc 2796 88.31 d 68.38 5.85 d
Lipase+Lecithin T14 58.67 0.93 ef 61.94 0.85 ef 53.04 1.66 d 51.49 1.12 ab 68.93 5.87 c 2723 34.07 d 75.82 6.16 bcd
NSPases T15 61.34 0.16 cdef 63.61 0.15 cdef 59.83 0.73 b 51.99 1.96 ab 70.31 5.93 bc 2682 65.35 d 68.86 5.87 cd 30
Lipase+Lecithin+NSPases T16 59.01 1.15 f 61.61 1.08 f 56.74 0.58 bcd 52.40 1.20 ab 70.85 5.95 c 2745 23.97 d 69.14 5.88 cd
SEM 1.540 1.540 1.650 2.275 1.742 70.530 4.888
CD 4.496 4.496 4.818 4.823 5.086 205.948 10.363
P-value1 <0.001 <0.001 <0.001 0.047 <0.001 <0.001 0.012
Effect of SPR
0% 70.59 0.33 a 73.98 0.31 a 66.28 0.4 a 53.34 0.85 a 77.67 0.43 a 3293 18.02 a 83.67 1.86 a
10% 66.26 0.48 b 69.58 0.45 b 58.44 0.7 b 49.88 0.97 b 75.21 0.3 b 3067 10.99 b 76.17 1.36 b

20% 60.73 0.39 c 64.25 0.35 c 56.20 0.7 bc 49.54 0.67 b 69.98 0.43 c 2803 18.37 c 79.94 0.99 ab
30% 59.80 0.45 c 62.58 0.39 c 56.59 0.8 c 51.57 0.46 ab 70.27 0.53 c 2736 22.15 d 70.55 1.80 c
SEM 0.770 0.770 0.8249 1.137 0.871 35.265 2.444
CD 1.986 1.986 2.128 2.229 2.247 90.984 6.306
P-value1 <0.001 <0.001 <0.001 0.015 <0.001 <0.001 <0.001
Effect of Biotechnological Tool
No supplement 64.34 1.61 67.39 1.60 60.42 1.5 a 51.90 0.97 73.58 1.29 3013 78.1 75.44 2.85
Lipase+Lecithin 63.94 1.99 67.33 2.00 57.63 2.1 b 52.14 0.61 72.29 1.45 2955 86.9 77.54 1.29
NSPases 64.55 1.60 67.86 1.61 59.58 1.8 a 49.58 1.50 73.65 1.37 2962 92.2 76.44 2.38
Lipase+Lecithin+NSPases 64.46 1.67 67.81 1.80 59.87 1.3 a 50.70 0.80 73.62 1.19 2969 86.6 80.92 3.14
SEM 0.770 0.770 0.8249 1.137 0.871 0.341 2.444
CD - - 1.617 - - - -
P-value1 0.838 0.814 0.021 0.133 0.355 0.379 0.169
1An effect with a probability of less than 0.05 is considered significant, a-fMeans with different superscripts in a column differ significantly

Table 4.8: Metabolizability coefficient of various nutrients of sun-dried SPR sample employed for metabolism trial of broilers
Dietary Description Metabolizability of Various Nutrients of SPR %
SPR % Biotechnological Tool
Tr.
No. DM OM CF EE GE
% Ileal N
Absorbability
ME
Kcal/kg
No supplement T1 33.71 27.24 34.70 24.87 33.30 33.56 a 15.85 0.76 abcd 56.68 5.98 -51.84 14.54 d 1307.9 245.2
Lipase+Lecithin T2 22.48 13.59 27.36 12.18 21.43 10.43 a -44.27 19.01 e 45.59 9.73 68.50 1.58 ab 924.1 399.4
NSPases T3 20.46 4.01 22.87 3.63 -33.07 1.31 b -17.56 3.83 de 56.16 5.53 26.52 10.85 abc 1122.8 224.0 10
Lipase+Lecithin+NSPases T4 32.71 2.05 35.18 1.83 53.45 7.15 a -2.37 16.15 cd 53.69 5.01 -8.68 18.89 cd 788.2 203.2
No supplement T5 25.43 3.78 28.59 3.47 33.79 7.31 a 21.61 6.67 abc 40.13 7.53 70.17 20.19 ab 112.8 307.3
Lipase+Lecithin T6 11.81 1.55 15.43 1.42 41.26 5.88 a 8.47 6.70 abcd 35.53 5.13 82.95 3.33 a 783.1 206.8
NSPases T7 17.77 5.09 25.72 4.54 15.42 4.03 a 0.27 6.42 bcd 38.76 5.79 64.51 15.79 ab 790.3 230.1 20
Lipase+Lecithin+NSPases T8 30.28 1.11 31.69 1.02 46.93 2.26 a 33.24 2.80 ab 42.34 5.68 42.48 14.69 ab 683.1 223.6
No supplement T9 37.60 4.74 40.11 4.39 40.80 1.01 a 34.36 3.52 ab 55.51 7.47 33.90 17.66 abc 1626.6 294.4
Lipase+Lecithin T10 29.22 3.08 32.29 2.84 44.87 3.73 a 21.03 5.52 abc 49.49 2.87 70.50 6.63 ab 1428.3 113.6
NSPases T11 39.19 0.54 38.81 0.51 46.65 6.55 a 43.72 2.44 a 52.12 5.71 38.26 24.72 abc 1252.2 217.8 30
Lipase+Lecithin+NSPases T12 32.56 3.84 32.74 3.60 57.42 4.01 a 36.78 1.92 a 54.86 2.06 17.08 11.29 bc 1444.6 79.9
MeanSE 27.77 2.55 30.46 2.25 33.52 5.36 a 12.59 5.38 48.40 1.97 37.86 8.35 1105.3 80.2
SEM 13.15 11.97 15.66 11.75 8.52 21.08 342.69
CD - - 47.919 35.959 - 64.510 -
P-value1 0.642 0.738 0.006 <0.001 0.218 0.001 0.200
Effect of SPR
10% 27.34 6.23 30.03 5.64 18.78 13.88 b -12.09 9.6 c 53.03 3.08 a 8.63 17.47 c 1035.7 129.1 ab

20% 21.32 2.95 25.36 2.57 34.35 4.91 a 15.90 5.25 b 39.19 2.49 b 65.03 7.88 a 842.3 111.0 b
30% 34.64 1.98 35.99 1.79 47.44 2.83 a 33.97 3.4 a 53.00 2.10 a 39.93 9.62 b 1437.9 89.4 a
SEM 6.577 5.984 7.830 5.876 4.262 10.541 171.344
CD - - 15.268 15.159 10.995 27.195 335.834
P-value1 0.171 0.245 0.011 <0.001 0.010 0.001 0.014
Effect of Biotechnological Tool
No supplement 32.24 7.55 34.47 6.91 35.96 9.00 a 23.94 3.97 a 50.77 4.61 17.41 24.20 b 1349.1 158.3 a
Lipase+Lecithin 21.17 4.84 25.02 4.54 35.85 5.63 a -4.92 13.8 b 43.54 3.94 73.98 3.46 a 1045.1 172.3 b
NSPases 25.81 4.58 29.14 3.45 9.66 14.81 b 8.81 11.7 ab 49.01 4.18 43.10 10.75 ab 1055.1 132.7 b
Lipase+Lecithin+NSPases 31.85 1.26 33.20 1.26 52.60 2.93 a 22.55 8.98 a 50.29 3.24 16.96 11.57 b 972.0 170.9 b
SEM 7.594 5.984 9.041 6.7846 4.921 12.171 197.851
CD - - 23.326 17.504 - 31.402 -
P-value1 0.438 0.535 0.004 0.003 0.462 0.001 0.285
1An effect with a probability of less than 0.05 is considered significant, a-d Means with different superscripts in a column differ significantly

Table 4.9: Performance of birds under different treatments during different weeks (2nd and 3rd week) of metabolism trail of broilers
Dietary Description Body Weight Gain (g/bird) Feed Consumption (g/bird) FCR (g feed/g weight gain) Livability
SPR % Biotech. Tool
Tr.
No. II Wk. III Wk. Cumulative II Wk. III Wk. Cumulative II Wk. III Wk. Cumulative %
No supplement T1 218.2a 367.1bc 629.6 a 333.7 a 583.9 abc 917.5abc 1.45cde 1.51cd 1.49 cd 100
Lipase+Lecithin T2 219.9a 384.1ab 604.0 a 322.5 ab 606.7 ab 929.2ab 1.32de 1.42d 1.38 d 100
NSPases T3 215.7b 421.5a 637.2 a 333.0 a 636.1 a 969.1a 1.39de 1.36d 1.37 d 100 0
Lipase+Lecithin+NSPases T4 191.9c 383.5ab 601.3 a 321.1 abc 589.0 abc 910.0abcd 1.27e 1.31d 1.29 d 100
No supplement T5 184.4cd 308.0de 492.4 bc 305.2 bc 554.6 bcd 859.8bcdef 1.49cde 1.62bcd 1.57 cd 100
Lipase+Lecithin T6 191.3c 329.3cd 520.5 b 308.4 bc 557.5 bcd 924.8ab 1.61cde 1.61bcd 1.61 cd 90
NSPases T7 193.4bc 336.4bcd 529.7 b 324.0 ab 578.6 abc 902.6abcd 1.51cde 1.55bcd 1.53 cd 100 10
Lipase+Lecithin+NSPases T8 178.4cd 335.2bcd 513.6 b 310.5 bc 581.1 abc 891.5abcd 1.48cde 1.47d 1.48 d 100
No supplement T9 153.6ef 253.9 fgh 407.4 d 313.2 bc 519.6 cde 832.8def 1.63cde 1.64bcd 1.64 cd 100
Lipase+Lecithin T10 161.4de 249.4ghi 410.8 d 319.9 abc 520.4 cde 840.3cdef 1.78bcde 1.88abcd 1.84 abcd 100
NSPases T11 152.7ef 289.0def 441.7 cd 313.1 bc 555.9 bcd 868.9bcde 1.85bcde 1.73abcd 1.77 bcd 100 20
Lipase+Lecithin+NSPases T12 141.8efg 273.8efg 415.6 d 308.1 bc 550.0 bcde 858.1bcdef 1.62cde 1.50cd 1.54 cd 100
No supplement T13 133.5 fgh 200.2 i 333.6 e 312.3 bc 490.7 de 803.0ef 1.99bcd 2.09abc 2.05 abc 100
Lipase+Lecithin T14 120.5ghi 206.8hi 327.3 e 317.5 abc 491.3 de 808.8ef 2.38ab 2.14ab 2.23 ab 100
NSPases T15 114.8hi 217.4hi 332.2 e 307.2 bc 477.5 e 784.7 f 2.68a 2.24a 2.38 a 100 30
Lipase+Lecithin+NSPases T16 109.6 i 224.1 jhi 333.7 e 303.2 c 486.7 de 789.8ef 2.10abc 1.62bcd 1.77 bcd 100
SEM 9.14 19.27 24.58 6.53 25.32 27.56 0.23 0.21 0.19 3.54
CD 23.6 49.73 63.42 19.07 73.94 80.47 0.68 0.60 0.56 -

P-value1 0.00 <0.001 <0.001 0.00 0.00 0.00 0.00 0.01 0.00 0.50
Effect of SPR
0% 211.4a 389.0a 618.0 a 328 a 603.9 a 931.4a 1.36c 1.40c 1.38 c 100
10% 186.8b 327.2b 514.0 b 312 b 567.9 b 894.7b 1.52bc 1.56bc 1.55 bc 97.5
20% 152.4c 266.5c 418.9 c 314 b 536.5 b 850.0c 1.72b 1.69b 1.70 b 100
30% 119.6d 212.1d 331.7 d 310 b 486.5 c 796.6c 2.29a 2.02a 2.11 a 100
SEM 4.57 9.64 12.29 3.27 12.66 13.78 0.12 0.10 0.10 1.77
CD 11.79 24.86 31.71 8.43 32.67 35.55 0.30 0.27 0.25 -
P-value1 <0.001 <0.001 <0.001 <0.001 <0.001 <0.001 0.00 0.00 0.00 0.42
Effect of Biotechnological Tool
No supplement 172.4a 282.3b 465.7 316 537.2 853.3 1.6 1.72 1.69 100
Lipase+Lecithin 173.3a 292.4ab 465.6 317 544.0 875.8 1.8 1.76 1.77 97.5
NSPases 169.1a 316.0a 485.2 319 562.0 881.3 1.9 1.72 1.76 100
Lipase+Lecithin+NSPases 155.4b 304.1ab 466.0 311 551.7 862.3 1.6 1.47 1.52 100
SEM 4.57 9.64 12.29 3.27 12.66 13.78 0.12 0.10 0.10 1.77
CD 11.79 24.86 - - - - - - - -
P-value1 <0.001 0.004 0.294 0.095 0.275 0.205 0.18 0.05 0.07 0.42
1An effect with a probability of less than 0.05 is considered significant, a-i Means with different superscripts in a column differ significantly

Table 4.10: Proximate composition and gross energy of experimental diets used in the metabolism trail of layers
Dietary Description Proximate Composition (%)
SPR % Biotech. Tool
Treatment
No. Dry
Matter
Total
Ash Crude
Protein Ether
Extract Crude Fiber NFE
Gross Energy Kcal/kg
No supplement T1 90.39 14.88 17.85 2.84 7.30 57.13 3812
Lipase+Lecithin T2 90.40 14.10 17.85 2.92 6.87 58.26 3780
NSPases T3 92.52 18.37 17.85 2.88 6.74 54.16 3769 0
Lipase+Lecithin+NSPases T4 91.76 13.07 17.85 2.74 6.39 59.95 3893
No supplement T5 90.63 16.82 17.71 3.16 7.86 54.45 3712
Lipase+Lecithin T6 90.77 17.10 17.71 3.44 8.13 53.62 3673
NSPases T7 92.53 15.73 17.71 3.46 8.19 54.91 3697 10
Lipase+Lecithin+NSPases T8 91.58 17.86 17.71 3.12 6.99 54.32 3728
No supplement T9 90.97 19.71 16.59 3.57 9.23 50.91 3686
Lipase+Lecithin T10 92.74 18.62 16.59 3.60 8.27 52.93 3625
NSPases T11 92.56 19.20 16.59 3.32 8.54 52.35 3594 20
Lipase+Lecithin+NSPases T12 91.89 21.49 16.59 3.04 8.16 50.72 3641
No supplement T13 90.98 19.79 15.98 3.87 9.39 50.97 3651
Lipase+Lecithin T14 92.82 22.92 15.98 3.80 9.56 47.74 3594
NSPases T15 93.07 21.13 15.98 4.22 9.08 49.59 3554 30
Lipase+Lecithin+NSPases T16 91.51 16.70 15.98 3.99 9.68 53.66 3604

Table 4.11: Metabolizability coefficient of various nutrients of experimental diets used in metabolism trail of layers
Dietary Description Metabolizability of various Nutrients (%)
SPR % Biotechnological Tool
Tr.
No. DM OM CP EE CF NFE GE ME (Kcal/kg)
No supplement T1 66.97 0.97 abc 72.47 0.82 abc 72.41 0.29 bcd 59.40 0.90 abc 19.62 3.60 abc 83.30 0.80 a 74.68 0.96 a 2846 36.56 ab
Lipase+Lecithin T2 69.79 0.82 a 74.53 0.41 a 84.43 0.87 a 64.91 2.46 a 23.26 3.25 ab 83.04 0.60 a 75.07 0.44 a 2838 16.60 ab
NSPases T3 67.12 1.14 abc 71.39 1.16 abc 73.26 0.33 abcd 62.87 2.01 ab 14.34 4.33 bcd 81.21 1.16 abc 75.00 0.82 a 2827 31.00 abc 0
Lipase+Lecithin+NSPases T4 67.92 0.71 ab 73.58 0.45 ab 71.60 1.82 bcde 62.97 0.83 ab 12.14 3.23 cd 83.38 0.17 a 74.04 2.32 a 2883 90.26 a
No supplement T5 63.68 0.81 bcde 68.69 0.54 bcde 72.15 2.72 bcd 56.37 1.67 abcde 17.02 1.09 abcd 79.95 1.00 abcd 71.28 1.38 abc 2646 51.31 cd
Lipase+Lecithin T6 63.25 0.53 bcde 68.92 0.55 bcd 78.08 0.53 ab 57.09 2.67 abcde 22.78 3.81 ab 79.23 1.47 abcde 71.73 0.70 ab 2634 25.55 de
NSPases T7 62.22 0.54 cdef 68.16 0.31 cdef 73.97 1.85 abc 58.51 5.27 abcd 16.53 1.00 abcd 78.61 1.76 abcdef 70.92 1.09 abc 2622 40.36 de 10
Lipase+Lecithin+NSPases T8 64.14 1.87 bcd 69.10 0.97 bc 71.48 3.56 bcde 53.65 5.08 bcdef 12.49 4.72 cd 81.28 2.15 abc 72.14 1.03 ab 2689 38.49 bcd
No supplement T9 58.37 1.79 efg 63.81 1.32 efg 69.92 3.10 bcdef 49.39 1.02 cdefg 23.59 3.22 ab 75.38 1.16 defg 66.43 1.28 cdef 2449 47.02 efg
Lipase+Lecithin T10 57.46 0.48 fg 63.73 0.64 fg 60.16 5.64 ef 45.25 2.23 fg 12.43 0.78 cd 77.78 1.09 bcdef 67.73 0.99 bcde 2455 35.75 efg
NSPases T11 59.62 1.90 defg 63.41 3.54 fg 68.50 4.76 bcdef 49.95 1.70 cdefg 20.77 3.97 abc 74.31 4.17 fg 68.27 1.33 bcde 2454 47.75 efg 20
Lipase+Lecithin+NSPases T12 56.76 0.73 g 61.48 0.67 g 62.56 3.62 cdef 41.78 1.43 g 8.02 1.32 d 76.46 0.62 cdef 68.82 0.92 bcd 2506 33.52 def
No supplement T13 57.07 2.86 fg 63.09 1.79 g 59.40 4.29 f 47.37 2.50 efg 26.76 4.41 a 74.98 0.98 defg 63.19 1.77 ef 2307 64.46 gh
Lipase+Lecithin T14 55.52 0.93 g 60.22 1.16 g 69.67 2.59 bcdef 48.07 1.60 defg 24.71 4.82 a 70.64 0.56 g 62.40 1.46 f 2243 52.58 h
NSPases T15 56.32 2.87 g 61.57 2.22 g 62.41 4.39 def 44.09 4.53 fg 21.07 6.74 abc 74.55 0.57 efg 64.84 2.37 def 2304 84.16 gh 30
Lipase+Lecithin+NSPases T16 56.90 1.11 fg 64.08 0.92 defg 59.67 2.39 f 45.87 3.99 fg 26.70 3.25 a 76.57 0.13 cdef 65.42 1.94 def 2358 69.94 efg
SEM 2.07 1.919 4.448 4.051 5.228 2.096 1.989 73.23
CD 5.34 4.95 11.48 10.45 10.25 5.41 5.13 188.94

P-value1 0.00 <0.001 <0.001 <0.001 0.017 <0.001 <0.001 0.00
Effect of SPR
0% 67.95 0.52 a 72.99 0.48 a 73.98 0.31 a 75.53 1.52 a 17.34 2.03 b 82.73 0.42 a 74.69 0.58 c 2848 22.96 a
10% 63.32 0.51 b 65.25 0.90 b 68.66 0.85 b 51.77 1.6 b 17.20 1.73 b 79.77 0.76 b 77.67 1.12 b 2648 18.69 b
20% 58.05 0.67 c 60.73 0.39 c 64.25 0.35 c 49.74 1.9 b 16.20 2.20 b 75.98 1.04 c 80.97 1.01 a 2466 19.04 c
30% 56.45 0.94 c 59.21 0.81 c 62.02 0.76 c 41.09 3.74 c 24.81 2.23 a 74.19 0.71 c 72.58 1.57 c 2303 31.78 d
SEM 1.03 0.960 1.207 1.864 2.614 1.048 0.995 36.62
CD 2.67 2.48 3.11 4.81 6.74 2.70 2.57 94.47
P-value1 0.00 <0.001 <0.001 <0.001 0.008 <0.001 <0.001 0.00
Effect of Biotechnological Tool
No supplement 61.52 1.43 67.01 1.26 66.90 1.71 55.02 4.33 a 21.75 1.80 78.40 1.12 68.89 1.45 2562 65.06
Lipase+Lecithin 61.50 1.71 63.94 1.99 67.33 2.00 49.37 8.11 b 20.79 2.10 77.67 1.42 78.43 1.22 2542 67.92
NSPases 61.32 1.42 64.07 1.60 67.44 1.60 56.23 4.54 a 18.18 2.10 77.17 1.33 78.33 2.19 2552 63.08
Lipase+Lecithin+NSPases 61.43 1.53 63.97 2.07 67.25 2.17 57.51 4.03 a 14.84 2.57 79.42 1.02 81.72 2.74 2609 65.06
SEM 1.03 0.960 1.207 1.864 2.614 2.599 0.995 36.62
CD - - - 4.81 - - - -
P-value1 1.00 0.754 0.964 0.002 0.056 0.178 0.628 0.29
1An effect with a probability of less than 0.05 is considered significant, a-g Means with different superscripts in a column differ significantly

Table 4.12: Metabolizability coefficients of various nutrients of sun-dried SPR as determined by difference method in metabolism trail layers
Dietary Description Metabolizability Coefficient of Various Nutrients of SPR (%)
SPR % Biotech. Tool
Tr.
No. DM OM CP EE CF NFE GE
ME of SPR
Kcal/kg
No supplement T1 34.03 8.07 34.66 5.40 69.79 27.20ab 29.07 16.73 -6.46 10.94 49.76 10.03d 40.68 13.82 845 513
Lipase+Lecithin T2 4.36 5.29 18.38 5.45 20.91 5.34b -13.28 26.67 18.46 38.07 44.98 14.67def 41.67 6.96 803 256
NSPases T3 18.10 5.41 39.08 3.09 80.34 18.54a 19.26 52.71 36.27 9.96 55.21 17.56c 34.23 10.92 780 404 10
Lipase+Lecithin+NSPases T4 30.18 18.73 28.72 9.70 70.36 35.62ab -30.23 50.75 15.56 47.23 62.39 21.52a 55.12 10.33 950 385
No supplement T5 23.97 8.97 29.21 6.58 59.93 15.51ab 9.38 5.10 39.46 16.11 43.68 5.78ef 33.47 6.38 859 235
Lipase+Lecithin T6 8.12 2.38 .20.50 3.20 -36.92 28.21c -33.40 11.15 -30.90 3.89 56.73 5.43bc 38.38 4.93 925 179
NSPases T7 29.64 9.48 31.47 17.71 49.47 23.82ab -10.74 8.48 46.52 19.83 46.69 20.86def 41.97 6.64 953 238 20
Lipase+Lecithin+NSPases T8 12.12 3.66 13.05 3.36 26.37 18.11ab -42.96 7.15 -8.47 6.58 48.77 3.08de 47.97 4.60 1000 168
No supplement T9 33.97 9.54 41.20 595 29.05 14.29ab 19.30 8.35 43.42 14.69 55.58 3.25bc 36.39 5.88 1058 215
Lipase+Lecithin T10 22.21 3.11 26.82 3.88 35.25 8.62ab 8.77 5.33 28.10 16.05 41.72 1.85 f 32.84 4.88 855 175
NSPases T11 31.13 9.57 38.64 7.41 37.11 14.63ab 0.27 15.12 36.78 22.47 59.00 1.91abc 41.16 7.89 1086 281 30
Lipase+Lecithin+NSPases T12 31.19 3.69 41.89 3.01 31.84 9.78ab 5.67 13.30 60.66 10.84 60.67 0.43ab 45.31 6.47 1133 233
MeanSE 23.25 2.64 30.30 2.33 39.46 6.97 -2.46 6.90 23..28 6.78 52.10 3.00 40.72 2.17 937 72
SEM 12.03 10.454 28.582 34.453 30.837 2.096 16.362 412.69
CD - 56.02 - - 5.41 - - -
P-value1 0.20 0157 0.038 0.568 0.193 <0.001 0.956 1.00
Effect of SPR
10% 21.67 5.81 30.21 3.59 60.35 12.53 1.21 18.46 15.96 14.08 53.06 7.30 42.92 5.14 845 172
20% 18.46 3.93 23.59 4.70 24.71 14.71 -17.18 7.41 11.65 11.31 48.97 5.02 40.30 2.90 937 90

30% 29.63 3.34 37.14 2.93 33.31 5.26 8.58 5.22 42.24 7.92 54.24 2.42 38.93 3.07 1031 103
SEM 6.01 5.227 14.291 17.227 15.418 1.048 8.196 206.34
CD - - - - - 2.704 - -
P-value1 0.18 0.051 0.051 0.323 0.121 <0.001 0.797 0.67
Effect of Biotechnological Tool
No supplement 30.66 4.74 35.02 3.46 52.92 11.68 19.25 6.28 25.47 10.66 49.67 3.87b 36.85 4.83 918 177
Lipase+Lecithin 11.56 3.32 21.90 2.49 6.41 14.02 -12.64 10.44 5.22 15.07 47.81 5.09b 37.63 3.11 861 105
NSPases 26.29 4.67 36.40 5.75 55.64 11.62 5.93 16.36 39.86 9.27 53.63 8.10ab 38.92 4.49 943 164
Lipase+Lecithin+NSPases 24.50 6.41 27.89 5.19 42.86 13.75 -22.40 16.95 22.58 17.37 57.28 6.63a 49.47 4.04 1028 141
SEM 6.95 6.036 16.502 19.892 17.804 2.599 9.464 238.27
CD - - 32.344 - - 6.705 - -
P-value1 0.06 0.085 0.024 0.182 0.305 <0.001 0.756 0.92
1An effect with a probability of less than 0.05 is considered significant, a-f Means with different superscripts in a column differ significantly


Table 4.13: Performance of birds under different treatments during 14-day metabolism period of layers
Dietary Description
SPR % Biotechnological Tool
Tr.
No.
Body wt.
change g/bird
Egg
Production
Feed
Consumption
g/day/bird
Egg Weight
g
FCR
g feed/g
egg mass
No supplement T1 113.22 41.4a 92.86 2.38a 117.5 0.96a 56.80 1.68abc 2.231 0.13
Lipase+Lecithin T2 60.11 21.4abc 93.65 3.64a 116.6 1.53ab 59.00 0.39a 2.113 0.09
NSPases T3 33.22 24.7bcd 92.86 2.38a 117.1 1.07a 57.24 0.32abc 2.204 0.05 0
Lipase+Lecithin+NSPases T4 42.78 25.4bc 88.89 9.01ab 117.4 0.80a 58.52 2.91a 2.269 0.12
No supplement T5 73.33 35.3ab 91.27 1.37a 117.7 0.61a 55.83 1.87abc 2.310 0.04
Lipase+Lecithin T6 55.78 77.2bc 87.30 2.75abc 116.9 1.26ab 57.93 2.69ab 2.316 0.11
NSPases T7 66.78 62.8ab 89.68 15.85a 117.7 2.22a 54.35 1.81bcd 2.477 0.52 10
Lipase+Lecithin+NSPases T8 33.11 41.5bcd 84.92 13.95abcd 116.6 1.67ab 54.24 2.68bcd 2.598 0.58
No supplement T9 55.67 48.8bc 84.92 10.74abcd 115.3 1.07ab 55.82 1.49abc 2.454 0.25
Lipase+Lecithin T10 76.00 37.0ab 80.95 16.67abcd 114.6 0.79ab 55.27 3.77abcd 2.660 0.68
NSPases T11 68.89 50.5ab 84.92 3.64abcd 114.3 1.01bc 57.56 0.89ab 2.343 0.12 20
Lipase+Lecithin+NSPases T12 73.89 45.0ab 79.37 11.25abcd 113.8 0.33bc 54.43 1.71bcd 2.683 0.50
No supplement T13 5.33 48.8cd 68.25 3.64d 106.9 3.94e 53.67 1.26cd 2.926 0.23
Lipase+Lecithin T14 -19.33 61.4d 76.98 5.50abcd 109.6 1.08de 54.30 2.1bcd 2.629 0.08
NSPases T15 39.56 54.3bc 72.22 4.96bcd 108.6 2.91de 51.44 5.11d 2.958 0.46 30
Lipase+Lecithin+NSPases T16 44.00 38.9bc 69.84 5.99cd 110.6 1.20de 55.28 2.8abcd 2.879 0.20
SEM 22.12306 7.065 1.357 1.967 0.271
CD 57.08 18.23 3.50 3.89 -
P-value1 <0.001 0.008 <0.001 0.038 0.055
Effect of SPR
0% 62.33 7.00a 92.06 0.80a 117.159 0.17a 57.89 0.29 2.205 0.02
10% 57.25 9.40a 88.29 1.57a 117.206 0.24a 55.59 0.42 2.425 0.06
20% 68.61 7.39a 82.54 1.69b 114.496 0.15bc 55.77 0.38 2.535 0.07
30% 17.39 9.31b 71.83 0.92c 108.921 0.44c 53.67 0.51 2.848 0.05
SEM 11.06153 2.040 0.392 0.568 0.078
CD 28.54 5.26 1.01 1.46 0.20
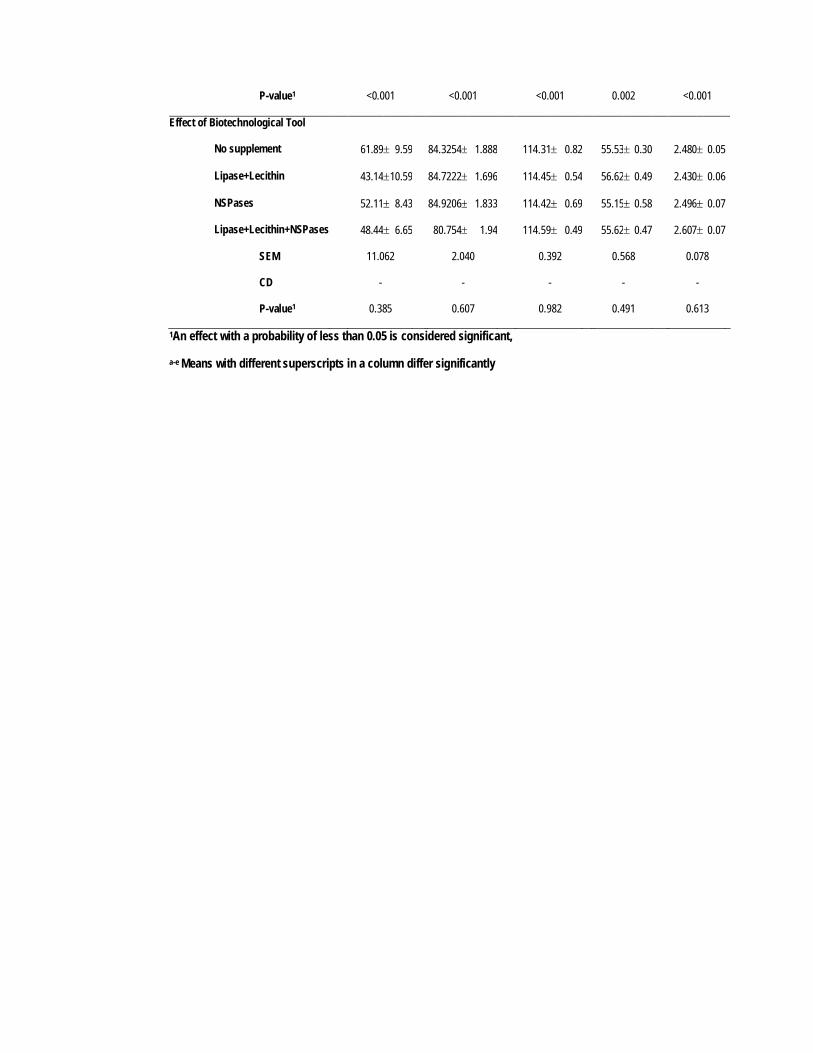
P-value1 <0.001 <0.001 <0.001 0.002 <0.001
Effect of Biotechnological Tool
No supplement 61.89 9.59 84.3254 1.888 114.31 0.82 55.53 0.30 2.480 0.05
Lipase+Lecithin 43.1410.59 84.7222 1.696 114.45 0.54 56.62 0.49 2.430 0.06
NSPases 52.11 8.43 84.9206 1.833 114.42 0.69 55.15 0.58 2.496 0.07
Lipase+Lecithin+NSPases 48.44 6.65 80.754 1.94 114.59 0.49 55.62 0.47 2.607 0.07
SEM 11.062 2.040 0.392 0.568 0.078
CD - - - - -
P-value1 0.385 0.607 0.982 0.491 0.613
1An effect with a probability of less than 0.05 is considered significant,
a-e Means with different superscripts in a column differ significantly


Table 4.14: Analyzed chemical composition of experimental diets compounded for different phases during performance trial of broilers
Starter diets Grower diets Finisher diets Constituents,
% 0% SPR 5% SPR 10% SPR 0% SPR 5% SPR 10% SPR 0% SPR 5% SPR 10% SPR
Dry matter 91.03 91.79 91.96 92.23 91.50 91.53 90.10 91.55 91.22
Total ash 7.74 6.84 7.39 7.05 7.00 7.19 7.40 7.27 7.52
Crude protein 22.67 21.86 21.25 21.44 20.95 20.93 19.80 19.54 19.47
Ether extract 3.16 3.87 4.77 4.85 5.39 6.04 4.62 6.03 6.42
Crude fiber 6.25 5.98 5.65 6.12 5.81 5.85 5.50 5.64 5.93
NFE 60.18 61.45 60.94 60.54 60.84 59.99 62.68 61.52 60.66
Calcium 1.13 1.44 1.19 1.11 1.41 1.31 1.61 1.76 1.64
Phosphorus 1.06 1.18 0.85 0.90 0.87 0.89 0.91 0.84 0.77
ME1, Kcal/kg 2822 2822 2822 2909 2910 2910 3000 3004 3004 1Calulated values

Table 4.15: Weekly average body weight gains of birds as influenced by different treatments and main factors during performance trial of broilers
Dietary Description Body Weight Gain (g/bird)
SPR % Biotechnological Tool
Tr.
No. I Wk. II Wk. III Wk. IV Wk. V Wk. VI Wk.
No supplement T1 69.8 2.0 a 226.3 4.8 a 372.9 8.7 ab 457.5 13.6 a 511.8 18.4 ab 285.3 8.7 e
Lipase+Lecithin T2 65.0 1.9 abc 207.3 5.3 b 357.1 14.1 abcd 431.2 18.2 abcd 516.7 17.2 ab 503.6 41.1 a
NSPases T3 67.1 2.4 ab 209.9 4.5 ab 336.2 6.4 d 410.5 12.9 bcde 501.7 16.3 ab 432.8 16.1 abc 0
Lipase+Lecithin+NSPases T4 69.4 2.1 a 209.1 4.8 ab 382.4 8.7 a 438.1 12.3 abc 481.7 12.3 bc 471.8 33.1 ab
No supplement T5 61.3 1.9 bc 202.1 5.7 b 365.2 8.4 abc 434.6 9.5 abc 544.5 14.5 a 285.4 37.6 e
Lipase+Lecithin T6 58.8 2.2 c 199.8 5.1 bcd 349.2 10.2 bcd 421.8 9.3 abcde 464.2 14.0 bcd 412.7 26.9 bcd
NSPases T7 67.6 4.4 ab 196.5 6.6 bcd 359.4 8.5 abcd 382.7 11.2 de 485.3 15.1 abc 337.9 25.4 cde 5
Lipase+Lecithin+NSPases T8 70.5 3.5 a 210.7 5.7 ab 373.9 9.4 ab 455.6 19.4 ab 478.6 23.3 bc 482.7 13.6 ab
No supplement T9 63.5 2.0 abc 188.7 4.2 bcde 346.9 7.5 cd 401.1 8.9 cde 467.9 13.5 bcd 324.2 23.7 de
Lipase+Lecithin T10 65.5 2.3 abc 181.4 5.1 de 352.0 8.3 bcd 442.4 8.9 abc 464.9 14.1 bcd 389.5 16.1 bcde
NSPases T11 63.7 1.9 abc 186.8 4.3 cde 370.5 10.4 abc 375.5 12.4 e 417.3 18.9 d 324.4 20.5 de 10
Lipase+Lecithin+NSPases T12 61.3 2.1 bc 175.3 4.9 e 356.5 8.6 abcd 427.1 12.1 abcd 434.2 18.6 cd 339.6 49.7 cde
MeanSE 65.3 0.7 199.5 1.6 360.2 2.7 423.2 3.9 480.7 5.0 382.5 9.0
SEM 3.6 7.3 13.1 18.1 23.5 40.4

CD 7.0 18.7 25.7 46.7 60.6 104.3
P-value1 0.015 <0.001 0.023 <0.001 <0.001 <0.001
Effect of SPR
0% 67.8 2.1 a 213.2 5.0 a 362.2 10.2 434.3 14.6 a 503.0 16.2 a 423.4 49.9 a
5% 64.6 3.3 ab 202.3 5.8 b 361.9 9.2 423.7 13.7 b 493.1 17.8 b 379.7 47.7 b
10% 63.5 2.1 b 183.0 4.7 a 356.5 8.8 411.5 11.5 b 446.1 16.7 c 344.4 48.2 b
SEM 1.8 3.6 6.6 9.1 11.7 20.2
CD 3.5 9.4 - 17.7 30.3 52.1
P-value1 0.041 <0.001 0.618 0.043 <0.001 0.001
Effect of Biotechnological Tool
No supplement 64.9 2.1 205.7 5.7 361.7 8.4 431.1 11.5 a 508.0 16.5 a 298.3 47.6 c
Lipase+Lecithin 63.1 2.2 196.2 5.5 352.8 11.0 431.8 12.8 a 482.0 15.7 ab 435.3 56.3 a
NSPases 66.1 3.1 197.7 5.5 355.4 8.9 389.6 12.4 b 468.1 17.9 b 365.0 41.2 b
Lipase+Lecithin+NSPases 67.1 2.8 198.4 5.9 371.0 9.0 440.3 15.0 a 464.8 18.9 b 431.4 67.4 a
SEM 2.1 4.2 7.6 10.5 13.6 23.3
CD - - - 27.0 35.0 60.2
P-value1 0.246 0.107 0.078 <0.001 0.006 <0.001
1An effect with a probability of less than 0.05 is considered significant, a-e Means with different superscripts in a column differ significantly

Table 4.16: Phase wise and cumulative average body weight gains of birds as influenced by different treatments and main factors during performance trial of broilers
Dietary Description Body Weight Gain (g/bird)
SPR % Biotechnological Tool
Tr.
No. Starter Phase Grower Phase Finisher Phase Cumulative
Livability
%
No supplement T1 296.1 5.9 a 830.4 20.3 a 797.1 22.6 def 1923.6 39.5 abc 100.00 0.00
Lipase+Lecithin T2 272.4 6.4 bc 788.3 20.1 ab 1020.3 45.5 a 2081.0 58.0 a 100.00 0.00
NSPases T3 277.0 6.3 bc 746.7 17.3 b 917.9 28.8 abcd 1941.5 43.0 abc 100.00 0.00 0
Lipase+Lecithin+NSPases T4 278.5 6.4 bc 820.5 20.1 a 953.5 35.3 abc 2052.5 49.7 a 100.00 0.00
No supplement T5 263.4 6.5 cde 799.8 16.4 ab 829.9 38.7 cdef 1893.3 49.3 bcd 96.67 3.33
Lipase+Lecithin T6 251.9 9.1 def 771.0 16.6 ab 877.0 33.5 bcde 1899.9 49.7 bcd 100.00 0.00
NSPases T7 264.9 5.4 cd 734.7 16.8 b 823.1 32.9 def 1822.3 46.6 cd 96.67 3.33 5
Lipase+Lecithin+NSPases T8 282.5 5.5 ab 829.5 25.4 a 964.8 27.9 ab 2080.8 43.4 a 96.67 3.33
No supplement T9 252.2 5.3 def 748.0 13.7 b 792.0 27.6 ef 1792.3 40.4 cd 100.00 0.00
Lipase+Lecithin T10 246.8 6.4 ef 794.4 14.7 ab 854.4 22.2 bcdef 1895.6 33.8 bcd 100.00 0.00
NSPases T11 250.5 5.6 def 746.0 17.4 b 743.0 33.0 f 1737.7 44.8 d 100.00 0.00 10
Lipase+Lecithin+NSPases T12 236.6 6.0 f 778.8 18.1 ab 769.2 49.6 ef 1789.6 57.9 cd 96.67 3.33

MeanSE 259.7 2.8 782.4 5.5 861.9 10.6 1915.6 14.7 98.61 0.58
SEM 8.9 25.9 48.2 66.2 2.722
CD 17.5 66.8 124.3 170.9 -
P-value1 <0.001 <0.001 <0.001 <0.001 2.630
Effect of SPR
0% 281.0 6.4 796.5 20.2 922.2 58.2 a 1999.7 77.6 a 100.00 0.0
5% 265.7 7.0 783.8 20.0 873.7 78.9 a 1924.1 78.9 a 96.7 1.4
10% 246.5 5.9 766.8 16.3 789.7 72.3 b 1803.8 72.3 b 99.2 0.8
SEM 4.5 13.0 24.1 33.1 1.571
CD - - 62.2 85.5 -
P-value1 <0.001 0.073 <0.001 <0.001 0.056
Effect of Biotechnological Tool
No supplement 270.6 6.8 792.8 18.0 a 806.3 55.1 c 1869.7 80.3 bc 98.9 1.1
Lipase+Lecithin 257.0 7.6 784.6 17.2 a 917.2 67.9 a 1958.8 91.7 ab 100.0 0.0
NSPases 264.1 6.1 742.5 17.0 b 828.0 61.9 bc 1833.9 85.6 c 98.9 1.1
Lipase+Lecithin+NSPases 265.9 7.0 809.6 21.6 a 895.8 76.0 ab 1974.3 101.5a 96.7 1.7
SEM 5.2 15.0 27.8 38.2 1.361
CD - 38.6 71.8 98.7 -
P-value1 0.072 <0.001 <0.001 <0.001 0.219
1An effect with a probability of less than 0.05 is considered significant, a-f Means with different superscripts in a column differ significantly

Table 4.17: Weekly average feed consumption of birds as influenced by different treatments and main factors during performance trial of broilers
Dietary Description Feed Consumption (g/bird)
SPR % Biotechnological Tool
Tr.
No. I Wk. II Wk. III Wk. IV Wk. V Wk. VI Wk.
No supplement T1 109.4 0.1 a 343.1 0.2 a 547.8 11.8 abc 815.0 3.2 953.7 12.2 799.8 32.2
Lipase+Lecithin T2 109.4 0.1 a 328.5 4.1 abc 540.0 7.0 abcd 820.6 24.7 1021.1 20.8 858.3 9.2
NSPases T3 107.5 0.3 bcd 327.5 3.9 abc 530.2 5.2 abcd 783.9 7.1 930.7 15.4 777.8 5.1 0
Lipase+Lecithin+NSPases T4 109.4 0.1 a 329.6 7.9 ab 561.8 2.9 a 810.4 13.4 952.6 3.5 834.0 10.8
No supplement T5 109.1 0.1 a 322.0 6.3 abcd 557.6 6.1 ab 810.8 11.9 970.9 4.5 765.3 34.4
Lipase+Lecithin T6 107.0 0.3 bc 334.6 5.4 a 532.3 11.8 abcd 791.5 18.3 920.5 16.9 751.8 33.1
NSPases T7 107.2 0.2 cd 340.3 5.8 a 551.7 10.8 ab 758.7 59.0 898.1 54.7 727.4 66.8 5
Lipase+Lecithin+NSPases T8 108.5 0.6 ab 337.7 10.9 a 561.4 15.0 a 821.5 33.9 896.5 46.3 738.7 86.3
No supplement T9 107.1 0.4 cd 303.5 3.7 de 514.1 6.0 cd 764.6 12.3 888.0 30.8 807.0 19.9
Lipase+Lecithin T10 104.8 0.4 e 291.4 7.5 e 526.9 1.0 bcd 788.8 4.1 954.8 22.5 810.0 21.1
NSPases T11 106.5 0.3 d 306.9 3.5 bcde 537.3 7.9 abcd 767.1 4.6 924.0 25.3 741.0 62.1 10
Lipase+Lecithin+NSPases T12 107.9 0.1 bc 305.1 4.8 cde 508.0 7.7 d 764.2 7.2 907.9 16.2 724.5 53.3
MeanSE 107.8 0.0 322.5 3.1 539.1 3.5 791.4 6.7 934.9 8.9 778.0 12.6
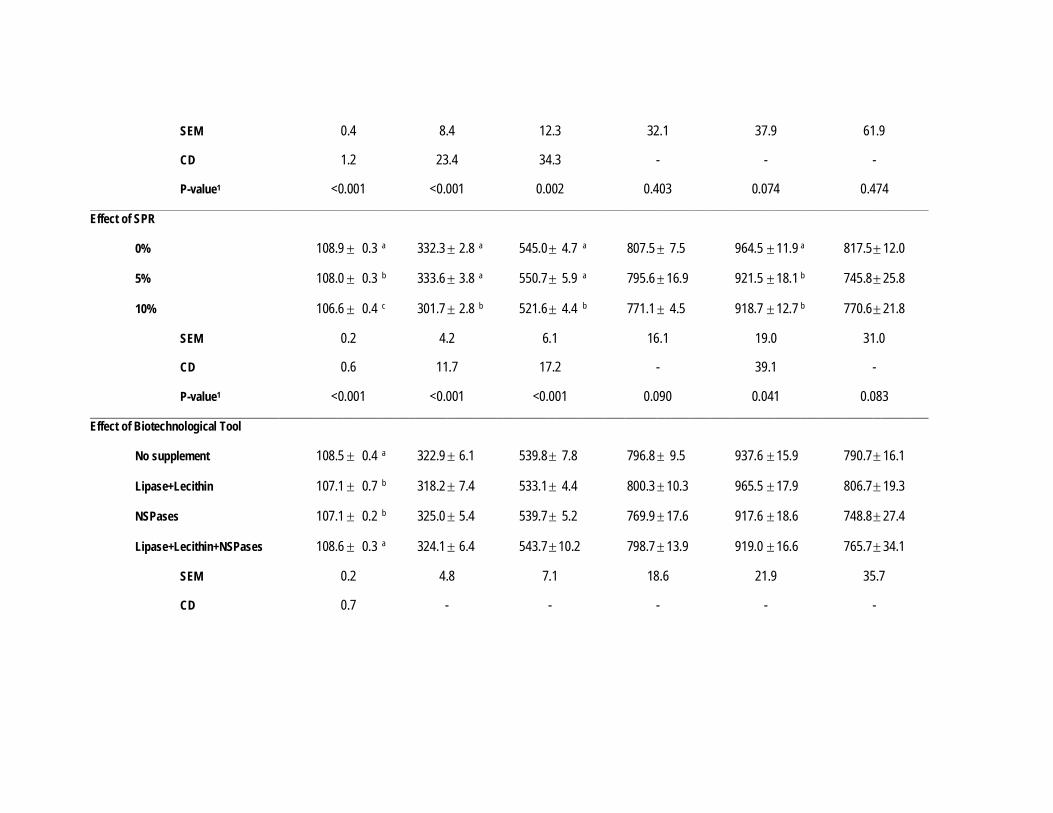
SEM 0.4 8.4 12.3 32.1 37.9 61.9
CD 1.2 23.4 34.3 - - -
P-value1 <0.001 <0.001 0.002 0.403 0.074 0.474
Effect of SPR
0% 108.9 0.3 a 332.3 2.8 a 545.0 4.7 a 807.5 7.5 964.5 11.9 a 817.5 12.0
5% 108.0 0.3 b 333.6 3.8 a 550.7 5.9 a 795.6 16.9 921.5 18.1 b 745.8 25.8
10% 106.6 0.4 c 301.7 2.8 b 521.6 4.4 b 771.1 4.5 918.7 12.7 b 770.6 21.8
SEM 0.2 4.2 6.1 16.1 19.0 31.0
CD 0.6 11.7 17.2 - 39.1 -
P-value1 <0.001 <0.001 <0.001 0.090 0.041 0.083
Effect of Biotechnological Tool
No supplement 108.5 0.4 a 322.9 6.1 539.8 7.8 796.8 9.5 937.6 15.9 790.7 16.1
Lipase+Lecithin 107.1 0.7 b 318.2 7.4 533.1 4.4 800.3 10.3 965.5 17.9 806.7 19.3
NSPases 107.1 0.2 b 325.0 5.4 539.7 5.2 769.9 17.6 917.6 18.6 748.8 27.4
Lipase+Lecithin+NSPases 108.6 0.3 a 324.1 6.4 543.7 10.2 798.7 13.9 919.0 16.6 765.7 34.1
SEM 0.2 4.8 7.1 18.6 21.9 35.7
CD 0.7 - - - - -

P-value1 <0.001 0.512 0.515 0.328 0.129 0.394
1An effect with a probability of less than 0.05 is considered significant, a-e Means with different superscripts in a column differ significantly
Table 4.18: Phase wise and cumulative average feed consumption of birds as influenced by different treatments
and main factors during performance trial of broilers
Dietary Description Feed Consumption (g/bird)
SPR % Biotechnological Tool
Tr.
No. Starter Phase Grower Phase Finisher Phase Cumulative
No supplement T1 452.5 0.2 a 1362.8 14.5 1753.5 41.9 3568.8 56.4
Lipase+Lecithin T2 437.9 4.1 ab 1360.6 30.5 1879.5 15.7 3678.0 40.7
NSPases T3 435.3 3.7 abc 1314.1 7.1 1708.5 18.8 3457.9 23.8 0
Lipase+Lecithin+NSPases T4 439.0 8.0 ab 1372.2 14.8 1786.6 14.4 3597.8 36.9
No supplement T5 431.2 6.4 abc 1368.4 17.9 1736.1 37.5 3549.9 33.7
Lipase+Lecithin T6 441.6 5.4 a 1323.8 9.1 1672.3 48.3 3437.7 181.0
NSPases T7 451.1 9.2 a 1310.4 66.2 1625.5 116.4 3387.0 191.0 5
Lipase+Lecithin+NSPases T8 449.7 13.9 a 1382.9 48.8 1668.0 139.0 3565.4 57.2
No supplement T9 410.6 4.1 cd 1278.7 7.4 1695.0 48.7 3384.2 24.9
Lipase+Lecithin T10 396.2 7.1 d 1315.6 4.9 1764.8 26.4 3476.7 96.6
NSPases T11 413.4 3.5 abc 1304.4 8.9 1665.1 85.1 3382.9 66.6 10
Lipase+Lecithin+NSPases T12 413.0 4.7 bcd 1272.2 14.8 1632.4 51.6 3317.6 66.6
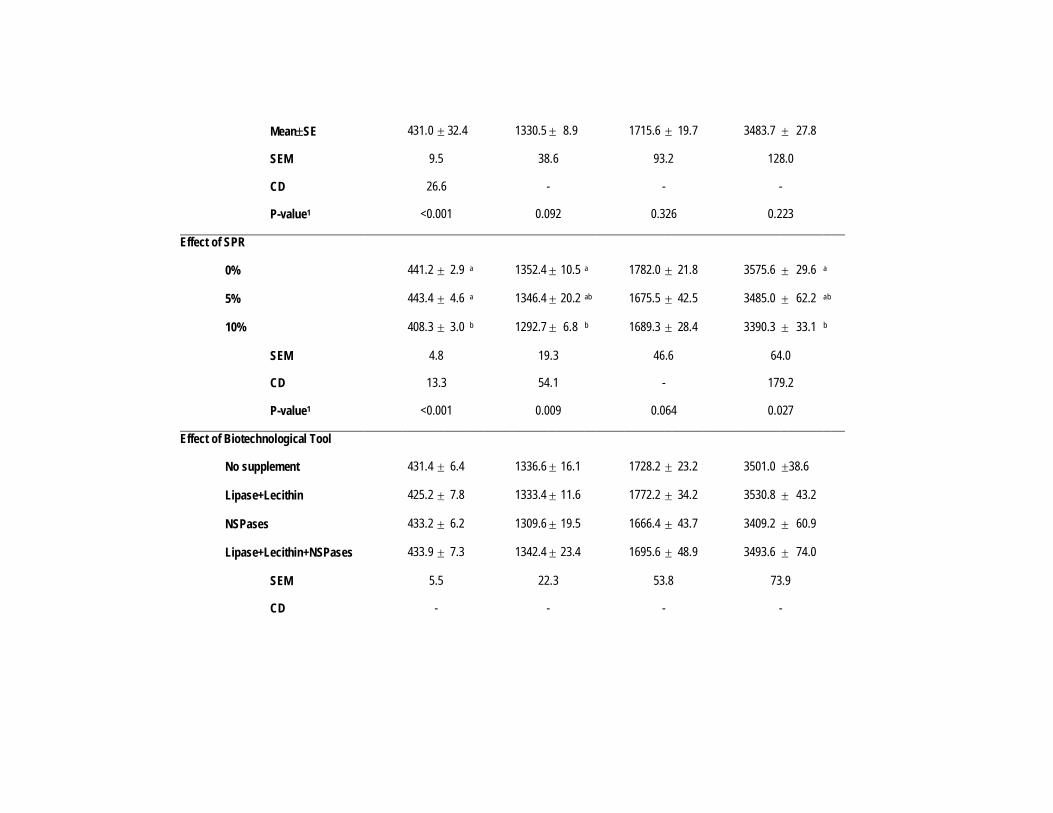
MeanSE 431.0 32.4 1330.5 8.9 1715.6 19.7 3483.7 27.8
SEM 9.5 38.6 93.2 128.0
CD 26.6 - - -
P-value1 <0.001 0.092 0.326 0.223
Effect of SPR
0% 441.2 2.9 a 1352.4 10.5 a 1782.0 21.8 3575.6 29.6 a
5% 443.4 4.6 a 1346.4 20.2 ab 1675.5 42.5 3485.0 62.2 ab
10% 408.3 3.0 b 1292.7 6.8 b 1689.3 28.4 3390.3 33.1 b
SEM 4.8 19.3 46.6 64.0
CD 13.3 54.1 - 179.2
P-value1 <0.001 0.009 0.064 0.027
Effect of Biotechnological Tool
No supplement 431.4 6.4 1336.6 16.1 1728.2 23.2 3501.0 38.6
Lipase+Lecithin 425.2 7.8 1333.4 11.6 1772.2 34.2 3530.8 43.2
NSPases 433.2 6.2 1309.6 19.5 1666.4 43.7 3409.2 60.9
Lipase+Lecithin+NSPases 433.9 7.3 1342.4 23.4 1695.6 48.9 3493.6 74.0
SEM 5.5 22.3 53.8 73.9
CD - - - -

P-value1 0.396 0.488 0.261 0.412
1An effect with a probability of less than 0.05 is considered significant, a-d Means with different superscripts in a column differ significantly
Table 4.19: Weekly average feed conversion ratio of birds as influenced by different treatments and main factors during performance trial of broilers
Dietary Description Feed Conversion Ratio (Kg Feed/ Kg Weight Gain)
SPR % Biotechnological Tool
Tr.
No. I Wk. II Wk. III Wk. IV Wk. V Wk. VI Wk.
No supplement T1 1.569 0.04 1.517 0.02 1.471 0.02 1.787 0.07 1.870 0.07 2.708 0.08
Lipase+Lecithin T2 1.688 0.07 1.585 0.03 1.513 0.03 1.917 0.13 1.984 0.10 1.736 0.16
NSPases T3 1.610 0.08 1.563 0.02 1.577 0.02 1.911 0.02 1.856 0.04 1.873 0.07 0
Lipase+Lecithin+NSPases T4 1.580 0.05 1.577 0.00 1.469 0.00 1.851 0.02 1.978 0.02 1.768 0.00
No supplement T5 1.793 0.10 1.597 0.06 1.536 0.06 1.875 0.07 1.793 0.06 2.766 0.32
Lipase+Lecithin T6 1.821 0.05 1.742 0.05 1.528 0.05 1.877 0.06 1.983 0.03 1.897 023
NSPases T7 1.615 0.15 1.681 0.12 1.566 0.12 2.011 0.08 1.853 0.03 2.226 0.24 5
Lipase+Lecithin+NSPases T8 1.565 0.14 1.555 0.04 1.507 0.04 1.820 0.12 1.960 0.08 1.580 0.14
No supplement T9 1.689 0.06 1.612 0.03 1.483 0.03 1.910 0.07 1.900 0.07 2.629 0.44
Lipase+Lecithin T10 1.612 0.09 1.612 0.01 1.497 0.01 1.785 0.04 2.058 0.05 2.093 0.11
10
NSPases T11 1.675 0.04 1.643 0.01 1.450 0.01 2.062 0.14 2.247 0.16 2.404 0.18

Lipase+Lecithin+NSPases T12 1.769 0.09 1.742 0.01 1.425 0.01 1.823 0.11 2.187 0.29 2.856 0.97
MeanSE 1.665 0.03 1.619 0.01 1.502 0.01 1.886 0.02 1.973 0.03 2.211 0.11
SEM 0.123 0.069 0.066 0.122 0.154 0.491
CD - - - - - -
P-value1 0.432 0.057 0.509 0.500 0.174 0.139
Effect of SPR
0% 1.612 0.03 1.560 0.02 a 1.507 0.02 1.866 0.04 1.922 0.03 2.021 0.13
5% 1.698 0.06 1.644 0.03 b 1.534 0.03 1.896 0.04 1.898 0.03 2.117 0.17
10% 1.689 0.04 1.652 0.01 b 1.464 0.01 1.895 0.05 2.098 0.08 2.495 0.25
SEM 0.061 0.034 0.033 0.061 0.077 0.246
CD - 0.071 - - - -
P-value1 0.328 0.024 0.119 0.860 0.194 0.147
Effect of Biotechnological Tool
No supplement 1.684 0.05 1.575 0.02 1.497 0.02 1.857 0.04 1.854 0.04 b 2.701 0.16
Lipase+Lecithin 1.707 0.05 1.646 0.02 1.513 0.02 1.860 0.05 2.008 0.04 ab 1.909 0.10
NSPases 1.633 0.05 1.629 0.04 1.531 0.04 1.995 0.05 1.986 0.08 ab 2.168 0.12
Lipase+Lecithin+NSPases 1.638 0.06 1.625 0.02 1.467 0.02 1.831 0.05 2.042 0.09 a 2.068 0.35

SEM 0.071 0.040 0.038 0.070 0.089 0.284
CD - - - - 0.184 -
P-value1 0.679 0.339 0.399 0.113 0.031 0.054
1An effect with a probability of less than 0.05 is considered significant, a-b Means with different superscripts in a column differ significantly
Table 4.20: Phase wise and cumulative average feed conversion ratio of birds as influenced by different treatments and main
factors during performance trial of broilers
Dietary Description Feed Conversion Ratio (Kg Feed/ Kg Weight Gain)
SPR % Biotechnological Tool
Tr.
No. Starter Phase Grower Phase Finisher Phase Cumulative
No supplement T1 1.529
0.01 d
1.644
0.05 2.175
0.03 abc
1.778
0.04
Lipase+Lecithin T2 1.608
0.01 cd
1.728
0.05 1.856
0.12 cd
1.773
0.08
NSPases T3 1.572
0.02 cd
1.761
0.02 1.864
0.05 cd
1.781
0.02
0
Lipase+Lecithin+NSPases T4 1.578
0.02 cd
1.673
0.01 1.874
0.01 cd
1.753
0.00
No supplement T5 1.639
0.04 bcd
1.720
0.06 2.110
0.10 abcd
1.887
0.08
5
Lipase+Lecithin T6 1.758
0.07 a
1.720
0.05 1.922
0.09 bcd
1.813
0.05

NSPases T7 1.654
0.01 abc
1.794
0.07 1.991
0.09 bcd
1.869
0.08
Lipase+Lecithin+NSPases T8 1.550
0.03 cd
1.677
0.08 1.789
0.06 d
1.779
0.04
No supplement T9 1.629
0.02 bcd
1.711
0.04 2.164
0.19 abc
1.894
0.09
Lipase+Lecithin T10 1.606
0.04 cd
1.657
0.02 2.068
0.04 abcd
1.835
0.02
NSPases T11 1.651
0.01 abc
1.753
0.06 2.341
0.18 a
1.977
0.09
10
Lipase+Lecithin+NSPases T12 1.746
0.03 ab
1.636
0.05 2.237
0.17 ab
1.925
0.07
MeanSE 1.627 0.01 1.706 0.01 2.032 0.04 1.839 0.02
SEM 0.043 0.074 0.158 0.086
CD 0.119 - 0.326 -
P-value1 <0.001 0.558 0.031 0.255
Effect of SPR
0% 1.571 0.01 b 1.701 0.02 1.942 0.05 b 1.771 0.02b
5% 1.650 0.03 a 1.728 0.03 1.953 0.05 b 1.837 0.03ab
10% 1.658 0.02 a 1.689 0.02 2.202 0.07 a 1.908 0.03a

SEM 0.021 0.037 0.079 0.043
CD 0.060 - 0.211 0.089
P-value1 0.001 0.577 0.004 0.015
Effect of Biotechnological Tool
No supplement 1.599 0.02 1.692 0.03 2.149 0.06 1.853 0.04
Lipase+Lecithin 1.657 0.03 1.702 0.03 1.948 0.06 1.807 0.03
NSPases 1.626 0.01 1.769 0.03 2.065 0.09 1.876 0.04
Lipase+Lecithin+NSPases 1.625 0.03 1.662 0.03 1.967 0.09 1.819 0.04
SEM 0.025 0.043 0.091 0.050
CD - - - -
P-value1 0.160 0.108 0.127 0.508
1An effect with a probability of less than 0.05 is considered significant, a-d Means with different superscripts in a column differ significantly

Table 4.24: Relative weight of vital organs of experimental birds as influenced by different treatments and main factors at the end of 42-day performance trial of broilers
Dietary Description g / 100 g body weight
SPR % Biotechnological Tool
Tr.
No. Liver Heart Gizzard Proventriculus Spleen Bursa
No supplement T1 2.81 0.16 0.59 0.03 2.22 0.09 0.49 0.02 0.24 0.02 0.23 0.05 abc
Lipase+Lecithin T2 2.89 0.17 0.60 0.03 2.54 0.13 0.54 0.05 0.20 0.03 0.24 0.03 abc
NSPases T3 2.69 0.20 0.62 0.03 2.34 0.15 0.57 0.04 0.19 0.01 0.22 0.02 abc 0
Lipase+Lecithin+NSPases T4 3.07 0.49 0.66 0.07 2.30 0.12 0.50 0.03 0.28 0.07 0.16 0.02 c
No supplement T5 2.41 0.22 0.55 0.03 2.34 0.11 0.52 0.05 0.18 0.02 0.21 0.04 abc
Lipase+Lecithin T6 2.89 0.37 0.60 0.03 2.52 0.09 0.56 0.08 0.19 0.03 0.16 0.02 c
NSPases T7 2.32 0.07 0.65 0.05 2.54 0.10 0.55 0.06 0.16 0.01 0.18 0.02 c 5
Lipase+Lecithin+NSPases T8 2.29 0.06 0.62 0.04 2.31 0.11 0.45 0.03 0.27 0.05 0.32 0.05 a
No supplement T9 2.70 0.16 0.63 0.03 2.55 0.04 0.55 0.03 0.23 0.02 0.30 0.03 ab
Lipase+Lecithin T10 2.83 0.22 0.68 0.03 2.54 0.15 0.57 0.03 0.18 0.04 0.20 0.03 bc
NSPases T11 2.91 0.12 0.64 0.03 2.45 0.19 0.52 0.04 0.22 0.02 0.21 0.02 bc 10
Lipase+Lecithin+NSPases T12 2.44 0.08 0.58 0.02 2.79 0.14 0.52 0.03 0.27 0.02 0.27 0.02 abc
MeanSE 2.69 0.07 0.62 0.01 2.45 0.04 0.53 0.01 0.22 0.01 0.22 0.01
SEM 0.32 0.05 0.17 0.06 0.05 0.04
CD - - - - - 0.109
P-value1 0.240 0.483 0.118 0.757 0.170 0.009

Effect of SPR
0% 2.87 0.62 0.62 0.02 2.35 0.06 b 0.52 0.02 0.23 0.02 0.21 0.02
5% 2.48 0.61 0.61 0.02 2.43 0.05 ab 0.52 0.03 0.20 0.02 0.22 0.02
10% 2.72 0.08 0.63 0.02 2.58 0.07 a 0.54 0.02 0.22 0.01 0.24 0.01
SEM 0.16 0.03 0.09 0.03 0.02 0.02
CD - - 0.17 - - -
P-value1 0.058 0.594 0.032 0.767 0.460 0.316
Effect of Biotechnological Tool
No supplement 2.64 0.11 0.59 0.02 2.37 0.06 0.52 0.02 0.21 0.01 b 0.24 0.02
Lipase+Lecithin 2.87 0.14 0.63 0.02 2.53 0.07 0.55 0.03 0.19 0.02 b 0.20 0.02
NSPases 2.64 0.10 0.64 0.02 2.45 0.08 0.55 0.03 0.19 0.01 b 0.20 0.01
Lipase+Lecithin+NSPases 2.60 0.18 0.62 0.03 2.46 0.09 0.49 0.02 0.27 0.03 a 0.25 0.02
SEM 0.19 0.03 0.10 0.04 0.03 0.02
CD - - - - 0.05 -
P-value1 0.452 0.433 0.471 0.258 0.011 0.104
1An effect with a probability of less than 0.05 is considered significant, a-c Means with different superscripts in a column differ significantly

Table 4.21: Metabolizability of various nutrients of experimental diets as influenced by different treatments and main factors during performance trial of broilers
Dietary Description Metabolizability Coefficient (%)
SPR% Biotechnological Tool
Tr.
No. Dry Matter Organic Matter
Crude Protein Ether Extract
No supplement T1 71.09 4.87abcd 84.64 5.31abc 67.36 4.74b 61.17 4.52bc
Lipase+Lecithin T2 70.77 4.86abcd 84.64 5.31abc 67.55 4.75b 71.75 4.89ab
NSPases T3 72.58 4.92ab
85.30 5.33a
73.26 4.94a
b 73.49 4.95a 0
Lipase+Lecithin+NSPases T4 71.88 4.90abcd
84.14 5.30bcd
71.24 4.87a
b 62.06 4.55bc
No supplement T5 71.91 4.90abcd 83.80 5.29d 68.53 4.78b 59.72 4.46c
Lipase+Lecithin T6 72.56 4.92abc 84.37 5.30bcd 76.89 5.06a 64.84 4.65abc
NSPases T7 74.44 4.98a 84.29 5.30bcd 75.92 5.03a 70.61 4.85ab 5
Lipase+Lecithin+NSPases T8 73.68 4.96a
83.94 5.29cd
72.75 4.92a
b 59.37 4.45c
No supplement T9 69.08 4.80bcd 84.10 5.29bcd 67.38 4.74b 65.12 4.66abc
Lipase+Lecithin T10 68.99 4.78cd 84.22 5.30cd 68.87 4.79b 68.03 4.76abc
NSPases T11 68.33 4.77d 84.01 5.29bcd 69.22 4.80b 62.76 4.57bc 10
Lipase+Lecithin+NSPases T12 71.31 4.88abcd
84.84 5.32bcd
71.91 4.90a
b 59.20 4.44c
MeanSE 71.36 1.41 84.36 1.53ab 70.91 1.40 63.83 1.33
SEM 1.39 0.30 2.13 3.81
CD 3.90 0.83 5.97 10.68
P-value1 0.03 0.002 0.01 0.005
Effect of SPR
0% 71.58 0.38a 84.68 0.14a 69.85 0.82b 67.12 2.13
5% 73.15 0.59a 84.10 0.14b 73.52 1.19a 63.64 1.92
10% 69.34 0.54b 84.29 0.12b 69.34 0.97b 63.78 1.17
SEM 0.70 0.15 1.07 1.91
CD 1.80 0.38 2.75 -
P-value1 <0.001 0.002 0.001 0.140

Effect of Biotechnological Tool
No supplement 70.69 0.53 84.18 0.15 67.76 1.04b 62.01 2.31b
Lipase+Lecithin 70.66 0.67 84.41 0.13 71.10 1.61a 68.21 1.25a
NSPases 71.78 1.14 84.53 0.24 72.82 1.07a 68.96 2.01a
Lipase+Lecithin+NSPases 72.29 0.62 84.31 0.15 71.97 0.79a 60.21 0.88a
SEM 0.80 0.17 1.23 2.20
CD - - 3.18 5.68
P-value1 0.135 0.225 0.002 0.001
1An effect with a probability of less than 0.05 is considered significant,
a-d Means with different superscripts in a column differ significantly

Table 4.22: Calcium and phosphorus retention of experimental diets as influenced by different treatments and main factors during performance trial of broilers
Dietary Description Calcium Phosphorus
SPR % Biotechnological Tool
Tr.
No. % of Intake g/day % of Intake g/day
No supplement T1 57.90 4.39bc 0.58 0.44cd 46.09 3.92ab 0.38 0.35 a
Lipase+Lecithin T2 63.91 4.62ab 0.60 0.45cd 43.10 3.79abcd 0.33 0.33 abc
NSPases T3 64.91 4.65ab 0.61 0.45cd 44.83 3.87abc 0.34 0.34 abc 0
Lipase+Lecithin+NSPases T4 50.05 4.08c 0.50 0.41d 30.89 3.21de 0.25 0.29 cd
No supplement T5 70.40 4.84a
0.87 0.54a
39.26 3.62abcd
e 0.30 0.31 abc
d
Lipase+Lecithin T6 63.26 4.59ab 0.77 0.51ab 46.41 3.93ab 0.34 0.34 abc
NSPases T7 75.29 5.01a 0.88 0.54a 49.01 4.04ab 0.35 0.34 ab
5
Lipase+Lecithin+NSPases T8 6 3.13 4.59ab 0.79 0.51ab 29.80 3.15e 0.23 0.28 d
No supplement T9 64.91 4.65ab 0.72 0.49abc 37.59 3.54bcde 0.28 0.31 bcd
Lipase+Lecithin T10 69.99 4.83ab 0.77 0.51ab 50.81 4.12a 0.38 0.36 a
NSPases T11 69.93 4.83ab
0.77 0.51ab
41.16 3.70abcd
e 0.31 0.32 abc
d
10
Lipase+Lecithin+NSPases T12 65.16 4.66ab 0.69 0.48bc 32.58 3.30cde 0.23 0.28 d
MeanSE 64.90 1.34 0.71 0.14 40.96 1.07 0.31 0.09
SEM 4.39 0.05 4.51 0.03
CD 12.29 0.15 12.63 0.09
P-value1 0.001 <0.001 0.001 <0.001
Effect of SPR
0% 59.19 2.38 b
0.57 0.02c
41.23 2.16
0.32 0.02
5% 68.02 1.94a 0.83 0.02a 41.12 2.66 0.31 0.02
10% 67.50 1.39a 0.74 0.02b 40.54 2.50 0.30 0.02
SEM 2.19 0.03 2.26 0.02
CD 5.66 0.07 - -
P-value1 0.001 <0.001 0.947 0.328
Effect of Biotechnological Tool

No supplement 64.40 2.57ab 0.72 0.05ab 40.98 1.63a 0.32 0.02a
Lipase+Lecithin 65.72 2.11ab 0.71 0.04ab 46.78 2.15a 0.35 0.02a
NSPases 70.04 1.79a 0.75 0.04a 45.00 2.21a 0.33 0.02a
Lipase+Lecithin+NSPases 59.45 2.76b 0.66 0.04b 31.09 1.55b 0.24 0.01b
SEM 2.53 0.03 2.60 0.02
CD 6.54 0.06 6.72 0.05
P-value1 0.004 0.037 <0.001 <0.001
1An effect with a probability of less than 0.05 is considered significant,
a-e Means with different superscripts in a column differ significantly
Table 4.23: Carcass characteristic of experimental birds as influenced by different treatments and main factors at the end of 42-day performance trial of broilers
Dietary Description Abdominal Fat
SPR % Biotechnological Tool
Tr.
No. Dressing
Percentage Meat: Bone ratio
g/bird % of live weight
No supplement T1 78.06 0.99 3.61 0.21 27.50 2.49 1.79 0.16
Lipase+Lecithin T2 79.39 0.71 2.98 0.06 24.33 1.96 1.50 0.13
NSPases T3 78.20 1.11 3.83 0.30 23.33 1.71 1.54 0.15 0
Lipase+Lecithin+NSPases T4 77.68 1.33 3.57 0.34 36.00 6.75 2.41 0.45
No supplement T5 75.91 2.48 3.32 0.24 21.33 2.69 1.31 0.17
Lipase+Lecithin T6 78.99 1.18 3.84 0.38 19.83 3.98 1.29 0.22
NSPases T7 79.61 0.51 3.36 0.09 28.00 5.56 1.89 0.42 5
Lipase+Lecithin+NSPases T8 79.23 0.97 3.86 0.16 21.25 1.99 1.38 0.16
No supplement T9 76.44 0.83 3.08 0.11 21.67 4.92 1.50 0.36
Lipase+Lecithin T10 78.44 1.00 3.68 0.19 20.50 5.38 1.41 0.39
NSPases T11 75.58 0.98 3.98 0.35 19.17 3.88 1.37 0.24 10
Lipase+Lecithin+NSPases T12 76.95 0.92 3.42 0.20 15.20 2.91 1.05 0.19
MeanSE 77.87 0.35 3.55 0.07 23.18 1.23 1.54 0.08
SEM 1.670 0.14 5.67 0.39
CD - - - -
P-value1 0.214 0.082 0.077 0.119

Effect of SPR
0% 78.33 0.51 3.50 0.13 27.79 2.06a 1.81 0.14a
5% 78.44 0.76 3.60 0.13 22.60 1.89ab 1.47 0.13ab
10% 76.86 0.41 3.54 0.13 19.13 2.10b 1.33 0.15b
SEM 0.835 0.07 2.84 0.20
CD - - 5.56 0.39
P-value1 0.114 0.852 0.012 0.049
Effect of Biotechnological Tool
No supplement 76.80 0.90 3.34 0.12 23.50 2.04 1.53 0.14
Lipase+Lecithin 78.84 0.54 3.50 0.16 21.56 2.23 1.40 0.15
NSPases 77.80 0.64 3.73 0.16 23.50 2.36 1.60 0.17
Lipase+Lecithin+NSPases 77.96 0.63 3.62 0.14 24.15 3.19 1.61 0.21
SEM 0.964 0.08 3.27 0.23
CD - - - -
P-value1 0.188 0.240 0.871 0.769
1An effect with a probability of less than 0.05 is considered significant,
a-e Means with different superscripts in a column differ significantly
Table 4.25: Relative length of intestinal segments of experimental birds as influenced by different treatments and main factors at the end of 42-day performance trial of broilers
Dietary Description cm / 100g body weight
SPR % Biotechnological Tool
Tr.
No. Duodenum Jejunum Ileum Small Intestine
No supplement T1 1.64 0.11 4.69 0.23ab 4.73 0.15ab 11.06 0.42a
Lipase+Lecithin T2 1.53 0.11 4.08 0.17de 4.10 0.15c 9.71 0.35b
NSPases T3 1.54 0.08 4.33 0.11de 4.22 0.11c 10.09 0.17ab 0
Lipase+Lecithin+NSPases T4 1.62 0.10 4.11 0.14de 4.45 0.23abc 10.18 0.49ab
No supplement T5 1.51 0.10 4.06 0.22de 4.19 0.19c 10.35 0.47b
Lipase+Lecithin T6 1.70 0.12 4.34 0.16de 4.31 0.15b 9.89 0.25ab
NSPases T7 1.54 0.05 4.09 0.12de 4.26 0.09c 9.79 0.15b 5
Lipase+Lecithin+NSPases T8 1.67 0.10 3.86 0.13e 4.26 0.14c 10.61 0.35b

No supplement T9 1.89 0.36 4.21 0.18de 4.51 0.14abc 10.21 0.35ab
Lipase+Lecithin T10 1.50 0.04 4.46 0.23cd 4.25 0.12c 10.21 0.54ab
NSPases T11 1.52 0.08 4.72 0.25a 4.71 0.14ab 10.95 0.39a 10
Lipase+Lecithin+NSPases T12 1.62 0.08 4.59 0.21bc 4.82 0.22a 11.03 0.52a
MeanSE 1.61 0.04 4.30 0.06 4.40 0.05 10.30 0.12
SEM 0.19 0.26 0.22 0.55
CD - 0.52 0.437 1.09
P-value1 0.75 0.03 0.02 0.04
Effect of SPR
0% 1.58 0.05 4.30 0.09ab 4.37 0.09 10.27 0.20ab
5% 1.60 0.05 4.09 0.08b 4.26 0.07 9.86 0.16b
10% 1.63 0.09 4.50 0.11a 4.57 0.09 10.78 0.23a
SEM 0.10 0.13 0.11 0.28
CD - 0.26 0.22 0.71
P-value1 0.86 0.01 0.021 0.006
Effect of Biotechnological Tool
No supplement 1.68 0.13 4.32 0.13 4.48 0.10 10.33 0.26
Lipase+Lecithin 1.58 0.06 4.29 0.11 4.22 0.08 10.19 0.24
NSPases 1.56 0.04 4.38 0.11 4.40 0.08 10.41 0.19
Lipase+Lecithin+NSPases 1.61 0.05 4.19 0.12 4.51 0.12 10.28 0.29
SEM 0.11 0.15 0.13 0.32
CD - - - -
P-value1 0.71 0.65 0.12 0.92
1An effect with a probability of less than 0.05 is considered significant,
a-e Means with different superscripts in a column differ significantly

Table 4.26: Bone mineralization of experimental birds as influenced by different treatments and main factors at the end of 42-day performance trial of broilers
Dietary Description % of Dry Bone % of Tibial Ash
SPR % Biotechnological Tool
Tr.
No. Toe Ash Tibia Ash Calcium Phosphorus
No supplement T1 33.41 3.34c 45.36 3.89 35.94 3.46cd 15.78 2.29
Lipase+Lecithin T2 32.25 3.28c 46.96 3.96 38.91 3.46cd 15.41 2.27
NSPases T3 37.41 3.53b 44.52 3.85 43.89 3.82ab 16.32 2.33 0
Lipase+Lecithin+NSPases T4 39.15 3.61ab 44.41 3.85 33.15 3.32d 13.19 2.10
No supplement T5 33.29 3.33c 43.50 3.81 35.62 3.45cd 16.63 2.35
Lipase+Lecithin T6 39.03 3.61ab 46.77 3.95 41.00 3.70ab 15.99 2.31
NSPases T7 41.42 3.72a 47.87 3.99 39.10 3.61abcd 14.69 2.21 5
Lipase+Lecithin+NSPases T8 39.20 3.61ab 50.50 4.10 40.33 3.67abc 19.19 2.53
No supplement T9 32.32 3.28c 43.34 3.80 36.31 3.48cd 15.90 2.30
Lipase+Lecithin T10 38.53 3.58ab 46.66 3.94 38.46 3.58bcd 15.26 2.26
NSPases T11 40.12 3.66ab 46.57 3.94 45.58 3.90a 16.23 2.33 10
Lipase+Lecithin+NSPases T12 39.67 3.64ab 43.60 3.81 39.35 3.62abcd 17.56 2.42
MeanSE
SEM 1.095 2.648 3.410 2.076
CD 3.06 - 7.03 -
P-value1 <0.001 0.286 0.046 0.474
Effect of SPR
0% 35.55 0.92b 45.32 0.73 37.22 1.79 15.18
5% 38.24 0.98a 47.16 1.33 39.01 1.18 16.62
10% 37.66 0.98a 45.04 0.71 39.93 1.23 16.24
SEM 0.547 1.324 1.705 1.038
CD 1.53 - - -
P-value1 <0.001 0.240 0.290 0.368
Effect of Biotechnological Tool
No supplement 33.010.488c 44.07 0.56 35.95 0.22b 16.10

Lipase+Lecithin 36.60 1.14b 46.80 0.43 38.45 1.25b 15.55
NSPases 39.65 0.68a 46.32 0.94 42.86 1.15a 15.75
Lipase+Lecithin+NSPases 39.34 0.41a 46.17 1.91 37.61 2.37b 16.64
SEM 0.632 1.529 1.969 1.199
CD 1.77 - 4.06 -
P-value1 <0.001 0.312 0.012 0.811
1An effect with a probability of less than 0.05 is considered significant,
a-d Means with different superscripts in a column differ significantly
Table 4.27: Blood mineral profile of experimental birds as influenced by different treatments and main factors at different intervals of 42-day performance trial of broilers
Dietary Description Serum Calcium (mg/dl) Serum Phosphorus (mg/dl)
SPR % Biotechnological Tool
Tr.
No. 21st day 42nd day 21st day 42nd day
No supplement T1 11.73 1.98 13.35 2.11 7.00 1.53 6.28 1.45
Lipase+Lecithin T2 11.55 1.96 13.27 2.10 6.04 1.42 5.56 1.36
NSPases T3 13.02 2.08 14.63 2.21 5.80 1.39 6.52 1.47 0
Lipase+Lecithin+NSPases T4 12.91 2.07 14.30 2.18 7.00 1.53 7.16 1.54
No supplement T5 11.95 2.00 12.61 2.05 6.52 1.47 5.72 1.38
Lipase+Lecithin T6 13.53 2.12 13.60 2.13 6.32 1.45 6.80 1.51
NSPases T7 13.09 2.09 14.01 2.16 6.72 1.50 6.12 1.43 5
Lipase+Lecithin+NSPases T8 12.14 2.01 12.87 2.07 6.52 1.47 7.04 1.53
No supplement T9 12.61 2.05 14.01 2.16 6.00 1.41 6.88 1.51
Lipase+Lecithin T10 12.06 2.01 13.05 2.09 7.12 1.54 7.32 1.56
NSPases T11 11.51 1.96 12.91 2.07 6.04 1.42 6.40 1.46 10
Lipase+Lecithin+NSPases T12 12.87 2.07 12.65 2.05 6.24 1.44 6.92 1.52
MeanSE 12.41 0.59 13.44 0.61 6.44 0.42 6.56 0.43
SEM 0.704 1.178 0.645 0.566
CD - - - -
P-value1 0.104 0.773 0.519 0.081

Effect of SPR
0% 12.30 0.28 13.89 0.36 6.46 0.24 6.38 0.26
5% 12.68 0.29 13.27 0.44 6.52 0.16 6.42 0.24
10% 12.27 0.28 13.15 0.37 6.35 0.28 6.88 0.17
SEM 0.352 0.589 0.322 0.283
CD - - - -
P-value1 0.443 0.423 0.868 0.167
Effect of Biotechnological Tool
No supplement 12.10 0.34 13.32 0.37 6.51 0.30 6.29 0.23
Lipase+Lecithin 12.38 0.43 13.31 0.49 6.49 0.27 6.56 0.34
NSPases 12.54 0.34 13.85 0.58 6.19 0.24 6.35 0.25
Lipase+Lecithin+NSPases 12.64 0.15 13.27 0.39 6.59 0.26 7.04 0.19
SEM 0.406 0.680 0.372 0.327
CD - - - -
P-value1 0.579 0.808 0.722 0.118
1An effect with a probability of less than 0.05 is considered significant,


Table 4.29: Analyzed chemical composition of experimental diets compounded during performance trial of layers
Diet Description Proximate Composition (%) Minerals (%)
SPR % Biotechnological Tool
Tr.
No. Dry matter Total Ash Ether Extract Crude Protein Crude Fiber NFE Calcium Phosphorus
No supplement T1 89.49 18.14 2.21 17.78 8.10 53.77 3.98 0.80
Lipase+Lecithin T2 90.25 21.04 2.21 17.73 7.94 51.08 4.00 0.81
NSPases T3 90.22 19.03 2.22 17.89 7.20 53.66 4.00 0.81 0
Lipase+Lecithin+NSPases T4 89.91 18.20 2.36 17.92 7.80 53.72 4.00 0.80
No supplement T5 89.96 20.70 2.97 17.72 7.85 50.76 3.95 0.78
Lipase+Lecithin T6 89.28 18.16 2.88 17.72 7.66 53.58 3.95 0.78
NSPases T7 89.48 20.21 3.07 17.61 7.62 51.49 3.98 0.75 5
Lipase+Lecithin+NSPases T8 89.03 17.59 3.07 17.35 7.73 54.26 3.98 0.78
No supplement T9 88.99 19.45 3.36 17.31 7.58 52.30 4.00 0.75
Lipase+Lecithin T10 89.70 18.01 3.96 17.56 8.00 52.47 3.98 0.76
NSPases T11 89.51 17.52 3.33 17.55 7.60 54.00 4.00 0.73 10
Lipase+Lecithin+NSPases T12 89.42 17.70 3.55 17.77 7.65 53.33 4.02 0.78

Table 4.30: Period wise and cumulative average egg production of birds as influenced by different treatments and main factors during performance trial of layers
Dietary Description Egg Production (%) Egg Production (Number)
SPR % Biotechnological Tool
Tr.
No. Period-I Period-II Period-III Cumulative Period-I Period-II Period-III Cumulative
No supplement T1 84.52 2.31 79.76 3.43 abcd 83.94 1.71 a 82.63 1.48a 23.7 0.65 22.2 0.94 abcd 23.5 0.48 a 23.1 0.41 ab
Lipase+Lecithin T2 85.95 1.95 82.54 2.37 ab 82.48 2.07 a 83.66 1.23a 24.1 0.55 23.1 0.66 ab 23.1 0.58 a 23.4 0.34 ab
NSPases T3 84.94 1.56 83.23 1.18 ab 82.85 1.51 a 83.68 0.81a 23.8 0.44 23.3 0.33 ab 23.2 0.42 a 23.4 0.23 ab 0
Lipase+Lecithin+NSPases T4 85.85 1.98 84.49 2.53 a 83.16 2.53 a 84.50 1.34a 24.0 0.55 23.7 0.71 a 23.3 0.71 a 23.7 0.37 a
No supplement T5 85.12 1.82 81.70 2.31 ab 83.33 1.62 a 83.38 1.11a 23.8 0.51 22.9 0.65 ab 23.3 0.45 a 23.3 0.31 ab
Lipase+Lecithin T6 80.30 1.73 80.11 2.45 abc 82.18 2.35 a 80.86 1.24ab 22.5 0.48 22.4 0.69 abcd 23.0 0.66 a 22.6 0.35 ab
NSPases T7 82.98 2.73 80.41 2.22 abc 77.17 1.82 ab 80.19 1.34abc 23.2 0.77 22.5 0.62 abc 21.6 0.51 ab 22.5 0.38 ab 5
Lipase+Lecithin+NSPases T8 78.75 1.94 75.20 2.10 cd 74.14 1.88 b 76.03 1.16c 22.1 0.54 21.1 0.59 cd 20.8 0.53 b 21.3 0.32 b
No supplement T9 78.57 2.65 77.58 1.78 bcd 74.53 2.32 b 76.89 1.31bc 22.0 0.74 21.7 0.50 bcd 20.9 0.65 b 21.5 0.37 ab
Lipase+Lecithin T10 79.05 3.10 74.95 2.99 cd 77.32 1.96 ab 77.11 1.56abc 22.1 0.87 21.0 0.84 cd 21.7 0.55 ab 21.6 0.44 ab
NSPases T11 82.62 1.89 79.51 1.47 abcd 83.15 1.20 a 81.76 0.91a 23.1 0.53 22.3 0.41 abcd 23.3 0.33 a 22.9 0.25 ab 10
Lipase+Lecithin+NSPases T12 78.87 2.74 73.81 1.10 d 77.33 1.60 ab 76.67 1.14c 22.1 0.77 20.7 0.31 d 21.7 0.45 ab 21.5 0.32 b
MeanSE 82.29 0.67 79.47 0.68 80.26 0.60 80.67 0.38 23.0 0.19 22.3 0.19 22.5 0.17 22.6 0.11
SEM 3.181 3.197 2.711 1.748 0.891 0.891 0.759 0.490
CD - 6.266 6.994 4.511 - 1.745 1.958 1.263
P-value1 0.063 0.013 <0.001 <0.001 0.063 0.012 <0.001 <0.001

Effect of SPR
0% 85.32 0.96 a 82.42 1.23 a 83.11 0.97 a 83.61 1.07 a 23.9 0.27 a 23.1 0.34 a 23.3 0.27 a 23.4 0.30 a
5% 81.79 1.07 ab 79.35 1.16 ab 79.21 1.08 b 80.11 1.11 b 22.9 0.30 ab 22.2 0.32 ab 22.2 0.30 b 22.4 0.31 ab
10% 79.78 1.30 b 76.46 1.01 b 78.08 0.99 b 78.11 1.12 b 22.3 0.36 b 21.4 0.28 b 21.9 0.28 b 21.9 0.31 b
SEM 1.591 1.599 1.355 0.874 0.445 0.445 0.380 0.245
CD 4.104 4.124 3.497 2.255 1.149 1.149 0.979 0.632
P-value1 0.003 0.001 0.001 <0.001 0.003 0.001 0.001 <0.001
Effect of Biotechnological Tool
No supplement 82.74 1.37 79.56 1.46 80.60 1.29 80.97 0.80 ab 23.2 0.38 22.3 0.41 22.6 0.36 22.7 0.22 a
Lipase+Lecithin 81.77 1.41 79.20 1.56 80.66 1.26 80.54 0.82 ab 22.9 0.39 22.2 0.44 22.6 0.35 22.6 0.23 ab
NSPases 83.51 1.20 80.82 1.02 81.06 0.98 81.87 0.61 a 23.4 0.34 22.7 0.27 22.7 0.27 22.9 0.17 a
Lipase+Lecithin+NSPases 81.16 1.38 78.06 1.37 78.21 1.31 79.07 0.79 b 22.7 0.39 21.8 0.39 21.9 0.37 22.1 0.22 b
SEM 1.837 1.846 1.565 1.009 0.514 0.514 0.438 0.283
CD - - - 0.979 - - - 0.554
P-value1 0.589 0.520 0.253 0.046 0.589 0.378 0.253 0.046
1An effect with a probability of less than 0.05 is considered significant, a-d Means with different superscripts in a column differ significantly

Table 4.32: Period wise and cumulative average feed efficiency of birds as influenced by different treatments and main factors during performance trial of layers
Dietary Description Feed efficiency (kg feed/kg egg mass) Feed efficiency (kg feed/ dozen egg)
SPR % Biotechnological Tool
Tr.
No. Period-I Period-II Period-III Cumulative Period-I Period-II Period-III Cumulative
No supplement T1 2.354 0.04 cd 2.550 0.04 bc 2.400 0.03 bcd 2.435 0.03 cd 1.629 0.01 de 1.776 0.00 c 1.691 0.01 f 1.698 0.02 cd
Lipase+Lecithin T2 2.317 0.05 d 2.410 0.02 d 2.412 0.04 bcd 2.379 0.03 d 1.631 0.01 de 1.725 0.01 cde 1.731 0.01 ef 1.696 0.02 cd
NSPases T3 2.364 0.01 cd 2.438 0.01 bd 2.412 0.02 cd 2.405 0.01 d 1.632 0.02 de 1.716 0.00 de 1.715 0.01 f 1.688 0.02 cd 0
Lipase+Lecithin+NSPases T4 2.309 0.02 d 2.402 0.02 d 2.414 0.03 bcd 2.375 0.02 d 1.599 0.03 e 1.686 0.00 e 1.705 0.01 f 1.664 0.02 d
No supplement T5 2.323 0.05 d 2.470 0.01 cd 2.388 0.01 bcd 2.394 0.03 d 1.637 0.02 de 1.738 0.00 cde 1.701 0.01 f 1.692 0.02 cd
Lipase+Lecithin T6 2.437 0.03 abcd 2.470 0.02 cd 2.373 0.04 cd 2.427 0.02 cd 1.729 0.01 abc 1.750 0.01 cd 1.714 0.01 f 1.731 0.01 bcd
NSPases T7 2.386 0.03 acd 2.467 0.03 cd 2.526 0.04 ab 2.460 0.03 bc 1.678 0.02 cd 1.771 0.0 c 1.832 0.01 c 1.760 0.02 bc 5
Lipase+Lecithin+NSPases T8 2.484 0.03 abc 2.682 0.04 a 2.640 0.02 a 2.602 0.03 a 1.752 0.02 ab 1.879 0.00 a 1.900 0.01 a 1.844 0.02 a
No supplement T9 2.468 0.04 abc 2.486 0.02 cd 2.620 0.07 a 2.524 0.03 abc 1.748 0.00 abc 1.777 0.01 c 1.855 0.02 b 1.794 0.02 ab
Lipase+Lecithin T10 2.526 0.05 a 2.647 0.07 ab 2.502 0.05 abc 2.558 0.04 ab 1.755 0.02 a 1.858 0.04 b 1.781 0.02 d 1.798 0.02 ab
NSPases T11 2.370 0.02 bcd 2.456 0.01 cd 2.354 0.03 d 2.393 0.02 c 1.689 0.01 bcd 1.777 0.01 c 1.693 0.01 f 1.720 0.02 cd 10
Lipase+Lecithin+NSPases T12 2.511 0.04 ab 2.687 0.02 a 2.513 0.03 abc 2.568 0.03 ab 1.757 0.01 a 1.871 0.01 a 1.772 0.00 de 1.800 0.02 a
MeanSE 2.404 0.02 2.513 0.02 2.463 0.02 2.460 0.01 1.686 0.01 1.777 0.01 1.757 0.01 1.740 0.01
SEM 0.052 0.043 0.053 0.039 0.023 0.019 0.015 0.026
CD 0.144 0.121 0.148 0.110 0.064 0.054 0.043 0.073

P-value1 0.01 <0.001 <0.001 <0.001 <0.001 <0.001 <0.001 <0.001
Effect of SPR
0% 2.336 0.02 b 2.450 0.02 b 2.409 .01 b 2.398 0.02 b 1.623 0.01 c 1.726 0.01 c 1.711 0.01 b 1.689 0.02 b
5% 2.408 0.02 a 2.523 0.03 a 2.482 0.04 a 2.471 0.03 a 1.699 0.02 b 1.784 0.02 b 1.786 0.03 a 1.757 0.02 a
10% 2.469 0.02 a 2.567 0.03 a 2.497 0.04 a 2.511 0.03 a 1.737 0.01 a 1.821 0.02 a 1.775 0.02 a 1.778 0.02 a
SEM 0.026 0.022 0.026 0.020 0.011 0.010 0.008 0.013
CD 0.067 0.056 0.068 0.051 0.029 0.025 0.020 0.034
P-value1 <0.001 <0.001 0.006 <0.001 <0.001 <0.001 <0.001 <0.001
Effect of Biotechnological Tool
No supplement 2.382 0.03 2.502 0.02 b 2.469 0.04 ab 2.451 0.02 b 1.671 0.02 bc 1.764 0.01 b 1.749 0.03 b 1.728 0.01 b
Lipase+Lecithin 2.427 1.41 2.509 0.04 b 2.429 0.03 b 2.455 0.02 b 1.705 0.0 a 1.778 0.02 b 1.742 0.35 b 1.741 0.01 ab
NSPases 2.373 1.20 2.454 0.01 b 2.431 0.03 b 2.419 0.01 b 1.666 0.01 c 1.755 0.01 b 1.747 0.27 b 1.723 0.01 b
Lipase+Lecithin+NSPases 2.435 1.38 2.588 0.05 a 2.522 0.04 a 2.515 0.03 a 1.703 0.03 ab 1.812 0.03 a 1.792 0.37 a 1.769 0.02 a
SEM 0.030 0.025 0.031 0.023 0.013 0.011 0.009 0.015
CD - 0.064 0.060 0.059 0.034 0.029 0.023 0.029
P-value1 0.118 <0.001 0.017 0.001 0.009 <0.001 <0.001 0.012
1An effect with a probability of less than 0.05 is considered significant, a-e Means with different superscripts in a column differ significantly

Table 4.33: Period wise and cumulative body weight change and livability of birds as influenced by different treatments and main factors during performance trial of layers
Dietary Description Body Weight Changes (g)
SPR % Biotechnological Tool
Tr.
No.
Initial Body
Weight (kg) Period-I Period-II Period-III Cumulative
Final Body
Weight (kg)
Livability
%
No supplement T1 1.548 0.03 -51.3 20.2 41.1 11.6 10.4 7.9 0.2 16.6 1.549 0.02 100.0 0.00
Lipase+Lecithin T2 1.547 0.03 -24.8 16.8 -14.7 11.2 40.2 13.0 0.7 22.1 1.547 0.03 100.0 0.00
NSPases T3 1.548 0.04 -24.4 12.3 1.1 13.7 -8.9 10.1 -32.8 13.1 1.522 0.03 100.00 0.00 0
Lipase+Lecithin+NSPases T4 1.527 0.04 -8.6 15.1 -9.7 14.6 36.9 10.6 18.6 18.7 1.540 0.03 91.67 8.33
No supplement T5 1.535 0.03 -18.3 18.3 6.6 16.7 22.7 10.8 11.0 18.8 1.546 0.03 100.00 0.00
Lipase+Lecithin T6 1.499 0.04 -7.6 14.8 20.3 26.4 25.1 14.6 37.8 25.9 1.537 0.05 100.00 0.00
NSPases T7 1.533 0.03 -48.7 12.1 -9.3 12.8 22.8 13.9 -35.3 14.3 1.498 0.03 100.00 0.00 5
Lipase+Lecithin+NSPases T8 1.573 0.03 -39.8 16.5 -1.5 17.9 52.3 13.7 11.0 27.4 1.584 0.03 100.00 0.00
No supplement T9 1.513 0.04 -24.5 15.9 140.7 132.0 8.4 7.4 119.4 133.7 1.511 0.05 91.67 8.33
Lipase+Lecithin T10 1.536 0.03 -8.9 18.0 -5.7 17.4 5.3 19.7 -9.8 26.2 1.517 0.03 100.00 0.00
NSPases T11 1.536 0.03 -1.4 23.5 -55.3 12.1 41.9 14.8 -14.8 23.6 1.521 0.03 100.00 0.00 10
Lipase+Lecithin+NSPases T12 1.493 0.03 -26.7 15.0 -11.2 16.4 9.6 11.2 -28.3 14.5 1.465 0.03 100.00 0.00
MeanSE 1.532 0.01 -23.8 4.8 8.5 12.0 22.2 3.8 6.5 12.5 1.528 0.01 98.61 0.97
SEM 0.046 23.8 58.1 18.0 61.4 0.046 1.60
CD - - - - - - -
0.918 0.516 0.215 0.032 0.516 0.595 0.547

Effect of SPR
0% 1.543 0.02 -27.3 8.2 4.5 7.0 19.6 5.9 -3.3 9.1 1.539 .01 97.92 2.08
5% 1.535 0.02 -28.6 7.9 4.0 9.4 30.7 6.7 6.1 11.4 1.541 0.02 100.00 0.00
10% 1.520 0.02 -15.4 9.0 17.1 34.3 16.3 7.1 16.6 34.7 1.503 0.02 97.92 2.08
SEM 0.023 11.9 29.1 9.0 30.7 0.023 0.80
CD - - - - - - -
0.600 0.475 0.877 0.249 0.809 0.186 0.613
Effect of Biotechnological Tool
No supplement 1.532 0.02 -31.4 10.5 62.8 44.3 13.8 5.1 43.5 45.0 1.535 0.02 97.2 2.78
Lipase+Lecithin 1.527 0.02 -13.8 9.4 0.0 11.2 23.5 9.3 9.6 14.3 1.534 0.02 100.00 0.00
NSPases 1.539 0.02 -24.8 10.0 -21.2 8.3 18.6 8.1 -27.6 10.0 1.514 0.02 100.00 0.00
Lipase+Lecithin+NSPases 1.531 0.02 -25.0 9.0 -7.5 9.2 32.9 7.3 0.5 12.2 1.530 0.02 97.22 2.78
SEM 0.027 13.7 33.6 10.4 35.4 0.027 0.93
CD - - - - - - -
P-value1 0.975 0.639 0.065 0.298 0.254 0.847 0.581
1An effect with a probability of less than 0.05 is considered significant

Table 4.41: Period wise and cumulative average protein and energy utilization efficiencies of birds as influenced by different treatments and main factors during performance trial of layers
Dietary Description Efficiency of Protein Utilization Efficiency of Energy Utilization
SPR % Biotechnological Tool
Tr.
No. Period-I Period-II Period-III Cumulative Period-I Period-II Period-III Cumulative
No supplement T1 29.03 0.54 abc 26.80 0.38 bc 28.47 0.31 abc 28.10 0.40 abcd 27.96 0.52 abc 25.80 0.36 bc 27.41 0.29 abc 27.06 0.38 abcd
Lipase+Lecithin T2 29.51 0.61 a 28.35 0.28 a 28.33 0.48 abc 28.73 0.31 ab 28.41 0.59 a 27.30 0.27 a 27.28 0.47 abc 27.66 0.30 ab
NSPases T3 28.89 0.16 abc 28.01 0.14 ab 28.32 0.22 abc 28.41 0.16 abc 27.82 0.15 abc 26.97 0.14 ab 27.27 0.22 abc 27.35 0.15 abc 0
Lipase+Lecithin+NSPases T4 29.59 0.31 a 28.44 0.23 a 28.31 0.36 abc 28.78 0.25 ab 28.49 0.30 a 27.38 0.22 a 27.26 0.35 abc 27.71 0.25 ab
No supplement T5 29.69 0.59 a 27.90 0.14 ab 28.87 0.12 abc 28.82 0.31 ab 28.60 0.56 a 26.88 0.13 ab 27.80 0.11 abc 27.76 0.30 ab
Lipase+Lecithin T6 28.29 0.38 abc 27.90 0.26 ab 29.06 0.53 ab 28.42 0.26 abc 27.25 0.36 abc 26.88 0.25 ab 27.99 0.51 ab 27.37 0.25 abc
NSPases T7 28.89 0.33 abc 27.94 0.30 ab 27.30 0.37 cde 28.04 0.29 abcd 27.83 0.32 abc 26.91 0.28 ab 26.29 0.36 cde 27.01 0.28 abcd 5
Lipase+Lecithin+NSPases T8 27.75 0.30 bc 25.71 0.37 c 26.11 0.17 e 26.52 0.34 e 26.73 0.29 bc 24.76 0.36 c 25.15 0.17 e 25.55 0.33 e
No supplement T9 28.26 0.47 abc 28.04 0.26 ab 26.64 0.75 de 27.65 0.37 bcde 27.19 0.45 abc 26.98 0.25 ab 25.64 0.72 de 26.60 0.35 bcde
Lipase+Lecithin T10 27.61 0.54 c 26.36 0.72 c 27.88 0.57 bcd 27.28 0.39 cde 26.57 0.52 bc 25.37 0.69 c 26.82 0.55 bcd 26.25 0.37 cde
NSPases T11 29.41 0.28 ab 28.38 0.14 a 29.62 0.35 a 29.13 0.23 a 28.30 0.27 ab 27.31 0.14 a 28.50 0.33 a 28.03 0.23 a 10
Lipase+Lecithin+NSPases T12 27.77 0.44 bc 26.01 0.20 c 27.73 0.31 bcde 27.17 0.33 de 26.72 0.42 bc 25.03 0.19 c 26.69 0.30 bcde 26.14 0.32 e
MeanSE 28.72 0.16 27.49 0.18 28.05 0.19 28.09 0.11 27.65 0.16 26.46 0.17 27.01 0.18 27.04 0.11
SEM 0.613 0.455 0.589 0.440 0.590 0.438 0.567 0.423
CD 1.716 1.275 1.648 1.231 1.652 1.227 1.587 1.185
P-value1 0.010 <0.001 <0.001 <0.001 0.009 <0.001 <0.001 <0.001

Effect of SPR
0% 29.25 0.21 a 27.90 0.23 a 28.36 0.15 28.50 0.25 a 28.17 0.20 a 26.86 0.22 a 27.30 0.15 27.44 0.25 a
5% 28.66 0.28 ab 27.36 0.31 b 27.83 0.39 27.95 0.36 ab 27.60 0.27 ab 26.36 0.30 b 26.81 0.38 26.92 0.34 ab
10% 28.26 0.28 b 27.19 0.35 b 27.97 0.39 27.81 0.36 b 257.190.27 b 26.17 0.34 b 26.91 0.38 26.76 0.35 b
SEM 0.306 0.228 0.294 0.220 0.295 0.219 0.283 0.212
CD 0.600 0.446 - 0.567 0.578 0.430 - 0.546
P-value1 0.012 0.013 0.203 0.005 0.011 0.012 0.205 0.004
Effect of Biotechnological Tool
No supplement 28.99 0.34 27.58 0.24 a 27.99 0.42 ab 28.19 0.22 a 27.91 0.33 26.55 0.23 a 26.95 0.40 ab 27.14 0.21 a
Lipase+Lecithin 28.47 0.38 27.54 0.38 a 28.42 0.32 a 28.14 0.22 ab 27.41 0.37 26.51 0.37 a 27.37 0.31 a 27.10 0.21 ab
NSPases 29.06 0.16 28.11 0.12 a 28.41 0.37 a 28.53 0.16 a 27.98 0.15 27.06 0.12 a 27.35 0.35 a 27.47 0.15 a
Lipase+Lecithin+NSPases 28.38 0.35 26.72 0.45 b 27.38 0.36 b 27.49 0.25 b 27.31 0.34 25.73 0.44 b 26.36 0.34 b 26.47 0.24 b
SEM 0.354 0.263 0.340 0.254 0.341 0.253 0.327 0.244
CD - 0.678 0.666 0.655 - 0.653 0.641 0.630
P-value1 0.138 <0.001 0.017 0.001 0.138 <0.001 0.017 0.001
1An effect with a probability of less than 0.05 is considered significant, a-e Means with different superscripts in a column differ significantly

Table 4.43: Blood mineral profile of birds as influenced by various treatments and main factors at different intervals during
performance trial of layers
Dietary Description Serum Calcium (mg/dl) Serum Inorganic Phosphorus (mg/dl)
SPR % Biotechnological Tool
Tr.
No. 28th Day 56th Day 84th Day Mean 28th Day 56th Day 84th Day Mean
No supplement T1 18.00 0.26 18.87 0.09 18.93 0.52 18.60 0.23 6.73 0.09 7.83 0.15 8.67 0.32 7.74 0.30
Lipase+Lecithin T2 17.67 0.54 19.03 0.29 19.20 0.15 18.63 0.30 6.33 0.29 7.70 0.55 8.63 0.24 7.56 0.39
NSPases T3 18.13 0.28 19.17 0.28 19.20 0.35 18.83 0.23 6.83 0.37 7.70 0.10 8.73 0.12 7.76 0.30 0
Lipase+Lecithin+NSPases T4 17.80 0.75 18.97 0.32 19.17 0.26 18.64 0.33 6.43 0.32 8.10 0.32 8.70 0.21 7.74 0.37
No supplement T5 17.30 0.17 18.93 0.23 19.10 0.12 18.44 0.30 6.70 0.81 8.17 0.07 8.90 0.23 7.92 0.40
Lipase+Lecithin T6 17.47 0.72 18.77 0.55 19.10 0.53 18.44 0.39 6.20 0.21 7.97 0.27 8.73 0.12 7.63 0.39
NSPases T7 17.50 0.51 18.53 0.20 19.03 0.46 18.36 0.31 6.63 0.43 8.10 0.15 8.67 0.23 7.80 0.34 5
Lipase+Lecithin+NSPases T8 17.50 0.62 18.97 0.24 18.83 0.35 18.43 0.32 6.43 0.32 8.23 0.32 8.67 0.12 7.78 0.37
No supplement T9 18.10 0.52 19.20 0.29 19.07 0.45 18.79 0.28 6.30 0.35 8.00 0.26 8.67 0.09 7.66 0.38
Lipase+Lecithin T10 18.10 0.51 18.63 0.66 18.77 0.13 18.50 0.27 7.17 0.20 8.10 0.15 8.63 0.03 7.97 0.23
NSPases T11 18.07 0.46 18.70 0.35 19.20 0.50 18.66 0.28 6.77 0.26 8.47 0.34 8.67 0.23 7.97 0.33 10
Lipase+Lecithin+NSPases T12 18.10 0.35 18.63 0.18 18.73 0.19 18.49 0.16 6.60 0.15 8.30 0.42 8.70 0.12 7.87 0.35
MeanSE 17.81 0.13 18.87 0.09 19.03 0.09 18.57 0.08 6.59 0.10 8.06 0.08 8.70 0.05 7.78 0.10
SEM 0.715 0.485 0.520 0.407 0.512 0.413 0.268 0.492
CD - - - - - - - -
P-value1 0.954 0.945 0.994 0.990 0.841 0.784 0.999 0.999

Effect of SPR
0% 17.90 0.22 19.01 0.12 19.13 10.15 18.68 0.13 6.58 0.14 7.83 0.15 8.68 0.10 7.70 0.16
5% 17.44 0.23 18.80 0.15 19.02 0.17 18.42 0.16 6.49 0.22 8.12 0.10 8.74 0.08 7.78 0.18
10% 18.09 0.20 18.79 0.19 18.94 0.16 18.61 0.12 6.71 0.14 8.22 0.14 8.67 0.06 7.86 0.16
SEM 0.358 0.242 0.260 0.203 0.256 0.206 0.134 0.246
CD - - - - - - - -
P-value1 0.196 0.605 0.780 0.425 0.701 0.178 0.842 0.801
Effect of Biotechnological Tool
No supplement 17.80 0.22 19.00 0.12 19.03 0.20 18.61 0.15 6.58 0.26 8.00 0.10 8.74 0.12 7.77 0.20
Lipase+Lecithin 17.74 0.31 18.81 0.27 19.02 0.18 18.53 0.18 6.57 0.19 7.92 0.19 8.67 0.08 7.73 0.19
NSPases 17.90 0.24 18.80 0.17 19.14 0.22 18.61 0.16 6.74 0.18 8.09 0.16 8.69 0.10 7.84 0.18
Lipase+Lecithin+NSPases 17.80 0.31 18.86 0.14 18.91 0.15 18.52 0.16 6.49 0.14 8.21 0.18 8.69 0.08 7.80 0.20
SEM 0.413 0.280 0.300 0.235 0.296 0.238 0.155 0.284
CD - - - - - - - -
P-value1 0.985 0.884 0.894 0.962 0.850 0.658 0.964 0.979
1An effect with a probability of less than 0.05 is considered significant

Table 4.42: Metabolizability of dry matter and organic matter and retention of calcium and phosphorus of diets as influenced by different treatments and main factors during performance trail of layers
Dietary Description Metabolizability of Nutrients (%) Retention of Minerals
SPR % Biotechnological Tool
Tr.
No. Dry Matter Organic Matter Ca, % Ca, g/h/d P, % P, g/h/d
No supplement T1 71.22 2.07 72.38 0.77 a 76.06 1.44 4.37 0.00 58.62 1.16 0.66 0.00
Lipase+Lecithin T2 68.30 2.85 71.51 0.56 ac 73.78 1.63 4.14 0.00 58.68 2.38 0.68 0.00
NSPases T3 69.68 0.23 72.09 0.90 ab 75.46 0.64 4.22 0.00 62.16 0.76 0.72 0.00 0
Lipase+Lecithin+NSPases T4 70.73 1.54 71.36 0.02 abcd 75.55 0.84 4.21 0.00 61.73 0.70 0.72 0.00
No supplement T5 69.66 1.84 69.29 1.04 cdef 76.17 1.27 4.31 0.00 60.61 2.52 0.66 0.00
Lipase+Lecithin T6 70.04 1.48 69.55 0.59 cdef 76.21 1.44 4.16 0.00 60.32 0.73 0.65 0.00
NSPases T7 70.83 2.77 69.14 0.71 defg 77.11 2.39 4.08 0.00 60.51 2.43 0.64 0.00 5
Lipase+Lecithin+NSPases T8 72.54 2.79 70.07 0.23 bcde 78.06 2.03 4.36 0.00 62.43 2.28 0.68 0.00
No supplement T9 68.19 4.13 68.23 0.47 fg 75.25 2.95 4.33 0.00 58.34 4.85 0.62 0.00
Lipase+Lecithin T10 68.27 2.17 68.67 0.67 fg 75.46 1.47 4.38 0.00 59.35 2.44 0.62 0.00
NSPases T11 68.28 1.21 67.97 0.78 g 76.45 0.69 4.20 0.00 60.95 1.46 0.66 0.00 10
Lipase+Lecithin+NSPases T12 71.02 0.90 69.04 0.42 efg 77.22 0.65 4.04 0.00 63.25 1.01 0.67 0.00
SEM 3.16 0.93 2.28 0.13 3.13 0.03
CD - 2.69 - - - -
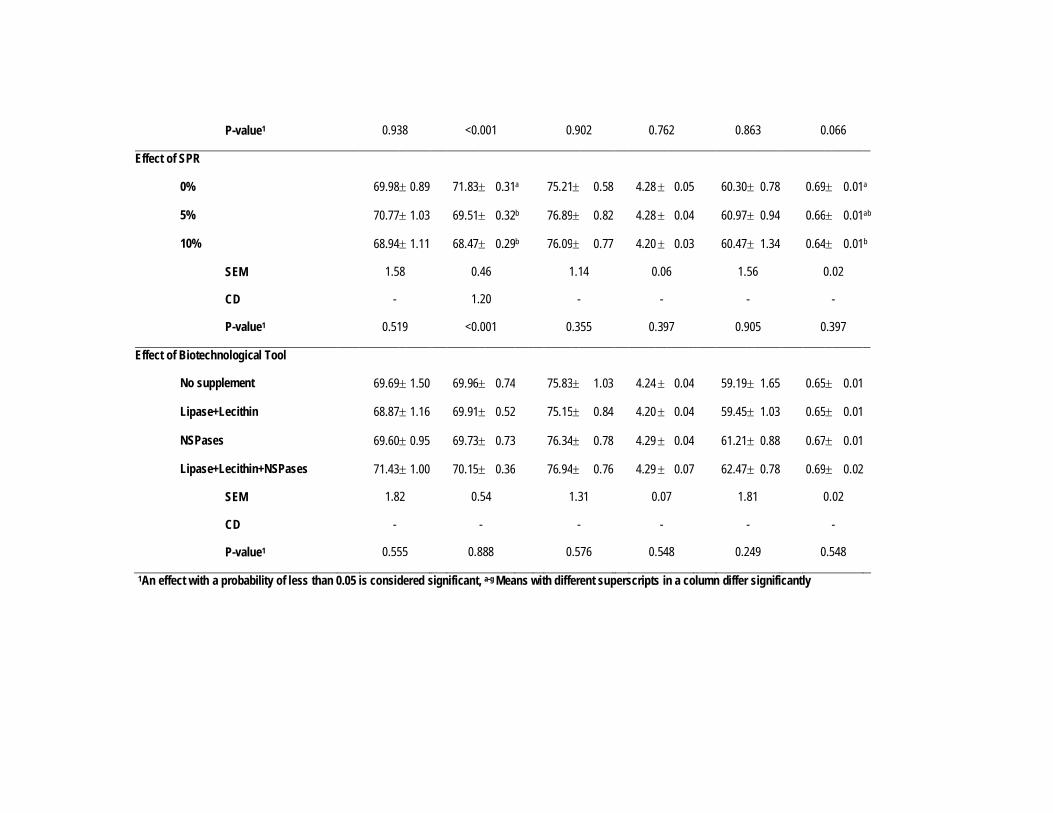
P-value1 0.938 <0.001 0.902 0.762 0.863 0.066
Effect of SPR
0% 69.98 0.89 71.83 0.31a 75.21 0.58 4.28 0.05 60.30 0.78 0.69 0.01a
5% 70.77 1.03 69.51 0.32b 76.89 0.82 4.28 0.04 60.97 0.94 0.66 0.01ab
10% 68.94 1.11 68.47 0.29b 76.09 0.77 4.20 0.03 60.47 1.34 0.64 0.01b
SEM 1.58 0.46 1.14 0.06 1.56 0.02
CD - 1.20 - - - -
P-value1 0.519 <0.001 0.355 0.397 0.905 0.397
Effect of Biotechnological Tool
No supplement 69.69 1.50 69.96 0.74 75.83 1.03 4.24 0.04 59.19 1.65 0.65 0.01
Lipase+Lecithin 68.87 1.16 69.91 0.52 75.15 0.84 4.20 0.04 59.45 1.03 0.65 0.01
NSPases 69.60 0.95 69.73 0.73 76.34 0.78 4.29 0.04 61.21 0.88 0.67 0.01
Lipase+Lecithin+NSPases 71.43 1.00 70.15 0.36 76.94 0.76 4.29 0.07 62.47 0.78 0.69 0.02
SEM 1.82 0.54 1.31 0.07 1.81 0.02
CD - - - - - -
P-value1 0.555 0.888 0.576 0.548 0.249 0.548
1An effect with a probability of less than 0.05 is considered significant, a-g Means with different superscripts in a column differ significantly


Table 4.44: Period wise and cumulative average net returns of birds as influenced by different treatments and main factors during performance trial of layers
Dietary Description Mean Net Returns (Rs./bird)
SPR Biotech. Tool
Tr.
No. Period-I Period-II Period-III Cumulative
No supplement T1 12.78 0.19a
b 9.87 0.06c
11.74 0.08a
11.47 0.43ab
Lipase+Lecithin T2 12.49 0.17a
b 10.54 0.08abc
10.45 0.09cd
11.16 0.34ab
NSPases T3 12.51 0.31a
b 10.95 0.02ab
10.92 0.12bc
11.46 0.28ab
0
Lipase+Lecithin+NSPases T4 12.68 0.44
a
b 11.11 0.07a
10.63 0.10bc
11.48 0.34ab
No supplement T5 13.20 0.26a 11.19 0.02a 11.97 0.12a 12.12 0.30a
Lipase+Lecithin T6 10.65 0.10c 10.33 0.22abc 11.13 0.12b 10.70 0.14ab
NSPases T7 11.96 0.29b
10.24 0.19bc
8.98 0.20e
10.39 0.45ab
c 5
Lipase+Lecithin+NSPases T8 9.83 0.23
d 7.62 0.06
e 7.23 0.10
f 8.23 0.41
c
No supplement T9 11.10 0.04c
10.56 0.18abc
9.13 0.21e
10.26 0.31ab
c
Lipase+Lecithin T10 10.60 0.27c 8.67 0.51d 10.01 0.32d 9.76 0.34bc
NSPases T11 12.24 0.22a
b 10.53 0.10abc
12.25 0.10a
11.67 0.30ab 10
Lipase+Lecithin+NSPases T12 10.26 0.19
c 8.08 0.13
de 9.85 0.04
d 9.39 0.34
bc
MeanSE 11.69 0.19 9.97 0.20 10.36 0.24 10.67 0.14
SEM 0.348 0.266 0.215 0.833
CD 0.975 0.744 0.602 2.332
P-value1 <0.001 <0.001 <0.001 <0.001
Effect of SPR
0% 12.62 0.13a 10.62 .15a 10.94 0.16a 11.39 0.29a
5% 11.41 0.40b 9.84 0.41b 9.83 0.56c 10.36 0.50ab
10% 11.05 0.24b 9.46 0.36c 10.31 0.36b 10.27 0.37b
SEM 0.174 0.133 0.107 0.416
CD 0.449 0.343 0.277 1.074

P-value1 <0.001 <0.001 <0.001 <0.001
Effect of Biotechnological Tool
No supplement 12.36 0.33a 10.54 0.20a 10.95 0.46a 11.28 0.25a
Lipase+Lecithin 11.25 0.32b 9.85 0.34b 10.53 0.19b 10.54 0.20ab
NSPases 12.24 0.16a 10.58 0.12a 10.72 0.48a 11.18 0.22a
Lipase+Lecithin+NSPases 10.92 0.47c 8.93 0.55c 9.24 0.52c 9.70 0.33b
SEM 0.201 0.153 0.124 0.481
CD 0.519 0.396 0.320 1.240
P-value1 <0.001 <0.001 <0.001 <0.001
1An effect with a probability of less than 0.05 is considered significant,
a-e Means with different superscripts in a column differ significantly

Table 4.31: Period wise and cumulative average feed consumption of birds as influenced by different treatments and main factors during performance trial of layers
Dietary Description Feed Consumption (g/bird/day)
SPR Biotech. Tool
Tr.
No. Period-I Period-II Period-III Cumulative
No supplement T1 114.7 0.95
117.5 0.46ab
118.3 0.43a
116.4 0.54abc
d
Lipase+Lecithin T2 116.8 1.13 118.7 0.46a 119.0 0.37a 117.9 0.55a
NSPases T3 115.5 1.39 119.1 0.34a 118.4 0.39a 117.3 0.70ab 0
Lipase+Lecithin+NSPases T4 114.4 1.40
118.7 0.44
a 118.2 0.61
a 116.7 0.75
abc
d
No supplement T5 116.1 1.38 118.3 0.47ab 118.1 0.58a 117.3 0.66ab
Lipase+Lecithin T6 115.7 0.71
116.8 0.58abc
117.4 0.45ab
116.4 0.39abc
d
NSPases T7 116.0 1.13 118.7 0.63a 117.8 0.65a 117.3 0.59ab 5
Lipase+Lecithin+NSPases T8 115.0 1.14
117.8 0.41
ab 117.4 0.48
ab 116.4 0.58
abc
d
No supplement T9 114.4 0.88 114.9 0.85c 115.2 0.80abc 114.8 0.50d
Lipase+Lecithin T10 115.6 0.99 116.1 1.32abc 114.7 1.25c 115.6 0.66bcd
NSPases T11 116.3 1.08 117.7 0.36ab 117.3 0.71ab 117.0 0.52abc 10
Lipase+Lecithin+NSPases T12 115.5 0.74
115.1 0.72
c 114.2 0.55
c 115.0 0.42
cd
MeanSE 115.5 0.90 117.4 1.04 117.2 1.28 116.5 0.60
SEM 1.56 0.91 0.92 0.83
CD - 2.35 2.37 2.13
P-value1 0.924 <0.001 <0.001 0.002
Effect of SPR
0% 115.4 1.23 118.5 0.39a 118.5 0.32a 117.1 0.97a
5% 115.7 1.09 117.9 0.48a 117.7 0.37a 116.9 0.85a
10% 115.4 0.92 115.9 0.80b 115.4 0.67b 115.6 0.83b
SEM 0.78 0.46 0.46 0.41
CD - 1.18 1.18 1.06
P-value1 0.897 <0.001 <0.001 0.001

Effect of Biotechnological Tool
No supplement 115.1 0.63 116.9 0.45b 117.2 0.48 116.2 0.35
Lipase+Lecithin 116.0 0.55 117.2 0.53b 117.0 0.61 116.6 0.33
NSPases 115.9 0.68 118.5 0.28a 117.8 0.34 117.2 0.35
Lipase+Lecithin+NSPases 115.0 0.64 117.2 0.43b 116.6 0.52 116.1 0.35
SEM 0.90 0.53 0.53 0.48
CD - 1.03 - -
P-value1 0.511 0.015 0.127 0.065
1An effect with a probability of less than 0.05 is considered significant,
a-d Means with different superscripts in a column differ significantly
Table 4.34: Period wise and cumulative average egg weight of birds as influenced by different treatments and main factors during performance trial of layers
Dietary Description Mean Egg Weight (g)
SPR %
Biotechnological Tool
Tr.
No. Period-I Period-II Period-III Cumulative
No supplement T1 57.67 0.47 c 57.81 0.43 c 58.73 0.45 48.12 0.26 e
Lipase+Lecithin T2 58.69 0.47 abc 59.67 0.43 ab 59.83 0.39 59.43 0.25 abc
NSPases T3 57.51 0.37 c 58.66 0.37 abc 59.25 0.36 58.54 0.21 cde 0
Lip+Lec+NSPases T4 57.72 0.47 c 58.49 0.46 bc 58.90 0.36 58.41 0.24 de
No supplement T5 58.73 0.33 abc 58.62 0.38 bc 59.35 0.68 58.94 0.30 abcd
Lipase+Lecithin T6 59.15 0.57 ab 59.04 0.59 abc 60.21 0.53 59.52 0.32 ab
NSPases T7 58.61 0.51 abc 59.82 0.47 ab 60.44 0.44 59.68 0.28 a 5
Lip+Lec+NSPases T8 58.77 0.42 abc 58.42 0.41 bc 59.97 0.29 59.12 0.22 abcd
No supplement T9 59.06 0.59 ab 59.60 0.57 ab 59.12 0.52 59.25 0.32 abcd
Lipase+Lecithin T10 57.92 0.52 bc 58.51 0.51 bc 59.32 0.45 58.64 0.29 bcde
NSPases T11 59.38 0.39 a 60.30 0.46 a 59.96 0.37 59.89 0.23 a 10
Lip+Lec+NSPases T12 58.33 0.38 abc 58.17 0.39 bc 58.76 0.35 58.45 0.22 de
MeanSE 58.46 0.13 58.9 0.13 59.49 0.13 59.00 0.08
SEM 0.66 0.65 0.63 0.37
CD 1.28 1.68 - 0.97

P-value1 0.047 0.002 0.066 <0.001
Effect of SPR
0% 57.9 1.10b 58.7 1.05 59.18 1.07b 58.62 1.08b
5% 58.8 1.13a 59.0 1.15 59.99 1.38a 59.32 1.25a
10% 58.7 1.18ab 59.1 1.21 59.29 1.18b 59.05 1.19ab
SEM 0.33 0.65 0.31 0.19
CD 0.64 - 0.61 0.48
P-value1 0.011 0.317 0.019 0.001
Effect of Biotechnological Tool
No supplement 58.49 0.28 58.68 0.27ab 59.07 0.32 58.77 0.17b
Lipase+Lecithin 58.59 0.30 59.07 0.30ab 59.79 0.27 59.20 0.17ab
NSPases 58.50 0.25 59.59 0.25a 59.88 0.23 59.37 0.14a
Lipase+Lecithin+NSPases 58.27 0.25 58.36 0.24b 59.21 0.20 58.66 0.13b
SEM 0.38 0.38 0.36 0.22
CD - 0.97 - 0.56
P-value1 0.865 0.008 0.053 0.002
1An effect with a probability of less than 0.05 is considered significant,
a-e Means with different superscripts in a column differ significantly
Table 4.39: Average yolk index values of eggs of birds as affected by different treatments and main factors at different intervals during performance trail of layers
Dietary Description Yolk Index
SPR % Biotechnological Tool
Tr. No. 1st Day 28th Day 56th Day 84th Day Cumulative
No supplement T1 29.97 0.56 36.43 0.41 32.325 0.45 33.47 0.45 33.18 0.47
Lipase+Lecithin T2 30.13 0.59 36.41 0.39 33.545 0.51 34.24 0.67 33.80 0.49
NSPases T3 31.34 0.15 35.42 0.64 33.393 0.49 34.99 0.77 33.73 0.37 0
Lipase+Lecithin+NSPases T4 31.50 0.30 34.95 0.39 32.702 0.28 33.61 0.36 33.05 0.26
No supplement T5 29.92 0.56 36.55 0.34 33.770 0.56 34.52 0.55 33.61 0.46
Lipase+Lecithin T6 30.15 0.36 36.28 0.63 34.011 0.20 34.34 0.70 33.72 0.44
5
NSPases T7 30.31 0.32 36.07 0.62 32.683 0.33 32.42 0.57 32.82 0.39

Lipase+Lecithin+NSPases T8 31.41 0.29 35.06 0.34 32.698 0.40 32.79 0.83 32.95 0.36
No supplement T9 30.10 0.45 36.34 0.59 32.989 0.32 35.42 0.57 33.76 0.47
Lipase+Lecithin T10 30.01 0.52 34.80 0.43 33.730 0.66 33.62 0.64 32.97 0.41
NSPases T11 31.53 0.27 35.62 0.39 32.974 0.35 33.82 0.62 33.44 0.30 10
Lipase+Lecithin+NSPases T12 31.57 0.42 35.73 0.56 33.694 0.40 33.20 0.52 33.50 0.34
SEM 0.768 0.697 0.608 0.873 0.569
CD - - - - -
P-value1 0.066 0.095 0.101 0.033 0.627
Effect of SPR
0% 30.74 0.58 35.80 0.47 32.991 0.43 34.08 0.57 33.44 0.79
5% 30.45 0.56 35.99 0.49 33.290 0.41 33.52 0.68 33.27 0.80
10% 30.80 0.54 35.62 0.49 33.347 0.43 34.01 0.60 33.42 0.74
SEM 0.384 0.348 0.304 0.437 0.285
CD - - - - -
P-value1 0.618 0.034 0.455 0.375 0.820
Effect of Biotechnological Tool
No supplement 30.00 0.33 36.44 0.26 33.028 0.27 34.47 0.33 33.51 0.27
Lipase+Lecithin 30.10 0.33 35.83 0.31 33.762 0.28 34.07 0.38 33.50 0.26
NSPases 31.06 0.20 35.70 0.32 33.017 0.23 33.74 0.41 33.33 0.21
Lipase+Lecithin+NSPases 31.49 0.35 35.25 0.25 33.031 0.22 33.20 0.34 33.17 0.19
SEM 0.443 0.402 0.351 0.504 0.329
CD - - - - -
P-value1 0.001 0.578 0.091 0.085 0.691
1An effect with a probability of less than 0.05 is considered significant,
Table 4.38: Average yolk colour values of eggs of birds as affected by different treatments and main factors at different intervals during performance trail of layers
Dietary Description Yolk Colour
SPR Biotechnological Tool Tr. No. 1st Day 28th Day 56th Day 84th Day Cumulative

%
No supplement T1 7.17 0.17 6.61 0.15 6.364 0.15 6.55 0.14 6.68 0.09
Lipase+Lecithin T2 7.27 0.59 7.19 0.18 6.091 0.16 6.30 0.14 6.73 0.11
NSPases T3 7.36 0.15 7.00 0.30 6.272 0.29 6.45 0.14 6.78 0.13 0
Lipase+Lecithin+NSPases T4 7.50 0.30 6.82 0.18 6.091 0.25 6.37 0.13 6.71 0.12
No supplement T5 7.08 0.56 7.10 0.16 7.182 0.26 6.25 0.12 6.91 0.12
Lipase+Lecithin T6 7.29 0.36 7.10 0.16 7.000 0.00 6.55 0.21 6.99 0.11
NSPases T7 7.5 0.32 7.10 0.09 6.364 0.20 6.45 0.20 6.87 0.11 5
Lipase+Lecithin+NSPases T8 7.50 0.29 7.29 0.18 6.575 0.24 6.36 0.23 6.94 0.12
No supplement T9 7.60 0.45 7.44 0.14 6.482 0.14 6.34 0.13 6.98 0.11
Lipase+Lecithin T10 7.20 0.52 7.45 0.20 6.259 0.18 6.33 0.14 6.82 0.11
NSPases T11 7.17 0.27 7.20 0.23 6.182 0.26 6.64 0.28 6.80 0.13 10
Lipase+Lecithin+NSPases T12 7.63 0.42 6.63 0.19 6.636 0.13 6.09 0.16 6.77 0.11
SEM 0.245 0.263 0.290 0.247 0.160
CD - - - - -
P-value1 0.332 0.019 0.003 0.716 0.581
Effect of SPR
0% 7.32 0.15 6.90 0.21 6.204 0.21 6.42 0.13 6.73 0.2
5% 7.34 0.23 7.15 0.14 6.780 0.21 6.40 0.18 6.93 0.2
10% 7.40 0.14 7.18 0.20 6.390 0.18 6.35 0.18 6.84 0.2
SEM 0.123 0.132 0.145 0.123 0.080
CD - - - - -
P-value1 0.812 0.182 <0.001 0.838 0.042
Effect of Biotechnological Tool
No supplement 7.28 0.12 7.05 0.10 6.676 0.13 6.38 0.08 6.86 0.1
Lipase+Lecithin 7.25 0.12 7.25 0.10 6.450 0.10 6.39 0.09 6.85 0.1
NSPases 7.34 0.08 7.10 0.13 6.272 0.14 6.51 0.12 6.82 0.1
Lipase+Lecithin+NSPases 7.54 0.08 6.91 0.11 6.434 0.13 6.27 0.10 6.81 0.1
SEM 0.142 0.152 0.167 0.143 0.093
CD - - - - -

P-value1 0.171 0.076 0.122 0.425 0.948
1An effect with a probability of less than 0.05 is considered significant,
Table 4.37: Average Haugh unit score values of eggs of birds as affected by different treatments and main factors at different intervals during performance trail of layers
Dietary Description Haugh Unit Score
SPR % Biotechnological Tool
Tr. No. 1st Day 28th Day 56th Day 84th Day Cumulative
No supplement T1 55.27 2.18 70.92 1.97 57.884 2.56 53.07 2.04 59.82 1.58
Lipase+Lecithin T2 54.12 0.59 70.63 1.16 58.087 1.75 49.84 1.89 58.73 1.54
NSPases T3 58.15 0.15 69.31 0.81 54.279 1.20 51.08 2.19 58.85 1.35 0
Lipase+Lecithin+NSPases T4 57.53 0.30 70.22 0.63 56.465 2.05 50.54 1.98 59.30 1.46
No supplement T5 51.06 0.56 69.96 1.60 60.203 0.99 48.82 1.72 58.03 1.63
Lipase+Lecithin T6 54.18 0.36 71.81 1.92 55.970 1.18 51.85 2.16 59.00 1.53
NSPases T7 54.92 0.32 70.72 1.05 56.994 1.21 56.14 0.89 60.20 1.33 5
Lipase+Lecithin+NSPases T8 51.42 0.29 69.81 0.56 58.783 1.22 45.72 3.69 57.01 1.81
No supplement T9 52.42 0.29 69.81 0.56 58.783 1.22 45.72 3.69 57.01 1.81
Lipase+Lecithin T10 52.64 0.45 69.52 1.37 58.880 2.30 50.41 1.85 58.40 1.52
NSPases T11 56.29 0.52 67.70 0.64 56.906 2.02 52.22 3.04 58.88 1.43 10
Lipase+Lecithin+NSPases T12 54.24 0.27 69.12 1.32 57.569 1.04 50.63 1.90 58.46 1.38
SEM 2.498 2.144 2.303 3.155 2.127
CD - - - - -
P-value1 0.137 0.476 0.527 0.258 0.985
Effect of SPR
0% 56.27 1.76 70.27 1.17 56.200 1.74 51.13 1.91 59.31 2.9
5% 52.89 2.02 70.57 1.30 57.988 1.17 50.63 2.44 58.92 3.0
10% 54.37 1.48 68.15 1.75 57.777 1.52 51.35 2.14 58.68 2.8
SEM 1.249 1.072 1.152 1.577 1.075
CD - - - - -

P-value1 0.028 0.672 0.216 0.898 0.839
Effect of Biotechnological Tool
No supplement 52.99 1.19 70.13 0.94 58.736 1.14 50.77 1.09 58.91 0.9
Lipase+Lecithin 54.86 0.96 70.05 0.81 56.349 0.85 51.30 1.36 59.00 0.9
NSPases 55.77 0.93 69.72 0.62 56.281 0.69 52.62 1.08 59.31 0.8
Lipase+Lecithin+NSPases 54.43 1.06 68.76 1.08 57.919 0.84 49.46 1.60 58.66 0.9
SEM 1.442 1.238 1.330 1.822 1.242
CD - - - - -
P-value1 0.280 0.052 0.154 0.382 0.964
1An effect with a probability of less than 0.05 is considered significant,
Table 4.36: Average albumen index values of eggs of birds as affected by different treatments and main factors at different intervals during performance trail of layers
Dietary Description Albumen Index
SPR % Biotechnological Tool
Tr. No. 1st Day 28th Day 56th Day 84th Day Cumulative
No supplement T1 3.11 0.21 6.31 0.32 4.504 0.29 4.08 0.18 4.56 0.24
Lipase+Lecithin T2 3.02 0.59 6.51 0.35 4.296 0.16 3.77 0.22 4.45 0.24
NSPases T3 3.12 0.15 6.36 0.16 4.159 0.14 3.92 0.23 4.36 0.20 0
Lipase+Lecithin+NSPases T4 3.38 0.30 6.64 0.12 4.448 0.28 3.96 0.20 4.58 0.21
No supplement T5 2.76 0.56 6.40 0.30 4.696 0.13 3.84 0.19 4.39 0.22
Lipase+Lecithin T6 3.10 0.36 7.11 0.31 4.260 0.17 4.13 0.22 4.61 0.25
NSPases T7 3.14 0.32 6.83 0.21 4.613 0.15 4.42 0.11 4.71 0.21 5
Lipase+Lecithin+NSPases T8 3.14 0.29 6.35 0.12 4.598 0.13 3.69 0.28 4.42 0.20
No supplement T9 2.82 0.45 6.32 0.29 4.586 0.20 3.87 0.16 4.36 0.22
Lipase+Lecithin T10 3.16 0.52 6.23 0.14 4.298 0.17 4.11 0.36 4.42 0.20
NSPases T11 2.95 0.27 6.55 0.21 4.602 0.11 3.93 0.22 4.47 0.22 10
Lipase+Lecithin+NSPases T12 3.10 0.42 6.07 0.33 4.357 0.07 4.19 0.27 4.40 0.20
SEM 0.203 0.356 0.251 0.324 0.307

CD - - - - -
P-value1 0.225 0.266 0.495 0.660 0.991
Effect of SPR
0% 3.16 0.16 6.46 0.24 4.352 0.21 3.93 0.19 4.49 0.43
5% 3.04 0.14 6.67 0.24 4.541 0.14 4.02 0.21 4.53 0.43
10% 3.01 0.14 6.29 0.24 4.461 0.14 4.03 0.25 4.42 0.4
SEM 0.101 0.178 0.125 0.162 0.153
CD - - - - -
P-value1 0.310 0.397 0.320 0.802 0.746
Effect of Biotechnological Tool
No supplement 2.90 0.10 6.34 0.17 4.595 0.12 3.93 0.10 4.44 0.13
Lipase+Lecithin 3.09 0.08 6.62 0.17 4.285 0.09 4.00 0.16 4.50 0.13
NSPases 3.07 0.07 6.58 0.11 4.458 0.08 4.09 0.12 4.52 0.12
Lipase+Lecithin+NSPases 3.21 0.08 6.35 0.13 4.468 0.10 3.95 0.15 4.47 0.12
SEM 0.117 0.206 0.145 0.187 0.177
CD - - - - -
P-value1 0.069 0.108 0.205 0.832 0.973
1An effect with a probability of less than 0.05 is considered significant,
Table 4.35: Average shape index values of eggs of birds as affected by different treatments and main factors at different intervals during performance trail of layers
Dietary Description Egg Shape Index
SPR % Biotechnological Tool
Tr. No. 1st Day 28th Day 56th Day 84th Day Cumulative
No supplement T1 77.71 1.17 78.33 2.08 75.813 1.08 77.30 1.35 77.30 0.72
Lipase+Lecithin T2 77.37 0.59 80.29 1.67 77.476 0.78 76.88 0.38 77.99 0.51
NSPases T3 84.52 0.15 76.81 1.11 79.202 2.04 76.57 0.96 79.39 2.18 0
Lipase+Lecithin+NSPases T4 76.92 0.30 76.78 1.11 78.243 0.85 78.26 0.96 77.54 0.48
5 No supplement T5 76.31 0.56 79.74 1.52 77.493 0.35 76.71 0.63 77.54 0.46

Lipase+Lecithin T6 76.77 0.36 76.56 0.80 77.255 0.71 76.93 0.77 76.88 0.58
NSPases T7 76.43 0.32 78.36 1.30 76.344 0.69 77.77 1.06 77.21 0.47
Lipase+Lecithin+NSPases T8 76.51 0.29 74.07 0.39 75.418 1.00 78.76 0.67 76.20 0.41
No supplement T9 77.02 0.45 77.44 1.57 77.681 0.57 79.87 1.09 77.98 0.51
Lipase+Lecithin T10 74.35 0.52 76.51 0.94 74.667 1.19 75.64 0.93 75.27 0.52
NSPases T11 76.65 0.27 75.44 1.37 82.980 4.94 78.58 1.49 78.37 1.34 10
Lipase+Lecithin+NSPases T12 76.19 0.42 78.28 0.59 76.866 0.58 77.78 0.67 77.26 0.33
SEM 3.446 1.825 2.423 1.360 1.232
CD - - - - -
P-value1 0.448 0.056 0.118 0.161 0.155
Effect of SPR
0% 79.13 4.00 78.05 1.49 77.251 0.92 77.25 0.92 78.05 2.31
5% 76.51 0.99 77.18 1.19 77.542 0.78 77.54 0.78 76.95 0.94
10% 76.05 0.78 76.92 1.13 77.969 1.10 77.97 1.10 77.22 1.54
SEM 1.723 0.913 1.212 0.680 0.616
CD - - - - -
P-value1 0.160 0.190 0.570 0.570 0.178
Effect of Biotechnological Tool
No supplement 77.02 0.44 78.50 0.99 77.960 0.64 77.96 0.64 77.61 0.33
Lipase+Lecithin 76.17 0.76 77.79 0.74 76.482 0.42 76.48 0.42 76.71 0.32
NSPases 79.20 2.65 76.87 0.74 77.640 0.68 77.64 0.68 78.32 0.86
Lipase+Lecithin+NSPases 76.54 0.40 76.38 0.53 78.267 0.44 78.27 0.44 77.00 0.24
SEM 1.989 1.054 1.399 0.785 0.711
CD - - - - -
P-value1 0.426 0.432 0.122 0.122 0.110
1An effect with a probability of less than 0.05 is considered significant,
Table 4.40: Average shell thickness values of eggs of birds as affected by different treatments and main factors at different intervals during performance trail of layers

Dietary Description Shell Thickness (mm)
SPR % Biotechnological Tool
Tr. No. 1st Day 28th Day 56th Day 84th Day Cumulative
No supplement T1 0.352 0.01 0.310 0.01 0.321 0.01 0.333 0.01 0.329 0.00
Lipase+Lecithin T2 0.371 0.01 0.321 0.01 0.303 0.01 0.335 0.01 0.333 0.01
NSPases T3 0.356 0.01 0.347 0.01 0.322 0.01 0.328 0.01 0.339 0.00 0
Lipase+Lecithin+NSPases T4 0.364 0.01 0.342 0.01 0.347 0.01 0.329 0.01 0.346 0.01
No supplement T5 0.352 0.01 0.325 0.01 0.327 0.01 0.331 0.01 0.334 0.00
Lipase+Lecithin T6 0.352 0.01 0.347 0.01 0.302 0.00 0.335 0.02 0.335 0.01
NSPases T7 0.350 0.00 0.364 0.02 0.320 0.00 0.327 0.01 0.341 0.01 5
Lipase+Lecithin+NSPases T8 0.356 0.01 0.356 0.01 0.332 0.01 0.325 0.01 0.342 0.00
No supplement T9 0.348 0.01 0.314 0.01 0.331 0.01 0.338 0.01 0.333 0.00
Lipase+Lecithin T10 0.344 0.01 0.366 0.01 0.304 0.01 0.347 0.01 0.341 0.01
NSPases T11 0.362 0.01 0.360 0.01 0.338 0.01 0.339 0.02 0.350 0.01 10
Lipase+Lecithin+NSPases T12 0.347 0.01 0.356 0.00 0.341 0.00 0.335 0.01 0.345 0.00
SEM 0.012 0.013 0.012 0.016 0.007
CD - - - - -
P-value1 0.562 <0.001 0.001 0.985 0.146
Effect of SPR
0% 0.361 0.01 0.330 0.01 0.323 0.01 0.331 0.01 0.337 0.01
5% 0.353 0.01 0.348 0.01 0.320 0.01 0.330 0.01 0.338 0.01
10% 0.350 0.01 0.349 0.01 0.328 0.01 0.340 0.01 0.342 0.01
SEM 0.006 0.006 0.006 0.008 0.004
CD - 0.017 - - -
P-value1 0.182 <0.001 0.398 0.397 0.324
Effect of Biotechnological Tool
No supplement 0.351 0.00 0.316 0.00 0.326 0.01 0.334 0.01 0.332 0.003
Lipase+Lecithin 0.356 0.01 0.345 0.01 0.303 0.01 0.339 0.01 0.336 0.003
NSPases 0.356 0.00 0.357 0.01 0.326 0.00 0.332 0.01 0.343 0.003
Lipase+Lecithin+NSPases 0.356 0.01 0.351 0.00 0.340 0.00 0.329 0.01 0.344 0.03
SEM 0.007 0.007 0.007 0.009 0.004

CD - 0.019 0.018 - 0.008
P-value1 0.818 0.005 <0.001 0.744 0.011
1An effect with a probability of less than 0.05 is considered significant,

LIST OF PLATE
Plate No.
Title
1. Sugarcane – Standing crop
2. Sugar factory – Source of Sugarcane Press Residue (SPR)
3. Abundant availability of SPR
4. Sun drying of SPR
5. Fractionation of fiber constituents of SPR
6. Exclusive sources of minerals
7. Metabolism trial in broiler birds
8. Collection of excreta-broilers
9. Metabolism trail in layer birds
10. Collection of excreta-layers
11. Experimental broilers birds –Perfroamnce trail
12. Collection of blood for mineral profile
13. Carcass characteristics studies-Broilers’ performance trail
14. Bone mineralization studies-Broilers’ performance trail
15. Experimental layer birds – Performance trail
16. Housing of birds-colony cages
17. Egg characteristic studies-Layers’ performance trail
18. Measuring egg quality-Layers’ performance trail

Plate 1: Sugarcane – Standing crop Plate 2: Sugar factory – Source of Sugarcane Press Residue (SPR)
Plate 3: Abundant availability of SPR Plate 4: Sun drying of SPR
Plate 5: Fractionation of fiber constituents
of SPR Plate 6: Exclusive sources of minerals

Plate 7: Metabolism trail in broiler birds Plate 8: Collection of excreta – broilers
Plate 9: Metabolism trail in layers birds Plate 10: Collection of excreta – layers
Plate 11: Experimental broiler birds – performance trail Plate 12: Collection of blood for
mineral profile
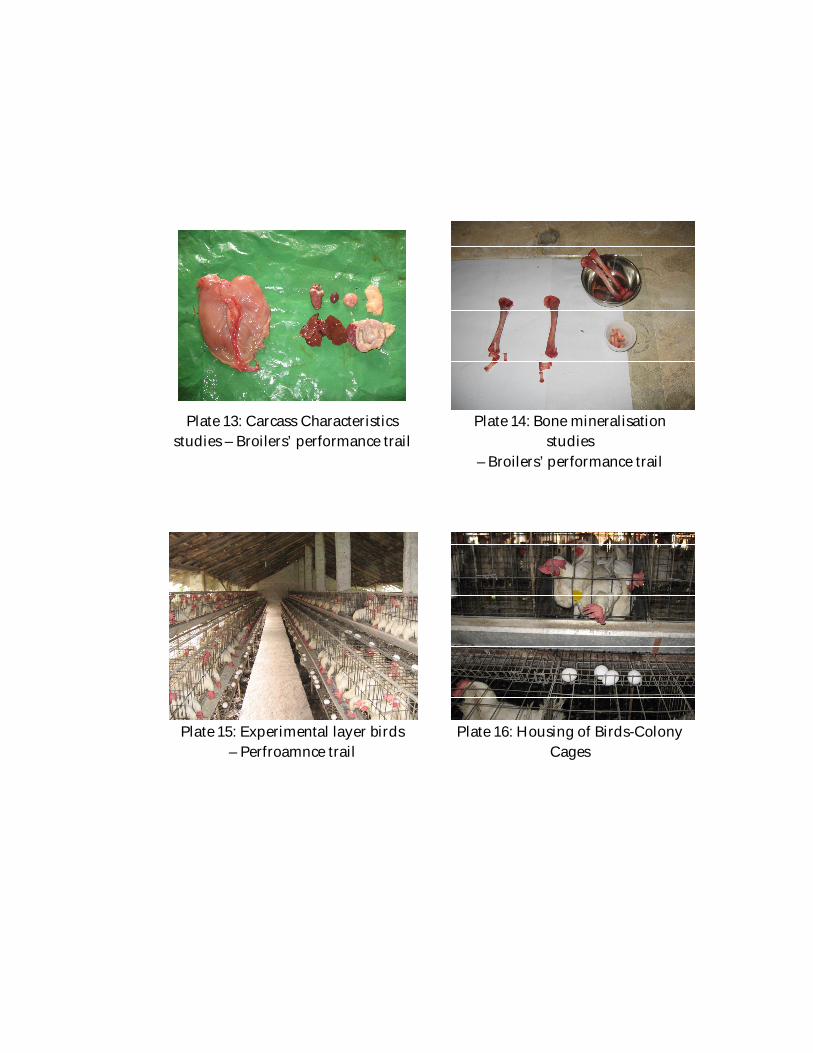
Plate 13: Carcass Characteristics studies – Broilers’ performance trail
Plate 14: Bone mineralisation studies
– Broilers’ performance trail
Plate 15: Experimental layer birds – Perfroamnce trail
Plate 16: Housing of Birds-Colony Cages

Plate 17: Egg Characteristic Studies
– Layers’ perfroamnce trail
Plate 18: Measuring Egg Quality – Layers’ perfroamnce trail

LIST OF FIGURE
Figure No.
Title
1 Chemical composition (on dry matter basis) of sun-dried SPR selected for biological trials
2 Cumulative average body weight gain of birds as influenced by different treatments and main factors during performance trial of broilers
3 Cumulative average feed consumption of birds as influenced by different treatments and main factors during performance trial of broilers
4 Cumulative average feed conversion ratio of birds as influenced by different treatments and main factors during performance trial of broilers
5 Metabolizability of dry matter and organic matter of diets under different treatments during performance trial of broilers
6 Balance of calcium and phosphorus of diets under different treatments during performance trial of broilers
7 Relative organ weights of birds under different treatments at the end of 42-day performance trial of broilers
8 Blood mineral profile of birds under different treatments during different intervals of 42-day performance trial of broilers
9 Average net returns from birds as influenced by different treatments and main factors at the end of 42-day performance trial of broilers
10 Cumulative average egg production of birds as influenced by different treatments and main factors during performance trial of layers
11 Cumulative average feed consumption of birds as influenced by different treatments and main factors during performance trial of layers
12 Cumulative average feed efficiency of birds as influenced by different treatments and main factors during performance trial of layers
13 Average weight of egg of experimental birds as influenced by different treatments and main factors during performance trial of layers
14 Quality characteristic of eggs of experimental birds under different treatments during performance trial of layers
15 Average gross efficiencies of utilization of protein and energy of birds as influenced by different treatments and main factors during performance trial of layers
16 Metabolizability of dry matter and organic matter of diets under

different treatments during performance trial of layers
17 Balance of calcium and phosphorus of birds under different treatments during performance trial of layers
18 Blood mineral profile of birds under different treatments at different intervals of 84-day performance trial of layers
19 Average net returns from birds as influenced by different treatments and main factors at the end of 84-day performance trial of layers
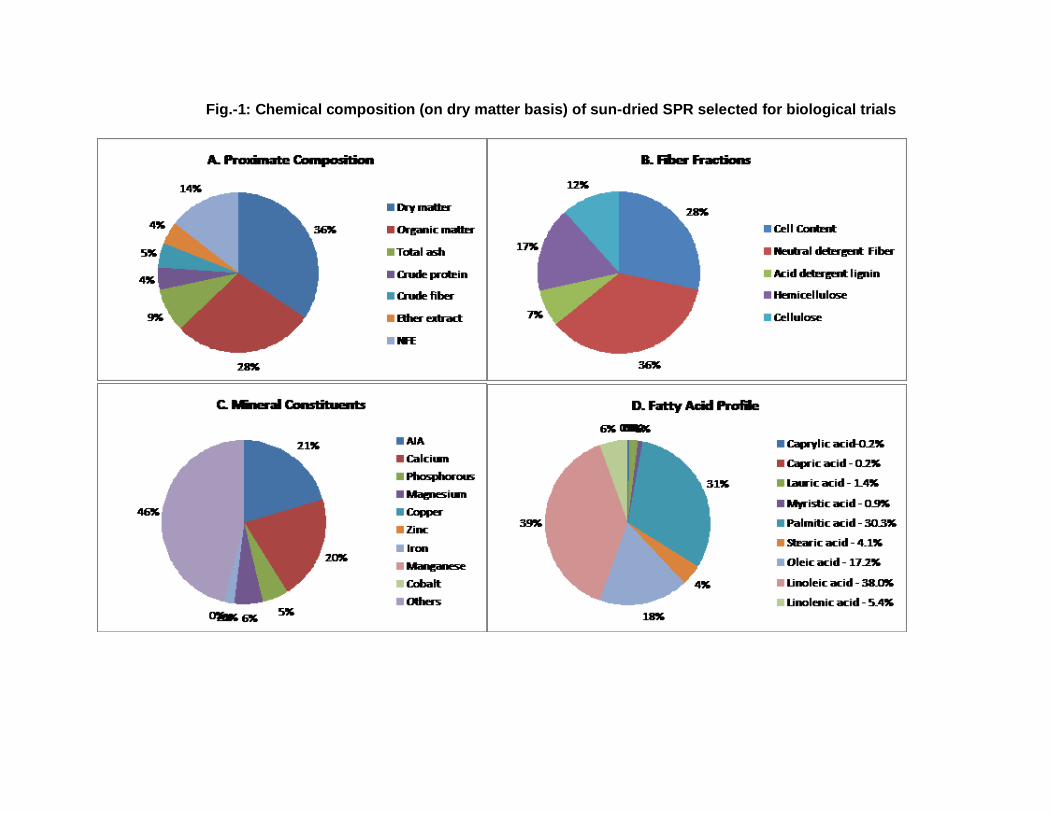
Fig.-1: Chemical composition (on dry matter basis) of sun-dried SPR selected for biological trials Dry matter 92.83 Cell Content 44.2 Organic matter 76.05 Neutral detergent Fiber 55.8 Total ash 23.95 Acid detergent lignin 11.13 Crude protein 11.8 Hemicellulose 26.38 Crude fiber 13.73 Cellulose 18.29 Ether extract 11.95 NFE 38.57 AIA 49.3 Caprylic acid-0.2% 0.24 Calcium 49 Capric acid - 0.2% 0.24 Phosphorous 12.5 Lauric acid - 1.4% 1.67 Magnesium 13.5 Myristic acid - 0.9% 1.08 Copper 0.0585 Palmitic acid - 30.3% 36.21 Zinc 0.0865 Stearic acid - 4.1% 4.9 Iron 4.3 Oleic acid - 17.2% 20.55 Manganese 0.26 Linoleic acid - 38.0% 45.41 Cobalt 0.0064 Linolenic acid - 5.4% 6.45 Others 110.4886

Gizzard Liver Heart Proventriculus Spleen Bursa
T1 2.81 2.22 0.59 0.49 0.24 0.23 T2 2.89 2.54 0.60 0.54 0.20 0.24 T3 2.69 2.34 0.62 0.57 0.19 0.22 T4 3.07 2.30 0.66 0.50 0.28 0.16 T5 2.41 2.34 0.55 0.52 0.18 0.21 T6 2.89 2.52 0.60 0.56 0.19 0.16 T7 2.32 2.54 0.65 0.55 0.16 0.18 T8 2.29 2.31 0.62 0.45 0.27 0.32 T9 2.70 2.55 0.63 0.55 0.23 0.30 T10 2.83 2.54 0.68 0.57 0.18 0.20 T11 2.91 2.45 0.64 0.52 0.22 0.21 T12 2.44 2.79 0.58 0.52 0.27 0.27

Fig.-14: Quality characteristic of eggs of experimental birds under different treatments during performance
trial of layers
T1 77.2968 T1 4.55917 T1 59.822 T1 6.68285 T1 33.1768 T1 0.32931 T2 77.9896 T2 4.45139 T2 58.73 T2 6.72543 T2 33.7991 T2 0.33348 T3 79.3917 T3 4.35937 T3 58.8509 T3 6.78281 T3 33.7302 T3 0.33868 T4 77.5355 T4 4.58208 T4 59.2999 T4 6.71235 T4 33.0497 T4 0.34618 T5 77.5369 T5 4.38706 T5 58.0313 T5 6.90864 T5 33.6055 T5 0.33433 T6 76.8757 T6 4.61441 T6 58.9989 T6 6.99202 T6 33.7248 T6 0.33465 T7 77.2079 T7 4.71352 T7 60.202 T7 6.86888 T7 32.8153 T7 0.34052 T8 76.1975 T8 4.41624 T8 57.0085 T8 6.94216 T8 32.9522 T8 0.34244 T9 77.9817 T9 4.3645 T9 58.4027 T9 6.97768 T9 33.7574 T9 0.33311
T10 75.2719 T10 4.42331
T10 58.8799
T10 6.81774
T10 32.9719
T10 0.34051
T11 78.3747 T11 4.47394
T11 58.4621
T11 6.80494
T11 33.4424
T11 0.35011
T12 77.2553 T12 4.40383
T12 58.3835
T12 6.76752
T12 33.5048
T12 0.34464


Fig.-2: Cumulative average body weight gain of birds as influenced by different treatments and main factors during performance trial of broilers
T1 2000.37 T2 2081.03 T3 1941.53 T4 2052.53 T5 1893.28 T6 1899.87 T7 1822.29 T8 2080.81 T9 1792.27 T10 1895.60 T11 1737.74 T12 1789.57
SPR = Sugarcane Press Residue NS = No Supplement LUA = Lipid Utilising Agents NDE = NSP Degrading Enzymes

Fig.-3: Cumulative average feed consumption of birds as influenced
by different treatments and main factors during performance trial of broilers
T1 3568.83 T2 3678.03 T3 3457.87 T4 3597.77 T5 3549.90 T6 3437.67 T7 3386.97 T8 3565.42 T9 3384.23 T10 3476.67 T11 3382.87 T12 3317.60
3575.6
3 NS 3500.9
9
3484.9
9 LUA 3530.7
9
3390.3
4 NDE 3409.2
3
LUA+NDE 3493.6
SPR = Sugarcane Press Residue NS = No Supplement LUA = Lipid Utilising Agents NDE = NSP Degrading Enzymes

Fig.-4:
T1 1.77779 T2 1.77259 T3 1.78126 T4 1.75287 T5 1.88749 T6 1.81314 T7 1.86902 T8 1.77934 T9 1.8943 T10 1.83479 T11 1.97667 T12 1.92503
1.77113 NS 1.83725 LUA 1.9077 NDE
LUA+NDE SPR = Sugarcane Press Residue NS = No Supplement LUA = Lipid Utilising Agents NDE = NSP Degrading Enzymes

Fig.-5: Metabolizability of dry matter and organic matter of diets under
different treatments during performance trial of broilers
Dry matter Organic matter
T1 71.0901 84.6382 T2 70.7714 84.6425 T3 72.5807 85.3031 T4 71.8836 84.1402 T5 71.9116 83.8029 T6 72.5554 84.3703 T7 74.4377 84.2858 T8 73.6769 83.9418 T9 69.078 84.0956 T10 68.6595 84.2213 T11 68.3272 84.0099 T12 71.3106 84.8422

Fig-6: Balance of calcium and phosphorus of diets under different
treatments during performance trial of broilers
Calcium Phosphorus
T1 0.58474 0.37767 T2 0.59936 0.3288 T3 0.60695 0.3407 T4 0.50323 0.252 T5 0.86758 0.29663 T6 0.76632 0.34429 T7 0.8838 0.35289 T8 0.78854 0.22867 T9 0.71662 0.28226 T10 0.77358 0.38188 T11 0.76582 0.30686 T12 0.68689 0.233

Fig.-8: Blood mineral profile of birds under different treatments during
different intervals of 42-day performance trial of broilers 21st day 42nd day
T1 11.73 13.35 T2 11.55 13.27 T3 13.02 14.63 T4 12.91 14.30 T5 11.95 12.61 T6 13.53 13.60 T7 13.09 14.01 T8 12.14 12.87 T9 12.61 14.01 T10 12.06 13.05 T11 11.51 12.91 T12 12.87 12.65
21st day 42nd day
T1 7.00 6.28 T2 6.04 5.56 T3 5.80 6.52 T4 7.00 7.16 T5 6.52 5.72 T6 6.32 6.80 T7 6.72 6.12 T8 6.52 7.04 T9 6.00 6.88 T10 7.12 7.32 T11 6.04 6.40 T12 6.24 6.92

Fig.-9: Average net returns from birds as influenced by different
treatments and main factors at the end of 42-day performance trial of broilers
T1 11.29 T2 12.14 T3 10.36 T4 10.69 T5 9.02 T6 9.78 T7 8.10 T8 13.51 T9 8.10 T10 9.93 T11 6.13 T12 6.92
11.1227 NS 9.47209 10.1018 LUA 10.6158 7.77004 NDE 8.19734
LUA+NDE 10.3742 SPR = Sugarcane Press Residue NS = No Supplement LUA = Lipid Utilising Agents NDE = NSP Degrading Enzymes


Fig.-10: Cumulative average egg production of birds as influenced by
different treatments and main factors during performance trial of layers
T1 82.6257 T2 83.6574 T3 83.6756 T4 84.5012 T5 83.3829 T6 80.8614 T7 80.1852 T8 76.0284 T9 76.8937 T10 77.1065 T11 81.7609 T12 76.67 83.615 NS 80.9674 80.1145 LUA 80.5418 78.1078 NDE 81.8739 LUA+NDE 79.0665 SPR = Sugarcane Press Residue NS = No Supplement LUA = Lipid Utilising Agents NDE = NSP Degrading Enzymes

Fig.-11: Cumulative average feed consumption of birds as influenced by
different treatments and main factors during performance trial of layers
T1 116.441 T2 117.903 T3 117.327 T4 116.683 T5 117.277 T6 116.448 T7 117.304 T8 116.437 T9 114.772 T10 115.552 T11 116.993 T12 115.049 117.089 NS 116.163 116.866 LUA 116.634 115.592 NDE 117.208 LUA+NDE 116.056 SPR = Sugarcane Press Residue NS = No Supplement LUA = Lipid Utilising Agents NDE = NSP Degrading Enzymes

Fig.-12: Cumulative average feed efficiency of birds as influenced by different treatments and main factors during performance trial of layers
T1 1.69843 T2 1.69559 T3 1.68769 T4 1.66352 T5 1.69167 T6 1.73101 T7 1.76026 T8 1.84366 T9 1.79351 T10 1.79778 T11 1.71961 T12 1.79981
1.68631 NS 1.72787 1.75665 LUA 1.74146 1.77768 NDE 1.72252 LUA+NDE 1.76899 SPR = Sugarcane Press Residue NS = No Supplement LUA = Lipid Utilising Agents NDE = NSP Degrading Enzymes

Fig.-13: Average weight of egg of experimental birds as influenced by different treatments and main factors during performance trial of layers
T1 58.1 T2 59.4 T3 58.5 T4 58.4 T5 58.9 T6 59.5 T7 59.7 T8 59.1 T9 59.2 T10 58.6 T11 59.9 T12 58.4
58.6248 NS 58.7677 59.3166 LUA 59.1971 59.0541 NDE 59.3686 LUA+NDE 58.6606 SPR = Sugarcane Press Residue NS = No Supplement LUA = Lipid Utilising Agents NDE = NSP Degrading Enzymes

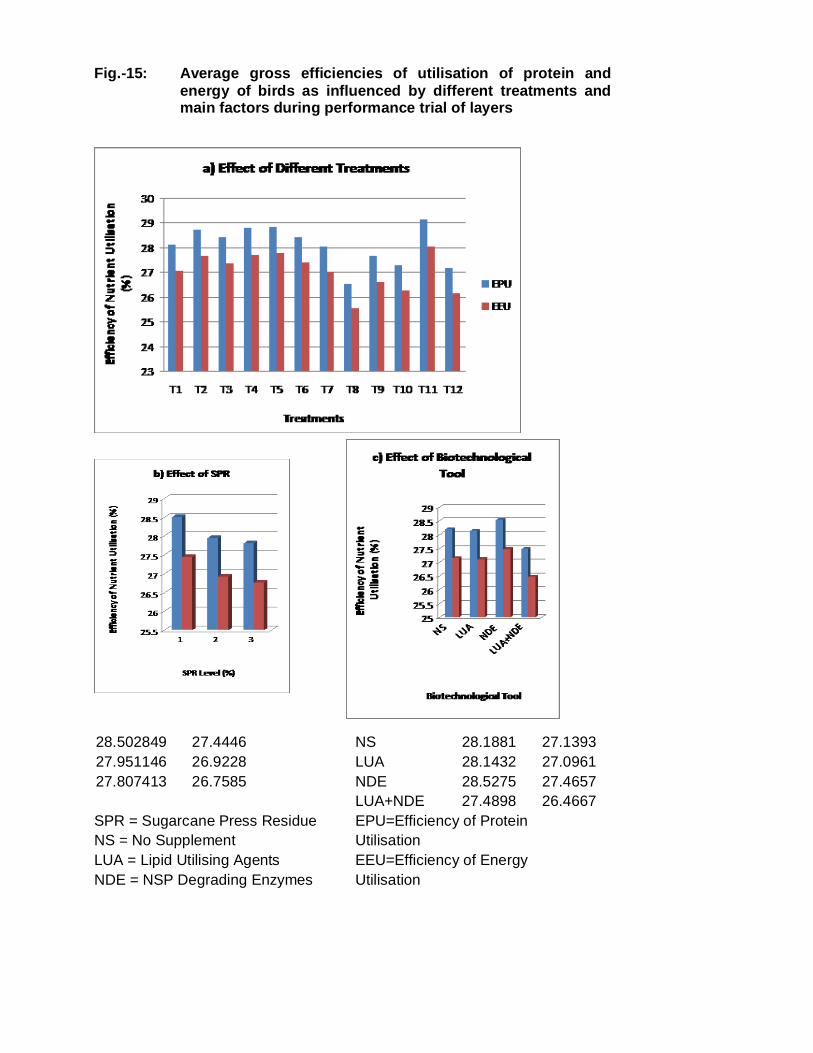
Fig.-15: Average gross efficiencies of utilisation of protein and
energy of birds as influenced by different treatments and main factors during performance trial of layers
EPU EEU T1 28.0992 27.0559 T2 28.7289 27.6623 T3 28.4068 27.3521 T4 28.7765 27.7081 T5 28.8195 27.7592 T6 28.4185 27.3729 T7 28.0422 27.0105 T8 26.5244 25.5485 T9 27.6455 26.6027 T10 27.2822 26.2531 T11 29.1336 28.0346 T12 27.1684 26.1436
28.502849 27.4446 NS 28.1881 27.1393 27.951146 26.9228 LUA 28.1432 27.0961 27.807413 26.7585 NDE 28.5275 27.4657 LUA+NDE 27.4898 26.4667 SPR = Sugarcane Press Residue EPU=Efficiency of Protein NS = No Supplement Utilisation LUA = Lipid Utilising Agents EEU=Efficiency of Energy NDE = NSP Degrading Enzymes Utilisation

Fig.-16: Metabolizability of dry matter and organic matter of
diets under different treatments during performance trial of layers
Dry matter Organic matter T1 71.22 72.38 T2 68.30 71.51 T3 69.68 72.09 T4 70.73 71.36 T5 69.66 69.29 T6 70.04 69.55 T7 70.83 69.14 T8 72.54 70.07 T9 68.19 68.23 T10 68.27 68.67 T11 68.28 67.97 T12 71.02 69.04 Fig.-17: Balance of calcium and phosphorus of diets under
different treatments during performance trial of layers
Calcium Phosphorus T1 4.37 0.66 T2 4.14 0.68 T3 4.22 0.72 T4 4.21 0.72 T5 4.31 0.66 T6 4.16 0.65 T7 4.08 0.64 T8 4.36 0.68 T9 4.33 0.62 T10 4.38 0.62 T11 4.20 0.66 T12 4.04 0.67


Fig.-18: Blood mineral profile of birds under different treatments
during different intervals of 84-day performance trial of layers
28th day 54th day 84th day T1 18.00 18.87 18.93 T2 17.67 19.03 19.20 T3 18.13 19.17 19.20 T4 17.80 18.97 19.17 T5 17.30 18.93 19.10 T6 17.47 18.77 19.10 T7 17.50 18.53 19.03 T8 17.50 18.97 18.83 T9 18.10 19.20 19.07 T10 18.10 18.63 18.77 T11 18.07 18.70 19.20 T12 18.10 18.63 18.73 28th day 54th day 84th day T1 6.73 7.83 8.67 T2 6.33 7.70 8.63 T3 6.83 7.70 8.73 T4 6.43 8.10 8.70 T5 6.70 8.17 8.90 T6 6.20 7.97 8.73 T7 6.63 8.10 8.67 T8 6.43 8.23 8.67 T9 6.30 8.00 8.67 T10 7.17 8.10 8.63 T11 6.77 8.47 8.67 T12 6.60 8.30 8.70


Fig.-19: Average net returns from birds as influenced by different
treatments and main factors at the end of 84-day performance trial of layers
T1 11.4665 T2 11.1596 T3 11.4619 T4 11.4751 T5 12.1215 T6 10.7009 T7 10.3926 T8 8.22671 T9 10.2635 T10 9.76117 T11 11.675 T12 9.39448 11.3908 NS 11.2838 10.3604 LUA 10.5406 10.2735 NDE 11.1765
LUA+NDE 9.69875 SPR = Sugarcane Press Residue NS = No Supplement LUA = Lipid Utilising Agents NDE = NSP Degrading Enzymes