Embed Size (px)
Citation preview
Evaluation of Surface Finish Affect on Aerodynamic Coefficients Of Wind Tunnel Testing Models
R. ADELNIA1, S. AGHANAJAFI2, S. DANESHMAND3
Department of Mechanical Engineering Islamic Azad University Majlesi Branch and K. N. Toosi University of Technology
Majlesi City, Isfahan IRAN
Abstract: - In this study has been undertaken to determine the suitability of effects surface roughness models for use in subsonic and transonic wind tunnel testing. The geometry used for the precursor study was that of a vertical lander concept. The vertical lander was a generic blunted cone followed by a bread-loaf-shaped base with two fins, or fairings, on the base’s upper surface. Three surface roughness were fabricated from Steel 17–4PH H900 by a CNC machining and grinding. The roughness average (Ra) of surfaces for each model was 0.8 µm, 1.6 µm and 6.3 µm that determined by optical surface profilometer. Testing covered the Mach range of Mach 0.3 to Mach 1.2 at an angle-of-attack range of -4° to +16° at zero sideslip. Coefficients of pitching moment, axial force, normal force, and lift over drag are shown at each of these Mach numbers. The study showed that between Mach numbers of 0.3 to 1.2, the longitudinal aerodynamic data in pitching moment and normal force showed very good agreement between the three models. The surface finish does have more effect on the aerodynamic characteristics such as axial force and lift over drag. Key-Words: - Vertical lander; Surface roughness; Longitudinal aerodynamic; angle-of-attack
1- PhD candidate 2- Associate Professor 3- PhD candidate
1 Introduction Often product quality is associated with surface roughness and a smooth surface is usually expensive to make. Each process can be expected to produce roughness values within a given range. Each process will take a given amount of time, and it will take more time to produce a better surface with a given process –rule of thumb: the smoother it is the more time it takes. Processes have different costs. These costs will increase as the surface roughness produced decreases [1]. In this study effects of surface finish on the aerodynamic characteristics of the models were determined. models constructed using CNC machining with various surface finish for use in subsonic, transonic, wind tunnel testing [2]. Surface finish is an important parameter in wind tunnel testing models fabrication. The cutting speed, tool feed, depth of cut, tool material and rake angle have most effects on the surface quality and usually time and costs are increased for optimization of these parameters [3]. Three models constructed using three surface finish and the aerodynamic characteristics are determined and compared to each
other. A vertical lander configuration was chosen for the actual study. Three Steel 17–4PH H900 models are prepared and machined at various conditions for testing in wind tunnel and determining the aerodynamics coefficients [4]. The roughness average (Ra) of surfaces for each model was 0.8 µm; 1.6 µm and 6.3 µm that determined by optical surface profilometer. Wind tunnel is an intermittent blow down tunnel, which operates by High-pressure air flowing from storage to either vacuum or atmosphere conditions. Testing was done over the Mach range of 0.3 to 1.2. All models were tested at angle-of-attack ranges from -4 degrees to +16 degrees at zero sideslip. Coefficients of normal force, axial force, pitching moment and lift over drag are shown at each of these Mach numbers. 2 Configurations The geometry used for the precursor study was that of a vertical lander concept. The vertical lander was a generic blunted cone followed by a bread-loaf-shaped base with two fins, or fairings, on the base’s upper surface [5]. Because this model was being
Proceedings of the 4th WSEAS International Conference on Fluid Mechanics and Aerodynamics, Elounda, Greece, August 21-23, 2006 (pp1-5)
fabricated in a machined metal model format (fig.1).This geometry provided a basis for comparisons between three models. The reference dimensions for this configuration were as follows[6]: Sref =3198.071 mm2 Lref =228.6 mm XMrp=158.648 millimeter aft of nose
Fig.1. Vertical lander model configuration
3 Model Construction The precursor study vertical lander model was constructed using the Steel 17–4PH H900 by a CNC machining and grinding. The model was constructed in two parts, a nose and a core body. The nose was attached to the core body with a removable knock pin. The roughness of surfaces for each model was 6.3 µm, 60µm and 150µm that determined by perthometers 2 with 0.8 mm wavelength. The roughness average (Ra) of surfaces for each model was 0.8 µm, 1.6 µm and 6.3 µm that determined by optical surface profilometer. The material property of Steel 17–4PH H900 is shown in table 1 [7].
Table 1 Material properties of steel
Property Steel 17-4PH Yield Strength (Mpa)
Tensile Strength (Mpa) Elongation (Percent)
1171 1309
6
4 Wind Tunnel Transonic Wind Tunnel is an intermittent blow down tunnel, which operates by high-pressure air flowing from storage to either vacuum or atmosphere conditions. The transonic test section provides a Mach number range from 0.2 to 2.0. Mach numbers between 0.2 and 0.9 are obtained by using a controllable diffuser. The Mach range from 0.95 to 1.2 is achieved through the use of plenum suction and perforated walls [8]. Each Mach number above 1.2 requires a specific set of two-dimensional contoured nozzle blocks. The tunnel flow is established and controlled with a servo-actuated gate valve. The air then passes through the test section
which contains the nozzle blocks and test region. Downstream of the test section is a hydraulically controlled pitch sector that provides the capability of testing angles-of-attack ranging from –10 to +10 degrees during each run. Sting offsets are available for obtaining various maximum angles-of-attack up to 90 degrees. The diffuser section has movable floor and ceiling panels, which are the primary means of controlling. Table 2 shown lists the relation between Mach number, dynamic pressure, and Reynolds number per meter.
Table 2.Wind Tunnel Operating Conditions
Mach Number
Reynolds Number
Dynamic Pressure
0.3 0.8 0.9 1.05 1.15 1.2
9.18×10⁴/m 18.03 19.34
20 20.32 20.32
8.96 kPa 44.58 50.71 58.43 61.94 64.14
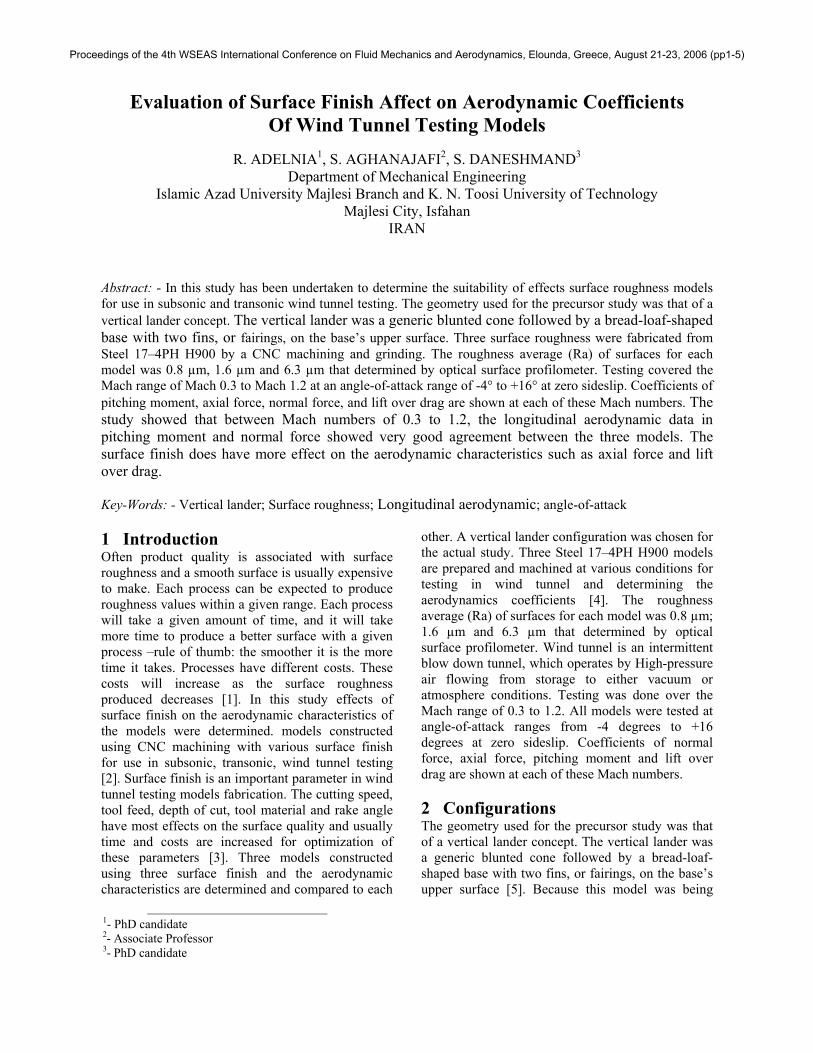
5 Test Models The effects of surface finish on the aerodynamic characteristics of the models were determined. The third model (6.3 µm) did not have as smooth a finish as did the first model (0.8 µm), so runs were made to determine if the difference in these surface finishes would affect the aerodynamic characteristics. Testing was done over the Mach range of 0.3 to 1.2 at 5 selected numbers for the precursor study. These Mach numbers were 0.30, 0.80, 0.90, 1.05 and 1.2. Models were tested at angle-of-attack ranges from -4 degrees to +16 degrees at zero sideslip. The reference aerodynamic axis system and reference parameters for the precursor study are shown in figure 2 [9].
Fig.2 Vertical lander aerodynamic axis system
Proceedings of the 4th WSEAS International Conference on Fluid Mechanics and Aerodynamics, Elounda, Greece, August 21-23, 2006 (pp1-5)
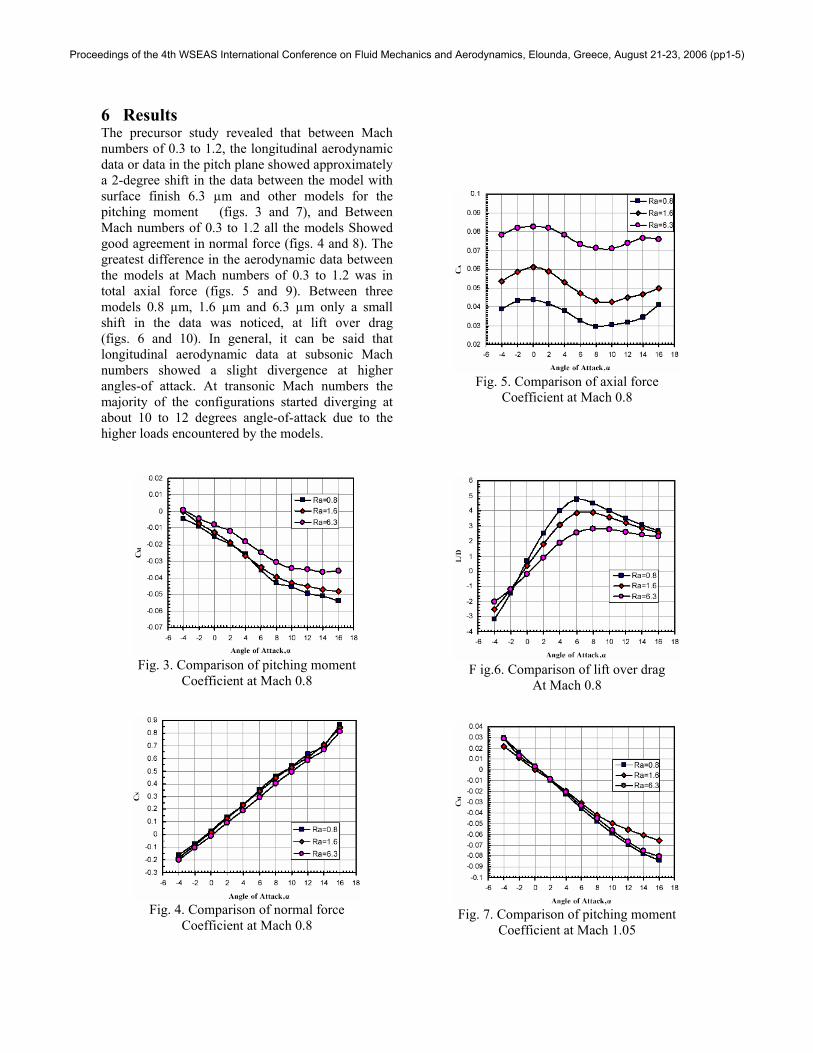
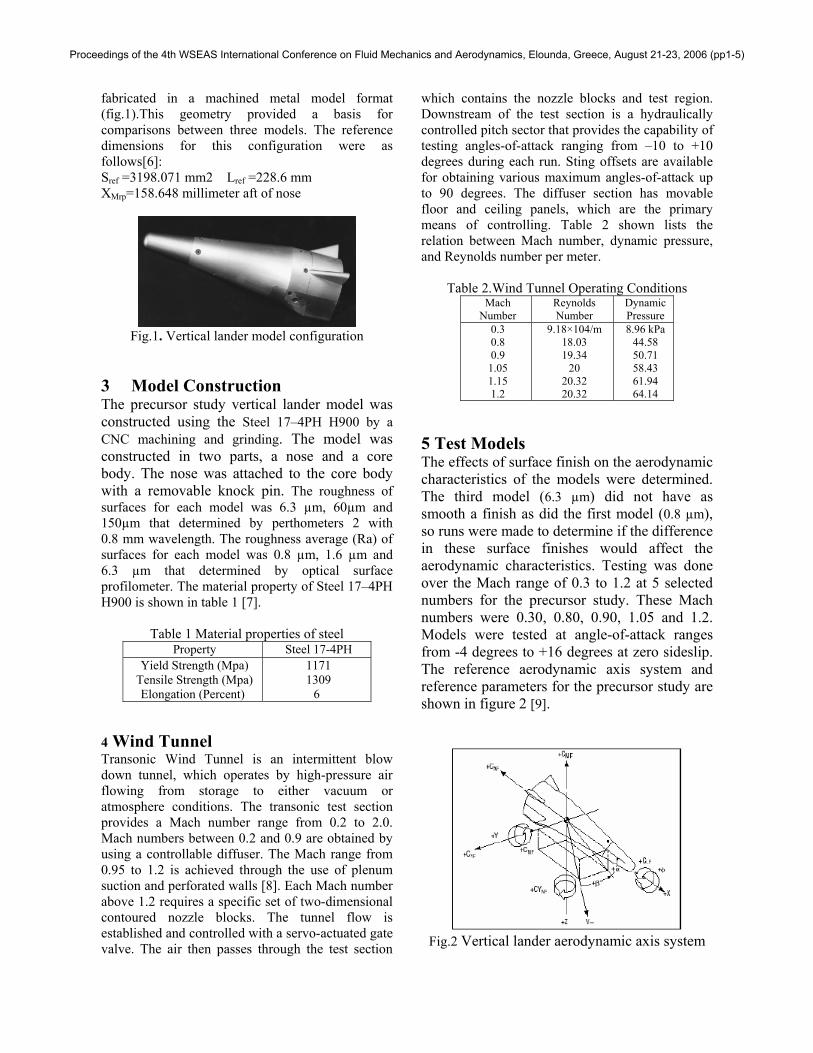
6 Results The precursor study revealed that between Mach numbers of 0.3 to 1.2, the longitudinal aerodynamic data or data in the pitch plane showed approximately a 2-degree shift in the data between the model with surface finish 6.3 µm and other models for the pitching moment (figs. 3 and 7), and Between Mach numbers of 0.3 to 1.2 all the models Showed good agreement in normal force (figs. 4 and 8). The greatest difference in the aerodynamic data between the models at Mach numbers of 0.3 to 1.2 was in total axial force (figs. 5 and 9). Between three models 0.8 µm, 1.6 µm and 6.3 µm only a small shift in the data was noticed, at lift over drag (figs. 6 and 10). In general, it can be said that longitudinal aerodynamic data at subsonic Mach numbers showed a slight divergence at higher angles-of attack. At transonic Mach numbers the majority of the configurations started diverging at about 10 to 12 degrees angle-of-attack due to the higher loads encountered by the models.
Fig. 3. Comparison of pitching moment
Coefficient at Mach 0.8
Fig. 4. Comparison of normal force
Coefficient at Mach 0.8
Fig. 5. Comparison of axial force
Coefficient at Mach 0.8
F ig.6. Comparison of lift over drag
At Mach 0.8
Fig. 7. Comparison of pitching moment
Coefficient at Mach 1.05
Proceedings of the 4th WSEAS International Conference on Fluid Mechanics and Aerodynamics, Elounda, Greece, August 21-23, 2006 (pp1-5)
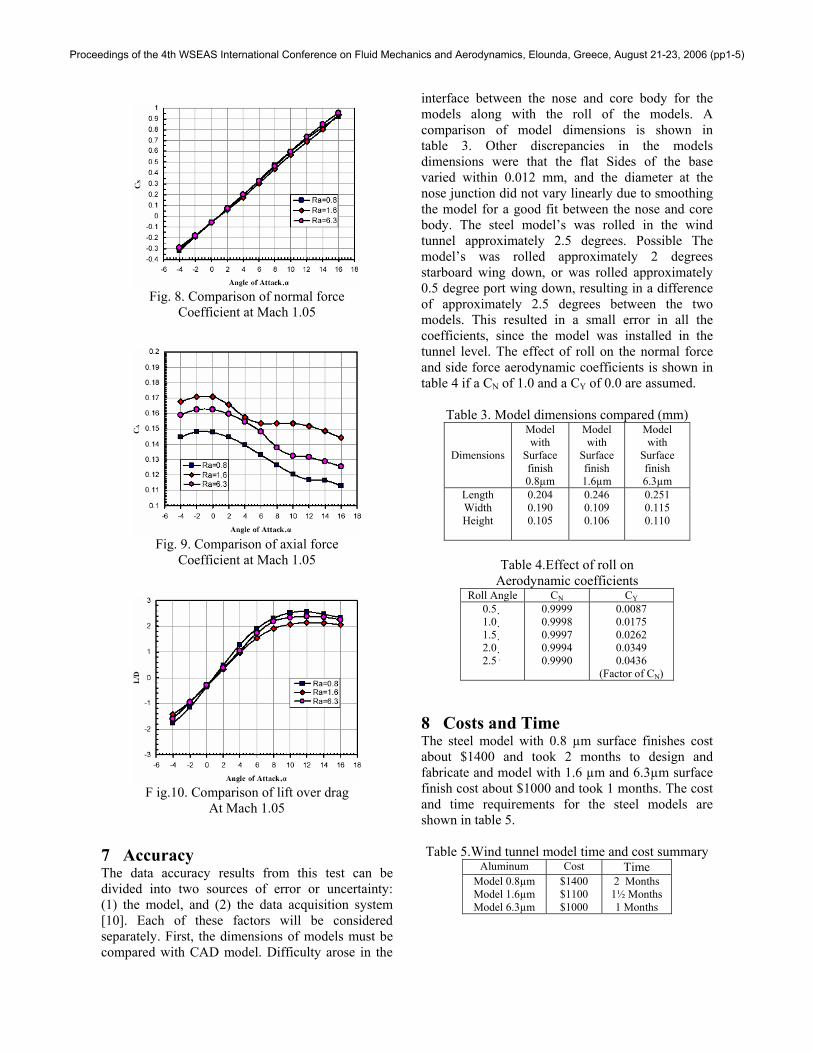
Fig. 8. Comparison of normal force
Coefficient at Mach 1.05
Fig. 9. Comparison of axial force
Coefficient at Mach 1.05
F ig.10. Comparison of lift over drag
At Mach 1.05
7 Accuracy The data accuracy results from this test can be divided into two sources of error or uncertainty: (1) the model, and (2) the data acquisition system [10]. Each of these factors will be considered separately. First, the dimensions of models must be compared with CAD model. Difficulty arose in the
interface between the nose and core body for the models along with the roll of the models. A comparison of model dimensions is shown in table 3. Other discrepancies in the models dimensions were that the flat Sides of the base varied within 0.012 mm, and the diameter at the nose junction did not vary linearly due to smoothing the model for a good fit between the nose and core body. The steel model’s was rolled in the wind tunnel approximately 2.5 degrees. Possible The model’s was rolled approximately 2 degrees starboard wing down, or was rolled approximately 0.5 degree port wing down, resulting in a difference of approximately 2.5 degrees between the two models. This resulted in a small error in all the coefficients, since the model was installed in the tunnel level. The effect of roll on the normal force and side force aerodynamic coefficients is shown in table 4 if a CN of 1.0 and a CY of 0.0 are assumed.
Table 3. Model dimensions compared (mm)
Dimensions
Model with
Surface finish 0.8µm
Model with
Surface finish 1.6µm
Model with
Surface finish 6.3µm
Length Width Height
0.204 0.190 0.105
0.246 0.109 0.106
0.251 0.115 0.110
Table 4.Effect of roll on
Aerodynamic coefficients Roll Angle CN CY
0.5� 1.0� 1.5� 2.0� 2.5�
0.9999 0.9998 0.9997 0.9994 0.9990
0.0087 0.0175 0.0262 0.0349 0.0436
(Factor of CN)
8 Costs and Time The steel model with 0.8 µm surface finishes cost about $1400 and took 2 months to design and fabricate and model with 1.6 µm and 6.3µm surface finish cost about $1000 and took 1 months. The cost and time requirements for the steel models are shown in table 5.
Table 5.Wind tunnel model time and cost summary
Aluminum Cost Time Model 0.8µm Model 1.6µm Model 6.3µm
$1400 $1100 $1000
2 Months 1½ Months 1 Months
Proceedings of the 4th WSEAS International Conference on Fluid Mechanics and Aerodynamics, Elounda, Greece, August 21-23, 2006 (pp1-5)
9 Conclusion It can be concluded from this precursor test that surface finish does have an effect on the aerodynamic characteristics in high Mach number speeds where the effect is less drastic than at lower Mach numbers. The surface finishes had little effect on the aerodynamic characteristics except for axial force and lift over drag its derivative coefficients. In general, it can be said that the longitudinal aerodynamic data for each model is within 6 percent. The wind tunnel models constructed with any surface finish using in subsonic, transonic wind tunnel testing for initial baseline aerodynamic database development. At transonic Mach number the majority of the configurations started diverging at about 10 to 12 degrees angle-of-attack due to the higher loads encountered by the models. The accuracy of the data is lower for models that have less surface finish but is quite accurate for this level of testing. The fewer than 3 percent change in the aerodynamic data between the models aerodynamics is acceptable for this level of preliminary design or phase studies. The use models with low surface finish will provide a rapid capability in the determination of the aerodynamic characteristics of preliminary designs over a large Mach range. This range covers the transonic regime, a regime in which analytical and empirical capabilities sometimes fall short. The cost and time for models that constructed with low surface finish is less than models with high surface finish accordingly, however models with less surface finish are suitable for preliminary design or phase studies. References: [1] Koster, W.P, Field, M., 2001. Effects of
Machining Variables on the Surface and Structural metals. Proceedings of the North American Manufacturing Research Conference, SME, 2:67-87.
[2] Determination of Rough-Surface Skin Friction Coefficients from Wake Profile Measurements, (Qiang Zhang, S. W. Lee, and P. M. Ligrani), Experiments in Fluids, Vol. 35, No. 6, pp. 627-635, December 2003.
[3] Maeder, W., Nguyen, V., Richard, J. & Stark, J. 2002. Standardization of the Manufacturing Process: the IMS STEP-NC project.
[4] S. daneshmand, R. adelnia, S. aghanajafi “Comparison between traditional method and FDM in Wind tunnel testing Models fabrication”6th WSEAS International Conference on Robotics, Control and
Manufacturing Technology, Hangzhou, China, April 16-18, 2006 (pp42-47).
[5] Jones, Pandey, R.T., "The Oblique Wing craft design for Transonic and Low Supersonic Speeds," Acta Astronautic, Vol. 4, Per gammon Press, 1999.
[6] S. Aghanajafi, S. Daneshmand, R. Adelnia “Comparison between FDM Model and Steel Model as Wind Tunnel Testing Models”, Wseas Transaction on Circuits and Systems Journal, Issue 4, Volume 5, April 2006, ISSN: 1109-2734.
[7] http://www.matweb.com [8] Springer A., Cooper K., ”Application of Rapid
Prototyping Methods to High Speed Wind Tunnel Testing”, proceedings of 86th Semiannual Meeting Supersonic Tunnel Association, October (1996).
[9] Springer, A.; Cooper, K.; and Roberts, F. “Application of Rapid Prototyping Models to Transonic Wind tunnel Testing. AIAA 97–0988, 35th Aerospace Sciences Meeting. January 1997.
[10] Springer A. and Cooper K., “Comparing the Aerodynamic Characteristics of Wind Tunnel Models Produced by Rapid Prototyping and Conventional Methods”, AIAA 97–2222, 15th AIAA Applied Aerodynamics Conference, June (1997).
Proceedings of the 4th WSEAS International Conference on Fluid Mechanics and Aerodynamics, Elounda, Greece, August 21-23, 2006 (pp1-5)