Embed Size (px)
Citation preview

This article was downloaded by: [University of Illinois at Urbana-Champaign]On: 18 September 2013, At: 05:42Publisher: Taylor & FrancisInforma Ltd Registered in England and Wales Registered Number: 1072954 Registered office: Mortimer House,37-41 Mortimer Street, London W1T 3JH, UK
Drying Technology: An International JournalPublication details, including instructions for authors and subscription information:http://www.tandfonline.com/loi/ldrt20
Evaluation of Textile Bobbins Drying Processes:Experimental and Modelling StudiesJ. RIBEIRO a & J.M.P. VENTURA ba Departamento de Tecnologias de Combustao Instituto de Tecnologias Energoticas InstitutoNacional de Engenharia e Tecnologia Industrial Azinhaga dos Lameiros, 1699, Lisboa Codex -PORTUGALb Departamento de Engenharia Hecanica Instituto Superior Tecnico Avenida Rovisco Pais,1096, Lisboa Codex - PORTUGALPublished online: 07 May 2007.
To cite this article: J. RIBEIRO & J.M.P. VENTURA (1995) Evaluation of Textile Bobbins Drying Processes: Experimental andModelling Studies, Drying Technology: An International Journal, 13:1-2, 239-265
To link to this article: http://dx.doi.org/10.1080/07373939508916952
PLEASE SCROLL DOWN FOR ARTICLE
Taylor & Francis makes every effort to ensure the accuracy of all the information (the “Content”) containedin the publications on our platform. However, Taylor & Francis, our agents, and our licensors make norepresentations or warranties whatsoever as to the accuracy, completeness, or suitability for any purpose of theContent. Any opinions and views expressed in this publication are the opinions and views of the authors, andare not the views of or endorsed by Taylor & Francis. The accuracy of the Content should not be relied upon andshould be independently verified with primary sources of information. Taylor and Francis shall not be liable forany losses, actions, claims, proceedings, demands, costs, expenses, damages, and other liabilities whatsoeveror howsoever caused arising directly or indirectly in connection with, in relation to or arising out of the use ofthe Content.
This article may be used for research, teaching, and private study purposes. Any substantial or systematicreproduction, redistribution, reselling, loan, sub-licensing, systematic supply, or distribution in anyform to anyone is expressly forbidden. Terms & Conditions of access and use can be found at http://www.tandfonline.com/page/terms-and-conditions

DRYING TECHNOLOGY, 13(lk2), 239-265 (1995)
EVALUATION OF TEXTILE BOBBINS DRYING PROCESSES: EXPERIMENTAL AND MODELLING STUDIES
(') Departamento de Tecnologias de Combustao Instituto de Tecnolooiae Eneraeticas -~ ~.~
Institute Nacional de Engenharia e Tecnologia Industrial Azinhaga doa Lameiros, 1699 Lisboa Codex - PORTUGAL
(") Departamento de Engenharia Mecanica Instituto Superior Tecnico
Avenida Rovieco Pais 1096 Lisboa Codex - PORTUGAL
Key words and Phrases: drying; textile bobbins, evaporation front, modelling
ABSTRACT
Drying of textile bobbins was carried out on two kinds of laboratory-scale dryers: in a cross circulation drying rig. atmospheric pressure heating air is used, while in the ehrough circulation drying apparatus, the heating air is pressurized before the drying process takes place.
In both cases, a bobbin was fitted with seven thermocouples, placed in a plane normal to the bobbin axis but at different radial distances, in order to provide temperature data during the drying process.
In cross circulation drying, plots of temperature against time indicated the presence of two moving fronts, one starting from inside the bobbin, another from the outside, while in through circulation drying, similar plots showed the presence of an evaporation front, moving from inside the bobbin to the outside.
In both cares, numerical models were developed to simulate the drying processes.
Copyright 0 1995 by Marcel Dckker, Inc.
Dow
nloa
ded
by [
Uni
vers
ity o
f Il
linoi
s at
Urb
ana-
Cha
mpa
ign]
at 0
5:42
18
Sept
embe
r 20
13

240 RlBElRO AND VENTURA
INTRODUCTION
Textile industry represents in Portugal about 17 per cent of
the manufacturing industry production and 28 per sent of the
industrial manpower. Considering its main components - Spinning, Weaving, Dyeing and Finishing - the firat two use essentially
electrical energy, while the last two sectors consume mainly
thermal energy. Drying is a very important operation in these
component-, and its application in the dyeing sector has been
less studied than in the finishing sector. This was therefore one
of the motivations for the present study.
Drying procees of textile bobbins is normally carried out in
two steps, centrifugal extraction of water followed by heat input
that gives riee t o evaporation of moisture. Mechanical drying
processes, are more economical than thermal ones; however, they
are not sufficient to reach deeirable drying levels. Hence,
mechanical drying must be usually followed by thermal drying.
Thermal processes used in the textile industry, particularly
in the wool industry, consist of passing a hot air stream over
the surface of the material to be dried. Air flow transfers heat
to the material by forced convection and, at the same time,
carries away evaporated water. The process continues until
equilibrium is attained, depending upon drying air temperature
and humidity.
Drying rat*! depends upon several factors, which primarily
include the material structure, air temperature, air humidity.
air flow turbulence, material thickness and exposed surface area.
Data on textile bobbins drying are insufficient. Nissan et
al. (1959) did some work with woollen flannel of closed
structure. The material was wound as cylindrical bobbins and was
dried in a wind tunnel in which hot air flowed along the axis of
Dow
nloa
ded
by [
Uni
vers
ity o
f Il
linoi
s at
Urb
ana-
Cha
mpa
ign]
at 0
5:42
18
Sept
embe
r 20
13

TEXnLE BOBBINS DRYING PROCESSES 24 1
the cylinder. Heat transfer was observed to take place solely
from the outer surface. A more recent study using cans of scoured
wool, was conducted by Walker (1969). This work aimed at
determining the drying rate curve and the temperature
distribution.
In the present work, experiments were carried out using
Cheviot wool bobbins (500 g net weight) with an approximate
conical form. Internal diameter was varied from 0.035 to 0.Of.m.
External diameter was kept between 0.13 and 0.16~1. hi bobbins
were 0.15 m long and were supported by a polyethylene structure
with holes.
In industrial drying processes, textile wool bobbins are
mounted top-to-top, forming a long cylinder. In the work reported
in the first part of the present paper (cross circulation
drying), only one bobbin was used with bottom and top covered by
stainless steel plates. The textile bobbin was fitted with 7
copper/constantan thermocouples, equally spaced, both in the
radial end azymuthal directions and equidistant from both the
lower and upper edges, as shown in Pig. 1. Preliminary
experiments showed that temperature differences along the bobbin
length were not important.
This drying technique presents serious limications concerning
total drying time. Even with 90 'C air temperature and 5 mls air
velocity it was not possible to reduce the drying time below 7
hours. However, commercial equipment exists where drying times
are much smaller, using pressurized air which is forced to move
through the bobbin from inside to outside. From this knowledge,
it was decided to study this drying technology, in particular the
influence of air temperature and flow rate on drying time.
Therefore, a new experimental rig was built, using
pressurized air, where five bobbins were placed top-to-top; the
Dow
nloa
ded
by [
Uni
vers
ity o
f Il
linoi
s at
Urb
ana-
Cha
mpa
ign]
at 0
5:42
18
Sept
embe
r 20
13

RlBElRO AND VENTURA
FIGURE 1 - Sketch of bobbin with thermocouples in position
Dow
nloa
ded
by [
Uni
vers
ity o
f Il
linoi
s at
Urb
ana-
Cha
mpa
ign]
at 0
5:42
18
Sept
embe
r 20
13

TEXTILE BOBBINS DRYING PROCESSES 243
second bobbin was fitted with thermocouples in a similar way to
the only bobbin ueed in cross circulation drying. In thia way, a
set of experiments using through circulation drying was
performed.
CROSS CIRCULATION
Experimental Set-Up
Hot air, at the required temperature and velociry, w a s
directed to the bobbin located axially inside a 20 cm i.d. duct.
Figure 2 shows a sketch of the experimental set up.
An electronic scale. Sartorius U3600, 0.19 resolution,
allowed continuous weighing of the bobbin. Temperature and weight
data were monitored and acquired by a datalogger, Fluke Helios I,
which sent them to a file on a microcomputer.
Air velocity was monitored by an orifice plate, 9 1 mm ID,
calibrated according BS 1042: Part 1, ( 1 9 6 4 ) . located on the air
duct. Air was electrically heated and its temperature controlled
by s PID regulator, Eurotherm 810. Values of air temperature, air
humidity and temperatures inside the bobbin, were fed at
previously defined time intervals to the datalogger, to be
recorded in the data file.
Modelling
To simulate the drying process, a mathematical model was
developed. The assumptions embedded in the model are described
below.
Due to the bobbin geometry, the heat equation was written in
cylindrical coordinates.
Dow
nloa
ded
by [
Uni
vers
ity o
f Il
linoi
s at
Urb
ana-
Cha
mpa
ign]
at 0
5:42
18
Sept
embe
r 20
13

FIGURE 2 - Schematic diagram of the wind tunnel.(Words in small type denote measured properties)
where:
T temperature
t time
c t thermal diffusivity
Dow
nloa
ded
by [
Uni
vers
ity o
f Il
linoi
s at
Urb
ana-
Cha
mpa
ign]
at 0
5:42
18
Sept
embe
r 20
13
TEXnLE BOBBINS DRYING PROCESSES 245
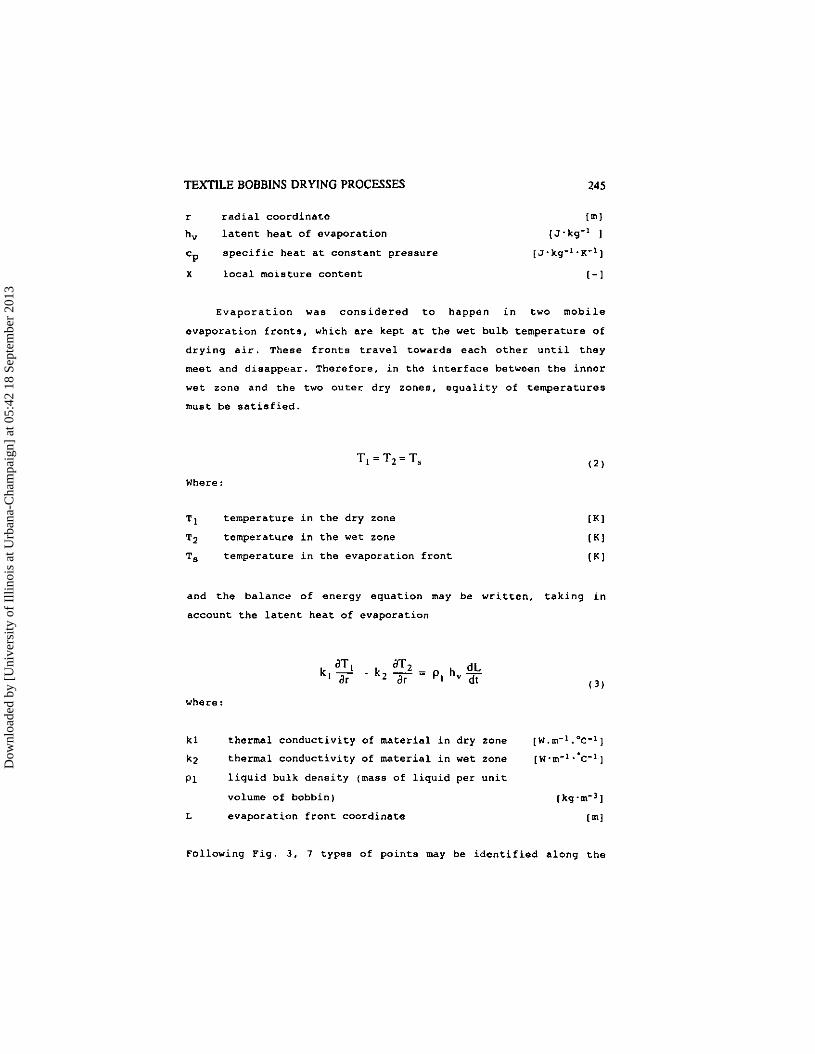
r radial coordinate [ml
h, latent heat of evaporation [~.kg'' I
cp specific heat at conatant preasure [3'kg-"~-']
X local moiature content [-I
Evaporation was considered to happen in two mobile
evaporation fronts, which are kept at the wet bulb temperature of
drying air. These fronts travel towards each other until they
meet and disappear. Therefore, in the interface between the inner
wet none and the two outer dry zones, equality of temperatures
must be satisfied.
T , = T 2 = T , (2)
Where:
T I temperature in the dry zone
T~ temperature in the wet zone
T, temperature in the evaporation front
and the balance of energy equation may be written, taking in
account the latent heat of evaporation
where:
kl thermal conductivity of material in dry zone [W.m-l.sC-' 1
k2 thermal conductivity of materiel in wet zone [w.m-'.'c-l I
01 liquid bulk deneity (mass of liquid pee unit
volume of bobbin) [kg-m-l]
L evaporation front coordinate [ml
Following Fig. 3, 7 types of points may be identified along the
Dow
nloa
ded
by [
Uni
vers
ity o
f Il
linoi
s at
Urb
ana-
Cha
mpa
ign]
at 0
5:42
18
Sept
embe
r 20
13

RlBElRO AND VENTURA
/ rfi " e;zone \/ ::;; 1, Dry zone
P7 , P6 P5 P4 P3 P2 P1
FIGURE 3 - Schematic diagram shoving the location of the points for drying simulation
radius, corresponding to:
1 - boundary between exterior dry rone and drying air 2 - point in exterior dry rone 3 - boundary between exterior dry zone and wet zone (exterior
front)
4 - wet zone 5 - boundary betveen interior dry zone and wet zone (interior
front)
6 - point in the interior dry zone 7 - boundary between interior dry zone and drying air.
It ahould be noted that the distance between points varies in
time. In the beginning it is zero between points 1 and 3 on one
hand and points 5 and 7 on the other hand: it is maximum between
points 3 and 5. By the end of the run these conditione are the
opposite, as the wet rone decreases at the expense of the two dry
zones.
Dow
nloa
ded
by [
Uni
vers
ity o
f Il
linoi
s at
Urb
ana-
Cha
mpa
ign]
at 0
5:42
18
Sept
embe
r 20
13

TEXTILE BOBBINS DRYING PROCESSES 247
The general equation presented above may be decomposed into 3
equations, two corresponding to the dry zones and one to the wet
zone.
where:
"1 thermal diffuaivity in dry zone
u2 thermal diffusivity in wet =one
re outer radius of the bobbin
ri inner radius of the bobbin
rLe position of the outer interface
r position of the inner interface
when the above equations are discretized, the last term in
the right-hand side exists only in the cells containing the
evaporation fronts.
Initial and boundary conditions were as follows:
TI = 1 5 - C
T2 - - 1 S'C
r ~ i = ri
rLe = re
Air was considered to be at 20% and 60% RH, before
being heated (to 60. 70, 80 or 9 0 ° C ) .
Dow
nloa
ded
by [
Uni
vers
ity o
f Il
linoi
s at
Urb
ana-
Cha
mpa
ign]
at 0
5:42
18
Sept
embe
r 20
13

248 RlBElRO AND VENTURA
Xh (moisture content in wet zone) =50a
X. (moisture content in exterior dry none) =lo\
Xi (moisture content in interior dry zone) =10P
k <I = -
I' c,, was obtained from a weighted average of the
properties of air, water and dry fibres.
Hi and He, heat transfer coefficients in the boundaries of
the bobbin, vere calculated through the correlation Dittue-
Boelter, reported by Holman (19761.
Results and Discussion
Experimental Results
In these experiments, temperatures of 70, 80 and 90 OC and
air velocities ranging from 2 to 4 mls were used. From the raw
data, profiles of temperature and moisture content against time
were obtained, e typical rseult being shown in Fig. 4.
Moieture content wae obtained weighing the bobbin along the
time and is expressed in percentage of dry weight.
After the first stage corresponding to the heating of the
bobbin (Region AB), a levelling of temperature is observed for
a11 the interior points (Region BC). The value at which the
levelling in temperature occurs, and its duration, depend on the
position of the thermocouple and correspond to the attainment of
a state of equilibrium between the m o u n t of heat transferred to
the material and the heat lost by evaporation. The constant value
of the temperature at this stage ie referred to as 'paeudo-wet-
bulb temperature- (Nisean et el., 1959). According t o Toei
(19831, the difference between this temperature end the wet bulb
temperature is 3 to 5'C if the thickness of the material is belov
5 mm.
Dow
nloa
ded
by [
Uni
vers
ity o
f Il
linoi
s at
Urb
ana-
Cha
mpa
ign]
at 0
5:42
18
Sept
embe
r 20
13

TEXTILE BOBBINS DRYING PROCESSES 249
Time (min)
FIGURE 4 - Variation of temperature and moiature content with time. (The curve labelled MC refers to the bulk moisture content of the bobbin. Curves labelled Ti refer to temperaturee inside the bobbin (T2 to T61 and on outside surface (TI) and inside surface (T7)I
For each location on the interior, the end of this constant
period corresponds to the bobbin becoming dry: hence there is no
more water to evaporate and as a result the equilibrium can no
longer be maintained and the temperature rises again. However,
part of the heat which ia arriving is still transferred to the
interior of the bobbin where evaporation is still taking place,
slowing down the rate at which the temperature rises (Region CD).
When the bobbin is totally dry, the rising of temperature becomes
stronger (Region DE) and the experimental test run ie completed.
Evaoorafion. The points C (end of the constant
temperature r c n e ) for each thermocouple location can be
aseociated to an evaporation front which is the boundary between
Dow
nloa
ded
by [
Uni
vers
ity o
f Il
linoi
s at
Urb
ana-
Cha
mpa
ign]
at 0
5:42
18
Sept
embe
r 20
13

250 RlBElRO AND VENTURA
TABLE 1 - Drying time in duct experiments (min)
two zones. name1.y the wet, liquid moi~ture diffusion zone, on the
interior, and the dry, vapour diffusion zone, on the exterior. AS
air convection drying takes place on both sides of the bobbin.
two evaporation fronts develop progressing towards each other
until they meet (Point D). This point is used to define the end
of drying.
Table I ahows drying timea (in minutes) for each thermocouple
location, for different air temperatures and velocitiee.
Figure 5 was drawn from the values in Table 1; it shows the
locecion of the evaporation fronta with time for each different
condition of the inlet air.
The slight "on-symmetry observed in the curves in Fig. 5 can
be explained by the geometry of the bobbin, with different heat
transfer areas cn the ourside and inside.
From Fig. 5, drying times for the whole bobbin can be
obtained. and these are shown in Table 2.
Dow
nloa
ded
by [
Uni
vers
ity o
f Il
linoi
s at
Urb
ana-
Cha
mpa
ign]
at 0
5:42
18
Sept
embe
r 20
13

TEXTILE BOBBINS DRYING PROCESSES
0 I00 ZOO 300 400 500 600 700 BOO
Time (mi")
FlCUilE 5 - Evaporation front disappearance
TABLE 2 - Evaporation front disappearance
Dow
nloa
ded
by [
Uni
vers
ity o
f Il
linoi
s at
Urb
ana-
Cha
mpa
ign]
at 0
5:42
18
Sept
embe
r 20
13
252 RlBElRO AND VENTURA
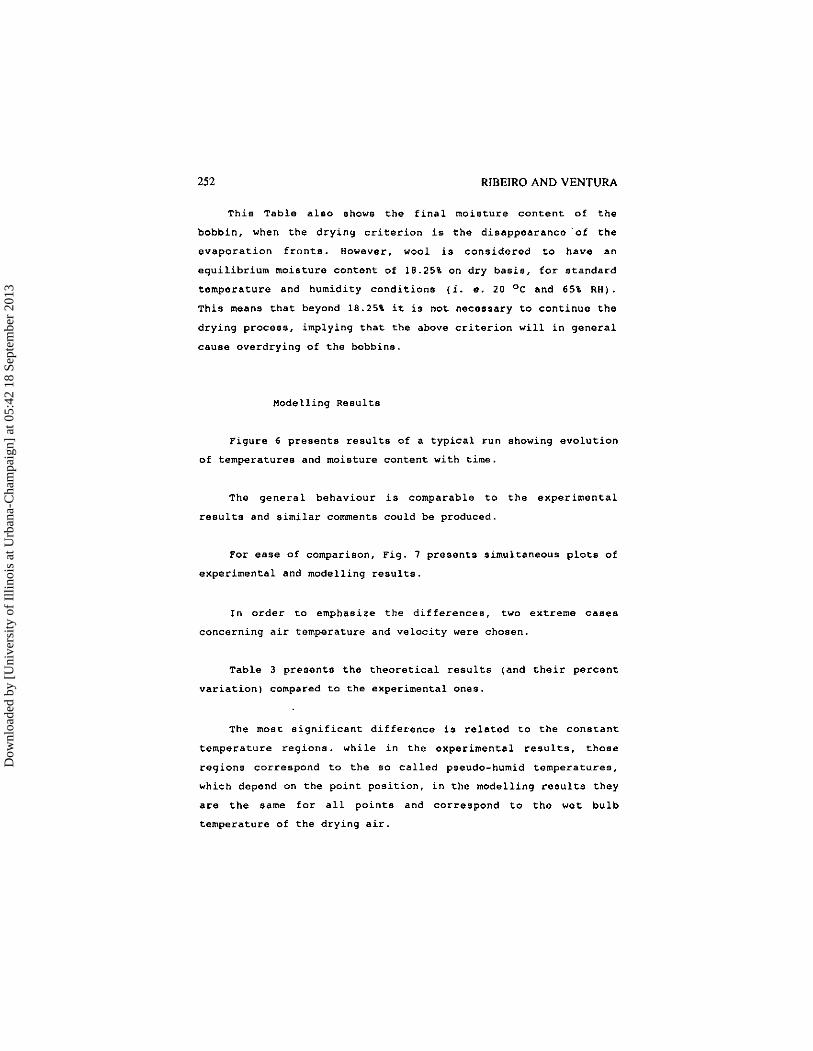
This Table also shows the final moisture content o f the
bobbin, when the drying criterion is the disappearance'of the
evaporation fronts. However, wool is considered to have an
equilibrium moisture content of 18.25% on dry basis, for standard
temperature and humidity conditions (i. e. 20 OC and 65% RH).
This means that beyond 18.25% it is not necessary to continue the
drying process, implying that the above criterion will in general
cause overdrying of the bobbins.
Modelling Results
Figure 6 presents results of a typical run showing evolution
of temperatures and moisture content with time.
The general behaviour is comparable to the experimental
results and similar comments could be produced.
for ease of comparison, Fig. 7 presents simultaneous plots of
experimental and modelling results.
In order to emphasize the differences, two extreme cases
concerning air temperature and velocity were chosen.
Table 3 preeente the theoretical results (and their percent
variation) compared to che experimental ones.
The most significant difference is related to the constant
temperature regiona. while in the experimental results, those
regions correspond to the so called pseudo-humid temperatures,
which depend on the point position, in the modelling results they
are the same for all points and correspond to the wet bulb
temperature of the drying air.
Dow
nloa
ded
by [
Uni
vers
ity o
f Il
linoi
s at
Urb
ana-
Cha
mpa
ign]
at 0
5:42
18
Sept
embe
r 20
13

TEXTILE BOBBINS DRYING PROCESSES
0 'O u 1:: 0 100 200 300 400 500 600
Time (min)
FIGURE 6 - Temperatures and moisture content evolution. Modelling values. (The curve labelled nC refers t o the bulk moisture content of the bobbin. Curves labelled T i refer to remperarures inside the bobbin (T2 to T6) and on outside surface (Tl) and inside surface (T7))
THROUGH CIRCULATION
Experimental Set-up
A new experimental rig was built, using pressurized air,
where five bobbins were placed top-to-top; the second bobbin was
fitted with thermocouples. Figure 8 ehows a aketch of the
experimental rig.
Air was farced to move through the bobbins from inside to
outside. The air was electrically heated, its temperature being
set by a PID controller; air velocity was controlled by two
valves and monitored by a rotameter.
Dow
nloa
ded
by [
Uni
vers
ity o
f Il
linoi
s at
Urb
ana-
Cha
mpa
ign]
at 0
5:42
18
Sept
embe
r 20
13

254 RlBElRO AND VENTURA
I 0.00 0 100 200 300 400 500 600
Time (mi")
FIGURE 7a - Temperature and moisture content evolution inside the bobbin
Drying air conditione: Temperature 90 'C. Velocity 4 mls. Symbols: Experimental results. Lines: Modelling results
With this experimental set-up, it was not possible to measure
directly the evolution of the bobbin's mass and therefore to
follow its overall moisture content. Thie has been evaluated from
the knowledge of air moisture variation between dryer input and
output.
Measurements in industry have indicated air flow rates of
about 150 litreo per minute and per bobbin. Our compressor could
provide up to 900 litres per minute at a pressure between 4.5 and
Dow
nloa
ded
by [
Uni
vers
ity o
f Il
linoi
s at
Urb
ana-
Cha
mpa
ign]
at 0
5:42
18
Sept
embe
r 20
13

TEXTILE BOBBINS DRYING PROCESSES
0 200 400 600 800
Time (min)
0 T I . T2 O T3 T4
FIGURE 7b - Temperature and moisture content evolution inside the - . - - . . .
Drying air conditions: Temperature 1 0 'C. Velocity 2 mls. Symbols: Experimental results. Lines: Modelling results
6.5 bar. Before entering the drying rig, air paeeed through a
pressure reducer where its pressure was stabilized in 4 or 2 bar.
according to the desired flow rate.
Modelling
In pressurized drying, air goes from the inside t o the
outside o f the bobbin, its moisture increasing at constant
enthalpy until becoming saturated.
Dow
nloa
ded
by [
Uni
vers
ity o
f Il
linoi
s at
Urb
ana-
Cha
mpa
ign]
at 0
5:42
18
Sept
embe
r 20
13

256 RIBEIRO AND VENTURA
TABLE 3 - Comparison between theoretical and experimental drying time
Figure 9 shows the evolution of the drying air in the
psychrometric diagram.
From point A air is heated until point 8 and the process
inside the bobbin is represented by the evolution 8-C.
Experimental Results
In this experiments there is only one drying front which
progresses from inside to outside. Figure 10 presents a typical
result. The end of drying w a s considered to be when the
temperature of the most exterior point reached half of the total
temperature rise.
The difference between the imposed 90'c and the measured
values of about 82'C is attributed to the distance between the
Dow
nloa
ded
by [
Uni
vers
ity o
f Il
linoi
s at
Urb
ana-
Cha
mpa
ign]
at 0
5:42
18
Sept
embe
r 20
13

TEXTILE BOBBINS DRYING PROCESSES
FIGURE 8 - Schematic diagram of the pressurized rig
Dow
nloa
ded
by [
Uni
vers
ity o
f Il
linoi
s at
Urb
ana-
Cha
mpa
ign]
at 0
5:42
18
Sept
embe
r 20
13

258 RlBElRO AND VENTURA
t Absolute Humidity
FIGURE 9 - Evolution of the drying air in the psychrometric diagram
Time (mnn]
FIGURE 10 - Temperature and air exhaust humidity along the time. Presnurized drying. (The curve labelled RH refers to the relative humidity of the exhaust air. Curves labelled Ti refer to temperatures inside the bobbin (T2 to T6) end on outside surface (TI) and inside surface (T7) )
Dow
nloa
ded
by [
Uni
vers
ity o
f Il
linoi
s at
Urb
ana-
Cha
mpa
ign]
at 0
5:42
18
Sept
embe
r 20
13

TEXTILE BOBBINS DRYING PROCESSES 259
- 90%. 750 llmin
90°C. 500 llrnin --.-- 80'C. 750 llmin
80°C. 500 Vmin
. . . . , . . . . 70°C. 750 llmin
--A'--- 70%. 500 Vmin
0 5 0 100 150 200 250 300
Time (min]
FIGURE 11- Evaporation front disappearance. Pressurized experiments
thermocouple which fixed the controller setting point and the
instrumented bohbin, implying some cooling of the air between the
two stations.
Each line in Fig. 1 1 , which represents approximately the
evolution of the evaporation front [Nissan, Kaye and Bell, 1 9 5 9 1 .
was obtained from a set of data like the one in Fig. 1 0 .
Drying times for the bobbin were obtained from Fig. 1 1 and
are shown in Table I .
Modelling Results
Figure 12 presents a typical reault from the simulation of
the present experimental situation
Dow
nloa
ded
by [
Uni
vers
ity o
f Il
linoi
s at
Urb
ana-
Cha
mpa
ign]
at 0
5:42
18
Sept
embe
r 20
13

RIBElRO AND VENTURA
TABLE 4 Drying times on pressurized drying
0 20 4 0 6 0 80 100
Time (min)
FIGURE 12 - simlllated results from the pre3surired drying process
Dow
nloa
ded
by [
Uni
vers
ity o
f Il
linoi
s at
Urb
ana-
Cha
mpa
ign]
at 0
5:42
18
Sept
embe
r 20
13

TEXTILE BOBBINS DRYING PROCESSES 261
TABLE 5 - Comparison between simulated and experimental results
Drying times
Table 5 contains e summary of the results for the different
conditions which were simulated, a e well as the corresponding
experimental results.
CONCLUSIONS
Crose Circulation Drying
The modelling results show a reasonable correspondance to the
experimental ones. For each point there is a heating period, a
constant temperature level and two further periods of temperature
rise: in the steeper, last one, there is not any heat provided
for water vaporization, and therefore it corresponds to pure
heating of the material.
In the modelling reeults, we can see, in the beginning of the
process, a sudden drop in moisture content, which is not observed
in the experimental results. This is attributed to the fact that,
in the model, we are conaidering evaporation to occur at the wet
bulb temperature; therefore, the rise in the interface
temperature will be smaller and a larger amount of heat will be
used to evaporation.
Dow
nloa
ded
by [
Uni
vers
ity o
f Il
linoi
s at
Urb
ana-
Cha
mpa
ign]
at 0
5:42
18
Sept
embe
r 20
13

262 RlBEIRO AND VENTURA
The sudden drop in moisture content near the end of the
proceee results from considering that the material is dry when
the wet zone thickneaa goes below 1 m.
The final rise in temperature in the model is much steeper
than in the experiments, because we consider the transition
between drying and pure heating of the material a discontinuous
one. This does not happen in reality and therefore the
experimental results show a smoother transition between the two
regions.
The difference in temperature level, between experimental and
modelling results, for the constant temperature zone (specially
noticeable for measuring positions 3, 1 and 5) is attributed to
the difference between wet bulb temperature (used in the model)
and peeudo-wet bulb temperature.
Through Circulation Drying
Comparing Fig. 1 2 wrth Fig. 10, a sharp traneitian in
temperature for each thermocouple is observed in the modelling
results, when the region around the thermocouple becomes dry.
Exporimentally, this is never observed, because the evaporation
front possesses a finite thisknesa, albeit small.
A difference of the same kind may be seen in the evolution of
humidity: experimental resulcs are always characterized by
smoother transitions between humidity levels.
In contrast with the results of cross circulation, where
experimental and modelled drying times are very similar, the
results of through circulation show differences of about 60 per
cent. This is due to the fact that, in the model, air is
considered saturated until the bobbin is completely dry. not
Dow
nloa
ded
by [
Uni
vers
ity o
f Il
linoi
s at
Urb
ana-
Cha
mpa
ign]
at 0
5:42
18
Sept
embe
r 20
13

TEXTILE BOBBINS DRYING PROCESSES 263
being recognized the failing rate drying period, while in the
experiments this is only true for the first part of the run.
Comparing the two drying techniques, 'through circulation'
shows shorter drying times (between 2 and 3 times shorrer,
depending on the air flow rate). However, an extra energy input
is needed to pressurize the air, and therefore the choice between
both processes is not clear, depending on the operating
conditions (type and amount of material to be processed).
NOTATION
constant pressure specific heat [~.kg-'.~-Ij
exterior convection heat transfer coefficient [W.m-'.'c-']
interior convection heat transfer coefficient [w.~-~.'c-']
vaporization latent heat [~.kg-' ]
specific enthalpy of the drying air in state A [kJ kg-']
specific enthalpy of the drying air in state B [kJ kg-']
specific enthalpy of the drying air in state C [kJ kg-']
dry zone thermal conductivity [H.m-l ..C-~l
wet zone thermal conductivity [w.m-l
evaporaticn front coordinate I ~ I exterior evaporation front advance lml
interior evaporation front advance [ml
bulk moisture content of the bobbin [ - I
flow rate [litres/min]
air exhaust relative humidity [ - I radius of bobbin at the point considered I ~ I outer radius of bobbin ["'I inner radius of bobbin [ml
position cf the outer interface [ml
position cf the inner interface [ml
temperature l K 1 temperature in the dry zone [KI
Dow
nloa
ded
by [
Uni
vers
ity o
f Il
linoi
s at
Urb
ana-
Cha
mpa
ign]
at 0
5:42
18
Sept
embe
r 20
13

2 64 RlBElRO AND VENTURA
temperature in the wet zone
temperature of the drying air in state A
temperature of the drying air in state B
temperature of the drying air in state C
temperatures in the bobbin
temperature in the evaporation front
time
air velocity
moisture content of the material
moisture content in exterior dry rone
moisture content in wet zone
moisture content in interior dry rone
absolute humidity of the drying air in state A
absolute humidity of the 'drying air in state B
absolute humidity of the drying air in state C
Greek symbols
r t thermal diffusivity [m2.s-'1
'ti thermal diffusivity in the dry zone [m2.e-'1
"2 chermal diffusivity in the wet zone [m2.s-'1
liquid bulk density (mass of liquid per unit
volume of bobbin) 1kg.m-'1
REFERENCES
1 Nissan, A.H.; W. A. Kaye; T. V. Bell (1959) Mechanism of
Drying Thick Porous Bodies During the Falling-Rate Period. I
The Pseuda-Wet-Bulb Temperature. AICHE J., 5, 103-110.
2 walker, B:v: (1969) The Drying Characteristics of Scoured
Wool. N.Z.J.Sci.. 12, 139-164.
Dow
nloa
ded
by [
Uni
vers
ity o
f Il
linoi
s at
Urb
ana-
Cha
mpa
ign]
at 0
5:42
18
Sept
embe
r 20
13

TEXTILE BOBBINS DRYING PROCESSES 265
3 British standard 1042i Part 1: (1964) Methods for the
Measurement of Fluid Flow in Pipes. Part 1, Orifice Plates,
Nozzles and Venturi Tubes. British Standard Institution.
London.
4 Holman. J.P.[1976], Heat Transfer, McGraw-Hill, New York
5 Toei, R. [1983], Drying Mechanism of Capillary Porous Bodies
- in - Advances in Drying, vol. 2, 269-297, Hemisphere
Publishing Corporation. Washington.
Dow
nloa
ded
by [
Uni
vers
ity o
f Il
linoi
s at
Urb
ana-
Cha
mpa
ign]
at 0
5:42
18
Sept
embe
r 20
13