Embed Size (px)
Citation preview
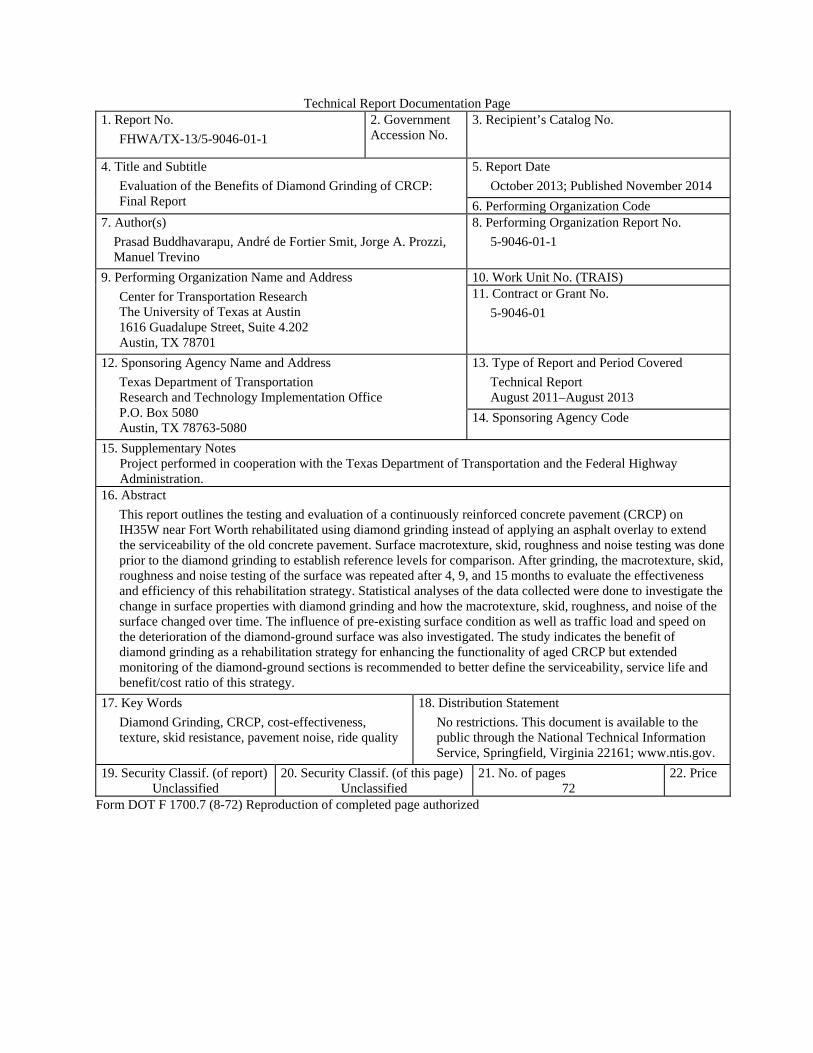
Technical Report Documentation Page 1. Report No.
FHWA/TX-13/5-9046-01-1
2. Government Accession No.
3. Recipient’s Catalog No.
4. Title and Subtitle
Evaluation of the Benefits of Diamond Grinding of CRCP: Final Report
5. Report Date
October 2013; Published November 2014
6. Performing Organization Code 7. Author(s)
Prasad Buddhavarapu, André de Fortier Smit, Jorge A. Prozzi, Manuel Trevino
8. Performing Organization Report No.
5-9046-01-1
9. Performing Organization Name and Address
Center for Transportation Research The University of Texas at Austin 1616 Guadalupe Street, Suite 4.202 Austin, TX 78701
10. Work Unit No. (TRAIS) 11. Contract or Grant No.
5-9046-01
12. Sponsoring Agency Name and Address
Texas Department of Transportation Research and Technology Implementation Office P.O. Box 5080 Austin, TX 78763-5080
13. Type of Report and Period Covered
Technical Report August 2011–August 2013
14. Sponsoring Agency Code
15. Supplementary Notes Project performed in cooperation with the Texas Department of Transportation and the Federal Highway Administration.
16. Abstract
This report outlines the testing and evaluation of a continuously reinforced concrete pavement (CRCP) on IH35W near Fort Worth rehabilitated using diamond grinding instead of applying an asphalt overlay to extend the serviceability of the old concrete pavement. Surface macrotexture, skid, roughness and noise testing was done prior to the diamond grinding to establish reference levels for comparison. After grinding, the macrotexture, skid, roughness and noise testing of the surface was repeated after 4, 9, and 15 months to evaluate the effectiveness and efficiency of this rehabilitation strategy. Statistical analyses of the data collected were done to investigate the change in surface properties with diamond grinding and how the macrotexture, skid, roughness, and noise of the surface changed over time. The influence of pre-existing surface condition as well as traffic load and speed on the deterioration of the diamond-ground surface was also investigated. The study indicates the benefit of diamond grinding as a rehabilitation strategy for enhancing the functionality of aged CRCP but extended monitoring of the diamond-ground sections is recommended to better define the serviceability, service life and benefit/cost ratio of this strategy.
17. Key Words
Diamond Grinding, CRCP, cost-effectiveness, texture, skid resistance, pavement noise, ride quality
18. Distribution Statement
No restrictions. This document is available to the public through the National Technical Information Service, Springfield, Virginia 22161; www.ntis.gov.
19. Security Classif. (of report) Unclassified
20. Security Classif. (of this page) Unclassified
21. No. of pages 72
22. Price
Form DOT F 1700.7 (8-72) Reproduction of completed page authorized

Evaluation of the Benefits of Diamond Grinding of CRCP: Final Report Prasad Buddhavarapu André de Fortier Smit Jorge A. Prozzi Manuel Trevino
CTR Technical Report: 5-9046-01-1 Report Date: October 2013 Project: 5-9046-01 Project Title: Evaluation of the Benefits of Diamond Grinding of CRC Pavements Sponsoring Agency: Texas Department of Transportation Performing Agency: Center for Transportation Research at The University of Texas at Austin Project performed in cooperation with the Texas Department of Transportation and the Federal Highway Administration.

iv
Center for Transportation Research The University of Texas at Austin 1616 Guadalupe St, Suite 4.202 Austin, TX 78701 http://ctr.utexas.edu/

v
Disclaimers Author's Disclaimer: The contents of this report reflect the views of the authors, who
are responsible for the facts and the accuracy of the data presented herein. The contents do not necessarily reflect the official view or policies of the Federal Highway Administration or the Texas Department of Transportation (TxDOT). This report does not constitute a standard, specification, or regulation.
Patent Disclaimer: There was no invention or discovery conceived or first actually reduced to practice in the course of or under this contract, including any art, method, process, machine manufacture, design or composition of matter, or any new useful improvement thereof, or any variety of plant, which is or may be patentable under the patent laws of the United States of America or any foreign country.
Engineering Disclaimer NOT INTENDED FOR CONSTRUCTION, BIDDING, OR PERMIT PURPOSES.
Research Supervisor: Dr. Jorge Prozzi

vi
Acknowledgments The authors express appreciation to the following personnel from the TxDOT Fort Worth
district office: Project Director David Wagner and his assistant, Andy Kissig, for their help throughout the duration of project, and Reco Chazarreta of the maintenance division for arranging traffic control for testing on IH35W.
vii
Table of Contents
Chapter 1. Introduction.................................................................................................................1 1.1 Background ............................................................................................................................1 1.2 Study Objectives ....................................................................................................................2 1.3 Report Outline ........................................................................................................................3
Chapter 2. Literature Review .......................................................................................................5 2.1 Diamond Grinding .................................................................................................................5 2.2 Influence of Diamond Grinding .............................................................................................6
2.2.1 Surface Texture and Skid Resistance ..............................................................................6 2.2.2 Pavement Roughness ......................................................................................................8 2.2.3 Pavement Noise ..............................................................................................................9 2.2.4 Structural Effects ..........................................................................................................10
2.3 Survival of the Diamond-Ground Surface ...........................................................................10
Chapter 3. Experimental Program .............................................................................................13 3.1 Diamond Grinding Rehabilitation .......................................................................................13 3.2 Field Data Collection ...........................................................................................................14
3.2.1 Surface Macrotexture ....................................................................................................15 3.2.2 Skid Resistance .............................................................................................................16 3.2.3 Surface Roughness ........................................................................................................17 3.2.4 Pavement Noise ............................................................................................................18
Chapter 4. Effectiveness and Efficiency .....................................................................................19 4.1 Immediate Effectiveness of Diamond Grinding ..................................................................19
4.1.1 Influence of Site-Specific Conditions on Effectiveness ...............................................21 4.2 Long-Term Effectiveness of Diamond Grinding .................................................................26
4.2.1 Influence of Site-Specific Conditions on Efficiency ....................................................29
Chapter 5. Cost-Effectiveness .....................................................................................................35 5.1 Cost Analysis .......................................................................................................................36
Chapter 6. Conclusions and Recommendations ........................................................................39 6.1 Effectiveness ........................................................................................................................39 6.2 Efficiency .............................................................................................................................40
References .....................................................................................................................................43
Appendix A: Data Collection Period I (January to April, 2012) .............................................45 A.1 Sand Patch, Circular Texture Meter, and Dynamic Friction Tester ................................45 A.2 Skid Trailer .....................................................................................................................47 A.3 Inertial Profiler (Roughness) ...........................................................................................49 A.4 Pavement Noise (OBSI) ..................................................................................................51
Appendix B: Data Collection Period II (May 2012 to July 2013) ............................................53 B.1 Sand Patch, Circular Texture Meter, and Dynamic Friction Tester ................................53 B.2 Skid Trailer ......................................................................................................................55 B.3 Inertial Profiler (Roughness) ...........................................................................................57 B.4 Pavement Noise (OBSI) ..................................................................................................59

viii
ix
List of Figures
Figure 2.1: Surface after the grinding ............................................................................................. 5 Figure 2.2: Typical diamond-grinding blade assembly .................................................................. 5 Figure 2.3: Mean texture depth with age since grinding, sorted by climatic region (Rao et
al., 1998) ............................................................................................................................. 7 Figure 2.4: Accident rates between 1988 and 1993 for diamond-ground and tined
pavements (Rao et al., 1999)............................................................................................... 8 Figure 2.5: Immediate effects of diamond grinding on pavement smoothness (Rao et al.,
1999) ................................................................................................................................... 8 Figure 2.6: Temporal variation of IRI on non-ground and ground sections (Rao et al.,
1999) ................................................................................................................................... 9 Figure 2.7: Survival curve with respect to age since first grind for diamond-ground
pavement (Rao et al., 1999) .............................................................................................. 11 Figure 2.8: Survival curve with respect to traffic since first grind for diamond-ground
pavement (Rao et al., 1999) .............................................................................................. 11 Figure 3.1: Site of the diamond-ground test sections in Fort Worth ............................................ 14 Figure 3.2: Sand patch test on transversely tined pavement (pre-grinding) ................................. 15 Figure 3.3: Circular texture meter ................................................................................................. 16 Figure 3.4: Dynamic friction tester ............................................................................................... 17 Figure 3.5: OBSI device microphones .......................................................................................... 18 Figure 4.1: Effectiveness of diamond grinding ............................................................................. 20 Figure 4.2: Overall noise reductions at different frequencies due to grinding ............................. 21 Figure 4.3: Correlation between texture (CTM) and coefficient of friction (DFT) ...................... 21 Figure 4.4: Deterioration of surface properties with time ............................................................. 26 Figure 4.5: Correlation between texture by CTM and sand patch ................................................ 28 Figure 5.1: Deterioration of surface properties with time ............................................................. 35 Figure 5.2: Analysis period for a pavement design alternative .................................................... 36 Figure 5.3: Performance curves for two rehabilitation strategies ................................................. 37 Figure 5.4: Breakdown of diamond-grinding rehabilitation costs ................................................ 38
Figure A.1 Northbound Inside Lane ............................................................................................. 47 Figure A.2 Northbound Outside Lane .......................................................................................... 47 Figure A.3 Southbound Inside Lane ............................................................................................. 48 Figure A.4 Southbound Outside Lane .......................................................................................... 48 Figure A.5 Northbound Inside Lane ............................................................................................. 49 Figure A.6 Northbound Outside Lane .......................................................................................... 49 Figure A.7 Southbound Inside Lane ............................................................................................. 50 Figure A.8 Southbound Outside Lane .......................................................................................... 50
x
Figure A.9 Northbound Direction ................................................................................................. 51 Figure A.10 Southbound Direction ............................................................................................... 51 Figure B.1 Northbound Inside Lane ............................................................................................. 55 Figure B.2 Northbound Outside Lane ........................................................................................... 55 Figure B.3 Southbound Inside Lane ............................................................................................. 56 Figure B.4 Southbound Outside Lane ........................................................................................... 56 Figure B.5 Northbound Inside Lane ............................................................................................. 57 Figure B.6 Northbound Outside Lane ........................................................................................... 57 Figure B.7 Southbound Inside Lane ............................................................................................. 58 Figure B.8 Southbound Outside Lane ........................................................................................... 58 Figure B.9 Northbound Inside Lane ............................................................................................. 59 Figure B.10 Northbound Outside Lane ......................................................................................... 59 Figure B.11 Southbound Inside Lane ........................................................................................... 60 Figure B.12 Southbound Outside Lane ......................................................................................... 60
xi
List of Tables
Table 2.1: Measured friction number before and after grinding (Mosher, 1985) ........................... 7 Table 3.1: Grinding specification ................................................................................................. 13 Table 4.1: Model estimates ........................................................................................................... 23 Table 4.2: Overall changes in surface properties over time .......................................................... 27 Table 4.3: Influence of site features on deterioration of ground CRC surface ............................. 31
Table A.1 Data from northbound sections .................................................................................... 45 Table A.2 Data from southbound sections .................................................................................... 46 Table B.1 Data from northbound sections .................................................................................... 53 Table B.2 Data from southbound sections .................................................................................... 54

xii
1
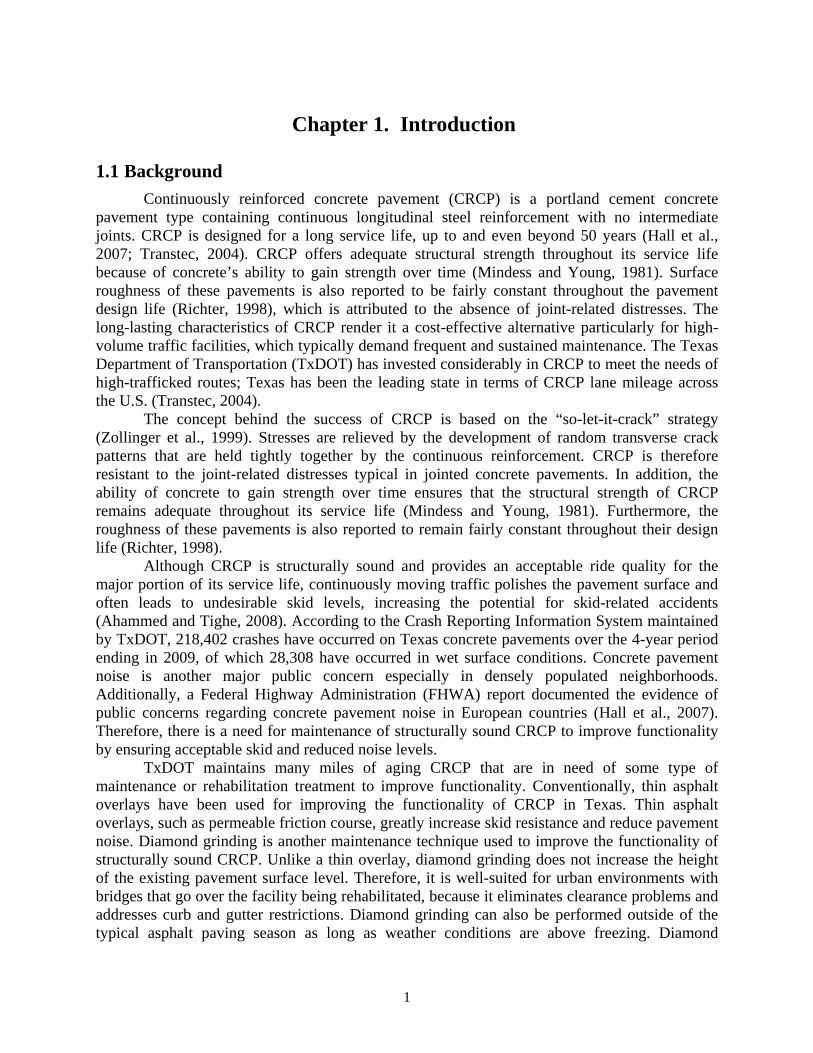
Chapter 1. Introduction
1.1 Background
Continuously reinforced concrete pavement (CRCP) is a portland cement concrete pavement type containing continuous longitudinal steel reinforcement with no intermediate joints. CRCP is designed for a long service life, up to and even beyond 50 years (Hall et al., 2007; Transtec, 2004). CRCP offers adequate structural strength throughout its service life because of concrete’s ability to gain strength over time (Mindess and Young, 1981). Surface roughness of these pavements is also reported to be fairly constant throughout the pavement design life (Richter, 1998), which is attributed to the absence of joint-related distresses. The long-lasting characteristics of CRCP render it a cost-effective alternative particularly for high-volume traffic facilities, which typically demand frequent and sustained maintenance. The Texas Department of Transportation (TxDOT) has invested considerably in CRCP to meet the needs of high-trafficked routes; Texas has been the leading state in terms of CRCP lane mileage across the U.S. (Transtec, 2004).
The concept behind the success of CRCP is based on the “so-let-it-crack” strategy (Zollinger et al., 1999). Stresses are relieved by the development of random transverse crack patterns that are held tightly together by the continuous reinforcement. CRCP is therefore resistant to the joint-related distresses typical in jointed concrete pavements. In addition, the ability of concrete to gain strength over time ensures that the structural strength of CRCP remains adequate throughout its service life (Mindess and Young, 1981). Furthermore, the roughness of these pavements is also reported to remain fairly constant throughout their design life (Richter, 1998).
Although CRCP is structurally sound and provides an acceptable ride quality for the major portion of its service life, continuously moving traffic polishes the pavement surface and often leads to undesirable skid levels, increasing the potential for skid-related accidents (Ahammed and Tighe, 2008). According to the Crash Reporting Information System maintained by TxDOT, 218,402 crashes have occurred on Texas concrete pavements over the 4-year period ending in 2009, of which 28,308 have occurred in wet surface conditions. Concrete pavement noise is another major public concern especially in densely populated neighborhoods. Additionally, a Federal Highway Administration (FHWA) report documented the evidence of public concerns regarding concrete pavement noise in European countries (Hall et al., 2007). Therefore, there is a need for maintenance of structurally sound CRCP to improve functionality by ensuring acceptable skid and reduced noise levels.
TxDOT maintains many miles of aging CRCP that are in need of some type of maintenance or rehabilitation treatment to improve functionality. Conventionally, thin asphalt overlays have been used for improving the functionality of CRCP in Texas. Thin asphalt overlays, such as permeable friction course, greatly increase skid resistance and reduce pavement noise. Diamond grinding is another maintenance technique used to improve the functionality of structurally sound CRCP. Unlike a thin overlay, diamond grinding does not increase the height of the existing pavement surface level. Therefore, it is well-suited for urban environments with bridges that go over the facility being rehabilitated, because it eliminates clearance problems and addresses curb and gutter restrictions. Diamond grinding can also be performed outside of the typical asphalt paving season as long as weather conditions are above freezing. Diamond
2
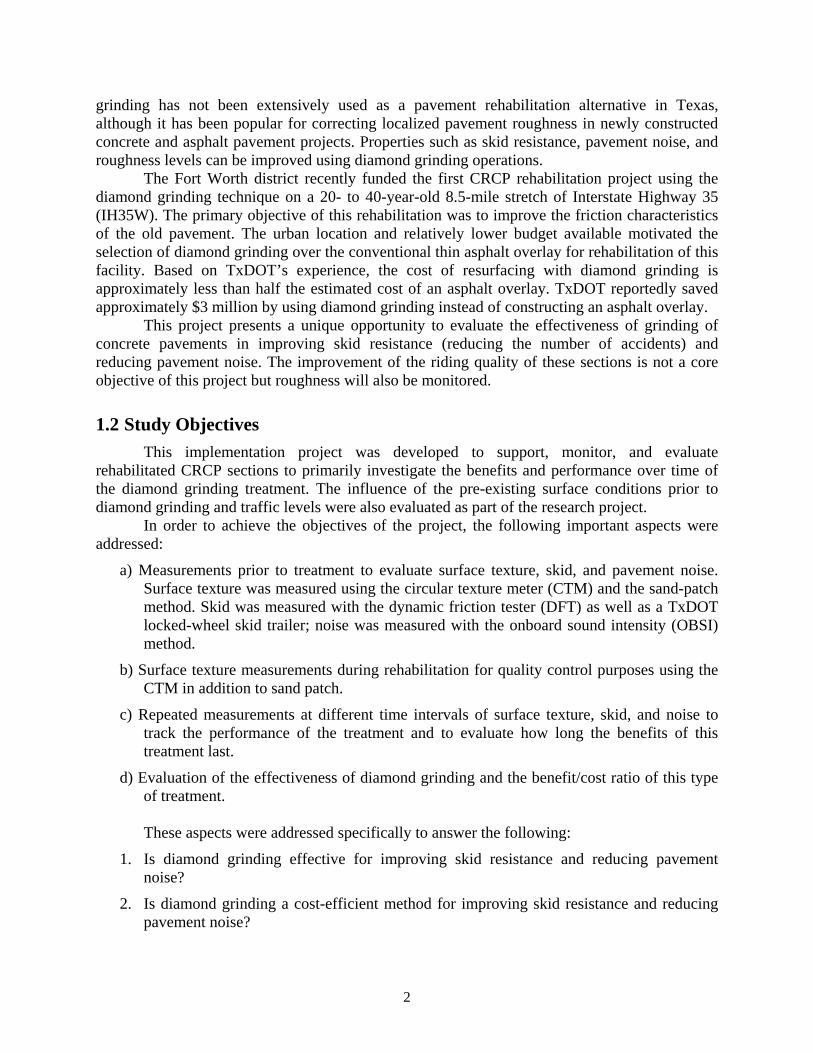
grinding has not been extensively used as a pavement rehabilitation alternative in Texas, although it has been popular for correcting localized pavement roughness in newly constructed concrete and asphalt pavement projects. Properties such as skid resistance, pavement noise, and roughness levels can be improved using diamond grinding operations.
The Fort Worth district recently funded the first CRCP rehabilitation project using the diamond grinding technique on a 20- to 40-year-old 8.5-mile stretch of Interstate Highway 35 (IH35W). The primary objective of this rehabilitation was to improve the friction characteristics of the old pavement. The urban location and relatively lower budget available motivated the selection of diamond grinding over the conventional thin asphalt overlay for rehabilitation of this facility. Based on TxDOT’s experience, the cost of resurfacing with diamond grinding is approximately less than half the estimated cost of an asphalt overlay. TxDOT reportedly saved approximately $3 million by using diamond grinding instead of constructing an asphalt overlay.
This project presents a unique opportunity to evaluate the effectiveness of grinding of concrete pavements in improving skid resistance (reducing the number of accidents) and reducing pavement noise. The improvement of the riding quality of these sections is not a core objective of this project but roughness will also be monitored.
1.2 Study Objectives
This implementation project was developed to support, monitor, and evaluate rehabilitated CRCP sections to primarily investigate the benefits and performance over time of the diamond grinding treatment. The influence of the pre-existing surface conditions prior to diamond grinding and traffic levels were also evaluated as part of the research project.
In order to achieve the objectives of the project, the following important aspects were addressed:
a) Measurements prior to treatment to evaluate surface texture, skid, and pavement noise. Surface texture was measured using the circular texture meter (CTM) and the sand-patch method. Skid was measured with the dynamic friction tester (DFT) as well as a TxDOT locked-wheel skid trailer; noise was measured with the onboard sound intensity (OBSI) method.
b) Surface texture measurements during rehabilitation for quality control purposes using the CTM in addition to sand patch.
c) Repeated measurements at different time intervals of surface texture, skid, and noise to track the performance of the treatment and to evaluate how long the benefits of this treatment last.
d) Evaluation of the effectiveness of diamond grinding and the benefit/cost ratio of this type of treatment. These aspects were addressed specifically to answer the following:
1. Is diamond grinding effective for improving skid resistance and reducing pavement noise?
2. Is diamond grinding a cost-efficient method for improving skid resistance and reducing pavement noise?
3
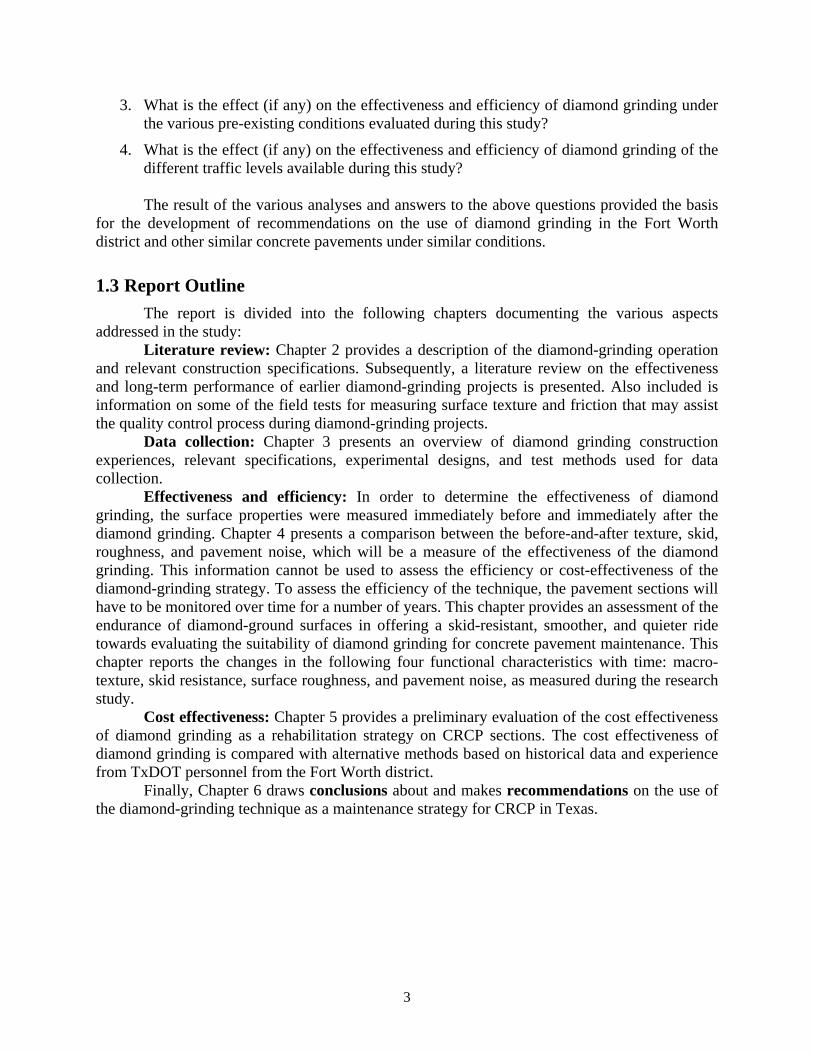
3. What is the effect (if any) on the effectiveness and efficiency of diamond grinding under the various pre-existing conditions evaluated during this study?
4. What is the effect (if any) on the effectiveness and efficiency of diamond grinding of the different traffic levels available during this study?
The result of the various analyses and answers to the above questions provided the basis
for the development of recommendations on the use of diamond grinding in the Fort Worth district and other similar concrete pavements under similar conditions.
1.3 Report Outline
The report is divided into the following chapters documenting the various aspects addressed in the study:
Literature review: Chapter 2 provides a description of the diamond-grinding operation and relevant construction specifications. Subsequently, a literature review on the effectiveness and long-term performance of earlier diamond-grinding projects is presented. Also included is information on some of the field tests for measuring surface texture and friction that may assist the quality control process during diamond-grinding projects.
Data collection: Chapter 3 presents an overview of diamond grinding construction experiences, relevant specifications, experimental designs, and test methods used for data collection.
Effectiveness and efficiency: In order to determine the effectiveness of diamond grinding, the surface properties were measured immediately before and immediately after the diamond grinding. Chapter 4 presents a comparison between the before-and-after texture, skid, roughness, and pavement noise, which will be a measure of the effectiveness of the diamond grinding. This information cannot be used to assess the efficiency or cost-effectiveness of the diamond-grinding strategy. To assess the efficiency of the technique, the pavement sections will have to be monitored over time for a number of years. This chapter provides an assessment of the endurance of diamond-ground surfaces in offering a skid-resistant, smoother, and quieter ride towards evaluating the suitability of diamond grinding for concrete pavement maintenance. This chapter reports the changes in the following four functional characteristics with time: macro-texture, skid resistance, surface roughness, and pavement noise, as measured during the research study.
Cost effectiveness: Chapter 5 provides a preliminary evaluation of the cost effectiveness of diamond grinding as a rehabilitation strategy on CRCP sections. The cost effectiveness of diamond grinding is compared with alternative methods based on historical data and experience from TxDOT personnel from the Fort Worth district.
Finally, Chapter 6 draws conclusions about and makes recommendations on the use of the diamond-grinding technique as a maintenance strategy for CRCP in Texas.

4
5
Chapter 2. Literature Review
2.1 Diamond Grinding
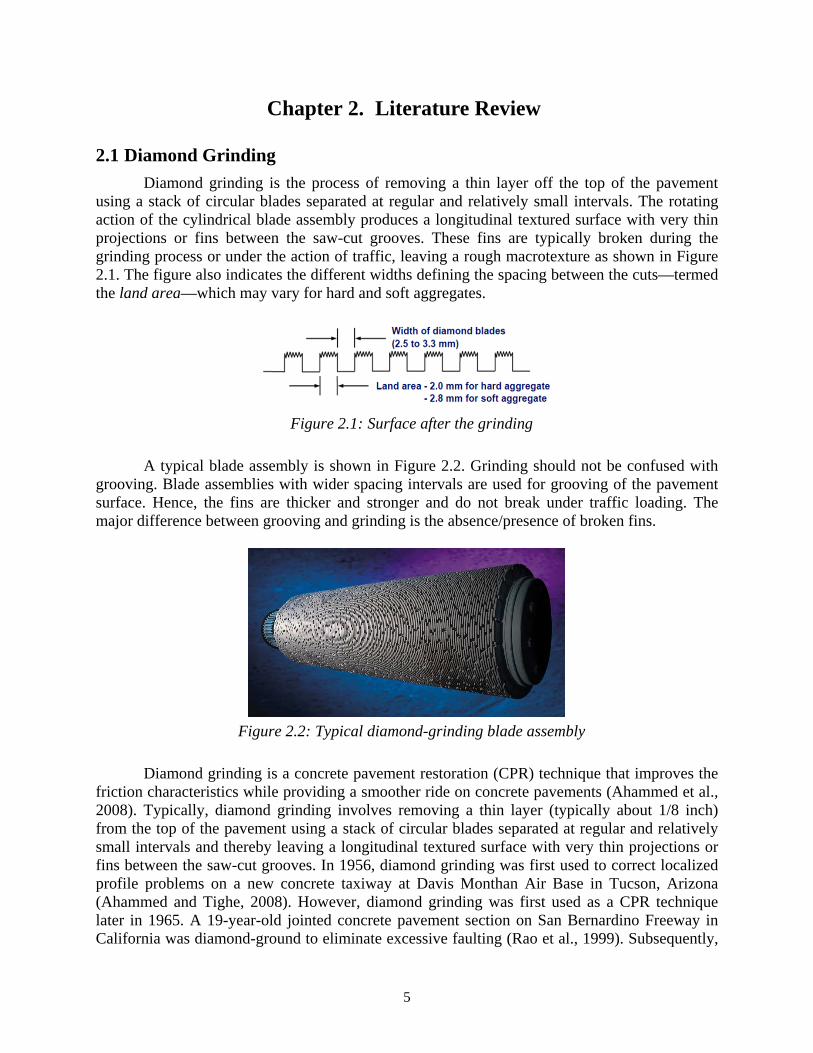
Diamond grinding is the process of removing a thin layer off the top of the pavement using a stack of circular blades separated at regular and relatively small intervals. The rotating action of the cylindrical blade assembly produces a longitudinal textured surface with very thin projections or fins between the saw-cut grooves. These fins are typically broken during the grinding process or under the action of traffic, leaving a rough macrotexture as shown in Figure 2.1. The figure also indicates the different widths defining the spacing between the cuts—termed the land area—which may vary for hard and soft aggregates.
Figure 2.1: Surface after the grinding
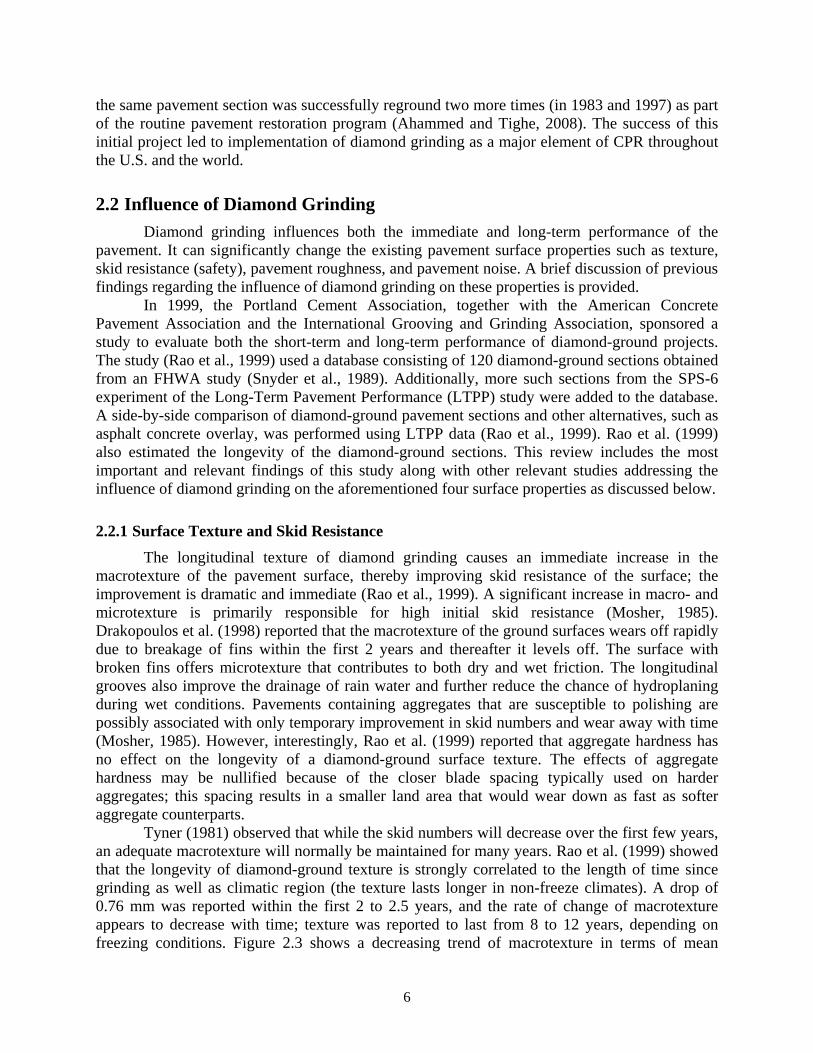
A typical blade assembly is shown in Figure 2.2. Grinding should not be confused with grooving. Blade assemblies with wider spacing intervals are used for grooving of the pavement surface. Hence, the fins are thicker and stronger and do not break under traffic loading. The major difference between grooving and grinding is the absence/presence of broken fins.
Figure 2.2: Typical diamond-grinding blade assembly
Diamond grinding is a concrete pavement restoration (CPR) technique that improves the friction characteristics while providing a smoother ride on concrete pavements (Ahammed et al., 2008). Typically, diamond grinding involves removing a thin layer (typically about 1/8 inch) from the top of the pavement using a stack of circular blades separated at regular and relatively small intervals and thereby leaving a longitudinal textured surface with very thin projections or fins between the saw-cut grooves. In 1956, diamond grinding was first used to correct localized profile problems on a new concrete taxiway at Davis Monthan Air Base in Tucson, Arizona (Ahammed and Tighe, 2008). However, diamond grinding was first used as a CPR technique later in 1965. A 19-year-old jointed concrete pavement section on San Bernardino Freeway in California was diamond-ground to eliminate excessive faulting (Rao et al., 1999). Subsequently,
6
the same pavement section was successfully reground two more times (in 1983 and 1997) as part of the routine pavement restoration program (Ahammed and Tighe, 2008). The success of this initial project led to implementation of diamond grinding as a major element of CPR throughout the U.S. and the world.
2.2 Influence of Diamond Grinding
Diamond grinding influences both the immediate and long-term performance of the pavement. It can significantly change the existing pavement surface properties such as texture, skid resistance (safety), pavement roughness, and pavement noise. A brief discussion of previous findings regarding the influence of diamond grinding on these properties is provided.
In 1999, the Portland Cement Association, together with the American Concrete Pavement Association and the International Grooving and Grinding Association, sponsored a study to evaluate both the short-term and long-term performance of diamond-ground projects. The study (Rao et al., 1999) used a database consisting of 120 diamond-ground sections obtained from an FHWA study (Snyder et al., 1989). Additionally, more such sections from the SPS-6 experiment of the Long-Term Pavement Performance (LTPP) study were added to the database. A side-by-side comparison of diamond-ground pavement sections and other alternatives, such as asphalt concrete overlay, was performed using LTPP data (Rao et al., 1999). Rao et al. (1999) also estimated the longevity of the diamond-ground sections. This review includes the most important and relevant findings of this study along with other relevant studies addressing the influence of diamond grinding on the aforementioned four surface properties as discussed below.
2.2.1 Surface Texture and Skid Resistance
The longitudinal texture of diamond grinding causes an immediate increase in the macrotexture of the pavement surface, thereby improving skid resistance of the surface; the improvement is dramatic and immediate (Rao et al., 1999). A significant increase in macro- and microtexture is primarily responsible for high initial skid resistance (Mosher, 1985). Drakopoulos et al. (1998) reported that the macrotexture of the ground surfaces wears off rapidly due to breakage of fins within the first 2 years and thereafter it levels off. The surface with broken fins offers microtexture that contributes to both dry and wet friction. The longitudinal grooves also improve the drainage of rain water and further reduce the chance of hydroplaning during wet conditions. Pavements containing aggregates that are susceptible to polishing are possibly associated with only temporary improvement in skid numbers and wear away with time (Mosher, 1985). However, interestingly, Rao et al. (1999) reported that aggregate hardness has no effect on the longevity of a diamond-ground surface texture. The effects of aggregate hardness may be nullified because of the closer blade spacing typically used on harder aggregates; this spacing results in a smaller land area that would wear down as fast as softer aggregate counterparts.
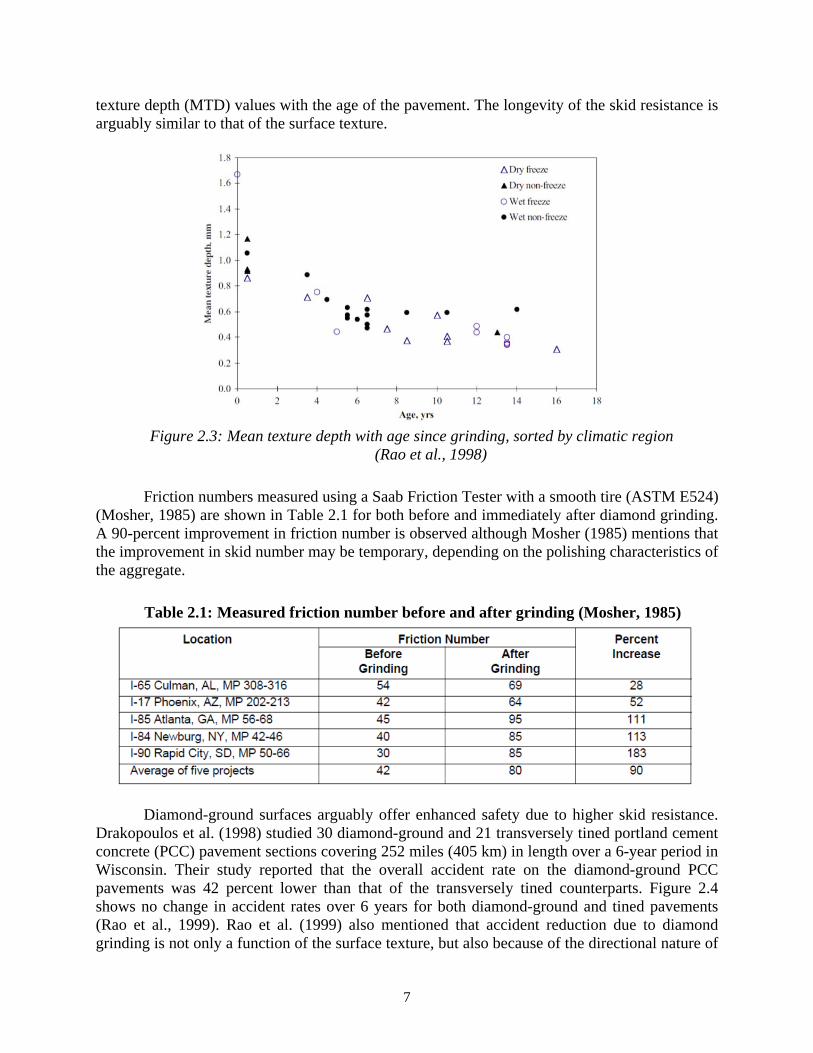
Tyner (1981) observed that while the skid numbers will decrease over the first few years, an adequate macrotexture will normally be maintained for many years. Rao et al. (1999) showed that the longevity of diamond-ground texture is strongly correlated to the length of time since grinding as well as climatic region (the texture lasts longer in non-freeze climates). A drop of 0.76 mm was reported within the first 2 to 2.5 years, and the rate of change of macrotexture appears to decrease with time; texture was reported to last from 8 to 12 years, depending on freezing conditions. Figure 2.3 shows a decreasing trend of macrotexture in terms of mean
7
texture depth (MTD) values with the age of the pavement. The longevity of the skid resistance is arguably similar to that of the surface texture.
Figure 2.3: Mean texture depth with age since grinding, sorted by climatic region
(Rao et al., 1998)
Friction numbers measured using a Saab Friction Tester with a smooth tire (ASTM E524) (Mosher, 1985) are shown in Table 2.1 for both before and immediately after diamond grinding. A 90-percent improvement in friction number is observed although Mosher (1985) mentions that the improvement in skid number may be temporary, depending on the polishing characteristics of the aggregate.
Table 2.1: Measured friction number before and after grinding (Mosher, 1985)
Diamond-ground surfaces arguably offer enhanced safety due to higher skid resistance.
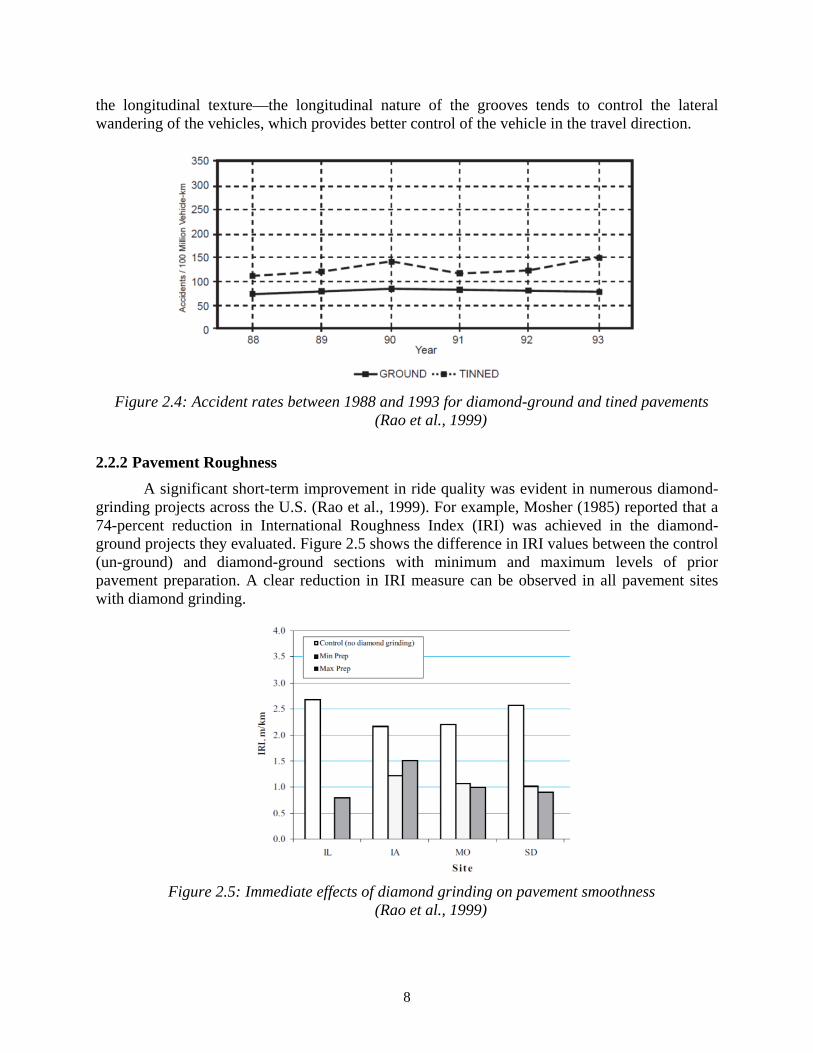
Drakopoulos et al. (1998) studied 30 diamond-ground and 21 transversely tined portland cement concrete (PCC) pavement sections covering 252 miles (405 km) in length over a 6-year period in Wisconsin. Their study reported that the overall accident rate on the diamond-ground PCC pavements was 42 percent lower than that of the transversely tined counterparts. Figure 2.4 shows no change in accident rates over 6 years for both diamond-ground and tined pavements (Rao et al., 1999). Rao et al. (1999) also mentioned that accident reduction due to diamond grinding is not only a function of the surface texture, but also because of the directional nature of
8
the longitudinal texture—the longitudinal nature of the grooves tends to control the lateral wandering of the vehicles, which provides better control of the vehicle in the travel direction.
Figure 2.4: Accident rates between 1988 and 1993 for diamond-ground and tined pavements
(Rao et al., 1999)
2.2.2 Pavement Roughness
A significant short-term improvement in ride quality was evident in numerous diamond-grinding projects across the U.S. (Rao et al., 1999). For example, Mosher (1985) reported that a 74-percent reduction in International Roughness Index (IRI) was achieved in the diamond-ground projects they evaluated. Figure 2.5 shows the difference in IRI values between the control (un-ground) and diamond-ground sections with minimum and maximum levels of prior pavement preparation. A clear reduction in IRI measure can be observed in all pavement sites with diamond grinding.
Figure 2.5: Immediate effects of diamond grinding on pavement smoothness
(Rao et al., 1999)
9
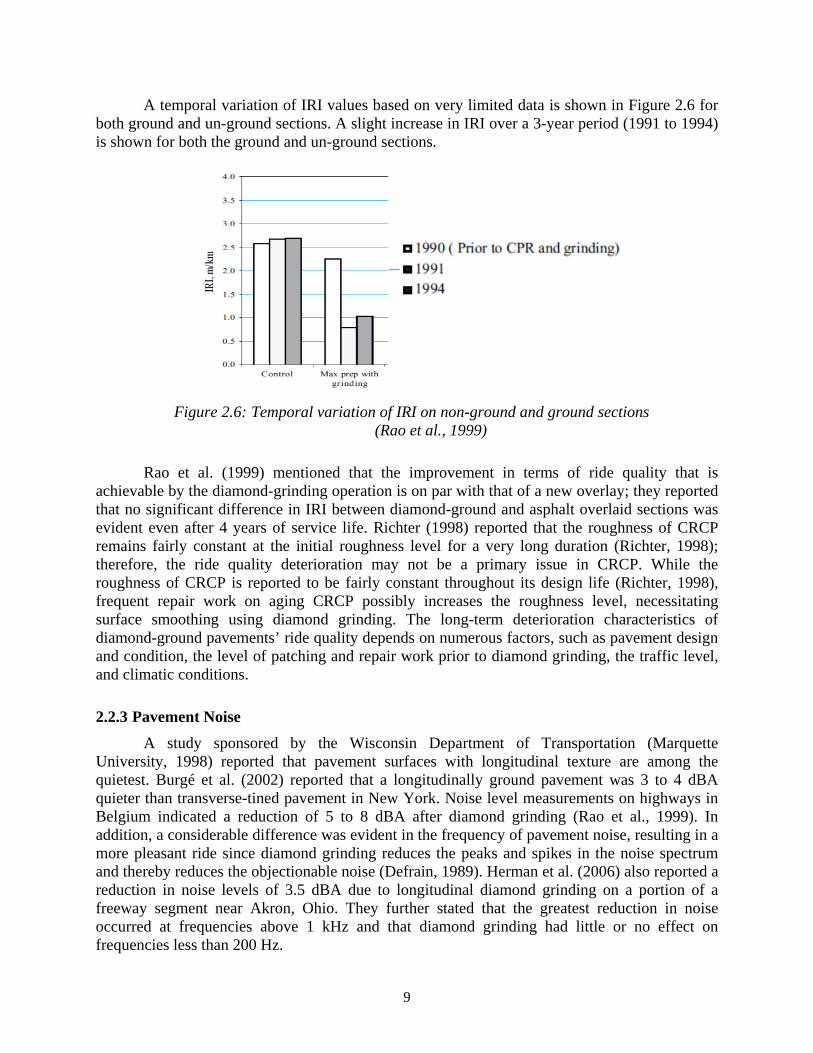
A temporal variation of IRI values based on very limited data is shown in Figure 2.6 for both ground and un-ground sections. A slight increase in IRI over a 3-year period (1991 to 1994) is shown for both the ground and un-ground sections.
Figure 2.6: Temporal variation of IRI on non-ground and ground sections
(Rao et al., 1999)
Rao et al. (1999) mentioned that the improvement in terms of ride quality that is achievable by the diamond-grinding operation is on par with that of a new overlay; they reported that no significant difference in IRI between diamond-ground and asphalt overlaid sections was evident even after 4 years of service life. Richter (1998) reported that the roughness of CRCP remains fairly constant at the initial roughness level for a very long duration (Richter, 1998); therefore, the ride quality deterioration may not be a primary issue in CRCP. While the roughness of CRCP is reported to be fairly constant throughout its design life (Richter, 1998), frequent repair work on aging CRCP possibly increases the roughness level, necessitating surface smoothing using diamond grinding. The long-term deterioration characteristics of diamond-ground pavements’ ride quality depends on numerous factors, such as pavement design and condition, the level of patching and repair work prior to diamond grinding, the traffic level, and climatic conditions.
2.2.3 Pavement Noise
A study sponsored by the Wisconsin Department of Transportation (Marquette University, 1998) reported that pavement surfaces with longitudinal texture are among the quietest. Burgé et al. (2002) reported that a longitudinally ground pavement was 3 to 4 dBA quieter than transverse-tined pavement in New York. Noise level measurements on highways in Belgium indicated a reduction of 5 to 8 dBA after diamond grinding (Rao et al., 1999). In addition, a considerable difference was evident in the frequency of pavement noise, resulting in a more pleasant ride since diamond grinding reduces the peaks and spikes in the noise spectrum and thereby reduces the objectionable noise (Defrain, 1989). Herman et al. (2006) also reported a reduction in noise levels of 3.5 dBA due to longitudinal diamond grinding on a portion of a freeway segment near Akron, Ohio. They further stated that the greatest reduction in noise occurred at frequencies above 1 kHz and that diamond grinding had little or no effect on frequencies less than 200 Hz.
10
In general, noise is believed to be related to surface macrotexture, particularly for dense-graded asphalt mixtures (Hanson et al., 2004). A pavement surface with higher macrotexture reduces the noise level at high frequencies, while the pavement with lower macrotexture is quieter at low frequencies (Dare et al., 2009). The long-term performance of diamond-ground surfaces in terms of pavement noise is not reported in the literature but it is believed that the noise reduction capabilities deteriorate at the same rate as does the surface macrotexture.
It is important to note that the majority of the earlier studies evaluated jointed concrete pavements; this study adds to the existing literature by documenting the functional deterioration characteristics (macrotexture, skid resistance, surface roughness, and pavement noise) of a diamond-ground CRCP.
2.2.4 Structural Effects
Rao et al. (1999) reported the influence of diamond grinding on the structural strength of concrete pavements. They mentioned that based on a fatigue cracking model (Yu et al., 1997), a reduction of 5 mm in pavement slab thickness results in a 30-percent fatigue life reduction. Hence, one pass of diamond grinding should considerably reduce the fatigue life of the concrete pavement. However, the ability of concrete to gain strength by at least 15 percent (Mindess and Young, 1981) over time nullifies this effect. Rao et al. (1998) also reported that a typical concrete pavement may be able to receive up to three grindings without influencing the fatigue life.
Perhaps the best argument for maintaining long-term performance of concrete pavements through the use of diamond grinding, which was a recurring theme in much of the literature reviewed, is the benefit derived by reducing the roughness of the rehabilitated concrete pavement. Concrete pavements tend to get very rough with age, particularly jointed pavements where faulting can significantly increase the dynamic loads (up to 1.5 times the static loads) on these pavements, which decreases a pavement’s service life. Diamond grinding improves the smoothness of these roads (up to 70 percent compared to pre-grinding profiles).
Asphalt overlays are not always effective on faulted concrete pavements since cracking may reflect through the pavement at these fault lines due to movement of the underlying slab. In addition, these overlays may be vulnerable to excessive rutting when subjected to large traffic volumes of the heavy trucks for which concrete pavements are designed. A counter argument against diamond grinding is that it reduces the thickness of the pavement, effectively reducing structural capacity and hence service life. Supporters of the technique argue, however, that reductions in slab thickness due to diamond grinding are offset by the increase in concrete strength over time and the reduction in dynamic loading. A 10-percent increase in concrete strength over time allows removal of up to 0.5 inch from the surface to still achieve the design life predicted using design strength.
2.3 Survival of the Diamond-Ground Surface
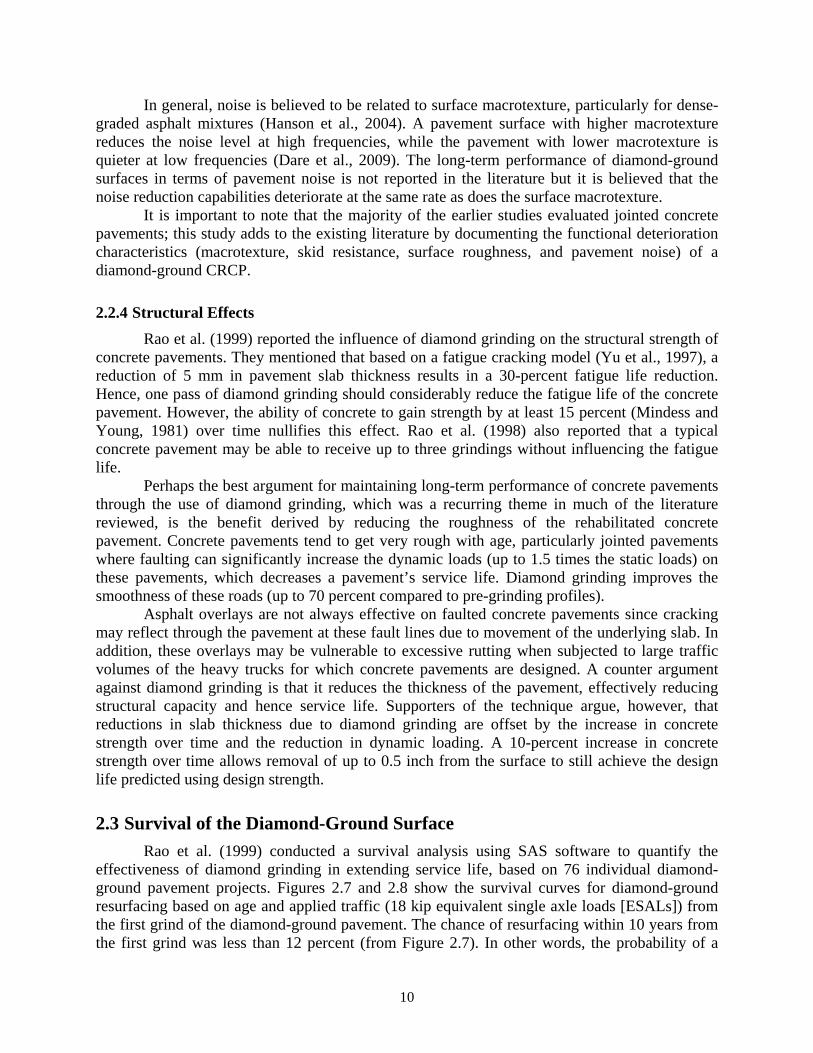
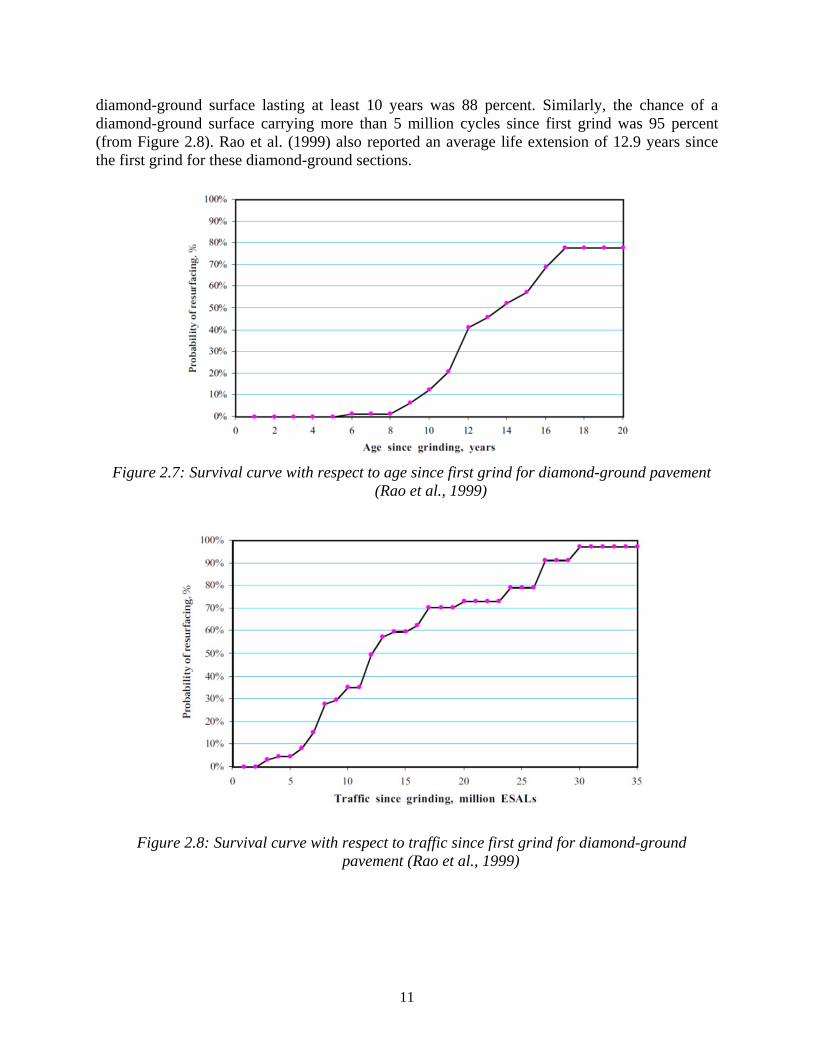
Rao et al. (1999) conducted a survival analysis using SAS software to quantify the effectiveness of diamond grinding in extending service life, based on 76 individual diamond-ground pavement projects. Figures 2.7 and 2.8 show the survival curves for diamond-ground resurfacing based on age and applied traffic (18 kip equivalent single axle loads [ESALs]) from the first grind of the diamond-ground pavement. The chance of resurfacing within 10 years from the first grind was less than 12 percent (from Figure 2.7). In other words, the probability of a
11
diamond-ground surface lasting at least 10 years was 88 percent. Similarly, the chance of a diamond-ground surface carrying more than 5 million cycles since first grind was 95 percent (from Figure 2.8). Rao et al. (1999) also reported an average life extension of 12.9 years since the first grind for these diamond-ground sections.
Figure 2.7: Survival curve with respect to age since first grind for diamond-ground pavement
(Rao et al., 1999)
Figure 2.8: Survival curve with respect to traffic since first grind for diamond-ground pavement (Rao et al., 1999)

12
13
Chapter 3. Experimental Program
This chapter initially discusses some aspects of the grinding operation and construction experiences during rehabilitation of the CRCP sections on IH35W near Fort Worth. A brief description of the grinding specification and equipment used is included. The latter part of the chapter discusses the equipment and experimental program for the field data collection necessary for achieving this project’s objectives.
3.1 Diamond Grinding Rehabilitation
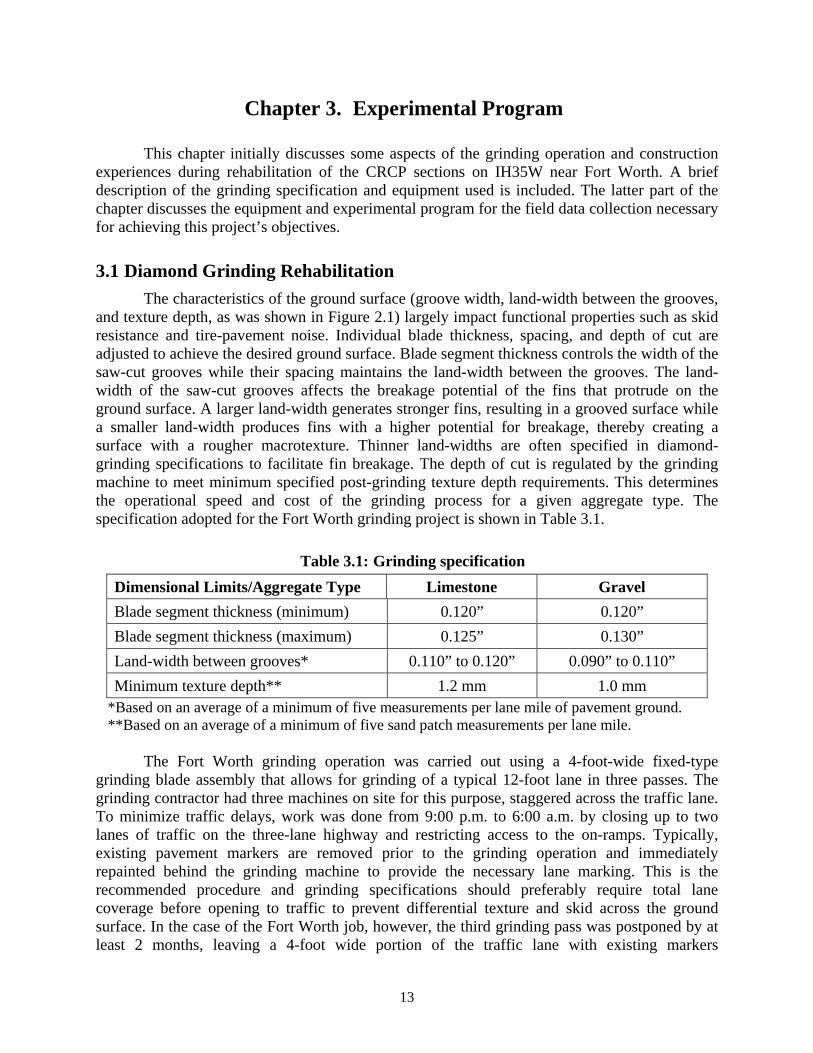
The characteristics of the ground surface (groove width, land-width between the grooves, and texture depth, as was shown in Figure 2.1) largely impact functional properties such as skid resistance and tire-pavement noise. Individual blade thickness, spacing, and depth of cut are adjusted to achieve the desired ground surface. Blade segment thickness controls the width of the saw-cut grooves while their spacing maintains the land-width between the grooves. The land-width of the saw-cut grooves affects the breakage potential of the fins that protrude on the ground surface. A larger land-width generates stronger fins, resulting in a grooved surface while a smaller land-width produces fins with a higher potential for breakage, thereby creating a surface with a rougher macrotexture. Thinner land-widths are often specified in diamond-grinding specifications to facilitate fin breakage. The depth of cut is regulated by the grinding machine to meet minimum specified post-grinding texture depth requirements. This determines the operational speed and cost of the grinding process for a given aggregate type. The specification adopted for the Fort Worth grinding project is shown in Table 3.1.
Table 3.1: Grinding specification
Dimensional Limits/Aggregate Type Limestone Gravel
Blade segment thickness (minimum) 0.120” 0.120”
Blade segment thickness (maximum) 0.125” 0.130”
Land-width between grooves* 0.110” to 0.120” 0.090” to 0.110”
Minimum texture depth** 1.2 mm 1.0 mm *Based on an average of a minimum of five measurements per lane mile of pavement ground. **Based on an average of a minimum of five sand patch measurements per lane mile.
The Fort Worth grinding operation was carried out using a 4-foot-wide fixed-type
grinding blade assembly that allows for grinding of a typical 12-foot lane in three passes. The grinding contractor had three machines on site for this purpose, staggered across the traffic lane. To minimize traffic delays, work was done from 9:00 p.m. to 6:00 a.m. by closing up to two lanes of traffic on the three-lane highway and restricting access to the on-ramps. Typically, existing pavement markers are removed prior to the grinding operation and immediately repainted behind the grinding machine to provide the necessary lane marking. This is the recommended procedure and grinding specifications should preferably require total lane coverage before opening to traffic to prevent differential texture and skid across the ground surface. In the case of the Fort Worth job, however, the third grinding pass was postponed by at least 2 months, leaving a 4-foot wide portion of the traffic lane with existing markers
14
ungrounded. The original plan was to make use of temporary reflective markers before painting the ground lanes, but these markers did not adhere properly to the ground surface.
The fixed-type blade assembly is expected to produce a smoother post-grinding profile as it removes surface bumps and irregularities. Scofield et al. (2003) compared fixed- and floating-type blade assemblies and found that the surface produced by a fixed blade grinding head is relatively smoother. A grinding speed of 0.3 miles per hour was maintained during the Fort Worth grinding project, corresponding to a texture depth of 1.2 mm on the CRCP with limestone aggregate.
3.2 Field Data Collection
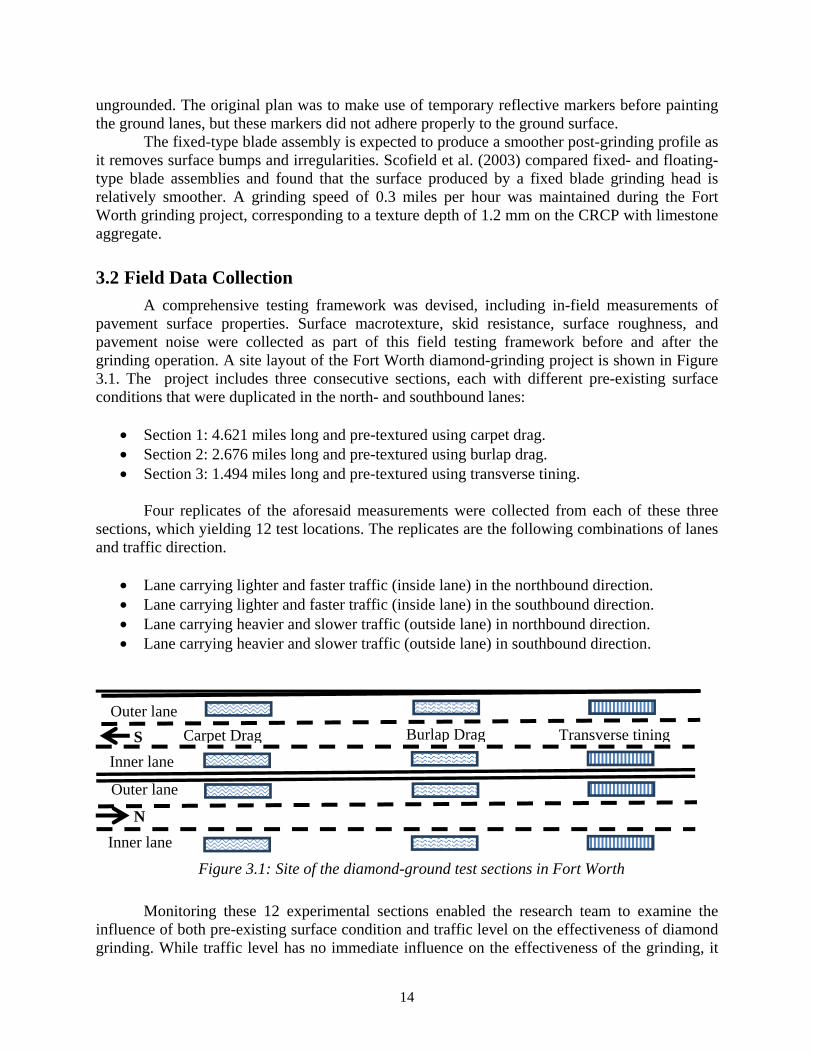
A comprehensive testing framework was devised, including in-field measurements of pavement surface properties. Surface macrotexture, skid resistance, surface roughness, and pavement noise were collected as part of this field testing framework before and after the grinding operation. A site layout of the Fort Worth diamond-grinding project is shown in Figure 3.1. The project includes three consecutive sections, each with different pre-existing surface conditions that were duplicated in the north- and southbound lanes:
• Section 1: 4.621 miles long and pre-textured using carpet drag. • Section 2: 2.676 miles long and pre-textured using burlap drag. • Section 3: 1.494 miles long and pre-textured using transverse tining.
Four replicates of the aforesaid measurements were collected from each of these three
sections, which yielding 12 test locations. The replicates are the following combinations of lanes and traffic direction.
• Lane carrying lighter and faster traffic (inside lane) in the northbound direction. • Lane carrying lighter and faster traffic (inside lane) in the southbound direction. • Lane carrying heavier and slower traffic (outside lane) in northbound direction. • Lane carrying heavier and slower traffic (outside lane) in southbound direction.
Figure 3.1: Site of the diamond-ground test sections in Fort Worth
Monitoring these 12 experimental sections enabled the research team to examine the influence of both pre-existing surface condition and traffic level on the effectiveness of diamond grinding. While traffic level has no immediate influence on the effectiveness of the grinding, it
Outer lane
Inner lane
Outer lane
Inner lane
Carpet Drag Burlap Drag Transverse tiningS
N
15
will influence the future deterioration rate of the ground pavement surface. Estimates of surface macrotexture, skid resistance, surface roughness, and pavement noise were obtained at each of these 12 experimental locations. A detailed description of the test methodologies adopted by the research team for obtaining the estimates of each of these four surface properties is given below.
3.2.1 Surface Macrotexture
Surface texture was measured using both the conventional volume-based sand patch method and the laser-based circular texture meter (CTM). The sand patch test method (ASTM E965) involves calculation of mean texture depth (MTD) while the CTM (ASTM E2157) provides mean profile depth (MPD). Both MTD and MPD are estimates of surface macrotexture.
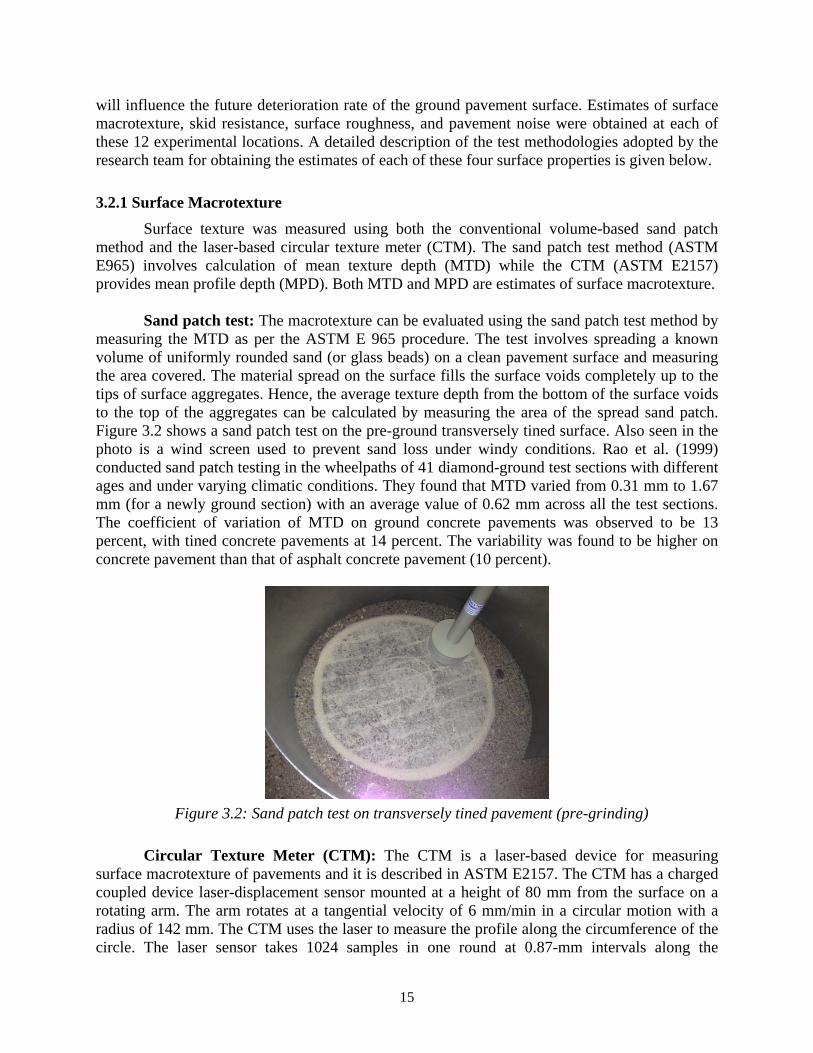
Sand patch test: The macrotexture can be evaluated using the sand patch test method by
measuring the MTD as per the ASTM E 965 procedure. The test involves spreading a known volume of uniformly rounded sand (or glass beads) on a clean pavement surface and measuring the area covered. The material spread on the surface fills the surface voids completely up to the tips of surface aggregates. Hence, the average texture depth from the bottom of the surface voids to the top of the aggregates can be calculated by measuring the area of the spread sand patch. Figure 3.2 shows a sand patch test on the pre-ground transversely tined surface. Also seen in the photo is a wind screen used to prevent sand loss under windy conditions. Rao et al. (1999) conducted sand patch testing in the wheelpaths of 41 diamond-ground test sections with different ages and under varying climatic conditions. They found that MTD varied from 0.31 mm to 1.67 mm (for a newly ground section) with an average value of 0.62 mm across all the test sections. The coefficient of variation of MTD on ground concrete pavements was observed to be 13 percent, with tined concrete pavements at 14 percent. The variability was found to be higher on concrete pavement than that of asphalt concrete pavement (10 percent).
Figure 3.2: Sand patch test on transversely tined pavement (pre-grinding)
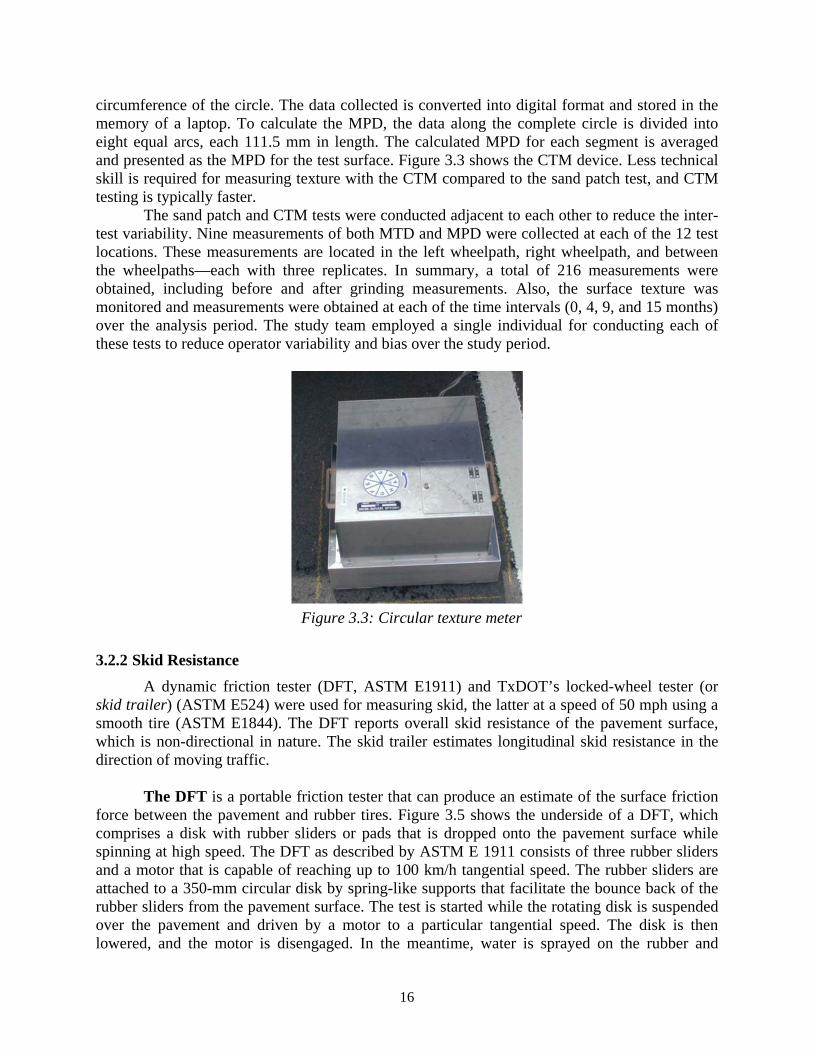
Circular Texture Meter (CTM): The CTM is a laser-based device for measuring surface macrotexture of pavements and it is described in ASTM E2157. The CTM has a charged coupled device laser-displacement sensor mounted at a height of 80 mm from the surface on a rotating arm. The arm rotates at a tangential velocity of 6 mm/min in a circular motion with a radius of 142 mm. The CTM uses the laser to measure the profile along the circumference of the circle. The laser sensor takes 1024 samples in one round at 0.87-mm intervals along the
16
circumference of the circle. The data collected is converted into digital format and stored in the memory of a laptop. To calculate the MPD, the data along the complete circle is divided into eight equal arcs, each 111.5 mm in length. The calculated MPD for each segment is averaged and presented as the MPD for the test surface. Figure 3.3 shows the CTM device. Less technical skill is required for measuring texture with the CTM compared to the sand patch test, and CTM testing is typically faster.
The sand patch and CTM tests were conducted adjacent to each other to reduce the inter-test variability. Nine measurements of both MTD and MPD were collected at each of the 12 test locations. These measurements are located in the left wheelpath, right wheelpath, and between the wheelpaths—each with three replicates. In summary, a total of 216 measurements were obtained, including before and after grinding measurements. Also, the surface texture was monitored and measurements were obtained at each of the time intervals (0, 4, 9, and 15 months) over the analysis period. The study team employed a single individual for conducting each of these tests to reduce operator variability and bias over the study period.
Figure 3.3: Circular texture meter
3.2.2 Skid Resistance
A dynamic friction tester (DFT, ASTM E1911) and TxDOT’s locked-wheel tester (or skid trailer) (ASTM E524) were used for measuring skid, the latter at a speed of 50 mph using a smooth tire (ASTM E1844). The DFT reports overall skid resistance of the pavement surface, which is non-directional in nature. The skid trailer estimates longitudinal skid resistance in the direction of moving traffic.
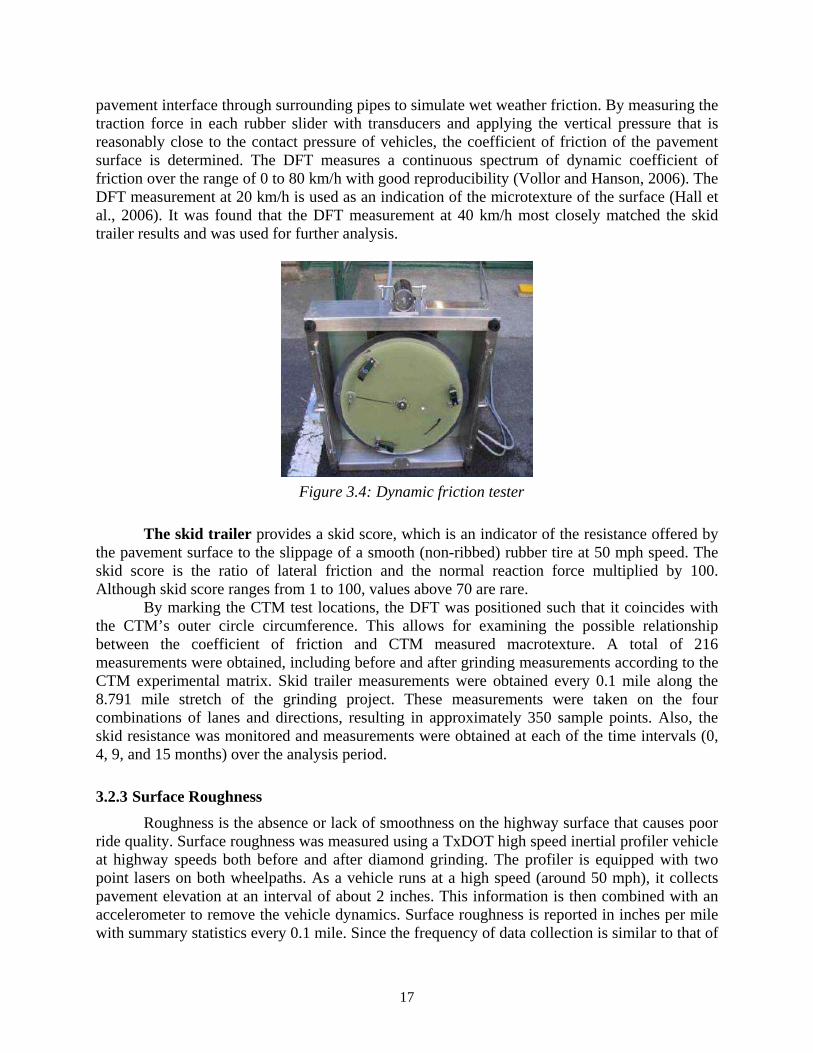
The DFT is a portable friction tester that can produce an estimate of the surface friction
force between the pavement and rubber tires. Figure 3.5 shows the underside of a DFT, which comprises a disk with rubber sliders or pads that is dropped onto the pavement surface while spinning at high speed. The DFT as described by ASTM E 1911 consists of three rubber sliders and a motor that is capable of reaching up to 100 km/h tangential speed. The rubber sliders are attached to a 350-mm circular disk by spring-like supports that facilitate the bounce back of the rubber sliders from the pavement surface. The test is started while the rotating disk is suspended over the pavement and driven by a motor to a particular tangential speed. The disk is then lowered, and the motor is disengaged. In the meantime, water is sprayed on the rubber and
17
pavement interface through surrounding pipes to simulate wet weather friction. By measuring the traction force in each rubber slider with transducers and applying the vertical pressure that is reasonably close to the contact pressure of vehicles, the coefficient of friction of the pavement surface is determined. The DFT measures a continuous spectrum of dynamic coefficient of friction over the range of 0 to 80 km/h with good reproducibility (Vollor and Hanson, 2006). The DFT measurement at 20 km/h is used as an indication of the microtexture of the surface (Hall et al., 2006). It was found that the DFT measurement at 40 km/h most closely matched the skid trailer results and was used for further analysis.
Figure 3.4: Dynamic friction tester
The skid trailer provides a skid score, which is an indicator of the resistance offered by the pavement surface to the slippage of a smooth (non-ribbed) rubber tire at 50 mph speed. The skid score is the ratio of lateral friction and the normal reaction force multiplied by 100. Although skid score ranges from 1 to 100, values above 70 are rare.
By marking the CTM test locations, the DFT was positioned such that it coincides with the CTM’s outer circle circumference. This allows for examining the possible relationship between the coefficient of friction and CTM measured macrotexture. A total of 216 measurements were obtained, including before and after grinding measurements according to the CTM experimental matrix. Skid trailer measurements were obtained every 0.1 mile along the 8.791 mile stretch of the grinding project. These measurements were taken on the four combinations of lanes and directions, resulting in approximately 350 sample points. Also, the skid resistance was monitored and measurements were obtained at each of the time intervals (0, 4, 9, and 15 months) over the analysis period.
3.2.3 Surface Roughness
Roughness is the absence or lack of smoothness on the highway surface that causes poor ride quality. Surface roughness was measured using a TxDOT high speed inertial profiler vehicle at highway speeds both before and after diamond grinding. The profiler is equipped with two point lasers on both wheelpaths. As a vehicle runs at a high speed (around 50 mph), it collects pavement elevation at an interval of about 2 inches. This information is then combined with an accelerometer to remove the vehicle dynamics. Surface roughness is reported in inches per mile with summary statistics every 0.1 mile. Since the frequency of data collection is similar to that of
18
skid trailer, the roughness dataset also comprises approximately 350 sample points. Also, the surface roughness was monitored and measurements were obtained at each of the time intervals (0, 4, 9, and 15 months) over the analysis period.
3.2.4 Pavement Noise
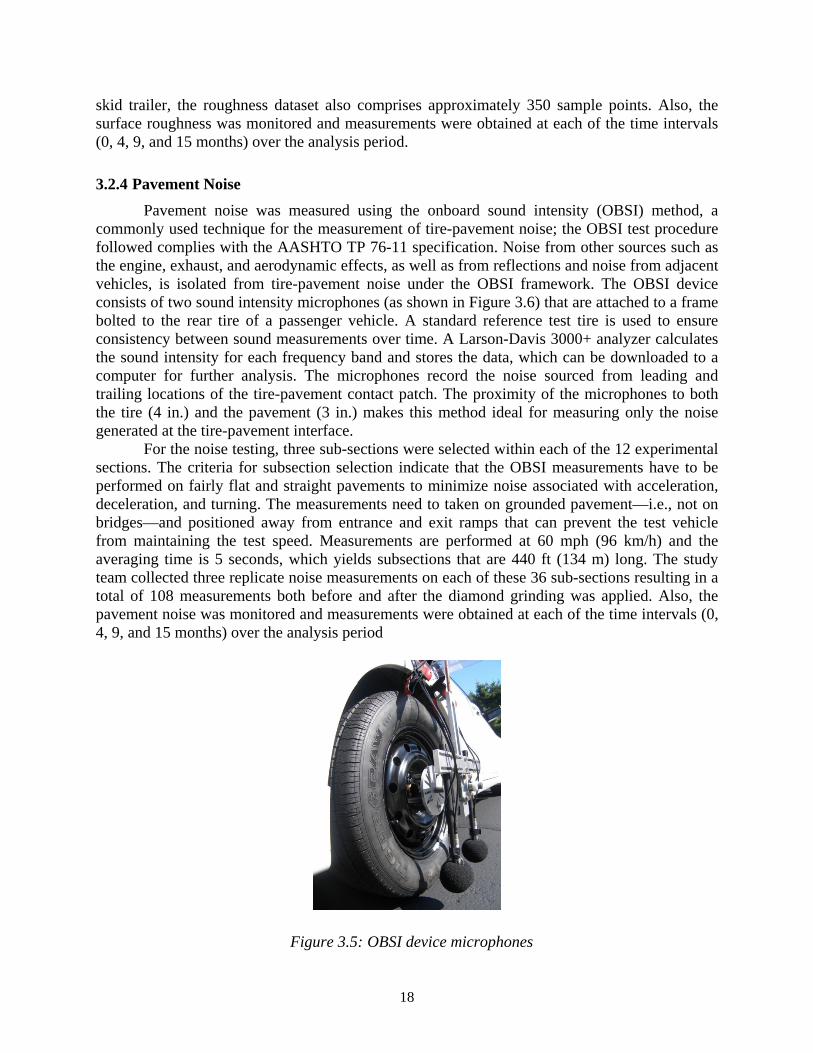
Pavement noise was measured using the onboard sound intensity (OBSI) method, a commonly used technique for the measurement of tire-pavement noise; the OBSI test procedure followed complies with the AASHTO TP 76-11 specification. Noise from other sources such as the engine, exhaust, and aerodynamic effects, as well as from reflections and noise from adjacent vehicles, is isolated from tire-pavement noise under the OBSI framework. The OBSI device consists of two sound intensity microphones (as shown in Figure 3.6) that are attached to a frame bolted to the rear tire of a passenger vehicle. A standard reference test tire is used to ensure consistency between sound measurements over time. A Larson-Davis 3000+ analyzer calculates the sound intensity for each frequency band and stores the data, which can be downloaded to a computer for further analysis. The microphones record the noise sourced from leading and trailing locations of the tire-pavement contact patch. The proximity of the microphones to both the tire (4 in.) and the pavement (3 in.) makes this method ideal for measuring only the noise generated at the tire-pavement interface.
For the noise testing, three sub-sections were selected within each of the 12 experimental sections. The criteria for subsection selection indicate that the OBSI measurements have to be performed on fairly flat and straight pavements to minimize noise associated with acceleration, deceleration, and turning. The measurements need to taken on grounded pavement—i.e., not on bridges—and positioned away from entrance and exit ramps that can prevent the test vehicle from maintaining the test speed. Measurements are performed at 60 mph (96 km/h) and the averaging time is 5 seconds, which yields subsections that are 440 ft (134 m) long. The study team collected three replicate noise measurements on each of these 36 sub-sections resulting in a total of 108 measurements both before and after the diamond grinding was applied. Also, the pavement noise was monitored and measurements were obtained at each of the time intervals (0, 4, 9, and 15 months) over the analysis period
Figure 3.5: OBSI device microphones
19
Chapter 4. Effectiveness and Efficiency
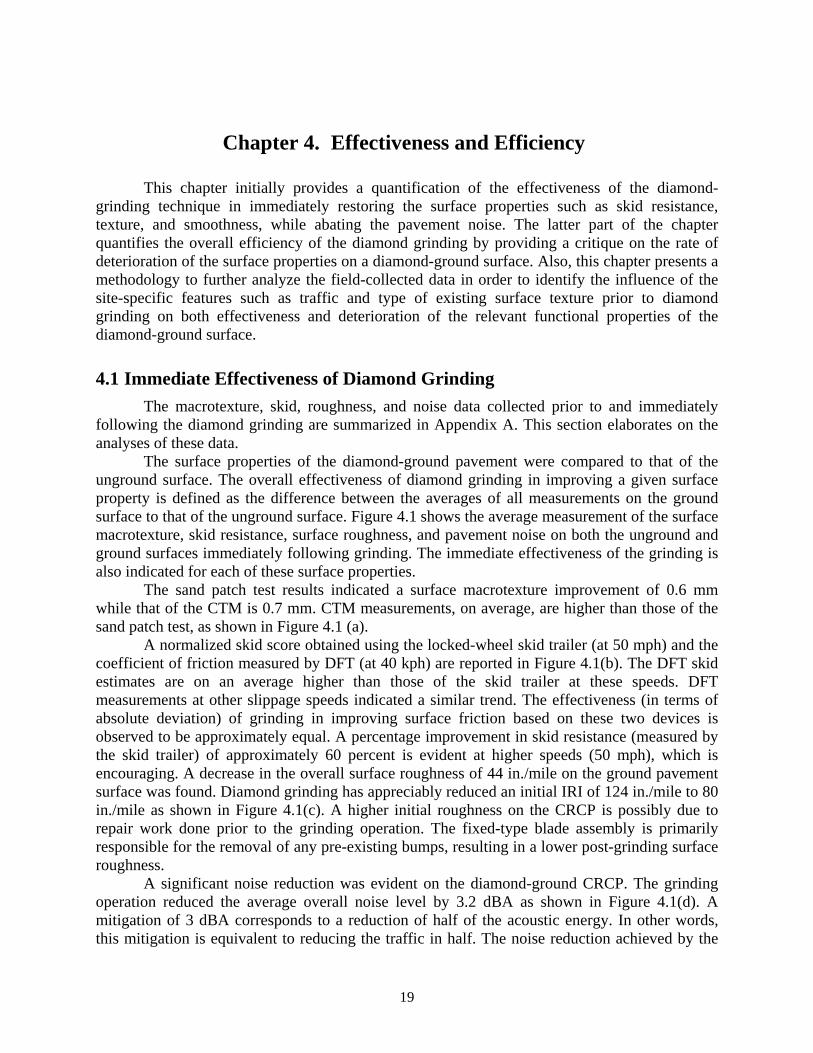
This chapter initially provides a quantification of the effectiveness of the diamond-grinding technique in immediately restoring the surface properties such as skid resistance, texture, and smoothness, while abating the pavement noise. The latter part of the chapter quantifies the overall efficiency of the diamond grinding by providing a critique on the rate of deterioration of the surface properties on a diamond-ground surface. Also, this chapter presents a methodology to further analyze the field-collected data in order to identify the influence of the site-specific features such as traffic and type of existing surface texture prior to diamond grinding on both effectiveness and deterioration of the relevant functional properties of the diamond-ground surface.
4.1 Immediate Effectiveness of Diamond Grinding
The macrotexture, skid, roughness, and noise data collected prior to and immediately following the diamond grinding are summarized in Appendix A. This section elaborates on the analyses of these data.
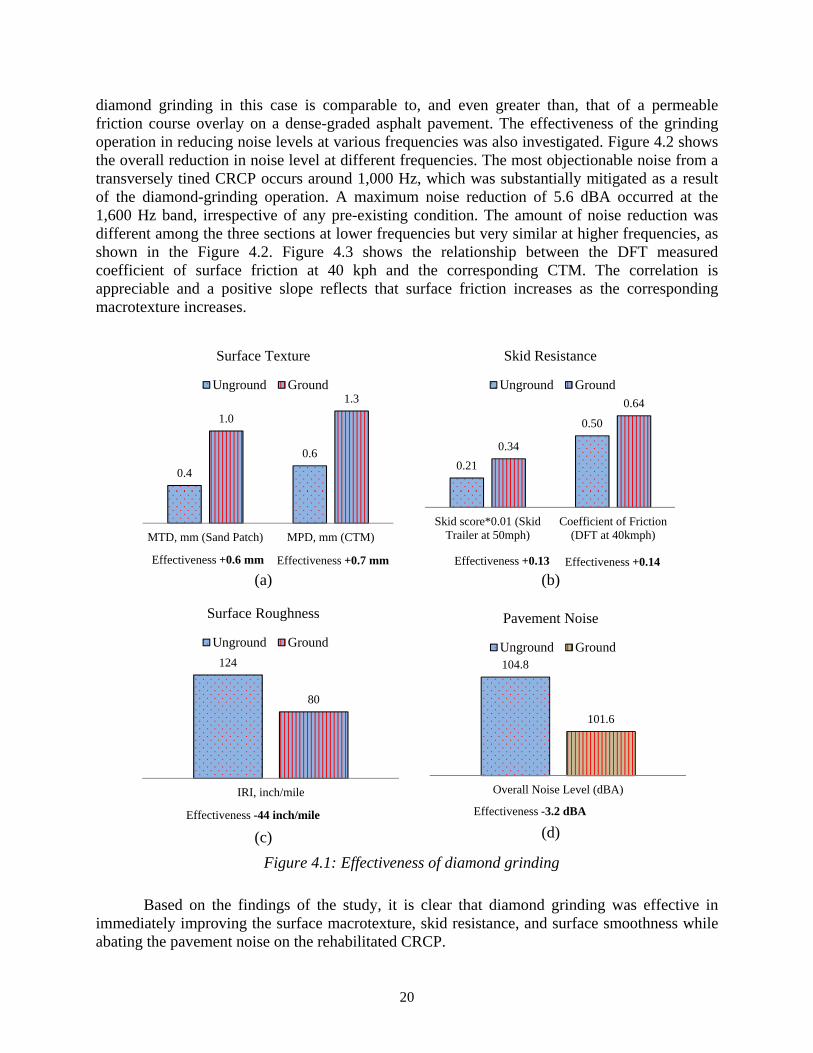
The surface properties of the diamond-ground pavement were compared to that of the unground surface. The overall effectiveness of diamond grinding in improving a given surface property is defined as the difference between the averages of all measurements on the ground surface to that of the unground surface. Figure 4.1 shows the average measurement of the surface macrotexture, skid resistance, surface roughness, and pavement noise on both the unground and ground surfaces immediately following grinding. The immediate effectiveness of the grinding is also indicated for each of these surface properties.
The sand patch test results indicated a surface macrotexture improvement of 0.6 mm while that of the CTM is 0.7 mm. CTM measurements, on average, are higher than those of the sand patch test, as shown in Figure 4.1 (a).
A normalized skid score obtained using the locked-wheel skid trailer (at 50 mph) and the coefficient of friction measured by DFT (at 40 kph) are reported in Figure 4.1(b). The DFT skid estimates are on an average higher than those of the skid trailer at these speeds. DFT measurements at other slippage speeds indicated a similar trend. The effectiveness (in terms of absolute deviation) of grinding in improving surface friction based on these two devices is observed to be approximately equal. A percentage improvement in skid resistance (measured by the skid trailer) of approximately 60 percent is evident at higher speeds (50 mph), which is encouraging. A decrease in the overall surface roughness of 44 in./mile on the ground pavement surface was found. Diamond grinding has appreciably reduced an initial IRI of 124 in./mile to 80 in./mile as shown in Figure 4.1(c). A higher initial roughness on the CRCP is possibly due to repair work done prior to the grinding operation. The fixed-type blade assembly is primarily responsible for the removal of any pre-existing bumps, resulting in a lower post-grinding surface roughness.
A significant noise reduction was evident on the diamond-ground CRCP. The grinding operation reduced the average overall noise level by 3.2 dBA as shown in Figure 4.1(d). A mitigation of 3 dBA corresponds to a reduction of half of the acoustic energy. In other words, this mitigation is equivalent to reducing the traffic in half. The noise reduction achieved by the
20
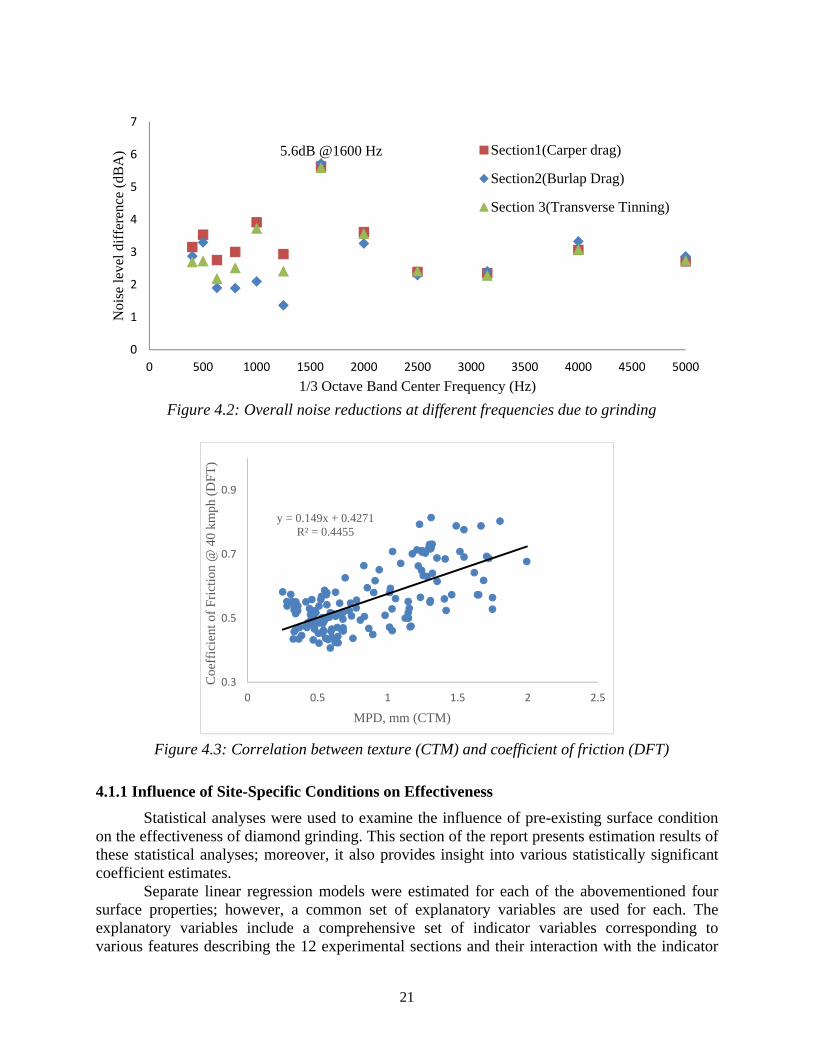
diamond grinding in this case is comparable to, and even greater than, that of a permeable friction course overlay on a dense-graded asphalt pavement. The effectiveness of the grinding operation in reducing noise levels at various frequencies was also investigated. Figure 4.2 shows the overall reduction in noise level at different frequencies. The most objectionable noise from a transversely tined CRCP occurs around 1,000 Hz, which was substantially mitigated as a result of the diamond-grinding operation. A maximum noise reduction of 5.6 dBA occurred at the 1,600 Hz band, irrespective of any pre-existing condition. The amount of noise reduction was different among the three sections at lower frequencies but very similar at higher frequencies, as shown in the Figure 4.2. Figure 4.3 shows the relationship between the DFT measured coefficient of surface friction at 40 kph and the corresponding CTM. The correlation is appreciable and a positive slope reflects that surface friction increases as the corresponding macrotexture increases.
(a)
(b)
(c)
(d)
Figure 4.1: Effectiveness of diamond grinding
Based on the findings of the study, it is clear that diamond grinding was effective in immediately improving the surface macrotexture, skid resistance, and surface smoothness while abating the pavement noise on the rehabilitated CRCP.
0.4
0.6
1.0
1.3
MTD, mm (Sand Patch) MPD, mm (CTM)
Surface Texture
Unground Ground
Effectiveness +0.6 mm Effectiveness +0.7 mm
0.21
0.50
0.34
0.64
Skid score*0.01 (SkidTrailer at 50mph)
Coefficient of Friction(DFT at 40kmph)
Skid Resistance
Unground Ground
Effectiveness +0.13 Effectiveness +0.14
124
80
IRI, inch/mile
Surface Roughness
Unground Ground
Effectiveness -44 inch/mile
104.8
101.6
Overall Noise Level (dBA)
Pavement Noise
Unground Ground
Effectiveness -3.2 dBA
21
Figure 4.2: Overall noise reductions at different frequencies due to grinding
Figure 4.3: Correlation between texture (CTM) and coefficient of friction (DFT)
4.1.1 Influence of Site-Specific Conditions on Effectiveness
Statistical analyses were used to examine the influence of pre-existing surface condition on the effectiveness of diamond grinding. This section of the report presents estimation results of these statistical analyses; moreover, it also provides insight into various statistically significant coefficient estimates.
Separate linear regression models were estimated for each of the abovementioned four surface properties; however, a common set of explanatory variables are used for each. The explanatory variables include a comprehensive set of indicator variables corresponding to various features describing the 12 experimental sections and their interaction with the indicator
0
1
2
3
4
5
6
7
0 500 1000 1500 2000 2500 3000 3500 4000 4500 5000
Noi
se le
vel d
iffe
renc
e (d
BA
)
1/3 Octave Band Center Frequency (Hz)
Section1(Carper drag)
Section2(Burlap Drag)
Section 3(Transverse Tinning)
5.6dB @1600 Hz
y = 0.149x + 0.4271R² = 0.4455
0.3
0.5
0.7
0.9
0 0.5 1 1.5 2 2.5
Coe
ffic
ient
of
Fri
ctio
n @
40
kmph
(D
FT
)
MPD, mm (CTM)

22
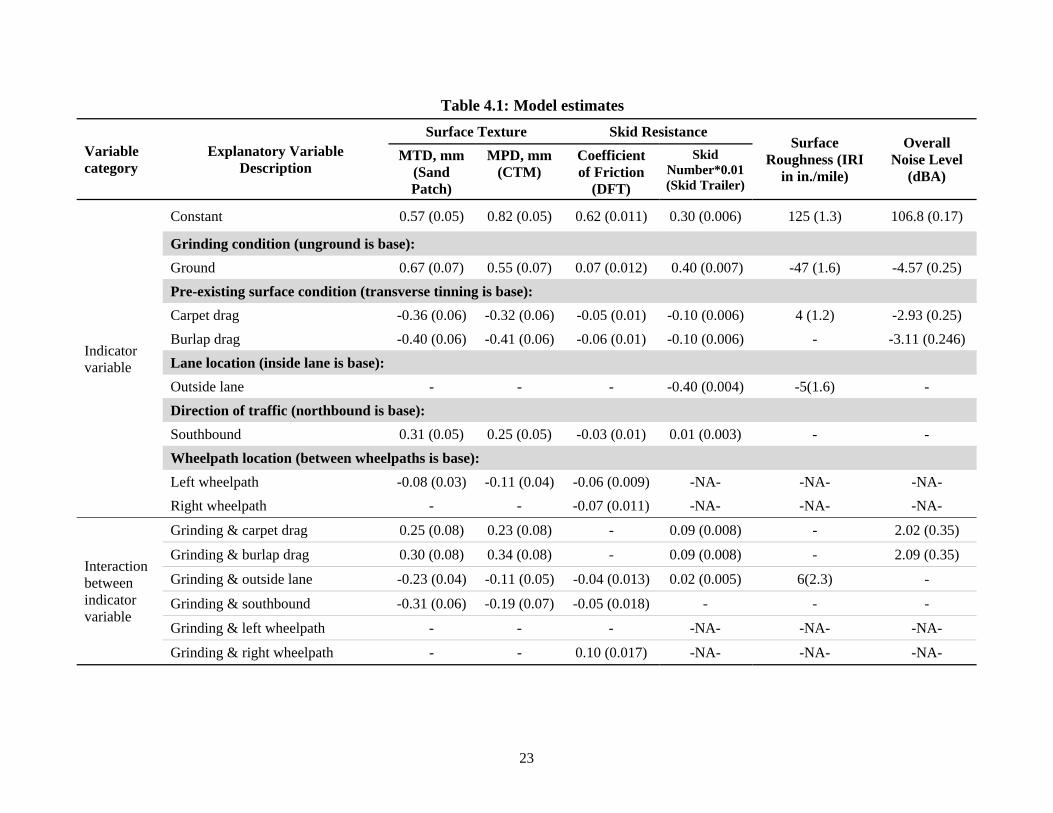
variable for the ground surface. Table 4.1 lists these explanatory variables and reports the corresponding coefficient estimates along with their standard deviations. The model estimates are primarily used to describe the pre-existing surface conditions and to examine their influence on the effectiveness of the diamond grinding. The coefficient estimates of the indicator variable describe the pre-existing conditions while those of interaction variables reveal specific information regarding the effect of diamond grinding on these pre-existing conditions.
23
Table 4.1: Model estimates
Variable category
Explanatory Variable Description
Surface Texture Skid Resistance Surface
Roughness (IRI in in./mile)
Overall Noise Level
(dBA)
MTD, mm (Sand Patch)
MPD, mm (CTM)
Coefficient of Friction
(DFT)
Skid Number*0.01 (Skid Trailer)
Indicator variable
Constant 0.57 (0.05) 0.82 (0.05) 0.62 (0.011) 0.30 (0.006) 125 (1.3) 106.8 (0.17)
Grinding condition (unground is base):
Ground 0.67 (0.07) 0.55 (0.07) 0.07 (0.012) 0.40 (0.007) -47 (1.6) -4.57 (0.25)
Pre-existing surface condition (transverse tinning is base):
Carpet drag -0.36 (0.06) -0.32 (0.06) -0.05 (0.01) -0.10 (0.006) 4 (1.2) -2.93 (0.25)
Burlap drag -0.40 (0.06) -0.41 (0.06) -0.06 (0.01) -0.10 (0.006) - -3.11 (0.246)
Lane location (inside lane is base):
Outside lane - - - -0.40 (0.004) -5(1.6) -
Direction of traffic (northbound is base):
Southbound 0.31 (0.05) 0.25 (0.05) -0.03 (0.01) 0.01 (0.003) - -
Wheelpath location (between wheelpaths is base):
Left wheelpath -0.08 (0.03) -0.11 (0.04) -0.06 (0.009) -NA- -NA- -NA-
Right wheelpath - - -0.07 (0.011) -NA- -NA- -NA-
Interaction between indicator variable
Grinding & carpet drag 0.25 (0.08) 0.23 (0.08) - 0.09 (0.008) - 2.02 (0.35)
Grinding & burlap drag 0.30 (0.08) 0.34 (0.08) - 0.09 (0.008) - 2.09 (0.35)
Grinding & outside lane -0.23 (0.04) -0.11 (0.05) -0.04 (0.013) 0.02 (0.005) 6(2.3) -
Grinding & southbound -0.31 (0.06) -0.19 (0.07) -0.05 (0.018) - - -
Grinding & left wheelpath - - - -NA- -NA- -NA-
Grinding & right wheelpath - - 0.10 (0.017) -NA- -NA- -NA-
24
Surface Macrotexture: In general, the coefficient estimates corresponding to surface macrotexture measured using the sand patch test and CTM are observed to be very similar. This similarity is attributed to the strong correlation between MTD and MPD respectively, as indicated previously.
The negative sign and magnitudes of the coefficient estimates of the carpet drag and burlap drag indicator variables corresponding to both the MTD and MPD models indicate that pre-existing transverse tining (the reference case) has the highest pre-grinding surface texture; the pavement section with burlap drag has the lowest. Transverse tining has deeper transverse grooves than that of either carpet or burlap drag, which is responsible for the highest pre-grinding surface texture. Both the MTD and MPD models suggest that there was no statistically significant difference between the average pre-grinding surface textures on the two lanes under consideration. The models indicate that the southbound sections have a higher pre-grinding surface texture than that of the northbound sections. Although the difference between the surface macrotexture measurements (both MTD and MPD) in the left wheelpath is statistically different from that between the wheelpaths, the magnitude of this difference is relatively small.
A positive sign on the coefficient estimates corresponding to the interaction of the carpet drag and burlap drag indicators with the grinding indicator variable indicates that the grinding reduced any pre-existing differences between the three sections (carpet drag, burlap drag, and transverse tining) in terms of surface texture (as per MTD and MPD). The magnitude of these coefficient estimates suggests that a pre-existing average texture of 0.36 mm on the carpet drag section relative to the transversely tined section is reduced by 0.25 mm and that of the burlap drag section is 0.40 mm, which is reduced by 0.30 mm. The transversely tined experimental sections possessed the highest post-grinding surface macrotexture; however, the difference is marginal with respect to the other two sections. Furthermore, the magnitude and sign of the coefficient estimate corresponding to the interaction between the grinding and the direction indicator variables reveals that the grinding operation nullified the pre-existing texture difference of 0.31 mm between the southbound and northbound experimental sections and produced a uniform surface texture across all experimental sections in both the traffic directions considered. On the other hand, the coefficient of interaction variable between the grinding and lane indicator variables reveals that grinding introduced a surface texture difference of 0.23 mm between the two lane types, with the inner lane carrying the lighter and faster traffic being highest. This difference is attributed to the variability in the measurements. In summary, the estimates suggest that grinding reduced or nullified the difference in surface macrotexture (in terms of MTD and MPD) due to pre-existing conditions and produced a uniform texture across the entire project.
Skid Resistance: A difference in the coefficient estimates corresponding to the skid
resistance models using the DFT and locked-wheel skid trailer score (skid number, or SN) is evident given the difference between the nature and speeds of these respective measurements—the skid trailer provides an estimate of longitudinal skid resistance while the DFT provides an overall skid resistance. This difference is emphasized on a tined surface.
The negative sign on the coefficient estimates of the carpet drag and burlap drag indicator variables corresponding to both the DFT and SN models indicates that the pre-existing transverse tining (base case) has a higher pre-grinding surface friction; the approximately equal magnitude of these two coefficients (in both the DFT and SN) indicates that the carpet drag and burlap drag sections have approximately equal pre-grinding skid resistance. The SN model suggests the pre-existing surface friction on the outside lane is higher than that of the inside lane by 0.04, while
25
there was no such evidence as per the DFT model. Both DFT and SN models indicated a minor difference between the two traffic directions in terms of skid resistance. The DFT model coefficient estimates corresponding to wheelpath location indicated a higher pre-grinding skid resistance between the wheelpaths.
The coefficient estimates of the SN model corresponding to the interaction of the carpet drag and burlap drag indicators with the grinding indicator variable indicates that grinding almost nullified the pre-existing difference of 0.10. In other words, the SN model suggests that, although the transversely tined section has the highest pre-grinding skid resistance, grinding produced approximately uniform skid resistance across the three sections by improving the skid resistance on the other two sections with pre-existing carpet and burlap drags. The coefficient estimates of both the DFT and SN models corresponding to interaction of the lane location indicator with the grinding indicator also highlighted that grinding reduced any pre-existing difference between the lanes regarding skid resistance.
In summary, pre-grinding skid resistance is higher on the transversely tined section compared to the other two sections, higher on the inside lane, and higher between the wheelpaths. Despite these pre-existing differences, grinding produced a uniform surface in terms of skid resistance; it either nullified or reduced pre-existing variations across the pavement surface, producing uniform skid resistance.
Surface Roughness: The roughness model coefficient estimates corresponding to the carpet drag indicator and the lane location indicator indicates minor differences in terms of roughness on the pre-ground surface. The coefficient estimate of the lane location indicator suggests that the outside lane possessed marginally higher pre-grinding roughness. The estimate coefficient of the variable corresponding to interaction of the lane location with grinding indicator reveals that grinding almost nullified the pre-existing difference of 5 in./mile between the two lanes. From this analysis, it is concluded that the pre-existing surface condition had no influence on both pre- and post-grinding roughness. The findings highlight the fact that roughness is independent of the existing texture; rather, it depends on the irregularities present along the surface. Pavement Noise: The negative sign on the coefficient estimates of the carpet drag and burlap drag indicator variables corresponding to the pavement noise model indicates that pre-existing transverse tining (base case) was the loudest section. The magnitude of these coefficient estimates suggests that the transversely tined section was 2.9 and 3.1 dBA louder than the carpet drag and burlap drag sections, respectively. Statistical insignificance of lane location and traffic direction indicates the uniformity of pavement noise before the grinding across the lanes and directions. The coefficient estimates corresponding to the interaction of the carpet drag and burlap drag indicators with the grinding indicator variable indicate that grinding reduced any pre-existing differences across the three sections in terms of pavement noise. The magnitude of these coefficient estimates highlights that grinding reduced the difference between the transverse tining and carpet drag by 2.0 dBA, while that of burlap drag is 2.1 dBA. In summary, grinding produced a relatively uniform surface in terms of pavement noise despite the loudest unground transversely tined section. The results highlight that direction of texture plays a vital role in abating the pavement noise.
26
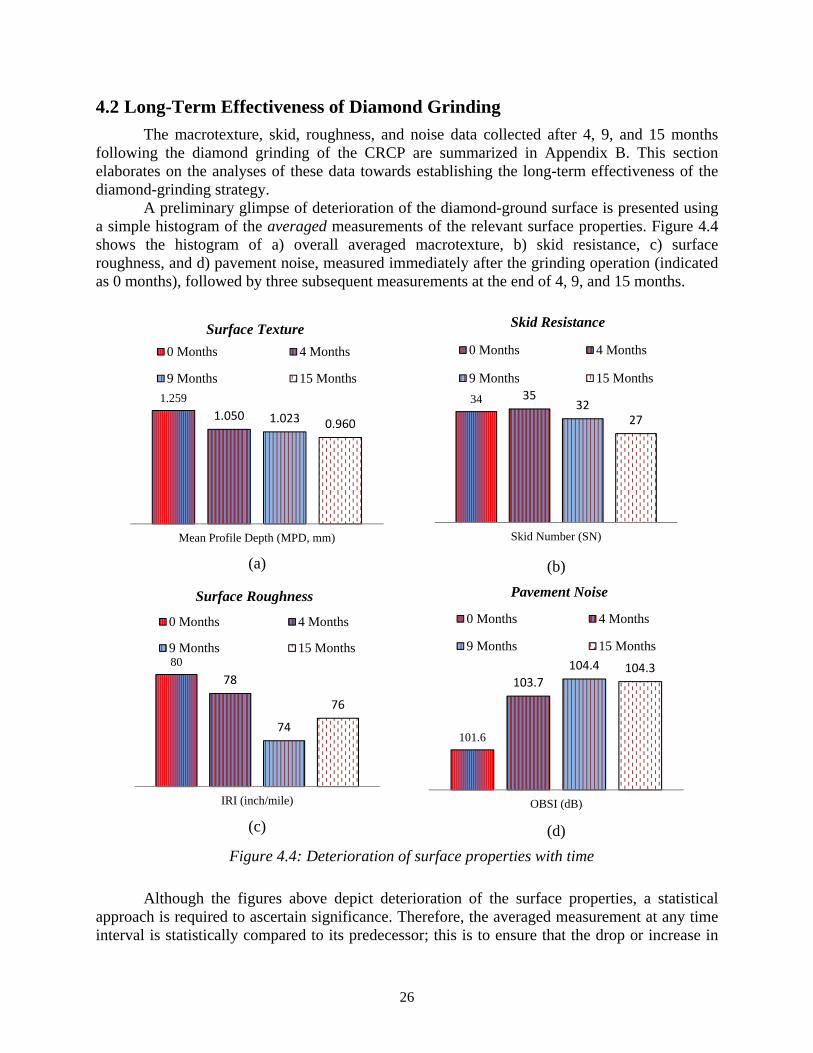
4.2 Long-Term Effectiveness of Diamond Grinding
The macrotexture, skid, roughness, and noise data collected after 4, 9, and 15 months following the diamond grinding of the CRCP are summarized in Appendix B. This section elaborates on the analyses of these data towards establishing the long-term effectiveness of the diamond-grinding strategy.
A preliminary glimpse of deterioration of the diamond-ground surface is presented using a simple histogram of the averaged measurements of the relevant surface properties. Figure 4.4 shows the histogram of a) overall averaged macrotexture, b) skid resistance, c) surface roughness, and d) pavement noise, measured immediately after the grinding operation (indicated as 0 months), followed by three subsequent measurements at the end of 4, 9, and 15 months.
(a)
(b)
(c)
(d)
Figure 4.4: Deterioration of surface properties with time
Although the figures above depict deterioration of the surface properties, a statistical approach is required to ascertain significance. Therefore, the averaged measurement at any time interval is statistically compared to its predecessor; this is to ensure that the drop or increase in
1.259
1.050 1.023 0.960
Mean Profile Depth (MPD, mm)
Surface Texture
0 Months 4 Months
9 Months 15 Months
34 3532
27
Skid Number (SN)
Skid Resistance
0 Months 4 Months
9 Months 15 Months
80
78
74
76
IRI (inch/mile)
Surface Roughness
0 Months 4 Months
9 Months 15 Months
101.6
103.7104.4 104.3
OBSI (dB)
Pavement Noise
0 Months 4 Months
9 Months 15 Months
27
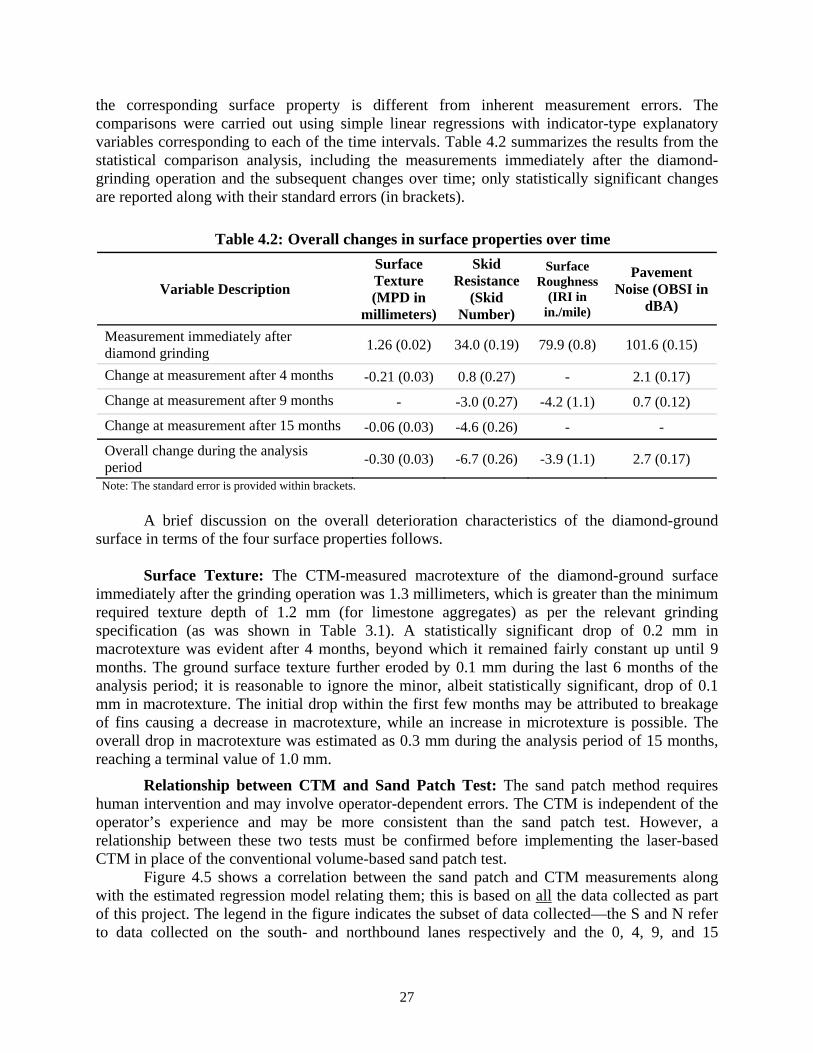
the corresponding surface property is different from inherent measurement errors. The comparisons were carried out using simple linear regressions with indicator-type explanatory variables corresponding to each of the time intervals. Table 4.2 summarizes the results from the statistical comparison analysis, including the measurements immediately after the diamond-grinding operation and the subsequent changes over time; only statistically significant changes are reported along with their standard errors (in brackets).
Table 4.2: Overall changes in surface properties over time
Variable Description
Surface Texture (MPD in
millimeters)
Skid Resistance
(Skid Number)
Surface Roughness
(IRI in in./mile)
Pavement Noise (OBSI in
dBA)
Measurement immediately after diamond grinding
1.26 (0.02) 34.0 (0.19) 79.9 (0.8) 101.6 (0.15)
Change at measurement after 4 months -0.21 (0.03) 0.8 (0.27) - 2.1 (0.17)
Change at measurement after 9 months - -3.0 (0.27) -4.2 (1.1) 0.7 (0.12)
Change at measurement after 15 months -0.06 (0.03) -4.6 (0.26) - -
Overall change during the analysis period
-0.30 (0.03) -6.7 (0.26) -3.9 (1.1) 2.7 (0.17)
Note: The standard error is provided within brackets.
A brief discussion on the overall deterioration characteristics of the diamond-ground
surface in terms of the four surface properties follows. Surface Texture: The CTM-measured macrotexture of the diamond-ground surface
immediately after the grinding operation was 1.3 millimeters, which is greater than the minimum required texture depth of 1.2 mm (for limestone aggregates) as per the relevant grinding specification (as was shown in Table 3.1). A statistically significant drop of 0.2 mm in macrotexture was evident after 4 months, beyond which it remained fairly constant up until 9 months. The ground surface texture further eroded by 0.1 mm during the last 6 months of the analysis period; it is reasonable to ignore the minor, albeit statistically significant, drop of 0.1 mm in macrotexture. The initial drop within the first few months may be attributed to breakage of fins causing a decrease in macrotexture, while an increase in microtexture is possible. The overall drop in macrotexture was estimated as 0.3 mm during the analysis period of 15 months, reaching a terminal value of 1.0 mm.
Relationship between CTM and Sand Patch Test: The sand patch method requires human intervention and may involve operator-dependent errors. The CTM is independent of the operator’s experience and may be more consistent than the sand patch test. However, a relationship between these two tests must be confirmed before implementing the laser-based CTM in place of the conventional volume-based sand patch test.
Figure 4.5 shows a correlation between the sand patch and CTM measurements along with the estimated regression model relating them; this is based on all the data collected as part of this project. The legend in the figure indicates the subset of data collected—the S and N refer to data collected on the south- and northbound lanes respectively and the 0, 4, 9, and 15
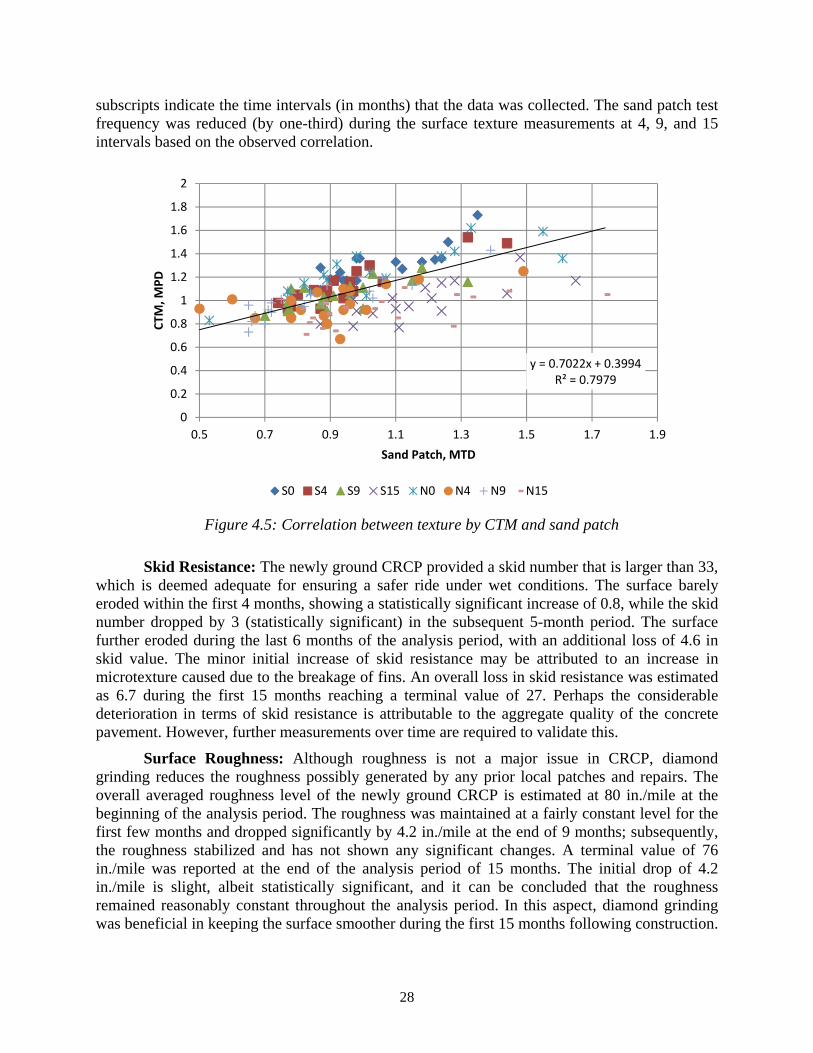
28
subscripts indicate the time intervals (in months) that the data was collected. The sand patch test frequency was reduced (by one-third) during the surface texture measurements at 4, 9, and 15 intervals based on the observed correlation.
Figure 4.5: Correlation between texture by CTM and sand patch
Skid Resistance: The newly ground CRCP provided a skid number that is larger than 33, which is deemed adequate for ensuring a safer ride under wet conditions. The surface barely eroded within the first 4 months, showing a statistically significant increase of 0.8, while the skid number dropped by 3 (statistically significant) in the subsequent 5-month period. The surface further eroded during the last 6 months of the analysis period, with an additional loss of 4.6 in skid value. The minor initial increase of skid resistance may be attributed to an increase in microtexture caused due to the breakage of fins. An overall loss in skid resistance was estimated as 6.7 during the first 15 months reaching a terminal value of 27. Perhaps the considerable deterioration in terms of skid resistance is attributable to the aggregate quality of the concrete pavement. However, further measurements over time are required to validate this.
Surface Roughness: Although roughness is not a major issue in CRCP, diamond grinding reduces the roughness possibly generated by any prior local patches and repairs. The overall averaged roughness level of the newly ground CRCP is estimated at 80 in./mile at the beginning of the analysis period. The roughness was maintained at a fairly constant level for the first few months and dropped significantly by 4.2 in./mile at the end of 9 months; subsequently, the roughness stabilized and has not shown any significant changes. A terminal value of 76 in./mile was reported at the end of the analysis period of 15 months. The initial drop of 4.2 in./mile is slight, albeit statistically significant, and it can be concluded that the roughness remained reasonably constant throughout the analysis period. In this aspect, diamond grinding was beneficial in keeping the surface smoother during the first 15 months following construction.
y = 0.7022x + 0.3994R² = 0.7979
0
0.2
0.4
0.6
0.8
1
1.2
1.4
1.6
1.8
2
0.5 0.7 0.9 1.1 1.3 1.5 1.7 1.9
CTM
, MPD
Sand Patch, MTD
S0 S4 S9 S15 N0 N4 N9 N15
29
Indeed, the finding is expected considering the structural strength and absence of joint-related distresses in CRCP.
Pavement Noise: Diamond grinding significantly reduced the tire-pavement noise with an overall immediate reduction of more than 3 dBA. An average noise intensity of 101.6 dBA was reported on the newly ground CRCP immediately after the grinding operation. As shown in Figure 4.4, the tire-pavement noise intensity considerably increased within the first few months. A significant increase of 2.1 dBA was evident within the first 4 months, followed by a further increment of 0.7 dBA at the end of 9 months. An overall statistically significant noise level reduction of 2.7 dBA was reported within a period of 15 months. Compared with the immediate noise abatement of 3.2 dBA, the increase in noise levels appears to nullify the initial benefit of utilizing diamond grinding as a noise abatement technique.
4.2.1 Influence of Site-Specific Conditions on Efficiency
The influence of traffic speed and load as well as pre-existing surface texture and other site-specific variables was investigated. Individual regression models were estimated for understanding the influence of site features on deterioration of a diamond-ground surface in terms of macrotexture, skid resistance, surface roughness, and pavement noise. A panel-based regression approach was implemented that recognizes the panel setting of the field-data collected at different time intervals. The detailed methodology used for model development and estimation, along with the modeling results, is provided below. Model Development
The field-collected data includes measurements of four different surface properties along with the site-specific features associated with each measurement location. The measured surface properties are modeled as continuous dependent variables while incorporating the site-specific features, represented as categorical explanatory variables. To achieve the main objectives of this study, the field data was collected at multiple times during the analysis period of 15 months. A linear regression of the pooled data (collected at multiple time intervals) would yield biased estimates in such scenarios; ignoring the time-dependent effects would generate omitted variable bias. The influence of the site-specific features may only be extracted accurately by accounting for the inherent time-dependent effect on the measured surface properties, which is a typical panel data problem. Panel data is commonly handled using either fixed or random effects approaches. The former approach assumes the time-dependent effect is correlated with the other explanatory variables in the model, while the latter assumes no correlation. Intuitively, the increase or decrease of the surface properties (texture, skid resistance, surface roughness, or pavement noise) between any two time intervals is possibly related to the features of the measurement location. For instance, the loss of skid resistance is arguably related to the traffic speed and load, which may be deduced from data collected in the corresponding lane—i.e., the outer lane carries slower and heavier traffic, while the inner lane carries faster and lighter traffic. In order to account for such potential correlations, a panel regression model using fixed effects was adopted. One way of estimating the fixed effects model is by introducing indicator variables representing each panel or time interval in this case. Additionally, these time-related indicator variables are interacted with explanatory variables to estimate the variation of the influence of site-specific features on measured surface properties. Subsequently, estimation of a linear regression model (including the time-related indicator variables, explanatory variables of
30
interest, and the interactions) would yield unbiased estimates, even though the estimates are obtained using simple ordinary least squares estimation procedures. The regression model that is being estimated in this study is presented as Equation 4.1: = + + + ∗ + (Eq. 4.1) where,
: observation of the surface property measured at time period : Constant that absorbs information relevant to the base case
: Vector of indicator variables corresponding to 4-, 9-, and 15-month time intervals; the base level is selected as measurement immediately after the grinding, i.e., 0 months
: Vector of fixed effects corresponding to 4-, 9-, and 15-month time periods : Vector of explanatory variables corresponding to observation at time interval. It is
important to note that the explanatory variables or site features do not change over time. : Vector of overall regression coefficients corresponding to the explanatory variables : Vector of regression coefficients corresponding to the interaction of explanatory variables
and time-related indicator variable; these are also another form of fixed effects. : Idiosyncratic error term
The model coefficients and the corresponding standard errors are obtained through
ordinary least squares estimation of the model presented in Equation 4.1. A final specification was chosen carefully based on a rigorous model development process including all the aforementioned variables. Model refinement was carried out using standard statistical tests (such as the F-test) and exclusion of statistically insignificant variables. Practical considerations played a role in the removal of insignificant variables, rather than solely adopting a statistically based mechanical approach. Table 4.3 presents the final specification estimates corresponding to each of the surface properties measured as part of the study.
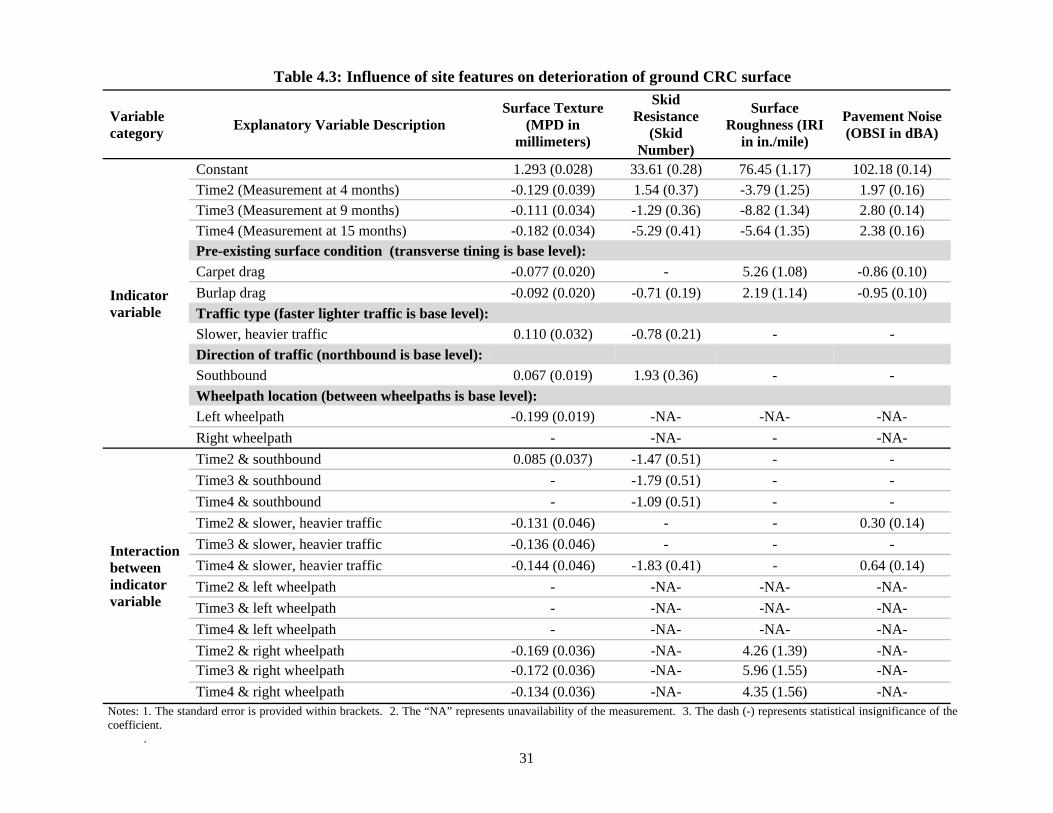
31
Table 4.3: Influence of site features on deterioration of ground CRC surface
Variable category
Explanatory Variable Description Surface Texture
(MPD in millimeters)
Skid Resistance
(Skid Number)
Surface Roughness (IRI
in in./mile)
Pavement Noise (OBSI in dBA)
Indicator variable
Constant 1.293 (0.028) 33.61 (0.28) 76.45 (1.17) 102.18 (0.14)
Time2 (Measurement at 4 months) -0.129 (0.039) 1.54 (0.37) -3.79 (1.25) 1.97 (0.16)
Time3 (Measurement at 9 months) -0.111 (0.034) -1.29 (0.36) -8.82 (1.34) 2.80 (0.14)
Time4 (Measurement at 15 months) -0.182 (0.034) -5.29 (0.41) -5.64 (1.35) 2.38 (0.16)
Pre-existing surface condition (transverse tining is base level):
Carpet drag -0.077 (0.020) - 5.26 (1.08) -0.86 (0.10)
Burlap drag -0.092 (0.020) -0.71 (0.19) 2.19 (1.14) -0.95 (0.10)
Traffic type (faster lighter traffic is base level):
Slower, heavier traffic 0.110 (0.032) -0.78 (0.21) - -
Direction of traffic (northbound is base level):
Southbound 0.067 (0.019) 1.93 (0.36) - -
Wheelpath location (between wheelpaths is base level):
Left wheelpath -0.199 (0.019) -NA- -NA- -NA-
Right wheelpath - -NA- - -NA-
Interaction between indicator variable
Time2 & southbound 0.085 (0.037) -1.47 (0.51) - -
Time3 & southbound - -1.79 (0.51) - -
Time4 & southbound - -1.09 (0.51) - -
Time2 & slower, heavier traffic -0.131 (0.046) - - 0.30 (0.14)
Time3 & slower, heavier traffic -0.136 (0.046) - - -
Time4 & slower, heavier traffic -0.144 (0.046) -1.83 (0.41) - 0.64 (0.14)
Time2 & left wheelpath - -NA- -NA- -NA-
Time3 & left wheelpath - -NA- -NA- -NA-
Time4 & left wheelpath - -NA- -NA- -NA-
Time2 & right wheelpath -0.169 (0.036) -NA- 4.26 (1.39) -NA- Time3 & right wheelpath -0.172 (0.036) -NA- 5.96 (1.55) -NA-
Time4 & right wheelpath -0.134 (0.036) -NA- 4.35 (1.56) -NA- Notes: 1. The standard error is provided within brackets. 2. The “NA” represents unavailability of the measurement. 3. The dash (-) represents statistical insignificance of the coefficient.
.
32
Model Results and Discussion A brief discussion on both magnitude and sign of the estimated coefficients
corresponding to the final specification is provided below; the four specifications corresponding to surface texture, skid resistance, surface roughness, and pavement noise are discussed. The discussion primarily revolves around the influence of the following site-specific features on the deterioration of diamond grinding: (a) pre-texturing (carpet drag, burlap drag, and transverse tinning), (b) traffic type, (c) direction of the traffic, and (d) wheelpath location.
Surface Texture: With reference to Table 4.3, the negative sign on the coefficients
corresponding to the carpet-drag and burlap-drag surfaces reflects that the surface texture on the transversely tined section is higher immediately after the diamond grinding; intuitively, the transverse tining is expected to possess deeper texture, which is in agreement with the coefficient signs. The coefficients corresponding to interaction of the carpet and burlap drag indicator variables with the time-related indicators were not statistically significant (hence, not reported in Table 4.3); therefore, it is concluded that the pre-texturing type existing prior to the grinding does not influence the deterioration of the surface texture over time.
Secondly, the positive sign on the coefficient corresponding to the slower and heavier traffic indicator variable indicates that lanes carrying slower, heavier traffic have a higher surface texture than that of lanes carrying faster, lighter traffic immediately after the grinding; this is attributed to construction-related variations. However, it is interesting to observe that the lanes carrying slower, heavier traffic deteriorated more rapidly than the lanes carrying the faster, lighter traffic; this is reflected by the negative signs on the coefficients corresponding to the time and traffic interaction variables. The magnitudes of the coefficients corresponding to these interactions indicate a moderate texture deterioration of the outer lane within the first few months followed by the faster deterioration in the last 6 months of the analysis period. It is concluded that traffic characteristics such as traffic speed and load influence the deterioration of the surface texture of diamond-ground surfaces.
Third, the positive sign on the southbound indicator reflects a higher surface texture in the southbound direction immediately following grinding. The southbound lanes continuously eroded loosing further texture within the first 4 months and remained on par with that of northbound direction thereafter.
Finally, the negative sign on the left wheelpath indicator reflects that the left wheelpath had the lowest surface texture immediately after the diamond grinding. The negative signs on the relevant interaction indicator variables indicate that the texture on the right wheelpath eroded faster than that on the left wheelpath.
Skid Resistance: The negative sign of the coefficient corresponding to the burlap drag
indicator variable represents a lower skid resistance, though a relatively smaller difference, on locations that are pre-textured with burlap drag relative to that with transverse tining immediately after the grinding operation; there was no statistically significant difference in terms of skid between the surface pre-textured with carpet drag and that with transverse tining. The coefficients corresponding to interaction of the carpet and burlap drag indicator variables with the time-related indicators were not statistically significant; therefore, it is concluded that the pre-texturing type existing prior to the grinding did not influence the deterioration of the skid resistance over time.
33
For the slower heavier traffic indicator, the negative sign on the corresponding coefficient reflects a relatively lower skid resistance on the lanes carrying slower, heavier traffic in comparison with that on lanes carrying faster, lighter traffic, which is intuitive. The statistical insignificance of coefficients of the time and traffic interaction variables indicates that traffic speed and load did not influence the deterioration of the skid resistance within the first 9 months. However, the lanes carrying slower, heavier traffic deteriorated considerably faster than lanes carrying faster, lighter traffic, losing considerable skid resistance during the last 6 months of the analysis period. It is therefore concluded that traffic speed and load do influence the deterioration of the skid resistance of diamond-ground surfaces, particularly after the first few months.
The positive sign on the coefficient corresponding to the southbound indicator variable reflects larger skid resistance on experimental sections in the southbound traffic direction than that of sections in the northbound direction. However, the negative sign on the relevant interaction variables indicates that the experimental sections located in the northbound direction lost skid resistance more rapidly than that in the southbound direction during the analysis period. The reason for this difference is unknown and may be related to more loaded vs. unloaded trucks travelling on the northbound vs. southbound lanes.
Surface Roughness: The positive sign of the coefficients corresponding to the carpet-
drag and burlap-drag indicator variables indicates that the experimental sections pre-textured with transverse tining were smoother immediately after grinding than those with carpet or burlap drag. The coefficients corresponding to interaction of the carpet and burlap drag indicator variables with the time-related indicators were not statistically significant; therefore, it is concluded that the pre-texturing type existing prior to grinding did not influence the deterioration of the surface smoothness with time. Also, the statistical insignificance of the traffic-related indicator variables highlights that the traffic speed and load did not influence the deterioration of the surface roughness. Intuitively, this finding is reasonable considering the underlying structurally sound CRCP. It is also observed that traffic direction does not influence the deterioration rate of the surface roughness. Finally, the statistical insignificance of the coefficient of the right wheelpath indicator variable indicates that there was no difference in the surface roughness of the left and right wheelpaths immediately after grinding. However, the right wheelpath deteriorated faster than the left wheelpath within the analysis period; this is indicated by the positive coefficient of the relevant time-related interaction variables. This is typically the case on Texas roads where the roughness in the right wheelpath is greater than that in the left, either due to the effect of the pavement edge or the road grade.
Pavement Noise: The negative coefficient of the indicator variables corresponding to the
carpet-drag and burlap-drag indicates that the transversely tined pavement was the loudest immediately after the grinding operation. The coefficient corresponding to the interaction of the carpet and burlap drag indicator variables with the time-related indicators were not statistically significant; therefore, it is concluded that the pre-texturing type existing prior to the grinding did not influence the noise-attenuating properties with time. Additionally, the statistical insignificance of the traffic-related indicator variable indicates that the noise levels on both the inner and outer lanes were similar immediately after grinding. However, within the first 4 months, the lane carrying slower and heavier traffic became louder; by the end of the analysis period, the noise levels on the outer lane increased further. Hence, it appears that both traffic

34
speed and load contributed to the increased noise levels, albeit indirectly. Finally, no significant difference in noise level was evident between the north- and southbound lanes.
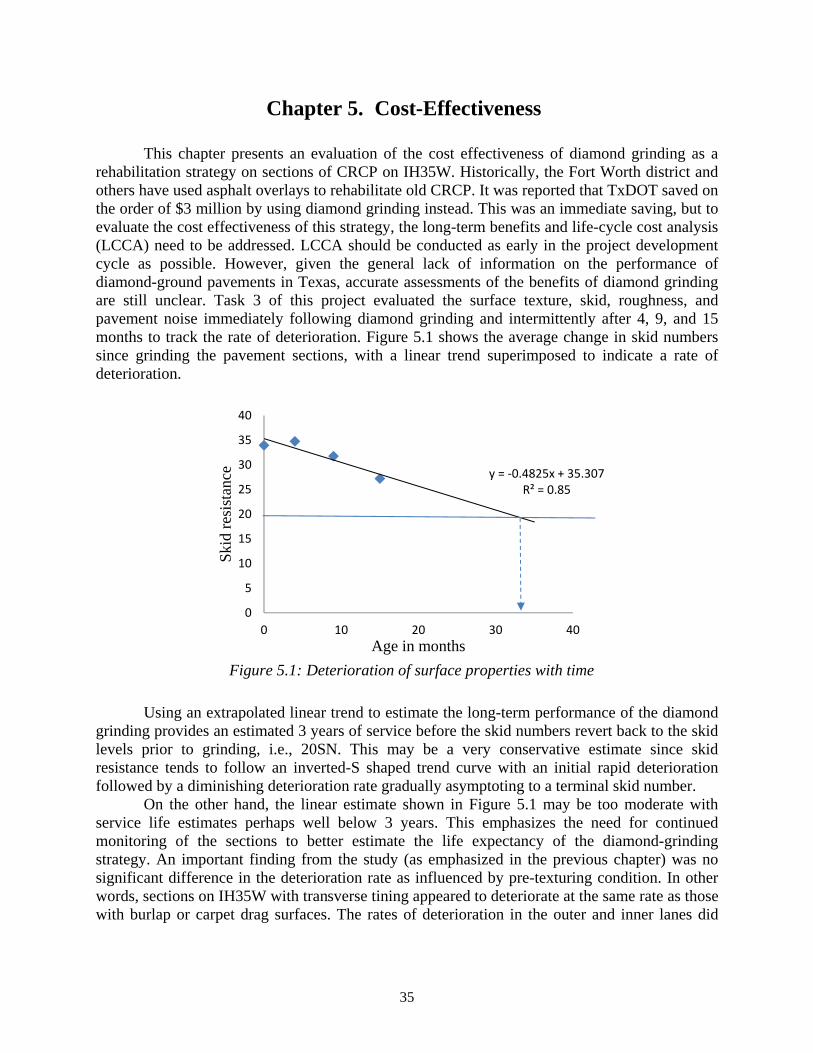
35
Chapter 5. Cost-Effectiveness
This chapter presents an evaluation of the cost effectiveness of diamond grinding as a rehabilitation strategy on sections of CRCP on IH35W. Historically, the Fort Worth district and others have used asphalt overlays to rehabilitate old CRCP. It was reported that TxDOT saved on the order of $3 million by using diamond grinding instead. This was an immediate saving, but to evaluate the cost effectiveness of this strategy, the long-term benefits and life-cycle cost analysis (LCCA) need to be addressed. LCCA should be conducted as early in the project development cycle as possible. However, given the general lack of information on the performance of diamond-ground pavements in Texas, accurate assessments of the benefits of diamond grinding are still unclear. Task 3 of this project evaluated the surface texture, skid, roughness, and pavement noise immediately following diamond grinding and intermittently after 4, 9, and 15 months to track the rate of deterioration. Figure 5.1 shows the average change in skid numbers since grinding the pavement sections, with a linear trend superimposed to indicate a rate of deterioration.
Figure 5.1: Deterioration of surface properties with time
Using an extrapolated linear trend to estimate the long-term performance of the diamond grinding provides an estimated 3 years of service before the skid numbers revert back to the skid levels prior to grinding, i.e., 20SN. This may be a very conservative estimate since skid resistance tends to follow an inverted-S shaped trend curve with an initial rapid deterioration followed by a diminishing deterioration rate gradually asymptoting to a terminal skid number.
On the other hand, the linear estimate shown in Figure 5.1 may be too moderate with service life estimates perhaps well below 3 years. This emphasizes the need for continued monitoring of the sections to better estimate the life expectancy of the diamond-grinding strategy. An important finding from the study (as emphasized in the previous chapter) was no significant difference in the deterioration rate as influenced by pre-texturing condition. In other words, sections on IH35W with transverse tining appeared to deteriorate at the same rate as those with burlap or carpet drag surfaces. The rates of deterioration in the outer and inner lanes did
y = -0.4825x + 35.307R² = 0.85
0
5
10
15
20
25
30
35
40
0 10 20 30 40
Ski
d re
sist
ance
Age in months
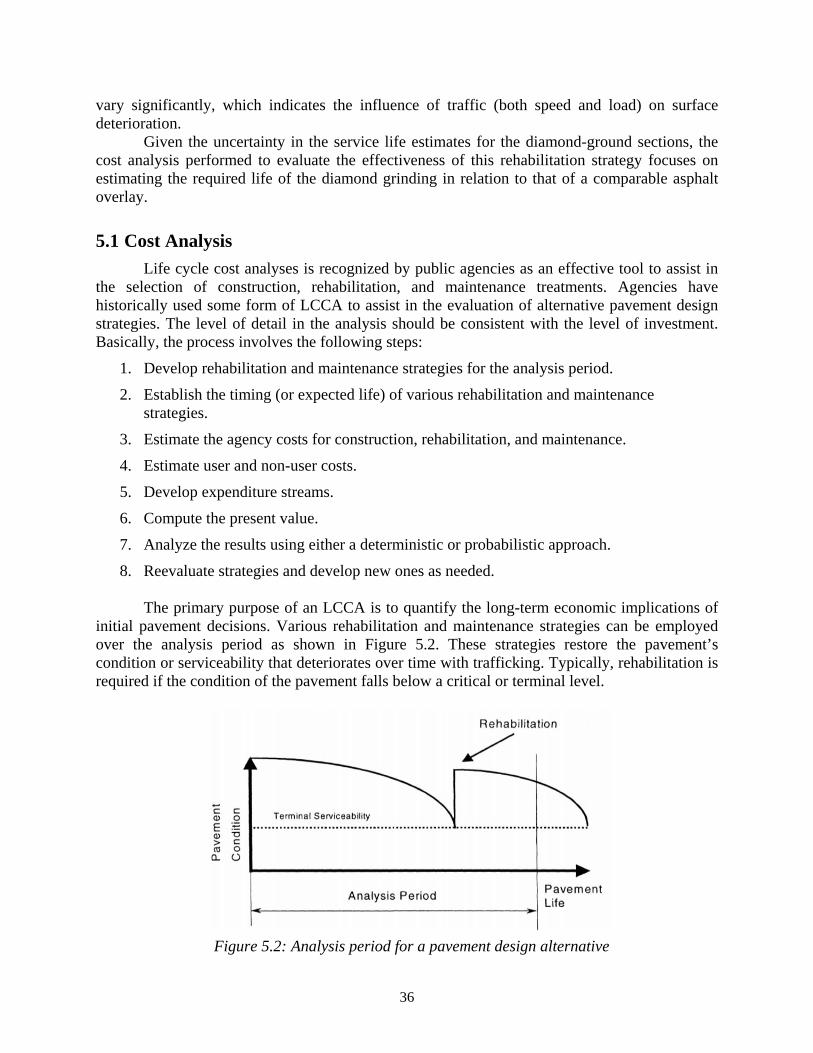
36
vary significantly, which indicates the influence of traffic (both speed and load) on surface deterioration.
Given the uncertainty in the service life estimates for the diamond-ground sections, the cost analysis performed to evaluate the effectiveness of this rehabilitation strategy focuses on estimating the required life of the diamond grinding in relation to that of a comparable asphalt overlay.
5.1 Cost Analysis
Life cycle cost analyses is recognized by public agencies as an effective tool to assist in the selection of construction, rehabilitation, and maintenance treatments. Agencies have historically used some form of LCCA to assist in the evaluation of alternative pavement design strategies. The level of detail in the analysis should be consistent with the level of investment. Basically, the process involves the following steps:
1. Develop rehabilitation and maintenance strategies for the analysis period.
2. Establish the timing (or expected life) of various rehabilitation and maintenance strategies.
3. Estimate the agency costs for construction, rehabilitation, and maintenance.
4. Estimate user and non-user costs.
5. Develop expenditure streams.
6. Compute the present value.
7. Analyze the results using either a deterministic or probabilistic approach.
8. Reevaluate strategies and develop new ones as needed. The primary purpose of an LCCA is to quantify the long-term economic implications of
initial pavement decisions. Various rehabilitation and maintenance strategies can be employed over the analysis period as shown in Figure 5.2. These strategies restore the pavement’s condition or serviceability that deteriorates over time with trafficking. Typically, rehabilitation is required if the condition of the pavement falls below a critical or terminal level.
Figure 5.2: Analysis period for a pavement design alternative
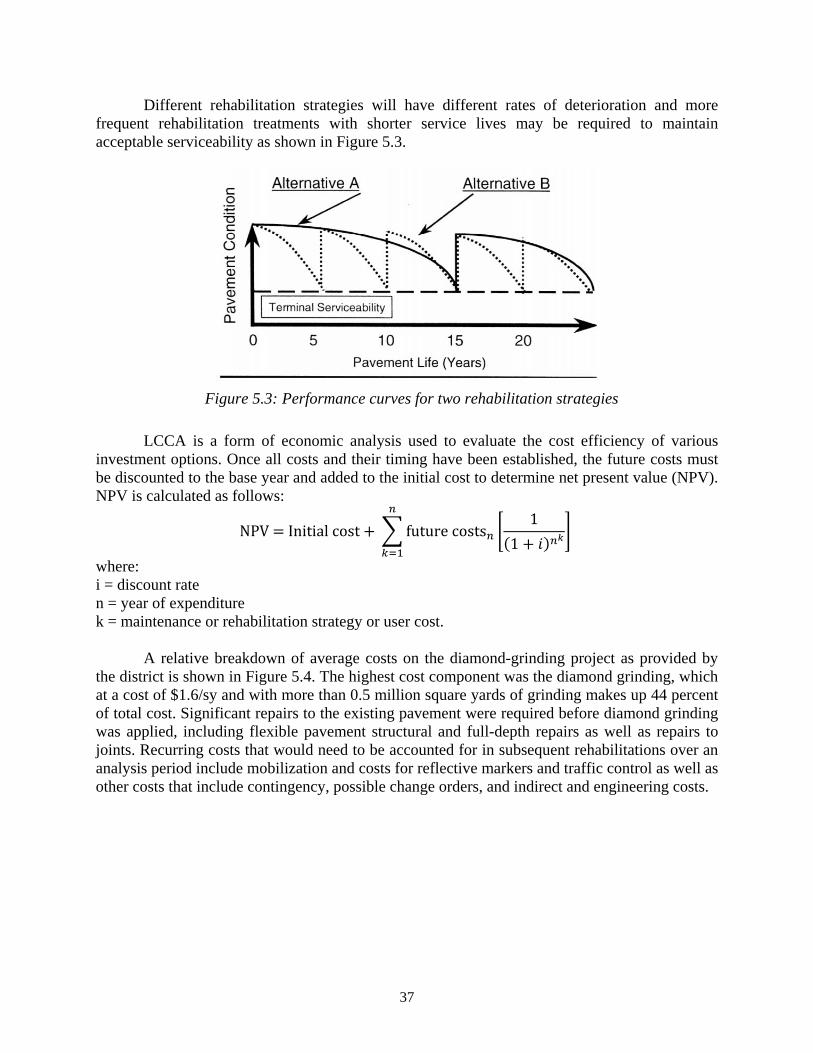
37
Different rehabilitation strategies will have different rates of deterioration and more frequent rehabilitation treatments with shorter service lives may be required to maintain acceptable serviceability as shown in Figure 5.3.
Figure 5.3: Performance curves for two rehabilitation strategies
LCCA is a form of economic analysis used to evaluate the cost efficiency of various investment options. Once all costs and their timing have been established, the future costs must be discounted to the base year and added to the initial cost to determine net present value (NPV). NPV is calculated as follows: NPV=Initialcost+ futurecosts 11 + where: i = discount rate n = year of expenditure k = maintenance or rehabilitation strategy or user cost.
A relative breakdown of average costs on the diamond-grinding project as provided by
the district is shown in Figure 5.4. The highest cost component was the diamond grinding, which at a cost of $1.6/sy and with more than 0.5 million square yards of grinding makes up 44 percent of total cost. Significant repairs to the existing pavement were required before diamond grinding was applied, including flexible pavement structural and full-depth repairs as well as repairs to joints. Recurring costs that would need to be accounted for in subsequent rehabilitations over an analysis period include mobilization and costs for reflective markers and traffic control as well as other costs that include contingency, possible change orders, and indirect and engineering costs.
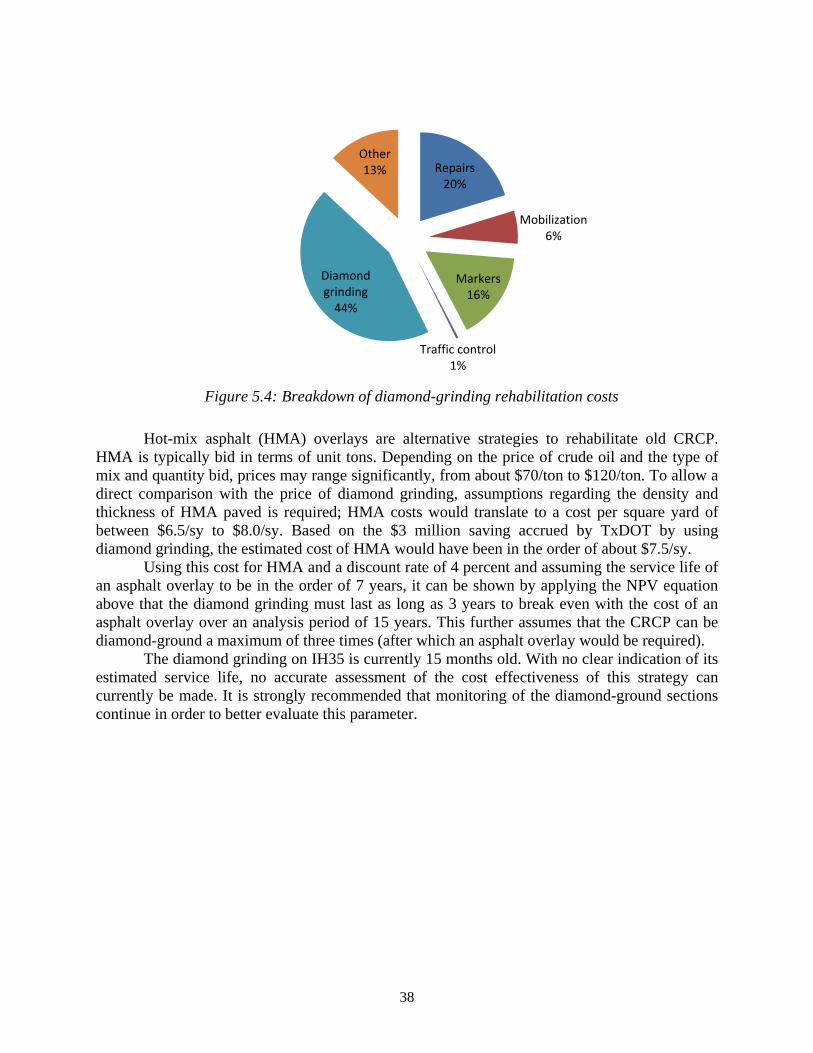
38
Figure 5.4: Breakdown of diamond-grinding rehabilitation costs
Hot-mix asphalt (HMA) overlays are alternative strategies to rehabilitate old CRCP. HMA is typically bid in terms of unit tons. Depending on the price of crude oil and the type of mix and quantity bid, prices may range significantly, from about $70/ton to $120/ton. To allow a direct comparison with the price of diamond grinding, assumptions regarding the density and thickness of HMA paved is required; HMA costs would translate to a cost per square yard of between $6.5/sy to $8.0/sy. Based on the $3 million saving accrued by TxDOT by using diamond grinding, the estimated cost of HMA would have been in the order of about $7.5/sy.
Using this cost for HMA and a discount rate of 4 percent and assuming the service life of an asphalt overlay to be in the order of 7 years, it can be shown by applying the NPV equation above that the diamond grinding must last as long as 3 years to break even with the cost of an asphalt overlay over an analysis period of 15 years. This further assumes that the CRCP can be diamond-ground a maximum of three times (after which an asphalt overlay would be required).
The diamond grinding on IH35 is currently 15 months old. With no clear indication of its estimated service life, no accurate assessment of the cost effectiveness of this strategy can currently be made. It is strongly recommended that monitoring of the diamond-ground sections continue in order to better evaluate this parameter.
Repairs20%
Mobilization6%
Markers16%
Traffic control1%
Diamond grinding
44%
Other13%
39
Chapter 6. Conclusions and Recommendations
The primary objective of the study is to quantify the medium-term performance of a diamond-ground CRCP surface in retaining essential surface properties. Also quantified is the influence of site-specific features such as traffic speed and load, the pre-existing surface condition or pre-texturing (such as carpet-drag, burlap-drag, and transverse tining), wheelpath, and trafficking direction on the deterioration of the diamond-ground surface. Macro-texture, skid resistance, surface roughness, and pavement noise were monitored for a period of 15 months using the CTM, TxDOT’s locked-wheel skid trailer, inertial profiler, and OBSI noise measuring equipment respectively. The surface properties were measured immediately before and after the diamond-grinding operation and at three subsequent time intervals, i.e., after 4, 9, and 15 months. An experimental program was developed to facilitate comprehensive data collection covering the site-specific features representing the primary surface properties of interest. The overall deterioration characteristics of the measured surface properties are discussed using sound statistical techniques. A panel-type regression approach incorporating fixed effects was implemented to evaluate the influence of the site-specific features on the deterioration of the relevant surface properties.
6.1 Effectiveness
In-field surface texture measurements were collected by both conventional and laser-based methods. Sand patch test results indicated a surface texture improvement of 0.6 mm while that of the CTM is 0.7 mm. A relatively strong correlation is evident between these two measurements. This relationship encourages the use of the CTM over the sand patch test for better quality control, as the CTM reduces the subjective variability due to human intervention and increases productivity. A DFT and TxDOT locked-wheel skid trailer were used for measuring skid resistance. The grinding operation produced a percentage improvement in skid resistance (measured by skid trailer) of approximately 60 percent, which is encouraging. An appreciable positive correlation was evident between the surface friction (measured by DFT) and surface macrotexture (measured by CTM). A decrease was evident in the overall surface roughness of 44 in./mile (124 in./mile to 80 in./mile) on the ground pavement surface. The grinding operation reduced the average overall noise level by 3.2 dBA, which represents a considerable reduction. The noise reduction achieved by diamond grinding is comparable to, and even greater than, that of a permeable friction course overlay on a dense-graded asphalt pavement. The maximum noise reduction of 5.6 dB was achieved at the 1,600 Hz frequency band irrespective of any pre-existing condition. The study team noticed a maximum reduction in the region of frequencies spanning 1,000 Hz to 2,500 Hz. Based on the findings of the study, it is concluded that diamond grinding was effective in improving the surface macrotexture, skid resistance, and surface smoothness while abating the pavement noise on the rehabilitated CRCP.
Statistical models were used to examine the influence of pre-existing surface condition on the effectiveness of diamond grinding. The model estimates suggested that the transversely tined section had the highest pre-grinding surface macrotexture, skid resistance, and pavement noise. In general, the overall improvement in terms of surface texture, skid resistance, ride quality, and noise level was higher in sections with pre-existing carpet drag and burlap drag. In addition, the pre-grinding skid resistance and surface roughness were higher on the outer lane than that of inner lane. The study provided adequate statistical evidence for concluding that grinding
40
operation produced a relatively uniform surface in terms of macrotexture, skid, roughness, and noise levels despite the variation in pre-existing conditions across the CRC pavement.
Although diamond grinding was appreciably effective in improving the functionality of the structurally sound CRC pavement, monitoring its rate of deterioration is recommended for drawing conclusions on its overall efficiency and cost effectiveness over time, particularly considering the wearing potential of limestone aggregates.
6.2 Efficiency
The deterioration of the diamond grinding is observed to be different for each of the four measured surface properties. MPD dropped by 0.2 mm after 4 months, beyond which it remained fairly constant up until 9 months; it showed further indications of wear, although minimal loss in texture is apparent during the last 6 months of the analysis period. The overall drop in macrotexture was estimated at 0.3 mm during the analysis period of 15 months, reaching a terminal value of 1 mm. The surface barely eroded within the first 4 months in terms of skid resistance; subsequently, the skid number dropped by 3 during the following 5-month period. The surface further lost an additional 4.6 in skid number during the last 6 months of the analysis period. The data suggests an overall loss of 6.7 in skid number during the first 15 months, reaching a terminal value of 27. The loss in skid resistance may be attributed to the more rapidly wearing limestone aggregate in the concrete pavement. The roughness maintained a fairly constant level for the first few months and dropped significantly by 4.2 in./mile at the end of 9 months; subsequently, the roughness stabilized and has not shown any significant changes since. A terminal value of 76 in./mile is reported at the end of the analysis period of 15 months. It is concluded that the roughness is reasonably constant throughout the analysis period. Thus, diamond grinding was beneficial in providing a smoother pavement during the first 15 months in service. Tire-pavement noise intensity increased by 2.1 dBA within the first 4 months, followed by a further increment of 0.7 dBA at the end of 9 months. An overall significant noise level reduction of 2.7 dBA was reported within a period of 15 months. Despite a noticeable immediate noise reduction, diamond grinding does not appear to be effective in reducing noise levels over extended periods. This finding is preliminary and should be investigated further on other diamond-ground CRCP sections.
In general, it was found that four site-specific features controlled the deterioration of the diamond-ground sections in terms of the monitored surface properties. First, based on the model estimates, the pre-texturing type existing prior to the grinding operation did not appear to have influenced the deterioration of essential surface properties monitored as part of the study. Second, slower and heavier traffic accelerated the deterioration of macro-texture, skid resistance, and pavement noise abatement. Third, according to observed data, the direction of the trafficking appears to influence macrotexture and skid resistance, although the reason for this is unclear. Fourth, more rapid deterioration was observed in the right wheelpath, in terms of macrotexture as well as surface roughness. In summary, this report provides statistical evidence that the diamond-ground surface did deteriorate in terms of macrotexture, skid resistance, roughness, and noise after 15 months in service—but additional measurements and monitoring of the sections over time is recommended to better model this deterioration towards establishing the long-term benefits of diamond grinding.
The diamond grinding on IH35W near Fort Forth is currently 15 months old. With no clear indication of its estimated service life, no accurate assessment of the cost effectiveness of

41
this strategy can currently be made. Preliminary evidence based on a life cycle cost analysis comparing diamond grinding with an asphalt overlay suggests that the diamond grinding’s effects must last as long as 3 years to break even with the cost of an asphalt overlay over an analysis period of 15 years. It is strongly recommended that monitoring of the diamond-ground sections continue in order to better evaluate this parameter.

42

43
References
1. Ahammed, A. M. and S. L. Tighe (2008), Incorporation of Surface Texture, Skid Resistance and Noise into PMS, Presented at 7th International Conference on Managing Pavement and Other Roadway Assets. Calgary, Alberta, Canada.
2. Burgé, P.L., Travis, K., and Z. Rado (2002), Transverse-Tined and Longitudinal Diamond-Ground Texturing for Newly Constructed Concrete Pavement, In Transportation Research record: Journal of the Transportation Research Board, No.1792, Transportation Research Board of the National Academies, Washington, D.C., pp 75–82.
3. Dare T., W. Thornton, T. Wulf and R. Bernhard (2009), Acoustical Effects of Grinding and Grooving on Portland Cement Concrete Pavements, Technical Information, International Grinding and Grooving Association.
4. Defrain, L (1989), Noise Analysis of Ground Surface on I-69 WB Near Lowell Road C.S. 19043, Research Project 88 TI-1342, Office Memorandum, Michigan Department of Transportation, Lansing, Michigan.
5. Drakopoulos, A., T. H. Wenzel, S. F. Shober and R. B. Schmiedlin (1998), Comparison of Accident Experience Between Tined and Continuously Ground Portland Cement Concrete Pavements, Presented at the 77th Annual TRB Meeting Committee on Surface Properties – Vehicle Interaction (A2B07), TRB, National Research Council, Washington, D.C.
6. Hall, K., D. Dawood, S. Vanikar, R. Tally, T. Cackler, A. Correa, P. Deem, J. Duit, G. Geary, A. Gisi, A. Hanna, S. Kosmatka, R. Rasmussen, S. Tayabji and G. Voigt (2007), Long-Life Concrete Pavements in Europe and Canada. Publication FHWA-PL-07-027, FHWA, U.S. Department of Transportation.
7. Hall, J. W., L. T. Glover, K. L. Smith, L. D. Evans, J. C. Wambold, T. J. Yager and Z. Rado (2006), Guide for Pavement Friction. Project No. 1-43, Final Guide, National Cooperative Highway Research Program, Transportation Research Board, National Research Council, Washington, D.C.
8. Hanson, D.I. and B. D. Prowell (2004), “Evaluation of Circular Texture Meter for Measuring Macro texture of Pavements,” NCAT Report 04-05, National Center for Asphalt Technology, Auburn, Alabama.
9. Herman, L., J. Withers and E. Pinckney (2006), Surface Retexturing to Reduce Tire-Road Noise for Existing Concrete Pavements. In Transportation Research record: Journal of the Transportation Research Board, No.1983, Transportation Research Board of the National Academies, Washington, D.C., pp 51–58.
10. Marquette University, Noise and Texture on PCC Pavements – Results of a Multi-State Study, Copy distributed as ACPA Technorandum, American Concrete Pavement Association, Skokie, IL, 1998.
44
11. Mindess, S., and J. F. Young (1981), Concrete, Prentice-Hall, Inc., Englewood Cliffs, New Jersey.
12. Mosher, L. G (1985), Restoration of Final Surface to Concrete Pavement by Diamond Grinding. Presented at Third International Conference on Concrete Pavement Design and Rehabilitation, Purdue University, West Lafayette, Indiana.
13. Richter, C (1998), What Makes Portland Cement Concrete (PCC) Pavements Rough? Publication No. FHWA-RD-98-148, FHWA, U.S. Department of Transportation.
14. Rao, S., H. T. Yu M. I. and Darter (1999), The Longevity and Performance of Diamond-Ground Pavements. Research and Development Bulletin RD118, Portland Cement Association, Skokie, Illinois.
15. Scofield, L (2003), Arizona SR202 PCCP Whisper Grinding Test Sections Final Report. Arizona Department of Transportation, Technical Information, International Grinding and Grooving Association.
16. Snyder, M. B., M. J. Reiter, K. T. Hall, and M. I. Darter (1989), “Rehabilitation of Concrete Pavements, Volume I: Repair Rehabilitation Techniques,” Report, FHWA-RD-88-071, Federal Highway Administration, Washington, D.C.
17. Transtec Inc. (2004), CRCP in Texas Five Decades of Experience. Research Series No.11, Concrete Reinforcing Steel Institute.
18. Tyner, H. L (1981), Concrete Pavement Rehabilitation: Georgia Methodology. Proc., National Seminar on PCC Pavement Recycling and Rehabilitation. Report FHWA-TS-82-208. FHWA, U.S. Department of Transportation.
19. Vollor, T.W. and D. I Hanson (2006), Development of Laboratory Procedure for Measuring Friction of HMA Mixtures-Phase 1. NCAT Report 06-06, National Center of Asphalt Technology, Auburn University, Alabama.
20. Yu, H. T., K. D. Smith, M. I. Darter, J. Jiang and L. Khazanovichw (1997), Performance of Concrete Pavements Volume III—Improving Concrete Pavement Performance, Report FHWA-RD-95-111, Federal Highway Administration, Washington, D.C.
21. Zollinger, D.G., N. Buch, D. Xin and J. Soares (1999), Performance of CRC pavements. Publication FHWA-RD-97-151, FHWA, U.S. Department of Transportation.
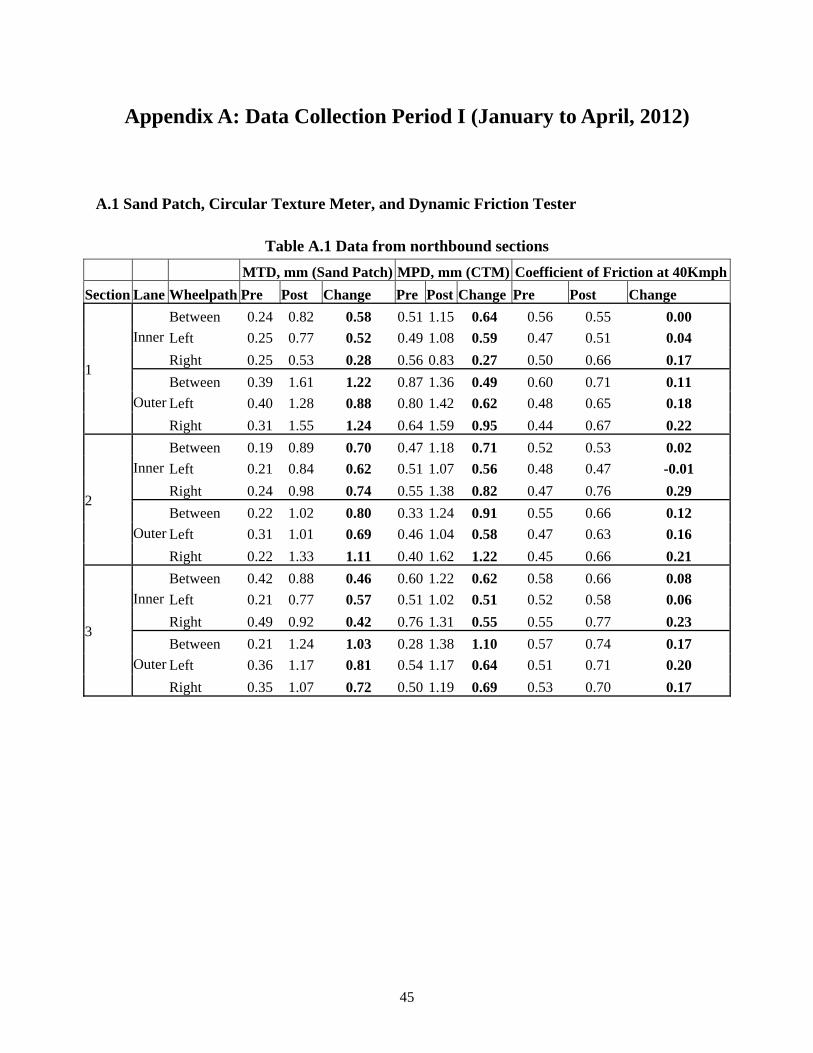
45
Appendix A: Data Collection Period I (January to April, 2012)
A.1 Sand Patch, Circular Texture Meter, and Dynamic Friction Tester
Table A.1 Data from northbound sections
MTD, mm (Sand Patch) MPD, mm (CTM) Coefficient of Friction at 40Kmph
Section Lane Wheelpath Pre Post Change Pre Post Change Pre Post Change
1
Inner Between 0.24 0.82 0.58 0.51 1.15 0.64 0.56 0.55 0.00
Left 0.25 0.77 0.52 0.49 1.08 0.59 0.47 0.51 0.04
Right 0.25 0.53 0.28 0.56 0.83 0.27 0.50 0.66 0.17
Outer Between 0.39 1.61 1.22 0.87 1.36 0.49 0.60 0.71 0.11
Left 0.40 1.28 0.88 0.80 1.42 0.62 0.48 0.65 0.18
Right 0.31 1.55 1.24 0.64 1.59 0.95 0.44 0.67 0.22
2
Inner Between 0.19 0.89 0.70 0.47 1.18 0.71 0.52 0.53 0.02
Left 0.21 0.84 0.62 0.51 1.07 0.56 0.48 0.47 -0.01
Right 0.24 0.98 0.74 0.55 1.38 0.82 0.47 0.76 0.29
Outer Between 0.22 1.02 0.80 0.33 1.24 0.91 0.55 0.66 0.12
Left 0.31 1.01 0.69 0.46 1.04 0.58 0.47 0.63 0.16
Right 0.22 1.33 1.11 0.40 1.62 1.22 0.45 0.66 0.21
3
Inner Between 0.42 0.88 0.46 0.60 1.22 0.62 0.58 0.66 0.08
Left 0.21 0.77 0.57 0.51 1.02 0.51 0.52 0.58 0.06
Right 0.49 0.92 0.42 0.76 1.31 0.55 0.55 0.77 0.23
Outer Between 0.21 1.24 1.03 0.28 1.38 1.10 0.57 0.74 0.17
Left 0.36 1.17 0.81 0.54 1.17 0.64 0.51 0.71 0.20
Right 0.35 1.07 0.72 0.50 1.19 0.69 0.53 0.70 0.17
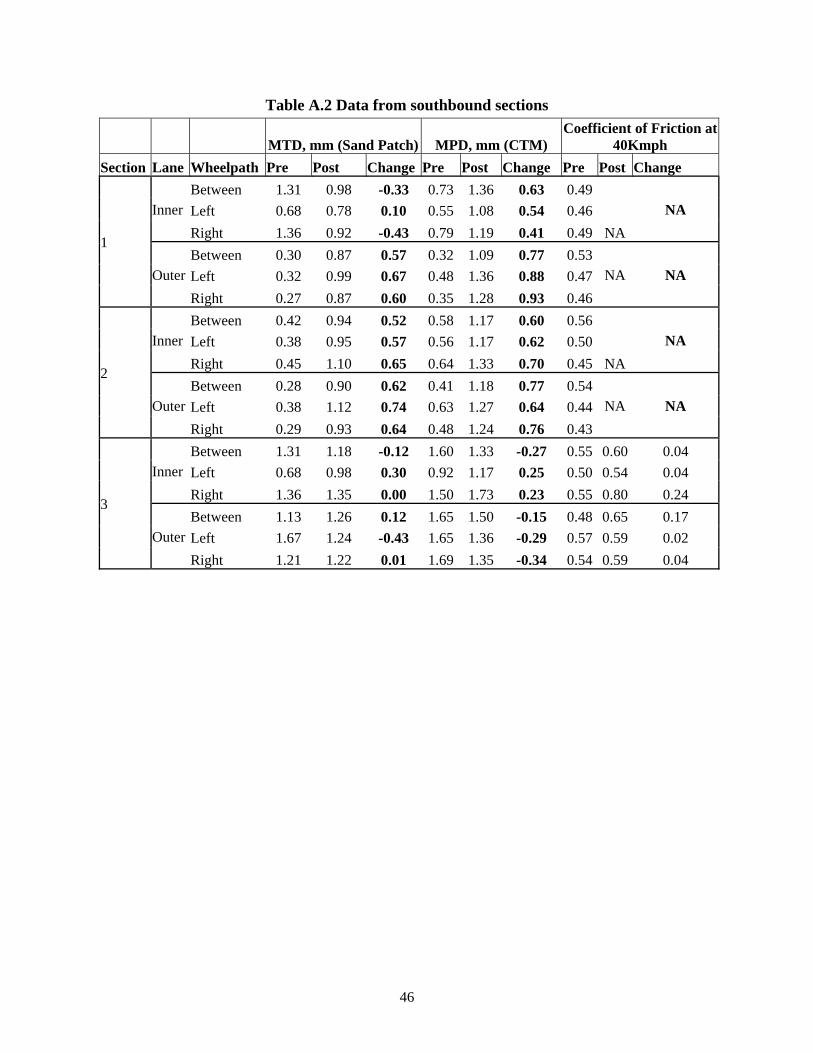
46
Table A.2 Data from southbound sections
MTD, mm (Sand Patch) MPD, mm (CTM)Coefficient of Friction at
40Kmph
Section Lane Wheelpath Pre Post Change Pre Post Change Pre Post Change
1
Inner Between 1.31 0.98 -0.33 0.73 1.36 0.63 0.49
NA
NA Left 0.68 0.78 0.10 0.55 1.08 0.54 0.46
Right 1.36 0.92 -0.43 0.79 1.19 0.41 0.49
Outer Between 0.30 0.87 0.57 0.32 1.09 0.77 0.53
NA NA Left 0.32 0.99 0.67 0.48 1.36 0.88 0.47
Right 0.27 0.87 0.60 0.35 1.28 0.93 0.46
2
Inner Between 0.42 0.94 0.52 0.58 1.17 0.60 0.56
NA
NA Left 0.38 0.95 0.57 0.56 1.17 0.62 0.50
Right 0.45 1.10 0.65 0.64 1.33 0.70 0.45
Outer Between 0.28 0.90 0.62 0.41 1.18 0.77 0.54
NA NA Left 0.38 1.12 0.74 0.63 1.27 0.64 0.44
Right 0.29 0.93 0.64 0.48 1.24 0.76 0.43
3
Inner Between 1.31 1.18 -0.12 1.60 1.33 -0.27 0.55 0.60 0.04
Left 0.68 0.98 0.30 0.92 1.17 0.25 0.50 0.54 0.04
Right 1.36 1.35 0.00 1.50 1.73 0.23 0.55 0.80 0.24
Outer Between 1.13 1.26 0.12 1.65 1.50 -0.15 0.48 0.65 0.17
Left 1.67 1.24 -0.43 1.65 1.36 -0.29 0.57 0.59 0.02
Right 1.21 1.22 0.01 1.69 1.35 -0.34 0.54 0.59 0.04
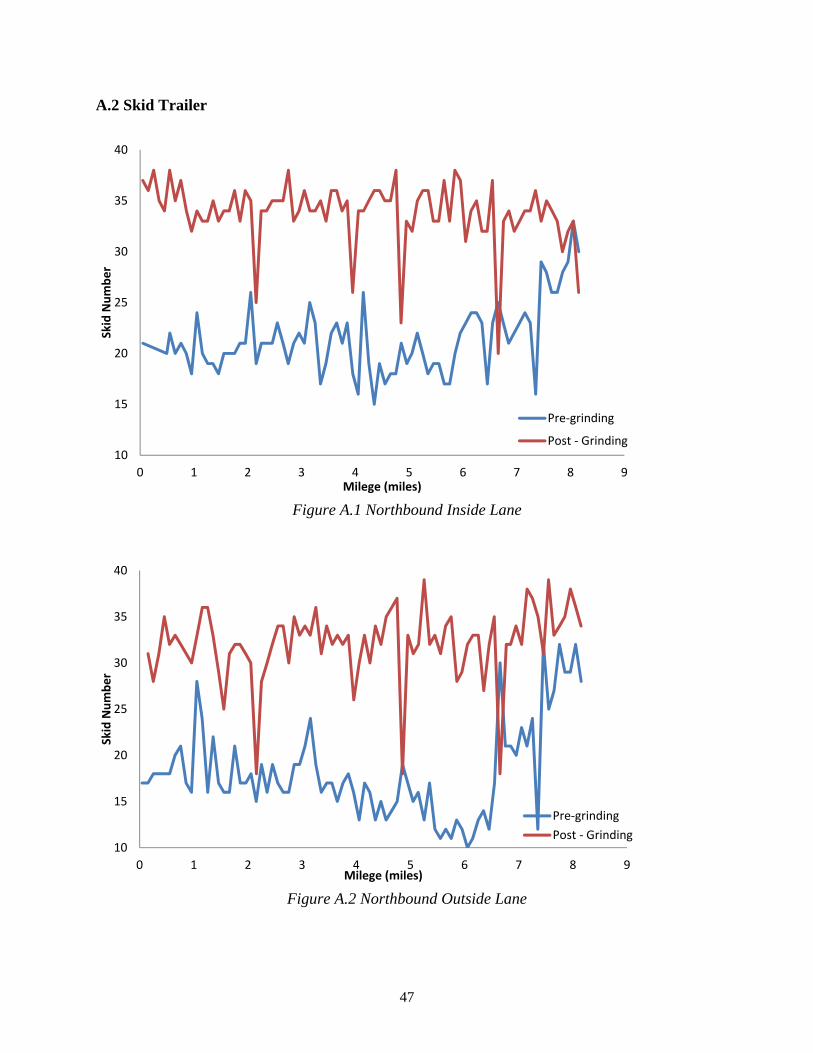
47
A.2 Skid Trailer
Figure A.1 Northbound Inside Lane
Figure A.2 Northbound Outside Lane
10
15
20
25
30
35
40
0 1 2 3 4 5 6 7 8 9
Skid
Num
ber
Milege (miles)
Pre-grinding
Post - Grinding
10
15
20
25
30
35
40
0 1 2 3 4 5 6 7 8 9
Skid
Num
ber
Milege (miles)
Pre-grindingPost - Grinding
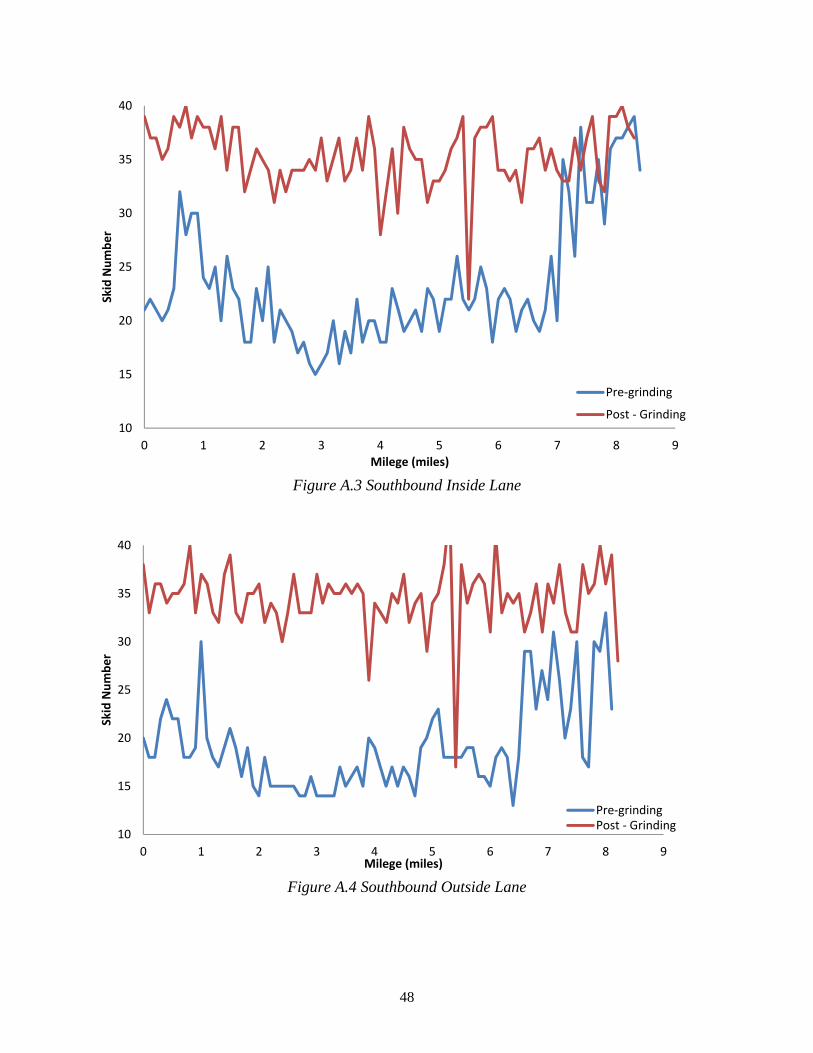
48
Figure A.3 Southbound Inside Lane
Figure A.4 Southbound Outside Lane
10
15
20
25
30
35
40
0 1 2 3 4 5 6 7 8 9
Skid
Num
ber
Milege (miles)
Pre-grinding
Post - Grinding
10
15
20
25
30
35
40
0 1 2 3 4 5 6 7 8 9
Skid
Num
ber
Milege (miles)
Pre-grindingPost - Grinding
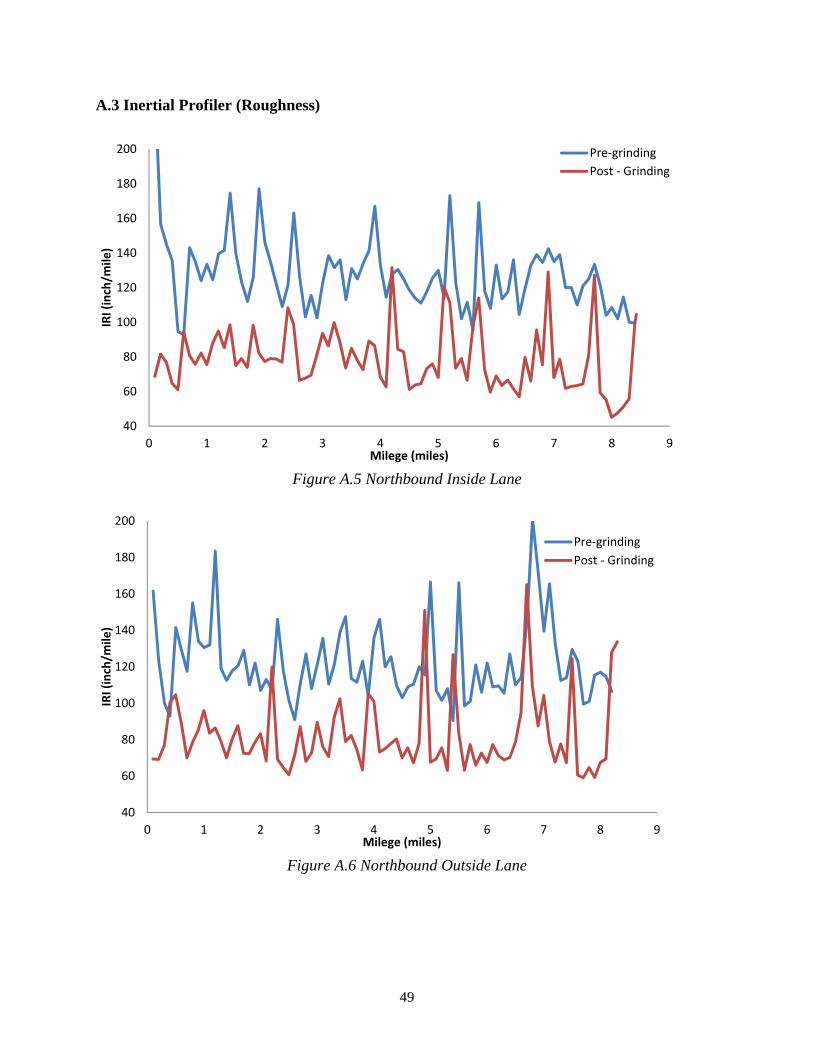
49
A.3 Inertial Profiler (Roughness)
Figure A.5 Northbound Inside Lane
Figure A.6 Northbound Outside Lane
40
60
80
100
120
140
160
180
200
0 1 2 3 4 5 6 7 8 9
IRI (
inch
/mile
)
Milege (miles)
Pre-grindingPost - Grinding
40
60
80
100
120
140
160
180
200
0 1 2 3 4 5 6 7 8 9
IRI (
inch
/mile
)
Milege (miles)
Pre-grindingPost - Grinding
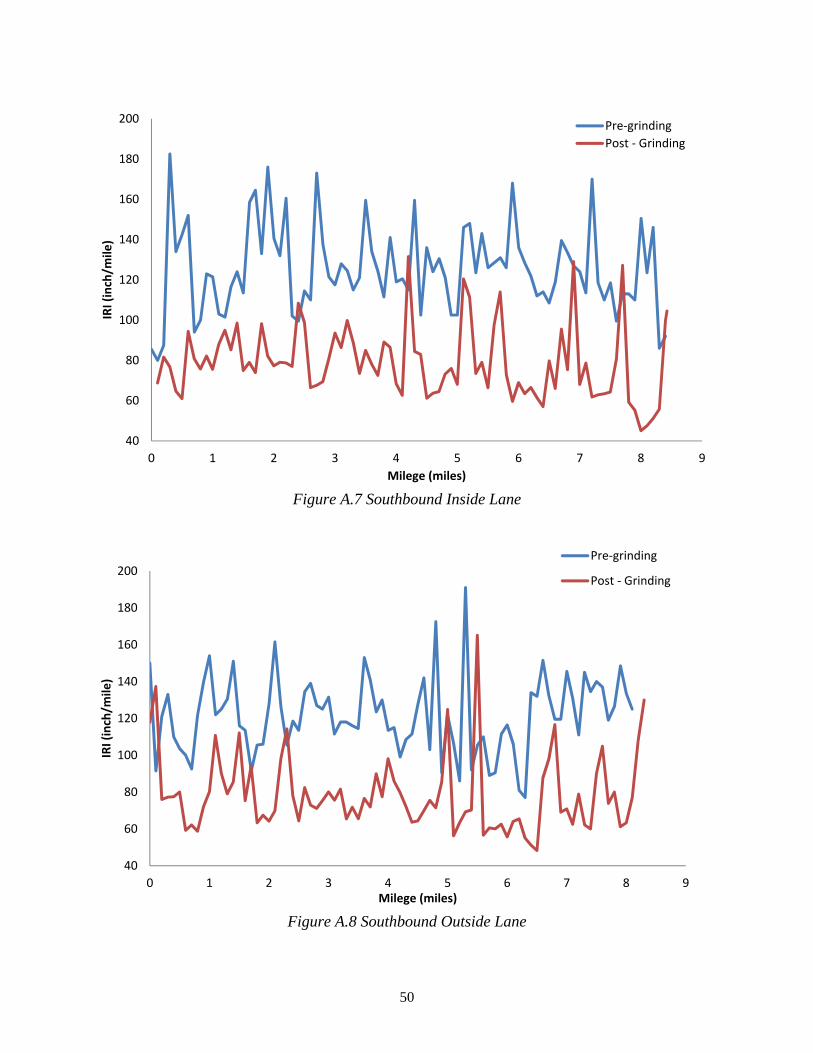
50
Figure A.7 Southbound Inside Lane
Figure A.8 Southbound Outside Lane
40
60
80
100
120
140
160
180
200
0 1 2 3 4 5 6 7 8 9
IRI (
inch
/mile
)
Milege (miles)
Pre-grindingPost - Grinding
40
60
80
100
120
140
160
180
200
0 1 2 3 4 5 6 7 8 9
IRI (
inch
/mile
)
Milege (miles)
Pre-grinding
Post - Grinding
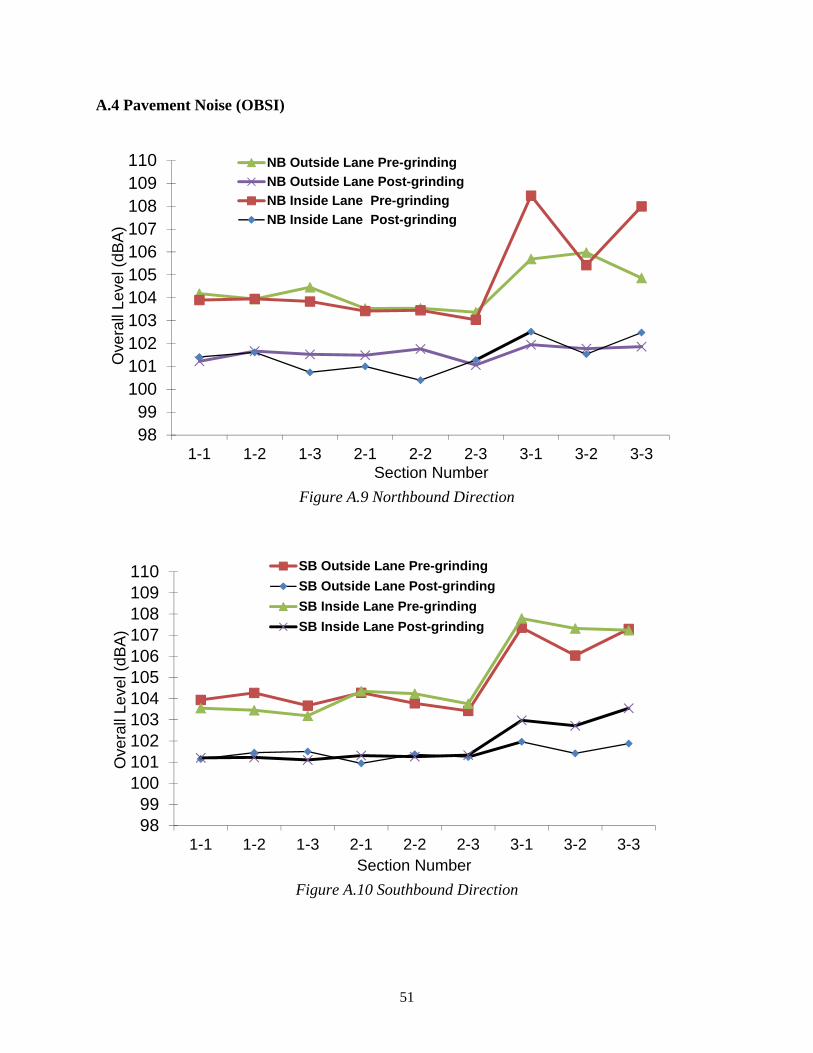
51
A.4 Pavement Noise (OBSI)
Figure A.9 Northbound Direction
Figure A.10 Southbound Direction
9899
100101102103104105106107108109110
1-1 1-2 1-3 2-1 2-2 2-3 3-1 3-2 3-3
Ove
rall
Leve
l (dB
A)
Section Number
NB Outside Lane Pre-grinding
NB Outside Lane Post-grinding
NB Inside Lane Pre-grinding
NB Inside Lane Post-grinding
9899
100101102103104105106107108109110
1-1 1-2 1-3 2-1 2-2 2-3 3-1 3-2 3-3
Ove
rall
Leve
l (dB
A)
Section Number
SB Outside Lane Pre-grinding
SB Outside Lane Post-grinding
SB Inside Lane Pre-grinding
SB Inside Lane Post-grinding

52
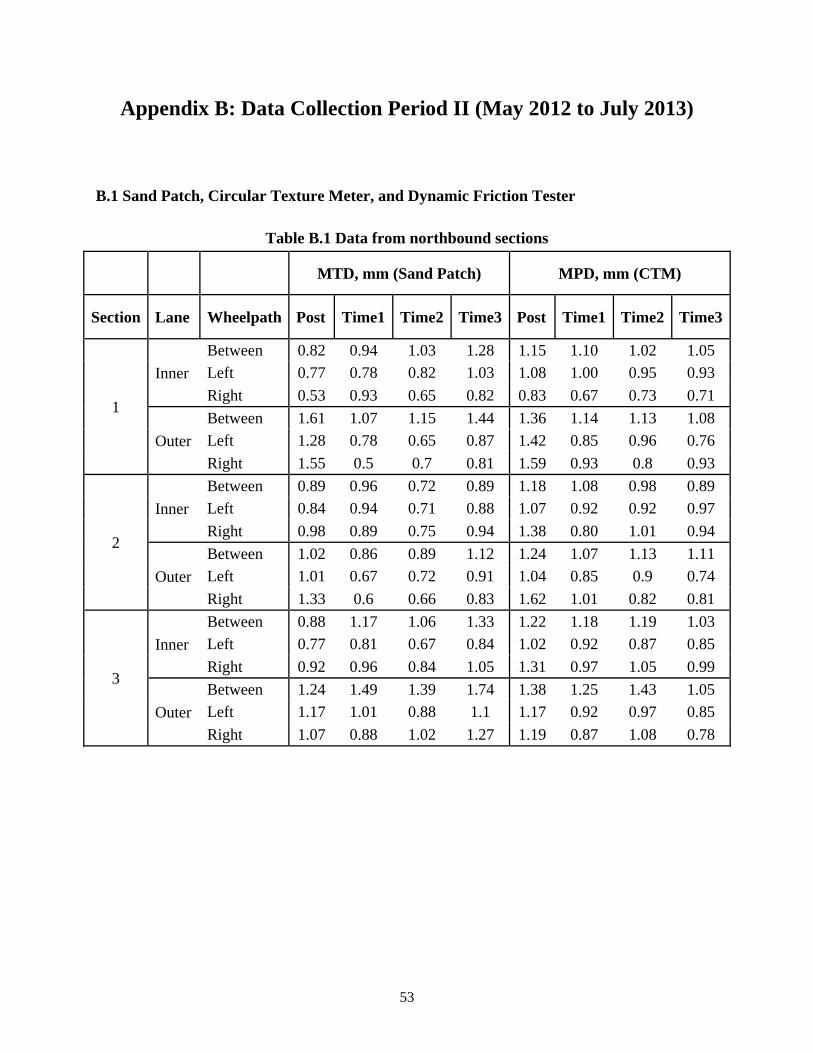
53
Appendix B: Data Collection Period II (May 2012 to July 2013)
B.1 Sand Patch, Circular Texture Meter, and Dynamic Friction Tester
Table B.1 Data from northbound sections
MTD, mm (Sand Patch) MPD, mm (CTM)
Section Lane Wheelpath Post Time1 Time2 Time3 Post Time1 Time2 Time3
1
Inner
Between 0.82 0.94 1.03 1.28 1.15 1.10 1.02 1.05
Left 0.77 0.78 0.82 1.03 1.08 1.00 0.95 0.93
Right 0.53 0.93 0.65 0.82 0.83 0.67 0.73 0.71
Outer
Between 1.61 1.07 1.15 1.44 1.36 1.14 1.13 1.08
Left 1.28 0.78 0.65 0.87 1.42 0.85 0.96 0.76
Right 1.55 0.5 0.7 0.81 1.59 0.93 0.8 0.93
2
Inner
Between 0.89 0.96 0.72 0.89 1.18 1.08 0.98 0.89
Left 0.84 0.94 0.71 0.88 1.07 0.92 0.92 0.97
Right 0.98 0.89 0.75 0.94 1.38 0.80 1.01 0.94
Outer
Between 1.02 0.86 0.89 1.12 1.24 1.07 1.13 1.11
Left 1.01 0.67 0.72 0.91 1.04 0.85 0.9 0.74
Right 1.33 0.6 0.66 0.83 1.62 1.01 0.82 0.81
3
Inner
Between 0.88 1.17 1.06 1.33 1.22 1.18 1.19 1.03
Left 0.77 0.81 0.67 0.84 1.02 0.92 0.87 0.85
Right 0.92 0.96 0.84 1.05 1.31 0.97 1.05 0.99
Outer
Between 1.24 1.49 1.39 1.74 1.38 1.25 1.43 1.05
Left 1.17 1.01 0.88 1.1 1.17 0.92 0.97 0.85
Right 1.07 0.88 1.02 1.27 1.19 0.87 1.08 0.78
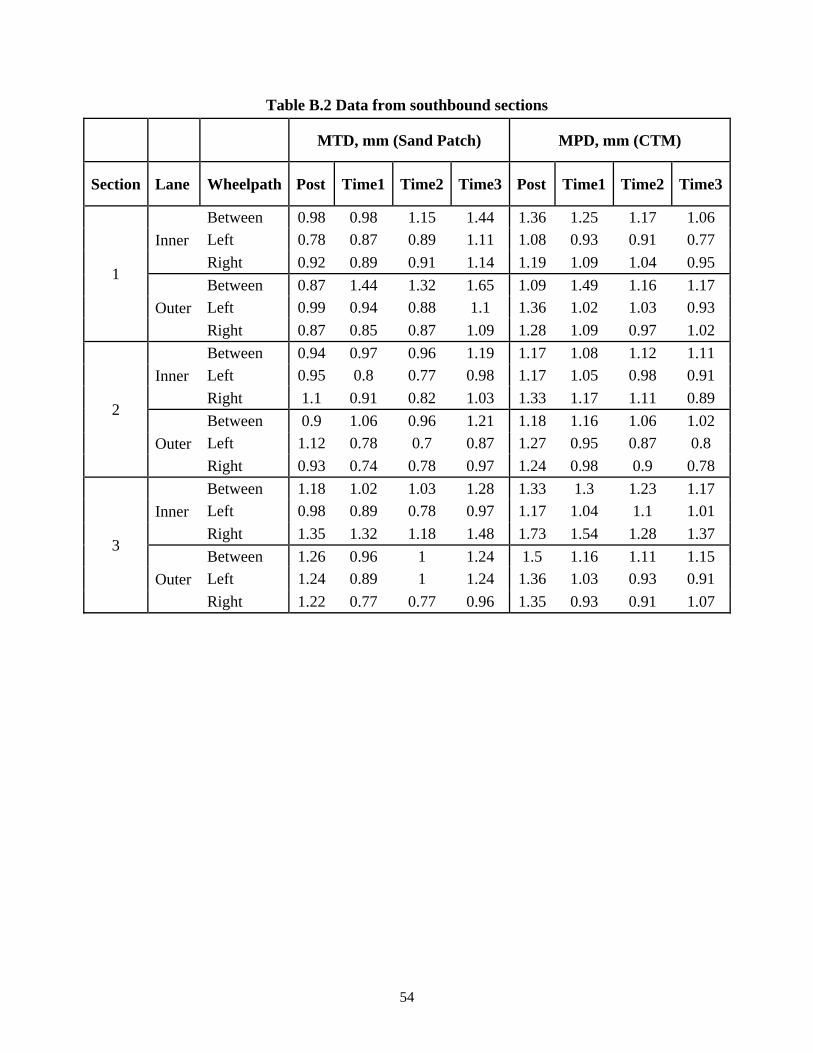
54
Table B.2 Data from southbound sections
MTD, mm (Sand Patch) MPD, mm (CTM)
Section Lane Wheelpath Post Time1 Time2 Time3 Post Time1 Time2 Time3
1
Inner
Between 0.98 0.98 1.15 1.44 1.36 1.25 1.17 1.06
Left 0.78 0.87 0.89 1.11 1.08 0.93 0.91 0.77
Right 0.92 0.89 0.91 1.14 1.19 1.09 1.04 0.95
Outer
Between 0.87 1.44 1.32 1.65 1.09 1.49 1.16 1.17
Left 0.99 0.94 0.88 1.1 1.36 1.02 1.03 0.93
Right 0.87 0.85 0.87 1.09 1.28 1.09 0.97 1.02
2
Inner
Between 0.94 0.97 0.96 1.19 1.17 1.08 1.12 1.11
Left 0.95 0.8 0.77 0.98 1.17 1.05 0.98 0.91
Right 1.1 0.91 0.82 1.03 1.33 1.17 1.11 0.89
Outer
Between 0.9 1.06 0.96 1.21 1.18 1.16 1.06 1.02
Left 1.12 0.78 0.7 0.87 1.27 0.95 0.87 0.8
Right 0.93 0.74 0.78 0.97 1.24 0.98 0.9 0.78
3
Inner
Between 1.18 1.02 1.03 1.28 1.33 1.3 1.23 1.17
Left 0.98 0.89 0.78 0.97 1.17 1.04 1.1 1.01
Right 1.35 1.32 1.18 1.48 1.73 1.54 1.28 1.37
Outer
Between 1.26 0.96 1 1.24 1.5 1.16 1.11 1.15
Left 1.24 0.89 1 1.24 1.36 1.03 0.93 0.91
Right 1.22 0.77 0.77 0.96 1.35 0.93 0.91 1.07
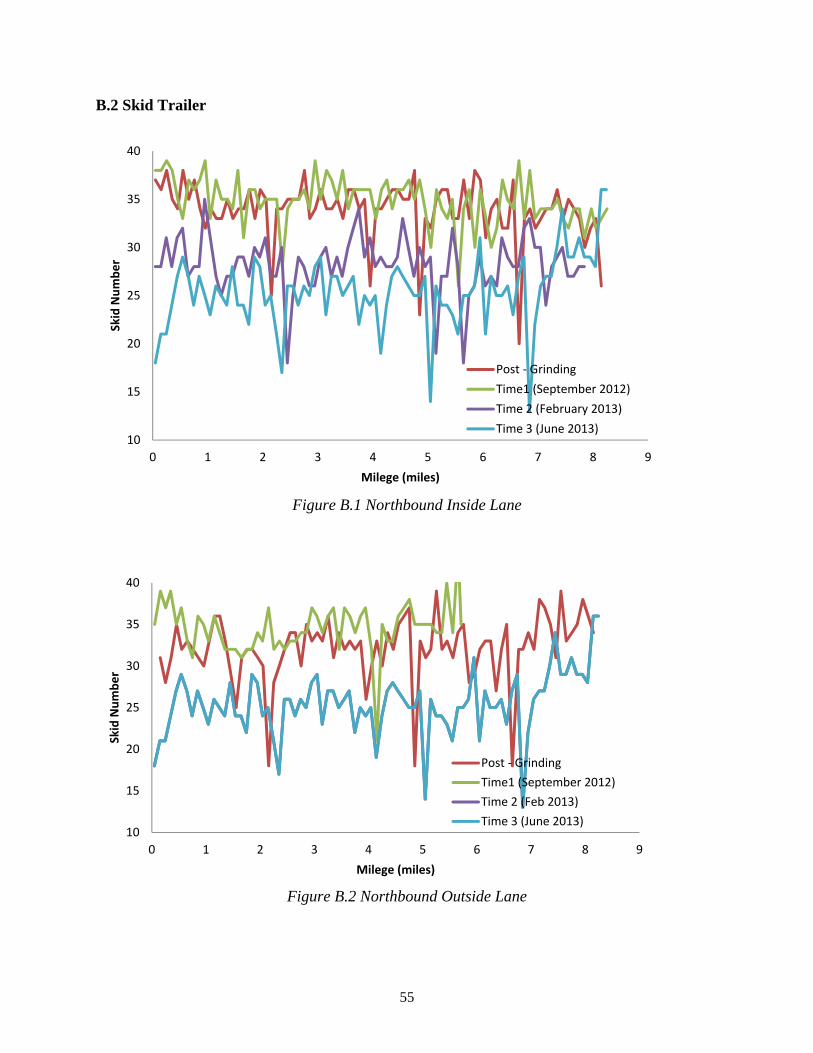
55
B.2 Skid Trailer
Figure B.1 Northbound Inside Lane
Figure B.2 Northbound Outside Lane
10
15
20
25
30
35
40
0 1 2 3 4 5 6 7 8 9
Skid
Num
ber
Milege (miles)
Post - GrindingTime1 (September 2012)Time 2 (February 2013)Time 3 (June 2013)
10
15
20
25
30
35
40
0 1 2 3 4 5 6 7 8 9
Skid
Num
ber
Milege (miles)
Post - GrindingTime1 (September 2012)Time 2 (Feb 2013)Time 3 (June 2013)
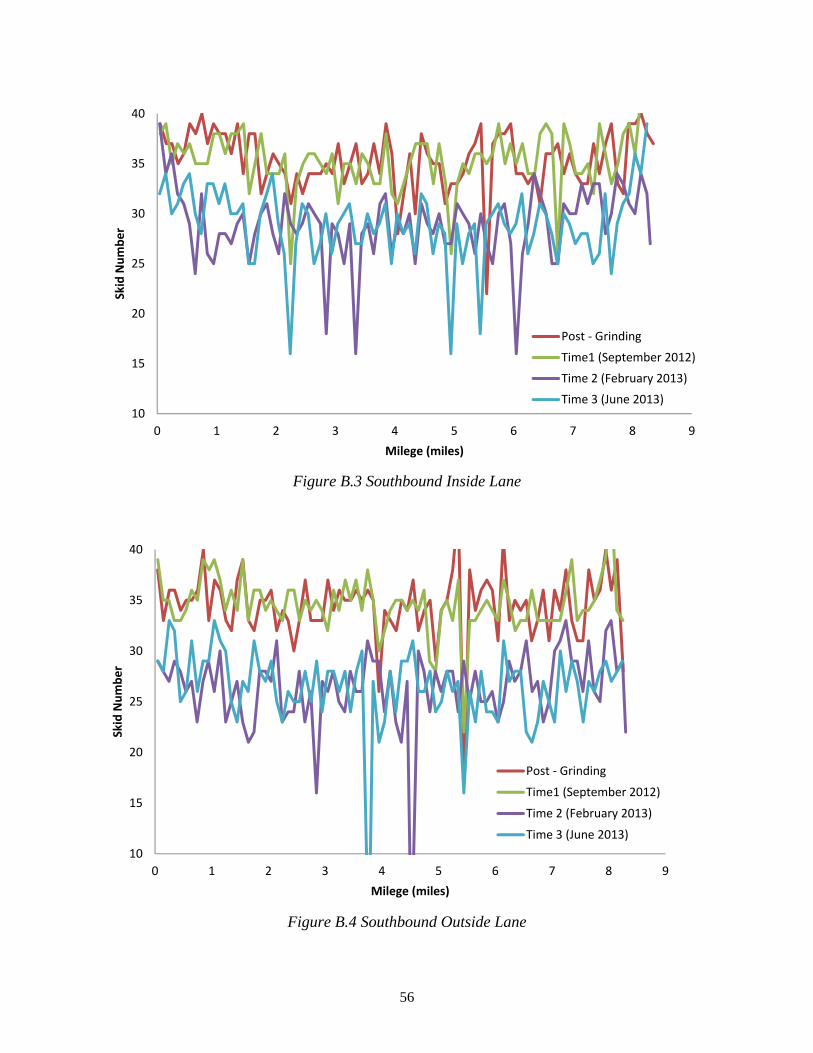
56
Figure B.3 Southbound Inside Lane
Figure B.4 Southbound Outside Lane
10
15
20
25
30
35
40
0 1 2 3 4 5 6 7 8 9
Skid
Num
ber
Milege (miles)
Post - GrindingTime1 (September 2012)Time 2 (February 2013)Time 3 (June 2013)
10
15
20
25
30
35
40
0 1 2 3 4 5 6 7 8 9
Skid
Num
ber
Milege (miles)
Post - Grinding
Time1 (September 2012)
Time 2 (February 2013)
Time 3 (June 2013)
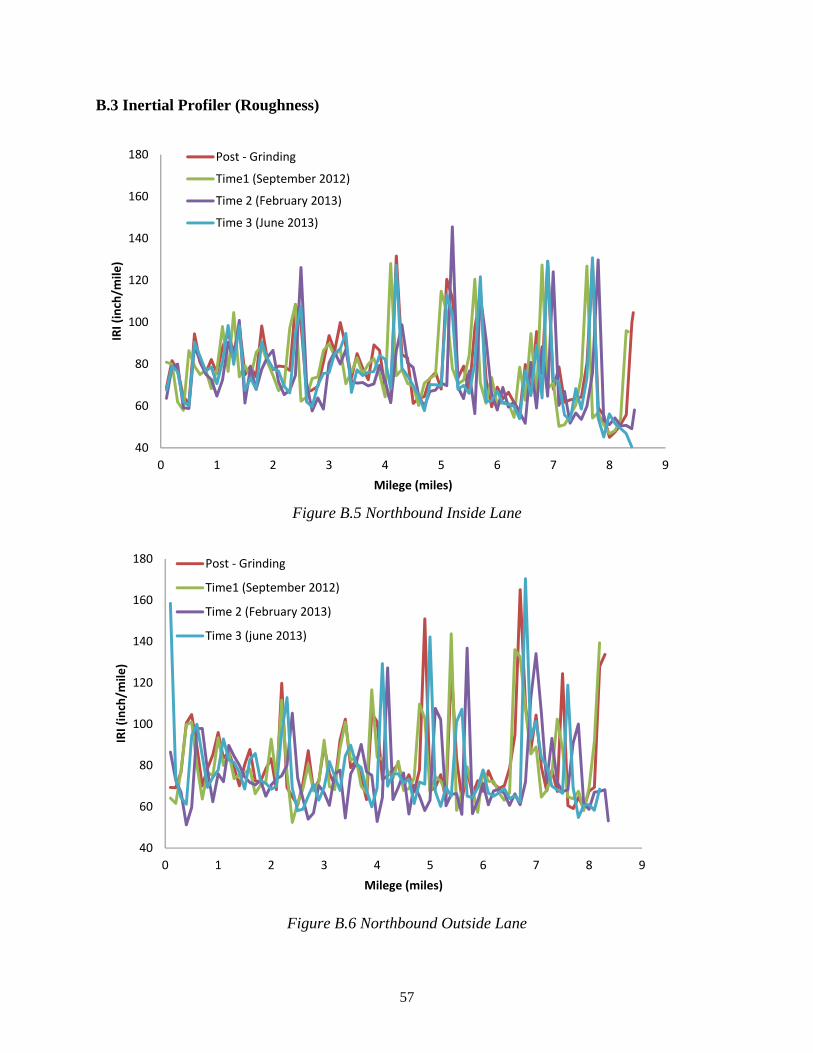
57
B.3 Inertial Profiler (Roughness)
Figure B.5 Northbound Inside Lane
Figure B.6 Northbound Outside Lane
40
60
80
100
120
140
160
180
0 1 2 3 4 5 6 7 8 9
IRI (
inch
/mile
)
Milege (miles)
Post - Grinding
Time1 (September 2012)
Time 2 (February 2013)
Time 3 (June 2013)
40
60
80
100
120
140
160
180
0 1 2 3 4 5 6 7 8 9
IRI (
inch
/mile
)
Milege (miles)
Post - Grinding
Time1 (September 2012)
Time 2 (February 2013)
Time 3 (june 2013)
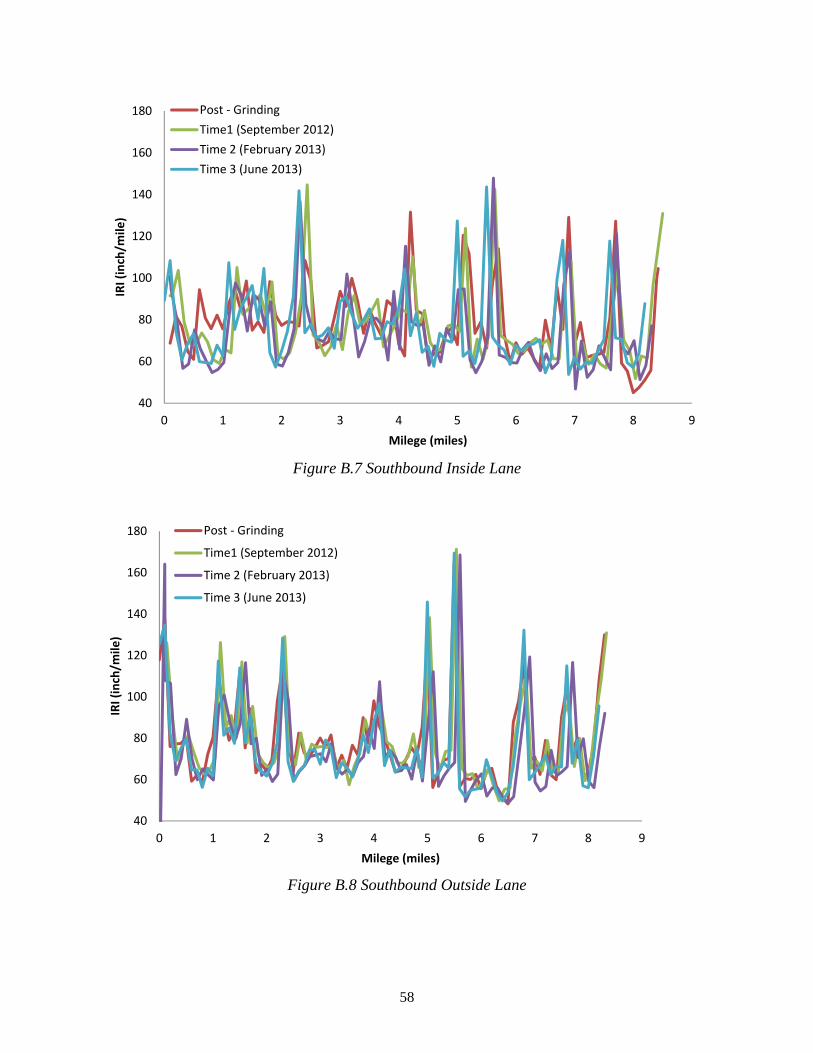
58
Figure B.7 Southbound Inside Lane
Figure B.8 Southbound Outside Lane
40
60
80
100
120
140
160
180
0 1 2 3 4 5 6 7 8 9
IRI (
inch
/mile
)
Milege (miles)
Post - GrindingTime1 (September 2012)Time 2 (February 2013)Time 3 (June 2013)
40
60
80
100
120
140
160
180
0 1 2 3 4 5 6 7 8 9
IRI (
inch
/mile
)
Milege (miles)
Post - Grinding
Time1 (September 2012)
Time 2 (February 2013)
Time 3 (June 2013)
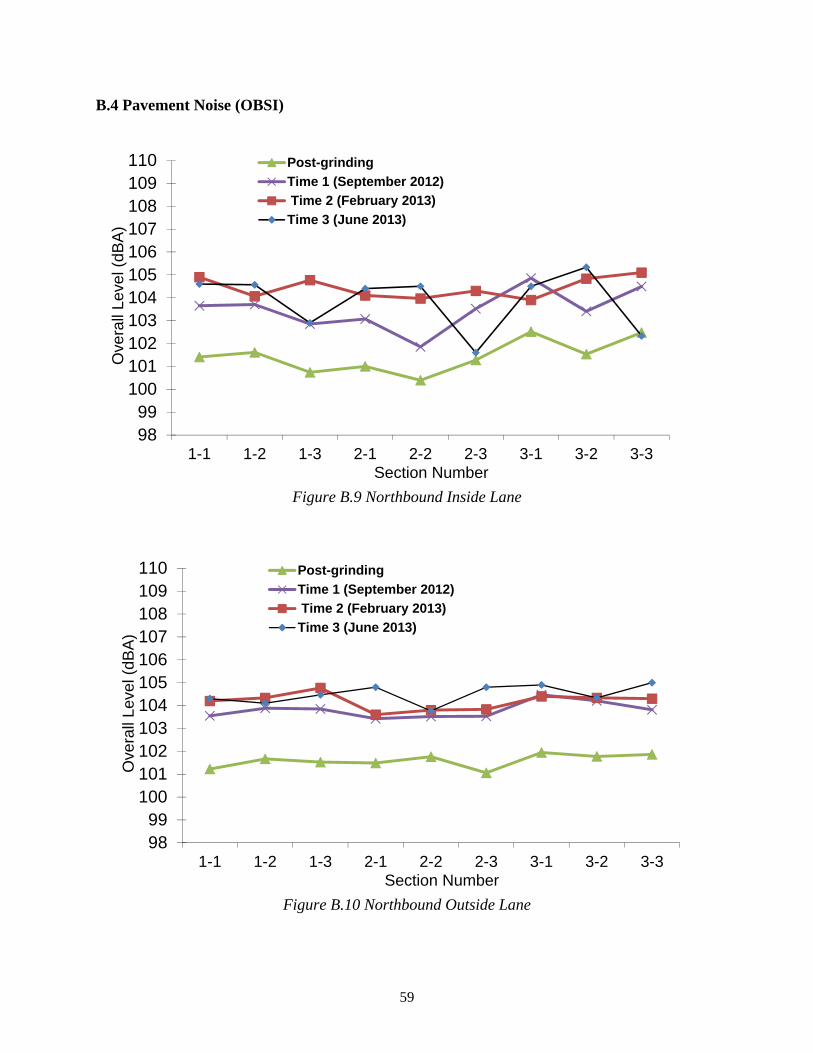
59
B.4 Pavement Noise (OBSI)
Figure B.9 Northbound Inside Lane
Figure B.10 Northbound Outside Lane
9899
100101102103104105106107108109110
1-1 1-2 1-3 2-1 2-2 2-3 3-1 3-2 3-3
Ove
rall
Leve
l (dB
A)
Section Number
Post-grinding
Time 1 (September 2012)
Time 2 (February 2013)
Time 3 (June 2013)
9899
100101102103104105106107108109110
1-1 1-2 1-3 2-1 2-2 2-3 3-1 3-2 3-3
Ove
rall
Leve
l (dB
A)
Section Number
Post-grinding
Time 1 (September 2012)
Time 2 (February 2013)
Time 3 (June 2013)
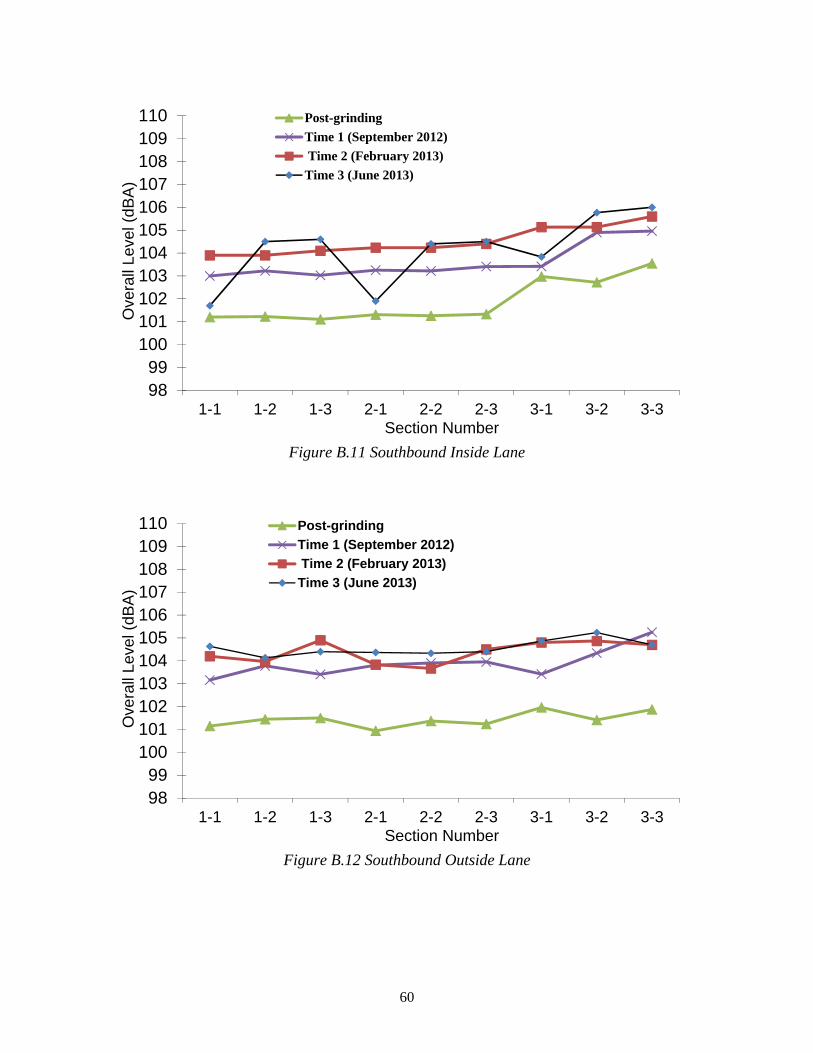
60
Figure B.11 Southbound Inside Lane
Figure B.12 Southbound Outside Lane
9899
100101102103104105106107108109110
1-1 1-2 1-3 2-1 2-2 2-3 3-1 3-2 3-3
Ove
rall
Leve
l (dB
A)
Section Number
Post-grinding
Time 1 (September 2012)
Time 2 (February 2013)
Time 3 (June 2013)
9899
100101102103104105106107108109110
1-1 1-2 1-3 2-1 2-2 2-3 3-1 3-2 3-3
Ove
rall
Leve
l (dB
A)
Section Number
Post-grinding
Time 1 (September 2012)
Time 2 (February 2013)
Time 3 (June 2013)