Embed Size (px)
Citation preview
Int. J. Mol. Sci. 2013, 14, 22449-22461; doi:10.3390/ijms141122449
International Journal of
Molecular Sciences ISSN 1422-0067
www.mdpi.com/journal/ijms
Article
Evaluation of the Comet Assay for Assessing the Dose-Response Relationship of DNA Damage Induced by Ionizing Radiation
Yan Wang 1,2,†, Chang Xu 1,2,†, Li Qing Du 1,2, Jia Cao 1,2, Jian Xiang Liu 3,4, Xu Su 3,4,
Hui Zhao 5, Fei-Yue Fan 1,2, Bing Wang 6, Takanori Katsube 6, Sai Jun Fan 1,2
and Qiang Liu 1,2,*
1 Institute of Radiation Medicine, Chinese Academy of Medical Sciences and Peking Union Medical
College, Tianjin 300192, China; E-Mails: [email protected] (Y.W.);
[email protected] (C.X.); [email protected] (L.Q.D.);
[email protected] (J.C.); [email protected] (F.-Y.F.); [email protected] (S.J.F.) 2 Tianjin Key Laboratory of Molecular Nuclear Medicine, First Clinical Department of Medical
Emergency Response Center for Nuclear Accidents, Ministry of Health, Tianjin 300192, China 3 National Institute for Radiological Protection and Nuclear Safety, Chinese Center for Disease Control,
Beijing 100088, China; E-Mails: [email protected] (J.X.L.); [email protected] (X.S.) 4 Medical Emergency Response Center for Nuclear Accidents, Ministry of Health,
Beijing 100088, China 5 Tianjin Key Laboratory of Food and Biotechnology, Tianjin University of Commerce,
Tianjin 300134, China; E-Mail: [email protected] 6 National Institute of Radiological Sciences, Chiba 263-8555, Japan;
E-Mails: [email protected] (B.W.); [email protected] (T.K.)
† These authors contributed equally to this work.
* Authors to whom correspondence should be addressed; E-Mail: [email protected];
Tel.: +86-22-8568-0279; Fax: +86-22-8568-3033.
Received: 4 September 2013; in revised form: 25 October 2013 / Accepted: 30 October 2013 /
Published: 14 November 2013
Abstract: Dose- and time-response curves were combined to assess the potential of the
comet assay in radiation biodosimetry. The neutral comet assay was used to detect DNA
double-strand breaks in lymphocytes caused by γ-ray irradiation. A clear dose-response
relationship with DNA double-strand breaks using the comet assay was found at different
times after irradiation (p < 0.001). A time-response relationship was also found within 72 h
after irradiation (p < 0.001). The curves for DNA double-strand breaks and DNA repair
OPEN ACCESS
Int. J. Mol. Sci. 2013, 14 22450
in vitro of human lymphocytes presented a nice model, and a smooth, three-dimensional
plane model was obtained when the two curves were combined.
Keywords: radiation; dose-response relationship; DNA damage; comet assay
1. Introduction
According to data reported by Turai [1], 134 deaths were registered after 420 radiation accidents
worldwide between 1944 and 2002. This number is certainly not the total, as it is likely that some
accidents worldwide (in particular those related to military or therapeutic use of radiation sources)
were not registered by organizations such as the International Atomic Energy Association (IAEA) or
the World Health Organization (WHO).
Since the “9/11” terrorist attack in America, people have become increasingly concerned that
radiation sources may be utilized by terrorists [1,2]. Additionally, the potential risk of radiation
accidents is increasing, especially in developing or politically disintegrating countries [3]. The
effective medical management of radiation overexposure incidents requires appropriate estimation of
the biological dose to aid the treating physician. Classical cytogenetic biodosimetry analysis includes
chromosome aberration (CA) and micronucleus (MN) assays [4]. The chromosome aberration assay
introduced by Bender and Gooch [5] remains the “gold standard” for early-response accident
biodosimetry and definitive dose assessment [6], but it is time-consuming for the purpose of rapid
response because the lymphocyte culturing process takes approximately 48 h to 72 h. Therefore, rapid
and sensitive methods are needed to assess the DNA damage induced by ionizing radiation.
The comet assay, also known as single-cell gel electrophoresis, which can detect DNA damage and
the repair kinetics at the level of a single cell, has been widely used in radiation biology, toxicology,
oncology, and molecular epidemiology in recent years [7–13]. The comet assay is a rapid and sensitive
microdosimetric technique that may be suitable for in vivo human biomonitoring, especially in cases of
incidental exposure to ionizing radiation [14–16]. To fit the dose- and time-response curves after
in vitro radiation, the difference in the number of DNA double-strand breaks (DSBs) in lymphocytes
between in vivo and in vitro radiation exposures should be studied first.
2. Results and Discussion
2.1. Differentiation of Apoptotic and Comet Cells
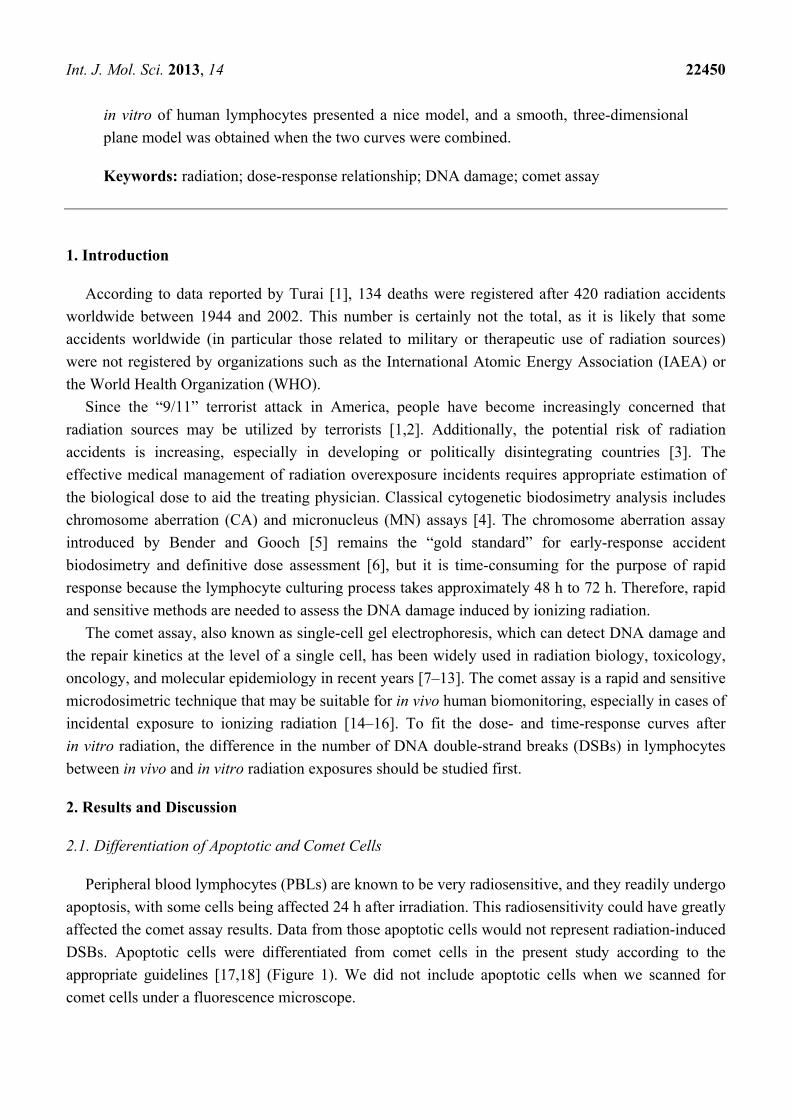
Peripheral blood lymphocytes (PBLs) are known to be very radiosensitive, and they readily undergo
apoptosis, with some cells being affected 24 h after irradiation. This radiosensitivity could have greatly
affected the comet assay results. Data from those apoptotic cells would not represent radiation-induced
DSBs. Apoptotic cells were differentiated from comet cells in the present study according to the
appropriate guidelines [17,18] (Figure 1). We did not include apoptotic cells when we scanned for
comet cells under a fluorescence microscope.
Int. J. Mol. Sci. 2013, 14 22451
Figure 1. Comparison of control, comet, and apoptotic cells based on fluorescence
microscopy [(A): Normal cell, a round cell without a tail; (B): Comet cell, a cell that
contains a tail and a head like a comet; and (C): Apoptotic cell, a cell with a large tail and a
small head)].
(A) (B) (C)
2.2. In Vivo and in Vitro Differences in DNA DSBs in Mouse Lymphocytes
There was no significant difference found in DNA DSBs between the in vivo and in vitro groups,
regardless of whether 1 or 2 Gy of irradiation was applied (Table 1, p > 0.05). The results of in vitro
irradiation may reflect the DNA damage induced after in vivo radiation exposure; therefore, the
dose-response curves of in vitro irradiation may reflect DNA damage after in vivo radiation exposure.
After mouse lymphocytes were exposed to radiation in vivo and in vitro and the lymphocytic DNA
DSBs were determined by the comet assay. As shown in Table 1, no significant difference was found
between the two groups. Therefore, we were able to describe the dose-response curve after in vitro
radiation, which reflected the DNA damage after in vivo radiation exposure.
Table 1. Comparison between the in vivo and in vitro DNA double-strand breaks (DSBs)
in mouse lymphocytes ( x ± SD).
Group N Control 1 Gy 2 Gy
in vivo in vitro p in vivo in vitro p in vivo in vitro p
Tail DNA (TDNA) % 6 5.8 ± 1.8 61 ± 2.1 0.27 31 ± 11.9 33 ± 10.7 0.16 39 ± 6.6 41 ± 7.8 0.40
Tail length (TL) (pix) 6 18.1 ± 5.2 19.9 ± 6.3 0.43 68.1 ± 27.1 70.1 ± 29.6 0.36 77.2 ± 15.2 79.4 ± 13.7 0.71
Tail moment (TM) 6 2.1 ± 0.6 2.6 ± 0.8 0.29 24.1 ± 9.2 25.1 ± 10.8 0.23 31.6 ± 13.2 34.7 ± 10.9 0.10
Olive tail moment (OTM) 6 1.9 ± 0.6 1.7 ± 0.8 0.18 13.6 ± 7.9 14.4 ± 6. 6 0.11 18.7 ± 6.46 19.2 ± 7.1 0.13
Note: pix: pixel, unit of TL.
2.3. DNA DSBs in Human Lymphocytes Induced by Radiation
The DNA DSBs in human lymphocytes were induced by irradiation with 137Cs γ-rays at a dose of
0–5 Gy. The DNA fragments migrated to the positive pole during electrophoresis, and a “comet” was
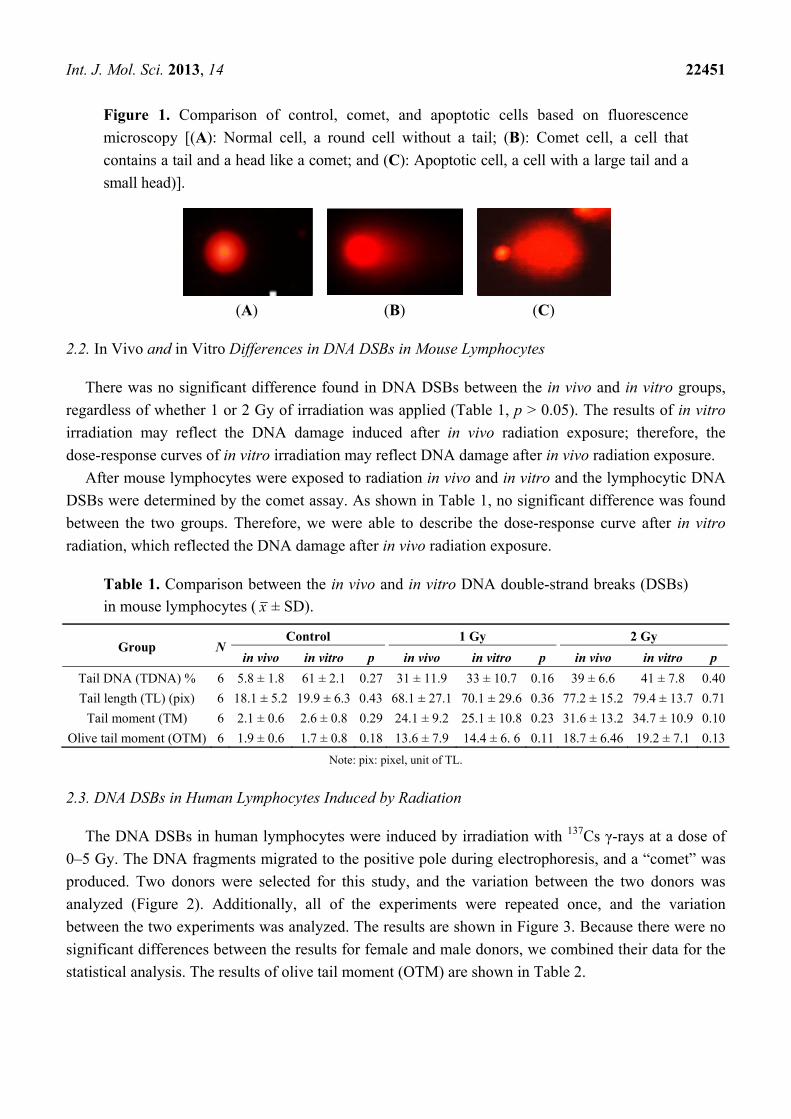
produced. Two donors were selected for this study, and the variation between the two donors was
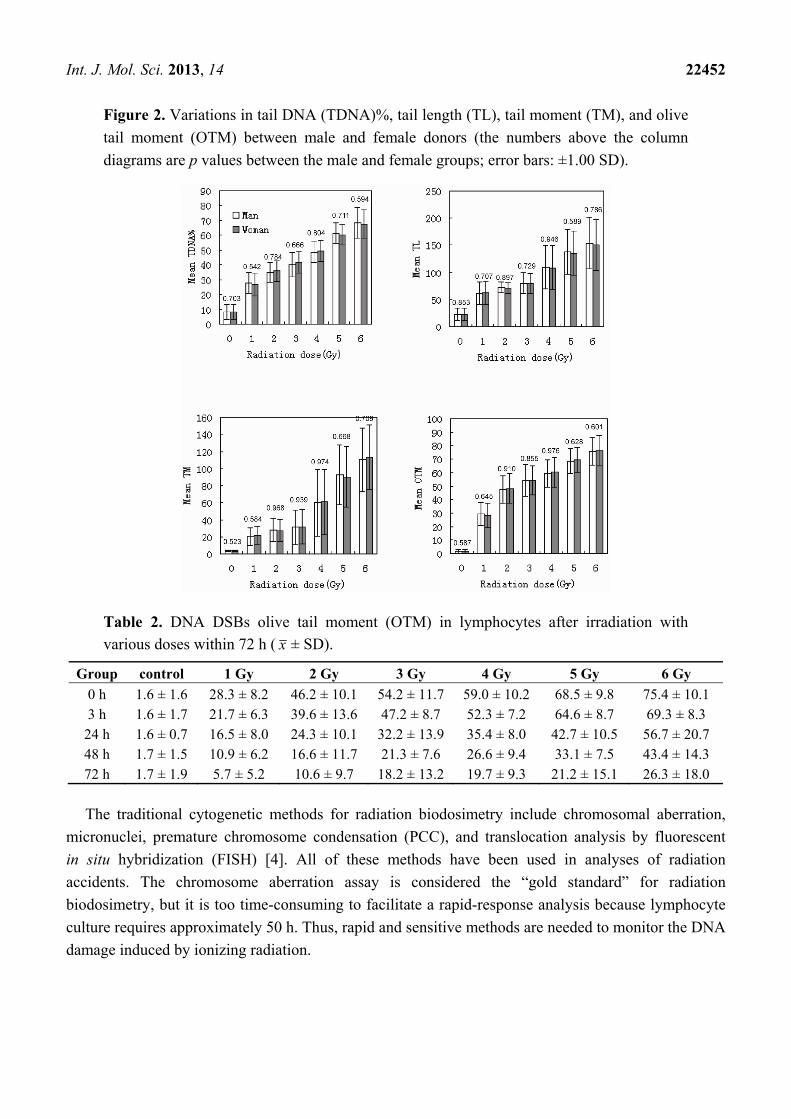
analyzed (Figure 2). Additionally, all of the experiments were repeated once, and the variation
between the two experiments was analyzed. The results are shown in Figure 3. Because there were no
significant differences between the results for female and male donors, we combined their data for the
statistical analysis. The results of olive tail moment (OTM) are shown in Table 2.
Int. J. Mol. Sci. 2013, 14 22452
Figure 2. Variations in tail DNA (TDNA)%, tail length (TL), tail moment (TM), and olive
tail moment (OTM) between male and female donors (the numbers above the column
diagrams are p values between the male and female groups; error bars: ±1.00 SD).
Table 2. DNA DSBs olive tail moment (OTM) in lymphocytes after irradiation with
various doses within 72 h ( x ± SD).
Group control 1 Gy 2 Gy 3 Gy 4 Gy 5 Gy 6 Gy
0 h 1.6 ± 1.6 28.3 ± 8.2 46.2 ± 10.1 54.2 ± 11.7 59.0 ± 10.2 68.5 ± 9.8 75.4 ± 10.1 3 h 1.6 ± 1.7 21.7 ± 6.3 39.6 ± 13.6 47.2 ± 8.7 52.3 ± 7.2 64.6 ± 8.7 69.3 ± 8.3
24 h 1.6 ± 0.7 16.5 ± 8.0 24.3 ± 10.1 32.2 ± 13.9 35.4 ± 8.0 42.7 ± 10.5 56.7 ± 20.7 48 h 1.7 ± 1.5 10.9 ± 6.2 16.6 ± 11.7 21.3 ± 7.6 26.6 ± 9.4 33.1 ± 7.5 43.4 ± 14.3 72 h 1.7 ± 1.9 5.7 ± 5.2 10.6 ± 9.7 18.2 ± 13.2 19.7 ± 9.3 21.2 ± 15.1 26.3 ± 18.0
The traditional cytogenetic methods for radiation biodosimetry include chromosomal aberration,
micronuclei, premature chromosome condensation (PCC), and translocation analysis by fluorescent
in situ hybridization (FISH) [4]. All of these methods have been used in analyses of radiation
accidents. The chromosome aberration assay is considered the “gold standard” for radiation
biodosimetry, but it is too time-consuming to facilitate a rapid-response analysis because lymphocyte
culture requires approximately 50 h. Thus, rapid and sensitive methods are needed to monitor the DNA
damage induced by ionizing radiation.
Int. J. Mol. Sci. 2013, 14 22453
Figure 3. Variations in TDNA%, TL, TM, and OTM between the first and second
experiments (the numbers above the column diagrams are p values between the first and
second experiments; error bars: ±1.00 SD).
2.4. Dose- and Time-Response Relationship of DNA DSBs
No significant difference was found between the male and female donors, and the same results were
found between the two experiments; therefore, we pooled all of the data into one database to describe
the dose-response relationship. The values of tail DNA (TDNA)%, tail length (TL), tail moment (TM),
and OTM increased with increasing radiation dose, demonstrating a clear dose-response relationship.
A comparison of the means of two optional groups revealed that the p values were all less than 0.01.
The column diagrams and error bars for TDNA%, TL, TM, and OTM are shown in Figure 4. Curve-fitting
was performed for OTM. The dose- and time-response curves are shown in Figures 5 and 6. Comet
images of lymphocytes after irradiation are shown in Figure 7. The three-dimensional plane model was
obtained when combining the dose- and time-response relationship of OTM obtained from the comet
assay within 72 h after irradiation (Figure 8).
Linear and linear-quadratic relationships are generally used for biodosimetry. It is easy to calculate
and estimate the radiation dose using linear and quadratic equations, but it is more difficult to calculate
the radiation dose using polynomial functions. However, polynomial functions can be used as
automated biodosimetry tools because they can be calculated easily using software [19,20]. In the
present study, the polynomial function relationship was selected because the R2 values (which
represent goodness of fit) of the equations were better than those of linear and quadratic curves.
Int. J. Mol. Sci. 2013, 14 22454
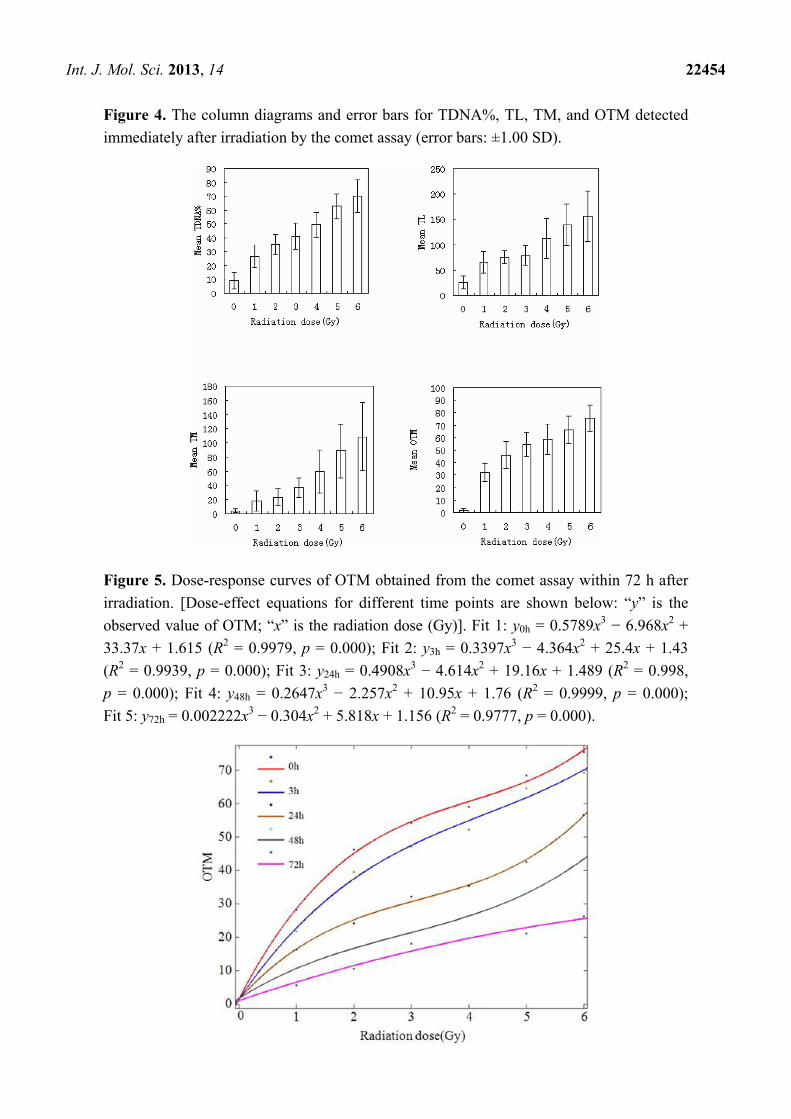
Figure 4. The column diagrams and error bars for TDNA%, TL, TM, and OTM detected
immediately after irradiation by the comet assay (error bars: ±1.00 SD).
Figure 5. Dose-response curves of OTM obtained from the comet assay within 72 h after
irradiation. [Dose-effect equations for different time points are shown below: “y” is the
observed value of OTM; “x” is the radiation dose (Gy)]. Fit 1: y0h = 0.5789x3 − 6.968x2 +
33.37x + 1.615 (R2 = 0.9979, p = 0.000); Fit 2: y3h = 0.3397x3 − 4.364x2 + 25.4x + 1.43
(R2 = 0.9939, p = 0.000); Fit 3: y24h = 0.4908x3 − 4.614x2 + 19.16x + 1.489 (R2 = 0.998,
p = 0.000); Fit 4: y48h = 0.2647x3 − 2.257x2 + 10.95x + 1.76 (R2 = 0.9999, p = 0.000);
Fit 5: y72h = 0.002222x3 − 0.304x2 + 5.818x + 1.156 (R2 = 0.9777, p = 0.000).
Int. J. Mol. Sci. 2013, 14 22455
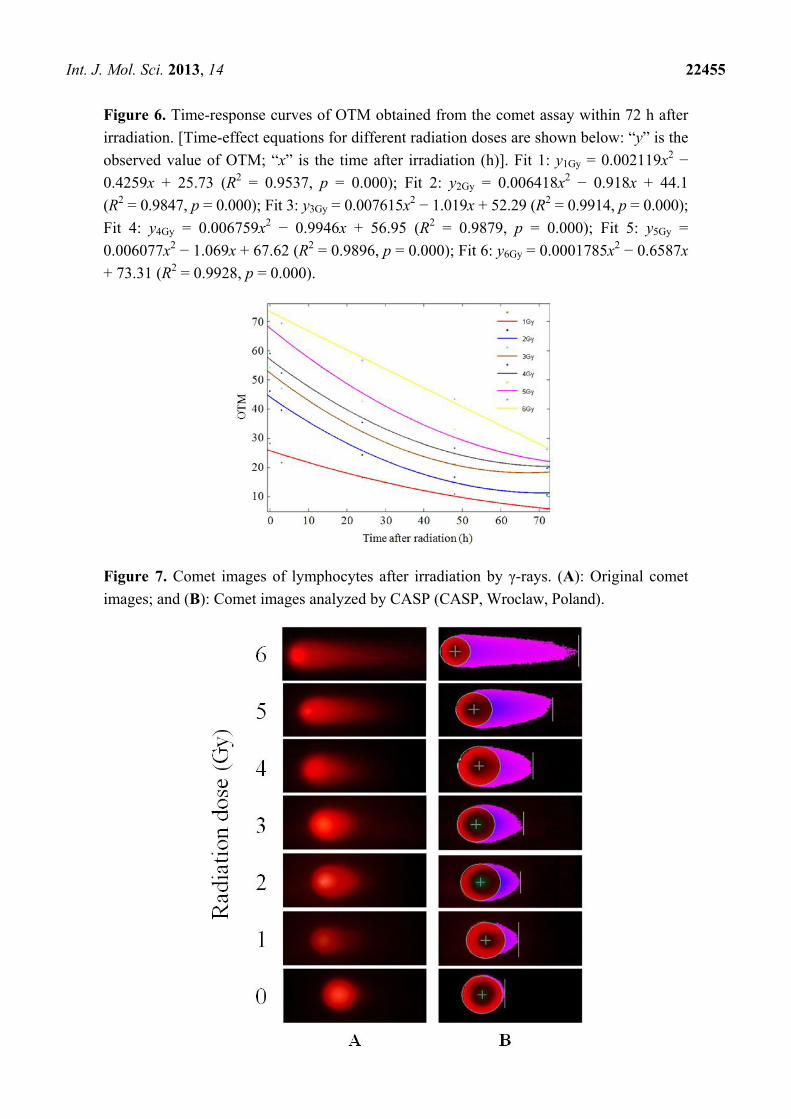
Figure 6. Time-response curves of OTM obtained from the comet assay within 72 h after
irradiation. [Time-effect equations for different radiation doses are shown below: “y” is the
observed value of OTM; “x” is the time after irradiation (h)]. Fit 1: y1Gy = 0.002119x2 −
0.4259x + 25.73 (R2 = 0.9537, p = 0.000); Fit 2: y2Gy = 0.006418x2 − 0.918x + 44.1
(R2 = 0.9847, p = 0.000); Fit 3: y3Gy = 0.007615x2 − 1.019x + 52.29 (R2 = 0.9914, p = 0.000);
Fit 4: y4Gy = 0.006759x2 − 0.9946x + 56.95 (R2 = 0.9879, p = 0.000); Fit 5: y5Gy =
0.006077x2 − 1.069x + 67.62 (R2 = 0.9896, p = 0.000); Fit 6: y6Gy = 0.0001785x2 − 0.6587x
+ 73.31 (R2 = 0.9928, p = 0.000).
Figure 7. Comet images of lymphocytes after irradiation by γ-rays. (A): Original comet
images; and (B): Comet images analyzed by CASP (CASP, Wroclaw, Poland).
Int. J. Mol. Sci. 2013, 14 22456
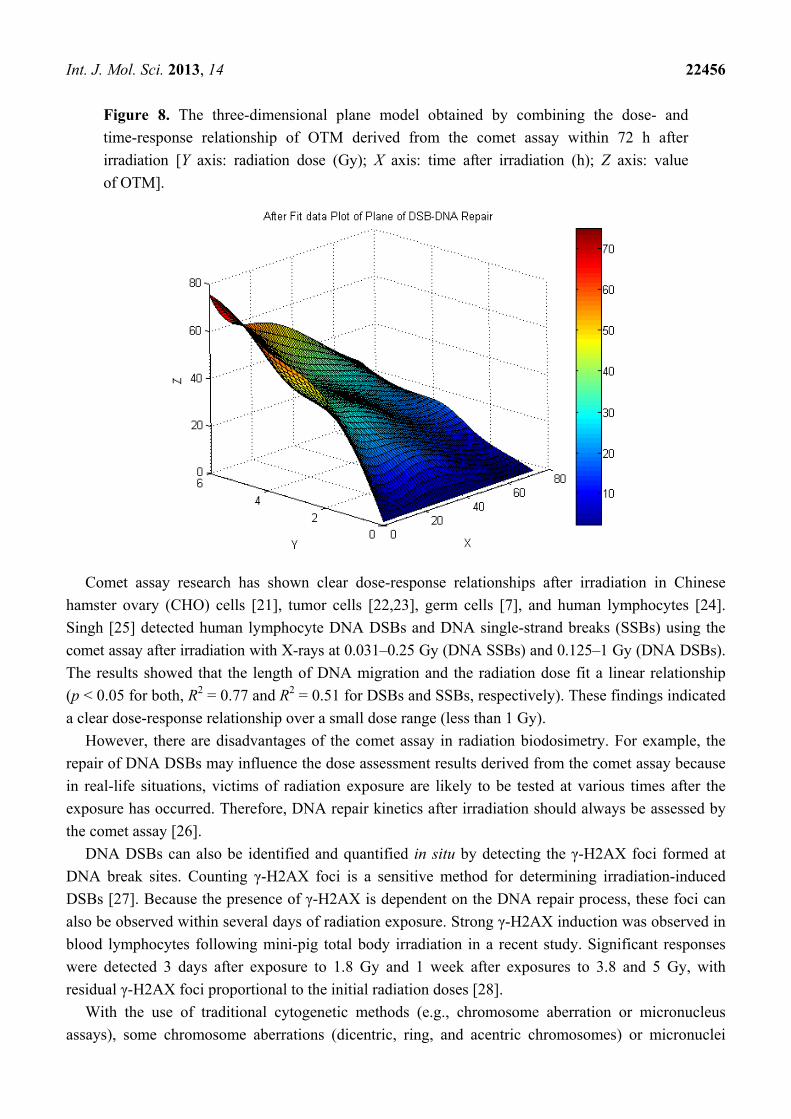
Figure 8. The three-dimensional plane model obtained by combining the dose- and
time-response relationship of OTM derived from the comet assay within 72 h after
irradiation [Y axis: radiation dose (Gy); X axis: time after irradiation (h); Z axis: value
of OTM].
Comet assay research has shown clear dose-response relationships after irradiation in Chinese
hamster ovary (CHO) cells [21], tumor cells [22,23], germ cells [7], and human lymphocytes [24].
Singh [25] detected human lymphocyte DNA DSBs and DNA single-strand breaks (SSBs) using the
comet assay after irradiation with X-rays at 0.031–0.25 Gy (DNA SSBs) and 0.125–1 Gy (DNA DSBs).
The results showed that the length of DNA migration and the radiation dose fit a linear relationship
(p < 0.05 for both, R2 = 0.77 and R2 = 0.51 for DSBs and SSBs, respectively). These findings indicated
a clear dose-response relationship over a small dose range (less than 1 Gy).
However, there are disadvantages of the comet assay in radiation biodosimetry. For example, the
repair of DNA DSBs may influence the dose assessment results derived from the comet assay because
in real-life situations, victims of radiation exposure are likely to be tested at various times after the
exposure has occurred. Therefore, DNA repair kinetics after irradiation should always be assessed by
the comet assay [26].
DNA DSBs can also be identified and quantified in situ by detecting the γ-H2AX foci formed at
DNA break sites. Counting γ-H2AX foci is a sensitive method for determining irradiation-induced
DSBs [27]. Because the presence of γ-H2AX is dependent on the DNA repair process, these foci can
also be observed within several days of radiation exposure. Strong γ-H2AX induction was observed in
blood lymphocytes following mini-pig total body irradiation in a recent study. Significant responses
were detected 3 days after exposure to 1.8 Gy and 1 week after exposures to 3.8 and 5 Gy, with
residual γ-H2AX foci proportional to the initial radiation doses [28].
With the use of traditional cytogenetic methods (e.g., chromosome aberration or micronucleus
assays), some chromosome aberrations (dicentric, ring, and acentric chromosomes) or micronuclei
Int. J. Mol. Sci. 2013, 14 22457
may remain in lymphocytes 72 h or longer after irradiation. In our experiments, radiation may have
induced altered chromatin metabolism leading to a significant number of temporary DSBs, that are not
labeled with γ-H2AX, yet detected as DSBs by the neutral comet assay. Additionally, apoptotic cells
were not included in the comet cell scoring in the present study.
In this study, we assessed the dose- and time-response relationship of DNA DSBs using the comet
assay within 72 h after 1–6 Gy irradiation. To assess the potential use of the comet assay in radiation
biodosimetry, the DNA repair kinetics should be considered in the dose-response curve. Therefore, we
combined the dose-effect curve and the DNA repair kinetics into one model to design the
three-dimensional plane model using the 3D difference calculation of the least squares method. This
model indicated that we successfully found a suitable mathematical model for in vitro DNA DSB
repair of human lymphocytes. Analysis software can be designed using this 3D plane model and used
to estimate the radiation dose within 72 h in the dose range of 1–6 Gy. Different parameters may
present different dose-response relationships at different doses or dose rate ranges. We focused on the
dose-response relationship of DNA DSBs in the high dose range (>1 Gy). We will evaluate
dose-response relationships by the comet assay following low-dose radiation exposures (<1 Gy) in
future studies.
3. Experimental Section
3.1. Mice, Reagents, and Equipment
Eighteen male Chinese Kunming mice were purchased from the animal center of the Chinese
Academy of Medical Science (age: 6–7 weeks; weight: 20 ± 2 g). The mice were randomly divided
into the following three groups: the control, 1 Gy, and 2 Gy groups.
Normal-melting-point agarose was obtained from Biowest Co. (Kansas, MO, USA), and
low-melting-point agarose was obtained from Promega Co. (Madison, WI, USA). Tris–HCl,
dimethyl sulfoxide (DMSO), and Triton X-100 were obtained from Sigma (St. Louis, MO, USA).
Lymphocyte separation medium (Lymphoprep) was obtained from Axis-Shield (Axis-Shield PoC,
Oslo, Norway). The horizontal-strip electrophoresis apparatus was obtained from Bio-Rad
(Bio Rad Laboratories Inc, Hercules, CA, USA). The 137Cs radiation source was obtained from Atomic
Energy Co. (Atomic Energy of Canadian Inc., Mississauga, ON, Canada). A Nikon 90i fluorescence
microscope was obtained from Nikon Co. (Tokyo, Japan). The comet slides were obtained from
Biocomet Co. (Biocomet, Nanning, Guangxi, China). The digital imaging system was purchased from
Union Science Inc. (Cherry Hill, NJ, USA). The Sanyo MCO-20AIC CO2 incubator was purchased
from Sanyo (Sakata, Japan).
3.2. Collection of Blood Samples and Selection of the Radiation Exposure Groups
A volume of 0.2 mL of peripheral blood was collected from each mouse via the orbital sinus using
a glass capillary, and all groups were anticoagulated with heparin. Then, the blood (in vitro) and
corresponding mouse (in vivo) were exposed at the same time to 137Cs at 1 or 2 Gy. Peripheral blood
was collected from each mouse for the second time after irradiation (in vivo).
Int. J. Mol. Sci. 2013, 14 22458
One healthy adult man and one healthy adult woman were selected for this study. Neither adult had
any history of smoking, excessive alcohol consumption, or exposure to radiation or any other industrial
poison. Peripheral blood was obtained from each donor in a 5 mL-tube containing heparin sodium. The
blood was then divided into eight parts for irradiation at various doses. The radiation doses were
0 (control group), 1, 2, 3, 4, 5, and 6 Gy. The absorbed dose rate was 0.8451 Gy/min. The comet assay
was performed immediately after each exposure. To assess the time-response relationship of DNA
repair, 7 mL of peripheral blood was required; then, each blood sample was divided equally into 7 parts
for irradiation at various doses (0, 1, 2, 3, 4, 5, and 6 Gy). The irradiated samples were then divided
equally into four parts for the detection of DNA DSBs at different time points (3, 24, 48, and 72 h after
irradiation) to assess the DNA repair kinetics. The blood samples were incubated in RPMI-1640
medium containing 20% bovine calf serum at 37 °C in a 5% CO2 incubator for 3, 24, 48, and 72 h for
further comet assay. Prior to the study, written informed consent was obtained from all of the subjects.
Because 40 min were required to prepare the lymphocytes in agarose for lysis from whole blood after
irradiation, resulting in some repair, this time point could not be considered t = 0 h. The t = 0 h group
consisted of lymphocytes isolated from whole blood and embedded in low-melting-point agarose on the
comet slides before irradiation. The comet slides were immersed in cold fresh lysis solution
immediately after irradiation. Using this procedure, we aimed to detect the DNA DSBs that were
reflective of the initial damage after exposure. The Institutional Animal Care and Use Committee of
Peking Union Medical College (PUMC) approved all of the experimental procedures used in this study.
3.3. Lymphocyte Isolation and Comet Assay
A volume of 0.15 mL of whole blood was carefully layered onto the lymphocyte separation
medium in a centrifugation tube at a ratio of 1:2. A gray layer of lymphocytes appeared between the
blood plasma and the lymphoprep after centrifugation for 2 min at 3500 rpm. The lymphocytes were
then carefully transferred to a 1.5-mL Eppendorf tube containing 1.2 mL of phosphate-buffered saline
(PBS, 0.1 M) and were centrifuged for 5 min at 2000 rpm. The lymphocytes were washed twice with
PBS. The cells were suspended in PBS, and the density was adjusted to 5–6 × 10⁴/mL. The cell
viability, as assessed by the Trypan blue test, was 98%, and the lymphocyte suspension was then
stored in a refrigerator at 4 °C.
The comet assay was performed under neutral conditions, as described by Banath et al. (1998) [29],
but with a slight modification; specifically, special comet slides were used rather than general slides.
There are gaps in comet slides to contain the agarose. Furthermore, much less agarose was used in the
procedure than originally described by Banath, yielding much thinner gel agarose to enable clearer
viewing under the fluorescence microscope. First, the comet slides was coated with 100 μL of
normal-melting-point agarose (0.075%); then, once the first agarose layer was coagulated, a mixture of
75 μL of low-melting-point agarose (0.075%) and 25 μL of lymphocyte suspension was applied as the
second layer. The comet slides were immersed in cold fresh lysis solution (2.5 M NaCl, 1% N-sodium
lauryl sarcosinate, 30 mM Na2EDTA, 10 mM Tris, 1% Triton X-100, 10% DMSO) for 1.5 h at 4 °C.
After lysis, they were placed in buffer for 20 min in a horizontal electrophoresis tank pre-filled with
cold fresh Tris-borate-EDTA buffer (TBE) to loosen the tight double-helical structure of DNA for
electrophoresis. Electrophoresis was then performed at 200 mA for 20 min in TBE buffer at room
Int. J. Mol. Sci. 2013, 14 22459
temperature. The slides were then rinsed twice with distilled water and were stained with ethidium
bromide (2 μg/mL). All of the above procedures were performed in the dark to avoid supernumerary
DNA damage. The comets were viewed using a Nikon 90i fluorescence microscope, and images of
100 comets were collected for each group using a digital imaging system. Cells that overlapped were not
counted. All of the comet images were analyzed using CASP software (CASP, Wroclaw, Poland) [30],
and the percentage of DNA in the comet tail (TDNA%), TL, TM, and the OTM were recorded to
characterize the lymphocytic DNA damage. All of the experiments were repeated once, and the
variation between experiments was analyzed.
3.4. Statistical Analysis
A paired-samples t test was used to compare the differences in DNA DSBs between the in vivo and
in vitro groups. Statistical analyses were performed using one-way analysis of variance (ANOVA),
and significance was assumed if p < 0.05. Matlab software, version 7.8 (MathWorks, Natick, MA,
USA), was used to fit the dose- and time-response (repair) curves, and the two curves were then
combined to design the three-dimensional plane model using the 3D difference calculation performed
using the least squares method.
4. Conclusions
We created a model for the repair of DNA damage within 72 h after 1–6 Gy irradiation. Curves of
DNA DSBs and DNA repair after different doses of radiation showed a linear relationship; therefore,
the 3D plane model may be useful for biodosimetry analysis of radiation-induced DNA damage.
Further studies should be performed to increase the practical value of the model in the estimation of
biological radiation doses.
Acknowledgments
This study was supported by the Special Foundation of the Ministry of Health (No. 201002009), the
National Natural Science Foundation of China (Nos. 31170804, 31240052, 31200634), the Natural
Science Foundation of Tianjin (Nos. 13JCYBJC23500, 13JCQNJC11600, 11ZCGYSY02400,
12JCYBJC15300, 12JCYBJC32900), and the PUMC Youth Fund and Fundamental Research Funds
for the Central Universities (Nos. 2012G01, 2012J05).
Conflicts of Interest
The authors declare no conflicts of interest.
References
1. Turai, I.; Veress, K.; Gunalp, B.; Souchkevitch, G. Medical response to radiation incidents and
radionuclear threats. Br. Med. J. 2004, 328, 568–572.
2. Helfand, I.; Forrow, L.; Tiwari, J. Nuclear terrorism. Br. Med. J. 2002, 324, 356–359.
3. Benger, J.R. Response to radiation incidents and radionuclear threats: Medical treatment should
be given only when safe to do so. Br. Med. J. 2004, 328, 1074.
Int. J. Mol. Sci. 2013, 14 22460
4. International Atomic Energy Agency. Cytogenetic Analysis for Radiation Dose Assessment: A
Manual; Technical Reports Series No. 405; International Atomic Energy Agency (IAEA):
Vienna, Austria, 2001; pp. 105–122.
5. Bender, M.A.; Gooch, P.C. Somatic chromosome aberrations induced by human whole-body
irradiation: The “Recuplex” criticality accident. Radiat. Res. 1966, 29, 568–582.
6. Waselenko, J.K.; MacVittie, T.J.; Blakely, W.F.; Pesik, N.; Wiley, A.L.; Dickerson, W.E.;
Tsu, H.; Confer, D.L.; Coleman, C.N.; Seed, T.; et al. Medical management of the acute radiation
syndrome: Recommendations of the strategic national stockpile radiation working group.
Ann. Intern. Med. 2004, 140, 1037–1051.
7. Haines, G.A.; Hendry, J.H.; Daniel, C.P.; Morris, I.D. Germ cell and dose-dependent DNA
damage measured by the comet assay in murine spermatozoaa after testicular X-irradiation.
Biol. Reprod. 2002, 67, 854–861.
8. Hoffmann, H.; Speit, G. Assessment of DNA damage in peripheral blood of heavy smokers with
the comet assay and the micronucleus test. Mutat. Res. 2005, 581, 105–114.
9. Paulraj, R.; Behari, J. Single strand DNA breaks in rat brain cells exposed to microwave radiation.
Mutat. Res. 2006, 596, 76–80.
10. Verde, P.E.; Geracitano, L.A.; Amado, L.L.; Rosa, C.E.; Bianchini, A.; Monserrat, J.M.
Application of public-domain statistical analysis software for evaluation and comparison of comet
assay data. Mutat. Res. 2006, 604, 71–82.
11. McKenna, D.J.; Doherty, B.A.; Downes, C.S.; McKeown, S.R.; McKelvey-Martin, V.J.
Use of the comet-FISH assay to compare DNA damage and repair in p53 and hTERT genes
following ionizing radiation. PLoS One 2012, 7, e49364.
12. Olive, P.L.; Banáth, J.P.; Durand, R.E. Heterogeneity in radiation-induced DNA damage and
repair in tumor and normal cells measured using the “comet” assay. Radiat. Res. 1990, 122, 86–94.
13. Seidel, C.; Lautenschläger, C.; Dunst, J.; Müller, A.C. Factors influencing heterogeneity of
radiation-induced DNA-damage measured by the alkaline comet assay. Radiat. Oncol. 2012, 7,
61, doi:10.1186/1748-717X-7-61.
14. Güerci, A.; Zúiga, L.; Marcos, R. Construction and validation of a dose-response curve using the
comet assay to determine human radiosensitivity to ionizing radiation. J. Toxicol. Environ. Health A
2011, 74, 1087–1093.
15. Garaj-Vrhovac, V.; Kopjar, N.; Razem, D.; Vekic, B.; Miljanic, S. Application of the alkaline
comet assay in biodosimetry: assessment of in vivo DNA damage in human peripheral leukocytes
after a gamma radiation incident. Radiat. Prot. Dosim. 2002, 98, 407–415.
16. Garcia, O. Mandina, T. DNA damage evaluated by the comet assay in lymphocytes of children
with 137Cs internal contamination caused by the Chernobyl accident. Mutat. Res. 2005, 565,
191–197.
17. Wada, S.; Khoa, T.V.; Kobayashi, Y.; Funayama, T.; Yamamoto, K.; Natsuhori, M.; Ito, N.
Detection of radiation-induced apoptosis using the comet assay. J. Vet. Med. Sci. 2003, 65,
1161–1166.
18. Yasuhara, S.; Zhu, Y.; Matsui, T.; Tipirneni, N.; Yasuhara, Y.; Kaneki, M.; Rosenzweig, A.;
Martyn, J.A. Comparison of comet assay, electron microscopy and flow cytometry for detection
of apoptosis. J. Histochem. Cytochem. 2003, 51, 873–885.
Int. J. Mol. Sci. 2013, 14 22461
19. Garty, G.; Chen, Y.; Salerno, A.; Turner, H.; Zhang, J.; Lyulko, O.; Bertucci. A.; Xu, Y.;
Wang, H.; Simaan, N.; et al. The RABIT: A rapid automated biodosimetry tool for radiological
triage. Health Phys. 2010, 98, 209–217.
20. Kinneberg, M; Lyulko, M.O.V. Applications of the Cytokinesis-Block Micronucleus Cytome
Assay on Human Lymphocytes: Construction of a Calibration Curve for use in the Rapid
Automated Biodosimetry Tool; Columbia University: New York, NY, USA, 2010.
21. Hu, Q.; Hill, R.P. Radiosensitivity, apoptosis and repair of DNA double-strand breaks in
radiation-sensitive Chinese hamster ovary cell mutants treated at different dose rates. Radiat. Res.
1996, 146, 636–645.
22. Qiu, L.M.; Li, W.J.; Pang, X.Y.; Gao, Q.X.; Feng, Y.; Zhou, L.B.; Zhang, G.H. Observation of
DNA damage of human hepatoma cells irradiated by heavy ions using comet assay.
World J. Gastroenterol. 2003, 9, 1450–1454.
23. Wada, S.; Kurahayashi, H.; Kobayashi, Y.; Funayama, T.; Yamamoto, K.; Natsuhori, M.; Ito, N.
The relationship between cellular radiosensitivity and radiation-induced DNA damage measured
by the comet assay. J. Vet. Med. Sci. 2003, 65, 471–477.
24. Rossler, U.; Hornhardt, S.; Seidl, C.; Muller-Laue, E.; Walsh, L.; Panzer, W.; Schmid, E.;
Senekowitsch-Schmidtke, R.; Gomolka, M. The sensitivity of the alkaline comet assay in
detecting DNA lesions induced by X-rays, γ-rays and α particles. Radiat. Prot. Dosim. 2006, 122,
154–159.
25. Singh, N.P. Microgels for estimation of DNA strand breaks, DNA protein crosslinks and
apoptosis. Mutat. Res. 2000, 455, 111–127.
26. Mozdarani, H.; Nasirian, B.; Haeri, S.A. In vivo γ-rays induced initial DNA damage and the effect
of famotidine in mouse leukocytes as assayed by the alkaline comet assay. J. Radiat. Res. 2007,
48, 129–134.
27. Redon, C.E.; Nakamura, A.J.; Sordet, O.; Dickey, J.S.; Gouliaeva, K.; Tabb, B.; Lawrence, S.;
Kinders, R.J.; Bonner, W.M.; Sedelnikova, O.A. γ-H2AX detection in peripheral blood
lymphocytes, splenocytes, bone marrow, xenografts, and skin. Methods Mol. Biol. 2011, 682,
249–270.
28. Moroni, M.; Maeda, D.; Whitnall, M.H.; Bonner, W.M.; Redon, C.E. Evaluation of the γ-H2AX
assay for radiation biodosimetry in a swine model. Int. J. Mol. Sci. 2013, 14, 14119–14135.
29. Banáth, J.P.; Fushiki, M.; Olive, P.L. Rejoining of DNA single- and double-strand breaks in
human white blood cells exposed to ionizing radiation. Int. J. Radiat. Biol. 1998, 73, 649–660.
30. Końca, K.; Lankoff, A.; Banasik, A.; Lisowska, H.; Kuszewski, T.; Góźdź, S.; Koza, Z.; Wojcik,
A. A cross-platform public domain PC image-analysis program for the comet assay. Mutat. Res.
2003, 534, 15–20.
© 2013 by the authors; licensee MDPI, Basel, Switzerland. This article is an open access article
distributed under the terms and conditions of the Creative Commons Attribution license
(http://creativecommons.org/licenses/by/3.0/).


![Comet Assay on Toxicogenetics; Several Studies in Recent Years … · 2020-03-06 · Comet Assay is technically simple, relatively, fast, cheap [2,5,15-20] and requiring only a small](https://img.pdfslide.net/doc/110x75/5f0c7e1e7e708231d435acd1/comet-assay-on-toxicogenetics-several-studies-in-recent-years-2020-03-06-comet.jpg)