Embed Size (px)
Citation preview

Evaluation of the Dutch Food Security Programme in Rwanda – including an impact study of the Catalist-2 Cassava project
Country case study for the food security evaluation for the Dutch Ministry of Foreign Affairs, the Netherlands
Evaluation of the Dutch Food Security Programme in Rwanda – including an impact study of the Catalist-2 Cassava project
Country case study for the food security evaluation for the Dutch Ministry of Foreign Affairs, the Netherlands
Final version Amsterdam, April 2017
List of Contributors
Amsterdam Institute for International Development
Chris Elbers (Team Leader)
Youdi Schipper (Principal Investigator, Evaluation FFS/CATALIST-2)
Emilie Berkhout (Junior Researcher, Evaluation FFS/CATALIST-2)
Melinda Vigh (Principal Investigator, Evaluation FFS/CATALIST-2)
Marijn van der List (Survey Manager, Evaluation FFS/CATALIST-2)
Stavros Malamas (Data Manager, Evaluation FFS/CATALIST-2)
Alexander Boers (Project Manager, Evaluation FFS/CATALIST-2)
PwC the Netherlands
Bas Warmenhoven (Project Coordinator and Lead Investigator of Rwanda Country Programme)
Lennart Konijnenberg (Quality Controller Rwanda Country Programme)
Pauline Mbundu (Researcher Rwanda Country Programme)
Hendrik Wiegand (Quality Controller Rwanda Country Programme at baseline)
Anne Marije Maters (Researcher Rwanda Country Programme at baseline)
PwC Rwanda
Richard Mugula (Focus Group Discussions Rwanda Country Programme)
Johnson Nyagah (Focus Group Discussions Rwanda Country Programme)
Carol Birungi (Focus Group Discussions Rwanda Country Programme)
Fiacre Makiriro (Focus Group Discussions Rwanda Country Programme)
Allype Ndayisaba (Focus Group Discussions Rwanda Country Programme)
PwC Belgium
Justine Comijn (Researcher Rwanda Country Programme at baseline)
University of Rwanda
Vincent Byusa (Field Research Coordinator, Evaluation FFS/CATALIST-2)
Foreword
This report presents results of an evaluation study of the Dutch food security programme for Rwanda 2012-
2015. The evaluation was commissioned by the Policy and Operations Department (IOB) of the Ministry of
Foreign Affairs in the Netherlands. The views and opinions in this evaluation report are those of the authors,
not necessarily those of the Ministry of Foreign Affairs or IOB.
The evaluation was made possible thanks to the support and information provided by a large number of
people. In particular, the evaluation team would like to thank Ferko Bodnar, IOB, at the Ministry of Foreign
Affairs in the Netherlands for the constructive support provided throughout the evaluation process, from the
baseline study in 2014 to the impact study in 2016. Rob Kuijpers, also at IOB, provided useful questions and
comments.
In addition, we would like to thank the staff at the Embassy of the Kingdom of the Netherlands in Kigali,
Rwanda, for their valuable contributions and time. John Veerkamp of the IFDC shared many insights about
the cassava sector and the CATALIST-2 programme and provided useful comments on early versions of the
report. Gervais Gashaka of the RAB provided an informative introduction to the Rwandan system of
inspection and regulation vis-a-vis new cassava varieties. John Twilingiyumukiza, the IBAKWE Programme
Coordinator, offered a detailed exposition and discussion of the IBAKWE programme implementation.
Vincent Byusa (National University of Rwanda) organised, trained and supervised a high quality team of
motivated field researchers and provided useful post-collection support.
Finally, we thank all the evaluation team members.
Amsterdam Institute for International Development: Chris Elbers, Melinda Vigh, Youdi Schipper, Emilie
Berkhout, Daniella Brals, Gerton Rongen, Alexander Boers
PwC The Netherlands: Bas Warmenhoven, Pauline Mbundu, Myrthe van den Berg, Yonne van der Horst, Lennart Konijnenberg, Hendrik Wiegand, Anton Koonstra (responsible partner)
PwC Belgium: Justine Comijn
PwC Rwanda: Richard Mugula, Johnson Nyagah, Carol Birungi, Fiacre Makiriro, Allype Ndayisaba, Florence W. Gatome
Table of Contents Executive Summary ......................................................................................................................................................... 9
1. Introduction .......................................................................................................................................................... 23
1.1 Scope of the evaluation ..................................................................................................................... 23
1.2 Structure of the report ...................................................................................................................... 25
2. Background: food security situation of Rwanda ................................................................................................... 27
2.1 Introduction ....................................................................................................................................... 27
2.1.1 Country Context ................................................................................................................................. 27
2.1.2 Food Security ..................................................................................................................................... 28
2.2 Food Insecurity Characteristics and Underlying Causes ..................................................................... 30
2.2.1 Characteristics of food insecure households ..................................................................................... 30
2.2.2 Women and child malnutrition ......................................................................................................... 33
2.2.3 Food insecurity characteristics and underlying causes ...................................................................... 34
2.2.4 Food insecurity trends 2012 – 2015 .................................................................................................. 39
2.3 National policy and programme related to food security .................................................................. 40
2.3.1 VISION 2020 ....................................................................................................................................... 40
2.3.2 Economic Development and Poverty Reduction Strategies (EDPRS I and II) ..................................... 40
2.3.3 Third Health Sector Strategic Plan 2012-2018 (HSSP III).................................................................... 41
2.3.4 Technical and Vocational Education and Training (TVET policies) .................................................... 41
2.3.5 Haute Intensité de Main d’Oeuvre or Labour Intensive Public Works (HIMO) ................................. 42
2.3.6 National Food and Nutrition Policy (NFNP) and National Food and Nutrition Strategy Plan (NFNSP) ........................................................................................................................................................... 43
2.3.7 National Rice development strategy (NRDS) ..................................................................................... 43
2.3.8 Compact 2025 Rwanda ...................................................................................................................... 44
2.4 Programmes of the main other donors in the country....................................................................... 48
2.5 Summary............................................................................................................................................ 49
3. Evaluation of the project portfolio ........................................................................................................................ 50
3.1 Description evaluation questions ....................................................................................................... 50
3.2 Approach portfolio evaluation ........................................................................................................... 51
3.3 Composition and motivation of the Dutch food security programme 2012-2015 (evaluation question 1) ........................................................................................................................................ 54
3.3.1 Overview & strategy EKN projects in food security portfolio ............................................................ 54
3.3.2 Link between Dutch strategy and broader analysis food security Rwanda ....................................... 60
3.3.3 Synthesis of the followed impact pathways ...................................................................................... 61
2
3.4 Instruments, coherence and synergy (evaluation question 2) .......................................................... 65
3.4.1 Instruments and channels ................................................................................................................. 65
3.4.2 Synergies between centrally and decentrally managed projects ...................................................... 68
3.4.3 Synergies between the Dutch food security programme and food security-related activities of GoR .................................................................................................................................................... 69
3.4.4 Synergies between the Dutch food security programme and other Dutch policies and programmes ...................................................................................................................................... 70
3.5 Effectiveness of the programme (evaluation question 3) ................................................................... 70
3.5.1 Project-level effectiveness ................................................................................................................. 71
3.5.2 Contribution analysis .......................................................................................................................106
3.5.3 Level of food security improvement ................................................................................................110
3.5.4 Evidence that food insecure people have been reached .................................................................111
3.6 Costs and efficiency programme (evaluation question 4) ...............................................................117
3.6.1 Direct and indirect beneficiaries ......................................................................................................117
3.6.2 Relation project expenditure and beneficiaries ...............................................................................120
3.6.3 Value of effects per beneficiary and cost-effectiveness ..................................................................126
3.7 Sustainability of the programme ......................................................................................................127
3.8 Unplanned, positive or negative, effects of the programme ...........................................................129
4. Quantitative Impact Analysis ..............................................................................................................................131
4.1 Introduction .....................................................................................................................................131
4.2 Context of CATALIST-2 .....................................................................................................................132
4.2.1 Cassava production in the programme areas ..................................................................................132
4.2.2 Cassava related diseases .................................................................................................................133
4.3 The CATALIST-2 programme ............................................................................................................134
4.3.1 Programme outline ..........................................................................................................................134
4.3.2 Programme logic..............................................................................................................................135
4.3.3 Field implementation detail ............................................................................................................141
4.3.4 Beneficiary feedback: Focus Group Discussions ..............................................................................144
4.4 Methodology ...................................................................................................................................146
4.4.1 Evaluation questions and indicators................................................................................................146
4.4.2 Identification strategy .....................................................................................................................147
4.4.3 Sampling and data collection ..........................................................................................................150
4.4.4 Sampling weights .............................................................................................................................152
4.5 Descriptives .....................................................................................................................................153
4.5.1 Community and household characteristics .....................................................................................153
3
4.5.2 Programme exposure ......................................................................................................................157
4.5.3 Selection into treatment .................................................................................................................161
4.6 Impact analysis ................................................................................................................................163
4.6.1 Adoption of ISFM farming practices ................................................................................................164
4.6.2 Cassava production: output, land use, yields ..................................................................................169
4.6.3 Other crop yields .............................................................................................................................174
4.6.4 Value chain indicators .....................................................................................................................175
4.6.5 Income and household welfare .......................................................................................................176
4.6.6 Food security and nutrition .............................................................................................................178
4.6.7 Access to credit: impact analysis of Business-Financial training .....................................................186
4.6.8 IBAKWE interventions and cooperation membership interaction effects ......................................188
4.7 Sensitivity analysis ...........................................................................................................................188
4.7.1 Alternative estimators .....................................................................................................................188
4.7.2 Sub-group analysis: female participants, food insecure households and small farmers ................190
4.7.3 Cross-section correlations along the results chain ..........................................................................191
4.7.4 Indirect and unintended effects ......................................................................................................191
4.7.5 Efficiency .........................................................................................................................................192
4.7.6 Long-term effects and sustainability ...............................................................................................192
5. Synthesis .............................................................................................................................................................197
5.1 Conclusions ......................................................................................................................................197
5.1.1 EQ1: Composition and motivation of Dutch food security programme ..........................................197
5.1.2 EQ2: Instruments and synergies in Dutch food security programme .............................................197
5.1.3 EQ3: Costs per beneficiary and cost per output ..............................................................................198
5.1.4 EQ4: Effects of the programme on food security ............................................................................199
5.1.5 Quantitative case study: Effects of Farmer Field Schools ................................................................201
5.1.6 Reflection and recommendation EKN food security programme ....................................................202
5.2 Hypotheses ......................................................................................................................................203
5.2.1 Impact hypotheses: .........................................................................................................................203
5.2.2 Approach hypotheses: .....................................................................................................................205
6. References...........................................................................................................................................................206
4
List of Figures Figure 2-1: Description food security categories of the food security index. Source: CFSVA, 2015 .............. 29 Figure 2-2: Food insecurity by livelihood zones in Rwanda. Source: CFSVA, 2015 ........................................ 31 Figure 2-3: Average share of total household budget spent on food, by province. Source: CFSVA, 2015 .... 31 Figure 2-4: Percentage of households by food security status. Source: CFSVA, 2015 ................................... 32 Figure 2-5: Distance to market by food security status. Source: CFSVA, 2015 .............................................. 35 Figure 2-6: Type of food access issues. Source: CFSVA, 2015 ........................................................................ 36 Figure 2-7: Gross National Income per Capita Rwanda (World Development Indicators, 2015) ................... 37 Figure 2-8: Consumer price index Rwanda (World Development Indicators, 2015) ...................................... 37 Figure 2-9: Domestic food price level in Rwanda (FAOSTAT, 2013) ............................................................... 38 Figure 2-10: Average number of days during a week food items were consumed (CFSVA, 2015) ................ 38 Figure 2-11: Undernourishment in Rwanda (FAO, IFAD and WFP, 2015: 44) ................................................ 39 Figure 3-1: Food security intervention logic, Source: MASP 2012 – 2015...................................................... 56 Figure 3-2: Donors involved in food security policy ....................................................................................... 65 Figure 3-3: Rwanda intervention method and effects ................................................................................... 67 Figure 4-1: Percentage of households growing cassava by districts ............................................................ 133 Figure 4-2: Programme logic for the cassava mega-cluster from the perspective of small producers (farming households) .................................................................................................................................... 138 Figure 4-3: Treatment probability ................................................................................................................ 163 Figure 4-4: Box plot for use of improved cassava cuttings ........................................................................... 168 Figure 4-5: Box plot for ISFM index .............................................................................................................. 169 Figure 4-6: Box plot for growing cassava and cassava yield ......................................................................... 172 Figure 4-7: Mean cassava yield ..................................................................................................................... 173 Figure 4-8: Nutrition adequacy in 2014 ........................................................................................................ 182 Figure 4-9: Box plot for protein intake adequacy ......................................................................................... 183 Figure 4-10: Box plot for vitamin C ............................................................................................................... 184 Figure 4-11: Use of improved cuttings by treatment and time .................................................................... 194 Figure 4-12: ISFM index by treatment and time ........................................................................................... 195 Figure 4-13: Mean yield by treatment and time .......................................................................................... 196
List of Tables Table 2-1: National policy and programme instruments used ....................................................................... 47 Table 3-1: Project portfolio food security programme EKN Kigali .................................................................. 55 Table 3-2: Project period per food security project and duration of MASP ................................................... 59 Table 3-3: Food security projects per embassy output .................................................................................. 62 Table 3-4: Channel types ................................................................................................................................ 65 Table 3-5: Overview projects related to Output 1 .......................................................................................... 71 Table 3-6: Overview project level objectives linked to outcomes – HIMO PDED II ........................................ 73 Table 3-7: Overview project level food security effects – HIMO PDED II ....................................................... 74 Table 3-8: Overview project level objectives linked to outcomes – Infrastructure investments ................... 76 Table 3-9: Overview project level food security effects – Infrastructure Investments .................................. 77 Table 3-10: Overview project level objectives linked to outcomes – Consolidation of Marshlands .............. 78 Table 3-11: Overview project level food security effects – Consolidation of Marshlands ............................. 79 Table 3-12: Overview project level objectives linked to outcomes – PAREF NL-2 ......................................... 80 Table 3-13: Overview project level food security effects – PAREF NL-2......................................................... 81 Table 3-14: Overview project level objectives linked to outcomes – Land Tenure Regularisation ................ 82 Table 3-15: Overview project level food security effects – Land Tenure Regularisation ............................... 83
5
Table 3-16: Overview project level objectives linked to outcomes – PAREF NL-1 ......................................... 84 Table 3-17: Overview project level food security effects – PAREF NL-1......................................................... 85 Table 3-18: Overview project level objectives linked to outcomes – EARP ................................................... 86 Table 3-19: Overview project level food security effects – EARP ................................................................... 86 Table 3-20: Overview projects related to Output 2 ........................................................................................ 88 Table 3-21: Overview project level objectives linked to outcomes – Capacity Building for Food Security.... 90 Table 3-22: Overview project level food security effects – Capacity Building for Food Security ................... 91 Table 3-23: Overview project level objectives linked to outcomes – Linking Farmers to Markets ................ 92 Table 3-24: Overview project level food security effects – Linking Farmers to Markets ............................... 93 Table 3-25: Overview project level objectives linked to outcomes – Skills Development and Employment Protection ....................................................................................................................................................... 95 Table 3-26: Overview project level food security effects – TVET Skills Development and Employment Protection ....................................................................................................................................................... 96 Table 3-27: Overview project level objectives linked to outcomes – PROSKID .............................................. 97 Table 3-28: Overview project level food security effects – PROSKID ............................................................. 98 Table 3-29: Overview project level objectives linked to outcomes – Cooperatives Support Programme ... 100 Table 3-30: Overview project level food security effects – Cooperatives Support Programme .................. 101 Table 3-31: Overview projects related to Output 3 ...................................................................................... 103 Table 3-32: Overview project level objectives linked to outcomes – Access to Food for Young Children ... 104 Table 3-33: Overview project level food security effects – Access to Food for Young Children .................. 105 Table 3-34: Consolidation of Marshlands results based on the Welthungerhilfe survey (2015) ................. 111 Table 3-35: Direct and indirect beneficiaries reached .................................................................................. 118 Table 3-36: Project expenditures related to the project share EKN food security ....................................... 123 Table 3-37: Project expenditures related to direct beneficiaries ................................................................. 126 Table 3-38: Costs per beneficiary by output ................................................................................................. 126 Table 4-1: Cassava disease incidence ........................................................................................................... 134 Table 4-2: Number of sampled cells by CATALIST-2 treatment status and district ...................................... 151 Table 4-3: Cell Demographics ....................................................................................................................... 154 Table 4-4: Household characteristics ............................................................................................................ 156 Table 4-5: Treatment .................................................................................................................................... 158 Table 4-6: Input subsidies ............................................................................................................................. 160 Table 4-7: Crops cultivated ........................................................................................................................... 161 Table 4-8: Treatment selection ..................................................................................................................... 162 Table 4-9: Use of ISFM practices in 2014 ...................................................................................................... 165 Table 4-10: ISFM adoption ............................................................................................................................ 167 Table 4-11: Cassava land use, yield, production ........................................................................................... 171 Table 4-12: Yields of other crops .................................................................................................................. 175 Table 4-13: Price and production value ........................................................................................................ 176 Table 4-14: Income and wealth .................................................................................................................... 178 Table 4-15: Food security ............................................................................................................................. 181 Table 4-16: Nutrition adequacy .................................................................................................................... 185 Table 4-17: Food consumption and Coping Strategies Index ....................................................................... 186 Table 4-18: Financial-business training......................................................................................................... 187 Table 4-19: Treatment status ....................................................................................................................... 193
6
Abbreviations and acronyms
AIID Amsterdam Institute for International Development BeMo Appraisal document (‘BeoordelingsMemorandum’) BF Business and Financial Training
CATALIST Catalyze Accelerated Agricultural Intensification for Social and Environmental Stability CASE Competitive Agricultural Systems and Enterprises CBSD Cassava Brown Streak Disease
CFSVA Comprehensive Food Security and Vulnerability Analysis CMD Cassava Mosaic Disease DD Difference-in-Differences
EDPRS I and II Economic Development and Poverty Reduction Strategies I and II (Government of Rwanda)
EKN Embassy of the Kingdom of the Netherlands FAO Food and Agriculture Organisation
FCS Food Consumption Score FDOV ‘Faciliteit Duurzaam Ondernemen en Voedselzekerheid’
FEWS NET Famine Early Warning Systems Network FFS Farmer Field School FGD Focus Group Discussion
GDP Gross Domestic Product GoR Government of Rwanda HIMO Haute Intensité de Main d’Oeuvre or Labour Intensive Public Works
IFDC International Fertilizer Development Center IOB Inspectie Ontwikkelingssamenwerking en Beleidsevaluatie (Policy and Operations
Evaluation Department, the independent evaluation department of MFA)
IFPRI International Food Policy Research Institute ISFM Integrated Soil Fertility Management
KCP Kinazi Cassava Plant KIT Royal Tropical Institute MASP Multi Annual Strategic Plan (Government of the Netherlands)
MFA Ministry of Foreign Affairs of the Kingdom of The Netherlands MFS MedeFinancieringsStelsel (grant programme for Dutch NGOs in development
cooperation)
MinAgri Rwandan Ministry of Agriculture and Animal Resources
NFNP National Food and Nutrition Policy (Government of Rwanda) ORIO Faciliteit Ontwikkelingsrelevante Infrastructuurontwikkeling PSF Private Sector Foundation
7
QaE Quality at Entry RAB Rwanda Agricultural Board
TPE Total Programme Effect TVET Technical and Vocational Education and Training UNDP United Nations Development Programme WFP World Food Programme
WHO World Health Organization
8
Executive Summary
Food security was made one of the four priorities of the Dutch policy for development cooperation in 2011. This coincides with a global trend to focus on the increase of food availability as well as its quality. The Dutch budget available for improving food security in developing countries has increased from € 160 million in 2011 up to € 435 million in 2015.
This report presents results of an impact evaluation of the Dutch food security programme for Rwanda 2012-2015. The evaluation analyses 14 separate projects in this programme. In addition, the report presents a quantitative impact evaluation of Integrated Farm Soil Management (ISFM) training programmes, including those organized by the EKN supported project CATALIST-2, which is part of the regional programme for the Great Lakes area.
The objective of this impact evaluation is to provide input for the policy review of the Dutch food security programme 2012-2015, which is managed by the Policy and Operations Evaluation Department (IOB) of the Ministry of Foreign Affairs (MFA) of the Government of the Netherlands. The policy review serves accountability of the MFA to parliament, and learning for policy development. This external and independent impact evaluation should above all provide evidence on the contribution of the Dutch-funded interventions to food security.
Scope of the evaluation
A part of the food security policy is implemented centrally (i.e. by the MFA in The Hague) through programmes such as ORIO, FDOV and MFS; these are outside the scope of this report. This report focusses solely on the evaluation of the decentralized implementation of the food security policy in Rwanda: projects that are financed directly by the Embassy of the Kingdom of the Netherlands (EKN) in Kigali.
The food security portfolio of the Dutch embassy in Kigali contains 15 decentrally managed projects. The evaluation has been conducted for these 15 projects. In addition the evaluation includes a quantitative impact evaluation of Integrated Farm Soil Management (ISFM) training programmes, part of which were under the EKN supported CATALIST-2 programme. The evaluation period focuses on the years 2012-2015. Survey data collection for the evaluation was conducted in Rwanda in February-March 2014 (baseline) and February-March 2016 (endline). During the endline field visit we carried out:
A. the portfolio evaluation of 14 projects (excluding the EKN Front Office Fund) for a ‘light’ assessment;
B. the in-depth qualitative evaluation of 3 projects;
C. the in-depth quantitative and qualitative evaluation of ISFM training programmes/CATALIST-2.
9
Evaluation questions and hypotheses
As part of its assignment to the evaluation consortium, IOB has formulated evaluation questions and sub-questions concerning the following aspects:
1. the composition and motivation of the Dutch food security country programme 2012- 2015; 2. the instruments used and the synergy between them in tackling food security; 3. costs and efficiency; 4. effectiveness.
The primary goal of the quantitative impact evaluation is to address the effectiveness of the supported ISFM training interventions. In addition to the evaluation questions we address the sustainability of the projects in the portfolio and their unplanned, positive or negative, effects.
Based on the results of the baseline round of evaluation, hypotheses have been formulated that were tested at endline. The hypotheses concern both the impact of the project portfolio as a whole and the supported ISFM training interventions specifically, as well as the approach taken by the food security programme.
Results at portfolio level Composition and motivation of the Dutch food security country programme 2012- 2015
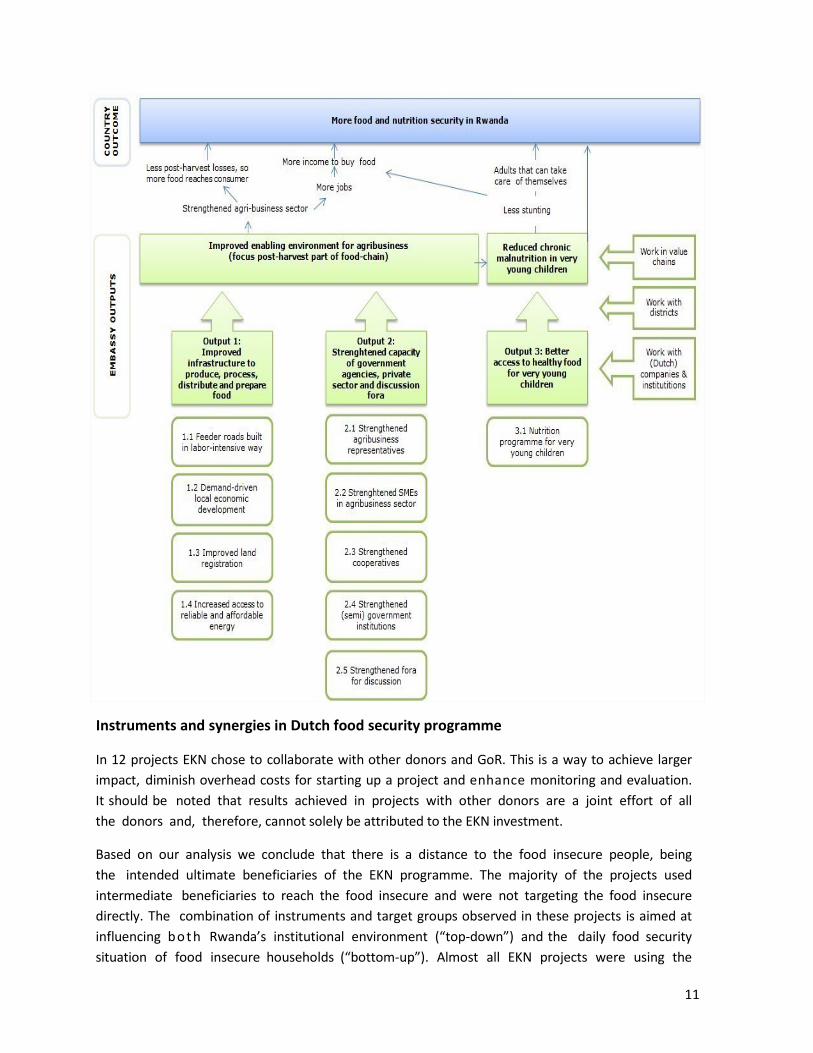
The food security programme aims to achieve three major outputs, by funding a number of projects per output (with some overlap between projects for outputs 1 and 2):
1. Output 1: Improved infrastructure to produce, process, distribute and prepare food (7 projects);
2. Output 2: Strengthened capacity of government agencies, private sector and discussion fora (10 projects);
3. Output 3: Better access to healthy food for very young children (1 project).
As a result of donor coordination and specialisation in Rwanda, the programme does not include a food production component. Therefore, the expected effects in terms of food security are mostly in the area of more jobs and income, thus enabling Rwandan households to buy more food. We observe that in both ways the strategy of the Dutch and Rwandan government (GoR) on food security are aligned or try to follow the same goals.
The intervention logic used for food security is presented in the figure on the next page.
10
Instruments and synergies in Dutch food security programme
In 12 projects EKN chose to collaborate with other donors and GoR. This is a way to achieve larger impact, diminish overhead costs for starting up a project and enhance monitoring and evaluation. It should be noted that results achieved in projects with other donors are a joint effort of all the donors and, therefore, cannot solely be attributed to the EKN investment.
Based on our analysis we conclude that there is a distance to the food insecure people, being the intended ultimate beneficiaries of the EKN programme. The majority of the projects used intermediate beneficiaries to reach the food insecure and were not targeting the food insecure directly. The combination of instruments and target groups observed in these projects is aimed at influencing bo th Rwanda’s institutional environment (“top-down”) and the daily food security situation of food insecure households (“bottom-up”). Almost all EKN projects were using the
11

intermediate approach to reach food insecure people. Even when projects were found to be working with cooperatives or farmer groups, we observe that the majority of people participating in those groups are not food insecure. They are in most cases people that were amongst those better off in their community. However, in some cases it was the explicit ambition of project implementers to create a trickle-down effect using a capacity building or train-the-trainer approach as an intervention to accomplish knowledge sharing and ultimately reach the food insecure. During focus group discussions with members of cooperatives targeted by Consolidation of Marshlands and CATALIST-2 we learned that the farmers were teaching their neighbours or others some of the acquired knowledge, as well as sharing high-quality seeds they received through the project. However, in projects such as SPARK’s ‘Cooperative Support Programme’ it was concluded by external evaluators that the expected trickle-down effect did not occur and that besides the cooperative managers, few others in the cooperatives were reached by the project. These examples show that the “intermediate” approach to targeting the food insecure did not work out as expected in all projects.
Furthermore, we observed that projects targeting the GoR or intermediate institutions sometimes had difficulties to single out project effects and direct numbers of beneficiaries. This is understandable when we distinguish between the top-down and bottom-up approach as described above. Even though EKN defines as one of the programme outputs (output 2) ‘strengthening capacity of government agencies, sector and discussion fora’, project assessments could state more clearly why and how these results can be reached, what the target group is and how project interventions will thus influence the final beneficiary, being food insecure people. This would have helped to monitor project results down to the food insecure and to be able to comment if the food insecure have been reached by the chosen intervention. The question whether or not this chosen approach was a good one is all the more salient, since many projects under output 2 did not achieve the anticipated outcomes.
Costs per beneficiary and cost per output
When trying to define the costs per beneficiary and per output we faced several challenges. First, at the endline stage of the evaluation seven projects were still ongoing and the final costs were not yet known. Second, the information about the direct and indirect beneficiaries was not always completely available and did cover in most cases the whole project period, when available. Third, information about the EKN costs was not always available and differed per source. We eventually decided to use the financial information received from IOB for the total project amounts disbursed. Fourth, even if some projects do give information about the direct beneficiaries, the results and effects cannot be attributed solely to EKN, since EKN is in most of the projects one of several other donors. Finally, there was no record of how many direct or indirect beneficiaries were actually food insecure at the start and end of the project. With these limitations in mind, we were able to do a costs-per-beneficiary calculation.
The numbers of direct beneficiaries per project range from 966 to 7,164,676. Given this wide range in the numbers of direct beneficiaries per project, we find that the project with the lowest number of direct beneficiaries was also the project with the highest costs per beneficiary, being € 4,347.83. The
12

project with the highest number of direct also has the lowest costs per beneficiary, being € 9.20.
On average the EKN programme expenditures related to the 8,331,024 beneficiaries were € 19.91. The expenditures for the EKN direct beneficiaries (calculated as the total number of direct beneficiaries times the percentage of project funding contributed by EKN), being 1,947,855 people, are on average € 85.17. We also compared the average costs per beneficiary for the different EKN outputs, which showed that projects contributing to EKN outputs 1 and 2 were less costly per beneficiary than the single project under output 3 (the UNICEF Access to Food for Young Children project). As the UNICEF project was still on-going at the time of the evaluation, we recommend a quantitative impact evaluation to assess how these relatively high costs compare to the development impact realised by the project.
For the Rwandan cassava cluster of CATALIST-2, direct project costs (contracts, meetings and cassava cuttings) are reported at Rwf 326,597,213. This amounts to a cost per direct beneficiary of Rwf 25,329 or about € 33, which implies costs well below the average of the EKN programme portfolio.
Effects of the programme on food security
While most project implementers are aware that EKN intends to make a positive impact on food security, they have more often than not limited themselves to implementing their own project outputs and monitoring those. Of the 14 projects, ten have explicit food security objectives. The other four have some relationship to food security objectives, which remains implicit in project documentation and interviews with project implementers. However, they had an impact on food security via enabling factors such as job creation or infrastructure. When asked whether or not outcomes required for making an impact on food security have materialized, project implementers often did not have any evidence to support a conclusion. Most mid-term reviews and evaluations have not covered food security impact, but in some cases provide indirect evidence. We observed that the project implementers were using different formats to report back. It would have been better to use a consistent format for all the projects or ask project implementer to report explicitly about food security in their mid-term and annual reports. Neither project implementers nor EKN reported baseline measurements at outcome level at the start of the projects, which makes it difficult to put effects into perspective and to evaluate the impact of the results, especially related to food security, which can only be achieved at the end of the results chain of a project. Nor did the projects specifically report about the achievement of their project output in relation to the three food security outputs specified in EKN’s intervention logic.
When zooming in on the achieved outcomes per EKN output indicator, we can conclude that for EKN output 1 ‘Improved infrastructure to produce, process, distribute and prepare food’ there are indications that the projects had a positive impact on food security. The use of relatively cheap labour force in these projects to support the poorest in the society contributed to an increase of income of the beneficiaries and better access to food. In addition, through the infrastructure built, it is now possible to easily transport food and enable better post-harvest handling via e.g. warehouses and processing plants in some of the agricultural value chains. In this way the food access and food availability have improved as well. We caution the reader that for more than half of the projects under output 1, we cannot with certainty conclude that the observed results are linked to the projects.
13

Despite these achievements, we do have some critical notes about the sustainability of the achieved effects. First, since there is no baseline information available at outcome level, we do not know for sure if the beneficiaries were food insecure at the start of the project. We are aware that most participants in the ‘cash-for-work’ projects (output 1) are classified as being the poorest in society, but this is not the case for projects related to energy or capacity building. For example, we have no evidence that the interns in the TVET project or capacity building projects were (moderately or severely) food insecure. Second, the increased income was earned during a relatively short period of time. Since no follow-up evaluations at beneficiary level have been performed we cannot tell if the beneficiaries are still benefiting from the fact that they contributed to one of the projects, or if the effects were only limited to that specific period in time.
For EKN output 2 ‘Strengthened capacity of government agencies, private sector and discussion fora’ the effects on food security are less tangible and direct. We acknowledge the importance of capacity building to embed the objective of improved food security in the country’s policies and institutions and thus contribute to sustainability. However, project outputs in the output 2 projects were not fully achieved. In addition, the beneficiaries of the projects were not food insecure and it is an open question whether any trickle-down effect took place to reach food insecure people. Furthermore, we noticed in projects related to output 2 that financial literacy is still a challenge. Beneficiaries in businesses and cooperatives were not yet familiar with working with loans and in several projects (Skills development and employment protection, Professionalization of Skills Development and Cooperatives Support Programme), loans were by and large not (fully) repaid by farmers or businesses. This has been explained by interviewees pointing to the fact that the HIMO approach and other forms of monetary support, giving people cash for work or grants without asking for repayment, have been widely used in Rwanda. Working with commercial (or soft) loans that need to be repaid requires a different mind-set that has to be stimulated with beneficiaries and through the GoR in order to have effective loan systems working and to modernize the economy.
The single project related to EKN output 3 ‘Better access to healthy food for very young children’ is still in progress. Intermediate results indicate that malnutrition of small children is decreasing. The food availability of participating families is also improving with the learned farming techniques.
We therefore conclude that the EKN projects related to output 1 and output 3 did have the most impact on food insecure beneficiaries and on improving their food security situation.
14
Quantitative Impact Evaluation
Farmer field schools and market development: background
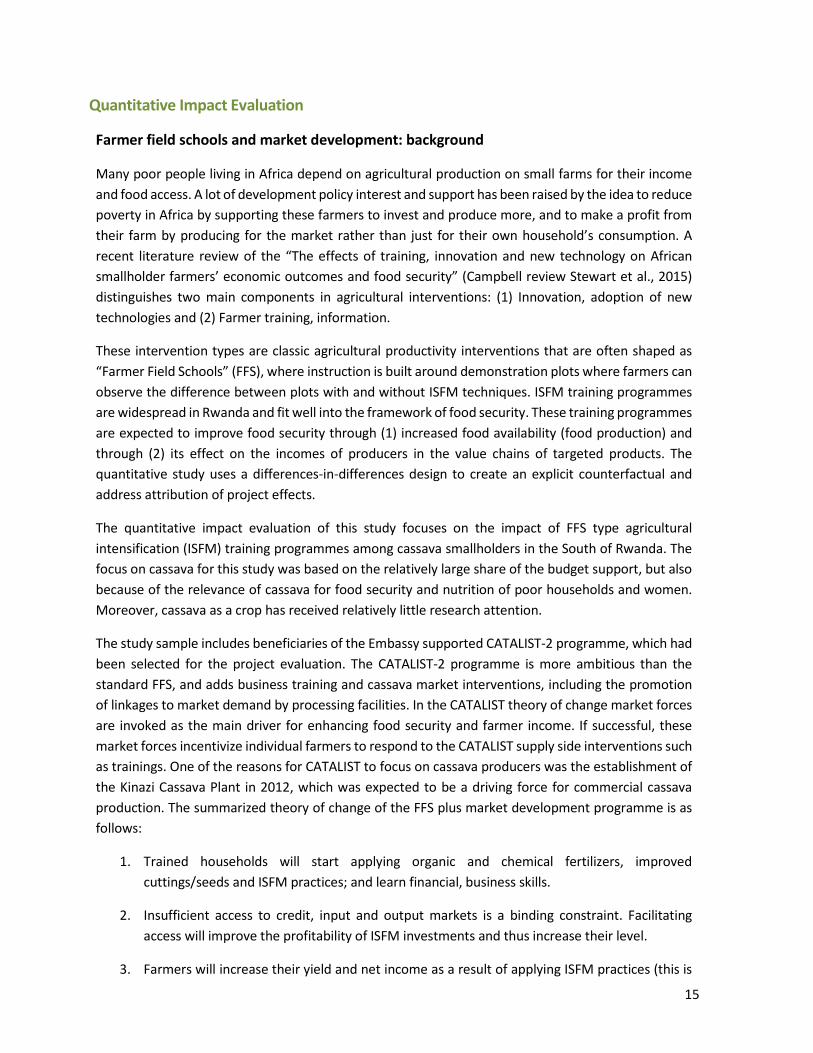
Many poor people living in Africa depend on agricultural production on small farms for their income and food access. A lot of development policy interest and support has been raised by the idea to reduce poverty in Africa by supporting these farmers to invest and produce more, and to make a profit from their farm by producing for the market rather than just for their own household’s consumption. A recent literature review of the “The effects of training, innovation and new technology on African smallholder farmers’ economic outcomes and food security” (Campbell review Stewart et al., 2015) distinguishes two main components in agricultural interventions: (1) Innovation, adoption of new technologies and (2) Farmer training, information.
These intervention types are classic agricultural productivity interventions that are often shaped as “Farmer Field Schools” (FFS), where instruction is built around demonstration plots where farmers can observe the difference between plots with and without ISFM techniques. ISFM training programmes are widespread in Rwanda and fit well into the framework of food security. These training programmes are expected to improve food security through (1) increased food availability (food production) and through (2) its effect on the incomes of producers in the value chains of targeted products. The quantitative study uses a differences-in-differences design to create an explicit counterfactual and address attribution of project effects.
The quantitative impact evaluation of this study focuses on the impact of FFS type agricultural intensification (ISFM) training programmes among cassava smallholders in the South of Rwanda. The focus on cassava for this study was based on the relatively large share of the budget support, but also because of the relevance of cassava for food security and nutrition of poor households and women. Moreover, cassava as a crop has received relatively little research attention.
The study sample includes beneficiaries of the Embassy supported CATALIST-2 programme, which had been selected for the project evaluation. The CATALIST-2 programme is more ambitious than the standard FFS, and adds business training and cassava market interventions, including the promotion of linkages to market demand by processing facilities. In the CATALIST theory of change market forces are invoked as the main driver for enhancing food security and farmer income. If successful, these market forces incentivize individual farmers to respond to the CATALIST supply side interventions such as trainings. One of the reasons for CATALIST to focus on cassava producers was the establishment of the Kinazi Cassava Plant in 2012, which was expected to be a driving force for commercial cassava production. The summarized theory of change of the FFS plus market development programme is as follows:
1. Trained households will start applying organic and chemical fertilizers, improved cuttings/seeds and ISFM practices; and learn financial, business skills.
2. Insufficient access to credit, input and output markets is a binding constraint. Facilitating access will improve the profitability of ISFM investments and thus increase their level.
3. Farmers will increase their yield and net income as a result of applying ISFM practices (this is
15
the main project goal and one of the main overall policy goals).
4. Increased harvest and/or income will increase the food and nutrition intake of the household members. Improved nutrition was not a project objective, but it is interesting to see whether the project contributed to this.
We note that the reach of the CATALIST-2 programme during the study period was limited. Programme data show that in the 2014-16 period 12,894 direct beneficiaries were reached, far fewer than the anticipated 43,000. As a result, our study sample only contains about eight percent of farmers that participated in a training in one of the CATALIST-2 program villages. For this reason, the empirical focus and our conclusions are on generic rather than CATALIST-2 specific training programme impacts.
Research Context
During the study period (2014-16), a major external shock affected the cassava sector as it suffered from the outbreak of two viral diseases, Cassava Mosaic Virus (CMV) and Cassava brown streak disease (CBSD). The disease outbreaks resulted in the destruction of large parts of the harvest and have resulted in a mass exit of farmers from cassava production during the study period. As detailed in the study, the 74 percent of farmers in our sample indicate that their harvest was affected; 51 percent state that more than half of the harvest is destroyed; and 39 percent have stopped cassava cultivation because of the diseases. The diseases clearly lowered the expected returns from cassava investments. Most cassava farmers have other options (e.g. beans) and respond to the changed expectations by reducing their cassava investment. The evaluated program did provide improved, resistant cassava varieties and this may explain why participation had a positive effect on the likelihood to remain active in cassava cultivation.
There was an additional set-back in the cassava market development, an important pillar of the theory of change. The technical problems and the continued low production level of the Kinazi Cassava Plant has impeded the anticipated market demand for the output of cassava cooperatives in the CATALIST theory of change.
Summary of findings
The quantitative impact analysis is based on the panel data collected at household and community level at baseline (March 2014) and endline (March 2016). Using these data and a difference-in-differences regression framework, this study finds the following headline results.
(1) Cassava growing farmers have adopted a small number of ISFM farming practices as a result of the ISFM training intervention. In particular, they have increased the use of chemical fertilizer for cassava and the use of improved cuttings for cassava cultivation. The programme does not have a significant impact on other ISFM indicators, nor on a composite index of ISFM adoption. As a likely result of the programme participating farmers have suffered less damage to their harvest.
(2) In terms of cassava production, the ISFM training intervention had a highly significant positive impact on the decision to engage or remain engaged in cassava cultivation. However, there are no further programme impacts: not on the amount of land allocated to cassava cultivation, nor on the
16

yields, total production, or amount sold. As expected, the cassava regression analyses do find significant negative effects of crop disease and a negative general time trend, reflecting the serious production problems for cassava growing farmers during the period covered by the analysis. No ISFM training intervention impacts are found for the other main crops cultivated by the farmers in our sample, and for these other crops no negative time trend is present.
(3) The study does not find an ISFM training intervention impact on the cassava market price, the cassava production value or the total production value of crops produced by farmers. As a likely result, the analysis also does not find an impact on a set of household income measures, including total income, net total farm income, total other income and net profit per hectare (improved farm production and income was the main project goal).
(4) The study does not find ISFM training intervention impacts in a large number of regression analyses using a variety of food security and nutrition indicators, with the exception of a significant treatment effect on the number of times that children under 15 years ate per day, with an effect size of close to 0.5 meals per day.
(5) There is no evidence that the specific CATALIST trainings have more impact than the generic trainings. However, given the small sample size this is to be expected. We find a somewhat stronger effect on ISFM techniques adoption in case the responsible for cassava in the household is female. Also, we find a positive effect of financial training on keeping track of expenditures, but not on the likelihood of obtaining credit.
(6) For the subgroup of food insecure households, we find a slightly larger programme effect on the probability to grow cassava; and we find a significant negative treatment effect on women being (moderately) undernourished. We find some evidence of indirect effects of the ISFM trainings on non-participants. Farmers that have heard of the programmes are more likely to use improved cuttings and grow cassava, but they (also) do not have higher yields or incomes. In further sub-group analysis we find evidence of positive impact on cassava sale prices for female headed households, especially when ISFM training is combined with business training (as in the CATALIST programme).
Discussion of findings
Evaluation focus, period: the evaluation was tasked to focus on cassava for the following reasons. Cassava represented a large share of programme beneficiaries and budget; cassava relevance for food security, particularly for poor and food insecure households; its relevance for women farmers; the difficulty of evaluating cassava using secondary information sources; and the fact that there is generally less research on cassava, compared to e.g. potatoes.
It can however be argued that the period of two years covered by the data is not sufficient to find the full effect of an ISFM programme with a cassava focus. Cassava is typically harvested 14 months after planting. The full ISFM treatment assumes some activities before planting, e.g. soil preparation. Therefore, the full ISFM production cycle may well take 15-16 months. This means that a farmer in our study sample would have had to be trained in 2014 for the results of the training to be reflected in a harvest measured in our endline survey. However, the farmers might need a few harvests before they master the farming techniques as taught during the trainings to optimally benefit from the
17
programme. On the other hand, our data for farmers with early training (trained before 2014) suggest that application of ISFM techniques diminishes after participation ends so the net effect of measuring the impact later is not entirely clear.
Given the many outcomes of interest (adoption, yield, land use, income, nutrition), many regression analyses have been performed for each step in the programme logic. In this sense, the data have been put to good use. The flipside of this is that it can be argued that if you run enough regressions you will always find a significant result. For this reason, we emphasize that, while we do find some significant results of program participation, these are found among a large number of insignificant results, often trying to capture the same mechanism. In this sense, our report findings may overstate rather than understate the programme impact.
Context, shocks: there is no doubt that much of what the data analysis shows has been coloured by the widespread cassava disease problems since 2014. Even under these conditions, it is not impossible for a programme to improve outcomes for programme participants and for impact analysis to detect this, as the results have shown. All farmers are, on average, affected by the cassava diseases, but the programme has been shown to increase the use of improved varieties and reduce the probability of having a severely affected crop.1 Nevertheless, it is likely that the more dynamic treatment effects, including seeing farmers make risky investments in fertilizer and other inputs, were diminished by the generally depressed state of production and increased risk.
Moreover, the demand-pull component of the programme was seriously hampered by the low level of demand from the Kinazi Cassava Plant. This plant represents a crucial part of the CATALIST programme logic, which centres on increasingly commercial cassava production. Without the KCP linkage, an important assumption of the programme is refuted.
Project implementation: the ISFM training interventions are implemented using a training of trainers system. From bottom to top this system includes: at the lowest level the farmer leaders, who train farmers; farmer leaders are trained by team leaders at sector level; these are trained by advisors at district level; and these by central management in Kigali. On average trainees receive eight hours of training divided over four sessions, in a group of around 30 farmers. Furthermore they are exposed to the so-called demo plots where they can see the impact of ISFM technique adoption by observing the differences between a treated and an untreated plot. It is not impossible that the signal-to-noise ratio decreases from top to bottom along the training chain; moreover, the in-class training exposure is not very intensive. Moreover, we note that the implementation reach of the CATALIST-2 programme during the study period was limited (see remark above on sample).
The cassava disease outbreak required an effective response from the ISFM training programmes. If the FFS would have supplied disease-free cassava cuttings to participating farmers on a large scale, the evaluation would likely have found a positive yield and production effect. In this sense, the implementers and the Rwanda Agricultural Board have not been able to adequately respond to the disease problems (that were known already in 2013).
1 This can be compared with training programs for the unemployed during a recession: finding a job becomes more difficult for all job seekers in a downturn, but the program can still improve the job prospects of participants.
18
On the market-pull side of the project the lack of demand from the KCP has been mentioned. While KCP was a major player, CATALIST worked with other, smaller processing firms for local markets. So there were other marketing channels for the project, but apparently the intervention activities did not result in sufficient demand to improve value chain indicators, e.g. output prices.
Project logic, design: the FFS/CATALIST-2 programme logic is ambitious. With the ambitious logic of programmes such as CATALIST, a lot of factors have to “click” for the interventions to produce the desired impacts on food production and farm income. We note that even when the goals are less ambitious, e.g. “just” improving yields, the scientific literature finds mixed impact for the FFS training intervention model (see more on this below). This is true even in the absence of major shocks like diseases or the non-emergence of an important market. With such shocks it becomes nearly impossible to successfully follow the programme logic.
More generally, one can conclude that in high-risk production environments, high-leverage programmes with many “switches” in the programme logic are unlikely to produce the desired end-result – in this case improved food production outcomes for the target population.
Relation to impact literature: There is a scientific literature on the farmer field school intervention, the core of the CATALIST-2 programme logic. A systematic review of Farmer Field School impact studies (International Initiative for Impact Evaluation (3ie), 2014) does find positive average impact on yields and net revenues. However, the majority of projects targeted better-off groups; while the best results were found for small-scale projects that focused on cash-crops and provided complementary inputs. There was no impact on non-participants and most of the effects were found in the short run. A noted difficulty was “.. identifying and training suitable facilitators on the scale necessary to move beyond pilot programmes.” More recently, a Campbell review by Stewart et al. (2015) finds - for a limited set of “high quality” studies - some positive effects of very specific innovation interventions, including introduction of orange-fleshed sweet potato, on food security, nutritional indicators and value of harvest. However, this review does not find any effects of FFS type training.
Conclusions and recommendations
EQ1: Composition and motivation of Dutch food security programme
We conclude that EKN has been able to successfully align its own strategy to the national policy in order to ensure an added value for the national policy and contribute to the sustainability of the interventions. Because of the relatively recent food security focus of the EKN programme several of the projects in the portfolio analysis did not have a clearly defined food security objective even if they were grouped during implementation into the EKN food security programme. However, most projects employed interventions aimed at improved farming practices, job creation and/or capacity building that arguably improve food access and security.
We recommend asking project implementers to define clear food security objectives at the start of each project in order to be able to better monitor the food security results and allow for steering the projects towards these objectives.
19
EQ2: Instruments and synergies in Dutch food security programme
We find that in several projects EKN collaborates with other donors and GoR to achieve synergies. The EKN food security strategy is implemented via and operates at multiple levels: central government, district governments, semi-government institutions, cooperatives (farmer groups) and local population (food insecure people). We conclude that most projects do not target food insecure households directly but use intermediate beneficiaries to reach the food insecure. Creating trickle-down effects using indirect targeting is common but it may result in “elite capture”, when, for example, a cooperative manager benefits but not the food insecure household that the intervention described as the intended beneficiary. Furthermore, we observed that projects targeting the GoR or intermediate institutions sometimes had difficulties to single out project effects and direct numbers of beneficiaries.
We recommend that project assessments in BeMos state more clearly why and how food security results can be reached, what the target group is and how project interventions will affect food insecure households as the final beneficiaries.
EQ3: Costs per beneficiary and cost per output
Based on the EKN contribution to the portfolio 1,947,855 people can be counted as direct beneficiaries of the project interventions. The average cost per beneficiary is € 85. A comparison of average costs per beneficiary for the different EKN outputs shows that projects contributing to EKN outputs 1 (improved infrastructure to produce, process, distribute and prepare food, 7 projects) and 2 (strengthened capacity of government agencies, private sector and discussion for a, 10 projects) were less costly per beneficiary than the project under output 3 (better access to healthy food for very young children, 1 project). The direct costs per beneficiary of the CATALIST-2 cassava ISFM training amounted to € 33.
EQ4: Effects of the programme on food security
Conclusions on programme effects in the portfolio projects are hindered by lack of targeted monitoring data, as well as the usual problem of attribution. When asked whether or not outcomes required for making an impact on food security have materialized, project implementers often did not have any evidence to support a conclusion. Neither implementers nor EKN reported baseline measurements at outcome level at the start of the projects. The projects did not specifically report about project output in relation to the three food security outputs specified in EKN’s intervention logic.
We recommend a more rigorous approach to monitoring of project outcomes, with baseline measurements before project support starts. We also recommend using a consistent format for all the projects and ask project implementers to report explicitly about project (food security) goals.
Quantitative case study as part of EQ4: Cassava growing farmers have adopted a small number of ISFM farming practices as a result of the (CATALIST-2) ISFM training interventions, particularly chemical fertilizer for cassava and the use of improved cuttings for cassava cultivation. In terms of cassava production, the ISFM training interventions had a positive impact on the decision to engage or remain engaged in cassava cultivation. However, we find no impacts on other indicators. The Focus Group
20

Discussions (FGDs) provide a more positive narrative of the project impact than the quantitative evaluation. The FGD respondents report, a.o., increases in use of improved seeds; increases in land used for production; increases in production and income; and increases in the number of meals.
Overall recommendations
In the selection or design phases, EKN could have been more specific in defining the intended ultimate beneficiaries of each project. Especially in projects that are related to capacity building of GoR or cooperatives, the final users were staff members or farmers that were not directly food insecure. In these projects we have not found the intended trickle-down effect to the food insecure people. We recommend to clearly define in the BeMos of new projects how the direct beneficiaries of the project are supposed to reach the final beneficiaries in order to have a better insight in the impact of the projects.
Furthermore, we noticed that important instruments to measure impact and monitor the progress of the project were not fully established. The step from the EKN outputs to the country outcome more food and nutrition security cannot be proved since monitoring data on outcome variables, such as income spent, are not available. The income of project beneficiaries may have increased, but it is not sure whether they have spent the extra money on buying food or buying land to produce more food or on other things such as clothing, education, health insurance or transport, as we have seen in some projects. Many projects lacked a baseline study, which made the starting point unclear. Also, in the mid- term reviews and annual reports external consultants were not asked to report about food security and the way the projects contribute to it.
On top of that, some project implementers did not even know their projects were part of the food security programme. It is advisable that EKN requires project implementers to conduct a baseline study at the start of the project, focused on the situation of the intended beneficiaries. EKN should also inform the project implementers about the EKN policy related to the project and ask the project implementers to report back on how the project contributes to the EKN objectives, in this case food security. In addition, monitoring and evaluation would be more accessible if the projects were using the same format to collect output and outcome information, direct and indirect beneficiaries and/or financial information about the project.
Finally, sustainability remains an important point of attention in the projects. Except for projects that revolved around training or capacity building, the sustainability of the results achieved will depend on whether continued funding will be made available to maintain the capital investment of the projects (e.g. roads, electricity infrastructure). For the farmer field school projects studied, the evidence suggests that uptake of improved cassava varieties and yields dropped sharply in the two years after participating in the trainings. However, it is hard to filter out the negative impact of the cassava disease outbreaks during this period.
In some projects (e.g. Land Tenure Regularization), continued funding has thus far not been committed by either EKN or GoR, which creates a significant risk that the results will not be sustained. On the other hand, there is a valid question how much longer EKN will have to support certain projects. Some projects already had one or more follow-up projects (e.g. EARP,
21

PAREF or Infrastructure investments) and at a certain point the strengthened capacity should be sufficient for the GoR or project implementers to continue their efforts without external support. We recommend to give more attention to sustainability in developing new EKN projects and require firm commitments from project implementers and GoR to get sufficient comfort that sustainability will be assured.
Ultimately, the success of an intervention depends on the strength of the behavioural responses of agents in the theory of change. The project design and selection stage is therefore crucial. If the mechanisms and assumptions in the underlying theory do not function as intended the project will not reach its goals, even with perfect alignment between funder and implementer goals, a well-established monitoring and evaluation framework and in the absence of external shocks.
Research literature may help guide project selection. For example, on inspection many of the Farmer Field School success factors mentioned in the systematic review on FFS interventions (International Initiative for Impact Evaluation, 2014) are missing for the Rwandan programme (CATALIST-2). Cassava is not a cash crop, while the geographic coverage of the combined training programmes is quite large. There is little evidence of complementary inputs provided by the project. If such knowledge could be used at the project selection stage, or even in recommendations for design, resources could be channelled to projects that include the most effective mechanisms and that prevent known pitfalls.
22

1. Introduction
This report contains the results of the impact evaluation of the Dutch food security policy in Rwanda. This impact evaluation is part of a broader policy review of the Dutch food security policy, managed by the Policy and Operations Evaluation Department (IOB) of the Ministry of Foreign Affairs (MFA) of the Government of the Netherlands.
There are four country impact evaluations in total, among which Rwanda, Uganda, Ethiopia and Bangladesh. IOB has awarded the assignment for the evaluation of the food security country programme in Rwanda to a consortium of the Amsterdam Institute for International Development (AIID) and PricewaterhouseCoopers Advisory N.V. (PwC). We acknowledge the support provided by the University of Rwanda and PwC Rwanda in implementing the evaluation. We also wish to thank the staff of IOB, the Dutch Embassy in Kigali and all project implementers for making themselves available to provide input for the evaluation.
The Dutch development cooperation policy focuses on 15 partner countries that are divided in three types of cooperation: aid relationships, transitional relationships and trade relationships. The food security policy in The Netherlands has undergone a shift from a single focus on development aid to more attention for the combination of aid and international trade. This also shows in the food security policy as attention is not only paid to core elements of food security like nutrition and food quality, but also to dimensions of trade in searching for added value of Dutch organizations and companies to the needs of partner countries. Rwanda is part of the aid relationships. This means that the Netherlands is assisting Rwanda in fighting poverty.
Food security is one of the four priorities of the Dutch policy for development cooperation and was implemented as such in 2011. This coincides with a global trend to focus on the increase of food availability as well as its quality. The budget available for improving food security in developing countries has been increased by The Netherlands from € 160 million in 2011 up to € 435 million in 2015.
In Annex XV we have included more information about the Dutch food security policy (centrally) and the way it is implemented by the Embassy of the Kingdom of the Netherlands (EKN) for Rwanda in Kigali decentrally through the Multi annual strategic plans (MASPs).
1.1 Scope of the evaluation
A part of the food security policy is implemented centrally (i.e. by the MFA in The Hague) through programmes such as ORIO, FDOV and MFS; they are outside the scope of this baseline report. This report focusses solely on the evaluation of the decentralized implementation of the food security policy in Rwanda: projects that are financed directly by the Embassy of the Kingdom of the Netherlands (EKN) in Kigali.
The food security portfolio of the Dutch embassy in Kigali contains 15 decentrally managed projects. The projects in the portfolio including project number, project name and the implementing organisation, are
23
listed in the Table 3-1 and Annex I of this report. In Annex IX a detailed description is given of the several projects with their objectives, outputs and outcomes.
The evaluation has been conducted for 14 projects in the portfolio (excluding the EKN Front Office Fund) in addition to a case study evaluation on project-level of CATALIST-2. The evaluation period focuses on the years 2012-2015. Survey data collection for the evaluation was conducted in Rwanda in February-March 2014 (baseline) and February-March 2016 (end line). During the end line field visit we carried out:
D. the portfolio evaluation of 14 projects for a ‘light’ assessment;
E. the in-depth qualitative evaluation of 3 projects2
F. the in-depth quantitative and qualitative evaluation of CATALIST-2.
The evaluation questions as set up in the Terms of Reference (2013, IOB) were as followed and form the basis for the end line data collection and analysis:
1. What is the composition and motivation for the Dutch food security country (Rwanda) programme 2012-2015?
2. What instruments are used and what is the synergy in tackling food security?
3. How does the expenditure relate to the number of directly and indirectly targeted beneficiaries and to the expected food security effect per beneficiary?
4. What are the effects of the Dutch country programme on food security?
At the beginning of this study the evaluation period 2012-2015 was covered by the Dutch food security policy letter 2011 of the ministry of Foreign Affairs and the Multi Annual Strategic Plan (MASP) 2012- 2015 of EKN. However, when a new policy letter on food security was published by the Dutch ministry of Foreign Affairs on 18 November 2014, the focus had slightly shifted (see annex XV). In the meantime, EKN also drew up a new MASP, covering the period 2014-2017.
With the above mentioned developments, IOB has asked the evaluation team to also take into consideration the highlights of the new food security policy and the new MASP (Annex XV) as reference points for this evaluation.
As a result of the new policy letter, IOB included additional sub-questions to this evaluation, which will be presented in Section 3.1. In addition, IOB requested the evaluation teams of all country evaluations to present a number of impact pathway hypotheses and approach hypotheses. The hypotheses of the Rwanda evaluation are presented in Section 3.1 as well.
2 Local Demand Driven Investments projects through RLDSF – Local Development Agency (‘LODA’) - 24371/ 25542; Consolidation of Marshland Development – 25059; and, Access to Food For Young Children - 25457.
24
1.2 Structure of the report
Background information on food security in Rwanda and the national policy of its government are presented in Chapter 2 of this report.
Chapter 3 describes the project portfolio evaluation and presents our main findings. It addresses the four evaluation questions and includes: first, the composition and motivation of the Dutch food security programme 2012-2015; second, the instruments, coherence and synergy in the Dutch food security programme; third, the costs and efficiency of the programme; and finally, the effectiveness of the programme.
The evaluation also zooms in on the effects of a selected case study of the food security project. In the Rwanda evaluation CATALIST-2 has been selected by IOB for a quantitative project-level impact evaluation case. CATALIST-2 is a broad agricultural intensification programme, and is discussed in detail in Chapter 4 of this report. We note here that CATALIST-2 is not part of the food security country programme of EKN Kigali that is covered in Chapter 2. CATALIST-2 is financed in the context of a regional cooperation of the Netherlands Embassies in the Great Lakes Region (Eastern DRC, Burundi, Rwanda and Uganda). This report only covers the Rwandan part of CATALIST-2, which is co-financed by the Swiss government.
Chapter 4 provides a detailed quantitative case study of the CATALIST-2 programme, examining the effectiveness, efficiency, sustainability and unplanned, positive or negative effects. Further details of the methodology and survey outcomes are presented in a number of Annexes. Finally, in Chapter 5 of this report we provide our conclusions on the overall end line study, answering the research questions that were formulated together with IOB and testing the hypothesis. This report also has a number of Annexes. They contain the following information:
I. Project Portfolio
II. Approach for conducting the programme evaluation (Analysis plan)
III. Results questionnaire for self-evaluation by project implementers
IV. Disaggregated household survey results CATALIST-2
V. Overview interviews and focus group discussions
VI. Project linkage to food security objectives
VII. Project level interview questions
VIII. Project level focus group discussion questions and questionnaires for participants
IX. Project level end line assessment
X. Project level food security effects
XI. Project level objectives linked to outcomes
25
XII. Results focus group discussions
XIII. Other programme donors in Rwanda
XIV. Sampled locations
XV. Dutch food security policy
XVI. Detailed design focus group discussions
XVII. Evaluation questions impact evaluation Rwanda
XVIII. Summary results of quantitative case study
XIX. Summary list of all outputs and outcomes estimated
26
2. Background: food security situation of Rwanda 2.1 Introduction
This chapter first describes the country context of Rwanda (2.1.1) and provides a definition of food security (2.1.2). Secondly, the food insecurity level (including characteristics and causes) in Rwanda is discussed. Section 2.3 addresses the Rwandan national policy with regard to food security and describes national trends. The information in this chapter will help to answer the first set of evaluation questions formulated by IOB in relation to the country context:
1. Where and who are the food insecure people?
2. What are the food insecurity characteristics (national food availability, household food access, food utilisation, stability in access) and underlying causes?
3. What is the national policy and programme?
4. What are the programmes of the main other donors in the country?
5. What are the trends of food insecurity over the period 2012-2015? 2.1.1 Country Context
The Republic of Rwanda is a landlocked, mountainous country with a total surface area of 26,338 km2
located in Central East Africa3. Rwanda is bordered by Uganda to the North, the Democratic Republic of the Congo to the West, Burundi to the South and Tanzania to the East. Kigali is the capital city of Rwanda. Rwanda is a low-income, food-deficit and less developed country, ranking 163 out of 188 countries based on the Human Development Index (from rank 151 in 2014)4. However, Rwanda has seen continued economic growth and progress in social development in a number of areas. Life expectancy at birth has increased by 18.7 years between 1980 and 2015 to 66.7 years5. This is at a relatively high level compared to countries with a similar Human Development Index (HDI), but low compared to more developed countries. Moreover, Rwanda has reached most of the Millennium Development goals (MDGs), and was particularly performing well in the areas of poverty reduction, health and education.
However, Rwanda is still exposed to challenges. One of the main development challenges Rwanda currently faces is population growth and density. The annual population growth of 2.6 percent (measured between 2002 and 2012) is among the highest of Africa and population growth for 2016 is estimated at 2.53 percent6. Rwanda has the highest population density of the East African region (493 inhabitants per square kilometre in 20167), and the urban population is now even growing faster than the
3 CIA World Factbook, https://www.cia.gov/library/publications/the-world-factbook/geos/rw.html 4 UNDP, 2015. Rwanda 2014 National Human Development Report and UNDP, 2016. HDR 2015 data on Rwanda, http://hdr.undp.org/en/countries/profiles/RWA 5 World Bank World Health Rankings, http://www.worldlifeexpectancy.com/rwanda-life-expectancy. Note that the National Institute of Statistics of Rwanda reports a life expectancy at birth of 66.1 years for 2015, http://www.statistics.gov.rw/publication/life-expectancy-birth 6 CIA World Factbook, Ibidem 7 CIA World Factbook, Ibidem
27
rural population. At the same time, agriculture accounts for more than 90 percent of the labour force, but remains unproductive and on a subsistence level; in 2015 only 34.6 percent of GDP came from the agricultural sector8. Distribution of arable land is diminishing due to high birth rates resulting in intense exploitation of the land, without corrective measures. This leads to a decline in land productivity and environmental degradation. As it will be difficult to sustain this population growth without sufficient growth in food production, food security remains a problem in Rwanda. Therefore, food security and nutrition are recognized as essential to the overall development of the country.
2.1.2 Food Security
Food security is still a global priority and concern, especially in the developing regions. In 1996 the World Food Summit defined food security as prevailing “when all people at all times have access to sufficient, safe, nutritious food to maintain a healthy and active life”. In addition, the World Health Organization (WHO) currently defines the concept of food security as “including both physical and economic access to food that meets people's dietary needs as well as their food preferences”. The WHO also states that in many countries, health problems related to dietary excess are an ever increasing threat and that malnutrition and foodborne diarrhoea have in fact become a double burden9.
According to the World Food Program food security is built on three pillars:
• “Food availability: sufficient quantities of food available on a consistent basis.
• Food access: having sufficient resources to obtain appropriate foods for a nutritious diet.
• Food use: appropriate use based on knowledge of basic nutrition and care, as well as adequate water and sanitation.”10
In this study we focus mainly on the first two pillars. This will be addressed in Chapter 3 when assessing the effectiveness of the EKN food security policy. In the evaluation of the CATALIST-2 project (Chapter 4) we also investigate food use.
The World Food Programme (WFP) further classifies food security in four different levels. Since 2009 the WFP publishes every three years the ‘Comprehensive food security and vulnerability analysis (CFSVA)’. During this impact evaluation we were able to compare the CFSVA reports of 2012 and 2015 for the situation in Rwanda. The CFSVA is developed based on WFP standards11. Households are classified into four descriptive groups of food security: food secure, marginally food secure, moderately food insecure and severely food insecure (CFSVA, 2015). Figure 2-1 below explains the differences between the categories.
8 CIA World Factbook, Ibidem 9 http://www.who.int/trade/glossary/story028/en 10 World Food Program, https://www.wfp.org/node/359289 11 https://www.wfp.org/food-security/assessments/comprehensive-food-security-vulnerability-analysis
28
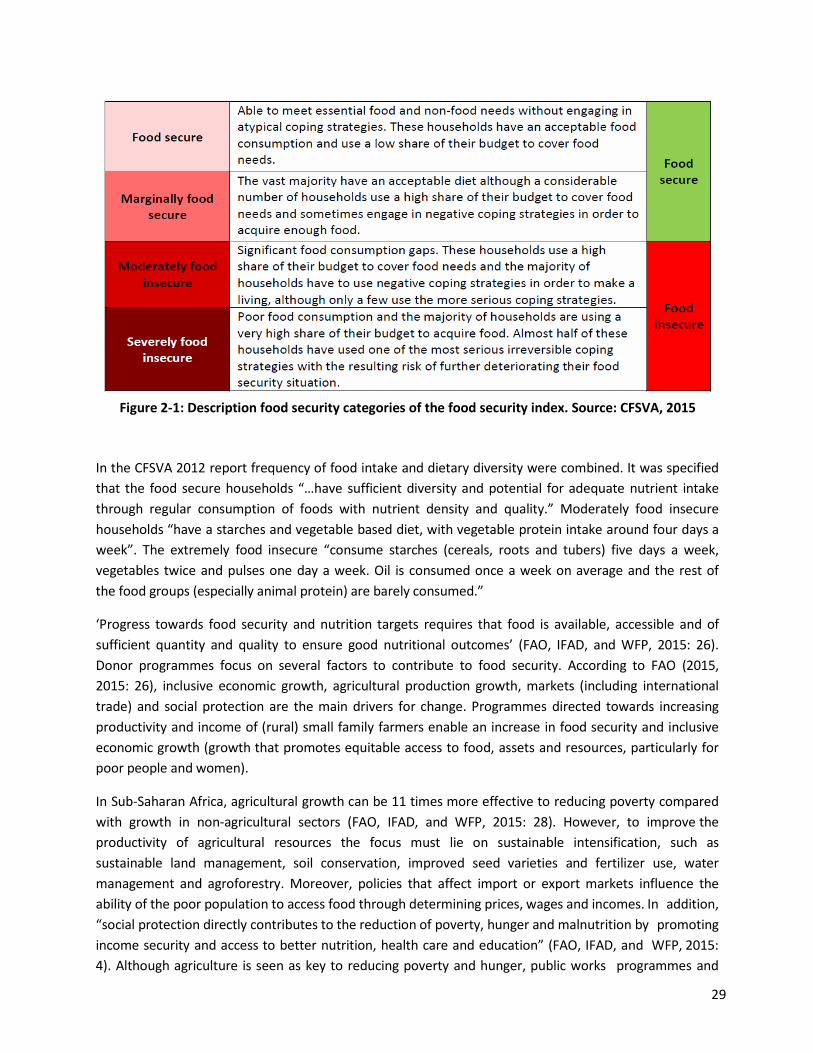
Figure 2-1: Description food security categories of the food security index. Source: CFSVA, 2015
In the CFSVA 2012 report frequency of food intake and dietary diversity were combined. It was specified that the food secure households “…have sufficient diversity and potential for adequate nutrient intake through regular consumption of foods with nutrient density and quality.” Moderately food insecure households “have a starches and vegetable based diet, with vegetable protein intake around four days a week”. The extremely food insecure “consume starches (cereals, roots and tubers) five days a week, vegetables twice and pulses one day a week. Oil is consumed once a week on average and the rest of the food groups (especially animal protein) are barely consumed.”
‘Progress towards food security and nutrition targets requires that food is available, accessible and of sufficient quantity and quality to ensure good nutritional outcomes’ (FAO, IFAD, and WFP, 2015: 26). Donor programmes focus on several factors to contribute to food security. According to FAO (2015, 2015: 26), inclusive economic growth, agricultural production growth, markets (including international trade) and social protection are the main drivers for change. Programmes directed towards increasing productivity and income of (rural) small family farmers enable an increase in food security and inclusive economic growth (growth that promotes equitable access to food, assets and resources, particularly for poor people and women).
In Sub-Saharan Africa, agricultural growth can be 11 times more effective to reducing poverty compared with growth in non-agricultural sectors (FAO, IFAD, and WFP, 2015: 28). However, to improve the productivity of agricultural resources the focus must lie on sustainable intensification, such as sustainable land management, soil conservation, improved seed varieties and fertilizer use, water management and agroforestry. Moreover, policies that affect import or export markets influence the ability of the poor population to access food through determining prices, wages and incomes. In addition, “social protection directly contributes to the reduction of poverty, hunger and malnutrition by promoting income security and access to better nutrition, health care and education” (FAO, IFAD, and WFP, 2015: 4). Although agriculture is seen as key to reducing poverty and hunger, public works programmes and
29
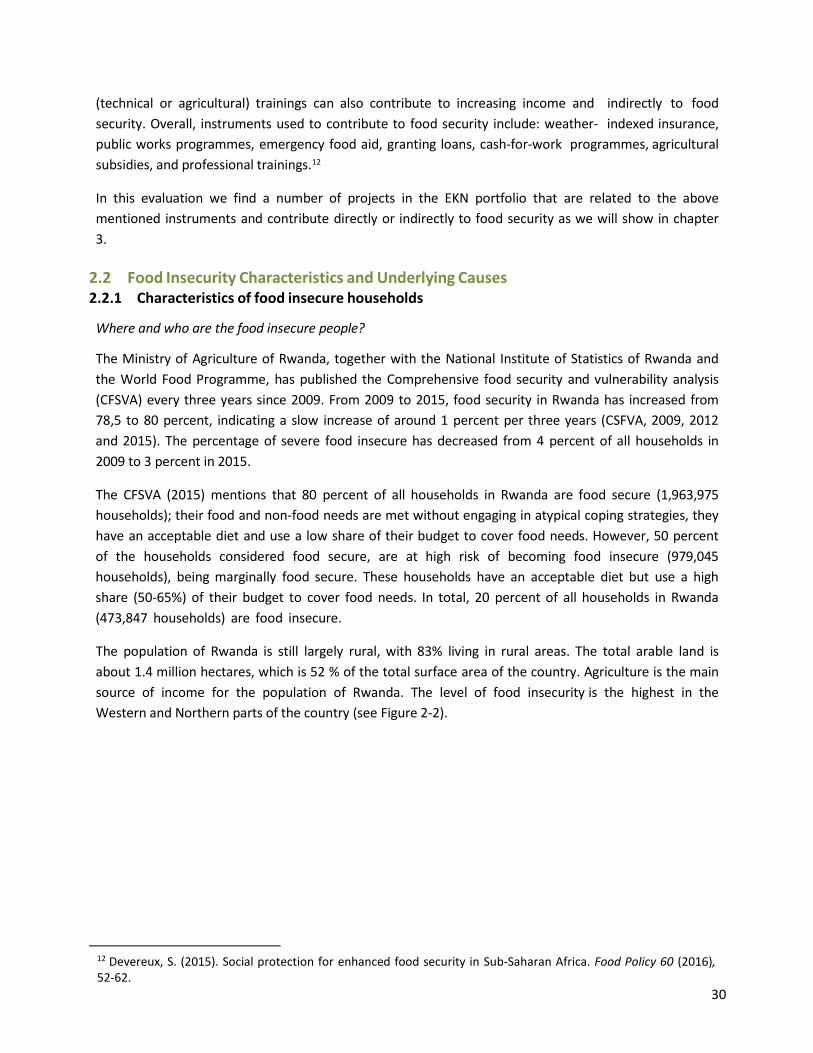
(technical or agricultural) trainings can also contribute to increasing income and indirectly to food security. Overall, instruments used to contribute to food security include: weather- indexed insurance, public works programmes, emergency food aid, granting loans, cash-for-work programmes, agricultural subsidies, and professional trainings.12
In this evaluation we find a number of projects in the EKN portfolio that are related to the above mentioned instruments and contribute directly or indirectly to food security as we will show in chapter 3.
2.2 Food Insecurity Characteristics and Underlying Causes 2.2.1 Characteristics of food insecure households
Where and who are the food insecure people?
The Ministry of Agriculture of Rwanda, together with the National Institute of Statistics of Rwanda and the World Food Programme, has published the Comprehensive food security and vulnerability analysis (CFSVA) every three years since 2009. From 2009 to 2015, food security in Rwanda has increased from 78,5 to 80 percent, indicating a slow increase of around 1 percent per three years (CSFVA, 2009, 2012 and 2015). The percentage of severe food insecure has decreased from 4 percent of all households in 2009 to 3 percent in 2015.
The CFSVA (2015) mentions that 80 percent of all households in Rwanda are food secure (1,963,975 households); their food and non-food needs are met without engaging in atypical coping strategies, they have an acceptable diet and use a low share of their budget to cover food needs. However, 50 percent of the households considered food secure, are at high risk of becoming food insecure (979,045 households), being marginally food secure. These households have an acceptable diet but use a high share (50-65%) of their budget to cover food needs. In total, 20 percent of all households in Rwanda (473,847 households) are food insecure.
The population of Rwanda is still largely rural, with 83% living in rural areas. The total arable land is about 1.4 million hectares, which is 52 % of the total surface area of the country. Agriculture is the main source of income for the population of Rwanda. The level of food insecurity is the highest in the Western and Northern parts of the country (see Figure 2-2).
12 Devereux, S. (2015). Social protection for enhanced food security in Sub-Saharan Africa. Food Policy 60 (2016), 52-62.
30
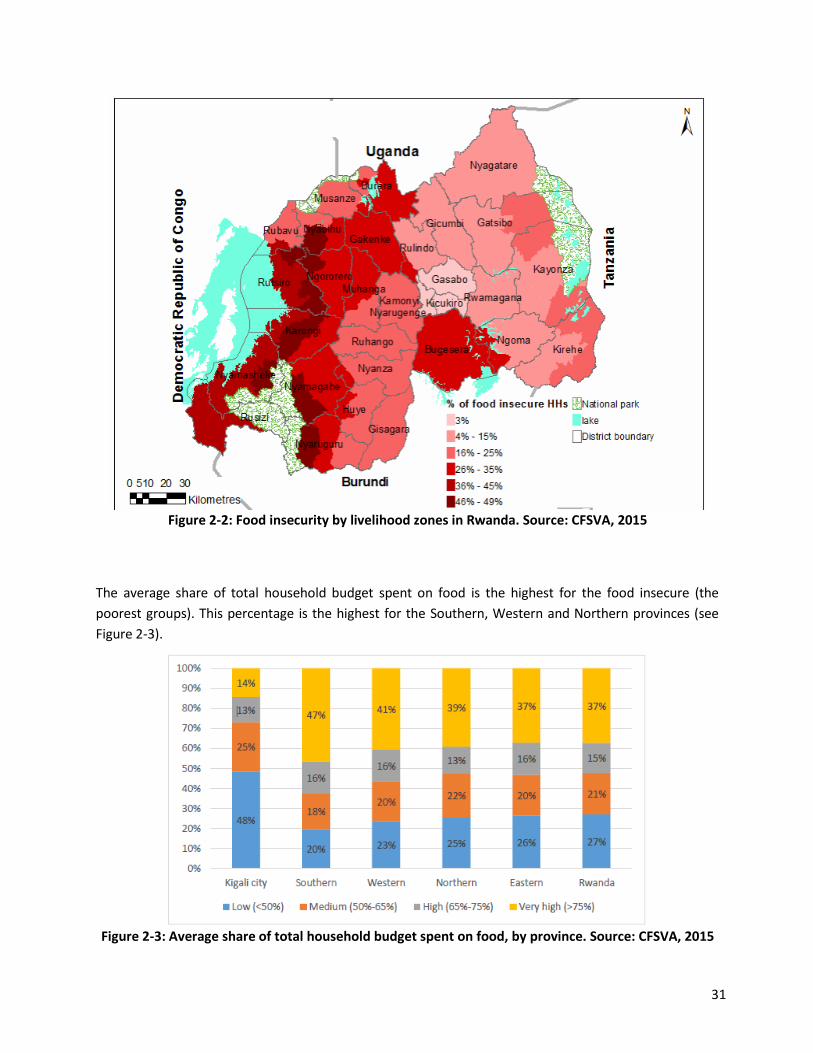
Figure 2-2: Food insecurity by livelihood zones in Rwanda. Source: CFSVA, 2015
The average share of total household budget spent on food is the highest for the food insecure (the poorest groups). This percentage is the highest for the Southern, Western and Northern provinces (see Figure 2-3).
Figure 2-3: Average share of total household budget spent on food, by province. Source: CFSVA, 2015
31

Food insecure households are typically poor rural households with few adult household members, who are dependent on daily agricultural labour, agriculture or external support for their livelihoods. Food insecure households tend to have less livestock, less agricultural land, lower food stocks, grow fewer crops, are less likely to have a vegetable garden, and consume more of their own production at home. The most common livelihood type in Rwanda is low-income agriculture, underlining the importance of agricultural production for household food security. As shown in Figure 2-4, food secure households are more likely to live in urban areas and to be engaged in skilled labour, salaried work, or own their own business.
Figure 2-4: Percentage of households by food security status. Source: CFSVA, 2015
Furthermore, gender, marital status and education level of the household head are also associated with the food security status of the household. Female-headed households (27 percent of all households) are more likely to be food insecure than those headed by men13. This can be explained by several factors: these female household heads are often widows; and women tend to be less educated and are more often engaged in agricultural production than in non-agricultural labour, contrary to men. This implies that female-headed households typically engage in the lowest paid work, which lowers their changes of being food secure. At least 29 percent of households in the low-income agriculture, agricultural labour and trade/petty trade livelihood groupings are represented by women. In more than a quarter of households involved in agricultural production only women or women and children are engaged (this is either the woman head of household or the spouse of a male household head).
13 69 percent of households headed by women are food secure, compared to 79 percent of households headed by men.
32
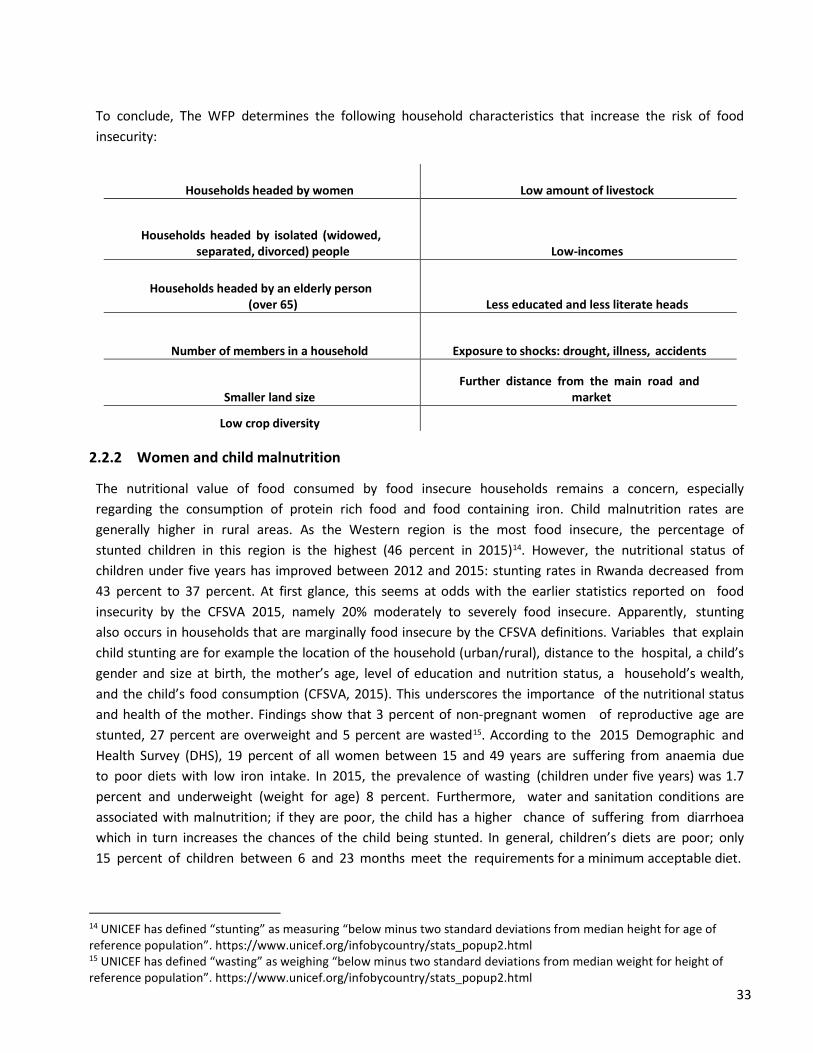
To conclude, The WFP determines the following household characteristics that increase the risk of food insecurity:
Households headed by women Low amount of livestock
Households headed by isolated (widowed, separated, divorced) people Low-incomes
Households headed by an elderly person (over 65) Less educated and less literate heads
Number of members in a household Exposure to shocks: drought, illness, accidents
Smaller land size Further distance from the main road and
market
Low crop diversity 2.2.2 Women and child malnutrition
The nutritional value of food consumed by food insecure households remains a concern, especially regarding the consumption of protein rich food and food containing iron. Child malnutrition rates are generally higher in rural areas. As the Western region is the most food insecure, the percentage of stunted children in this region is the highest (46 percent in 2015)14. However, the nutritional status of children under five years has improved between 2012 and 2015: stunting rates in Rwanda decreased from 43 percent to 37 percent. At first glance, this seems at odds with the earlier statistics reported on food insecurity by the CFSVA 2015, namely 20% moderately to severely food insecure. Apparently, stunting also occurs in households that are marginally food insecure by the CFSVA definitions. Variables that explain child stunting are for example the location of the household (urban/rural), distance to the hospital, a child’s gender and size at birth, the mother’s age, level of education and nutrition status, a household’s wealth, and the child’s food consumption (CFSVA, 2015). This underscores the importance of the nutritional status and health of the mother. Findings show that 3 percent of non-pregnant women of reproductive age are stunted, 27 percent are overweight and 5 percent are wasted15. According to the 2015 Demographic and Health Survey (DHS), 19 percent of all women between 15 and 49 years are suffering from anaemia due to poor diets with low iron intake. In 2015, the prevalence of wasting (children under five years) was 1.7 percent and underweight (weight for age) 8 percent. Furthermore, water and sanitation conditions are associated with malnutrition; if they are poor, the child has a higher chance of suffering from diarrhoea which in turn increases the chances of the child being stunted. In general, children’s diets are poor; only 15 percent of children between 6 and 23 months meet the requirements for a minimum acceptable diet.
14 UNICEF has defined “stunting” as measuring “below minus two standard deviations from median height for age of reference population”. https://www.unicef.org/infobycountry/stats_popup2.html 15 UNICEF has defined “wasting” as weighing “below minus two standard deviations from median weight for height of reference population”. https://www.unicef.org/infobycountry/stats_popup2.html
33
2.2.3 Food insecurity characteristics and underlying causes What are the food insecurity characteristics (national food availability, household food access, food utilisation, stability in access) and underlying causes?
National food availability
With regards to national food availability, more is gradually being achieved in terms of addressing issues related to markets and trade (CFSVA, 2015: 20). However, several constraints remain, such as post- harvest losses, physical access, storage facilities, handling perishable commodities and unpredictable non-tariff barriers. Overall, Rwanda has a negative trade balance and cereals are the main food commodity imported in Rwanda, while pulses, roots and tubers are more commonly exported. However, food availability in Rwanda is mainly dependent on domestic agricultural production.
Agriculture is of critical importance to the Rwandan economy. According to the latest household survey (EICV, 2013-14) 87 percent of households in Rwanda are engaged in some sort of crop or livestock production activity. Close to 70 percent of working adults are usually employed in agriculture and agriculture makes up around a third of gross domestic product.
Rwandan agriculture is almost exclusively rain fed, with a fertile soil which typically allows for two harvests a year (season A and season B) and a third minor season related to households that cultivate in marshland areas during the drier season (season C) (CFSVA, 2015):
- Agricultural Season A: starts in September and ends in February of the following calendar year, with the main harvest in December to February
- Agricultural Season B: starts in March and ends in July of the same calendar year with main harvest in June-July
- Agricultural Season C: starts in August and ends in September of the same calendar year with the harvest taking place in September
Beans are the most important crops cultivated by Rwandan farmers (by 88% of all households cultivating any land), followed by maize (49%), sweet potato (45%), cassava (28%), Irish potatoes (17%), sorghum (17%) and bananas (12%). On average, households grow 3 crops. Since 2012, these numbers slightly changed. The most outstanding drops are in cassava (40% of all households cultivated this in 2012) and banana (28% in 2012). These drops are also reflected in the trend in production volumes. Since 2013, production volumes exhibit a downward trend during the two main seasons A and B for roots and tubers (-7.4% in aggregate production between Season A 2013 and Season A 2015) and bananas (-19.1% during the same period). A large influence on the drop in cassava production has been an increase in cassava diseases. More details about this are discussed in Chapter 4. Cereal production shows an increasing trend and legumes and pulses were maintained at relatively stable levels.
Despite having the greatest potential to address food security and poverty in Rwanda, the agricultural sector needs improvement, for example, by increasing crop yields, using more innovative agricultural practices (instead of traditional manual practices) and using irrigation systems. Productivity increases in
34
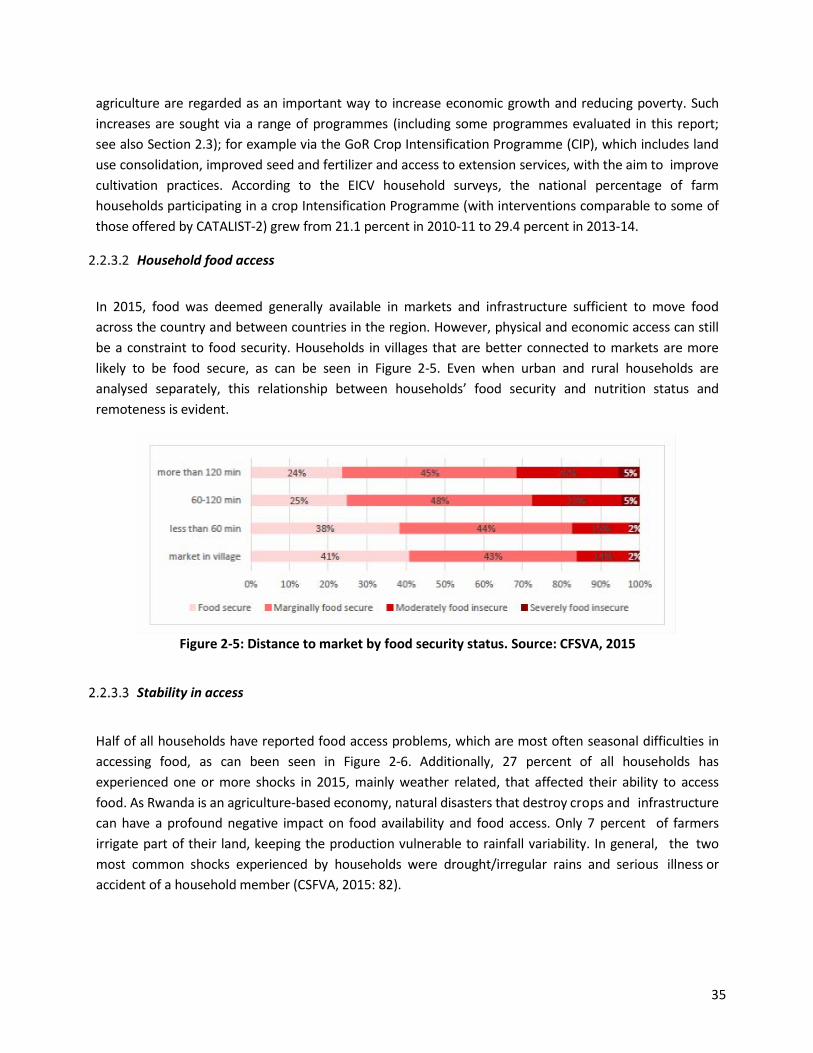
agriculture are regarded as an important way to increase economic growth and reducing poverty. Such increases are sought via a range of programmes (including some programmes evaluated in this report; see also Section 2.3); for example via the GoR Crop Intensification Programme (CIP), which includes land use consolidation, improved seed and fertilizer and access to extension services, with the aim to improve cultivation practices. According to the EICV household surveys, the national percentage of farm households participating in a crop Intensification Programme (with interventions comparable to some of those offered by CATALIST-2) grew from 21.1 percent in 2010-11 to 29.4 percent in 2013-14.
Household food access
In 2015, food was deemed generally available in markets and infrastructure sufficient to move food across the country and between countries in the region. However, physical and economic access can still be a constraint to food security. Households in villages that are better connected to markets are more likely to be food secure, as can be seen in Figure 2-5. Even when urban and rural households are analysed separately, this relationship between households’ food security and nutrition status and remoteness is evident.
Figure 2-5: Distance to market by food security status. Source: CFSVA, 2015
Stability in access
Half of all households have reported food access problems, which are most often seasonal difficulties in accessing food, as can been seen in Figure 2-6. Additionally, 27 percent of all households has experienced one or more shocks in 2015, mainly weather related, that affected their ability to access food. As Rwanda is an agriculture-based economy, natural disasters that destroy crops and infrastructure can have a profound negative impact on food availability and food access. Only 7 percent of farmers irrigate part of their land, keeping the production vulnerable to rainfall variability. In general, the two most common shocks experienced by households were drought/irregular rains and serious illness or accident of a household member (CSFVA, 2015: 82).
35
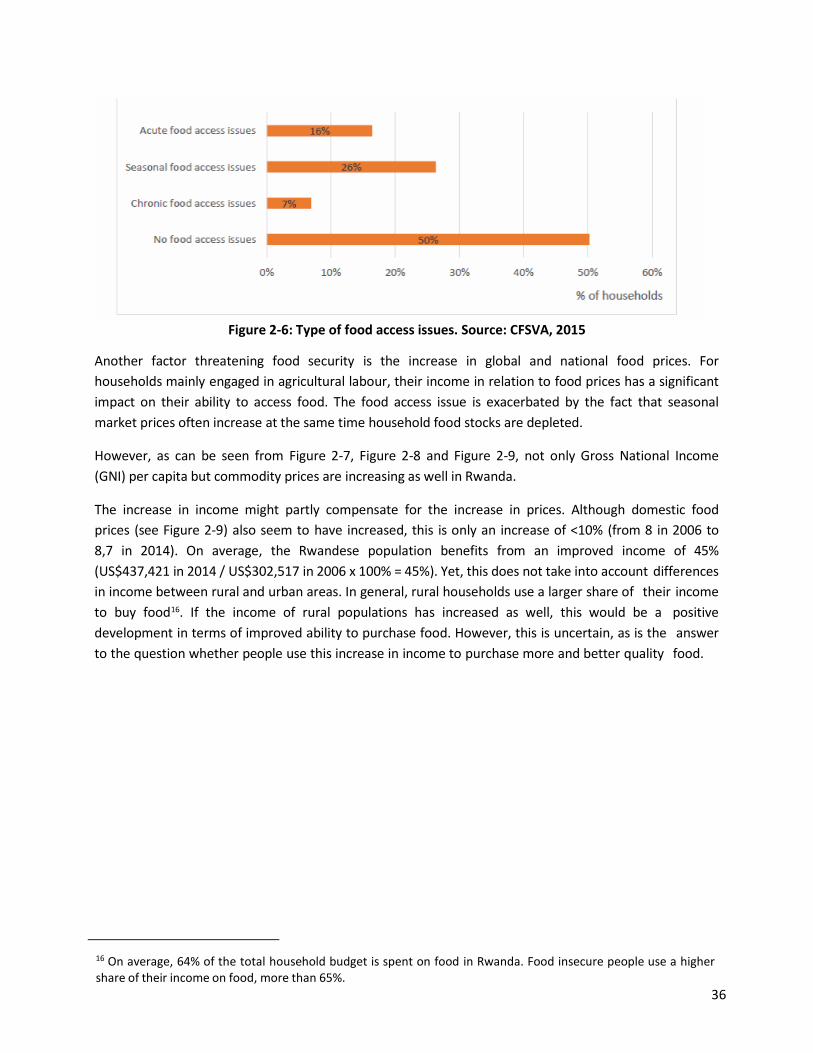
Figure 2-6: Type of food access issues. Source: CFSVA, 2015
Another factor threatening food security is the increase in global and national food prices. For households mainly engaged in agricultural labour, their income in relation to food prices has a significant impact on their ability to access food. The food access issue is exacerbated by the fact that seasonal market prices often increase at the same time household food stocks are depleted.
However, as can be seen from Figure 2-7, Figure 2-8 and Figure 2-9, not only Gross National Income (GNI) per capita but commodity prices are increasing as well in Rwanda.
The increase in income might partly compensate for the increase in prices. Although domestic food prices (see Figure 2-9) also seem to have increased, this is only an increase of <10% (from 8 in 2006 to 8,7 in 2014). On average, the Rwandese population benefits from an improved income of 45% (US$437,421 in 2014 / US$302,517 in 2006 x 100% = 45%). Yet, this does not take into account differences in income between rural and urban areas. In general, rural households use a larger share of their income to buy food16. If the income of rural populations has increased as well, this would be a positive development in terms of improved ability to purchase food. However, this is uncertain, as is the answer to the question whether people use this increase in income to purchase more and better quality food.
16 On average, 64% of the total household budget is spent on food in Rwanda. Food insecure people use a higher share of their income on food, more than 65%.
36
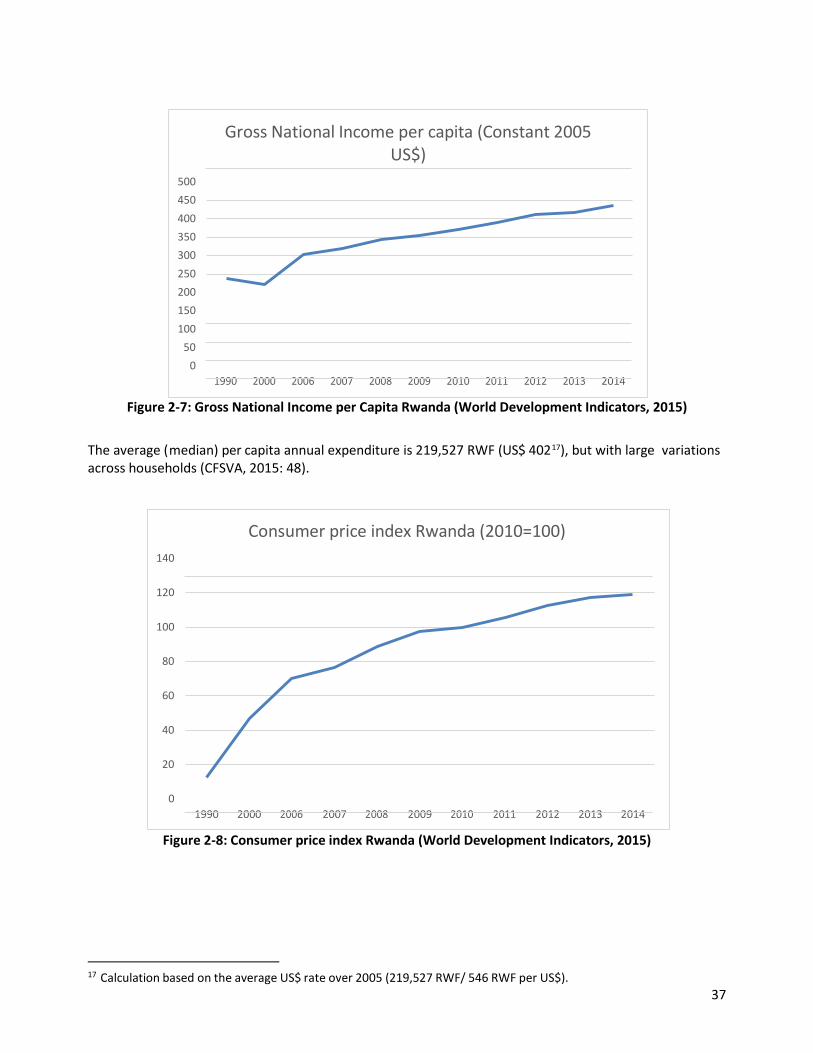
Figure 2-7: Gross National Income per Capita Rwanda (World Development Indicators, 2015)
The average (median) per capita annual expenditure is 219,527 RWF (US$ 40217), but with large variations across households (CFSVA, 2015: 48).
Figure 2-8: Consumer price index Rwanda (World Development Indicators, 2015)
17 Calculation based on the average US$ rate over 2005 (219,527 RWF/ 546 RWF per US$).
Gross National Income per capita (Constant 2005 US$)
500 450 400 350 300 250 200 150 100
50 0
2014
Consumer price index Rwanda (2010=100) 140
120
100
80
60
40
20
0
1990 2000 2007 2009 2012 2013 2014
37

Figure 2-9: Domestic food price level in Rwanda (FAOSTAT, 2013)
Food utilisation
On average, 73 percent of crops cultivated by households is used for household consumption and 19 percent is sold (CFSVA, 2015). The Food Consumption Score (FCS) is a food security indicator combining diet diversity, frequency of consumption (the number of days each food group is consumed), and the relative nutritional importance of different food groups. 74 percent of households in Rwanda have an acceptable FCS, while 19 percent a borderline FCS and seven percent poor FCS. The Western province has the highest amount of poor consumption (14 percent). Figure 2-10 illustrates the difference in food intake per threshold by the average number of days during a week food items were consumed. Linking food consumption to food security, households with the poorest consumption and lowest dietary diversity (four food groups or lower) belong to the food insecure group. Consequently, food insecure households have nutrient-low diets and are at high risk of suffering deficiencies and health problems.
Figure 2-10: Average number of days during a week food items were consumed (CFSVA, 2015)
38

2.2.4 Food insecurity trends 2012 – 2015 What are the trends of food insecurity over the period 2012-2015?
According to FAO18 (2015), the prevalence of undernourishment in 2014-2016 will decline to just one in 9 or 10.9 percent of the world population (compared to 14.9 percent in 2000-2002). The estimated reduction of prevalence in undernourishment in developing regions is one percentage point above the desired MDG target of 2015. Yet, progress is uneven amongst the regions in the world. Compared to Latin America and Eastern Asia, progress in Sub-Saharan Africa remains slow and is worrisome. The number of undernourished continues to be the highest in the East African region. Rwanda is expected to reach the goal of reducing by half the number of people who suffer from hunger by 2020 (FAO, 2015: 12). Figure 2-11 below shows Rwanda’s progress towards reducing undernourishment. From 2010-2012 to 2014-2016 the proportion of undernourished in the total population of Rwanda declined from 35.4 percent to 31.6 percent.
Figure 2-11: Undernourishment in Rwanda (FAO, IFAD and WFP, 2015: 44)
The United Nations have predicted that the world population will grow to 9.7 billion people in 2050 and even further after that date (United Nations, 2015). Most growth will take place in developing countries, especially in Sub-Saharan Africa. With an annual population growth of 2.53 percent, Rwanda has one of the fastest growing populations in Africa and, therefore, faces a serious challenge to its food security.
Especially in East Africa, including Rwanda, El Nino related droughts contribute to food insecurity and malnutrition19. On the other hand, above-normal rainfall related to El Nino, such as in Rwanda October- December 2015, may have a favourable impact on production.
In 2015, one in four children around the world was estimated to be affected by stunting and one in seven was underweight (WHO, 201620: 73). However, improvements have been made. The prevalence of underweight among children under five years declined from 25% to 14% between 1990 and 2015. Since reducing malnutrition is essential to improving health, including that of women and children, the SDGs
18 FAO, IFAD and WFP. (2015). The State of Food Insecurity in the World 2015. 19 WFP VAM. (March 2016). Global Food Security Update. Retrieved from: http://vam.wfp.org/sites/global_update/March_2016/Index.htm 20 WHO. (2015). Health in 2015: From MDGs to SDGs. Retrieved from: http://www.who.int/gho/publications/mdgs-sdgs/en/
39
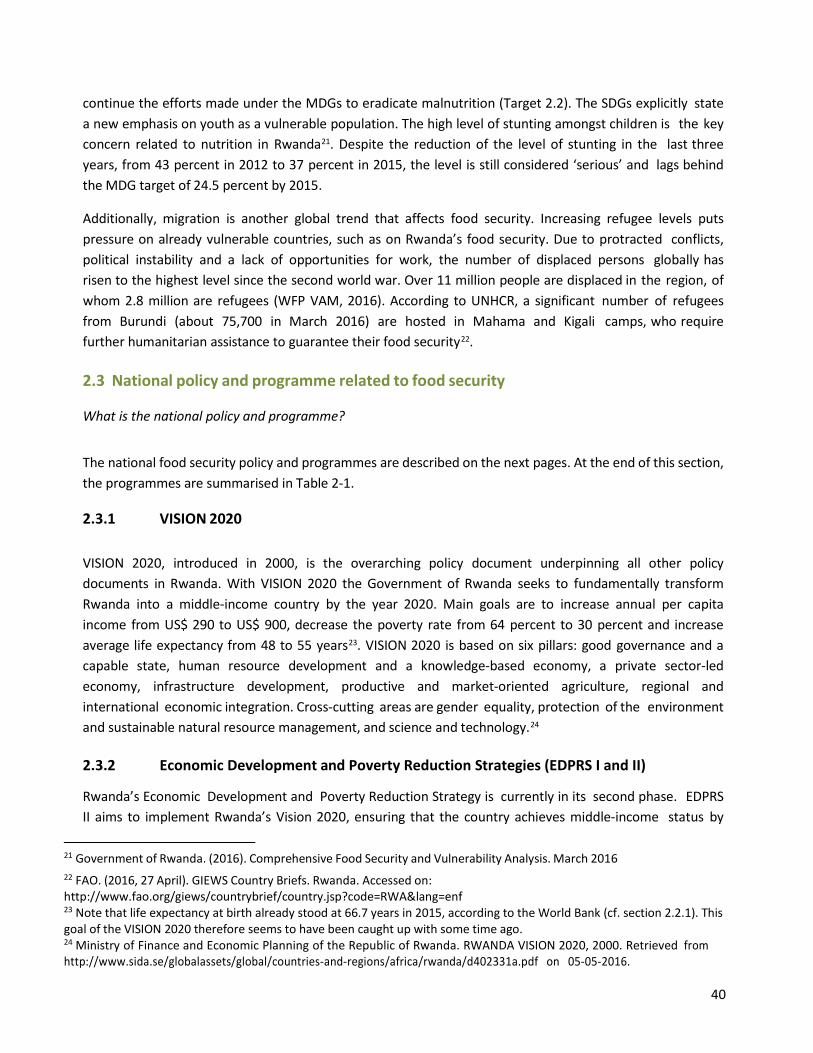
continue the efforts made under the MDGs to eradicate malnutrition (Target 2.2). The SDGs explicitly state a new emphasis on youth as a vulnerable population. The high level of stunting amongst children is the key concern related to nutrition in Rwanda21. Despite the reduction of the level of stunting in the last three years, from 43 percent in 2012 to 37 percent in 2015, the level is still considered ‘serious’ and lags behind the MDG target of 24.5 percent by 2015.
Additionally, migration is another global trend that affects food security. Increasing refugee levels puts pressure on already vulnerable countries, such as on Rwanda’s food security. Due to protracted conflicts, political instability and a lack of opportunities for work, the number of displaced persons globally has risen to the highest level since the second world war. Over 11 million people are displaced in the region, of whom 2.8 million are refugees (WFP VAM, 2016). According to UNHCR, a significant number of refugees from Burundi (about 75,700 in March 2016) are hosted in Mahama and Kigali camps, who require further humanitarian assistance to guarantee their food security22. 2.3 National policy and programme related to food security What is the national policy and programme?
The national food security policy and programmes are described on the next pages. At the end of this section, the programmes are summarised in Table 2-1.
2.3.1 VISION 2020
VISION 2020, introduced in 2000, is the overarching policy document underpinning all other policy documents in Rwanda. With VISION 2020 the Government of Rwanda seeks to fundamentally transform Rwanda into a middle-income country by the year 2020. Main goals are to increase annual per capita income from US$ 290 to US$ 900, decrease the poverty rate from 64 percent to 30 percent and increase average life expectancy from 48 to 55 years23. VISION 2020 is based on six pillars: good governance and a capable state, human resource development and a knowledge-based economy, a private sector-led economy, infrastructure development, productive and market-oriented agriculture, regional and international economic integration. Cross-cutting areas are gender equality, protection of the environment and sustainable natural resource management, and science and technology.24
2.3.2 Economic Development and Poverty Reduction Strategies (EDPRS I and II)
Rwanda’s Economic Development and Poverty Reduction Strategy is currently in its second phase. EDPRS II aims to implement Rwanda’s Vision 2020, ensuring that the country achieves middle-income status by
21 Government of Rwanda. (2016). Comprehensive Food Security and Vulnerability Analysis. March 2016 22 FAO. (2016, 27 April). GIEWS Country Briefs. Rwanda. Accessed on: http://www.fao.org/giews/countrybrief/country.jsp?code=RWA&lang=enf 23 Note that life expectancy at birth already stood at 66.7 years in 2015, according to the World Bank (cf. section 2.2.1). This goal of the VISION 2020 therefore seems to have been caught up with some time ago. 24 Ministry of Finance and Economic Planning of the Republic of Rwanda. RWANDA VISION 2020, 2000. Retrieved from http://www.sida.se/globalassets/global/countries-and-regions/africa/rwanda/d402331a.pdf on 05-05-2016.
40
2020.25 The overarching goal of EDPRS II is the following: “Accelerating progress to middle income status and better quality of life for all Rwandans through sustained average GDP growth of 11.5 percent and accelerated reduction of poverty to less than 30 percent of the population” (Ministry of Finance and Economic Planning of the Republic of Rwanda26, 2013: 1). The following objectives are set: rapid economic growth to middle income status, increased poverty reduction, more off-farm jobs and more urbanization, reduced external dependency, and private sector as engine of growth. Four thematic areas are designed to address these objectives: economic transformation, rural development, productivity and youth employment, and accountable governance (Ministry of Finance and Economic Planning of the Republic of Rwanda, 2013). EDPRS II recognizes the food consumption scores reported in the Comprehensive Food Security and Vulnerability Analysis and Nutrition Survey 2012 by the World Food Programme and the high levels of stunting reporting in the 2014/2015 Health and Demographic Survey and therefore highlights food security and reduced malnutrition as key long-term strategic priorities. EDPRS II proposes community-based nutrition programmes and country-wide campaigns to reduce the rates of chronic malnutrition and to stabilize rural incomes (Ministry of Agriculture of Rwanda, National Institute of Statistics of Rwanda, and the World Food Programme, 2016: 9). 2.3.3 Third Health Sector Strategic Plan 2012-2018 (HSSP III)
The Third Health Sector Strategic Plan 2012-2018 provides strategic guidance to health, in correspondence with national and international policies and commitments (Ministry of Health, 201227). Food security is included in priority number 1, as well as child and maternal healthcare, and disease control. The HSSP III has set targets for reducing the prevalence of underweight children below five from 11 to 4 percent and prevalence of stunting among children 6-59 months from 44 to 18 percent by 2018. According to the HSSP III, the decrease in underweight results can be allocated to a better geographical and financial access to health care (Ministry of Health, 2012: 10). The health sector is deemed to be able to make crucial contributions to improving living conditions in rural areas of the country. The plan also underlines the importance of networking amongst cross-cutting issues in the health sector, such as nutrition, road safety, sanitation, child growth, etc.
2.3.4 Technical and Vocational Education and Training (TVET policies)
Several projects of EKN under the food security programme have a strong capacity building (private sector, vocational education, etc.) link. Those projects are considered as contributing to an increase in income and consequently, increase of access to food. This will be explained in more detail in Chapter 3 (see projects 19160 – TVET Skills Development and 23743 – HIMO PDED II Consolidation). In this and the following
25 Government of Rwanda, ministry of Health, ministry of Agriculture, ministry of Local Government. National food and nutrition strategic plan 2013-2018, (18 October 2013). 26 Ministry of Finance and Economic Planning of the Republic of Rwanda. Economic Development and Poverty Reduction Strategy II (EDPRS2) 2013-2018, May 2013. Retrieved from: http://www.minecofin.gov.rw/fileadmin/templates/documents/NDPR/EDPRS_2.pdf 27 Government of Rwanda. (2012). Third Health Sector Strategic Plan 2012-2018. Ministry of Health. Retrieved from: http://www.moh.gov.rw/fileadmin/templates/Docs/HSSP_III_FINAL_VERSION.pdf
41
sections we already introduce the TVET and HIMO concepts.
The TVET policy supports the overall Vision 2020 to fundamentally transform Rwanda into a middle- income country and to become a knowledge-based and service-oriented economy. The TVET policy states that education is essential for economic and social development of the country. The objectives of the policy include among others the provision of theoretical and practical trainings in all sectors matching with the needs of enterprises and international standards and satisfy quantitative and qualitative needs of priority sectors by training required manpower for the relevant qualification areas. In August 2008, the Rwandan Cabinet approved a law that introduced the Workforce Development Authority (WDA) and an Integrated TVET System Concept Paper. In this concept paper the following sectors are identified as more potential sectors: Hotel and Tourism, Agriculture/Food processing, ICT, Building, Technical Servicing, Manufacturing, Art and Crafts.
Following the adoption of the EDPRS II, the TVET policy has been revised in September 2015 with a new policy and related strategy (the National TVET Strategy for 2015-2018) that takes into account the current environment28. Unlike the previous TVET policy of 2008, the new policy is focused on transferring skills and adopts a competence-based training (CBT) approach (Kwibuka, 201629). The emphasis of CBT (or Competence Based Approach CBA) is on mastery of specific competence by trainees instead of the number of hours spent on a lesson, chapter or module.
The National TVET Strategy requires at least Rwf 40 billion in funding every fiscal year to be successful (Kwibuka, 2016). The targets include having 60 percent of students graduating from nine-year basic education enrolled into TVET schools by 2017 (compared to the 40 percent enrolment in 2015). The number of TVET schools in the country has already been growing from 60 in 2010 to 365 in 2014.
2.3.5 Haute Intensité de Main d’Oeuvre or Labour Intensive Public Works (HIMO)
To fight poverty and to create wealth, more efforts have to be geared towards the development and efficient utilization of its most important resource – its population (Ministry of Local Government, 2008: 3). This is why not only education and professional training, but also a public works programme requiring labour-intensive methods (HIMO), are prioritized in Rwanda’s national policies. Labour-based technology (HIMO) describes “a technology that applies a labour/equipment mix that gives priority to labour, supplementing it with appropriate equipment where necessary for reasons of quality or cost.” Labour based technology is mainly based on ‘manpower’, used in construction works, production, transformation, and maintenance of works, which optimises the use and management of local resources. With the HIMO initiatives the government envisages to reduce unemployment, to provide the necessary infrastructure (e.g. also promoting agriculture by linking farmers to markets), to achieve a harmonious demobilisation and reintegration of soldiers, and to increase revenue and purchasing power in rural areas (Ministry of Local
28 Republic of Rwanda. (2015). TVET Policy. September 2015. Retrieved from: http://www.wda.gov.rw/sites/default/files/TVET%20Policy.pdf 29 Kwibuka, E. (2016). Rwanda: New Policy Tailors TVET to Labour Market Needs. Allafrica. 8 February 2016. Accessed on: http://allafrica.com/stories/201602080170.html
42
Government, 2008: 4). In general, the HIMO strategy is established in the perspective of creating economic growth and greater social equity, with activities that enhance the use of local resources and their translation to socio-economic capital. As of 1994, the HIMO approach has been institutionalized by the Government of Rwanda as part of their sustainable development initiatives. The HIMO programme has been conceived within the framework of international commitments (e.g. MDGs) and national commitments, such as the Vision 2020, EDPRS, National Investment Strategy (NIS), and others. The EKN funded project 23743 – HIMO PDED II Consolidation directly contributes to these objectives. 2.3.6 National Food and Nutrition Policy (NFNP) and National Food and Nutrition Strategy Plan (NFNSP)
The NFNP (2013) is the updated revision of the National Nutrition Policy of 2007. It describes key trends as well as challenges and opportunities related to nutrition and household food security in Rwanda. The NFNP is closely linked to Rwanda VISION 2020, the Millennium Development Goals and provides a policy base for nutrition and household food security actions that takes into account national progress and challenges. The NFNP also aligns with the EDPRS 2, sector and subsector policies and strategic plans (Government of Rwanda, 2013: 1).
The National Food and Nutrition Strategic Plan (NFNSP) (2013-2018) outlines the strategies to solve serious problems as presented in the NFNP, such as the high level of child stunting and high levels of anaemia in women and children30. The persistently high level of chronic malnutrition in children under two years is marked as highest priority (also noted in EDPRS2).
The strategic objectives of the NFNSP include: sustaining the position of food and nutrition as central priorities of the Government across Sectors at all levels and among Development Partners; strengthening and expanding services and practices that result in household food security; preventing stunting (in children under two years of age) and all forms of malnutrition; and improving governance systems and accountability (planning, budget allocation, implementation and monitoring and evaluation) for nutrition and food security. These objectives can also be found in the projects ‘Capacity Building for Food Security in Rwanda’ and ‘Access to Food for Young Children’ (see Chapter 3).
2.3.7 National Rice development strategy (NRDS)
After having been introduced in the 1960s by missionaries from South Korea, Taiwan and PRC, rice has soon become one of the major food crops grown in Rwanda and an increasingly important commodity in the Rwandan food consumption. In recent years the local production of rice has increased substantially, with a national average rice yield level of 5.7 t/ha versus the global average level of 4.3 t/ha. However, national demand exceeds the local production. The current domestic production is only able to cover 75 percent of the national annual requirement. The National Rice Development Strategy (NRDS) aims to “achieve self-
30 Ministry of Health (MOH) Rwanda. (2014). Rwanda National Food and Nutrition Policy Executive Summary. 3rd National Food & Nutrition Summit 2014. Retrieved from: http://moh.gov.rw/fileadmin/templates/summit/food_policy.pdf
43

sufficiency in rice production by 2018, and to substantially raise the competitiveness of Rwanda rice in local and regional markets” (MINAGRI, 2013: 2). It is intended to increase the productivity level from 5.72 t/ Ha in 2012 to 7.0 t/ Ha by 2018 and expand the area under cultivation to 28,500 by 2018 (compared to 7,350.5 ha in 2012). Further objectives are: improving the breed of quality rice varieties, improving the efficiency of fertilizer use and providing site-specific fertilizer recommendations; increasing the area under rice production; further extension services to accelerate the dissemination of technologies to farmers; searching for appropriate mechanization; improving the quality of rice; improving farmers access to markets and finances. The EKN supported project ‘Consolidation of the Marshlands’ (25059) corresponds with the objectives as set by this strategy (see Chapter 3). 2.3.8 Compact 2025 Rwanda
The “Compact 2025 Rwanda”31 was created to accelerate progress towards meeting the targets of reducing the prevalence of child stunting to 18 percent by 2018 (from 37 percent in 2015) and ending hunger and undernutrition by 2025 (Compact 2025, 2016: 1). In line with vision 2020 and EDPRSII improving food security and nutrition are considered as priority. ‘According to the Cost of Hunger in Rwanda study, the total losses associated with undernutrition are estimated at US$820 million— equivalent to 11.5 percent of GDP in 2012’ (Compact 2025, 2016: 6). Therefore, the Compact 2025 urges to fill gaps in research, policy, and implementation in order to accelerate progress. This includes more and better data on undernutrition, improved coordination across sectors, ministries, and levels of government, more investment in agricultural R&D, a strategic research agenda for implementation, systems for tracking and monitoring progress and promoting innovation in multiple sectors.
The national food security policy and programmes are summarised in table 2-1 below.
31 Compact 2025. Rwanda. Ending hunger & undernutrition. Challenges & Opportunities. Draft scoping report for roundtable discussions. March 2016. Retrieved from: http://www.compact2025.org/files/2016/03/Rwanda_Draft_Scoping_Report_03.pdf
44
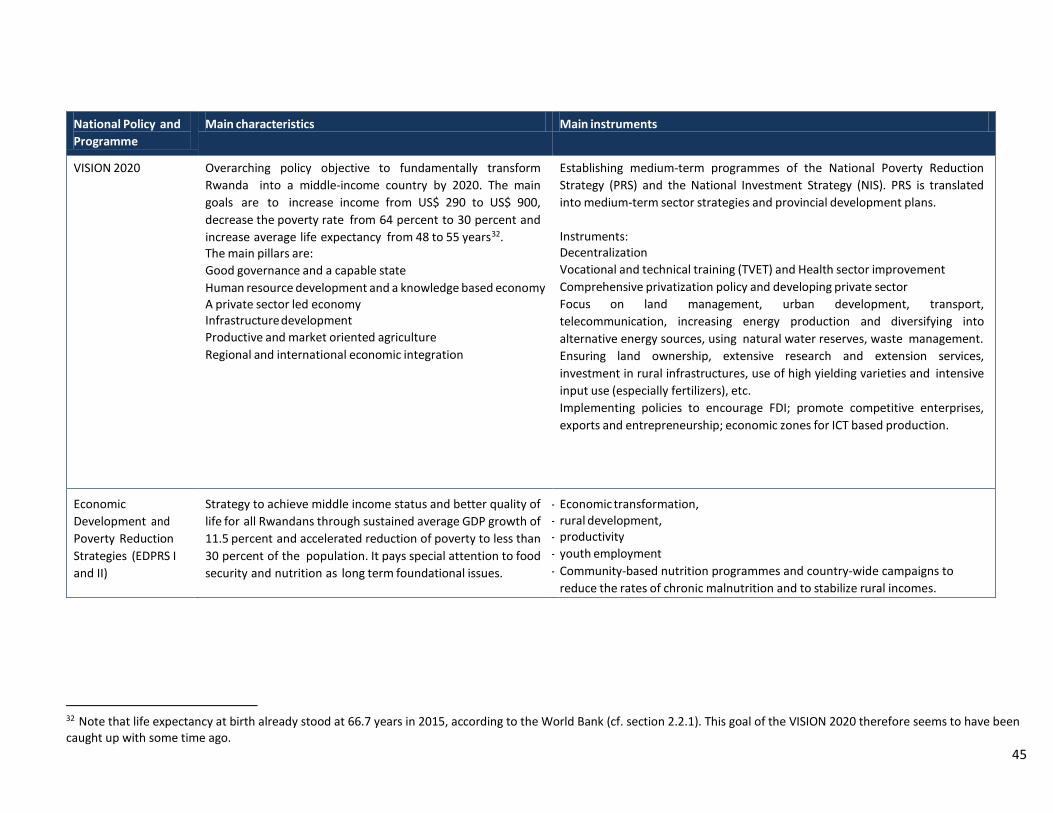
National Policy and Programme
Main characteristics Main instruments
VISION 2020 Overarching policy objective to fundamentally transform Rwanda into a middle-income country by 2020. The main goals are to increase income from US$ 290 to US$ 900, decrease the poverty rate from 64 percent to 30 percent and increase average life expectancy from 48 to 55 years32. The main pillars are:
Good governance and a capable state Human resource development and a knowledge based economy A private sector led economy Infrastructure development Productive and market oriented agriculture Regional and international economic integration
Establishing medium-term programmes of the National Poverty Reduction Strategy (PRS) and the National Investment Strategy (NIS). PRS is translated into medium-term sector strategies and provincial development plans. Instruments:
Decentralization Vocational and technical training (TVET) and Health sector improvement Comprehensive privatization policy and developing private sector Focus on land management, urban development, transport,
telecommunication, increasing energy production and diversifying into alternative energy sources, using natural water reserves, waste management.
Ensuring land ownership, extensive research and extension services, investment in rural infrastructures, use of high yielding varieties and intensive input use (especially fertilizers), etc.
Implementing policies to encourage FDI; promote competitive enterprises, exports and entrepreneurship; economic zones for ICT based production.
Economic Development and Poverty Reduction Strategies (EDPRS I and II)
Strategy to achieve middle income status and better quality of life for all Rwandans through sustained average GDP growth of 11.5 percent and accelerated reduction of poverty to less than 30 percent of the population. It pays special attention to food security and nutrition as long term foundational issues.
- Economic transformation, - rural development, - productivity - youth employment - Community-based nutrition programmes and country-wide campaigns to
reduce the rates of chronic malnutrition and to stabilize rural incomes.
32 Note that life expectancy at birth already stood at 66.7 years in 2015, according to the World Bank (cf. section 2.2.1). This goal of the VISION 2020 therefore seems to have been caught up with some time ago.
45

Third Health Sector Strategic Plan 2012-2018 (HSSP III)
HSSP III aims to continually improve the health of the people of Rwanda, by ensuring universal access to quality health services for all Rwandans. This is realized through coordinated interventions by all stakeholders at all levels, thereby enhancing the general well-being of the population and contributing to the reduction of poverty.
- Improving leadership and governance, health support systems and programmes focusing on (access and quality of) service delivery systems.
- Capacity building within the health sector, - increasing participation of private sector, - decentralization, - community mobilization and participation (Joint Action Development
Forums (JADF)) for accountable governance, and - information and education.
Technical and Vocational Education and Training (TVET policies)
Develop a regional and international TVET system that produces men and women quality graduates, with employability skills that respond to the changing demands of employers and the country’s labour market, providing them with the opportunity to engage in decent work, work for themselves, be competent entrepreneurs and engage in life-long learning.
- Establishing a ‘Workforce (Development) Planning Mechanism’ to realize a match between current and future skills demand and supply.
- Establishing a ‘National Qualification Framework’ harmonizing vertical, horizontal and diagonal pathways between education.
- Capacity building within the TVET system - Improving coordination of TVET initiatives with a TVET ‘Strategic Partnership
Framework’ - Improve TVET facilities - Expand the TVET curriculum and change to serving the industry (competency
based) - Providing career information and guidance to students and improving TVET
attractiveness - Increasing employer engagement with internships and apprenticeships
Haute Intensité de Main d’Oeuvre or Labour Intensive Public Works (HIMO)
Reduce unemployment, to provide the necessary infrastructure (e.g. also promoting agriculture by linking farmers to markets), to achieve a harmonious demobilisation and reintegration of soldiers, and to increase revenue and purchasing power in rural areas.
Labour-based public works projects employing local (poor) people for construction works, production, and maintenance of works.
46
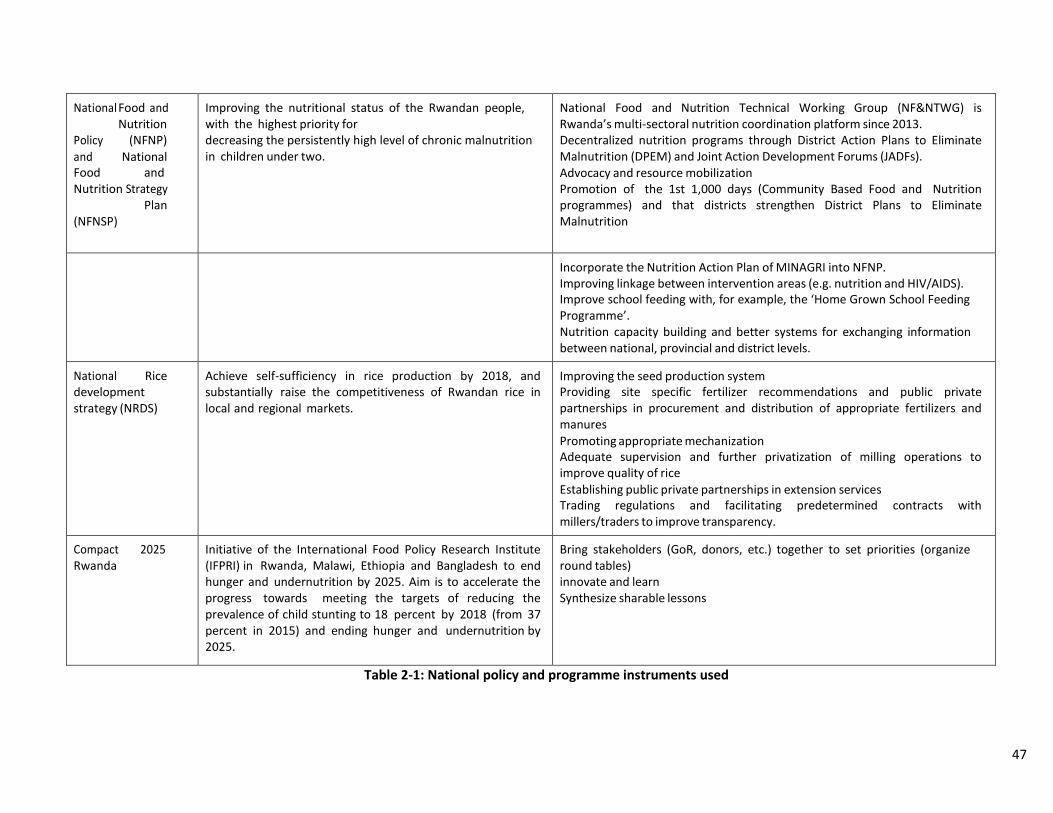
National Food and Nutrition Policy (NFNP) and National Food and Nutrition Strategy Plan (NFNSP)
Improving the nutritional status of the Rwandan people, with the highest priority for decreasing the persistently high level of chronic malnutrition in children under two.
National Food and Nutrition Technical Working Group (NF&NTWG) is Rwanda’s multi-sectoral nutrition coordination platform since 2013.
Decentralized nutrition programs through District Action Plans to Eliminate Malnutrition (DPEM) and Joint Action Development Forums (JADFs).
Advocacy and resource mobilization Promotion of the 1st 1,000 days (Community Based Food and Nutrition
programmes) and that districts strengthen District Plans to Eliminate Malnutrition
Incorporate the Nutrition Action Plan of MINAGRI into NFNP. Improving linkage between intervention areas (e.g. nutrition and HIV/AIDS). Improve school feeding with, for example, the ‘Home Grown School Feeding
Programme’. Nutrition capacity building and better systems for exchanging information
between national, provincial and district levels.
National Rice development strategy (NRDS)
Achieve self-sufficiency in rice production by 2018, and substantially raise the competitiveness of Rwandan rice in local and regional markets.
Improving the seed production system Providing site specific fertilizer recommendations and public private
partnerships in procurement and distribution of appropriate fertilizers and manures
Promoting appropriate mechanization Adequate supervision and further privatization of milling operations to
improve quality of rice Establishing public private partnerships in extension services Trading regulations and facilitating predetermined contracts with
millers/traders to improve transparency.
Compact 2025 Rwanda
Initiative of the International Food Policy Research Institute (IFPRI) in Rwanda, Malawi, Ethiopia and Bangladesh to end hunger and undernutrition by 2025. Aim is to accelerate the progress towards meeting the targets of reducing the prevalence of child stunting to 18 percent by 2018 (from 37 percent in 2015) and ending hunger and undernutrition by 2025.
Bring stakeholders (GoR, donors, etc.) together to set priorities (organize round tables)
innovate and learn Synthesize sharable lessons
Table 2-1: National policy and programme instruments used
47
2.4 Programmes of the main other donors in the country
What are the programmes of the main other donors in the country?
The number of stakeholders working to advance food security and nutrition in Rwanda is growing. In 2015, 65 food and nutrition stakeholders from government, UN agencies, research, civil society, bilateral and multilateral donors, private sector, and other development partners are working at national and subnational levels in Rwanda to end hunger and undernutrition (Compact 2025, 2016: 13). In 2014, net Official Development Aid (ODA) comprised of US$ 1.034,0 million33. This section will look at the several active donors (besides the Netherlands) in combatting food insecurity in Rwanda.
The other donors active in the field of food security in Rwanda are listed below, with several programme examples. Detailed information about the programmes and donor expenditures can be found in the Annex XIII.
• USAID – Feed the Future
• The Global Agriculture and Food security Program (GAFSP) (USA) - Land Husbandry, Water Harvesting and Hillside Irrigation Project (LWH)
• Australian International Food Security Research Centre (AIFSRC) - Trees for Food Security
• Caritas Europe – Projects supporting farmer cooperatives
• Canadian Foodgrains Bank – Learning Environmental Adaptions for Food Security (LEAF).
• International Fund for Agricultural Development (IFAD) (UN Agency) – Funding the PSTA III programme (an agricultural project initiated by the Government of Rwanda); Climate resilient post-harvest and agribusiness support project; Project for rural income through exports (PRICE); Kirehe community-based watershed management project (KWAMP)
• Food and Agricultural Organisation (FAO) – Capacity Development for Agricultural Innovation Systems (CDAIS) project
• World Food Programme (WFP) – Purchase for Progress (P4P) initiative; Funding government programmes focusing on Maternal, Infant and Young Child Nutrition (MIYCN), School Nutrition and Supplementary Feeding; Food assistance to refugees
• UNICEF – supporting Government’s programmes in the areas of MIYCN; Promoting hygiene and sanitation (WASH project)
33 OECD. (2016). Workbook OECD DAC aid at a glance. Rwanda. Last update 27 February 2016. Accessed on: https://public.tableau.com/views/OECDDACAidataglancebyrecipient_new/Recipients?:embed=y&:display_count=y es&:showTabs=y&:toolbar=no?&:showVizHome=no
48
2.5 Summary
In this chapter we have discussed the characteristics of food (in)security in Rwanda, the trends in food security, and an overview of food security related programmes, both from GoR and other donors. Although food security in Rwanda is increasing, there are still more than 1,9 million food insecure households. These are mostly rural households, dependent on low-income agricultural labour/production, less educated, having a small size of land and low crop diversity. Other factors contributing to food insecurity are: being a female headed household, physical and economic household access to markets, and weather related risks (droughts/rains). To combat poverty and food insecurity GoR has ensured many national policies and programmes are in place, for example focusing on infrastructure development, increasing agricultural production and improving human development (health, nutrition, education and employment). In addition, donors help contributing to these national goals related to food security. In the next chapters we will address the evaluation questions and present our findings of this study against the backdrop of the context described above.
49
3. Evaluation of the project portfolio
This chapter starts with a description of the evaluation questions and the hypotheses of this portfolio evaluation (3.1). Subsequently the approach used for the portfolio evaluation is presented (3.2). This is followed by answering the main evaluation questions in the rest of the chapter.
3.1 Description evaluation questions
1. At the start of this impact evaluation the following evaluation questions were presented by IOB (ToR 2013) for the period 2012-2015: What is the composition and motivation for the Dutch food security country programme 2012-2015?
2. What instruments are used and what is the synergy in tackling food security?
3. How does the expenditure relate to the number of directly and indirectly targeted beneficiaries and to the expected food security effect per beneficiary?
4. What are the effects of the Dutch country programme on food security?
In addition to this questions, IOB has formulated sub-questions which be covered in the following sections. The extended version of those evaluations questions and the hypotheses are included in Annex XVII.
5. What is the composition and motivation of the Dutch food security country programme 2012- 2015 (Section 3.3):
a. What is the link between the Dutch strategy and the (broader) analysis of food insecurity in the country?
b. What projects are part of the food security portfolio?
c. What is the synthesis of the followed impact pathways?
6. What instruments are used and what is the synergy in tackling food security? (Section 3.4):
a. What instruments and channels are used (central-decentral, bilateral, multilateral; government, NGO, private sector)?
b. What is the coherence and synergy of the Dutch food security programme?
7. Effectiveness (Section 3.5):
a. To what extent is the anticipated pathway followed / have results been achieved?
b. To what extent can changes be attributed to the project pathway, alternative pathways, or other factors?
50

c. Up to what level and impact has the food security of targeted households improved?
d. What is the evidence that food insecure people have been reached, directly or indirectly? How have women benefited?
8. Costs and efficiency (Section 3.6):
a. How many direct and indirect beneficiaries have been reached?
b. How does project expenditure compare to the number of beneficiaries?
c. What can be concluded on the value of effects per beneficiary, and about their cost- effectiveness?
Next to the evaluation questions we will describe the approach for the portfolio evaluation, (Section 3.2), the sustainability of the programme (Section 3.7); and unplanned, positive of negative, effects of the programme (Section 3.8). The hypotheses for this evaluation are included in Annex XVII as well. The information gathered to answer the evaluation questions forms the basis to address the hypotheses. In Chapter 5 we will present the overall conclusions for each of the evaluation questions and hypotheses.
3.2 Approach portfolio evaluation
The EKN food security portfolio in Rwanda consists of 15 projects (including the Front Office Fund and CATALIST-234). Although EKN considers this group of projects to be the food security programme, for some their primary objective is not to increase food security and not all of them have an explicit food security objective in the project theory of change. We will return to this point in section 3.3.3. An overview of the projects is presented in Table 3-1 and Annex I. In Annex IX a detailed description is given of these projects, their objectives and achieved results.
This evaluation started in 2013 and contained three stages. The first stage was the inception phase, aimed at gaining insight in the information and documentation available. We established our working relationships with the embassy in Kigali and our local partners PwC Rwanda and the University of Rwanda. In November 2013 the first visit to Rwanda took place, the inception visit. This was followed by an Inception workshop in the Netherlands with all evaluators working on Food Security country evaluations in Bangladesh, Ethiopia, Uganda and Rwanda. After desk research and setting up the evaluation approach we delivered the inception report to IOB in early 2014.
Secondly, we conducted the baseline study in 2014. Documents such as appraisal documents, mid-term reports, final & narrative reports were used to carry out the desk research. After collecting the information, we went on a second visit to Rwanda in March 2014, where we interviewed all project
34 CATALIST-2 will be presented in Chapter 4 in more detail. The Front Office Fund (FOF) is a basket fund that was used to finance many small projects. It was agreed with IOB that the FOF would not be included in the evaluation, as food security impact should be expected to be fragmented and limited.
51
implementers, embassy staff and some other donors involved in the EKN food security programme. During the baseline only few projects had already been completed and most of the projects were still in progress.
In order to assess the state of the EKN food security portfolio, project implementers were asked between the baseline and end line phase to fill in a self-evaluation (Annex III) about the project and its contribution to the food security programme. We opted for this approach to have a better view on the progress of the projects and to serve as input for the evaluation team to prepare the end line phase.
The third stage was the end line evaluation, with a third visit to Rwanda that took place in March 2016. This stage included desk research of new available documents such as final reports of projects that recently ended, and a more targeted review of food security literature in view of issue encountered in the projects. Besides we had to take into consideration the changes in the Dutch Food Security Policy and the new MASP of EKN as described in Annex XV. In addition, the end line consisted of:
A. the portfolio evaluation of 14 projects (the EKN Front Office Fund excluded) for a standard assessment;
B. the in-depth qualitative evaluation of 3 projects;
C. the in-depth quantitative and qualitative evaluation of CATALIST-2.
For the components A to C we prepared the analysis plan of qualitative evaluation (Annex II) and the interview guidelines (Annex VII). The portfolio interviews were structured following general interview questions and specific interview questions for the project, the latter raising issues that were not clear after the desk research. During the end line visit project implementers were interviewed for the standard assessment, in-depth portfolio evaluation and CATALIST-2 case study.
The project portfolio field visit took place in Kigali from 2-10 March 2016. In that timeframe stakeholders of all 14 projects were interviewed, 3 projects were visited on-site and data collection for the qualitative CATALIST-2 evaluation took place. Data collection for the quantitative project-level evaluation of CATALIST-2 was done from 15 February – 3 March 2016 and is described in Chapter 4. An overview of all interviewees is included in Annex V.
The in-depth qualitative evaluation aimed to have a better insight in the project implementation, participation of beneficiaries, their knowledge of the project and the impact the project had on them. The following projects were involved in the qualitative portfolio in-depth evaluation:
• Local Demand Driven Investments projects through RLDSF – Local Development Agency (‘LODA’) - 24371/ 25542;
• Consolidation of Marshland Development – 25059; and,
• Access to Food For Young Children - 25457.
For those projects we visited the project locations, interviewed representatives of local government, local implementing project staff and beneficiaries (see Annex V). The field visit took place in the district
52
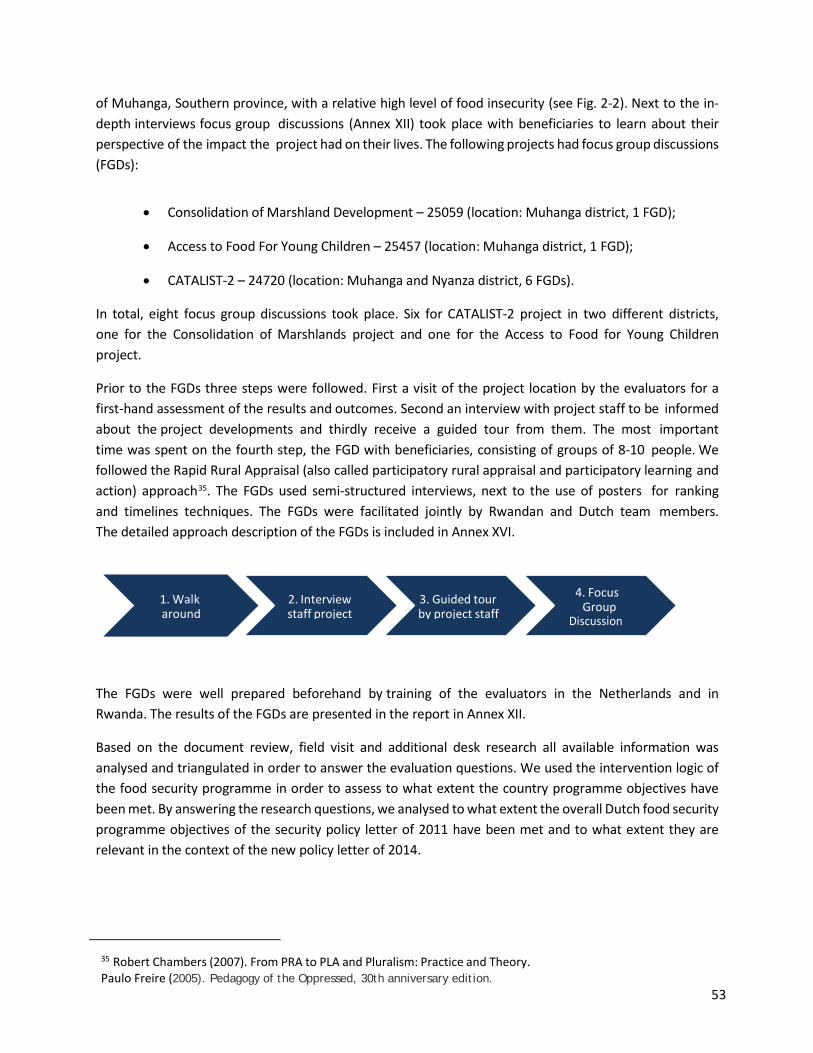
of Muhanga, Southern province, with a relative high level of food insecurity (see Fig. 2-2). Next to the in-depth interviews focus group discussions (Annex XII) took place with beneficiaries to learn about their perspective of the impact the project had on their lives. The following projects had focus group discussions (FGDs):
• Consolidation of Marshland Development – 25059 (location: Muhanga district, 1 FGD);
• Access to Food For Young Children – 25457 (location: Muhanga district, 1 FGD);
• CATALIST-2 – 24720 (location: Muhanga and Nyanza district, 6 FGDs).
In total, eight focus group discussions took place. Six for CATALIST-2 project in two different districts, one for the Consolidation of Marshlands project and one for the Access to Food for Young Children project.
Prior to the FGDs three steps were followed. First a visit of the project location by the evaluators for a first-hand assessment of the results and outcomes. Second an interview with project staff to be informed about the project developments and thirdly receive a guided tour from them. The most important time was spent on the fourth step, the FGD with beneficiaries, consisting of groups of 8-10 people. We followed the Rapid Rural Appraisal (also called participatory rural appraisal and participatory learning and action) approach35. The FGDs used semi-structured interviews, next to the use of posters for ranking and timelines techniques. The FGDs were facilitated jointly by Rwandan and Dutch team members. The detailed approach description of the FGDs is included in Annex XVI.
The FGDs were well prepared beforehand by training of the evaluators in the Netherlands and in Rwanda. The results of the FGDs are presented in the report in Annex XII.
Based on the document review, field visit and additional desk research all available information was analysed and triangulated in order to answer the evaluation questions. We used the intervention logic of the food security programme in order to assess to what extent the country programme objectives have been met. By answering the research questions, we analysed to what extent the overall Dutch food security programme objectives of the security policy letter of 2011 have been met and to what extent they are relevant in the context of the new policy letter of 2014.
35 Robert Chambers (2007). From PRA to PLA and Pluralism: Practice and Theory. Paulo Freire (2005). Pedagogy of the Oppressed, 30th anniversary edition.
1. Walkaround
2. Interviewstaff project
3. Guided tourby project staff
4. FocusGroup
53
3.3 Composition and motivation of the Dutch food security programme 2012-2015 (evaluation question 1)
3.3.1 Overview & strategy EKN projects in food security portfolio
Composition of the Dutch food security programme 2012-2015
The table below presents an overview of all the fifteen EKN projects in the food security programme. As mentioned earlier in this report, CATALIST-2 and the Front Office Fund are not part of the project portfolio evaluation.
54
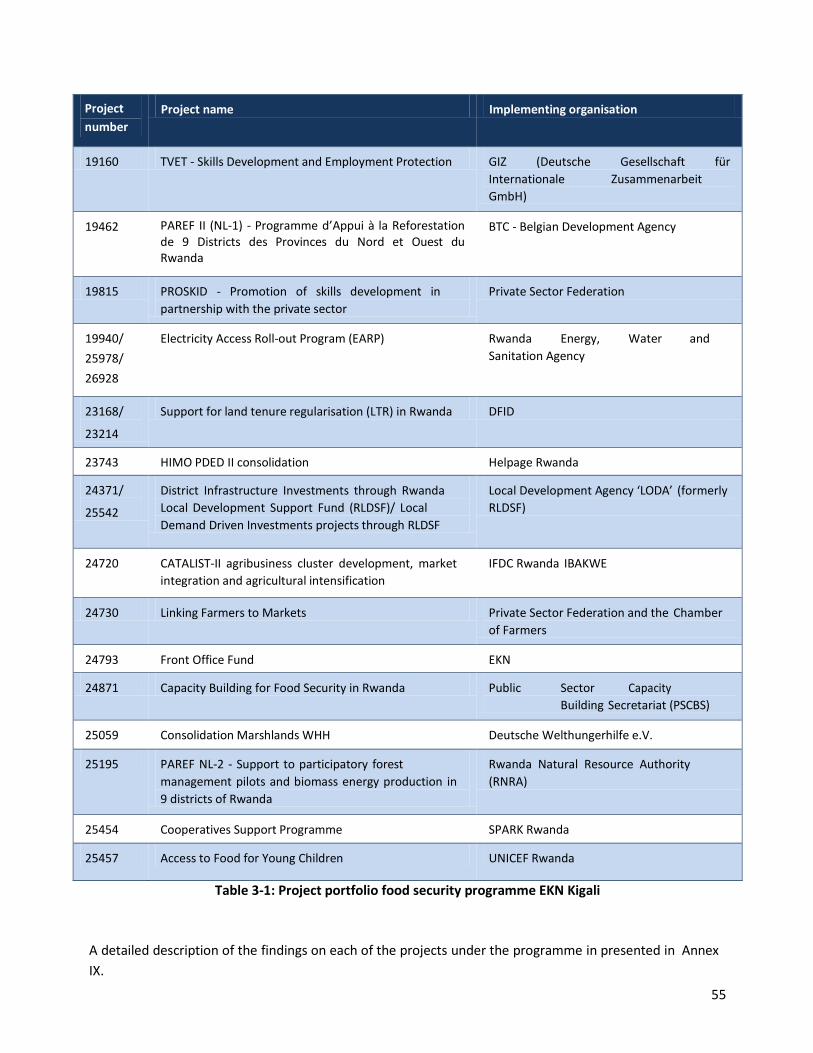
Project number
Project name Implementing organisation
19160 TVET - Skills Development and Employment Protection GIZ (Deutsche Gesellschaft für Internationale Zusammenarbeit GmbH)
19462 PAREF II (NL-1) - Programme d’Appui à la Reforestation de 9 Districts des Provinces du Nord et Ouest du Rwanda
BTC - Belgian Development Agency
19815 PROSKID - Promotion of skills development in partnership with the private sector
Private Sector Federation
19940/ 25978/ 26928
Electricity Access Roll-out Program (EARP) Rwanda Energy, Water and Sanitation Agency
23168/
23214
Support for land tenure regularisation (LTR) in Rwanda DFID
23743 HIMO PDED II consolidation Helpage Rwanda
24371/
25542
District Infrastructure Investments through Rwanda Local Development Support Fund (RLDSF)/ Local Demand Driven Investments projects through RLDSF
Local Development Agency ‘LODA’ (formerly RLDSF)
24720 CATALIST-II agribusiness cluster development, market integration and agricultural intensification
IFDC Rwanda IBAKWE
24730 Linking Farmers to Markets Private Sector Federation and the Chamber of Farmers
24793 Front Office Fund EKN
24871 Capacity Building for Food Security in Rwanda Public Sector Capacity Building Secretariat (PSCBS)
25059 Consolidation Marshlands WHH Deutsche Welthungerhilfe e.V.
25195 PAREF NL-2 - Support to participatory forest management pilots and biomass energy production in 9 districts of Rwanda
Rwanda Natural Resource Authority (RNRA)
25454 Cooperatives Support Programme SPARK Rwanda
25457 Access to Food for Young Children UNICEF Rwanda
Table 3-1: Project portfolio food security programme EKN Kigali
A detailed description of the findings on each of the projects under the programme in presented in Annex IX.
55

Motivation for the Dutch food security country programme 2012-2015
During the evaluation period EKN published two Multi-Annual Strategic Plans, MASP 2012-2015 and MASP 2014-2017. In both plans EKN selected three priority areas: Security and Legal Order, Water Resources Management and Food Security. The desired country outcomes for EKN are (1) a just and fair society, (2) more food secure persons and (3) sustainable use of water resources. In Annex XV we include more information on the Dutch policy on food security of the Ministry of Foreign Affairs and the differences between both Multi-Annual Strategic Plans of EKN.
The intervention logic used for food security is presented in Figure 3-1.
Figure 3-1: Food security intervention logic, Source: MASP 2012 – 2015
56
The food security outputs that EKN wanted to realize in 2012-2015 were:
1. Improved infrastructure to produce, process, distribute, and prepare food
2. Increased influence of agri-business
3. Improved business facilitation by EKN, GoR, and service providers
4. Increased access to healthy food for very young children.
In the new MASP 2014-2017 the outcomes are almost similar, except that EKN did not include agri- business as an outcome anymore (output 1). Also the description of output 2 (in MASP 2014-2017 this is labelled “Outcome 2” of the Food Security programme) has slightly changed and is now ‘Increased capacity of government and private sector (representatives) in the field of food security’.
Through (1) an improved enabling environment for (post-harvest) agri-business, supported by output 1 and 2, and (2) better access to healthy food for young children (output 3), EKN aims to realize the country outcome of ‘more food and nutrition security in Rwanda. The assumption made by the embassy is that an improved enabling environment will lead to more and better organized agri-business (including cooperatives of small farmers) and agro-processing, commercial storage and food-related trade. It is expected that this will increase the likelihood that harvest reaches the consumer. In addition, EKN expects that people in rural areas with little or no land and unable to grow their own food, will have more chance to find a job, gain income and become food secure.
Between the embassy outputs and country outcomes EKN distinguishes several intermediate outcomes such as reduction of post-harvest losses, so that more food and food of better quality can reach the consumer (‘more efficient markets’). Another intermediate outcome described in the MASP 2012-2015 is ‘people that grow little or no food need income to buy it and vulnerable groups at the household level need enough nutrition (‘better access to healthy food’).
EKN proceeds in the MASP 2012-2015 with the fact that binding constraints need to be tackled to improve the enabling environment. A few of those binding constraints mentioned are a ‘lack of skilled labour, limited access to finance, inaccessible roads, high electricity prices and uncertainty about land’36. Another constraint is the demand for skilled labour. This is already covered by other donors focusing on TVET (see Chapter 2). As a consequence, EKN chose to limit itself to improved service delivery to the private sector. All of those binding constraints have been addressed by EKN by the selection of the projects that are part of this food security impact evaluation.
The intervention logic of EKN follows a similar logic as the literature presented in Chapter 2, stating that improved food security and nutrition requires that food is available, accessible and of sufficient quantity and quality. Nevertheless, we observe that the focus of EKN on sufficient quantity and quality of food is limited to a single project (output 3.1) covering the quality of food for a specific demographic (young children). The quantity of food is covered in several projects aiming to increase the productivity such as the ‘Consolidation of Marshlands’ project. In Chapter 2 we mentioned that food insecure households are typically poor rural households, which are dependent on daily agricultural labour, agriculture or
36 EKN, Kigali. Multi-annual strategic plan (EKN MASP) 2012 – 2015, p. 13. 57
external support for their livelihoods. In addition, food insecure households tend to have less livestock, less agricultural land, lower food stocks, grow fewer crops, are less likely to have a vegetable garden, and consume more of their own production at home. EKN has tried to address this with for example job creation which was part of the projects Skills Development and Employment Protection, PROSKID HIMO PDED II and PAREF NL-2. Also the Land Tenure programme contributed to more clarity about land ownership, aiming for more productive use of land. Furthermore the HIMO PDED II, Consolidation of Marshlands, Infrastructure Investments and Access to food for young children projects contributed to households growing more crops. The latter two projects also stimulated kitchen gardens in the villages to consume more of the production at home.
Table 3-2 gives an impression on how the project portfolio fits the time scope of this evaluation and the MASPs. Six of the fifteen projects have been finalized during MASP 2012-2015. Nine projects now fall under MASP 2014-2017, eight of them are expected to be finalized by the end of 2016 and one project has been extended to 2017.
58
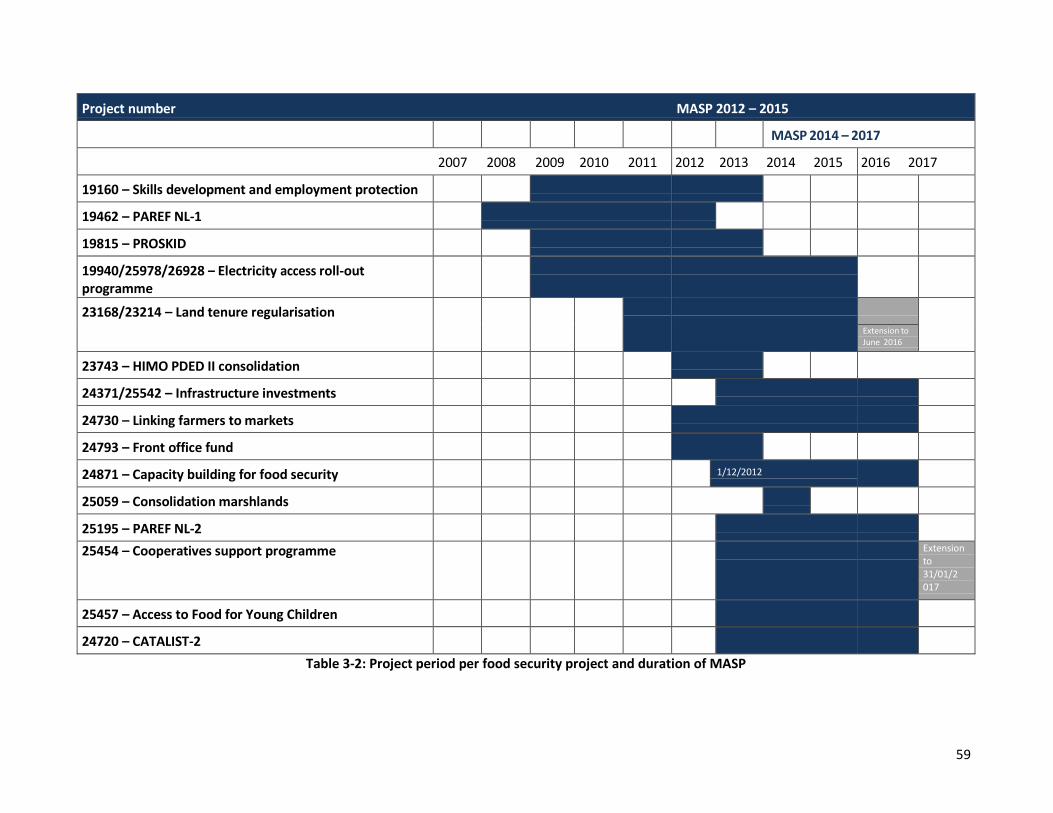
Project number MASP 2012 – 2015 MASP 2014 – 2017
2007 2008 2009 2010 2011 2012 2013 2014 2015 2016 2017
19160 – Skills development and employment protection
19462 – PAREF NL-1
19815 – PROSKID
19940/25978/26928 – Electricity access roll-out programme
23168/23214 – Land tenure regularisation Extension to June 2016
23743 – HIMO PDED II consolidation
24371/25542 – Infrastructure investments
24730 – Linking farmers to markets
24793 – Front office fund
24871 – Capacity building for food security 1/12/2012
25059 – Consolidation marshlands
25195 – PAREF NL-2
25454 – Cooperatives support programme Extension to 31/01/2 017
25457 – Access to Food for Young Children
24720 – CATALIST-2
Table 3-2: Project period per food security project and duration of MASP
59
3.3.2 Link between Dutch strategy and broader analysis food security Rwanda What is the link between the Dutch strategy and the (broader) analysis of food insecurity in the country?
We observe that in both ways the strategy of the Dutch and Rwandan government on food security are aligned or try to follow the same goals.
First from the Rwandan perspective, the GoR aims to transform Rwanda from an agricultural based economy into a modern service oriented urban society. The EKN programme focuses on key interventions contributing to this economic transformation, while keeping in mind food security.37 This can be demonstrated by the ‘Skills Development and Employment Protection’ project, which specifically focused on strengthen the SMEs and to promote employment opportunities outside the agricultural sector, through the improvement of TVET employability. The results of this evaluation indicate that EKN collaborates with and discusses its food security policy with the Government of Rwanda and the key stakeholders involved in food security (Ministry of Agriculture, Ministry of Trade and Industries, Ministry of Health).
To proceed the Dutch and Rwandan Food Security Policies also emphasize private sector development as catalyst of national development. Increasing the role of the private sector will lead to the creation of jobs and, consequently, contributes to economic development. The Government of Rwanda aims to give the private sector a larger role in the agricultural sector than the government. Yet, it remains a challenge to involve the private sector.
EKN has considered both Dutch and Rwandan objectives to define its MASP. In line with the Dutch development priorities and Rwanda’s Vision 2020 (set by the Government of Rwanda), EKN has selected Food Security as one of the priority areas in its MASP 2012-2015. Furthermore, the government of Rwanda introduced its new poverty reduction strategy (EDPRS II) in 2013. This is the same year that the National Food and Nutrition Policy and National Food and Nutrition Plan of the GoR were published. One of the focus points is preventing stunting with children aged under 2. Based on these policy changes, EKN defined a new MASP for the period 2014-2017. It can be observed that the project ‘Access to food for young children’ (started in 2013), which is focused at preventing stunting with children under 2, almost exactly follows the goals of the GoR ambitions. This example illustrates that the EKN strategy takes into consideration the national strategy and is aligned to it.
Another example is that the Dutch government changed its focus from bilateral development aid to more trade. In MASP 2012-2015 it was mentioned that the government of Rwanda embraces this approach and wants to work become more self-reliant and less aid dependent. In MASP 2014-2017 this shift resulted in a country outcome for economic development stating: “NL relationship with Rwanda becomes a ‘transitional relationship’ rather than an ‘aid relationship’, meaning that while aid remains at an adequate level, efforts are being made to increase trade and investment.”
In sum, on the one hand the Dutch strategy for food security closely aligns with the national policies of the Government of Rwanda such as the Vision 2020, EDPRS II, National TVET Strategy 2015-2018, National Food and Nutrition Strategic Plan (NFNSP) (2013-2018) and Compact 2025 Rwanda. The
37 Source: EKN Kigali, Multi-Annual Strategic Plan 2014-2017 60

Rwandan government’s vision on the other hand is fully consistent with the long-term vision ‘from aid to trade’ of the Dutch government.
3.3.3 Synthesis of the followed impact pathways
Synthesis of the followed impact pathways and underlying assumptions
Since the outputs in the new MASP 2014-2017 are for the most part similar to MASP 2012-2015, EKN continued to apply the same intervention logic for the food security programme. We therefore used the same approach as during the baseline and categorized the projects in relation to the outputs in Table 3-3. Contrary to the baseline study, we classified three projects under an additional sub-output, which is explained in a footnote in each case.
Output 1: Improved infrastructure to produce, process, distribute and prepare food.
1.1 Feeder roads built in labour intensive way 23743 – HIMO PDED II consolidation 24371/25542 – Infrastructure investments38
25059 – Consolidation of marshlands39
1.2 Demand driven local economic development 24371/25542 – Infrastructure investments 24720 – CATALIST-2 25195 – PAREF 2
1.3 Improved land registration 23168 /23214 – Land tenure regularisation
1.4 Increased access to reliable and affordable energy 19462 – PAREF 1 19940 – Electricity access programme
Output2: Strengthened capacity of government agencies, private sector and discussion fora.
2.1 Strengthened agribusiness representatives 19462 – PAREF NL-1 24720 – CATALIST-2 24871 – Capacity building for food security 24730 – Linking farmers to markets 25059 – Consolidation of marshlands
2.2 Strengthened SMEs in agribusiness sector 19160 – Skills development and employment protection
19815 – PROSKID 23743 – HIMO PDED II consolidation 24720 – CATALIST-2
38 At baseline this project was not mentioned under output 1.1. However with the endline in-depth evaluation we learned that the project also included the construction of feeder roads (at least 552 km) via the HIMO approach. 39 At baseline this project was not mentioned under output 1.1. However with the endline in-depth evaluation we learned that the project also included the construction and rehabilitation of 120 km via the HIMO / Cash for Work approach.
61
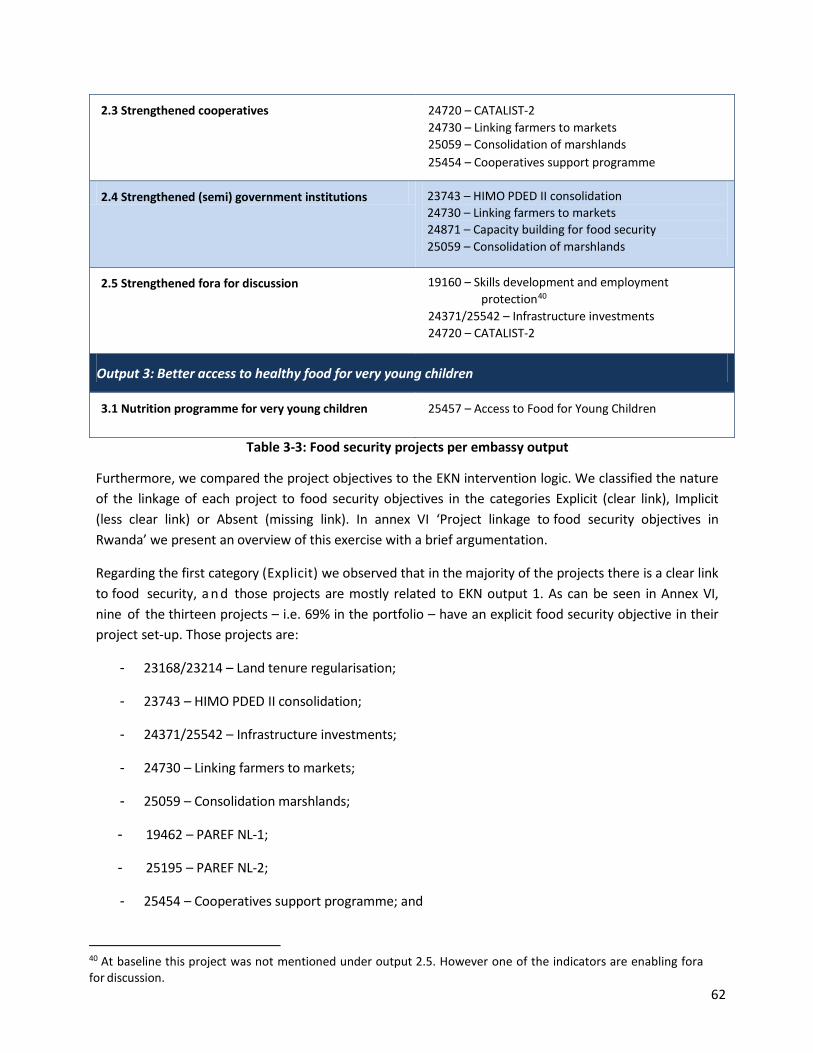
2.3 Strengthened cooperatives 24720 – CATALIST-2 24730 – Linking farmers to markets 25059 – Consolidation of marshlands 25454 – Cooperatives support programme
2.4 Strengthened (semi) government institutions 23743 – HIMO PDED II consolidation 24730 – Linking farmers to markets 24871 – Capacity building for food security 25059 – Consolidation of marshlands
2.5 Strengthened fora for discussion 19160 – Skills development and employment protection40
24371/25542 – Infrastructure investments 24720 – CATALIST-2
Output 3: Better access to healthy food for very young children
3.1 Nutrition programme for very young children 25457 – Access to Food for Young Children
Table 3-3: Food security projects per embassy output
Furthermore, we compared the project objectives to the EKN intervention logic. We classified the nature of the linkage of each project to food security objectives in the categories Explicit (clear link), Implicit (less clear link) or Absent (missing link). In annex VI ‘Project linkage to food security objectives in Rwanda’ we present an overview of this exercise with a brief argumentation.
Regarding the first category (Explicit) we observed that in the majority of the projects there is a clear link to food security, a n d those projects are mostly related to EKN output 1. As can be seen in Annex VI, nine of the thirteen projects – i.e. 69% in the portfolio – have an explicit food security objective in their project set-up. Those projects are:
- 23168/23214 – Land tenure regularisation;
- 23743 – HIMO PDED II consolidation;
- 24371/25542 – Infrastructure investments;
- 24730 – Linking farmers to markets;
- 25059 – Consolidation marshlands;
- 19462 – PAREF NL-1;
- 25195 – PAREF NL-2;
- 25454 – Cooperatives support programme; and
40 At baseline this project was not mentioned under output 2.5. However one of the indicators are enabling fora for discussion.
62
- 25457 – Access to food for young children.
Having a predefined link to food security makes it easier for project implementers to manage beforehand the intended food security outputs and outcomes. Besides it helps EKN to effectively monitor the project contributions to the EKN food security outputs and outcomes.
Four projects can be categorized as having an implicit link to food security (30%), being:
- 19160 – Skills development and employment protection
- 19815 – PROSKID
- 19940 – Electricity access programme
- 24871 – Capacity building for food security
The majority of those projects contribute to output 2. An implicit link is demonstrated by the fact that the appraisal documents and the setup of the project have for example job creation or capacity building as main project objective and not food security. However, as we will see later in chapter 3.6 when answering the questions related to effectiveness, projects that did not have a clear food security objective at the start of the project, can still have an important impact on food security. This is supported by the intervention logic of EKN and the literature about food security being built on several pillars. The intervention logic choses several pathways to realize food security, not only through contribution to food availability, but also through food access using intermediate outcomes such as increased income and strengthened agri-business. This corresponds with the two EKN pathways that are defined by projects from an enabling environment to more food and nutrition (‘more jobs’ and ‘less post-harvest losses’). The first pathway is the second pillar of the WFP’s definition of food access introduced in section 2.1.2: sufficient resources to obtain appropriate foods for a nutritious diet. The underlying assumption is that more income enables beneficiaries to buy more food and thus may lead directly to increased food consumption. However, we argue that only part of the additional income will be spent on food. As we learned from a survey of the PAREF projects, some beneficiaries used their extra income on education and weddings next to buying more food. That is why we classify income generating projects as having an implicit link to food security, especially if their main focus is not food security.
With the intervention logic EKN aims favour food availability, access, increased income, increased nutrition and better access to markets. When analysing the embassy output areas, we first observe that those are unevenly represented in terms of the number of associated projects in the food security programme for Rwanda, as presented in Table 3-3. There is only one project on nutrition whereas many of the projects focus on capacity building (income, markets) and infrastructure (availability and access).
Second, the intervention logic acknowledges only three main outputs in its approach to increase food security in Rwanda: infrastructure (1), capacity building (2) and nutrition (3). No output has been defined specifically focusing on an increase in food production. During the baseline EKN clarified that the reason for this is the division of labour in Rwanda, which limits the number of donors per sector (in this case agriculture). When zooming in on the enabling factors such as post-harvest handling or enabling infrastructure EKN clarified at end line that post-harvest handling was a conscious choice instead of
63
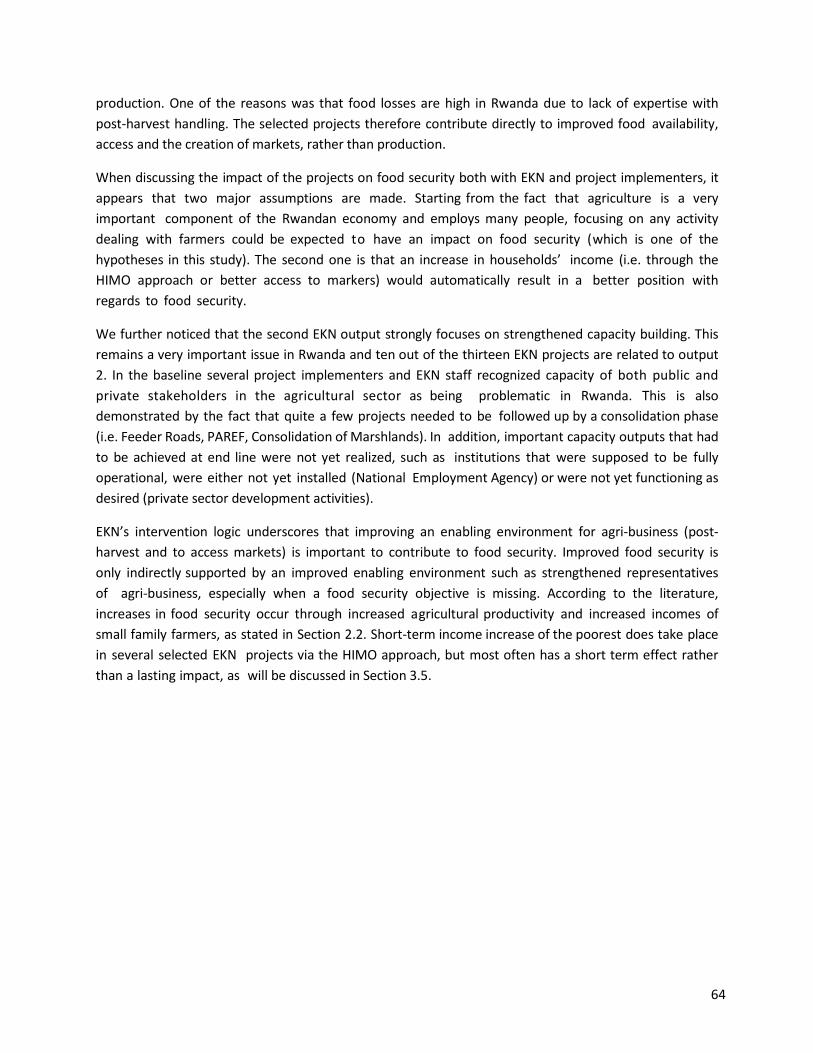
production. One of the reasons was that food losses are high in Rwanda due to lack of expertise with post-harvest handling. The selected projects therefore contribute directly to improved food availability, access and the creation of markets, rather than production.
When discussing the impact of the projects on food security both with EKN and project implementers, it appears that two major assumptions are made. Starting from the fact that agriculture is a very important component of the Rwandan economy and employs many people, focusing on any activity dealing with farmers could be expected to have an impact on food security (which is one of the hypotheses in this study). The second one is that an increase in households’ income (i.e. through the HIMO approach or better access to markers) would automatically result in a better position with regards to food security.
We further noticed that the second EKN output strongly focuses on strengthened capacity building. This remains a very important issue in Rwanda and ten out of the thirteen EKN projects are related to output 2. In the baseline several project implementers and EKN staff recognized capacity of both public and private stakeholders in the agricultural sector as being problematic in Rwanda. This is also demonstrated by the fact that quite a few projects needed to be followed up by a consolidation phase (i.e. Feeder Roads, PAREF, Consolidation of Marshlands). In addition, important capacity outputs that had to be achieved at end line were not yet realized, such as institutions that were supposed to be fully operational, were either not yet installed (National Employment Agency) or were not yet functioning as desired (private sector development activities).
EKN’s intervention logic underscores that improving an enabling environment for agri-business (post- harvest and to access markets) is important to contribute to food security. Improved food security is only indirectly supported by an improved enabling environment such as strengthened representatives of agri-business, especially when a food security objective is missing. According to the literature, increases in food security occur through increased agricultural productivity and increased incomes of small family farmers, as stated in Section 2.2. Short-term income increase of the poorest does take place in several selected EKN projects via the HIMO approach, but most often has a short term effect rather than a lasting impact, as will be discussed in Section 3.5.
64
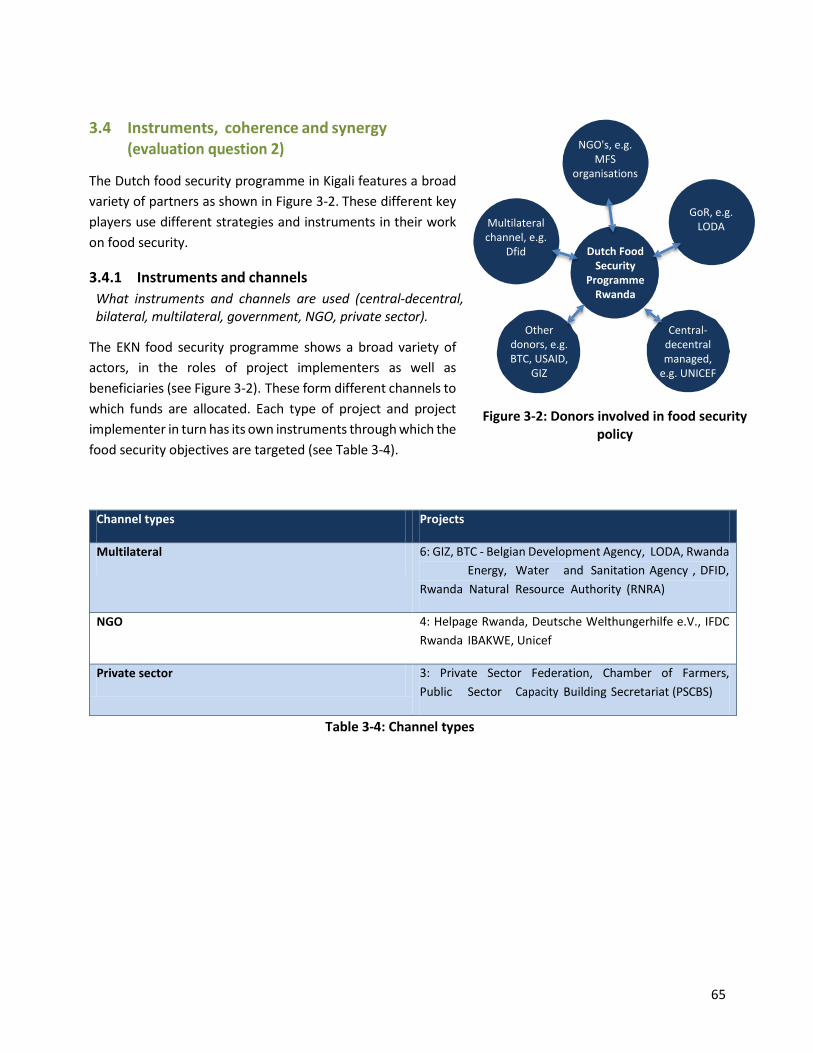
Figure 3-2: Donors involved in food security policy
3.4 Instruments, coherence and synergy (evaluation question 2)
The Dutch food security programme in Kigali features a broad variety of partners as shown in Figure 3-2. These different key players use different strategies and instruments in their work on food security.
3.4.1 Instruments and channels What instruments and channels are used (central-decentral, bilateral, multilateral, government, NGO, private sector).
The EKN food security programme shows a broad variety of actors, in the roles of project implementers as well as beneficiaries (see Figure 3-2). These form different channels to which funds are allocated. Each type of project and project implementer in turn has its own instruments through which the food security objectives are targeted (see Table 3-4).
Multilateral channel, e.g.Dfid
Other donors, e.g. BTC,USAID, GIZ
Dutch Food Security
programme Rwanda
GoR, e.g. LODA
Central- decentral managed, e.g. Unicef
Channel types Projects
Multilateral 6: GIZ, BTC - Belgian Development Agency, LODA, RwandaEnergy, Water and Sanitation Agency , DFID,
Rwanda Natural Resource Authority (RNRA)
NGO 4: Helpage Rwanda, Deutsche Welthungerhilfe e.V., IFDC Rwanda IBAKWE, Unicef
Private sector 3: Private Sector Federation, Chamber of Farmers, Public Sector Capacity Building Secretariat (PSCBS)
Table 3-4: Channel types
65
NGO's, e.g.MFS
organisations
GoR, e.g. LODA
Dutch Food Security
Programme Rwanda
Central-decentral managed,
e.g. UNICEF
Other donors, e.g. BTC, USAID,
GIZ
Multilateral channel, e.g.
Dfid
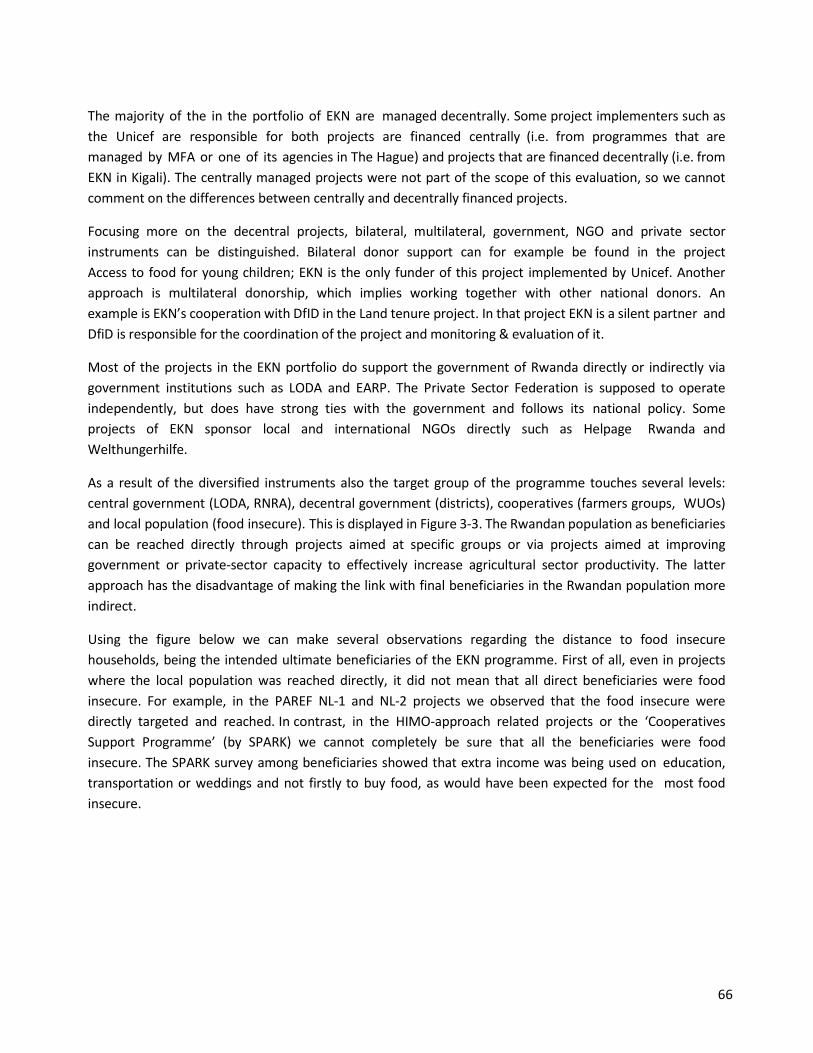
The majority of the in the portfolio of EKN are managed decentrally. Some project implementers such as the Unicef are responsible for both projects are financed centrally (i.e. from programmes that are managed by MFA or one of its agencies in The Hague) and projects that are financed decentrally (i.e. from EKN in Kigali). The centrally managed projects were not part of the scope of this evaluation, so we cannot comment on the differences between centrally and decentrally financed projects.
Focusing more on the decentral projects, bilateral, multilateral, government, NGO and private sector instruments can be distinguished. Bilateral donor support can for example be found in the project Access to food for young children; EKN is the only funder of this project implemented by Unicef. Another approach is multilateral donorship, which implies working together with other national donors. An example is EKN’s cooperation with DfID in the Land tenure project. In that project EKN is a silent partner and DfiD is responsible for the coordination of the project and monitoring & evaluation of it.
Most of the projects in the EKN portfolio do support the government of Rwanda directly or indirectly via government institutions such as LODA and EARP. The Private Sector Federation is supposed to operate independently, but does have strong ties with the government and follows its national policy. Some projects of EKN sponsor local and international NGOs directly such as Helpage Rwanda and Welthungerhilfe.
As a result of the diversified instruments also the target group of the programme touches several levels: central government (LODA, RNRA), decentral government (districts), cooperatives (farmers groups, WUOs) and local population (food insecure). This is displayed in Figure 3-3. The Rwandan population as beneficiaries can be reached directly through projects aimed at specific groups or via projects aimed at improving government or private-sector capacity to effectively increase agricultural sector productivity. The latter approach has the disadvantage of making the link with final beneficiaries in the Rwandan population more indirect.
Using the figure below we can make several observations regarding the distance to food insecure households, being the intended ultimate beneficiaries of the EKN programme. First of all, even in projects where the local population was reached directly, it did not mean that all direct beneficiaries were food insecure. For example, in the PAREF NL-1 and NL-2 projects we observed that the food insecure were directly targeted and reached. In contrast, in the HIMO-approach related projects or the ‘Cooperatives Support Programme’ (by SPARK) we cannot completely be sure that all the beneficiaries were food insecure. The SPARK survey among beneficiaries showed that extra income was being used on education, transportation or weddings and not firstly to buy food, as would have been expected for the most food insecure.
66
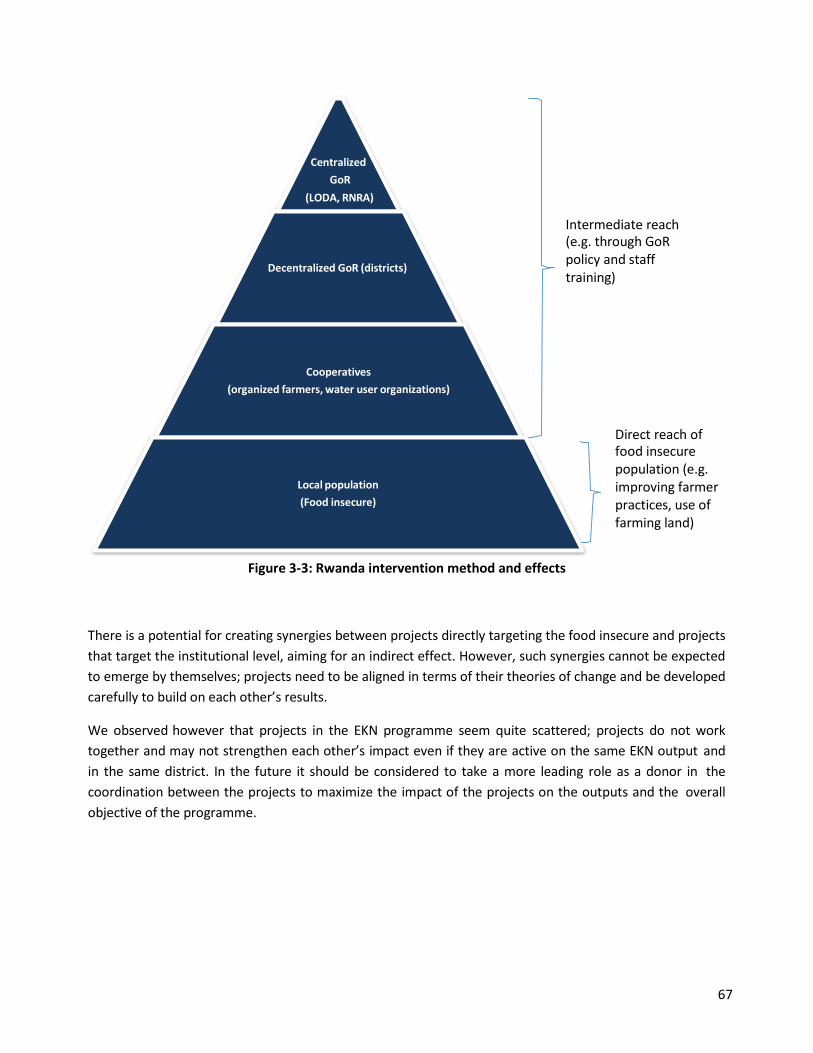
Figure 3-3: Rwanda intervention method and effects
There is a potential for creating synergies between projects directly targeting the food insecure and projects that target the institutional level, aiming for an indirect effect. However, such synergies cannot be expected to emerge by themselves; projects need to be aligned in terms of their theories of change and be developed carefully to build on each other’s results.
We observed however that projects in the EKN programme seem quite scattered; projects do not work together and may not strengthen each other’s impact even if they are active on the same EKN output and in the same district. In the future it should be considered to take a more leading role as a donor in the coordination between the projects to maximize the impact of the projects on the outputs and the overall objective of the programme.
Centralized GoR
(LODA, RNRA)
Decentralized GoR (districts)
Intermediate reach (e.g. through GoR policy and staff training)
Cooperatives (organized farmers, water user organizations)
Local population (Food insecure)
Direct reach of food insecure population (e.g. improving farmer practices, use of farming land)
67

3.4.2 Synergies between centrally and decentrally managed projects
Since we did not systematically analyse centrally managed projects in Rwanda41, we cannot comment on the synergy between central and decentral projects in detail. During interviews with EKN staff we learned that the embassy is in most cases informed timely by the Dutch Ministry of Foreign Affairs when a programme / project is financed centrally. Nevertheless, it sometimes occurs that EKN is not informed upfront of new projects. One of the main reasons for this appears to be that some projects are not perceived as being related to food security and the role of EKN, whereas they do follow the intervention logic of EKN and have a strong link with food security. This misinterpretation can in some cases lead to miscommunication and hinder collaboration. It is therefore crucial that coordination between central and decentral managed projects is well managed to increase total impact and prevent misunderstandings, double overhead and additional work.
During our end line interviews with EKN it was mentioned that food safety requires:
- Involvement of private sector; e.g. certification of good products
- Research.
An example of a project that promotes private sector development and research is the Dutch NICHE programme (Netherlands Initiative for Capacity development in Higher Education). NICHE is an innovative programme that promotes research and vocational education and has a large involvement of the private sector in it. Partners of NICHE (which is a centrally managed programme) are:
- University of Rwanda (local level);
- the workforce development authority (vocational authority in Rwanda);
- one private university involved in applied sciences.;
- global level: Consortium of Dutch Lead organizations such as Erasmus School of Management, TU Delft, DV Plant, Qpoint and SNV.
For EKN this partnership is a good opportunity to bring research from the Netherlands and the consortium of organizations from abroad and Rwanda together. EKN wants Dutch companies that are working on food security in Rwanda to support and give guidance to the agriculture sector in Rwanda. Examples are Hollanda fair foods (producing potatoes) and DSM (coming to Rwanda for a plant for baby food). These synergies are not directly part of the food security programme, but may contribute to food security. EKN staff monitor these activities, so they can detect successful approaches and explore how these cooperations contribute to the MASP.
41 “Centrally managed projects” refers to projects initiated by Dutch government International Development programmes that are managed by or for the MFA in The Hague, as opposed to the EKN food security programme which is managed “decentrally”, i.e. in Rwanda. In the original ToR for this evaluation, it was foreseen that centrally managed projects aimed at improving food security would be part of the evaluation. However, IOB decided in 2015 not to include centrally managed projects in the evaluation scope.
68
3.4.3 Synergies between the Dutch food security programme and food security-related activities of GoR
We noticed a link between the Dutch food security programme and food security-related activities of the GoR. EKN seems to contribute in most of the projects to the national policy of GoR and even directly supports government institutions such as LODA, EARP as well as the institutions targeted by capacity building for food security, i.e. Ministry of Trade and Industry (MINICOM), Rwanda Bureau of Standards (RBS), Rwanda Cooperative Agency (RCA) and Rwanda Agriculture Board (RAB).
GoR has a strategy for economic development and poverty reduction. The focus is on rural economic transformation, but there is also an emphasis on private sector development. GoR wants to stimulate the private sector to play a larger role in agriculture business. Capacity building of private sector therefore remains an important intervention and EKN is supporting this approach through the various projects related to capacity building.
In addition, the GoR tries to stimulate more jobs outside agriculture (off-farm jobs) or to modernize agriculture, to diversify the options of the young population on the labour market since this sector is not that popular among the youth (15-24) in Rwanda, which make up 19% of the population42. By modernizing the agriculture sector, it is expected that this will attract more young people and stimulate an increase in job creation, increase of income and in this was improved availability and access of food. In addition, the GoR has taken several measurements in line with its national standardization policy to improve food quality and safety. This has also been an aspect of one of the EKN projects such as Skills Development.
With the new MASP EKN has adjusted its approach to realize synergies, since it noticed that not all parties were supporting the choices made for the projects in MASP 2012-2015. Now EKN aims at strengthening agricultural value chains. EKN’s ambition is to be involved in all the chains until the input supply, which is rather ambitious. With this approach EKN wants to stimulate the ‘thinking in processes’ rather than thinking in terms of isolated projects. EKN has written 6 concept notes on what it refers to as Strategic Directions for improving food security:
- Interim coordination;
- Nutrition sensitive agriculture development;
- Supply chain orientation, connecting public and private actors;
- Integral approach to natural resource management aimed at higher overall long-term productivity, including sustainable land use, reforestation (e.g. PAREF projects) and water use;
- Aligning programmes that focus on the same target group, e.g. Unicef programme including private sector and TVET to interest children already on a young age for the private sector;
- Infrastructure combined with economic development opportunities and markets (LODA, feeder roads), involving consumers more directly in their role as ultimate beneficiaries.
42 CIA World Factbook, Ibidem 69
3.4.4 Synergies between the Dutch food security programme and other Dutch policies and programmes
EKN staff are familiar with other Dutch central policies such as the Dutch Good Growth Fund (DGGF, financing for SMEs) and the Development Related Infrastructure Investment Vehicle (DRIVE). We also learned with regard to DGGF that EKN does have questions on how the fund can contribute to the situation in Rwanda. EKN recommends a more frequent exchange of information between centrally managed programmes and EKN to be able to promote them better in Rwanda. In conclusion, we find very limited synergies between the Dutch food security programme and other Dutch policies and programmes
3.5 Effectiveness of the programme (evaluation question 3)
One of the most important questions to be answered in order to assess the impact of this programme, is ‘What are the effects of the Dutch country programme on food security?’. In this section we will address this third evaluation question first based on our main findings of the end line assessment of the EKN portfolio before presenting the cost-efficiency (evaluation question 4).
For each project we analysed to what extent the anticipated outputs and outcomes have been achieved. In order to do so, we used desk research, the self-evaluation performed by the project implementers and our end line evaluation fieldwork (interviews with EKN staff and project implementers, as well as interviews with project participants and focus group discussions in the projects evaluated in-depth). In addition, we defined per project the general impact of the project on food security and the sustainability of the project, by assessing the reported impacts using four aspects of food security:
- food availability;
- food accessibility;
- food stability; and
- food utilization.
This resulted in Annex IX Project-level end line assessment, where our main findings at project level are presented. After the general assessment of the projects in Annex IX, we linked the project-level outputs to the outcomes in Annex XI to have a better insight of the individual results. In addition, we assessed the contribution to food security in Annex X for each project to define to what extent the project contributed to food security.
This approach forms the basis for the presentation of the results in this section. We use these results to answer the sub-questions related to the impact pathway (achievement of results), outputs and outcomes achieved and improvement of the food security at the household level, to the extent data are available on this. With regard to food security effects, we rely on information from various sources:
- information reported by project implementers in reports to the Embassy in the course of project implementation;
- information offered by project implementers in response to a questionnaire sent by PwC and/or in
70

an interview with a PwC team member;
- information/conclusions contained in reviews and evaluations conducted by external evaluators.
This means that for the portfolio evaluation, food security effects have not been measured directly, but assumed in case indications exist in these three sources.
The Annexes present the results at project level. In the next sections we will link the results to the EKN outputs to be able to assess the broader contribution to the EKN portfolio as a whole. We start in the next section by presenting per output the group of projects, their results that influenced the output and the manner in which they influenced it.
3.5.1 Project-level effectiveness
To what extent is the anticipated pathway followed / have results been achieved?
In Table 3-5 we linked the food security projects to the three embassy outputs. In this section we address the results of the groups of projects contributing to the three main EKN outputs and in relation to their individual outputs, outcomes and contribution to food security. At the end of the description of results of each project we present our conclusions on the way it contributed to the anticipated pathway and food security.
EKN output 1: Improved infrastructure to produce, process, distribute and prepare food.
Output 1: Improved infrastructure to produce, process, distribute and prepare food.
1.1 Feeder roads built in labour intensive way 23743 – HIMO PDED II consolidation 24371/25542 – Infrastructure investments 25059 – Consolidation of marshlands
1.2 Demand driven local economic development 24371/25542 – Infrastructure investments 25195 – PAREF NL-2
1.3 Improved land registration 23168 /23214– Land tenure regularisation
1.4 Increased access to reliable and affordable energy
19462 – PAREF NL-1 19940 – Electricity roll-out access programme
Table 3-5: Overview projects related to Output 1
The table presents the projects contributing to output 1 and its sub-outputs. Eight out of the 14 projects in the portfolio (excluding CATALIST-2) contribute to output 1.
In all projects under EKN’s Output 1, some form of the HIMO approach (described in section 2.3.5) has been employed. HIMO is seen by the GoR as a means to apply a solid and sustainable strategy to fight poverty and permit the beneficiaries to participate in their own development. However, some reservations must be taken into account. The effectiveness of the public works programmes is focused on the short term creation of jobs, through temporarily increasing incomes of the households in the targeted region. Without a continuation of HIMO projects, economic improvement is likely to end (Andrianjaka and Milazzo, 2008). No research findings
71
are available to substantiate the claims made regarding longer- term food security. McCord (2012: 92) points out that ‘‘there is little evidence of positive livelihoods or local economic development impacts arising as the result of the creation of Public Works Programmes assets”. For example, there are no longitudinal data showing an improvement in the economic and social situation of the targeted population after participation in a HIMO project. Public works programmes are also controversial. Some consider the programmes unethical because of paying participants below-market wages in an attempt to target the poorest, and counterproductive as net nutritional benefits are lower than nutritional value of wages being paid (Devereux, 2016: 54). Additionally, the maintenance of infrastructural works is a major weakness of HIMO projects in terms of sustainability (KFW Entwicklungsbank, 2014 : 6). Without maintenance, the life-cycle of e.g. rural roads is short and leads to high costs for municipalities. The effectiveness and sustainability of the roads built using labour-intensive methods have not sufficiently been proven yet in the literature (KFW Entwicklungsbank, 2014: 1).
In the next sections we present for each project a set of two tables. The first one is a summary of the main output and outcomes achieved for that project, the second one determines the level of food security improvement for that project. Afterwards we give a brief conclusion to the contribution of the project to output 1.
3.5.1.1.1 23743 - HIMO PDED II consolidation
The project aimed to increase food security by generating income for unskilled and the poorest Rwandans through labour intensive feeder roads development. Feeder roads were rehabilitated using relatively cheap labour force under the Cash for Work programme, providing temporary work to more than 26.000 Rwandans. The construction of the feeder roads was also aimed at enabling better access to markets, thus better access to food at lower costs.
72
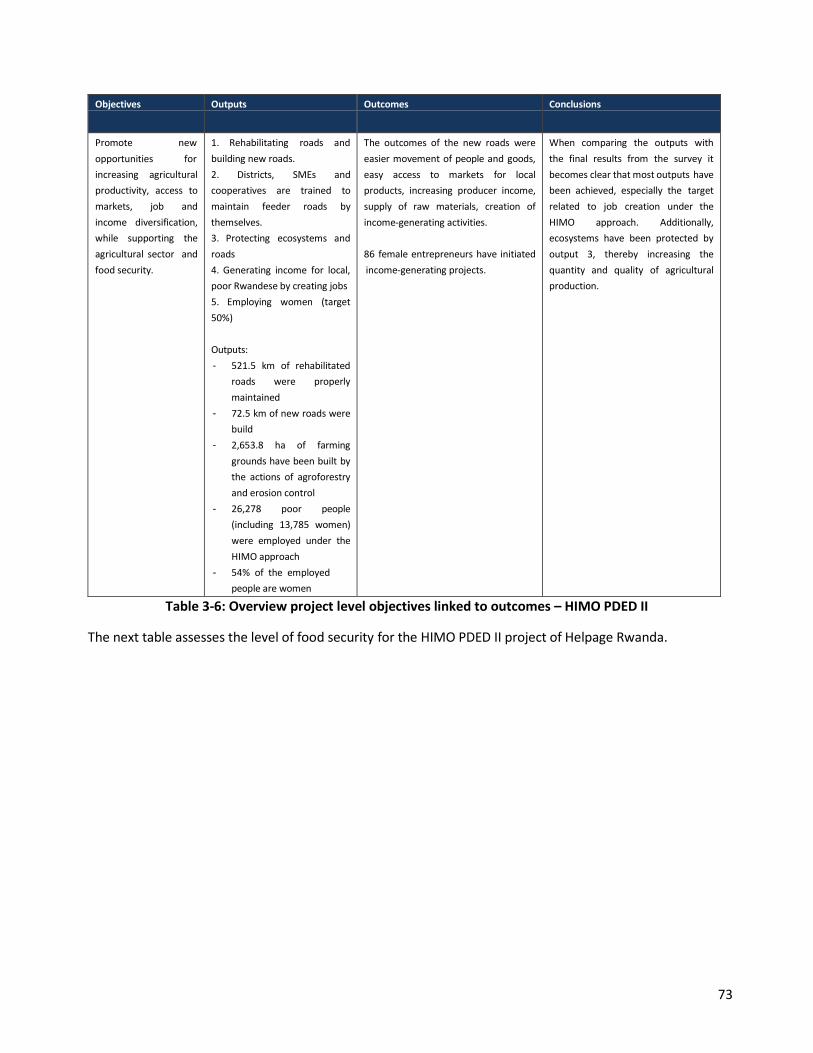
Objectives Outputs Outcomes Conclusions
Promote new opportunities for increasing agricultural productivity, access to markets, job and income diversification, while supporting the agricultural sector and food security.
1. Rehabilitating roads and building new roads. 2. Districts, SMEs and cooperatives are trained to maintain feeder roads by themselves. 3. Protecting ecosystems and roads 4. Generating income for local, poor Rwandese by creating jobs 5. Employing women (target 50%)
Outputs: - 521.5 km of rehabilitated
roads were properly maintained
- 72.5 km of new roads were build
- 2,653.8 ha of farming grounds have been built by the actions of agroforestry and erosion control
- 26,278 poor people (including 13,785 women) were employed under the HIMO approach
- 54% of the employed people are women
The outcomes of the new roads were easier movement of people and goods, easy access to markets for local products, increasing producer income, supply of raw materials, creation of income-generating activities.
86 female entrepreneurs have initiated income-generating projects.
When comparing the outputs with the final results from the survey it becomes clear that most outputs have been achieved, especially the target related to job creation under the HIMO approach. Additionally, ecosystems have been protected by output 3, thereby increasing the quantity and quality of agricultural production.
Table 3-6: Overview project level objectives linked to outcomes – HIMO PDED II
The next table assesses the level of food security for the HIMO PDED II project of Helpage Rwanda.
73
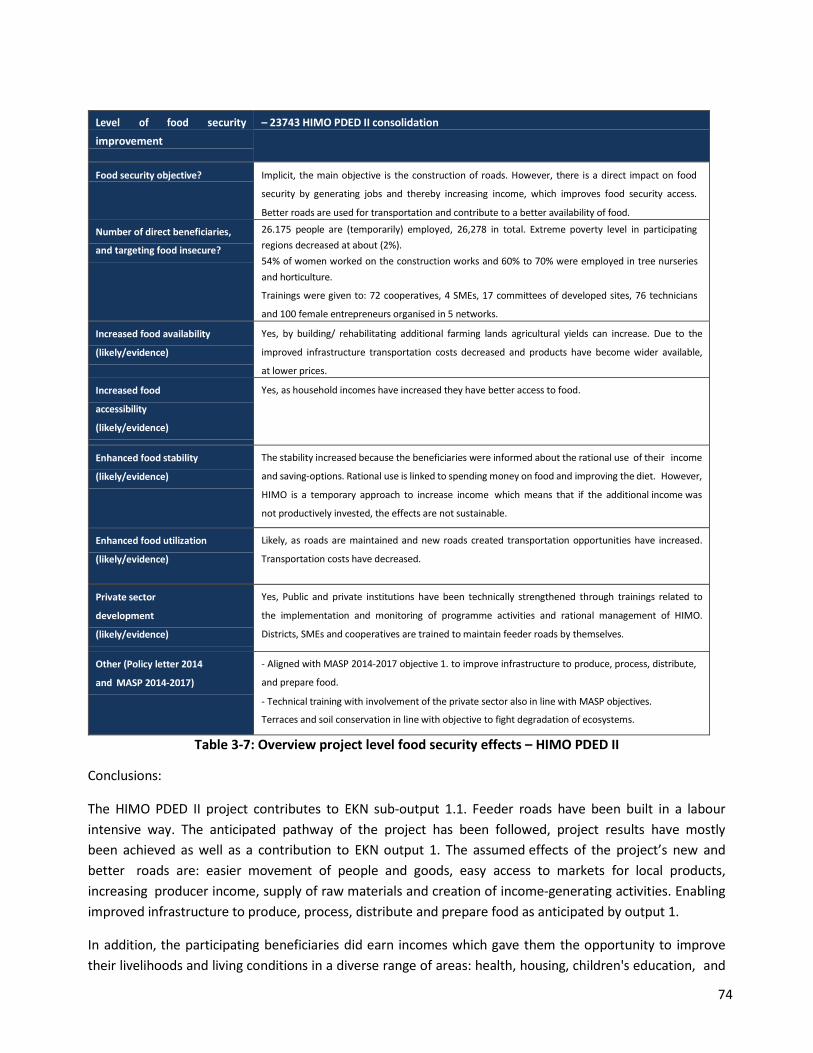
Level of food security improvement
– 23743 HIMO PDED II consolidation
Food security objective? Implicit, the main objective is the construction of roads. However, there is a direct impact on food
security by generating jobs and thereby increasing income, which improves food security access.
Better roads are used for transportation and contribute to a better availability of food.
Number of direct beneficiaries,
and targeting food insecure?
26.175 people are (temporarily) employed, 26,278 in total. Extreme poverty level in participating regions decreased at about (2%). 54% of women worked on the construction works and 60% to 70% were employed in tree nurseries and horticulture.
Trainings were given to: 72 cooperatives, 4 SMEs, 17 committees of developed sites, 76 technicians
and 100 female entrepreneurs organised in 5 networks.
Increased food availability
(likely/evidence)
Yes, by building/ rehabilitating additional farming lands agricultural yields can increase. Due to the
improved infrastructure transportation costs decreased and products have become wider available,
at lower prices.
Increased food
accessibility
(likely/evidence)
Yes, as household incomes have increased they have better access to food.
Enhanced food stability
(likely/evidence)
The stability increased because the beneficiaries were informed about the rational use of their income
and saving-options. Rational use is linked to spending money on food and improving the diet. However,
HIMO is a temporary approach to increase income which means that if the additional income was
not productively invested, the effects are not sustainable.
Enhanced food utilization
(likely/evidence)
Likely, as roads are maintained and new roads created transportation opportunities have increased.
Transportation costs have decreased.
Private sector
development
(likely/evidence)
Yes, Public and private institutions have been technically strengthened through trainings related to
the implementation and monitoring of programme activities and rational management of HIMO.
Districts, SMEs and cooperatives are trained to maintain feeder roads by themselves.
Other (Policy letter 2014
and MASP 2014-2017)
- Aligned with MASP 2014-2017 objective 1. to improve infrastructure to produce, process, distribute,
and prepare food.
- Technical training with involvement of the private sector also in line with MASP objectives.
Terraces and soil conservation in line with objective to fight degradation of ecosystems.
Table 3-7: Overview project level food security effects – HIMO PDED II
Conclusions:
The HIMO PDED II project contributes to EKN sub-output 1.1. Feeder roads have been built in a labour intensive way. The anticipated pathway of the project has been followed, project results have mostly been achieved as well as a contribution to EKN output 1. The assumed effects of the project’s new and better roads are: easier movement of people and goods, easy access to markets for local products, increasing producer income, supply of raw materials and creation of income-generating activities. Enabling improved infrastructure to produce, process, distribute and prepare food as anticipated by output 1.
In addition, the participating beneficiaries did earn incomes which gave them the opportunity to improve their livelihoods and living conditions in a diverse range of areas: health, housing, children's education, and
74
re-investment in agriculture, livestock, trade, other income-generating activities. The project contributed to an improved level of food security. The increased income led to increased possibilities to buy food, which could imply increased access to food. However, the employment period was relatively short, which significantly limits the chances of long lasting reduction of food insecurity. The scale on which people were reached is however relatively high and indicates that in a certain period of time there was an impact on more than 26,000 people.
Overall we can conclude that project objectives as well as EKN output objectives have been met. Although food security was not the main project objective, the project had impact on the access to food and availability of food. The fact that the GoR supports the HIMO approach contributed to an enabling environment to achieve the project results. However, the main outcomes of this project can be in the first place attributed to the project itself. This will also be discussed in Section 3.5.2.
3.5.1.1.2 24371/25542 Infrastructure investments
The Infrastructure investments projects developed enabling infrastructures that can contribute to increased food security in districts. The anticipated pathways of LODA are derived from EDPRS 2 to realize sustained poverty reduction and economic growth. Project 24371 was a one-year support programme from 2012-2013 which was followed by the 3-year programme 25542. The latter project is still ongoing and took part in the in-depth evaluation of this study.
75
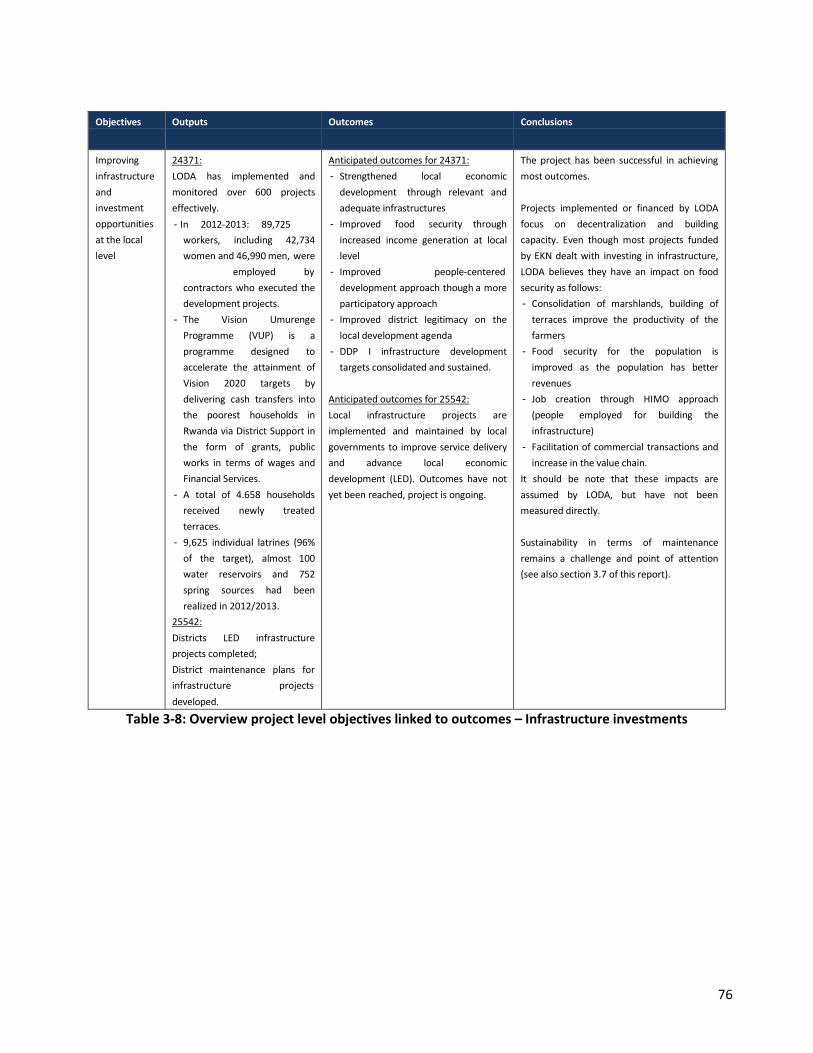
Objectives Outputs Outcomes Conclusions
Improving infrastructure and investment opportunities at the local level
24371: LODA has implemented and monitored over 600 projects effectively. - In 2012-2013: 89,725
workers, including 42,734 women and 46,990 men, were employed by contractors who executed the development projects.
- The Vision Umurenge Programme (VUP) is a programme designed to accelerate the attainment of Vision 2020 targets by delivering cash transfers into the poorest households in Rwanda via District Support in the form of grants, public works in terms of wages and Financial Services.
- A total of 4.658 households received newly treated terraces.
- 9,625 individual latrines (96% of the target), almost 100 water reservoirs and 752 spring sources had been realized in 2012/2013.
25542: Districts LED infrastructure projects completed; District maintenance plans for infrastructure projects developed.
Anticipated outcomes for 24371: - Strengthened local economic
development through relevant and adequate infrastructures
- Improved food security through increased income generation at local level
- Improved people-centered development approach though a more participatory approach
- Improved district legitimacy on the local development agenda
- DDP I infrastructure development targets consolidated and sustained.
Anticipated outcomes for 25542: Local infrastructure projects are implemented and maintained by local governments to improve service delivery and advance local economic development (LED). Outcomes have not yet been reached, project is ongoing.
The project has been successful in achieving most outcomes.
Projects implemented or financed by LODA focus on decentralization and building capacity. Even though most projects funded by EKN dealt with investing in infrastructure, LODA believes they have an impact on food security as follows: - Consolidation of marshlands, building of
terraces improve the productivity of the farmers
- Food security for the population is improved as the population has better revenues
- Job creation through HIMO approach (people employed for building the infrastructure)
- Facilitation of commercial transactions and increase in the value chain.
It should be note that these impacts are assumed by LODA, but have not been measured directly.
Sustainability in terms of maintenance remains a challenge and point of attention (see also section 3.7 of this report).
Table 3-8: Overview project level objectives linked to outcomes – Infrastructure investments
76
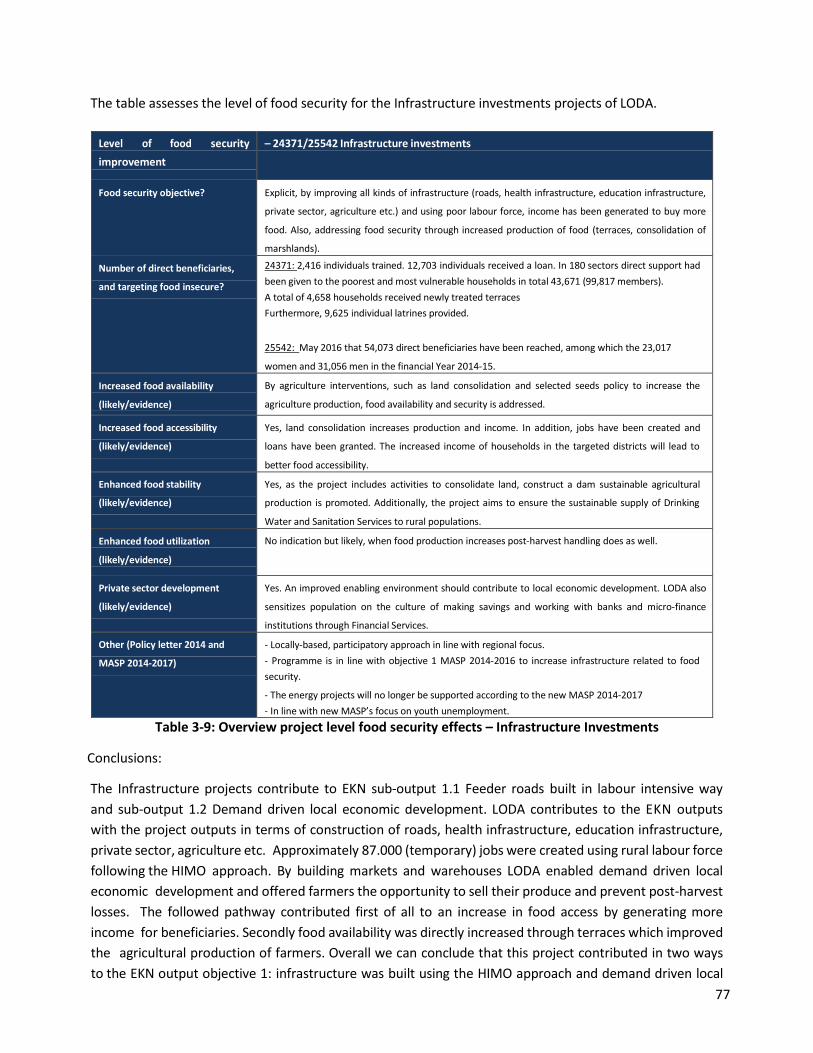
The table assesses the level of food security for the Infrastructure investments projects of LODA.
Level of food security improvement
– 24371/25542 Infrastructure investments
Food security objective? Explicit, by improving all kinds of infrastructure (roads, health infrastructure, education infrastructure,
private sector, agriculture etc.) and using poor labour force, income has been generated to buy more
food. Also, addressing food security through increased production of food (terraces, consolidation of
marshlands).
Number of direct beneficiaries,
and targeting food insecure?
24371: 2,416 individuals trained. 12,703 individuals received a loan. In 180 sectors direct support had been given to the poorest and most vulnerable households in total 43,671 (99,817 members). A total of 4,658 households received newly treated terraces Furthermore, 9,625 individual latrines provided.
25542: May 2016 that 54,073 direct beneficiaries have been reached, among which the 23,017
women and 31,056 men in the financial Year 2014-15.
Increased food availability
(likely/evidence)
By agriculture interventions, such as land consolidation and selected seeds policy to increase the
agriculture production, food availability and security is addressed.
Increased food accessibility
(likely/evidence)
Yes, land consolidation increases production and income. In addition, jobs have been created and
loans have been granted. The increased income of households in the targeted districts will lead to
better food accessibility.
Enhanced food stability
(likely/evidence)
Yes, as the project includes activities to consolidate land, construct a dam sustainable agricultural
production is promoted. Additionally, the project aims to ensure the sustainable supply of Drinking
Water and Sanitation Services to rural populations.
Enhanced food utilization
(likely/evidence)
No indication but likely, when food production increases post-harvest handling does as well.
Private sector development
(likely/evidence)
Yes. An improved enabling environment should contribute to local economic development. LODA also
sensitizes population on the culture of making savings and working with banks and micro-finance
institutions through Financial Services.
Other (Policy letter 2014 and
MASP 2014-2017)
- Locally-based, participatory approach in line with regional focus. - Programme is in line with objective 1 MASP 2014-2016 to increase infrastructure related to food security.
- The energy projects will no longer be supported according to the new MASP 2014-2017 - In line with new MASP’s focus on youth unemployment.
Table 3-9: Overview project level food security effects – Infrastructure Investments
Conclusions:
The Infrastructure projects contribute to EKN sub-output 1.1 Feeder roads built in labour intensive way and sub-output 1.2 Demand driven local economic development. LODA contributes to the EKN outputs with the project outputs in terms of construction of roads, health infrastructure, education infrastructure, private sector, agriculture etc. Approximately 87.000 (temporary) jobs were created using rural labour force following the HIMO approach. By building markets and warehouses LODA enabled demand driven local economic development and offered farmers the opportunity to sell their produce and prevent post-harvest losses. The followed pathway contributed first of all to an increase in food access by generating more income for beneficiaries. Secondly food availability was directly increased through terraces which improved the agricultural production of farmers. Overall we can conclude that this project contributed in two ways to the EKN output objective 1: infrastructure was built using the HIMO approach and demand driven local
77

economic development took place focusing also on food production and food processing. Since the project is working as an intragovernmental funding programme, there is a strong synergy between the projects. Project results tend to be attributed mainly to this project, however it is important to note that other projects in the same area with similar objectives can influence each other. We saw this in the Muhanga districts were several projects were using the same approach, such as kitchen-gardens, terraces etc. which is also a way of working in other projects.
3.5.1.1.3 25059 - Consolidation of marshlands
The Consolidation of marshlands project is a follow up of the ESIRU project I and II (Establishing a System of Integrated Resource Utilization), an earlier investment in strengthening soft infrastructure and investments in marshlands. The overall goals for this programme were poverty reduction, reduced malnutrition and self-reliant continuation of development The consolidation phase aimed to improve the capacity of users (farmer cooperatives, water user organizations and district staff) and infrastructure maintenance. This project was part of the in-depth evaluation with focus group discussions.
Objectives Outputs Outcomes Conclusions
Poverty reduction, reduced malnutrition and self-reliant continuation of development initiatives”
1. Ensure infrastructure around the Marshlands is consolidated and functioning: irrigation schemes, dams, terraces, infiltration galleries, roads and rice platforms as well as the rice mill (latter not financed by EKN) 2. Capacity building local government authorities 3. Strengthen influence of women within cooperatives and water users associations (SACCO project)
1. Complete productive marshlands and hillside infrastructure and to enable beneficiaries and local government authorities to take full responsibility and ownership of these works - Indications are the income (Esiru) has not
increased by 50% (increase of 30% excl. income terraces), but the impact has been large.
- Increase of 50% in rice production (5.5 t/ha)
- 100% of the rice-lands is utilized - Rice harvests twice a year - Improved irrigation schemes 2. Sustained reduction of poverty, enhancement of food security and self- reliant continuation of development initiatives. 3. More women employed and better access to finance. In all Water User Associations 42% of leaders are women by the end of 2014
The project results show that the outputs have been met. The farmers were taught and guided in constructing soil conservation structures to address the problem of erosion in the area. Rice production has substantially increased. The comprehensive involvement of users and local government authorities (LGA) during all project phases was a key success factor in the consolidation phase. The first outcome has been successful and is reached. Second, The project has improved the food security situation of households in many ways. According to the district agronomist in Muhanga Welthungerhilfe had achieved its goal by 100% that of increasing production among the farmers. The marshlands were consolidated and put into productive use. Third, the influence of women within cooperatives and water user organizations has been strengthened.
Table 3-10: Overview project level objectives linked to outcomes – Consolidation of Marshlands
78
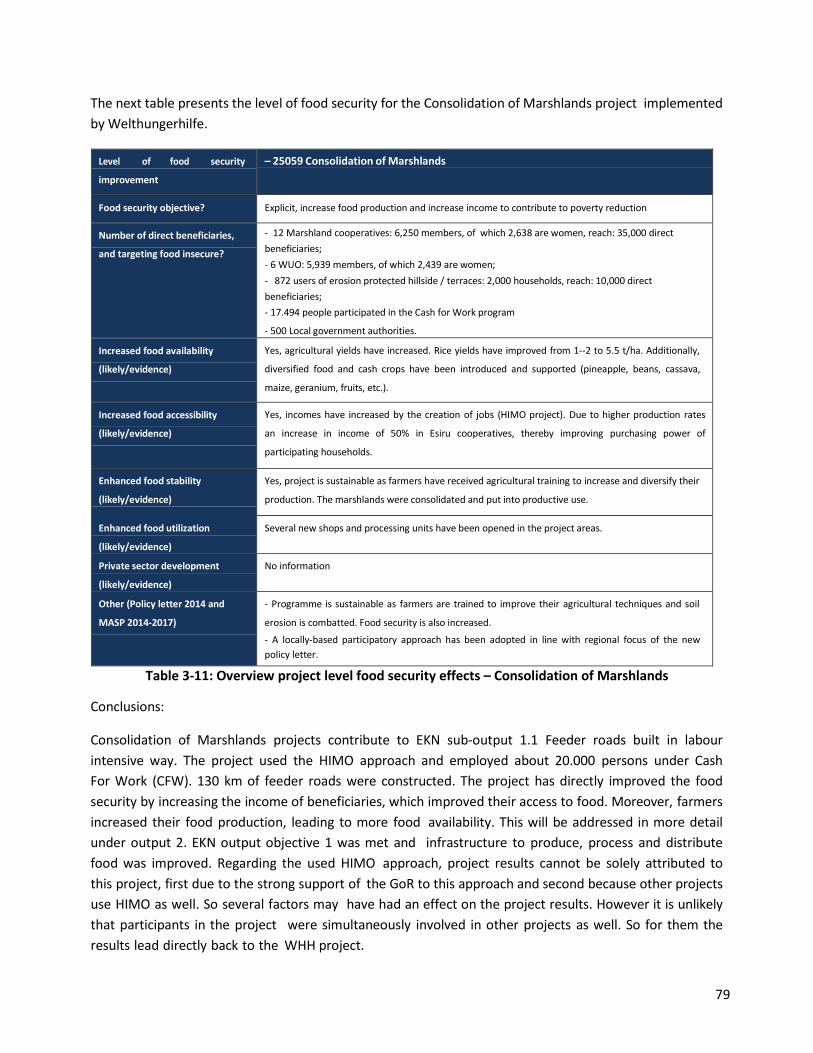
The next table presents the level of food security for the Consolidation of Marshlands project implemented by Welthungerhilfe.
Level of food security
improvement
– 25059 Consolidation of Marshlands
Food security objective? Explicit, increase food production and increase income to contribute to poverty reduction
Number of direct beneficiaries,
and targeting food insecure?
- 12 Marshland cooperatives: 6,250 members, of which 2,638 are women, reach: 35,000 direct beneficiaries; - 6 WUO: 5,939 members, of which 2,439 are women; - 872 users of erosion protected hillside / terraces: 2,000 households, reach: 10,000 direct beneficiaries; - 17.494 people participated in the Cash for Work program
- 500 Local government authorities.
Increased food availability
(likely/evidence)
Yes, agricultural yields have increased. Rice yields have improved from 1--2 to 5.5 t/ha. Additionally,
diversified food and cash crops have been introduced and supported (pineapple, beans, cassava,
maize, geranium, fruits, etc.).
Increased food accessibility
(likely/evidence)
Yes, incomes have increased by the creation of jobs (HIMO project). Due to higher production rates
an increase in income of 50% in Esiru cooperatives, thereby improving purchasing power of
participating households.
Enhanced food stability
(likely/evidence)
Yes, project is sustainable as farmers have received agricultural training to increase and diversify their
production. The marshlands were consolidated and put into productive use.
Enhanced food utilization
(likely/evidence)
Several new shops and processing units have been opened in the project areas.
Private sector development
(likely/evidence)
No information
Other (Policy letter 2014 and
MASP 2014-2017)
- Programme is sustainable as farmers are trained to improve their agricultural techniques and soil
erosion is combatted. Food security is also increased.
- A locally-based participatory approach has been adopted in line with regional focus of the new policy letter.
Table 3-11: Overview project level food security effects – Consolidation of Marshlands
Conclusions:
Consolidation of Marshlands projects contribute to EKN sub-output 1.1 Feeder roads built in labour intensive way. The project used the HIMO approach and employed about 20.000 persons under Cash For Work (CFW). 130 km of feeder roads were constructed. The project has directly improved the food security by increasing the income of beneficiaries, which improved their access to food. Moreover, farmers increased their food production, leading to more food availability. This will be addressed in more detail under output 2. EKN output objective 1 was met and infrastructure to produce, process and distribute food was improved. Regarding the used HIMO approach, project results cannot be solely attributed to this project, first due to the strong support of the GoR to this approach and second because other projects use HIMO as well. So several factors may have had an effect on the project results. However it is unlikely that participants in the project were simultaneously involved in other projects as well. So for them the results lead directly back to the WHH project.
79
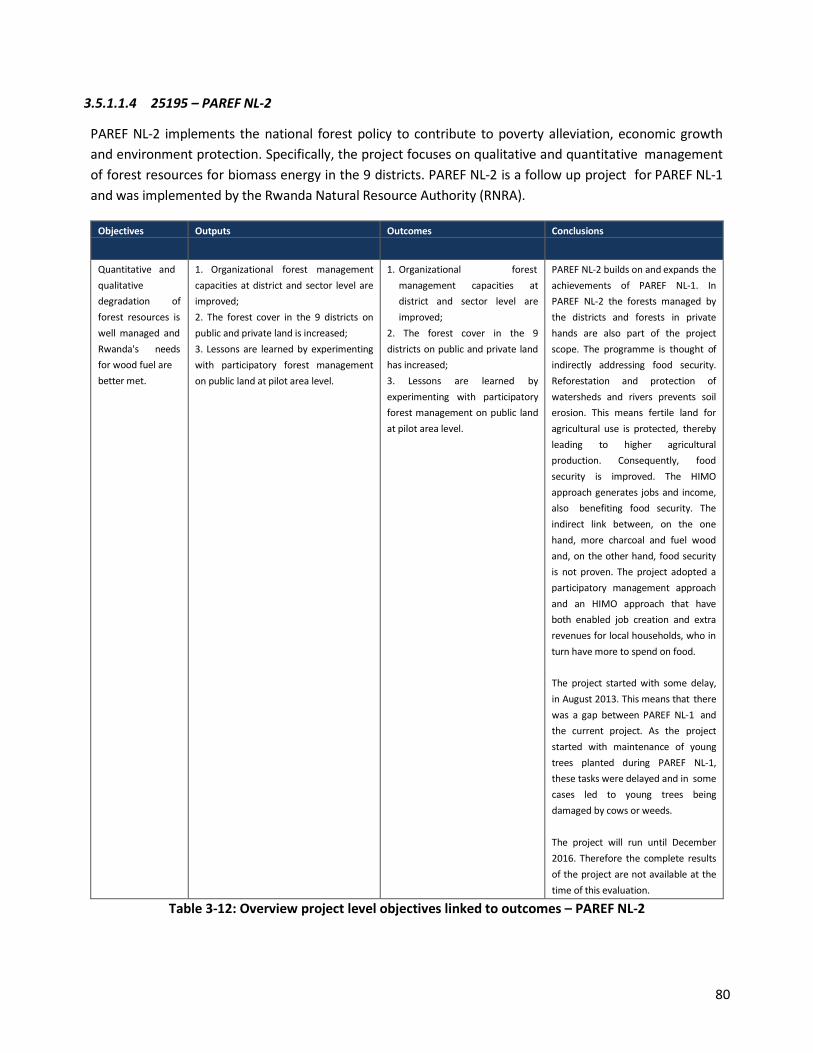
3.5.1.1.4 25195 – PAREF NL-2
PAREF NL-2 implements the national forest policy to contribute to poverty alleviation, economic growth and environment protection. Specifically, the project focuses on qualitative and quantitative management of forest resources for biomass energy in the 9 districts. PAREF NL-2 is a follow up project for PAREF NL-1 and was implemented by the Rwanda Natural Resource Authority (RNRA).
Objectives Outputs Outcomes Conclusions
Quantitative and qualitative degradation of forest resources is well managed and Rwanda's needs for wood fuel are better met.
1. Organizational forest management capacities at district and sector level are improved; 2. The forest cover in the 9 districts on public and private land is increased; 3. Lessons are learned by experimenting with participatory forest management on public land at pilot area level.
1. Organizational forest management capacities at district and sector level are improved;
2. The forest cover in the 9 districts on public and private land has increased; 3. Lessons are learned by experimenting with participatory forest management on public land at pilot area level.
PAREF NL-2 builds on and expands the achievements of PAREF NL-1. In PAREF NL-2 the forests managed by the districts and forests in private hands are also part of the project scope. The programme is thought of indirectly addressing food security. Reforestation and protection of watersheds and rivers prevents soil erosion. This means fertile land for agricultural use is protected, thereby leading to higher agricultural production. Consequently, food security is improved. The HIMO approach generates jobs and income, also benefiting food security. The indirect link between, on the one hand, more charcoal and fuel wood and, on the other hand, food security is not proven. The project adopted a participatory management approach and an HIMO approach that have both enabled job creation and extra revenues for local households, who in turn have more to spend on food.
The project started with some delay, in August 2013. This means that there was a gap between PAREF NL-1 and the current project. As the project started with maintenance of young trees planted during PAREF NL-1, these tasks were delayed and in some cases led to young trees being damaged by cows or weeds.
The project will run until December 2016. Therefore the complete results of the project are not available at the time of this evaluation.
Table 3-12: Overview project level objectives linked to outcomes – PAREF NL-2
80
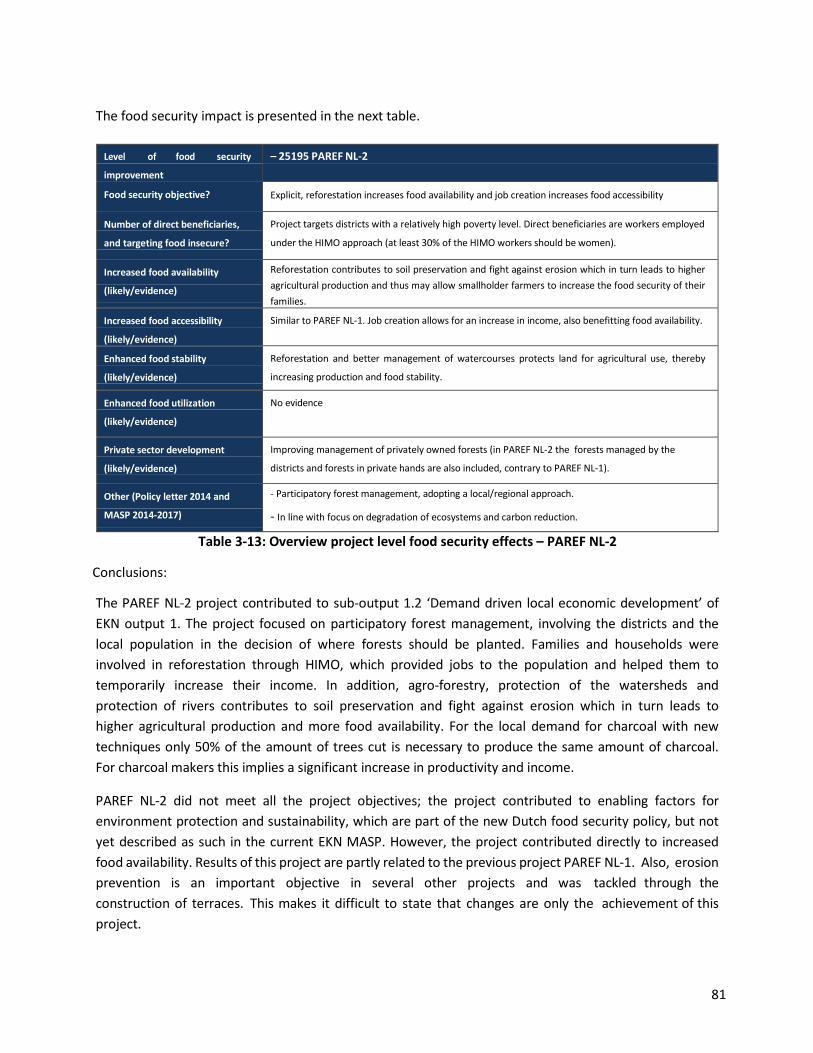
The food security impact is presented in the next table.
Level of food security
improvement
– 25195 PAREF NL-2
Food security objective? Explicit, reforestation increases food availability and job creation increases food accessibility
Number of direct beneficiaries,
and targeting food insecure?
Project targets districts with a relatively high poverty level. Direct beneficiaries are workers employed
under the HIMO approach (at least 30% of the HIMO workers should be women).
Increased food availability
(likely/evidence)
Reforestation contributes to soil preservation and fight against erosion which in turn leads to higher agricultural production and thus may allow smallholder farmers to increase the food security of their families.
Increased food accessibility
(likely/evidence)
Similar to PAREF NL-1. Job creation allows for an increase in income, also benefitting food availability.
Enhanced food stability
(likely/evidence)
Reforestation and better management of watercourses protects land for agricultural use, thereby
increasing production and food stability.
Enhanced food utilization
(likely/evidence)
No evidence
Private sector development
(likely/evidence)
Improving management of privately owned forests (in PAREF NL-2 the forests managed by the
districts and forests in private hands are also included, contrary to PAREF NL-1).
Other (Policy letter 2014 and
MASP 2014-2017)
- Participatory forest management, adopting a local/regional approach.
- In line with focus on degradation of ecosystems and carbon reduction.
Table 3-13: Overview project level food security effects – PAREF NL-2
Conclusions:
The PAREF NL-2 project contributed to sub-output 1.2 ‘Demand driven local economic development’ of EKN output 1. The project focused on participatory forest management, involving the districts and the local population in the decision of where forests should be planted. Families and households were involved in reforestation through HIMO, which provided jobs to the population and helped them to temporarily increase their income. In addition, agro-forestry, protection of the watersheds and protection of rivers contributes to soil preservation and fight against erosion which in turn leads to higher agricultural production and more food availability. For the local demand for charcoal with new techniques only 50% of the amount of trees cut is necessary to produce the same amount of charcoal. For charcoal makers this implies a significant increase in productivity and income.
PAREF NL-2 did not meet all the project objectives; the project contributed to enabling factors for environment protection and sustainability, which are part of the new Dutch food security policy, but not yet described as such in the current EKN MASP. However, the project contributed directly to increased food availability. Results of this project are partly related to the previous project PAREF NL-1. Also, erosion prevention is an important objective in several other projects and was tackled through the construction of terraces. This makes it difficult to state that changes are only the achievement of this project.
81
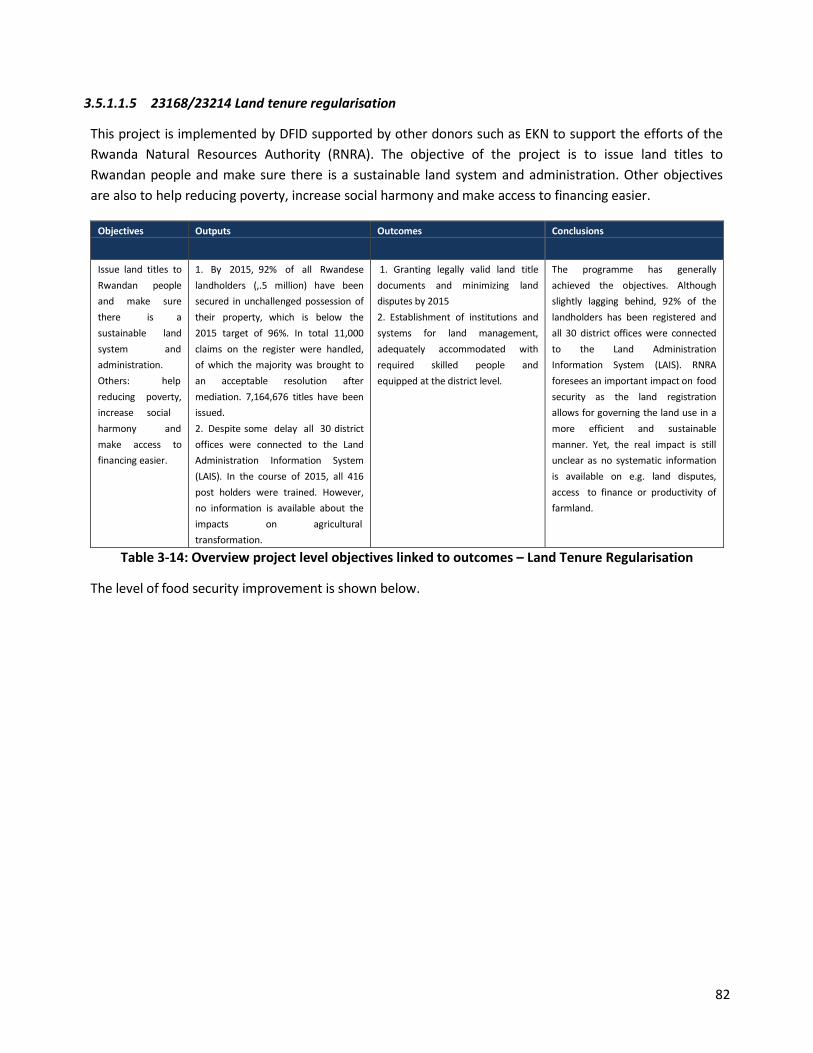
3.5.1.1.5 23168/23214 Land tenure regularisation
This project is implemented by DFID supported by other donors such as EKN to support the efforts of the Rwanda Natural Resources Authority (RNRA). The objective of the project is to issue land titles to Rwandan people and make sure there is a sustainable land system and administration. Other objectives are also to help reducing poverty, increase social harmony and make access to financing easier.
Objectives Outputs Outcomes Conclusions
Issue land titles to Rwandan people and make sure there is a sustainable land system and administration. Others: help reducing poverty, increase social harmony and make access to financing easier.
1. By 2015, 92% of all Rwandese landholders (,.5 million) have been secured in unchallenged possession of their property, which is below the 2015 target of 96%. In total 11,000 claims on the register were handled, of which the majority was brought to an acceptable resolution after mediation. 7,164,676 titles have been issued. 2. Despite some delay all 30 district offices were connected to the Land Administration Information System (LAIS). In the course of 2015, all 416 post holders were trained. However, no information is available about the impacts on agricultural transformation.
1. Granting legally valid land title documents and minimizing land disputes by 2015 2. Establishment of institutions and systems for land management, adequately accommodated with required skilled people and equipped at the district level.
The programme has generally achieved the objectives. Although slightly lagging behind, 92% of the landholders has been registered and all 30 district offices were connected to the Land Administration Information System (LAIS). RNRA foresees an important impact on food security as the land registration allows for governing the land use in a more efficient and sustainable manner. Yet, the real impact is still unclear as no systematic information is available on e.g. land disputes, access to finance or productivity of farmland.
Table 3-14: Overview project level objectives linked to outcomes – Land Tenure Regularisation
The level of food security improvement is shown below.
82
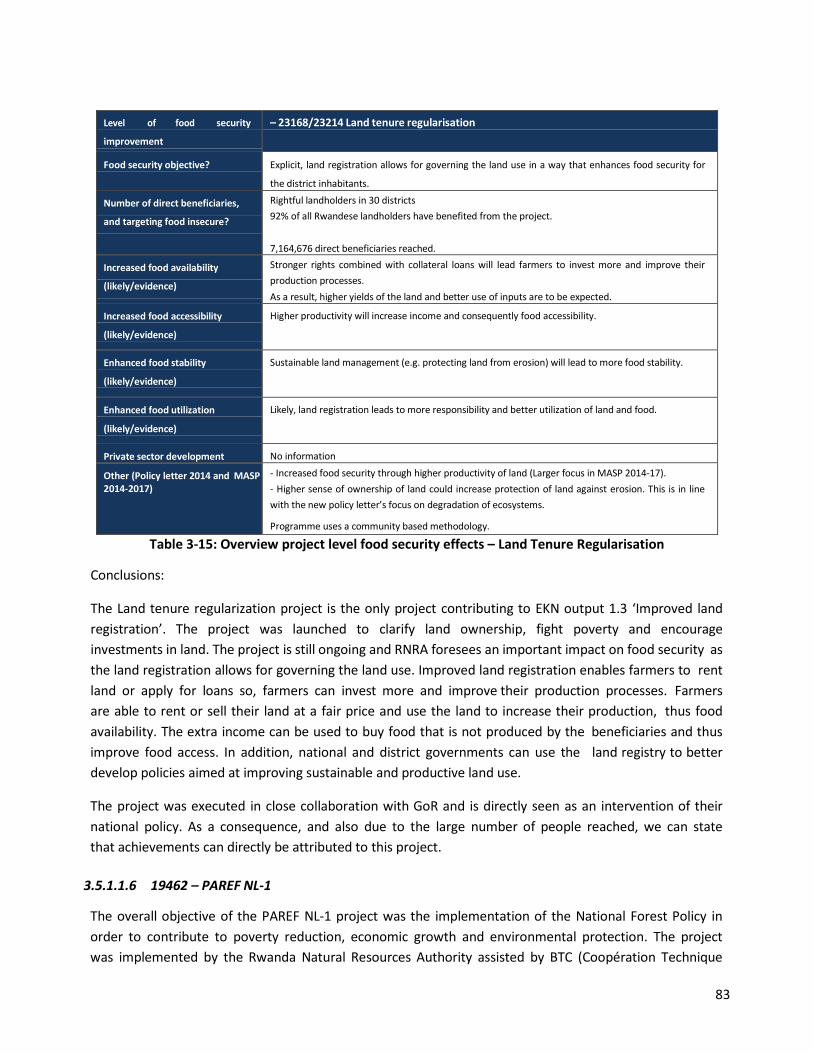
Level of food security
improvement
– 23168/23214 Land tenure regularisation
Food security objective? Explicit, land registration allows for governing the land use in a way that enhances food security for
the district inhabitants.
Number of direct beneficiaries,
and targeting food insecure?
Rightful landholders in 30 districts 92% of all Rwandese landholders have benefited from the project.
7,164,676 direct beneficiaries reached.
Increased food availability
(likely/evidence)
Stronger rights combined with collateral loans will lead farmers to invest more and improve their production processes. As a result, higher yields of the land and better use of inputs are to be expected.
Increased food accessibility
(likely/evidence)
Higher productivity will increase income and consequently food accessibility.
Enhanced food stability
(likely/evidence)
Sustainable land management (e.g. protecting land from erosion) will lead to more food stability.
Enhanced food utilization
(likely/evidence)
Likely, land registration leads to more responsibility and better utilization of land and food.
Private sector development
No information
Other (Policy letter 2014 and MASP 2014-2017)
- Increased food security through higher productivity of land (Larger focus in MASP 2014-17). - Higher sense of ownership of land could increase protection of land against erosion. This is in line with the new policy letter’s focus on degradation of ecosystems.
Programme uses a community based methodology.
Table 3-15: Overview project level food security effects – Land Tenure Regularisation
Conclusions:
The Land tenure regularization project is the only project contributing to EKN output 1.3 ‘Improved land registration’. The project was launched to clarify land ownership, fight poverty and encourage investments in land. The project is still ongoing and RNRA foresees an important impact on food security as the land registration allows for governing the land use. Improved land registration enables farmers to rent land or apply for loans so, farmers can invest more and improve their production processes. Farmers are able to rent or sell their land at a fair price and use the land to increase their production, thus food availability. The extra income can be used to buy food that is not produced by the beneficiaries and thus improve food access. In addition, national and district governments can use the land registry to better develop policies aimed at improving sustainable and productive land use.
The project was executed in close collaboration with GoR and is directly seen as an intervention of their national policy. As a consequence, and also due to the large number of people reached, we can state that achievements can directly be attributed to this project.
3.5.1.1.6 19462 – PAREF NL-1
The overall objective of the PAREF NL-1 project was the implementation of the National Forest Policy in order to contribute to poverty reduction, economic growth and environmental protection. The project was implemented by the Rwanda Natural Resources Authority assisted by BTC (Coopération Technique
83
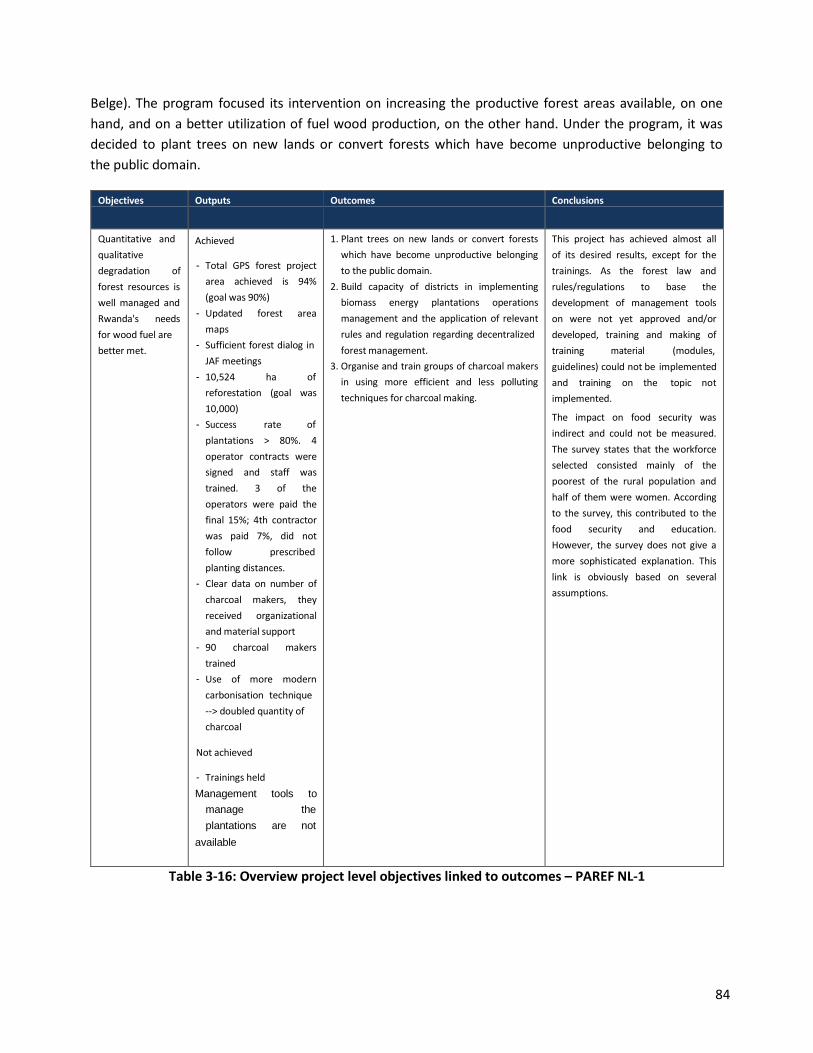
Belge). The program focused its intervention on increasing the productive forest areas available, on one hand, and on a better utilization of fuel wood production, on the other hand. Under the program, it was decided to plant trees on new lands or convert forests which have become unproductive belonging to the public domain.
Objectives Outputs Outcomes Conclusions
Quantitative and qualitative degradation of forest resources is well managed and Rwanda's needs for wood fuel are better met.
Achieved
- Total GPS forest project area achieved is 94% (goal was 90%)
- Updated forest area maps
- Sufficient forest dialog in JAF meetings
- 10,524 ha of reforestation (goal was 10,000)
- Success rate of plantations > 80%. 4 operator contracts were signed and staff was trained. 3 of the operators were paid the final 15%; 4th contractor was paid 7%, did not follow prescribed planting distances.
- Clear data on number of charcoal makers, they received organizational and material support
- 90 charcoal makers trained
- Use of more modern carbonisation technique --> doubled quantity of charcoal
Not achieved
- Trainings held Management tools to
manage the plantations are not
available
1. Plant trees on new lands or convert forests which have become unproductive belonging to the public domain.
2. Build capacity of districts in implementing biomass energy plantations operations management and the application of relevant rules and regulation regarding decentralized forest management.
3. Organise and train groups of charcoal makers in using more efficient and less polluting techniques for charcoal making.
This project has achieved almost all of its desired results, except for the trainings. As the forest law and rules/regulations to base the development of management tools on were not yet approved and/or developed, training and making of training material (modules, guidelines) could not be implemented and training on the topic not implemented.
The impact on food security was indirect and could not be measured. The survey states that the workforce selected consisted mainly of the poorest of the rural population and half of them were women. According to the survey, this contributed to the food security and education. However, the survey does not give a more sophisticated explanation. This link is obviously based on several assumptions.
Table 3-16: Overview project level objectives linked to outcomes – PAREF NL-1
84
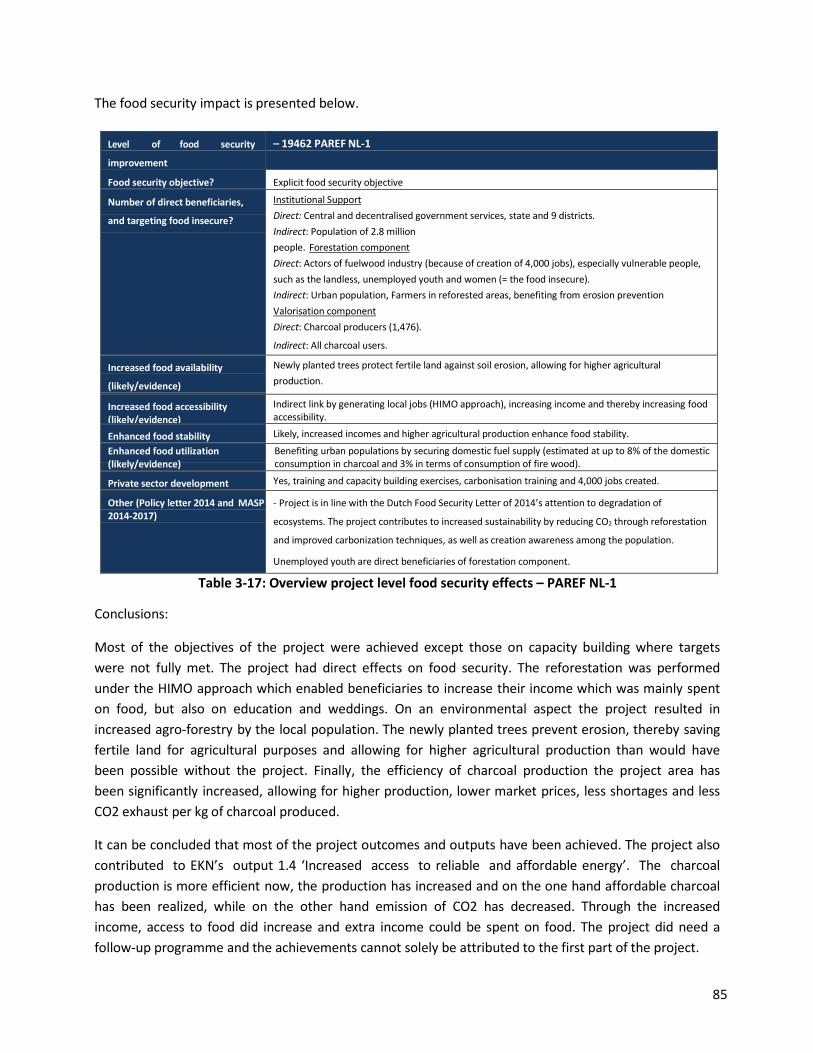
The food security impact is presented below.
Level of food security
improvement
– 19462 PAREF NL-1
Food security objective? Explicit food security objective
Number of direct beneficiaries,
and targeting food insecure?
Institutional Support Direct: Central and decentralised government services, state and 9 districts. Indirect: Population of 2.8 million people. Forestation component Direct: Actors of fuelwood industry (because of creation of 4,000 jobs), especially vulnerable people, such as the landless, unemployed youth and women (= the food insecure). Indirect: Urban population, Farmers in reforested areas, benefiting from erosion prevention Valorisation component Direct: Charcoal producers (1,476).
Indirect: All charcoal users.
Increased food availability
(likely/evidence)
Newly planted trees protect fertile land against soil erosion, allowing for higher agricultural production.
Increased food accessibility (likely/evidence)
Indirect link by generating local jobs (HIMO approach), increasing income and thereby increasing food accessibility.
Enhanced food stability
Likely, increased incomes and higher agricultural production enhance food stability.
Enhanced food utilization (likely/evidence)
Benefiting urban populations by securing domestic fuel supply (estimated at up to 8% of the domestic consumption in charcoal and 3% in terms of consumption of fire wood).
Private sector development
Yes, training and capacity building exercises, carbonisation training and 4,000 jobs created.
Other (Policy letter 2014 and MASP 2014-2017)
- Project is in line with the Dutch Food Security Letter of 2014’s attention to degradation of
ecosystems. The project contributes to increased sustainability by reducing CO2 through reforestation
and improved carbonization techniques, as well as creation awareness among the population.
Unemployed youth are direct beneficiaries of forestation component.
Table 3-17: Overview project level food security effects – PAREF NL-1
Conclusions:
Most of the objectives of the project were achieved except those on capacity building where targets were not fully met. The project had direct effects on food security. The reforestation was performed under the HIMO approach which enabled beneficiaries to increase their income which was mainly spent on food, but also on education and weddings. On an environmental aspect the project resulted in increased agro-forestry by the local population. The newly planted trees prevent erosion, thereby saving fertile land for agricultural purposes and allowing for higher agricultural production than would have been possible without the project. Finally, the efficiency of charcoal production the project area has been significantly increased, allowing for higher production, lower market prices, less shortages and less CO2 exhaust per kg of charcoal produced.
It can be concluded that most of the project outcomes and outputs have been achieved. The project also contributed to EKN’s output 1.4 ‘Increased access to reliable and affordable energy’. The charcoal production is more efficient now, the production has increased and on the one hand affordable charcoal has been realized, while on the other hand emission of CO2 has decreased. Through the increased income, access to food did increase and extra income could be spent on food. The project did need a follow-up programme and the achievements cannot solely be attributed to the first part of the project.
85
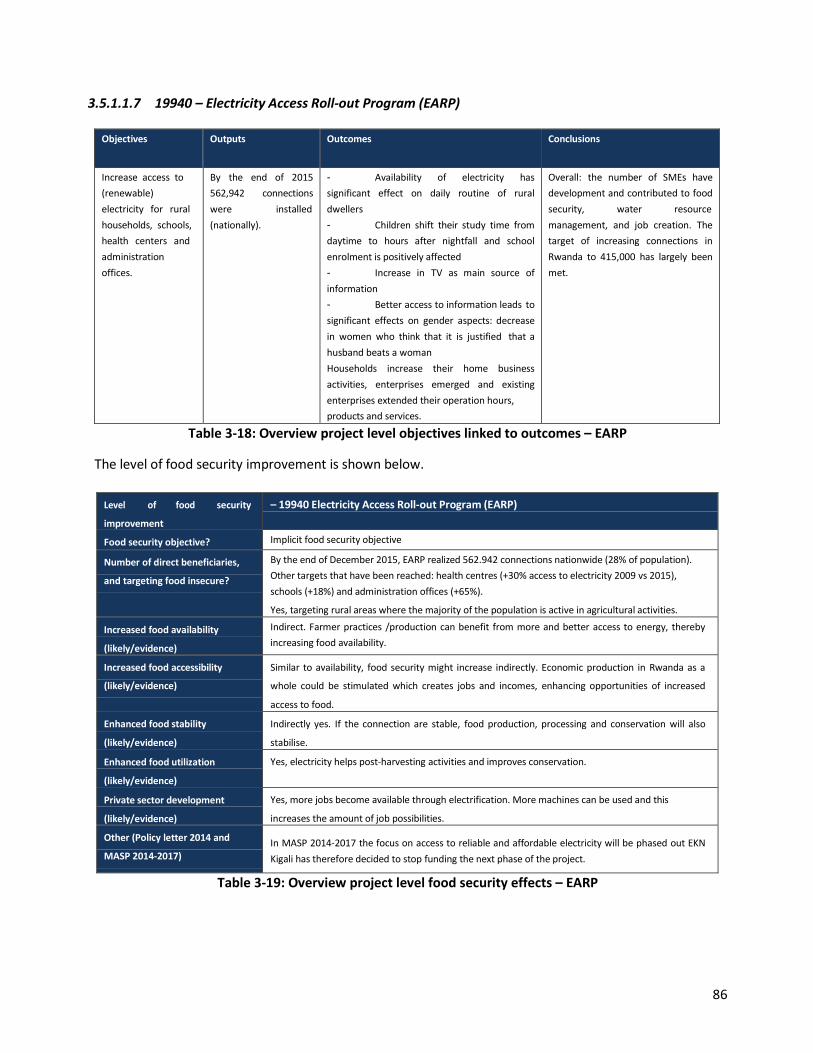
3.5.1.1.7 19940 – Electricity Access Roll-out Program (EARP)
Objectives Outputs Outcomes Conclusions
Increase access to (renewable) electricity for rural households, schools, health centers and administration offices.
By the end of 2015 562,942 connections were installed (nationally).
- Availability of electricity has significant effect on daily routine of rural dwellers - Children shift their study time from daytime to hours after nightfall and school enrolment is positively affected - Increase in TV as main source of information - Better access to information leads to significant effects on gender aspects: decrease in women who think that it is justified that a husband beats a woman Households increase their home business activities, enterprises emerged and existing enterprises extended their operation hours, products and services.
Overall: the number of SMEs have development and contributed to food security, water resource management, and job creation. The target of increasing connections in Rwanda to 415,000 has largely been met.
Table 3-18: Overview project level objectives linked to outcomes – EARP
The level of food security improvement is shown below.
Level of food security
improvement
– 19940 Electricity Access Roll-out Program (EARP)
Food security objective? Implicit food security objective
Number of direct beneficiaries,
and targeting food insecure?
By the end of December 2015, EARP realized 562.942 connections nationwide (28% of population). Other targets that have been reached: health centres (+30% access to electricity 2009 vs 2015), schools (+18%) and administration offices (+65%).
Yes, targeting rural areas where the majority of the population is active in agricultural activities.
Increased food availability
(likely/evidence)
Indirect. Farmer practices /production can benefit from more and better access to energy, thereby increasing food availability.
Increased food accessibility
(likely/evidence)
Similar to availability, food security might increase indirectly. Economic production in Rwanda as a
whole could be stimulated which creates jobs and incomes, enhancing opportunities of increased
access to food.
Enhanced food stability
(likely/evidence)
Indirectly yes. If the connection are stable, food production, processing and conservation will also
stabilise.
Enhanced food utilization
(likely/evidence)
Yes, electricity helps post-harvesting activities and improves conservation.
Private sector development
(likely/evidence)
Yes, more jobs become available through electrification. More machines can be used and this
increases the amount of job possibilities.
Other (Policy letter 2014 and
MASP 2014-2017) In MASP 2014-2017 the focus on access to reliable and affordable electricity will be phased out EKN Kigali has therefore decided to stop funding the next phase of the project.
Table 3-19: Overview project level food security effects – EARP
86
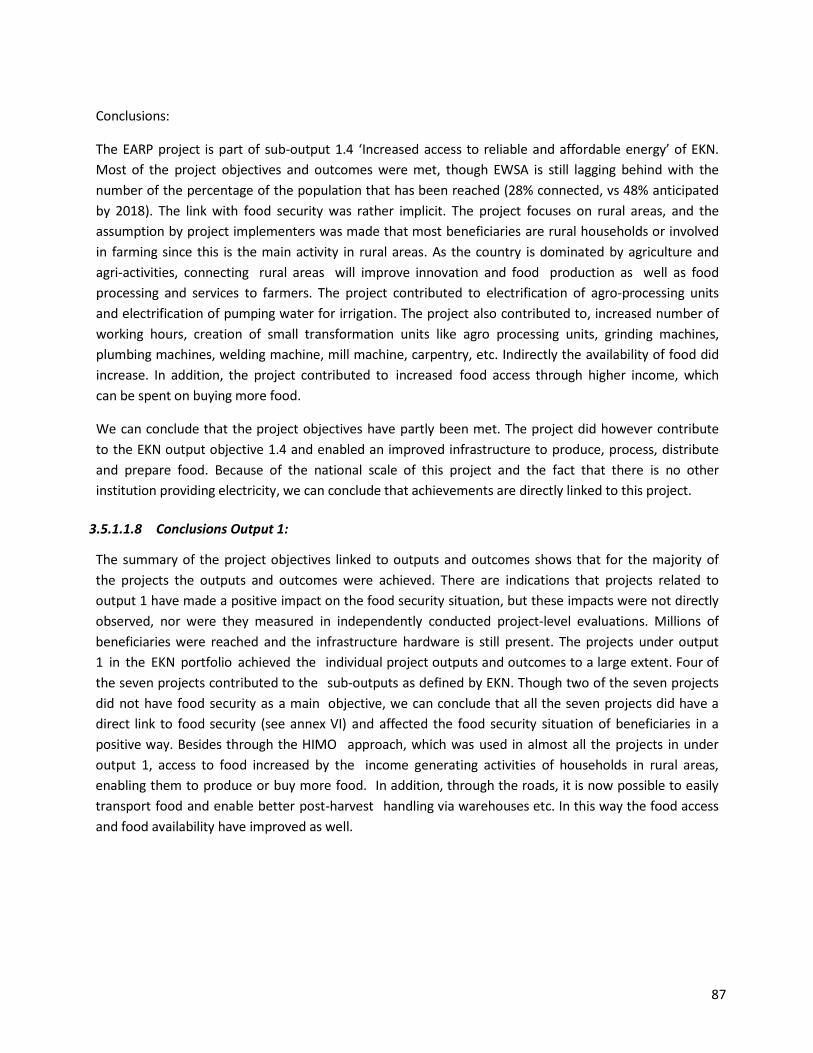
Conclusions:
The EARP project is part of sub-output 1.4 ‘Increased access to reliable and affordable energy’ of EKN. Most of the project objectives and outcomes were met, though EWSA is still lagging behind with the number of the percentage of the population that has been reached (28% connected, vs 48% anticipated by 2018). The link with food security was rather implicit. The project focuses on rural areas, and the assumption by project implementers was made that most beneficiaries are rural households or involved in farming since this is the main activity in rural areas. As the country is dominated by agriculture and agri-activities, connecting rural areas will improve innovation and food production as well as food processing and services to farmers. The project contributed to electrification of agro-processing units and electrification of pumping water for irrigation. The project also contributed to, increased number of working hours, creation of small transformation units like agro processing units, grinding machines, plumbing machines, welding machine, mill machine, carpentry, etc. Indirectly the availability of food did increase. In addition, the project contributed to increased food access through higher income, which can be spent on buying more food.
We can conclude that the project objectives have partly been met. The project did however contribute to the EKN output objective 1.4 and enabled an improved infrastructure to produce, process, distribute and prepare food. Because of the national scale of this project and the fact that there is no other institution providing electricity, we can conclude that achievements are directly linked to this project.
3.5.1.1.8 Conclusions Output 1:
The summary of the project objectives linked to outputs and outcomes shows that for the majority of the projects the outputs and outcomes were achieved. There are indications that projects related to output 1 have made a positive impact on the food security situation, but these impacts were not directly observed, nor were they measured in independently conducted project-level evaluations. Millions of beneficiaries were reached and the infrastructure hardware is still present. The projects under output 1 in the EKN portfolio achieved the individual project outputs and outcomes to a large extent. Four of the seven projects contributed to the sub-outputs as defined by EKN. Though two of the seven projects did not have food security as a main objective, we can conclude that all the seven projects did have a direct link to food security (see annex VI) and affected the food security situation of beneficiaries in a positive way. Besides through the HIMO approach, which was used in almost all the projects in under output 1, access to food increased by the income generating activities of households in rural areas, enabling them to produce or buy more food. In addition, through the roads, it is now possible to easily transport food and enable better post-harvest handling via warehouses etc. In this way the food access and food availability have improved as well.
87
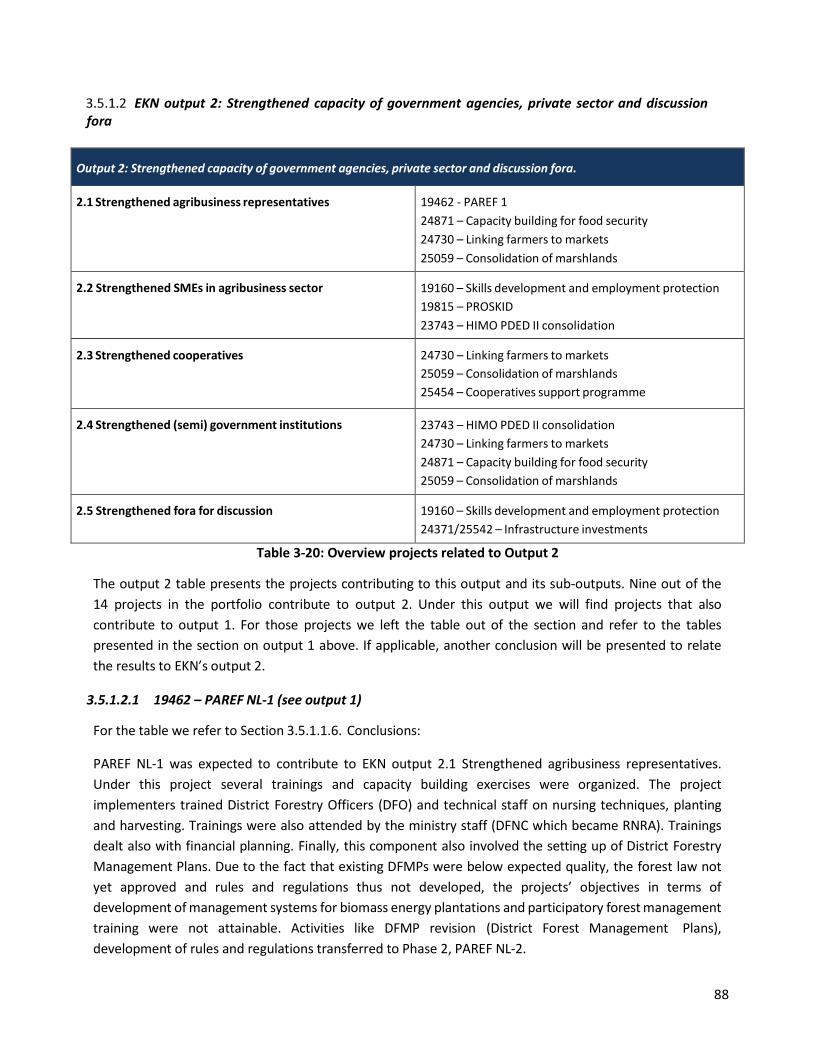
EKN output 2: Strengthened capacity of government agencies, private sector and discussion fora
Output 2: Strengthened capacity of government agencies, private sector and discussion fora.
2.1 Strengthened agribusiness representatives 19462 - PAREF 1 24871 – Capacity building for food security 24730 – Linking farmers to markets 25059 – Consolidation of marshlands
2.2 Strengthened SMEs in agribusiness sector 19160 – Skills development and employment protection 19815 – PROSKID 23743 – HIMO PDED II consolidation
2.3 Strengthened cooperatives 24730 – Linking farmers to markets 25059 – Consolidation of marshlands 25454 – Cooperatives support programme
2.4 Strengthened (semi) government institutions 23743 – HIMO PDED II consolidation 24730 – Linking farmers to markets 24871 – Capacity building for food security 25059 – Consolidation of marshlands
2.5 Strengthened fora for discussion 19160 – Skills development and employment protection 24371/25542 – Infrastructure investments
Table 3-20: Overview projects related to Output 2
The output 2 table presents the projects contributing to this output and its sub-outputs. Nine out of the 14 projects in the portfolio contribute to output 2. Under this output we will find projects that also contribute to output 1. For those projects we left the table out of the section and refer to the tables presented in the section on output 1 above. If applicable, another conclusion will be presented to relate the results to EKN’s output 2.
3.5.1.2.1 19462 – PAREF NL-1 (see output 1)
For the table we refer to Section 3.5.1.1.6. Conclusions:
PAREF NL-1 was expected to contribute to EKN output 2.1 Strengthened agribusiness representatives. Under this project several trainings and capacity building exercises were organized. The project implementers trained District Forestry Officers (DFO) and technical staff on nursing techniques, planting and harvesting. Trainings were also attended by the ministry staff (DFNC which became RNRA). Trainings dealt also with financial planning. Finally, this component also involved the setting up of District Forestry Management Plans. Due to the fact that existing DFMPs were below expected quality, the forest law not yet approved and rules and regulations thus not developed, the projects’ objectives in terms of development of management systems for biomass energy plantations and participatory forest management training were not attainable. Activities like DFMP revision (District Forest Management Plans), development of rules and regulations transferred to Phase 2, PAREF NL-2.
88

It can be concluded that the project outcomes and outputs related to capacity have only partly been achieved. The food security objective was explicit and was visible for the concrete activity of tree planting, preventing erosion and job creation (output 1.4). Specifically for the capacity building path (output 2.1), the link to food security can be made through the trainings of district staff and members of cooperatives (indirectly reached 511 members). An important achievement was the organization, recognition and structuring forest management groups for the management of the planting process, management of the reforested sites, the harvesting, processing and marketing of fuel wood. Though the project implementer BTC was not aware that the project falls under food security for EKN, we can state that there was a potential contribution to food security under PAREF 1. As already stated under output 1, this project needed a follow-up. That is why achievements cannot solely be attributed to the first project but are a joint effort of both parts.
3.5.1.2.2 24871 – Capacity building for food security
The National Capacity Building Secretariat (NCBS) is the GoR body in charge of coordinating capacity building for the entire government. NCBS provides a CB Handbook, monitoring and evaluation tools, coaching and mentoring and resource mobilization. NCBS was established in 2009 (then as Public Sector Capacity Building Secretariat (PSCBS)) to deal with capacity of public institutions in an effective and efficient manner and to foster accountability and transparency in service delivery. Involved organizations include: Ministry of Trade and Industry (MINICOM), Rwanda Bureau of Standards (RBS), Rwanda Cooperative Agency (RCA) and Rwanda Agriculture Board (RAB). As from 2011 there was a larger focus on the agricultural sector in Rwanda to strengthen technical and organizational capacity in order to deliver effective services at individual, organizational and institutional level.
89
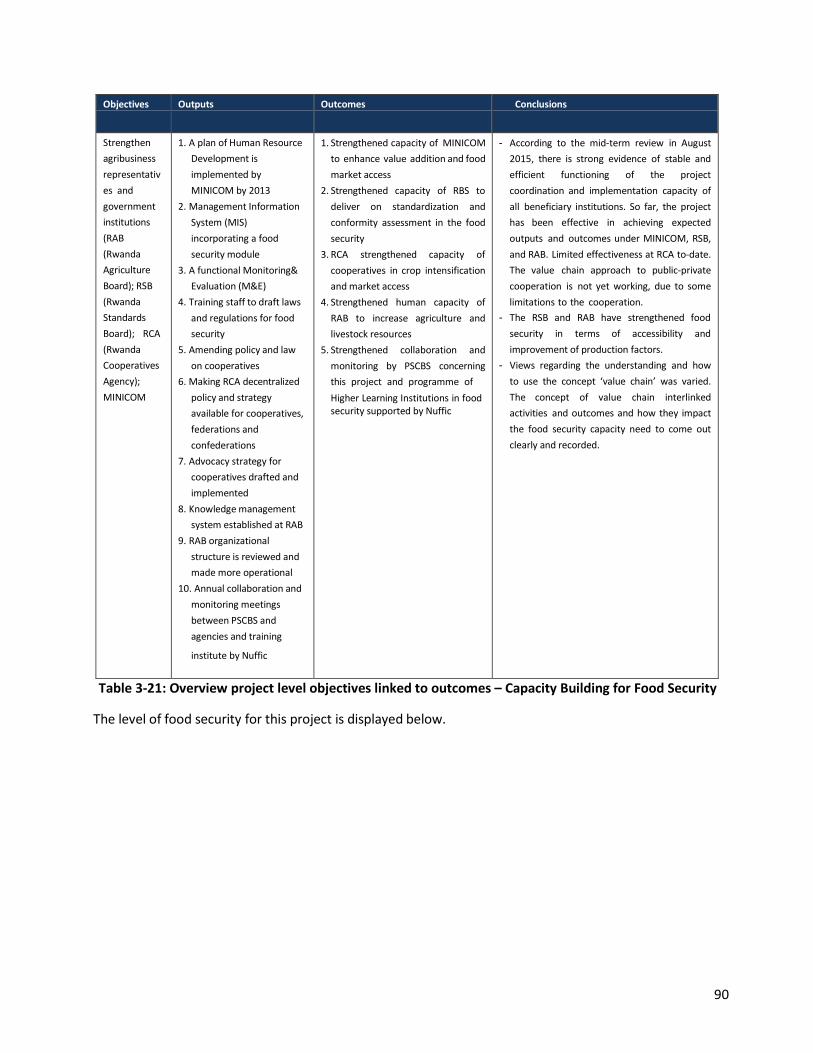
Objectives Outputs Outcomes Conclusions
Strengthen agribusiness representativ es and government institutions (RAB (Rwanda Agriculture Board); RSB (Rwanda Standards Board); RCA (Rwanda Cooperatives Agency); MINICOM
1. A plan of Human Resource Development is implemented by MINICOM by 2013
2. Management Information System (MIS) incorporating a food security module
3. A functional Monitoring&Evaluation (M&E)
4. Training staff to draft laws and regulations for food security
5. Amending policy and lawon cooperatives
6. Making RCA decentralized policy and strategy available for cooperatives,federations and confederations
7. Advocacy strategy for cooperatives drafted and implemented
8. Knowledge management system established at RAB
9. RAB organizational structure is reviewed and made more operational
10. Annual collaboration and monitoring meetings between PSCBS and agencies and training
institute by Nuffic
1. Strengthened capacity of MINICOM to enhance value addition and food market access
2. Strengthened capacity of RBS to deliver on standardization and conformity assessment in the food security
3. RCA strengthened capacity of cooperatives in crop intensification and market access
4. Strengthened human capacity of RAB to increase agriculture and livestock resources
5. Strengthened collaboration and monitoring by PSCBS concerning this project and programme of Higher Learning Institutions in foodsecurity supported by Nuffic
- According to the mid-term review in August 2015, there is strong evidence of stable and efficient functioning of the project coordination and implementation capacity of all beneficiary institutions. So far, the project has been effective in achieving expected outputs and outcomes under MINICOM, RSB, and RAB. Limited effectiveness at RCA to-date. The value chain approach to public-private cooperation is not yet working, due to some limitations to the cooperation.
- The RSB and RAB have strengthened food security in terms of accessibility and improvement of production factors.
- Views regarding the understanding and how to use the concept ‘value chain’ was varied. The concept of value chain interlinked activities and outcomes and how they impact the food security capacity need to come out clearly and recorded.
Table 3-21: Overview project level objectives linked to outcomes – Capacity Building for Food Security
The level of food security for this project is displayed below.
90
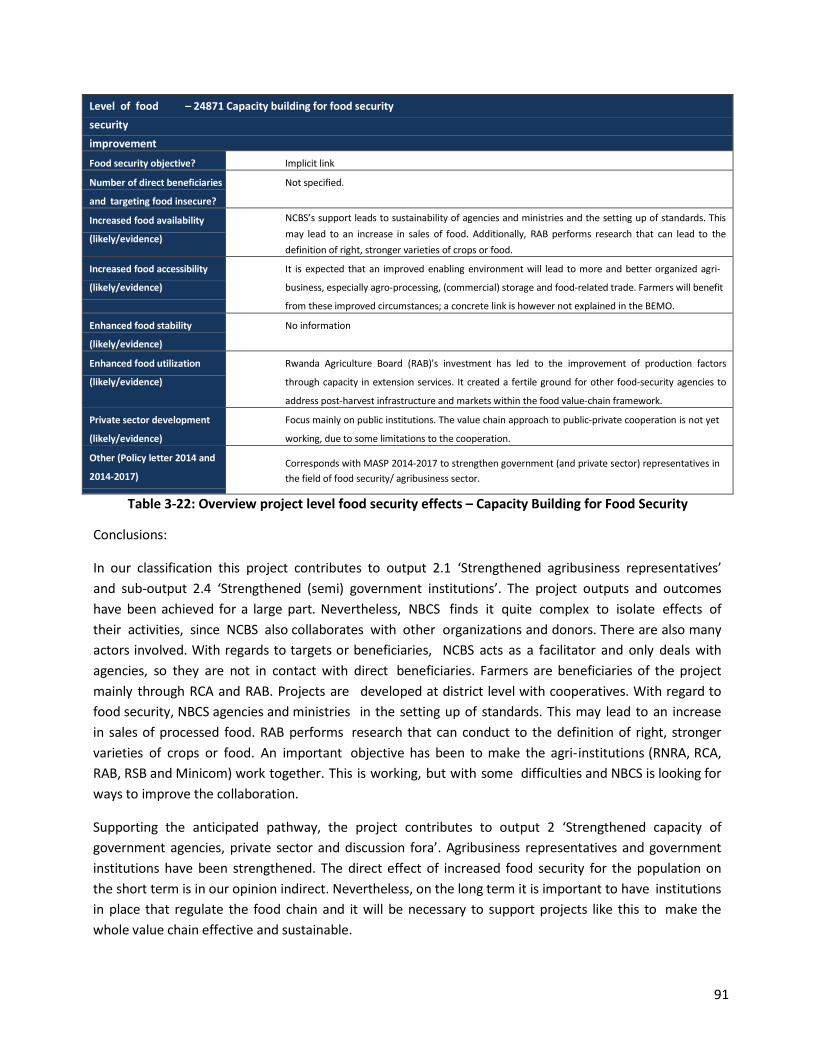
Level of food – 24871 Capacity building for food securitysecurity improvement
Food security objective? Implicit link
Number of direct beneficiaries
and targeting food insecure?
Not specified.
Increased food availability
(likely/evidence)
NCBS’s support leads to sustainability of agencies and ministries and the setting up of standards. This may lead to an increase in sales of food. Additionally, RAB performs research that can lead to the definition of right, stronger varieties of crops or food.
Increased food accessibility
(likely/evidence)
It is expected that an improved enabling environment will lead to more and better organized agri-
business, especially agro-processing, (commercial) storage and food-related trade. Farmers will benefit
from these improved circumstances; a concrete link is however not explained in the BEMO.
Enhanced food stability
(likely/evidence)
No information
Enhanced food utilization
(likely/evidence)
Rwanda Agriculture Board (RAB)'s investment has led to the improvement of production factors
through capacity in extension services. It created a fertile ground for other food-security agencies to
address post-harvest infrastructure and markets within the food value-chain framework.
Private sector development
(likely/evidence)
Focus mainly on public institutions. The value chain approach to public-private cooperation is not yet
working, due to some limitations to the cooperation.
Other (Policy letter 2014 and
2014-2017)
MASP Corresponds with MASP 2014-2017 to strengthen government (and private sector) representatives in the field of food security/ agribusiness sector.
Table 3-22: Overview project level food security effects – Capacity Building for Food Security
Conclusions:
In our classification this project contributes to output 2.1 ‘Strengthened agribusiness representatives’ and sub-output 2.4 ‘Strengthened (semi) government institutions’. The project outputs and outcomes have been achieved for a large part. Nevertheless, NBCS finds it quite complex to isolate effects of their activities, since NCBS also collaborates with other organizations and donors. There are also many actors involved. With regards to targets or beneficiaries, NCBS acts as a facilitator and only deals with agencies, so they are not in contact with direct beneficiaries. Farmers are beneficiaries of the project mainly through RCA and RAB. Projects are developed at district level with cooperatives. With regard to food security, NBCS agencies and ministries in the setting up of standards. This may lead to an increase in sales of processed food. RAB performs research that can conduct to the definition of right, stronger varieties of crops or food. An important objective has been to make the agri-institutions (RNRA, RCA, RAB, RSB and Minicom) work together. This is working, but with some difficulties and NBCS is looking for ways to improve the collaboration.
Supporting the anticipated pathway, the project contributes to output 2 ‘Strengthened capacity of government agencies, private sector and discussion fora’. Agribusiness representatives and government institutions have been strengthened. The direct effect of increased food security for the population on the short term is in our opinion indirect. Nevertheless, on the long term it is important to have institutions in place that regulate the food chain and it will be necessary to support projects like this to make the whole value chain effective and sustainable.
91

3.5.1.2.3 24730 – Linking farmers to markets
Linking Farmers to Markets (LIFAM) aims to strengthen the capacities of the Chamber of Farmers (CoF; the organ in which all agricultural associations (themselves made up of cooperatives) aim to coordinate their work) to provide a better job at their tasks including: playing a consultative and representative role for agriculture in policy discussions; provide information and training that improves producers' access to markets and to credit; promote the development of professional agricultural associations that help producers participate more effectively in agricultural policy making. The project started out as a Private Sector Federation (PSF) project working with the CoF. It is now a project within the CoF. Part of the objectives is to make the CoF self-supporting, based on the collection of membership fees paid by the federations.
Objectives Outputs Outcomes Conclusions
To build capacity of the Chamber of Farmers (CoF) and to allow its members to develop knowledge and skills allowing them to be more competitive and to access profitable markets.
1. Strengthened Chamber to advocate for and represent the farmers, improve service delivery capacity and Rwandan farmers feel they are well represented and served;
2. Audit of knowledge, skills and competences of associations' members of the Chamber is conducted and plans to address the gaps are implemented
3. Increase number of farmers starting an agri- business through a year basis contest.
4. Publish study on access to finance by farmers.
5. Platform to discuss access to finances/ meets twice a year
6. A post-harvest specialist is recruited to assist PSF to elaborate a concrete plan on post-harvest programme possibly
including subsidies.
1. Farmers know PSF and CoF more than before; they have joined the cooperatives that have become stronger; farmer-members have become more knowledgeable (MTR Nov 2015).
2. No information 3. A business plan competition is foreseen
but it has not started yet because they want to develop a new approach onthis topic.
4. Providing guarantees on loans taken out by farmers did not work well. A significant amount of the project funding was consumed by guarantees called upon by the banks, as farmers did not understand they should repay their loans.
5. Forums were co-chaired by the responsible of the Province. They look at constraints faced by farmers and come up with recommendations. Stakeholders meet twice a year.
4. No information
- The programme has contributed to capacity building through a skills audit and subsequent trainings for 6,753 individual farmers and 137 cooperatives belonging to 16 associations. Additionally, four study trips have been organized.
- Part of the objectives is to make CRF self-supporting, based on the collection of membership fees paid by the federations. Yet, this did not succeed.
- Providing guarantees on loans taken out by farmers did not have the anticipated results.
- National representation of farmers has resulted in a regulated market for potatoes. Also, the project manager of the Linking farmers project served as CRF director for the duration of the project, but has now left the organisation, as project funding has ended, potentially leading to a loss of knowledge for CRF.
- The impact on food security has not been measured, but the training, post-harvest and advocacy components are likely to have a lasting effect. However, the food security status of the participating farmers at the start of the project is unknown. Therefore a conclusion on improved food security is not possible.
Table 3-23: Overview project level objectives linked to outcomes – Linking Farmers to Markets
92
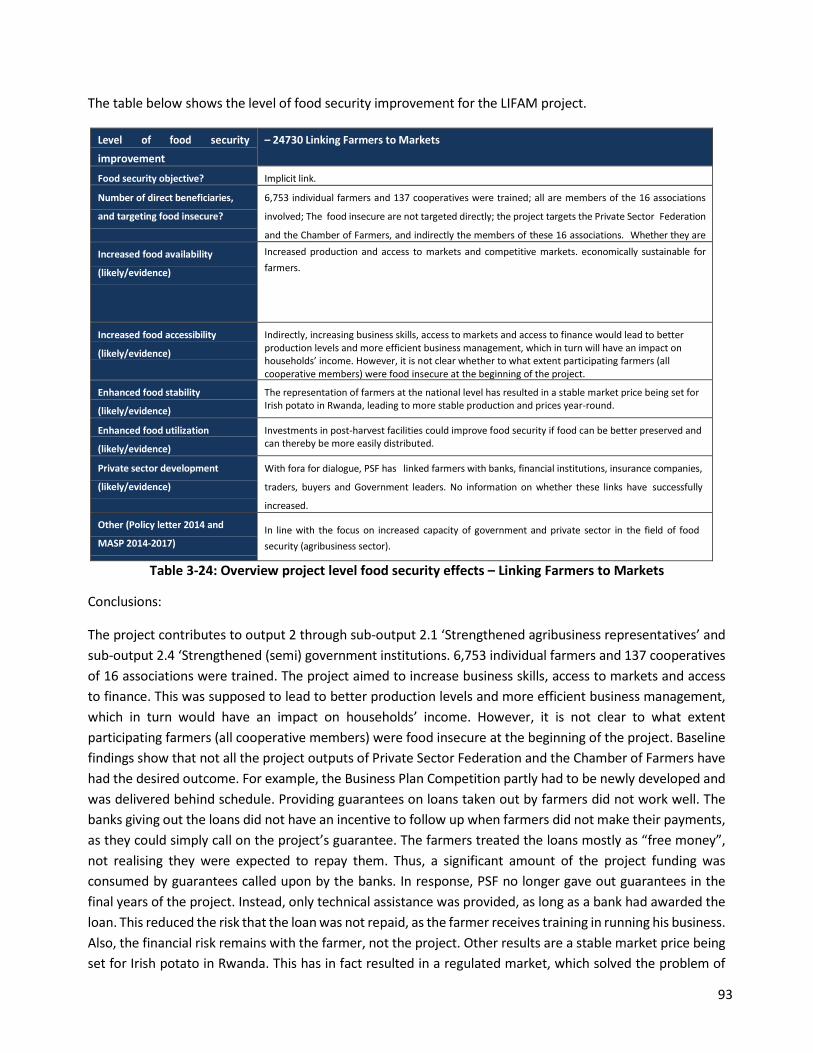
The table below shows the level of food security improvement for the LIFAM project.
Level of food security improvement
– 24730 Linking Farmers to Markets
Food security objective? Implicit link.
Number of direct beneficiaries,
and targeting food insecure?
6,753 individual farmers and 137 cooperatives were trained; all are members of the 16 associations
involved; The food insecure are not targeted directly; the project targets the Private Sector Federation
and the Chamber of Farmers, and indirectly the members of these 16 associations. Whether they are
Increased food availability
(likely/evidence)
Increased production and access to markets and competitive markets. economically sustainable for farmers.
Increased food accessibility
(likely/evidence)
Indirectly, increasing business skills, access to markets and access to finance would lead to better production levels and more efficient business management, which in turn will have an impact on households’ income. However, it is not clear whether to what extent participating farmers (all cooperative members) were food insecure at the beginning of the project.
Enhanced food stability
(likely/evidence)
The representation of farmers at the national level has resulted in a stable market price being set for Irish potato in Rwanda, leading to more stable production and prices year-round.
Enhanced food utilization
(likely/evidence)
Investments in post-harvest facilities could improve food security if food can be better preserved and can thereby be more easily distributed.
Private sector development
(likely/evidence)
With fora for dialogue, PSF has linked farmers with banks, financial institutions, insurance companies,
traders, buyers and Government leaders. No information on whether these links have successfully
increased.
Other (Policy letter 2014 and
MASP 2014-2017) In line with the focus on increased capacity of government and private sector in the field of food security (agribusiness sector).
Table 3-24: Overview project level food security effects – Linking Farmers to Markets
Conclusions:
The project contributes to output 2 through sub-output 2.1 ‘Strengthened agribusiness representatives’ and sub-output 2.4 ‘Strengthened (semi) government institutions. 6,753 individual farmers and 137 cooperatives of 16 associations were trained. The project aimed to increase business skills, access to markets and access to finance. This was supposed to lead to better production levels and more efficient business management, which in turn would have an impact on households’ income. However, it is not clear to what extent participating farmers (all cooperative members) were food insecure at the beginning of the project. Baseline findings show that not all the project outputs of Private Sector Federation and the Chamber of Farmers have had the desired outcome. For example, the Business Plan Competition partly had to be newly developed and was delivered behind schedule. Providing guarantees on loans taken out by farmers did not work well. The banks giving out the loans did not have an incentive to follow up when farmers did not make their payments, as they could simply call on the project’s guarantee. The farmers treated the loans mostly as “free money”, not realising they were expected to repay them. Thus, a significant amount of the project funding was consumed by guarantees called upon by the banks. In response, PSF no longer gave out guarantees in the final years of the project. Instead, only technical assistance was provided, as long as a bank had awarded the loan. This reduced the risk that the loan was not repaid, as the farmer receives training in running his business. Also, the financial risk remains with the farmer, not the project. Other results are a stable market price being set for Irish potato in Rwanda. This has in fact resulted in a regulated market, which solved the problem of
93

very low prices during harvest season, due to which potato farmers would have to sell below cost price. Now they can earn an income and save enough money to invest in seeds and agri-inputs for the next season.
The impact on food security has not been measured by the project. Therefore, a conclusion on improved food security is not possible. Contributions to the functioning of government institutions are also limited.
3.5.1.2.4 25059 – Consolidation marshlands (see output 1 for table)
For the table of Consolidation of Marshlands we refer to Table 3-10. The conclusions are slightly different when the project results are related to output 2.
Conclusions:
Consolidation of Marshlands projects contribute to two EKN country outputs and four sub-outputs being: EKN sub-output 1.1 Feeder roads built in labour intensive way; 2.1 Strengthened agribusiness representatives; 2.3 Strengthened cooperatives and finally 2.4 Strengthened (semi) government institutions.
The project has improved the food security on one hand by increasing the income of beneficiaries, which improved their access to food (output 1.1). On the other hand, farmers increased food availability. The rice yields improved at a rate of more than 4 times (from 1--2 to 5.5 t/ha). Produces were used to sell and for the own consumption. The project was not only teaching farmers how to grow rice, but was also promoting appropriate farming techniques for growing maize and beans on the terraces. The farmers were taught and guided in constructing soil conservation structures to address the problem of erosion in the area. In that way farmer households could increase the area of land available from growing crops and thus directly increase food production. During the in-depth interviews we spoke to representatives of cooperatives, water user organizations (WUOs) and district staff. The WUOs control the use of the dam water and ensure the dam infrastructure is maintained. The WUOs were working closely with the Cooperatives. The cooperatives allocated part of the farmers’ incomes to WUOs to facilitate them in performing their functions. The comprehensive involvement of users and local government authorities (LGA) during all project phases was a key success factor in the consolidation phase. The District monitors cooperatives to ensure that they perform their functions as expected. All the relevant stakeholders still maintain the infrastructure in a self-determined, inclusive and sustainable manner even though the project has ended.
We can conclude that the project outputs have mostly been met, even though slightly lagging behind on some points. The EKN output 2 has largely been realized following different pathways in order to contribute to ‘strengthened capacity of government agencies, private sector and discussion fora’. Other factors such as the GoR favoring terraces and institutionalization of cooperatives, WUO’s did also impacted the realized changes in this project.
3.5.1.2.5 19160 – Skills development and employment protection
The overall objective is to strengthen the SMEs and to promote employment opportunities outside the agricultural sector. The project focused especially on improving the employability of TVET (Technical and Vocational Education Training) graduates. It is assumed that better vocational training will increase the
94

number of businesses (modern technologies, better understanding of labour market). This way the private sector will be strengthened. Another objective of the project is that improvement of technical skills of students will increase their knowledge and their chances of employability.
Generally speaking, despite increased investments in TVET, there remains an overall scarcity of research in this area and specific knowledge gaps (Tripney and Hombrados, 2013). The widespread assumption is that the supply of skills creates jobs, but there is not sufficient evidence (King, 2013). A systematic review of TVET studies by Tripney and Hombrados (2013) has provided “some evidence to support the claim that participation in TVET improves the labour market situation of youth in LMICs, on average, when compared to youth who do not participate, with the strength of the evidence strongest for formal employment and monthly earnings”. However, this positive effect of TVET on youth is statistically small and cannot be seen as conclusive evidence of the effectiveness of TVET on youth unemployment outcomes. According to the Asian Development Bank (ADB) (2009), investing in skills is necessary but not sufficient to promote development; an enabling environment (economic, social and institutional) is deemed crucial. After building the right skills, a country should make use of their talent pool by shaping demand. Skills also need to be used at work efficiently and be maintained to prevent skills ‘evaporation’ (Sleicher, 2013).
Objectives Outputs Outcomes Conclusions
1. The economic performance of MSMEs and non- agricultural employment opportunities has significantly improved for poor sections of the population.
2. The employability of youngRwandans,especially youngwomen, is improved.
1. A structured Public Private Dialogue (PPD) is established and a PPD Secretariat was launched (Results Matrix GIZ Report).
2. A TVET strategy and an organizational framework for implementation are established and reflect the results of Public Private Dialogue (PPD).
- 10,087 people, including 4,815 women (48%), are trained by private-sector organizations
- 9,034 people, including 4,657 women (52%), received training as part of the Upgrade Your Skills (UYS) initiative
- 69,342 jobs created until 2013 (including temporary jobs)
1. Three Public-Private Partnerships (PPP) were launched, leading to a total of 155 male and female entrepreneurs and employees to receive training in financial accounting (GIZ Final Report).
2. - The systematic inclusion of the private
sector has been secured through the integration of work experience as part of the school-based training
- Increase in credit and loans to private sector
- From 95 (2012) to 240 (2013) exporting companies in Rwanda
- Investor Perception Index increased from 71 (2012) to 74.4 (2013)
With respect to the 1st objective it is unclear if and how SMEs are actually strengthened.
The 2nd objective has been completed. - Skills of trainees were improved - Employability of trained people increased, because
of acquired skills - Companies introduced new products, provided
better service, and got more income - Training centre increased the number of new
trainees The programme was not primarily aimed at poverty reduction, but it did make a contribution to improving the qualifications of young men and women, who therefore have better access to more productive employment and a more secure income. The programme has organised a campaign for women and girls to increase their participation in vocational training courses.
Table 3-25: Overview project level objectives linked to outcomes – Skills Development and Employment Protection
In the table below we present the level of food security improvement for this project.
95
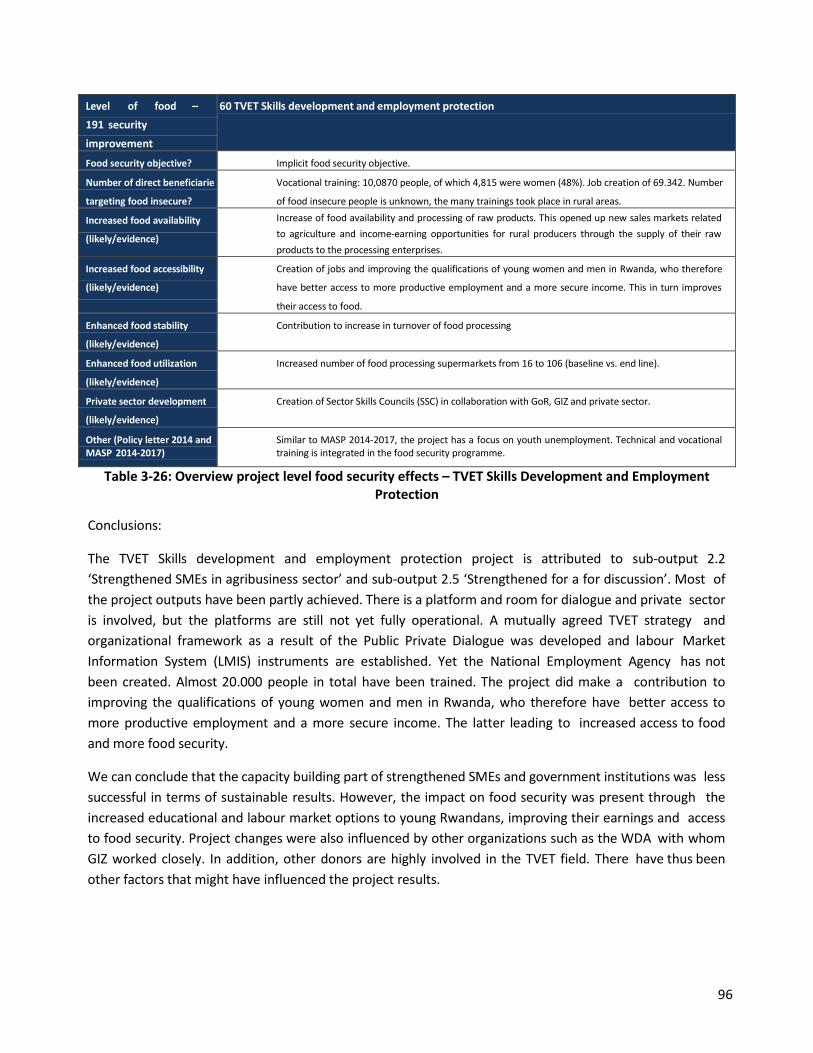
Level of food – 191 security improvement
60 TVET Skills development and employment protection
Food security objective? Implicit food security objective.
Number of direct beneficiarie
targeting food insecure?
s, and Vocational training: 10,0870 people, of which 4,815 were women (48%). Job creation of 69.342. Number
of food insecure people is unknown, the many trainings took place in rural areas.
Increased food availability
(likely/evidence)
Increase of food availability and processing of raw products. This opened up new sales markets related to agriculture and income-earning opportunities for rural producers through the supply of their raw products to the processing enterprises.
Increased food accessibility
(likely/evidence)
Creation of jobs and improving the qualifications of young women and men in Rwanda, who therefore
have better access to more productive employment and a more secure income. This in turn improves
their access to food.
Enhanced food stability
(likely/evidence)
Contribution to increase in turnover of food processing
Enhanced food utilization
(likely/evidence)
Increased number of food processing supermarkets from 16 to 106 (baseline vs. end line).
Private sector development
(likely/evidence)
Creation of Sector Skills Councils (SSC) in collaboration with GoR, GIZ and private sector.
Other (Policy letter 2014 and MASP 2014-2017)
Similar to MASP 2014-2017, the project has a focus on youth unemployment. Technical and vocational training is integrated in the food security programme.
Table 3-26: Overview project level food security effects – TVET Skills Development and Employment Protection
Conclusions:
The TVET Skills development and employment protection project is attributed to sub-output 2.2 ‘Strengthened SMEs in agribusiness sector’ and sub-output 2.5 ‘Strengthened for a for discussion’. Most of the project outputs have been partly achieved. There is a platform and room for dialogue and private sector is involved, but the platforms are still not yet fully operational. A mutually agreed TVET strategy and organizational framework as a result of the Public Private Dialogue was developed and labour Market Information System (LMIS) instruments are established. Yet the National Employment Agency has not been created. Almost 20.000 people in total have been trained. The project did make a contribution to improving the qualifications of young women and men in Rwanda, who therefore have better access to more productive employment and a more secure income. The latter leading to increased access to food and more food security.
We can conclude that the capacity building part of strengthened SMEs and government institutions was less successful in terms of sustainable results. However, the impact on food security was present through the increased educational and labour market options to young Rwandans, improving their earnings and access to food security. Project changes were also influenced by other organizations such as the WDA with whom GIZ worked closely. In addition, other donors are highly involved in the TVET field. There have thus been other factors that might have influenced the project results.
96
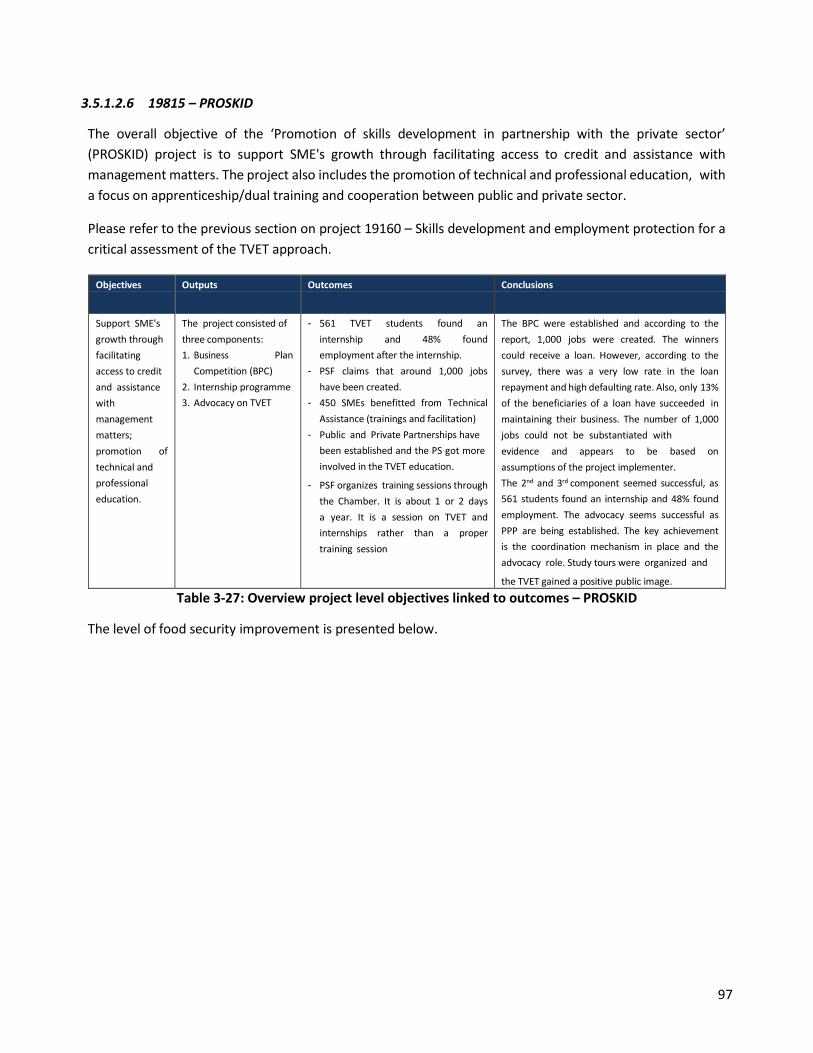
3.5.1.2.6 19815 – PROSKID
The overall objective of the ‘Promotion of skills development in partnership with the private sector’ (PROSKID) project is to support SME's growth through facilitating access to credit and assistance with management matters. The project also includes the promotion of technical and professional education, with a focus on apprenticeship/dual training and cooperation between public and private sector.
Please refer to the previous section on project 19160 – Skills development and employment protection for a critical assessment of the TVET approach.
Objectives Outputs Outcomes Conclusions
Support SME's growth through facilitating access to credit and assistance with management matters; promotion of technical and professional education.
The project consisted of three components: 1. Business Plan
Competition (BPC) 2. Internship programme 3. Advocacy on TVET
- 561 TVET students found an internship and 48% found employment after the internship.
- PSF claims that around 1,000 jobs have been created.
- 450 SMEs benefitted from Technical Assistance (trainings and facilitation)
- Public and Private Partnerships have been established and the PS got more involved in the TVET education.
- PSF organizes training sessions through the Chamber. It is about 1 or 2 days a year. It is a session on TVET and internships rather than a proper training session
The BPC were established and according to the report, 1,000 jobs were created. The winners could receive a loan. However, according to the survey, there was a very low rate in the loan repayment and high defaulting rate. Also, only 13% of the beneficiaries of a loan have succeeded in maintaining their business. The number of 1,000 jobs could not be substantiated with evidence and appears to be based on assumptions of the project implementer. The 2nd and 3rd component seemed successful, as 561 students found an internship and 48% found employment. The advocacy seems successful as PPP are being established. The key achievement is the coordination mechanism in place and the advocacy role. Study tours were organized and
the TVET gained a positive public image.
Table 3-27: Overview project level objectives linked to outcomes – PROSKID
The level of food security improvement is presented below.
97

Level of food security improvement
– 19815 PROSKID
Food security objective? Implicit food security objective
Number of direct beneficiaries, and
targeting food insecure?
Direct beneficiaries are 516 interns and 450 companies in business plan competition. Food insecure
were not a target group.
Increased food availability
(likely/evidence)
No information
Increased food accessibility
(likely/evidence)
No information
Enhanced food stability
(likely/evidence)
No information
Enhanced food utilization
(likely/evidence)
No information
Private sector development
(likely/evidence)
Direct focus on private sector development through granting loans, trainings and graduate internships
at companies. Promotion of entrepreneurship and increase of employability of students. However,
additionality is not clear, as no baseline data are available.
Other (Policy letter 2014 and MASP
2014-2017) In line with MASP 2014-2017 to focus on youth unemployment, thereby also indirectly improving food security.
Table 3-28: Overview project level food security effects – PROSKID
Conclusions:
The PROSKID project can be attributed to EKN sub-output 2.2 ‘Strengthened SMEs in agribusiness sector’ of output 2. The project outputs have in general been achieved. 450 companies took part in the final stage of the business plan competition (BPC) which is slightly higher than what was expected (400). Even though the number of participants is higher than targeted, all results were not achieved and especially with regards to access to funds. PSF had assumed that people would repay their loan and that this money could be reused every year through the guarantee fund to finance new companies. So, it was problematic if a company wanted to have another intake. As a result, the guarantee fund was fully operational only during the first year of operations. Afterwards, PSF had to work with other banks. In the BeMo, With regards to the second component of the project (internships). 516 graduates got an internship in a company and about 47% of the interns were employed afterwards. Baseline information of the situation before the project is not available, making it impossible to compare the results of the project to a situation prior to the project. The main focus of the project was not on food security even though business environment improvement, economic development and access to finance led to high revenues for households which in turn enable them to have better access to food.
We can conclude that the project did strengthen SMEs in general (EKN output), however most of the targeted SMEs were not active in agribusiness sector. Nevertheless, increase job opportunities and internships improved the income situation of the participants contributing to an improved access to food.
98

3.5.1.2.7 23743 – HIMO PDED II consolidation (see output 1)
The HIMO PDED II project contributes to EKN sub-output 1.1 and sub-output 2.4 Strengthened (semi) government institutions. Output 2.4 aims to contribute to the general goal of output 2, being ‘Strengthened capacity of government agencies, private sector and discussion fora’.
Conclusions:
One of the project objectives was to train districts, SMEs and cooperatives to maintain feeder roads by themselves. Public and private institutions have been technically trained through the HIMO approach (72 cooperatives, 4 SMEs, 17 committees of developed sites, 76 technicians and 100 female entrepreneurs organized in 5 networks). In line with objective 2 districts, SMEs and cooperatives have been trained to maintain feeder roads by themselves. The transfer of capacity has been done in favor of cooperatives, SMEs and districts. The objective of this project has been met, however we learned that a challenge has been the instability of the District technical staff periodically subjected to administrative changes. At end line (March 2016) the capacity building program to Districts and partners is ongoing, under the coordination of the Ministry of Agriculture and Animal Resources (MINAGRI) and with the technical assistance from Helpage Rwanda to further strengthen the districts to perform work independently of any technical support.
Overall we can conclude that the project objectives have been met, however capacity building is still in progress and remains challenging. In line with EKN output 2.4 semi government institutions have been strengthened, contributing to output 2. Though following the anticipated pathway of EKN, strengthening capacity of institutions, in our opinion, strengthening representatives of agri-business only indirectly contributes to an increase of food accessibility and food availability.
3.5.1.2.8 25454 – Cooperatives support programme
The project goal is to accelerate agri-business development thus promoting rural economic growth and generating jobs in the agricultural sector. Two approaches are used in this project: a selected group of cooperatives is directly targeted with coaching and training and a much larger cooperative group is indirectly targeted through capacity building of the Cooperative Support Network in the selected districts.
99
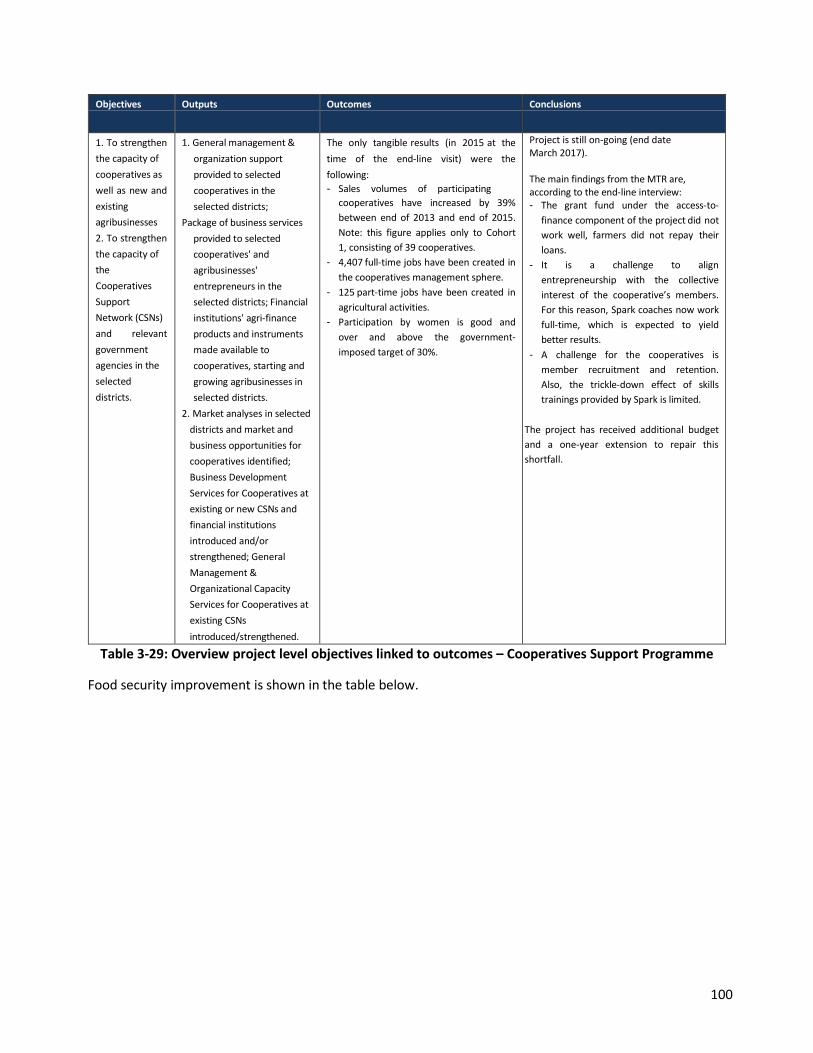
Objectives Outputs Outcomes Conclusions
1. To strengthen the capacity of cooperatives as well as new and existing agribusinesses 2. To strengthen the capacity of the Cooperatives Support Network (CSNs) and relevant government agencies in the selected districts.
1. General management &organization support provided to selected cooperatives in the selected districts;
Package of business services provided to selected cooperatives' and agribusinesses' entrepreneurs in the selected districts; Financial institutions' agri-finance products and instruments made available to cooperatives, starting and growing agribusinesses in selected districts.
2. Market analyses in selected districts and market and business opportunities for cooperatives identified; Business Development Services for Cooperatives at existing or new CSNs and financial institutions introduced and/or strengthened; General Management & Organizational Capacity Services for Cooperatives at existing CSNs introduced/strengthened.
The only tangible results (in 2015 at the time of the end-line visit) were the following: - Sales volumes of participating
cooperatives have increased by 39% between end of 2013 and end of 2015. Note: this figure applies only to Cohort 1, consisting of 39 cooperatives.
- 4,407 full-time jobs have been created in the cooperatives management sphere.
- 125 part-time jobs have been created in agricultural activities.
- Participation by women is good and over and above the government- imposed target of 30%.
Project is still on-going (end date March 2017).
The main findings from the MTR are, according to the end-line interview: - The grant fund under the access-to-
finance component of the project did not work well, farmers did not repay their loans.
- It is a challenge to align entrepreneurship with the collective interest of the cooperative’s members. For this reason, Spark coaches now work full-time, which is expected to yield better results.
- A challenge for the cooperatives is member recruitment and retention. Also, the trickle-down effect of skills trainings provided by Spark is limited.
The project has received additional budget and a one-year extension to repair this shortfall.
Table 3-29: Overview project level objectives linked to outcomes – Cooperatives Support Programme
Food security improvement is shown in the table below.
100
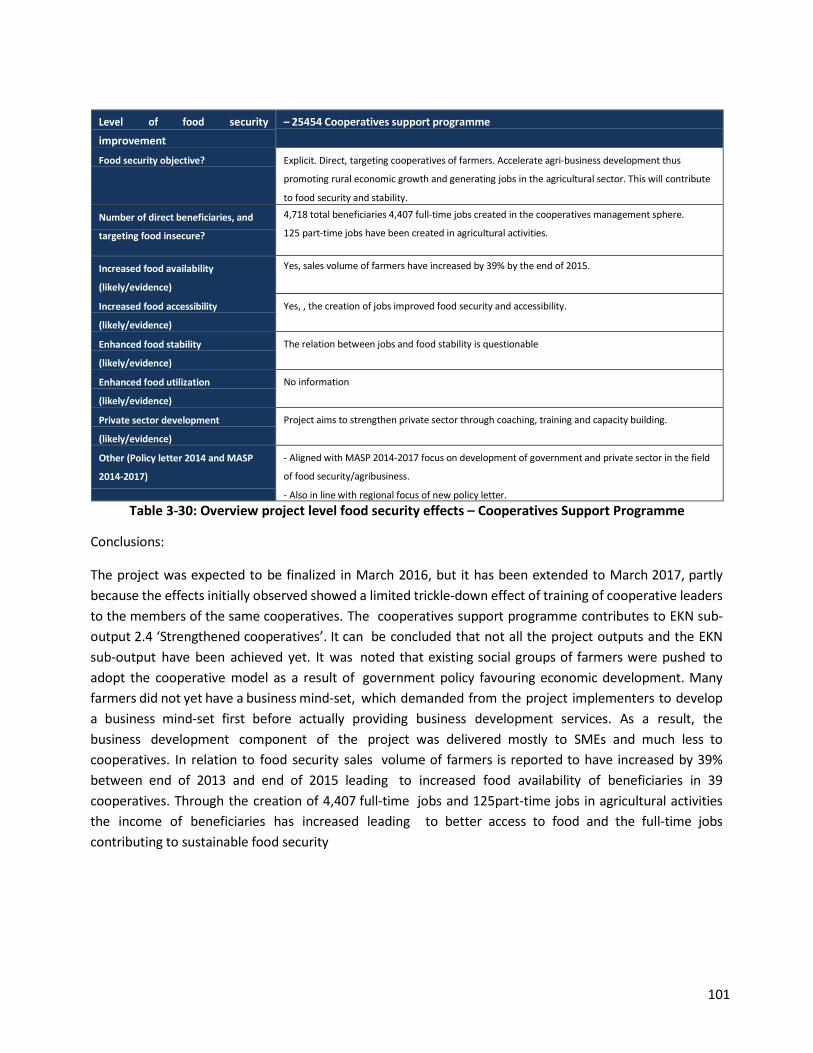
Level of food security improvement
– 25454 Cooperatives support programme
Food security objective? Explicit. Direct, targeting cooperatives of farmers. Accelerate agri-business development thus
promoting rural economic growth and generating jobs in the agricultural sector. This will contribute
to food security and stability.
Number of direct beneficiaries, and
targeting food insecure?
4,718 total beneficiaries 4,407 full-time jobs created in the cooperatives management sphere.
125 part-time jobs have been created in agricultural activities.
Increased food availability
(likely/evidence)
Yes, sales volume of farmers have increased by 39% by the end of 2015.
Increased food accessibility
(likely/evidence)
Yes, , the creation of jobs improved food security and accessibility.
Enhanced food stability
(likely/evidence)
The relation between jobs and food stability is questionable
Enhanced food utilization
(likely/evidence)
No information
Private sector development
(likely/evidence)
Project aims to strengthen private sector through coaching, training and capacity building.
Other (Policy letter 2014 and MASP
2014-2017)
- Aligned with MASP 2014-2017 focus on development of government and private sector in the field
of food security/agribusiness.
- Also in line with regional focus of new policy letter. Table 3-30: Overview project level food security effects – Cooperatives Support Programme
Conclusions:
The project was expected to be finalized in March 2016, but it has been extended to March 2017, partly because the effects initially observed showed a limited trickle-down effect of training of cooperative leaders to the members of the same cooperatives. The cooperatives support programme contributes to EKN sub-output 2.4 ‘Strengthened cooperatives’. It can be concluded that not all the project outputs and the EKN sub-output have been achieved yet. It was noted that existing social groups of farmers were pushed to adopt the cooperative model as a result of government policy favouring economic development. Many farmers did not yet have a business mind-set, which demanded from the project implementers to develop a business mind-set first before actually providing business development services. As a result, the business development component of the project was delivered mostly to SMEs and much less to cooperatives. In relation to food security sales volume of farmers is reported to have increased by 39% between end of 2013 and end of 2015 leading to increased food availability of beneficiaries in 39 cooperatives. Through the creation of 4,407 full-time jobs and 125part-time jobs in agricultural activities the income of beneficiaries has increased leading to better access to food and the full-time jobs contributing to sustainable food security
101

3.5.1.2.9 24371/25542 – Infrastructure investments (see output 1)
The Infrastructure projects contribute to EKN sub-output 1.1, 1.2 and to output 2.4 Strengthened fora for discussion.
Conclusions:
The project provides funds to the GoR’s Local Development Agency (LODA) to utilise in its basket fund for local infrastructure investments and was implemented in a decentralized and participatory approach. With this approach LODA wanted to promote economic and social development. LODA develops tools, puts guidelines in places, monitors & evaluates the development of local government. In addition, it carries out feasibility studies and offers information on project progress and impact. In each district, there is an engineer in charge of monitoring, managing the funds and the progress of the projects. There is also a financial compliance team, with economists and sociologists involved in the projects.
The decentralized approach of this project gave the opportunity to focus on the local needs and bring information from bottom-up (population – districts – LODA – GoR). This can be considered as a more participatory approach than was the case before in Rwanda. One of the project objectives was improved district legitimacy on the local development agenda: the projects are chosen locally by the districts who decide on the priorities for the district. In the Muhanga district (in-depth evaluation) we learned that there is a yearly performance evaluation in all the districts and that each of them sets up a performance contract with the staff and with GoR. After a year the districts are evaluated based on the results achieved. This gives them on the one hand more legitimacy on the local agenda, on the other hand it helps LODA and the GoR to discuss the points for improvement.
Maintenance plans have been developed by districts already during the first phase of the project. In the draft final evaluation report of LODA to EKN (March 2016) we see that the execution of maintenance is in several districts not up to the desired level. The evaluation recommends to carry out regularly and preventive maintenance. It seems that this output is lagging behind. It can be observed that most of the project outputs have been achieved. In the latest phase of the project, maintenance remains a point of attention. Contribution to EKN output 2.5 seems not to be very clear. We learned that there is discussion within the districts, but not in what way there are discussion fora of for example farming cooperatives of dialogue between farming cooperatives and districts. Furthermore, as evaluators we do not see in what way the EKN output contributes to food security. Thus achievements under output 2 for this project are not very strong, the contribution to output 1 and to food security is much more evident.
3.5.1.2.10 Conclusions Output 2:
Projects related to output 2 “Strengthened capacity of government agencies, private sector and discussion” managed to institutionalize cooperatives, build the capacity of local government officers and private sector agents. Also young people have been trained and vocational training have been developed to improve the job opportunities of the youth and create more jobs for SMEs.
Capacity building can have a long term positive effect. However, some important challenges remain to be overcome. In some projects capacity building seems to be a continuous process, while it is actually the ambition that the private sector or local government will be sufficiently equipped to put important
102
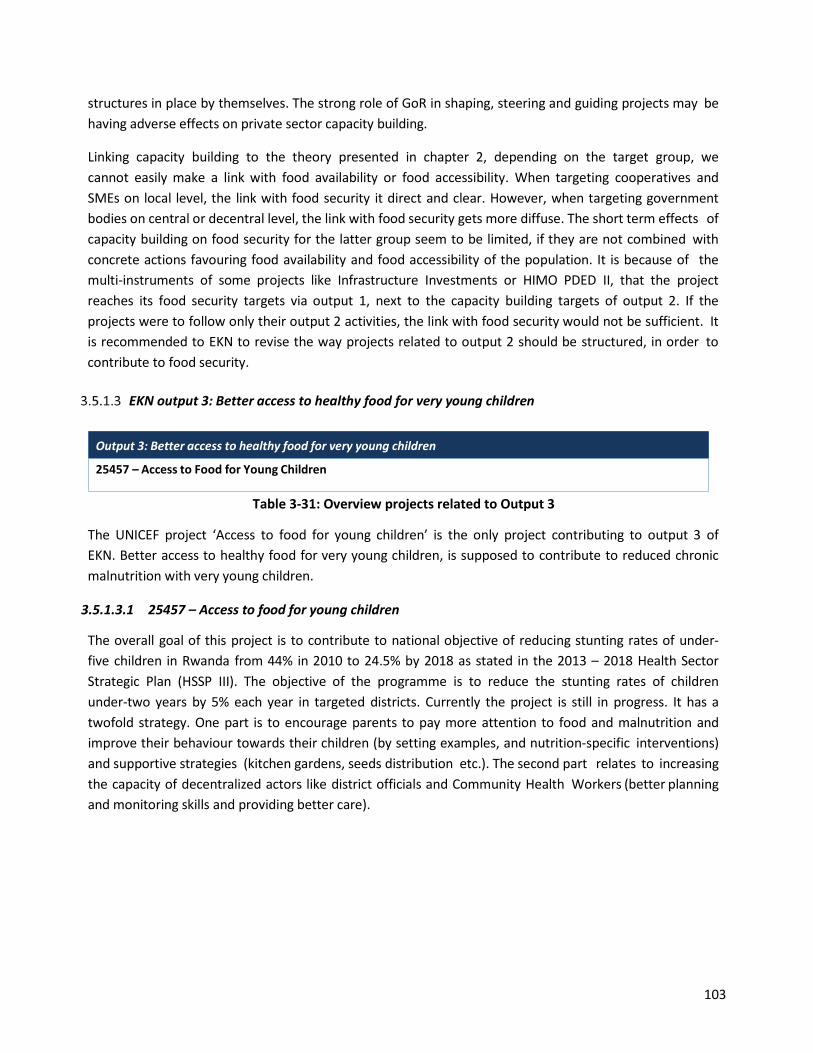
structures in place by themselves. The strong role of GoR in shaping, steering and guiding projects may be having adverse effects on private sector capacity building.
Linking capacity building to the theory presented in chapter 2, depending on the target group, we cannot easily make a link with food availability or food accessibility. When targeting cooperatives and SMEs on local level, the link with food security it direct and clear. However, when targeting government bodies on central or decentral level, the link with food security gets more diffuse. The short term effects of capacity building on food security for the latter group seem to be limited, if they are not combined with concrete actions favouring food availability and food accessibility of the population. It is because of the multi-instruments of some projects like Infrastructure Investments or HIMO PDED II, that the project reaches its food security targets via output 1, next to the capacity building targets of output 2. If the projects were to follow only their output 2 activities, the link with food security would not be sufficient. It is recommended to EKN to revise the way projects related to output 2 should be structured, in order to contribute to food security.
EKN output 3: Better access to healthy food for very young children
Table 3-31: Overview projects related to Output 3
The UNICEF project ‘Access to food for young children’ is the only project contributing to output 3 of EKN. Better access to healthy food for very young children, is supposed to contribute to reduced chronic malnutrition with very young children.
3.5.1.3.1 25457 – Access to food for young children
The overall goal of this project is to contribute to national objective of reducing stunting rates of under- five children in Rwanda from 44% in 2010 to 24.5% by 2018 as stated in the 2013 – 2018 Health Sector Strategic Plan (HSSP III). The objective of the programme is to reduce the stunting rates of children under-two years by 5% each year in targeted districts. Currently the project is still in progress. It has a twofold strategy. One part is to encourage parents to pay more attention to food and malnutrition and improve their behaviour towards their children (by setting examples, and nutrition-specific interventions) and supportive strategies (kitchen gardens, seeds distribution etc.). The second part relates to increasing the capacity of decentralized actors like district officials and Community Health Workers (better planning and monitoring skills and providing better care).
Output 3: Better access to healthy food for very young children
25457 – Access to Food for Young Children
103
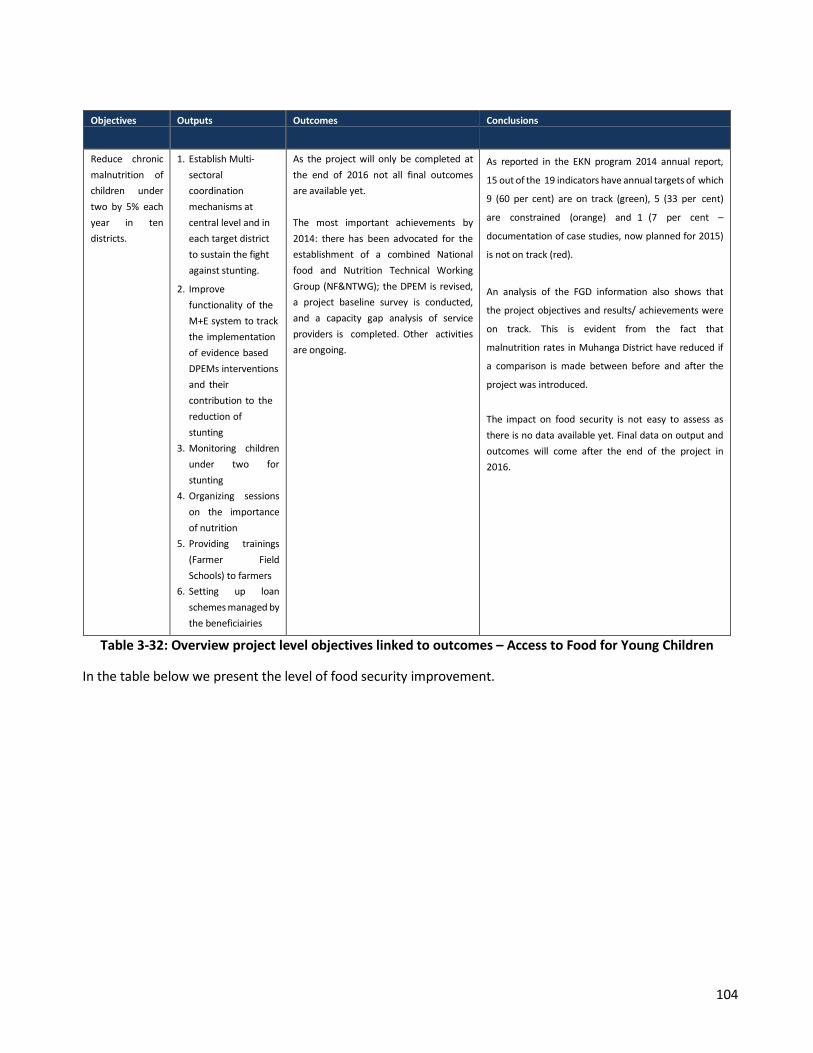
Objectives Outputs Outcomes Conclusions
Reduce chronic malnutrition of children under two by 5% each year in ten districts.
1. Establish Multi- sectoral coordination mechanisms at central level and in each target district to sustain the fight against stunting.
2. Improve functionality of the M+E system to track the implementation of evidence based DPEMs interventions and their contribution to the reduction of stunting
3. Monitoring children under two for stunting
4. Organizing sessions on the importance of nutrition
5. Providing trainings (Farmer Field Schools) to farmers
6. Setting up loanschemes managed by the beneficiairies
As the project will only be completed at the end of 2016 not all final outcomes are available yet.
The most important achievements by 2014: there has been advocated for the establishment of a combined National food and Nutrition Technical Working Group (NF&NTWG); the DPEM is revised, a project baseline survey is conducted, and a capacity gap analysis of service providers is completed. Other activities are ongoing.
As reported in the EKN program 2014 annual report,
15 out of the 19 indicators have annual targets of which
9 (60 per cent) are on track (green), 5 (33 per cent)
are constrained (orange) and 1 (7 per cent –
documentation of case studies, now planned for 2015)
is not on track (red).
An analysis of the FGD information also shows that
the project objectives and results/ achievements were
on track. This is evident from the fact that
malnutrition rates in Muhanga District have reduced if
a comparison is made between before and after the
project was introduced.
The impact on food security is not easy to assess as there is no data available yet. Final data on output and outcomes will come after the end of the project in 2016.
Table 3-32: Overview project level objectives linked to outcomes – Access to Food for Young Children
In the table below we present the level of food security improvement.
104

Level of food security improvement
– 25457 Access to food for young children
Food security objective? Yes, objective of the programme is to reduce stunting (chronic malnutrition) rates of children under 2
years by 5% (compared to existing level of 44%) by each year in targeted districts.
Number of direct beneficiaries,
and targeting food insecure?
Targeting 9,930 households including pregnant women, lactating women and children under the age
of two.
Increased food availability
(likely/evidence)
Food availability increased to more technical knowledge of farming, growing vegetables, using fertilizers etc. No evidence available of an increase in production.
Increased food accessibility
(likely/evidence)
Food accessibility addressed by teaching women agricultural skills that make them more self-
sufficient. Also, by sensitizing communities to join saving and lending groups.
Enhanced food stability
(likely/evidence)
For the target group of young children food stability could increase since their food consumption
attracts more attention and is given higher priority.
Enhanced food utilization
(likely/evidence)
Yes, pregnant women/mothers have better knowledge of the nutritious value of food and learn how
to produce and cook by themselves.
Private sector development
(likely/evidence)
No information
Other (Policy letter 2014 and
MASP 2014-2017)
- Focus on pregnant/lactating women to decrease stunting rates for two-year olds is in line with new policy letter’s focus on reproductive health.
- In line with regional focus of new policy letter
- Project contributes directly to food security. Trainings ensure sustainability and long-term effects.
Table 3-33: Overview project level food security effects – Access to Food for Young Children
Conclusions:
The Unicef project has an explicit link to food security and direct impact on beneficiaries (food availability).
At the time when the program proposal was developed, the most recent Rwanda RDHS survey, 2010, showed a prevalence of chronic malnutrition (stunting) among children under-five as alarmingly high at 44%. This level dropped to 38% in 2014/15. Since the project is still ongoing, it is difficult to assess whether or not output and outcome targets will be met. For the in-depth end line evaluation, we visited the Muhanga district where the partner NGO CRS is active to reduce malnutrition.
The project seems to have contributed to better food security of the participants using an integrated approach of:
• Nutrition Education: This is mainly education on nutrition, health and sanitation, cookingdemonstration sessions, recuperative feeding and growth monitoring of beneficiary children under 2years as well as sensitization sessions on the nutritional needs of pregnant and lactating mothers.
• Antenatal Sensitization – The project taught the importance of ante-natal care and more specificallyurged pregnant women to visit an ante-natal clinic at least four times before the birth of their babies.It also stressed the need for male involvement. In the CRS operated antenatal clinics, women whocame with their male counterparts were given priority in being attended to.
105
• Saving/lending activities which the beneficiaries own entirely. They raise a base amount that issupposed to be contributed by each one of the participants. They then use these savings to lendmoney to each other to use it to buy livestock, farming, school fees, in case of illness of for socialevents. The loans advance to members are paid back with no interest.
• Improved household agriculture techniques where beneficiaries are taught better and improvedways of farming, which also includes and not limited to use of fertilizers in their farms as well aspromoting the planting of vegetables and fruits.
The above mentioned techniques contributed to the awareness of mothers and fathers of young children with regard to use of farming techniques and quality of food to be offered to their children. For the in-depth evaluation we conducted focus group discussions in Muhanga. An analysis of the FGD information shows that the project objectives and results/achievements were on track. This is evident from the fact that malnutrition rates in Muhanga District have reduced if a comparison is made between before and after the project was introduced. The malnutrition reduction was also evidenced by the testimonies from some of the mothers who said their children did not suffer from malnutrition anymore because of the project’s interventions. From the information provided by the female participants, the health status of mothers and children who participated in the project has improved. For example, the pregnant mothers now often go for ante-natal care and are able to eat a more balanced diet now than before the project started.
It can be concluded that the EKN output goal is being reached. Malnourished children have, through their mothers, better access to healthy food. The food availability is improving, however, as we learned during the FGD in Muhanga district it remains a challenge to supply sufficient food for all family members to reduce chronic malnutrition.
3.5.2 Contribution analysis “To what extent have the project pathway, alternative pathways, or other factors contributed to changes
observed?”
In this section we will discuss to what extent the changes observed can be attributed to the project or also to alternative pathways. We will list all the projects below and briefly present our analysis.
19160 - TVET - Skills Development and Employment Protection
In this project the project implementer GIZ had a close collaboration with the joint Workforce Development Authority (WDA) to stimulate private sector dialogue. In the project thousands of people received training and labor market instruments were developed in close collaboration with the Rwandan Development Board (RDB). The project pathway was thus a joint effort of several actors.
We cannot state to what extent the project’s achieved result were influenced or were not influenced by other internal or external factors. There is the possibility that the following factors did also had an impact on the project outcomes on a positive or neutral way:
• The other actors in the project may have continued the dialogue outside the reach of the projectand may have a positive multiplying impact on the project.
106
• Beneficiaries may have received other trainings before or educated themselves via Internet. Inthat way better education or improved job opportunities can not only be attributed to GIZ.
Observed results can therefore not solely be attributed to this project, especially with the high number of donors involved in other TVET projects. As a result, we cannot conclude on its contribution.
19462 - PAREF II (NL-1) - Programme d’Appui à la Reforestation de 9 Districts des Provinces du Nord et Ouest du Rwanda
Reforestation, land protection and capacity building were important components of this project. Challenges were on the one hand shortage of public lands regarding realization of the planned biomass energy plantation area. On the other hand, the project was confronted with a lot of very small sites and long transport distances to reach them. This consumed a lot of time and money during the site identification, preparation and tree planting activities. The project in these situations concentrated on Roadside plantations, which may be less sustainable than more remote plantations, because they are more vulnerable to over-exploitation. In addition, this project had a follow-up project in PAREF-NL 2 and changes in the first project are not the only factors that influenced the results. As a result, we cannot conclude on its contribution.
19815 - PROSKID - Promotion of skills development in partnership with the private sector
Through the beneficiaries’ participation in the business plan competitions, jobs were created and internships were realized via partnership with the private sector. In this way SMEs were strengthened and job opportunities of participants were created. Changes attributed to the project may also have been effected by the TVET strategy of GoR and the great importance that is put on stimulating the private sector, which creates an enabling environment. As a result, we cannot conclude on its contribution. A negative impact on the project was the lack of financial literacy and the lagging business mind-set of some participants (with an agricultural background) which slowed down the funds and pace of the project. Beneficiaries that were already trained or had the right education prior to the project had an advantage on those who did not.
19940/ 25978/ 26928 - Electricity Access Roll-out Program (EARP)
The project contributed to increased electrification in mainly rural areas, contributing to increased agro- processing activities and improved standards of living. Growing number of economic activity was observed in the areas that were connected to electricity. Other factors that may however have influenced the project results are other projects related to infrastructure, stimulating the construction of ware-houses, drying places etc. The use of alternative energy sources, outside the scope of this project, such as carbon or solar energy may also have influenced the food security situation of the targeted population. However, since EARP is the only institution implementing electricity nationwide, we can conclude that project results are the achievement of this project.
23168/23214 - Support for land tenure regularization (LTR) in Rwanda
With the LTR project land ownership, poverty reduction and investments in land were achieved. The programme supports the National Land Policy and National Land Tenure Reform Programme of GoR.
107

Results of the project are achieved in joint venture with GoR, DFID and EKN and other donors.
Alternative pathways for this project are difficult to identify, since there is no other institute that issues land than GoR in close collaboration with the project. What we learned from the in-depth evaluation with focus group discussions is that increased income stimulates farmers to buy or rent more land. Groups of farmers or women also decide to put money together to rent approx. 1 ha of land together for farming practices. So title holders of land rent their ground, leading to even more people impacted when issuing titles. We conclude that no other approach than the large-scale registration effort that has been performed would have allowed for such a high percentage of land registered. However, the income effects of the titling outcomes could also have been achieved as a result of many other activities and independent developments in Rwanda.
23743 - HIMO PDED II consolidation
The anticipated project pathway to use unskilled and poor labor force to construct new and better roads contributed to: easier movement of people and goods, easy access to food. Capacity building and strengthening of semi governments institutions were not reached with the selected pathway. The impact of improved food security for the population via measurements taken by government staff has not yet been proven. Alternative pathways stimulating food security were:
• Productivity and agricultural production on protected and restored soils may not be the same onsoils that lack these features. The soils were reported to be less productive before. Other factorscan influence productivity such as quality seeds, organic and chemical fertilizers, pesticides etc.
• The fact that the HIMO approach has been institutionalized by GoR and is part of theirsustainable development initiatives to fight poverty and permit beneficiaries to participate intheir own development. Other HIMO initiatives of GoR may have influenced the results and cannot only be contributed to this project. As a result, we cannot conclude on its contribution.
24371/25542 - Infrastructure Investments
The Infrastructure Investments project can be seen as a flagship project contributing to enabling infrastructure and economic development. LODA coordinates the implementation of over 600 projects all over the country. An example is the construction of a pineapple collection centre in Ngoma district that allowed the pineapple processing plant to obtain raw materials and increase pineapple juice production. Furthermore, in targeted areas other projects regarding the same topic may be mutually reinforcing. Therefore, there is an increase in pineapple juice production. We saw this in the Muhanga district were terraces were consolidated by LODA in one part of the hills and in other selected hillsides by Welthungerhilfe for the Consolidation of Marshlands projects. This approach seems to stimulate activity and stimulates the local population to also participate in the economic development. However, we cannot state for sure that the achievements in the LODA project or vice versa Welthungerhilfe project can be solely attributed to the one or the other, since they are influencing each other and using similar techniques.
108
24730 - Linking Farmers to Markets
The programme has contributed to capacity building through a skills audit and subsequent trainings for associations. Part of the objectives is to make chamber of farmers (CoF) more self-supporting, based on the collection of membership fees paid by the federation. However, this objective has not been reached. In the main, this project has not been effective.
16806/25059 - Consolidation of Marshlands
The project developed idle swamps into irrigated marshland schemes for mainly rice farming. The overall goals were poverty reduction (through the HIMO approach), reduced malnutrition and self-reliant continuation of development initiatives. Rice became the most preferred crop grown in the marshland because of its productivity, the fact that two harvest per year could be realized and the relative high price that can be received for rice. As the production of rice increased, the need for adding value to the crop was high which resulted in a Public Private Partnership by the Government and the farmers to put up a rice milling factory with the Government contributing 60% and the farmers 40% of the cost. Those are also factors that had a positive impact on the project results. As addressed at the Infrastructure Investments section and in 3.6.1 when discussing the HIMO approach in this project, we cannot conclude for sure that the results of this project can solely be attributed to it and the project implementers. We noticed a strong involvement of the district agronomist in the project to help achieve results and also LODA projects in for example the Muhanga district were using the same techniques of cultivating terraces. In addition, the GoR was strongly in favor of institutionalization of cooperatives and WUO’s which were important pillars of this projects. Also the use of the HIMO approach was strongly supported by the GoR and used in other projects in the area. There seem to be a multiplier effect between projects and the national policy.
25195 / 25812 - PAREF NL-2
Project PAREF 2-NL focuses on participatory forest management, involving the districts and the local population in the decision of where forests should be planted. The project used the HIMO-approach to plant the trees. The planted trees prevented erosion, thereby saving fertile land for agricultural purposes and allowing for higher agricultural production. Other techniques such as constructing terraces also prevent erosion. We can therefore not state for sure that the achieved changes are solely related to this project.
25454 - Cooperatives Support Programme
The project is still in progress and not all the outputs have been achieved yet. It was noted many farmers did not yet have a business mind-set, which demanded from the project implementers to develop a business mind-set first before actually providing business development services. The projects had to tackle financial literacy first, before being able to focus on the actual objectives. Observed results are thus related to other factors that contributed to the achieved results.
109

24871 - Capacity Building for Food Security
The National Capacity Building Secretariat (NCBS) support has led to sustainability of agencies and ministries and the setting up of standards. The project coordination and implementation capacity are well functioning. Other factors influencing the project are however a high number of other organizations and donors working directly with the beneficiaries (farmers). This is why NBCS finds it quite complex to isolate effects of their activities. As a result, we cannot conclude on the project’s contribution.
25457 - Access to Food for Young Children
The project contributes to reduction of stunting rates of children under two, builds capacity of districts and implementing staff and organizes all kinds of activities to provide nutrition information to mothers. The main focus of the project was on mothers and their children. In addition, the Unicef project puts great effort in men involvement to stimulate their role as fathers and positively influence the health and nutrition of their children. We cannot state to what extent changes in this project are solely attributed to this project, since there is a high involvement of the ministry of Health to reduce child malnutrition and children may be reached through other programmes of GoR as well.
3.5.3 Level of food security improvement Up to what level (institutional outcome; hh outcome / proxy impact (food production, income, food prices, buffers), impact (food consumption, nutritional status) has the food security improvement of targeted households been established?
In Section 3.5.1 we provide for each project in the tables ‘overview project level food security’ information about the level and impact the projects had on the targeted households.
Several EKN projects realized job creation, which led to an increase of access to food. A few projects directly targeted improved farming practices via trainings, providing improved seeds, which led to improved food production.
The HIMO and cash for work related projects enabled beneficiaries to have direct access to higher income and more money, but it is not sure if the money was used on food consumption or on investments that improve food security in the long run.
An important observation is that good baseline information on the different projects about the type of beneficiaries, e.g. if they were food insecure (e.g. TVET - 19815) or how they spent their money (e.g. HIMO - 23743) was not collected. This makes it difficult to assess the improvement afterwards.
However, the in-depth assessment of the Consolidation of Marshlands project (25059) shows there is a real impact in terms of increased productivity, which increases both food availability and access to food for the farmers that benefited from the project. This is evident from the table below:
“From the proceeds I got from the sale of my rice and maize I have been able to build a better house for my family” FGD Participant, Consolidation of Marshlands project
110

Situation at the beginning of ESIRU
Situation at the beginning of the consolidation phase (end 2012)
Situation at the end of the project (End 2014)
Most of beneficiaries have an annual income of less than 10 euro.
4t/ha/season on average: 8t/ha/year 5.5t/ha/season on average: 11t/ha/year
700 ha x 8,000 kg x 300 RWF = 1,680,000,000 RWF/year (2.2 Mio €) gross-return;
700 ha x 11,000 kg x 300 RWF =2,310,000,000 RWF/year (3.9 Mio €) gross-return;
1 household on 1/10 ha plot has presently: 240,000 RWF/ year; or € 315
1 household: 330,000 RWF/year; or € 412
Table 3-34: Consolidation of Marshlands results based on the Welthungerhilfe survey (2015)
3.5.4 Evidence that food insecure people have been reached What is the evidence that food insecure people have been reached, directly or indirectly? How have women (female headed households, women in the households) benefited?
In Section 3.5.1 we describe for each project to what extent food insecure people have been reached. Most of the EKN projects did impact the food security situation of beneficiaries directly. The selected projects took place in rural areas where the number of poor people is relatively high. Also the most important source of income of the people is farming. For example, the PAREF NL-1 and PAREF NL-2 projects did have a direct link to prevent erosion, farmers benefitted from better grounds which stimulated their food production. Furthermore, the HIMO approach was widespread in several EKN project. This approach indirectly increased the access to food by the income generating activities of households in rural areas, enabling them to buy more food. In addition, through the roads, for the population in the targeted areas as a whole, it is now possible to easily transport food and enable better post-harvest handling via warehouses etc. In this way a large part of the population, even if they did not participate in the project, indirectly benefitted from it.
On 7, 8 and 9 March 2016 the in-depth evaluation took place in Muhanga district (Southern province) for the following projects:
• District Infrastructure Investments through Rwanda Local Development Support Fund (RLDSF)24371 / Local Demand Driven Investments projects through RLDSF 25542 (Infrastructure projects),
• Consolidation of Marshland Development’ project (25059) and
• Access to food for young children project (25457).
For those three projects a field visit took place. We conducted focus group discussions with the two projects Consolidation of Marshlands and Access to food for young children. In Annex XII the final report of the focus group discussions (including CATALIST-2) is presented in detail.
111
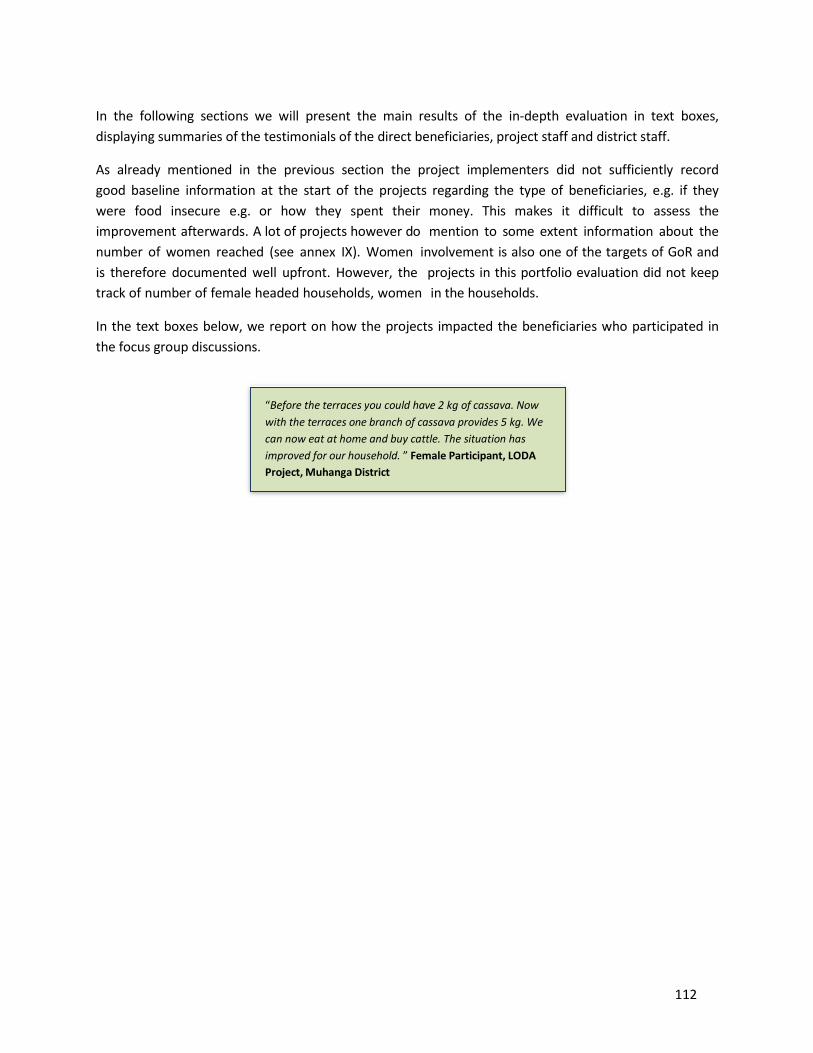
In the following sections we will present the main results of the in-depth evaluation in text boxes, displaying summaries of the testimonials of the direct beneficiaries, project staff and district staff.
As already mentioned in the previous section the project implementers did not sufficiently record good baseline information at the start of the projects regarding the type of beneficiaries, e.g. if they were food insecure e.g. or how they spent their money. This makes it difficult to assess the improvement afterwards. A lot of projects however do mention to some extent information about the number of women reached (see annex IX). Women involvement is also one of the targets of GoR and is therefore documented well upfront. However, the projects in this portfolio evaluation did not keep track of number of female headed households, women in the households.
In the text boxes below, we report on how the projects impacted the beneficiaries who participated in the focus group discussions.
“Before the terraces you could have 2 kg of cassava. Nowwith the terraces one branch of cassava provides 5 kg. Wecan now eat at home and buy cattle. The situation has improved for our household. ” Female Participant, LODAProject, Muhanga District
112
Targeting the food insecure: Infrastructure Investments (24371 /25542)
LODA was created in 2002 and is a body of the GoR. It works as an intermediate between the central government and the local government. The focus of the projects lays in decentralization which plays a key role to hear more about the needs locally. With this approach LODA wants to promote economic and social development. A key role of LODA is planning & budgeting. LODA develops tools, puts guidelines in places, monitors & evaluates the development of local government. In addition, it carries out feasibility studies and offers information on project progress and impact.
There is an engineer in charge in each district in Rwanda of monitoring the projects. The engineer is also in charge of following up the funds disbursement and the progress of the projects. Procurement is also performed at district level even though the procedure is reviewed by LODA before disbursing the funds. There is also a financial compliance team, economists and sociologists involved in the projects. In addition, LODA also organizes field visits in order to verify the information. There is a control mechanism for each project and reporting is made every three months towards LODA. Field visits are generally organized twice a year with donors. LODA also takes part in technical working groups with donors.
LODA implements over 600 projects in 30 districts, using the decentralized approach. Effectiveness of the project is summed up below:
• Districts invested in income generating projects which created job opportunities and increased districtsrevenues. 87.000 (temporary) jobs were created in the first phase of the project.
• LODA sensitizes population on the culture of making savings and working with banks and micro-financeinstitutions through Financial Services. A total of 2.416 individuals were trained in the several districts tothen continue to train others within their community. Financial Services were operational in 150 sectorsacross Rwanda. A total of 12.703 individuals received a loan. In addition, in 180 sectors direct supporthad been given to the poorest and most vulnerable households in total 43.671 (99.817 members).
• With the projects LODA managed the creation of public markets (37), guest houses (6), slaughter houses(6), factories (2), storages/warehouses (11), public / tax parking or bus stations (2).
• Direct agriculture interventions were projects in reclaiming of marshlands, progressive and radicalterracing, and construction of dams. The district also implemented land consolidation and selectedseeds policy to increase the agriculture production. Those projects can be seen as direct interventions toimprove the food security. A total of 1.961,10 hectare was realized, next to 4.750,54 progressive terracesand 2.888,95 radial terraces. A total of 4.658 households was earning newly treated terraces. In addition,1 dam was constructed. Also the fact to improve transportation infrastructure and agricultureinfrastructure was mentioned as an important intervention by LODA to give farmers access to marketsand help them increase income and indirectly improve their food security.
• Farmers reported that they learned how to vary crops and received better seeds. Many households havekitchen gardens now. They also learned new food processing practices, such as making cassava juice,which they did not know before.
113
Targeting the food insecure: Consolidation of Marshland Development (25059)
In the period before the project by Welthungerhilfe, the communities around Muhanga district used to grow potatoes and different crops including beans, soya and local maize varieties as their main crops. Welthungerhilfe has promoted the production of rice in the area because of the valleys and marshlands that make the land conducive to rice farming. There is currently over 600 hectares of land under rice cultivation. The project provided numerous trainings on rice farming and worked with the farmers to consolidate the marshlands. In addition, six water user organizations and 12 farmer cooperatives have been established, and more jobs have been created. Furthermore, the district and farmers were growing more agro-forest trees through the initiative. Growing trees is meant to protect soil from erosion and protect crops that are being grown. Over 1,000 hectares of land have been protected. Farmers believe to have ownership of the project and will continue to farm after Welthungerhilfe has left the project area. The farmers who participated in the FGD at KIABR Cooperative Office near Rugeramigozi Water Dam in Muhanga District noted that the effectiveness of the Consolidation of Marshlands project could be summed up in the following ways:
• Improvement in food security in the area. For example, it was reported that farm production increased onaverage 4-5 tons for rice per ha per season and 4.2 tons per ha per season for maize. According to theagronomist, Welthungerhilfe had achieved its goal of increasing production among the farmers by 100%. Itwas reported that the project has improved subsistence farming but also allowed more farming for sale.Generally, 80% of their produce was taken to the cooperative for sale and the financial proceeds banked intheir respective bank accounts. The remaining 20% was taken home for own consumption.
• Training. The farmers involved in the marshlands project have been taught better ways of farming inmarshlands, how to conserve water in the marshlands and on the adjacent hill-sides to control soilerosion as well as use of modern farming practices such as using fertilizers, pesticides and improved seeds.
• Improvement in income. As a result of the improvement in farming of rice, maize and beans, thefarmers have increased farm yields and consequently have increased their incomes, which meant they couldafford other foods that they did not produce, such as vegetables and meat. The farmers expressed satisfactionwith the fact that the improvement in income, which is attributable to this project, has allowed them tobe able to acquire other assets as well, such as building permanent houses, buying animals or bicyclesand motor cycles. Consequently, the project has had a positive impact on the livelihood.
114
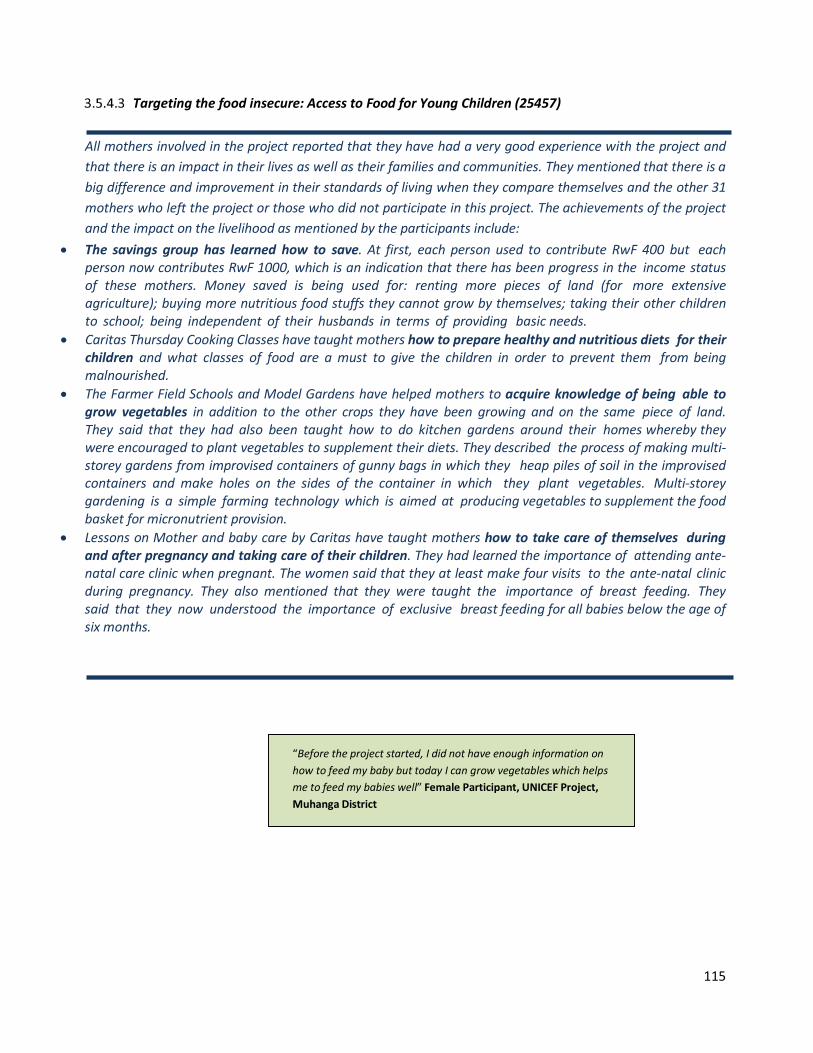
Targeting the food insecure: Access to Food for Young Children (25457)
All mothers involved in the project reported that they have had a very good experience with the project and that there is an impact in their lives as well as their families and communities. They mentioned that there is a big difference and improvement in their standards of living when they compare themselves and the other 31 mothers who left the project or those who did not participate in this project. The achievements of the project and the impact on the livelihood as mentioned by the participants include:
• The savings group has learned how to save. At first, each person used to contribute RwF 400 but eachperson now contributes RwF 1000, which is an indication that there has been progress in the income statusof these mothers. Money saved is being used for: renting more pieces of land (for more extensiveagriculture); buying more nutritious food stuffs they cannot grow by themselves; taking their other childrento school; being independent of their husbands in terms of providing basic needs.
• Caritas Thursday Cooking Classes have taught mothers how to prepare healthy and nutritious diets for theirchildren and what classes of food are a must to give the children in order to prevent them from beingmalnourished.
• The Farmer Field Schools and Model Gardens have helped mothers to acquire knowledge of being able togrow vegetables in addition to the other crops they have been growing and on the same piece of land.They said that they had also been taught how to do kitchen gardens around their homes whereby theywere encouraged to plant vegetables to supplement their diets. They described the process of making multi-storey gardens from improvised containers of gunny bags in which they heap piles of soil in the improvisedcontainers and make holes on the sides of the container in which they plant vegetables. Multi-storeygardening is a simple farming technology which is aimed at producing vegetables to supplement the foodbasket for micronutrient provision.
• Lessons on Mother and baby care by Caritas have taught mothers how to take care of themselves duringand after pregnancy and taking care of their children. They had learned the importance of attending ante-natal care clinic when pregnant. The women said that they at least make four visits to the ante-natal clinicduring pregnancy. They also mentioned that they were taught the importance of breast feeding. Theysaid that they now understood the importance of exclusive breast feeding for all babies below the age ofsix months.
“Before the project started, I did not have enough information on how to feed my baby but today I can grow vegetables which helps me to feed my babies well” Female Participant, UNICEF Project,Muhanga District
115
How have women (female-headed households, women in the households) benefited?
As demonstrated in Chapter 2, women belong to the group most likely to be food insecure. Therefore, the government of Rwanda has set targets for the involvement of women, for example declaring that at least 30% of the HIMO workers should be women. In all of the food security programmes women are likely to benefit in some way, either through increased income for the entire household, improved infrastructure, or female jobs creation, etc. However, several programmes have specifically focused on improving the livelihood of women.
Skills Development and Employment Protection, PAREF NL-1 and NL-2, PROSKID, Support for Land Tenure, HIMO, Consolidation of Marshlands and Access to Food for Young Children all target women specifically. For Skills Development and Employment Protection the target of training 3,000 people of which 25% women has largely been met. In total, 4,815 women were trained as a result of the vocational training and labour market component (48% of total). The project has made a contribution to improving the qualifications of young women and men in Rwanda, who therefore have better access to more productive employment and a more secure income.
PAREF NL-1 and PAREF NL-2 target vulnerable households and women, mainly by generating employment through HIMO projects. In total, 48% of HIMO workers in PAREF NL-1 were women. In addition, three women received training in charcoal making (of the 90 charcoal makers), which represents a far lower percentage, possibly associated with the type of work. Although PAREF NL-2 is still in progress, the reported number of employed people is 20,762, of which 9,681 women and 11,081 men.
Similar to Skills Development and Employment Protection, PROSKID also ensured the training of women and mentioned a special interest in ‘women jobs’ in the project description. However, there is no evidence of targeting the food insecure and the amount of women reached.
Support for Land Tenure Regularisation specifically addresses women with poor access to the land administration system. Land Tenure Regularisation also mentions the indirect effect of promoting gender equality through registration systematically done using the names of both husband and wife. Yet, there is no information available on the number of women reached.
HIMO PDED II started with a clear objective of reaching at least 50% in Cash for Work and implemented a gender plan. The end line reported this indicator was met as 54% of women worked on the construction works and 60% to 70% were employed in tree nurseries and horticulture. Women earnings are deemed to directly benefit the family. The programme also trained female-owned SMEs and 100 women in women networks. Furthermore, 86 female entrepreneurs managed to initiate income generating activities.
Consolidation of the Marshlands aimed to strengthen the influence of women within cooperatives and water user associations. At the time of the end line 2,638 (42,2%) women had a leading position within a cooperative. In all Water User Associations 42% of leaders are women by end 2014 (target 42% met): 2,439 were reached by the programme. It is not known how many of them had a leading position. The WHH gender specialist involved in the programme made sure that women were employed, that they were getting paid on their own bank accounts (SACCO Bank) and that women were empowered by receiving financial literacy. However, the exact number of women having access to SACCO via this project is unknown.
116
Lastly, Access to Food for Young Children specifically targeted 160,000 pregnant/lactating women in 10 districts. In total, 9,930 households were reached (the exact amount of women is unclear). Food accessibility was addressed by learning women agricultural skills that make them more self-sufficient and less dependent on their husbands. Moreover, communities were sensitized to join saving and lending groups. The project also taught women about the nutritious value of food and the importance of antenatal care (visiting a clinic at least four times before giving birth).
The other programmes, Electricity Access Roll-out Programme (EARP), Capacity Building for Food Security, Linking Farmers to Markets, and Cooperatives Support do not target women directly. Additionally, the indirect effects are not easily measured. For example, households in general may benefit from improved infrastructure, but the benefit of strengthening local authorities or cooperatives on women is not clear.
3.6 Costs and efficiency programme (evaluation question 4)
3.6.1 Direct and indirect beneficiaries How many direct and indirect beneficiaries have been reached?
Specifying the direct and indirect number of beneficiaries in this evaluation has been a challenge since the majority of projects does not give clear insights in direct and indirect beneficiaries reached.
With the available information received from project implementers we tried to give an estimation of the beneficiaries, which is demonstrated in Table 3-35. The challenge was to define the number of direct beneficiaries reached for the evaluation period 2012-2015, since most of the projects tend to present the number of direct beneficiaries reached for the whole project duration or are not yet finalized.
117
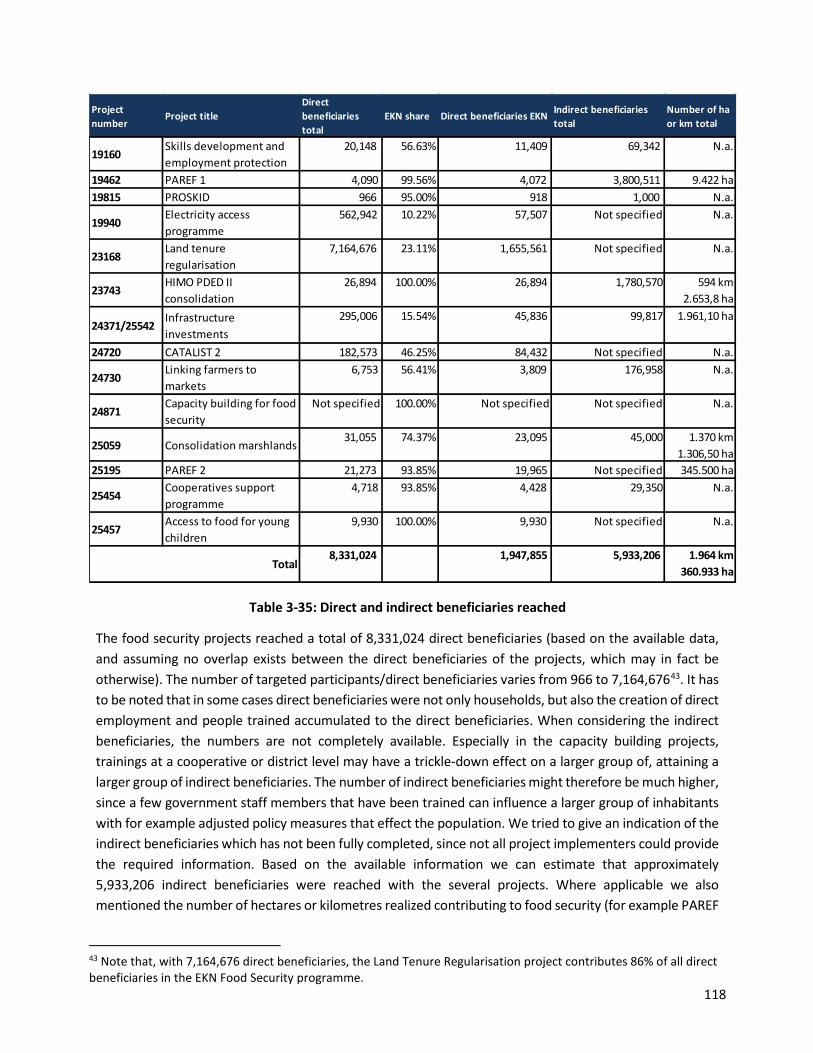
Table 3-35: Direct and indirect beneficiaries reached
The food security projects reached a total of 8,331,024 direct beneficiaries (based on the available data, and assuming no overlap exists between the direct beneficiaries of the projects, which may in fact be otherwise). The number of targeted participants/direct beneficiaries varies from 966 to 7,164,67643. It has to be noted that in some cases direct beneficiaries were not only households, but also the creation of direct employment and people trained accumulated to the direct beneficiaries. When considering the indirect beneficiaries, the numbers are not completely available. Especially in the capacity building projects, trainings at a cooperative or district level may have a trickle-down effect on a larger group of, attaining a larger group of indirect beneficiaries. The number of indirect beneficiaries might therefore be much higher, since a few government staff members that have been trained can influence a larger group of inhabitants with for example adjusted policy measures that effect the population. We tried to give an indication of the indirect beneficiaries which has not been fully completed, since not all project implementers could provide the required information. Based on the available information we can estimate that approximately 5,933,206 indirect beneficiaries were reached with the several projects. Where applicable we also mentioned the number of hectares or kilometres realized contributing to food security (for example PAREF
43 Note that, with 7,164,676 direct beneficiaries, the Land Tenure Regularisation project contributes 86% of all direct beneficiaries in the EKN Food Security programme.
Project number
Project titleDirect beneficiaries total
EKN share Direct beneficiaries EKN Indirect beneficiaries total
Number of ha or km total
19160Skills development and employment protection
20,148 56.63% 11,409 69,342 N.a.
19462 PAREF 1 4,090 99.56% 4,072 3,800,511 9.422 ha 19815 PROSKID 966 95.00% 918 1,000 N.a.
19940Electricity access programme
562,942 10.22% 57,507 Not specified N.a.
23168Land tenure regularisation
7,164,676 23.11% 1,655,561 Not specified N.a.
23743HIMO PDED II consolidation
26,894 100.00% 26,894 1,780,570 594 km2.653,8 ha
24371/25542Infrastructure investments
295,006 15.54% 45,836 99,817 1.961,10 ha
24720 CATALIST 2 182,573 46.25% 84,432 Not specified N.a.
24730Linking farmers to markets
6,753 56.41% 3,809 176,958 N.a.
24871Capacity building for food security
Not specified 100.00% Not specified Not specified N.a.
25059 Consolidation marshlands 31,055 74.37% 23,095 45,000 1.370 km
1.306,50 ha 25195 PAREF 2 21,273 93.85% 19,965 Not specified 345.500 ha
25454Cooperatives support programme
4,718 93.85% 4,428 29,350 N.a.
25457Access to food for young children
9,930 100.00% 9,930 Not specified N.a.
8,331,024 1,947,855 5,933,206 1.964 km360.933 ha Total
118
and HIMO projects).
As stated previously, several projects did not consider food security as a main objective. Most project implementers did not conduct a baseline measurement of outcome criteria at the start of their projects, nor did they report about the food insecure in reports to EKN. As a consequence, information on whether or not beneficiaries were food insecure was not always monitored. Based on the end line interviews we find that most of the projects took place in rural areas of Rwanda where people face at least the threat of food insecurity, as was explained in chapter 2. As a result, it can be assumed that without it being the main focus, a considerable number of food insecure people were reached by the programme. The actual number of food insecure people cannot be defined, since project implementers did not register how many beneficiaries were actually food insecure. In annex VI we presented tables of the linkage of the project with food security, which also gives an indication of the target group of the EKN projects. Based on annex IV and our analysis in section 3.5 we distinguish the following projects targeting directly the food insecure and having the food insecure as direct beneficiaries:
19462 – PAREF NL-1
23743 – HIMO PDED II consolidation
24371/25542 – Infrastructure investments
25059 – Consolidation of marshlands
25195 – PAREF NL-2
25457 – Access to food for young children.
Together those projects reached at least 220,382 food insecure direct beneficiaries.
For other projects like the 23168/23214 – Land tenure regularisation, 24730 – Linking farmers to markets project, 25454 – Cooperatives support programme and 24720 – CATALIST-2 there was an explicit link to food security, however the target group was not always per definition food insecure. Participating farmers in the CATALIST-2 programme were for example supposed to own a minimum number hectare to participate in the project. Several food insecure direct beneficiaries do not own their own land (they rent land) or have a very small part of it not, producing enough for their own consumption and for selling.
The last type of projects, with an implicit food security objective, in most cases included the food insecure as direct beneficiaries. This regarded the policy makers in the 24871 – Capacity building for food security. As shown in our table above, the number of direct beneficiaries could not be specified.
To conclude we can state that the food insecure people were more or less proportionally targeted in the EKN programme as a whole, but substantial differences have been identified at project level.
In sections 3.6.2 and 3.6.3 we will elaborate that since EKN is in several projects not the only donor, we cannot completely attribute all project beneficiaries to the EKN grant. This is why we calculated the EKN share per project, which will be explained in 3.6.2 and has already been included in the table above. The EKN share helps to define the proportion to which direct beneficiaries have been reached with EKN funding. In the table above we see that in total 1,947,855 people can be considered as direct EKN beneficiaries (if
119
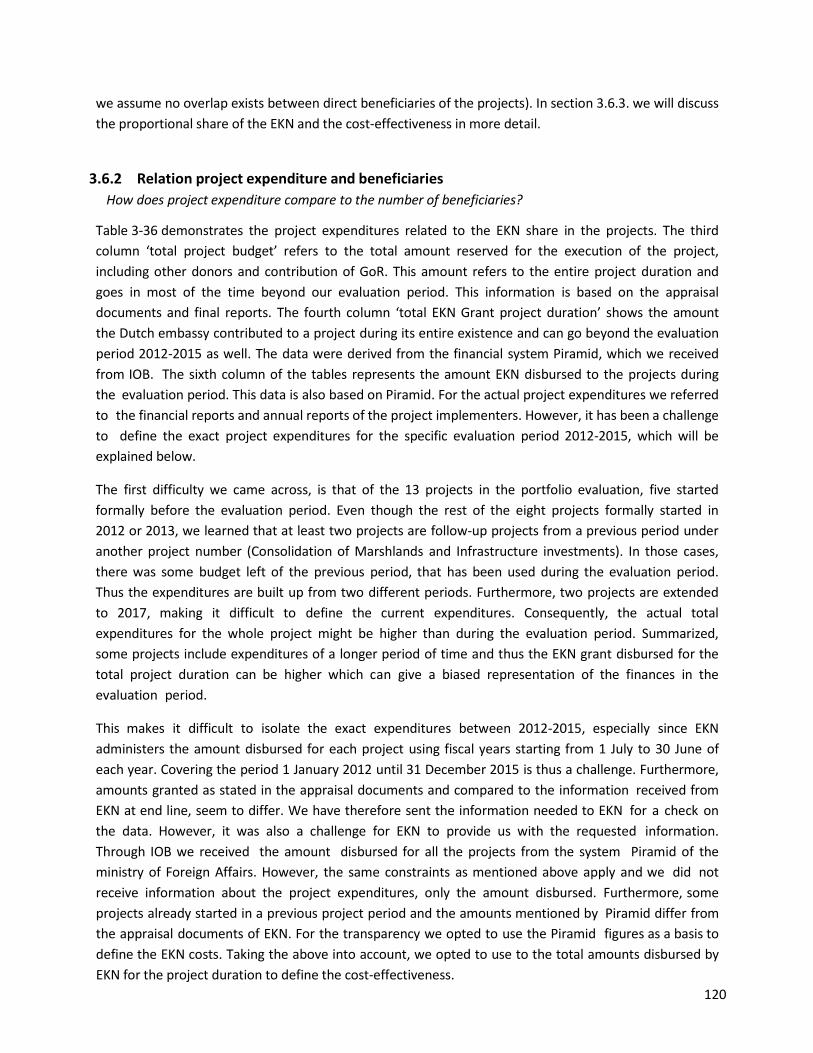
we assume no overlap exists between direct beneficiaries of the projects). In section 3.6.3. we will discuss the proportional share of the EKN and the cost-effectiveness in more detail.
3.6.2 Relation project expenditure and beneficiaries How does project expenditure compare to the number of beneficiaries?
Table 3-36 demonstrates the project expenditures related to the EKN share in the projects. The third column ‘total project budget’ refers to the total amount reserved for the execution of the project, including other donors and contribution of GoR. This amount refers to the entire project duration and goes in most of the time beyond our evaluation period. This information is based on the appraisal documents and final reports. The fourth column ‘total EKN Grant project duration’ shows the amount the Dutch embassy contributed to a project during its entire existence and can go beyond the evaluation period 2012-2015 as well. The data were derived from the financial system Piramid, which we received from IOB. The sixth column of the tables represents the amount EKN disbursed to the projects during the evaluation period. This data is also based on Piramid. For the actual project expenditures we referred to the financial reports and annual reports of the project implementers. However, it has been a challenge to define the exact project expenditures for the specific evaluation period 2012-2015, which will be explained below.
The first difficulty we came across, is that of the 13 projects in the portfolio evaluation, five started formally before the evaluation period. Even though the rest of the eight projects formally started in 2012 or 2013, we learned that at least two projects are follow-up projects from a previous period under another project number (Consolidation of Marshlands and Infrastructure investments). In those cases, there was some budget left of the previous period, that has been used during the evaluation period. Thus the expenditures are built up from two different periods. Furthermore, two projects are extended to 2017, making it difficult to define the current expenditures. Consequently, the actual total expenditures for the whole project might be higher than during the evaluation period. Summarized, some projects include expenditures of a longer period of time and thus the EKN grant disbursed for the total project duration can be higher which can give a biased representation of the finances in the evaluation period.
This makes it difficult to isolate the exact expenditures between 2012-2015, especially since EKN administers the amount disbursed for each project using fiscal years starting from 1 July to 30 June of each year. Covering the period 1 January 2012 until 31 December 2015 is thus a challenge. Furthermore, amounts granted as stated in the appraisal documents and compared to the information received from EKN at end line, seem to differ. We have therefore sent the information needed to EKN for a check on the data. However, it was also a challenge for EKN to provide us with the requested information. Through IOB we received the amount disbursed for all the projects from the system Piramid of the ministry of Foreign Affairs. However, the same constraints as mentioned above apply and we did not receive information about the project expenditures, only the amount disbursed. Furthermore, some projects already started in a previous project period and the amounts mentioned by Piramid differ from the appraisal documents of EKN. For the transparency we opted to use the Piramid figures as a basis to define the EKN costs. Taking the above into account, we opted to use to the total amounts disbursed by EKN for the project duration to define the cost-effectiveness.
120

When trying to define the direct and indirect beneficiaries, we have taken into account that project implementers keep track of the outputs for the entire project period. Thus the beneficiaries reached cover the entire project duration of many years, not only the evaluation period and are related to all the funds received by the project implementers. That is why we included the total project contribution of EKN besides the EKN grant for the period 2012-2015 in our table. In the cost-effectiveness calculation we worked with the total number of beneficiaries as reported to us, since it was not feasible to single them out for our exact evaluation period.
121

Project number Project name Total project
budget
Total EKN Grant project duration (IOB Piramide)
EKN Grant disbursed 2012-2015 (according to IOB Piramide)
Project Expenditures evaluation period 2012-2015 (final reports, EKN info)
Left on budget (total)
EKN share % Other project donors
19160
TVET - Skills Development and Employment Protection
€ 7,931,000.00 € 4,491,044.00 € 1,506,044.00 € 1,111,604.00 € 394,440.00 56.63% Implementing organisation (GIZ) and partners
19462
PAREF II (NL-1) -Programme d’Appui à la Reforestation de 9 Districts des Provinces du Nord et Ouest du Rwanda
€ 9,900,000.00 € 9,856,242.00 € 1,826,814.00 unknown unknown 99.56% Government of Rwanda (RNRA/DFNC)
19815
PROSKID - Promotion of skills development in partnership with the private sector
€ 4,200,000.00 € 3,990,000.00 € 1,950,000.00 € 3,981,619.00 € 8,381.00 95.00% Rwandan Development Bank, Private Sector Federation
19940/25978/ 26928
Electricity Access Roll-out Programme (EARP) € 381,163,525.67 € 38,937,329.00 € 11,937,329.00 unknown unknown 10.22%
Arab Bank for Economic Development in Africa (BADEA), OPEC Fund for International Development (OFID), Saudi Fund, World Bank IDA, Agence Française Développement (AFD), Government of Rwanda
23168/23214 Support for land tenure regularisation (LTR) in Rwanda
€ 65,883,126.81 € 15,223,792.00 € 7,226,510.00 unknown unknown 23.11%
Department for International Development (DFID - UK), Sweden, EU and Government of Rwanda
23743 HIMO PDED II consolidation € 9,946,759.00 € 9,946,759.00 € 9,946,759.00 € 9,164,253.05 € 782,505.95 100.00%
(Direct money transfers to districts from former CDF, EU, USAID, World Bank )
24720 CATALIST 2 € 26,190,348.00 € 12,111,851.90 € 11,521,837.00 € 24,250,579.55 € 1,941,295.00 46.25%
Swiss Agency for Development and Cooperation (but NL main funding source)
122

Project number Project name Total project
budget
Total EKN Grant project duration (IOB Piramide)
EKN Grant disbursed 2012-2015 (according to IOB Piramide)
Project Expenditures evaluation period 2012-2015 (final reports, EKN info)
Left on budget (total)
EKN share % Other project donors
24371/25542
District Infrastructure Investments through Rwanda Local Development Support Fund (RLDSF)/ Local Demand Driven Investments projects through RLDSF
€ 36,547,099.57 € 5,678,400.00 € 5,678,400.00 € 29,302,371.00 € 0.00 15.54%
Government of Rwanda, World Bank, Swedish International Development Agency (SIDA), DFID (UK), KfW Development Bank, African Development Bank(PNEAR), CTB/PADSEC
24730 Linking Farmers to Markets € 9,219,600.00 € 5,200,800.00 € 2,672,977.00 € 2,672,977.00 € 0.00 56.41% Not applicable
24871 Capacity Building for Food Security in Rwanda
€ 5,300,705.00 € 5,300,705.00 € 3,175,637.00 € 3,175,637.00 € 0.00 100.00% Not applicable
16806/25059 Consolidation Marshlands WHH € 15,815,719.00 € 11,761,707.00 € 1,436,079.00 € 1,500,000.00 € -63,921.00 74.37%
Welthungerhilfe, Canadian International Development Agency (CIDA)
25195 /25812
PAREF NL-2 - Support to participatory forest management pilots and biomass energy production in 9 districts of Rwanda
€ 6,000,000.00 € 5,630,996.00 unknown ongoing, project in progress in progress 93.85% Belgian Technical
Cooperation (BTC)
25454 Cooperatives Support Programme € 2,166,843.00 € 2,166,843.00 € 1,758,474.00 € 1,758,474.00 in progress 100.00% Not applicable
25457 Access to Food for Young Children € 14,179,706.00 € 11,969,958.00 € 8,939,126.00 € 8,939,126.00 in progress 84.42% Unicef
Table 3-36: Project expenditures related to the project share EKN food security
123

When comparing the project expenditures to the number of beneficiaries, it needs to be taken into account that EKN is not the only donor in many projects. That means that we cannot simply calculate the EKN expenses and divide it by the number of beneficiaries, since the beneficiaries are ‘shared’. We have included the column ‘EKN share’, which demonstrates the share EKN has in the project. We calculated this share based on the EKN grant divided by the total project budget.
EKN seems to be the main donor in 7 of the 14 projects: in three projects EKN contributes for 100% to the project and in another four projects the EKN share is more than 80% of the total project budget. In three projects the embassy has a share of less than 25%.
Despite the above mentioned limitations we tried to define the costs per beneficiary in Table 3-37. The numbers presented in Table 3-37 should be interpreted with care, since we did not always receive accurate data and had to retrieve data from the latest reports available, also for projects not yet completed. As proxy for cost efficiency, we used the EKN grant amount disbursed divided by:
• the total number of direct project beneficiaries;• the number of direct project beneficiaries, adjusted for EKN’s share in the project budget44; and• the number of hectares covered by the project, where relevant (i.e., in four projects).
The table shows that the Land Tenure Regularisation project has the lowest costs per beneficiary, with € 2.12 per beneficiary in total and specifically for the EKN share € 9.20. The three projects with the highest costs per EKN direct beneficiary are: (1) PROSKID with € 4,347.83, (2) PAREF NL-1 with € 2.420,54 and (3) Linking Farmers to Markets with € 1,365.26.
The expenditures for the EKN direct beneficiaries being 1,947,855 people are on average € 85.17 (again assuming that direct beneficiaries do not overlap between projects). If we interpret the EKN’s contribution as leveraging other financing, and therefore divide the EKN funding by all 8,331,024 beneficiaries, EKN funded € 19.91 per beneficiary reached. When zooming into the costs per hectare we find that for the four projects in which costs per hectare are applicable, average costs per hectare were € 459.74.
44 It should be noted that The division of EKN Cost/EKN direct beneficiaries yields the same result as Total project costs/Total direct beneficiaries, as both EKN Cost and EKN direct beneficiaries are calculated by taking the total and multiplying by the EKN share in the budget (fifth column from the left in the table).
124
* The division of EKN Cost/EKN direct beneficiaries yields the same result as Total project costs/Total direct beneficiaries, as both EKN Cost and EKN direct beneficiaries are calculated by taking the total and multiplying by the EKN share in the budget (fifth
Project name Total EKN Grant project duration (IOB Piramide)
EKN share in project
budget (%)
Category of beneficiaries
Direct beneficiaries
total
Direct beneficiaries
EKN
Project area (ha)
EKN Cost/ total direct
beneficiaries
EKN Cost/ EKN direct
beneficiaries*
EKN Cost/ total ha
Support for land tenure regularisation (LTR) in Rwanda
€ 15,223,792.00 23.11% Rightful landholders
in 30 districts 7,164,676 1,655,561 N.a. € 2.12 € 9.20 N.a.
District Infrastructure Investments through Rwanda Local Development Support Fund (RLDSF)/ Local Demand Driven Investments projects through RLDSF**
€ 29,302,371.00 15.54% Individuals, vulnerable households
295,006 45,836 1,961.10 € 99.33 € 639.29 € 14,941.80
Electricity Access Roll-out Programme (EARP)
€ 38,937,329.00 10.22% Households, public
institutions 562,942 57,507 N.a. € 69.17 € 677.09 N.a.
PAREF NL-2 - Support to participatory forest management pilots and biomass energy production in 9 districts of Rwanda
€ 5,630,996.00 93.85% Individuals in poor
districts, cooperative committee members
21,273 19,965 345,500 € 264.70 € 282.05 Unknown
PAREF II (NL-1) - Programme d’Appui à la Reforestation de 9 Districts des Provinces du Nord et Ouest du Rwanda
€ 9,856,242.00 99.56%
Central and decentralised
government, actors of fuelwood
industry, charcoal producers
4,090 4,072 9,422 € 2,409.84 € 2,420.54 € 1,046.09
CATALIST 2 € 12,111,851.90 46.25% Smallholder farmers 182,573 84,432 N.a. € 66.34 € 143.45 N.a.
HIMO PDED II consolidation
€ 9,946,759.00 100.00%
Population of five districts, civil
society/technical cooperatives
26,894 26,894 2643.80 € 369.85 € 369.85 € 3,762.30
Consolidation Marshlands WHH
€ 11,761,707.00 74.37%
Members of 12 cooperatives, 6
water user organisations, users of planted terraces,
households, local government authorities
31,055 23,095 1306.50 € 378.74 € 509.28 € 9,002.45
TVET - Skills Development and Employment Protection
€ 4,491,044.00 56.63% Entrepreneurs, job-
seekers 20,148 11,409 N.a. € 222.90 € 393.64 N.a.
PROSKID - Promotion of skills development in partnership with the private sector
€ 3,990,000.00 95.00%
BPC winning companies in TVET
sector, interns, TVET schools,
966 918 N.a. € 4,130.43 € 4,347.83 N.a.
Linking Farmers to Markets
€ 5,200,800.00 56.41% Members of the 16
associations 6,753 3,809 N.a. € 770.15 € 1,365.26 N.a.
Capacity Building for Food Security in Rwanda
€ 5,300,705.00 100.00% Government
agencies, ministries Not specified
Not specified
N.a. Unknown Not specified N.a.
Cooperatives Support Programme
€ 2,166,843.00 93.85% Agribusiness
cooperatives and service providers
4,718 4,428 N.a. € 459.27 € 489.37 N.a.
Access to Food for Young Children
€ 11,969,978.00 100.00% Pregnant/lactating women and under-
two children 9,930 9,930 N.a. € 1,205.44 € 1,205.44 N.a.
Total € 165,890,417.90 8,331,024 1,947,855 360,833 Average 68.91% € 19.91 € 85.17 € 459.74
125

column from the left in the table. ** For the LODA project we used the total project contribution of EKN as mentioned in the BEMO and final report, as opposed to Piramid. *** Formally speaking, the CATALIST-2 programme is not part of the EKN Food Security programme for Rwanda, as it is implemented in multiple countries in the Great Lakes region. In practice, the programme contributes to the objectives set for both output 1 and output 2 of the EKN country programme.
Table 3-37: Project expenditures related to direct beneficiaries
Finally, an analysis can be conducted comparing the average costs per beneficiary for the projects that contribute to each of the three Embassy outputs. If we calculate these averages, we find that the cost per direct beneficiary for the Access to Food for Young Children project (the only project under EKN output 3) are much higher than the average costs per direct beneficiary for projects that contribute to EKN outputs 1 and 2 (see table below).
Output 1 Output 1 without LTR project
Output 2 Output 3 (AFYC project)
EKN cost/EKN direct beneficiaries (= total cost/total direct beneficiaries)
€ 69.25 € 449.00 € 454.45 € 1,205.44
EKN cost/total direct beneficiaries € 16.02 € 104.59 € 267.46 € 1,205.44
Table 3-38: Costs per beneficiary by output
When assessing these numbers, it should be taken into account that for the projects contributing to EKN output 1, the Land Tenure Regularisation (LTR) project very strongly influences the average, due to its extremely large number of direct beneficiaries. If we take the LTR project out of the calculation, it becomes clear that in terms of average cost per beneficiary, the projects contributing to EKN outputs 1 and 2 become much more comparable, especially when the results for the calculation of EKN Cost/total direct beneficiaries are compared to those for EKN Cost/EKN direct beneficiaries.
In both approaches however, the cost per beneficiary for the Access to Food for Young Children (AFYC) project remains the same, as the project is entirely funded by EKN. Depending on the method of comparison, the project has ~2.7 to 75.2 times higher cost per beneficiary than projects contributing to EKN outputs 1 and 2, on average. These costs could be justified, if the benefits delivered by the project are equally high compared to the other projects in the EKN portfolio. We will explore this in the following section.
3.6.3 Value of effects per beneficiary and cost-effectiveness What can be concluded on the value of effects per beneficiary, and about their cost-effectiveness?
As mentioned in Section 3.6.2, not all the factors required to calculate the cost-effectiveness are completely available for the evaluation period. The value of effects per beneficiary can only be calculated correctly when all these effects can be precisely estimated and valued. Without these estimates we would need to make strong assumptions on benefits. Instead we use the number of beneficiaries as a very rough estimate of effectiveness and (equally crudely) assume that the effect value per beneficiary
126
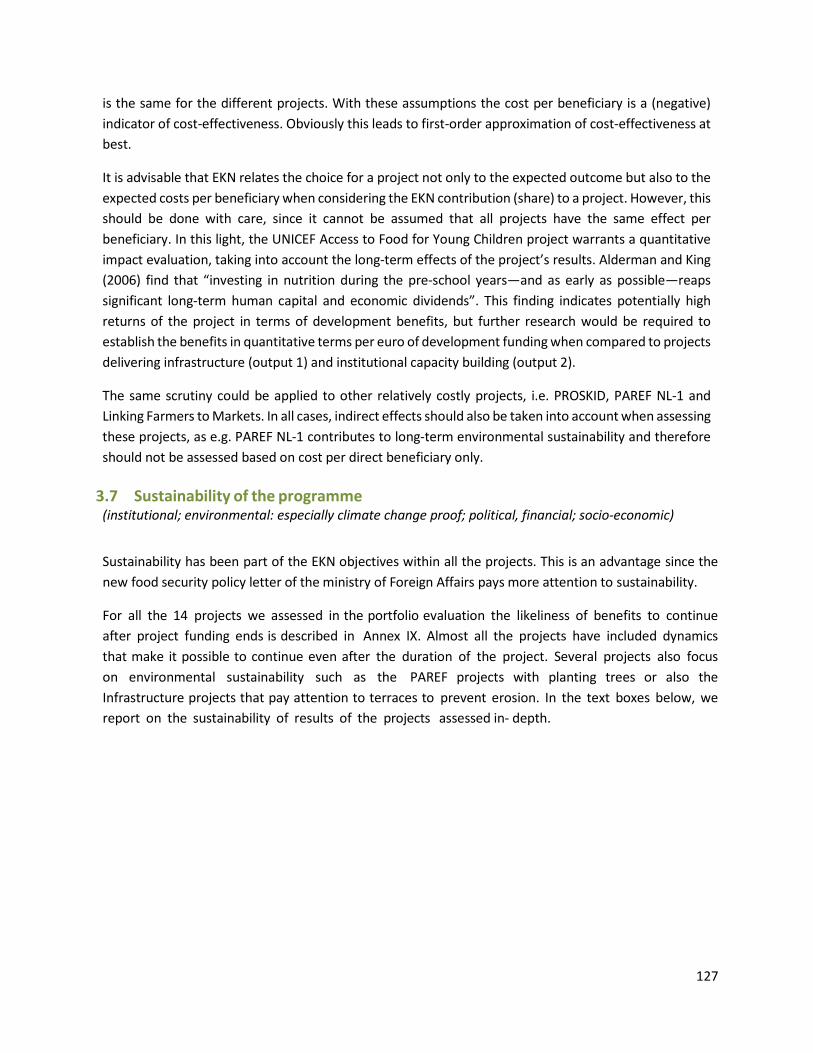
is the same for the different projects. With these assumptions the cost per beneficiary is a (negative) indicator of cost-effectiveness. Obviously this leads to first-order approximation of cost-effectiveness at best.
It is advisable that EKN relates the choice for a project not only to the expected outcome but also to the expected costs per beneficiary when considering the EKN contribution (share) to a project. However, this should be done with care, since it cannot be assumed that all projects have the same effect per beneficiary. In this light, the UNICEF Access to Food for Young Children project warrants a quantitative impact evaluation, taking into account the long-term effects of the project’s results. Alderman and King (2006) find that “investing in nutrition during the pre-school years—and as early as possible—reaps significant long-term human capital and economic dividends”. This finding indicates potentially high returns of the project in terms of development benefits, but further research would be required to establish the benefits in quantitative terms per euro of development funding when compared to projects delivering infrastructure (output 1) and institutional capacity building (output 2).
The same scrutiny could be applied to other relatively costly projects, i.e. PROSKID, PAREF NL-1 and Linking Farmers to Markets. In all cases, indirect effects should also be taken into account when assessing these projects, as e.g. PAREF NL-1 contributes to long-term environmental sustainability and therefore should not be assessed based on cost per direct beneficiary only.
3.7 Sustainability of the programme (institutional; environmental: especially climate change proof; political, financial; socio-economic)
Sustainability has been part of the EKN objectives within all the projects. This is an advantage since the new food security policy letter of the ministry of Foreign Affairs pays more attention to sustainability.
For all the 14 projects we assessed in the portfolio evaluation the likeliness of benefits to continue after project funding ends is described in Annex IX. Almost all the projects have included dynamics that make it possible to continue even after the duration of the project. Several projects also focus on environmental sustainability such as the PAREF projects with planting trees or also the Infrastructure projects that pay attention to terraces to prevent erosion. In the text boxes below, we report on the sustainability of results of the projects assessed in- depth.
127
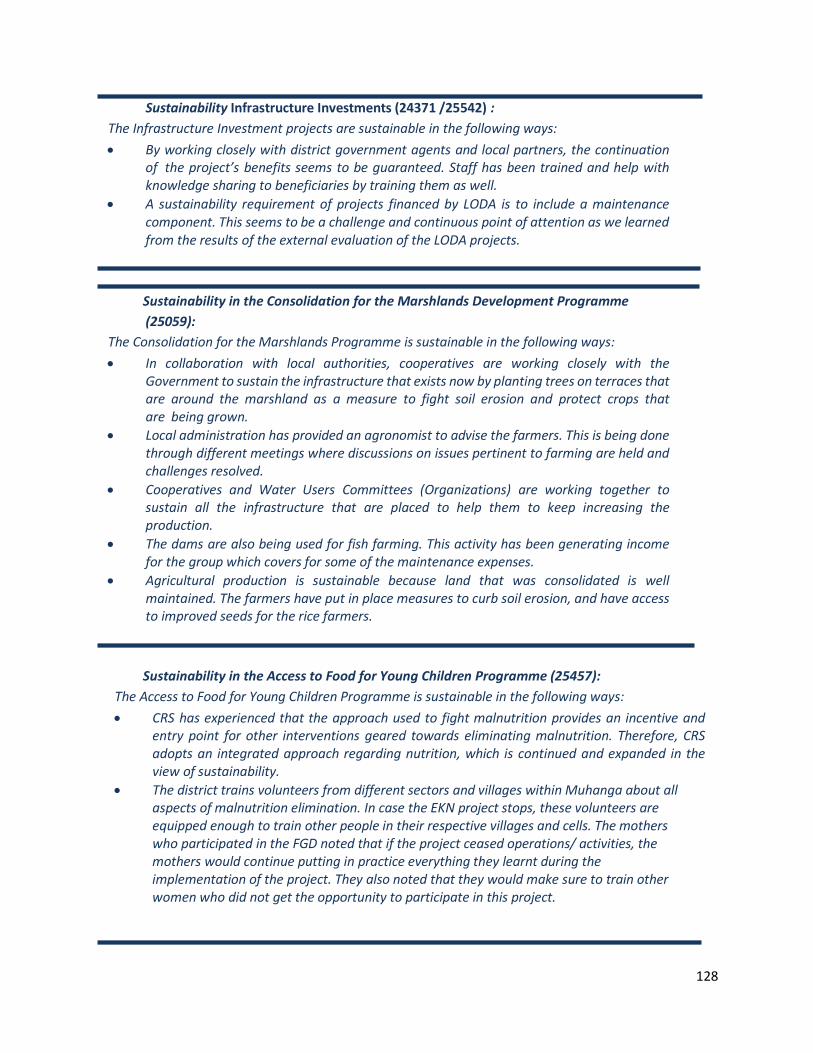
Sustainability Infrastructure Investments (24371 /25542) : The Infrastructure Investment projects are sustainable in the following ways: • By working closely with district government agents and local partners, the continuation
of the project’s benefits seems to be guaranteed. Staff has been trained and help withknowledge sharing to beneficiaries by training them as well.
• A sustainability requirement of projects financed by LODA is to include a maintenancecomponent. This seems to be a challenge and continuous point of attention as we learnedfrom the results of the external evaluation of the LODA projects.
Sustainability in the Consolidation for the Marshlands Development Programme (25059):
The Consolidation for the Marshlands Programme is sustainable in the following ways: • In collaboration with local authorities, cooperatives are working closely with the
Government to sustain the infrastructure that exists now by planting trees on terraces thatare around the marshland as a measure to fight soil erosion and protect crops thatare being grown.
• Local administration has provided an agronomist to advise the farmers. This is being donethrough different meetings where discussions on issues pertinent to farming are held andchallenges resolved.
• Cooperatives and Water Users Committees (Organizations) are working together tosustain all the infrastructure that are placed to help them to keep increasing theproduction.
• The dams are also being used for fish farming. This activity has been generating incomefor the group which covers for some of the maintenance expenses.
• Agricultural production is sustainable because land that was consolidated is wellmaintained. The farmers have put in place measures to curb soil erosion, and have accessto improved seeds for the rice farmers.
Sustainability in the Access to Food for Young Children Programme (25457): The Access to Food for Young Children Programme is sustainable in the following ways: • CRS has experienced that the approach used to fight malnutrition provides an incentive and
entry point for other interventions geared towards eliminating malnutrition. Therefore, CRSadopts an integrated approach regarding nutrition, which is continued and expanded in theview of sustainability.
• The district trains volunteers from different sectors and villages within Muhanga about allaspects of malnutrition elimination. In case the EKN project stops, these volunteers areequipped enough to train other people in their respective villages and cells. The motherswho participated in the FGD noted that if the project ceased operations/ activities, themothers would continue putting in practice everything they learnt during theimplementation of the project. They also noted that they would make sure to train otherwomen who did not get the opportunity to participate in this project.
128

3.8 Unplanned, positive or negative, effects of the programme
During the focus group discussions with beneficiaries it was possible to discuss unplanned positive or negative effects of the programme. The main findings for the LODA, Unicef and Welthungerhilfe projects are presented below.
Unplanned positive/negative effects – Infrastructure Investments (24371 /25542) :
During the field visit a health center, primary school and village with farmers, for whom terraces had been created on a hillside, were visited.
Interventions of the project may have contributed to a poverty reduction. In 2012 53,16% of the population in Muhanga was considered poor, in 2015 this was reduced to 30,50% poor people. Together with people in the villages and the district, every year there is a screening on the poorest and most deprived people. Those people are selected to provide manual labour at a minimum daily wage for the projects implemented, to help them get out of poverty. Free houses are being built to provide housing to the most vulnerable and poor in the district.
Muhanga district officials mentioned that it remains a challenge to have sufficient budget to realize all the planned development projects. Another challenge is access to data to perform feasibility studies. The district also mentioned a lack of baseline data, which hinder their work. At the health centre it was mentioned that though a water pipeline had been installed, the connection of water to the pipes was still missing and the health centre had to make use of water tanks. Furthermore, frequent power cuts, even being next to the electricity line, made the work difficult since there was no generator. The preference of the health centre would be to work with solar panels, which were not included in the project.
“Before the installation of terraces the ground suffered from erosion and would be washed away. Now with the cultivation of terracesthe ground is in good state. Even in the dry season it is not as dry as it used to be before ” Male Participant, LODA Project, Muhanga
129
Unplanned positive/negative effects – Consolidation of the Marshlands Programme (25059): The project has had the unplanned positive effect of generating extra income for farmers by fish farming activities carried out in the dams. The farmer groups introduced fingerlings in the dam for the group. The proceeds from sale of fish are put in the group’s account, which is used for care and maintenance of the group’s resources. Another positive achievement is encouraging a culture of savings among members of the cooperative groups/farmers who are involved in the project. Lastly, extra income has been generated by visitors of the Rugeramigozi I and II Water Dams who are charged a small fee (RwF 1000 for taking pictures and RwF 5,000-10,000 for events).
The sector agronomist did not recall many challenges. However, the first two years were not regarded very productive due to several factors: farmers were still learning how to grow rice; the marshlands were not yet well consolidated; only some farmers had fertilizers. Second, there were farmers who did not understand the value of collective bargaining and were hesitant to sell their produce through the cooperatives. The cooperatives engaged them in different ways to change their minds and allow the cooperative to sell on their behalf the farm produce. Additionally, the cooperative assigned day and night guards in the consolidated marshlands to inhibit farmers from taking their harvests at home. Therefore, the agronomist has given two recommendations for future programming: to protect dams and have adequate storage facilities.
Unplanned positive/negative effects – Access to Food for Young Children Programme (25457): An unplanned positive effect is the increased involvement of husbands also outside the sphere of the project. The women who participated in this FGD mentioned that their husbands have been very supportive of their participation in this project. The women noted that after the men got information on the importance of supporting their wives they changed their attitudes positively and started providing more support to the women in taking care of the children and the family as a whole.
A challenge is posed by the fact that malnutrition is not visible from the outside, which makes it difficult to identify it. That is why community workers measure it monthly. In addition, the project focuses on reducing stunting, while the EKN project description is focusing on reducing severe malnutrition. For CRS, malnutrition is part of the reduction of stunting. Stunting is a form of malnutrition that cannot be easily reduced, it takes time to reduce stunting and this needs medical treatment. Finally, 31 participants dropped out because of time constraints, personal reasons, or they felt they did not need the group. Unfortunately, this could not be prevented, which misses an important opportunity. However, the women participating in the project have suggested to train the other women who did not participate.
130
4. Quantitative Impact Analysis
4.1 Introduction
This chapter zooms in on the effects of programme elements of CATALIST-2, a broad agricultural intensification and food security programme selected by IOB for quantitative project-level impact evaluation. Formally, the CATALIST-2 programme is not part of the EKN country programme for Food Security in Rwanda, as it is part of a regional programme for the Great Lakes area.
The Terms of Reference of this evaluation specify that only the Rwandan component of the programme is to be evaluated in the framework of the Food Security Evaluation. The programme activities in Rwanda focus on Irish potatoes in the Northern Province, and cassava in the Southern and Eastern provinces. In addition, maize, rice and vegetable clusters are spread over the country.
CATALIST-2 is a multi-faceted regional programme. In order to design a rigorous impact evaluation, with micro-level observations on programme participants and non-participants, an empirical focus has been imposed. As remarked in the baseline report, the study has opted for a focus on a single crop, cassava. The cassava focus is based on its relatively large share of beneficiaries and of programme budget; its relevance for food security, particularly for poor and food insecure households; its relevance for women farmers; the difficulty of evaluating cassava using secondary information sources and the fact that there is generally less research on cassava, compared to e.g. potatoes.
The empirical focus of the quantitative evaluation is thus on cassava growing farmers in Rwanda’s Southern province. This does neither mean that these farmers grow cassava exclusively or predominantly, nor that all the interventions studied have a strict cassava focus.
The main source of information used in this chapter is a dataset collected in two household and community survey rounds. The baseline data were collected in March-April 2014; see the IOB Rwanda evaluation, baseline report, for details. The endline data have been collected in March-April 2016. At baseline, 804 households in 67 cells (134 villages) were interviewed; at endline, 786 households (97.8 percent of the baseline sample) were re-interviewed. The endline survey was organized during the exact same months as the baseline to ensure comparability in terms of harvest and food availability seasons. The main use of the dataset is to estimate the impact on a set of beneficiary outcomes of Farmer Field School type trainings quantitatively in a sample that includes CATALIST-2 beneficiaries. Moreover, the data are used to describe the programme participation and characteristics of the beneficiaries.
The chapter also makes use of other types of information. Inception and annual reports were used to describe the implementation of CATALIST-2. Implementation data were merged with the survey data to obtain a good record of the intervention. Programme partners and implementers were interviewed at the time of the endline survey. Focus group discussions were carried out in two CATALIST-2 beneficiary villages.
This chapter is organized as follows. In the next section the context of CATALIST-2 in Rwanda is described, with special attention to the cassava disease situation. In section 4.3 the CATALIST-2 programme is
131
described in terms of the organization, the theory of change, the implementation and concluding with beneficiary feedback from focus group discussions in two villages. Section 4.4 presents the methodology of the quantitative impact evaluation, with particular attention to the identification strategy. Descriptive evidence from the survey data is presented and discussed in section 4.5. Section 4.6 presents the impact estimates for all the outcomes along the causal chain of CATALIST-2. A central specification is discussed, and a few alternative specifications and sub-populations to check the robustness of the qualitative conclusions. Section 4.7 summarizes and provides a discussion of the findings.
4.2 Context of CATALIST-2 4.2.1 Cassava production in the programme areas
Figure 4-1 shows the percentage of households planting cassava in all the districts of Rwanda and indicating the CATALIST-2 programme areas. The figure shows that in three of the CATALIST-2 districts (Ruhango, Nyanza, Kamonyi) more than 80% of the farmers grow cassava, while in Muhanga district between 60 and 80% of farmers, and in Gisagara district between 40 and 60% of farmers grow cassava. In Bugesera district, which is a former CATALIST-2 cassava cluster, also between 60 and 80% of farmers cultivate cassava. Hence, the programme focuses on the most important cassava producing areas. However, cassava farmers are not likely to be uniformly distributed in the districts. There are sectors45 where cassava is a major crop, while other sectors are better suited for other crops.
Between 2007 and 2010 cassava production has increased threefold in the Southern province, and in 2010 the Southern province was providing 48% of the national cassava production (Schrader et al 2013). In 2012, the share of land cultivated with cassava is between 16 and 22% in the programme districts and lower outside the programme areas. The main other crops are banana and (ordinary and climbing) beans.
45 The administrative units in Rwanda from largest to smallest are province, district, sector, cell and the smallest unit is village.
132

Figure 4-1: Percentage of households growing cassava by districts
4.2.2 Cassava related diseases
A 2010 report by the UN Food and Agricultural Organization (FAO, 2010) describes two major viral diseases, Cassava Mosaic Virus (CMV) and Cassava brown streak disease (CBSD), that are a major threat to cassava production in the Great Lakes region. According to the FAO, “These are just the latest in a long line of strains of disease affecting cassava crop (with new variants appearing in 1983, 1993, 1997, 2004). Although timing is not regular, depending on biological events and conditions such as area under cultivation and climatic factors, it seems that major new diseases or strains of cassava disease tend to appear every 7–10 years.” The diseases are spread by a whitefly vector (Bemisia tabaci) and the movement of planting materials.
Follow-up FAO press releases and newspaper articles46 report that after 2010 Rwandan cassava farmers had been affected. According to CATALIST programme implementers, the CBSD became a major problem in the Southern districts in 2014.
The survey data confirm that between the baseline in 2014 and the endline in 2016, cassava crops of farmers in the study area have been attacked by these diseases and large parts of the harvest have been destroyed. As shown in Table 4-1, 38.7 percent of the sampled farmers have stopped cultivating cassava since 2014 due to the diseases. Of the 561 farmers that did cultivate cassava in 2015, 74.1 percent indicated that their harvest suffered from the diseases and for 50.6 percent of the sampled farmers the diseases destroyed more than half their harvest. Although the Rwanda Agricultural Board (RAB) has been
46 FAO, 2011, press release, 16 November, 2011: “Cassava virus on verge of epidemic in East Africa”; The New Times, 1 June 2015, “Cassava farmers count the cost of 'endless' diseases, call for support”.
CATALIST-2 cassava mega cluster (Kamonyi, Nyanza, Muhanga, Gisagara, Ruhango) CATALIST-2 Bugesera cassava cluster (CATALIST-2 funding stopped in 2013/2014)
Source: CFSVA 2012 and CATALIST-2 programme documents
133
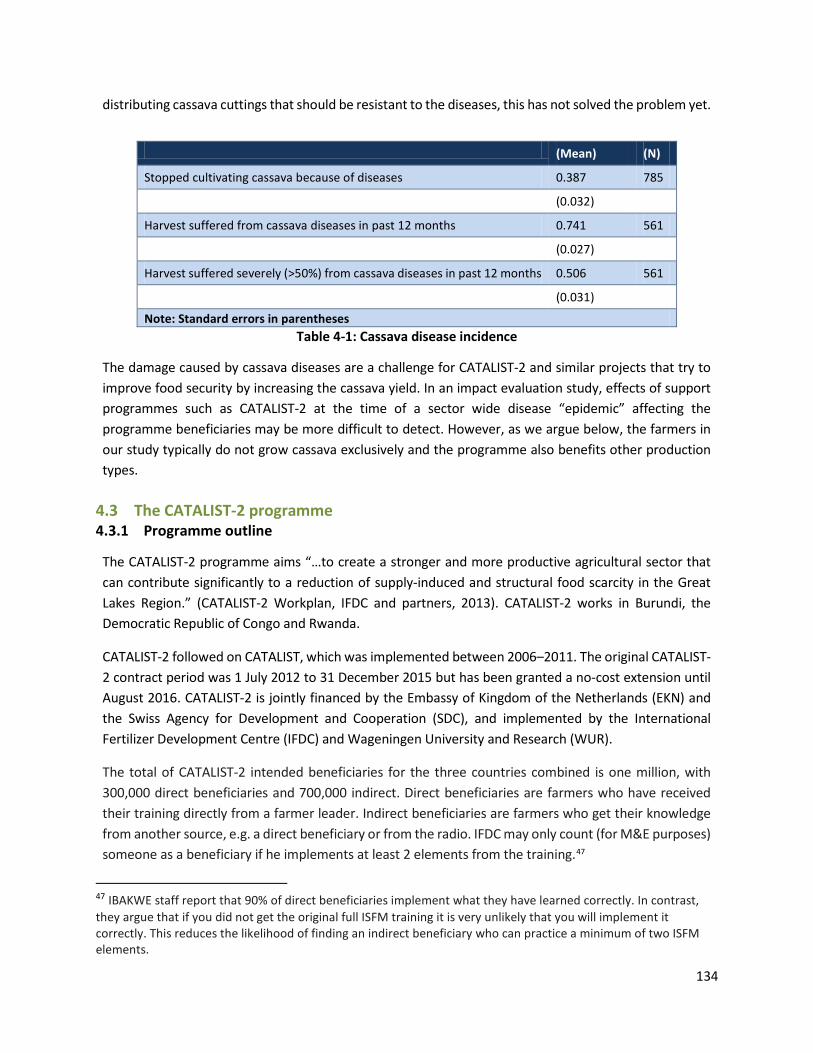
distributing cassava cuttings that should be resistant to the diseases, this has not solved the problem yet.
(Mean) (N)
Stopped cultivating cassava because of diseases 0.387 785
(0.032)
Harvest suffered from cassava diseases in past 12 months 0.741 561
(0.027)
Harvest suffered severely (>50%) from cassava diseases in past 12 months 0.506 561
(0.031)
Note: Standard errors in parentheses Table 4-1: Cassava disease incidence
The damage caused by cassava diseases are a challenge for CATALIST-2 and similar projects that try to improve food security by increasing the cassava yield. In an impact evaluation study, effects of support programmes such as CATALIST-2 at the time of a sector wide disease “epidemic” affecting the programme beneficiaries may be more difficult to detect. However, as we argue below, the farmers in our study typically do not grow cassava exclusively and the programme also benefits other production types.
4.3 The CATALIST-2 programme 4.3.1 Programme outline
The CATALIST-2 programme aims “…to create a stronger and more productive agricultural sector that can contribute significantly to a reduction of supply-induced and structural food scarcity in the Great Lakes Region.” (CATALIST-2 Workplan, IFDC and partners, 2013). CATALIST-2 works in Burundi, the Democratic Republic of Congo and Rwanda.
CATALIST-2 followed on CATALIST, which was implemented between 2006–2011. The original CATALIST-2 contract period was 1 July 2012 to 31 December 2015 but has been granted a no-cost extension until August 2016. CATALIST-2 is jointly financed by the Embassy of Kingdom of the Netherlands (EKN) and the Swiss Agency for Development and Cooperation (SDC), and implemented by the International Fertilizer Development Centre (IFDC) and Wageningen University and Research (WUR).
The total of CATALIST-2 intended beneficiaries for the three countries combined is one million, with 300,000 direct beneficiaries and 700,000 indirect. Direct beneficiaries are farmers who have received their training directly from a farmer leader. Indirect beneficiaries are farmers who get their knowledge from another source, e.g. a direct beneficiary or from the radio. IFDC may only count (for M&E purposes) someone as a beneficiary if he implements at least 2 elements from the training.47
47 IBAKWE staff report that 90% of direct beneficiaries implement what they have learned correctly. In contrast, they argue that if you did not get the original full ISFM training it is very unlikely that you will implement it correctly. This reduces the likelihood of finding an indirect beneficiary who can practice a minimum of two ISFM elements.
134
Based on the CATALIST-2 Annual Reports, the regional programme has reached 320,694 farmers at the end of 2015. This number represents the direct reach through various activities implemented in the three countries. The programme budget for 2012-2015 was 29,5 mn USD of which 27,3 mn USD was spent. The costs for the full duration of the three country programme are about 85 USD per direct beneficiary.
In Rwanda CATALIST-2 aims to reach approximately 43,000 direct beneficiaries; that is, producers (households) in the cassava cluster in Rwanda who will benefit directly from the programme activities in Rwanda. An additional 57,000 indirect beneficiaries are estimated to benefit from CATALIST-2 in the same area bringing the total number of targeted direct and indirect beneficiaries to 100,000. IFDC report 12,894 as the number of realized direct beneficiaries. The full cost the support to the Rwanda cassava megacluster over the life of CATALIST-2, including IBAKWE contracts, meetings and cassava cuttings are reported at 514,326 USD (Rwf 326,597,213). This amounts to a cost per direct beneficiary of about 40 USD (Rwf 25,329). IFDC have confirmed the lower than average cost of the cassava cluster support, partly because of the relatively low cost of crop inputs.
4.3.2 Programme logic
The CATALIST-2 Workplan (IFDC and partners, 2013) describes the focus of the programme as follows:
“Building on the experience and technical achievements of CATALIST-1, IFDC will take on the challenge to create a stronger and more productive agricultural sector that can contribute significantly to a reduction of supply-induced and structural food scarcity in the Great Lakes Region. The focus of CATALIST-2 will be on regional food security, a reduction of production costs per unit product and an improved policy and business environment in the agricultural sector. The primary role of CATALIST-2 will be to increase agricultural production and create a vibrant market for the resulting agricultural products. The project will work towards a balanced mix of commodities and markets to reduce the risks of reliance on a narrow commodity base. Staple crops as well as pulses, oil-crops, fruits and vegetables may be included; allowing the region to address nutritional issues through diversification of diets.“
The goals of the CATALIST-2 programme are a 30 percent increase in commodity related income, 80 percent of food insecure household moving up at least one step on the FAO household hunger scale and spill-over of benefits to non-participating households (farmer and non-farmer; CATALIST-2 workplan 2016, IFDC). The programme is implemented in Congo, Uganda and Rwanda.
CATALIST-2 is based on the Competitive Agricultural Systems and Enterprises (CASE) framework, developed by IFDC, that promotes farmer entrepreneurship. The underlying hypothesis of the programme is that small farmers need to have profitable market outlets (demand side) in order to have the means and to be motivated to invest in integrated soil fertility management on their farms (supply side).
CASE suggests the following strategies for farmer empowerment in the value chains:
• Improve farmers’ role as producers and explore the role of farming communities in processing;
• Improve farmer collaboration with chain operators and chain supporters;
135
• Influence enabling environment.
CATALIST-2 works through agribusiness clusters, networks of actors including input dealers, small, medium or large agro-processors, producer organisations (cooperatives, farming groups, unions), traders and farmers. These are (largely informal) networks of private and public actors that need to cooperate to achieve their individual and collective objectives. A cluster is usually specialized in the value chain of a commodity in a geographic area.
In CATALIST-2, the concept of a ‘mega-cluster’ was introduced to scale the outreach of the programme. A mega-cluster serves as an umbrella organisation/network for several local agribusiness clusters, which leads to concentration of efforts on geographical areas, agricultural sub-sectors or both. In theory, bundling efforts in a large number of agribusiness clusters operating in the same area may result in scale economies, for example through: contracting with larger sourcing companies, leading to more market-pull; more possibilities to organize specialization on commodities; more advocacy clout to support claims for policy change and action at higher strategic levels (Schrader, 2013).48
CATALIST-2 is thus based on a public-private partnership (PPP) model, and partnership – whenever possible – with national and international (including Dutch) agro-enterprises in areas such as agro-input supply, professional service provision and output marketing.
The above description indicates a more ambitious approach compared with a strict supply side type intervention such as the Farmer Field School (FFS, Waddington et al, 2014). In the CATALIST theory of change market forces are invoked as the main driver for enhancing food security and farmer income. If successful, these market forces incentivize individual farmers to respond to the CATALIST supply side interventions such as trainings. Such responses, for example increased application of fertilizer and improved seeds and cuttings, and their yield and production effects should be observable at the micro-level in the survey data.
The CATALIST-2 core interventions in the local cassava clusters consist of:
1. Providing information on ISFM (integrated soil fertility management) farming practices;49
2. Providing information on business and financial planning;
48 In relation to the market-pull aspect of CATALIST-2, it is important to mention the Kinazi Cassava Plant (KCP) that was established in 2012. An important reason for the focus on the increase in cassava production in CATALIST-2 was the establishment of the KCP factory. The factory would presumably create an important market demand for cassava. Linking farmers and cooperatives to the new plant was a major focus of the project, with the expectation that cassava farmers would become more organized in cooperatives, among others for delivering cassava to KCP. However, the plant has hardly been operational since its establishment and demand for its high-quality cassava, either from export or domestic markets, has failed to materialize. According to the programme officers, this has negatively influenced the impact of CATALIST-2. 49 Integrated Soil Fertility Management (ISFM) is a set of soil fertility management practices adapted to local conditions and aimed at maximizing efficiency of crop nutrient use and improving crop productivity. Practices involved include the use of mineral fertilizer, soil amendments (lime, rock phosphate), organic inputs, improved germplasm, agro-forestry and the use of rotations or intercropping with legumes (CATALIST-2 project proposal).
136
3. Enhancing access to improved cassava cuttings and other inputs (fertilizers, pesticides,herbicides); this is largely facilitation of contacts as subsidies to inputs are rare.50
The target beneficiaries of the CATALIST-2 information interventions are cassava farmers. The focus of the programme is on “intermediate farmers” (IFDC/EKN/SDC, 2013) with land holdings of 0.5-2 hectares but farmers with smaller land holdings are included (both in the intervention and in the research sample).
The information is provided to farmers via trainings using a training of trainers system. At the top level IFDC trains the partner NGOs responsible for clusters (for example, IBAKWE in the case of the cassava mega-cluster in the Southern provinces of Rwanda). Then, in turn, the cluster NGOs organise trainings for farmer leaders in the area of their cluster. It is the responsibility of the cluster NGOs to recruit farmer leaders. The responsibility of the farmer leader is to organise in his/her locality a group of around 20-30 farmers that he/she will train on using ISFM farming practices.
Figure 4-2 reproduces the programme logic for the cassava mega-cluster from the perspective of small producers (farming households) that are in the focus of this evaluation.
In the figure CATALIST-2 related activities are highlighted with green. The left hand side of the figure shows that the programme logic starts with providing information on ISFM farming practices and business and financial planning.
50 Access to fertilizers is implemented by the government, while PReFER (another programme of IFDC) supports the privatisation of the system of fertilizer import and distribution. Improved cassava varieties are approved by RAB, while the improved cuttings are directly sold by farmers.
137
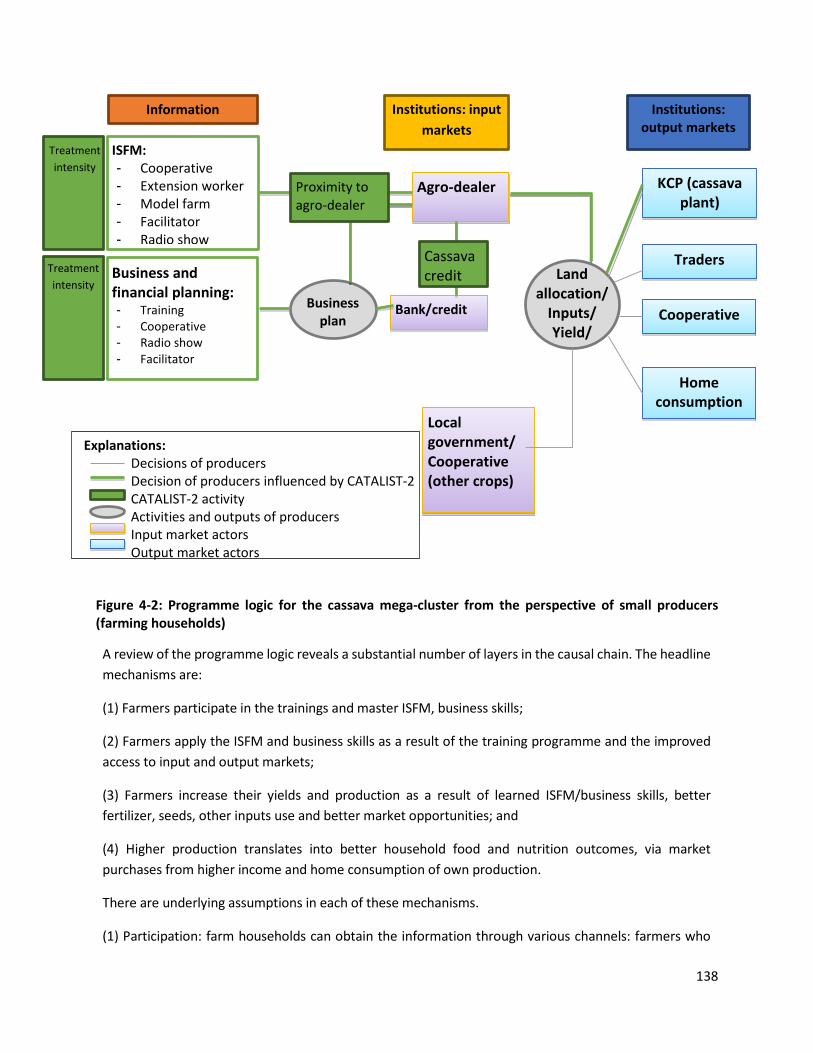
Figure 4-2: Programme logic for the cassava mega-cluster from the perspective of small producers (farming households)
A review of the programme logic reveals a substantial number of layers in the causal chain. The headline mechanisms are:
(1) Farmers participate in the trainings and master ISFM, business skills;
(2) Farmers apply the ISFM and business skills as a result of the training programme and the improved access to input and output markets;
(3) Farmers increase their yields and production as a result of learned ISFM/business skills, better fertilizer, seeds, other inputs use and better market opportunities; and
(4) Higher production translates into better household food and nutrition outcomes, via market purchases from higher income and home consumption of own production.
There are underlying assumptions in each of these mechanisms.
(1) Participation: farm households can obtain the information through various channels: farmers who
ISFM: - Cooperative - Extension worker - Model farm - Facilitator - Radio show
Business and financial planning: - Training - Cooperative - Radio show - Facilitator
Business plan
Information
Bank/credit
Agro-dealer
Institutions: input markets
Land allocation/
Inputs/ Yield/
Institutions: output markets
KCP (cassava plant)
Traders
Home consumption
Cooperative
Proximity to agro-dealer
Cassava credit
Treatment intensity
Treatment intensity
Explanations: Decisions of producers Decision of producers influenced by CATALIST-2 CATALIST-2 activity Activities and outputs of producers Input market actors Output market actors
Local government/ Cooperative (other crops)
138
are members of a cooperative can receive information through trainings at the cooperatives or from fellow cooperative members who were trained by facilitators; extension workers or farmer promoters can be trained on ISFM, and they can set up a model farm or demonstration plot in their village; finally, information is also provided through a radio show.
Underlying assumptions are: facilitators are adequately trained, well-motivated, the trainings are high quality and follow-up with the farmers is taken care off; farmers are interested and attend sufficient meetings; the trainings are well synchronised with the planting season. For indirect information transmission (to non-attending households) it is necessary that there is a high degree of social cohesion within the village; geographical proximity to other farmers (observation) or market (communication).
(2) Use of information: knowledge of ISFM farming may motivate farmers to start implementing ISFM practices, the improved cassava cuttings and organic and inorganic fertilizers.
Note that the government does not provide subsidized fertilizers for cassava, and most people do not use any chemical fertilizers for cassava. Input subsidies are very rare in Rwanda, as is shown in section 4.5. However, governmental institutions (RAB) promote the use of disease-resistant improved cuttings for cassava and improved cassava cuttings are financed by CATALIST-2. Furthermore, CATALIST-2 is involved in training agro-dealers to set up local outlets for inputs including fertilizers for cassava. Hence, it assists in linking farmers to input markets (potentially also farmers who have not heard of IFSM).
Since fertilizers and improved cuttings are not generally subsidized, farmers may be constrained in investing in these inputs by their lack of savings and limited knowledge and possibility to apply for a loan. CATALIST-2 addresses this shortcoming by training farmers on cost-benefit calculation and on how to make a business plan that can be submitted to the bank to apply for a loan.
For use of information, including investment in inputs to happen, the curriculum needs to be relevant to problems facing farmers and farmer attitudes need to be changed (convinced message appropriate) as a result of the programme (e.g. if farmers already applied ISFM – or learned it through another channel than CATALIST-2, before or during the CATALIST programme implementation – the programme will not show an effect). Moreover, if appropriate, the relative advantage over old practices must be sufficiently large and convincing to make the required investments and start implementing. The new technology must be attractive in terms of market access, favourable prices and environmental factors including weather, soil fertility and, importantly in this case, diseases.
CATALIST-2 is also lobbying at a national bank to offer a cassava-specific loan contract in the mega-cluster area. The fact that KCP is willing to buy all cassava harvest provides a good basis for these negotiations. However, farmers need to submit a realistic business plan to be able to get a loan. For the programme to generate an impact, the credit access and market prospects need to be an ex-ante binding constraint with respect to the application of ISFM techniques; if they are not binding constraints, lifting them will not measurably increase ISFM application.
In addition to inputs, farmers have to decide on the land allocation between cassava and other crops. Government subsidies for maize and other crops, and extension programmes on other crops also
139
influence the land allocation decision of farmers.
Market crop prices need to be sufficiently attractive to motivate farmers. CATALIST-2 is facilitating negotiations between KCP and farmers to get a better cassava price deal for the farmers. KCP offers farmers a fixed price for their harvest. However, farmers might be able to sell their harvest at a better price to other outlets. In addition, the fixed buy-in price does not motivate farmers to grow high quality cassava.
(3) Production: based on their decisions, the farmers realize an output and yield for cassava and other crops. The harvested cassava can be used for home consumption or it can be sold to various outlets: traders, cooperatives or the cassava plant.
An important underlying assumption is that production circumstances are sufficiently favourable that farmers are able to replicate the demonstrated yield increases on their own land. The cassava diseases discussed in the previous section are clearly disruptive in this sense, especially because the ISFM practices often require farmers to borrow money to make the necessary investments.
(4) Food security and nutritional outcomes: the most direct way for increased production to translate into increased food intake is via home consumption of household farm harvest. An indirect way is via food expenditure due to increased farm income. For such outcomes to happen, intra-household bargaining must lead to allocation of resources to food and nutrition, in a way that benefits otherwise vulnerable household members. For example, if the additional income is spent on household members who eat reasonably well otherwise, no impact will be attributable to the programme. Furthermore, the nutritional value of additional food consumption and/or expenditure will determine whether the nutritional status of household members is affected.
In summary, the programme logic assumes that via participation in the programme intervention trainings, farming households will start applying organic and chemical fertilizers, improved cuttings/seeds and soil fertility management practices. It further assumes that farmers will increase their yield and net income as a result of these practices. It is assumed that farmers have insufficient access to credit, input and output markets, which prevents them from fully realizing the benefits of IFSM. Therefore, the programme works on eliminating these obstacles; it assumes these are binding constraints so that removing them will improve the profitability of ISFM investment and thus increase their level. Finally, the programme logic assumes that increased harvest and/or income will increase the food and nutrition intake of the household members51.
51 This is consistent with the hypotheses regarding the specific interventions (CATALIST-2) formulated in discussions with IOB:
1. The training programmes lead to sustained changes in agricultural practice and entrepreneurship.2. The changes in agricultural practice and entrepreneurship result in improved household income.3. Increased household income improves food consumption (quantity and nutritional quality) in a manner that
benefits all household members, including infants and women.
140
4.3.3 Field implementation detail
The CATALIST-2 programme is implemented through programme partners. The international partners are IFDC and WUR, while the Non-Governmental Organisation IBAKWE is one of the main local implementing partners in Rwanda. This section provides details on implementation of CATALIST-2 based on an interview with IBAKWE director John Twilingiyumukiza and project officers (Kigali, 22 February 2016).
The programme uses an escalated training system, or training of trainers system. From bottom to top this system includes: at the lowest level the Benibakwe, or farmer leaders; then team leaders at sector level; then advisors at district level; and central management in Kigali. The trainings target individuals and cooperatives. In the South (5 districts) the focus is on cassava (manioc). IFDC is one of IBAKWE’s (financial) partners.
IBAKWE is contracted to manage three types of substantive activities in CATALIST (leaving aside tasks such as monitoring and evaluation):
1. Training farmers with regard to intensification of agriculture (ISFM)
2. Facilitation of access to improved cassava cuts
3. Facilitation of mega-cluster development, incl. financial training
The stated focus of CATALIST-2 is on middle-sized farmers with landholdings of 0.5 – 2 ha. However, in reality a lot of small sized farmers participate in the programme, with holdings below 0.5 ha (and these are sampled for this study as well).
1) ISFM training, Farmer Field School
IBAKWE uses the term Farmer Field School (FFS) for this intervention. First a demo plot is introduced, which consists of 2 plots: treatment and control. On the treatment plot all treatments are introduced, including ISFM, fertilizer, phosphates.
The full ISFM treatment has the following steps:
1. Anti – erosion
2. Good preparation of the soil, 2 steps
3. Application of compost
4. Liquid fertilizer (Digro), cuttings are put in this
5. Planting: make sure that plants/cuts are put in neat rows with sufficient space
6. Weeding (in first 2-3 months)
7. Fertilizer, either liquid or NPK
141
8. Weeding 2nd time (5-6 months)
9. Repeat fertilizer 2nd time; repeat fertilizer 3rd time
10. Weeding 3rd time
11. Harvest: 12-24 months after planting. On average 14 months.
Yields reported by IBAKWE are: before treatment in the range 0-7 ton/ha, on average 5 or 6 t/ha. After full treatment: 20-40 t/ha, so should be very visible to farmers. These numbers are based on demo plot differences. The reported impact on cost is from 70 Rwf/kg on average (before treatment) to 21 Rwf/kg (after).
Once these differences become visible to the farmers, trainers ask the farmer leader to organize a model farm, where the full treatment is implemented at scale (max 20 ha). The message to farmers is to implement the ISFM practices at scale on their own plot. The location of the demo plot is important. The programme advises the Benibakwe to locate them centrally, a place where a lot of farmers can observe the difference with their own harvest.
IBAKWE claim that the intervention is an eye-opener to the farmers: “Before 2012 there was no ISFM in these districts at all”, “they were ignorant”. In 2012 they contracted/started with 120 farmer leaders or Benibakwe. In 2016 they have 656 under contract. There is a minimum of one farmer leader per village. But the number of leaders is a function of the number of farmers. The rule is one farmer leader per 30 farmers.
IBAKWE confirms that they are not the only ones to implement the FFS. For example, there are similar programmes by RAB. As we know, for example in Huye district there are non-CATALIST FFS interventions. Also, it is possible that in the Catalist districts cells that are not reached by IBAKWE do participate in FFS interventions.
However, there is a difference in approach. Most importantly, the IBAKWE/Catalist intervention focuses exclusively on cassava. E.g. RAB FFS has FFS in many different crops (wheat, corn, potatoes, and cassava). This was confirmed by IFDC, although according to RAB they in practice sometimes train together with IBAKWE. According to IFDC it will be hard to find any household that has never heard about ISFM, either via radio or via visits. But they are insistent that there is a big difference between Catalist treatment and generic Government programmes. IBAKWE has far more resources, is better funded and focuses on cassava only. They provide structured trainings and follow-up via the farmer leader model, so with representation close to the producer. In contrast the “business as usual” model is that one RAB or district representative has to cover a whole sector, so brief trainings, without local resource person and without follow-up.
Secondly, the Catalist programme includes the other components mentioned: cuttings, facilitation (including business training, value chain networking).
Typically, trainees follow 4 sessions of 2 hours, focusing on:
142
1. Preparation of the land, application of compost
2. Application of chemical fertilizer, NPK
3. Looking at evidence on the demo plot
4. Harvest
So for the main element of Catalist, ISFM FFS, the total treatment is 8 hours training. Sometimes they add a class for special issues, e.g. plant diseases. The number of farmers per farmer leader is 30. That is, the farmer leaders are told to recruit a class of 30. The total number of farmer leaders depends on the quantitative targets set by the programme/IFDC.
It happens that farmers refuse to participate or continue participation. Reasons given are: no time, do not believe in the programme, “ignorant” of the benefits, or belief that the cost of inputs are too high.
2) Access to improved cassava cuttings, diseases
The set-up of a model farm is incentivized by CATALIST-2 through the provision of subsidized or free fertilizers and improved seeds.
IBAKWE implementers regard the Cassava diseases as a big problem. Mosaique disease has been around for a long time. Improved varieties resistant against mosaique disease came in 2005, 12 types. They selected the 5 best and used these. The CBSD (cassava brown streak disease) only arrived in 2014. IBAKWE says that both the mosaique resistant and traditional variety cuttings are affected by CBSD.
In 2014-15 IBAKWE had 5300 ha of model farms/demo plots. Because of brown streak the harvest on all plots was completely lost. This was the first time they saw CBSD. So the improved variety cuttings introduced in 2005-06 were resistant against mosaique but as it turned out not against CBSD. According to IBAKWE, traditional or non-improved varieties also suffer from CBSD. So the idea that the intervention may have promoted a variety more sensitive to disease is contradicted.
3) Facilitation of mega-cluster development
This part of the intervention includes (a) financial training and (b) networking to get contracts signed in the value chain, for example between producers and traders, between banks and producers.
As part of this facilitation, there is a push to provide individual farmers with credit contracts from banks. These are a type of group loan where members of the cooperative will guarantee loans for one another. In effect these are group loans with assortative matching, as members have to vouch for one another and are liable for each other’s’ loans. The contracts are individual, but it is not exactly clear how the group liability works.
According to IBAKWE management, the actors in the value chain are: producers; banks; traders; processing industries; researchers, advisors; (local) government; NGOs. All these actors together form a cluster, and groups of clusters form a mega-cluster. However, it is not clear what the nature of the economies of scale is. The facilitation also includes an element of advocacy for the sector, e.g. with
143
respect to the Rwanda Agricultural Board. 4.3.4 Beneficiary feedback: Focus Group Discussions
Focus Group Discussions (FGD) with IBAKWE CATALIST-2 project beneficiaries were organized in two villages: in Binuga village, Cyeza Sector in Muhanga District (7 March 2016); and Musangano village, Busoro Sector in Nyanza District (8 March 2016). The selection of these two districts and villages was intended to represent a degree of diversity in terms of cassava cultivation while at the same time providing respondents who have interacted with the programme for some time. According to Schrader et al (2013), Nyanza district has a high score in terms cassava production potential and Muhanga has a medium score. In the Muhanga village there are relatively few people active in cassava production, in the Nyanza village many. What both villages have in common is the fact there is a demo plot and a model farm and that the programma had been operating from before our baseline survey (early treatment).
The full FGD reports are included in Annex XII. Here a summary of the main findings in both villages is presented. FGDs were organized in both villages in groups of male only participants, female only participants, men and women together, as well from groups of men and women who did not participate in the project. As there is substantial similarity between the main findings, both across the villages as across groups, the common findings are presented, by group type and by theme.
The main goal of the project according to the men and women in the FGD was to assist farmers get out of poverty by assisting them to increase their farm production. They all confirmed their participation in the project activities and more specifically in trainings giving the following as the key topics taught:
• Land preparation
• Crop rotation
• Use of improved seeds
• Use of fertilizers
• Use of pesticides
The farmers in Musangano in addition mention record keeping and cost benefit analysis as part of the training. The project focused mainly on cassava growing. The project also linked them with markets where they could sell their produce. Before the project, farmers used to practice subsistence farming using traditional practices which were not very productive but the project empowered them to produce commercially.
From the FGD with the male farmers, the main reasons for using agro-inputs include the following: • The training that the farmers have got from the project with regard to use of modern farming
methods;
• Access to and use of improved seeds for cassava, rice and maize which give better returns for the farmers hence allowing them to produce enough for home consumption and for sale
144
• Growing crops on a timely basis i.e. during the right season and weather as well as at a time when the demand for the produce is high. This has ensured that there is always a ready market/ demand for the produce.
• Access to and use of pesticides to control the various diseases that attack crops. The farmers who have participated in the project, have been able to apply pesticides to control diseases which attack cassava, maize and rice
• Land conservation and control of soil erosion has given the farmers an opportunity to grow crops on the hill-sides and in marshlands. Previously, the farmers were unable to grow crops in some of these places but today they are able to due to the introduction of modern farming techniques and as a result, the farmers have got new opportunities to grow crops in areas which used to be redundant hence increasing their produce for home use and for sale.
• The farmers also cited the challenge of small sizes of land as a key reason for using agro-inputs. The need to increase yields per acreage is what is driving the farmers to apply fertilizers and use the pesticides so as to increase production.
All farmers said that they were able to apply the knowledge acquired in practical ways in their farming. As a result, the project had positively impacted the community in the following ways:
• Increase in production meaning they had sufficient quantities of food for consumption and the excess for sale.
• The farmers reported that it was common for people in the area to have only two meals a day but children had three meals. The FGD participants mentioned that this is now slowly changing as a result because they are now able to produce enough food.
• They also bought or leased land to increase their production.
• Increase in income from sale of produces.
• Improved access to food. From the income gained from sales of farm produce, the farmers were able to buys other foods that did not produce.
• Improved ability to meet household needs such as paying schools fees, buying food.
In addition, the women pointed out that they are more financially independent from their husbands and they are more involved in decision-making in the household. The women from Binuga village were also able to obtain loans from financial institutions after gaining information and courage through the project and they made female friends in the group that allowed them to talk about their issues.
The farmers said that their neighbours and friends had indirectly benefitted for the project as they shared some of the seeds and cuttings issued by the project. They said it was important to share with their neighbours because if their neighbours continued planting poor varieties of crops, they were prone to get diseases which could easily spread to their farms.
They felt that the project had positively impacted their lives and that their families were living better lives compared to the period before the project. They further recommended that the project be replicated in other regions so that other people can benefit the way they had benefited in the years the
145

project was in their area.
Below are main challenges that the farmers who participated in the CATALIST-2 project mentioned:
1. The Cassava Brown Streak Disease CBSD) had negatively reduced their food production. The disease affected the tuber, the stems and the leaves. The tubers were particularly damaged with some cases resulting in tuber rot of the whole root system. The project had made effort to overcome this challenge by introducing a different cassava variety from Uganda that was claimed to be resistant to the virus causing CBSD. As at the time of the evaluation, the project was testing the new cassava variety in the model farms to gauge its performance.
2. The weather was unpredictable as rains became intermittent. Although the overall land production in the land had increased, the farmers felt it would have even been higher were rains more reliable.
3. The farmers felt that it would be difficult for them to access improved seeds and cuttings without the assistance of the project.
4. Loan payment was difficult for farmers who had lost most of their crop to CBSD.
The farmers who participated in the FGD were asked about the issue of sustainability of the programme. All the participants responded that sustainability of the programme was possible because the farmers felt that they had been equipped with knowledge and skills that they could continue to use even beyond the project period. Moreover, they mention the possibility to spread the knowledge further to non-participants.
4.4 Methodology 4.4.1 Evaluation questions and indicators
The primary goal of the quantitative impact evaluation is to address Evaluation question 4: effects on food security. As the food security impact is the ultimate effect in a long chain of causation, the evaluation addresses the following evaluation sub-questions to quantify intermediate effects of the intervention:
First order effects: 1. Have cassava growing farmers adopted ISFM farming practices (use of fertilizers and soil
management) as a result of the CATALIST-2 programme (specifically, information on ISFM and proximity to agro-dealers, link to credit market)?
2. Do cassava growing farmers have better access to credit as a result of CATALIST-2 programme (specifically, information on business planning and applying for credit, cassava credit arrangement)?
146
Second order effects: 3. How has the land used for cassava changed as a result of CATALIST-2 programme among the
targeted cassava growing farmers? 4. How has the yield of cassava changed as a result of the CATALIST-2 programme among the
targeted cassava growing farmers? 5. How has the output of cassava changed as a result of the CATALIST-2 programme among the
targeted cassava growing farmers? 6. How has the total output of the farmers changed as a result of CATALIST-2 programme among
the targeted cassava growing farmers?
Third order effects: 7. How has the income (price of cassava and wages) changed as a result of the CATALIST-2
programme? 8. How has the food security (availability, utilization, access, stability and nutritional intake) of
cassava growing farmers changed as a result of the CATALIST-2 programme. 4.4.2 Identification strategy
An essential step in a quantitative impact evaluation is to establish an identification strategy, which determines the counterfactual. In non-experimental impact studies the evaluator needs to use observational data in a setting where, typically, treatment assignment is endogenous. This means that treatment status is correlated with the outcomes of interest, not just because of the treatment effect itself but - likely - because of mechanisms that co-determine the outcomes and treatment status irrespective of the treatment effect. The identification strategy needs to address this “confounding”.
A typical approach in observational impact studies is to measure impact as the difference between the changes over time in mean outcomes for treated and untreated units (villages, households). This difference-in-differences (DD) approach requires that data are available for two points in time for a sample of treated and untreated units, where the numbers of treated and untreated are preferably approximately balanced. Since our data fit this description, we use the DD as our central estimator. Other methods that we considered are DD identification with matched controls and a household fixed effects model. As we discuss in Section 4.7.1 the qualitative differences between our central estimates and these alternative estimates are minimal. A summary of the various estimation results is provided in Annex XVIII.
The DD estimator requires the assumption of a common trend for treatment and control units: the parameter estimated is the treatment-control difference of the differences for each of these groups over time. In a regression framework, we control for two types of fixed effects: (1) fixed treatment group effects, to control for all time-invariant observed and unobserved factors that correlate with membership of the treatment group; and (2) fixed time effects, so effects that are common to both treatment and control groups at one particular point in time, or “common trends”. In our case, the disease trend in cassava production regressions is a good example.
147
As detailed in the next section with descriptive evidence and consistent with the programme descriptions in the previous section, our main treatment indicator is household self-reported participation in any ISFM training. We cannot use a village level treatment indicator because nearly all villages in our sample have received some form of training support. In other words, there is no control group in terms of village level treatment; therefore, these groups need to be defined at the household level.
Moreover, the analysis does not focus exclusively on CATALIST-2 (IBAKWE) interventions, because of the relatively low percentage of sample households that participated in these. Based on IBAKWE programme data only 16 percent of households in our sample live in villages where IBAKWE trained farmers between baseline and endline,52 and about 8 percent of the full sample participated in these trainings. However, we find that 49 percent of households have taken part in some ISFM training; that is, a training that could have been organised by IBAKWE, the (local) government or by another NGO. Based on program descriptions by several implementers all these trainings have the farmer field school format, but may differ in details; see also the discussion in 4.3.3.
We provide the IBAKWE specific regression equation below and in Section 4.6.8 discuss specific IBAKWE results if they are different. The empirical focus of this chapter is therefore on generic “CATALIST-2 type” ISFM or business training interventions, even if it is not strictly a CATALIST-2 labelled intervention. We also present tests of possible interaction effects between ISFM training and specific CATALIST-2 elements such as business training.
The treatment indicator is also delineated in time: treatment group households are those that have participated in (ISFM or business) training in the last 24 months before the endline survey, i.e. between April 2014 and March 2016. This means that the impact regressions will pick up effects that occur within two years of the intervention. A possible concern is that some households have participated in trainings before April 2014. This would be especially problematic if a) effects are long-term so affecting the endline outcomes and b) these pre-baseline treatments were concentrated in our control households. If a and b hold, we would run the risk of underestimating treatment effects. We find that 42 percent of the study population received this “pre-baseline” treatment. However, this early treatment group is divided equally over our 2014-16 treatment group: 49 percent of this group is “treatment” in our analysis and 51 percent control. In other words, our treatment and control groups are balanced in this regard.
A general issue with DD identification is that any differences in trends between the treatment and control groups, that occur at the same time as the intervention, are attributed to that intervention. If there are other unobservable factors that affect the difference in trends between the two groups, then the estimation will be biased. A particular concern here is the cassava disease environment. For example, if there are characteristics of the cassava disease that make, say, the control group on average more vulnerable to it, this has the potential to bias the impact estimate upward as we assume a parallel trend in the absence of the treatment. However, this is only the case if a) the disease vulnerability is not observed and b) the differential vulnerability is unrelated to treatment.
52 Note that IBAKWE is active in 30 out of the 67 sampled cells, but they did not organize trainings in all the villages within these cells.
148

The argument here is that both conditions are not met and that the parallel trend assumption is thus not invalidated. First, the disease environment is an observable (as farmers report to what degree their (cassava) crops are affected by diseases) and the information is used in the production impact regressions. Second, even if there is a disadvantage to being in the control group on account of the cassava diseases, it can be argued that this should be attributed to the intervention as improved varieties are distributed as part of the programme. We test this separately and do not find a difference in the treatment effect estimate; therefore we retain the disease indicator in the production regressions (section 4.6.2).
For all our outcome variables of interest we estimate the following equation:
Outcomeijt= α + β1 * Time(2016)t * T-Groupi + β2 * T-Groupi + β3* Time(2016) (1)
+ δ1* Xijt + δ2* Zjt + ηjt + εijt
where Outcome is the outcome of interest for household i in village j at time t. T-Group is a dummy constant which equals one if the household is part of the intervention group. Time is a dummy that is equal to one for 2016, i.e. after the intervention took place, and zero for 2014, before the intervention took place. X and Z represent time-variant household and community characteristics. η and ε are idiosyncratic error terms at the village and household level.
The parameter of primary interest is β1 measuring the impact of participation on the outcome variable of interest. Parameter β2 is not an impact parameter. It is a constant which measures the mean difference between treated and untreated households; it reflects any time-invariant unobserved differences between treated and untreated households that would confound the estimate of β1 if not accounted for. Parameter β3 is a time trend and filters out any “macro” changes over time that affect both the treatment and the control group.
Equation (1) shows that the difference-in-differences parameter β1 measures the impact of the programme after controlling for unobservables that determine both participation and the outcome; after controlling for changes over time that are unrelated to the treatment; and after controlling for household and village level observables that determine the outcome and may be correlated with participation.
To study any differential impact of IBAKWE interventions next to generic type ISFM trainings, we estimate
Outcomeijt= α + β1 * Time(2016)t * T-Groupi + β2 * T-Groupi + β3* Time(2016) (2)
+ γ1* IB*Time(2016)t * T-Groupi + γ2* IB * T-Groupi + γ3* IB* Time(2016)
+ γ4* IB + δ1* Xijt + δ2* Zjt + ηjt + εijt
In this equation we have added the indicator variable IB which is a village level indicator of IBAKWE activities having taken place there in the study period. For example, the interaction IB*T-Group is a household level variable indicating the household participated in an ISFM training in an IBAKWE village.
149

In effect, two different treatments are specified in (2), generic ISFM training and IBAKWE ISFM training, in a DD equation.
The coefficient of interest here is γ1, the IBAKWE training treatment indicator. We note that the control group is formed by the group that is not represented by any of the indicators in the equation, which is formed by non-treated households in non-IBAKWE villages.
Lastly, a caveat about multiple hypothesis testing is in order. The Rwanda food security causal chain is long and complex. Each part of the chain tests whether program participation had an effect on a large set of outcomes. For example, in Section 4.6.1, the impact of the program on twenty-two ISFM adoption indicators is tested. This series of regressions can be seen as testing a family of related hypotheses on the treatment effect on ISFM adoption. We caution that in the context of multiple hypothesis testing the standard p-values for individual impact estimates are suggesting more significant findings than when adjustment is made for family-wise hypothesis testing. This is especially true when there is a large set of tested outcomes that are closely correlated, say different aspects of ISFM adoption, while only few of them have a significant coefficient estimate.53 We do not make these adjustments formally, as this is not (yet) standard practice in the literature. However, in Section 4.6 we mention the fact that many regressions do not show a significant impact on a particular outcome in the causal chain; and that most of these results are omitted while we select a few significant effects for presentation. We thus remind readers that a selective set of results is presented and that the many “unsuccessful trials” should not be forgotten. We provide a summary list of all the outcomes tested in Annex XIX.
4.4.3 Sampling and data collection
The baseline sample consists of 804 households in 67 cells sampled from seven districts in Southern Rwanda, located in the agro-cultural zones with relatively high shares of farmers growing cassava. The seven sample districts include the five CATALIST-2 programme districts (Gisagara, Kamonyi, Muhanga, Nyanza and Ruhango) and a control district in the Southern province (Huye). The five programme districts constitute the so-called CATALIST-2 cassava mega-cluster in the Southern province.
Between baseline and endline, the CATALIST-2/IBAKWE programme had been active (e.g. organised trainings, established demoplots or set up agrodealers) in 30 cells or 44.8 percent of all cells according to program data received from IBAKWE. Additionally, within these cells, IBAKWE did not organize trainings in every village and not all households in each village participated. Only 16.1 percent of the households in our sample live in villages where IBAKWE organized ISFM trainings between baseline and endline, and – as reported in the previous section – only 7.80 percent of our sample have participated during this period.
53 A small but growing literature (Anderson, 2008; Aker et al., 2012) argues that if outcomes A and B are correlated, the failure to find a significant impact for outcome A is informative for and should lower the significance of the impact estimate for outcome B. Since this is not yet standard practice, the reported standard errors and significance levels in this report have not been adjusted. Preliminary calculations are available on request and show that the adjusted p-values on the treatment coefficients are larger than 0.11 for all ISFM outcome variables.
150
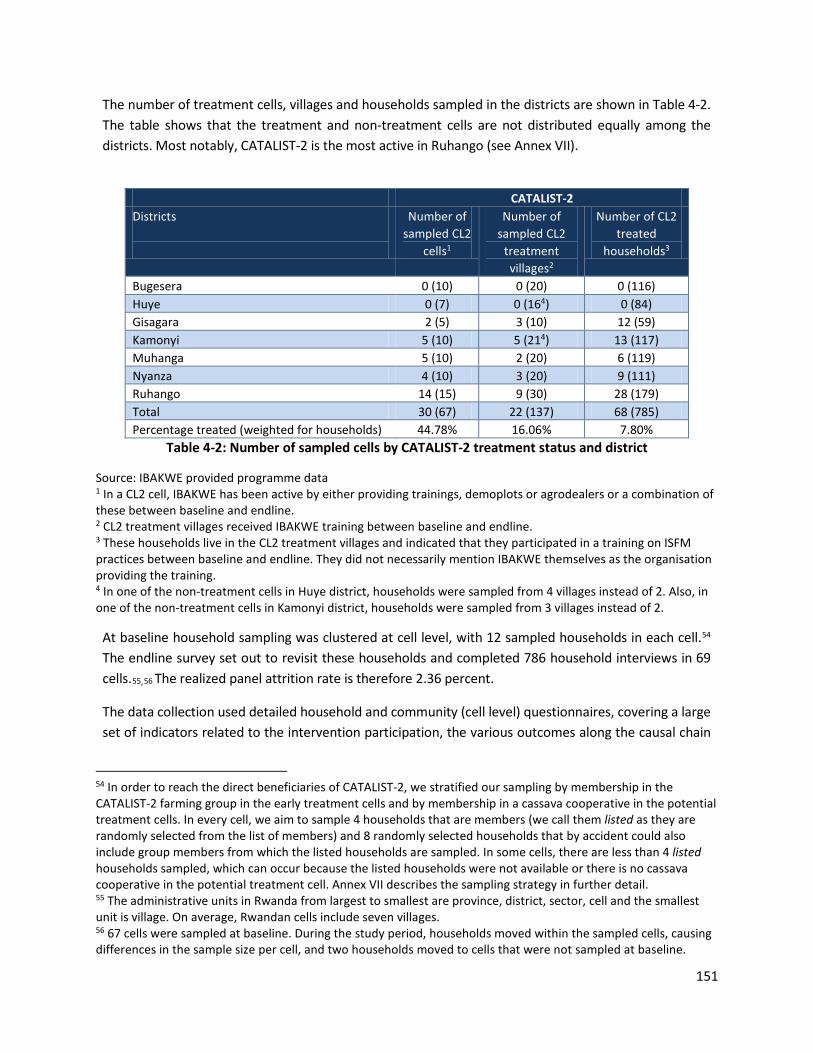
The number of treatment cells, villages and households sampled in the districts are shown in Table 4-2. The table shows that the treatment and non-treatment cells are not distributed equally among the districts. Most notably, CATALIST-2 is the most active in Ruhango (see Annex VII).
CATALIST-2 Districts
Number of sampled CL2
cells1
Number of sampled CL2
treatment villages2
Number of CL2 treated
households3
Bugesera 0 (10) 0 (20) 0 (116) Huye 0 (7) 0 (164) 0 (84) Gisagara 2 (5) 3 (10) 12 (59) Kamonyi 5 (10) 5 (214) 13 (117) Muhanga 5 (10) 2 (20) 6 (119) Nyanza 4 (10) 3 (20) 9 (111) Ruhango 14 (15) 9 (30) 28 (179) Total 30 (67) 22 (137) 68 (785) Percentage treated (weighted for households) 44.78% 16.06% 7.80%
Table 4-2: Number of sampled cells by CATALIST-2 treatment status and district
Source: IBAKWE provided programme data 1 In a CL2 cell, IBAKWE has been active by either providing trainings, demoplots or agrodealers or a combination of these between baseline and endline. 2 CL2 treatment villages received IBAKWE training between baseline and endline. 3 These households live in the CL2 treatment villages and indicated that they participated in a training on ISFM practices between baseline and endline. They did not necessarily mention IBAKWE themselves as the organisation providing the training. 4 In one of the non-treatment cells in Huye district, households were sampled from 4 villages instead of 2. Also, in one of the non-treatment cells in Kamonyi district, households were sampled from 3 villages instead of 2.
At baseline household sampling was clustered at cell level, with 12 sampled households in each cell.54 The endline survey set out to revisit these households and completed 786 household interviews in 69 cells.55,56 The realized panel attrition rate is therefore 2.36 percent.
The data collection used detailed household and community (cell level) questionnaires, covering a large set of indicators related to the intervention participation, the various outcomes along the causal chain
54 In order to reach the direct beneficiaries of CATALIST-2, we stratified our sampling by membership in the CATALIST-2 farming group in the early treatment cells and by membership in a cassava cooperative in the potential treatment cells. In every cell, we aim to sample 4 households that are members (we call them listed as they are randomly selected from the list of members) and 8 randomly selected households that by accident could also include group members from which the listed households are sampled. In some cells, there are less than 4 listed households sampled, which can occur because the listed households were not available or there is no cassava cooperative in the potential treatment cell. Annex VII describes the sampling strategy in further detail. 55 The administrative units in Rwanda from largest to smallest are province, district, sector, cell and the smallest unit is village. On average, Rwandan cells include seven villages. 56 67 cells were sampled at baseline. During the study period, households moved within the sampled cells, causing differences in the sample size per cell, and two households moved to cells that were not sampled at baseline.
151
in the programme logic as well as control variables. The questionnaires for the quantitative survey are available in Annex III of this report, while the qualitative data collection plans for the endline period are discussed in Annex II.
In each of the cells, at least one household has participated in some training on ISFM practices (either from CATALIST-2 or other program). Therefore, the impact of the treatment is only analysed on the individual level. As mentioned in section 4.4.2, the share of households in the treatment group, defined as having participated in at least one ISFM training between baseline and endline, is 49.2 percent.
Because of the focus of the study, only cassava farmers were sampled at baseline. However, due to the cassava disease outbreak, 25.3 percent of the sampled cassava farmers stopped cultivating cassava between 2014 and 2015 and another 18.2 percent has indicated that they stopped cultivating cassava after their harvest between 2015 and 2016. In all sampled cells we sampled only households that grow cassava and their total cultivated land size does not exceed 2 ha. Despite the stated focus of CATALIST-2 on middle sized farmers with landholdings of 0.5 – 2 ha, we did not include a lower bound on the size of land holdings because in reality we observe a lot of small sized farmers participating in the programme. Small sized farmers are also important for the evaluation from the perspective of food security.
4.4.4 Sampling weights
As mentioned above, we stratified the sampling within the cells by listed and randomly selected households. In order to make the results representative at the cell level for cassava growing households that cultivate less than 2 hectares of land, we need to weight the observations because the listed households have a far higher probability of being included in the sample than random sampling would imply. Therefore, within each cell we calculate sampling weights for the listed and randomly drawn households so that each sampled household in the cell has the same weighted probability of being included in the sample.
Ideally, the probability of being included in the sample for the listed and randomly drawn households in each cell is the following:
𝑝𝑝(𝑙𝑙𝑙𝑙𝑙𝑙𝑙𝑙𝑙𝑙𝑙𝑙) =4
#𝑙𝑙𝑙𝑙𝑙𝑙𝑙𝑙𝑙𝑙𝑙𝑙 ℎ𝑜𝑜𝑜𝑜𝑙𝑙𝑙𝑙ℎ𝑜𝑜𝑙𝑙𝑙𝑙𝑙𝑙
𝑝𝑝(𝑟𝑟𝑟𝑟𝑟𝑟𝑙𝑙𝑜𝑜𝑟𝑟) =8
# ℎ𝑜𝑜𝑜𝑜𝑙𝑙𝑙𝑙ℎ𝑜𝑜𝑙𝑙𝑙𝑙𝑙𝑙 𝑙𝑙𝑟𝑟 𝑙𝑙ℎ𝑙𝑙 𝑣𝑣𝑙𝑙𝑙𝑙𝑙𝑙𝑟𝑟𝑣𝑣𝑙𝑙𝑙𝑙 𝑓𝑓𝑟𝑟𝑜𝑜𝑟𝑟 𝑤𝑤ℎ𝑙𝑙𝑖𝑖ℎ 𝑙𝑙ℎ𝑙𝑙 𝑙𝑙𝑙𝑙𝑙𝑙𝑙𝑙 ℎ𝑟𝑟𝑙𝑙 𝑟𝑟𝑙𝑙𝑟𝑟𝑚𝑚𝑙𝑙𝑟𝑟𝑙𝑙
In p(listed), 4 in the numerator stands for the number of households sampled in this group. It may happen that the number of households on the membership list is less than 4, in which case each sampled household has a 100% probability of being included in the sample (p(listed)=1).
In p(random), 8 in the numerator stands for the number of households sampled in this group. In the denominator we take the number of households in all the villages in the cell where the farmer leader group/cooperative (from which we sample the listed households from) has at least one member. This is
152
a simplification in the calculation on at least two grounds: firstly, we assume that these villages are representative of the cell; and secondly, we do not exclude ineligible households (with no cultivated land or with cultivated land above 2 ha) from the number of households because we have no information on it.
The sampling weight is calculated as the inverse of the sampling probability normalized at the cell level. The normalization occurs in order to give each cell equal weight in the sample (the sum of the weight in any cell is 12, the number of sampled households in the cell). Note that this implies that in a cell where there are no listed households sampled (only random sample) each household receives a weight of one.
Looking further, it may be desirable to apply sampling weights to the cells as well, so that we have a representative sample. We have considered this option, however, given that the CATALIST-2 project area is not representative of the districts, i.e.: CATALIST-2 works with cells where the productivity of cassava is high, we are not able to construct representative sampling weights for the CATALIST-2 and comparison cells in the sample. Therefore, readers should be aware that the results are not representative of the districts where CATALIST-2 is active, but only of the CATALIST-2 project area.
4.5 Descriptives 4.5.1 Community and household characteristics
The tables below present on cells (communities consisting of a few villages) and households in the sample at endline.
Table 4-3 shows that on average there are 1241 households in a cell. According to the cell leaders, most of the households in the cells are small landholders with landholdings between 0.01-0.5 ha (56%) and 84.85 percent of the households cultivate cassava.
Considering the facilities in the cells, almost all cells have a feeder road going through and have mobile network coverage. On average there is 1.5 cooperative in a cell and an agrodealer is situated in 64.18 percent of the cells. There is a bank in 11.94 percent of the cells and a micro-credit institution in 19.4 percent of the cells, which shows that there are limits to formal types of credit supply for farmers.
153

All cells N=67
Mean
Number Of Households In Cell 1,241.284 (49.107) Landless Households In Cell (fraction) 0.066 (0.011) Households In Cell With Landholdings Between 0.01-0.5 ha (fraction)
0.560
(0.0249) Households In Cell With Landholdings Between 0.51-2 ha (fraction)
0.339
(0.02.44) Households In Cell With Landholdings Larger than 2 ha (fraction)
0.035
(0.007) Households in Cell Cultivating Cassava (fraction) 0.848 (0.026) Dum. Feeder Road Going Through Cell 0.985 (0.015) Dum. Bank In Cell 0.119 (0.040) Dum. Micro-Credit Institution In Cell 0.194 (0.049) Dum. Agro-Input Dealer In Cell 0.642 (0.059) Number Of Cooperatives In Cell 0.015 (0.001) Dum. Mobile Network Coverage In Cell 0.985 (0.015) Note: Standard errors in parentheses
Table 4-3: Cell Demographics
The household characteristics are presented in Table 4-4. The columns in the table show the weighted average, the standard error in parentheses and the sample size in square brackets. The weighted average of the total sample is shown in the first column labelled “Full sample (2016)”. Then the sample is divided by treatment in column 2 (Non-treated) and column 3 (Treated). Column 4 displays the p-values for the differences between the weighted averages of the indicators for treated and non-treated (P).
The households in the sample have 5.4 household members on average and 53.8 percent has a child between 12 and 95 months in the household. The household head is 49 years old on average, with 27.2 percent of the households being run by a female. Most household heads have at least some primary education and 71.1 percent of them have the skills to read and write. Finally, the average total plot size is 0.545 ha.
The table shows that all characteristic indicators are significantly different between the treatment groups at endline (where treatment is defined as having participated in ISFM training in the study period, between baseline and endline). The treatment households are larger, less likely to be run by a female,
154
the household heads have a higher education level and the treatment households have more land.57 Such differences in between treatment and control group mean household characteristics are to be expected when there is selection into treatment. Selection effects should not be misinterpreted as treatment effects and are controlled for through the dummy variable for treatment group (see section 4.4.2). This treatment group indicator will capture any (un)observed differences related to treatment status.
57 The differences between treatment and non-treatment are smaller for the food insecure subsample. Tables are available on request.
155

(1) (2) (3) (4)
Full sample (2016) Non-treated Treated (P)
Number of People Living in Household 5.383 5.181 5.625 0.003*** (0.087) (0.095) (0.133) [786.000] [402.000] [384.000] Adult Equivalent Household Size 4.218 4.021 4.454 0.001*** (0.071) (0.079) (0.110) [786.000] [402.000] [384.000] (1701) Dum Children (12-95 months) 0.538 0.505 0.578 0.073* (0.022) (0.028) (0.032) [785.000] [401.000] [384.000] Dum. Female Household Head 0.272 0.314 0.222 0.005*** (0.020) (0.026) (0.025) [786.000] [402.000] [384.000] Age Household Head 49.015 50.388 47.400 0.004*** (0.560) (0.775) (0.713) [764.000] [387.000] [377.000] Dum. HHhead No School 0.228 0.254 0.196 0.094* (0.017) (0.024) (0.023) [786.000] [402.000] [384.000] Dum. HHhead Some Primary 0.369 0.400 0.331 0.059* (0.018) (0.025) (0.026) [786.000] [402.000] [384.000] Dum. HHhead Completed Primary 0.304 0.257 0.359 0.006*** (0.019) (0.024) (0.027) [786.000] [402.000] [384.000] Dum. HHhead At Least Some Secondary 0.076 0.059 0.098 0.049** (0.010) (0.013) (0.015) [786.000] [402.000] [384.000] Dum. Household Head Can Read & Write 0.711 0.665 0.765 0.002*** (0.019) (0.021) (0.026) [786.000] [402.000] [384.000] Sum of Plot Area in Hectares 0.545 0.468 0.637 0.003*** (0.036) (0.037) (0.051) [786.000] [402.000] [384.000] Note: Standard errors in parentheses, sample size in brackets, * p < .10, ** p < .05, *** p < .01
Table 4-4: Household characteristics
IBAKWE provided us with data on the villages in which they organize trainings. Assuming that all participants in those villages joined the IBAKWE trainings, the IBAKWE participants are not significantly different from the non-participants in terms of the characteristics of Table 4-4, except for a marginally larger household size.
156

4.5.2 Programme exposure
The main interventions of the CATALIST-2 are two types of farmer trainings: (1) Integrated Soil Fertility Management ISFM and (2) Business and Financial planning. We will refer to these as ISFM and BF trainings.
Table 4-5 provides the self-reported farmer participation rates in these trainings during the study period in the sample. An important finding is that 49.21 percent of farmers in the study area participated in ISFM training. This means that, as far as the main ISFM training treatment is concerned, the study sampling plan was successful in producing an ex-post treated group of close to 50 percent of the full endline sample. This allows for a comparison of changes over time in the relevant outcomes between treated and untreated households.
157
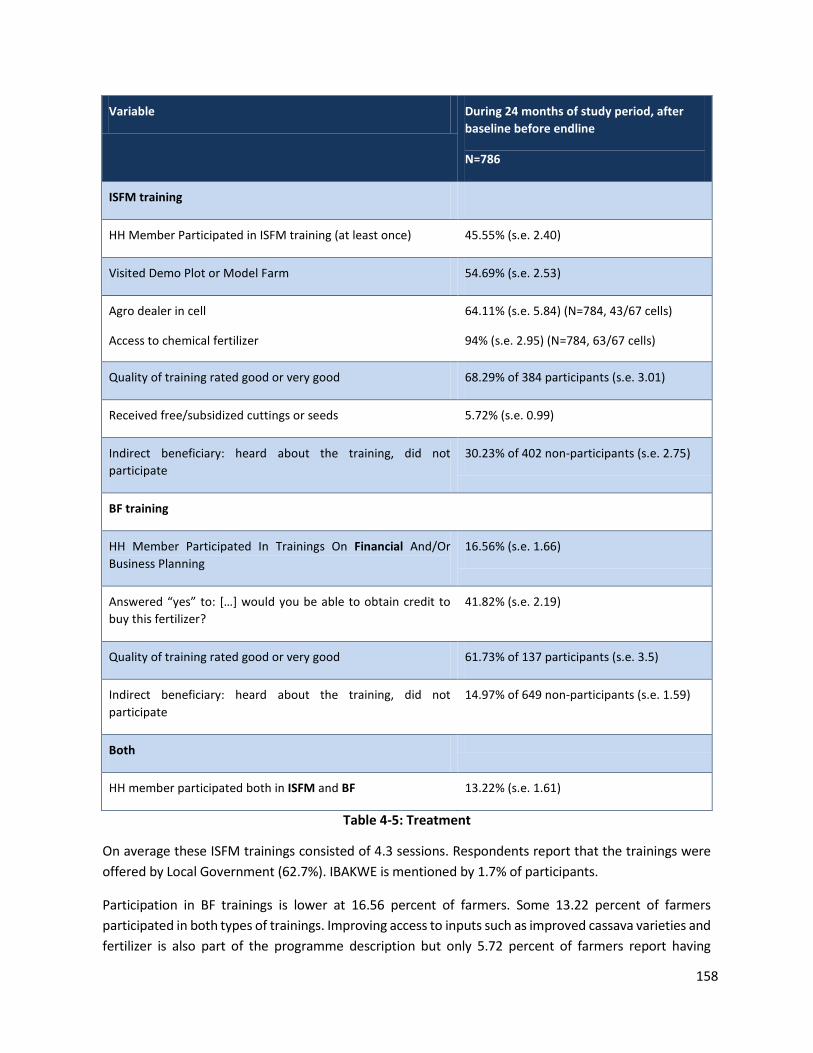
Variable During 24 months of study period, after baseline before endline
N=786
ISFM training
HH Member Participated in ISFM training (at least once) 45.55% (s.e. 2.40)
Visited Demo Plot or Model Farm 54.69% (s.e. 2.53)
Agro dealer in cell
Access to chemical fertilizer
64.11% (s.e. 5.84) (N=784, 43/67 cells)
94% (s.e. 2.95) (N=784, 63/67 cells)
Quality of training rated good or very good 68.29% of 384 participants (s.e. 3.01)
Received free/subsidized cuttings or seeds 5.72% (s.e. 0.99)
Indirect beneficiary: heard about the training, did not participate
30.23% of 402 non-participants (s.e. 2.75)
BF training
HH Member Participated In Trainings On Financial And/Or Business Planning
16.56% (s.e. 1.66)
Answered “yes” to: […] would you be able to obtain credit to buy this fertilizer?
41.82% (s.e. 2.19)
Quality of training rated good or very good 61.73% of 137 participants (s.e. 3.5)
Indirect beneficiary: heard about the training, did not participate
14.97% of 649 non-participants (s.e. 1.59)
Both
HH member participated both in ISFM and BF 13.22% (s.e. 1.61)
Table 4-5: Treatment
On average these ISFM trainings consisted of 4.3 sessions. Respondents report that the trainings were offered by Local Government (62.7%). IBAKWE is mentioned by 1.7% of participants.
Participation in BF trainings is lower at 16.56 percent of farmers. Some 13.22 percent of farmers participated in both types of trainings. Improving access to inputs such as improved cassava varieties and fertilizer is also part of the programme description but only 5.72 percent of farmers report having
158
received seeds or cassava cuttings for free or at reduced price.
Table 4-5 provides some additional information on the intervention “environment”, particularly about access to agricultural inputs and credit. These are seen as complements to the trainings in the programme logic. Fertilizer is “accessible” by almost all farmers, but credit is not. More than 60 percent of the trainees consider the training quality to be good or very good, both for ISFM and BF.
Table 4-6 provides an overview of the receipt of subsidized inputs as reported by farmers in our sample, at baseline and endline. This shows that input subsidies are rare. The most common type of input subsidy received by the farmers is in the form of improved cuttings/seeds, which close to 10 percent of farmers have at baseline. All the other inputs subsidy types are received by very small fractions of respondents only.
159
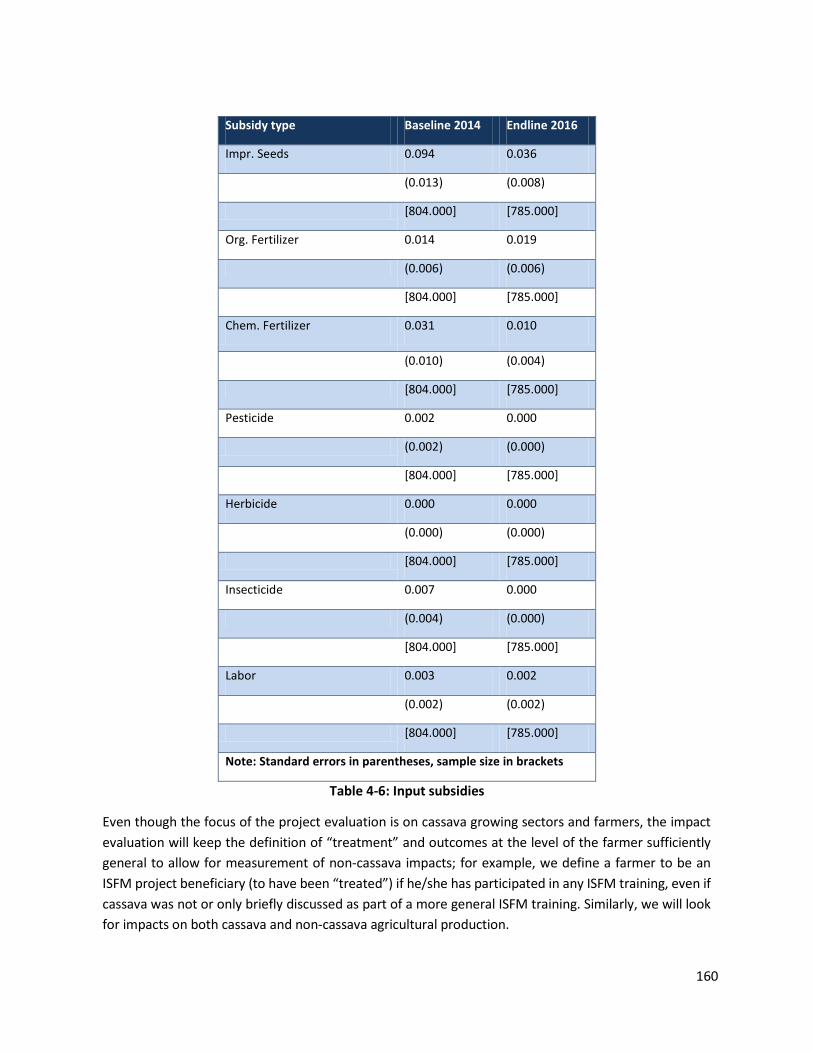
Subsidy type Baseline 2014 Endline 2016
Impr. Seeds 0.094 0.036
(0.013) (0.008)
[804.000] [785.000]
Org. Fertilizer 0.014 0.019
(0.006) (0.006)
[804.000] [785.000]
Chem. Fertilizer 0.031 0.010
(0.010) (0.004)
[804.000] [785.000]
Pesticide 0.002 0.000
(0.002) (0.000)
[804.000] [785.000]
Herbicide 0.000 0.000
(0.000) (0.000)
[804.000] [785.000]
Insecticide 0.007 0.000
(0.004) (0.000)
[804.000] [785.000]
Labor 0.003 0.002
(0.002) (0.002)
[804.000] [785.000]
Note: Standard errors in parentheses, sample size in brackets
Table 4-6: Input subsidies
Even though the focus of the project evaluation is on cassava growing sectors and farmers, the impact evaluation will keep the definition of “treatment” and outcomes at the level of the farmer sufficiently general to allow for measurement of non-cassava impacts; for example, we define a farmer to be an ISFM project beneficiary (to have been “treated”) if he/she has participated in any ISFM training, even if cassava was not or only briefly discussed as part of a more general ISFM training. Similarly, we will look for impacts on both cassava and non-cassava agricultural production.
160

This approach is informed by data on land use in our sample. As summarized in Table 4-7 it is clear that while cassava is an important crop in our study sample, most farmers grow other crops besides it. In fact, more households cultivate beans than cassava and on average farmers allocate slightly more land to beans than to cassava (despite the fact that the study purposively sampled cassava farmers). These findings are consistent with generic ISFM training as the treatment (programme participation) variable of interest.
(Cassava) (Beans) (Sorghum) (Maize) (Soybeans)
Cultivate (share of hh) 0.70 0.83 0.20 0.22 0.17 (0.03) (0.02) (0.03) (0.02) (0.02) Largest Land Use (share of hh)
0.57 0.27 0.03 0.03 0.02
(0.03) (0.02) (0.01) (0.01) (0.01) Land use (share land) 0.41 0.45 0.09 0.08 0.05 (0.03) (0.02) (0.01) (0.01) (0.01) Note: Standard errors in parentheses
Table 4-7: Crops cultivated
4.5.3 Selection into treatment
The selection of areas, villages and individual farmers into training is not random. The higher level selection of treatment villages is driven by the cluster NGOs (IBAKWE), but the village level treatment allocation reportedly also has a “snowball” element, where neighbouring villagers become enthusiastic and invite the programme officers. Once the programme officers are in contact with a farmer group in a village, individual farmers select themselves into treatment or decline the invitation. Since the trainings typically take several sessions, farmers can also participate in a few sessions of the training only. Table 4-8 shows results of a regression of training participation, our primary treatment indicator, and a number of household characteristics at baseline58,59. We find that the likelihood of participating is positively correlated with membership of a farmer cooperative.
58 The distance from the household to the farmer cooperative was calculated using GPS data. 59 The asset index was constructed using ownership of radio, mobile phone, watch, bicycle, scooter or car. The weights for the items was determined based on principal component analysis of the DHS 2010 survey. Hence, the results are comparable to a representative sample of the Southern province in 2010. We find that households on average are somewhat better off in terms of ownership of the above mentioned assets compared to DHS 2010 (asset index score of 0.457 in DHS).
161

(1) Treatment Sum of Plot Area in Hectares 0.028 (0.040) Asset Index 0.068 (0.042) Dum. Female Household Head -0.060 (0.047) Dummy Primary School Graduate 0.033 (0.044) Member of a Cooperative 0.182***
(0.042) Distance in km to cooperative/farmer leader (only at endline) -0.003 (0.005) Age Household Head -0.003* (0.001) Constant 0.461*** (0.078) Region Controls Yes N 764 r2 0.085 ymean 0.456 Note: Standard errors in parentheses, * p < .10, ** p < .05, *** p < .01
Table 4-8: Treatment selection
A regression of cooperative membership (results not presented here) shows a strong association with assets and household size. We conclude that cooperative members are relatively well off, with large family sizes and many assets. They are also more likely to participate in the trainings offered by CATALIST-2 (and similar programmes).
Using the above model an ISFM training treatment probability score can be calculated for each household, using the observables in the model. The predicted treatment probabilities are presented in Figure 4-3, separating treatment and control group. Not surprisingly, the graph shows that a large share of observations for the treatment group is located on the right hand side, with a relatively high treatment probability. Nevertheless, the graph shows that most of the households are on the so-called common support, that is, the treatment probability interval defined by the minimum score of the treatment group and the maximum score of the control group.
162
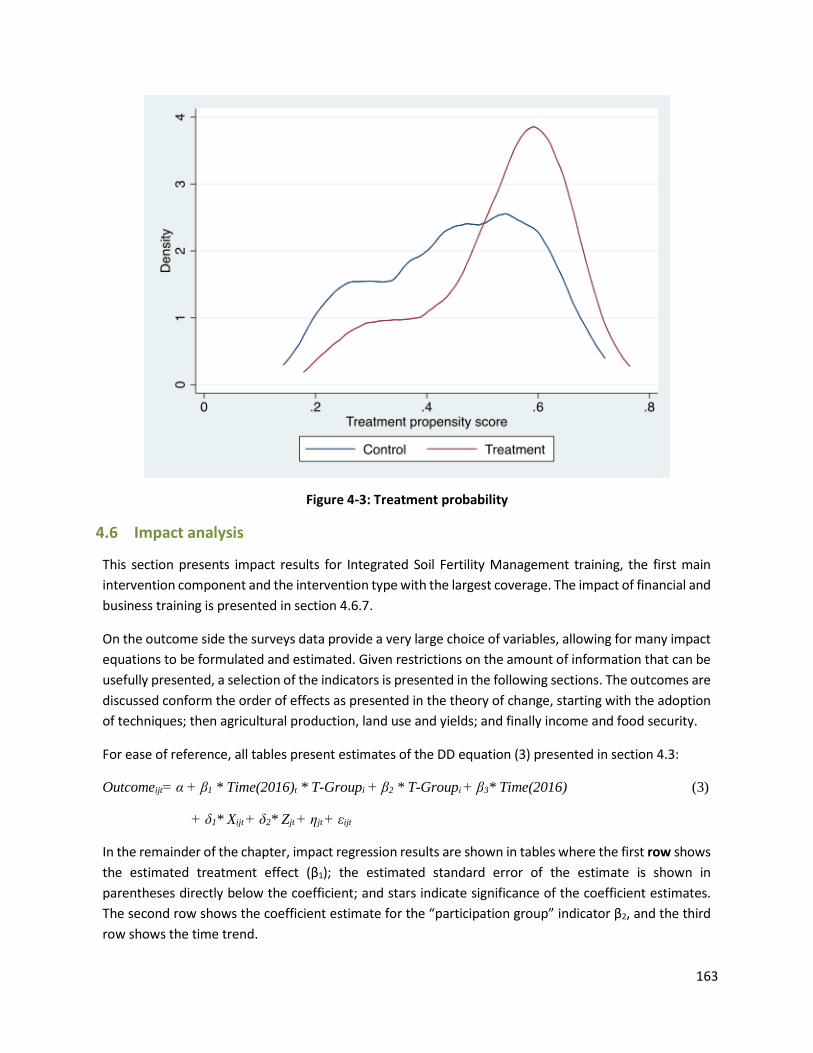
Figure 4-3: Treatment probability
4.6 Impact analysis
This section presents impact results for Integrated Soil Fertility Management training, the first main intervention component and the intervention type with the largest coverage. The impact of financial and business training is presented in section 4.6.7.
On the outcome side the surveys data provide a very large choice of variables, allowing for many impact equations to be formulated and estimated. Given restrictions on the amount of information that can be usefully presented, a selection of the indicators is presented in the following sections. The outcomes are discussed conform the order of effects as presented in the theory of change, starting with the adoption of techniques; then agricultural production, land use and yields; and finally income and food security.
For ease of reference, all tables present estimates of the DD equation (3) presented in section 4.3:
Outcomeijt= α + β1 * Time(2016)t * T-Groupi + β2 * T-Groupi + β3* Time(2016) (3)
+ δ1* Xijt + δ2* Zjt + ηjt + εijt
In the remainder of the chapter, impact regression results are shown in tables where the first row shows the estimated treatment effect (β1); the estimated standard error of the estimate is shown in parentheses directly below the coefficient; and stars indicate significance of the coefficient estimates. The second row shows the coefficient estimate for the “participation group” indicator β2, and the third row shows the time trend.
163
All regressions include total plot size, cooperative membership, wealth, gender, age, education, household shocks, distance from village to agrodealer and district dummies as covariates (see the regression table footnotes; full results are available on request). Several specifications with varying sets of covariates and geographic dummy variables have been tried and typically the differences in estimates are very small. Note that we present alternative econometric specifications at the end of this section, including versions with propensity score matching to select control households and others with household fixed effects. We obtain impact results that are by and large qualitatively similar to the estimates of equation (1).
4.6.1 Adoption of ISFM farming practices
Question: Have cassava growing farmers adopted ISFM farming practices (use of fertilizers and soil management) as a result of the CATALIST-2 programme?
The survey provides a set of 22 ISFM adoption outcome variables60. Table 4-9 gives a description of ISFM use in 2014 based on the mean values of five of these indicators: the use of soil protection, crop rotation, fertilizer and improved seeds and cuttings for cassava. Almost all households used soil protection and 80 percent used crop rotation. Looking at cassava specific ISFM practices, only 3 percent of households apply chemical fertilizer to their cassava and 52 percent of household apply organic fertilizer61. In addition, the uptake of improved cassava cuttings was limited to 23 percent.
60 These include the adoption of soil protection measures, crop rotation, application of chemical or organic fertilizer (in general or for cassava), application of improved cuttings/seeds, adoption indicators with respect to different types of improved cassava cuttings. 61 For crops in general, 84 percent of households used organic fertilizer (see table 13 in Annex IV).
164

2014 Full sample
Control Treatment
Fraction HH that Used Any Soil Protection
0.981 0.977 0.986 (0.005) (0.008) (0.007)
[804] [420] [384] Fraction HH that Used Crop Rotation
0.797 0.760 0.843 (0.020) (0.027) (0.024)
[804] [420] [384] Fraction HH that Used Chemical Fertilizer For Cassava In Last 12 Months
0.028 0.024 0.033 (0.006) (0.007) (0.008)
[804] [420] [384] Fraction HH that Used Organic Fertilizer For Cassava In Last 12 Months
0.516 0.490 0.548 (0.026) (0.029) (0.036)
[804] [420] [384] Fraction HH that Used Improved Seeds & Cuttings For Cassava In Last 12 Months
0.224 0.213 0.238 (0.018) (0.020) (0.029)
[804] [420] [384]
Table 4-9: Use of ISFM practices in 2014
Table 4-10 provides estimates of the difference-in-differences equation (1) for three selected outcomes. The first column presents impact estimates for a composite index (the first principal component) of the full group of ISFM adoption variables. The treatment effect estimate is small and not precisely estimated (i.e. the standard error is relatively large), meaning we cannot differentiate it from a zero effect. In other words, we do not find a broad based impact that affects adoption measures as a group.
At the level of the individual ISFM adoption indicators we find a few significant programme impacts. In column 2, we find that use of chemical fertilizer for cassava increases significantly. The coefficient size is 0.042 or 131 percent of the mean use level (last row) of 0.032. This is a large impact and points to a success, as the increased use of fertilizer in cassava cultivation is one of the key goals of the CATALIST-2 programme in the study area, and of agricultural intensification or farmer field school programmes generally.
The programme impact for use of improved cuttings for cassava is also significant and large (66 percent of the mean use level, column 3).62 We also find a weakly significant positive effect on the use of improved seeds or cuttings in general (results not in table). The increased use of improved cuttings (seeds) is another first-order goal with a view to increased agricultural productivity. Therefore, this should also count as a success for the programme. There is an additional moderately significant positive association between adoption of improved cuttings and having experienced severe crop damage. This correlation remains if we interact the disease incidence variable with treatment (group), timetrend and their interaction. As expected, on average farmers who have experienced severe damage are more likely
62 A note on observation numbers in Table 4-9: the full panel has 1590 households so this is the maximum number of observations in any regression. In column 1 we lose 47 observations due to missing values in some of the covariates. In columns 2 and 3 we analyze the decision to use fertilizer and improved cuttings in cassava cultivation. However, at endline many households no longer grow cassava while these regressions only include the farmers that do grow cassava and thus have to make the decision.
165
to adopt improved varieties and the programme further strengthens this adoption.
Column 4 shows the DD regression results with a generic (not cassava specific) severe disease shock as the outcome. The result suggests that the programme resulted in less damage to the harvest of training participants. The previous regressions suggest that the mechanism is the higher use of improved varieties.
The problematic cassava disease environment does, however, raise problems for the general theory of change for FFS interventions. For example, complementary inputs such as chemical fertilizer are costly and will not be profitable under all production circumstances. The increased uptake of improved cuttings may also reflect both successful implementation as well as the urgent need for farmers to change to disease resistant cassava varieties. We will see in the next sub-section whether the programme also raises yields.
We conclude that the impact of the ISFM training programme on adoption of ISFM techniques is statistically significant and large for a few selected practices. However, it should be noted that the regressions leading to these significant findings are part of a series of twenty-two similar regressions, where the impact parameter estimate is significant in seven of these individual regressions. This series of regressions can be seen as testing a family of related hypotheses on the treatment effect on ISFM adoption and the caveats about precision of individual estimates in this setting apply (see the remarks at the end of Section 4.4.2.).
Interestingly, the second row, column 1, shows that there is a strong correlation between the composite ISFM index and programme participation. In other words, farmers that participate are also ISFM adopters, but this is not the result of the trainings observed during the study. This is consistent with the earlier observation that farmers that are already cooperative members and relatively wealthy are more likely to participate in the training. It appears that on average these farmers would also apply ISFM techniques without the CATALIST-2 trainings.
Column 3, row 3 is interesting because it shows that the trend in adoption of improved cassava cuttings is significantly negative. This “macro trend” is likely the result of the general insecurity about diseases in the cassava sector, steering farmers away from new cassava varieties. Seen against the backdrop of this negative trend it is particularly interesting to see that the programme succeeds in inducing participants to adopt improved cuttings.63
63 The positive adoption impact is especially noticeable for the imituburano cutting.
166
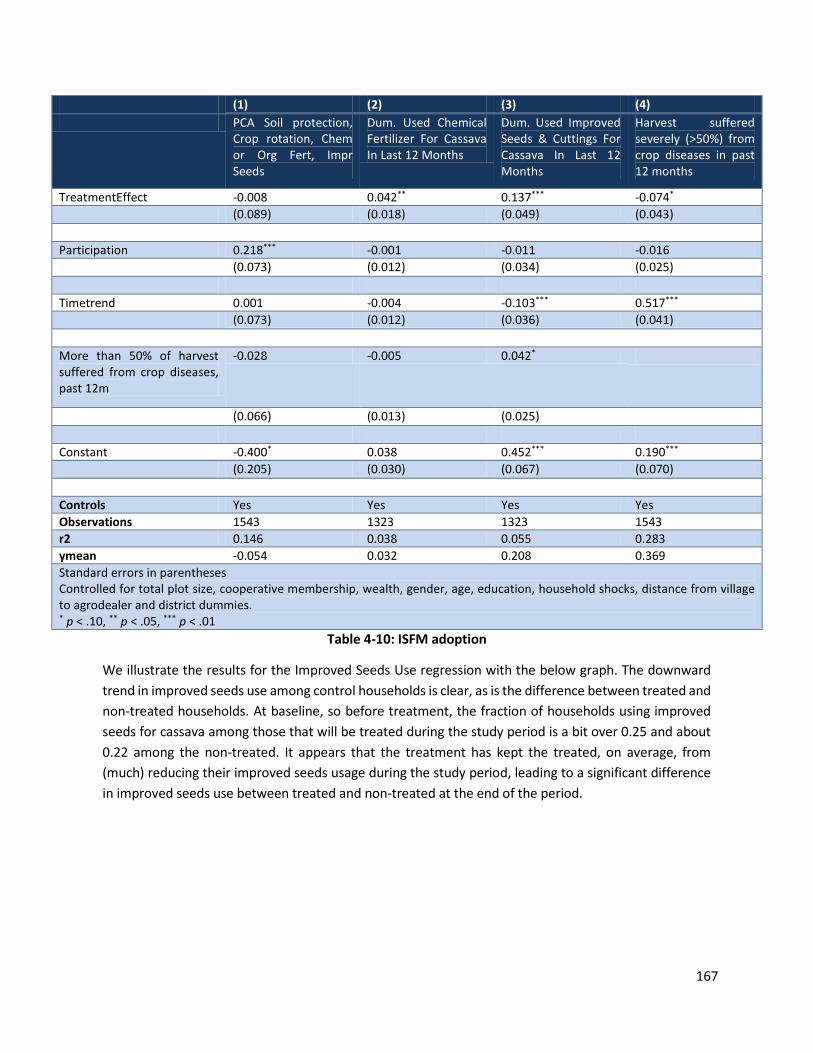
(1) (2) (3) (4) PCA Soil protection,
Crop rotation, Chem or Org Fert, Impr Seeds
Dum. Used Chemical Fertilizer For Cassava In Last 12 Months
Dum. Used Improved Seeds & Cuttings For Cassava In Last 12 Months
Harvest suffered severely (>50%) from crop diseases in past 12 months
TreatmentEffect -0.008 0.042** 0.137*** -0.074* (0.089) (0.018) (0.049) (0.043) Participation 0.218*** -0.001 -0.011 -0.016 (0.073) (0.012) (0.034) (0.025) Timetrend 0.001 -0.004 -0.103*** 0.517*** (0.073) (0.012) (0.036) (0.041) More than 50% of harvest suffered from crop diseases, past 12m
-0.028 -0.005 0.042*
(0.066) (0.013) (0.025) Constant -0.400* 0.038 0.452*** 0.190*** (0.205) (0.030) (0.067) (0.070) Controls Yes Yes Yes Yes Observations 1543 1323 1323 1543 r2 0.146 0.038 0.055 0.283 ymean -0.054 0.032 0.208 0.369 Standard errors in parentheses Controlled for total plot size, cooperative membership, wealth, gender, age, education, household shocks, distance from village to agrodealer and district dummies. * p < .10, ** p < .05, *** p < .01
Table 4-10: ISFM adoption
We illustrate the results for the Improved Seeds Use regression with the below graph. The downward trend in improved seeds use among control households is clear, as is the difference between treated and non-treated households. At baseline, so before treatment, the fraction of households using improved seeds for cassava among those that will be treated during the study period is a bit over 0.25 and about 0.22 among the non-treated. It appears that the treatment has kept the treated, on average, from (much) reducing their improved seeds usage during the study period, leading to a significant difference in improved seeds use between treated and non-treated at the end of the period.
167
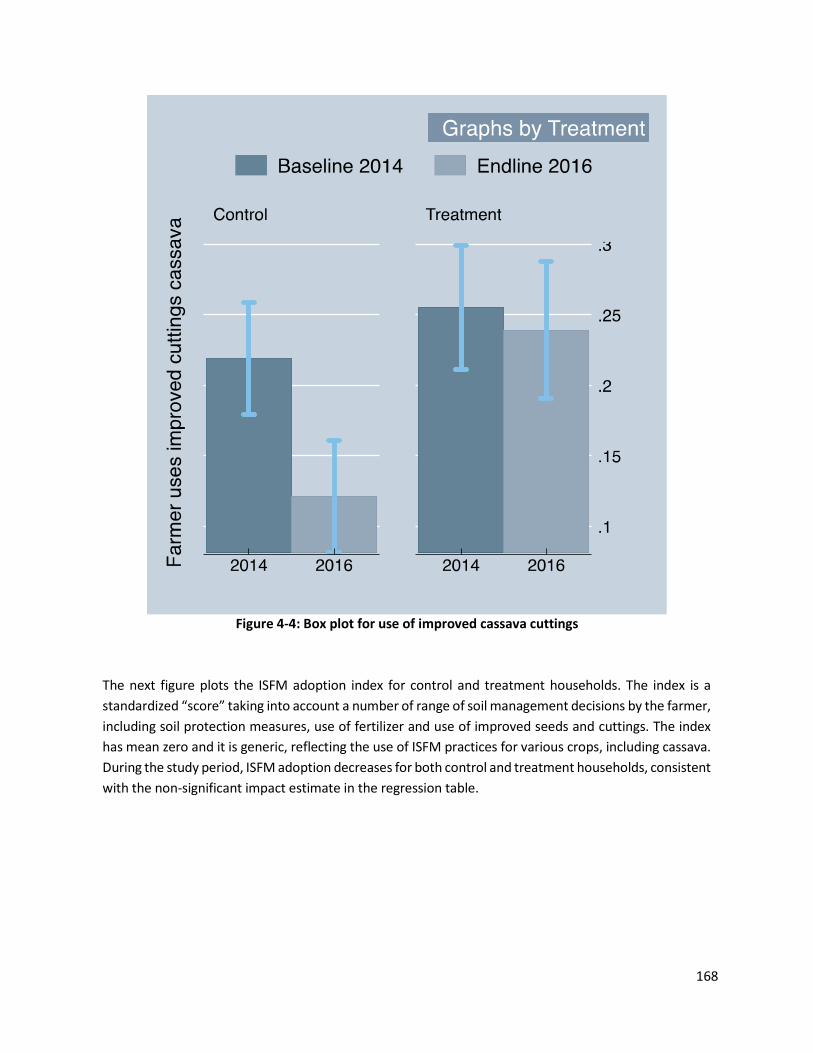
Figure 4-4: Box plot for use of improved cassava cuttings
The next figure plots the ISFM adoption index for control and treatment households. The index is a standardized “score” taking into account a number of range of soil management decisions by the farmer, including soil protection measures, use of fertilizer and use of improved seeds and cuttings. The index has mean zero and it is generic, reflecting the use of ISFM practices for various crops, including cassava. During the study period, ISFM adoption decreases for both control and treatment households, consistent with the non-significant impact estimate in the regression table.
168
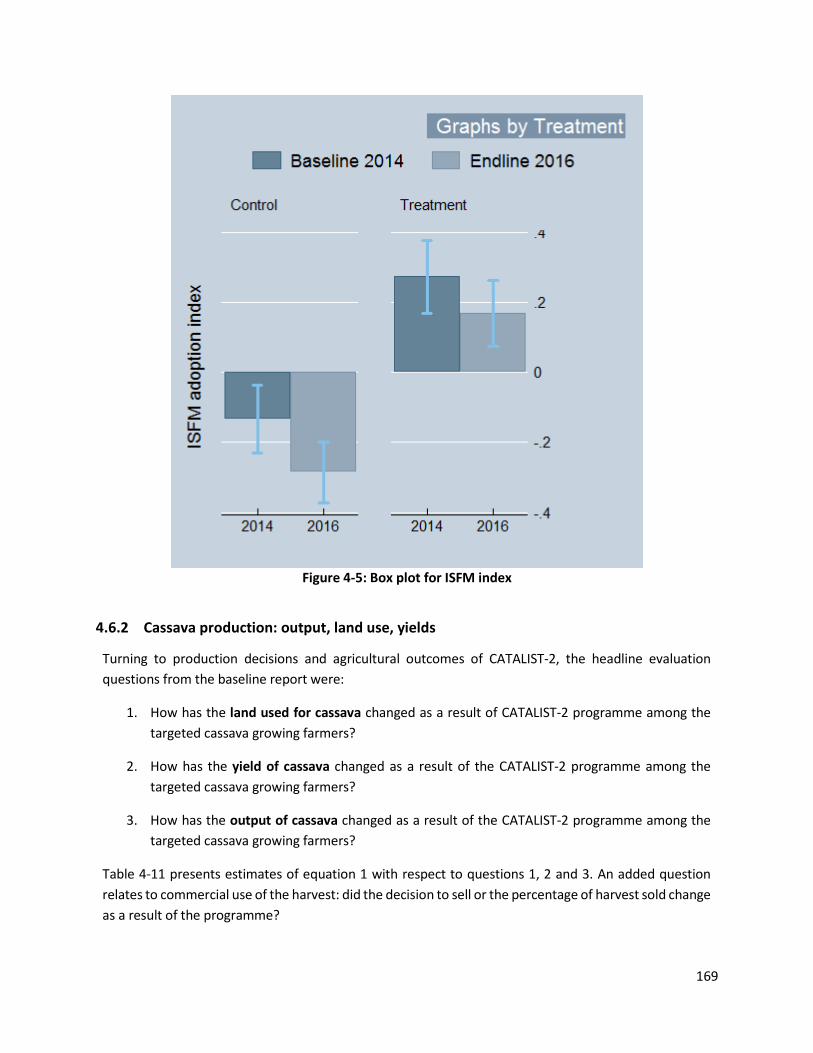
Figure 4-5: Box plot for ISFM index
4.6.2 Cassava production: output, land use, yields
Turning to production decisions and agricultural outcomes of CATALIST-2, the headline evaluation questions from the baseline report were:
1. How has the land used for cassava changed as a result of CATALIST-2 programme among the targeted cassava growing farmers?
2. How has the yield of cassava changed as a result of the CATALIST-2 programme among the targeted cassava growing farmers?
3. How has the output of cassava changed as a result of the CATALIST-2 programme among the targeted cassava growing farmers?
Table 4-11 presents estimates of equation 1 with respect to questions 1, 2 and 3. An added question relates to commercial use of the harvest: did the decision to sell or the percentage of harvest sold change as a result of the programme?
169
For the production of the cassava harvest farmers used 0.148 ha on average64, which is 39 percent of the total land. The cassava yield is calculated in the same way as at baseline65,66.
The outcome analysed in columns 1 and 2 is land allocation to cassava cultivation. The outcome in column 1 is whether the household planted cassava at all in the past 12 months; the outcome in column 2 is the cassava land size allocation in ha. As shown in the descriptive tables in the previous section, about 39 percent of farmers indicated to have stopped cultivating cassava during the study period. This negative trend is clearly visible in row 3, and highly significant. In contrast, row 1 shows that the programme had a highly significant positive impact on cassava cultivation. The coefficient size is about one third of the (absolute) time trend coefficient. This shows that participation in the ISFM training programme did not reverse the negative trend but caused about 10 percent of farm households to continue cultivating cassava. The programme did not have a significant impact on the amount of land allocated to cassava cultivation (column 2, row 1). Columns 3 and 4 report impact estimates for, respectively, cassava yield (in tonne/ha) and total cassava harvest (kg) over the last 12 months before the interview. We do not find a significant impact of the programme on these outcomes. As expected we do find – for all variables in this table – a negative and significant time trend.
64 This is the total area of plots on which cassava is the most important crop, which is more likely to correspond to the area on which cassava was harvested in the last 12 months than the area on which cassava was planted in the last season A and B. This, because the cassava harvested in the past 12 months was planted between one and two years ago. 65 For the calculation of cassava yield, farmers with 0 kilograms of harvest and farmers that did not harvest yet were included. 6.8 percent of the sampled farmers cultivated cassava, but did not harvest yet. 66 The area of plots cultivated with cassava is calculated in two ways: area of land planted with cassava in the last 12 months, which may not be the same as the area on which the household harvested cassava, and the total area of plots on which cassava is the most important crop. The second value is more likely to correspond to the area on which cassava was harvested in the last 12 months. This measure is used to calculate the yield of cassava. However, the two measures show similar results both for the area planted and cassava yield.
170

(1) (2) (3) (4) (5) (6) HH grows
Cassava Land of Cultivated Cassava
Cassava Yield Harvest Per Hectare (ton/ha)+
Cassava Harvest In Kg In The Last 12 Months+
HH Sold Crop
% Of Cassava Sold
TreatmentEffect 0.103*** 0.006 0.691 11.354 -0.041 -0.000 (0.035) (0.026) (0.651) (126.322) (0.047) (0.027) Participation 0.005 -0.014 -0.090 2.228 0.075* 0.031 (0.011) (0.020) (0.406) (123.865) (0.040) (0.021) Timetrend -0.266*** -0.070*** -1.724*** -179.268* -0.090** -0.034 (0.032) (0.018) (0.501) (102.923) (0.039) (0.023) More than 50% of harvest suffered from crop diseases, past 12m
-0.192*** -0.039** -0.680 -174.938*** -0.112*** -0.056**
(0.026) (0.018) (0.413) (48.851) (0.039) (0.022) Constant 0.781*** 0.017 1.636* 95.460 0.419*** 0.128** (0.044) (0.042) (0.971) (107.636) (0.102) (0.049) Controls Yes Yes Yes Yes Yes Yes Observations 1543 1543 1082 1505 1323 1269 r2 0.298 0.475 0.058 0.070 0.113 0.124 ymean 0.851 0.190 2.959 302.365 0.335 0.157 Standard errors in parentheses Controlled for total plot size, cooperative membership, wealth, gender, age, education, household shocks, distance from village to agrodealer, cassava diseases and district dummies. +Including 0 harvest and incl farmer that harvest later * p < .10, ** p < .05, *** p < .01
Table 4-11: Cassava land use, yield, production
We recall that in the previous section a negative significant treatment coefficient on the self-reported indicator for severe disease impact on harvest. Table 4-11 shows that the programme does not result in significantly higher (or less reduced) yields or harvest, despite the lower disease impact.
We illustrate these findings using two “double difference graphs” in Figure 4-6, one for column 1 (farmer grows cassava) and one for column 3 (yield). At baseline all farmers grow cassava, a requirement to be selected for the survey. This means that the error bar is flat in both the control and the treatment group. During the study period there is a substantial fall in cassava planting for both groups, but the decrease is more pronounced among the control group. At endline the means are 66 and 77 percent for control and treatment group farmers, respectively. The difference of 11 percent is very close to the regression treatment impact (10.3 percent) reported in column 1.
171

Figure 4-6: Box plot for growing cassava and cassava yield
The treatment effect is significant because the variation around the respective means is relatively limited, as illustrated by the 95 percent confidence intervals; the simple difference in the graph is “significant” because the confidence intervals do not overlap. This contrasts with the double difference analysis for cassava yields, illustrated in the right hand panel. There is a sizeable difference between control and treatment yields at endline (of approximately 1.5 versus 2.5 t/ha) while yields were close at baseline. However, there is a relatively large variation around these means and the confidence intervals overlap. This is consistent with the insignificant treatment effect estimate in column 3.
To further explore the underlying mechanisms, Figure 4-7 plots mean cassava yields for improved and non-improved varieties for baseline and endline. This clearly shows that the general downward trend is much stronger than the positive yield difference between improved and non-improved varieties. A regression of severe disease incidence on use of cassava varieties (results not presented) shows that one variety has significantly lower risk and one a higher risk of such an adverse shock.
This suggests the following explanation for the reported programme impacts. First, some cassava varieties reduce disease risk and programme participation increases access to such varieties. Farmers who have participated are more likely to continue growing cassava, as a result of the perceived benefits of participation including access to improved varieties; but possibly also because of behavioral effect of being member of a training group. Second and remarkably, the negative trend affects yields for both improved and non-improved varieties. The figure shows that the relative difference between the variety
172

qualities is approximately unchanged between baseline and endline. As some participants were already using improved varieties at baseline, it is not surprising that the yield effect is not significant (note that it is positive but with a relatively large standard error). We note that the quality of the varieties in our data is self-reported and there may be measurement error or uncertainty about this quality. This is also reported in interviews with implementers and beneficiaries. This uncertainty in combination with the experienced crop damages may explain why many farmers have decided to stop cultivating cassava. Moreover, when cassava plots have been affected by CBSD farmers are advised to leave these fields unused for a period of 1-2 years.
Figure 4-7: Mean cassava yield
It is perhaps surprising that we see a significant coefficient on the time trend next to the household level diseases indicator. However, note that the disease indicator is generic, not referring to cassava diseases specifically. A further explanation may be that there are disincentive mechanisms beyond the direct disease effect that impact the cassava production and decisions. The sum of the trend and the cassava shock parameters is larger than the full panel mean level in the sample. This is consistent with anecdotal evidence of farmers reporting that their complete harvest has been wiped out, as well as with farmers completely dropping out of cassava production.
We also do not find significant programme effects on the decision to sell any cassava, nor on the percentage of the crop sold (but still find that participating farmers sell more of their crop than non-participants, which is interpreted as a selection effect as discussed in the previous section).
One concern with the regression specification might be that any positive programme impact on cassava
173

production that is related to lower disease incidence is captured by the disease shock variable. That is, the programme might succeed in lowering disease shocks via the distribution of resistant cassava variety cuttings but the impact parameter in columns (3) and (4) would reflect the programme effect exclusive of the disease effect. We have tested for this by excluding the crop disease shock variable and find that there is no difference in the qualitative conclusions regarding significance of treatment.
4.6.3 Other crop yields
How has the total output of the farmers changed as a result of CATALIST-2 programme among the targeted cassava growing farmers?
The 5 most important crops at endline are beans, cassava, sorghum, maize and soybeans. In Table 4-12 we review what happened to the yields of the “other” crops during the evaluation period to answer the question. None of the households reported growing maize or soybeans at baseline, so the cultivation of these crops has become popular in the past two years. This is clear from the significant time trend (columns 3 and 4, row 3). However, there is no significant treatment effect on the yield of any of these crops.
Not reported here are regression results for the outcome “Household cultivates crop”. In this type of regression, we find a positive treatment effect on the cultivation of maize (0.193 or 175 percent of the mean, p<0.01), but there is a negative treatment effect on the cultivation of soybeans (-0.076 or 93 percent of the mean, p<0.05; results not tabled but available on request). Apparently, the programme induced farmers to start growing maize, but induced them to stop growing soybeans. Similar results are found on the percentage of land used for these crops.
174

(1) (2) (3) (4) Beans_Yield Sorghum_Yield Maize_Yield Soybeans_Yield TreatmentEffect -1.926 -0.508 -0.143 -0.036 (1.695) (0.688) (0.871) (0.203) Participation -0.426 0.608 0.063 0.013 (0.515) (0.540) (0.045) (0.018) Timetrend 2.480 0.177 2.225** 0.731*** (1.907) (0.563) (0.944) (0.192) Harvest suffered severely (>50%) from crop diseases in past 12 months
1.099 -0.157 -0.461 -0.072
(1.146) (0.222) (0.282) (0.077) Constant 4.774 1.311** -0.380 -0.030 (3.321) (0.588) (0.230) (0.081) Controls Yes Yes Yes Yes Observations 1230 298 955 913 r2 0.025 0.086 0.230 0.240 ymean 1.546 1.384 0.335 0.098 Standard errors in parentheses Controlled for total plot size, cooperative membership, wealth, gender, age, education, household shocks, distance from village to agrodealer and district dummies. * p < .10, ** p < .05, *** p < .01
Table 4-12: Yields of other crops
4.6.4 Value chain indicators
How have the price of cassava and crop value changed as a result of the CATALIST-2 programme?
Table 4-13 presents impact estimates for the (farmer specific) cassava market price obtained by farmers that sell (col 1); and the cassava and total production value of crops produced by farmers (columns 2 and 3, respectively).
We do not find any impact of generic ISFM training participation on these outcomes. We do see that the time trend for the cassava price is positive and significant at the 10 percent level, in line with expectation in a market where supply is suppressed. The negative price coefficient for the disease shock variable suggests that in severe cases the market is in disarray. In column 2, the negative trend and disease shock parameters for cassava production value are also as expected and consistent with the previous results for production quantities. The results confirm the general suppressed state of cassava production and market in the study area and period. The sum of the trend and the cassava shock parameters equals the mean level in the sample, again consistent with production value dropping to very low levels compared to baseline levels. As we did not find any impact on sales (see 4.6.2) nor in price, we do not find any effects through improvements in the value chain.
175
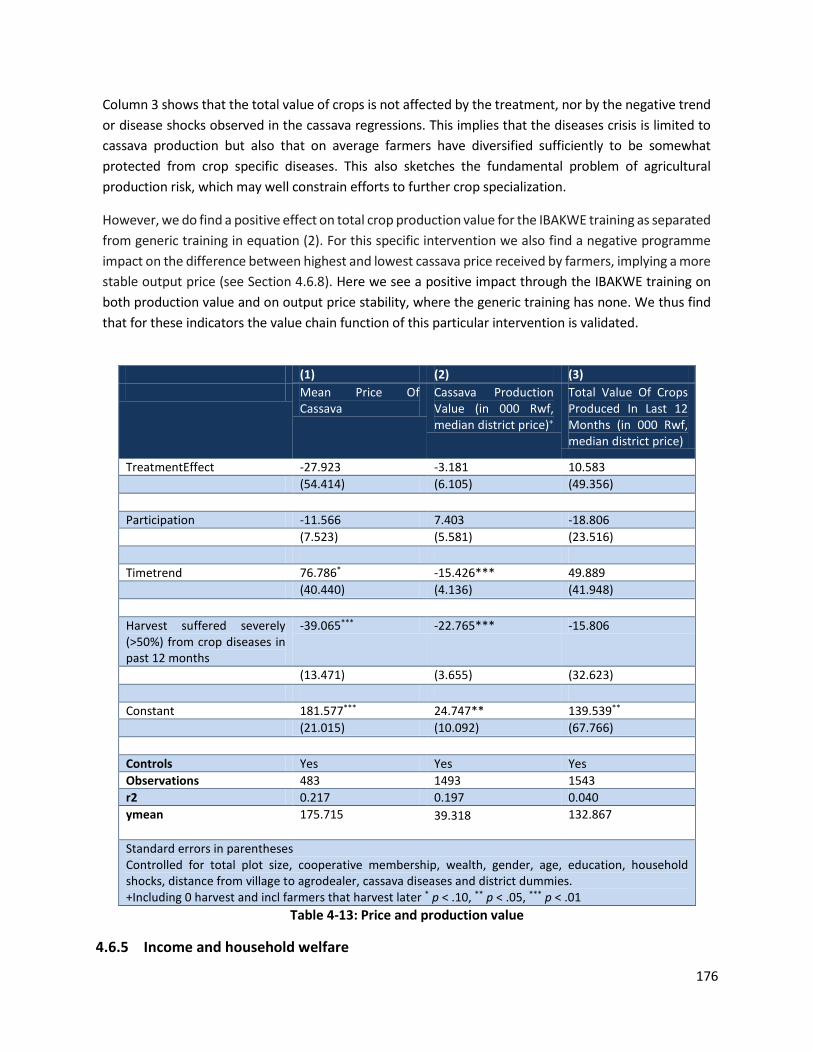
Column 3 shows that the total value of crops is not affected by the treatment, nor by the negative trend or disease shocks observed in the cassava regressions. This implies that the diseases crisis is limited to cassava production but also that on average farmers have diversified sufficiently to be somewhat protected from crop specific diseases. This also sketches the fundamental problem of agricultural production risk, which may well constrain efforts to further crop specialization.
However, we do find a positive effect on total crop production value for the IBAKWE training as separated from generic training in equation (2). For this specific intervention we also find a negative programme impact on the difference between highest and lowest cassava price received by farmers, implying a more stable output price (see Section 4.6.8). Here we see a positive impact through the IBAKWE training on both production value and on output price stability, where the generic training has none. We thus find that for these indicators the value chain function of this particular intervention is validated.
(1) (2) (3) Mean Price Of Cassava
Cassava Production Value (in 000 Rwf, median district price)+
Total Value Of Crops Produced In Last 12 Months (in 000 Rwf, median district price)
TreatmentEffect -27.923 -3.181 10.583 (54.414) (6.105) (49.356)
Participation -11.566 7.403 -18.806 (7.523) (5.581) (23.516)
Timetrend 76.786* -15.426*** 49.889 (40.440) (4.136) (41.948)
Harvest suffered severely (>50%) from crop diseases in past 12 months
-39.065*** -22.765*** -15.806
(13.471) (3.655) (32.623)
Constant 181.577*** 24.747** 139.539** (21.015) (10.092) (67.766)
Controls Yes Yes Yes Observations 483 1493 1543 r2 0.217 0.197 0.040 ymean 175.715 39.318 132.867
Standard errors in parentheses Controlled for total plot size, cooperative membership, wealth, gender, age, education, household shocks, distance from village to agrodealer, cassava diseases and district dummies. +Including 0 harvest and incl farmers that harvest later * p < .10, ** p < .05, *** p < .01
Table 4-13: Price and production value
4.6.5 Income and household welfare
176

How have the household income and welfare changed as a result of the CATALIST-2 programme?
The total income is calculated by adding up the total other income and the total farm income, which in turn is calculated by subtracting the total value of expenditures on agricultural inputs from the total crop production value defined as the sum of the crop harvests times the median crop price in the district. Dividing the net total farm income by the total plot size makes the net profit per hectare of land.
Table 4-14 presents impact estimates of ISFM training on a set of household welfare measures. Columns (1)-(4) present estimates for total income, net total farm income, total other income and net profit per hectare in the last 12 months. We do not find any impact of the training participation on these measures. We also do not find time trend or disease shock effects. This is not a surprise, given similar results of estimates for the total crop production value in the previous table. A further measure of income is the value of food consumption during the last seven days, valued at local prices. The total household value was analysed (result not in the table), but no significant result was found. (See the next Table 4-15 for impact regression results for the per adult equivalent consumption value).
We do find a negative time trend effect on the asset index and on the indicator for hiring in labour for harvesting crops. These are signs of financial pressure for household in our sample. It is not clear why we would see such an impact for wealth but not for income, an arguably equally or more sensitive measure of household welfare. One explanation is that measurement error is a notorious problem for estimates of income in household surveys where full consumption modules are not feasible.
177
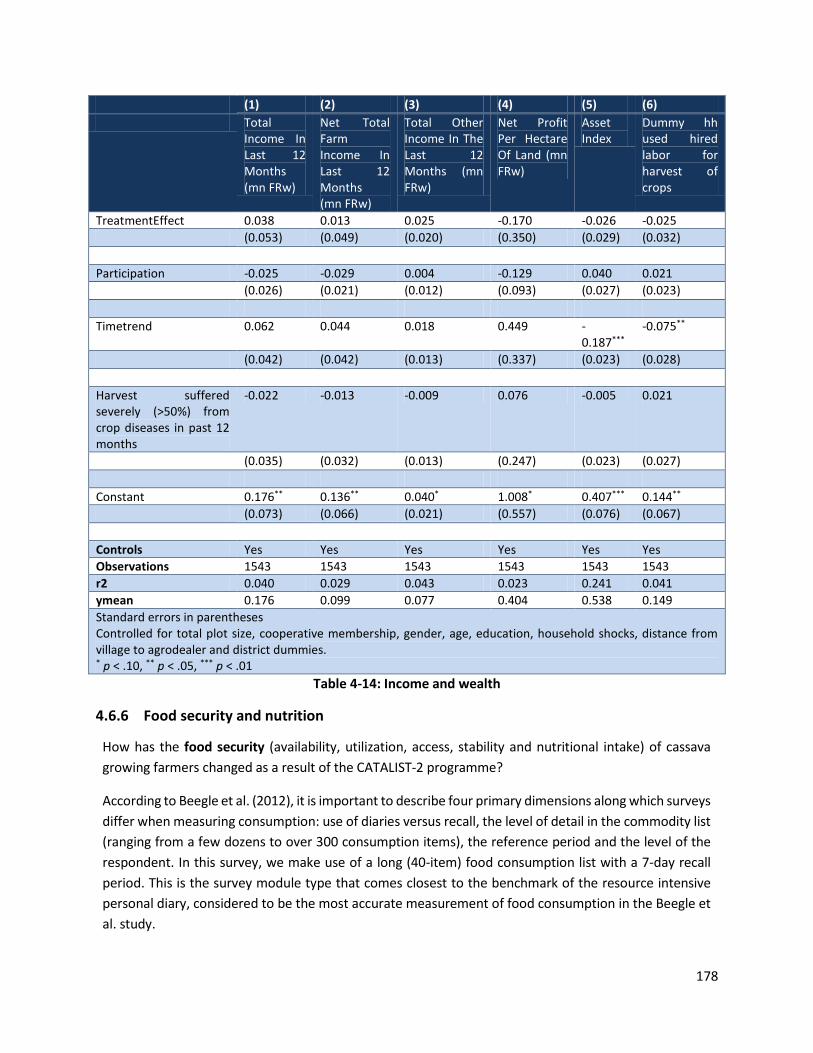
(1) (2) (3) (4) (5) (6) Total
Income In Last 12 Months (mn FRw)
Net Total Farm Income In Last 12 Months (mn FRw)
Total Other Income In The Last 12 Months (mn FRw)
Net Profit Per Hectare Of Land (mn FRw)
Asset Index
Dummy hh used hired labor for harvest of crops
TreatmentEffect 0.038 0.013 0.025 -0.170 -0.026 -0.025 (0.053) (0.049) (0.020) (0.350) (0.029) (0.032) Participation -0.025 -0.029 0.004 -0.129 0.040 0.021 (0.026) (0.021) (0.012) (0.093) (0.027) (0.023) Timetrend 0.062 0.044 0.018 0.449 -
0.187*** -0.075**
(0.042) (0.042) (0.013) (0.337) (0.023) (0.028) Harvest suffered severely (>50%) from crop diseases in past 12 months
-0.022 -0.013 -0.009 0.076 -0.005 0.021
(0.035) (0.032) (0.013) (0.247) (0.023) (0.027) Constant 0.176** 0.136** 0.040* 1.008* 0.407*** 0.144** (0.073) (0.066) (0.021) (0.557) (0.076) (0.067) Controls Yes Yes Yes Yes Yes Yes Observations 1543 1543 1543 1543 1543 1543 r2 0.040 0.029 0.043 0.023 0.241 0.041 ymean 0.176 0.099 0.077 0.404 0.538 0.149 Standard errors in parentheses Controlled for total plot size, cooperative membership, gender, age, education, household shocks, distance from village to agrodealer and district dummies. * p < .10, ** p < .05, *** p < .01
Table 4-14: Income and wealth
4.6.6 Food security and nutrition
How has the food security (availability, utilization, access, stability and nutritional intake) of cassava growing farmers changed as a result of the CATALIST-2 programme?
According to Beegle et al. (2012), it is important to describe four primary dimensions along which surveys differ when measuring consumption: use of diaries versus recall, the level of detail in the commodity list (ranging from a few dozens to over 300 consumption items), the reference period and the level of the respondent. In this survey, we make use of a long (40-item) food consumption list with a 7-day recall period. This is the survey module type that comes closest to the benchmark of the resource intensive personal diary, considered to be the most accurate measurement of food consumption in the Beegle et al. study.
178
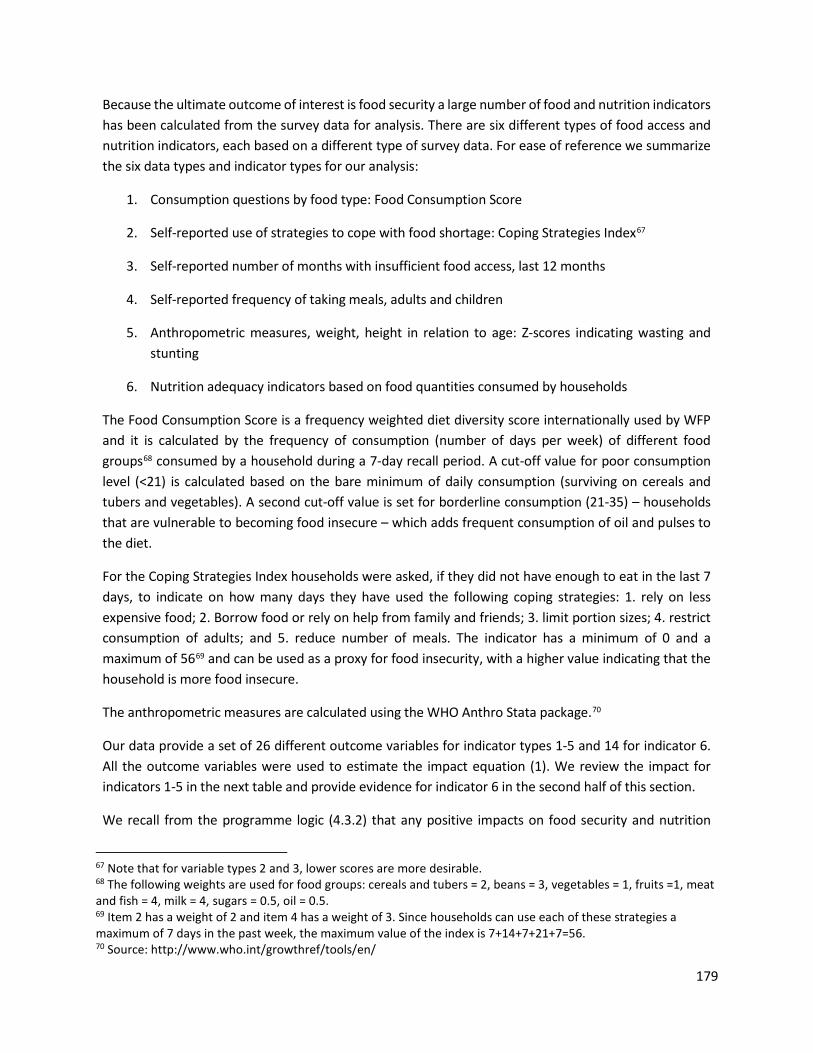
Because the ultimate outcome of interest is food security a large number of food and nutrition indicators has been calculated from the survey data for analysis. There are six different types of food access and nutrition indicators, each based on a different type of survey data. For ease of reference we summarize the six data types and indicator types for our analysis:
1. Consumption questions by food type: Food Consumption Score
2. Self-reported use of strategies to cope with food shortage: Coping Strategies Index67
3. Self-reported number of months with insufficient food access, last 12 months
4. Self-reported frequency of taking meals, adults and children
5. Anthropometric measures, weight, height in relation to age: Z-scores indicating wasting and stunting
6. Nutrition adequacy indicators based on food quantities consumed by households
The Food Consumption Score is a frequency weighted diet diversity score internationally used by WFP and it is calculated by the frequency of consumption (number of days per week) of different food groups68 consumed by a household during a 7-day recall period. A cut-off value for poor consumption level (<21) is calculated based on the bare minimum of daily consumption (surviving on cereals and tubers and vegetables). A second cut-off value is set for borderline consumption (21-35) – households that are vulnerable to becoming food insecure – which adds frequent consumption of oil and pulses to the diet.
For the Coping Strategies Index households were asked, if they did not have enough to eat in the last 7 days, to indicate on how many days they have used the following coping strategies: 1. rely on less expensive food; 2. Borrow food or rely on help from family and friends; 3. limit portion sizes; 4. restrict consumption of adults; and 5. reduce number of meals. The indicator has a minimum of 0 and a maximum of 5669 and can be used as a proxy for food insecurity, with a higher value indicating that the household is more food insecure.
The anthropometric measures are calculated using the WHO Anthro Stata package.70
Our data provide a set of 26 different outcome variables for indicator types 1-5 and 14 for indicator 6. All the outcome variables were used to estimate the impact equation (1). We review the impact for indicators 1-5 in the next table and provide evidence for indicator 6 in the second half of this section.
We recall from the programme logic (4.3.2) that any positive impacts on food security and nutrition
67 Note that for variable types 2 and 3, lower scores are more desirable. 68 The following weights are used for food groups: cereals and tubers = 2, beans = 3, vegetables = 1, fruits =1, meat and fish = 4, milk = 4, sugars = 0.5, oil = 0.5. 69 Item 2 has a weight of 2 and item 4 has a weight of 3. Since households can use each of these strategies a maximum of 7 days in the past week, the maximum value of the index is 7+14+7+21+7=56. 70 Source: http://www.who.int/growthref/tools/en/
179

outcomes of CATALIST-2 (or other types of) ISFM training rely on improvements either in home produced agricultural stocks or in income, triggered by productivity increases from the adoption of ISFM techniques. Given that food security and nutrition outcomes take the last place in the causal pathway and that the production and income impacts have not materialized, it is not unexpected that we do not see impact for most of these outcomes.
Perhaps surprisingly, the programme has a significant treatment effect on the number of times that children under 15 years ate per day, with an effect size of close to 0.5 meals per day (16.1 percent of the mean). It is not straightforward to explain the mechanism behind this result. One explanation consistent with our findings is that the treatment caused participating households to continue cassava cultivation, even if it did not lead to an increased cassava yield or higher income. Having some cassava produced at the household may explain the additional half meal to children. If so, that is a success for the programme. However, it is also true that this is one significant result, “cherry picked” from a set of 26 food and nutrition “experiments”. The bulk of the evidence suggests that there is no impact of this type of training programme on food security.
180
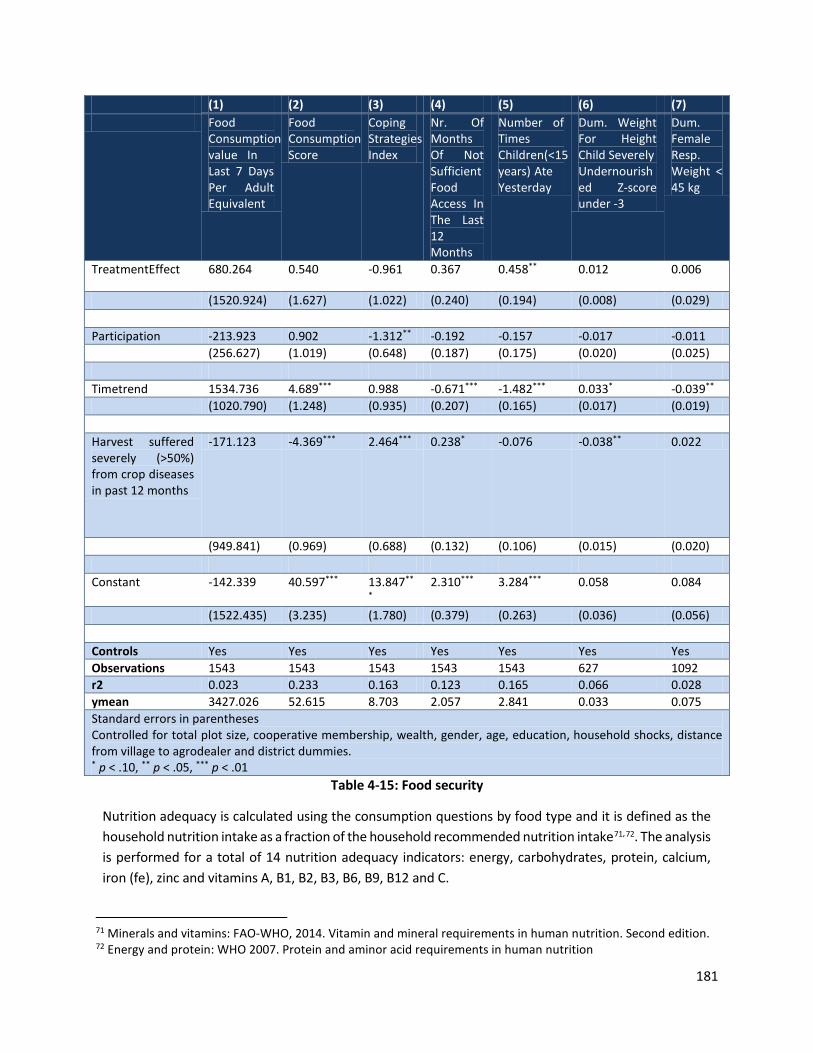
(1) (2) (3) (4) (5) (6) (7) Food Consumptionvalue In Last 7 Days Per Adult Equivalent
Food ConsumptionScore
Coping StrategiesIndex
Nr. Of Months Of Not Sufficient Food Access In The Last 12 Months
Number of Times Children(<15years) Ate Yesterday
Dum. Weight For Height Child Severely Undernourished Z-score under -3
Dum. Female Resp. Weight < 45 kg
TreatmentEffect 680.264 0.540 -0.961 0.367 0.458** 0.012 0.006
(1520.924) (1.627) (1.022) (0.240) (0.194) (0.008) (0.029)
Participation -213.923 0.902 -1.312** -0.192 -0.157 -0.017 -0.011 (256.627) (1.019) (0.648) (0.187) (0.175) (0.020) (0.025)
Timetrend 1534.736 4.689*** 0.988 -0.671*** -1.482*** 0.033* -0.039** (1020.790) (1.248) (0.935) (0.207) (0.165) (0.017) (0.019)
Harvest suffered severely (>50%) from crop diseases in past 12 months
-171.123 -4.369*** 2.464*** 0.238* -0.076 -0.038** 0.022
(949.841) (0.969) (0.688) (0.132) (0.106) (0.015) (0.020)
Constant -142.339 40.597*** 13.847**
*2.310*** 3.284*** 0.058 0.084
(1522.435) (3.235) (1.780) (0.379) (0.263) (0.036) (0.056)
Controls Yes Yes Yes Yes Yes Yes Yes Observations 1543 1543 1543 1543 1543 627 1092 r2 0.023 0.233 0.163 0.123 0.165 0.066 0.028 ymean 3427.026 52.615 8.703 2.057 2.841 0.033 0.075 Standard errors in parentheses Controlled for total plot size, cooperative membership, wealth, gender, age, education, household shocks, distance from village to agrodealer and district dummies. * p < .10, ** p < .05, *** p < .01
Table 4-15: Food security
Nutrition adequacy is calculated using the consumption questions by food type and it is defined as the household nutrition intake as a fraction of the household recommended nutrition intake71,72. The analysis is performed for a total of 14 nutrition adequacy indicators: energy, carbohydrates, protein, calcium, iron (fe), zinc and vitamins A, B1, B2, B3, B6, B9, B12 and C.
71 Minerals and vitamins: FAO-WHO, 2014. Vitamin and mineral requirements in human nutrition. Second edition. 72 Energy and protein: WHO 2007. Protein and aminor acid requirements in human nutrition
181
Figure 4-8 provides an illustration of the nutrition adequacy for households in 2014. It mainly shows a limited adequacy for vitamin A, vitamin B12 and calcium.
Figure 4-8: Nutrition adequacy in 2014
The next two figures, Figure 4-9 and Figure 4-10, illustrate adequacy changes for Protein and Vitamin C, respectively. These changes are also represented in the impact estimates in Table 4-16. For these nutrients the relative changes are such that the program impact estimate is significant and as expected: a larger increase in adequacy for treated households than for controls (Protein) or a smaller decrease (Vitamin C). We note again that these significant impact estimates are a selection out of a large number of nutrient regressions, many of which did not show a significant treatment effect.
182
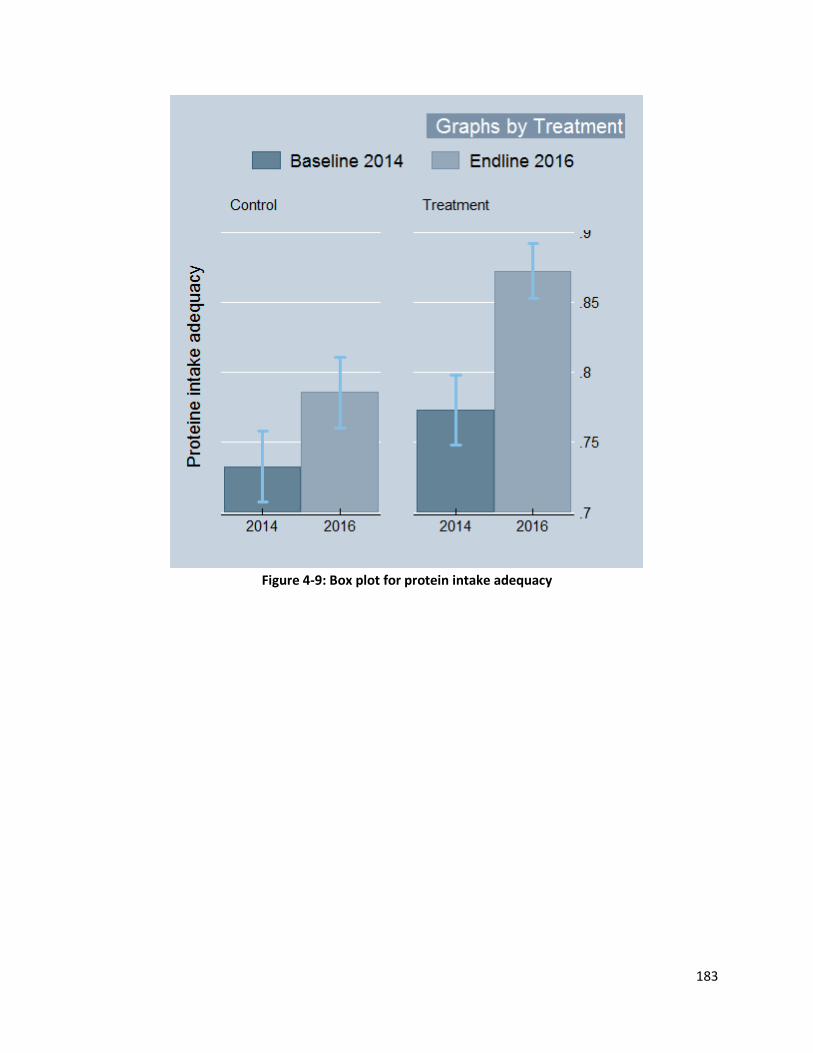
Figure 4-9: Box plot for protein intake adequacy
183

Figure 4-10: Box plot for vitamin C
The estimates of equation (1) are presented in Table 4-16 for a selection of three nutrient adequacy indicators (out of 14 outcomes tested). This selection is biased as it presents the nutrients for which the analysis finds significant positive treatment effects: protein (0.049 or 6.2 percent of the mean), vitamin B6 (0.055 or 6.2 percent of the mean) and vitamin C (0.041 or 4.6 percent of the mean). The regressions yield coefficient signs that are consistent with expectations. In row three, the time trend shows that intake of Vitamines B6 and C decreases in the study period, which is consistent with the fact that cassava contains a high level of Vitamin B6 and C and the general decrease in cassava availability. We see an increase in protein intake, which is provided by cassava leaves. A similar argument holds for the crop damage coefficients. A possible explanation for the positive protein and vitamin effects is that treated households on average are more likely to remain active in cassava cultivation and therefore have easier access to cassava. We did not find this in tests of self-reported cassava consumption quantities, however. Anecdotal evidence suggests that additional produce is likely to be eaten, especially among small-scale farmers that are well represented in our sample. The cassava leaves are popular food and, apparently, the mosaic virus affected leaves are particularly tasty. This may help explain the higher protein and vitamin B effect, but not the vitamin C effect.
184
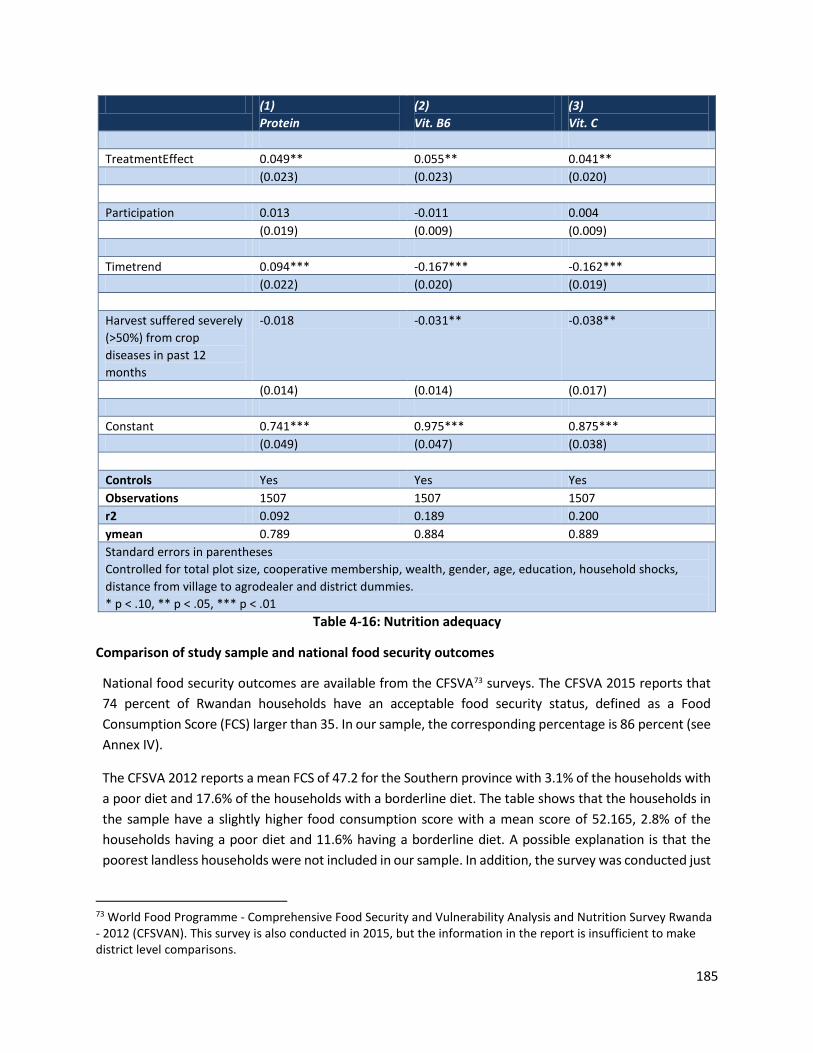
(1) Protein
(2) Vit. B6
(3) Vit. C
TreatmentEffect 0.049** 0.055** 0.041** (0.023) (0.023) (0.020) Participation 0.013 -0.011 0.004 (0.019) (0.009) (0.009) Timetrend 0.094*** -0.167*** -0.162*** (0.022) (0.020) (0.019) Harvest suffered severely (>50%) from crop diseases in past 12 months
-0.018 -0.031** -0.038**
(0.014) (0.014) (0.017) Constant 0.741*** 0.975*** 0.875*** (0.049) (0.047) (0.038) Controls Yes Yes Yes Observations 1507 1507 1507 r2 0.092 0.189 0.200 ymean 0.789 0.884 0.889 Standard errors in parentheses Controlled for total plot size, cooperative membership, wealth, gender, age, education, household shocks, distance from village to agrodealer and district dummies. * p < .10, ** p < .05, *** p < .01
Table 4-16: Nutrition adequacy
Comparison of study sample and national food security outcomes
National food security outcomes are available from the CFSVA73 surveys. The CFSVA 2015 reports that 74 percent of Rwandan households have an acceptable food security status, defined as a Food Consumption Score (FCS) larger than 35. In our sample, the corresponding percentage is 86 percent (see Annex IV).
The CFSVA 2012 reports a mean FCS of 47.2 for the Southern province with 3.1% of the households with a poor diet and 17.6% of the households with a borderline diet. The table shows that the households in the sample have a slightly higher food consumption score with a mean score of 52.165, 2.8% of the households having a poor diet and 11.6% having a borderline diet. A possible explanation is that the poorest landless households were not included in our sample. In addition, the survey was conducted just
73 World Food Programme - Comprehensive Food Security and Vulnerability Analysis and Nutrition Survey Rwanda - 2012 (CFSVAN). This survey is also conducted in 2015, but the information in the report is insufficient to make district level comparisons.
185

around harvest time, when households’ consumption is the highest. This implies that we overestimate the yearly average of food consumption.
CFSVA 2012 reports that the Coping Strategies Index is 5.56 on average in a 7-day recall period in the Southern province. In our sample, and 4 years later, this is 10.49. (Although the average Coping Strategies Index is not mentioned in CFSVA 2015, the report does notice a deterioration between 2012 and 2015, with households on average using a greater number of and more severe coping strategies as a result of food shortages in all provinces except the Northern Province).
Full sample (2016)
Food Consumption Score 52.165 (0.823) [786.000] Dum. FCS 0-21 0.028 (0.007) [786.000] Dum. FCS 21.5 - 35 0.116 (0.014) [786.000] Dum. FCS >35 0.856 (0.015) [786.000] Coping Strategies Index for past 7 days 10.492 (0.678) [785.000] Standard errors in parentheses, sample size between brackets
Table 4-17: Food consumption and Coping Strategies Index
4.6.7 Access to credit: impact analysis of Business-Financial training
Do cassava growing farmers have better access to credit as a result of CATALIST-2 programme (specifically, information on business planning and applying for credit, cassava credit arrangement)?
Another objective of CATALIST-2 is to induce farmers to have a more business-like attitude towards farming. The aim is that farmers use cost-benefit analysis when deciding about investments and in general they keep track of their expenses. Table 4-18 presents results for the financial and business training impact analysis. We recall that participation in these trainings at some 17 percent of households is much less widespread than for ISFM training (49 percent). However, these trainings represent the entrepreneurship and business environment side of the programme, a non-standard feature in farmer field school interventions.
186
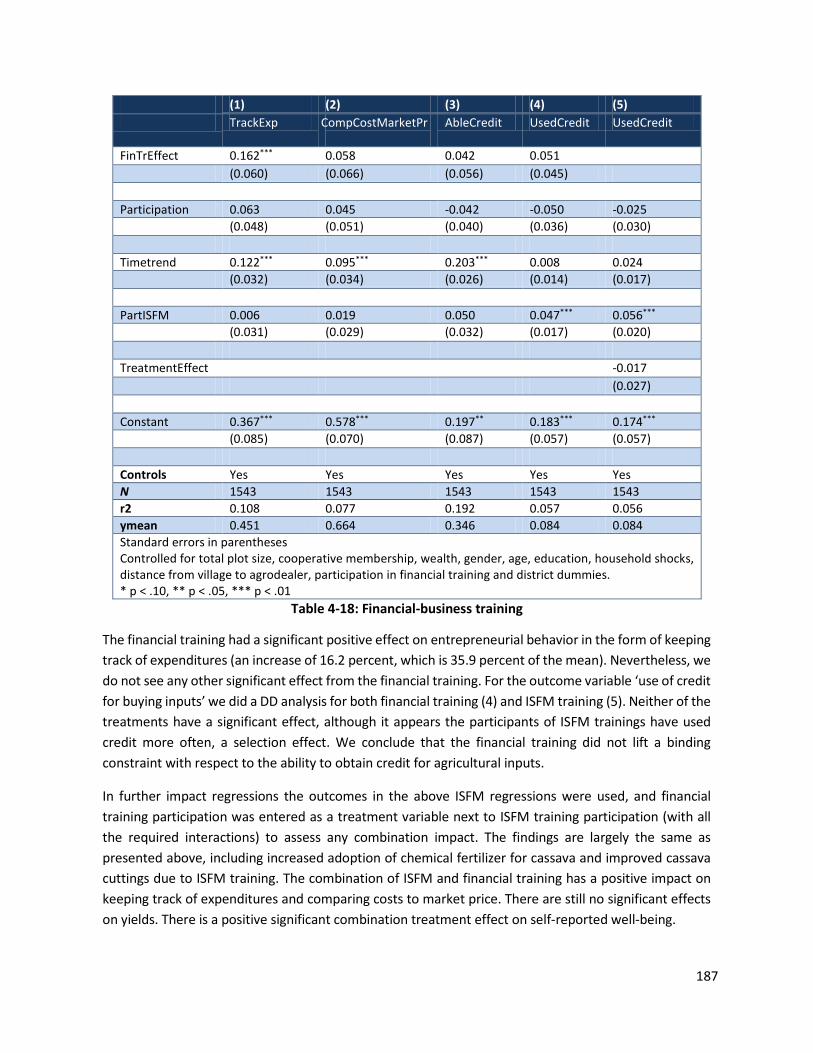
(1) (2) (3) (4) (5) TrackExp CompCostMarketPr AbleCredit UsedCredit UsedCredit
FinTrEffect 0.162*** 0.058 0.042 0.051 (0.060) (0.066) (0.056) (0.045)
Participation 0.063 0.045 -0.042 -0.050 -0.025 (0.048) (0.051) (0.040) (0.036) (0.030)
Timetrend 0.122*** 0.095*** 0.203*** 0.008 0.024 (0.032) (0.034) (0.026) (0.014) (0.017)
PartISFM 0.006 0.019 0.050 0.047*** 0.056*** (0.031) (0.029) (0.032) (0.017) (0.020)
TreatmentEffect -0.017 (0.027)
Constant 0.367*** 0.578*** 0.197** 0.183*** 0.174*** (0.085) (0.070) (0.087) (0.057) (0.057)
Controls Yes Yes Yes Yes Yes N 1543 1543 1543 1543 1543 r2 0.108 0.077 0.192 0.057 0.056 ymean 0.451 0.664 0.346 0.084 0.084 Standard errors in parentheses Controlled for total plot size, cooperative membership, wealth, gender, age, education, household shocks, distance from village to agrodealer, participation in financial training and district dummies. * p < .10, ** p < .05, *** p < .01
Table 4-18: Financial-business training
The financial training had a significant positive effect on entrepreneurial behavior in the form of keeping track of expenditures (an increase of 16.2 percent, which is 35.9 percent of the mean). Nevertheless, we do not see any other significant effect from the financial training. For the outcome variable ‘use of credit for buying inputs’ we did a DD analysis for both financial training (4) and ISFM training (5). Neither of the treatments have a significant effect, although it appears the participants of ISFM trainings have used credit more often, a selection effect. We conclude that the financial training did not lift a binding constraint with respect to the ability to obtain credit for agricultural inputs.
In further impact regressions the outcomes in the above ISFM regressions were used, and financial training participation was entered as a treatment variable next to ISFM training participation (with all the required interactions) to assess any combination impact. The findings are largely the same as presented above, including increased adoption of chemical fertilizer for cassava and improved cassava cuttings due to ISFM training. The combination of ISFM and financial training has a positive impact on keeping track of expenditures and comparing costs to market price. There are still no significant effects on yields. There is a positive significant combination treatment effect on self-reported well-being.
187
4.6.8 IBAKWE interventions and cooperation membership interaction effects
In this section we consider the impact results for participating in the IBAKWE trainings as per equation (2). These results are summarized in the table in Annex XVIII. If we restrict ourselves to distinct IBAKWE results that appear using at least two of the three estimators used, we only find a surprising negative effect on cassava production value; and positive effects on protein and vitamin B6 intake. We do not find any additional positive treatment effect regarding ISFM practice adoption, yield, production or income.
Allowing for results that appear only using one of the three estimators, we find a marginally significant additional positive IBAKWE effect on the ISFM adoption index and on having a cassava harvest. The former means that participating households in IBAKWE villages were slightly more likely to stay in cassava cultivation, all else equal. However, we find these impacts only when using the FE estimator, not for the other two estimators.
The estimates for the non-IBAKWE treatment in equation (2) are remarkably consistent with the estimates of the generic treatment presented in the preceding tables, both in coefficient sizes and significance. The only new finding here is a marginally significant positive (non-IBAKWE) treatment effect on “other income”. In other words, participants in these other trainings experienced a slight increase in income from any livelihood activities other than crop cultivation.
As a variation of equation (2), we also estimated this equation replacing the dummy for IBAKWE training with a dummy for cooperative membership at endline. Using this specification, we only find a positive effect on using improved cassava cuttings and chemical fertilizer on cassava for the treated households that are also member of a cooperative. For this group, we also find a positive effect on total income, which is explained by an increase in total other income, not by farm income. Membership in a cooperative seems to increase the use if hired labour, irrespective of the treatment. Both for treatment and cooperative membership, either both or separate, the coefficients are positive and significant for growing cassava and the number of meals that a child ate yesterday.
4.7 Sensitivity analysis 4.7.1 Alternative estimators
As mentioned in the methodology section, two alternative estimators were used to assess sensitivity of our results. A summary of all estimates, including all three estimators used in both equations (1) and (2), is provided in Annex XVIII.
Matched controls
Recall from section 4.5.2 that the treatment selection did not happen at random. We found that membership in a cooperative has a significant positive correlation with the treatment probability of the household and that cooperative members are relatively well-off. In the above analysis we controlled for this selection bias by adding a treatment group specific control variable to the model. To further
188

strengthen the comparability of treatment and control households the control group can be trimmed using propensity score matching (PSM). With PSM, treatment probability scores (pscores) are calculated for each household. Then the pscores are used to select for each treatment group household the control that is closest in terms of the probability of treatment.
The first step is to remove households that are not on the “common support”. That is, we remove untreated households whose pscore is lower than the minimum pscore among treated households. Similarly, we remove treated households whose pscore is higher than the maximum pscore among untreated households (see Figure 4-3). Next, treatment households are matched with the nearest neighbour from the control group. Each control household can only be matched once. The match needs to come from the same district and the maximum difference between the pscores is 0.174. As a result, we have a balanced sample of 492 households (246 treatment, 246 control), compared with a sample of 786 analyzed in the previous paragraphs.
In a DD analysis on this subsample we find results that are very similar to the full sample DD results. In a set of 29 impact regressions, each comparing results for the two estimators for a different outcome along the causal chain, we find that the coefficient differs qualitatively in only three cases. In these cases, the coefficient estimate was significant in one but not in the other (but had the same sign). Given the large set of regressions where no difference was found, we do not want to overstate the significance of these differences.
Household fixed effects
The basic regression specification can be slightly reformulated as follows:
Yijt = α + β1 * Time(2016)t * T-Groupi + β2 * T-Groupi + β3* Time(2016)+ γi + εijt (4)
This formulation omits the household and village level covariates and adds a household fixed effect. This household fixed effect reflects all time-invariant determinants, both observed and unobserved, that may affect the outcome and program participation. This specification adds value as it allows for household level unobserved factors, such as expected gains or curiosity, to affect program participation and outcomes. Such factors are no longer constrained to operate at a treatment group level. If we take first differences and write d to denote a change in a variable; and set the change in the endline time dummy to one, we have
dYijt = β1 * T-Groupi + β3 + dγi + dεijt (4’)
The differencing removes the household fixed effect (dγi = 0) so any bias due to observable and unobservable constant household factors is filtered out. The standard errors are obtained by bootstrapping.
As with the matched controls estimates we compared these fixed effects results with our standard DD estimates for a large set of outcomes along the causal chain. In this comparison, none of the qualitative
74 Arbitrarily chosen maximum difference in pscores in order to keep a substantial sample size.
189

conclusions on parameters changed. That is, if the fixed effect estimate is positive (negative) and significant, then so is the DD estimate.
4.7.2 Sub-group analysis: female participants, food insecure households and small farmers
We discuss here whether limiting our analysis to a sub-sample of beneficiaries changes our impact results qualitatively. We consider the following subgroups: female headed households, female respondents and households where a woman is responsible for cassava; food insecure households; and small and medium sized farms.
The first sub-group analysis is for female-headed households; these represent 27.21 percent of the sample and 37.12 percent of the subgroup participated in the ISFM training. For this subgroup we do not find a significant ISFM adoption effect and no effect on cassava production outcomes, but higher use of hired labour. We do find a positive effect on mean sale price of cassava. This effect is larger and more significant when we look at business training participation. A puzzling finding is that the number of months in which the household did not have sufficient food increased for this subgroup.
We also analysed female respondents as a subgroup, who represent 56.82 percent of the sample and 39.75% of them participated in an ISFM training. We find a slightly larger effect on the use of improved cuttings compared to the total sample. In addition, the effects of participation on growing cassava and on growing maize are positive and slightly larger than for the total sample. However, the results show a negative treatment effect for the total cassava harvest.
In participating households where a female is indicated as being responsible for cassava production the use of organic fertilizer increased relative to non-participants (but chemical fertilizer decreased). For this group we also find a positive program impact on the ISFM adoption index, which was absent for the full beneficiary analysis. We do not find evidence of a differential positive impact on the number of meals for children in these households.
Secondly, we discuss whether limiting the analysis to the sub-population defined as “food insecure” changes the results. According to the FCS based definition we estimate that only 14 percent of households in the sample are food insecure (see Annex IV). To perform the analysis, we define food insecure households here as those households who are, at baseline, below the poverty line based on food consumption (1.25 PPP USD per adult equivalent household member per day). These households are 63.88 percent (weighted) of the total sample and in the food insecure sub-sample, 43.05 percent participate in the ISFM training.
For this sub-group, we find a slightly larger effect on use of improved cuttings, both for all crops and for cassava; we also find a slightly larger effect on the probability to grow cassava; and we find a significant negative treatment effect on women being moderately undernourished (that is, having a Z-score between -2 and -3). As before, these programme treatment effects have the “right sign”, suggesting that the programme in this respect works according to the theory of change. However, these encouraging results are typically taken from a long list of similar outcome regressions without significant treatment effect.
190

The third subgroup is “small farmers” (0.1-0.5 ha plot size). These are 64.21 percent of the sample and of these, 42.14 percent participated in ISFM training. For this subgroup we find a negative effect on use of organic fertilizer. We find a positive effect on adoption of improved cuttings for all crops and also for only cassava. We further find a positive effect (of ISFM training) on keeping track of expenditures; a negative effect on selling cassava produce; a positive effect on maize yield; and a positive effect on number of times that adults and children ate yesterday.
4.7.3 Cross-section correlations along the results chain
As an added analysis, separate from the question of intervention impact, we look at two important correlations along the results chain of the theory of change: (1) the link between ISFM adoption and production and (2) the link between production and nutrition.
For these links we regress a number of production (nutrition) outcome indicators on a measure of ISFM adoption (production) and a number of covariates. We use the data to correlate household level differences in the outcome to a change in the adoption (or production) variable.
We find (results not shown) that there is no consistent correlation between ISFM adoption and a number of yield production variables, including cassava yield; total cassava harvest; and total production value of all cultivated crops together in our sample. As discussed earlier, this is not surprising given the severe cassava disease outbreak in the study period.
We do find significant correlations between production, measured as total household cassava harvest (kilogram), and a set of nutrition adequacy variables (energy, carbohydrates, protein, calcium, iron (fe), zinc and vitamins A, B1, B2, B3, B6, B9, B12 and C). To be precise, out of 15 regression analyses (including the production variable and a set of covariates) we find a significant positive coefficient on the production variable in seven regressions. However, the correlation coefficient on the combined nutrition index (which combines all nutrition adequacy variables) is significant only at the 10 percent level and is small (0.14 percent of the sample mean). We interpret this as suggestive evidence that households with better production indicators tend to have better nutrition outcomes. So even though on balance we do not find evidence that the ISFM trainings improved farm production, increased household production appears to be a reasonable intermediate goal on the road towards improved nutritional outcomes.
4.7.4 Indirect and unintended effects
Our estimates have covered impacts on participating households, comparing outcomes with a counterfactual of non-participants. Non-participants could in principle benefit via production impacts on local labor markets, or on local product markets via increased food supply and/or lower prices. Since we have not found any of these production effects for ISFM training, we conclude that there are no effects on indirect beneficiaries.
Non-participants, however, could also benefit by learning from the participants. As shown in section 4.5.2, 30.23 percent of non-participants heard about the trainings. In addition, 12.85 percent of non-
191

participants talked about what the participants learned in the trainings and 5.21 percent spoke about cassava.
We analyzed these indirect beneficiary effects in a regression with an indicator for farmers who had heard of the trainings (30 percent of non-participants), where we control for actual participation in the training as well as other covariates. We find a positive significant effect on the use of improved seeds/cuttings, but not on chemical fertilizer. We also see an increase in their expectation to be able to receive credit for buying inputs; and an increase in the probability that they grow cassava (but smaller than for the participants, as one would expect). However, we do not see any yield effect and no income effect but the subjective well-being has improved. We conclude that, up to a point, there is an impact on indirect beneficiaries as per the program description but it appears that the transmission of the information is limited. In our random sample of non-participating farmers each living in a cell where at least some ISFM training has taken place, only 30 percent have heard about the training. A number of empirical studies on indirect effects of Farmer Field School programs, from a variety of country settings, have reported limited knowledge spillovers. We conclude that the findings for Rwanda are relatively encouraging, as they suggest at least a limited change in expectation and behavior among non-participants.
Finally, we have also considered unintended effects on direct beneficiaries. Included in this analysis are impacts on education participation of children in the household between 6 and 16 years old; and on a self-reported measure of well-being (based on the question “Taken all things together how would you say things are going for you these days?”, with four ordered answer possibilities). We do not find an impact of the ISFM training for either of these outcomes. We note that the education attendance null-result contrasts with the findings in the FGD reports.
4.7.5 Efficiency
Finally, because of the lack of income effects, it does not seem useful to discuss monetary cost-benefit calculations. As mentioned in the baseline report (Evaluation question) the cost per direct beneficiary (40 USD for CATALIST-2) could be used in a comparison of costs versus income effects for the cassava clusters, attributable to the project (as suggested in the baseline report). Since we do not find any income effects, we will not pursue this calculation.
4.7.6 Long-term effects and sustainability
Sustainability analysis for this project may be defined as assessing whether project impacts remain during a certain period after the project participation of a household ends. A problem here is that we do not have such post-participation period observations for households that have participated in training in the study period (not beyond the endline data). We therefore propose to approach the problem by analysing households who had participated at baseline but did not participate between baseline and endline. These households have been referred to as the “early treatment” (ET) group.
A likely reason for households to no longer participate in the training is that they have gained sufficient knowledge and/or that farmer leaders and trainers prioritize other farmers in the community to
192

participate. If this is the case, observing what happens to ISFM outcomes for these farmers arguably provides a good view of programme sustainability.
Before the baseline survey, several organisations already provided ISFM trainings resulting in 42 percent of the sample indicating that they had already participated in one at baseline. Taking the early treatment into account, we can divide the sample in four groups: households that followed trainings before and after baseline (BT), households that only followed trainings before baseline (ET), households that only followed trainings after baseline(LT) and households that did not follow any ISFM trainings between 2013 and 2016 (Control). Table 4-19 shows the weighted fraction of each of these groups in the sample.
Weighted fraction of the sample Control 0.34 ET: Only training before baseline 0.21 LT: Only training after baseline 0.24 BT: Training before and after baseline 0.21
Table 4-19: Treatment status
Figure 4-11 shows the trend for the adoption of improved cassava cuttings for these four groups. The use level of improved cassava cuttings at baseline is clearly larger for the households who had followed training before baseline (ET and BT). Moreover, the graph shows a steep decline for the ET group in the use of improved seeds and cuttings (both generic and cassava only), from 42 to some 10 percent of households. Over the same period, use of improved cuttings in the LT group increases and in BT decreases more slowly. These differential trends are not unexpected when making improved seeds and cuttings available is part of the programme. But it does suggest that there is no sustained uptake of this type of ISFM practice after a household’s participation in the programme ends.
It can be argued that this is lack of sustainability, so that without the cuttings and training provided by the program (funding) the adoption of improved seeds stops. FGD respondents have mentioned that they fear not being able to obtain the improved cuttings after the program participation ends. However, it is likely that cassava diseases confound the issue. It is clear that the market for improved cuttings has an information problem during the study period, where the purchase of the “wrong” kind of cutting can turn out to be a bad investment.
193
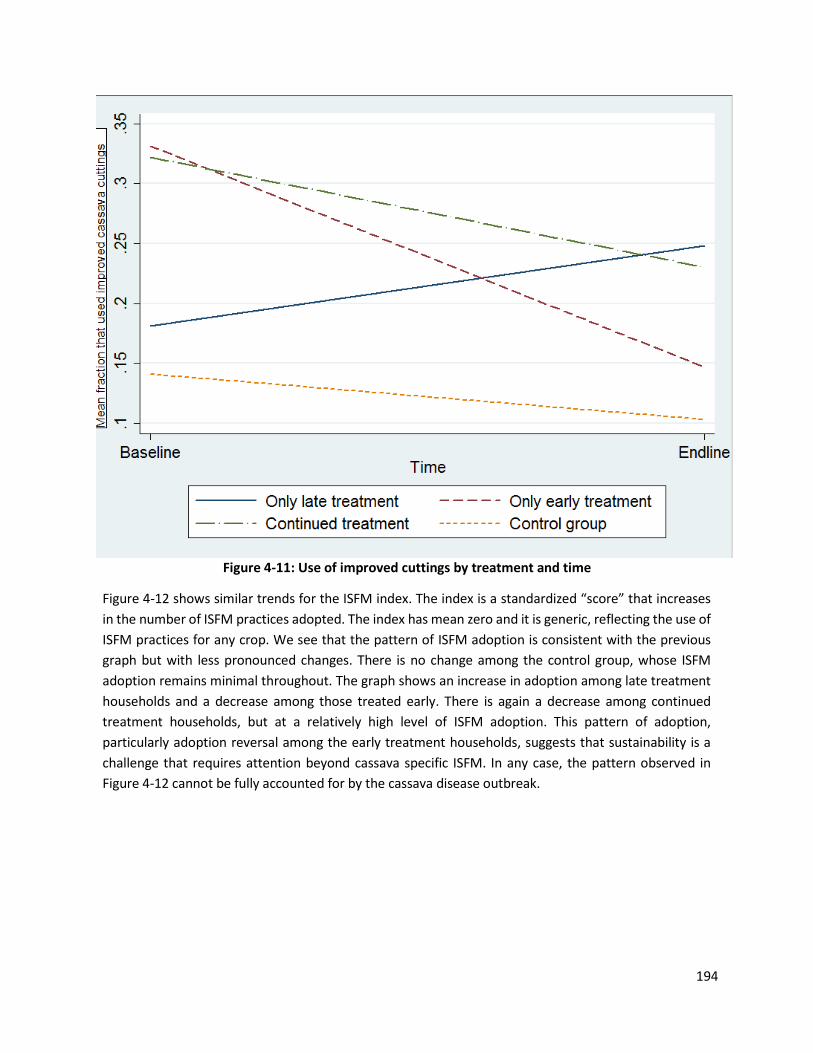
Figure 4-11: Use of improved cuttings by treatment and time
Figure 4-12 shows similar trends for the ISFM index. The index is a standardized “score” that increases in the number of ISFM practices adopted. The index has mean zero and it is generic, reflecting the use of ISFM practices for any crop. We see that the pattern of ISFM adoption is consistent with the previous graph but with less pronounced changes. There is no change among the control group, whose ISFM adoption remains minimal throughout. The graph shows an increase in adoption among late treatment households and a decrease among those treated early. There is again a decrease among continued treatment households, but at a relatively high level of ISFM adoption. This pattern of adoption, particularly adoption reversal among the early treatment households, suggests that sustainability is a challenge that requires attention beyond cassava specific ISFM. In any case, the pattern observed in Figure 4-12 cannot be fully accounted for by the cassava disease outbreak.
194
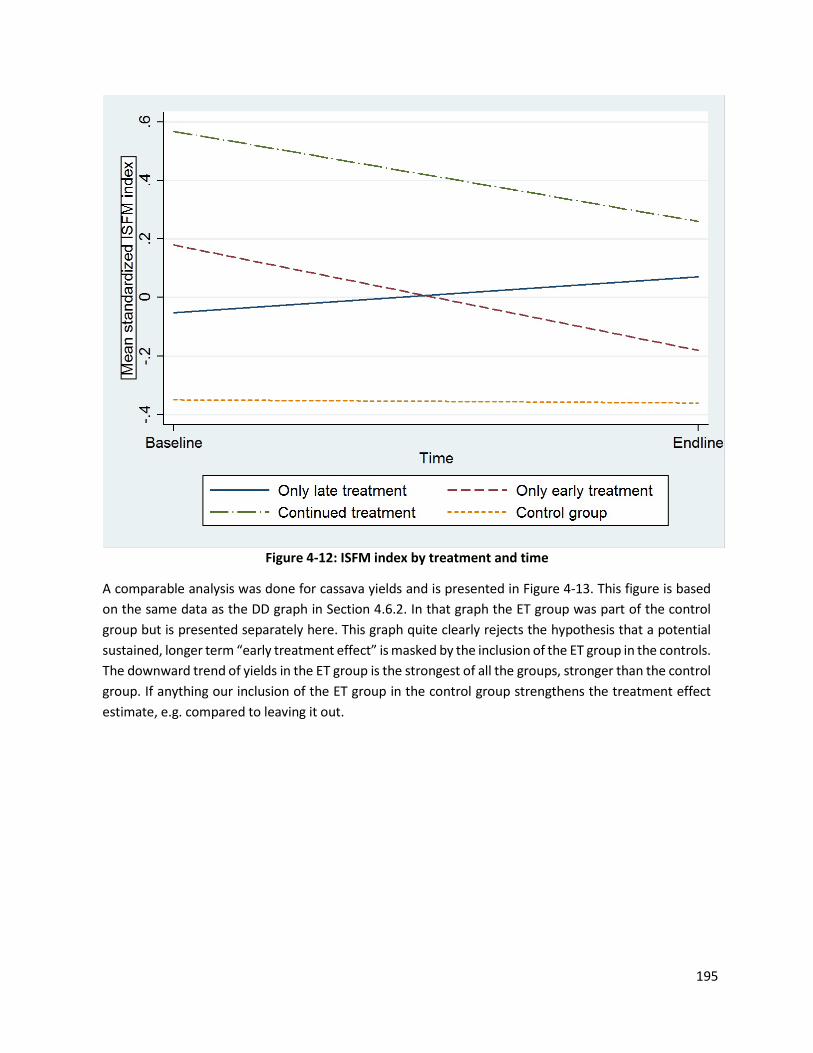
Figure 4-12: ISFM index by treatment and time
A comparable analysis was done for cassava yields and is presented in Figure 4-13. This figure is based on the same data as the DD graph in Section 4.6.2. In that graph the ET group was part of the control group but is presented separately here. This graph quite clearly rejects the hypothesis that a potential sustained, longer term “early treatment effect” is masked by the inclusion of the ET group in the controls. The downward trend of yields in the ET group is the strongest of all the groups, stronger than the control group. If anything our inclusion of the ET group in the control group strengthens the treatment effect estimate, e.g. compared to leaving it out.
195

Figure 4-13: Mean yield by treatment and time
196
5. Synthesis
In this chapter we present our conclusions related to the evaluation questions and the hypotheses. 5.1 Conclusions
In Chapter 3 and 4 we presented the results of the end line evaluation regarding the project portfolio and the quantitative impact analysis of agricultural intensification programmes, including the CATALIST-2 project. In this section we will summarize our conclusions. In Section 5.2 we present the hypotheses and reflect on the results.
5.1.1 EQ1: Composition and motivation of Dutch food security programme
The 14 analyzed projects in the EKN project portfolio show contributions of varying extent to the improved food security of beneficiaries in Rwanda. Prior to the food security policy set out in the MASP 2012-2015 and 2014-2017, six of the projects were already part of the previous EKN programme, which was not directly linked to food security. As a result, several projects did not have a clearly defined food security objective, even if they were grouped during implementation into the EKN food security programme. Consequently, some project implementers did not focus directly on food security in the implementation of their activities. Nevertheless, most projects did contribute to food security because they impacted food availability, food access and in a single case food use, employing interventions such as improved farming practices, job creation and/or capacity building. In our opinion it would have been more effective to ask project implementers to define clear food security objectives at the start of each project or when the focus of the EKN programme changed, in order to be able to better monitor the food security results and impact and allow for steering the projects towards these objectives.
When commenting on the link between the Dutch strategy and the broader food security in Rwanda, we observed that, with the chosen strategy, EKN supports the national policy on food security of the GoR. Rwanda aims to transform from an agriculture-based economy into a modern service-oriented urban society. This has been underlined by EKN in the MASPs. By supporting projects related to capacity building and agro-processing, EKN contributed to GoR’s national strategy. We conclude that EKN has been able to successfully align its own strategy to the national policy in order to ensure an added value for the national policy and contribute to the sustainability of the interventions.
5.1.2 EQ2: Instruments and synergies in Dutch food security programme
In 12 projects EKN chose to collaborate with other donors and GoR. This is a good way to achieve large impact and diminish overhead costs for starting up a project and monitoring & evaluation. It should be noted that results achieved in projects with other donors are a joint effort of all the donors and, therefore, cannot solely be attributed to the EKN investment.
Zooming in on the instruments, Rwanda has organized its food security strategy via various channels and levels. EKN did follow a similar approach with the food security programme and projects that had impact on several levels: central government (for example RNRA, EARP, LODA), decentral government
197
(districts), semi-government institutions (PSD), cooperatives (farmer groups) and local population (food insecure people). This has been visualized in chapter 3.
Based on our analysis we conclude that there is a distance to the food insecure people, being the intended ultimate beneficiaries of the EKN programme. The majority of the projects used intermediate beneficiaries to reach the food insecure and were not targeting the food insecure directly. The combination of instruments and target groups observed in these projects is aimed at, on the one hand, influencing “top-down” Rwanda’s institutional environment and, on the other hand, “bottom-up” the daily food security situation of the food insecure. Almost all EKN projects were using the intermediate approach to reach food insecure people. Even when projects were found to be working with cooperatives or farmer groups, we observed that the majority of people participating in those groups are not food insecure. They are in most cases people that were amongst those better off in their community. However, in some cases it was the explicit ambition of project implementers to create a trickle-down effect using a capacity building or train-the-trainer approach as an intervention to accomplish knowledge sharing and ultimately reach the food insecure. During focus group discussions with members of cooperatives targeted by Consolidation of Marshlands and CATALIST-2 we learned that the farmers were teaching their neighbours or others some of the acquired knowledge, as well as sharing high-quality seeds they received through the project. However, in projects such as SPARK’s ‘Cooperative Support Programme’ it was concluded by external evaluators that the expected trickle-down effect did not occur and other than cooperative managers, few others in the cooperatives were reached by the project. These examples show that the “intermediate” approach to targeting the food insecure did not work out as expected in all projects.
Furthermore, we observed that projects targeting the GoR or intermediate institutions sometimes had difficulties to single out project effects and direct numbers of beneficiaries. This is understandable when we distinguish between the top-down and bottom-up approach as described above. Even though EKN defines as one of the programme outputs (output 2) ‘strengthening capacity of government agencies, sector and discussion fora’, project assessments in BeMos could state more clearly why and how these results can be reached, what the target group is and how project interventions will thus influence the final beneficiary, being food insecure people. This would have helped to monitor project results down to the food insecure and be able to comment if the food insecure have been reached by the chosen intervention. The question whether or not this chosen approach was a good one is all the more salient, since many projects under output 2 did not achieve the anticipated outcomes.
5.1.3 EQ3: Costs per beneficiary and cost per output
When trying to define the costs per beneficiary and per output we faced several challenges. First, at the endline stage of the evaluation seven projects were still ongoing and the final costs were not yet known. Second, the information about the direct and indirect beneficiaries was not always completely available and did cover in most cases the whole project period, when available. Third, information about the EKN costs was not always available and differed per source. We eventually decided to use the financial information received from IOB for the total project amounts disbursed. Fourth, even if
198
some projects do give information about the direct beneficiaries, the results and effects cannot be attributed solely to EKN, since EKN is in most of the projects one of several other donors. Finally, there was no record of how many direct or indirect beneficiaries in each were actually food insecure at the start and end of the project. With these limitations in mind, we were able to do a costs- per-beneficiary calculation, of which the results are reported in Section 3.6.2.
The project with the lowest number of direct beneficiaries was the PROSKID project (966), which was also the project with the highest costs per beneficiary being € 4,347.83. The project with the highest beneficiaries reached was the Land Tenure project with 7,164,676 direct beneficiaries and the lowest costs per beneficiary, being € 9.20. In this project multiple donors were involved and the EKN contribution was 23,11%.
On average the EKN programme expenditures related to the 8,331,024 beneficiaries were € 19.91. The expenditures for the EKN direct beneficiaries being 1,947,855 people are on average € 85.17. We also compared the average costs per beneficiary for the different EKN outputs, which showed that projects contributing to EKN outputs 1 and 2 were less costly per beneficiary than the single project under output 3 (the UNICEF Access to Food for Young Children project). As the UNICEF project was still on-going at the time of the evaluation, we recommend a quantitative impact evaluation to assess how these relatively high costs compare to the development impact realised by the project.
For the Rwandan cassava cluster of CATALIST-2, direct project costs (contracts, meetings and cassava cuttings) are reported at Rwf 326,597,213. This amounts to a cost per direct beneficiary of Rwf 25,329 or about € 33, which implies costs well below the average of the EKN programme portfolio.
5.1.4 EQ4: Effects of the programme on food security
While most project implementers are aware that EKN intends to make a positive impact on food security, they have more often than not limited themselves to implementing their own project outputs and monitoring those. As mentioned earlier, in many cases the projects did not have an explicit food security objective. However, they had an impact on food security via enabling factors such as job creation or infrastructure. When asked whether or not outcomes required for making an impact on food security have materialized, project implementers often did not have any evidence to support a conclusion. Most mid-term reviews and evaluations have not covered food security impact, but in some cases provide indirect evidence. We observed that the project implementers were using different formats to report back. It would have been better to use a consistent format for all the projects or ask project implementer to report explicitly about food security in their mid-term and annual reports. Neither project implementers nor EKN reported baseline measurements at outcome level at the start of the projects, which makes it difficult to put effects into perspective and to evaluate the impact of the results, especially related to food security, which can only be achieved at the end of the results chain of a project. Nor did the projects specifically report about the achievement of their project output in relation to the three food security outputs specified in EKN’s intervention logic.
When zooming in on the achieved outcomes per EKN output indicator, we can conclude that for EKN output 1 ‘Improved infrastructure to produce, process, distribute and prepare food’ there are
199
indications that the projects had a positive impact on food security. The use of relatively cheap labour force in these projects to support the poorest in the society contributed to an increase of income of the beneficiaries and better access to food. In addition, through the infrastructure built, it is now possible to easily transport food and enable better post-harvest handling via e.g. warehouses and processing plants in some of the agricultural value chains. In this way the food access and food availability have improved as well. We caution the reader that for more than half of the projects under output 1, we find that the observed results are not necessarily linked to the projects.
Despite these achievements, we do have some critical notes about the sustainability of the achieved effects. First, since there is no baseline information available at outcome level, we do not know for sure if the beneficiaries were all food insecure at the start of the project. We are aware that most participants in the ‘cash-for-work’ projects (output 1) are classified as being the poorest in society, but this is not the case for projects related to energy or capacity building. For example, we have no evidence that the interns in the TVET project or capacity building projects were (moderately or severely) food insecure. Second, the increased income was earned during a relatively short period of time. Since no follow-up evaluations at beneficiary level have been performed we cannot tell if the beneficiaries are still benefiting from the fact that they contributed to one of the projects, or if the effects were only limited to that specific period in time.
For EKN output 2 ‘Strengthened capacity of government agencies, private sector and discussion fora’ the effects on food security are less tangible and direct. We acknowledge the importance of capacity building to embed the objective of improved food security in the country’s policies and institutions and thus contribute to sustainability. However, project outputs in the output 2 projects were not fully achieved. In addition, the beneficiaries of the projects were not food insecure and it is the question if any trickle-down effect took place to reach food insecure people. Furthermore, we noticed in projects related to output 2 that financial literacy is still a challenge. Beneficiaries in businesses and cooperatives were not yet familiar with working with loans and in several projects (Skills development and employment protection, Professionalization of Skills Development and Cooperatives Support Programme), loans were by and large not (fully) repaid by farmers or businesses. This has been explained by interviewees by the fact that the HIMO approach and other forms of monetary support, giving people cash for work or grants without asking for repayment, have been widely used in Rwanda. Working with commercial (or soft) loans that need to be repaid requires a different mind-set that has to be stimulated with beneficiaries and through the GoR in order to have effective loan systems working and to modernize the economy
The single project related to EKN output 3 ‘Better access to healthy food for very young children’ is still in progress. Intermediate results indicate that malnutrition of small children is decreasing. The food availability of participating families is also improving with the learned farming techniques.
In summary, the EKN projects related to output 1 and output 3 did have the most impact on food insecure beneficiaries and on improving their food security situation.
Evaluation question 4 has been specified as a series of effect questions in the project theory of change
200
for the quantitative impact evaluation. These questions were answered in Chapter 4. We summarize our headline findings here.
5.1.5 Quantitative case study: Effects of Farmer Field Schools
The quantitative impact analysis focused on villages and households that were targeted by ISFM trainings of the farmer field school type. The village sample included communities benefitting from the more ambitious CATALIST-2 programme during the study program. This impact analysis used panel data collected at household and community level at baseline (March 2014) and endline (March 2016). A difference in differences regression framework was employed to create a credible counterfactual so that observed changes can be attributed to the impact of the programme.
Cassava growing farmers have adopted a small number of ISFM farming practices as a result of the (CATALIST-2) ISFM training interventions, particularly chemical fertilizer for cassava and the use of improved cuttings for cassava cultivation. As a likely result of the programme participating farmers have suffered less damage to their harvest.
In terms of cassava production, the ISFM training interventions had a positive impact on the decision to engage or remain engaged in cassava cultivation. However, there are no impacts on other indicators such as the amount of land allocated to cassava cultivation, nor on the yields, total production, or amount sold. Also, no impact was found on the cassava market price, the cassava production value or the total production value of crops produced by farmers. As a likely result, the analysis also does not find an impact on a set of household income measures, including total income, net total farm income, total other income and net profit per hectare. The only exception is the finding of a positive effect on total income for farmers that are member of a cooperative and participated in the trainings. However, this is explained by an increase in total other income, not by farm income.
The analysis does not find ISFM training intervention impacts using a variety of food security and nutrition indicators. However, a significant treatment effect on the number of times that children under 15 years ate per day is found, with an effect size of close to 0.5 meals per day.
For the subgroup of food insecure households, we find a slightly larger effect on the probability to grow cassava; and we find a significant negative treatment effect on women being (moderately) undernourished. We find some evidence of indirect effects of the ISFM trainings on non-participants. Farmers that have heard of the programmes are more likely to use improved cuttings and grow cassava, but they (also) do not have higher yields or incomes. In further sub-group analysis we find evidence of positive impact on cassava sale prices for female headed households, especially when ISFM training is combined with business training (as in the CATALIST programme).
The Focus Group Discussions (FGDs) provide a more positive narrative of the project impact than the quantitative evaluation. The FGD respondents report, a.o., increases in use of improved seeds; increases in land used for production; increases in production and income; and increases in the number of meals. While some of these FGD statements are echoed in the quantitative findings (e.g., the increased number
201

of meals), the impacts on production and income are not. There are a number of possible explanations for this apparent contrast. First, both of the villages selected for the FGDs were part of the CATALIST-2 programme, while the quantitative impact evaluation has a much broader scope. Secondly, the FGD interview data come from two villages whereas the survey data cover 134 villages; even with randomly sampled villages, the average experience in a small sample of two villages is likely to be different due to chance (sampling error). Third, the method of inquiry is quite different between the two approaches. In the survey, respondents are asked about the levels of inputs, investments, production and income at two different points in time, with a maximum recall of 12 months. In the FGDs, respondents are asked about changes rather than levels; and in addition are asked directly about attribution of these changes to the project. Finally, the respondents in the FGDs were not sampled randomly but purposively selected as having participated in the IBAKWE trainings or as non-participants. This non-randomness shows from the high IBAKWE name recognition among beneficiaries participating in the FGDs. Such familiarity with the program may reflect, on the one hand, a truly better than average experience; on the other, it may also provide an incentive to speak more positively about the programme.
5.1.6 Reflection and recommendation EKN food security programme
The Dutch embassy in Kigali used the projects in the programme to support the pathway as set out in the intervention logic. Overall, we see that impact on food security has been made (except for projects under output 2) and that with the EKN projects good results have been achieved. EKN tried to use several pathways to achieve improved food security, on the one hand via enabling factors that support food availability and food access, on the other way through capacity building and food use of malnourished children. The selected projects could have been more clearly linked to the food security objective of EKN, even if some projects already started under another programme.
In the approach EKN could have been more specific in defining the intended ultimate beneficiaries of each project. Especially in projects that are related to capacity building of GoR or cooperatives, the final users were staff members or farmers that were not directly food insecure. In these projects we have not found the intended trickle-down effect to the food insecure people. We recommend to clearly define in the BeMos of new projects how the direct beneficiaries of the project are supposed to reach the final beneficiaries in order to have a better insight in the impact of the projects.
Furthermore, we noticed that important instruments to measure impact and monitor the progress of the project were not fully established. The step from the EKN outputs to the country outcome more food and nutrition security cannot be proved since monitoring data on outcome variables, such as income spent, are not available. The income of project beneficiaries may have increased, but it is not sure whether they have spent the extra money on buying food or buying land to produce more food or on other things such as clothing, education, health insurance or transport, as we have seen in some projects. Many projects lacked a baseline study, which made the starting point unclear. Also, in the mid- term reviews and annual reports external consultants were not asked to report about food security and the way the projects contribute to it. On top of that, some project implementers did not even know their projects were part of the food security programme. It is advisable that EKN requires project implementers to conduct a baseline study at the start of the project, focused on
202

the situation of the intended beneficiaries. EKN should also inform the project implementers about the EKN policy related to the project and ask the project implementers to report back on how the project contributes to the EKN objectives, in this case food security. In addition, monitoring and evaluation would be more accessible if the projects were using the same format to collect output and outcome information, direct and indirect beneficiaries and/or financial information about the project.
Finally, sustainability remains an important point of attention in the projects. Except for projects that revolved around training or capacity building (e.g. PAREF, CATALIST, Capacity building for Food Security, and others), the sustainability of the results achieved will depend on whether continued funding will be made available to maintain the capital investment of the projects (e.g. roads, electricity infrastructure). For the farmer field school projects studied in Chapter 4, including CATALIST, the evidence suggests that uptake of improved cassava varieties and yields dropped sharply in the two years after participating in the trainings. However, it is hard to filter out the negative impact of the cassava disease outbreaks during this period.
In some projects (e.g. Land Tenure Regularization), continued funding has thus far not been committed by either EKN or GoR, which creates a significant risk that the results will not be sustained. On the other hand, there is a valid question how much longer EKN will have to support certain projects. Some projects already had one or more follow-up projects (e.g. EARP, PAREF or Infrastructure investments) and at a certain point the strengthened capacity should be sufficient for the GoR or project implementers to continue their efforts without external support. We conclude that sustainability warrants more attention in developing new EKN projects and firm commitments from project implementers and GoR are required to get sufficient comfort that sustainability will be assured.
5.2 Hypotheses 5.2.1 Impact hypotheses:
1. Projects that contribute to a rural enabling environment (agro-processing, infrastructure etc.), also contribute to improved food security.
There is support for this hypothesis. We have seen in several projects focusing on enabling environment, such as Infrastructure Investments, HIMO PDED II, Consolidation of Marshlands and Electricity Access roll-out programme that the enabling environment plays an important role to improve food security of beneficiaries, even if the effects are indirect and in some cases short-run. As noted, a limitation of the portfolio analysis is that attribution of observed outcomes to a particular project remains a challenge. Though food security might not be the primary objective of the project, the result is that the infrastructure helps to increase food availability by the construction of terraces, dams, roads warehouses or providing of electricity for cooling installations. The available food increases, and also the implementation through manual labour force helps to realize an increase of income (if the income is spent on food), even if only for a short period of time and not sustainable in nature. The infrastructure built, however, remains sustainable and is being reused, continuing to create the enabling factors to have better availability of food. In addition, there is evidence that the enabling infrastructure in the ‘Consolidation of Marshlands’ project contributed to higher productivity of rice and diversified crops. Thus, enabling infrastructure has been shown to contribute to increased
203
productivity, food availability, stability and utilization.
An important point for attention remains, however, that maintenance of this infrastructure requires special attention, to have long-term sustainable results. In addition the effects of the increased income via the HIMO approach seem to be temporary and are not contributing to food stability in the long term.
2. Focusing on any activity dealing with farmers will have an impact on food security.
We have not found support for this hypothesis. First of all, it should not be assumed that farmers are generally food insecure. Not all the farmers are the same in this respect and with the decreasing numbers of food insecure households in Rwanda, interventions should be more precisely targeted to reach those who need them most. Especially farmers who are part of a cooperative are much more likely to be food secure than farming households not involved in cooperatives. Also, the additional income earned through e.g. HIMO projects is not always used to buy more food or other food that is not grown by the farmers; it is often spent on education or other things that do not influence the food security of the farmers in the short term.
In most cases, however, dealing with farmers does increase the agricultural productivity and income of farmers involved and improves their food security situation in addition to increasing the amount of food available on the market. For example, in the ‘Support for land tenure’ project land rights increased the incentives to invest and manage land responsibility, thereby increasing food productivity. More certainty about who owns which land also makes giving loans to farmers more attractive to banks, which could also increase agricultural productivity in the long run. Other examples are the ‘Consolidation of marshlands’ project where improving marshlands led to temporary jobs and increased agricultural yields for farmers, which contributes to food security. However, as mentioned before, it is not proven that the farmers involved in the cooperatives and Water user organizations were food insecure. Finally, we have seen in several projects that external factors relating to farming, such as the cassava disease or bad seeds, can also negatively influence the food security of farmers as a result of the project interventions, even though this was not intended. In summary, while some activities dealing with farmers who are food insecure can have a very positive direct impact and others dealing with food secure farmers but increasing agricultural productivity can yield indirect benefits for the food insecure, it is by no means a given that targeting farmers always improves food security.
3. Increased income improves food consumption in terms of both quantity and nutritional quality.
There is some support for the first part of the hypothesis. Increased income has shown in some projects to lead to improved food access and is thus likely to result in consumption of larger quantities of food. We did not find any evidence of better quality of food that is purchased with the extra income. Only that more and different food (for example crops that a famer does not grow himself) could be purchased.
In addition, three hypotheses for the ISFM training/CATALIST-2 interventions have been formulated. We offer the following conclusions.
1. The training programmes lead to sustained changes in agricultural practice and entrepreneurship.
204
The impact analysis shows that the ISFM/CATALIST-2 training programmes result in adoption of selected new farming techniques. There is also a positive impact on the likelihood that a household grows cassava, against a general trend of declining cassava production. The analysis covers a two- year period where the key crop discussed during the trainings, cassava, suffered from a disease epidemic. It is not clear that the changes in agricultural practices are sustained after the programme ends.
2. The changes in agricultural practice and entrepreneurship result in improved household income.
The impact analysis does not find a significant ISFM/CATALIST-2 treatment effect on the majority of income variables used. This null result is found for aggregate income variables, including total income, farm income and agricultural profit, as well as for specific elements such as cassava production, cassava yield and cassava market price. At the same time expected negative time trends for cassava production are found. There are also no significant effects on yields of the other main crops (beans, sorghum, maize).
3. Increased household production ( income) improves food consumption (quantity and nutritional quality) in a manner that benefits all household members, including infants and women.
At project impact level, there is a positive significant treatment effect on the number of meals taken by children. Also, there is a decrease in undernourishment among women in food insecure households. At a more aggregate level, we find evidence of positive correlations between household cassava harvest and several indices of nutritional adequacy.
5.2.2 Approach hypotheses:
1. The embassy assures synergy between the Dutch FS programme and the programme of other actors (Government of Rwanda, main other donors).
This is correct. Programmes of EKN and GoR are aligned, as concluded in response to evaluation question 2.
2. There is synergy between FS and other Dutch policy objectives: Involvement of Dutch expertise and private sector result in win-win situations.
We did not see involvement of Dutch expertise and private sector in the evaluated projects. We only saw at the start of the programme that MDF and Wageningen University were involved in providing input to the food security programme. Also, Dutch capacity-building institute EP-Nuffic ran a project in Rwandan “higher institutions of learning using multiple approaches including vocationalisation of food security”.75 Involvement of Dutch expertise in the evaluated projects was not found.
75 Dr. Mercyline Kamande and Mr. Eugene N.Gatari (2015). Medium Term Evaluation for the Food Security Capacity Building Project for Rwanda: Final Report. August 2015, page 12.
205

6. References
Alderman, H. and King, E.M. (2006). Investing in Early Childhood Development. Research brief available at http://econ.worldbank.org/WBSITE/EXTERNAL/EXTDEC/EXTRESEARCH/0,,contentMDK:21035311~pagePK:64165401~piPK:64165026~theSitePK:469382~isCURL:Y,00.html.
Andrianjaka N. and Milazzo A. (2008). “Highly Labor-Intensive Public Works in Madagascar: Issues and Policy Options”. Social Protection Discussion Paper. No 0836, The World Bank.
Asian Development Bank. (2009). Good Practice in Technical and Vocational Education and Training, ADB, Manila, retrieved from: http://www.adb.org/publications/good-practice-technical-and-vocational- education-and-training
Beegle, K., De Weerdt, J., Friedman, J., & Gibson, J. (2012). Methods of household consumption measurement through surveys: Experimental results from Tanzania. Journal of Development Economics, 98(1), 3-18.
CIA World Factbook, https://www.cia.gov/library/publications/the-world-factbook/geos/rw.html
Compact 2025. (2016). Rwanda. Ending Hunger & Undernutrition. Challenges & Opportunities. Draft Scoping Report for Roundtable Discussions. March 2016. Retrieved from: http://www.compact2025.org/files/2016/03/Rwanda_Draft_Scoping_Report_03.pdf
Devereux, S. (2016). Social protection for enhanced food security in sub-Saharan Africa. Food Policy 60, 52-62.
EKN, Kigali. Multi-annual strategic plan (EKN MASP) 2012 – 2015. EKN, Kigali. Multi-annual strategic plan (EKN MASP) 2014 – 2017.
Food and Agriculture Organization of the United Nations (FAO) (2009). How to Feed the World in 2050.
Food and Agriculture Organization of the United Nations (2010). Cassava Diseases in Africa: a major threat to food security. Rome, Italy.
FAO and WHO (2014). Vitamin and mineral requirements in human nutrition. Second edition.
FAO, IFAD and WFP. (2015). The State of Food Insecurity in the World 2015. Meeting the 2015 international hunger targets: taking stock of uneven progress. Rome, FAO. Retrieved from: http://www.fao.org/3/a-i4646e.pdf
FAO. (2016, 27 April). GIEWS Country Briefs. Rwanda. Accessed on: http://www.fao.org/giews/countrybrief/country.jsp?code=RWA&lang=en
Freire, Paulo (2005). Pedagogy of the Oppressed, 30th anniversary edition. Continuum International Publishing Group Inc.: New York.
206
Government of Rwanda. (2012). Third Health Sector Strategic Plan 2012-2018. Ministry of Health. Retrieved from: http://www.moh.gov.rw/fileadmin/templates/Docs/HSSP_III_FINAL_VERSION.pdf
Government of Rwanda. (2013). National Food and Nutrition Strategic Plan 2013-2018, draft version, 29 October 2013. Retrieved from: https://extranet.who.int/nutrition/gina/sites/default/files/RWA%202013%20National%20Food%20and%20Nutrition%20Policy%20(Draft).pdf
IFDC and partners (2013). CATALIST-2 Workplan.
IFDC and partners (2016). CATALIST-2 Workplan.
King, K. (2013). TVET and Skills Development: Some Reflections on Concepts and Discourse. In: K. King. 2012: The Year of Global Reports on TVET, Skills & Jobs Consensus or Diversity? Norrag News 46, 5-9. Retrieved from: http://www.norrag.org/fileadmin/Full%20Versions/NN48.pdf
Kwibuka, E. (2016). Rwanda: New Policy Tailors TVET to Labour Market Needs. Allafrica. 8 February 2016. Accessed on: http://allafrica.com/stories/201602080170.html
McCord, A., 2012. Public Works and Social Protection in Sub-Saharan Africa: Do Public Works Work for the Poor? United Nations University Press, New York.
Ministerie van Buitenlandse Zaken, Nederland. ‘Kamerbrief over Nederlandse inzet voor wereldwijde voedselzekerheid’, 18 November 2014, retrieved from: https://www.rijksoverheid.nl/documenten/kamerstukken/2014/11/18/kamerbrief-over-nederlandse- inzet-voor-wereldwijde-voedselzekerheid
Ministry of Agriculture and Animal Resources (MINAGRI). (2013). National Rice Development Strategy (2011-2018). Revised edition August 2013. Retrieved from: http://www.riceforafrica.net/images/stories/PDF/rwanda_revised_aug2013.pdf
Ministry of Finance and Economic Planning of the Republic of Rwanda. Economic Development and Poverty Reduction Strategy II (EDPRS2) 2013-2018, May 2013. Retrieved from: http://www.minecofin.gov.rw/fileadmin/templates/documents/NDPR/EDPRS_2.pdf
Ministry of Finance and Economic Planning of the Republic of Rwanda. RWANDA VISION 2020, 2000. Retrieved from: http://www.sida.se/globalassets/global/countries-and- regions/africa/rwanda/d402331a.pdf on 05-05-2016.
Ministry of Foreign Affairs of the Kingdom of the Netherlands, IOB evaluation. Access to Energy in Rwanda, impact evaluation of activities supported by the Dutch Promoting Renewable Energy Programme.
Ministry of Health of the Republic of Rwanda. Third Health Sector Strategic Plan July 2012- June 2018.
207

Ministry of Health (MOH) of the Republic of Rwanda. (2014). Rwanda National Food and Nutrition Policy Executive Summary. 3rd National Food & Nutrition Summit 2014. Retrieved from: http://moh.gov.rw/fileadmin/templates/summit/food_policy.pdf
Ministry of Local Government. (2008). National Labour Intensive Public Works (HIMO/LIPW) Strategy. Retrieved from: https://www.ilo.org/dyn/natlex/docs/ELECTRONIC/98537/117302/F-1141199772/RWA- 98537.pdf
National Institute of Statistics Rwanda. Demographic and Health Survey 2010 final report, February 2012.
National Institute of Statistics Rwanda. Demographic and Health Survey 2014/2015 key findings, June 2015.
National Institute of Statistics Rwanda. Demographic and Health Survey 2014/2015 Key Indicators, June 2015.
National Institute of Statistics Rwanda. GDP data, sector contribution to GDP.
OECD. (2016). Workbook OECD DAC aid at a glance. Rwanda. Last update 27 February 2016. Accessed on: https://public.tableau.com/views/OECDDACAidataglancebyrecipient_new/Recipients?:embed=y&:display_count=y es&:showTabs=y&:toolbar=no?&:showVizHome=no
Republic of Rwanda. (2015). TVET Policy. September 2015. Retrieved from: http://www.wda.gov.rw/sites/default/files/TVET%20Policy.pdf
Robert Chambers (2007). From PRA to PLA and Pluralism: Practice and Theory.
Schrader (2013): “Why Megaclusters?”, mimeo.
Schrader, T., Twilingiyumukiza, J., Mbonyinshuti, M. and Rudiger, U. (2013): “Catalysing competitive, sustainable and inclusive cassava value chains”.
Sleicher, A. (2013). Transforming Education into Better Jobs and Better Lives. In: K. King. 2012: The Year of Global Reports on TVET, Skills & Jobs Consensus or Diversity? Norrag News 46, 61-62. Retrieved from: http://www.norrag.org/fileadmin/Full%20Versions/NN48.pdf
Stewart, R., Erasmus, Y., Zaranyika, H., Rebelo Da Silva, N., Korth, M., Langer, L., Madinga, N., Randall, N. and De Wet, T. (2015). The Effects of Training, Innovation and New Technology on African Smallholder Farmers’ Wealth and Food Security: A Systematic Review. Campbell Systematic Reviews, 11(16).
Tripney, J.S. and Hombrados, J.G. (2013). Technical and vocational education and training (TVET) for young people in low- and middle-income countries: a systematic review and meta-analysis. Empirical Research in Vocational Education and Training, 2013 5:3. Retrieved from: http://ervet- journal.springeropen.com/articles/10.1186/1877-6345-5-3
208
UNDP, 2015. Rwanda 2014 National Human Development Report. Retrieved from http://hdr.undp.org/en/countries/profiles/RWA
UNDP, 2016. HDR 2015 data on Rwanda. Retrieved from http://hdr.undp.org/en/countries/profiles/RWA
Waddington, H., Snilstveit, B., Hombrados, J., Vojtkova, M., Phillips, D., Davies, P. and White, H. (2014). Farmer field schools for improving farming practices and farmer outcomes: A systematic review. Campbell Systematic Reviews, 10(6), The Campbell Collaboration, Oslo. Available at: http://www.campbellcollaboration.org/lib/project/203/
World Bank. (2015). World Development Indicators. Retrieved from: http://databank.worldbank.org/data/reports.aspx?source=2&country=RWA&series=&period=#
World Food Programme, Rwandan National Institute of Statistics (NISR) and Ministry of Agriculture and Animal Resources (MINAGRI) (2012). Comprehensive Food Security and Vulnerability Analysis and Nutrition Survey 2012. Rome, Italy.
World Food Programme, Rwandan National Institute of Statistics (NISR) and Ministry of Agriculture and Animal Resources (MINAGRI) (2015). Comprehensive Food Security and Vulnerability Analysis 2015. Rome, Italy.
World Food Programme VAM. (March 2016). Global Food Security Update. Accessed from: http://vam.wfp.org/sites/global_update/March_2016/Index.htm
World Health Organization (WHO). (2015). Health in 2015: From MDGs to SDGs. Retrieved from: http://www.who.int/gho/publications/mdgs-sdgs/en/
WHO (2007). Protein and aminor acid requirements in human nutrition.
Project related documentation as received from IOB and EKN Kigali, and project implementers. Information received during focus group discussions
209