Embed Size (px)
Citation preview
Evaluation of the e-rater® Scoring Engine for the GRE® Issue and Argument Prompts
Chaitanya Ramineni
Catherine S. Trapani
David M. Williamson
Tim Davey
Brent Bridgeman
February 2012
Research Report ETS RR–12-02
February 2012
Evaluation of the e-rater® Scoring Engine for the GRE® Issue and Argument Prompts
Chaitanya Ramineni, Catherine S. Trapani, David M. Williamson, Tim Davey, and Brent Bridgeman
ETS, Princeton, New Jersey
Technical Review Editor: Donald Powers
Technical Reviewers: Yigal Attali and Shelby Haberman
Copyright © 2012 by Educational Testing Service. All rights reserved.
CRITERION, ETS, the ETS logo, E-RATER, GRE, LISTENING. LEARNING. LEADING., and TOEFL are registered trademarks of
Educational Testing Service (ETS).
SAT is a registered trademark of the College Board.
As part of its nonprofit mission, ETS conducts and disseminates the results of research to advance
quality and equity in education and assessment for the benefit of ETS’s constituents and the field.
To obtain a PDF or a print copy of a report, please visit:
http://www.ets.org/research/contact.html
i
Abstract
Automated scoring models for the e-rater® scoring engine were built and evaluated for the GRE®
argument and issue-writing tasks. Prompt-specific, generic, and generic with prompt-specific
intercept scoring models were built and evaluation statistics such as weighted kappas, Pearson
correlations, standardized difference in mean scores, and correlations with external measures
were examined to evaluate the e-rater model performance against human scores. Performance
was also evaluated across different demographic subgroups. Additional analyses were performed
to establish appropriate agreement thresholds between human and e-rater scores for unusual
essays and the impact of using e-rater on operational scores. The generic e-rater scoring model
with operational prompt-specific intercept for the issue-writing task and prompt-specific e-rater
scoring model for the argument writing task were recommended for operational use. The two
automated scoring models were implemented to produce check scores at a discrepancy threshold
of 0.5 with human scores.
Key words: e-rater, automated essay scoring, GRE analytical writing, automated scoring models
ii
Acknowledgments
The authors wish to thank Yigal Attali, Neil Dorans, Shelby Haberman, Don Powers, and Cathy
Wendler for their assistance in interpretation of the results; Jackie Briel, Kathy O’Neill, Fred
Robin, Doug Baldwin, Jennifer Bivens-Tatum, and the GRE program for providing the data; and
Vincent Weng, Sailesh Vezzu, Scott Davis, Slava Andreyev, and Waverely VanWinkle for their
assistance with the data and analyses.
iii
Table of Contents
Page
Overview ......................................................................................................................................... 1
Scoring Rules for GRE Writing Tasks .................................................................................... 3
Automated Scoring With the e-rater Scoring Engine .............................................................. 3
Methods......................................................................................................................................... 11
Data ........................................................................................................................................ 11
Construct Relevance .............................................................................................................. 12
Model Building and Evaluation ............................................................................................. 13
Results ........................................................................................................................................... 14
Advisory Analyses ................................................................................................................. 14
Model Build and Evaluation .................................................................................................. 16
Agreement With Human Scores ............................................................................................ 17
Association With External Measures ..................................................................................... 20
Subgroup Differences ............................................................................................................ 21
Models for Implementation ................................................................................................... 22
Impact of Implementation ...................................................................................................... 25
Conclusion .................................................................................................................................... 27
References ..................................................................................................................................... 29
List of Appendices ........................................................................................................................ 33
iv
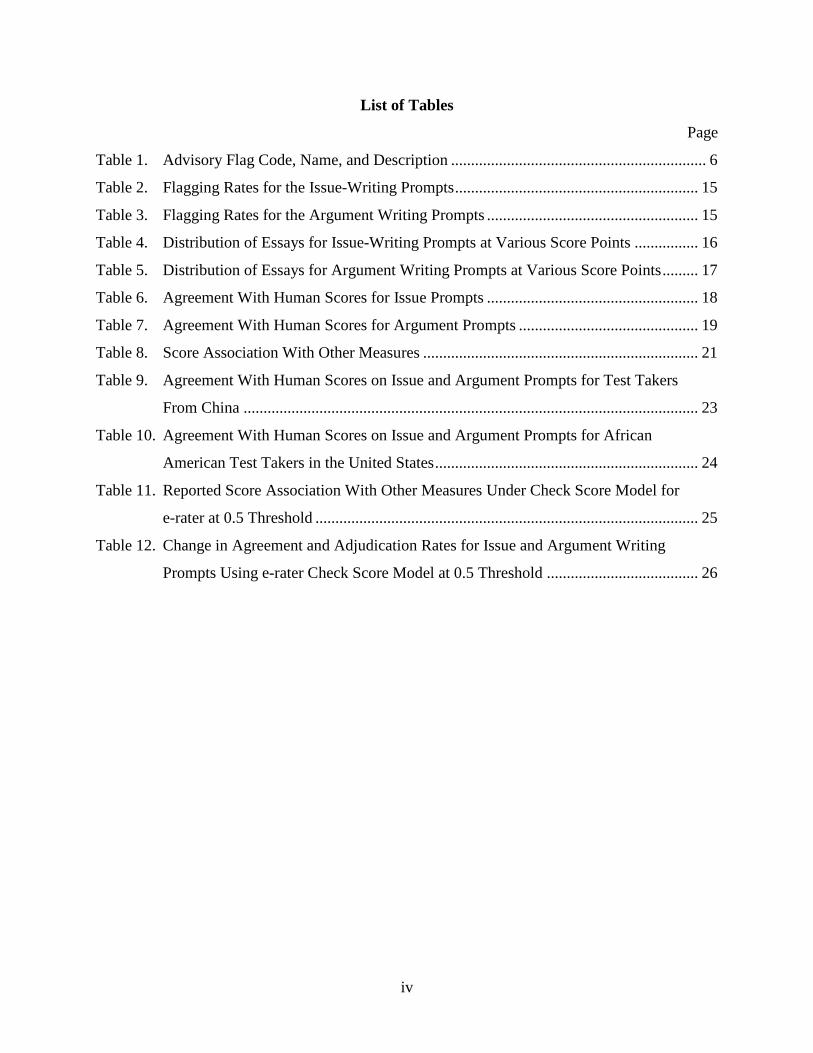
List of Tables
Page
Table 1. Advisory Flag Code, Name, and Description ................................................................ 6
Table 2. Flagging Rates for the Issue-Writing Prompts ............................................................. 15
Table 3. Flagging Rates for the Argument Writing Prompts ..................................................... 15
Table 4. Distribution of Essays for Issue-Writing Prompts at Various Score Points ................ 16
Table 5. Distribution of Essays for Argument Writing Prompts at Various Score Points ......... 17
Table 6. Agreement With Human Scores for Issue Prompts ..................................................... 18
Table 7. Agreement With Human Scores for Argument Prompts ............................................. 19
Table 8. Score Association With Other Measures ..................................................................... 21
Table 9. Agreement With Human Scores on Issue and Argument Prompts for Test Takers
From China .................................................................................................................. 23
Table 10. Agreement With Human Scores on Issue and Argument Prompts for African
American Test Takers in the United States .................................................................. 24
Table 11. Reported Score Association With Other Measures Under Check Score Model for
e-rater at 0.5 Threshold ................................................................................................ 25
Table 12. Change in Agreement and Adjudication Rates for Issue and Argument Writing
Prompts Using e-rater Check Score Model at 0.5 Threshold ...................................... 26
1
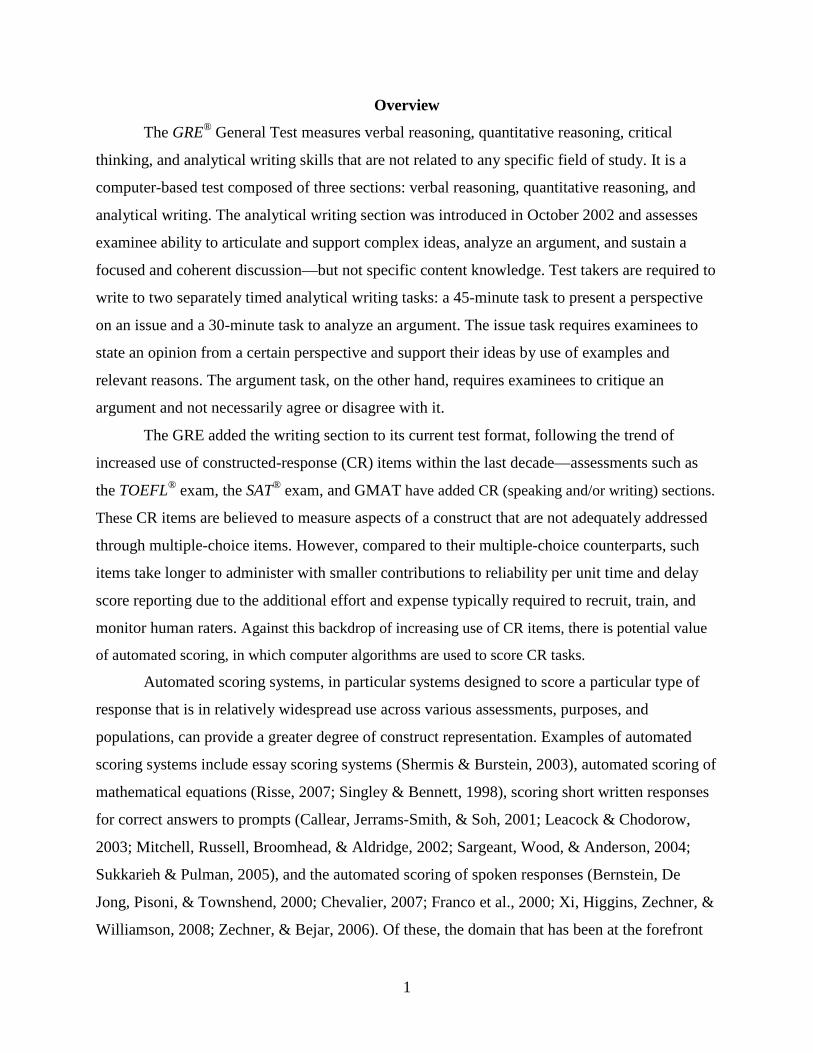
Overview
The GRE® General Test measures verbal reasoning, quantitative reasoning, critical
thinking, and analytical writing skills that are not related to any specific field of study. It is a
computer-based test composed of three sections: verbal reasoning, quantitative reasoning, and
analytical writing. The analytical writing section was introduced in October 2002 and assesses
examinee ability to articulate and support complex ideas, analyze an argument, and sustain a
focused and coherent discussion—but not specific content knowledge. Test takers are required to
write to two separately timed analytical writing tasks: a 45-minute task to present a perspective
on an issue and a 30-minute task to analyze an argument. The issue task requires examinees to
state an opinion from a certain perspective and support their ideas by use of examples and
relevant reasons. The argument task, on the other hand, requires examinees to critique an
argument and not necessarily agree or disagree with it.
The GRE added the writing section to its current test format, following the trend of
increased use of constructed-response (CR) items within the last decade—assessments such as
the TOEFL® exam, the SAT® exam, and GMAT have added CR (speaking and/or writing) sections.
These CR items are believed to measure aspects of a construct that are not adequately addressed
through multiple-choice items. However, compared to their multiple-choice counterparts, such
items take longer to administer with smaller contributions to reliability per unit time and delay
score reporting due to the additional effort and expense typically required to recruit, train, and
monitor human raters. Against this backdrop of increasing use of CR items, there is potential value
of automated scoring, in which computer algorithms are used to score CR tasks.
Automated scoring systems, in particular systems designed to score a particular type of
response that is in relatively widespread use across various assessments, purposes, and
populations, can provide a greater degree of construct representation. Examples of automated
scoring systems include essay scoring systems (Shermis & Burstein, 2003), automated scoring of
mathematical equations (Risse, 2007; Singley & Bennett, 1998), scoring short written responses
for correct answers to prompts (Callear, Jerrams-Smith, & Soh, 2001; Leacock & Chodorow,
2003; Mitchell, Russell, Broomhead, & Aldridge, 2002; Sargeant, Wood, & Anderson, 2004;
Sukkarieh & Pulman, 2005), and the automated scoring of spoken responses (Bernstein, De
Jong, Pisoni, & Townshend, 2000; Chevalier, 2007; Franco et al., 2000; Xi, Higgins, Zechner, &
Williamson, 2008; Zechner, & Bejar, 2006). Of these, the domain that has been at the forefront
2
of applications of automated scoring has been for the traditional essay response, with more than
12 different automated essay evaluation systems available for scoring and/or for performance
feedback and improvement of writing quality. The most widely known of these systems include
the Knowledge Analysis Technologies (KAT) engine 5 (Landauer, Laham, & Foltz, 2003),
e-rater® system (Attali, & Burstein, 2006; Burstein, 2003), Project Essay Grade (Page, 1966;
1968; 2003) and IntelliMetric (Rudner, Garcia, & Welch, 2006). Each of these engines targets a
generalizable approach to the automated scoring of essays, yet each takes a somewhat different
approach to achieving the desired scoring, both through different statistical methods as well as
through different formulations of what features of writing are measured and used in determining
the score. An explanation of how these systems work is beyond the scope of this paper, except
for e-rater, which will be provided later in the paper.
Automated scoring in general can provide performance that approximates some
advantages of multiple-choice scoring, including fast scoring, constant availability of scoring,
lower per unit costs, reduced coordination efforts for human raters, greater score consistency, a
higher degree of tractability of score logic for a given response, and the potential for a degree of
performance-specific feedback that is not feasible under operational human scoring. This, in
turn, may facilitate allowing some testing programs and learning environments to make greater
use of CR items where such items were previously too onerous to support. However,
accompanying such potential advantages is a need to evaluate the cost and effort of developing
such systems and the potential for vulnerability in scoring unusual or bad-faith responses
inappropriately, to validate the use of such systems, and to critically review the construct that is
represented in resultant scores.
The purpose of this study was to develop and evaluate e-rater automated scoring models
for the GRE issue and argument writing prompts. In particular, this study investigated if e-rater
scores could successfully replace one of the two human raters in operational scoring of GRE,
thereby effectively reducing the program costs and ensuring fast and consistent score turnaround
for the large number of test takers and prospective graduate applicants who take the test year-
round at several computer-based test centers in the United States, Canada, and many other
countries.
3
Scoring Rules for GRE Writing Tasks
Under the human scoring process for the GRE program, the writing samples from the
tests were distributed to trained raters who assigned a score to each essay using a 6-point holistic
scale. The scale reflects the overall quality of an essay in response to the assigned task. Each
essay received scores from two trained raters, the scores from the two readings of an essay were
averaged and rounded up to the nearest half-point interval (e.g., 3.0, 3.5). If the two assigned
scores differed by two or more points on the scale, a third rating was obtained and the final item
score was the mean of the three ratings unless the third rating was two or more points on the
scale from one of the two initial ratings, in which case the final item score was the mean of the
two nearest ratings. If the scores were equidistant, for example, 1, 3, and 5, or 2, 4, and 6, or if
any of the ratings was a 0, a more experienced rater was approached for a final score. The final
scores on the two essays were then averaged and rounded up to the nearest half-point interval
and a single score was reported for the test taker’s performance on the analytical writing section.
If the test taker wrote an essay for only one of the two tasks, he/she received a score of zero on
the task for which no response was provided; whereas, if a test taker did not write to either of the
two tasks, an NS (no score) was reported for the analytical writing section. A complete GRE
scoring guide is included in Appendix A.
Automated Scoring With the e-rater Scoring Engine
The computer program, e-rater, scores essays primarily on the basis of features that are
related to writing quality. The initial version of e-rater (Burstein, Kukich, Wolff, Lu, &
Chodorow, 1998) used more than 60 features to assess quality of writing in written assessments.
In e-rater v2 (Attali & Burstein, 2006), the features were combined into a smaller set of features
intuitively linking them to general dimensions of writing quality for scoring. This set of features
is constantly refined and enhanced in newer versions of e-rater, with e-rater v11.1 currently in
operation. The e-rater program primarily emphasizes the characterization of writing quality
rather than the content discussed in the essay, although some content features can be used in the
scoring. It uses natural language processing (NLP) technology to evaluate a number of
characteristics of the essay, including grammar, usage, mechanics, development, and other
features. These characteristics of essay quality are used to derive a prediction of the score that a
human rater would have provided for the same response.
4
Features. E-rater uses 11 score features, with nine representing aspects of writing quality
and two representing content. Most of these primary scoring features are composed of a set of
subfeatures computed from NLP techniques, and many of these have multiple layers of
microfeatures that have cascaded up to produce the subfeature values. An illustration of the
construct decomposition of e-rater resulting from this structure is provided in Appendix B, where
the features encapsulated in bold are the independent variables in the regression and the other
features are an incomplete illustrative listing of subfeatures measuring aspects of writing quality.
The scoring features and subfeatures of e-rater have been mapped to the 6-trait model (Culham,
2003), commonly used to evaluate writing by teachers, by Quinlan, Higgins, and Wolff (2009).
A glossary of all the microfeatures is included in Appendix C.
Grammar, usage, mechanics, and style together identify over 30 error types, including
errors in subject-verb agreement, homophone errors, misspelling, and overuse of vocabulary.
These error types are summarized for each feature as proportions of error rates relative to the
essay length. Organization and development features are based on automatically identifying
sentences in an essay as they correspond to essay-discourse categories: introductory material
(background), thesis, main ideas, supporting ideas, and conclusion. For the development feature,
e-rater evaluates general essay development by identifying how many discourse elements are
present for each category of discourse in an essay. For the organization feature, e-rater computes
the average length of the discourse elements (in words) in an essay. Lexical complexity of the
essay is represented by two features. The first is computed through a word frequency index used
to obtain a measure of vocabulary level. The second feature computes average word length
across all words in the essay and uses this as an index of sophistication of word usage. A new
feature indicative of correct use of collocation and preposition use in the essay was included in e-
rater version 10.1 to support further development of measures of positive attributes of writing
style and ability (Ramineni, Davey, & Weng, 2010).
Two prompt-specific (PS) vocabulary usage features relate to content of vocabulary used
in the essay. Both features are based on the tendency to use words typical of those used in prior
essays. The first feature indicates the score point level to which the essay text is most similar
with regard to vocabulary usage. The second analyzes the similarity of essay vocabulary to prior
essays with the highest score point on the scale. These were revised in the previous version to
include information for all score points in computing the two measures (Attali, 2009).
5
Scoring models for e-rater. Developing e-rater scoring models is typically a two-stage
process: (a) model training/building and (b) model evaluation. Data are split into a model
building set and an evaluation set. Training/building of an e-rater model is a fully automated
process, given a properly constituted set of training essays in the model building set.
A properly constituted set of training essays includes a random sample of responses that
must have been entered on the computer and should be representative of the population for
which e-rater is intended for use. Prior to model build, the selected essay set is subjected to
advisory flag analyses.
A number of advisory flags (acting as filters) have been established that indicate when a
specific essay is inappropriate for automated scoring. Each advisory flag marks a different
problem because of which an essay would be identified as inappropriate for automated scoring.
The use of these flags for an assessment is evaluated by comparing when e-rater considers an
essay inappropriate versus when a human rater considers an essay inappropriate or off topic. All
advisories are evaluated individually as well as combined. That is, individual advisories for
which e-rater is found to effectively (on par with humans) identify essays that are inappropriate
for automated scoring are combined sequentially and subjected to a similar evaluation against
human markings. This process of advisory flag analyses helps determine which group of
advisories aid e-rater in effectively screening for inappropriate essays and should be included as
part of the operational e-rater framework for an assessment. Subjecting the sample of essays to
advisory flagging prior to model build improves quality of model build by filtering the
inappropriate essays from going into the model build phase for e-rater.
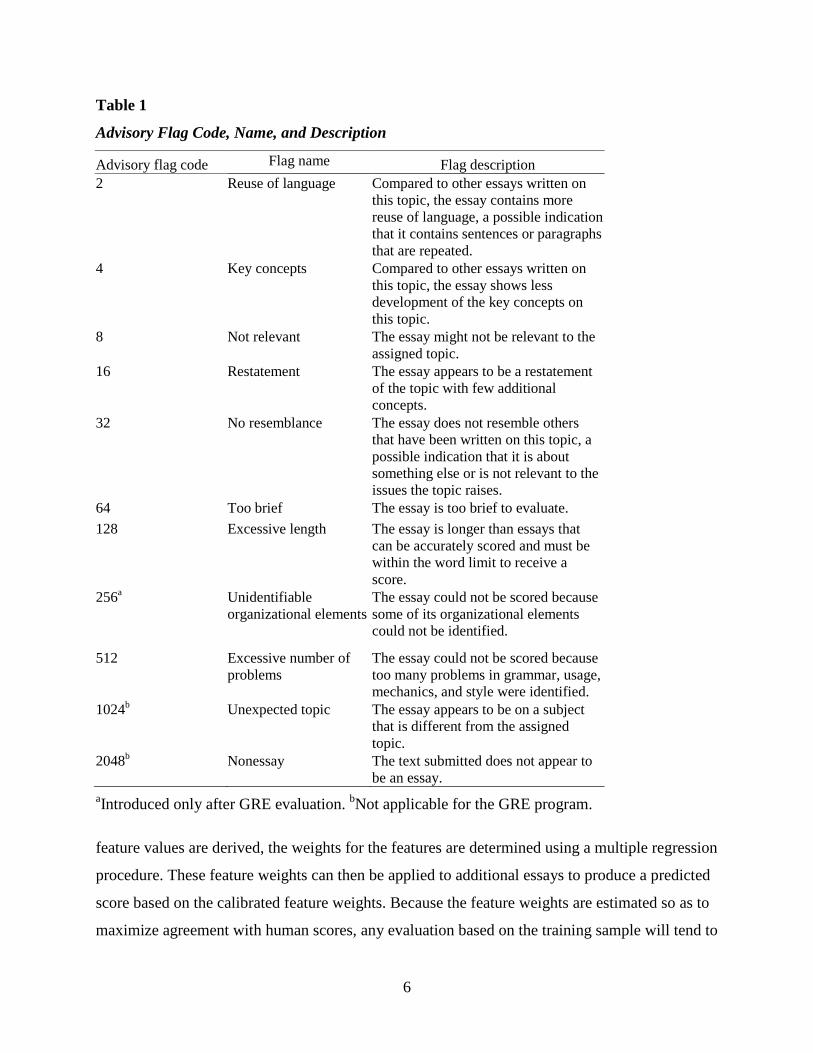
Advisory flags for e-rater are coded depending on the type of issue(s) identified. Table 1
lists the names, a brief description, and binary codes for all the advisory flags. An essay can be
flagged for single or multiple issues. For instance, if an essay contains repetition of words, the
flag will be set to 2 (reuse of language). However, if an essay contains repetition of words and is
not relevant to the assigned topic, the flag will be set to 10, i.e. 2 (reuse of language) + 8 (not
relevant). Flags 64 (too brief) and higher force the engine to assign a score of 0, while the other
flags are provided as warnings.
If no severe advisory flags that would preclude automated scoring were issued, the e-rater
program uses NLP technology to evaluate a number of characteristics of the essays in the model
build set, including grammar, usage, mechanics, development, and other features. After the
6
Table 1
Advisory Flag Code, Name, and Description
Advisory flag code Flag name Flag description 2 Reuse of language Compared to other essays written on
this topic, the essay contains more reuse of language, a possible indication that it contains sentences or paragraphs that are repeated.
4 Key concepts Compared to other essays written on this topic, the essay shows less development of the key concepts on this topic.
8 Not relevant The essay might not be relevant to the assigned topic.
16 Restatement The essay appears to be a restatement of the topic with few additional concepts.
32 No resemblance The essay does not resemble others that have been written on this topic, a possible indication that it is about something else or is not relevant to the issues the topic raises.
64 Too brief The essay is too brief to evaluate. 128 Excessive length The essay is longer than essays that
can be accurately scored and must be within the word limit to receive a score.
256a Unidentifiable organizational elements
The essay could not be scored because some of its organizational elements could not be identified.
512 Excessive number of problems
The essay could not be scored because too many problems in grammar, usage, mechanics, and style were identified.
1024b Unexpected topic The essay appears to be on a subject that is different from the assigned topic.
2048b Nonessay The text submitted does not appear to be an essay.
aIntroduced only after GRE evaluation. bNot applicable for the GRE program.
feature values are derived, the weights for the features are determined using a multiple regression
procedure. These feature weights can then be applied to additional essays to produce a predicted
score based on the calibrated feature weights. Because the feature weights are estimated so as to
maximize agreement with human scores, any evaluation based on the training sample will tend to
7
overstate a scoring model’s performance. However, a more appropriate measure of performance
can be obtained by applying the model to the independent evaluation sample. Subsequently, the
feature scores and weights are applied to samples of essays in the evaluation set to produce an
overall e-rater score and validate the model performance. In general, model performance will
appear slightly degraded in this sample in comparison to the training sample. Models are
evaluated and recommended for operational use if the results of automated scoring are
comparable with agreement between two human raters.
The regression-based procedure of using NLP-based features to derive the automated
score within e-rater lends itself to multiple methods of model construction. The following model
types were built for the GRE data:
Prompt-specific (PS). These are custom built models for each prompt in the item pool.
They are designed to provide the best fit models for the particular prompt in question, with both
the feature weights and the intercept customized for the human score distribution used to
calibrate the prompt model. Prompt-specific models incorporate PS vocabulary related content
features into the scoring.
Generic (G). The smaller set of features derived in e-rater v2 enabled use of a single
scoring model, referred to as generic, and standards across all prompts of an assessment. Generic
models are based upon taking a group of related prompts, typically 10 or more, and calibrating a
regression model across all prompts so that the resultant model is the best fit for predicting
human scores for all the prompts, taken as a whole. As such, a common set of feature weights
and a single intercept are used for all prompts regardless of the particular prompt in the set.
Generic models do not take into account the content of the essay and address only writing
quality; content features related to the vocabulary usage are prompt specific and therefore not
included in the regression. The generic modeling approach has the advantage of requiring
smaller sample sizes per prompt (with enough prompts) and a truly consistent set of scoring
criteria regardless of the prompt delivered operationally.
Generic with prompt-specific intercept (GPSI). These models are produced by first
producing a fully generic model as described above but then adjusting the model for each prompt
so that the intercept of the regression matches the human score mean for the particular prompt.
The result is a set of prompts for which the feature weights in the regression, and therefore the
scoring criteria, are constant across prompts but the intercept allows for scaling of scores to
8
reflect minor differences in difficulty of the prompt that may have been captured in the human
scoring process. This result allows combining sample efficiency of G models with optimization
of score scales from PS models. Like the fully generic model, it does not consider content in
scoring and provides for reduced sample sizes per prompt with sufficient number of prompts for
generic model calibration.
Evaluation criteria. Once the automated (e-rater) scores for all essays have been
calculated, ETS uses certain evaluation criteria to assess the quality of the models. There are
guidelines for performance that are applied to the independent evaluation sample used to validate
the scoring models. The results on the evaluation sample independent from the model-building
sample represent a more generalizable measure of performance that would be more consistent
with what would be observed on future data. The criteria are as follows:
Construct evaluation. Automated scoring capabilities, in general, are designed with
certain assumptions and limitations regarding the tasks they will score. Therefore, the initial step
in any prospective use of automated scoring is the evaluation of fit between the goals and design
of the assessment (or other use of automated scoring) and the design of the capability itself. The
process includes a comparison of the construct of interest with that represented by the capability,
review of task design, review of scoring rubric, review of human scoring rules, review of score
reporting goals, and review of claims and disclosures.
Association with human scores. Absolute agreement of automated scores with human
scores has been a long-standing measure of the quality of automated scoring. Although it is
common to report absolute agreements as percentages of cases being exact agreements and
exact-plus-adjacent agreements, in evaluation of e-rater for assessment these are only reported in
statistical analysis reports as conveniences for laypersons rather than as part of acceptance
criteria due to scale dependence (values will be expected to be higher by chance on a four-point
scale than on a six-point scale) and sensitivity to base distributions (tendencies of human scores
to use some score points much more frequently than others). Instead, the absolute agreement of
automated scores with their human counterparts is typically evaluated on the basis of quadratic-
weighted kappa and Pearson correlations. Typically, the quadratic-weighted kappa between
automated and human scoring must be at least 0.70 (rounded normally). This value was selected
on the conceptual basis that it represents the “tipping point” at which signal outweighs noise in
the prediction. The identical threshold of 0.70 has been adopted for Pearson correlations. It
9
should be noted that the results from quadratic-weighted kappa and Pearson correlations are not
identical as kappa is computed on the basis of values of e-rater that are rounded normally to the
nearest scale score point while the correlation is computed on the basis of unrounded values (e-
rater scores are provided unrounded so that when multiple prompts are combined for a reported
score the precise values can be combined and rounded at the point of scaling rather than
rounding prior to summation). It is worthwhile to note that since e-rater is calibrated to
empirically optimize the prediction of human scores, the expected performance of e-rater against
this criterion is bounded by the performance of human scoring. That is, if the inter-rater
agreement of independent human raters is low, especially below the 0.70 threshold, then
automated scoring is disadvantaged in demonstrating this level of performance not because of
any particular failing of automated scoring, but because of the inherent unreliability of the
human scoring upon which it is both modeled and evaluated. Therefore, the inter-rater agreement
among human raters is commonly evaluated as a precursor to automated scoring modeling and
evaluation.
Degradation. Another criterion of performance in relationship with human scores
recognizing the inherent relationship between the reliability of human scoring and the
performance of automated scoring is degradation. The e-rater/human scoring agreement cannot
be more than 0.10 lower, in either weighted kappa or correlation, than the human/human
agreement. This standard prevents circumstances in which automated scoring may reach the 0.70
threshold but still be notably deficient in comparison with human scoring. It should be noted that
in practice, occasionally cases are observed in which the e-rater/human agreement for a
particular prompt has been slightly less than the 0.70 performance threshold but very close to a
borderline performance for human scoring (e.g., an e-rater/human weighted kappa of 0.68 and a
human/human kappa of 0.71), and such models have been approved for operational use on the
basis of being highly similar to human scoring and consistent with the purpose of the assessment
for which they are used. Similarly, it is common to observe e-rater/human absolute agreements
that are higher than the human/human agreements for prompts that primarily target writing
quality.
Standardized mean score difference. A third criterion for association of automated
scores with human scores is that the standardized mean score difference (standardized on the
distribution of human scores) between the human scores and the e-rater scores cannot exceed
10
0.15. This standard ensures that the distribution of scores from automated scoring is centered on
a point close to what is observed with human scoring in order to avoid problems with differential
scaling.
Association with external variables. Problems and concerns with human scoring
represent a range of potential pitfalls including halo effects, fatigue, tendency to overlook details,
and problems with consistency of scoring across time (Braun, 1988; Daly & Dickson-Markman,
1982; Hales & Tokar, 1975; Hughes & Keeling, 1984; Hughes, Keeling & Tuck, 1980a, 1980b,
1983; Lunz, Wright, & Linacre, 1990; Spear, 1997; Stalnaker, 1936). Therefore, it is of
relevance to investigate more than just the consistency with human scores and to also evaluate
the patterns of relationship of automated scores, compared to their human counterparts, with
external criteria. Scores on other test sections to examine within-test relationships and external
criteria such as self-reported measures that may be of interest (e.g., grades in English class,
academic majors) are some examples that are used for this purpose. It should be noted that the
external criteria that are typically available are not a direct external measure of exactly the same
construct and hence often pose some problems for interpretation.
Subgroup differences. In evaluating fairness of automated scoring the question is
whether it is fair to subgroups of interest to substitute a human rater with an automated score.
Due to lack of a suitable differential item functioning measure for this purpose, two approaches
have been proposed and implemented to address measures of fairness for e-rater. The first is
extending the flagging criterion of standardized mean score differences from the prompt-level
analysis discussed above to the evaluation of subgroup differences. A more stringent threshold of
performance has been adopted, setting the flagging criteria at 0.10, and is applied to all
subgroups of interest to identify patterns of systematic differences in the distribution of scores
between human scoring and automated scoring for subgroups at the reported score level.
The second approach is examination of differences in the predictive ability of automated
scoring by subgroup. This consists of two classes of prediction that are likewise related to the
standards and processes discussed above. First is to compare an initial human score and the
automated score in their ability to predict the score of a second human rater by subgroup. The
second type of prediction is comparing the automated and human score ability to predict an
external variable of interest by subgroup.
11
Operational impact analysis. The final stage of the evaluation of automated scoring is
the determination of predicted impact on the aggregate reported score for the writing section.
This impact is evaluated by simulating the score that would result from substituting an automated
score for a human score and determining the distribution of changes in reported scores that
would result from such a policy. The result lends an additional opportunity to compare the
performance of scoring under the proposed model (automated and human) to that of the
traditional model (two human raters). In the empirical comparison, the primary areas of interest
are an examination of the rate and degree of raw and scaled score differences resulting from the
change, the differences in association of reported scores to other test scores and external criteria,
and both of these applied to the level of subgroups of interest. Such an analysis allows for the
consideration of issues in scale continuity and other factors that may bear on the decision to
implement automated scoring.
Variations in agreement threshold. Alternative thresholds are considered for the
definition of discrepancy when evaluating the operational agreement between automated and
human scores. In human scoring, it is common practice for most scoring scales in high-stakes
programs that use double human scoring to consider scores that are one point apart (e.g., one
rater issuing a 3 and the other a 4) to be in agreement under the interpretation that reasonable
judges following the rubric may differ, especially when evaluating a borderline submission.
Typically, when two human scores are considered discrepant, an adjudication process occurs in
which additional human raters are used and a resolution process is followed to determine the
final reported score. These adjudication and resolution processes vary substantially by program
and are sometimes conditional on the particular distribution of initial human scores produced. In
the implementation of automated scoring with precise values recorded (decimal values), a wider
range of options is available for defining agreement, each of which has implications for the
extent to which the results of automated scoring influence the final reported scores and therefore
the ultimate evaluation of impact under the procedures defined above.
Methods
Data
More than 750,000 operational responses across 113 issue prompts and 139 argument
prompts were drawn from the available test records from September 2006 to September 2007.
This resulted in roughly 3,000 essays per prompt. Along with the two human rater scores for
12
each essay, several additional variables were included for analysis—examinee background
variables (gender, ethnicity, test center country, undergraduate overall and major grade point
average, English as their best language) and other GRE section test scores.
The quality of the e-rater models estimated and the effective functioning of the models in
operational settings depend critically on the nature and quality of the training and evaluation
data. Thereby, the automated scoring group at ETS has developed certain guidelines to use in the
collection and analyses of the data for building and evaluation of automated scoring models
(Williamson & Davey, 2007). These guidelines include choosing a representative sample, double
scored essays in electronic format, and sufficient number of prompts and sample size for model
building. For the assumptions not met, there are subsequent implications when interpreting the
results. The data provided by the GRE program met all the guidelines for automated scoring
model building and evaluation.
For evaluations, e-rater v7.2 was used. This version of e-rater had ten features (excluding
the new positive measure on the use of collocations and prepositions) and the content features
used information only from one score point (unlike the revised content features that derive
information from all five score points). At the subfeature level, double negation and preposition
errors under usage, and good collocation density as well as good preposition usage under
positive feature, were not present in v7.2. However, it should be noted that during the annual
engine upgrade process each year, new models are built and evaluated using the latest e-rater
version for all high- and low-stakes assessments that use e-rater for operational scoring.
Construct Relevance
The construct of GRE assessment was evaluated against the construct represented by e-
rater as part of a previous study (Quinlan et al., 2009). Under analytic scoring framework, e-
rater’s feature categories were mapped by Quinlan et al. (2009) to the 6-trait scoring model
(Culham, 2003) that focuses on the dimensions of ideas and content, organization, voice, word
choice, sentence fluency, and conventions. The two GRE writing tasks require test takers to
present an insightful position on an issue or develop an argument with compelling reasons. These
ideas and content are measured by e-rater primarily by two features using content vector
13
analysis. The features measure topic-specific vocabulary use only, and therefore the breadth of
construct coverage is limited. However, they do a fairly reasonable job of measuring this limited
domain. The GRE writing assessment demands a well-focused, well-organized analysis
representing a logical connection of ideas that is measured by the organization/development
features of e-rater. The organization and development features measure the number and average
length of discourse units (i.e., functionally related segments of text) in an essay and correlate
strongly with the essay length. In addition, the GRE writing tasks elicit fluent and precise
expression of ideas using effective vocabulary and sentence variety. These traits are represented
in e-rater by a variety of microfeatures that measure sentence-level errors (e.g., run-on sentences
and fragments) and grammatical errors (e.g., subject-verb agreement) and also the frequency
with which the words in an essay are commonly used. The GRE rubric also emphasizes test
takers’ abilities to demonstrate facility with conventions (i.e., grammar, usage, and mechanics)
of standard written English. This trait in particular is well represented in e-rater by a large
selection of microfeatures that measure errors and rule violations in grammar, usage, mechanics,
and style.
The review of task design, scoring rubric, human scoring rules, reporting goals, and
claims and disclosures for the assessment were made in conjunction with the GRE program as
the study progressed.
Model Building and Evaluation
The PS, G, and GPSI scoring models were built and evaluated for the GRE data from the
year ranging from September 2006 to September 2007 using e-rater v7.2.
Agreement statistics for automated scores with human scores were computed for all e-
rater models built and evaluated for the GRE data. The best chosen model(s) was then subjected
to remaining evaluation criteria of association with external variables, subgroup differences,
operational impact analysis, and agreement thresholds for adjudication.
The following section presents the results for each scoring model type
developed/evaluated for the two prompt types (issue and argument). The results for each model
are supported with summary tables of performance at the aggregate level in the main text and
summary tables of performance at the prompt level in Appendix F.
14
Results
Advisory Analyses
A number of advisory flags are used to indicate when e-rater is inappropriate for scoring
a specific essay response. The use of these flags as effective filters was evaluated as described
earlier in the paper under the process for building and evaluating e-rater scoring models. All
advisories were evaluated against human1 (H1) markings individually, as well as combined, and
the results for these evaluations are presented in Appendix E.
Based on the analyses reflecting e-rater’s performance to human rater in effectively
identifying an essay inappropriate or off-topic for automated scoring, following advisories were
turned on for the GRE writing assessment to filter the responses adequately prior to e-rater
model building:
• Advisory 2—Repetition: essay contains more repetition of words and phrases than
other essays written for the prompt (not used for the issue prompt type)
• Advisory 8—Not relevant: essay might not be clearly relevant to the topic, compared
to other essays written for the prompt
• Advisory 64—Too brief: essay is too brief for e-rater to issue a valid score (less than
or equal to 2 sentences, or fewer than 25 words)
• Advisory 128—Excessive length: essay is too long for e-rater to issue a valid score
(greater than 1000 words)
• Advisory 512—Excessive number of problems: essay with a very high number of
errors in grammar, usage, and mechanics.
The combination of the selected advisories for the two writing tasks resulted in successful
filtering of 96% of the responses on the issue prompt type that received a human score of 0 out
of the set of cases to be sent to e-rater for scoring, thus diverting them to double human scoring.
For responses on argument prompt type, 93% of the responses that received a human score of 0
were successfully filtered using this approach. The use of these rules overall flagged a very small
number of cases (about 1% for issue prompts and about 3% for argument) requiring double
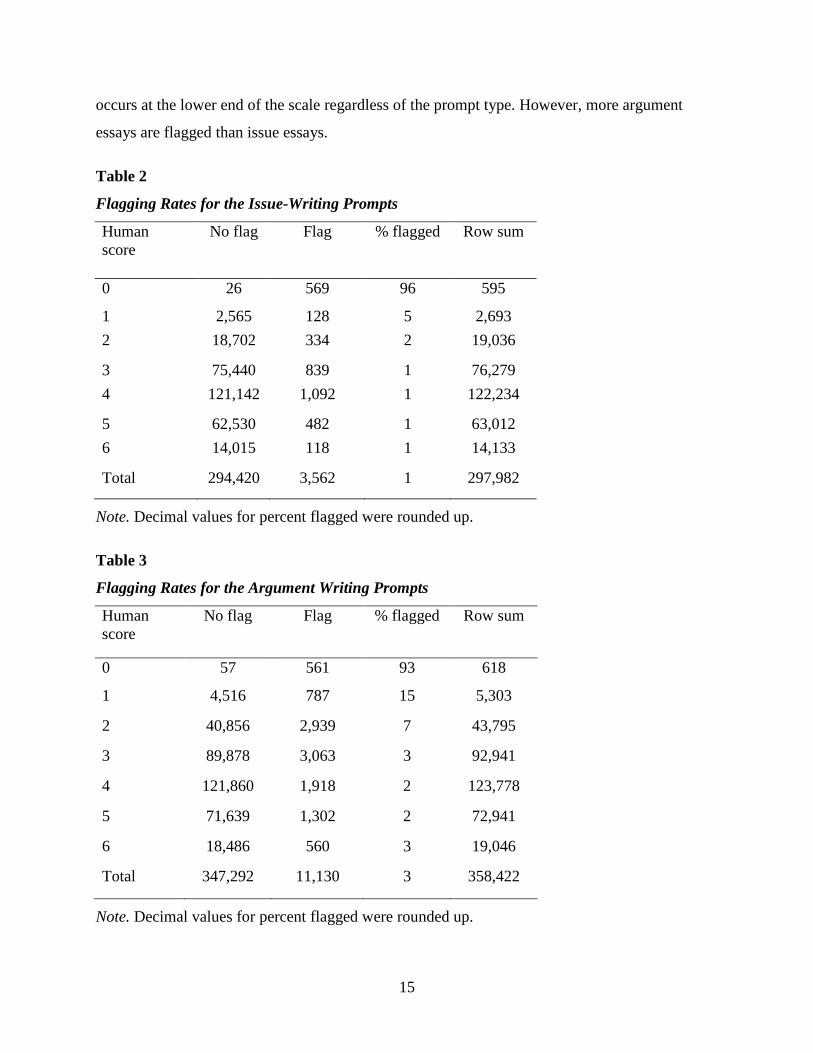
human scoring. Tables 2 and 3 show the results for flagging rates for the two writing tasks. From
these two tables it can be seen that the majority of flagging that requires double human scoring
15
occurs at the lower end of the scale regardless of the prompt type. However, more argument
essays are flagged than issue essays.
Table 2
Flagging Rates for the Issue-Writing Prompts
Human score
No flag Flag % flagged Row sum
0 26 569 96 595
1 2,565 128 5 2,693 2 18,702 334 2 19,036
3 75,440 839 1 76,279 4 121,142 1,092 1 122,234
5 62,530 482 1 63,012 6 14,015 118 1 14,133
Total 294,420 3,562 1 297,982
Note. Decimal values for percent flagged were rounded up.
Table 3
Flagging Rates for the Argument Writing Prompts
Human score
No flag Flag % flagged Row sum
0 57 561 93 618
1 4,516 787 15 5,303
2 40,856 2,939 7 43,795
3 89,878 3,063 3 92,941
4 121,860 1,918 2 123,778
5 71,639 1,302 2 72,941
6 18,486 560 3 19,046
Total 347,292 11,130 3 358,422
Note. Decimal values for percent flagged were rounded up.
16
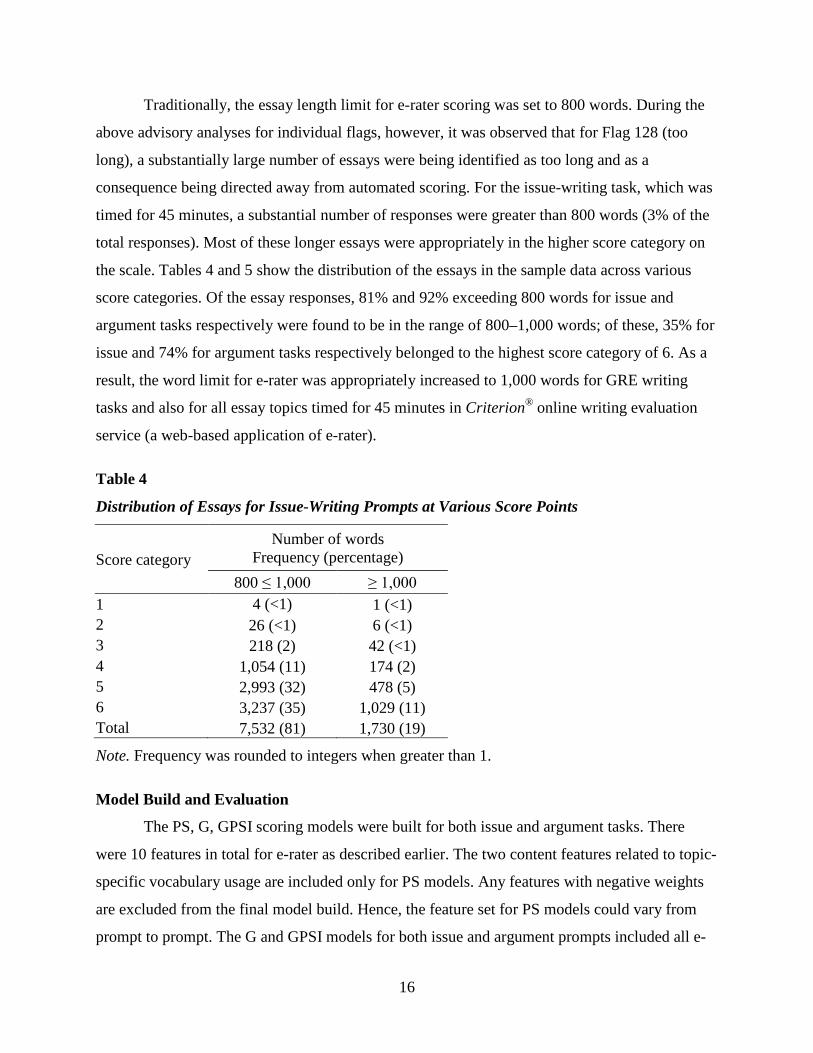
Traditionally, the essay length limit for e-rater scoring was set to 800 words. During the
above advisory analyses for individual flags, however, it was observed that for Flag 128 (too
long), a substantially large number of essays were being identified as too long and as a
consequence being directed away from automated scoring. For the issue-writing task, which was
timed for 45 minutes, a substantial number of responses were greater than 800 words (3% of the
total responses). Most of these longer essays were appropriately in the higher score category on
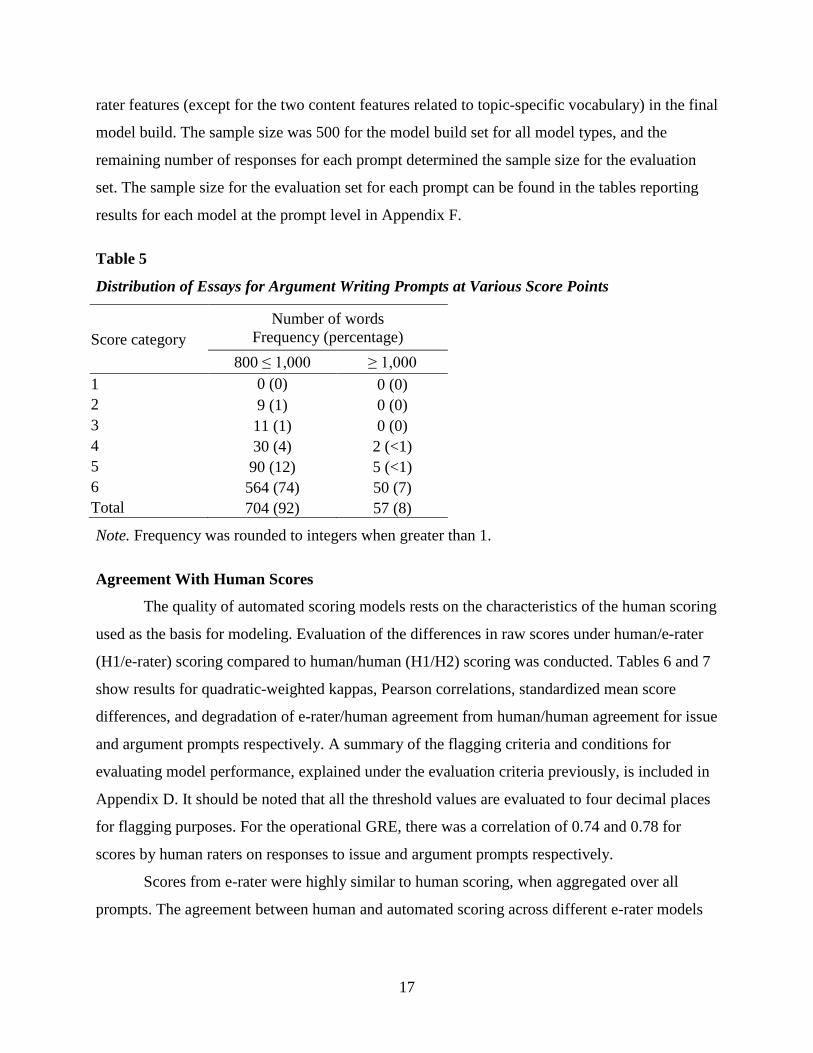
the scale. Tables 4 and 5 show the distribution of the essays in the sample data across various
score categories. Of the essay responses, 81% and 92% exceeding 800 words for issue and
argument tasks respectively were found to be in the range of 800–1,000 words; of these, 35% for
issue and 74% for argument tasks respectively belonged to the highest score category of 6. As a
result, the word limit for e-rater was appropriately increased to 1,000 words for GRE writing
tasks and also for all essay topics timed for 45 minutes in Criterion® online writing evaluation
service (a web-based application of e-rater).
Table 4
Distribution of Essays for Issue-Writing Prompts at Various Score Points
Score category Number of words
Frequency (percentage) 800 ≤ 1,000 ≥ 1,000
1 4 (<1)
1 (<1) 2 26 (<1) 6 (<1) 3 218 (2) 42 (<1) 4 1,054 (11) 174 (2) 5 2,993 (32) 478 (5) 6 3,237 (35) 1,029 (11) Total 7,532 (81) 1,730 (19)
Note. Frequency was rounded to integers when greater than 1.
Model Build and Evaluation
The PS, G, GPSI scoring models were built for both issue and argument tasks. There
were 10 features in total for e-rater as described earlier. The two content features related to topic-
specific vocabulary usage are included only for PS models. Any features with negative weights
are excluded from the final model build. Hence, the feature set for PS models could vary from
prompt to prompt. The G and GPSI models for both issue and argument prompts included all e-
17
rater features (except for the two content features related to topic-specific vocabulary) in the final
model build. The sample size was 500 for the model build set for all model types, and the
remaining number of responses for each prompt determined the sample size for the evaluation
set. The sample size for the evaluation set for each prompt can be found in the tables reporting
results for each model at the prompt level in Appendix F.
Table 5
Distribution of Essays for Argument Writing Prompts at Various Score Points
Score category Number of words
Frequency (percentage) 800 ≤ 1,000 ≥ 1,000
1 0 (0)
0 (0) 2 9 (1) 0 (0) 3 11 (1) 0 (0) 4 30 (4) 2 (<1) 5 90 (12) 5 (<1) 6 564 (74) 50 (7) Total 704 (92) 57 (8)
Note. Frequency was rounded to integers when greater than 1.
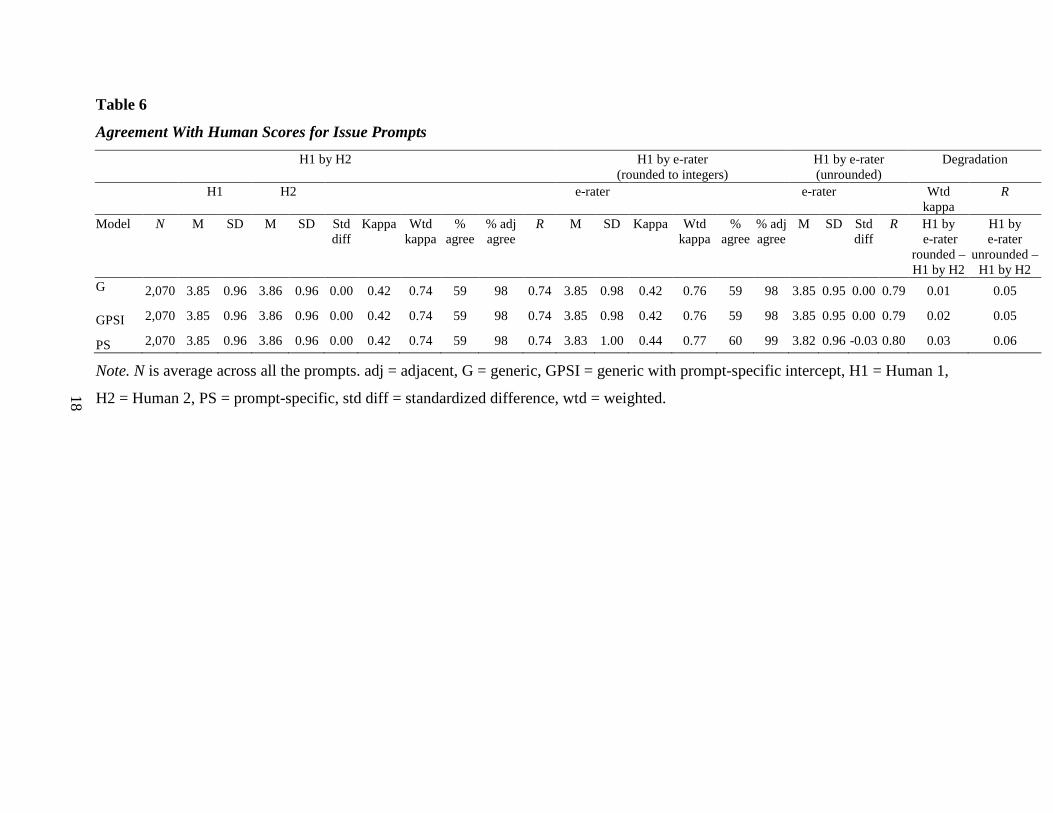
Agreement With Human Scores
The quality of automated scoring models rests on the characteristics of the human scoring
used as the basis for modeling. Evaluation of the differences in raw scores under human/e-rater
(H1/e-rater) scoring compared to human/human (H1/H2) scoring was conducted. Tables 6 and 7
show results for quadratic-weighted kappas, Pearson correlations, standardized mean score
differences, and degradation of e-rater/human agreement from human/human agreement for issue
and argument prompts respectively. A summary of the flagging criteria and conditions for
evaluating model performance, explained under the evaluation criteria previously, is included in
Appendix D. It should be noted that all the threshold values are evaluated to four decimal places
for flagging purposes. For the operational GRE, there was a correlation of 0.74 and 0.78 for
scores by human raters on responses to issue and argument prompts respectively.
Scores from e-rater were highly similar to human scoring, when aggregated over all
prompts. The agreement between human and automated scoring across different e-rater models
18
Table 6
Agreement With Human Scores for Issue Prompts H1 by H2 H1 by e-rater
(rounded to integers) H1 by e-rater (unrounded)
Degradation
H1 H2 e-rater e-rater Wtd kappa
R
Model N M SD M SD Std diff
Kappa Wtd kappa
% agree
% adj agree
R M SD Kappa Wtd kappa
% agree
% adj agree
M SD Std diff
R H1 by e-rater
rounded –H1 by H2
H1 by e-rater
unrounded – H1 by H2
G 2,070 3.85 0.96 3.86 0.96 0.00 0.42 0.74 59 98 0.74 3.85 0.98 0.42 0.76 59 98 3.85 0.95 0.00 0.79 0.01 0.05
GPSI 2,070 3.85 0.96 3.86 0.96 0.00 0.42 0.74 59 98 0.74 3.85 0.98 0.42 0.76 59 98 3.85 0.95 0.00 0.79 0.02 0.05
PS 2,070 3.85 0.96 3.86 0.96 0.00 0.42 0.74 59 98 0.74 3.83 1.00 0.44 0.77 60 99 3.82 0.96 -0.03 0.80 0.03 0.06
Note. N is average across all the prompts. adj = adjacent, G = generic, GPSI = generic with prompt-specific intercept, H1 = Human 1,
H2 = Human 2, PS = prompt-specific, std diff = standardized difference, wtd = weighted.
19
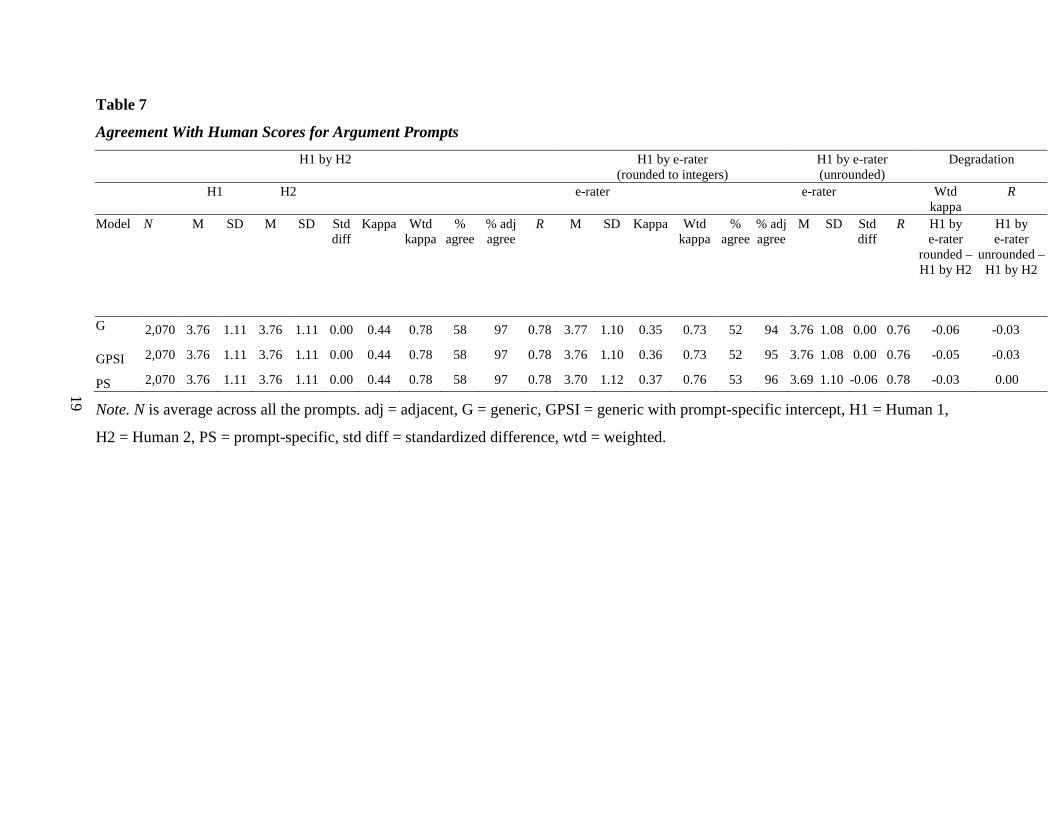
Table 7
Agreement With Human Scores for Argument Prompts H1 by H2 H1 by e-rater
(rounded to integers) H1 by e-rater (unrounded)
Degradation
H1 H2 e-rater e-rater Wtd kappa
R
Model N M SD M SD Std diff
Kappa Wtd kappa
% agree
% adj agree
R M SD Kappa Wtd kappa
% agree
% adj agree
M SD Std diff
R H1 by e-rater
rounded –H1 by H2
H1 by e-rater
unrounded – H1 by H2
G 2,070 3.76 1.11 3.76 1.11 0.00 0.44 0.78 58 97 0.78 3.77 1.10 0.35 0.73 52 94 3.76 1.08 0.00 0.76 -0.06 -0.03
GPSI 2,070 3.76 1.11 3.76 1.11 0.00 0.44 0.78 58 97 0.78 3.76 1.10 0.36 0.73 52 95 3.76 1.08 0.00 0.76 -0.05 -0.03
PS 2,070 3.76 1.11 3.76 1.11 0.00 0.44 0.78 58 97 0.78 3.70 1.12 0.37 0.76 53 96 3.69 1.10 -0.06 0.78 -0.03 0.00
Note. N is average across all the prompts. adj = adjacent, G = generic, GPSI = generic with prompt-specific intercept, H1 = Human 1,
H2 = Human 2, PS = prompt-specific, std diff = standardized difference, wtd = weighted.
20
compared to the agreement between human readers was at par for argument prompts with a
correlation of 0.79, and even slightly better for issue prompts with a correlation of 0.78.
All three types of e-rater scores from different scoring models showed similar weighted
kappas (0.73–0.77) and correlations (0.76–0.80) with human scores for both issue and argument
prompts, which met the evaluation criterion of correlation and weighted kappa greater than 0.70
and was higher than what was observed for the two human scores (0.76 on average). For the
issue prompts, the threshold for both weighted kappa and correlation was met at the prompt level
as well, however, 13 of the argument prompts under the G model and 11 of the argument
prompts under the GPSI model failed to meet the 0.70 threshold for weighted kappa.
The degradation of e-rater/human agreement from human/human agreement met the
evaluation criteria (less than 0.10 decrease in weighted kappa and correlation) at the overall level
for both issue and argument prompts. In fact, the e-rater/human agreement was higher (on
average 0.02 for weighted kappa and 0.06 for correlation) than human/human agreement for
issue prompts reflecting an improvement in agreement (denoted by a positive sign in Table 4).
There was slight degradation in e-rater/human agreement from human/human agreement for
argument prompts (on average 0.05 for weighted kappa and 0.02 for correlation) but well below
the set evaluation criterion for degradation. At the prompt level, however, for the argument task,
17 prompts under the G model and 9 prompts under the GPSI model exceeded the minimal
degradation threshold.
The standardized score differences between e-rater and human scores were 0.01 on
average for the issue prompts and 0.02 on average for the argument prompts, both well under the
acceptable limit of 0.15 of a standard deviation of the human score distribution. At the prompt
level, however, 4 prompts for issue task and 37 prompts for argument task failed to meet the 0.15
threshold for standardized mean difference under the G model.
Based on the results for the evaluation criteria at the aggregate and the prompt level for
the three e-rater models, GPSI and PS models were chosen as the best scoring models for issue
and argument writing prompts respectively.
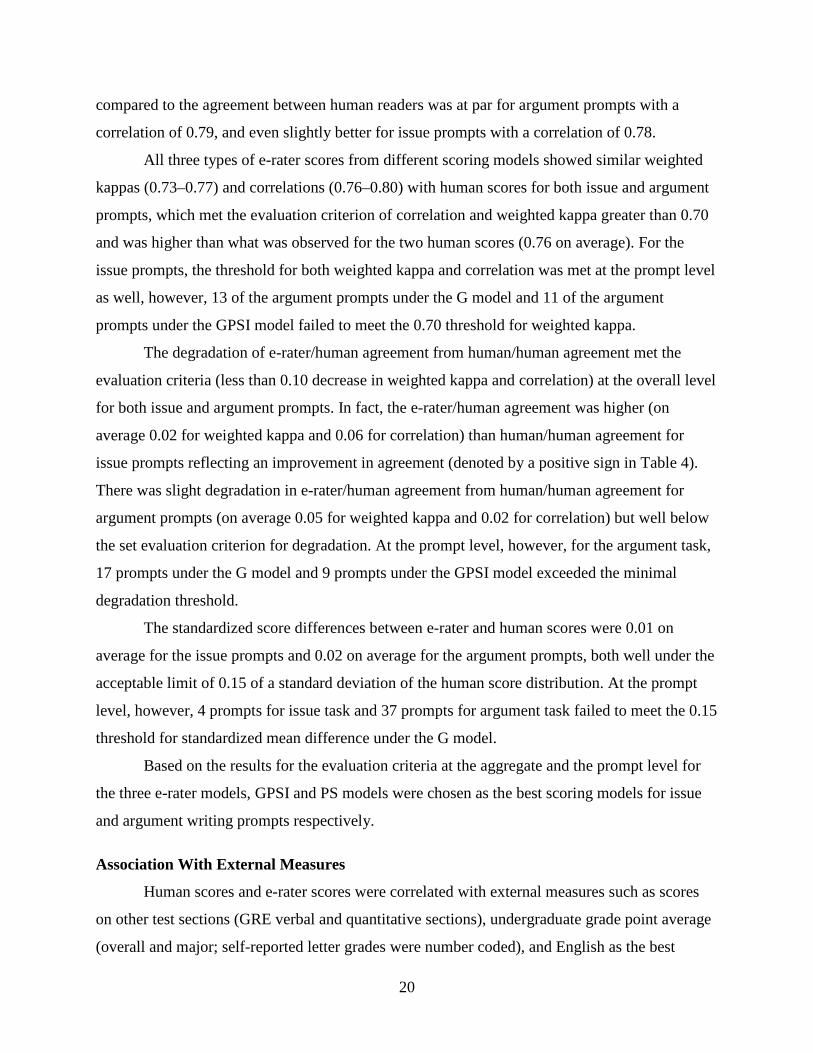
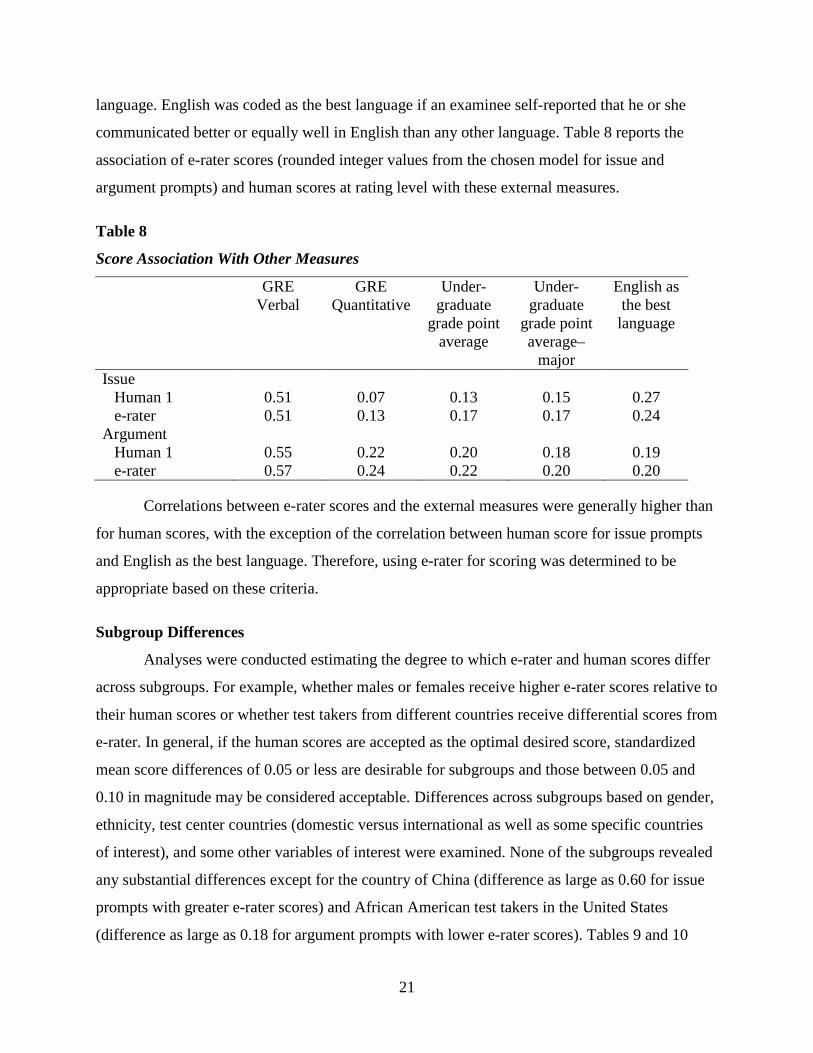
Association With External Measures
Human scores and e-rater scores were correlated with external measures such as scores
on other test sections (GRE verbal and quantitative sections), undergraduate grade point average
(overall and major; self-reported letter grades were number coded), and English as the best
21
language. English was coded as the best language if an examinee self-reported that he or she
communicated better or equally well in English than any other language. Table 8 reports the
association of e-rater scores (rounded integer values from the chosen model for issue and
argument prompts) and human scores at rating level with these external measures.
Table 8
Score Association With Other Measures
GRE Verbal
GRE Quantitative
Under-graduate
grade point average
Under-graduate
grade point average–
major
English as the best
language
Issue Human 1 0.51 0.07 0.13 0.15 0.27 e-rater 0.51 0.13 0.17 0.17 0.24 Argument Human 1 0.55 0.22 0.20 0.18 0.19 e-rater 0.57 0.24 0.22 0.20 0.20
Correlations between e-rater scores and the external measures were generally higher than
for human scores, with the exception of the correlation between human score for issue prompts
and English as the best language. Therefore, using e-rater for scoring was determined to be
appropriate based on these criteria.
Subgroup Differences
Analyses were conducted estimating the degree to which e-rater and human scores differ
across subgroups. For example, whether males or females receive higher e-rater scores relative to
their human scores or whether test takers from different countries receive differential scores from
e-rater. In general, if the human scores are accepted as the optimal desired score, standardized
mean score differences of 0.05 or less are desirable for subgroups and those between 0.05 and
0.10 in magnitude may be considered acceptable. Differences across subgroups based on gender,
ethnicity, test center countries (domestic versus international as well as some specific countries
of interest), and some other variables of interest were examined. None of the subgroups revealed
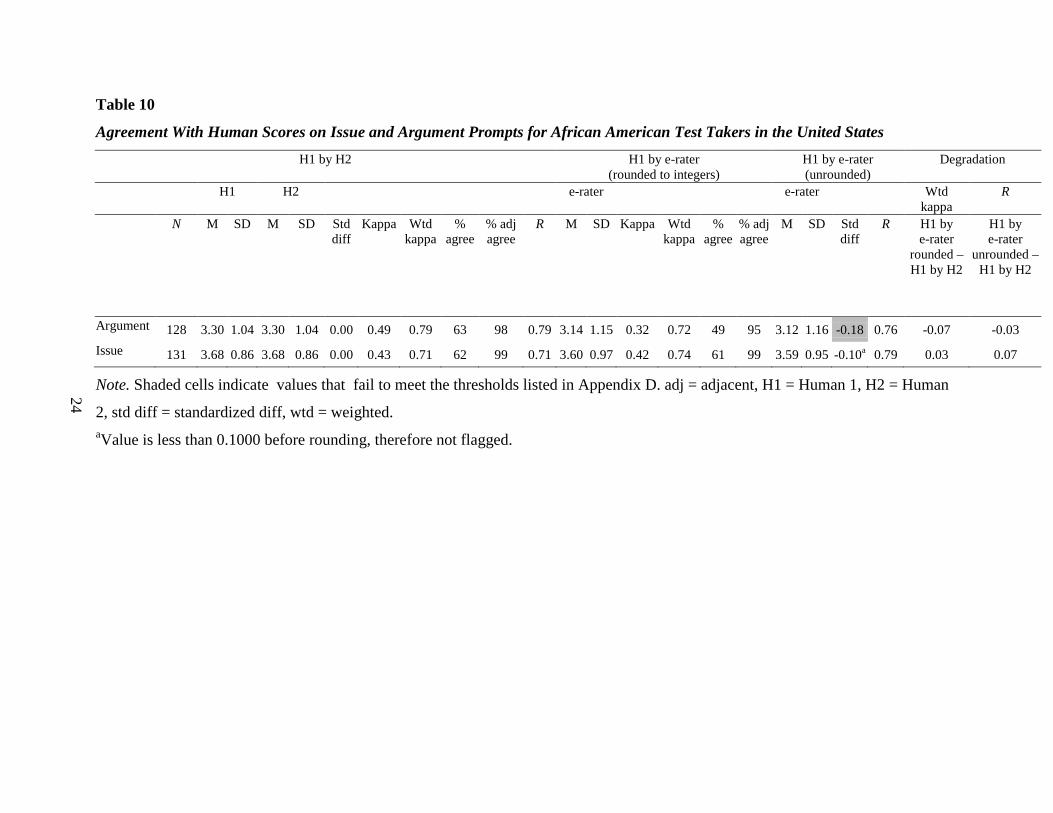
any substantial differences except for the country of China (difference as large as 0.60 for issue
prompts with greater e-rater scores) and African American test takers in the United States
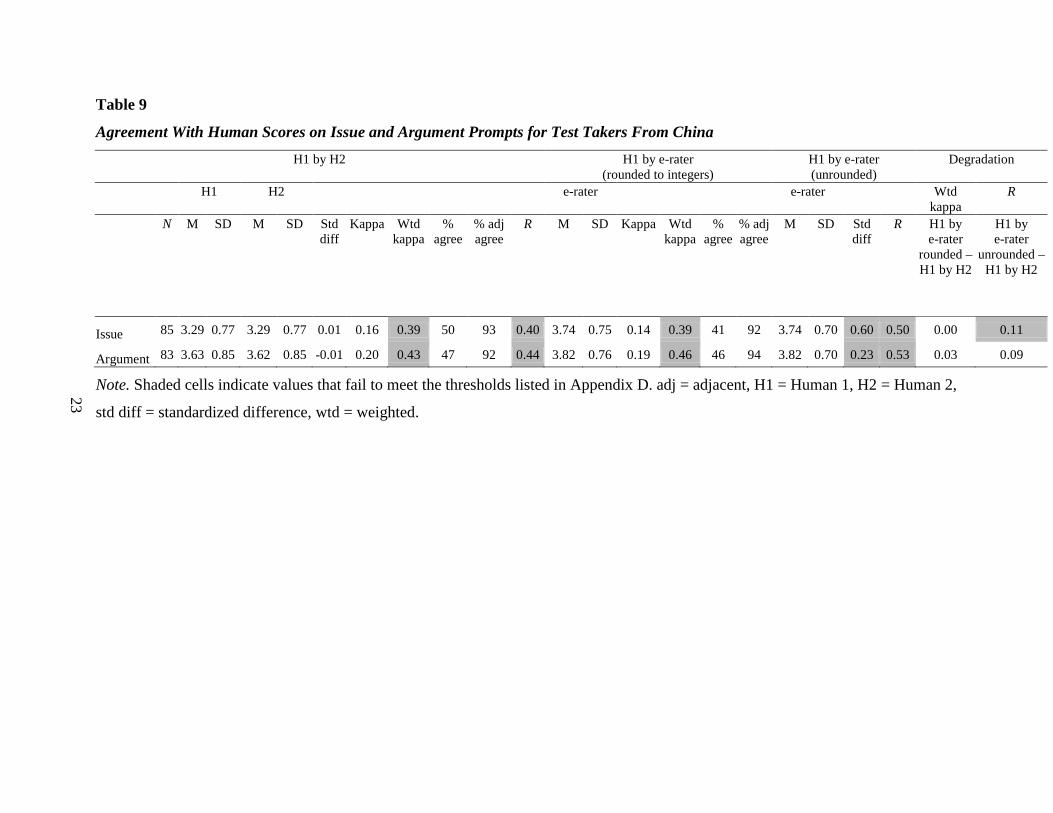
(difference as large as 0.18 for argument prompts with lower e-rater scores). Tables 9 and 10
22
show the results for quadratic-weighted kappas, Pearson correlations, standardized mean score
differences, and degradation of e-rater/human agreement from human/human agreement for the
test takers from China and for African American test takers in the United States respectively on
both the issue and the argument prompts. For subgroups with small sample sizes (less than
1,000), any differences around or beyond the threshold were discarded from further formal
review. The N reported in these tables is the average number of examinees per prompt. Results
for subgroups based on gender, ethnicity (other than African American), and test center countries
(other than China) of interest are included in Appendix G. Further examination across subgroups
based on ability level and undergraduate major field revealed no significant differences.
Models for Implementation
Initially e-rater was proposed as a contributory score in conjunction with one human
rating in determining the final score for a writing task. Under the contributory model, the mean
of the e-rater score and the human rating yields the final score on a writing task. This score is
consistent with the implementation approach adopted by GMAT in the past. However, under
such a model it must be acknowledged that the construct measured in e-rater may be somewhat
different than that measured by human raters for prompts that emphasize the content of the
response in the rubric—at least to the extent that cognition of human scoring is known.
The allowable discrepancy threshold between the two human scores on a GRE writing
task is 1 point. Scores discrepant by more than 1 point (that is, apart by 2 or more points as
outlined previously under GRE scoring rules) are routed to a third human rater. Since e-rater
produces real values, unlike human scores which are restricted to integer values, scores greater
than 1 but less than equal to 1.4999 are rounded down to 1 under normal rounding rules. Hence,
adhering to the GRE scoring rules, a contributory model at threshold of 1.5 was initially chosen
for evaluating the impact of including e-rater in operational scoring for GRE writing tasks.
However, upon discovering subgroup differences under the chosen e-rater models on the two
writing tasks, alternate model implementations with different thresholds were proposed to ensure
that the presence of any differences did not adversely affect the reported scores. Smaller
discrepancy thresholds in increments of 0.25 (1.25, 1.0, 0.75, 0.5) were evaluated to increase
sensitivity to discrepant cases while using e-rater for scoring and thereby control subgroup
differences between e-rater and human scores at the writing score level. As a result of these
23
Table 9
Agreement With Human Scores on Issue and Argument Prompts for Test Takers From China H1 by H2 H1 by e-rater
(rounded to integers) H1 by e-rater (unrounded)
Degradation
H1 H2 e-rater e-rater Wtd kappa
R
N M SD M SD Std diff
Kappa Wtd kappa
% agree
% adj agree
R M SD Kappa Wtd kappa
% agree
% adj agree
M SD Std diff
R H1 by e-rater
rounded – H1 by H2
H1 by e-rater
unrounded – H1 by H2
Issue 85 3.29 0.77 3.29 0.77 0.01 0.16 0.39 50 93 0.40 3.74 0.75 0.14 0.39 41 92 3.74 0.70 0.60 0.50 0.00 0.11
Argument 83 3.63 0.85 3.62 0.85 -0.01 0.20 0.43 47 92 0.44 3.82 0.76 0.19 0.46 46 94 3.82 0.70 0.23 0.53 0.03 0.09
Note. Shaded cells indicate values that fail to meet the thresholds listed in Appendix D. adj = adjacent, H1 = Human 1, H2 = Human 2,
std diff = standardized difference, wtd = weighted.
24
Table 10
Agreement With Human Scores on Issue and Argument Prompts for African American Test Takers in the United States H1 by H2 H1 by e-rater
(rounded to integers) H1 by e-rater (unrounded)
Degradation
H1 H2 e-rater e-rater Wtd kappa
R
N M SD M SD Std diff
Kappa Wtd kappa
% agree
% adj agree
R M SD Kappa Wtd kappa
% agree
% adj agree
M SD Std diff
R H1 by e-rater
rounded – H1 by H2
H1 by e-rater
unrounded – H1 by H2
Argument 128 3.30 1.04 3.30 1.04 0.00 0.49 0.79 63 98 0.79 3.14 1.15 0.32 0.72 49 95 3.12 1.16 -0.18 0.76 -0.07 -0.03 Issue 131 3.68 0.86 3.68 0.86 0.00 0.43 0.71 62 99 0.71 3.60 0.97 0.42 0.74 61 99 3.59 0.95 -0.10a 0.79 0.03 0.07
Note. Shaded cells indicate values that fail to meet the thresholds listed in Appendix D. adj = adjacent, H1 = Human 1, H2 = Human
2, std diff = standardized diff, wtd = weighted. aValue is less than 0.1000 before rounding, therefore not flagged.
25
investigations it was determined that the 0.5 threshold was the optimal level for discrepancy
thresholds in operational practice as it ensured no subgroups were flagged for differences in
score.
As a more conservative approach, check score or a confirmatory score model was
identified as a potential alternative implementation of automated scoring. Under this particular
model, it was proposed that the e-rater score be used only to check or confirm the human score,
and when within the allowable discrepancy threshold, the human rating would constitute the final
score for the examinee on a given writing task. Thus each response would get only one score,
unless identified as discrepant and a second human rating was requested.
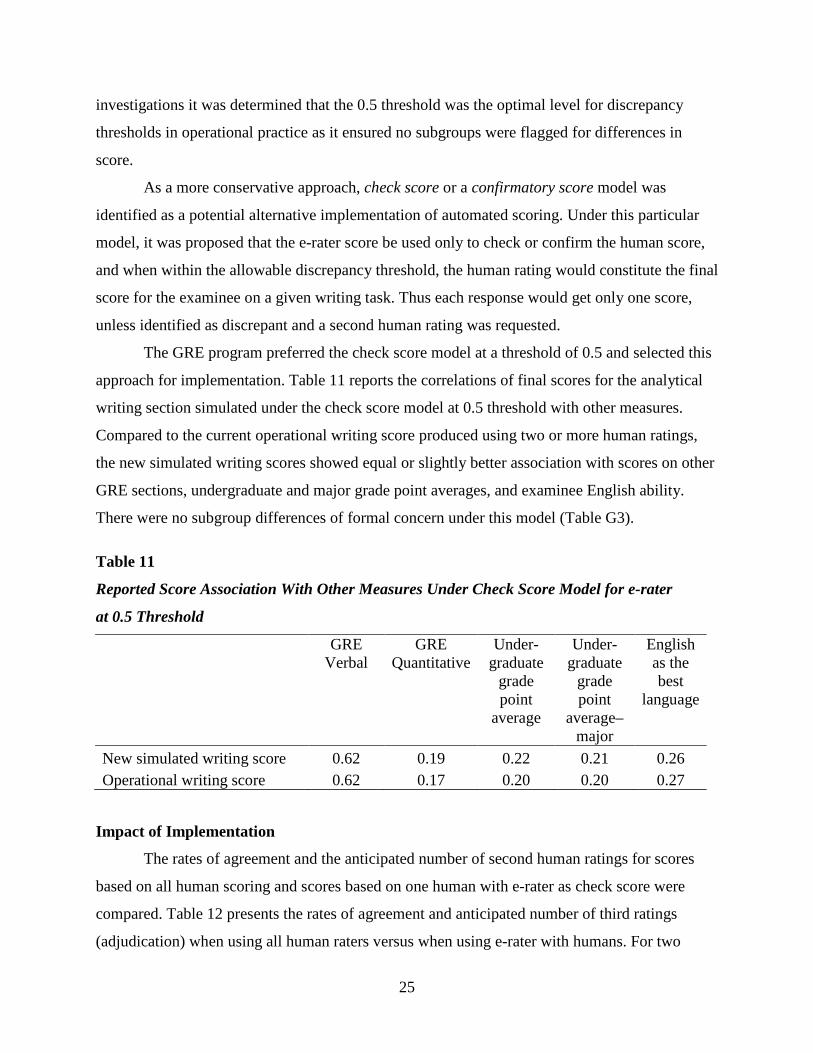
The GRE program preferred the check score model at a threshold of 0.5 and selected this
approach for implementation. Table 11 reports the correlations of final scores for the analytical
writing section simulated under the check score model at 0.5 threshold with other measures.
Compared to the current operational writing score produced using two or more human ratings,
the new simulated writing scores showed equal or slightly better association with scores on other
GRE sections, undergraduate and major grade point averages, and examinee English ability.
There were no subgroup differences of formal concern under this model (Table G3).
Table 11
Reported Score Association With Other Measures Under Check Score Model for e-rater
at 0.5 Threshold
GRE Verbal
GRE Quantitative
Under-graduate
grade point
average
Under-graduate
grade point
average–major
English as the best
language
New simulated writing score 0.62 0.19 0.22 0.21 0.26 Operational writing score 0.62 0.17 0.20 0.20 0.27
Impact of Implementation
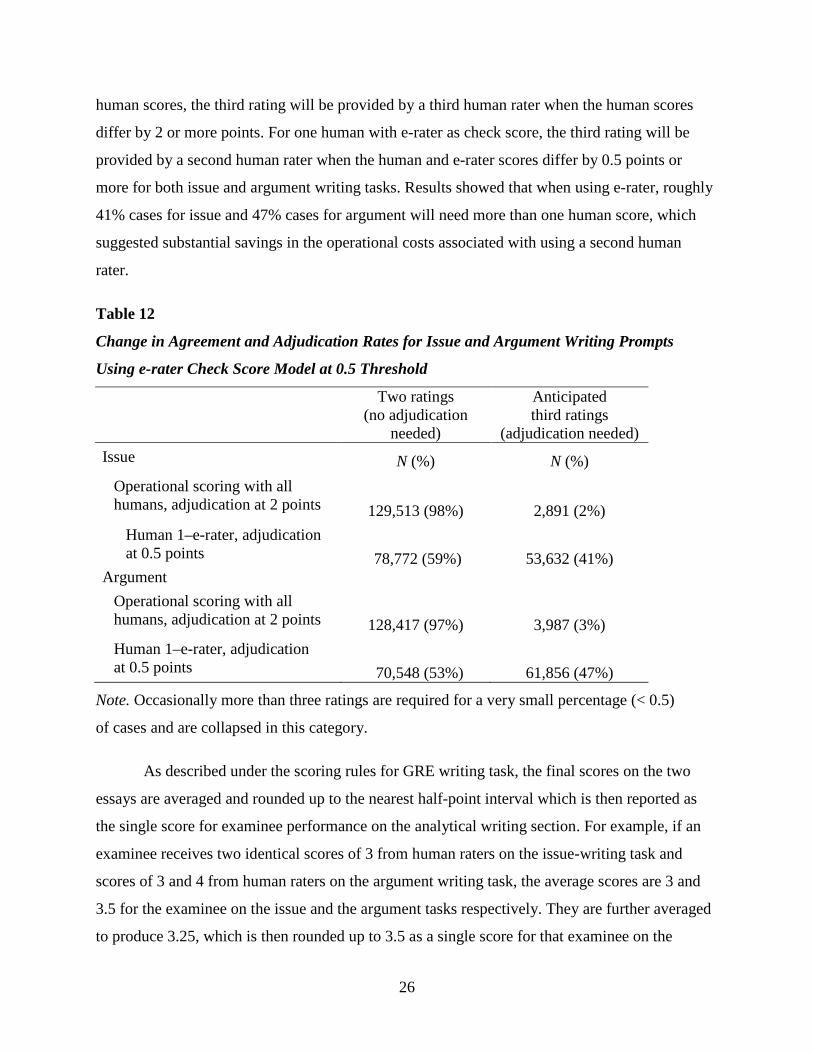
The rates of agreement and the anticipated number of second human ratings for scores
based on all human scoring and scores based on one human with e-rater as check score were
compared. Table 12 presents the rates of agreement and anticipated number of third ratings
(adjudication) when using all human raters versus when using e-rater with humans. For two
26
human scores, the third rating will be provided by a third human rater when the human scores
differ by 2 or more points. For one human with e-rater as check score, the third rating will be
provided by a second human rater when the human and e-rater scores differ by 0.5 points or
more for both issue and argument writing tasks. Results showed that when using e-rater, roughly
41% cases for issue and 47% cases for argument will need more than one human score, which
suggested substantial savings in the operational costs associated with using a second human
rater.
Table 12
Change in Agreement and Adjudication Rates for Issue and Argument Writing Prompts
Using e-rater Check Score Model at 0.5 Threshold
Two ratings
(no adjudication needed)
Anticipated third ratings
(adjudication needed) Issue N (%) N (%)
Operational scoring with all humans, adjudication at 2 points 129,513 (98%) 2,891 (2%)
Human 1–e-rater, adjudication at 0.5 points 78,772 (59%) 53,632 (41%)
Argument Operational scoring with all humans, adjudication at 2 points 128,417 (97%) 3,987 (3%) Human 1–e-rater, adjudication at 0.5 points 70,548 (53%) 61,856 (47%)
Note. Occasionally more than three ratings are required for a very small percentage (< 0.5)
of cases and are collapsed in this category.
As described under the scoring rules for GRE writing task, the final scores on the two
essays are averaged and rounded up to the nearest half-point interval which is then reported as
the single score for examinee performance on the analytical writing section. For example, if an
examinee receives two identical scores of 3 from human raters on the issue-writing task and
scores of 3 and 4 from human raters on the argument writing task, the average scores are 3 and
3.5 for the examinee on the issue and the argument tasks respectively. They are further averaged
to produce 3.25, which is then rounded up to 3.5 as a single score for that examinee on the
27
analytical writing section. Scores assessed by e-rater are real values, unlike human scores, which
are strictly integers, and the decimal values in e-rater scores are preserved for accuracy up until
the last stage when a final single score is generated for the analytical writing section. For
example, if the same examinee as discussed previously receives a score of 3 from a single human
rater on both issue and argument writing tasks, and scores 3.3 and 3.4 from e-rater on the issue
and argument writing tasks respectively; the average scores for the two tasks will be 3.15 and
3.20 for issue and argument respectively. A further average of these two scores will produce a
single score of 3.175 which when rounded off according to the general rounding rules (round
down if less than 0.5 and vice versa) will result in a final score of 3 as the single score for the
examinee on the analytical writing section. Now, when compared to the previous single score
derived solely on the basis of human scores, the computed discrepancy is inflated in contrast to
the actual discrepancy as the score derived from humans was rounded up to a higher value.
Conclusion
The PS, G, and GPSI scoring models were built and evaluated on GRE data drawn from
the available test records between September 2006 and September 2007 using e-rater v7.2. These
data comprised of over 750,000 essay responses written to 113 issue prompts and 139 argument
prompts. Criteria for evaluation of e-rater scoring models included level of agreement with
human scores, degradation in agreement from human scoring, standardized mean score
differences between human and automated scoring, and correlations with external variables (such
as scores on other GRE sections, English as best language, and undergraduate overall and major
GPA). Based on the evaluation criteria, GPSI and PS models were determined as the best scoring
models for the issue and the argument prompts respectively. Performance of the selected e-rater
scoring models was further evaluated across different demographic subgroups. Results revealed
adequate performance of the different e-rater scores at the prompt level, with a notable exception
for examinees from China with e-rater scores around half a SD higher than the human scores,
and for African American test takers with e-rater scores roughly two-tenths of a SD lower than
the human scores.
The use of e-rater as a check on a human score was investigated as an alternate approach
to a contributory score. Under the check score approach, e-rater score was checked for agreement
with the first human score within an empirically established range, beyond which a second
human score was required. The first human score became the final score for the essay, unless a
28
second human rating was desired. Various agreement thresholds were evaluated under the check
score model to minimize differences across the subgroups. A discrepancy threshold of 0.5 point
between the automated and the human score was selected for e-rater to yield performance similar
to double human scoring, but with significant savings in second human ratings.
As part of ongoing efforts, it will be critical to monitor and evaluate e-rater performance
in operation from time to time owing to the anticipated changes in the overall test format,
examinee and human rater characteristics, and human scoring trends over time, as well as new
feature developments and enhancements in the e-rater engine. We will also investigate the
differences in e-rater and human scores observed for some subgroups in this evaluation to better
understand their source and origin.
29
References
Attali, Y. (2009). Interim summary of analyses related to content scoring of TOEFL integrated
essays. Unpublished manuscript.
Attali, Y., & Burstein, J. (2006). Automated essay scoring with e-rater v.2. Journal of
Technology, Learning, and Assessment, 4(3). Retrieved from www.jtla.org.
Bernstein, J., De Jong, J., Pisoni, D., & Townshend, B. (2000). Two experiments on automatic
scoring of spoken language proficiency. Proceedings of InSTIL2000 (pp. 57–61).
Dundee, Scotland: University of Abertay.
Braun, H. I. (1988). Understanding scoring reliability: Experiments in calibrating essay readers.
Journal of Educational Statistics, 13, 1–18.
Burstein, J. (2003). The e-rater® scoring engine: Automated essay scoring with natural language
processing. In M. D. Shermis & J. C. Burstein (Eds.), Automated essay scoring: A cross-
disciplinary perspective (pp. 113–121). Hillsdale, NJ: Lawrence Erlbaum Associates.
Burstein, J., Kukich, K., Wolff, S., Lu, C., & Chodorow, M. (1998, April). Computer analysis of
essays. Paper presented at the annual meeting of the National Council on Measurement in
Education, Montreal, Canada.
Callear, D., Jerrams-Smith, J., & Soh, V. (2001). CAA of short non-MCQ answers. Proceedings
of the 5th International CAA Conference (pp. 55–69). Loughborough, UK: Loughborough
University.
Chevalier, S. (2007). Speech interaction with Saybot player, a CALL software to help Chinese
learners of English. In Proceedings of the International Speech Communication
Association Special Interest Group on Speech and Language Technology in Education
(pp. 37-40). Farmington, PA: International Speech Communication Association.
Culham, R. (2003). 6 + 1 traits of writing: The complete guide. New York, NY: Scholastic, Inc.
Daly, J. A., & Dickson-Markman, F. (1982). Contrast effects in evaluating essays. Journal of
Educational Measurement, 19, 309–316.
Franco, H., Abrash, V., Precoda, K., Bratt, H., Rao, R., Butzberger, J., … Cesari, F. (2000). The
SRI EduSpeakTM system: Recognition and pronunciation scoring for language learning.
Proceedings of InSTILL (pp. 123–128). Scotland: University of Abertay, Dundee.
30
Hales, L. W., & Tokar, E. (1975). The effect of the quality of preceding responses on the grades
assigned to subsequent responses to an essay question. Journal of Educational
Measurement, 12, 115–117.
Hughes, D. C., & Keeling, B. (1984). The use of model essays to reduce context effects in essay
scoring. Journal of Educational Measurement, 21, 277–281.
Hughes, D. C., Keeling, B., & Tuck, B. F. (1980a). Essay marking and the context problem.
Educational Research, 22, 147–148.
Hughes, D. C., Keeling, B., & Tuck, B. F. (1980b). The influence of context position and scoring
method on essay scoring. Journal of Educational Measurement, 17, 131–135.
Hughes, D. C., Keeling, B., & Tuck, B. F. (1983). The effects of instructions to scorers intended
to reduce context effects in essay scoring. Educational and Psychological Measurement,
43, 1047–1050.
Landauer, T. K., Laham, D., & Foltz, P. W. (2003). Automated scoring and annotation of essays
with the Intelligent Essay Assessor. In M. D. Shermis & J. C. Burstein (Eds.), Automated
essay scoring: A cross-disciplinary perspective (pp. 87–112). Hillsdale, NJ: Lawrence
Erlbaum Associates.
Leacock, C., & Chodorow, M. (2003). C-rater: Scoring of short-answer questions. Computers
and the Humanities, 37(4), 389–405.
Lunz, M. E., Wright, B. D., & Linacre, J. M. (1990). Measuring the impact of judge severity on
examination scores. Applied Measurement in Education, 3, 331–345.
Mitchell, T., Russell, T., Broomhead, P., & Aldridge, N. (2002). Towards robust computerized
marking of free-text responses. Proceedings of the Sixth International Computer Assisted
Assessment Conference (pp. 233–249). Loughborough, UK: Loughborough University.
Page, E. B. (1966). The imminence of grading essays by computer. Phi Delta Kappan, 48, 238–
243.
Page, E. B. (1968). The use of the computer in analyzing student essays. International Review of
Education 14(2), 210–225.
Page, E. B. (2003). Project essay grade: PEG. In M. D. Shermis & J. C. Burstein (Eds.),
Automated essay scoring: A cross-disciplinary perspective (pp. 43–54). Hillsdale, NJ:
Lawrence Erlbaum Associates.
31
Quinlan, T., Higgins, D., & Wolff, S. (2009). Evaluating the construct coverage of the e-rater®
scoring engine (ETS Research Rep. No. RR-09-01). Princeton, NJ: ETS.
Ramineni, C., Davey, T., & Weng, V. (2010). Statistical evaluation and integration of a new
positive feature for e-rater v10.1. Unpublished manuscript.
Risse, T. (2007, September). Testing and assessing mathematical skills by a script based system.
Paper presented at the 10th International Conference on Interactive Computer Aided
Learning, Villach, Austria.
Rudner, L. M., Garcia, V., & Welch, C. (2006). An evaluation of IntelliMetricTM essay scoring
system. The Journal of Technology, Learning and Assessment, 4(4), Retrieved from
www.jtla.org.
Sargeant, J., Wood, M. M., & Anderson, S. M. (2004). A human-computer collaborative
approach to the marking of free text answers. Proceedings of the 8th International CAA
Conference (pp. 361–370). Loughborough, UK: Loughborough University.
Shermis, M. D., & Burstein, J. C. (2003). Automated essay scoring: A cross-disciplinary
perspective. Hillsdale, NJ: Lawrence Erlbaum Associates.
Singley, M. K., & Bennett, R. E. (1998). Validation and extension of the mathematical
expression response type: Applications of schema theory to automatic scoring and item
generation in mathematics (GRE Board Professional Report No. 93-24P). Princeton, NJ:
ETS.
Spear, M. (1997). The influence of contrast effects upon teachers’ marks. Educational Research,
39, 229–233.
Stalnaker, J. M. (1936). The problem of the English examination. Educational Record, 17, 41.
Sukkarieh, J. Z., & Pulman, S. G. (2005). Information extraction and machine learning: Auto-
marking short free text responses to science questions. Proceedings of the 12th
International Conference on Artificial Intelligence in Education (pp. 629–637).
Amsterdam, The Netherlands: IOS Press.
Williamson, D. M., & Davey, T. (2007). Principles and processes for automated scoring: A
summary of current policy, procedures and future work (ETS Statistical Rep. No. SR-
2009-061). Princeton, NJ: ETS.
32
Xi, X., Higgins, D., Zechner, K., & Williamson, D. M. (2008). Automated scoring of
spontaneous speech using SpeechRater v1.0 (ETS Research Rep. No. RR-08-62).
Princeton, NJ: ETS.
Zechner, K., & Bejar, I. (2006). Towards automatic scoring of non-native spontaneous speech.
Proceedings of the Human Language Technology Conference of the North American
Chapter of the ACL (pp. 216–223). New York, NY: Association for Computational
Linguistics.
33
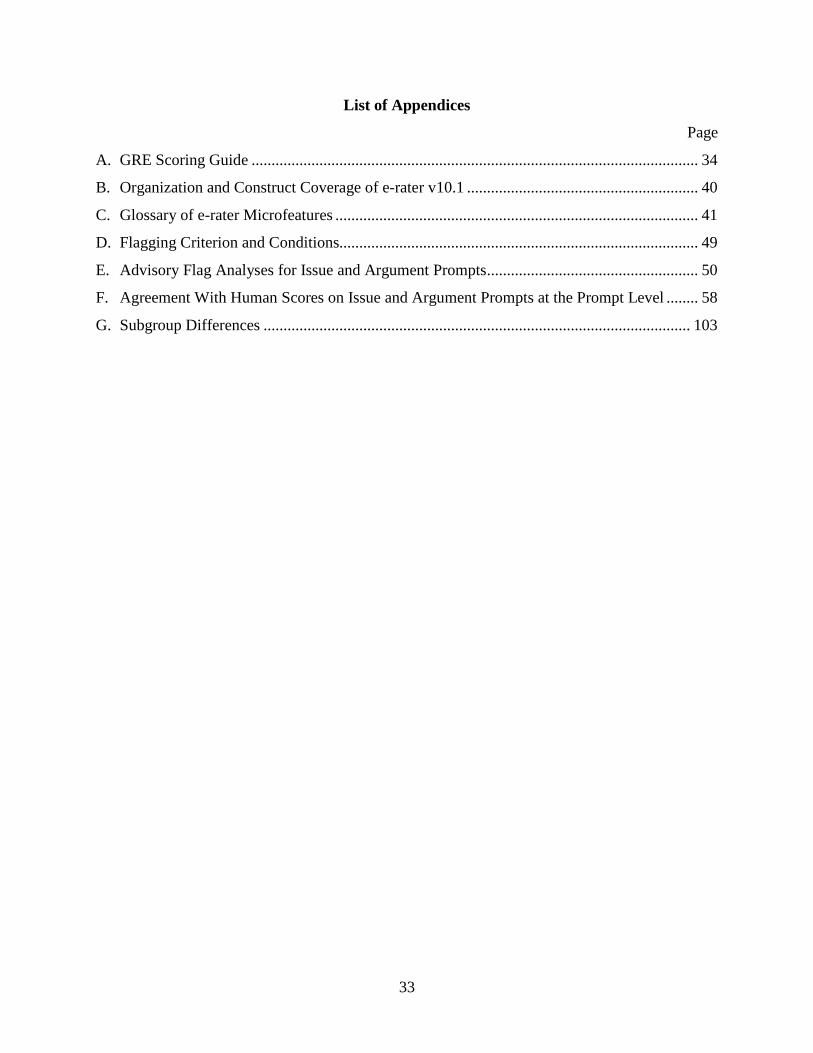
List of Appendices
Page
A. GRE Scoring Guide ................................................................................................................ 34
B. Organization and Construct Coverage of e-rater v10.1 .......................................................... 40
C. Glossary of e-rater Microfeatures ........................................................................................... 41
D. Flagging Criterion and Conditions.......................................................................................... 49
E. Advisory Flag Analyses for Issue and Argument Prompts ..................................................... 50
F. Agreement With Human Scores on Issue and Argument Prompts at the Prompt Level ........ 58
G. Subgroup Differences ........................................................................................................... 103
34
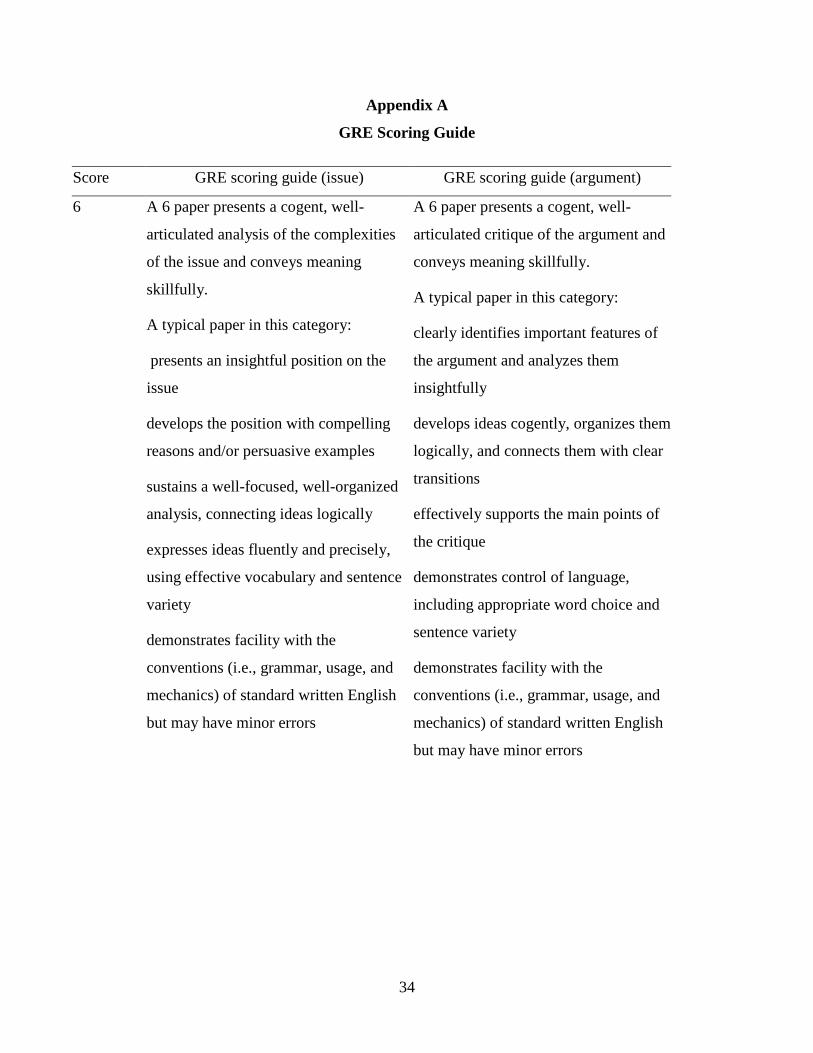
Appendix A
GRE Scoring Guide
Score GRE scoring guide (issue) GRE scoring guide (argument)
6 A 6 paper presents a cogent, well-
articulated analysis of the complexities
of the issue and conveys meaning
skillfully.
A typical paper in this category:
presents an insightful position on the
issue
develops the position with compelling
reasons and/or persuasive examples
sustains a well-focused, well-organized
analysis, connecting ideas logically
expresses ideas fluently and precisely,
using effective vocabulary and sentence
variety
demonstrates facility with the
conventions (i.e., grammar, usage, and
mechanics) of standard written English
but may have minor errors
A 6 paper presents a cogent, well-
articulated critique of the argument and
conveys meaning skillfully.
A typical paper in this category:
clearly identifies important features of
the argument and analyzes them
insightfully
develops ideas cogently, organizes them
logically, and connects them with clear
transitions
effectively supports the main points of
the critique
demonstrates control of language,
including appropriate word choice and
sentence variety
demonstrates facility with the
conventions (i.e., grammar, usage, and
mechanics) of standard written English
but may have minor errors
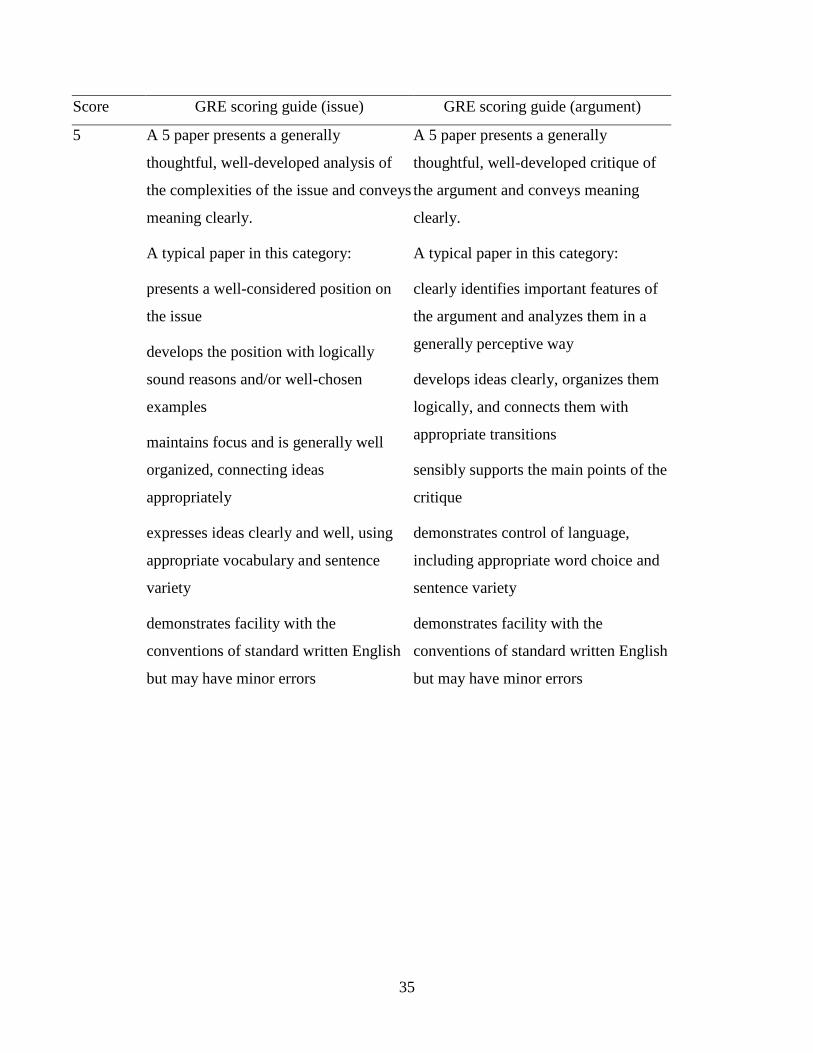
35
Score GRE scoring guide (issue) GRE scoring guide (argument)
5 A 5 paper presents a generally
thoughtful, well-developed analysis of
the complexities of the issue and conveys
meaning clearly.
A typical paper in this category:
presents a well-considered position on
the issue
develops the position with logically
sound reasons and/or well-chosen
examples
maintains focus and is generally well
organized, connecting ideas
appropriately
expresses ideas clearly and well, using
appropriate vocabulary and sentence
variety
demonstrates facility with the
conventions of standard written English
but may have minor errors
A 5 paper presents a generally
thoughtful, well-developed critique of
the argument and conveys meaning
clearly.
A typical paper in this category:
clearly identifies important features of
the argument and analyzes them in a
generally perceptive way
develops ideas clearly, organizes them
logically, and connects them with
appropriate transitions
sensibly supports the main points of the
critique
demonstrates control of language,
including appropriate word choice and
sentence variety
demonstrates facility with the
conventions of standard written English
but may have minor errors
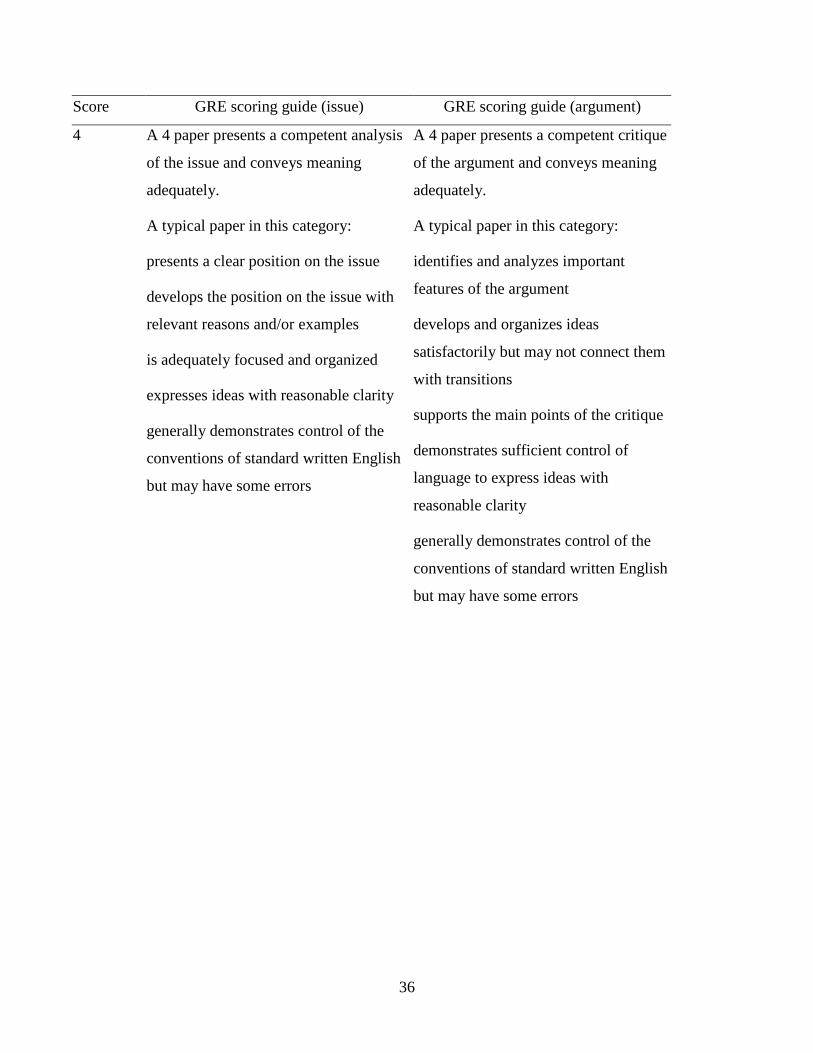
36
Score GRE scoring guide (issue) GRE scoring guide (argument)
4 A 4 paper presents a competent analysis
of the issue and conveys meaning
adequately.
A typical paper in this category:
presents a clear position on the issue
develops the position on the issue with
relevant reasons and/or examples
is adequately focused and organized
expresses ideas with reasonable clarity
generally demonstrates control of the
conventions of standard written English
but may have some errors
A 4 paper presents a competent critique
of the argument and conveys meaning
adequately.
A typical paper in this category:
identifies and analyzes important
features of the argument
develops and organizes ideas
satisfactorily but may not connect them
with transitions
supports the main points of the critique
demonstrates sufficient control of
language to express ideas with
reasonable clarity
generally demonstrates control of the
conventions of standard written English
but may have some errors
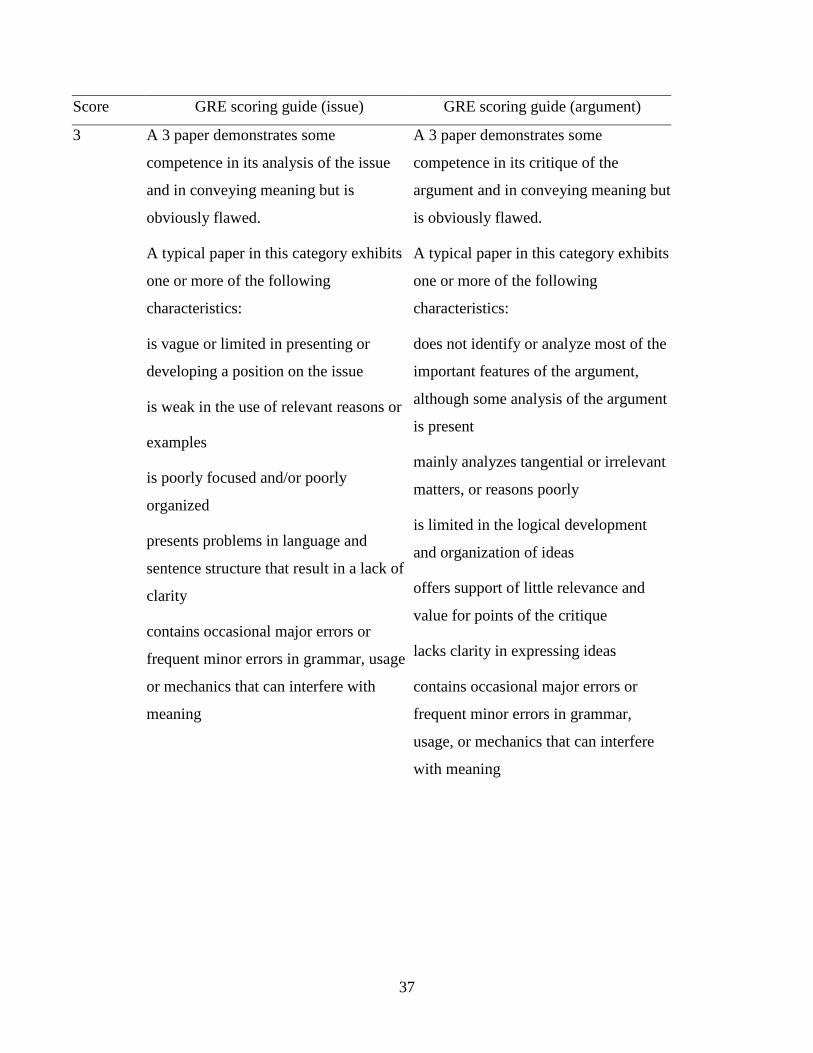
37
Score GRE scoring guide (issue) GRE scoring guide (argument)
3 A 3 paper demonstrates some
competence in its analysis of the issue
and in conveying meaning but is
obviously flawed.
A typical paper in this category exhibits
one or more of the following
characteristics:
is vague or limited in presenting or
developing a position on the issue
is weak in the use of relevant reasons or
examples
is poorly focused and/or poorly
organized
presents problems in language and
sentence structure that result in a lack of
clarity
contains occasional major errors or
frequent minor errors in grammar, usage
or mechanics that can interfere with
meaning
A 3 paper demonstrates some
competence in its critique of the
argument and in conveying meaning but
is obviously flawed.
A typical paper in this category exhibits
one or more of the following
characteristics:
does not identify or analyze most of the
important features of the argument,
although some analysis of the argument
is present
mainly analyzes tangential or irrelevant
matters, or reasons poorly
is limited in the logical development
and organization of ideas
offers support of little relevance and
value for points of the critique
lacks clarity in expressing ideas
contains occasional major errors or
frequent minor errors in grammar,
usage, or mechanics that can interfere
with meaning
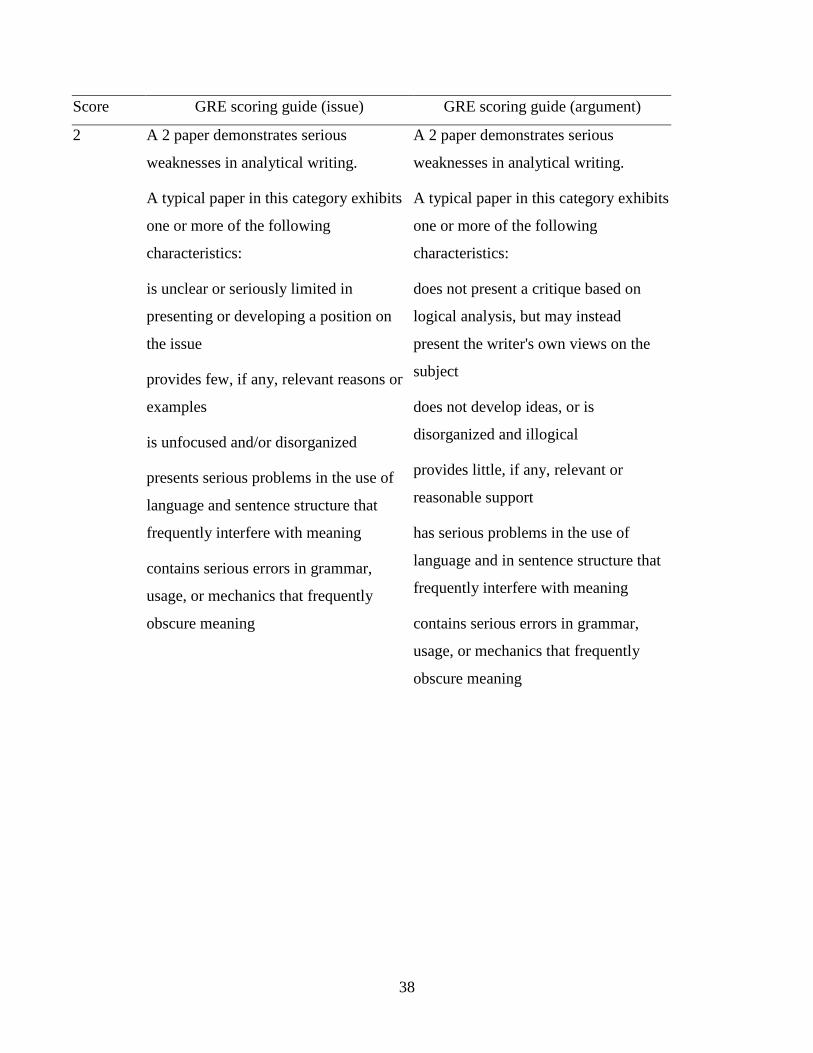
38
Score GRE scoring guide (issue) GRE scoring guide (argument)
2 A 2 paper demonstrates serious
weaknesses in analytical writing.
A typical paper in this category exhibits
one or more of the following
characteristics:
is unclear or seriously limited in
presenting or developing a position on
the issue
provides few, if any, relevant reasons or
examples
is unfocused and/or disorganized
presents serious problems in the use of
language and sentence structure that
frequently interfere with meaning
contains serious errors in grammar,
usage, or mechanics that frequently
obscure meaning
A 2 paper demonstrates serious
weaknesses in analytical writing.
A typical paper in this category exhibits
one or more of the following
characteristics:
does not present a critique based on
logical analysis, but may instead
present the writer's own views on the
subject
does not develop ideas, or is
disorganized and illogical
provides little, if any, relevant or
reasonable support
has serious problems in the use of
language and in sentence structure that
frequently interfere with meaning
contains serious errors in grammar,
usage, or mechanics that frequently
obscure meaning
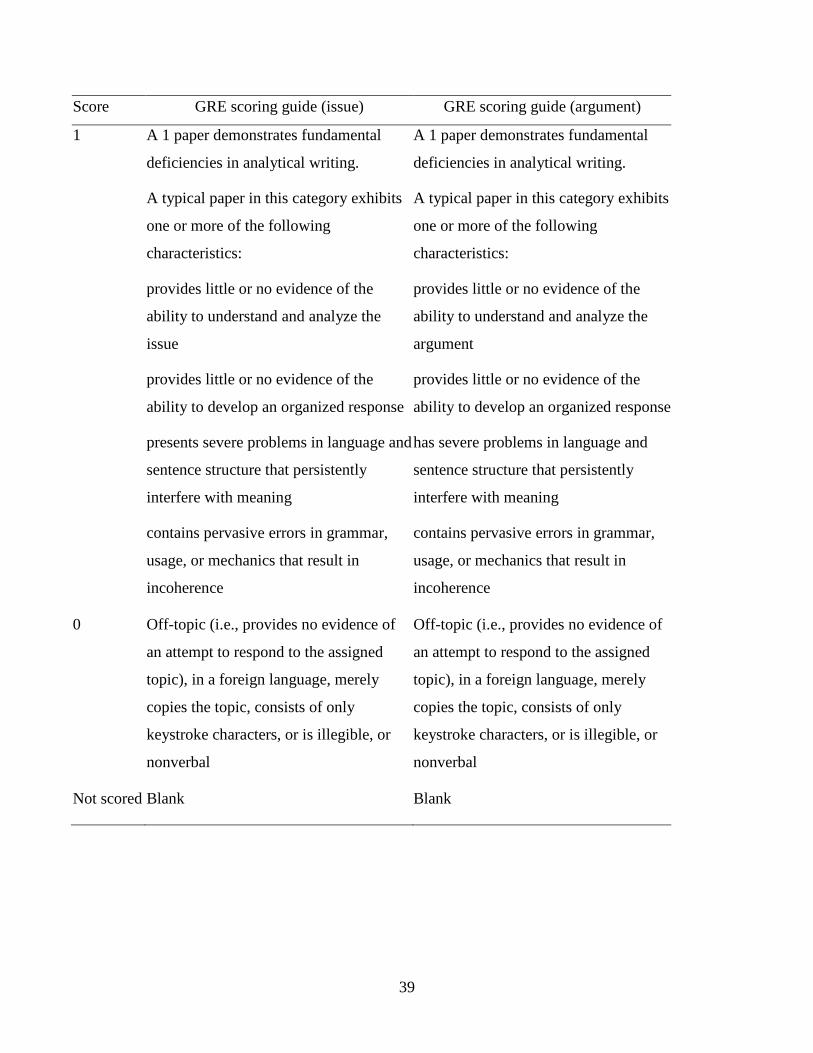
39
Score GRE scoring guide (issue) GRE scoring guide (argument)
1 A 1 paper demonstrates fundamental
deficiencies in analytical writing.
A typical paper in this category exhibits
one or more of the following
characteristics:
provides little or no evidence of the
ability to understand and analyze the
issue
provides little or no evidence of the
ability to develop an organized response
presents severe problems in language and
sentence structure that persistently
interfere with meaning
contains pervasive errors in grammar,
usage, or mechanics that result in
incoherence
A 1 paper demonstrates fundamental
deficiencies in analytical writing.
A typical paper in this category exhibits
one or more of the following
characteristics:
provides little or no evidence of the
ability to understand and analyze the
argument
provides little or no evidence of the
ability to develop an organized response
has severe problems in language and
sentence structure that persistently
interfere with meaning
contains pervasive errors in grammar,
usage, or mechanics that result in
incoherence
0 Off-topic (i.e., provides no evidence of
an attempt to respond to the assigned
topic), in a foreign language, merely
copies the topic, consists of only
keystroke characters, or is illegible, or
nonverbal
Off-topic (i.e., provides no evidence of
an attempt to respond to the assigned
topic), in a foreign language, merely
copies the topic, consists of only
keystroke characters, or is illegible, or
nonverbal
Not scored Blank Blank
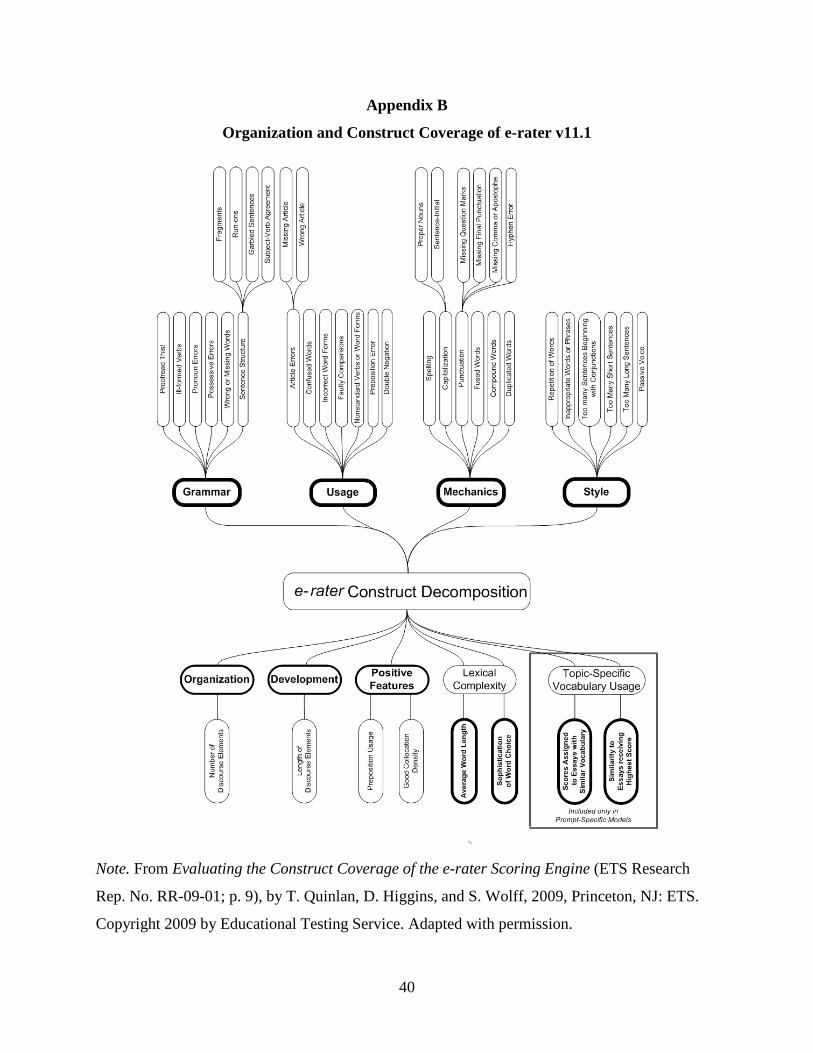
40
Appendix B
Organization and Construct Coverage of e-rater v11.1
Note. From Evaluating the Construct Coverage of the e-rater Scoring Engine (ETS Research
Rep. No. RR-09-01; p. 9), by T. Quinlan, D. Higgins, and S. Wolff, 2009, Princeton, NJ: ETS.
Copyright 2009 by Educational Testing Service. Adapted with permission.
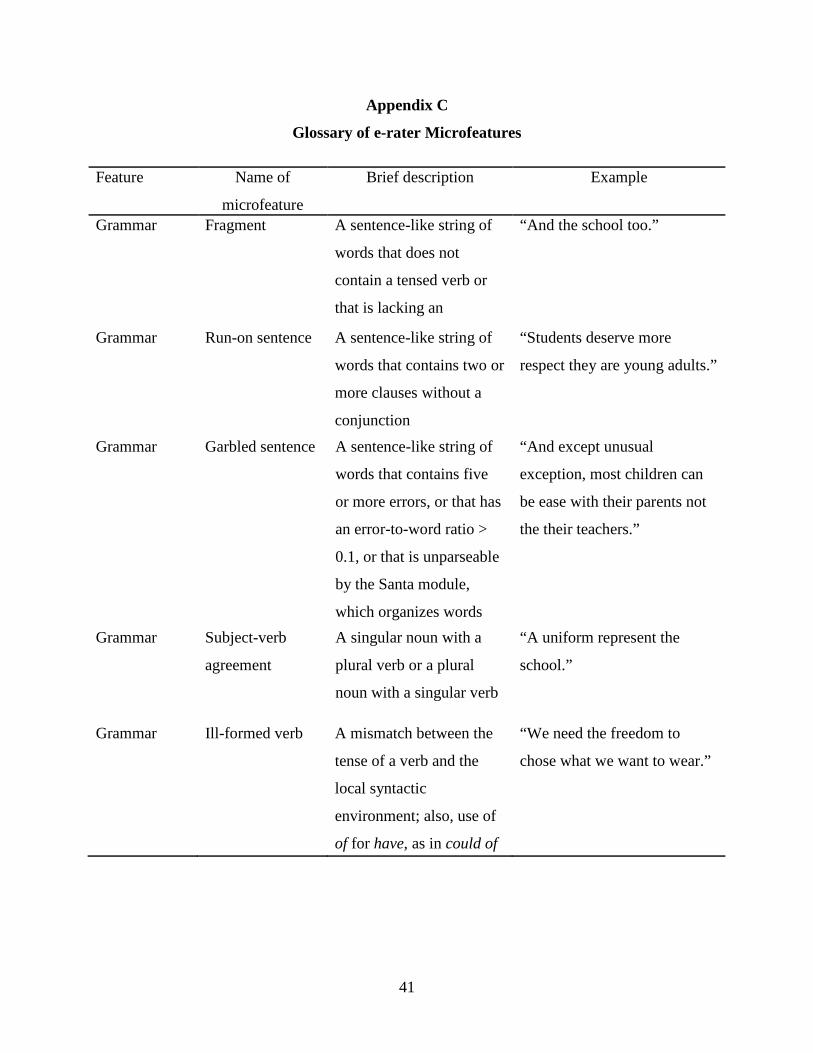
41
Appendix C
Glossary of e-rater Microfeatures
Feature Name of
microfeature
Brief description Example
Grammar Fragment A sentence-like string of
words that does not
contain a tensed verb or
that is lacking an
“And the school too.”
Grammar Run-on sentence A sentence-like string of
words that contains two or
more clauses without a
conjunction
“Students deserve more
respect they are young adults.”
Grammar Garbled sentence A sentence-like string of
words that contains five
or more errors, or that has
an error-to-word ratio >
0.1, or that is unparseable
by the Santa module,
which organizes words
“And except unusual
exception, most children can
be ease with their parents not
the their teachers.”
Grammar Subject-verb
agreement
A singular noun with a
plural verb or a plural
noun with a singular verb
“A uniform represent the
school.”
Grammar Ill-formed verb A mismatch between the
tense of a verb and the
local syntactic
environment; also, use of
of for have, as in could of
“We need the freedom to
chose what we want to wear.”
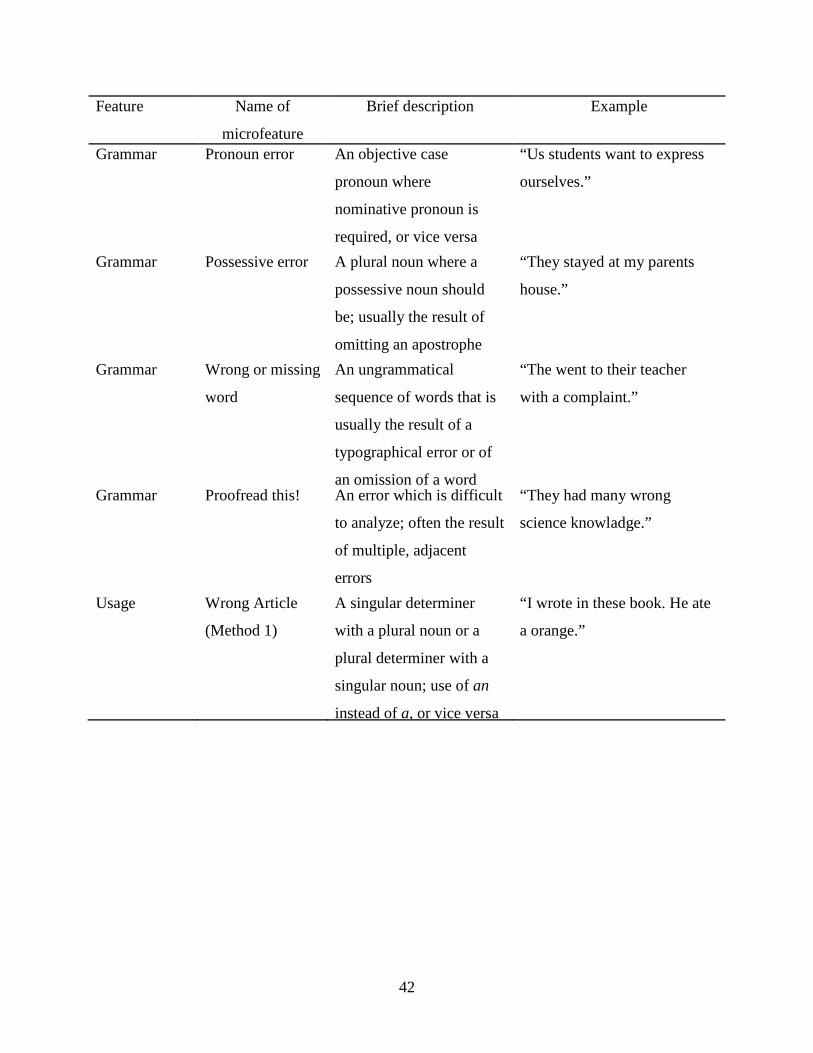
42
Feature Name of
microfeature
Brief description Example
Grammar Pronoun error An objective case
pronoun where
nominative pronoun is
required, or vice versa
“Us students want to express
ourselves.”
Grammar Possessive error A plural noun where a
possessive noun should
be; usually the result of
omitting an apostrophe
“They stayed at my parents
house.”
Grammar Wrong or missing
word
An ungrammatical
sequence of words that is
usually the result of a
typographical error or of
an omission of a word
“The went to their teacher
with a complaint.”
Grammar Proofread this! An error which is difficult
to analyze; often the result
of multiple, adjacent
errors
“They had many wrong
science knowladge.”
Usage Wrong Article
(Method 1)
A singular determiner
with a plural noun or a
plural determiner with a
singular noun; use of an
instead of a, or vice versa
“I wrote in these book. He ate
a orange.”
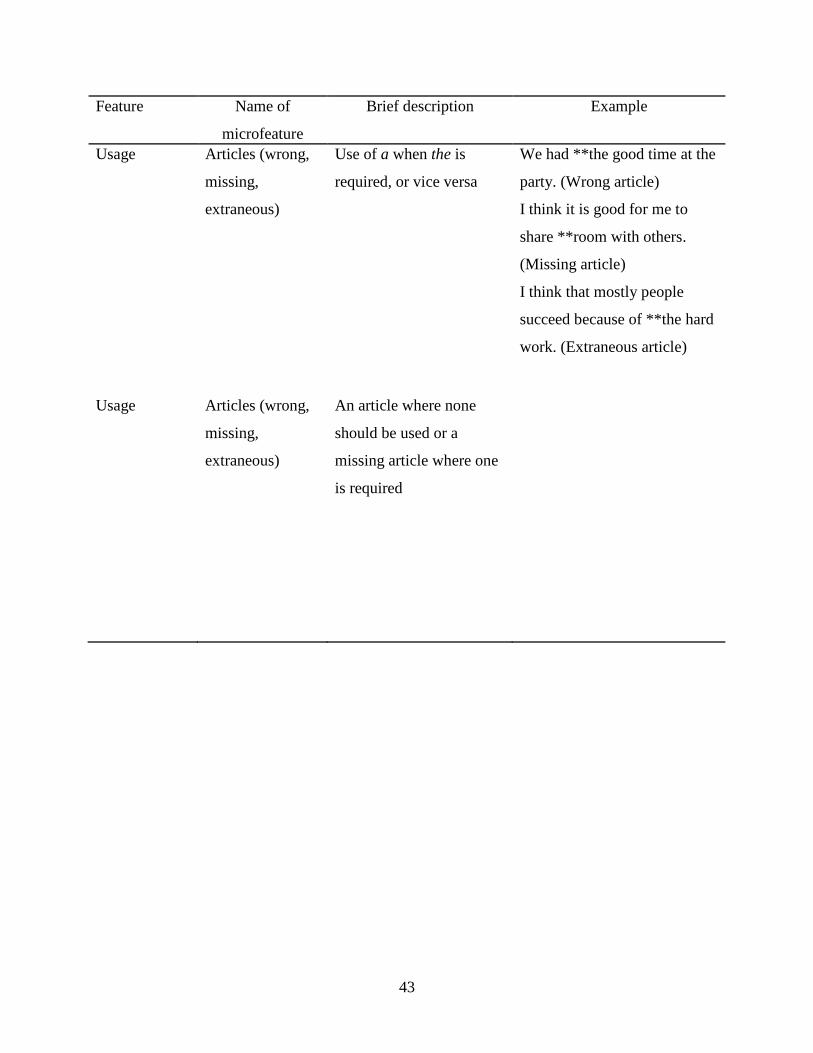
43
Feature Name of
microfeature
Brief description Example
Usage Articles (wrong,
missing,
extraneous)
Use of a when the is
required, or vice versa
We had **the good time at the
party. (Wrong article)
I think it is good for me to
share **room with others.
(Missing article)
I think that mostly people
succeed because of **the hard
work. (Extraneous article)
Usage Articles (wrong,
missing,
extraneous)
An article where none
should be used or a
missing article where one
is required
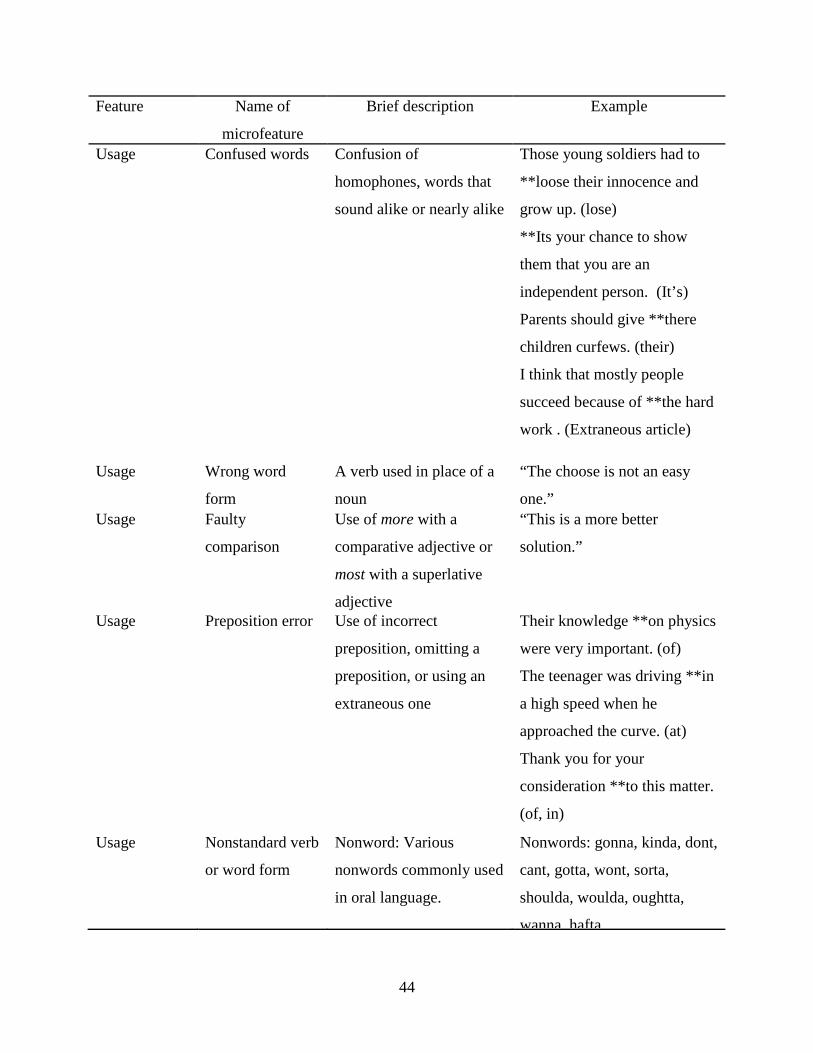
44
Feature Name of
microfeature
Brief description Example
Usage Confused words Confusion of
homophones, words that
sound alike or nearly alike
Those young soldiers had to
**loose their innocence and
grow up. (lose)
**Its your chance to show
them that you are an
independent person. (It’s)
Parents should give **there
children curfews. (their)
I think that mostly people
succeed because of **the hard
work . (Extraneous article)
Usage Wrong word
form
A verb used in place of a
noun
“The choose is not an easy
one.” Usage Faulty
comparison
Use of more with a
comparative adjective or
most with a superlative
adjective
“This is a more better
solution.”
Usage Preposition error Use of incorrect
preposition, omitting a
preposition, or using an
extraneous one
Their knowledge **on physics
were very important. (of)
The teenager was driving **in
a high speed when he
approached the curve. (at)
Thank you for your
consideration **to this matter.
(of, in)
Usage Nonstandard verb
or word form
Nonword: Various
nonwords commonly used
in oral language.
Nonwords: gonna, kinda, dont,
cant, gotta, wont, sorta,
shoulda, woulda, oughtta,
wanna, hafta
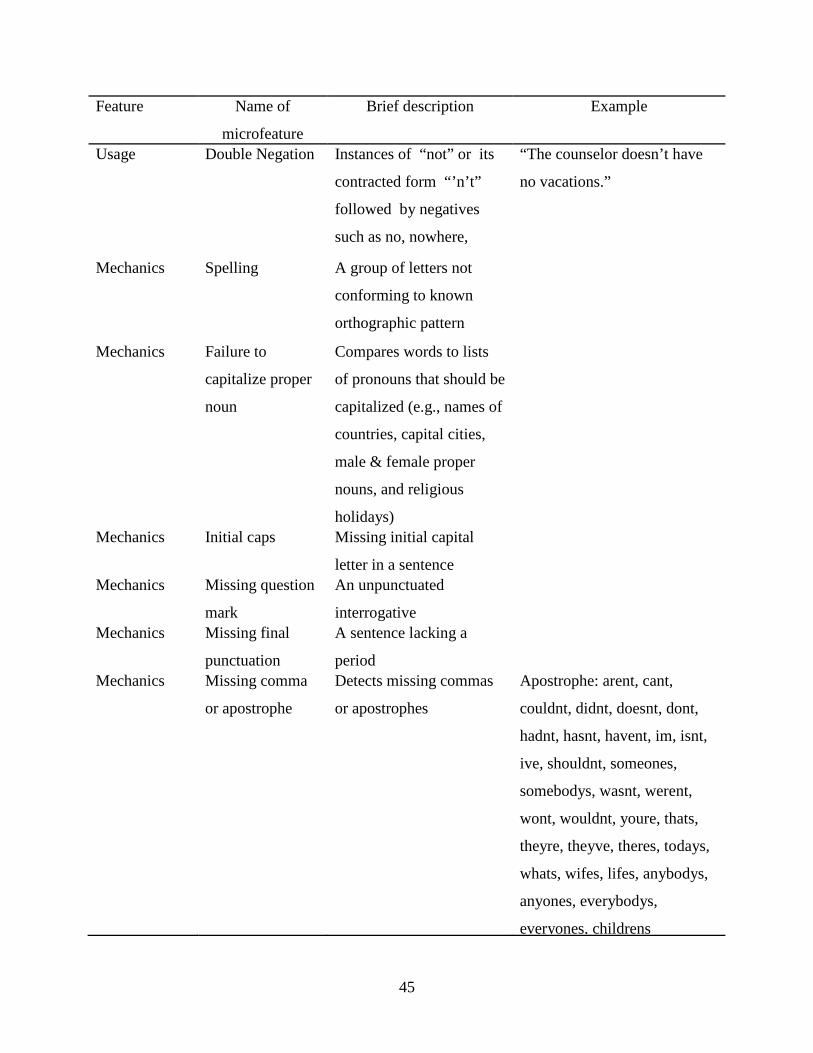
45
Feature Name of
microfeature
Brief description Example
Usage Double Negation Instances of “not” or its
contracted form “’n’t”
followed by negatives
such as no, nowhere,
h
“The counselor doesn’t have
no vacations.”
Mechanics Spelling A group of letters not
conforming to known
orthographic pattern
Mechanics Failure to
capitalize proper
noun
Compares words to lists
of pronouns that should be
capitalized (e.g., names of
countries, capital cities,
male & female proper
nouns, and religious
holidays)
Mechanics Initial caps Missing initial capital
letter in a sentence
Mechanics Missing question
mark
An unpunctuated
interrogative
Mechanics Missing final
punctuation
A sentence lacking a
period
Mechanics Missing comma
or apostrophe
Detects missing commas
or apostrophes
Apostrophe: arent, cant,
couldnt, didnt, doesnt, dont,
hadnt, hasnt, havent, im, isnt,
ive, shouldnt, someones,
somebodys, wasnt, werent,
wont, wouldnt, youre, thats,
theyre, theyve, theres, todays,
whats, wifes, lifes, anybodys,
anyones, everybodys,
everyones, childrens
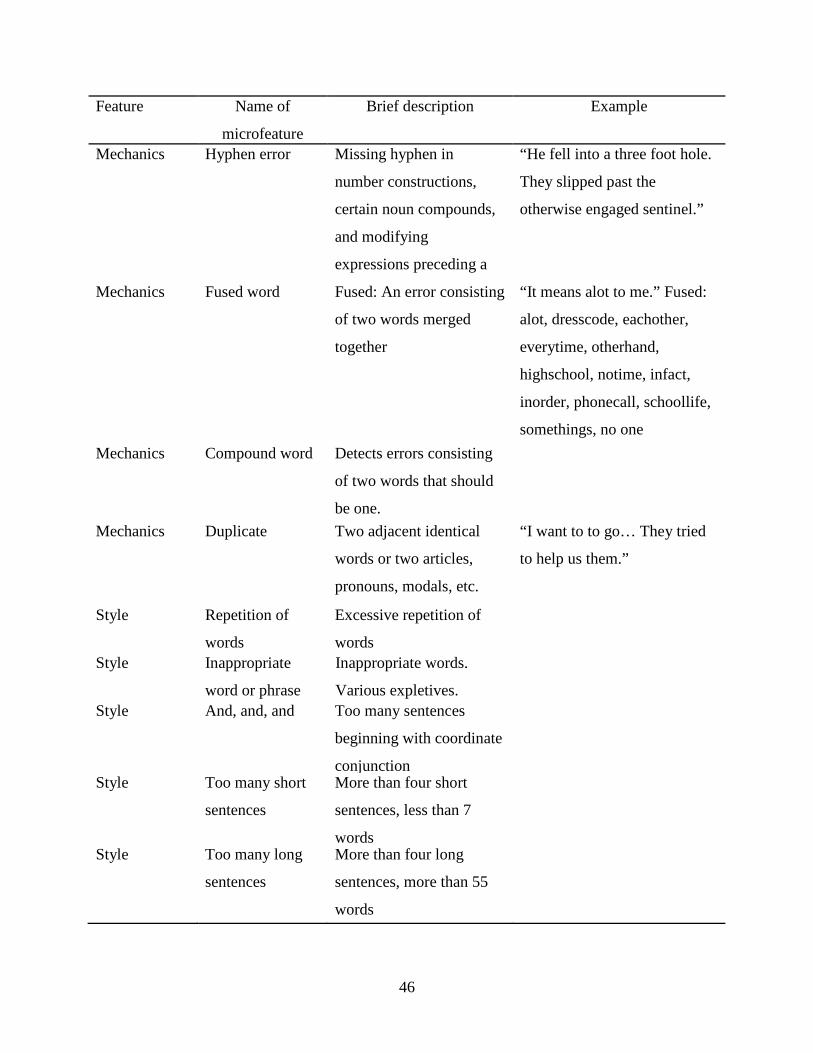
46
Feature Name of
microfeature
Brief description Example
Mechanics Hyphen error Missing hyphen in
number constructions,
certain noun compounds,
and modifying
expressions preceding a
“He fell into a three foot hole.
They slipped past the
otherwise engaged sentinel.”
Mechanics Fused word Fused: An error consisting
of two words merged
together
“It means alot to me.” Fused:
alot, dresscode, eachother,
everytime, otherhand,
highschool, notime, infact,
inorder, phonecall, schoollife,
somethings, no one Mechanics Compound word Detects errors consisting
of two words that should
be one.
Mechanics Duplicate Two adjacent identical
words or two articles,
pronouns, modals, etc.
“I want to to go… They tried
to help us them.”
Style Repetition of
words
Excessive repetition of
words
Style Inappropriate
word or phrase
Inappropriate words.
Various expletives.
Style And, and, and Too many sentences
beginning with coordinate
conjunction
Style Too many short
sentences
More than four short
sentences, less than 7
words
Style Too many long
sentences
More than four long
sentences, more than 55
words
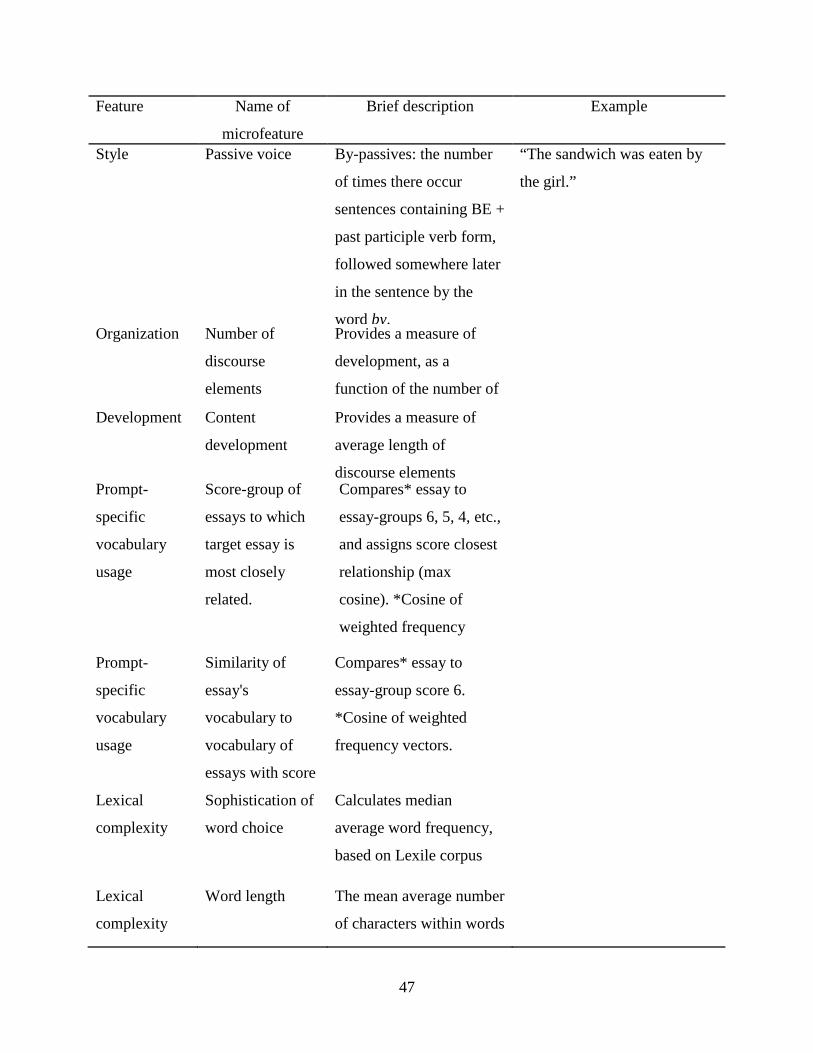
47
Feature Name of
microfeature
Brief description Example
Style Passive voice By-passives: the number
of times there occur
sentences containing BE +
past participle verb form,
followed somewhere later
in the sentence by the
word by.
“The sandwich was eaten by
the girl.”
Organization Number of
discourse
elements
Provides a measure of
development, as a
function of the number of
Development Content
development
Provides a measure of
average length of
discourse elements
Prompt-
specific
vocabulary
usage
Score-group of
essays to which
target essay is
most closely
related.
Compares* essay to
essay-groups 6, 5, 4, etc.,
and assigns score closest
relationship (max
cosine). *Cosine of
weighted frequency
Prompt-
specific
vocabulary
usage
Similarity of
essay's
vocabulary to
vocabulary of
essays with score
Compares* essay to
essay-group score 6.
*Cosine of weighted
frequency vectors.
Lexical
complexity
Sophistication of
word choice
Calculates median
average word frequency,
based on Lexile corpus
Lexical
complexity
Word length The mean average number
of characters within words
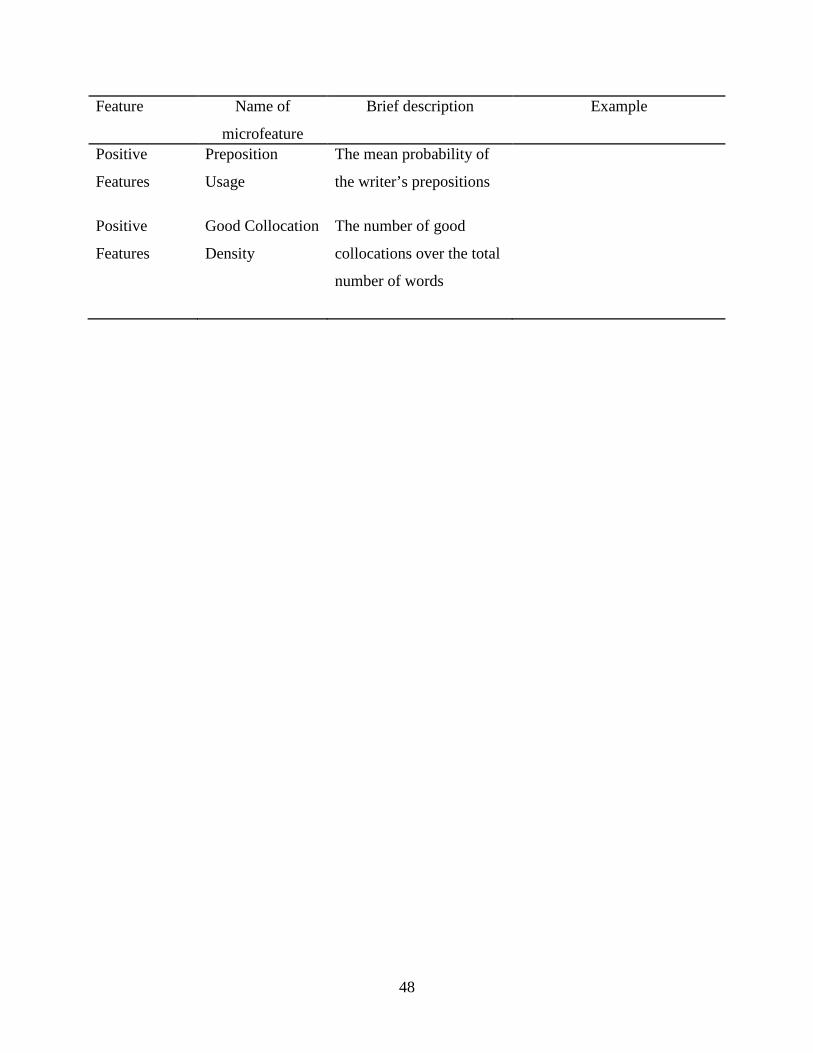
48
Feature Name of
microfeature
Brief description Example
Positive
Features
Preposition
Usage
The mean probability of
the writer’s prepositions
Positive
Features
Good Collocation
Density
The number of good
collocations over the total
number of words
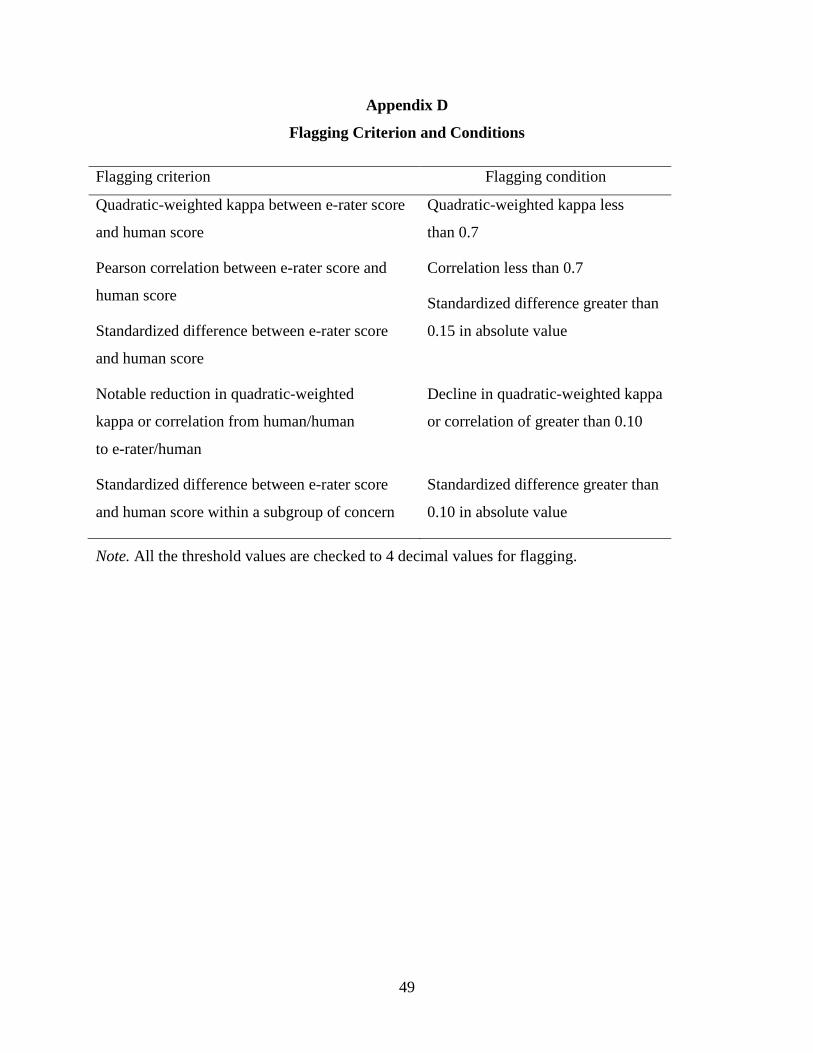
49
Appendix D
Flagging Criterion and Conditions
Flagging criterion Flagging condition
Quadratic-weighted kappa between e-rater score
and human score
Pearson correlation between e-rater score and
human score
Standardized difference between e-rater score
and human score
Quadratic-weighted kappa less
than 0.7
Correlation less than 0.7
Standardized difference greater than
0.15 in absolute value
Notable reduction in quadratic-weighted
kappa or correlation from human/human
to e-rater/human
Decline in quadratic-weighted kappa
or correlation of greater than 0.10
Standardized difference between e-rater score
and human score within a subgroup of concern
Standardized difference greater than
0.10 in absolute value
Note. All the threshold values are checked to 4 decimal values for flagging.
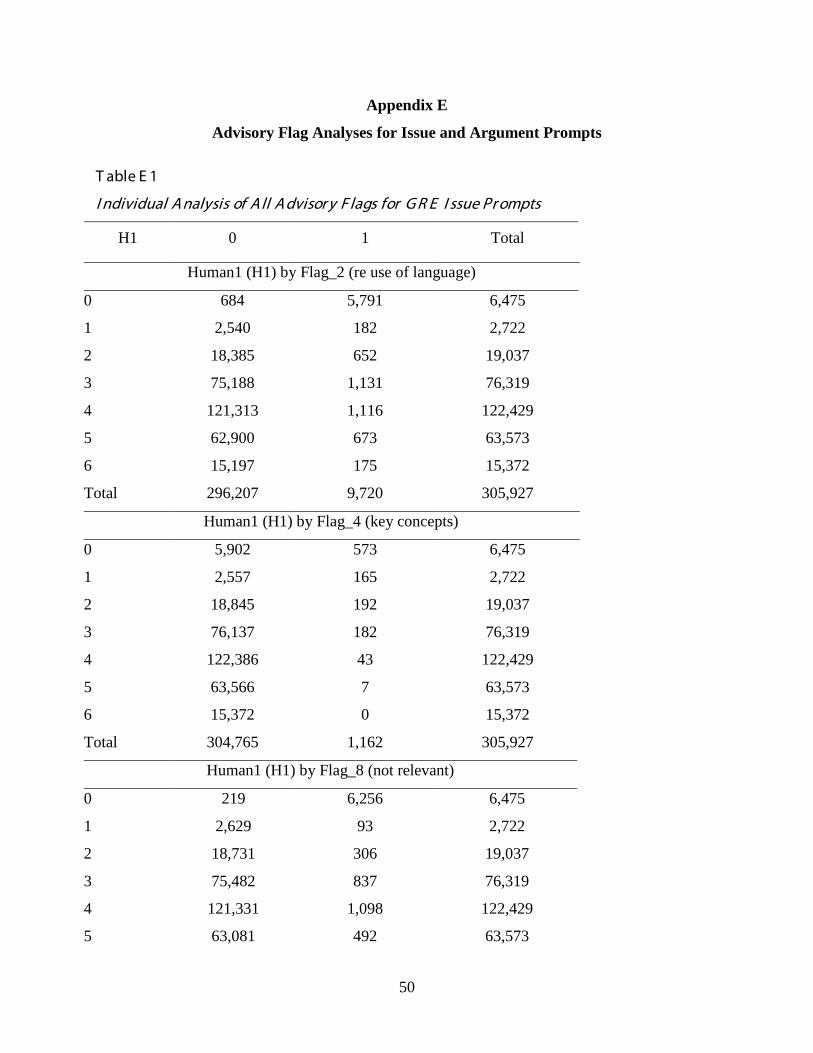
50
Appendix E
Advisory Flag Analyses for Issue and Argument Prompts
T able E 1
I ndividual A nalysis of A ll A dvisor y F lags for G R E I ssue Pr ompts
H1 0 1 Total
Human1 (H1) by Flag_2 (re use of language)
0 684 5,791 6,475
1 2,540 182 2,722
2 18,385 652 19,037
3 75,188 1,131 76,319
4 121,313 1,116 122,429
5 62,900 673 63,573
6 15,197 175 15,372
Total 296,207 9,720 305,927
Human1 (H1) by Flag_4 (key concepts)
0 5,902 573 6,475
1 2,557 165 2,722
2 18,845 192 19,037
3 76,137 182 76,319
4 122,386 43 122,429
5 63,566 7 63,573
6 15,372 0 15,372
Total 304,765 1,162 305,927
Human1 (H1) by Flag_8 (not relevant)
0 219 6,256 6,475
1 2,629 93 2,722
2 18,731 306 19,037
3 75,482 837 76,319
4 121,331 1,098 122,429
5 63,081 492 63,573
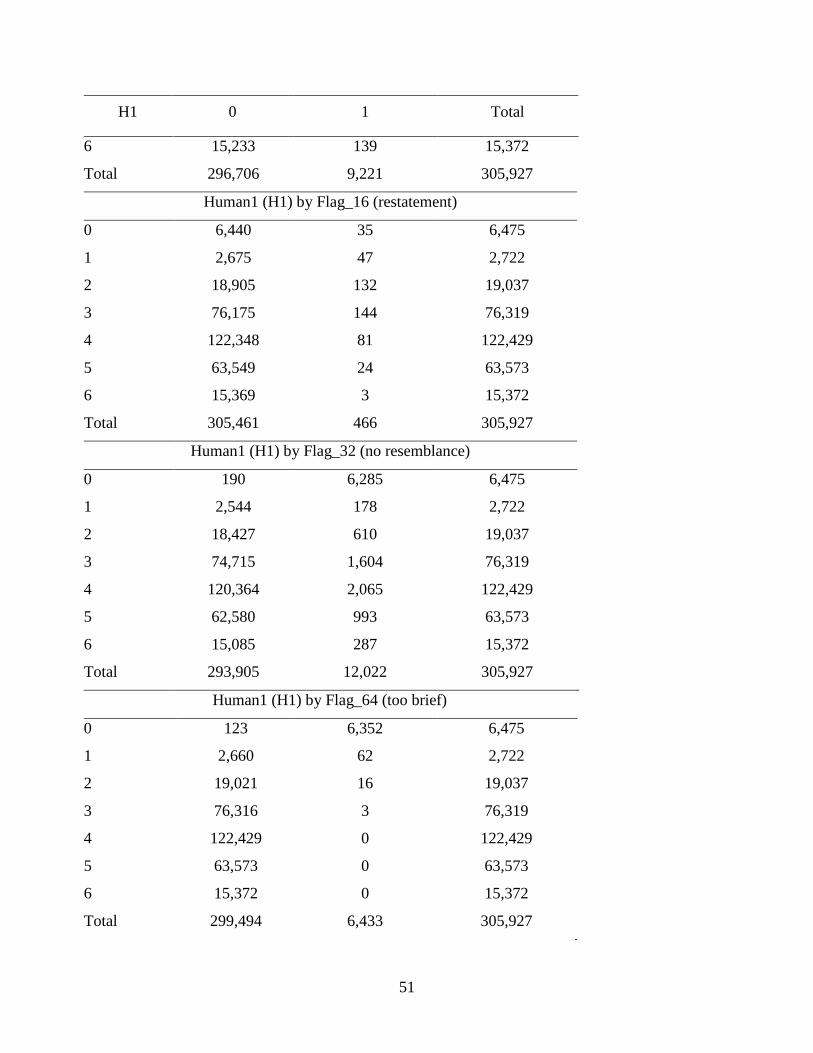
51
H1 0 1 Total
6 15,233 139 15,372
Total 296,706 9,221 305,927
Human1 (H1) by Flag_16 (restatement)
0 6,440 35 6,475
1 2,675 47 2,722
2 18,905 132 19,037
3 76,175 144 76,319
4 122,348 81 122,429
5 63,549 24 63,573
6 15,369 3 15,372
Total 305,461 466 305,927
Human1 (H1) by Flag_32 (no resemblance)
0 190 6,285 6,475
1 2,544 178 2,722
2 18,427 610 19,037
3 74,715 1,604 76,319
4 120,364 2,065 122,429
5 62,580 993 63,573
6 15,085 287 15,372
Total 293,905 12,022 305,927
Human1 (H1) by Flag_64 (too brief)
0 123 6,352 6,475
1 2,660 62 2,722
2 19,021 16 19,037
3 76,316 3 76,319
4 122,429 0 122,429
5 63,573 0 63,573
6 15,372 0 15,372
Total 299,494 6,433 305,927
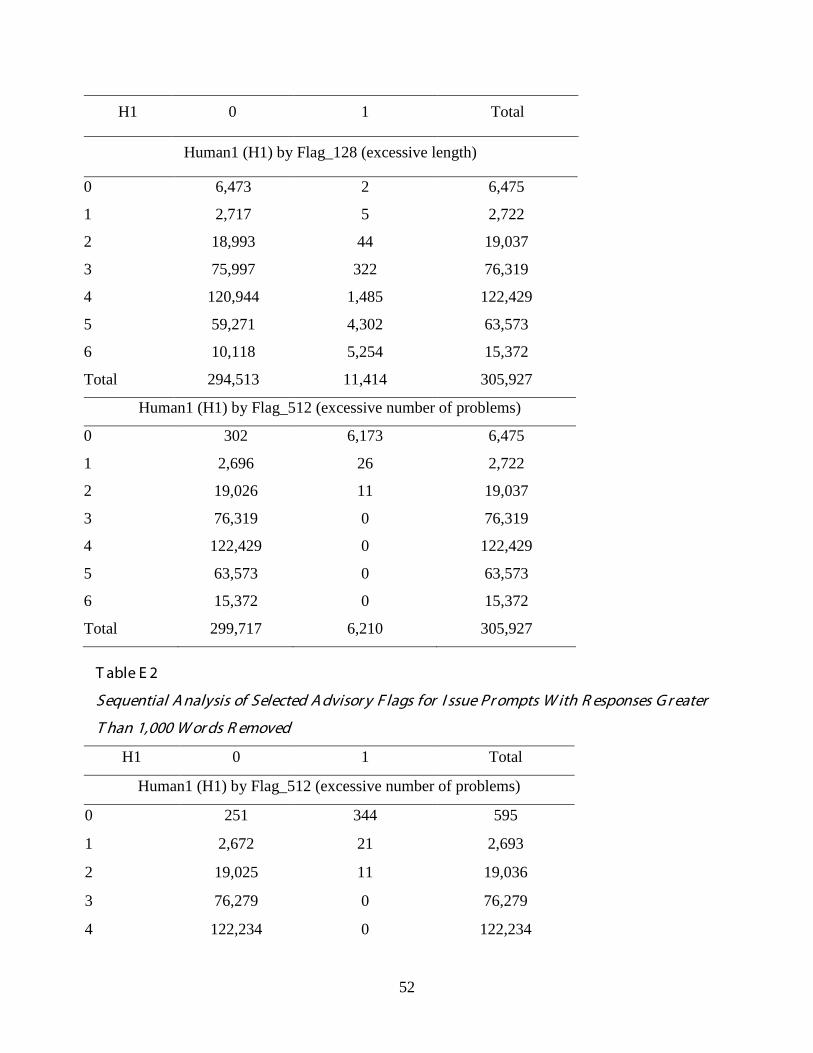
52
H1 0 1 Total
Human1 (H1) by Flag_128 (excessive length)
0 6,473 2 6,475
1 2,717 5 2,722
2 18,993 44 19,037
3 75,997 322 76,319
4 120,944 1,485 122,429
5 59,271 4,302 63,573
6 10,118 5,254 15,372
Total 294,513 11,414 305,927
Human1 (H1) by Flag_512 (excessive number of problems)
0 302 6,173 6,475
1 2,696 26 2,722
2 19,026 11 19,037
3 76,319 0 76,319
4 122,429 0 122,429
5 63,573 0 63,573
6 15,372 0 15,372
Total 299,717 6,210 305,927
T able E 2
Sequential A nalysis of Selected A dvisor y F lags for I ssue Pr ompts W ith R esponses G r eater
T han 1,000 W or ds R emoved
H1 0 1 Total
Human1 (H1) by Flag_512 (excessive number of problems)
0 251 344 595
1 2,672 21 2,693
2 19,025 11 19,036
3 76,279 0 76,279
4 122,234 0 122,234
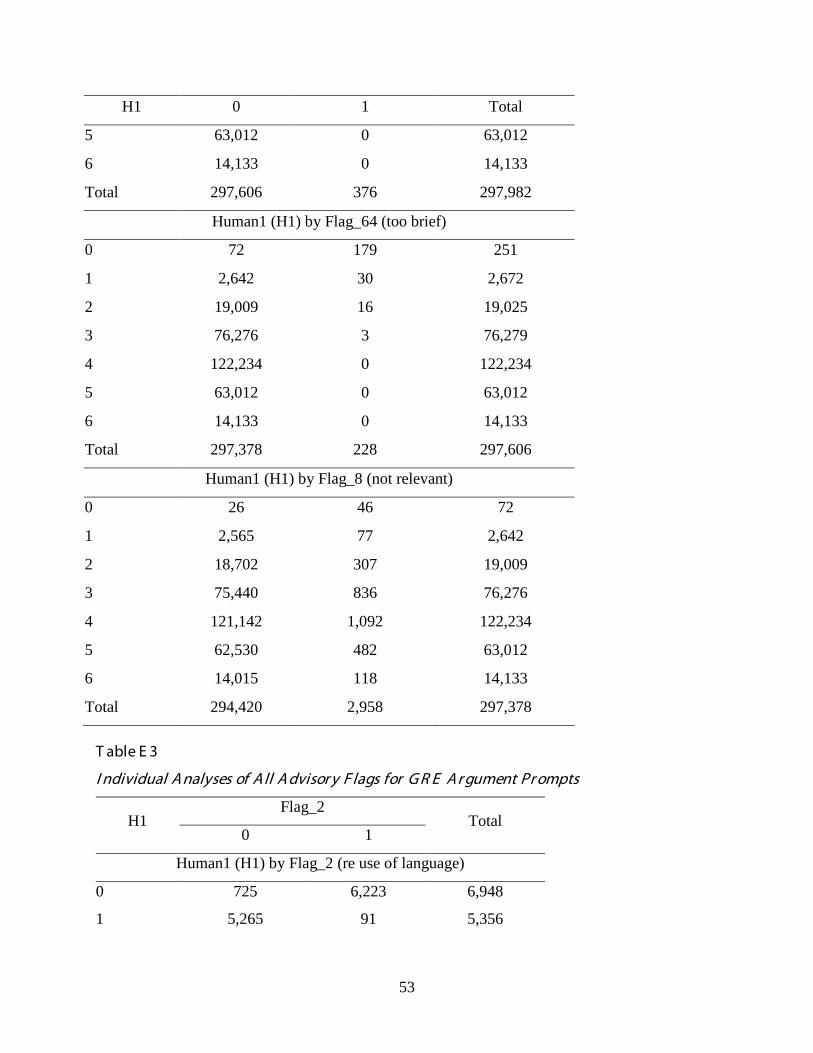
53
H1 0 1 Total
5 63,012 0 63,012
6 14,133 0 14,133
Total 297,606 376 297,982
Human1 (H1) by Flag_64 (too brief)
0 72 179 251
1 2,642 30 2,672
2 19,009 16 19,025
3 76,276 3 76,279
4 122,234 0 122,234
5 63,012 0 63,012
6 14,133 0 14,133
Total 297,378 228 297,606
Human1 (H1) by Flag_8 (not relevant)
0 26 46 72
1 2,565 77 2,642
2 18,702 307 19,009
3 75,440 836 76,276
4 121,142 1,092 122,234
5 62,530 482 63,012
6 14,015 118 14,133
Total 294,420 2,958 297,378
T able E 3
I ndividual A nalyses of A ll A dvisor y F lags for G R E A r gument Pr ompts
H1 Flag_2
Total 0 1
Human1 (H1) by Flag_2 (re use of language)
0 725 6,223 6,948
1 5,265 91 5,356
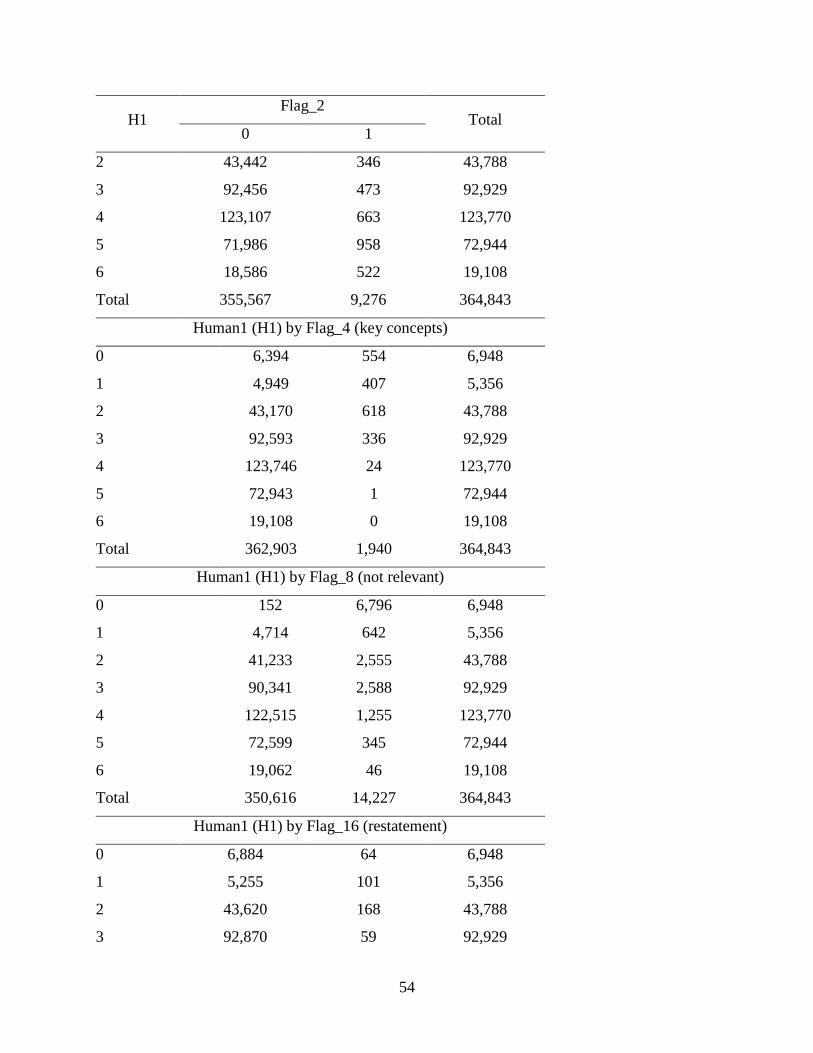
54
H1 Flag_2
Total 0 1
2 43,442 346 43,788
3 92,456 473 92,929
4 123,107 663 123,770
5 71,986 958 72,944
6 18,586 522 19,108
Total 355,567 9,276 364,843
Human1 (H1) by Flag_4 (key concepts)
0 6,394 554 6,948
1 4,949 407 5,356
2 43,170 618 43,788
3 92,593 336 92,929
4 123,746 24 123,770
5 72,943 1 72,944
6 19,108 0 19,108
Total 362,903 1,940 364,843
Human1 (H1) by Flag_8 (not relevant)
0 152 6,796 6,948
1 4,714 642 5,356
2 41,233 2,555 43,788
3 90,341 2,588 92,929
4 122,515 1,255 123,770
5 72,599 345 72,944
6 19,062 46 19,108
Total 350,616 14,227 364,843
Human1 (H1) by Flag_16 (restatement)
0 6,884 64 6,948
1 5,255 101 5,356
2 43,620 168 43,788
3 92,870 59 92,929
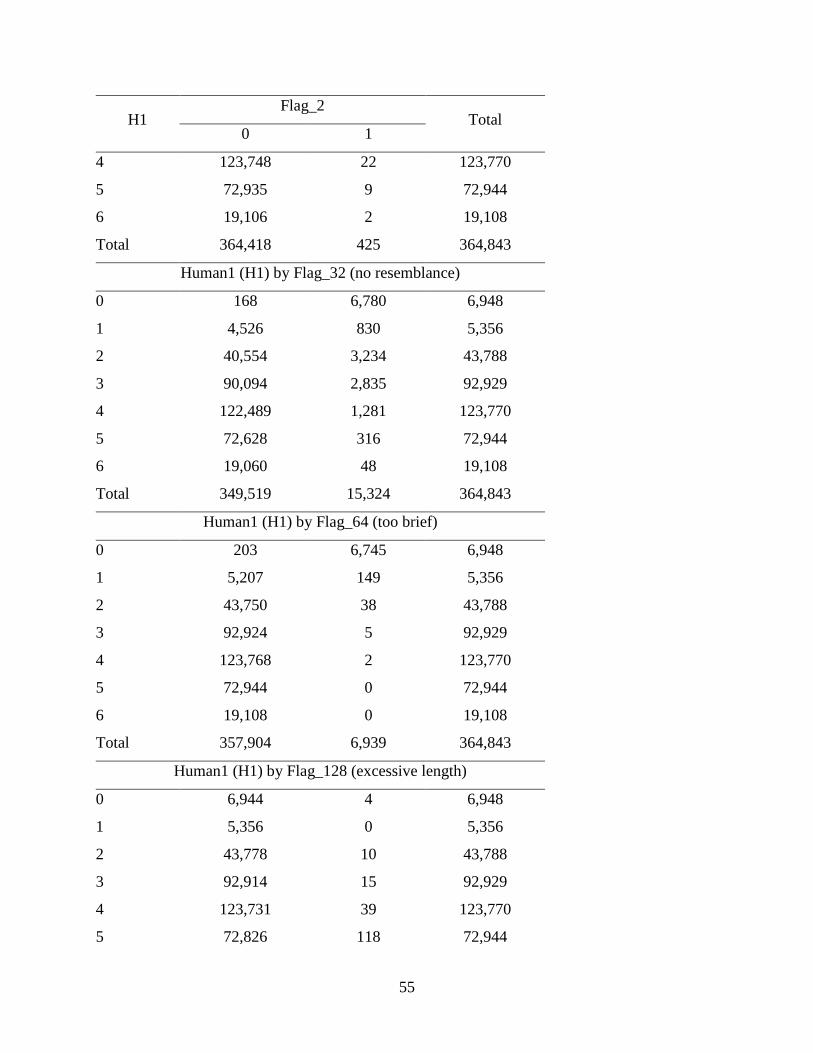
55
H1 Flag_2
Total 0 1
4 123,748 22 123,770
5 72,935 9 72,944
6 19,106 2 19,108
Total 364,418 425 364,843
Human1 (H1) by Flag_32 (no resemblance)
0 168 6,780 6,948
1 4,526 830 5,356
2 40,554 3,234 43,788
3 90,094 2,835 92,929
4 122,489 1,281 123,770
5 72,628 316 72,944
6 19,060 48 19,108
Total 349,519 15,324 364,843
Human1 (H1) by Flag_64 (too brief)
0 203 6,745 6,948
1 5,207 149 5,356
2 43,750 38 43,788
3 92,924 5 92,929
4 123,768 2 123,770
5 72,944 0 72,944
6 19,108 0 19,108
Total 357,904 6,939 364,843
Human1 (H1) by Flag_128 (excessive length)
0 6,944 4 6,948
1 5,356 0 5,356
2 43,778 10 43,788
3 92,914 15 92,929
4 123,731 39 123,770
5 72,826 118 72,944
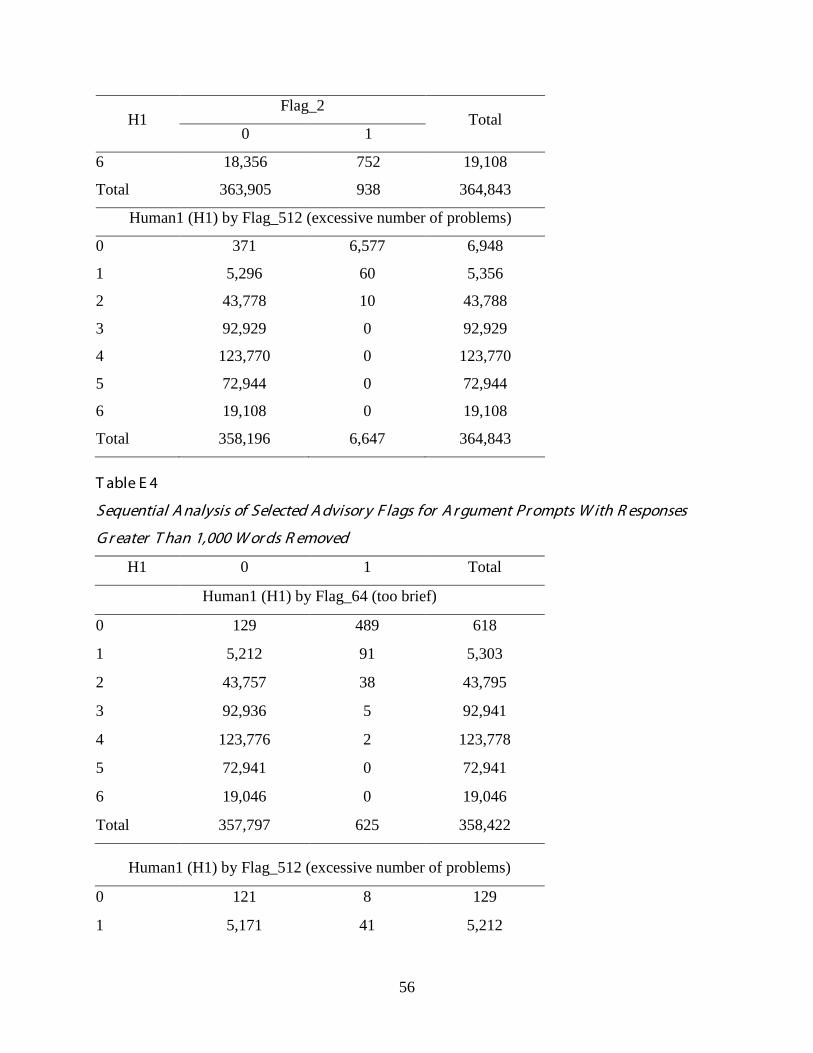
56
H1 Flag_2
Total 0 1
6 18,356 752 19,108
Total 363,905 938 364,843
Human1 (H1) by Flag_512 (excessive number of problems)
0 371 6,577 6,948
1 5,296 60 5,356
2 43,778 10 43,788
3 92,929 0 92,929
4 123,770 0 123,770
5 72,944 0 72,944
6 19,108 0 19,108
Total 358,196 6,647 364,843
T able E 4
Sequential A nalysis of Selected A dvisor y F lags for A r gument Pr ompts W ith R esponses
G r eater T han 1,000 W or ds R emoved
H1 0 1 Total
Human1 (H1) by Flag_64 (too brief)
0 129 489 618
1 5,212 91 5,303
2 43,757 38 43,795
3 92,936 5 92,941
4 123,776 2 123,778
5 72,941 0 72,941
6 19,046 0 19,046
Total 357,797 625 358,422
Human1 (H1) by Flag_512 (excessive number of problems)
0 121 8 129
1 5,171 41 5,212
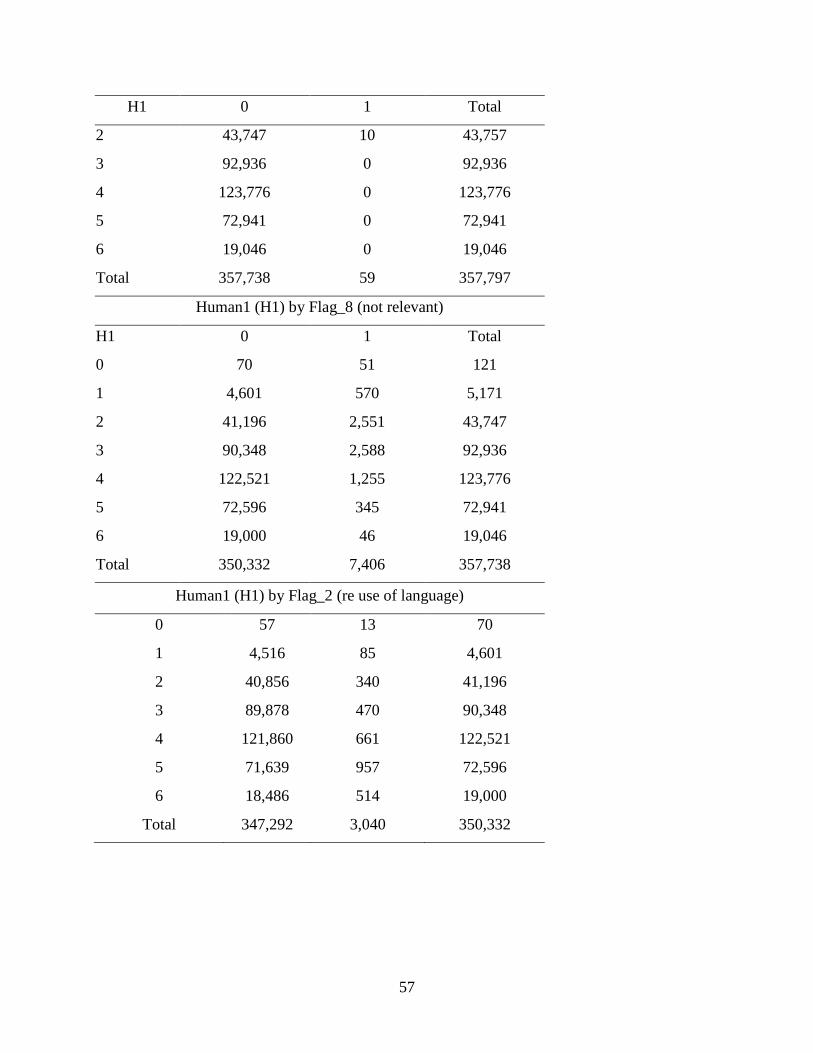
57
H1 0 1 Total
2 43,747 10 43,757
3 92,936 0 92,936
4 123,776 0 123,776
5 72,941 0 72,941
6 19,046 0 19,046
Total 357,738 59 357,797
Human1 (H1) by Flag_8 (not relevant)
H1 0 1 Total
0 70 51 121
1 4,601 570 5,171
2 41,196 2,551 43,747
3 90,348 2,588 92,936
4 122,521 1,255 123,776
5 72,596 345 72,941
6 19,000 46 19,046
Total 350,332 7,406 357,738
Human1 (H1) by Flag_2 (re use of language)
0 57 13 70
1 4,516 85 4,601
2 40,856 340 41,196
3 89,878 470 90,348
4 121,860 661 122,521
5 71,639 957 72,596
6 18,486 514 19,000
Total 347,292 3,040 350,332
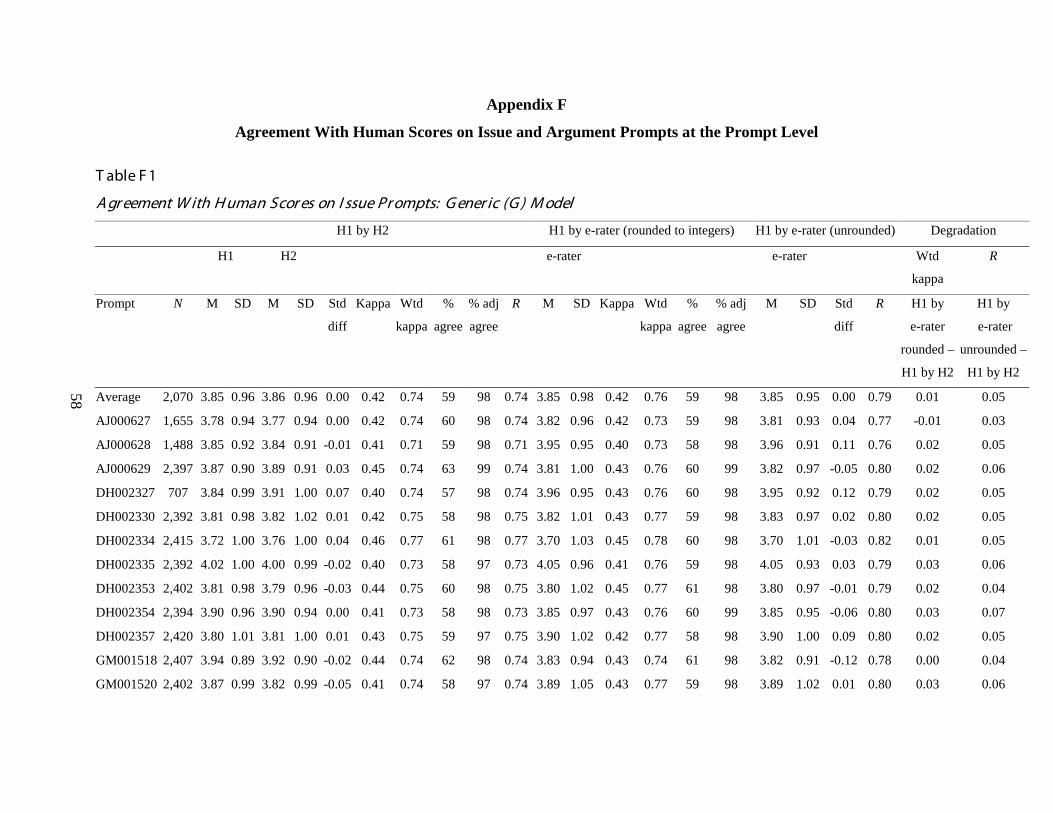
58
Appendix F
Agreement With Human Scores on Issue and Argument Prompts at the Prompt Level
T able F 1
A gr eement W ith H uman Scor es on I ssue Pr ompts: G ener ic (G ) M odel
H1 by H2 H1 by e-rater (rounded to integers) H1 by e-rater (unrounded) Degradation
H1 H2 e-rater e-rater Wtd
kappa
R
Prompt N M SD M SD Std
diff
Kappa Wtd
kappa
%
agree
% adj
agree
R M SD Kappa Wtd
kappa
%
agree
% adj
agree
M SD Std
diff
R H1 by
e-rater
rounded –
H1 by H2
H1 by
e-rater
unrounded –
H1 by H2
Average 2,070 3.85 0.96 3.86 0.96 0.00 0.42 0.74 59 98 0.74 3.85 0.98 0.42 0.76 59 98 3.85 0.95 0.00 0.79 0.01 0.05
AJ000627 1,655 3.78 0.94 3.77 0.94 0.00 0.42 0.74 60 98 0.74 3.82 0.96 0.42 0.73 59 98 3.81 0.93 0.04 0.77 -0.01 0.03
AJ000628 1,488 3.85 0.92 3.84 0.91 -0.01 0.41 0.71 59 98 0.71 3.95 0.95 0.40 0.73 58 98 3.96 0.91 0.11 0.76 0.02 0.05
AJ000629 2,397 3.87 0.90 3.89 0.91 0.03 0.45 0.74 63 99 0.74 3.81 1.00 0.43 0.76 60 99 3.82 0.97 -0.05 0.80 0.02 0.06
DH002327 707 3.84 0.99 3.91 1.00 0.07 0.40 0.74 57 98 0.74 3.96 0.95 0.43 0.76 60 98 3.95 0.92 0.12 0.79 0.02 0.05
DH002330 2,392 3.81 0.98 3.82 1.02 0.01 0.42 0.75 58 98 0.75 3.82 1.01 0.43 0.77 59 98 3.83 0.97 0.02 0.80 0.02 0.05
DH002334 2,415 3.72 1.00 3.76 1.00 0.04 0.46 0.77 61 98 0.77 3.70 1.03 0.45 0.78 60 98 3.70 1.01 -0.03 0.82 0.01 0.05
DH002335 2,392 4.02 1.00 4.00 0.99 -0.02 0.40 0.73 58 97 0.73 4.05 0.96 0.41 0.76 59 98 4.05 0.93 0.03 0.79 0.03 0.06
DH002353 2,402 3.81 0.98 3.79 0.96 -0.03 0.44 0.75 60 98 0.75 3.80 1.02 0.45 0.77 61 98 3.80 0.97 -0.01 0.79 0.02 0.04
DH002354 2,394 3.90 0.96 3.90 0.94 0.00 0.41 0.73 58 98 0.73 3.85 0.97 0.43 0.76 60 99 3.85 0.95 -0.06 0.80 0.03 0.07
DH002357 2,420 3.80 1.01 3.81 1.00 0.01 0.43 0.75 59 97 0.75 3.90 1.02 0.42 0.77 58 98 3.90 1.00 0.09 0.80 0.02 0.05
GM001518 2,407 3.94 0.89 3.92 0.90 -0.02 0.44 0.74 62 98 0.74 3.83 0.94 0.43 0.74 61 98 3.82 0.91 -0.12 0.78 0.00 0.04
GM001520 2,402 3.87 0.99 3.82 0.99 -0.05 0.41 0.74 58 97 0.74 3.89 1.05 0.43 0.77 59 98 3.89 1.02 0.01 0.80 0.03 0.06
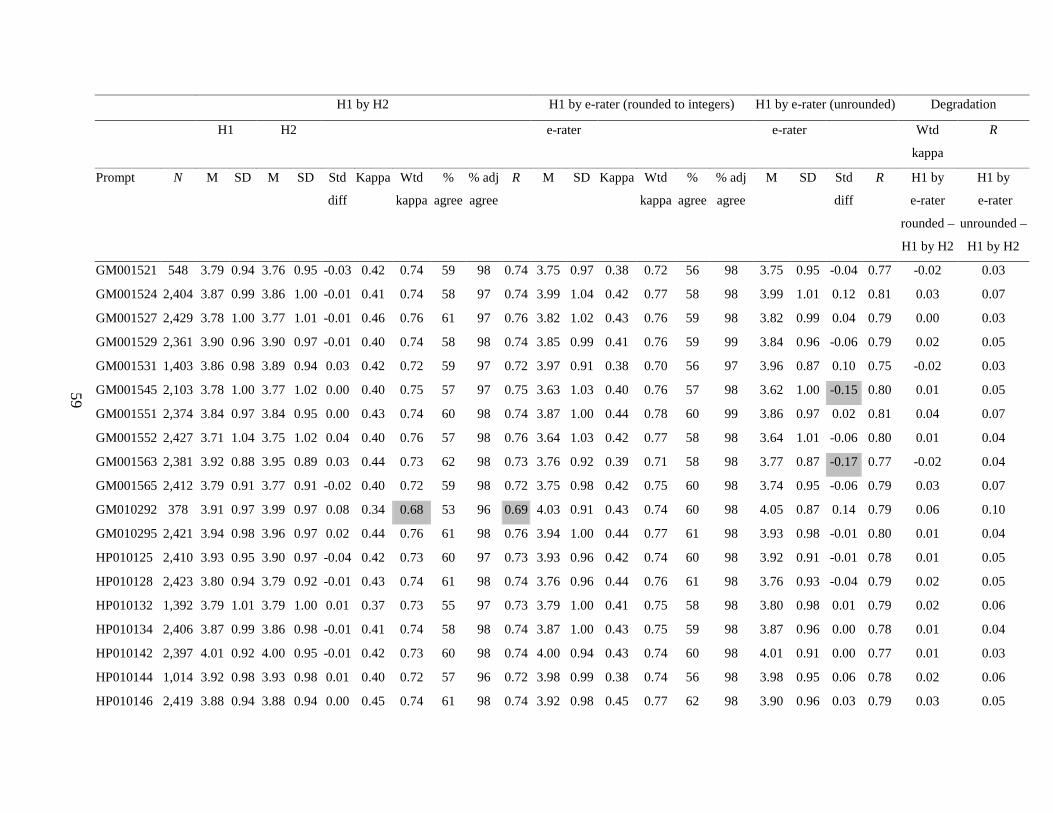
59
H1 by H2 H1 by e-rater (rounded to integers) H1 by e-rater (unrounded) Degradation
H1 H2 e-rater e-rater Wtd
kappa
R
Prompt N M SD M SD Std
diff
Kappa Wtd
kappa
%
agree
% adj
agree
R M SD Kappa Wtd
kappa
%
agree
% adj
agree
M SD Std
diff
R H1 by
e-rater
rounded –
H1 by H2
H1 by
e-rater
unrounded –
H1 by H2
GM001521 548 3.79 0.94 3.76 0.95 -0.03 0.42 0.74 59 98 0.74 3.75 0.97 0.38 0.72 56 98 3.75 0.95 -0.04 0.77 -0.02 0.03
GM001524 2,404 3.87 0.99 3.86 1.00 -0.01 0.41 0.74 58 97 0.74 3.99 1.04 0.42 0.77 58 98 3.99 1.01 0.12 0.81 0.03 0.07
GM001527 2,429 3.78 1.00 3.77 1.01 -0.01 0.46 0.76 61 97 0.76 3.82 1.02 0.43 0.76 59 98 3.82 0.99 0.04 0.79 0.00 0.03
GM001529 2,361 3.90 0.96 3.90 0.97 -0.01 0.40 0.74 58 98 0.74 3.85 0.99 0.41 0.76 59 99 3.84 0.96 -0.06 0.79 0.02 0.05
GM001531 1,403 3.86 0.98 3.89 0.94 0.03 0.42 0.72 59 97 0.72 3.97 0.91 0.38 0.70 56 97 3.96 0.87 0.10 0.75 -0.02 0.03
GM001545 2,103 3.78 1.00 3.77 1.02 0.00 0.40 0.75 57 97 0.75 3.63 1.03 0.40 0.76 57 98 3.62 1.00 -0.15 0.80 0.01 0.05
GM001551 2,374 3.84 0.97 3.84 0.95 0.00 0.43 0.74 60 98 0.74 3.87 1.00 0.44 0.78 60 99 3.86 0.97 0.02 0.81 0.04 0.07
GM001552 2,427 3.71 1.04 3.75 1.02 0.04 0.40 0.76 57 98 0.76 3.64 1.03 0.42 0.77 58 98 3.64 1.01 -0.06 0.80 0.01 0.04
GM001563 2,381 3.92 0.88 3.95 0.89 0.03 0.44 0.73 62 98 0.73 3.76 0.92 0.39 0.71 58 98 3.77 0.87 -0.17 0.77 -0.02 0.04
GM001565 2,412 3.79 0.91 3.77 0.91 -0.02 0.40 0.72 59 98 0.72 3.75 0.98 0.42 0.75 60 98 3.74 0.95 -0.06 0.79 0.03 0.07
GM010292 378 3.91 0.97 3.99 0.97 0.08 0.34 0.68 53 96 0.69 4.03 0.91 0.43 0.74 60 98 4.05 0.87 0.14 0.79 0.06 0.10
GM010295 2,421 3.94 0.98 3.96 0.97 0.02 0.44 0.76 61 98 0.76 3.94 1.00 0.44 0.77 61 98 3.93 0.98 -0.01 0.80 0.01 0.04
HP010125 2,410 3.93 0.95 3.90 0.97 -0.04 0.42 0.73 60 97 0.73 3.93 0.96 0.42 0.74 60 98 3.92 0.91 -0.01 0.78 0.01 0.05
HP010128 2,423 3.80 0.94 3.79 0.92 -0.01 0.43 0.74 61 98 0.74 3.76 0.96 0.44 0.76 61 98 3.76 0.93 -0.04 0.79 0.02 0.05
HP010132 1,392 3.79 1.01 3.79 1.00 0.01 0.37 0.73 55 97 0.73 3.79 1.00 0.41 0.75 58 98 3.80 0.98 0.01 0.79 0.02 0.06
HP010134 2,406 3.87 0.99 3.86 0.98 -0.01 0.41 0.74 58 98 0.74 3.87 1.00 0.43 0.75 59 98 3.87 0.96 0.00 0.78 0.01 0.04
HP010142 2,397 4.01 0.92 4.00 0.95 -0.01 0.42 0.73 60 98 0.74 4.00 0.94 0.43 0.74 60 98 4.01 0.91 0.00 0.77 0.01 0.03
HP010144 1,014 3.92 0.98 3.93 0.98 0.01 0.40 0.72 57 96 0.72 3.98 0.99 0.38 0.74 56 98 3.98 0.95 0.06 0.78 0.02 0.06
HP010146 2,419 3.88 0.94 3.88 0.94 0.00 0.45 0.74 61 98 0.74 3.92 0.98 0.45 0.77 62 98 3.90 0.96 0.03 0.79 0.03 0.05
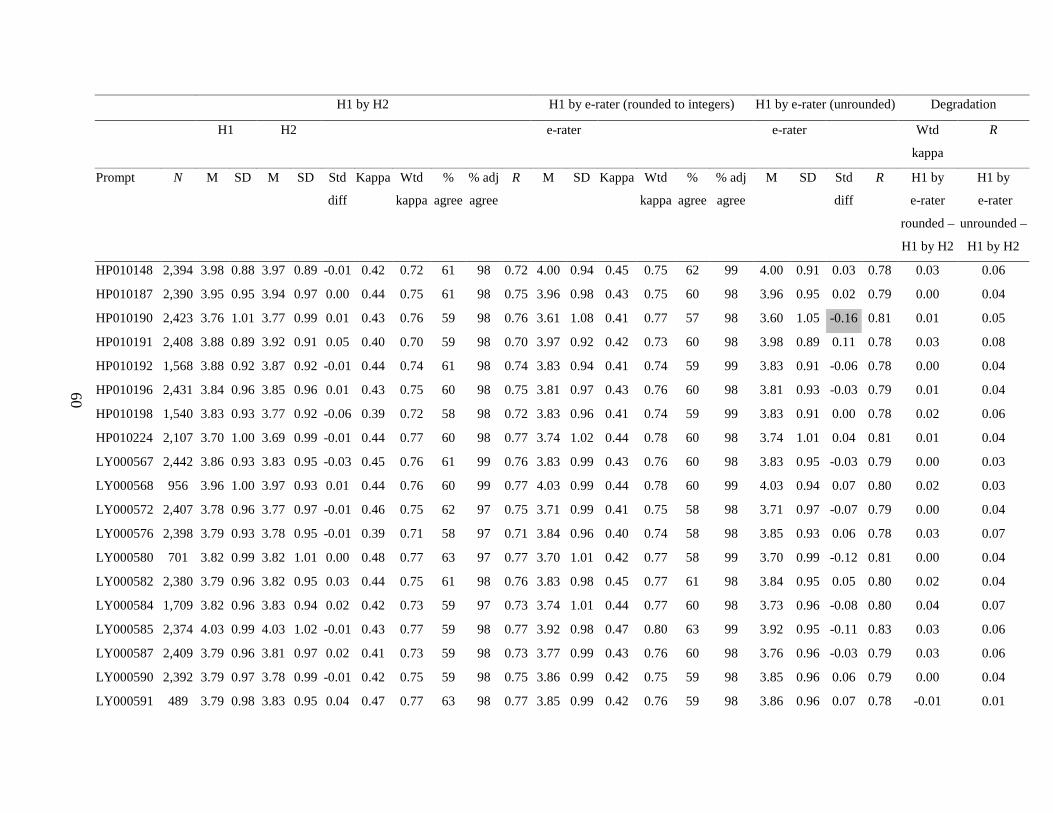
60
H1 by H2 H1 by e-rater (rounded to integers) H1 by e-rater (unrounded) Degradation
H1 H2 e-rater e-rater Wtd
kappa
R
Prompt N M SD M SD Std
diff
Kappa Wtd
kappa
%
agree
% adj
agree
R M SD Kappa Wtd
kappa
%
agree
% adj
agree
M SD Std
diff
R H1 by
e-rater
rounded –
H1 by H2
H1 by
e-rater
unrounded –
H1 by H2
HP010148 2,394 3.98 0.88 3.97 0.89 -0.01 0.42 0.72 61 98 0.72 4.00 0.94 0.45 0.75 62 99 4.00 0.91 0.03 0.78 0.03 0.06
HP010187 2,390 3.95 0.95 3.94 0.97 0.00 0.44 0.75 61 98 0.75 3.96 0.98 0.43 0.75 60 98 3.96 0.95 0.02 0.79 0.00 0.04
HP010190 2,423 3.76 1.01 3.77 0.99 0.01 0.43 0.76 59 98 0.76 3.61 1.08 0.41 0.77 57 98 3.60 1.05 -0.16 0.81 0.01 0.05
HP010191 2,408 3.88 0.89 3.92 0.91 0.05 0.40 0.70 59 98 0.70 3.97 0.92 0.42 0.73 60 98 3.98 0.89 0.11 0.78 0.03 0.08
HP010192 1,568 3.88 0.92 3.87 0.92 -0.01 0.44 0.74 61 98 0.74 3.83 0.94 0.41 0.74 59 99 3.83 0.91 -0.06 0.78 0.00 0.04
HP010196 2,431 3.84 0.96 3.85 0.96 0.01 0.43 0.75 60 98 0.75 3.81 0.97 0.43 0.76 60 98 3.81 0.93 -0.03 0.79 0.01 0.04
HP010198 1,540 3.83 0.93 3.77 0.92 -0.06 0.39 0.72 58 98 0.72 3.83 0.96 0.41 0.74 59 99 3.83 0.91 0.00 0.78 0.02 0.06
HP010224 2,107 3.70 1.00 3.69 0.99 -0.01 0.44 0.77 60 98 0.77 3.74 1.02 0.44 0.78 60 98 3.74 1.01 0.04 0.81 0.01 0.04
LY000567 2,442 3.86 0.93 3.83 0.95 -0.03 0.45 0.76 61 99 0.76 3.83 0.99 0.43 0.76 60 98 3.83 0.95 -0.03 0.79 0.00 0.03
LY000568 956 3.96 1.00 3.97 0.93 0.01 0.44 0.76 60 99 0.77 4.03 0.99 0.44 0.78 60 99 4.03 0.94 0.07 0.80 0.02 0.03
LY000572 2,407 3.78 0.96 3.77 0.97 -0.01 0.46 0.75 62 97 0.75 3.71 0.99 0.41 0.75 58 98 3.71 0.97 -0.07 0.79 0.00 0.04
LY000576 2,398 3.79 0.93 3.78 0.95 -0.01 0.39 0.71 58 97 0.71 3.84 0.96 0.40 0.74 58 98 3.85 0.93 0.06 0.78 0.03 0.07
LY000580 701 3.82 0.99 3.82 1.01 0.00 0.48 0.77 63 97 0.77 3.70 1.01 0.42 0.77 58 99 3.70 0.99 -0.12 0.81 0.00 0.04
LY000582 2,380 3.79 0.96 3.82 0.95 0.03 0.44 0.75 61 98 0.76 3.83 0.98 0.45 0.77 61 98 3.84 0.95 0.05 0.80 0.02 0.04
LY000584 1,709 3.82 0.96 3.83 0.94 0.02 0.42 0.73 59 97 0.73 3.74 1.01 0.44 0.77 60 98 3.73 0.96 -0.08 0.80 0.04 0.07
LY000585 2,374 4.03 0.99 4.03 1.02 -0.01 0.43 0.77 59 98 0.77 3.92 0.98 0.47 0.80 63 99 3.92 0.95 -0.11 0.83 0.03 0.06
LY000587 2,409 3.79 0.96 3.81 0.97 0.02 0.41 0.73 59 98 0.73 3.77 0.99 0.43 0.76 60 98 3.76 0.96 -0.03 0.79 0.03 0.06
LY000590 2,392 3.79 0.97 3.78 0.99 -0.01 0.42 0.75 59 98 0.75 3.86 0.99 0.42 0.75 59 98 3.85 0.96 0.06 0.79 0.00 0.04
LY000591 489 3.79 0.98 3.83 0.95 0.04 0.47 0.77 63 98 0.77 3.85 0.99 0.42 0.76 59 98 3.86 0.96 0.07 0.78 -0.01 0.01

61
H1 by H2 H1 by e-rater (rounded to integers) H1 by e-rater (unrounded) Degradation
H1 H2 e-rater e-rater Wtd
kappa
R
Prompt N M SD M SD Std
diff
Kappa Wtd
kappa
%
agree
% adj
agree
R M SD Kappa Wtd
kappa
%
agree
% adj
agree
M SD Std
diff
R H1 by
e-rater
rounded –
H1 by H2
H1 by
e-rater
unrounded –
H1 by H2
LY000597 980 3.78 0.99 3.71 0.99 -0.08 0.44 0.75 60 97 0.75 3.71 1.00 0.44 0.78 60 99 3.70 0.97 -0.08 0.80 0.03 0.05
LY000598 2,439 3.88 0.98 3.87 0.97 -0.01 0.44 0.75 60 98 0.75 3.88 1.01 0.45 0.78 61 99 3.87 0.98 -0.01 0.81 0.03 0.06
LY000599 1,369 3.95 0.96 3.92 0.93 -0.02 0.40 0.73 58 98 0.73 3.98 0.95 0.41 0.75 59 99 3.99 0.92 0.04 0.79 0.02 0.06
LY000600 489 3.90 1.02 3.99 1.03 0.09 0.39 0.73 56 96 0.74 3.97 0.98 0.42 0.73 59 96 3.97 0.93 0.06 0.77 0.00 0.03
LY000611 2,384 3.88 0.98 3.91 0.94 0.03 0.44 0.73 60 98 0.74 3.94 0.93 0.44 0.74 61 98 3.94 0.90 0.06 0.79 0.01 0.05
LY000631 2,416 3.93 0.99 3.93 1.00 0.01 0.42 0.75 58 97 0.75 3.94 0.97 0.41 0.76 58 98 3.94 0.94 0.02 0.79 0.01 0.04
LY000632 2,376 3.92 0.95 3.94 0.95 0.02 0.40 0.73 58 98 0.73 3.92 1.00 0.45 0.77 61 99 3.91 0.97 -0.01 0.81 0.04 0.08
LY000633 2,394 3.90 0.97 3.90 0.97 0.00 0.41 0.73 58 98 0.73 3.97 0.98 0.42 0.75 58 98 3.97 0.95 0.07 0.78 0.02 0.05
LY000641 2,404 3.74 0.97 3.75 0.98 0.00 0.42 0.75 59 98 0.75 3.73 1.01 0.41 0.76 58 99 3.73 0.97 -0.02 0.80 0.01 0.05
LY000646 2,406 3.80 0.93 3.82 0.95 0.02 0.42 0.74 60 98 0.74 3.82 1.00 0.41 0.75 58 98 3.81 0.97 0.00 0.79 0.01 0.05
LY000647 2,395 3.74 0.96 3.75 0.95 0.00 0.42 0.74 59 98 0.74 3.70 0.99 0.40 0.75 58 98 3.70 0.96 -0.05 0.79 0.01 0.05
LY000648 760 3.79 0.95 3.85 0.95 0.07 0.40 0.71 58 97 0.72 3.86 0.99 0.42 0.76 59 98 3.85 0.95 0.06 0.80 0.05 0.08
LY000650 2,389 3.83 0.93 3.83 0.93 -0.01 0.46 0.75 62 98 0.75 3.83 0.98 0.42 0.75 59 98 3.82 0.94 -0.01 0.79 0.00 0.04
NB007538 2,407 3.82 0.94 3.81 0.93 -0.01 0.43 0.74 60 98 0.74 3.78 0.96 0.46 0.77 62 99 3.77 0.93 -0.05 0.80 0.03 0.06
NB007545 2,388 3.85 1.04 3.86 1.02 0.02 0.43 0.78 59 98 0.78 3.74 0.98 0.43 0.78 59 98 3.73 0.95 -0.11 0.81 0.00 0.03
SP001606 2,382 3.83 0.98 3.83 0.99 0.01 0.44 0.76 60 98 0.76 3.81 0.99 0.44 0.77 60 98 3.82 0.95 -0.01 0.80 0.01 0.04
UA100002 2,362 3.81 1.01 3.80 1.00 -0.01 0.43 0.77 59 98 0.77 3.74 1.03 0.42 0.77 58 98 3.75 1.00 -0.06 0.80 0.00 0.03
UA100025 2,389 3.78 1.03 3.80 1.01 0.02 0.41 0.75 57 97 0.75 3.81 1.00 0.43 0.76 59 98 3.83 0.98 0.05 0.79 0.01 0.04
UA100033 277 3.95 0.86 3.89 0.93 -0.06 0.50 0.74 65 98 0.75 4.00 0.95 0.38 0.73 57 100 4.00 0.91 0.06 0.76 -0.01 0.01
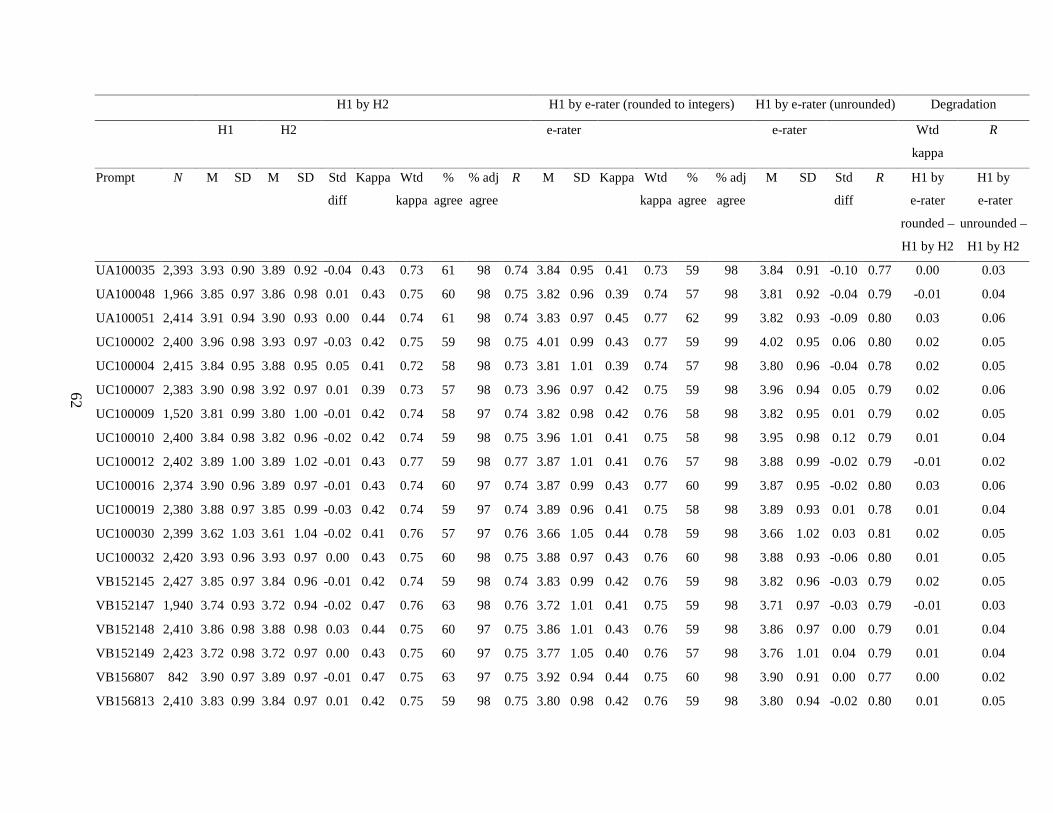
62
H1 by H2 H1 by e-rater (rounded to integers) H1 by e-rater (unrounded) Degradation
H1 H2 e-rater e-rater Wtd
kappa
R
Prompt N M SD M SD Std
diff
Kappa Wtd
kappa
%
agree
% adj
agree
R M SD Kappa Wtd
kappa
%
agree
% adj
agree
M SD Std
diff
R H1 by
e-rater
rounded –
H1 by H2
H1 by
e-rater
unrounded –
H1 by H2
UA100035 2,393 3.93 0.90 3.89 0.92 -0.04 0.43 0.73 61 98 0.74 3.84 0.95 0.41 0.73 59 98 3.84 0.91 -0.10 0.77 0.00 0.03
UA100048 1,966 3.85 0.97 3.86 0.98 0.01 0.43 0.75 60 98 0.75 3.82 0.96 0.39 0.74 57 98 3.81 0.92 -0.04 0.79 -0.01 0.04
UA100051 2,414 3.91 0.94 3.90 0.93 0.00 0.44 0.74 61 98 0.74 3.83 0.97 0.45 0.77 62 99 3.82 0.93 -0.09 0.80 0.03 0.06
UC100002 2,400 3.96 0.98 3.93 0.97 -0.03 0.42 0.75 59 98 0.75 4.01 0.99 0.43 0.77 59 99 4.02 0.95 0.06 0.80 0.02 0.05
UC100004 2,415 3.84 0.95 3.88 0.95 0.05 0.41 0.72 58 98 0.73 3.81 1.01 0.39 0.74 57 98 3.80 0.96 -0.04 0.78 0.02 0.05
UC100007 2,383 3.90 0.98 3.92 0.97 0.01 0.39 0.73 57 98 0.73 3.96 0.97 0.42 0.75 59 98 3.96 0.94 0.05 0.79 0.02 0.06
UC100009 1,520 3.81 0.99 3.80 1.00 -0.01 0.42 0.74 58 97 0.74 3.82 0.98 0.42 0.76 58 98 3.82 0.95 0.01 0.79 0.02 0.05
UC100010 2,400 3.84 0.98 3.82 0.96 -0.02 0.42 0.74 59 98 0.75 3.96 1.01 0.41 0.75 58 98 3.95 0.98 0.12 0.79 0.01 0.04
UC100012 2,402 3.89 1.00 3.89 1.02 -0.01 0.43 0.77 59 98 0.77 3.87 1.01 0.41 0.76 57 98 3.88 0.99 -0.02 0.79 -0.01 0.02
UC100016 2,374 3.90 0.96 3.89 0.97 -0.01 0.43 0.74 60 97 0.74 3.87 0.99 0.43 0.77 60 99 3.87 0.95 -0.02 0.80 0.03 0.06
UC100019 2,380 3.88 0.97 3.85 0.99 -0.03 0.42 0.74 59 97 0.74 3.89 0.96 0.41 0.75 58 98 3.89 0.93 0.01 0.78 0.01 0.04
UC100030 2,399 3.62 1.03 3.61 1.04 -0.02 0.41 0.76 57 97 0.76 3.66 1.05 0.44 0.78 59 98 3.66 1.02 0.03 0.81 0.02 0.05
UC100032 2,420 3.93 0.96 3.93 0.97 0.00 0.43 0.75 60 98 0.75 3.88 0.97 0.43 0.76 60 98 3.88 0.93 -0.06 0.80 0.01 0.05
VB152145 2,427 3.85 0.97 3.84 0.96 -0.01 0.42 0.74 59 98 0.74 3.83 0.99 0.42 0.76 59 98 3.82 0.96 -0.03 0.79 0.02 0.05
VB152147 1,940 3.74 0.93 3.72 0.94 -0.02 0.47 0.76 63 98 0.76 3.72 1.01 0.41 0.75 59 98 3.71 0.97 -0.03 0.79 -0.01 0.03
VB152148 2,410 3.86 0.98 3.88 0.98 0.03 0.44 0.75 60 97 0.75 3.86 1.01 0.43 0.76 59 98 3.86 0.97 0.00 0.79 0.01 0.04
VB152149 2,423 3.72 0.98 3.72 0.97 0.00 0.43 0.75 60 97 0.75 3.77 1.05 0.40 0.76 57 98 3.76 1.01 0.04 0.79 0.01 0.04
VB156807 842 3.90 0.97 3.89 0.97 -0.01 0.47 0.75 63 97 0.75 3.92 0.94 0.44 0.75 60 98 3.90 0.91 0.00 0.77 0.00 0.02
VB156813 2,410 3.83 0.99 3.84 0.97 0.01 0.42 0.75 59 98 0.75 3.80 0.98 0.42 0.76 59 98 3.80 0.94 -0.02 0.80 0.01 0.05
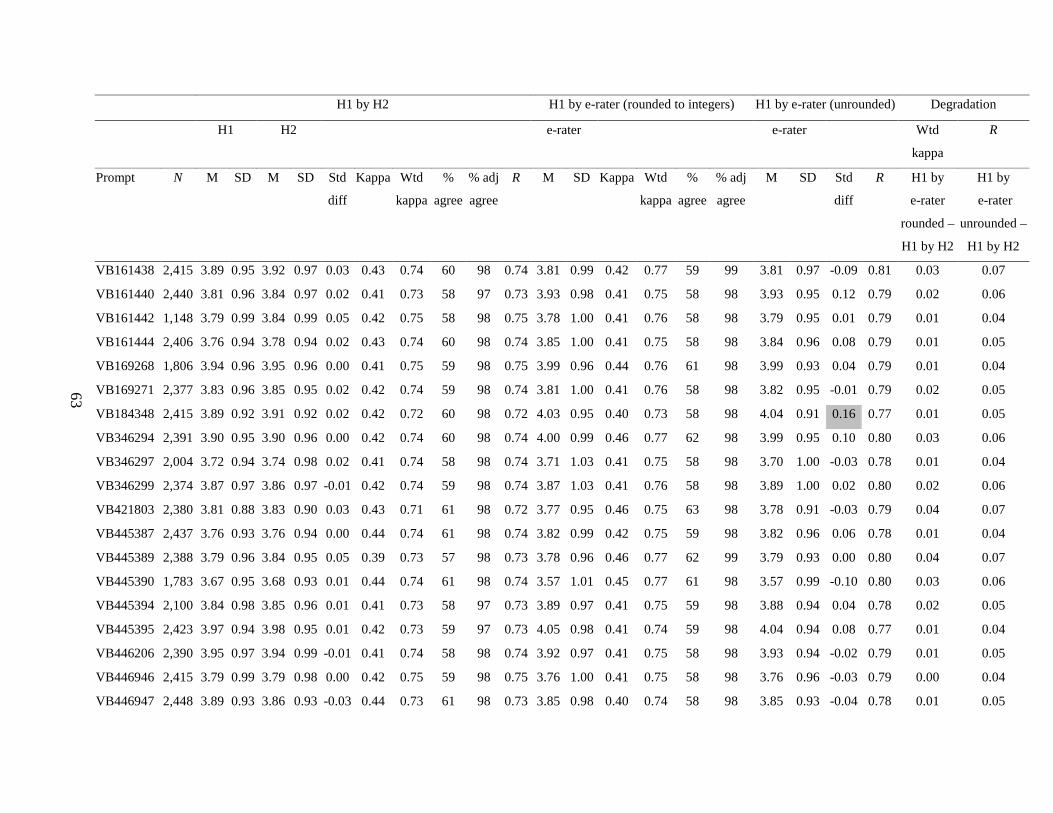
63
H1 by H2 H1 by e-rater (rounded to integers) H1 by e-rater (unrounded) Degradation
H1 H2 e-rater e-rater Wtd
kappa
R
Prompt N M SD M SD Std
diff
Kappa Wtd
kappa
%
agree
% adj
agree
R M SD Kappa Wtd
kappa
%
agree
% adj
agree
M SD Std
diff
R H1 by
e-rater
rounded –
H1 by H2
H1 by
e-rater
unrounded –
H1 by H2
VB161438 2,415 3.89 0.95 3.92 0.97 0.03 0.43 0.74 60 98 0.74 3.81 0.99 0.42 0.77 59 99 3.81 0.97 -0.09 0.81 0.03 0.07
VB161440 2,440 3.81 0.96 3.84 0.97 0.02 0.41 0.73 58 97 0.73 3.93 0.98 0.41 0.75 58 98 3.93 0.95 0.12 0.79 0.02 0.06
VB161442 1,148 3.79 0.99 3.84 0.99 0.05 0.42 0.75 58 98 0.75 3.78 1.00 0.41 0.76 58 98 3.79 0.95 0.01 0.79 0.01 0.04
VB161444 2,406 3.76 0.94 3.78 0.94 0.02 0.43 0.74 60 98 0.74 3.85 1.00 0.41 0.75 58 98 3.84 0.96 0.08 0.79 0.01 0.05
VB169268 1,806 3.94 0.96 3.95 0.96 0.00 0.41 0.75 59 98 0.75 3.99 0.96 0.44 0.76 61 98 3.99 0.93 0.04 0.79 0.01 0.04
VB169271 2,377 3.83 0.96 3.85 0.95 0.02 0.42 0.74 59 98 0.74 3.81 1.00 0.41 0.76 58 98 3.82 0.95 -0.01 0.79 0.02 0.05
VB184348 2,415 3.89 0.92 3.91 0.92 0.02 0.42 0.72 60 98 0.72 4.03 0.95 0.40 0.73 58 98 4.04 0.91 0.16 0.77 0.01 0.05
VB346294 2,391 3.90 0.95 3.90 0.96 0.00 0.42 0.74 60 98 0.74 4.00 0.99 0.46 0.77 62 98 3.99 0.95 0.10 0.80 0.03 0.06
VB346297 2,004 3.72 0.94 3.74 0.98 0.02 0.41 0.74 58 98 0.74 3.71 1.03 0.41 0.75 58 98 3.70 1.00 -0.03 0.78 0.01 0.04
VB346299 2,374 3.87 0.97 3.86 0.97 -0.01 0.42 0.74 59 98 0.74 3.87 1.03 0.41 0.76 58 98 3.89 1.00 0.02 0.80 0.02 0.06
VB421803 2,380 3.81 0.88 3.83 0.90 0.03 0.43 0.71 61 98 0.72 3.77 0.95 0.46 0.75 63 98 3.78 0.91 -0.03 0.79 0.04 0.07
VB445387 2,437 3.76 0.93 3.76 0.94 0.00 0.44 0.74 61 98 0.74 3.82 0.99 0.42 0.75 59 98 3.82 0.96 0.06 0.78 0.01 0.04
VB445389 2,388 3.79 0.96 3.84 0.95 0.05 0.39 0.73 57 98 0.73 3.78 0.96 0.46 0.77 62 99 3.79 0.93 0.00 0.80 0.04 0.07
VB445390 1,783 3.67 0.95 3.68 0.93 0.01 0.44 0.74 61 98 0.74 3.57 1.01 0.45 0.77 61 98 3.57 0.99 -0.10 0.80 0.03 0.06
VB445394 2,100 3.84 0.98 3.85 0.96 0.01 0.41 0.73 58 97 0.73 3.89 0.97 0.41 0.75 59 98 3.88 0.94 0.04 0.78 0.02 0.05
VB445395 2,423 3.97 0.94 3.98 0.95 0.01 0.42 0.73 59 97 0.73 4.05 0.98 0.41 0.74 59 98 4.04 0.94 0.08 0.77 0.01 0.04
VB446206 2,390 3.95 0.97 3.94 0.99 -0.01 0.41 0.74 58 98 0.74 3.92 0.97 0.41 0.75 58 98 3.93 0.94 -0.02 0.79 0.01 0.05
VB446946 2,415 3.79 0.99 3.79 0.98 0.00 0.42 0.75 59 98 0.75 3.76 1.00 0.41 0.75 58 98 3.76 0.96 -0.03 0.79 0.00 0.04
VB446947 2,448 3.89 0.93 3.86 0.93 -0.03 0.44 0.73 61 98 0.73 3.85 0.98 0.40 0.74 58 98 3.85 0.93 -0.04 0.78 0.01 0.05
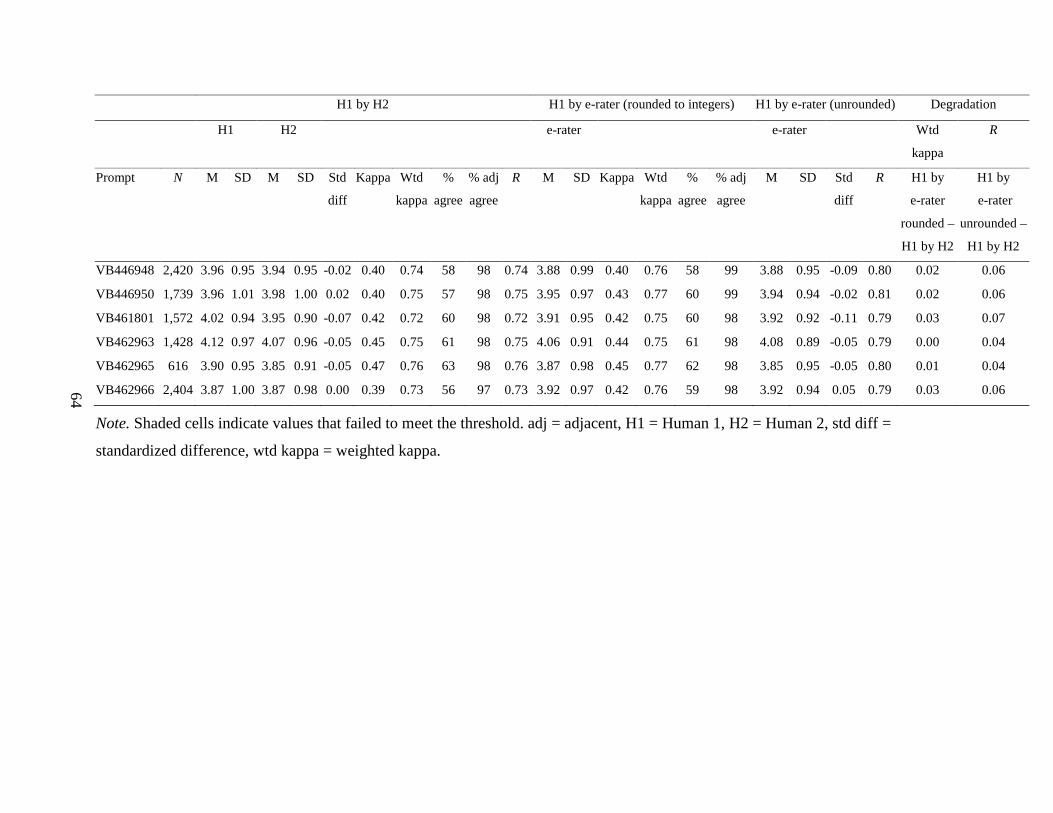
64
H1 by H2 H1 by e-rater (rounded to integers) H1 by e-rater (unrounded) Degradation
H1 H2 e-rater e-rater Wtd
kappa
R
Prompt N M SD M SD Std
diff
Kappa Wtd
kappa
%
agree
% adj
agree
R M SD Kappa Wtd
kappa
%
agree
% adj
agree
M SD Std
diff
R H1 by
e-rater
rounded –
H1 by H2
H1 by
e-rater
unrounded –
H1 by H2
VB446948 2,420 3.96 0.95 3.94 0.95 -0.02 0.40 0.74 58 98 0.74 3.88 0.99 0.40 0.76 58 99 3.88 0.95 -0.09 0.80 0.02 0.06
VB446950 1,739 3.96 1.01 3.98 1.00 0.02 0.40 0.75 57 98 0.75 3.95 0.97 0.43 0.77 60 99 3.94 0.94 -0.02 0.81 0.02 0.06
VB461801 1,572 4.02 0.94 3.95 0.90 -0.07 0.42 0.72 60 98 0.72 3.91 0.95 0.42 0.75 60 98 3.92 0.92 -0.11 0.79 0.03 0.07
VB462963 1,428 4.12 0.97 4.07 0.96 -0.05 0.45 0.75 61 98 0.75 4.06 0.91 0.44 0.75 61 98 4.08 0.89 -0.05 0.79 0.00 0.04
VB462965 616 3.90 0.95 3.85 0.91 -0.05 0.47 0.76 63 98 0.76 3.87 0.98 0.45 0.77 62 98 3.85 0.95 -0.05 0.80 0.01 0.04
VB462966 2,404 3.87 1.00 3.87 0.98 0.00 0.39 0.73 56 97 0.73 3.92 0.97 0.42 0.76 59 98 3.92 0.94 0.05 0.79 0.03 0.06
Note. Shaded cells indicate values that failed to meet the threshold. adj = adjacent, H1 = Human 1, H2 = Human 2, std diff =
standardized difference, wtd kappa = weighted kappa.
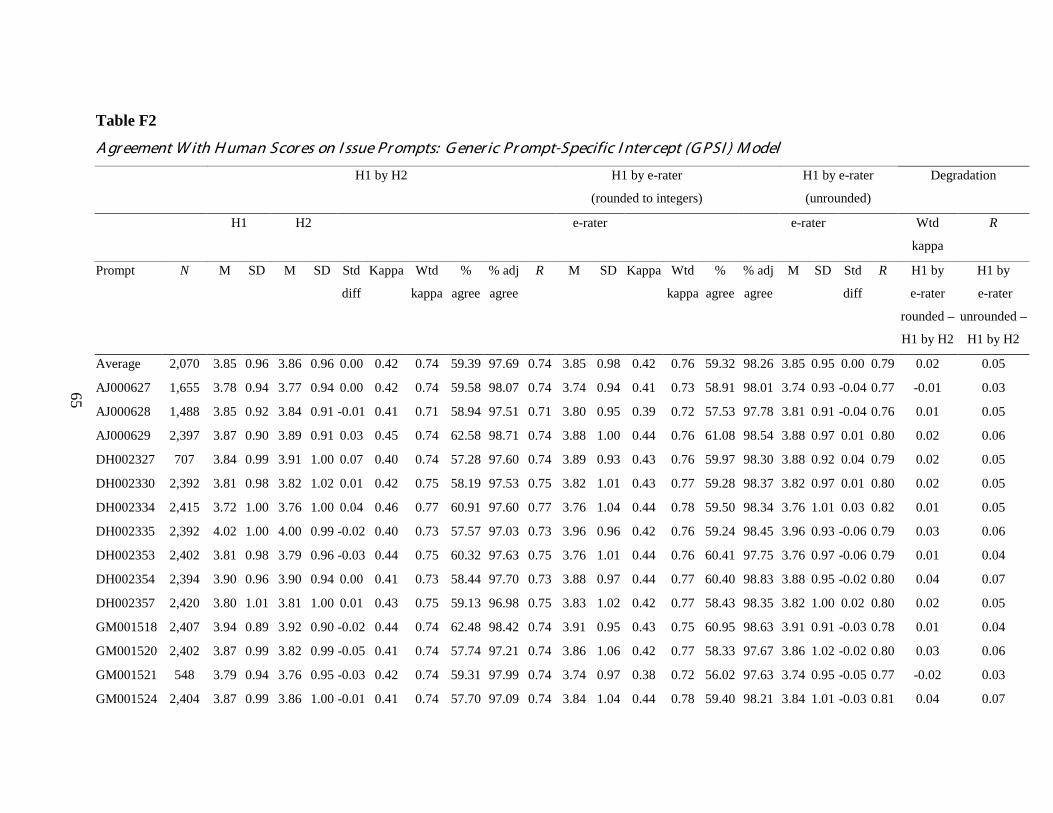
65
Table F2
A gr eement W ith H uman Scor es on I ssue Pr ompts: G ener ic Pr ompt-Specific I nter cept (G PSI ) M odel
H1 by H2 H1 by e-rater
(rounded to integers)
H1 by e-rater
(unrounded)
Degradation
H1 H2 e-rater e-rater Wtd
kappa
R
Prompt N M SD M SD Std
diff
Kappa Wtd
kappa
%
agree
% adj
agree
R M SD Kappa Wtd
kappa
%
agree
% adj
agree
M SD Std
diff
R H1 by
e-rater
rounded –
H1 by H2
H1 by
e-rater
unrounded –
H1 by H2
Average 2,070 3.85 0.96 3.86 0.96 0.00 0.42 0.74 59.39 97.69 0.74 3.85 0.98 0.42 0.76 59.32 98.26 3.85 0.95 0.00 0.79 0.02 0.05
AJ000627 1,655 3.78 0.94 3.77 0.94 0.00 0.42 0.74 59.58 98.07 0.74 3.74 0.94 0.41 0.73 58.91 98.01 3.74 0.93 -0.04 0.77 -0.01 0.03
AJ000628 1,488 3.85 0.92 3.84 0.91 -0.01 0.41 0.71 58.94 97.51 0.71 3.80 0.95 0.39 0.72 57.53 97.78 3.81 0.91 -0.04 0.76 0.01 0.05
AJ000629 2,397 3.87 0.90 3.89 0.91 0.03 0.45 0.74 62.58 98.71 0.74 3.88 1.00 0.44 0.76 61.08 98.54 3.88 0.97 0.01 0.80 0.02 0.06
DH002327 707 3.84 0.99 3.91 1.00 0.07 0.40 0.74 57.28 97.60 0.74 3.89 0.93 0.43 0.76 59.97 98.30 3.88 0.92 0.04 0.79 0.02 0.05
DH002330 2,392 3.81 0.98 3.82 1.02 0.01 0.42 0.75 58.19 97.53 0.75 3.82 1.01 0.43 0.77 59.28 98.37 3.82 0.97 0.01 0.80 0.02 0.05
DH002334 2,415 3.72 1.00 3.76 1.00 0.04 0.46 0.77 60.91 97.60 0.77 3.76 1.04 0.44 0.78 59.50 98.34 3.76 1.01 0.03 0.82 0.01 0.05
DH002335 2,392 4.02 1.00 4.00 0.99 -0.02 0.40 0.73 57.57 97.03 0.73 3.96 0.96 0.42 0.76 59.24 98.45 3.96 0.93 -0.06 0.79 0.03 0.06
DH002353 2,402 3.81 0.98 3.79 0.96 -0.03 0.44 0.75 60.32 97.63 0.75 3.76 1.01 0.44 0.76 60.41 97.75 3.76 0.97 -0.06 0.79 0.01 0.04
DH002354 2,394 3.90 0.96 3.90 0.94 0.00 0.41 0.73 58.44 97.70 0.73 3.88 0.97 0.44 0.77 60.40 98.83 3.88 0.95 -0.02 0.80 0.04 0.07
DH002357 2,420 3.80 1.01 3.81 1.00 0.01 0.43 0.75 59.13 96.98 0.75 3.83 1.02 0.42 0.77 58.43 98.35 3.82 1.00 0.02 0.80 0.02 0.05
GM001518 2,407 3.94 0.89 3.92 0.90 -0.02 0.44 0.74 62.48 98.42 0.74 3.91 0.95 0.43 0.75 60.95 98.63 3.91 0.91 -0.03 0.78 0.01 0.04
GM001520 2,402 3.87 0.99 3.82 0.99 -0.05 0.41 0.74 57.74 97.21 0.74 3.86 1.06 0.42 0.77 58.33 97.67 3.86 1.02 -0.02 0.80 0.03 0.06
GM001521 548 3.79 0.94 3.76 0.95 -0.03 0.42 0.74 59.31 97.99 0.74 3.74 0.97 0.38 0.72 56.02 97.63 3.74 0.95 -0.05 0.77 -0.02 0.03
GM001524 2,404 3.87 0.99 3.86 1.00 -0.01 0.41 0.74 57.70 97.09 0.74 3.84 1.04 0.44 0.78 59.40 98.21 3.84 1.01 -0.03 0.81 0.04 0.07
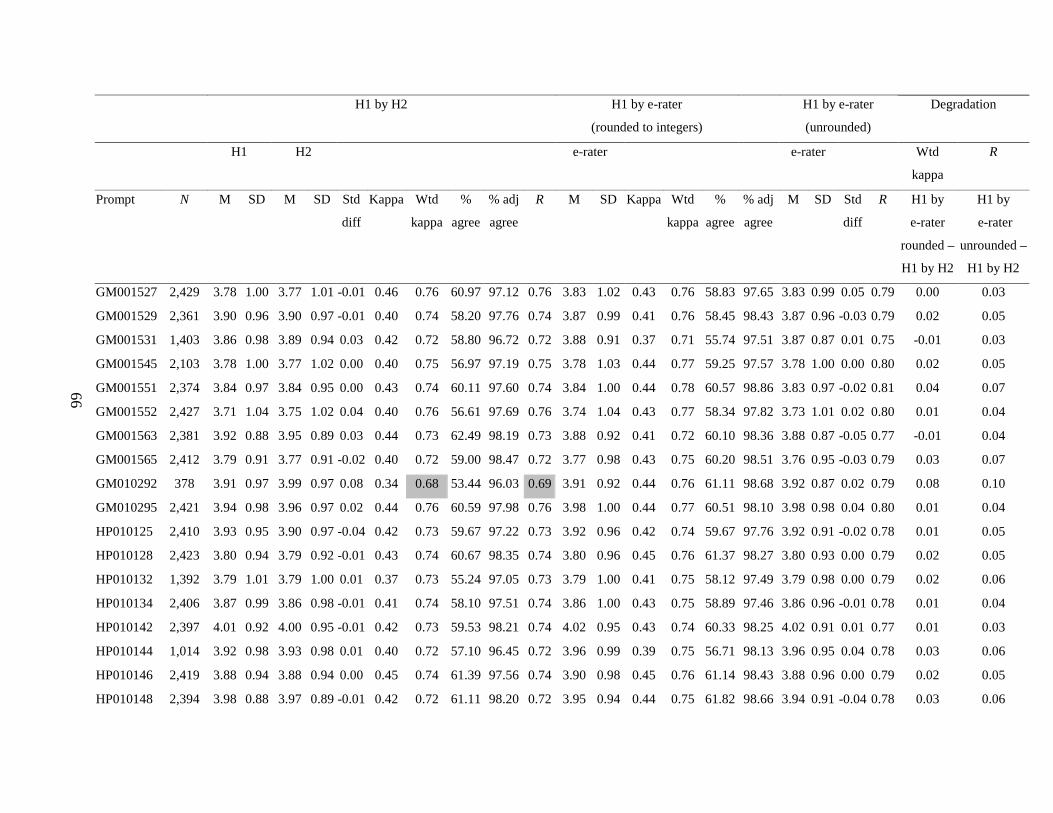
66
H1 by H2 H1 by e-rater
(rounded to integers)
H1 by e-rater
(unrounded)
Degradation
H1 H2 e-rater e-rater Wtd
kappa
R
Prompt N M SD M SD Std
diff
Kappa Wtd
kappa
%
agree
% adj
agree
R M SD Kappa Wtd
kappa
%
agree
% adj
agree
M SD Std
diff
R H1 by
e-rater
rounded –
H1 by H2
H1 by
e-rater
unrounded –
H1 by H2
GM001527 2,429 3.78 1.00 3.77 1.01 -0.01 0.46 0.76 60.97 97.12 0.76 3.83 1.02 0.43 0.76 58.83 97.65 3.83 0.99 0.05 0.79 0.00 0.03
GM001529 2,361 3.90 0.96 3.90 0.97 -0.01 0.40 0.74 58.20 97.76 0.74 3.87 0.99 0.41 0.76 58.45 98.43 3.87 0.96 -0.03 0.79 0.02 0.05
GM001531 1,403 3.86 0.98 3.89 0.94 0.03 0.42 0.72 58.80 96.72 0.72 3.88 0.91 0.37 0.71 55.74 97.51 3.87 0.87 0.01 0.75 -0.01 0.03
GM001545 2,103 3.78 1.00 3.77 1.02 0.00 0.40 0.75 56.97 97.19 0.75 3.78 1.03 0.44 0.77 59.25 97.57 3.78 1.00 0.00 0.80 0.02 0.05
GM001551 2,374 3.84 0.97 3.84 0.95 0.00 0.43 0.74 60.11 97.60 0.74 3.84 1.00 0.44 0.78 60.57 98.86 3.83 0.97 -0.02 0.81 0.04 0.07
GM001552 2,427 3.71 1.04 3.75 1.02 0.04 0.40 0.76 56.61 97.69 0.76 3.74 1.04 0.43 0.77 58.34 97.82 3.73 1.01 0.02 0.80 0.01 0.04
GM001563 2,381 3.92 0.88 3.95 0.89 0.03 0.44 0.73 62.49 98.19 0.73 3.88 0.92 0.41 0.72 60.10 98.36 3.88 0.87 -0.05 0.77 -0.01 0.04
GM001565 2,412 3.79 0.91 3.77 0.91 -0.02 0.40 0.72 59.00 98.47 0.72 3.77 0.98 0.43 0.75 60.20 98.51 3.76 0.95 -0.03 0.79 0.03 0.07
GM010292 378 3.91 0.97 3.99 0.97 0.08 0.34 0.68 53.44 96.03 0.69 3.91 0.92 0.44 0.76 61.11 98.68 3.92 0.87 0.02 0.79 0.08 0.10
GM010295 2,421 3.94 0.98 3.96 0.97 0.02 0.44 0.76 60.59 97.98 0.76 3.98 1.00 0.44 0.77 60.51 98.10 3.98 0.98 0.04 0.80 0.01 0.04
HP010125 2,410 3.93 0.95 3.90 0.97 -0.04 0.42 0.73 59.67 97.22 0.73 3.92 0.96 0.42 0.74 59.67 97.76 3.92 0.91 -0.02 0.78 0.01 0.05
HP010128 2,423 3.80 0.94 3.79 0.92 -0.01 0.43 0.74 60.67 98.35 0.74 3.80 0.96 0.45 0.76 61.37 98.27 3.80 0.93 0.00 0.79 0.02 0.05
HP010132 1,392 3.79 1.01 3.79 1.00 0.01 0.37 0.73 55.24 97.05 0.73 3.79 1.00 0.41 0.75 58.12 97.49 3.79 0.98 0.00 0.79 0.02 0.06
HP010134 2,406 3.87 0.99 3.86 0.98 -0.01 0.41 0.74 58.10 97.51 0.74 3.86 1.00 0.43 0.75 58.89 97.46 3.86 0.96 -0.01 0.78 0.01 0.04
HP010142 2,397 4.01 0.92 4.00 0.95 -0.01 0.42 0.73 59.53 98.21 0.74 4.02 0.95 0.43 0.74 60.33 98.25 4.02 0.91 0.01 0.77 0.01 0.03
HP010144 1,014 3.92 0.98 3.93 0.98 0.01 0.40 0.72 57.10 96.45 0.72 3.96 0.99 0.39 0.75 56.71 98.13 3.96 0.95 0.04 0.78 0.03 0.06
HP010146 2,419 3.88 0.94 3.88 0.94 0.00 0.45 0.74 61.39 97.56 0.74 3.90 0.98 0.45 0.76 61.14 98.43 3.88 0.96 0.00 0.79 0.02 0.05
HP010148 2,394 3.98 0.88 3.97 0.89 -0.01 0.42 0.72 61.11 98.20 0.72 3.95 0.94 0.44 0.75 61.82 98.66 3.94 0.91 -0.04 0.78 0.03 0.06
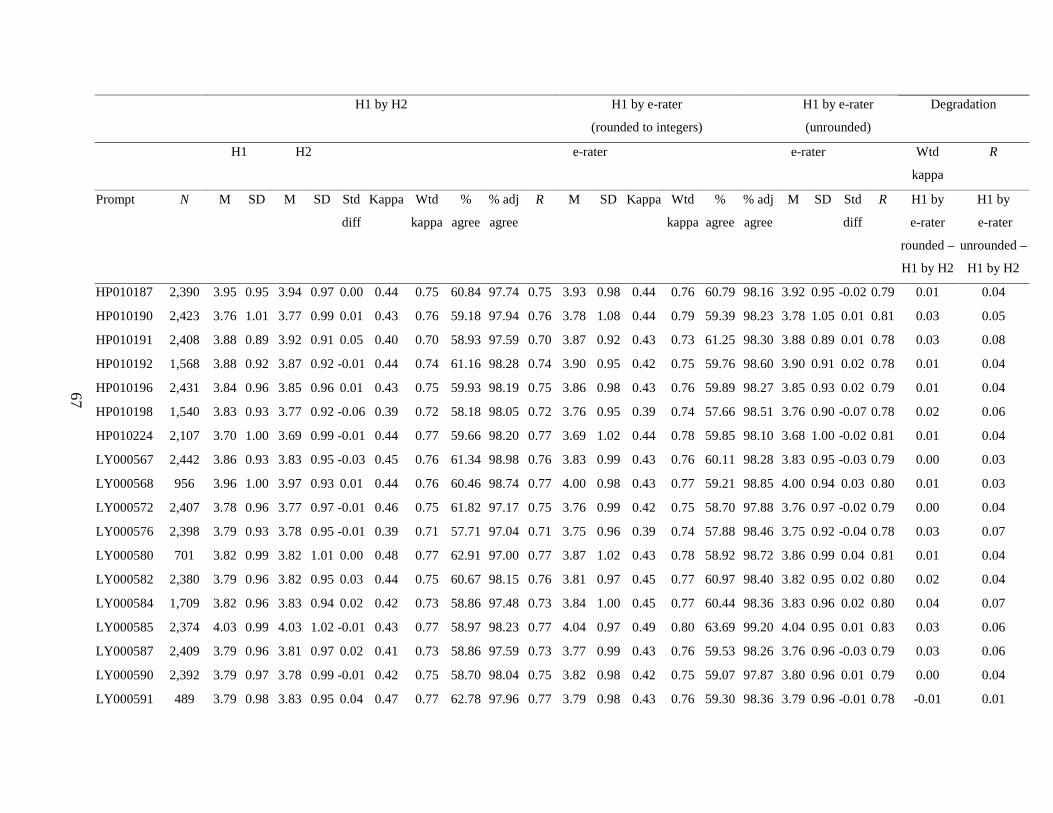
67
H1 by H2 H1 by e-rater
(rounded to integers)
H1 by e-rater
(unrounded)
Degradation
H1 H2 e-rater e-rater Wtd
kappa
R
Prompt N M SD M SD Std
diff
Kappa Wtd
kappa
%
agree
% adj
agree
R M SD Kappa Wtd
kappa
%
agree
% adj
agree
M SD Std
diff
R H1 by
e-rater
rounded –
H1 by H2
H1 by
e-rater
unrounded –
H1 by H2
HP010187 2,390 3.95 0.95 3.94 0.97 0.00 0.44 0.75 60.84 97.74 0.75 3.93 0.98 0.44 0.76 60.79 98.16 3.92 0.95 -0.02 0.79 0.01 0.04
HP010190 2,423 3.76 1.01 3.77 0.99 0.01 0.43 0.76 59.18 97.94 0.76 3.78 1.08 0.44 0.79 59.39 98.23 3.78 1.05 0.01 0.81 0.03 0.05
HP010191 2,408 3.88 0.89 3.92 0.91 0.05 0.40 0.70 58.93 97.59 0.70 3.87 0.92 0.43 0.73 61.25 98.30 3.88 0.89 0.01 0.78 0.03 0.08
HP010192 1,568 3.88 0.92 3.87 0.92 -0.01 0.44 0.74 61.16 98.28 0.74 3.90 0.95 0.42 0.75 59.76 98.60 3.90 0.91 0.02 0.78 0.01 0.04
HP010196 2,431 3.84 0.96 3.85 0.96 0.01 0.43 0.75 59.93 98.19 0.75 3.86 0.98 0.43 0.76 59.89 98.27 3.85 0.93 0.02 0.79 0.01 0.04
HP010198 1,540 3.83 0.93 3.77 0.92 -0.06 0.39 0.72 58.18 98.05 0.72 3.76 0.95 0.39 0.74 57.66 98.51 3.76 0.90 -0.07 0.78 0.02 0.06
HP010224 2,107 3.70 1.00 3.69 0.99 -0.01 0.44 0.77 59.66 98.20 0.77 3.69 1.02 0.44 0.78 59.85 98.10 3.68 1.00 -0.02 0.81 0.01 0.04
LY000567 2,442 3.86 0.93 3.83 0.95 -0.03 0.45 0.76 61.34 98.98 0.76 3.83 0.99 0.43 0.76 60.11 98.28 3.83 0.95 -0.03 0.79 0.00 0.03
LY000568 956 3.96 1.00 3.97 0.93 0.01 0.44 0.76 60.46 98.74 0.77 4.00 0.98 0.43 0.77 59.21 98.85 4.00 0.94 0.03 0.80 0.01 0.03
LY000572 2,407 3.78 0.96 3.77 0.97 -0.01 0.46 0.75 61.82 97.17 0.75 3.76 0.99 0.42 0.75 58.70 97.88 3.76 0.97 -0.02 0.79 0.00 0.04
LY000576 2,398 3.79 0.93 3.78 0.95 -0.01 0.39 0.71 57.71 97.04 0.71 3.75 0.96 0.39 0.74 57.88 98.46 3.75 0.92 -0.04 0.78 0.03 0.07
LY000580 701 3.82 0.99 3.82 1.01 0.00 0.48 0.77 62.91 97.00 0.77 3.87 1.02 0.43 0.78 58.92 98.72 3.86 0.99 0.04 0.81 0.01 0.04
LY000582 2,380 3.79 0.96 3.82 0.95 0.03 0.44 0.75 60.67 98.15 0.76 3.81 0.97 0.45 0.77 60.97 98.40 3.82 0.95 0.02 0.80 0.02 0.04
LY000584 1,709 3.82 0.96 3.83 0.94 0.02 0.42 0.73 58.86 97.48 0.73 3.84 1.00 0.45 0.77 60.44 98.36 3.83 0.96 0.02 0.80 0.04 0.07
LY000585 2,374 4.03 0.99 4.03 1.02 -0.01 0.43 0.77 58.97 98.23 0.77 4.04 0.97 0.49 0.80 63.69 99.20 4.04 0.95 0.01 0.83 0.03 0.06
LY000587 2,409 3.79 0.96 3.81 0.97 0.02 0.41 0.73 58.86 97.59 0.73 3.77 0.99 0.43 0.76 59.53 98.26 3.76 0.96 -0.03 0.79 0.03 0.06
LY000590 2,392 3.79 0.97 3.78 0.99 -0.01 0.42 0.75 58.70 98.04 0.75 3.82 0.98 0.42 0.75 59.07 97.87 3.80 0.96 0.01 0.79 0.00 0.04
LY000591 489 3.79 0.98 3.83 0.95 0.04 0.47 0.77 62.78 97.96 0.77 3.79 0.98 0.43 0.76 59.30 98.36 3.79 0.96 -0.01 0.78 -0.01 0.01

68
H1 by H2 H1 by e-rater
(rounded to integers)
H1 by e-rater
(unrounded)
Degradation
H1 H2 e-rater e-rater Wtd
kappa
R
Prompt N M SD M SD Std
diff
Kappa Wtd
kappa
%
agree
% adj
agree
R M SD Kappa Wtd
kappa
%
agree
% adj
agree
M SD Std
diff
R H1 by
e-rater
rounded –
H1 by H2
H1 by
e-rater
unrounded –
H1 by H2
LY000597 980 3.78 0.99 3.71 0.99 -0.08 0.44 0.75 59.59 97.04 0.75 3.73 1.00 0.45 0.78 60.31 98.67 3.74 0.97 -0.04 0.80 0.03 0.05
LY000598 2,439 3.88 0.98 3.87 0.97 -0.01 0.44 0.75 60.11 97.50 0.75 3.86 1.01 0.45 0.78 60.89 98.56 3.85 0.98 -0.03 0.81 0.03 0.06
LY000599 1,369 3.95 0.96 3.92 0.93 -0.02 0.40 0.73 58.22 97.81 0.73 3.93 0.95 0.41 0.75 58.44 98.76 3.94 0.92 -0.01 0.79 0.02 0.06
LY000600 489 3.90 1.02 3.99 1.03 0.09 0.39 0.73 56.24 96.32 0.74 3.99 0.97 0.43 0.73 59.30 96.11 3.99 0.94 0.08 0.77 0.00 0.03
LY000611 2,384 3.88 0.98 3.91 0.94 0.03 0.44 0.73 60.23 97.53 0.74 3.90 0.93 0.44 0.75 60.78 97.86 3.91 0.90 0.03 0.79 0.02 0.05
LY000631 2,416 3.93 0.99 3.93 1.00 0.01 0.42 0.75 58.49 97.27 0.75 3.88 0.98 0.39 0.75 56.83 98.14 3.87 0.94 -0.06 0.79 0.00 0.04
LY000632 2,376 3.92 0.95 3.94 0.95 0.02 0.40 0.73 57.83 97.98 0.73 3.91 1.00 0.44 0.77 60.48 98.61 3.90 0.97 -0.02 0.81 0.04 0.08
LY000633 2,394 3.90 0.97 3.90 0.97 0.00 0.41 0.73 57.98 97.62 0.73 3.91 0.98 0.42 0.75 58.69 98.25 3.91 0.95 0.01 0.78 0.02 0.05
LY000641 2,404 3.74 0.97 3.75 0.98 0.00 0.42 0.75 58.90 98.21 0.75 3.78 1.00 0.41 0.76 58.07 98.63 3.79 0.97 0.05 0.79 0.01 0.04
LY000646 2,406 3.80 0.93 3.82 0.95 0.02 0.42 0.74 59.64 98.17 0.74 3.81 1.00 0.41 0.75 58.31 98.13 3.80 0.97 0.00 0.79 0.01 0.05
LY000647 2,395 3.74 0.96 3.75 0.95 0.00 0.42 0.74 59.21 98.08 0.74 3.75 1.00 0.41 0.75 57.87 98.12 3.75 0.96 0.01 0.79 0.01 0.05
LY000648 760 3.79 0.95 3.85 0.95 0.07 0.40 0.71 58.42 96.97 0.72 3.88 0.99 0.43 0.76 59.61 98.03 3.86 0.95 0.08 0.80 0.05 0.08
LY000650 2,389 3.83 0.93 3.83 0.93 -0.01 0.46 0.75 62.29 97.95 0.75 3.81 0.97 0.42 0.75 58.94 98.58 3.80 0.94 -0.03 0.79 0.00 0.04
NB007538 2,407 3.82 0.94 3.81 0.93 -0.01 0.43 0.74 60.07 98.05 0.74 3.81 0.96 0.46 0.77 62.15 98.96 3.80 0.93 -0.02 0.80 0.03 0.06
NB007545 2,388 3.85 1.04 3.86 1.02 0.02 0.43 0.78 58.67 97.99 0.78 3.87 1.00 0.44 0.78 59.84 98.16 3.87 0.96 0.03 0.81 0.00 0.03
SP001606 2,382 3.83 0.98 3.83 0.99 0.01 0.44 0.76 59.87 98.03 0.76 3.84 0.99 0.45 0.77 60.41 98.07 3.83 0.95 0.01 0.80 0.01 0.04
UA100002 2,362 3.81 1.01 3.80 1.00 -0.01 0.43 0.77 58.72 98.05 0.77 3.77 1.02 0.42 0.77 57.96 98.18 3.77 1.00 -0.03 0.80 0.00 0.03
UA100025 2,389 3.78 1.03 3.80 1.01 0.02 0.41 0.75 57.35 97.15 0.75 3.78 1.00 0.43 0.76 58.98 97.74 3.78 0.98 0.01 0.79 0.01 0.04

69
H1 by H2 H1 by e-rater
(rounded to integers)
H1 by e-rater
(unrounded)
Degradation
H1 H2 e-rater e-rater Wtd
kappa
R
Prompt N M SD M SD Std
diff
Kappa Wtd
kappa
%
agree
% adj
agree
R M SD Kappa Wtd
kappa
%
agree
% adj
agree
M SD Std
diff
R H1 by
e-rater
rounded –
H1 by H2
H1 by
e-rater
unrounded –
H1 by H2
UA100033 277 3.95 0.86 3.89 0.93 -0.06 0.50 0.74 64.98 97.83 0.75 3.92 0.96 0.39 0.72 57.76 98.92 3.92 0.91 -0.04 0.76 -0.02 0.01
UA100035 2,393 3.93 0.90 3.89 0.92 -0.04 0.43 0.73 61.01 98.33 0.74 3.91 0.95 0.41 0.73 59.59 98.20 3.91 0.92 -0.02 0.77 0.00 0.03
UA100048 1,966 3.85 0.97 3.86 0.98 0.01 0.43 0.75 59.61 97.71 0.75 3.89 0.96 0.40 0.75 58.09 98.17 3.89 0.92 0.04 0.79 0.00 0.04
UA100051 2,414 3.91 0.94 3.90 0.93 0.00 0.44 0.74 60.89 97.80 0.74 3.92 0.97 0.46 0.77 62.01 98.72 3.90 0.93 0.00 0.80 0.03 0.06
UC100002 2,400 3.96 0.98 3.93 0.97 -0.03 0.42 0.75 59.17 98.00 0.75 3.94 0.98 0.42 0.76 59.13 98.46 3.95 0.95 -0.01 0.80 0.01 0.05
UC100004 2,415 3.84 0.95 3.88 0.95 0.05 0.41 0.72 58.26 97.52 0.73 3.86 1.00 0.39 0.74 56.73 98.22 3.85 0.97 0.02 0.78 0.02 0.05
UC100007 2,383 3.90 0.98 3.92 0.97 0.01 0.39 0.73 56.74 97.52 0.73 3.92 0.96 0.42 0.75 59.21 98.03 3.92 0.94 0.02 0.79 0.02 0.06
UC100009 1,520 3.81 0.99 3.80 1.00 -0.01 0.42 0.74 58.16 97.04 0.74 3.80 0.98 0.41 0.76 57.96 98.55 3.81 0.95 -0.01 0.79 0.02 0.05
UC100010 2,400 3.84 0.98 3.82 0.96 -0.02 0.42 0.74 58.54 97.83 0.75 3.76 1.01 0.42 0.76 58.88 98.04 3.76 0.97 -0.08 0.79 0.02 0.04
UC100012 2,402 3.89 1.00 3.89 1.02 -0.01 0.43 0.77 59.08 97.92 0.77 3.92 1.01 0.40 0.76 56.83 98.08 3.92 0.99 0.03 0.79 -0.01 0.02
UC100016 2,374 3.90 0.96 3.89 0.97 -0.01 0.43 0.74 59.56 97.43 0.74 3.85 0.99 0.42 0.77 59.35 98.69 3.86 0.95 -0.04 0.80 0.03 0.06
UC100019 2,380 3.88 0.97 3.85 0.99 -0.03 0.42 0.74 58.61 97.23 0.74 3.85 0.96 0.40 0.75 57.73 98.19 3.85 0.93 -0.04 0.78 0.01 0.04
UC100030 2,399 3.62 1.03 3.61 1.04 -0.02 0.41 0.76 56.94 97.25 0.76 3.64 1.05 0.43 0.78 58.82 97.96 3.64 1.02 0.01 0.81 0.02 0.05
UC100032 2,420 3.93 0.96 3.93 0.97 0.00 0.43 0.75 60.12 97.60 0.75 3.96 0.97 0.44 0.76 60.58 98.51 3.95 0.93 0.02 0.80 0.01 0.05
VB152145 2,427 3.85 0.97 3.84 0.96 -0.01 0.42 0.74 59.29 97.78 0.74 3.83 0.98 0.42 0.76 58.92 98.27 3.83 0.96 -0.03 0.79 0.02 0.05
VB152147 1,940 3.74 0.93 3.72 0.94 -0.02 0.47 0.76 62.94 98.30 0.76 3.72 1.01 0.41 0.75 58.61 98.40 3.72 0.97 -0.03 0.79 -0.01 0.03
VB152148 2,410 3.86 0.98 3.88 0.98 0.03 0.44 0.75 59.75 97.30 0.75 3.85 1.01 0.43 0.76 58.96 98.09 3.85 0.97 0.00 0.79 0.01 0.04
VB152149 2,423 3.72 0.98 3.72 0.97 0.00 0.43 0.75 59.64 97.48 0.75 3.72 1.04 0.41 0.76 57.37 98.10 3.72 1.01 0.00 0.79 0.01 0.04
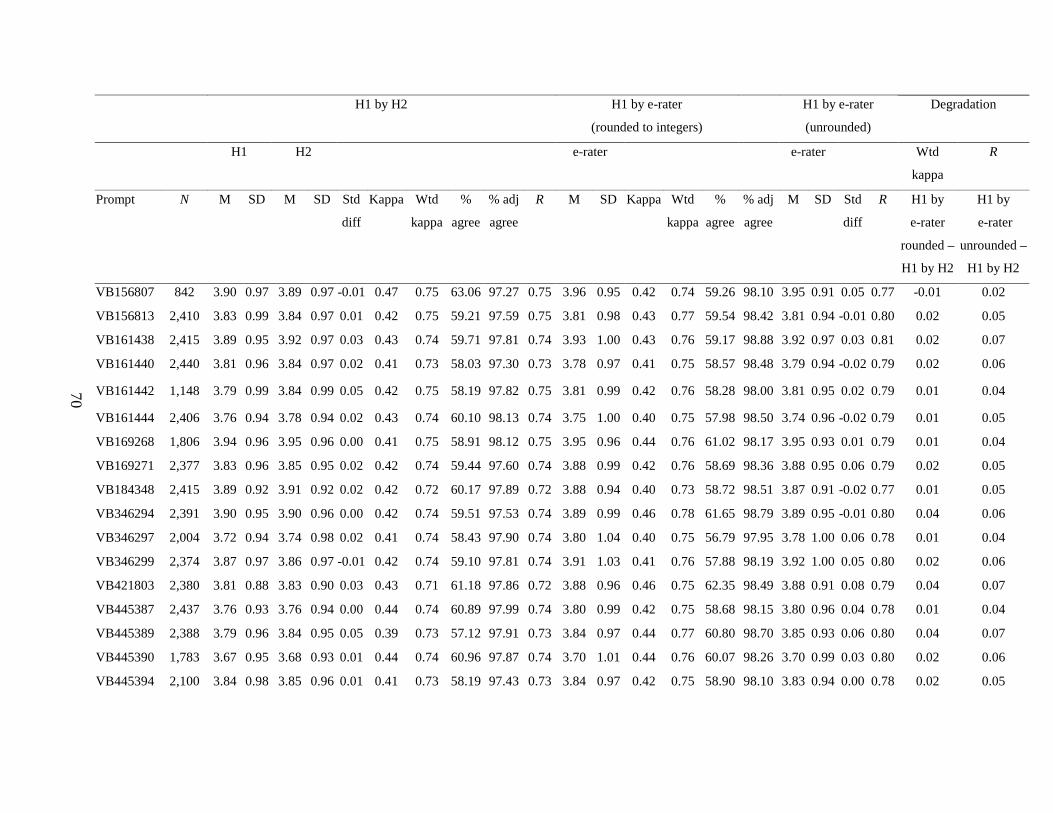
70
H1 by H2 H1 by e-rater
(rounded to integers)
H1 by e-rater
(unrounded)
Degradation
H1 H2 e-rater e-rater Wtd
kappa
R
Prompt N M SD M SD Std
diff
Kappa Wtd
kappa
%
agree
% adj
agree
R M SD Kappa Wtd
kappa
%
agree
% adj
agree
M SD Std
diff
R H1 by
e-rater
rounded –
H1 by H2
H1 by
e-rater
unrounded –
H1 by H2
VB156807 842 3.90 0.97 3.89 0.97 -0.01 0.47 0.75 63.06 97.27 0.75 3.96 0.95 0.42 0.74 59.26 98.10 3.95 0.91 0.05 0.77 -0.01 0.02
VB156813 2,410 3.83 0.99 3.84 0.97 0.01 0.42 0.75 59.21 97.59 0.75 3.81 0.98 0.43 0.77 59.54 98.42 3.81 0.94 -0.01 0.80 0.02 0.05
VB161438 2,415 3.89 0.95 3.92 0.97 0.03 0.43 0.74 59.71 97.81 0.74 3.93 1.00 0.43 0.76 59.17 98.88 3.92 0.97 0.03 0.81 0.02 0.07
VB161440 2,440 3.81 0.96 3.84 0.97 0.02 0.41 0.73 58.03 97.30 0.73 3.78 0.97 0.41 0.75 58.57 98.48 3.79 0.94 -0.02 0.79 0.02 0.06
VB161442 1,148 3.79 0.99 3.84 0.99 0.05 0.42 0.75 58.19 97.82 0.75 3.81 0.99 0.42 0.76 58.28 98.00 3.81 0.95 0.02 0.79 0.01 0.04
VB161444 2,406 3.76 0.94 3.78 0.94 0.02 0.43 0.74 60.10 98.13 0.74 3.75 1.00 0.40 0.75 57.98 98.50 3.74 0.96 -0.02 0.79 0.01 0.05
VB169268 1,806 3.94 0.96 3.95 0.96 0.00 0.41 0.75 58.91 98.12 0.75 3.95 0.96 0.44 0.76 61.02 98.17 3.95 0.93 0.01 0.79 0.01 0.04
VB169271 2,377 3.83 0.96 3.85 0.95 0.02 0.42 0.74 59.44 97.60 0.74 3.88 0.99 0.42 0.76 58.69 98.36 3.88 0.95 0.06 0.79 0.02 0.05
VB184348 2,415 3.89 0.92 3.91 0.92 0.02 0.42 0.72 60.17 97.89 0.72 3.88 0.94 0.40 0.73 58.72 98.51 3.87 0.91 -0.02 0.77 0.01 0.05
VB346294 2,391 3.90 0.95 3.90 0.96 0.00 0.42 0.74 59.51 97.53 0.74 3.89 0.99 0.46 0.78 61.65 98.79 3.89 0.95 -0.01 0.80 0.04 0.06
VB346297 2,004 3.72 0.94 3.74 0.98 0.02 0.41 0.74 58.43 97.90 0.74 3.80 1.04 0.40 0.75 56.79 97.95 3.78 1.00 0.06 0.78 0.01 0.04
VB346299 2,374 3.87 0.97 3.86 0.97 -0.01 0.42 0.74 59.10 97.81 0.74 3.91 1.03 0.41 0.76 57.88 98.19 3.92 1.00 0.05 0.80 0.02 0.06
VB421803 2,380 3.81 0.88 3.83 0.90 0.03 0.43 0.71 61.18 97.86 0.72 3.88 0.96 0.46 0.75 62.35 98.49 3.88 0.91 0.08 0.79 0.04 0.07
VB445387 2,437 3.76 0.93 3.76 0.94 0.00 0.44 0.74 60.89 97.99 0.74 3.80 0.99 0.42 0.75 58.68 98.15 3.80 0.96 0.04 0.78 0.01 0.04
VB445389 2,388 3.79 0.96 3.84 0.95 0.05 0.39 0.73 57.12 97.91 0.73 3.84 0.97 0.44 0.77 60.80 98.70 3.85 0.93 0.06 0.80 0.04 0.07
VB445390 1,783 3.67 0.95 3.68 0.93 0.01 0.44 0.74 60.96 97.87 0.74 3.70 1.01 0.44 0.76 60.07 98.26 3.70 0.99 0.03 0.80 0.02 0.06
VB445394 2,100 3.84 0.98 3.85 0.96 0.01 0.41 0.73 58.19 97.43 0.73 3.84 0.97 0.42 0.75 58.90 98.10 3.83 0.94 0.00 0.78 0.02 0.05
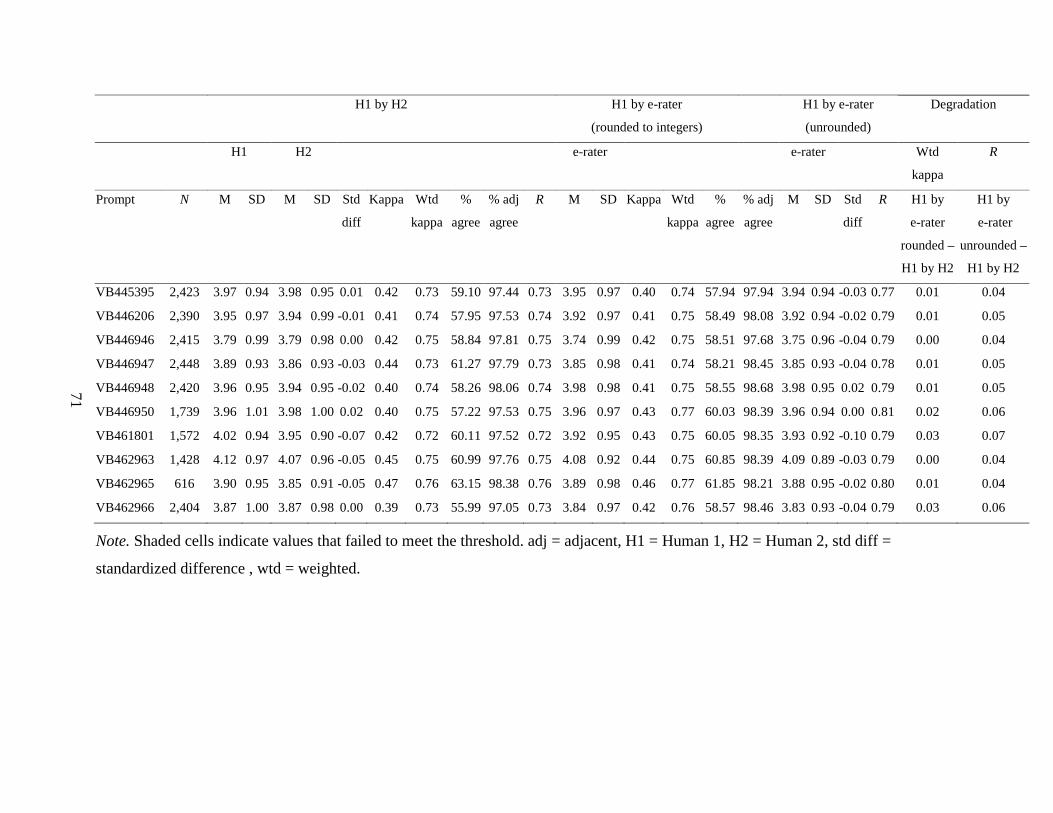
71
H1 by H2 H1 by e-rater
(rounded to integers)
H1 by e-rater
(unrounded)
Degradation
H1 H2 e-rater e-rater Wtd
kappa
R
Prompt N M SD M SD Std
diff
Kappa Wtd
kappa
%
agree
% adj
agree
R M SD Kappa Wtd
kappa
%
agree
% adj
agree
M SD Std
diff
R H1 by
e-rater
rounded –
H1 by H2
H1 by
e-rater
unrounded –
H1 by H2
VB445395 2,423 3.97 0.94 3.98 0.95 0.01 0.42 0.73 59.10 97.44 0.73 3.95 0.97 0.40 0.74 57.94 97.94 3.94 0.94 -0.03 0.77 0.01 0.04
VB446206 2,390 3.95 0.97 3.94 0.99 -0.01 0.41 0.74 57.95 97.53 0.74 3.92 0.97 0.41 0.75 58.49 98.08 3.92 0.94 -0.02 0.79 0.01 0.05
VB446946 2,415 3.79 0.99 3.79 0.98 0.00 0.42 0.75 58.84 97.81 0.75 3.74 0.99 0.42 0.75 58.51 97.68 3.75 0.96 -0.04 0.79 0.00 0.04
VB446947 2,448 3.89 0.93 3.86 0.93 -0.03 0.44 0.73 61.27 97.79 0.73 3.85 0.98 0.41 0.74 58.21 98.45 3.85 0.93 -0.04 0.78 0.01 0.05
VB446948 2,420 3.96 0.95 3.94 0.95 -0.02 0.40 0.74 58.26 98.06 0.74 3.98 0.98 0.41 0.75 58.55 98.68 3.98 0.95 0.02 0.79 0.01 0.05
VB446950 1,739 3.96 1.01 3.98 1.00 0.02 0.40 0.75 57.22 97.53 0.75 3.96 0.97 0.43 0.77 60.03 98.39 3.96 0.94 0.00 0.81 0.02 0.06
VB461801 1,572 4.02 0.94 3.95 0.90 -0.07 0.42 0.72 60.11 97.52 0.72 3.92 0.95 0.43 0.75 60.05 98.35 3.93 0.92 -0.10 0.79 0.03 0.07
VB462963 1,428 4.12 0.97 4.07 0.96 -0.05 0.45 0.75 60.99 97.76 0.75 4.08 0.92 0.44 0.75 60.85 98.39 4.09 0.89 -0.03 0.79 0.00 0.04
VB462965 616 3.90 0.95 3.85 0.91 -0.05 0.47 0.76 63.15 98.38 0.76 3.89 0.98 0.46 0.77 61.85 98.21 3.88 0.95 -0.02 0.80 0.01 0.04
VB462966 2,404 3.87 1.00 3.87 0.98 0.00 0.39 0.73 55.99 97.05 0.73 3.84 0.97 0.42 0.76 58.57 98.46 3.83 0.93 -0.04 0.79 0.03 0.06
Note. Shaded cells indicate values that failed to meet the threshold. adj = adjacent, H1 = Human 1, H2 = Human 2, std diff =
standardized difference , wtd = weighted.
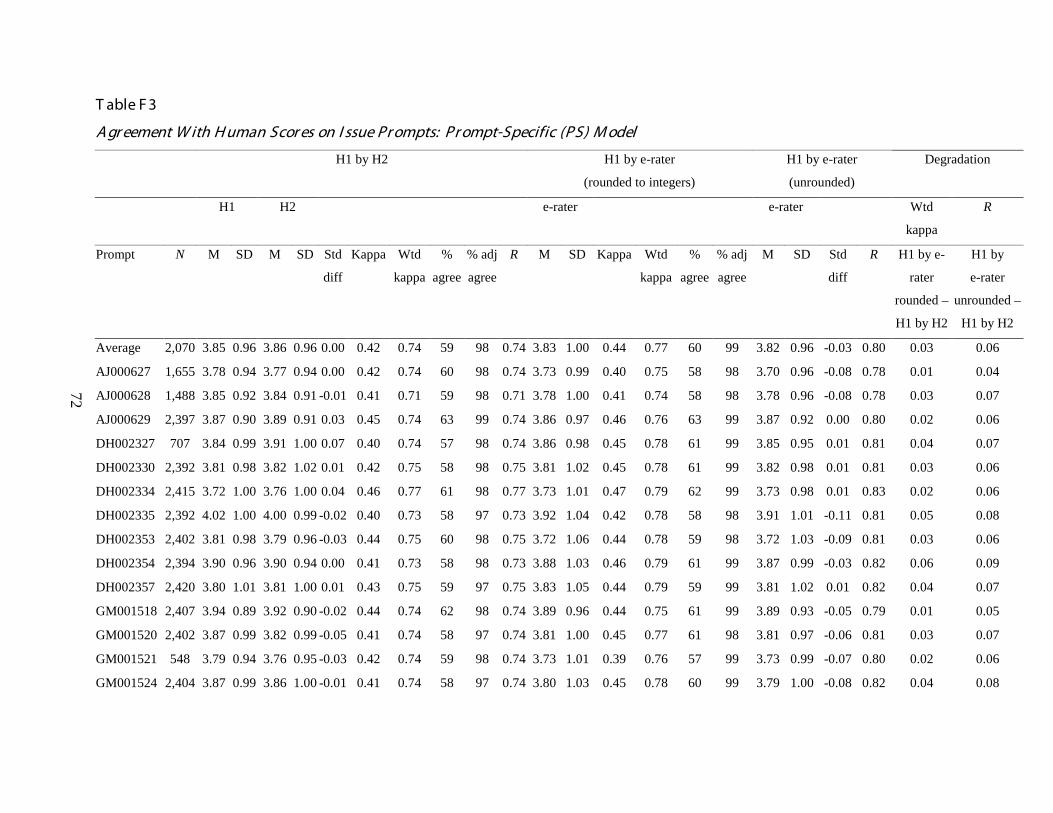
72
T able F 3
A gr eement W ith H uman Scor es on I ssue Pr ompts: Pr ompt-Specific (PS) M odel
H1 by H2 H1 by e-rater
(rounded to integers)
H1 by e-rater
(unrounded)
Degradation
H1 H2 e-rater e-rater Wtd
kappa
R
Prompt N M SD M SD Std
diff
Kappa Wtd
kappa
%
agree
% adj
agree
R M SD Kappa Wtd
kappa
%
agree
% adj
agree
M SD Std
diff
R H1 by e-
rater
rounded –
H1 by H2
H1 by
e-rater
unrounded –
H1 by H2
Average 2,070 3.85 0.96 3.86 0.96 0.00 0.42 0.74 59 98 0.74 3.83 1.00 0.44 0.77 60 99 3.82 0.96 -0.03 0.80 0.03 0.06
AJ000627 1,655 3.78 0.94 3.77 0.94 0.00 0.42 0.74 60 98 0.74 3.73 0.99 0.40 0.75 58 98 3.70 0.96 -0.08 0.78 0.01 0.04
AJ000628 1,488 3.85 0.92 3.84 0.91 -0.01 0.41 0.71 59 98 0.71 3.78 1.00 0.41 0.74 58 98 3.78 0.96 -0.08 0.78 0.03 0.07
AJ000629 2,397 3.87 0.90 3.89 0.91 0.03 0.45 0.74 63 99 0.74 3.86 0.97 0.46 0.76 63 99 3.87 0.92 0.00 0.80 0.02 0.06
DH002327 707 3.84 0.99 3.91 1.00 0.07 0.40 0.74 57 98 0.74 3.86 0.98 0.45 0.78 61 99 3.85 0.95 0.01 0.81 0.04 0.07
DH002330 2,392 3.81 0.98 3.82 1.02 0.01 0.42 0.75 58 98 0.75 3.81 1.02 0.45 0.78 61 99 3.82 0.98 0.01 0.81 0.03 0.06
DH002334 2,415 3.72 1.00 3.76 1.00 0.04 0.46 0.77 61 98 0.77 3.73 1.01 0.47 0.79 62 99 3.73 0.98 0.01 0.83 0.02 0.06
DH002335 2,392 4.02 1.00 4.00 0.99 -0.02 0.40 0.73 58 97 0.73 3.92 1.04 0.42 0.78 58 98 3.91 1.01 -0.11 0.81 0.05 0.08
DH002353 2,402 3.81 0.98 3.79 0.96 -0.03 0.44 0.75 60 98 0.75 3.72 1.06 0.44 0.78 59 98 3.72 1.03 -0.09 0.81 0.03 0.06
DH002354 2,394 3.90 0.96 3.90 0.94 0.00 0.41 0.73 58 98 0.73 3.88 1.03 0.46 0.79 61 99 3.87 0.99 -0.03 0.82 0.06 0.09
DH002357 2,420 3.80 1.01 3.81 1.00 0.01 0.43 0.75 59 97 0.75 3.83 1.05 0.44 0.79 59 99 3.81 1.02 0.01 0.82 0.04 0.07
GM001518 2,407 3.94 0.89 3.92 0.90 -0.02 0.44 0.74 62 98 0.74 3.89 0.96 0.44 0.75 61 99 3.89 0.93 -0.05 0.79 0.01 0.05
GM001520 2,402 3.87 0.99 3.82 0.99 -0.05 0.41 0.74 58 97 0.74 3.81 1.00 0.45 0.77 61 98 3.81 0.97 -0.06 0.81 0.03 0.07
GM001521 548 3.79 0.94 3.76 0.95 -0.03 0.42 0.74 59 98 0.74 3.73 1.01 0.39 0.76 57 99 3.73 0.99 -0.07 0.80 0.02 0.06
GM001524 2,404 3.87 0.99 3.86 1.00 -0.01 0.41 0.74 58 97 0.74 3.80 1.03 0.45 0.78 60 99 3.79 1.00 -0.08 0.82 0.04 0.08
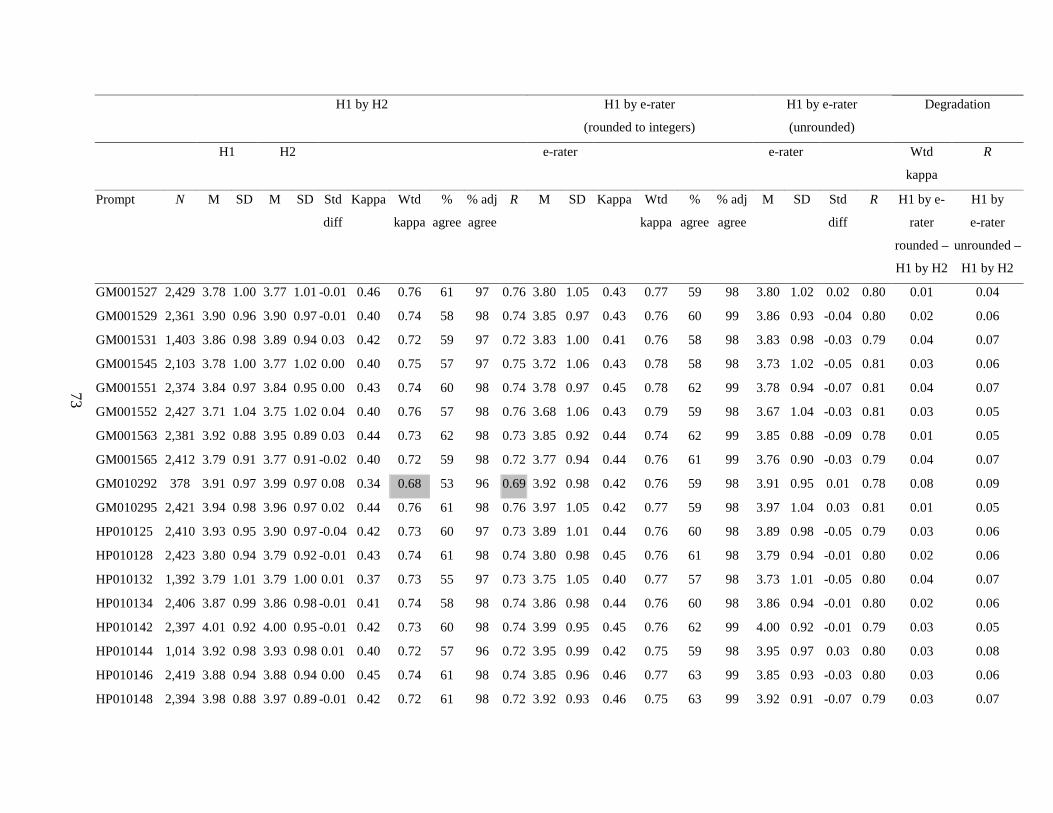
73
H1 by H2 H1 by e-rater
(rounded to integers)
H1 by e-rater
(unrounded)
Degradation
H1 H2 e-rater e-rater Wtd
kappa
R
Prompt N M SD M SD Std
diff
Kappa Wtd
kappa
%
agree
% adj
agree
R M SD Kappa Wtd
kappa
%
agree
% adj
agree
M SD Std
diff
R H1 by e-
rater
rounded –
H1 by H2
H1 by
e-rater
unrounded –
H1 by H2
GM001527 2,429 3.78 1.00 3.77 1.01 -0.01 0.46 0.76 61 97 0.76 3.80 1.05 0.43 0.77 59 98 3.80 1.02 0.02 0.80 0.01 0.04
GM001529 2,361 3.90 0.96 3.90 0.97 -0.01 0.40 0.74 58 98 0.74 3.85 0.97 0.43 0.76 60 99 3.86 0.93 -0.04 0.80 0.02 0.06
GM001531 1,403 3.86 0.98 3.89 0.94 0.03 0.42 0.72 59 97 0.72 3.83 1.00 0.41 0.76 58 98 3.83 0.98 -0.03 0.79 0.04 0.07
GM001545 2,103 3.78 1.00 3.77 1.02 0.00 0.40 0.75 57 97 0.75 3.72 1.06 0.43 0.78 58 98 3.73 1.02 -0.05 0.81 0.03 0.06
GM001551 2,374 3.84 0.97 3.84 0.95 0.00 0.43 0.74 60 98 0.74 3.78 0.97 0.45 0.78 62 99 3.78 0.94 -0.07 0.81 0.04 0.07
GM001552 2,427 3.71 1.04 3.75 1.02 0.04 0.40 0.76 57 98 0.76 3.68 1.06 0.43 0.79 59 98 3.67 1.04 -0.03 0.81 0.03 0.05
GM001563 2,381 3.92 0.88 3.95 0.89 0.03 0.44 0.73 62 98 0.73 3.85 0.92 0.44 0.74 62 99 3.85 0.88 -0.09 0.78 0.01 0.05
GM001565 2,412 3.79 0.91 3.77 0.91 -0.02 0.40 0.72 59 98 0.72 3.77 0.94 0.44 0.76 61 99 3.76 0.90 -0.03 0.79 0.04 0.07
GM010292 378 3.91 0.97 3.99 0.97 0.08 0.34 0.68 53 96 0.69 3.92 0.98 0.42 0.76 59 98 3.91 0.95 0.01 0.78 0.08 0.09
GM010295 2,421 3.94 0.98 3.96 0.97 0.02 0.44 0.76 61 98 0.76 3.97 1.05 0.42 0.77 59 98 3.97 1.04 0.03 0.81 0.01 0.05
HP010125 2,410 3.93 0.95 3.90 0.97 -0.04 0.42 0.73 60 97 0.73 3.89 1.01 0.44 0.76 60 98 3.89 0.98 -0.05 0.79 0.03 0.06
HP010128 2,423 3.80 0.94 3.79 0.92 -0.01 0.43 0.74 61 98 0.74 3.80 0.98 0.45 0.76 61 98 3.79 0.94 -0.01 0.80 0.02 0.06
HP010132 1,392 3.79 1.01 3.79 1.00 0.01 0.37 0.73 55 97 0.73 3.75 1.05 0.40 0.77 57 98 3.73 1.01 -0.05 0.80 0.04 0.07
HP010134 2,406 3.87 0.99 3.86 0.98 -0.01 0.41 0.74 58 98 0.74 3.86 0.98 0.44 0.76 60 98 3.86 0.94 -0.01 0.80 0.02 0.06
HP010142 2,397 4.01 0.92 4.00 0.95 -0.01 0.42 0.73 60 98 0.74 3.99 0.95 0.45 0.76 62 99 4.00 0.92 -0.01 0.79 0.03 0.05
HP010144 1,014 3.92 0.98 3.93 0.98 0.01 0.40 0.72 57 96 0.72 3.95 0.99 0.42 0.75 59 98 3.95 0.97 0.03 0.80 0.03 0.08
HP010146 2,419 3.88 0.94 3.88 0.94 0.00 0.45 0.74 61 98 0.74 3.85 0.96 0.46 0.77 63 99 3.85 0.93 -0.03 0.80 0.03 0.06
HP010148 2,394 3.98 0.88 3.97 0.89 -0.01 0.42 0.72 61 98 0.72 3.92 0.93 0.46 0.75 63 99 3.92 0.91 -0.07 0.79 0.03 0.07

74
H1 by H2 H1 by e-rater
(rounded to integers)
H1 by e-rater
(unrounded)
Degradation
H1 H2 e-rater e-rater Wtd
kappa
R
Prompt N M SD M SD Std
diff
Kappa Wtd
kappa
%
agree
% adj
agree
R M SD Kappa Wtd
kappa
%
agree
% adj
agree
M SD Std
diff
R H1 by e-
rater
rounded –
H1 by H2
H1 by
e-rater
unrounded –
H1 by H2
HP010187 2,390 3.95 0.95 3.94 0.97 0.00 0.44 0.75 61 98 0.75 3.92 1.01 0.44 0.77 60 99 3.93 0.97 -0.02 0.81 0.02 0.06
HP010190 2,423 3.76 1.01 3.77 0.99 0.01 0.43 0.76 59 98 0.76 3.79 1.03 0.47 0.80 61 99 3.78 0.99 0.01 0.82 0.04 0.06
HP010191 2,408 3.88 0.89 3.92 0.91 0.05 0.40 0.70 59 98 0.70 3.88 0.97 0.45 0.75 62 98 3.89 0.94 0.01 0.79 0.05 0.09
HP010192 1,568 3.88 0.92 3.87 0.92 -0.01 0.44 0.74 61 98 0.74 3.86 0.93 0.45 0.76 62 99 3.86 0.90 -0.02 0.80 0.02 0.06
HP010196 2,431 3.84 0.96 3.85 0.96 0.01 0.43 0.75 60 98 0.75 3.85 0.99 0.44 0.77 60 99 3.84 0.95 0.00 0.80 0.02 0.05
HP010198 1,540 3.83 0.93 3.77 0.92 -0.06 0.39 0.72 58 98 0.72 3.73 0.93 0.40 0.74 59 99 3.74 0.90 -0.10 0.78 0.02 0.06
HP010224 2,107 3.70 1.00 3.69 0.99 -0.01 0.44 0.77 60 98 0.77 3.65 1.02 0.46 0.78 61 98 3.66 1.00 -0.05 0.82 0.01 0.05
LY000567 2,442 3.86 0.93 3.83 0.95 -0.03 0.45 0.76 61 99 0.76 3.82 1.02 0.44 0.77 61 99 3.82 0.97 -0.04 0.80 0.01 0.04
LY000568 956 3.96 1.00 3.97 0.93 0.01 0.44 0.76 60 99 0.77 3.96 1.01 0.45 0.78 60 98 3.96 0.97 -0.01 0.82 0.02 0.05
LY000572 2,407 3.78 0.96 3.77 0.97 -0.01 0.46 0.75 62 97 0.75 3.75 1.01 0.43 0.77 60 98 3.75 0.98 -0.04 0.80 0.02 0.05
LY000576 2,398 3.79 0.93 3.78 0.95 -0.01 0.39 0.71 58 97 0.71 3.72 0.96 0.40 0.74 58 98 3.71 0.92 -0.09 0.78 0.03 0.07
LY000580 701 3.82 0.99 3.82 1.01 0.00 0.48 0.77 63 97 0.77 3.88 0.98 0.45 0.78 61 99 3.86 0.93 0.04 0.82 0.01 0.05
LY000582 2,380 3.79 0.96 3.82 0.95 0.03 0.44 0.75 61 98 0.76 3.79 0.96 0.46 0.78 62 99 3.80 0.94 0.01 0.81 0.03 0.05
LY000584 1,709 3.82 0.96 3.83 0.94 0.02 0.42 0.73 59 97 0.73 3.80 0.99 0.45 0.77 61 99 3.80 0.94 -0.01 0.81 0.04 0.08
LY000585 2,374 4.03 0.99 4.03 1.02 -0.01 0.43 0.77 59 98 0.77 4.00 1.04 0.48 0.80 63 99 4.00 1.02 -0.03 0.83 0.03 0.06
LY000587 2,409 3.79 0.96 3.81 0.97 0.02 0.41 0.73 59 98 0.73 3.76 1.01 0.42 0.76 59 98 3.75 0.98 -0.04 0.79 0.03 0.06
LY000590 2,392 3.79 0.97 3.78 0.99 -0.01 0.42 0.75 59 98 0.75 3.77 1.03 0.42 0.77 59 98 3.76 1.00 -0.03 0.80 0.02 0.05
LY000591 489 3.79 0.98 3.83 0.95 0.04 0.47 0.77 63 98 0.77 3.74 0.93 0.43 0.77 60 99 3.75 0.92 -0.05 0.79 0.00 0.02

75
H1 by H2 H1 by e-rater
(rounded to integers)
H1 by e-rater
(unrounded)
Degradation
H1 H2 e-rater e-rater Wtd
kappa
R
Prompt N M SD M SD Std
diff
Kappa Wtd
kappa
%
agree
% adj
agree
R M SD Kappa Wtd
kappa
%
agree
% adj
agree
M SD Std
diff
R H1 by e-
rater
rounded –
H1 by H2
H1 by
e-rater
unrounded –
H1 by H2
LY000597 980 3.78 0.99 3.71 0.99 -0.08 0.44 0.75 60 97 0.75 3.68 1.00 0.44 0.77 60 98 3.69 0.95 -0.09 0.81 0.02 0.06
LY000598 2,439 3.88 0.98 3.87 0.97 -0.01 0.44 0.75 60 98 0.75 3.82 1.03 0.44 0.78 60 99 3.82 1.00 -0.06 0.82 0.03 0.07
LY000599 1,369 3.95 0.96 3.92 0.93 -0.02 0.40 0.73 58 98 0.73 3.91 1.03 0.42 0.77 59 99 3.91 0.98 -0.04 0.80 0.04 0.07
LY000600 489 3.90 1.02 3.99 1.03 0.09 0.39 0.73 56 96 0.74 3.95 1.06 0.41 0.75 57 97 3.96 1.02 0.06 0.77 0.02 0.03
LY000611 2,384 3.88 0.98 3.91 0.94 0.03 0.44 0.73 60 98 0.74 3.84 0.99 0.45 0.77 61 98 3.85 0.95 -0.03 0.80 0.04 0.06
LY000631 2,416 3.93 0.99 3.93 1.00 0.01 0.42 0.75 58 97 0.75 3.84 1.04 0.41 0.76 57 98 3.84 1.01 -0.08 0.79 0.01 0.04
LY000632 2,376 3.92 0.95 3.94 0.95 0.02 0.40 0.73 58 98 0.73 3.88 1.02 0.45 0.78 61 99 3.88 0.98 -0.04 0.81 0.05 0.08
LY000633 2,394 3.90 0.97 3.90 0.97 0.00 0.41 0.73 58 98 0.73 3.90 1.01 0.43 0.76 59 98 3.89 0.98 -0.01 0.79 0.03 0.06
LY000641 2,404 3.74 0.97 3.75 0.98 0.00 0.42 0.75 59 98 0.75 3.77 1.00 0.42 0.77 58 99 3.77 0.96 0.02 0.81 0.02 0.06
LY000646 2,406 3.80 0.93 3.82 0.95 0.02 0.42 0.74 60 98 0.74 3.78 0.98 0.42 0.75 59 99 3.79 0.94 -0.02 0.79 0.01 0.05
LY000647 2,395 3.74 0.96 3.75 0.95 0.00 0.42 0.74 59 98 0.74 3.73 0.96 0.45 0.76 61 99 3.72 0.91 -0.03 0.80 0.02 0.06
LY000648 760 3.79 0.95 3.85 0.95 0.07 0.40 0.71 58 97 0.72 3.84 0.99 0.47 0.78 63 99 3.82 0.96 0.04 0.81 0.07 0.09
LY000650 2,389 3.83 0.93 3.83 0.93 -0.01 0.46 0.75 62 98 0.75 3.80 0.98 0.43 0.76 60 99 3.78 0.95 -0.05 0.79 0.01 0.04
NB007538 2,407 3.82 0.94 3.81 0.93 -0.01 0.43 0.74 60 98 0.74 3.80 0.97 0.47 0.78 63 99 3.79 0.93 -0.03 0.81 0.04 0.07
NB007545 2,388 3.85 1.04 3.86 1.02 0.02 0.43 0.78 59 98 0.78 3.84 1.05 0.47 0.80 62 99 3.84 1.01 -0.01 0.83 0.02 0.05
SP001606 2,382 3.83 0.98 3.83 0.99 0.01 0.44 0.76 60 98 0.76 3.81 0.98 0.46 0.77 61 98 3.81 0.95 -0.01 0.81 0.01 0.05
UA100002 2,362 3.81 1.01 3.80 1.00 -0.01 0.43 0.77 59 98 0.77 3.73 1.00 0.43 0.78 59 99 3.74 0.97 -0.07 0.82 0.01 0.05
UA100025 2,389 3.78 1.03 3.80 1.01 0.02 0.41 0.75 57 97 0.75 3.76 1.04 0.43 0.77 58 98 3.76 1.01 -0.02 0.81 0.02 0.06
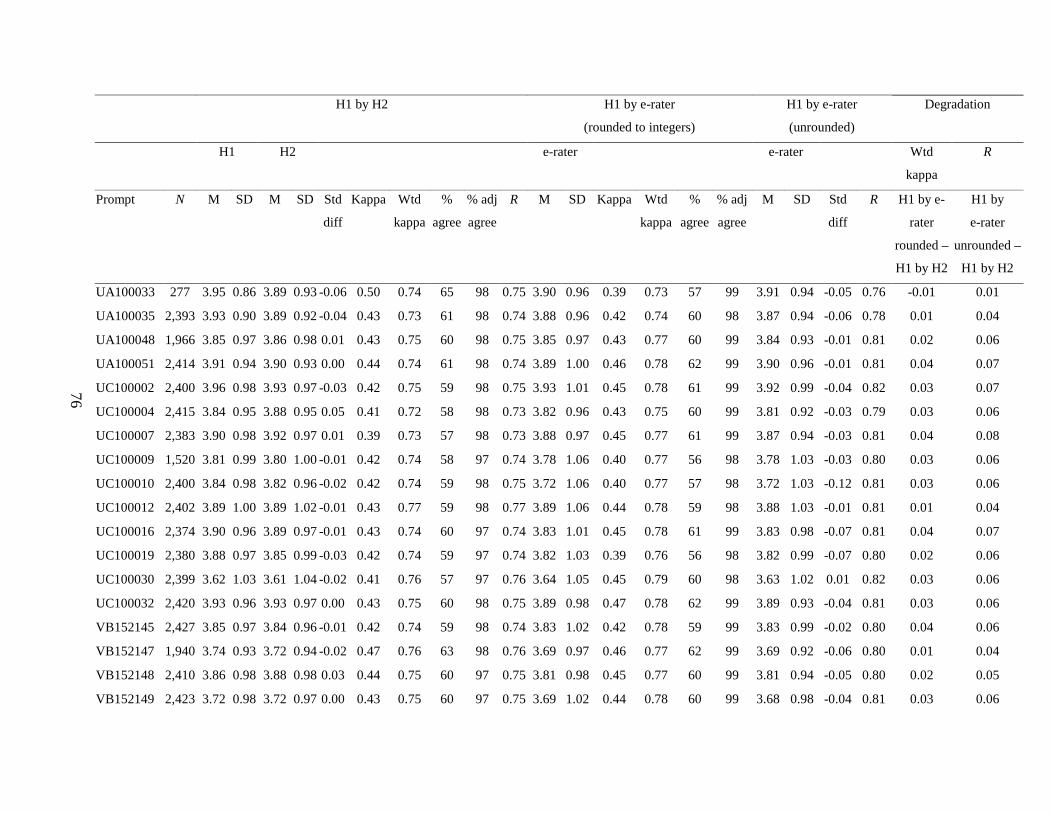
76
H1 by H2 H1 by e-rater
(rounded to integers)
H1 by e-rater
(unrounded)
Degradation
H1 H2 e-rater e-rater Wtd
kappa
R
Prompt N M SD M SD Std
diff
Kappa Wtd
kappa
%
agree
% adj
agree
R M SD Kappa Wtd
kappa
%
agree
% adj
agree
M SD Std
diff
R H1 by e-
rater
rounded –
H1 by H2
H1 by
e-rater
unrounded –
H1 by H2
UA100033 277 3.95 0.86 3.89 0.93 -0.06 0.50 0.74 65 98 0.75 3.90 0.96 0.39 0.73 57 99 3.91 0.94 -0.05 0.76 -0.01 0.01
UA100035 2,393 3.93 0.90 3.89 0.92 -0.04 0.43 0.73 61 98 0.74 3.88 0.96 0.42 0.74 60 98 3.87 0.94 -0.06 0.78 0.01 0.04
UA100048 1,966 3.85 0.97 3.86 0.98 0.01 0.43 0.75 60 98 0.75 3.85 0.97 0.43 0.77 60 99 3.84 0.93 -0.01 0.81 0.02 0.06
UA100051 2,414 3.91 0.94 3.90 0.93 0.00 0.44 0.74 61 98 0.74 3.89 1.00 0.46 0.78 62 99 3.90 0.96 -0.01 0.81 0.04 0.07
UC100002 2,400 3.96 0.98 3.93 0.97 -0.03 0.42 0.75 59 98 0.75 3.93 1.01 0.45 0.78 61 99 3.92 0.99 -0.04 0.82 0.03 0.07
UC100004 2,415 3.84 0.95 3.88 0.95 0.05 0.41 0.72 58 98 0.73 3.82 0.96 0.43 0.75 60 99 3.81 0.92 -0.03 0.79 0.03 0.06
UC100007 2,383 3.90 0.98 3.92 0.97 0.01 0.39 0.73 57 98 0.73 3.88 0.97 0.45 0.77 61 99 3.87 0.94 -0.03 0.81 0.04 0.08
UC100009 1,520 3.81 0.99 3.80 1.00 -0.01 0.42 0.74 58 97 0.74 3.78 1.06 0.40 0.77 56 98 3.78 1.03 -0.03 0.80 0.03 0.06
UC100010 2,400 3.84 0.98 3.82 0.96 -0.02 0.42 0.74 59 98 0.75 3.72 1.06 0.40 0.77 57 98 3.72 1.03 -0.12 0.81 0.03 0.06
UC100012 2,402 3.89 1.00 3.89 1.02 -0.01 0.43 0.77 59 98 0.77 3.89 1.06 0.44 0.78 59 98 3.88 1.03 -0.01 0.81 0.01 0.04
UC100016 2,374 3.90 0.96 3.89 0.97 -0.01 0.43 0.74 60 97 0.74 3.83 1.01 0.45 0.78 61 99 3.83 0.98 -0.07 0.81 0.04 0.07
UC100019 2,380 3.88 0.97 3.85 0.99 -0.03 0.42 0.74 59 97 0.74 3.82 1.03 0.39 0.76 56 98 3.82 0.99 -0.07 0.80 0.02 0.06
UC100030 2,399 3.62 1.03 3.61 1.04 -0.02 0.41 0.76 57 97 0.76 3.64 1.05 0.45 0.79 60 98 3.63 1.02 0.01 0.82 0.03 0.06
UC100032 2,420 3.93 0.96 3.93 0.97 0.00 0.43 0.75 60 98 0.75 3.89 0.98 0.47 0.78 62 99 3.89 0.93 -0.04 0.81 0.03 0.06
VB152145 2,427 3.85 0.97 3.84 0.96 -0.01 0.42 0.74 59 98 0.74 3.83 1.02 0.42 0.78 59 99 3.83 0.99 -0.02 0.80 0.04 0.06
VB152147 1,940 3.74 0.93 3.72 0.94 -0.02 0.47 0.76 63 98 0.76 3.69 0.97 0.46 0.77 62 99 3.69 0.92 -0.06 0.80 0.01 0.04
VB152148 2,410 3.86 0.98 3.88 0.98 0.03 0.44 0.75 60 97 0.75 3.81 0.98 0.45 0.77 60 99 3.81 0.94 -0.05 0.80 0.02 0.05
VB152149 2,423 3.72 0.98 3.72 0.97 0.00 0.43 0.75 60 97 0.75 3.69 1.02 0.44 0.78 60 99 3.68 0.98 -0.04 0.81 0.03 0.06
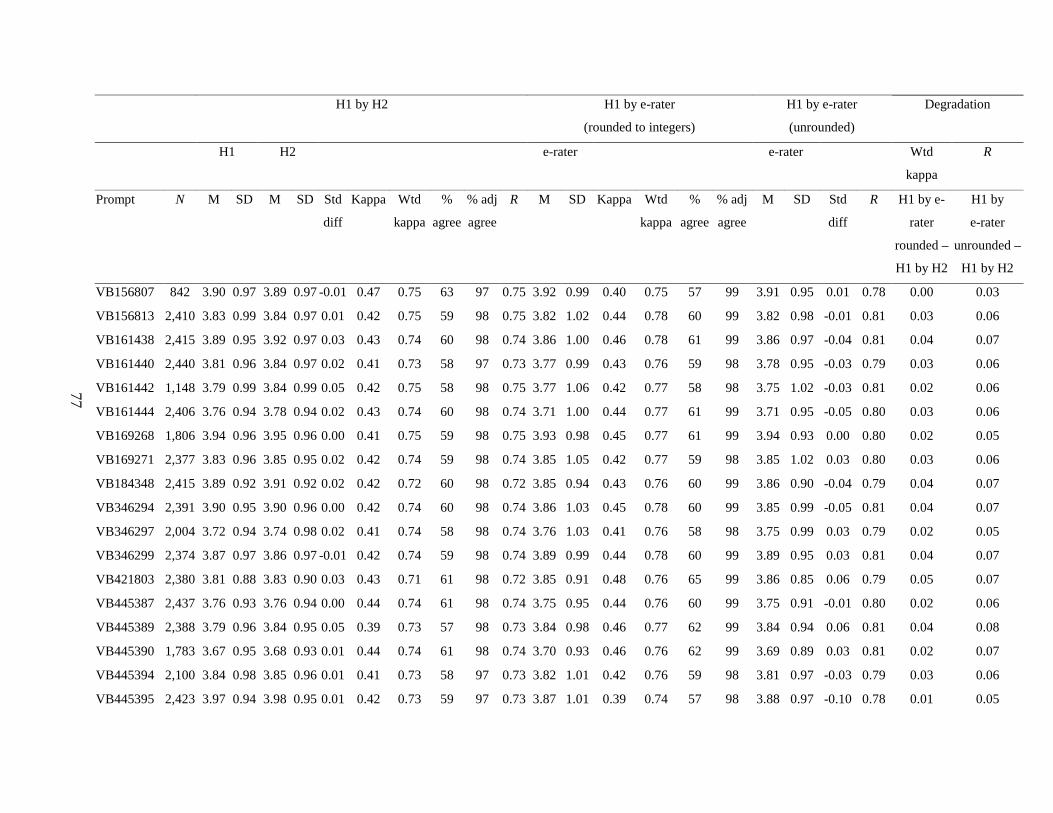
77
H1 by H2 H1 by e-rater
(rounded to integers)
H1 by e-rater
(unrounded)
Degradation
H1 H2 e-rater e-rater Wtd
kappa
R
Prompt N M SD M SD Std
diff
Kappa Wtd
kappa
%
agree
% adj
agree
R M SD Kappa Wtd
kappa
%
agree
% adj
agree
M SD Std
diff
R H1 by e-
rater
rounded –
H1 by H2
H1 by
e-rater
unrounded –
H1 by H2
VB156807 842 3.90 0.97 3.89 0.97 -0.01 0.47 0.75 63 97 0.75 3.92 0.99 0.40 0.75 57 99 3.91 0.95 0.01 0.78 0.00 0.03
VB156813 2,410 3.83 0.99 3.84 0.97 0.01 0.42 0.75 59 98 0.75 3.82 1.02 0.44 0.78 60 99 3.82 0.98 -0.01 0.81 0.03 0.06
VB161438 2,415 3.89 0.95 3.92 0.97 0.03 0.43 0.74 60 98 0.74 3.86 1.00 0.46 0.78 61 99 3.86 0.97 -0.04 0.81 0.04 0.07
VB161440 2,440 3.81 0.96 3.84 0.97 0.02 0.41 0.73 58 97 0.73 3.77 0.99 0.43 0.76 59 98 3.78 0.95 -0.03 0.79 0.03 0.06
VB161442 1,148 3.79 0.99 3.84 0.99 0.05 0.42 0.75 58 98 0.75 3.77 1.06 0.42 0.77 58 98 3.75 1.02 -0.03 0.81 0.02 0.06
VB161444 2,406 3.76 0.94 3.78 0.94 0.02 0.43 0.74 60 98 0.74 3.71 1.00 0.44 0.77 61 99 3.71 0.95 -0.05 0.80 0.03 0.06
VB169268 1,806 3.94 0.96 3.95 0.96 0.00 0.41 0.75 59 98 0.75 3.93 0.98 0.45 0.77 61 99 3.94 0.93 0.00 0.80 0.02 0.05
VB169271 2,377 3.83 0.96 3.85 0.95 0.02 0.42 0.74 59 98 0.74 3.85 1.05 0.42 0.77 59 98 3.85 1.02 0.03 0.80 0.03 0.06
VB184348 2,415 3.89 0.92 3.91 0.92 0.02 0.42 0.72 60 98 0.72 3.85 0.94 0.43 0.76 60 99 3.86 0.90 -0.04 0.79 0.04 0.07
VB346294 2,391 3.90 0.95 3.90 0.96 0.00 0.42 0.74 60 98 0.74 3.86 1.03 0.45 0.78 60 99 3.85 0.99 -0.05 0.81 0.04 0.07
VB346297 2,004 3.72 0.94 3.74 0.98 0.02 0.41 0.74 58 98 0.74 3.76 1.03 0.41 0.76 58 98 3.75 0.99 0.03 0.79 0.02 0.05
VB346299 2,374 3.87 0.97 3.86 0.97 -0.01 0.42 0.74 59 98 0.74 3.89 0.99 0.44 0.78 60 99 3.89 0.95 0.03 0.81 0.04 0.07
VB421803 2,380 3.81 0.88 3.83 0.90 0.03 0.43 0.71 61 98 0.72 3.85 0.91 0.48 0.76 65 99 3.86 0.85 0.06 0.79 0.05 0.07
VB445387 2,437 3.76 0.93 3.76 0.94 0.00 0.44 0.74 61 98 0.74 3.75 0.95 0.44 0.76 60 99 3.75 0.91 -0.01 0.80 0.02 0.06
VB445389 2,388 3.79 0.96 3.84 0.95 0.05 0.39 0.73 57 98 0.73 3.84 0.98 0.46 0.77 62 99 3.84 0.94 0.06 0.81 0.04 0.08
VB445390 1,783 3.67 0.95 3.68 0.93 0.01 0.44 0.74 61 98 0.74 3.70 0.93 0.46 0.76 62 99 3.69 0.89 0.03 0.81 0.02 0.07
VB445394 2,100 3.84 0.98 3.85 0.96 0.01 0.41 0.73 58 97 0.73 3.82 1.01 0.42 0.76 59 98 3.81 0.97 -0.03 0.79 0.03 0.06
VB445395 2,423 3.97 0.94 3.98 0.95 0.01 0.42 0.73 59 97 0.73 3.87 1.01 0.39 0.74 57 98 3.88 0.97 -0.10 0.78 0.01 0.05
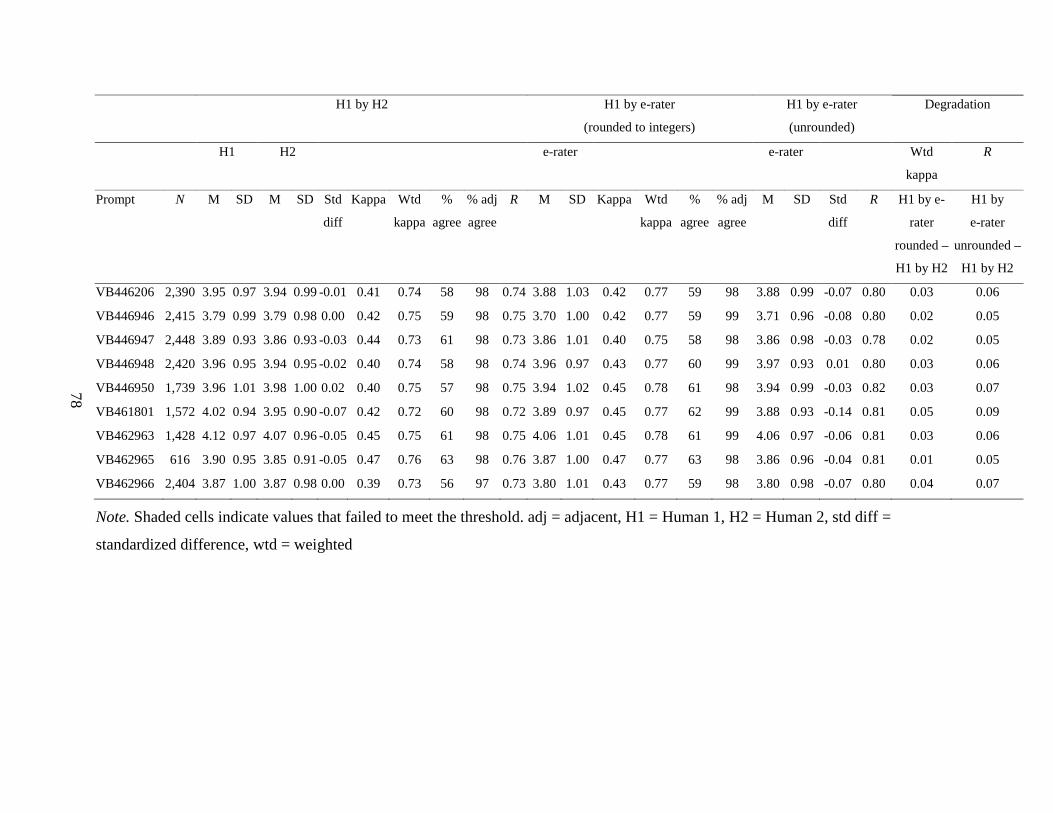
78
H1 by H2 H1 by e-rater
(rounded to integers)
H1 by e-rater
(unrounded)
Degradation
H1 H2 e-rater e-rater Wtd
kappa
R
Prompt N M SD M SD Std
diff
Kappa Wtd
kappa
%
agree
% adj
agree
R M SD Kappa Wtd
kappa
%
agree
% adj
agree
M SD Std
diff
R H1 by e-
rater
rounded –
H1 by H2
H1 by
e-rater
unrounded –
H1 by H2
VB446206 2,390 3.95 0.97 3.94 0.99 -0.01 0.41 0.74 58 98 0.74 3.88 1.03 0.42 0.77 59 98 3.88 0.99 -0.07 0.80 0.03 0.06
VB446946 2,415 3.79 0.99 3.79 0.98 0.00 0.42 0.75 59 98 0.75 3.70 1.00 0.42 0.77 59 99 3.71 0.96 -0.08 0.80 0.02 0.05
VB446947 2,448 3.89 0.93 3.86 0.93 -0.03 0.44 0.73 61 98 0.73 3.86 1.01 0.40 0.75 58 98 3.86 0.98 -0.03 0.78 0.02 0.05
VB446948 2,420 3.96 0.95 3.94 0.95 -0.02 0.40 0.74 58 98 0.74 3.96 0.97 0.43 0.77 60 99 3.97 0.93 0.01 0.80 0.03 0.06
VB446950 1,739 3.96 1.01 3.98 1.00 0.02 0.40 0.75 57 98 0.75 3.94 1.02 0.45 0.78 61 98 3.94 0.99 -0.03 0.82 0.03 0.07
VB461801 1,572 4.02 0.94 3.95 0.90 -0.07 0.42 0.72 60 98 0.72 3.89 0.97 0.45 0.77 62 99 3.88 0.93 -0.14 0.81 0.05 0.09
VB462963 1,428 4.12 0.97 4.07 0.96 -0.05 0.45 0.75 61 98 0.75 4.06 1.01 0.45 0.78 61 99 4.06 0.97 -0.06 0.81 0.03 0.06
VB462965 616 3.90 0.95 3.85 0.91 -0.05 0.47 0.76 63 98 0.76 3.87 1.00 0.47 0.77 63 98 3.86 0.96 -0.04 0.81 0.01 0.05
VB462966 2,404 3.87 1.00 3.87 0.98 0.00 0.39 0.73 56 97 0.73 3.80 1.01 0.43 0.77 59 98 3.80 0.98 -0.07 0.80 0.04 0.07
Note. Shaded cells indicate values that failed to meet the threshold. adj = adjacent, H1 = Human 1, H2 = Human 2, std diff =
standardized difference, wtd = weighted
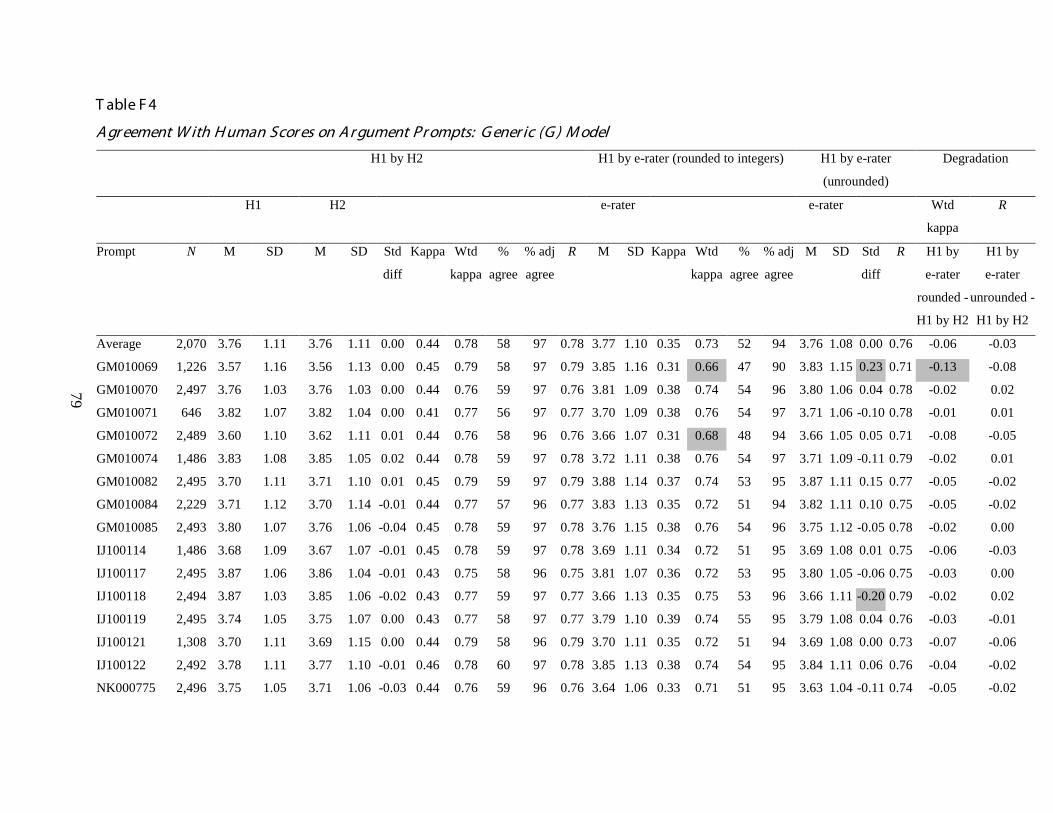
79
T able F 4
A gr eement W ith H uman Scor es on A r gument Pr ompts: G ener ic (G ) M odel
H1 by H2 H1 by e-rater (rounded to integers) H1 by e-rater
(unrounded)
Degradation
H1 H2 e-rater e-rater Wtd
kappa
R
Prompt N M SD M SD Std
diff
Kappa Wtd
kappa
%
agree
% adj
agree
R M SD Kappa Wtd
kappa
%
agree
% adj
agree
M SD Std
diff
R H1 by
e-rater
rounded -
H1 by H2
H1 by
e-rater
unrounded -
H1 by H2
Average 2,070 3.76 1.11 3.76 1.11 0.00 0.44 0.78 58 97 0.78 3.77 1.10 0.35 0.73 52 94 3.76 1.08 0.00 0.76 -0.06 -0.03
GM010069 1,226 3.57 1.16 3.56 1.13 0.00 0.45 0.79 58 97 0.79 3.85 1.16 0.31 0.66 47 90 3.83 1.15 0.23 0.71 -0.13 -0.08
GM010070 2,497 3.76 1.03 3.76 1.03 0.00 0.44 0.76 59 97 0.76 3.81 1.09 0.38 0.74 54 96 3.80 1.06 0.04 0.78 -0.02 0.02
GM010071 646 3.82 1.07 3.82 1.04 0.00 0.41 0.77 56 97 0.77 3.70 1.09 0.38 0.76 54 97 3.71 1.06 -0.10 0.78 -0.01 0.01
GM010072 2,489 3.60 1.10 3.62 1.11 0.01 0.44 0.76 58 96 0.76 3.66 1.07 0.31 0.68 48 94 3.66 1.05 0.05 0.71 -0.08 -0.05
GM010074 1,486 3.83 1.08 3.85 1.05 0.02 0.44 0.78 59 97 0.78 3.72 1.11 0.38 0.76 54 97 3.71 1.09 -0.11 0.79 -0.02 0.01
GM010082 2,495 3.70 1.11 3.71 1.10 0.01 0.45 0.79 59 97 0.79 3.88 1.14 0.37 0.74 53 95 3.87 1.11 0.15 0.77 -0.05 -0.02
GM010084 2,229 3.71 1.12 3.70 1.14 -0.01 0.44 0.77 57 96 0.77 3.83 1.13 0.35 0.72 51 94 3.82 1.11 0.10 0.75 -0.05 -0.02
GM010085 2,493 3.80 1.07 3.76 1.06 -0.04 0.45 0.78 59 97 0.78 3.76 1.15 0.38 0.76 54 96 3.75 1.12 -0.05 0.78 -0.02 0.00
IJ100114 1,486 3.68 1.09 3.67 1.07 -0.01 0.45 0.78 59 97 0.78 3.69 1.11 0.34 0.72 51 95 3.69 1.08 0.01 0.75 -0.06 -0.03
IJ100117 2,495 3.87 1.06 3.86 1.04 -0.01 0.43 0.75 58 96 0.75 3.81 1.07 0.36 0.72 53 95 3.80 1.05 -0.06 0.75 -0.03 0.00
IJ100118 2,494 3.87 1.03 3.85 1.06 -0.02 0.43 0.77 59 97 0.77 3.66 1.13 0.35 0.75 53 96 3.66 1.11 -0.20 0.79 -0.02 0.02
IJ100119 2,495 3.74 1.05 3.75 1.07 0.00 0.43 0.77 58 97 0.77 3.79 1.10 0.39 0.74 55 95 3.79 1.08 0.04 0.76 -0.03 -0.01
IJ100121 1,308 3.70 1.11 3.69 1.15 0.00 0.44 0.79 58 96 0.79 3.70 1.11 0.35 0.72 51 94 3.69 1.08 0.00 0.73 -0.07 -0.06
IJ100122 2,492 3.78 1.11 3.77 1.10 -0.01 0.46 0.78 60 97 0.78 3.85 1.13 0.38 0.74 54 95 3.84 1.11 0.06 0.76 -0.04 -0.02
NK000775 2,496 3.75 1.05 3.71 1.06 -0.03 0.44 0.76 59 96 0.76 3.64 1.06 0.33 0.71 51 95 3.63 1.04 -0.11 0.74 -0.05 -0.02
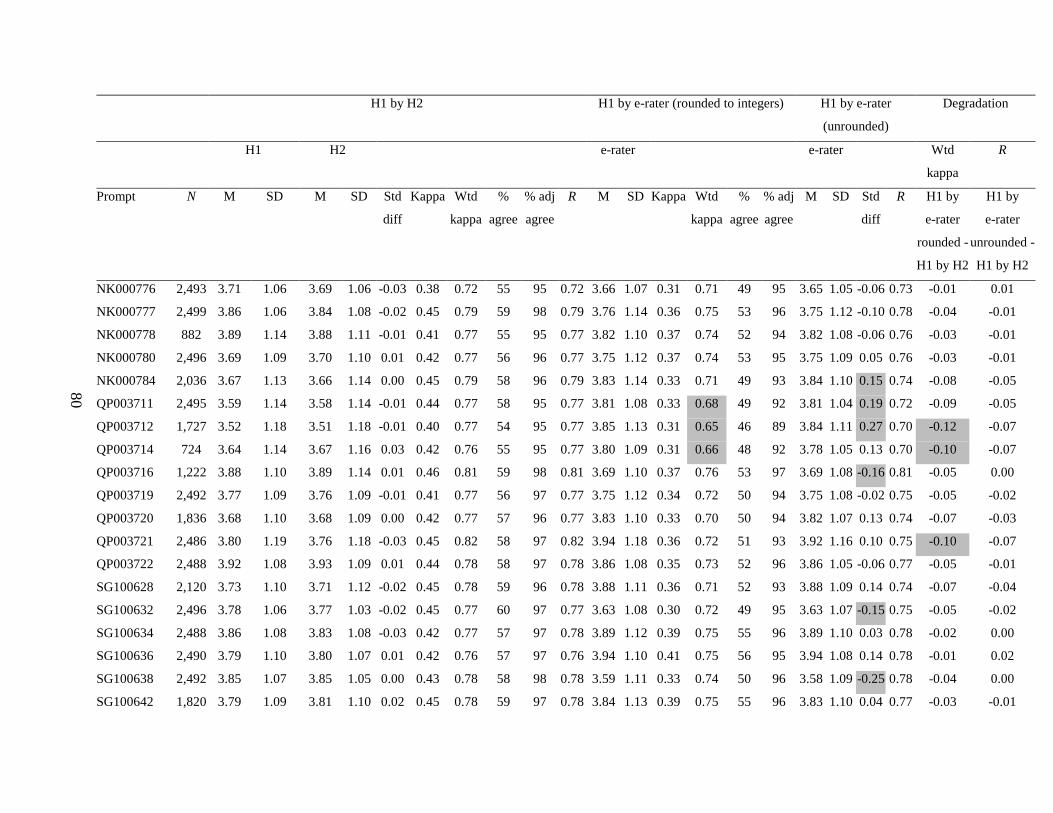
80
H1 by H2 H1 by e-rater (rounded to integers) H1 by e-rater
(unrounded)
Degradation
H1 H2 e-rater e-rater Wtd
kappa
R
Prompt N M SD M SD Std
diff
Kappa Wtd
kappa
%
agree
% adj
agree
R M SD Kappa Wtd
kappa
%
agree
% adj
agree
M SD Std
diff
R H1 by
e-rater
rounded -
H1 by H2
H1 by
e-rater
unrounded -
H1 by H2
NK000776 2,493 3.71 1.06 3.69 1.06 -0.03 0.38 0.72 55 95 0.72 3.66 1.07 0.31 0.71 49 95 3.65 1.05 -0.06 0.73 -0.01 0.01
NK000777 2,499 3.86 1.06 3.84 1.08 -0.02 0.45 0.79 59 98 0.79 3.76 1.14 0.36 0.75 53 96 3.75 1.12 -0.10 0.78 -0.04 -0.01
NK000778 882 3.89 1.14 3.88 1.11 -0.01 0.41 0.77 55 95 0.77 3.82 1.10 0.37 0.74 52 94 3.82 1.08 -0.06 0.76 -0.03 -0.01
NK000780 2,496 3.69 1.09 3.70 1.10 0.01 0.42 0.77 56 96 0.77 3.75 1.12 0.37 0.74 53 95 3.75 1.09 0.05 0.76 -0.03 -0.01
NK000784 2,036 3.67 1.13 3.66 1.14 0.00 0.45 0.79 58 96 0.79 3.83 1.14 0.33 0.71 49 93 3.84 1.10 0.15 0.74 -0.08 -0.05
QP003711 2,495 3.59 1.14 3.58 1.14 -0.01 0.44 0.77 58 95 0.77 3.81 1.08 0.33 0.68 49 92 3.81 1.04 0.19 0.72 -0.09 -0.05
QP003712 1,727 3.52 1.18 3.51 1.18 -0.01 0.40 0.77 54 95 0.77 3.85 1.13 0.31 0.65 46 89 3.84 1.11 0.27 0.70 -0.12 -0.07
QP003714 724 3.64 1.14 3.67 1.16 0.03 0.42 0.76 55 95 0.77 3.80 1.09 0.31 0.66 48 92 3.78 1.05 0.13 0.70 -0.10 -0.07
QP003716 1,222 3.88 1.10 3.89 1.14 0.01 0.46 0.81 59 98 0.81 3.69 1.10 0.37 0.76 53 97 3.69 1.08 -0.16 0.81 -0.05 0.00
QP003719 2,492 3.77 1.09 3.76 1.09 -0.01 0.41 0.77 56 97 0.77 3.75 1.12 0.34 0.72 50 94 3.75 1.08 -0.02 0.75 -0.05 -0.02
QP003720 1,836 3.68 1.10 3.68 1.09 0.00 0.42 0.77 57 96 0.77 3.83 1.10 0.33 0.70 50 94 3.82 1.07 0.13 0.74 -0.07 -0.03
QP003721 2,486 3.80 1.19 3.76 1.18 -0.03 0.45 0.82 58 97 0.82 3.94 1.18 0.36 0.72 51 93 3.92 1.16 0.10 0.75 -0.10 -0.07
QP003722 2,488 3.92 1.08 3.93 1.09 0.01 0.44 0.78 58 97 0.78 3.86 1.08 0.35 0.73 52 96 3.86 1.05 -0.06 0.77 -0.05 -0.01
SG100628 2,120 3.73 1.10 3.71 1.12 -0.02 0.45 0.78 59 96 0.78 3.88 1.11 0.36 0.71 52 93 3.88 1.09 0.14 0.74 -0.07 -0.04
SG100632 2,496 3.78 1.06 3.77 1.03 -0.02 0.45 0.77 60 97 0.77 3.63 1.08 0.30 0.72 49 95 3.63 1.07 -0.15 0.75 -0.05 -0.02
SG100634 2,488 3.86 1.08 3.83 1.08 -0.03 0.42 0.77 57 97 0.78 3.89 1.12 0.39 0.75 55 96 3.89 1.10 0.03 0.78 -0.02 0.00
SG100636 2,490 3.79 1.10 3.80 1.07 0.01 0.42 0.76 57 97 0.76 3.94 1.10 0.41 0.75 56 95 3.94 1.08 0.14 0.78 -0.01 0.02
SG100638 2,492 3.85 1.07 3.85 1.05 0.00 0.43 0.78 58 98 0.78 3.59 1.11 0.33 0.74 50 96 3.58 1.09 -0.25 0.78 -0.04 0.00
SG100642 1,820 3.79 1.09 3.81 1.10 0.02 0.45 0.78 59 97 0.78 3.84 1.13 0.39 0.75 55 96 3.83 1.10 0.04 0.77 -0.03 -0.01
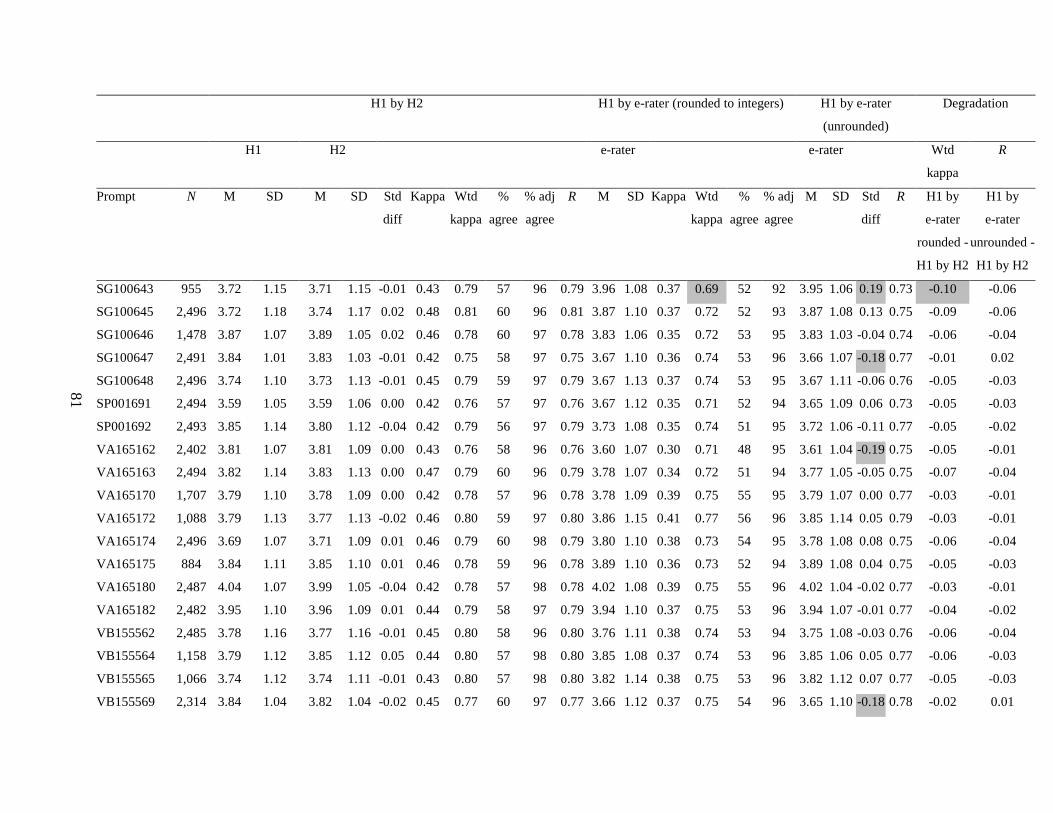
81
H1 by H2 H1 by e-rater (rounded to integers) H1 by e-rater
(unrounded)
Degradation
H1 H2 e-rater e-rater Wtd
kappa
R
Prompt N M SD M SD Std
diff
Kappa Wtd
kappa
%
agree
% adj
agree
R M SD Kappa Wtd
kappa
%
agree
% adj
agree
M SD Std
diff
R H1 by
e-rater
rounded -
H1 by H2
H1 by
e-rater
unrounded -
H1 by H2
SG100643 955 3.72 1.15 3.71 1.15 -0.01 0.43 0.79 57 96 0.79 3.96 1.08 0.37 0.69 52 92 3.95 1.06 0.19 0.73 -0.10 -0.06
SG100645 2,496 3.72 1.18 3.74 1.17 0.02 0.48 0.81 60 96 0.81 3.87 1.10 0.37 0.72 52 93 3.87 1.08 0.13 0.75 -0.09 -0.06
SG100646 1,478 3.87 1.07 3.89 1.05 0.02 0.46 0.78 60 97 0.78 3.83 1.06 0.35 0.72 53 95 3.83 1.03 -0.04 0.74 -0.06 -0.04
SG100647 2,491 3.84 1.01 3.83 1.03 -0.01 0.42 0.75 58 97 0.75 3.67 1.10 0.36 0.74 53 96 3.66 1.07 -0.18 0.77 -0.01 0.02
SG100648 2,496 3.74 1.10 3.73 1.13 -0.01 0.45 0.79 59 97 0.79 3.67 1.13 0.37 0.74 53 95 3.67 1.11 -0.06 0.76 -0.05 -0.03
SP001691 2,494 3.59 1.05 3.59 1.06 0.00 0.42 0.76 57 97 0.76 3.67 1.12 0.35 0.71 52 94 3.65 1.09 0.06 0.73 -0.05 -0.03
SP001692 2,493 3.85 1.14 3.80 1.12 -0.04 0.42 0.79 56 97 0.79 3.73 1.08 0.35 0.74 51 95 3.72 1.06 -0.11 0.77 -0.05 -0.02
VA165162 2,402 3.81 1.07 3.81 1.09 0.00 0.43 0.76 58 96 0.76 3.60 1.07 0.30 0.71 48 95 3.61 1.04 -0.19 0.75 -0.05 -0.01
VA165163 2,494 3.82 1.14 3.83 1.13 0.00 0.47 0.79 60 96 0.79 3.78 1.07 0.34 0.72 51 94 3.77 1.05 -0.05 0.75 -0.07 -0.04
VA165170 1,707 3.79 1.10 3.78 1.09 0.00 0.42 0.78 57 96 0.78 3.78 1.09 0.39 0.75 55 95 3.79 1.07 0.00 0.77 -0.03 -0.01
VA165172 1,088 3.79 1.13 3.77 1.13 -0.02 0.46 0.80 59 97 0.80 3.86 1.15 0.41 0.77 56 96 3.85 1.14 0.05 0.79 -0.03 -0.01
VA165174 2,496 3.69 1.07 3.71 1.09 0.01 0.46 0.79 60 98 0.79 3.80 1.10 0.38 0.73 54 95 3.78 1.08 0.08 0.75 -0.06 -0.04
VA165175 884 3.84 1.11 3.85 1.10 0.01 0.46 0.78 59 96 0.78 3.89 1.10 0.36 0.73 52 94 3.89 1.08 0.04 0.75 -0.05 -0.03
VA165180 2,487 4.04 1.07 3.99 1.05 -0.04 0.42 0.78 57 98 0.78 4.02 1.08 0.39 0.75 55 96 4.02 1.04 -0.02 0.77 -0.03 -0.01
VA165182 2,482 3.95 1.10 3.96 1.09 0.01 0.44 0.79 58 97 0.79 3.94 1.10 0.37 0.75 53 96 3.94 1.07 -0.01 0.77 -0.04 -0.02
VB155562 2,485 3.78 1.16 3.77 1.16 -0.01 0.45 0.80 58 96 0.80 3.76 1.11 0.38 0.74 53 94 3.75 1.08 -0.03 0.76 -0.06 -0.04
VB155564 1,158 3.79 1.12 3.85 1.12 0.05 0.44 0.80 57 98 0.80 3.85 1.08 0.37 0.74 53 96 3.85 1.06 0.05 0.77 -0.06 -0.03
VB155565 1,066 3.74 1.12 3.74 1.11 -0.01 0.43 0.80 57 98 0.80 3.82 1.14 0.38 0.75 53 96 3.82 1.12 0.07 0.77 -0.05 -0.03
VB155569 2,314 3.84 1.04 3.82 1.04 -0.02 0.45 0.77 60 97 0.77 3.66 1.12 0.37 0.75 54 96 3.65 1.10 -0.18 0.78 -0.02 0.01
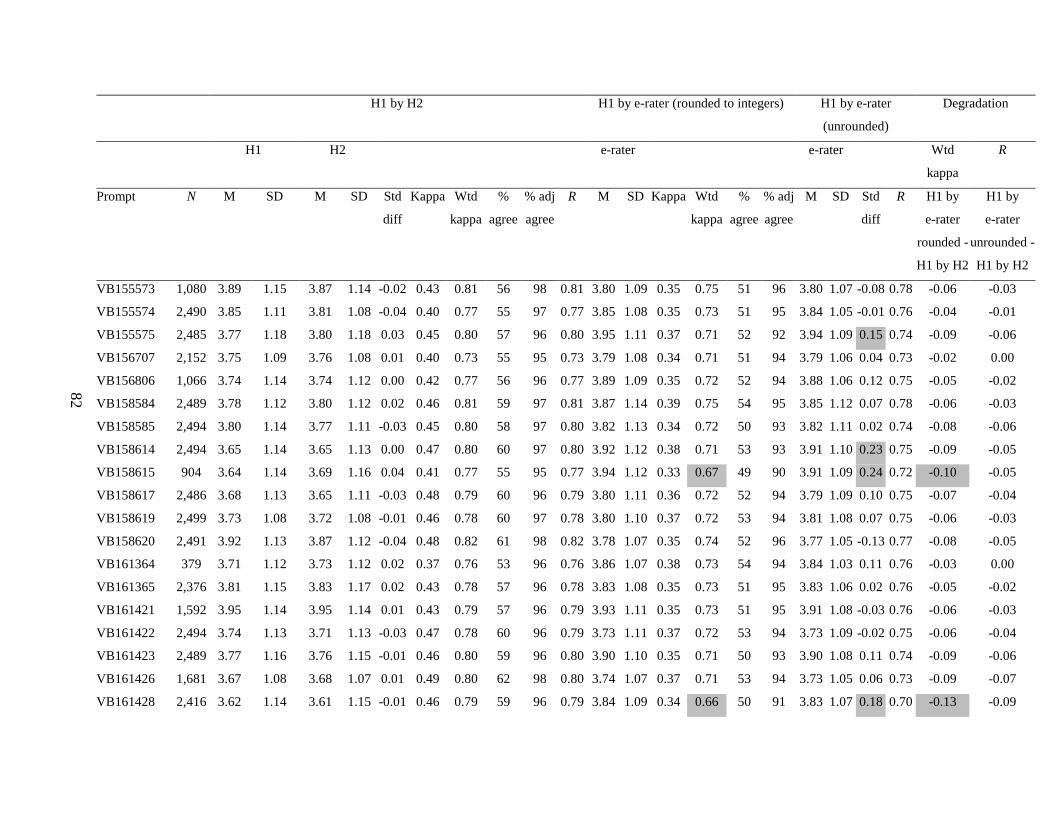
82
H1 by H2 H1 by e-rater (rounded to integers) H1 by e-rater
(unrounded)
Degradation
H1 H2 e-rater e-rater Wtd
kappa
R
Prompt N M SD M SD Std
diff
Kappa Wtd
kappa
%
agree
% adj
agree
R M SD Kappa Wtd
kappa
%
agree
% adj
agree
M SD Std
diff
R H1 by
e-rater
rounded -
H1 by H2
H1 by
e-rater
unrounded -
H1 by H2
VB155573 1,080 3.89 1.15 3.87 1.14 -0.02 0.43 0.81 56 98 0.81 3.80 1.09 0.35 0.75 51 96 3.80 1.07 -0.08 0.78 -0.06 -0.03
VB155574 2,490 3.85 1.11 3.81 1.08 -0.04 0.40 0.77 55 97 0.77 3.85 1.08 0.35 0.73 51 95 3.84 1.05 -0.01 0.76 -0.04 -0.01
VB155575 2,485 3.77 1.18 3.80 1.18 0.03 0.45 0.80 57 96 0.80 3.95 1.11 0.37 0.71 52 92 3.94 1.09 0.15 0.74 -0.09 -0.06
VB156707 2,152 3.75 1.09 3.76 1.08 0.01 0.40 0.73 55 95 0.73 3.79 1.08 0.34 0.71 51 94 3.79 1.06 0.04 0.73 -0.02 0.00
VB156806 1,066 3.74 1.14 3.74 1.12 0.00 0.42 0.77 56 96 0.77 3.89 1.09 0.35 0.72 52 94 3.88 1.06 0.12 0.75 -0.05 -0.02
VB158584 2,489 3.78 1.12 3.80 1.12 0.02 0.46 0.81 59 97 0.81 3.87 1.14 0.39 0.75 54 95 3.85 1.12 0.07 0.78 -0.06 -0.03
VB158585 2,494 3.80 1.14 3.77 1.11 -0.03 0.45 0.80 58 97 0.80 3.82 1.13 0.34 0.72 50 93 3.82 1.11 0.02 0.74 -0.08 -0.06
VB158614 2,494 3.65 1.14 3.65 1.13 0.00 0.47 0.80 60 97 0.80 3.92 1.12 0.38 0.71 53 93 3.91 1.10 0.23 0.75 -0.09 -0.05
VB158615 904 3.64 1.14 3.69 1.16 0.04 0.41 0.77 55 95 0.77 3.94 1.12 0.33 0.67 49 90 3.91 1.09 0.24 0.72 -0.10 -0.05
VB158617 2,486 3.68 1.13 3.65 1.11 -0.03 0.48 0.79 60 96 0.79 3.80 1.11 0.36 0.72 52 94 3.79 1.09 0.10 0.75 -0.07 -0.04
VB158619 2,499 3.73 1.08 3.72 1.08 -0.01 0.46 0.78 60 97 0.78 3.80 1.10 0.37 0.72 53 94 3.81 1.08 0.07 0.75 -0.06 -0.03
VB158620 2,491 3.92 1.13 3.87 1.12 -0.04 0.48 0.82 61 98 0.82 3.78 1.07 0.35 0.74 52 96 3.77 1.05 -0.13 0.77 -0.08 -0.05
VB161364 379 3.71 1.12 3.73 1.12 0.02 0.37 0.76 53 96 0.76 3.86 1.07 0.38 0.73 54 94 3.84 1.03 0.11 0.76 -0.03 0.00
VB161365 2,376 3.81 1.15 3.83 1.17 0.02 0.43 0.78 57 96 0.78 3.83 1.08 0.35 0.73 51 95 3.83 1.06 0.02 0.76 -0.05 -0.02
VB161421 1,592 3.95 1.14 3.95 1.14 0.01 0.43 0.79 57 96 0.79 3.93 1.11 0.35 0.73 51 95 3.91 1.08 -0.03 0.76 -0.06 -0.03
VB161422 2,494 3.74 1.13 3.71 1.13 -0.03 0.47 0.78 60 96 0.79 3.73 1.11 0.37 0.72 53 94 3.73 1.09 -0.02 0.75 -0.06 -0.04
VB161423 2,489 3.77 1.16 3.76 1.15 -0.01 0.46 0.80 59 96 0.80 3.90 1.10 0.35 0.71 50 93 3.90 1.08 0.11 0.74 -0.09 -0.06
VB161426 1,681 3.67 1.08 3.68 1.07 0.01 0.49 0.80 62 98 0.80 3.74 1.07 0.37 0.71 53 94 3.73 1.05 0.06 0.73 -0.09 -0.07
VB161428 2,416 3.62 1.14 3.61 1.15 -0.01 0.46 0.79 59 96 0.79 3.84 1.09 0.34 0.66 50 91 3.83 1.07 0.18 0.70 -0.13 -0.09
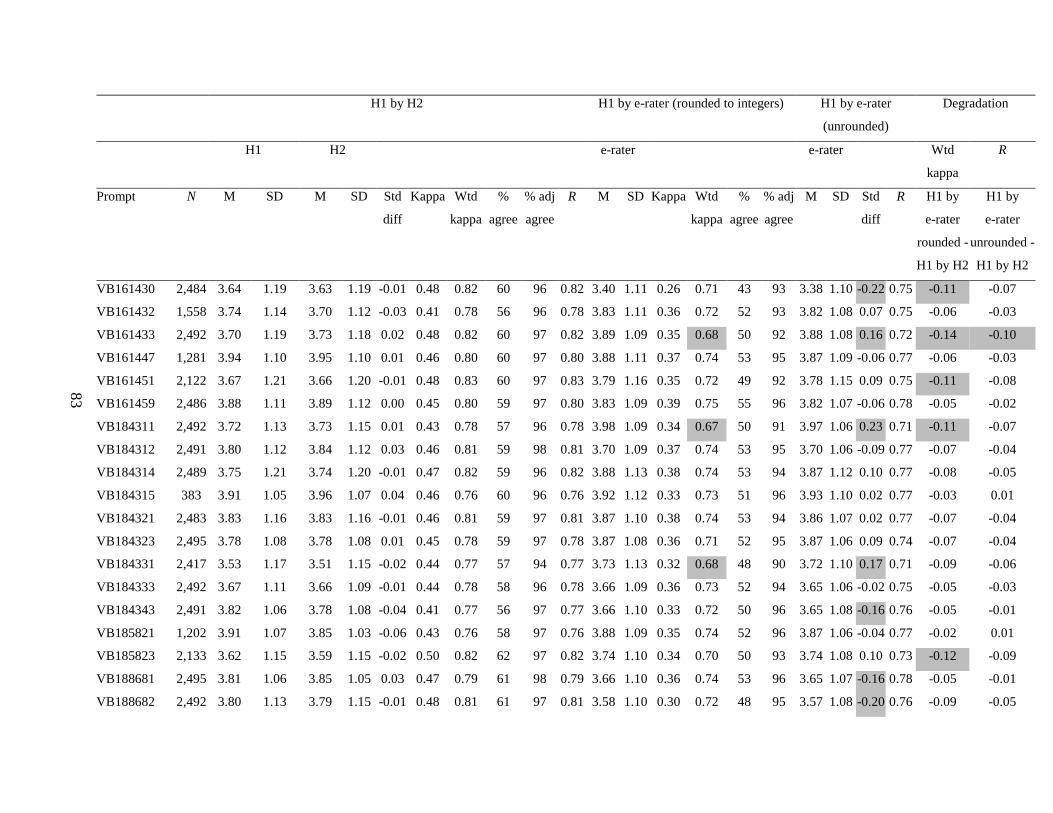
83
H1 by H2 H1 by e-rater (rounded to integers) H1 by e-rater
(unrounded)
Degradation
H1 H2 e-rater e-rater Wtd
kappa
R
Prompt N M SD M SD Std
diff
Kappa Wtd
kappa
%
agree
% adj
agree
R M SD Kappa Wtd
kappa
%
agree
% adj
agree
M SD Std
diff
R H1 by
e-rater
rounded -
H1 by H2
H1 by
e-rater
unrounded -
H1 by H2
VB161430 2,484 3.64 1.19 3.63 1.19 -0.01 0.48 0.82 60 96 0.82 3.40 1.11 0.26 0.71 43 93 3.38 1.10 -0.22 0.75 -0.11 -0.07
VB161432 1,558 3.74 1.14 3.70 1.12 -0.03 0.41 0.78 56 96 0.78 3.83 1.11 0.36 0.72 52 93 3.82 1.08 0.07 0.75 -0.06 -0.03
VB161433 2,492 3.70 1.19 3.73 1.18 0.02 0.48 0.82 60 97 0.82 3.89 1.09 0.35 0.68 50 92 3.88 1.08 0.16 0.72 -0.14 -0.10
VB161447 1,281 3.94 1.10 3.95 1.10 0.01 0.46 0.80 60 97 0.80 3.88 1.11 0.37 0.74 53 95 3.87 1.09 -0.06 0.77 -0.06 -0.03
VB161451 2,122 3.67 1.21 3.66 1.20 -0.01 0.48 0.83 60 97 0.83 3.79 1.16 0.35 0.72 49 92 3.78 1.15 0.09 0.75 -0.11 -0.08
VB161459 2,486 3.88 1.11 3.89 1.12 0.00 0.45 0.80 59 97 0.80 3.83 1.09 0.39 0.75 55 96 3.82 1.07 -0.06 0.78 -0.05 -0.02
VB184311 2,492 3.72 1.13 3.73 1.15 0.01 0.43 0.78 57 96 0.78 3.98 1.09 0.34 0.67 50 91 3.97 1.06 0.23 0.71 -0.11 -0.07
VB184312 2,491 3.80 1.12 3.84 1.12 0.03 0.46 0.81 59 98 0.81 3.70 1.09 0.37 0.74 53 95 3.70 1.06 -0.09 0.77 -0.07 -0.04
VB184314 2,489 3.75 1.21 3.74 1.20 -0.01 0.47 0.82 59 96 0.82 3.88 1.13 0.38 0.74 53 94 3.87 1.12 0.10 0.77 -0.08 -0.05
VB184315 383 3.91 1.05 3.96 1.07 0.04 0.46 0.76 60 96 0.76 3.92 1.12 0.33 0.73 51 96 3.93 1.10 0.02 0.77 -0.03 0.01
VB184321 2,483 3.83 1.16 3.83 1.16 -0.01 0.46 0.81 59 97 0.81 3.87 1.10 0.38 0.74 53 94 3.86 1.07 0.02 0.77 -0.07 -0.04
VB184323 2,495 3.78 1.08 3.78 1.08 0.01 0.45 0.78 59 97 0.78 3.87 1.08 0.36 0.71 52 95 3.87 1.06 0.09 0.74 -0.07 -0.04
VB184331 2,417 3.53 1.17 3.51 1.15 -0.02 0.44 0.77 57 94 0.77 3.73 1.13 0.32 0.68 48 90 3.72 1.10 0.17 0.71 -0.09 -0.06
VB184333 2,492 3.67 1.11 3.66 1.09 -0.01 0.44 0.78 58 96 0.78 3.66 1.09 0.36 0.73 52 94 3.65 1.06 -0.02 0.75 -0.05 -0.03
VB184343 2,491 3.82 1.06 3.78 1.08 -0.04 0.41 0.77 56 97 0.77 3.66 1.10 0.33 0.72 50 96 3.65 1.08 -0.16 0.76 -0.05 -0.01
VB185821 1,202 3.91 1.07 3.85 1.03 -0.06 0.43 0.76 58 97 0.76 3.88 1.09 0.35 0.74 52 96 3.87 1.06 -0.04 0.77 -0.02 0.01
VB185823 2,133 3.62 1.15 3.59 1.15 -0.02 0.50 0.82 62 97 0.82 3.74 1.10 0.34 0.70 50 93 3.74 1.08 0.10 0.73 -0.12 -0.09
VB188681 2,495 3.81 1.06 3.85 1.05 0.03 0.47 0.79 61 98 0.79 3.66 1.10 0.36 0.74 53 96 3.65 1.07 -0.16 0.78 -0.05 -0.01
VB188682 2,492 3.80 1.13 3.79 1.15 -0.01 0.48 0.81 61 97 0.81 3.58 1.10 0.30 0.72 48 95 3.57 1.08 -0.20 0.76 -0.09 -0.05
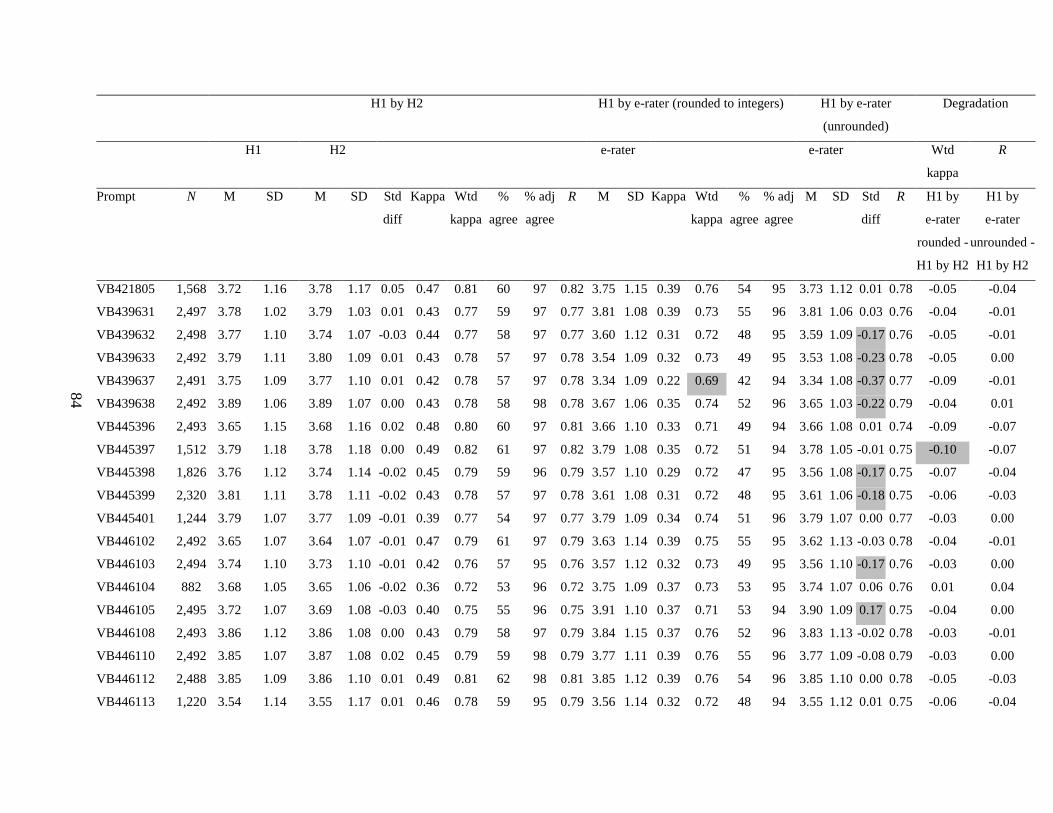
84
H1 by H2 H1 by e-rater (rounded to integers) H1 by e-rater
(unrounded)
Degradation
H1 H2 e-rater e-rater Wtd
kappa
R
Prompt N M SD M SD Std
diff
Kappa Wtd
kappa
%
agree
% adj
agree
R M SD Kappa Wtd
kappa
%
agree
% adj
agree
M SD Std
diff
R H1 by
e-rater
rounded -
H1 by H2
H1 by
e-rater
unrounded -
H1 by H2
VB421805 1,568 3.72 1.16 3.78 1.17 0.05 0.47 0.81 60 97 0.82 3.75 1.15 0.39 0.76 54 95 3.73 1.12 0.01 0.78 -0.05 -0.04
VB439631 2,497 3.78 1.02 3.79 1.03 0.01 0.43 0.77 59 97 0.77 3.81 1.08 0.39 0.73 55 96 3.81 1.06 0.03 0.76 -0.04 -0.01
VB439632 2,498 3.77 1.10 3.74 1.07 -0.03 0.44 0.77 58 97 0.77 3.60 1.12 0.31 0.72 48 95 3.59 1.09 -0.17 0.76 -0.05 -0.01
VB439633 2,492 3.79 1.11 3.80 1.09 0.01 0.43 0.78 57 97 0.78 3.54 1.09 0.32 0.73 49 95 3.53 1.08 -0.23 0.78 -0.05 0.00
VB439637 2,491 3.75 1.09 3.77 1.10 0.01 0.42 0.78 57 97 0.78 3.34 1.09 0.22 0.69 42 94 3.34 1.08 -0.37 0.77 -0.09 -0.01
VB439638 2,492 3.89 1.06 3.89 1.07 0.00 0.43 0.78 58 98 0.78 3.67 1.06 0.35 0.74 52 96 3.65 1.03 -0.22 0.79 -0.04 0.01
VB445396 2,493 3.65 1.15 3.68 1.16 0.02 0.48 0.80 60 97 0.81 3.66 1.10 0.33 0.71 49 94 3.66 1.08 0.01 0.74 -0.09 -0.07
VB445397 1,512 3.79 1.18 3.78 1.18 0.00 0.49 0.82 61 97 0.82 3.79 1.08 0.35 0.72 51 94 3.78 1.05 -0.01 0.75 -0.10 -0.07
VB445398 1,826 3.76 1.12 3.74 1.14 -0.02 0.45 0.79 59 96 0.79 3.57 1.10 0.29 0.72 47 95 3.56 1.08 -0.17 0.75 -0.07 -0.04
VB445399 2,320 3.81 1.11 3.78 1.11 -0.02 0.43 0.78 57 97 0.78 3.61 1.08 0.31 0.72 48 95 3.61 1.06 -0.18 0.75 -0.06 -0.03
VB445401 1,244 3.79 1.07 3.77 1.09 -0.01 0.39 0.77 54 97 0.77 3.79 1.09 0.34 0.74 51 96 3.79 1.07 0.00 0.77 -0.03 0.00
VB446102 2,492 3.65 1.07 3.64 1.07 -0.01 0.47 0.79 61 97 0.79 3.63 1.14 0.39 0.75 55 95 3.62 1.13 -0.03 0.78 -0.04 -0.01
VB446103 2,494 3.74 1.10 3.73 1.10 -0.01 0.42 0.76 57 95 0.76 3.57 1.12 0.32 0.73 49 95 3.56 1.10 -0.17 0.76 -0.03 0.00
VB446104 882 3.68 1.05 3.65 1.06 -0.02 0.36 0.72 53 96 0.72 3.75 1.09 0.37 0.73 53 95 3.74 1.07 0.06 0.76 0.01 0.04
VB446105 2,495 3.72 1.07 3.69 1.08 -0.03 0.40 0.75 55 96 0.75 3.91 1.10 0.37 0.71 53 94 3.90 1.09 0.17 0.75 -0.04 0.00
VB446108 2,493 3.86 1.12 3.86 1.08 0.00 0.43 0.79 58 97 0.79 3.84 1.15 0.37 0.76 52 96 3.83 1.13 -0.02 0.78 -0.03 -0.01
VB446110 2,492 3.85 1.07 3.87 1.08 0.02 0.45 0.79 59 98 0.79 3.77 1.11 0.39 0.76 55 96 3.77 1.09 -0.08 0.79 -0.03 0.00
VB446112 2,488 3.85 1.09 3.86 1.10 0.01 0.49 0.81 62 98 0.81 3.85 1.12 0.39 0.76 54 96 3.85 1.10 0.00 0.78 -0.05 -0.03
VB446113 1,220 3.54 1.14 3.55 1.17 0.01 0.46 0.78 59 95 0.79 3.56 1.14 0.32 0.72 48 94 3.55 1.12 0.01 0.75 -0.06 -0.04
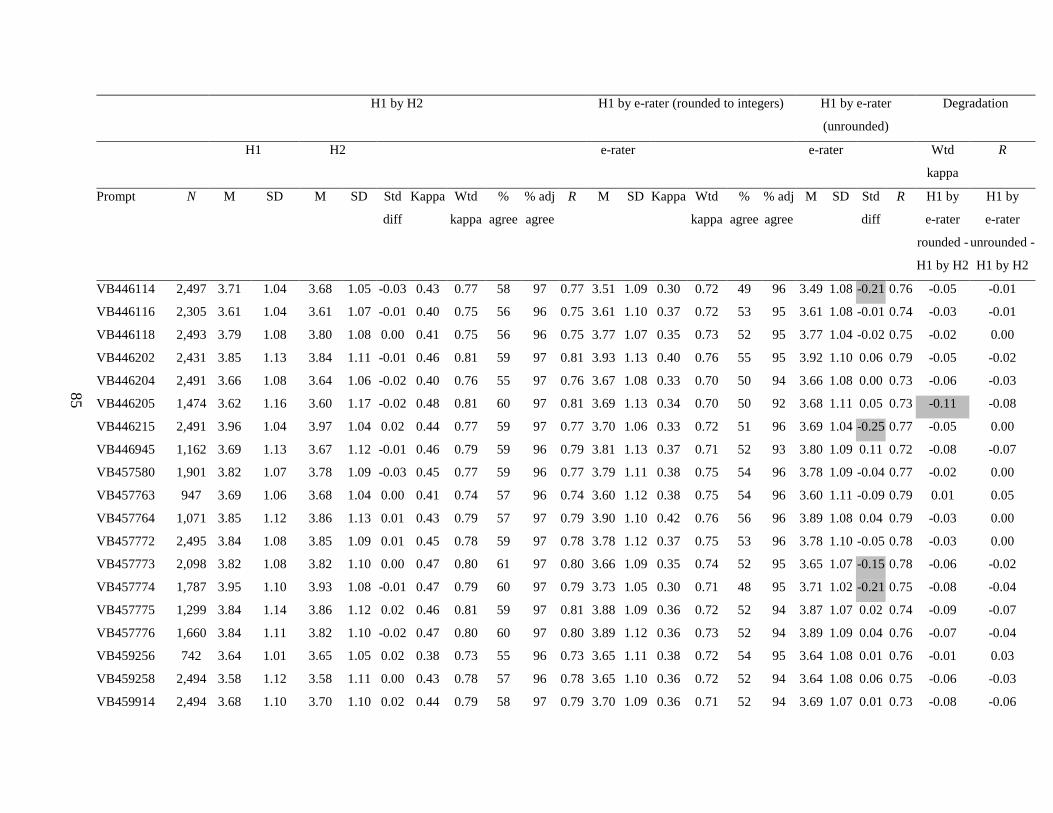
85
H1 by H2 H1 by e-rater (rounded to integers) H1 by e-rater
(unrounded)
Degradation
H1 H2 e-rater e-rater Wtd
kappa
R
Prompt N M SD M SD Std
diff
Kappa Wtd
kappa
%
agree
% adj
agree
R M SD Kappa Wtd
kappa
%
agree
% adj
agree
M SD Std
diff
R H1 by
e-rater
rounded -
H1 by H2
H1 by
e-rater
unrounded -
H1 by H2
VB446114 2,497 3.71 1.04 3.68 1.05 -0.03 0.43 0.77 58 97 0.77 3.51 1.09 0.30 0.72 49 96 3.49 1.08 -0.21 0.76 -0.05 -0.01
VB446116 2,305 3.61 1.04 3.61 1.07 -0.01 0.40 0.75 56 96 0.75 3.61 1.10 0.37 0.72 53 95 3.61 1.08 -0.01 0.74 -0.03 -0.01
VB446118 2,493 3.79 1.08 3.80 1.08 0.00 0.41 0.75 56 96 0.75 3.77 1.07 0.35 0.73 52 95 3.77 1.04 -0.02 0.75 -0.02 0.00
VB446202 2,431 3.85 1.13 3.84 1.11 -0.01 0.46 0.81 59 97 0.81 3.93 1.13 0.40 0.76 55 95 3.92 1.10 0.06 0.79 -0.05 -0.02
VB446204 2,491 3.66 1.08 3.64 1.06 -0.02 0.40 0.76 55 97 0.76 3.67 1.08 0.33 0.70 50 94 3.66 1.08 0.00 0.73 -0.06 -0.03
VB446205 1,474 3.62 1.16 3.60 1.17 -0.02 0.48 0.81 60 97 0.81 3.69 1.13 0.34 0.70 50 92 3.68 1.11 0.05 0.73 -0.11 -0.08
VB446215 2,491 3.96 1.04 3.97 1.04 0.02 0.44 0.77 59 97 0.77 3.70 1.06 0.33 0.72 51 96 3.69 1.04 -0.25 0.77 -0.05 0.00
VB446945 1,162 3.69 1.13 3.67 1.12 -0.01 0.46 0.79 59 96 0.79 3.81 1.13 0.37 0.71 52 93 3.80 1.09 0.11 0.72 -0.08 -0.07
VB457580 1,901 3.82 1.07 3.78 1.09 -0.03 0.45 0.77 59 96 0.77 3.79 1.11 0.38 0.75 54 96 3.78 1.09 -0.04 0.77 -0.02 0.00
VB457763 947 3.69 1.06 3.68 1.04 0.00 0.41 0.74 57 96 0.74 3.60 1.12 0.38 0.75 54 96 3.60 1.11 -0.09 0.79 0.01 0.05
VB457764 1,071 3.85 1.12 3.86 1.13 0.01 0.43 0.79 57 97 0.79 3.90 1.10 0.42 0.76 56 96 3.89 1.08 0.04 0.79 -0.03 0.00
VB457772 2,495 3.84 1.08 3.85 1.09 0.01 0.45 0.78 59 97 0.78 3.78 1.12 0.37 0.75 53 96 3.78 1.10 -0.05 0.78 -0.03 0.00
VB457773 2,098 3.82 1.08 3.82 1.10 0.00 0.47 0.80 61 97 0.80 3.66 1.09 0.35 0.74 52 95 3.65 1.07 -0.15 0.78 -0.06 -0.02
VB457774 1,787 3.95 1.10 3.93 1.08 -0.01 0.47 0.79 60 97 0.79 3.73 1.05 0.30 0.71 48 95 3.71 1.02 -0.21 0.75 -0.08 -0.04
VB457775 1,299 3.84 1.14 3.86 1.12 0.02 0.46 0.81 59 97 0.81 3.88 1.09 0.36 0.72 52 94 3.87 1.07 0.02 0.74 -0.09 -0.07
VB457776 1,660 3.84 1.11 3.82 1.10 -0.02 0.47 0.80 60 97 0.80 3.89 1.12 0.36 0.73 52 94 3.89 1.09 0.04 0.76 -0.07 -0.04
VB459256 742 3.64 1.01 3.65 1.05 0.02 0.38 0.73 55 96 0.73 3.65 1.11 0.38 0.72 54 95 3.64 1.08 0.01 0.76 -0.01 0.03
VB459258 2,494 3.58 1.12 3.58 1.11 0.00 0.43 0.78 57 96 0.78 3.65 1.10 0.36 0.72 52 94 3.64 1.08 0.06 0.75 -0.06 -0.03
VB459914 2,494 3.68 1.10 3.70 1.10 0.02 0.44 0.79 58 97 0.79 3.70 1.09 0.36 0.71 52 94 3.69 1.07 0.01 0.73 -0.08 -0.06
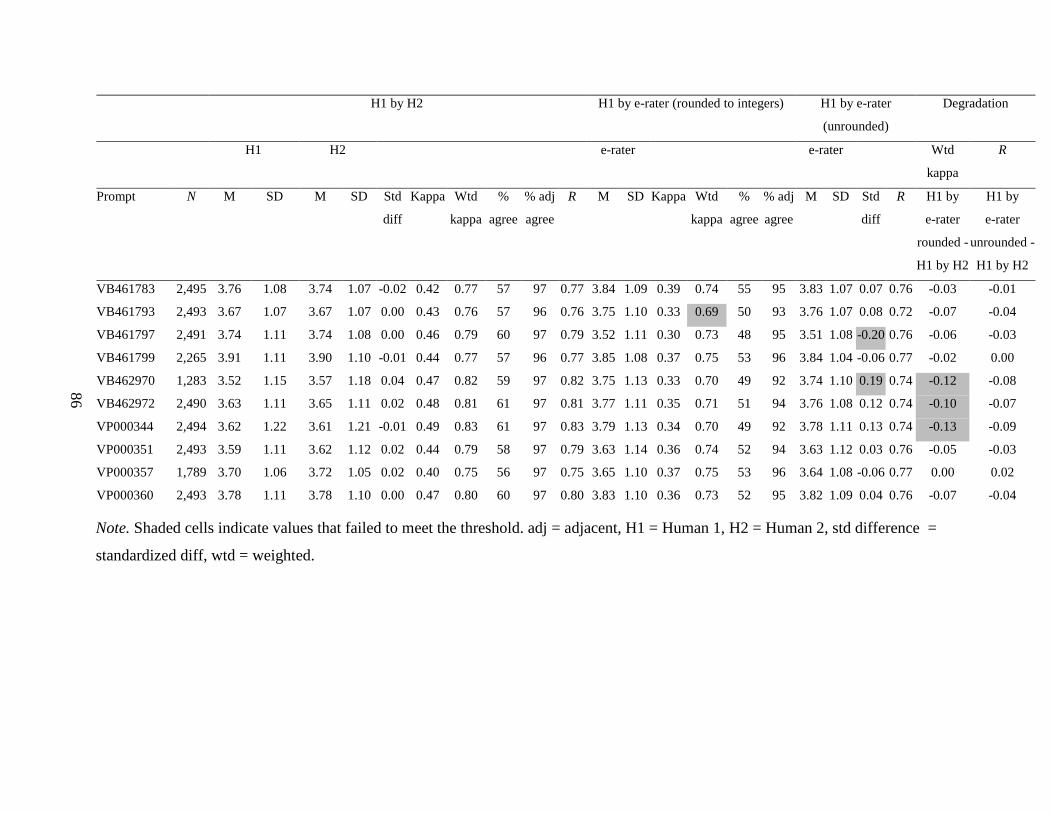
86
H1 by H2 H1 by e-rater (rounded to integers) H1 by e-rater
(unrounded)
Degradation
H1 H2 e-rater e-rater Wtd
kappa
R
Prompt N M SD M SD Std
diff
Kappa Wtd
kappa
%
agree
% adj
agree
R M SD Kappa Wtd
kappa
%
agree
% adj
agree
M SD Std
diff
R H1 by
e-rater
rounded -
H1 by H2
H1 by
e-rater
unrounded -
H1 by H2
VB461783 2,495 3.76 1.08 3.74 1.07 -0.02 0.42 0.77 57 97 0.77 3.84 1.09 0.39 0.74 55 95 3.83 1.07 0.07 0.76 -0.03 -0.01
VB461793 2,493 3.67 1.07 3.67 1.07 0.00 0.43 0.76 57 96 0.76 3.75 1.10 0.33 0.69 50 93 3.76 1.07 0.08 0.72 -0.07 -0.04
VB461797 2,491 3.74 1.11 3.74 1.08 0.00 0.46 0.79 60 97 0.79 3.52 1.11 0.30 0.73 48 95 3.51 1.08 -0.20 0.76 -0.06 -0.03
VB461799 2,265 3.91 1.11 3.90 1.10 -0.01 0.44 0.77 57 96 0.77 3.85 1.08 0.37 0.75 53 96 3.84 1.04 -0.06 0.77 -0.02 0.00
VB462970 1,283 3.52 1.15 3.57 1.18 0.04 0.47 0.82 59 97 0.82 3.75 1.13 0.33 0.70 49 92 3.74 1.10 0.19 0.74 -0.12 -0.08
VB462972 2,490 3.63 1.11 3.65 1.11 0.02 0.48 0.81 61 97 0.81 3.77 1.11 0.35 0.71 51 94 3.76 1.08 0.12 0.74 -0.10 -0.07
VP000344 2,494 3.62 1.22 3.61 1.21 -0.01 0.49 0.83 61 97 0.83 3.79 1.13 0.34 0.70 49 92 3.78 1.11 0.13 0.74 -0.13 -0.09
VP000351 2,493 3.59 1.11 3.62 1.12 0.02 0.44 0.79 58 97 0.79 3.63 1.14 0.36 0.74 52 94 3.63 1.12 0.03 0.76 -0.05 -0.03
VP000357 1,789 3.70 1.06 3.72 1.05 0.02 0.40 0.75 56 97 0.75 3.65 1.10 0.37 0.75 53 96 3.64 1.08 -0.06 0.77 0.00 0.02
VP000360 2,493 3.78 1.11 3.78 1.10 0.00 0.47 0.80 60 97 0.80 3.83 1.10 0.36 0.73 52 95 3.82 1.09 0.04 0.76 -0.07 -0.04
Note. Shaded cells indicate values that failed to meet the threshold. adj = adjacent, H1 = Human 1, H2 = Human 2, std difference =
standardized diff, wtd = weighted.
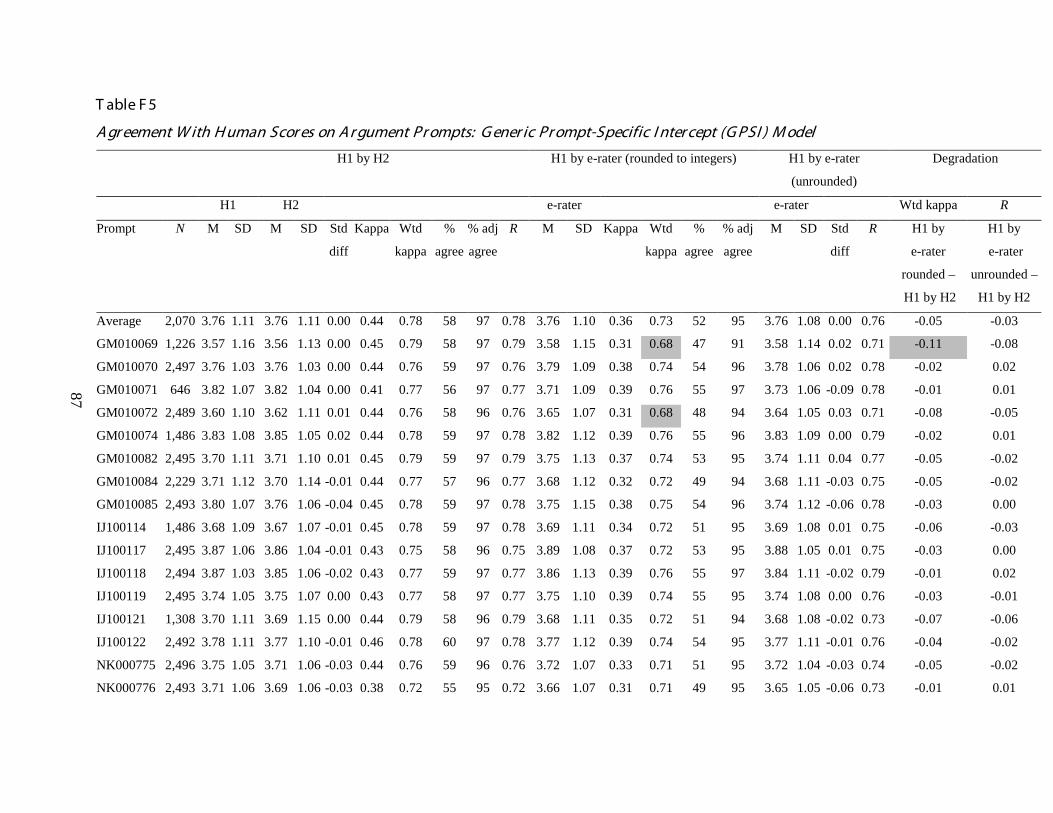
87
T able F 5
A gr eement W ith H uman Scor es on A r gument Pr ompts: G ener ic Pr ompt-Specific I nter cept (G PSI ) M odel
H1 by H2 H1 by e-rater (rounded to integers) H1 by e-rater
(unrounded)
Degradation
H1 H2 e-rater e-rater Wtd kappa R
Prompt N M SD M SD Std
diff
Kappa Wtd
kappa
%
agree
% adj
agree
R M SD Kappa Wtd
kappa
%
agree
% adj
agree
M SD Std
diff
R H1 by
e-rater
rounded –
H1 by H2
H1 by
e-rater
unrounded –
H1 by H2
Average 2,070 3.76 1.11 3.76 1.11 0.00 0.44 0.78 58 97 0.78 3.76 1.10 0.36 0.73 52 95 3.76 1.08 0.00 0.76 -0.05 -0.03
GM010069 1,226 3.57 1.16 3.56 1.13 0.00 0.45 0.79 58 97 0.79 3.58 1.15 0.31 0.68 47 91 3.58 1.14 0.02 0.71 -0.11 -0.08
GM010070 2,497 3.76 1.03 3.76 1.03 0.00 0.44 0.76 59 97 0.76 3.79 1.09 0.38 0.74 54 96 3.78 1.06 0.02 0.78 -0.02 0.02
GM010071 646 3.82 1.07 3.82 1.04 0.00 0.41 0.77 56 97 0.77 3.71 1.09 0.39 0.76 55 97 3.73 1.06 -0.09 0.78 -0.01 0.01
GM010072 2,489 3.60 1.10 3.62 1.11 0.01 0.44 0.76 58 96 0.76 3.65 1.07 0.31 0.68 48 94 3.64 1.05 0.03 0.71 -0.08 -0.05
GM010074 1,486 3.83 1.08 3.85 1.05 0.02 0.44 0.78 59 97 0.78 3.82 1.12 0.39 0.76 55 96 3.83 1.09 0.00 0.79 -0.02 0.01
GM010082 2,495 3.70 1.11 3.71 1.10 0.01 0.45 0.79 59 97 0.79 3.75 1.13 0.37 0.74 53 95 3.74 1.11 0.04 0.77 -0.05 -0.02
GM010084 2,229 3.71 1.12 3.70 1.14 -0.01 0.44 0.77 57 96 0.77 3.68 1.12 0.32 0.72 49 94 3.68 1.11 -0.03 0.75 -0.05 -0.02
GM010085 2,493 3.80 1.07 3.76 1.06 -0.04 0.45 0.78 59 97 0.78 3.75 1.15 0.38 0.75 54 96 3.74 1.12 -0.06 0.78 -0.03 0.00
IJ100114 1,486 3.68 1.09 3.67 1.07 -0.01 0.45 0.78 59 97 0.78 3.69 1.11 0.34 0.72 51 95 3.69 1.08 0.01 0.75 -0.06 -0.03
IJ100117 2,495 3.87 1.06 3.86 1.04 -0.01 0.43 0.75 58 96 0.75 3.89 1.08 0.37 0.72 53 95 3.88 1.05 0.01 0.75 -0.03 0.00
IJ100118 2,494 3.87 1.03 3.85 1.06 -0.02 0.43 0.77 59 97 0.77 3.86 1.13 0.39 0.76 55 97 3.84 1.11 -0.02 0.79 -0.01 0.02
IJ100119 2,495 3.74 1.05 3.75 1.07 0.00 0.43 0.77 58 97 0.77 3.75 1.10 0.39 0.74 55 95 3.74 1.08 0.00 0.76 -0.03 -0.01
IJ100121 1,308 3.70 1.11 3.69 1.15 0.00 0.44 0.79 58 96 0.79 3.68 1.11 0.35 0.72 51 94 3.68 1.08 -0.02 0.73 -0.07 -0.06
IJ100122 2,492 3.78 1.11 3.77 1.10 -0.01 0.46 0.78 60 97 0.78 3.77 1.12 0.39 0.74 54 95 3.77 1.11 -0.01 0.76 -0.04 -0.02
NK000775 2,496 3.75 1.05 3.71 1.06 -0.03 0.44 0.76 59 96 0.76 3.72 1.07 0.33 0.71 51 95 3.72 1.04 -0.03 0.74 -0.05 -0.02
NK000776 2,493 3.71 1.06 3.69 1.06 -0.03 0.38 0.72 55 95 0.72 3.66 1.07 0.31 0.71 49 95 3.65 1.05 -0.06 0.73 -0.01 0.01
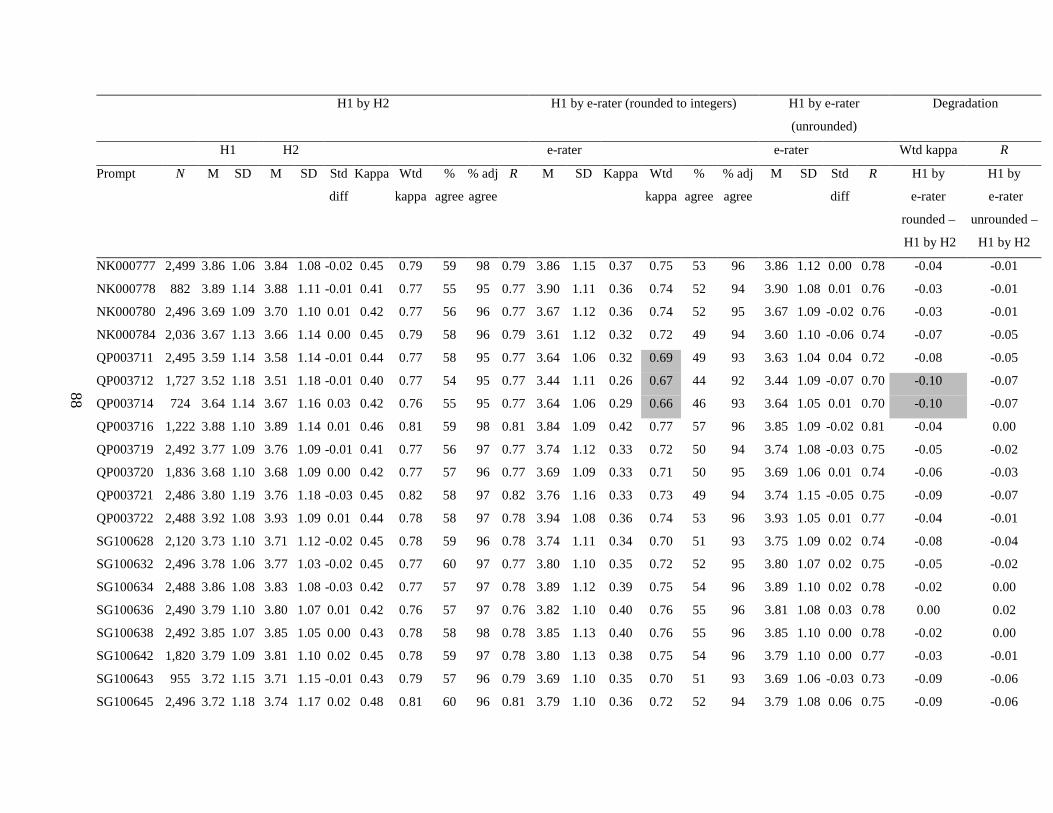
88
H1 by H2 H1 by e-rater (rounded to integers) H1 by e-rater
(unrounded)
Degradation
H1 H2 e-rater e-rater Wtd kappa R
Prompt N M SD M SD Std
diff
Kappa Wtd
kappa
%
agree
% adj
agree
R M SD Kappa Wtd
kappa
%
agree
% adj
agree
M SD Std
diff
R H1 by
e-rater
rounded –
H1 by H2
H1 by
e-rater
unrounded –
H1 by H2
NK000777 2,499 3.86 1.06 3.84 1.08 -0.02 0.45 0.79 59 98 0.79 3.86 1.15 0.37 0.75 53 96 3.86 1.12 0.00 0.78 -0.04 -0.01
NK000778 882 3.89 1.14 3.88 1.11 -0.01 0.41 0.77 55 95 0.77 3.90 1.11 0.36 0.74 52 94 3.90 1.08 0.01 0.76 -0.03 -0.01
NK000780 2,496 3.69 1.09 3.70 1.10 0.01 0.42 0.77 56 96 0.77 3.67 1.12 0.36 0.74 52 95 3.67 1.09 -0.02 0.76 -0.03 -0.01
NK000784 2,036 3.67 1.13 3.66 1.14 0.00 0.45 0.79 58 96 0.79 3.61 1.12 0.32 0.72 49 94 3.60 1.10 -0.06 0.74 -0.07 -0.05
QP003711 2,495 3.59 1.14 3.58 1.14 -0.01 0.44 0.77 58 95 0.77 3.64 1.06 0.32 0.69 49 93 3.63 1.04 0.04 0.72 -0.08 -0.05
QP003712 1,727 3.52 1.18 3.51 1.18 -0.01 0.40 0.77 54 95 0.77 3.44 1.11 0.26 0.67 44 92 3.44 1.09 -0.07 0.70 -0.10 -0.07
QP003714 724 3.64 1.14 3.67 1.16 0.03 0.42 0.76 55 95 0.77 3.64 1.06 0.29 0.66 46 93 3.64 1.05 0.01 0.70 -0.10 -0.07
QP003716 1,222 3.88 1.10 3.89 1.14 0.01 0.46 0.81 59 98 0.81 3.84 1.09 0.42 0.77 57 96 3.85 1.09 -0.02 0.81 -0.04 0.00
QP003719 2,492 3.77 1.09 3.76 1.09 -0.01 0.41 0.77 56 97 0.77 3.74 1.12 0.33 0.72 50 94 3.74 1.08 -0.03 0.75 -0.05 -0.02
QP003720 1,836 3.68 1.10 3.68 1.09 0.00 0.42 0.77 57 96 0.77 3.69 1.09 0.33 0.71 50 95 3.69 1.06 0.01 0.74 -0.06 -0.03
QP003721 2,486 3.80 1.19 3.76 1.18 -0.03 0.45 0.82 58 97 0.82 3.76 1.16 0.33 0.73 49 94 3.74 1.15 -0.05 0.75 -0.09 -0.07
QP003722 2,488 3.92 1.08 3.93 1.09 0.01 0.44 0.78 58 97 0.78 3.94 1.08 0.36 0.74 53 96 3.93 1.05 0.01 0.77 -0.04 -0.01
SG100628 2,120 3.73 1.10 3.71 1.12 -0.02 0.45 0.78 59 96 0.78 3.74 1.11 0.34 0.70 51 93 3.75 1.09 0.02 0.74 -0.08 -0.04
SG100632 2,496 3.78 1.06 3.77 1.03 -0.02 0.45 0.77 60 97 0.77 3.80 1.10 0.35 0.72 52 95 3.80 1.07 0.02 0.75 -0.05 -0.02
SG100634 2,488 3.86 1.08 3.83 1.08 -0.03 0.42 0.77 57 97 0.78 3.89 1.12 0.39 0.75 54 96 3.89 1.10 0.02 0.78 -0.02 0.00
SG100636 2,490 3.79 1.10 3.80 1.07 0.01 0.42 0.76 57 97 0.76 3.82 1.10 0.40 0.76 55 96 3.81 1.08 0.03 0.78 0.00 0.02
SG100638 2,492 3.85 1.07 3.85 1.05 0.00 0.43 0.78 58 98 0.78 3.85 1.13 0.40 0.76 55 96 3.85 1.10 0.00 0.78 -0.02 0.00
SG100642 1,820 3.79 1.09 3.81 1.10 0.02 0.45 0.78 59 97 0.78 3.80 1.13 0.38 0.75 54 96 3.79 1.10 0.00 0.77 -0.03 -0.01
SG100643 955 3.72 1.15 3.71 1.15 -0.01 0.43 0.79 57 96 0.79 3.69 1.10 0.35 0.70 51 93 3.69 1.06 -0.03 0.73 -0.09 -0.06
SG100645 2,496 3.72 1.18 3.74 1.17 0.02 0.48 0.81 60 96 0.81 3.79 1.10 0.36 0.72 52 94 3.79 1.08 0.06 0.75 -0.09 -0.06
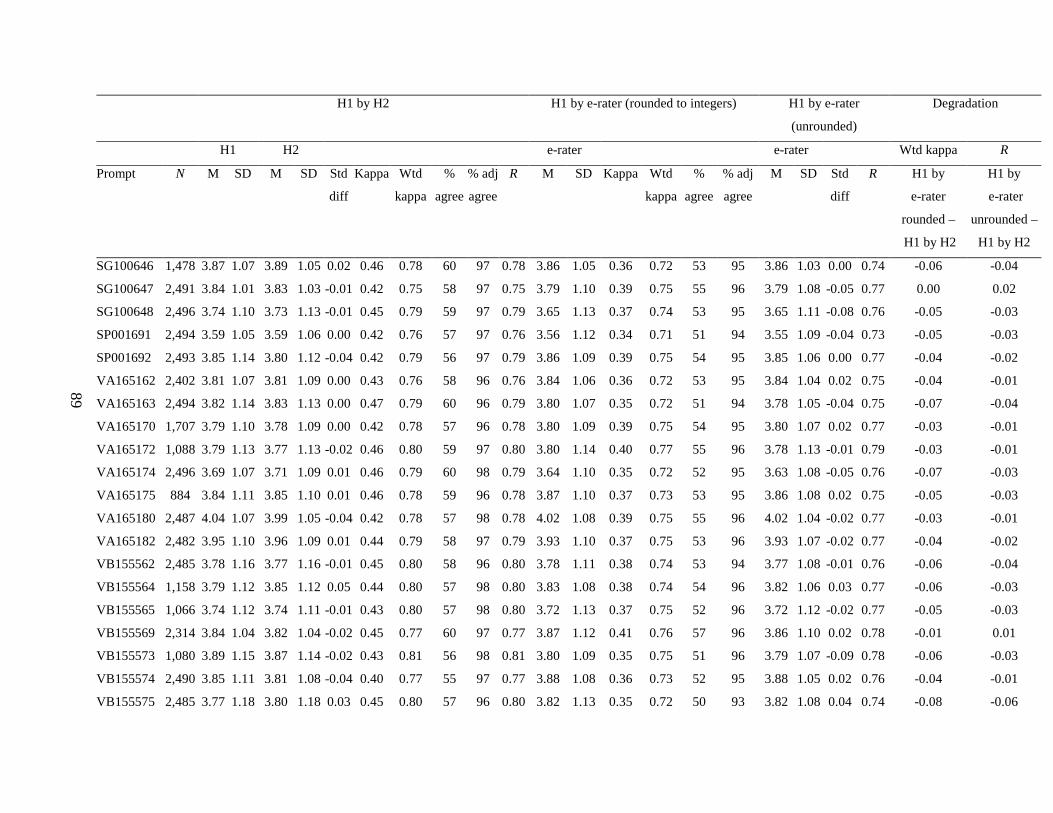
89
H1 by H2 H1 by e-rater (rounded to integers) H1 by e-rater
(unrounded)
Degradation
H1 H2 e-rater e-rater Wtd kappa R
Prompt N M SD M SD Std
diff
Kappa Wtd
kappa
%
agree
% adj
agree
R M SD Kappa Wtd
kappa
%
agree
% adj
agree
M SD Std
diff
R H1 by
e-rater
rounded –
H1 by H2
H1 by
e-rater
unrounded –
H1 by H2
SG100646 1,478 3.87 1.07 3.89 1.05 0.02 0.46 0.78 60 97 0.78 3.86 1.05 0.36 0.72 53 95 3.86 1.03 0.00 0.74 -0.06 -0.04
SG100647 2,491 3.84 1.01 3.83 1.03 -0.01 0.42 0.75 58 97 0.75 3.79 1.10 0.39 0.75 55 96 3.79 1.08 -0.05 0.77 0.00 0.02
SG100648 2,496 3.74 1.10 3.73 1.13 -0.01 0.45 0.79 59 97 0.79 3.65 1.13 0.37 0.74 53 95 3.65 1.11 -0.08 0.76 -0.05 -0.03
SP001691 2,494 3.59 1.05 3.59 1.06 0.00 0.42 0.76 57 97 0.76 3.56 1.12 0.34 0.71 51 94 3.55 1.09 -0.04 0.73 -0.05 -0.03
SP001692 2,493 3.85 1.14 3.80 1.12 -0.04 0.42 0.79 56 97 0.79 3.86 1.09 0.39 0.75 54 95 3.85 1.06 0.00 0.77 -0.04 -0.02
VA165162 2,402 3.81 1.07 3.81 1.09 0.00 0.43 0.76 58 96 0.76 3.84 1.06 0.36 0.72 53 95 3.84 1.04 0.02 0.75 -0.04 -0.01
VA165163 2,494 3.82 1.14 3.83 1.13 0.00 0.47 0.79 60 96 0.79 3.80 1.07 0.35 0.72 51 94 3.78 1.05 -0.04 0.75 -0.07 -0.04
VA165170 1,707 3.79 1.10 3.78 1.09 0.00 0.42 0.78 57 96 0.78 3.80 1.09 0.39 0.75 54 95 3.80 1.07 0.02 0.77 -0.03 -0.01
VA165172 1,088 3.79 1.13 3.77 1.13 -0.02 0.46 0.80 59 97 0.80 3.80 1.14 0.40 0.77 55 96 3.78 1.13 -0.01 0.79 -0.03 -0.01
VA165174 2,496 3.69 1.07 3.71 1.09 0.01 0.46 0.79 60 98 0.79 3.64 1.10 0.35 0.72 52 95 3.63 1.08 -0.05 0.76 -0.07 -0.03
VA165175 884 3.84 1.11 3.85 1.10 0.01 0.46 0.78 59 96 0.78 3.87 1.10 0.37 0.73 53 95 3.86 1.08 0.02 0.75 -0.05 -0.03
VA165180 2,487 4.04 1.07 3.99 1.05 -0.04 0.42 0.78 57 98 0.78 4.02 1.08 0.39 0.75 55 96 4.02 1.04 -0.02 0.77 -0.03 -0.01
VA165182 2,482 3.95 1.10 3.96 1.09 0.01 0.44 0.79 58 97 0.79 3.93 1.10 0.37 0.75 53 96 3.93 1.07 -0.02 0.77 -0.04 -0.02
VB155562 2,485 3.78 1.16 3.77 1.16 -0.01 0.45 0.80 58 96 0.80 3.78 1.11 0.38 0.74 53 94 3.77 1.08 -0.01 0.76 -0.06 -0.04
VB155564 1,158 3.79 1.12 3.85 1.12 0.05 0.44 0.80 57 98 0.80 3.83 1.08 0.38 0.74 54 96 3.82 1.06 0.03 0.77 -0.06 -0.03
VB155565 1,066 3.74 1.12 3.74 1.11 -0.01 0.43 0.80 57 98 0.80 3.72 1.13 0.37 0.75 52 96 3.72 1.12 -0.02 0.77 -0.05 -0.03
VB155569 2,314 3.84 1.04 3.82 1.04 -0.02 0.45 0.77 60 97 0.77 3.87 1.12 0.41 0.76 57 96 3.86 1.10 0.02 0.78 -0.01 0.01
VB155573 1,080 3.89 1.15 3.87 1.14 -0.02 0.43 0.81 56 98 0.81 3.80 1.09 0.35 0.75 51 96 3.79 1.07 -0.09 0.78 -0.06 -0.03
VB155574 2,490 3.85 1.11 3.81 1.08 -0.04 0.40 0.77 55 97 0.77 3.88 1.08 0.36 0.73 52 95 3.88 1.05 0.02 0.76 -0.04 -0.01
VB155575 2,485 3.77 1.18 3.80 1.18 0.03 0.45 0.80 57 96 0.80 3.82 1.13 0.35 0.72 50 93 3.82 1.08 0.04 0.74 -0.08 -0.06
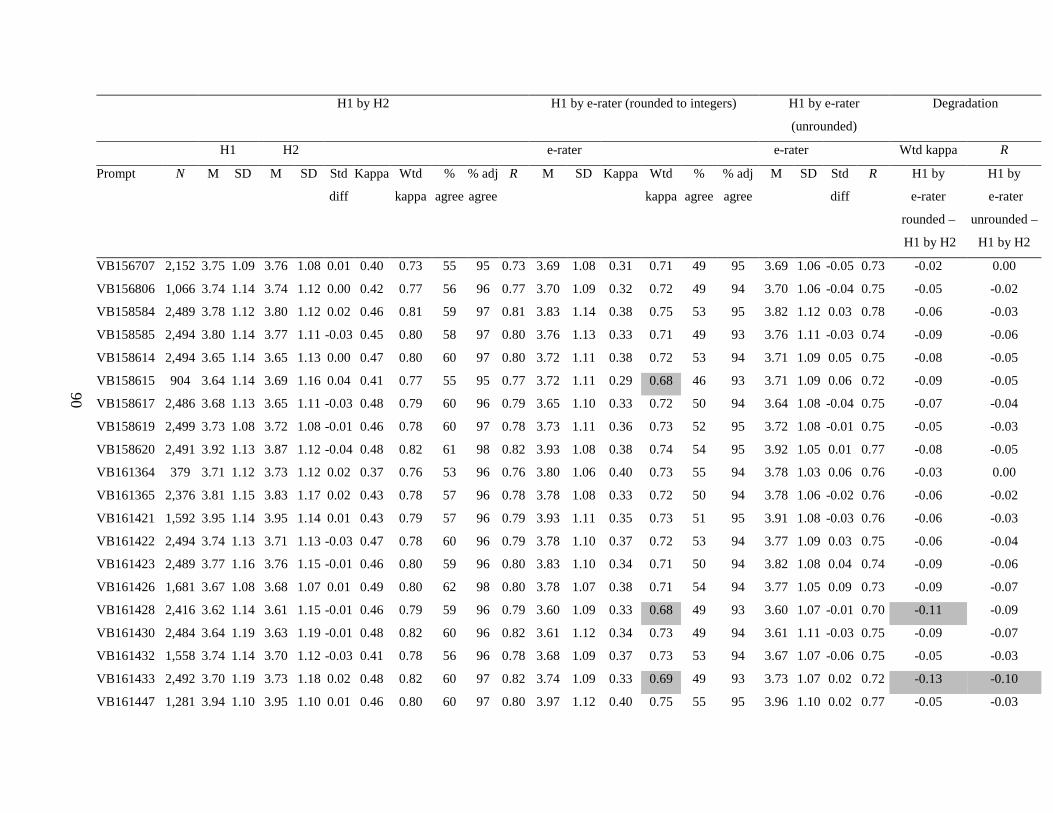
90
H1 by H2 H1 by e-rater (rounded to integers) H1 by e-rater
(unrounded)
Degradation
H1 H2 e-rater e-rater Wtd kappa R
Prompt N M SD M SD Std
diff
Kappa Wtd
kappa
%
agree
% adj
agree
R M SD Kappa Wtd
kappa
%
agree
% adj
agree
M SD Std
diff
R H1 by
e-rater
rounded –
H1 by H2
H1 by
e-rater
unrounded –
H1 by H2
VB156707 2,152 3.75 1.09 3.76 1.08 0.01 0.40 0.73 55 95 0.73 3.69 1.08 0.31 0.71 49 95 3.69 1.06 -0.05 0.73 -0.02 0.00
VB156806 1,066 3.74 1.14 3.74 1.12 0.00 0.42 0.77 56 96 0.77 3.70 1.09 0.32 0.72 49 94 3.70 1.06 -0.04 0.75 -0.05 -0.02
VB158584 2,489 3.78 1.12 3.80 1.12 0.02 0.46 0.81 59 97 0.81 3.83 1.14 0.38 0.75 53 95 3.82 1.12 0.03 0.78 -0.06 -0.03
VB158585 2,494 3.80 1.14 3.77 1.11 -0.03 0.45 0.80 58 97 0.80 3.76 1.13 0.33 0.71 49 93 3.76 1.11 -0.03 0.74 -0.09 -0.06
VB158614 2,494 3.65 1.14 3.65 1.13 0.00 0.47 0.80 60 97 0.80 3.72 1.11 0.38 0.72 53 94 3.71 1.09 0.05 0.75 -0.08 -0.05
VB158615 904 3.64 1.14 3.69 1.16 0.04 0.41 0.77 55 95 0.77 3.72 1.11 0.29 0.68 46 93 3.71 1.09 0.06 0.72 -0.09 -0.05
VB158617 2,486 3.68 1.13 3.65 1.11 -0.03 0.48 0.79 60 96 0.79 3.65 1.10 0.33 0.72 50 94 3.64 1.08 -0.04 0.75 -0.07 -0.04
VB158619 2,499 3.73 1.08 3.72 1.08 -0.01 0.46 0.78 60 97 0.78 3.73 1.11 0.36 0.73 52 95 3.72 1.08 -0.01 0.75 -0.05 -0.03
VB158620 2,491 3.92 1.13 3.87 1.12 -0.04 0.48 0.82 61 98 0.82 3.93 1.08 0.38 0.74 54 95 3.92 1.05 0.01 0.77 -0.08 -0.05
VB161364 379 3.71 1.12 3.73 1.12 0.02 0.37 0.76 53 96 0.76 3.80 1.06 0.40 0.73 55 94 3.78 1.03 0.06 0.76 -0.03 0.00
VB161365 2,376 3.81 1.15 3.83 1.17 0.02 0.43 0.78 57 96 0.78 3.78 1.08 0.33 0.72 50 94 3.78 1.06 -0.02 0.76 -0.06 -0.02
VB161421 1,592 3.95 1.14 3.95 1.14 0.01 0.43 0.79 57 96 0.79 3.93 1.11 0.35 0.73 51 95 3.91 1.08 -0.03 0.76 -0.06 -0.03
VB161422 2,494 3.74 1.13 3.71 1.13 -0.03 0.47 0.78 60 96 0.79 3.78 1.10 0.37 0.72 53 94 3.77 1.09 0.03 0.75 -0.06 -0.04
VB161423 2,489 3.77 1.16 3.76 1.15 -0.01 0.46 0.80 59 96 0.80 3.83 1.10 0.34 0.71 50 94 3.82 1.08 0.04 0.74 -0.09 -0.06
VB161426 1,681 3.67 1.08 3.68 1.07 0.01 0.49 0.80 62 98 0.80 3.78 1.07 0.38 0.71 54 94 3.77 1.05 0.09 0.73 -0.09 -0.07
VB161428 2,416 3.62 1.14 3.61 1.15 -0.01 0.46 0.79 59 96 0.79 3.60 1.09 0.33 0.68 49 93 3.60 1.07 -0.01 0.70 -0.11 -0.09
VB161430 2,484 3.64 1.19 3.63 1.19 -0.01 0.48 0.82 60 96 0.82 3.61 1.12 0.34 0.73 49 94 3.61 1.11 -0.03 0.75 -0.09 -0.07
VB161432 1,558 3.74 1.14 3.70 1.12 -0.03 0.41 0.78 56 96 0.78 3.68 1.09 0.37 0.73 53 94 3.67 1.07 -0.06 0.75 -0.05 -0.03
VB161433 2,492 3.70 1.19 3.73 1.18 0.02 0.48 0.82 60 97 0.82 3.74 1.09 0.33 0.69 49 93 3.73 1.07 0.02 0.72 -0.13 -0.10
VB161447 1,281 3.94 1.10 3.95 1.10 0.01 0.46 0.80 60 97 0.80 3.97 1.12 0.40 0.75 55 95 3.96 1.10 0.02 0.77 -0.05 -0.03
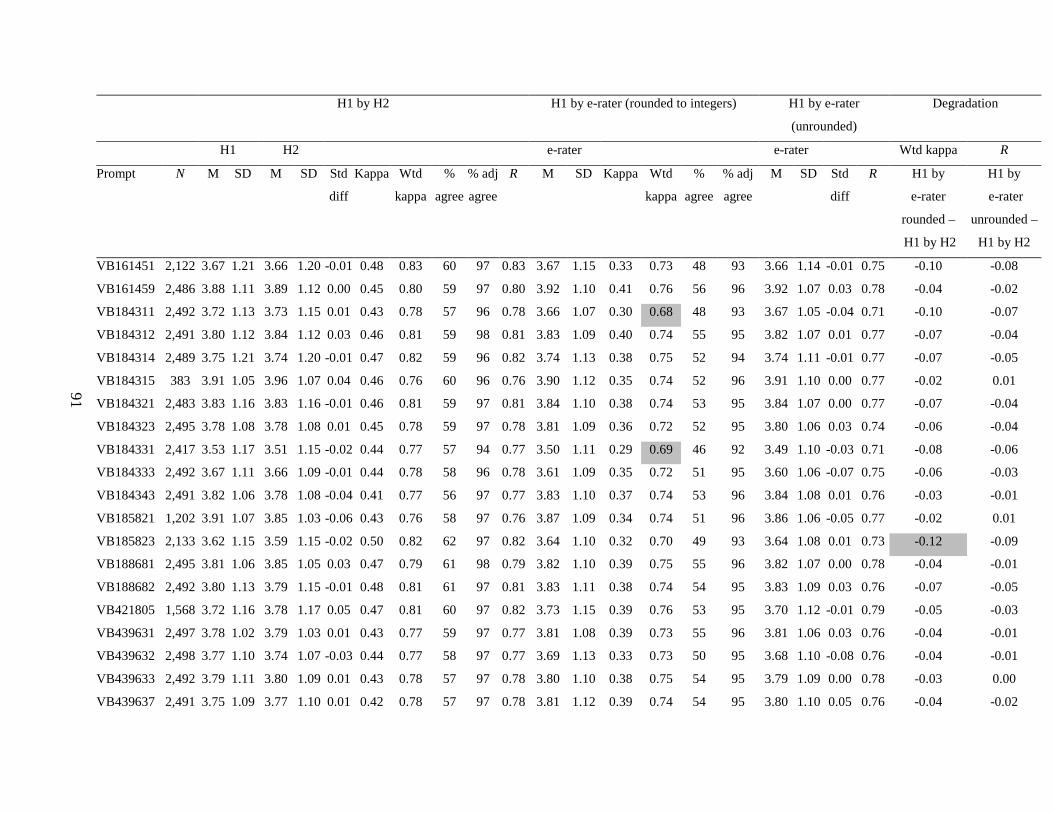
91
H1 by H2 H1 by e-rater (rounded to integers) H1 by e-rater
(unrounded)
Degradation
H1 H2 e-rater e-rater Wtd kappa R
Prompt N M SD M SD Std
diff
Kappa Wtd
kappa
%
agree
% adj
agree
R M SD Kappa Wtd
kappa
%
agree
% adj
agree
M SD Std
diff
R H1 by
e-rater
rounded –
H1 by H2
H1 by
e-rater
unrounded –
H1 by H2
VB161451 2,122 3.67 1.21 3.66 1.20 -0.01 0.48 0.83 60 97 0.83 3.67 1.15 0.33 0.73 48 93 3.66 1.14 -0.01 0.75 -0.10 -0.08
VB161459 2,486 3.88 1.11 3.89 1.12 0.00 0.45 0.80 59 97 0.80 3.92 1.10 0.41 0.76 56 96 3.92 1.07 0.03 0.78 -0.04 -0.02
VB184311 2,492 3.72 1.13 3.73 1.15 0.01 0.43 0.78 57 96 0.78 3.66 1.07 0.30 0.68 48 93 3.67 1.05 -0.04 0.71 -0.10 -0.07
VB184312 2,491 3.80 1.12 3.84 1.12 0.03 0.46 0.81 59 98 0.81 3.83 1.09 0.40 0.74 55 95 3.82 1.07 0.01 0.77 -0.07 -0.04
VB184314 2,489 3.75 1.21 3.74 1.20 -0.01 0.47 0.82 59 96 0.82 3.74 1.13 0.38 0.75 52 94 3.74 1.11 -0.01 0.77 -0.07 -0.05
VB184315 383 3.91 1.05 3.96 1.07 0.04 0.46 0.76 60 96 0.76 3.90 1.12 0.35 0.74 52 96 3.91 1.10 0.00 0.77 -0.02 0.01
VB184321 2,483 3.83 1.16 3.83 1.16 -0.01 0.46 0.81 59 97 0.81 3.84 1.10 0.38 0.74 53 95 3.84 1.07 0.00 0.77 -0.07 -0.04
VB184323 2,495 3.78 1.08 3.78 1.08 0.01 0.45 0.78 59 97 0.78 3.81 1.09 0.36 0.72 52 95 3.80 1.06 0.03 0.74 -0.06 -0.04
VB184331 2,417 3.53 1.17 3.51 1.15 -0.02 0.44 0.77 57 94 0.77 3.50 1.11 0.29 0.69 46 92 3.49 1.10 -0.03 0.71 -0.08 -0.06
VB184333 2,492 3.67 1.11 3.66 1.09 -0.01 0.44 0.78 58 96 0.78 3.61 1.09 0.35 0.72 51 95 3.60 1.06 -0.07 0.75 -0.06 -0.03
VB184343 2,491 3.82 1.06 3.78 1.08 -0.04 0.41 0.77 56 97 0.77 3.83 1.10 0.37 0.74 53 96 3.84 1.08 0.01 0.76 -0.03 -0.01
VB185821 1,202 3.91 1.07 3.85 1.03 -0.06 0.43 0.76 58 97 0.76 3.87 1.09 0.34 0.74 51 96 3.86 1.06 -0.05 0.77 -0.02 0.01
VB185823 2,133 3.62 1.15 3.59 1.15 -0.02 0.50 0.82 62 97 0.82 3.64 1.10 0.32 0.70 49 93 3.64 1.08 0.01 0.73 -0.12 -0.09
VB188681 2,495 3.81 1.06 3.85 1.05 0.03 0.47 0.79 61 98 0.79 3.82 1.10 0.39 0.75 55 96 3.82 1.07 0.00 0.78 -0.04 -0.01
VB188682 2,492 3.80 1.13 3.79 1.15 -0.01 0.48 0.81 61 97 0.81 3.83 1.11 0.38 0.74 54 95 3.83 1.09 0.03 0.76 -0.07 -0.05
VB421805 1,568 3.72 1.16 3.78 1.17 0.05 0.47 0.81 60 97 0.82 3.73 1.15 0.39 0.76 53 95 3.70 1.12 -0.01 0.79 -0.05 -0.03
VB439631 2,497 3.78 1.02 3.79 1.03 0.01 0.43 0.77 59 97 0.77 3.81 1.08 0.39 0.73 55 96 3.81 1.06 0.03 0.76 -0.04 -0.01
VB439632 2,498 3.77 1.10 3.74 1.07 -0.03 0.44 0.77 58 97 0.77 3.69 1.13 0.33 0.73 50 95 3.68 1.10 -0.08 0.76 -0.04 -0.01
VB439633 2,492 3.79 1.11 3.80 1.09 0.01 0.43 0.78 57 97 0.78 3.80 1.10 0.38 0.75 54 95 3.79 1.09 0.00 0.78 -0.03 0.00
VB439637 2,491 3.75 1.09 3.77 1.10 0.01 0.42 0.78 57 97 0.78 3.81 1.12 0.39 0.74 54 95 3.80 1.10 0.05 0.76 -0.04 -0.02
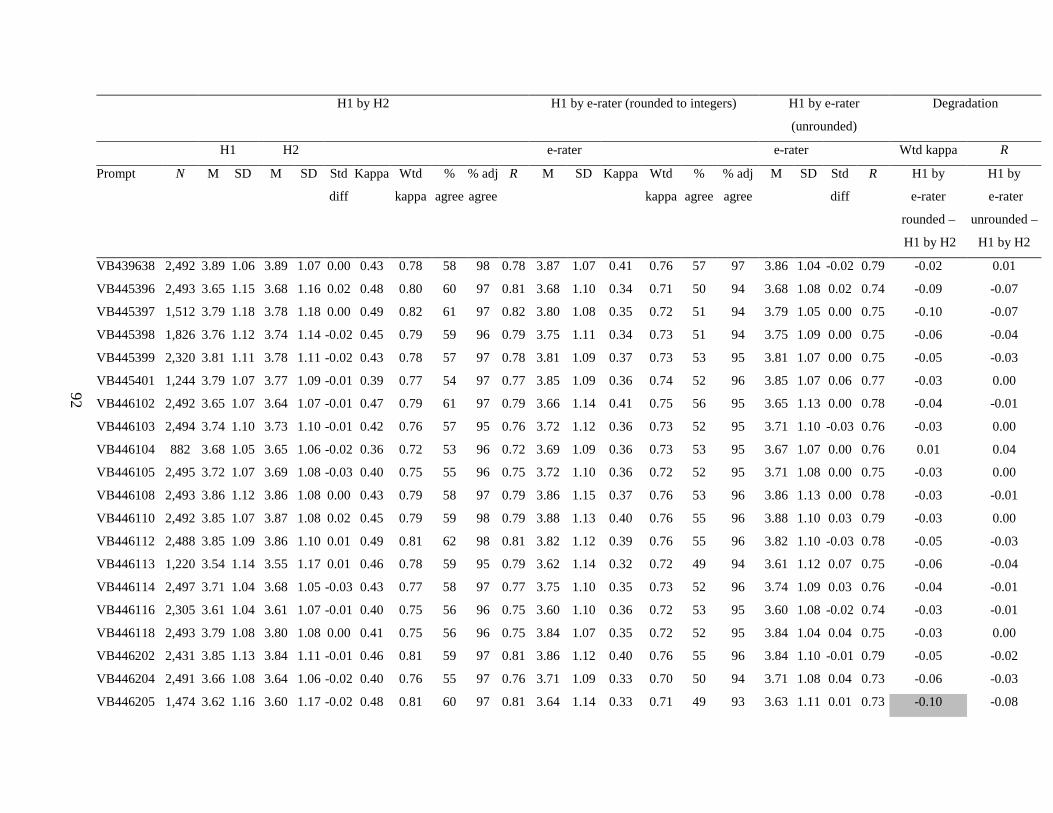
92
H1 by H2 H1 by e-rater (rounded to integers) H1 by e-rater
(unrounded)
Degradation
H1 H2 e-rater e-rater Wtd kappa R
Prompt N M SD M SD Std
diff
Kappa Wtd
kappa
%
agree
% adj
agree
R M SD Kappa Wtd
kappa
%
agree
% adj
agree
M SD Std
diff
R H1 by
e-rater
rounded –
H1 by H2
H1 by
e-rater
unrounded –
H1 by H2
VB439638 2,492 3.89 1.06 3.89 1.07 0.00 0.43 0.78 58 98 0.78 3.87 1.07 0.41 0.76 57 97 3.86 1.04 -0.02 0.79 -0.02 0.01
VB445396 2,493 3.65 1.15 3.68 1.16 0.02 0.48 0.80 60 97 0.81 3.68 1.10 0.34 0.71 50 94 3.68 1.08 0.02 0.74 -0.09 -0.07
VB445397 1,512 3.79 1.18 3.78 1.18 0.00 0.49 0.82 61 97 0.82 3.80 1.08 0.35 0.72 51 94 3.79 1.05 0.00 0.75 -0.10 -0.07
VB445398 1,826 3.76 1.12 3.74 1.14 -0.02 0.45 0.79 59 96 0.79 3.75 1.11 0.34 0.73 51 94 3.75 1.09 0.00 0.75 -0.06 -0.04
VB445399 2,320 3.81 1.11 3.78 1.11 -0.02 0.43 0.78 57 97 0.78 3.81 1.09 0.37 0.73 53 95 3.81 1.07 0.00 0.75 -0.05 -0.03
VB445401 1,244 3.79 1.07 3.77 1.09 -0.01 0.39 0.77 54 97 0.77 3.85 1.09 0.36 0.74 52 96 3.85 1.07 0.06 0.77 -0.03 0.00
VB446102 2,492 3.65 1.07 3.64 1.07 -0.01 0.47 0.79 61 97 0.79 3.66 1.14 0.41 0.75 56 95 3.65 1.13 0.00 0.78 -0.04 -0.01
VB446103 2,494 3.74 1.10 3.73 1.10 -0.01 0.42 0.76 57 95 0.76 3.72 1.12 0.36 0.73 52 95 3.71 1.10 -0.03 0.76 -0.03 0.00
VB446104 882 3.68 1.05 3.65 1.06 -0.02 0.36 0.72 53 96 0.72 3.69 1.09 0.36 0.73 53 95 3.67 1.07 0.00 0.76 0.01 0.04
VB446105 2,495 3.72 1.07 3.69 1.08 -0.03 0.40 0.75 55 96 0.75 3.72 1.10 0.36 0.72 52 95 3.71 1.08 0.00 0.75 -0.03 0.00
VB446108 2,493 3.86 1.12 3.86 1.08 0.00 0.43 0.79 58 97 0.79 3.86 1.15 0.37 0.76 53 96 3.86 1.13 0.00 0.78 -0.03 -0.01
VB446110 2,492 3.85 1.07 3.87 1.08 0.02 0.45 0.79 59 98 0.79 3.88 1.13 0.40 0.76 55 96 3.88 1.10 0.03 0.79 -0.03 0.00
VB446112 2,488 3.85 1.09 3.86 1.10 0.01 0.49 0.81 62 98 0.81 3.82 1.12 0.39 0.76 55 96 3.82 1.10 -0.03 0.78 -0.05 -0.03
VB446113 1,220 3.54 1.14 3.55 1.17 0.01 0.46 0.78 59 95 0.79 3.62 1.14 0.32 0.72 49 94 3.61 1.12 0.07 0.75 -0.06 -0.04
VB446114 2,497 3.71 1.04 3.68 1.05 -0.03 0.43 0.77 58 97 0.77 3.75 1.10 0.35 0.73 52 96 3.74 1.09 0.03 0.76 -0.04 -0.01
VB446116 2,305 3.61 1.04 3.61 1.07 -0.01 0.40 0.75 56 96 0.75 3.60 1.10 0.36 0.72 53 95 3.60 1.08 -0.02 0.74 -0.03 -0.01
VB446118 2,493 3.79 1.08 3.80 1.08 0.00 0.41 0.75 56 96 0.75 3.84 1.07 0.35 0.72 52 95 3.84 1.04 0.04 0.75 -0.03 0.00
VB446202 2,431 3.85 1.13 3.84 1.11 -0.01 0.46 0.81 59 97 0.81 3.86 1.12 0.40 0.76 55 96 3.84 1.10 -0.01 0.79 -0.05 -0.02
VB446204 2,491 3.66 1.08 3.64 1.06 -0.02 0.40 0.76 55 97 0.76 3.71 1.09 0.33 0.70 50 94 3.71 1.08 0.04 0.73 -0.06 -0.03
VB446205 1,474 3.62 1.16 3.60 1.17 -0.02 0.48 0.81 60 97 0.81 3.64 1.14 0.33 0.71 49 93 3.63 1.11 0.01 0.73 -0.10 -0.08
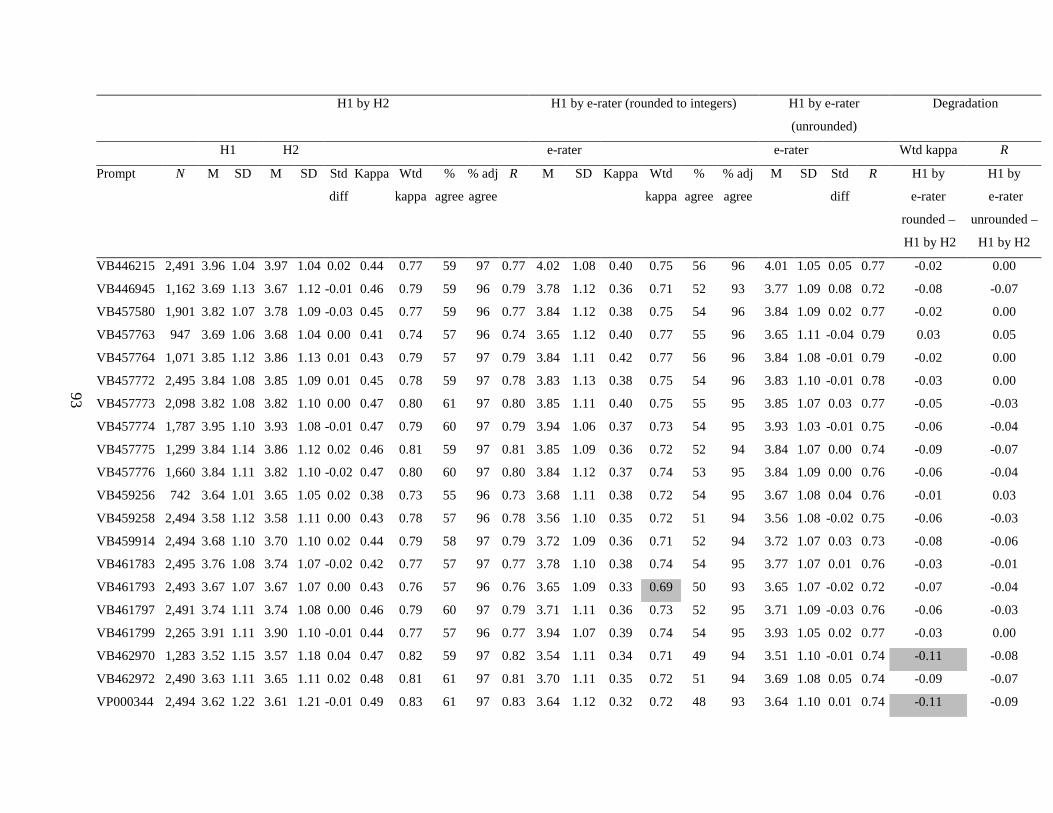
93
H1 by H2 H1 by e-rater (rounded to integers) H1 by e-rater
(unrounded)
Degradation
H1 H2 e-rater e-rater Wtd kappa R
Prompt N M SD M SD Std
diff
Kappa Wtd
kappa
%
agree
% adj
agree
R M SD Kappa Wtd
kappa
%
agree
% adj
agree
M SD Std
diff
R H1 by
e-rater
rounded –
H1 by H2
H1 by
e-rater
unrounded –
H1 by H2
VB446215 2,491 3.96 1.04 3.97 1.04 0.02 0.44 0.77 59 97 0.77 4.02 1.08 0.40 0.75 56 96 4.01 1.05 0.05 0.77 -0.02 0.00
VB446945 1,162 3.69 1.13 3.67 1.12 -0.01 0.46 0.79 59 96 0.79 3.78 1.12 0.36 0.71 52 93 3.77 1.09 0.08 0.72 -0.08 -0.07
VB457580 1,901 3.82 1.07 3.78 1.09 -0.03 0.45 0.77 59 96 0.77 3.84 1.12 0.38 0.75 54 96 3.84 1.09 0.02 0.77 -0.02 0.00
VB457763 947 3.69 1.06 3.68 1.04 0.00 0.41 0.74 57 96 0.74 3.65 1.12 0.40 0.77 55 96 3.65 1.11 -0.04 0.79 0.03 0.05
VB457764 1,071 3.85 1.12 3.86 1.13 0.01 0.43 0.79 57 97 0.79 3.84 1.11 0.42 0.77 56 96 3.84 1.08 -0.01 0.79 -0.02 0.00
VB457772 2,495 3.84 1.08 3.85 1.09 0.01 0.45 0.78 59 97 0.78 3.83 1.13 0.38 0.75 54 96 3.83 1.10 -0.01 0.78 -0.03 0.00
VB457773 2,098 3.82 1.08 3.82 1.10 0.00 0.47 0.80 61 97 0.80 3.85 1.11 0.40 0.75 55 95 3.85 1.07 0.03 0.77 -0.05 -0.03
VB457774 1,787 3.95 1.10 3.93 1.08 -0.01 0.47 0.79 60 97 0.79 3.94 1.06 0.37 0.73 54 95 3.93 1.03 -0.01 0.75 -0.06 -0.04
VB457775 1,299 3.84 1.14 3.86 1.12 0.02 0.46 0.81 59 97 0.81 3.85 1.09 0.36 0.72 52 94 3.84 1.07 0.00 0.74 -0.09 -0.07
VB457776 1,660 3.84 1.11 3.82 1.10 -0.02 0.47 0.80 60 97 0.80 3.84 1.12 0.37 0.74 53 95 3.84 1.09 0.00 0.76 -0.06 -0.04
VB459256 742 3.64 1.01 3.65 1.05 0.02 0.38 0.73 55 96 0.73 3.68 1.11 0.38 0.72 54 95 3.67 1.08 0.04 0.76 -0.01 0.03
VB459258 2,494 3.58 1.12 3.58 1.11 0.00 0.43 0.78 57 96 0.78 3.56 1.10 0.35 0.72 51 94 3.56 1.08 -0.02 0.75 -0.06 -0.03
VB459914 2,494 3.68 1.10 3.70 1.10 0.02 0.44 0.79 58 97 0.79 3.72 1.09 0.36 0.71 52 94 3.72 1.07 0.03 0.73 -0.08 -0.06
VB461783 2,495 3.76 1.08 3.74 1.07 -0.02 0.42 0.77 57 97 0.77 3.78 1.10 0.38 0.74 54 95 3.77 1.07 0.01 0.76 -0.03 -0.01
VB461793 2,493 3.67 1.07 3.67 1.07 0.00 0.43 0.76 57 96 0.76 3.65 1.09 0.33 0.69 50 93 3.65 1.07 -0.02 0.72 -0.07 -0.04
VB461797 2,491 3.74 1.11 3.74 1.08 0.00 0.46 0.79 60 97 0.79 3.71 1.11 0.36 0.73 52 95 3.71 1.09 -0.03 0.76 -0.06 -0.03
VB461799 2,265 3.91 1.11 3.90 1.10 -0.01 0.44 0.77 57 96 0.77 3.94 1.07 0.39 0.74 54 95 3.93 1.05 0.02 0.77 -0.03 0.00
VB462970 1,283 3.52 1.15 3.57 1.18 0.04 0.47 0.82 59 97 0.82 3.54 1.11 0.34 0.71 49 94 3.51 1.10 -0.01 0.74 -0.11 -0.08
VB462972 2,490 3.63 1.11 3.65 1.11 0.02 0.48 0.81 61 97 0.81 3.70 1.11 0.35 0.72 51 94 3.69 1.08 0.05 0.74 -0.09 -0.07
VP000344 2,494 3.62 1.22 3.61 1.21 -0.01 0.49 0.83 61 97 0.83 3.64 1.12 0.32 0.72 48 93 3.64 1.10 0.01 0.74 -0.11 -0.09
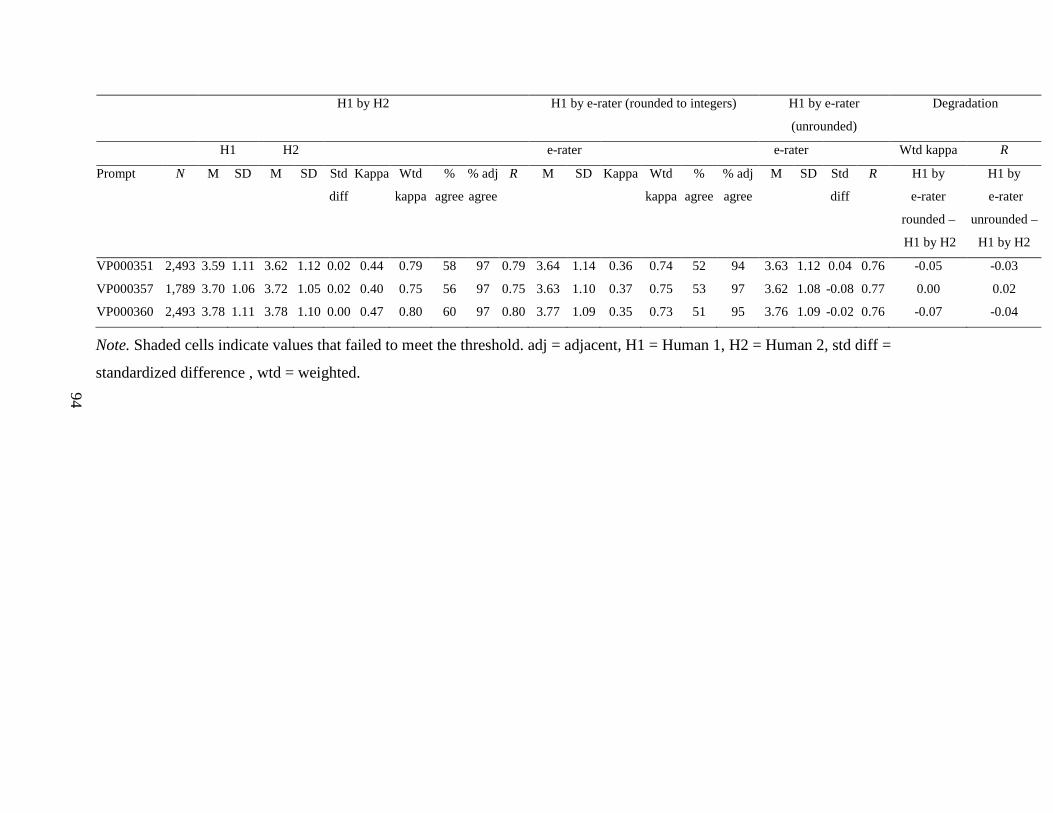
94
H1 by H2 H1 by e-rater (rounded to integers) H1 by e-rater
(unrounded)
Degradation
H1 H2 e-rater e-rater Wtd kappa R
Prompt N M SD M SD Std
diff
Kappa Wtd
kappa
%
agree
% adj
agree
R M SD Kappa Wtd
kappa
%
agree
% adj
agree
M SD Std
diff
R H1 by
e-rater
rounded –
H1 by H2
H1 by
e-rater
unrounded –
H1 by H2
VP000351 2,493 3.59 1.11 3.62 1.12 0.02 0.44 0.79 58 97 0.79 3.64 1.14 0.36 0.74 52 94 3.63 1.12 0.04 0.76 -0.05 -0.03
VP000357 1,789 3.70 1.06 3.72 1.05 0.02 0.40 0.75 56 97 0.75 3.63 1.10 0.37 0.75 53 97 3.62 1.08 -0.08 0.77 0.00 0.02
VP000360 2,493 3.78 1.11 3.78 1.10 0.00 0.47 0.80 60 97 0.80 3.77 1.09 0.35 0.73 51 95 3.76 1.09 -0.02 0.76 -0.07 -0.04
Note. Shaded cells indicate values that failed to meet the threshold. adj = adjacent, H1 = Human 1, H2 = Human 2, std diff =
standardized difference , wtd = weighted.
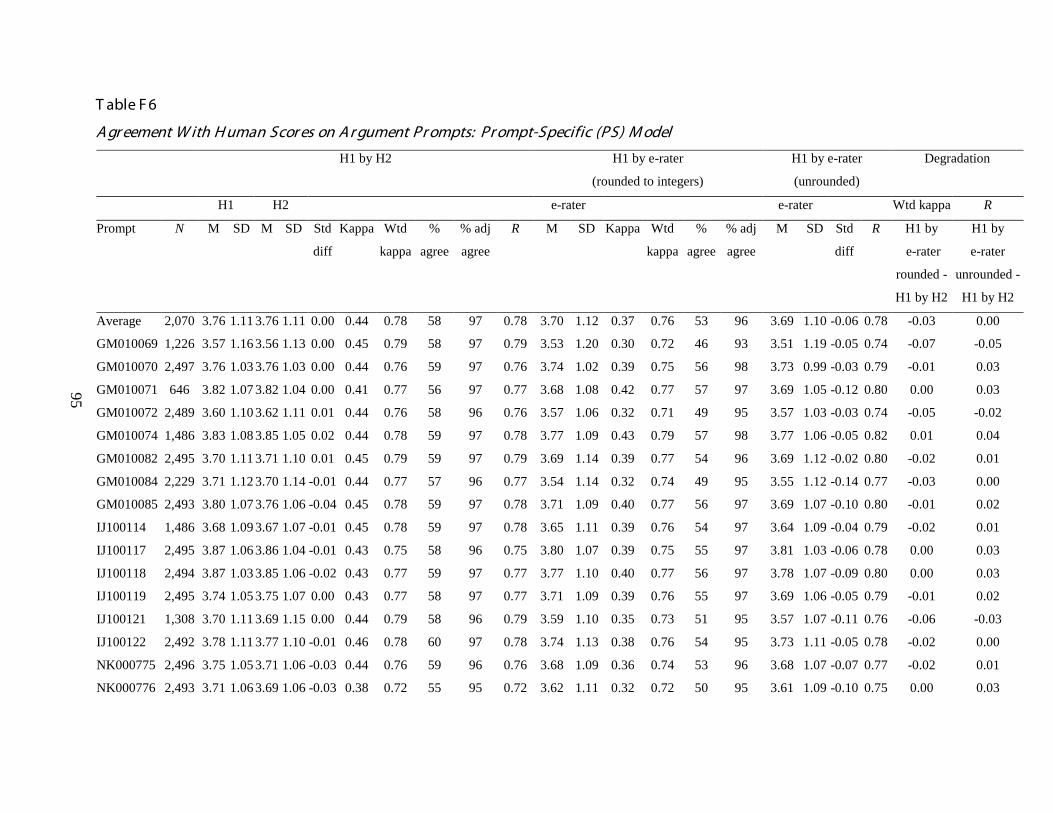
95
T able F 6
A gr eement W ith H uman Scor es on A r gument Pr ompts: Pr ompt-Specific (PS) M odel
H1 by H2 H1 by e-rater
(rounded to integers)
H1 by e-rater
(unrounded)
Degradation
H1 H2 e-rater e-rater Wtd kappa R
Prompt N M SD M SD Std
diff
Kappa Wtd
kappa
%
agree
% adj
agree
R M SD Kappa Wtd
kappa
%
agree
% adj
agree
M SD Std
diff
R H1 by
e-rater
rounded -
H1 by H2
H1 by
e-rater
unrounded -
H1 by H2
Average 2,070 3.76 1.11 3.76 1.11 0.00 0.44 0.78 58 97 0.78 3.70 1.12 0.37 0.76 53 96 3.69 1.10 -0.06 0.78 -0.03 0.00
GM010069 1,226 3.57 1.16 3.56 1.13 0.00 0.45 0.79 58 97 0.79 3.53 1.20 0.30 0.72 46 93 3.51 1.19 -0.05 0.74 -0.07 -0.05
GM010070 2,497 3.76 1.03 3.76 1.03 0.00 0.44 0.76 59 97 0.76 3.74 1.02 0.39 0.75 56 98 3.73 0.99 -0.03 0.79 -0.01 0.03
GM010071 646 3.82 1.07 3.82 1.04 0.00 0.41 0.77 56 97 0.77 3.68 1.08 0.42 0.77 57 97 3.69 1.05 -0.12 0.80 0.00 0.03
GM010072 2,489 3.60 1.10 3.62 1.11 0.01 0.44 0.76 58 96 0.76 3.57 1.06 0.32 0.71 49 95 3.57 1.03 -0.03 0.74 -0.05 -0.02
GM010074 1,486 3.83 1.08 3.85 1.05 0.02 0.44 0.78 59 97 0.78 3.77 1.09 0.43 0.79 57 98 3.77 1.06 -0.05 0.82 0.01 0.04
GM010082 2,495 3.70 1.11 3.71 1.10 0.01 0.45 0.79 59 97 0.79 3.69 1.14 0.39 0.77 54 96 3.69 1.12 -0.02 0.80 -0.02 0.01
GM010084 2,229 3.71 1.12 3.70 1.14 -0.01 0.44 0.77 57 96 0.77 3.54 1.14 0.32 0.74 49 95 3.55 1.12 -0.14 0.77 -0.03 0.00
GM010085 2,493 3.80 1.07 3.76 1.06 -0.04 0.45 0.78 59 97 0.78 3.71 1.09 0.40 0.77 56 97 3.69 1.07 -0.10 0.80 -0.01 0.02
IJ100114 1,486 3.68 1.09 3.67 1.07 -0.01 0.45 0.78 59 97 0.78 3.65 1.11 0.39 0.76 54 97 3.64 1.09 -0.04 0.79 -0.02 0.01
IJ100117 2,495 3.87 1.06 3.86 1.04 -0.01 0.43 0.75 58 96 0.75 3.80 1.07 0.39 0.75 55 97 3.81 1.03 -0.06 0.78 0.00 0.03
IJ100118 2,494 3.87 1.03 3.85 1.06 -0.02 0.43 0.77 59 97 0.77 3.77 1.10 0.40 0.77 56 97 3.78 1.07 -0.09 0.80 0.00 0.03
IJ100119 2,495 3.74 1.05 3.75 1.07 0.00 0.43 0.77 58 97 0.77 3.71 1.09 0.39 0.76 55 97 3.69 1.06 -0.05 0.79 -0.01 0.02
IJ100121 1,308 3.70 1.11 3.69 1.15 0.00 0.44 0.79 58 96 0.79 3.59 1.10 0.35 0.73 51 95 3.57 1.07 -0.11 0.76 -0.06 -0.03
IJ100122 2,492 3.78 1.11 3.77 1.10 -0.01 0.46 0.78 60 97 0.78 3.74 1.13 0.38 0.76 54 95 3.73 1.11 -0.05 0.78 -0.02 0.00
NK000775 2,496 3.75 1.05 3.71 1.06 -0.03 0.44 0.76 59 96 0.76 3.68 1.09 0.36 0.74 53 96 3.68 1.07 -0.07 0.77 -0.02 0.01
NK000776 2,493 3.71 1.06 3.69 1.06 -0.03 0.38 0.72 55 95 0.72 3.62 1.11 0.32 0.72 50 95 3.61 1.09 -0.10 0.75 0.00 0.03
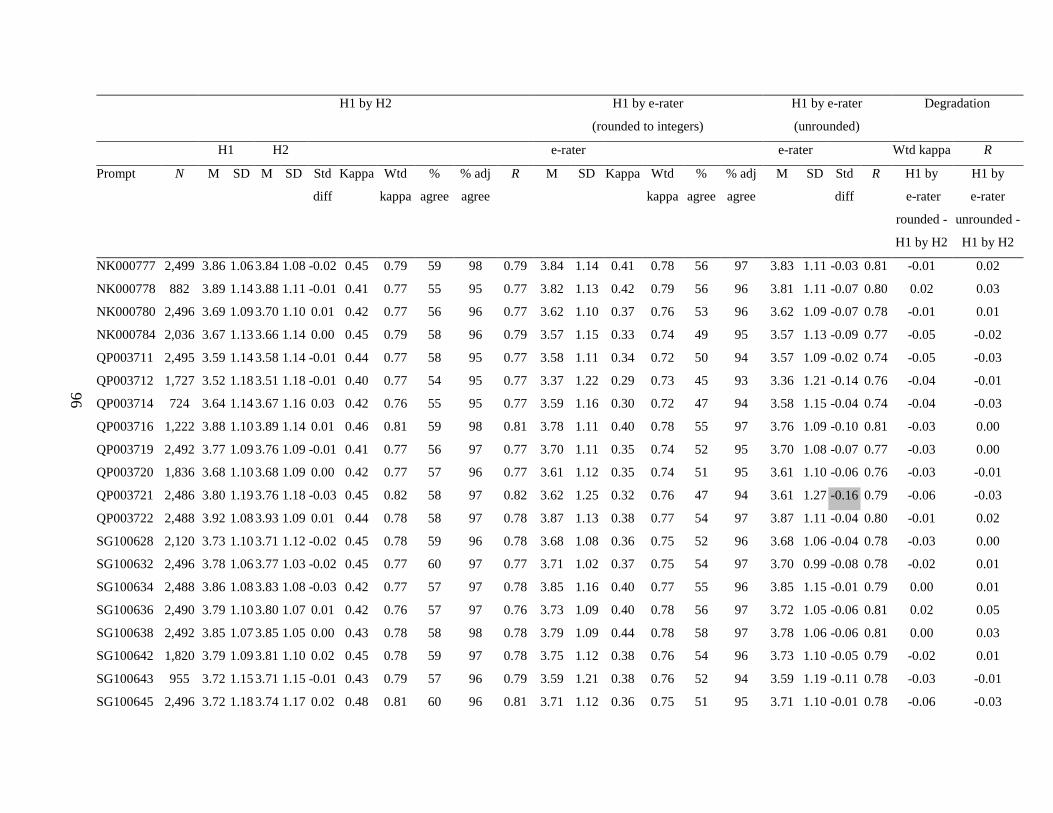
96
H1 by H2 H1 by e-rater
(rounded to integers)
H1 by e-rater
(unrounded)
Degradation
H1 H2 e-rater e-rater Wtd kappa R
Prompt N M SD M SD Std
diff
Kappa Wtd
kappa
%
agree
% adj
agree
R M SD Kappa Wtd
kappa
%
agree
% adj
agree
M SD Std
diff
R H1 by
e-rater
rounded -
H1 by H2
H1 by
e-rater
unrounded -
H1 by H2
NK000777 2,499 3.86 1.06 3.84 1.08 -0.02 0.45 0.79 59 98 0.79 3.84 1.14 0.41 0.78 56 97 3.83 1.11 -0.03 0.81 -0.01 0.02
NK000778 882 3.89 1.14 3.88 1.11 -0.01 0.41 0.77 55 95 0.77 3.82 1.13 0.42 0.79 56 96 3.81 1.11 -0.07 0.80 0.02 0.03
NK000780 2,496 3.69 1.09 3.70 1.10 0.01 0.42 0.77 56 96 0.77 3.62 1.10 0.37 0.76 53 96 3.62 1.09 -0.07 0.78 -0.01 0.01
NK000784 2,036 3.67 1.13 3.66 1.14 0.00 0.45 0.79 58 96 0.79 3.57 1.15 0.33 0.74 49 95 3.57 1.13 -0.09 0.77 -0.05 -0.02
QP003711 2,495 3.59 1.14 3.58 1.14 -0.01 0.44 0.77 58 95 0.77 3.58 1.11 0.34 0.72 50 94 3.57 1.09 -0.02 0.74 -0.05 -0.03
QP003712 1,727 3.52 1.18 3.51 1.18 -0.01 0.40 0.77 54 95 0.77 3.37 1.22 0.29 0.73 45 93 3.36 1.21 -0.14 0.76 -0.04 -0.01
QP003714 724 3.64 1.14 3.67 1.16 0.03 0.42 0.76 55 95 0.77 3.59 1.16 0.30 0.72 47 94 3.58 1.15 -0.04 0.74 -0.04 -0.03
QP003716 1,222 3.88 1.10 3.89 1.14 0.01 0.46 0.81 59 98 0.81 3.78 1.11 0.40 0.78 55 97 3.76 1.09 -0.10 0.81 -0.03 0.00
QP003719 2,492 3.77 1.09 3.76 1.09 -0.01 0.41 0.77 56 97 0.77 3.70 1.11 0.35 0.74 52 95 3.70 1.08 -0.07 0.77 -0.03 0.00
QP003720 1,836 3.68 1.10 3.68 1.09 0.00 0.42 0.77 57 96 0.77 3.61 1.12 0.35 0.74 51 95 3.61 1.10 -0.06 0.76 -0.03 -0.01
QP003721 2,486 3.80 1.19 3.76 1.18 -0.03 0.45 0.82 58 97 0.82 3.62 1.25 0.32 0.76 47 94 3.61 1.27 -0.16 0.79 -0.06 -0.03
QP003722 2,488 3.92 1.08 3.93 1.09 0.01 0.44 0.78 58 97 0.78 3.87 1.13 0.38 0.77 54 97 3.87 1.11 -0.04 0.80 -0.01 0.02
SG100628 2,120 3.73 1.10 3.71 1.12 -0.02 0.45 0.78 59 96 0.78 3.68 1.08 0.36 0.75 52 96 3.68 1.06 -0.04 0.78 -0.03 0.00
SG100632 2,496 3.78 1.06 3.77 1.03 -0.02 0.45 0.77 60 97 0.77 3.71 1.02 0.37 0.75 54 97 3.70 0.99 -0.08 0.78 -0.02 0.01
SG100634 2,488 3.86 1.08 3.83 1.08 -0.03 0.42 0.77 57 97 0.78 3.85 1.16 0.40 0.77 55 96 3.85 1.15 -0.01 0.79 0.00 0.01
SG100636 2,490 3.79 1.10 3.80 1.07 0.01 0.42 0.76 57 97 0.76 3.73 1.09 0.40 0.78 56 97 3.72 1.05 -0.06 0.81 0.02 0.05
SG100638 2,492 3.85 1.07 3.85 1.05 0.00 0.43 0.78 58 98 0.78 3.79 1.09 0.44 0.78 58 97 3.78 1.06 -0.06 0.81 0.00 0.03
SG100642 1,820 3.79 1.09 3.81 1.10 0.02 0.45 0.78 59 97 0.78 3.75 1.12 0.38 0.76 54 96 3.73 1.10 -0.05 0.79 -0.02 0.01
SG100643 955 3.72 1.15 3.71 1.15 -0.01 0.43 0.79 57 96 0.79 3.59 1.21 0.38 0.76 52 94 3.59 1.19 -0.11 0.78 -0.03 -0.01
SG100645 2,496 3.72 1.18 3.74 1.17 0.02 0.48 0.81 60 96 0.81 3.71 1.12 0.36 0.75 51 95 3.71 1.10 -0.01 0.78 -0.06 -0.03
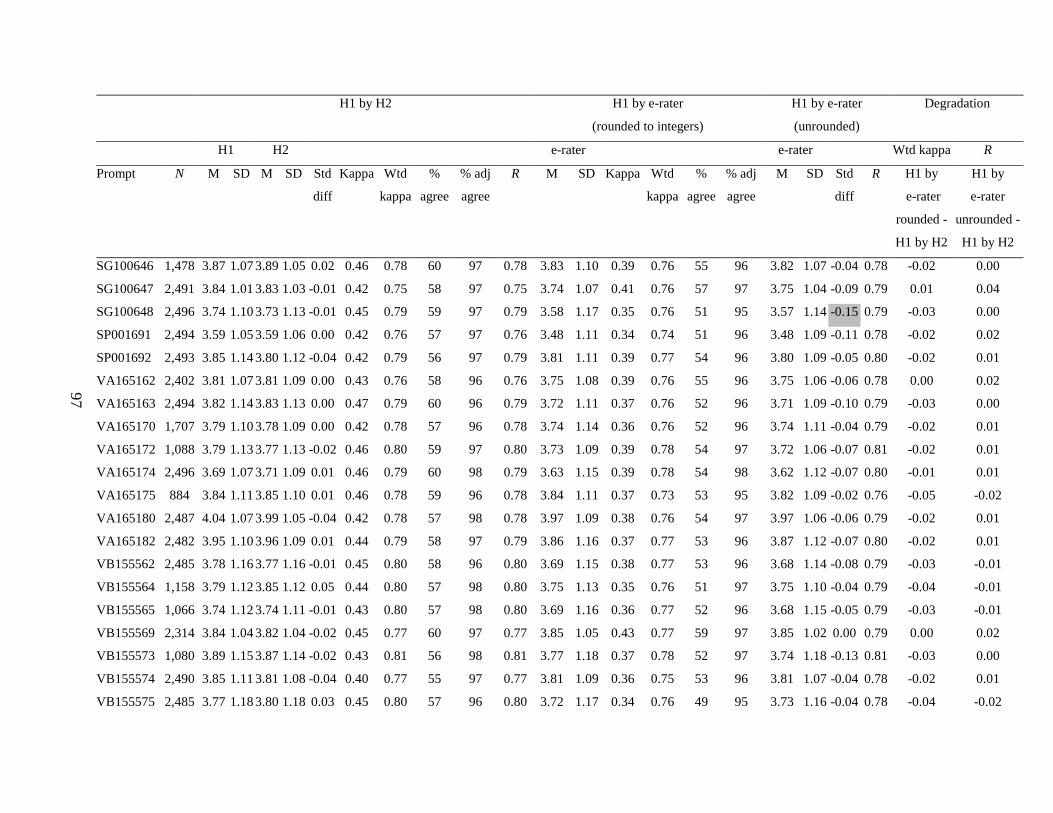
97
H1 by H2 H1 by e-rater
(rounded to integers)
H1 by e-rater
(unrounded)
Degradation
H1 H2 e-rater e-rater Wtd kappa R
Prompt N M SD M SD Std
diff
Kappa Wtd
kappa
%
agree
% adj
agree
R M SD Kappa Wtd
kappa
%
agree
% adj
agree
M SD Std
diff
R H1 by
e-rater
rounded -
H1 by H2
H1 by
e-rater
unrounded -
H1 by H2
SG100646 1,478 3.87 1.07 3.89 1.05 0.02 0.46 0.78 60 97 0.78 3.83 1.10 0.39 0.76 55 96 3.82 1.07 -0.04 0.78 -0.02 0.00
SG100647 2,491 3.84 1.01 3.83 1.03 -0.01 0.42 0.75 58 97 0.75 3.74 1.07 0.41 0.76 57 97 3.75 1.04 -0.09 0.79 0.01 0.04
SG100648 2,496 3.74 1.10 3.73 1.13 -0.01 0.45 0.79 59 97 0.79 3.58 1.17 0.35 0.76 51 95 3.57 1.14 -0.15 0.79 -0.03 0.00
SP001691 2,494 3.59 1.05 3.59 1.06 0.00 0.42 0.76 57 97 0.76 3.48 1.11 0.34 0.74 51 96 3.48 1.09 -0.11 0.78 -0.02 0.02
SP001692 2,493 3.85 1.14 3.80 1.12 -0.04 0.42 0.79 56 97 0.79 3.81 1.11 0.39 0.77 54 96 3.80 1.09 -0.05 0.80 -0.02 0.01
VA165162 2,402 3.81 1.07 3.81 1.09 0.00 0.43 0.76 58 96 0.76 3.75 1.08 0.39 0.76 55 96 3.75 1.06 -0.06 0.78 0.00 0.02
VA165163 2,494 3.82 1.14 3.83 1.13 0.00 0.47 0.79 60 96 0.79 3.72 1.11 0.37 0.76 52 96 3.71 1.09 -0.10 0.79 -0.03 0.00
VA165170 1,707 3.79 1.10 3.78 1.09 0.00 0.42 0.78 57 96 0.78 3.74 1.14 0.36 0.76 52 96 3.74 1.11 -0.04 0.79 -0.02 0.01
VA165172 1,088 3.79 1.13 3.77 1.13 -0.02 0.46 0.80 59 97 0.80 3.73 1.09 0.39 0.78 54 97 3.72 1.06 -0.07 0.81 -0.02 0.01
VA165174 2,496 3.69 1.07 3.71 1.09 0.01 0.46 0.79 60 98 0.79 3.63 1.15 0.39 0.78 54 98 3.62 1.12 -0.07 0.80 -0.01 0.01
VA165175 884 3.84 1.11 3.85 1.10 0.01 0.46 0.78 59 96 0.78 3.84 1.11 0.37 0.73 53 95 3.82 1.09 -0.02 0.76 -0.05 -0.02
VA165180 2,487 4.04 1.07 3.99 1.05 -0.04 0.42 0.78 57 98 0.78 3.97 1.09 0.38 0.76 54 97 3.97 1.06 -0.06 0.79 -0.02 0.01
VA165182 2,482 3.95 1.10 3.96 1.09 0.01 0.44 0.79 58 97 0.79 3.86 1.16 0.37 0.77 53 96 3.87 1.12 -0.07 0.80 -0.02 0.01
VB155562 2,485 3.78 1.16 3.77 1.16 -0.01 0.45 0.80 58 96 0.80 3.69 1.15 0.38 0.77 53 96 3.68 1.14 -0.08 0.79 -0.03 -0.01
VB155564 1,158 3.79 1.12 3.85 1.12 0.05 0.44 0.80 57 98 0.80 3.75 1.13 0.35 0.76 51 97 3.75 1.10 -0.04 0.79 -0.04 -0.01
VB155565 1,066 3.74 1.12 3.74 1.11 -0.01 0.43 0.80 57 98 0.80 3.69 1.16 0.36 0.77 52 96 3.68 1.15 -0.05 0.79 -0.03 -0.01
VB155569 2,314 3.84 1.04 3.82 1.04 -0.02 0.45 0.77 60 97 0.77 3.85 1.05 0.43 0.77 59 97 3.85 1.02 0.00 0.79 0.00 0.02
VB155573 1,080 3.89 1.15 3.87 1.14 -0.02 0.43 0.81 56 98 0.81 3.77 1.18 0.37 0.78 52 97 3.74 1.18 -0.13 0.81 -0.03 0.00
VB155574 2,490 3.85 1.11 3.81 1.08 -0.04 0.40 0.77 55 97 0.77 3.81 1.09 0.36 0.75 53 96 3.81 1.07 -0.04 0.78 -0.02 0.01
VB155575 2,485 3.77 1.18 3.80 1.18 0.03 0.45 0.80 57 96 0.80 3.72 1.17 0.34 0.76 49 95 3.73 1.16 -0.04 0.78 -0.04 -0.02

98
H1 by H2 H1 by e-rater
(rounded to integers)
H1 by e-rater
(unrounded)
Degradation
H1 H2 e-rater e-rater Wtd kappa R
Prompt N M SD M SD Std
diff
Kappa Wtd
kappa
%
agree
% adj
agree
R M SD Kappa Wtd
kappa
%
agree
% adj
agree
M SD Std
diff
R H1 by
e-rater
rounded -
H1 by H2
H1 by
e-rater
unrounded -
H1 by H2
VB156707 2,152 3.75 1.09 3.76 1.08 0.01 0.40 0.73 55 95 0.73 3.62 1.12 0.34 0.73 50 95 3.62 1.10 -0.12 0.77 0.00 0.04
VB156806 1,066 3.74 1.14 3.74 1.12 0.00 0.42 0.77 56 96 0.77 3.66 1.15 0.34 0.74 50 95 3.63 1.13 -0.10 0.77 -0.03 0.00
VB158584 2,489 3.78 1.12 3.80 1.12 0.02 0.46 0.81 59 97 0.81 3.76 1.17 0.38 0.77 53 96 3.75 1.15 -0.02 0.80 -0.04 -0.01
VB158585 2,494 3.80 1.14 3.77 1.11 -0.03 0.45 0.80 58 97 0.80 3.67 1.11 0.33 0.74 50 95 3.67 1.08 -0.11 0.76 -0.06 -0.04
VB158614 2,494 3.65 1.14 3.65 1.13 0.00 0.47 0.80 60 97 0.80 3.62 1.11 0.37 0.75 53 96 3.62 1.09 -0.03 0.78 -0.05 -0.02
VB158615 904 3.64 1.14 3.69 1.16 0.04 0.41 0.77 55 95 0.77 3.65 1.15 0.31 0.73 48 95 3.65 1.12 0.01 0.75 -0.04 -0.02
VB158617 2,486 3.68 1.13 3.65 1.11 -0.03 0.48 0.79 60 96 0.79 3.60 1.08 0.37 0.74 52 95 3.59 1.06 -0.08 0.77 -0.05 -0.02
VB158619 2,499 3.73 1.08 3.72 1.08 -0.01 0.46 0.78 60 97 0.78 3.66 1.09 0.38 0.76 54 96 3.65 1.07 -0.07 0.79 -0.02 0.01
VB158620 2,491 3.92 1.13 3.87 1.12 -0.04 0.48 0.82 61 98 0.82 3.87 1.15 0.39 0.78 55 96 3.87 1.12 -0.04 0.80 -0.04 -0.02
VB161364 379 3.71 1.12 3.73 1.12 0.02 0.37 0.76 53 96 0.76 3.69 1.09 0.42 0.76 56 95 3.68 1.07 -0.03 0.77 0.00 0.01
VB161365 2,376 3.81 1.15 3.83 1.17 0.02 0.43 0.78 57 96 0.78 3.72 1.16 0.37 0.77 52 96 3.71 1.15 -0.08 0.79 -0.01 0.01
VB161421 1,592 3.95 1.14 3.95 1.14 0.01 0.43 0.79 57 96 0.79 3.83 1.19 0.36 0.77 52 96 3.81 1.17 -0.12 0.80 -0.02 0.01
VB161422 2,494 3.74 1.13 3.71 1.13 -0.03 0.47 0.78 60 96 0.79 3.67 1.12 0.38 0.76 53 95 3.67 1.08 -0.07 0.78 -0.02 -0.01
VB161423 2,489 3.77 1.16 3.76 1.15 -0.01 0.46 0.80 59 96 0.80 3.77 1.14 0.37 0.77 52 96 3.77 1.11 0.00 0.79 -0.03 -0.01
VB161426 1,681 3.67 1.08 3.68 1.07 0.01 0.49 0.80 62 98 0.80 3.69 1.09 0.41 0.75 56 95 3.69 1.05 0.01 0.77 -0.05 -0.03
VB161428 2,416 3.62 1.14 3.61 1.15 -0.01 0.46 0.79 59 96 0.79 3.54 1.18 0.32 0.72 48 94 3.52 1.16 -0.08 0.75 -0.07 -0.04
VB161430 2,484 3.64 1.19 3.63 1.19 -0.01 0.48 0.82 60 96 0.82 3.59 1.19 0.36 0.78 50 96 3.58 1.17 -0.05 0.80 -0.04 -0.02
VB161432 1,558 3.74 1.14 3.70 1.12 -0.03 0.41 0.78 56 96 0.78 3.63 1.17 0.36 0.76 51 95 3.63 1.16 -0.10 0.79 -0.02 0.01
VB161433 2,492 3.70 1.19 3.73 1.18 0.02 0.48 0.82 60 97 0.82 3.66 1.18 0.35 0.74 50 94 3.65 1.15 -0.04 0.76 -0.08 -0.06
VB161447 1,281 3.94 1.10 3.95 1.10 0.01 0.46 0.80 60 97 0.80 3.93 1.14 0.39 0.76 54 96 3.93 1.12 -0.01 0.79 -0.04 -0.01
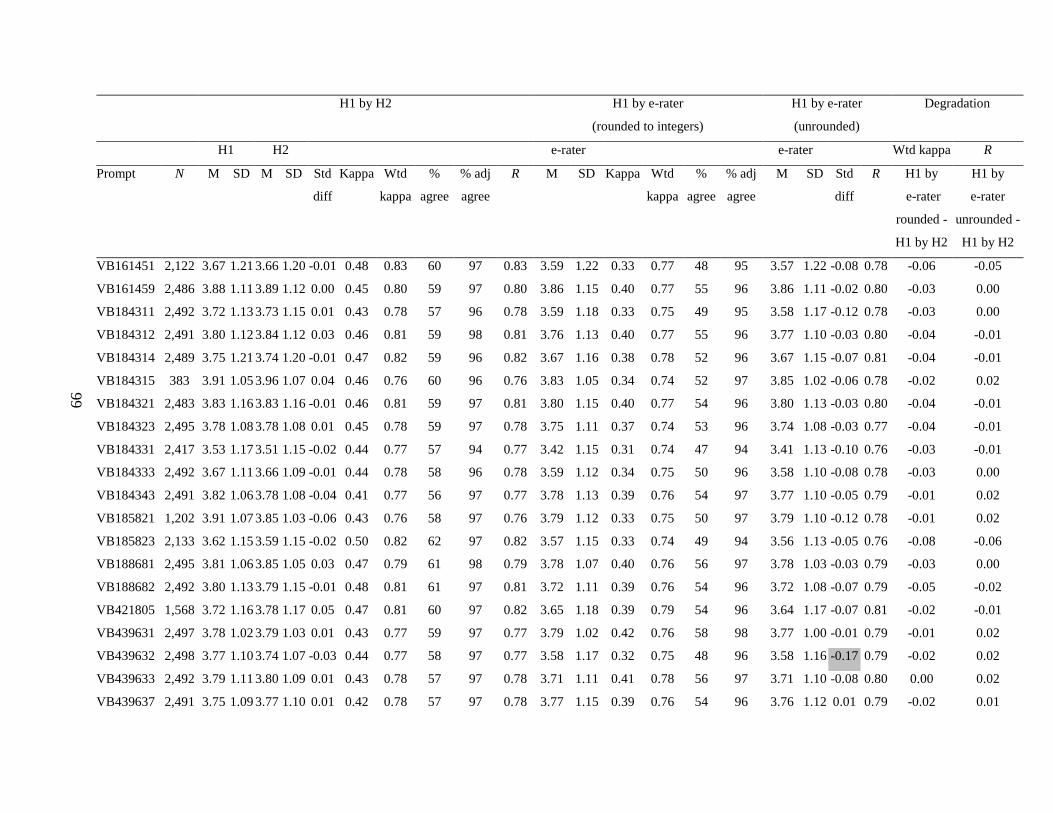
99
H1 by H2 H1 by e-rater
(rounded to integers)
H1 by e-rater
(unrounded)
Degradation
H1 H2 e-rater e-rater Wtd kappa R
Prompt N M SD M SD Std
diff
Kappa Wtd
kappa
%
agree
% adj
agree
R M SD Kappa Wtd
kappa
%
agree
% adj
agree
M SD Std
diff
R H1 by
e-rater
rounded -
H1 by H2
H1 by
e-rater
unrounded -
H1 by H2
VB161451 2,122 3.67 1.21 3.66 1.20 -0.01 0.48 0.83 60 97 0.83 3.59 1.22 0.33 0.77 48 95 3.57 1.22 -0.08 0.78 -0.06 -0.05
VB161459 2,486 3.88 1.11 3.89 1.12 0.00 0.45 0.80 59 97 0.80 3.86 1.15 0.40 0.77 55 96 3.86 1.11 -0.02 0.80 -0.03 0.00
VB184311 2,492 3.72 1.13 3.73 1.15 0.01 0.43 0.78 57 96 0.78 3.59 1.18 0.33 0.75 49 95 3.58 1.17 -0.12 0.78 -0.03 0.00
VB184312 2,491 3.80 1.12 3.84 1.12 0.03 0.46 0.81 59 98 0.81 3.76 1.13 0.40 0.77 55 96 3.77 1.10 -0.03 0.80 -0.04 -0.01
VB184314 2,489 3.75 1.21 3.74 1.20 -0.01 0.47 0.82 59 96 0.82 3.67 1.16 0.38 0.78 52 96 3.67 1.15 -0.07 0.81 -0.04 -0.01
VB184315 383 3.91 1.05 3.96 1.07 0.04 0.46 0.76 60 96 0.76 3.83 1.05 0.34 0.74 52 97 3.85 1.02 -0.06 0.78 -0.02 0.02
VB184321 2,483 3.83 1.16 3.83 1.16 -0.01 0.46 0.81 59 97 0.81 3.80 1.15 0.40 0.77 54 96 3.80 1.13 -0.03 0.80 -0.04 -0.01
VB184323 2,495 3.78 1.08 3.78 1.08 0.01 0.45 0.78 59 97 0.78 3.75 1.11 0.37 0.74 53 96 3.74 1.08 -0.03 0.77 -0.04 -0.01
VB184331 2,417 3.53 1.17 3.51 1.15 -0.02 0.44 0.77 57 94 0.77 3.42 1.15 0.31 0.74 47 94 3.41 1.13 -0.10 0.76 -0.03 -0.01
VB184333 2,492 3.67 1.11 3.66 1.09 -0.01 0.44 0.78 58 96 0.78 3.59 1.12 0.34 0.75 50 96 3.58 1.10 -0.08 0.78 -0.03 0.00
VB184343 2,491 3.82 1.06 3.78 1.08 -0.04 0.41 0.77 56 97 0.77 3.78 1.13 0.39 0.76 54 97 3.77 1.10 -0.05 0.79 -0.01 0.02
VB185821 1,202 3.91 1.07 3.85 1.03 -0.06 0.43 0.76 58 97 0.76 3.79 1.12 0.33 0.75 50 97 3.79 1.10 -0.12 0.78 -0.01 0.02
VB185823 2,133 3.62 1.15 3.59 1.15 -0.02 0.50 0.82 62 97 0.82 3.57 1.15 0.33 0.74 49 94 3.56 1.13 -0.05 0.76 -0.08 -0.06
VB188681 2,495 3.81 1.06 3.85 1.05 0.03 0.47 0.79 61 98 0.79 3.78 1.07 0.40 0.76 56 97 3.78 1.03 -0.03 0.79 -0.03 0.00
VB188682 2,492 3.80 1.13 3.79 1.15 -0.01 0.48 0.81 61 97 0.81 3.72 1.11 0.39 0.76 54 96 3.72 1.08 -0.07 0.79 -0.05 -0.02
VB421805 1,568 3.72 1.16 3.78 1.17 0.05 0.47 0.81 60 97 0.82 3.65 1.18 0.39 0.79 54 96 3.64 1.17 -0.07 0.81 -0.02 -0.01
VB439631 2,497 3.78 1.02 3.79 1.03 0.01 0.43 0.77 59 97 0.77 3.79 1.02 0.42 0.76 58 98 3.77 1.00 -0.01 0.79 -0.01 0.02
VB439632 2,498 3.77 1.10 3.74 1.07 -0.03 0.44 0.77 58 97 0.77 3.58 1.17 0.32 0.75 48 96 3.58 1.16 -0.17 0.79 -0.02 0.02
VB439633 2,492 3.79 1.11 3.80 1.09 0.01 0.43 0.78 57 97 0.78 3.71 1.11 0.41 0.78 56 97 3.71 1.10 -0.08 0.80 0.00 0.02
VB439637 2,491 3.75 1.09 3.77 1.10 0.01 0.42 0.78 57 97 0.78 3.77 1.15 0.39 0.76 54 96 3.76 1.12 0.01 0.79 -0.02 0.01
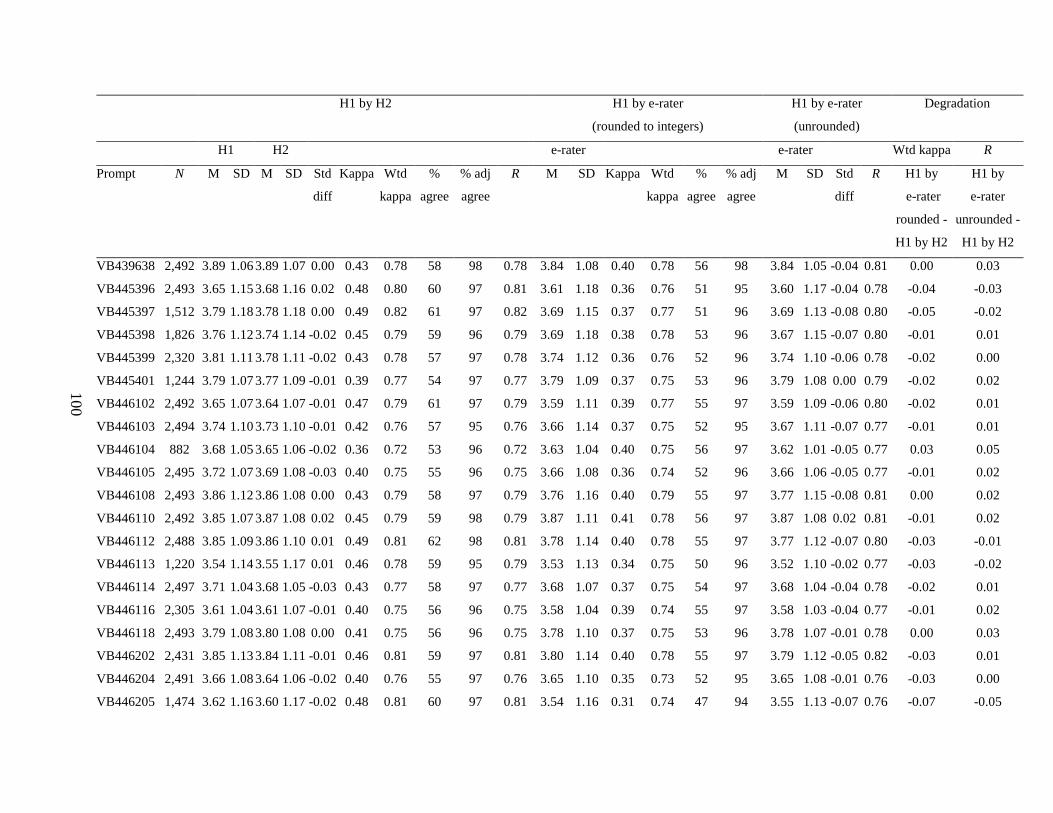
100
H1 by H2 H1 by e-rater
(rounded to integers)
H1 by e-rater
(unrounded)
Degradation
H1 H2 e-rater e-rater Wtd kappa R
Prompt N M SD M SD Std
diff
Kappa Wtd
kappa
%
agree
% adj
agree
R M SD Kappa Wtd
kappa
%
agree
% adj
agree
M SD Std
diff
R H1 by
e-rater
rounded -
H1 by H2
H1 by
e-rater
unrounded -
H1 by H2
VB439638 2,492 3.89 1.06 3.89 1.07 0.00 0.43 0.78 58 98 0.78 3.84 1.08 0.40 0.78 56 98 3.84 1.05 -0.04 0.81 0.00 0.03
VB445396 2,493 3.65 1.15 3.68 1.16 0.02 0.48 0.80 60 97 0.81 3.61 1.18 0.36 0.76 51 95 3.60 1.17 -0.04 0.78 -0.04 -0.03
VB445397 1,512 3.79 1.18 3.78 1.18 0.00 0.49 0.82 61 97 0.82 3.69 1.15 0.37 0.77 51 96 3.69 1.13 -0.08 0.80 -0.05 -0.02
VB445398 1,826 3.76 1.12 3.74 1.14 -0.02 0.45 0.79 59 96 0.79 3.69 1.18 0.38 0.78 53 96 3.67 1.15 -0.07 0.80 -0.01 0.01
VB445399 2,320 3.81 1.11 3.78 1.11 -0.02 0.43 0.78 57 97 0.78 3.74 1.12 0.36 0.76 52 96 3.74 1.10 -0.06 0.78 -0.02 0.00
VB445401 1,244 3.79 1.07 3.77 1.09 -0.01 0.39 0.77 54 97 0.77 3.79 1.09 0.37 0.75 53 96 3.79 1.08 0.00 0.79 -0.02 0.02
VB446102 2,492 3.65 1.07 3.64 1.07 -0.01 0.47 0.79 61 97 0.79 3.59 1.11 0.39 0.77 55 97 3.59 1.09 -0.06 0.80 -0.02 0.01
VB446103 2,494 3.74 1.10 3.73 1.10 -0.01 0.42 0.76 57 95 0.76 3.66 1.14 0.37 0.75 52 95 3.67 1.11 -0.07 0.77 -0.01 0.01
VB446104 882 3.68 1.05 3.65 1.06 -0.02 0.36 0.72 53 96 0.72 3.63 1.04 0.40 0.75 56 97 3.62 1.01 -0.05 0.77 0.03 0.05
VB446105 2,495 3.72 1.07 3.69 1.08 -0.03 0.40 0.75 55 96 0.75 3.66 1.08 0.36 0.74 52 96 3.66 1.06 -0.05 0.77 -0.01 0.02
VB446108 2,493 3.86 1.12 3.86 1.08 0.00 0.43 0.79 58 97 0.79 3.76 1.16 0.40 0.79 55 97 3.77 1.15 -0.08 0.81 0.00 0.02
VB446110 2,492 3.85 1.07 3.87 1.08 0.02 0.45 0.79 59 98 0.79 3.87 1.11 0.41 0.78 56 97 3.87 1.08 0.02 0.81 -0.01 0.02
VB446112 2,488 3.85 1.09 3.86 1.10 0.01 0.49 0.81 62 98 0.81 3.78 1.14 0.40 0.78 55 97 3.77 1.12 -0.07 0.80 -0.03 -0.01
VB446113 1,220 3.54 1.14 3.55 1.17 0.01 0.46 0.78 59 95 0.79 3.53 1.13 0.34 0.75 50 96 3.52 1.10 -0.02 0.77 -0.03 -0.02
VB446114 2,497 3.71 1.04 3.68 1.05 -0.03 0.43 0.77 58 97 0.77 3.68 1.07 0.37 0.75 54 97 3.68 1.04 -0.04 0.78 -0.02 0.01
VB446116 2,305 3.61 1.04 3.61 1.07 -0.01 0.40 0.75 56 96 0.75 3.58 1.04 0.39 0.74 55 97 3.58 1.03 -0.04 0.77 -0.01 0.02
VB446118 2,493 3.79 1.08 3.80 1.08 0.00 0.41 0.75 56 96 0.75 3.78 1.10 0.37 0.75 53 96 3.78 1.07 -0.01 0.78 0.00 0.03
VB446202 2,431 3.85 1.13 3.84 1.11 -0.01 0.46 0.81 59 97 0.81 3.80 1.14 0.40 0.78 55 97 3.79 1.12 -0.05 0.82 -0.03 0.01
VB446204 2,491 3.66 1.08 3.64 1.06 -0.02 0.40 0.76 55 97 0.76 3.65 1.10 0.35 0.73 52 95 3.65 1.08 -0.01 0.76 -0.03 0.00
VB446205 1,474 3.62 1.16 3.60 1.17 -0.02 0.48 0.81 60 97 0.81 3.54 1.16 0.31 0.74 47 94 3.55 1.13 -0.07 0.76 -0.07 -0.05
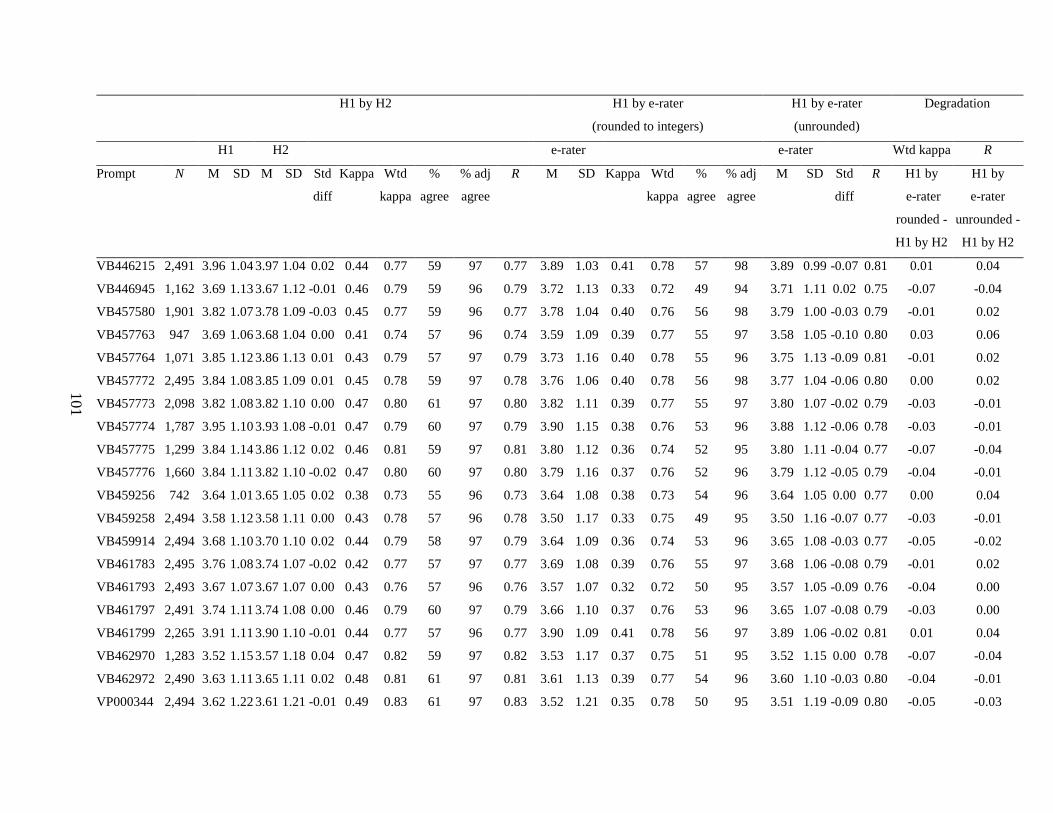
101
H1 by H2 H1 by e-rater
(rounded to integers)
H1 by e-rater
(unrounded)
Degradation
H1 H2 e-rater e-rater Wtd kappa R
Prompt N M SD M SD Std
diff
Kappa Wtd
kappa
%
agree
% adj
agree
R M SD Kappa Wtd
kappa
%
agree
% adj
agree
M SD Std
diff
R H1 by
e-rater
rounded -
H1 by H2
H1 by
e-rater
unrounded -
H1 by H2
VB446215 2,491 3.96 1.04 3.97 1.04 0.02 0.44 0.77 59 97 0.77 3.89 1.03 0.41 0.78 57 98 3.89 0.99 -0.07 0.81 0.01 0.04
VB446945 1,162 3.69 1.13 3.67 1.12 -0.01 0.46 0.79 59 96 0.79 3.72 1.13 0.33 0.72 49 94 3.71 1.11 0.02 0.75 -0.07 -0.04
VB457580 1,901 3.82 1.07 3.78 1.09 -0.03 0.45 0.77 59 96 0.77 3.78 1.04 0.40 0.76 56 98 3.79 1.00 -0.03 0.79 -0.01 0.02
VB457763 947 3.69 1.06 3.68 1.04 0.00 0.41 0.74 57 96 0.74 3.59 1.09 0.39 0.77 55 97 3.58 1.05 -0.10 0.80 0.03 0.06
VB457764 1,071 3.85 1.12 3.86 1.13 0.01 0.43 0.79 57 97 0.79 3.73 1.16 0.40 0.78 55 96 3.75 1.13 -0.09 0.81 -0.01 0.02
VB457772 2,495 3.84 1.08 3.85 1.09 0.01 0.45 0.78 59 97 0.78 3.76 1.06 0.40 0.78 56 98 3.77 1.04 -0.06 0.80 0.00 0.02
VB457773 2,098 3.82 1.08 3.82 1.10 0.00 0.47 0.80 61 97 0.80 3.82 1.11 0.39 0.77 55 97 3.80 1.07 -0.02 0.79 -0.03 -0.01
VB457774 1,787 3.95 1.10 3.93 1.08 -0.01 0.47 0.79 60 97 0.79 3.90 1.15 0.38 0.76 53 96 3.88 1.12 -0.06 0.78 -0.03 -0.01
VB457775 1,299 3.84 1.14 3.86 1.12 0.02 0.46 0.81 59 97 0.81 3.80 1.12 0.36 0.74 52 95 3.80 1.11 -0.04 0.77 -0.07 -0.04
VB457776 1,660 3.84 1.11 3.82 1.10 -0.02 0.47 0.80 60 97 0.80 3.79 1.16 0.37 0.76 52 96 3.79 1.12 -0.05 0.79 -0.04 -0.01
VB459256 742 3.64 1.01 3.65 1.05 0.02 0.38 0.73 55 96 0.73 3.64 1.08 0.38 0.73 54 96 3.64 1.05 0.00 0.77 0.00 0.04
VB459258 2,494 3.58 1.12 3.58 1.11 0.00 0.43 0.78 57 96 0.78 3.50 1.17 0.33 0.75 49 95 3.50 1.16 -0.07 0.77 -0.03 -0.01
VB459914 2,494 3.68 1.10 3.70 1.10 0.02 0.44 0.79 58 97 0.79 3.64 1.09 0.36 0.74 53 96 3.65 1.08 -0.03 0.77 -0.05 -0.02
VB461783 2,495 3.76 1.08 3.74 1.07 -0.02 0.42 0.77 57 97 0.77 3.69 1.08 0.39 0.76 55 97 3.68 1.06 -0.08 0.79 -0.01 0.02
VB461793 2,493 3.67 1.07 3.67 1.07 0.00 0.43 0.76 57 96 0.76 3.57 1.07 0.32 0.72 50 95 3.57 1.05 -0.09 0.76 -0.04 0.00
VB461797 2,491 3.74 1.11 3.74 1.08 0.00 0.46 0.79 60 97 0.79 3.66 1.10 0.37 0.76 53 96 3.65 1.07 -0.08 0.79 -0.03 0.00
VB461799 2,265 3.91 1.11 3.90 1.10 -0.01 0.44 0.77 57 96 0.77 3.90 1.09 0.41 0.78 56 97 3.89 1.06 -0.02 0.81 0.01 0.04
VB462970 1,283 3.52 1.15 3.57 1.18 0.04 0.47 0.82 59 97 0.82 3.53 1.17 0.37 0.75 51 95 3.52 1.15 0.00 0.78 -0.07 -0.04
VB462972 2,490 3.63 1.11 3.65 1.11 0.02 0.48 0.81 61 97 0.81 3.61 1.13 0.39 0.77 54 96 3.60 1.10 -0.03 0.80 -0.04 -0.01
VP000344 2,494 3.62 1.22 3.61 1.21 -0.01 0.49 0.83 61 97 0.83 3.52 1.21 0.35 0.78 50 95 3.51 1.19 -0.09 0.80 -0.05 -0.03
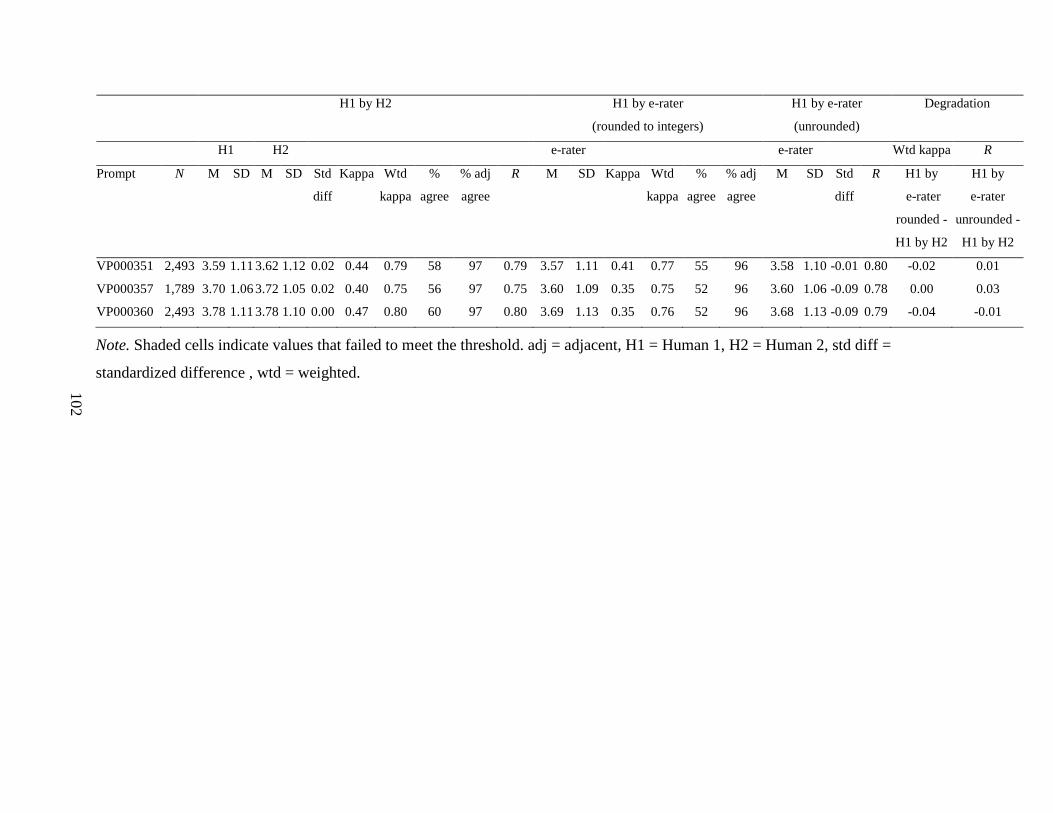
102
H1 by H2 H1 by e-rater
(rounded to integers)
H1 by e-rater
(unrounded)
Degradation
H1 H2 e-rater e-rater Wtd kappa R
Prompt N M SD M SD Std
diff
Kappa Wtd
kappa
%
agree
% adj
agree
R M SD Kappa Wtd
kappa
%
agree
% adj
agree
M SD Std
diff
R H1 by
e-rater
rounded -
H1 by H2
H1 by
e-rater
unrounded -
H1 by H2
VP000351 2,493 3.59 1.11 3.62 1.12 0.02 0.44 0.79 58 97 0.79 3.57 1.11 0.41 0.77 55 96 3.58 1.10 -0.01 0.80 -0.02 0.01
VP000357 1,789 3.70 1.06 3.72 1.05 0.02 0.40 0.75 56 97 0.75 3.60 1.09 0.35 0.75 52 96 3.60 1.06 -0.09 0.78 0.00 0.03
VP000360 2,493 3.78 1.11 3.78 1.10 0.00 0.47 0.80 60 97 0.80 3.69 1.13 0.35 0.76 52 96 3.68 1.13 -0.09 0.79 -0.04 -0.01
Note. Shaded cells indicate values that failed to meet the threshold. adj = adjacent, H1 = Human 1, H2 = Human 2, std diff =
standardized difference , wtd = weighted.
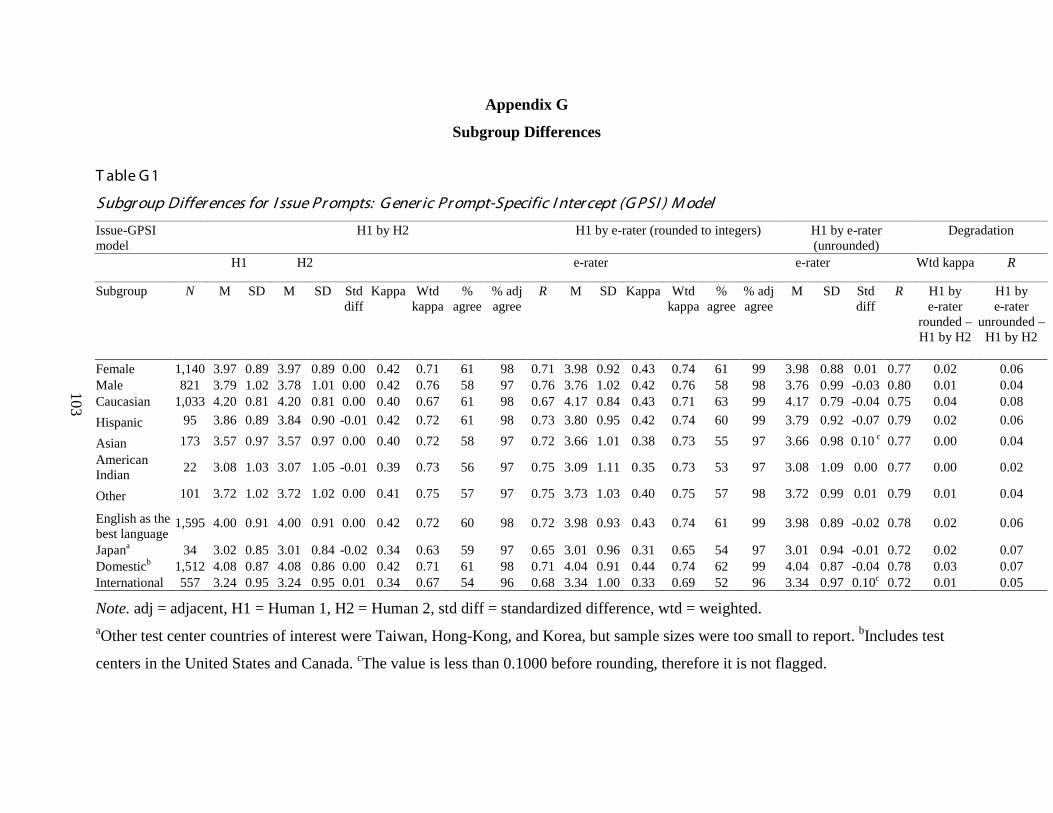
103
Appendix G
Subgroup Differences
T able G 1
Subgr oup Differ ences for I ssue Pr ompts: G ener ic Pr ompt-Specific I nter cept (G PSI ) M odel
Issue-GPSI model
H1 by H2 H1 by e-rater (rounded to integers) H1 by e-rater (unrounded)
Degradation
H1 H2 e-rater e-rater Wtd kappa R
Subgroup N M SD M SD Std diff
Kappa Wtd kappa
% agree
% adj agree
R M SD Kappa Wtd kappa
% agree
% adj agree
M SD Std diff
R H1 by e-rater
rounded –H1 by H2
H1 by e-rater
unrounded –H1 by H2
Female 1,140 3.97 0.89 3.97 0.89 0.00 0.42 0.71 61 98 0.71 3.98 0.92 0.43 0.74 61 99 3.98 0.88 0.01 0.77 0.02 0.06 Male 821 3.79 1.02 3.78 1.01 0.00 0.42 0.76 58 97 0.76 3.76 1.02 0.42 0.76 58 98 3.76 0.99 -0.03 0.80 0.01 0.04 Caucasian 1,033 4.20 0.81 4.20 0.81 0.00 0.40 0.67 61 98 0.67 4.17 0.84 0.43 0.71 63 99 4.17 0.79 -0.04 0.75 0.04 0.08 Hispanic 95 3.86 0.89 3.84 0.90 -0.01 0.42 0.72 61 98 0.73 3.80 0.95 0.42 0.74 60 99 3.79 0.92 -0.07 0.79 0.02 0.06
Asian 173 3.57 0.97 3.57 0.97 0.00 0.40 0.72 58 97 0.72 3.66 1.01 0.38 0.73 55 97 3.66 0.98 0.10 c 0.77 0.00 0.04 American Indian 22 3.08 1.03 3.07 1.05 -0.01 0.39 0.73 56 97 0.75 3.09 1.11 0.35 0.73 53 97 3.08 1.09 0.00 0.77 0.00 0.02
Other 101 3.72 1.02 3.72 1.02 0.00 0.41 0.75 57 97 0.75 3.73 1.03 0.40 0.75 57 98 3.72 0.99 0.01 0.79 0.01 0.04
English as the best language
1,595 4.00 0.91 4.00 0.91 0.00 0.42 0.72 60 98 0.72 3.98 0.93 0.43 0.74 61 99 3.98 0.89 -0.02 0.78 0.02 0.06
Japana 34 3.02 0.85 3.01 0.84 -0.02 0.34 0.63 59 97 0.65 3.01 0.96 0.31 0.65 54 97 3.01 0.94 -0.01 0.72 0.02 0.07 Domesticb 1,512 4.08 0.87 4.08 0.86 0.00 0.42 0.71 61 98 0.71 4.04 0.91 0.44 0.74 62 99 4.04 0.87 -0.04 0.78 0.03 0.07 International 557 3.24 0.95 3.24 0.95 0.01 0.34 0.67 54 96 0.68 3.34 1.00 0.33 0.69 52 96 3.34 0.97 0.10c 0.72 0.01 0.05
Note. adj = adjacent, H1 = Human 1, H2 = Human 2, std diff = standardized difference, wtd = weighted. aOther test center countries of interest were Taiwan, Hong-Kong, and Korea, but sample sizes were too small to report. bIncludes test
centers in the United States and Canada. cThe value is less than 0.1000 before rounding, therefore it is not flagged.
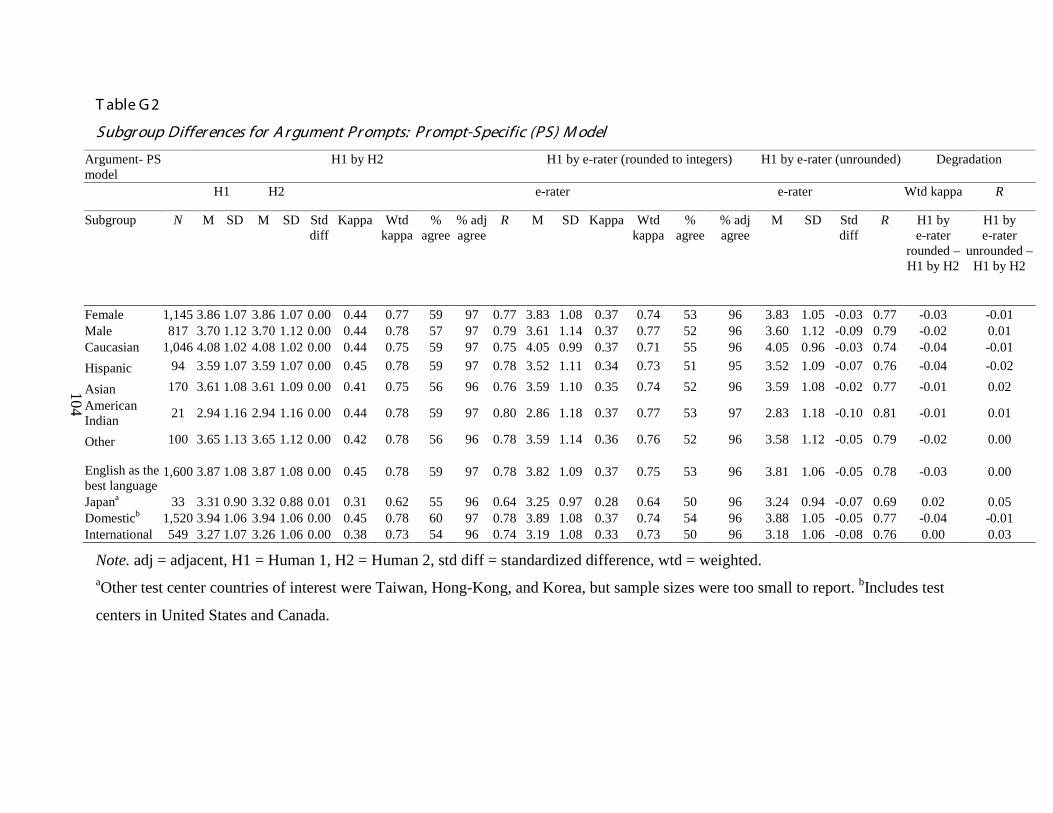
104
T able G 2
Subgr oup Differ ences for A r gument Pr ompts: Pr ompt-Specific (PS) M odel
Argument- PS model
H1 by H2 H1 by e-rater (rounded to integers) H1 by e-rater (unrounded) Degradation
H1 H2 e-rater e-rater Wtd kappa R
Subgroup N M SD M SD Std diff
Kappa Wtd kappa
% agree
% adj agree
R M SD Kappa Wtd kappa
% agree
% adj agree
M SD Std diff
R H1 by e-rater
rounded – H1 by H2
H1 by e-rater
unrounded –H1 by H2
Female 1,145 3.86 1.07 3.86 1.07 0.00 0.44 0.77 59 97 0.77 3.83 1.08 0.37 0.74 53 96 3.83 1.05 -0.03 0.77 -0.03 -0.01 Male 817 3.70 1.12 3.70 1.12 0.00 0.44 0.78 57 97 0.79 3.61 1.14 0.37 0.77 52 96 3.60 1.12 -0.09 0.79 -0.02 0.01 Caucasian 1,046 4.08 1.02 4.08 1.02 0.00 0.44 0.75 59 97 0.75 4.05 0.99 0.37 0.71 55 96 4.05 0.96 -0.03 0.74 -0.04 -0.01 Hispanic 94 3.59 1.07 3.59 1.07 0.00 0.45 0.78 59 97 0.78 3.52 1.11 0.34 0.73 51 95 3.52 1.09 -0.07 0.76 -0.04 -0.02
Asian 170 3.61 1.08 3.61 1.09 0.00 0.41 0.75 56 96 0.76 3.59 1.10 0.35 0.74 52 96 3.59 1.08 -0.02 0.77 -0.01 0.02 American Indian 21 2.94 1.16 2.94 1.16 0.00 0.44 0.78 59 97 0.80 2.86 1.18 0.37 0.77 53 97 2.83 1.18 -0.10 0.81 -0.01 0.01
Other 100 3.65 1.13 3.65 1.12 0.00 0.42 0.78 56 96 0.78 3.59 1.14 0.36 0.76 52 96 3.58 1.12 -0.05 0.79 -0.02 0.00
English as the best language
1,600 3.87 1.08 3.87 1.08 0.00 0.45 0.78 59 97 0.78 3.82 1.09 0.37 0.75 53 96 3.81 1.06 -0.05 0.78 -0.03 0.00
Japana 33 3.31 0.90 3.32 0.88 0.01 0.31 0.62 55 96 0.64 3.25 0.97 0.28 0.64 50 96 3.24 0.94 -0.07 0.69 0.02 0.05 Domesticb 1,520 3.94 1.06 3.94 1.06 0.00 0.45 0.78 60 97 0.78 3.89 1.08 0.37 0.74 54 96 3.88 1.05 -0.05 0.77 -0.04 -0.01 International 549 3.27 1.07 3.26 1.06 0.00 0.38 0.73 54 96 0.74 3.19 1.08 0.33 0.73 50 96 3.18 1.06 -0.08 0.76 0.00 0.03
Note. adj = adjacent, H1 = Human 1, H2 = Human 2, std diff = standardized difference, wtd = weighted. aOther test center countries of interest were Taiwan, Hong-Kong, and Korea, but sample sizes were too small to report. bIncludes test
centers in United States and Canada.
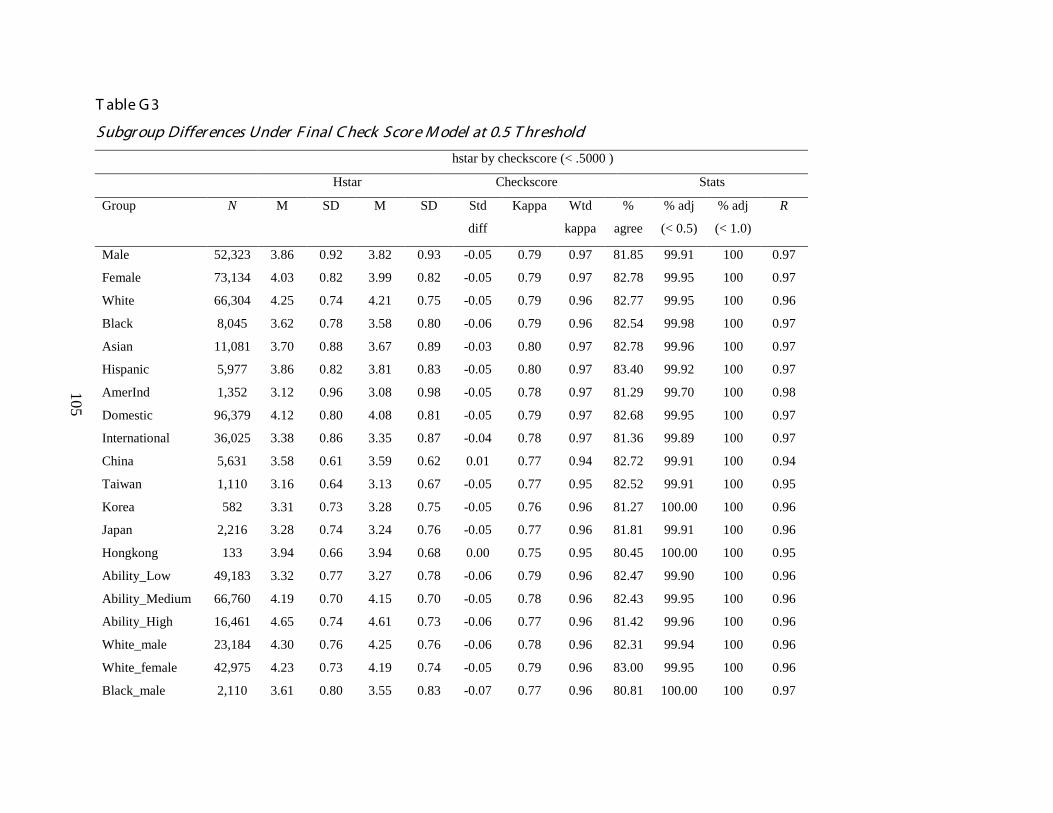
105
T able G 3
Subgr oup Differ ences Under F inal C heck Scor e M odel at 0.5 T hr eshold
hstar by checkscore (< .5000 )
Hstar Checkscore Stats
Group N M SD M SD Std
diff
Kappa Wtd
kappa
%
agree
% adj
(< 0.5)
% adj
(< 1.0)
R
Male 52,323 3.86 0.92 3.82 0.93 -0.05 0.79 0.97 81.85 99.91 100 0.97
Female 73,134 4.03 0.82 3.99 0.82 -0.05 0.79 0.97 82.78 99.95 100 0.97
White 66,304 4.25 0.74 4.21 0.75 -0.05 0.79 0.96 82.77 99.95 100 0.96
Black 8,045 3.62 0.78 3.58 0.80 -0.06 0.79 0.96 82.54 99.98 100 0.97
Asian 11,081 3.70 0.88 3.67 0.89 -0.03 0.80 0.97 82.78 99.96 100 0.97
Hispanic 5,977 3.86 0.82 3.81 0.83 -0.05 0.80 0.97 83.40 99.92 100 0.97
AmerInd 1,352 3.12 0.96 3.08 0.98 -0.05 0.78 0.97 81.29 99.70 100 0.98
Domestic 96,379 4.12 0.80 4.08 0.81 -0.05 0.79 0.97 82.68 99.95 100 0.97
International 36,025 3.38 0.86 3.35 0.87 -0.04 0.78 0.97 81.36 99.89 100 0.97
China 5,631 3.58 0.61 3.59 0.62 0.01 0.77 0.94 82.72 99.91 100 0.94
Taiwan 1,110 3.16 0.64 3.13 0.67 -0.05 0.77 0.95 82.52 99.91 100 0.95
Korea 582 3.31 0.73 3.28 0.75 -0.05 0.76 0.96 81.27 100.00 100 0.96
Japan 2,216 3.28 0.74 3.24 0.76 -0.05 0.77 0.96 81.81 99.91 100 0.96
Hongkong 133 3.94 0.66 3.94 0.68 0.00 0.75 0.95 80.45 100.00 100 0.95
Ability_Low 49,183 3.32 0.77 3.27 0.78 -0.06 0.79 0.96 82.47 99.90 100 0.96
Ability_Medium 66,760 4.19 0.70 4.15 0.70 -0.05 0.78 0.96 82.43 99.95 100 0.96
Ability_High 16,461 4.65 0.74 4.61 0.73 -0.06 0.77 0.96 81.42 99.96 100 0.96
White_male 23,184 4.30 0.76 4.25 0.76 -0.06 0.78 0.96 82.31 99.94 100 0.96
White_female 42,975 4.23 0.73 4.19 0.74 -0.05 0.79 0.96 83.00 99.95 100 0.96
Black_male 2,110 3.61 0.80 3.55 0.83 -0.07 0.77 0.96 80.81 100.00 100 0.97
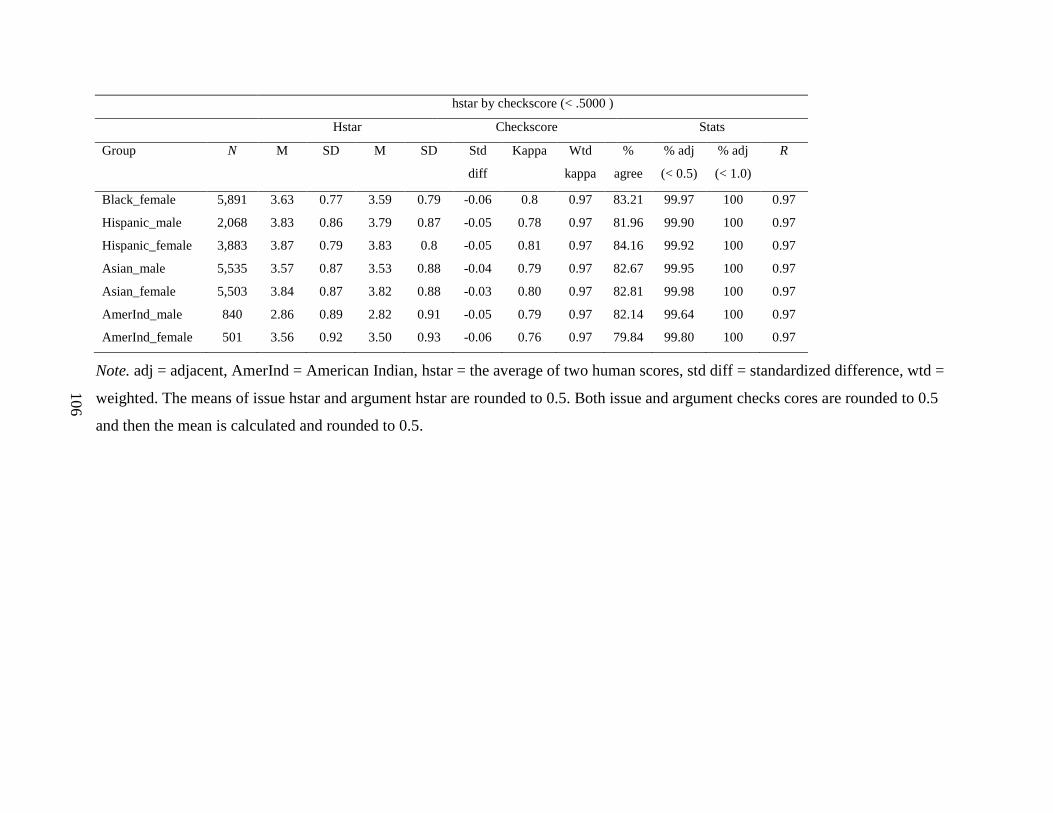
106
hstar by checkscore (< .5000 )
Hstar Checkscore Stats
Group N M SD M SD Std
diff
Kappa Wtd
kappa
%
agree
% adj
(< 0.5)
% adj
(< 1.0)
R
Black_female 5,891 3.63 0.77 3.59 0.79 -0.06 0.8 0.97 83.21 99.97 100 0.97
Hispanic_male 2,068 3.83 0.86 3.79 0.87 -0.05 0.78 0.97 81.96 99.90 100 0.97
Hispanic_female 3,883 3.87 0.79 3.83 0.8 -0.05 0.81 0.97 84.16 99.92 100 0.97
Asian_male 5,535 3.57 0.87 3.53 0.88 -0.04 0.79 0.97 82.67 99.95 100 0.97
Asian_female 5,503 3.84 0.87 3.82 0.88 -0.03 0.80 0.97 82.81 99.98 100 0.97
AmerInd_male 840 2.86 0.89 2.82 0.91 -0.05 0.79 0.97 82.14 99.64 100 0.97
AmerInd_female 501 3.56 0.92 3.50 0.93 -0.06 0.76 0.97 79.84 99.80 100 0.97
Note. adj = adjacent, AmerInd = American Indian, hstar = the average of two human scores, std diff = standardized difference, wtd =
weighted. The means of issue hstar and argument hstar are rounded to 0.5. Both issue and argument checks cores are rounded to 0.5
and then the mean is calculated and rounded to 0.5.