Embed Size (px)
Citation preview
Evaluation of the Early Mediation Pilot Programs
FEBRUARY 27, 2004
EVALUATION OF THE EARLY MEDIATION PILOT PROGRAMS
Judicial Council of California Administrative Office of the Courts
Office of the General Counsel
February 27, 2004
Judicial Council of California Administrative Office of the Courts 455 Golden Gate Avenue San Francisco, CA 94102-3688 This report has been prepared and submitted to the California Legislature and Governor pursuant to Code of Civil Procedure Section 1742 (Statutes of 1999, Chapter 67, Section 4 (A.B. 1105)). Copyright © 2004 by Judicial Council of California/Administrative Office of the Courts. All rights reserved. Except as permitted under the Copyright Act of 1976 and as otherwise expressly provided herein, no part of this publication may be reproduced in any form or by any means, electronic or mechanical, including the use of information storage and retrieval systems, without permission in writing from the copyright holder. Permission is hereby granted to nonprofit institutions to reproduce and distribute this publication for educational purposes if the copies credit the copyright holder. Please address inquiries to: Judicial Council of California Administrative Office of the Courts Office of the General Counsel Attn: Heather Anderson 455 Golden Gate Avenue San Francisco, CA 94102-3688 This report is also available on the California Courts Web site: www.courtinfo.ca.gov/reference Printed on 100% recycled and recyclable paper
.
Judicial Council of California Administrative Office of the Courts
Chief Justice Ronald M. George Chair, Judicial Council of California
William C. Vickrey
Administrative Director of the Courts
Michael Bergeisen General Counsel and
Deputy Administrative Director
Primary Authors
Heather Anderson Senior Attorney
Office of the General Counsel
Ron Pi Senior Research Analyst
Executive Office Programs Division, Office of Court Research
Other Contributing Staff
Kenneth L. Kann Supervising Attorney
Office of the General Counsel
Dag MacLeod Manager
Executive Office Programs Division, Office of Court Research
Melissa Levitt
Research Analyst Executive Office Programs Division,
Office of Court Research
Lisa Lightman Court Services Analyst
Center for Families, Children & the Courts

5

i
CONTENTS
Executive Summary ......................................................................................................... xix
I. Introduction................................................................................................................ 1
A. Background........................................................................................................ 2
B. Measurement of Program Impacts, Data, and Methods .................................... 7
II. Overview of Study Findings .................................................................................... 29
A. Summary of Findings ...................................................................................... 29
B. Introduction ..................................................................................................... 32
C. Program Cases—Mediation Referrals, Mediations, and Settlements.............. 34
D. Findings Concerning the Impact of Pilot Programs on Trial Rates................. 41
E. Findings Concerning the Impact of Pilot Programs on Disposition Time................................................................................................................. 44
F. Findings Concerning the Impact of Pilot Programs on Litigant
Satisfaction ...................................................................................................... 53
G. Findings Concerning the Impact of Pilot Programs on Litigant Costs............ 65
H. Findings Concerning the Impact of Pilot Programs on Court Workload ........ 70
I. Comparison of Court-Ordered Mediation Under Pilot Program and Voluntary Mediation in Los Angeles .............................................................. 77
III. San Diego Pilot Program ......................................................................................... 81
A. Summary of Findings Concerning San Diego Pilot Program.......................... 81
B. Introduction ..................................................................................................... 83
C. San Diego Pilot Program Description ............................................................. 85
D. Data and Methods Used in Study of San Diego Pilot Program....................... 92
E. Program-Group Cases—Referrals, Mediations, and Settlements ................... 96
F. Impact of San Diego’s Pilot Program on Trial Rates ...................................... 99
ii
G. Impact of San Diego’s Pilot Program on Case Disposition Time ................. 105
H. Impact of San Diego’s Pilot Program on Litigant Satisfaction ..................... 115
I. Impact of San Diego’s Pilot Program on Litigant Costs ............................... 126
J. Impact of San Diego’s Pilot Program on the Court’s Workload................... 132
IV. Los Angeles Pilot Program ................................................................................. 143
A. Summary of Findings .................................................................................... 143
B. Introduction ................................................................................................... 145
C. Los Angeles Mediation Pilot Program Description....................................... 147
D. Data and Methods Used in Study of Los Angeles Pilot Program ................. 154
E. Program-Group Cases—Referrals, Mediations, and Settlements ................. 160
F. Impact of Los Angeles’ Pilot Program on Trial Rates .................................. 162
G. Impact of Los Angeles’ Pilot Program on Case Disposition Time ............... 168
H. Impact of Los Angeles’ Pilot Program on Litigant Satisfaction ................... 181
I. Impact of Los Angeles’ Pilot Program on Litigant Costs ............................. 195
J. Impact of Los Angeles’ Pilot Program on the Court’s Workload ................. 204
V. Fresno Pilot Program ............................................................................................. 217
A. Summary of Study Findings .......................................................................... 217
B. Introduction ................................................................................................... 219
C. Fresno Pilot Program Description ................................................................. 221
D. Data and Methods Used in Study of Fresno Pilot Program........................... 228
E. Program-Group Cases—Referrals, Mediations, and Settlements ................. 233
F. Impact of Fresno’s Pilot Program on Trial Rates .......................................... 236
G. Impact of Fresno’s Pilot Program on Case Disposition Time ....................... 238
iii
H. Impact of Fresno’s Pilot Program on Litigant Satisfaction ........................... 251
I. Impact of Fresno’s Pilot Program on Litigant Costs ..................................... 262
J. Impact of Fresno’s Pilot Program on the Court’s Workload......................... 268
VI. Contra Costa Pilot Program ................................................................................ 279
A. Summary of Study Findings .......................................................................... 279
B. Introduction ................................................................................................... 282
C. Contra Costa Pilot Program Description ....................................................... 285
D. Data and Methods Used in Study of Contra Costa Pilot Program................. 290
E. Stipulated Cases –Mediations and Settlements ............................................. 293
F. Impact of Contra Costa’s Pilot Program on Trial Rates................................ 295
G. Impact of Contra Costa’s Pilot Program on Case Disposition Time............. 299
H. Impact of Contra Costa’s Pilot Program on Litigant Satisfaction ................. 307
I. Impact of Contra Costa’s Pilot Program on Litigant Costs ........................... 316
J. Impact of Contra Costa’s Pilot Program on the Court’s Workload............... 323
VII. Sonoma Pilot Program ........................................................................................ 329
A. Summary of Study Findings .......................................................................... 329
B. Introduction ................................................................................................... 331
C. Sonoma Pilot Program Description ............................................................... 333
D. Data and Methods Used in Study of Sonoma Pilot Program ........................ 339
E. Stipulated Cases—Mediations and Settlements ............................................ 342
F. Impact of Sonoma’s Pilot Program on Trial Rate ......................................... 344
G. Impact of Sonoma’s Pilot Program on Case Disposition Time..................... 347
H. Impact of Sonoma’s Pilot Program on Litigant Satisfaction......................... 355
iv
I. Impact of Sonoma’s Pilot Program on Litigant Costs................................... 362
J. Impact of Sonoma’s Pilot Program on Court’s Workload ............................ 365
VIII. Glossary .............................................................................................................. 371
Appendix A. Early Mediation Pilot Program Statutes ............................................... 375
Appendix B. Early Mediation Pilot Program Rules ................................................... 379
Appendix C. Survey Instruments ............................................................................... 383
Appendix D. Survey Distribution and Response Rate ............................................... 401
v
FIGURES
Figure I-1. Distribution of Case Disposition Time for Stipulated and Nonstipulated Cases in Contra Costa ....................................................................... 22
Figure I-2. Case Disposition Rate Over Time in Contra Costa ........................................ 23
Figure I-3. Case Characteristics of Nonstipulated Cases.................................................. 23
Figure III-1. Case Flow Process for Unlimited Program-Group Cases Filed in 2000 and 2001 in San Diego .................................................................................... 89
Figure III-2. Case-Flow Process for Limited Program-Group Cases Filed
in 2000 and 2001 in San Diego ................................................................................ 90 Figure III-3. Case Characteristics of Program Subgroups for Unlimited Cases
in San Diego ............................................................................................................. 94 Figure III-4. Case Characteristics of Program Subgroups for Limited Cases
in San Diego ............................................................................................................. 95 Figure III-5. Comparison of Case Disposition Rate Over Time in Program
Group and Control Group San Diego..................................................................... 109 Figure III-6. Average Party and Attorney Satisfaction in Mediated Cases
in San Diego ........................................................................................................... 116 Figure IV-1. Case-Flow Process for Unlimited Cases Filed From April to
December of 2001 in the Nine Participating Unlimited Departments in Los Angeles ....................................................................................................... 152
Figure IV-2. Case Characteristics of Subgroups for Unlimited Cases in
Los Angeles............................................................................................................ 157 Figure IV-3. Comparison of Case Disposition Rate Over Time in Program
and Control Groups in Los Angeles....................................................................... 172 Figure IV-4. Average Case Disposition Time (in Days) for Unlimited Cases
in Los Angeles, by Subgroups................................................................................ 175 Figure IV-5. Average Party and Attorney Satisfaction in Mediated Cases in
LosAngeles............................................................................................................. 183 Figure IV-6. Average Attorney Satisfactions in Los Angeles by Subgroups ................. 189
vi
Figure IV-7. Median Litigant Costs and Attorney Hours in Program and Control Groups in Los Angeles by Subgroups....................................................... 199
Figure IV-8. Average Number of Pretrial Court Events (Per Case) in Program
and Control Groups in Los Angeles by Subgroups................................................ 208 Figure V-1. Case Flow Process for Unlimited Cases Filed in 2000 and 2001
in Fresno................................................................................................................. 226 Figure V-2. Case Flow Process for Limited Cases Filed in 2000 and 2001
in Fresno................................................................................................................. 227 Figure V-3. Case Characteristics of Program Subgroups for Unlimited Cases
in Fresno................................................................................................................. 231 Figure V-4. Case Characteristics of Program Subgroups for Limited Cases
in Fresno................................................................................................................. 232 Figure V-5. Disposition Rate Over Time in Unlimited and Limited Program-
and Control-Group Cases in Fresno. ...................................................................... 243 Figure V-6. Relationship Between Timing of Case Management Conference
(CMC) and Case Disposition Rate for Unlimited Program-Group Cases in Fresno................................................................................................................. 245
Figure V-7. Relationship Between Timing of Mediation Orders and Mediation
Sessions and Proportion of Cases Disposed for Unlimited Program- Group Cases in Fresno. .......................................................................................... 246
Figure V-8. Average Party and Attorney Satisfaction in Mediated Cases
in Fresno................................................................................................................. 252 Figure VI-1. Case Flow for Unlimited Cases Filed in 2000 and 2001 in
Contra Costa........................................................................................................... 288 Figure VI-2. Comparison of Case Disposition Rate for Cases Filed Before
and After Program in Contra Costa........................................................................ 301 Figure VI-3. Comparison of Case Disposition Rate Over Time in Stipulated
and Nonstipulated Cases in Contra Costa ............................................................. 304 Figure VI-4. Average Party and Attorney Satisfaction in Mediated Cases in
Contra Costa........................................................................................................... 308 Figure VII-1. Case Flow for Unlimited Cases Filed in 2000 and 2001 in
Sonoma................................................................................................................... 337
vii
Figure VII-2. Case Flow for Limited Cases Filed in 2000 and 2001 in Sonoma ........... 337
Figure VII-3. Comparison of Case Disposition Rate for Cases Filed Before and After Program in Sonoma................................................................................ 349
Figure VII-4. Comparison of Case Disposition Rate Over Time in Stipulated and
Nonstipulated Cases in Sonoma............................................................................. 353 Figure VII-5. Average Party and Attorney Satisfaction in Mediated Cases
in Sonoma............................................................................................................... 356
viii
TABLES
Table I-1. Summary of Key Early Mediation Pilot Program Features ............................... 5
Table II-1. Unlimited Cases Filed in 2000 and 2001—Comparison of Mediation Referral, Mediation, and Settlement Rates in the Pilot Programs............................ 35
Table II-2. Limited Cases Filed in 2000 and 2001—Comparison of Mediation
Referral, Mediation, and Settlement Rates in the Pilot Programs............................ 36 Table II-3. Unlimited Cases—Average and Median Disposition Times and
Cumulative Disposition Rates for Program and Nonprogram Cases ....................... 46 Table II-4. Limited Cases—Average and Median Disposition Times and
Cumulative Disposition Rates for Program and Nonprogram Cases....................... 47 Table II-5. Unlimited Cases—Average Satisfaction Levels Reported by
Attorneys in Program and Nonprogram Cases........................................................ 55 Table II-6. Limited Cases—Average Satisfaction Levels Reported by A
ttorneys in Program and Nonprogram Cases............................................................ 56 Table II-7. Unlimited Cases—Parties’ and Attorneys’ Satisfaction Levels in
Mediated Program Cases.......................................................................................... 59 Table II-8. Limited Cases—Parties’ and Attorney s’ Satisfaction Levels in
Mediated Program Cases.......................................................................................... 59 Table II-9. Unlimited Cases—Parties’ and Attorneys’ Perceptions of Fairness
and Willingness to Recommend or Use Mediation (average level of agreement with statement) ....................................................................................... 60
Table II-10. Limited Cases—Parties’ and Attorneys’ Perceptions of Fairness
and Willingness to Recommend or Use Mediation (average level of agreement with statement) ....................................................................................... 60
Table II-11. Savings in Litigant Costs and Attorney Hours From Resolution at
Mediation—Estimates by Attorneys ........................................................................ 67 Table II-12. Unlimited Cases—Average Number of Various Court Events for
Program and Nonprogram Cases .............................................................................. 71 Table II-13. Limited Cases—Average Number of Various Court Events for
Program and Nonprogram Cases.............................................................................. 72 Table II-14. Compliance With Agreement/Judgment....................................................... 75
ix
Table II-15. Additional Court Proceedings to Enforce Agreement/Judgment ................. 75
Table II-16. Comparison of Trial Rates in Cases Over $50,000 Referred to Mediation ................................................................................................................. 78
Table II-17. Comparison of Case Disposition Time in Cases Over $50,000
Referred to Mediation .............................................................................................. 78 Table II-18. Comparison of Litigant Satisfaction in Cases Over $50,000
Referred to Mediation .............................................................................................. 78 Table II-19. Comparison of Court Workload in Cases Over $50,000 Referred
to Mediation ............................................................................................................. 79 Table III-1. Program-Group Cases in San Diego—Subgroup Breakdown....................... 96
Table III-2. Proportion of Program-Group Cases Settled at Mediation in San Diego ................................................................................................................. 97
Table III-3. Attorney Opinions of Mediation’s Importance to Post-Median
Settlement in San Diego........................................................................................... 98 Table III-4. Comparison of Trial Rates in Program Group and Control Group in
San Diego ............................................................................................................... 100 Table III-5. Comparison of Trial Rates in Program Group and Control Group
in San Diego, by Case Type ................................................................................... 101 Table III-6. Impact of Reduced Trial Rate on Judicial Time in San Diego.................... 102
Table III-7. Potential Courtwide Annual Impact of Reduced Trial Rate Judicial Time in San Diego.................................................................................................. 103
Table III-8. Average Case Disposition Time (in Days) for Unlimited
Program-Group Cases in San Diego, by Program Subgroups ............................... 106 Table III-9. Average Case Disposition Time (in Days) for Limited
Program-Group Cases in San Diego, by Program Subgroups ............................... 107 Table III-10. Comparison of Case Disposition Time (in Days) in Program
Group and Control Group in San Diego................................................................. 108 Table III-11. Average Case Disposition Time (in Days) in San Diego for
Limited and Unlimited Program-Group Cases That Did Not Settle at Mediation, by Importance of Mediation to Subsequent Settlement....................... 112
x
Table III-12. Comparison of Average Case Disposition Time (in Days) in Program-Group and Control Group in San Diego, by Case Types........................ 113
Table III-13. Party and Attorney Perceptions of Fairness and Willingness to
Recommend or Use Mediation in San Diego (average agreement with statement) ....................................................................................................... 117
Table III-14. Average Attorney Satisfaction in Unlimited Program-Group
Cases in San Diego, by Program Subgroups.......................................................... 120 Table III-15. Average Attorney Satisfaction in Limited Program-Group
Cases in San Diego, by Program Subgroups.......................................................... 121 Table III-16. Comparison of Average Attorney Satisfaction in Program
Group and Control Group in San Diego................................................................. 121 Table III-17. Comparison of Average Attorney Satisfaction in Program
Group and Control Group in San Diego, by Case Type......................................... 125 Table III-18. Litigant Costs and Attorney Hours for Unlimited Program-Group
Cases in San Diego, by Program Subgroup ........................................................... 127 Table III-19. Litigant Costs and Attorney Hours for Limited Program-Group
Cases in San Diego, by Program Subgroup ........................................................... 128 Table III-20. Savings in Litigant Costs and Attorney Hours From Resolving at
Mediation in San Diego—Estimates by Attorneys ................................................ 130 Table III-21. Average Number of Pretrial Court Events (Per Case) in
Unlimited Program-Group Cases in San Diego, by Program Subgroup................ 133 Table III-22. Average Number of Pretrial Court Events (Per Case) in
Limited Program-Group Cases in San Diego, by Program Subgroup ................... 134 Table III-23. Comparison of Average Number of Pretrial Court Events
(Per Case) in Program-Group and Control-Group Cases in San Diego................. 135 Table III-24. Comparison of Average Number of Pretrial Court Events
(Per Case) in Program-Group and Control-Group Cases in San Diego, by Case Type.......................................................................................................... 137
Table III-25. Impact of Reduced Workload on Judicial Time in San Diego.................. 138
Table III-26. Potential Courtwide Annual Impact of Reduced Workload on Judicial Time in San Diego .................................................................................... 140

xi
Table III-27. Compliance With Agreement/Judgment in San Diego ............................. 141
Table III-28. Additional Court Proceedings to Enforce Agreement/ Judgment in San Diego .......................................................................................... 141
Table IV-1. Program-Group Cases—Subgroup Breakdown .......................................... 160
Table IV-2. Proportion of Program-Group Cases Settled at Mediation ......................... 161
Table IV-3. Attorney Opinions of Mediation’s Importance to Post-Mediation Settlement............................................................................................................... 161
Table IV-4. Comparison of Trial Rates in Program and Control Groups
in 2001 in Los Angeles........................................................................................... 163 Table IV-5. Comparison of Trial Rates in Program and Control Cases
Within the Participating Departments, by Case Type ............................................ 164 Table IV-6. Comparison of Trial Rates in Program Group and Control
Departments, by Case Type ................................................................................... 164 Table IV-7. Impact of Reduced Trial Rate on Judicial Time in Los Angeles ................ 165
Table IV-8. Potential Courtwide Annual Impact of Reduced Trial Rate on Judicial Time in Los Angeles................................................................................. 166
Table IV-9. Comparison of Trial Rates in Cases Over $50,000 Referred
to Mediation in Los Angeles .................................................................................. 167 Table IV-10. Average Case Disposition Time (in Days) for Program-
Group Cases in Los Angeles, by Program Subgroups ........................................... 169 Table IV-11. Comparison of Case Disposition Time (in Days) in Program and
Control Groups in Los Angeles.............................................................................. 170 Table IV-12. Average Case Disposition Time (in Days) for Unlimited Cases
in Los Angeles, by Subgroups................................................................................ 174 Table IV-13. Average Case Disposition Time (in Days) in Los Angeles for
Program-Group Cases That Did Not Settle at Mediation, by Importance of Mediation to Subsequent Case Settlement......................................................... 177
Table IV-14. Comparison of Average Case Disposition Time (in Days) in
Program and Control Groups in Los Angeles, by Case Type ................................ 178
xii
Table IV-15. Comparison of Case Disposition Time in Cases Over $50,000 Referred to Mediation in Los Angeles ................................................................... 179
Table IV-16. Party and Attorney Perceptions of Fairness and Willingness to
Recommend or Use Mediation in Los Angeles (average agreement with statement) ....................................................................................................... 183
Table IV-17. Average Attorney Satisfaction in Unlimited Program-Group
Cases in Los Angeles, by Program Subgroups ...................................................... 186 Table IV-18. Comparison of Average Attorney Satisfaction in Program
and Control Groups in Los Angeles....................................................................... 187 Table IV-19. Average Attorney Satisfaction in Los Angeles, by Subgroups................. 188
Table IV-20. Comparison of Average Attorney Satisfaction in Program and Control Groups in Los Angeles, by Case Type...................................................... 192
Table IV-21. Comparison of Litigant Satisfaction in Cases Over $50,000
Referred to Mediation in Los Angeles ................................................................... 193 Table IV-22. Litigant Costs and Attorney Hours for Program-Group Cases
in Los Angeles by Subgroups................................................................................. 197 Table IV-23. Litigant Costs in Program and Control Groups in Los Angeles by
Subgroups............................................................................................................... 198 Table IV-24. Attorney Hours in Program and Control Groups in Los Angeles by
Subgroups............................................................................................................... 198 Table IV-25. Savings in Litigant Costs and Attorney Hours from Resolving at
Mediation in Los Angeles - Estimates by Attorneys.............................................. 201 Table IV-26. Average Number of Pretrial Court Events (Per-Case) in
Program-Group Cases in Los Angeles, by Program Subgroups ............................ 205 Table IV-27. Comparison of Average Number of Pretrial Court Events
(Per Case) in Program and Control Groups in Los Angeles .................................. 206 Table IV-28. Average Number of Pretrial Court Events (Per Case) in
Program and Control Groups in Los Angeles by Subgroups ................................. 207 Table IV-29. Comparison of Average Number of Pretrial Court Events
(Per Case) in Program and Control Groups in Los Angeles, by Case Type .......... 211 Table IV-30. Impact of Reduced Workload on Judicial Time in Los Angeles .............. 212

xiii
Table IV-31. Potential Courtwide Annual Impact of Reduced Workload on Judicial Time in Los Angeles................................................................................. 214
Table IV-32. Comparison of Court Workload in Cases Over $50,000 Referred
to Mediation in Los Angeles .................................................................................. 215 Table V-1. Program-Group Cases in Fresno—Subgroup Breakdown............................ 233
Table V-2. Proportion of Program-Group Cases Settled at Mediation in Fresno........... 234 Table V-3. Attorney Opinions of Mediation’s Importance to Post-Mediation
Settlement in Fresno............................................................................................... 234 Table V-4. Comparison of Trial Rates In Program and Control Groups
in Fresno................................................................................................................. 236 Table V-5. Average Case Disposition Time (in Days) for Unlimited Program-
Group Cases in Fresno, by Program Subgroups .................................................... 239 Table V-6. Average Case Disposition Time (in Days) for Limited Program-
Group Cases in Fresno, by Program Subgroups .................................................... 240 Table V-7. Comparison of Case Disposition Time (in Days) in Program and
Control Groups in Fresno....................................................................................... 240 Table V-8. Average Case Disposition Time (in Days) in Fresno for
Limited and Unlimited Cases That Did Not Settle at Mediation, by Importance of Mediation to Subsequent Settlement ......................................... 248
Table V-9. Comparison of Average Case Disposition Time in Program
and Control Groups in Fresno, by Case Type ........................................................ 249 Table V-10. Party and Attorney Perceptions of Fairness and Willingness to
Recommend or Use Mediation in Fresno (average agreement with statement) ............................................................................................................... 253
Table V-11. Average Attorney Satisfaction in Unlimited Program-
Group Cases in Fresno, by Program Subgroup ...................................................... 256 Table V-12. Average Attorney Satisfaction in Limited Program-Group Cases
in Fresno, by Program Subgroup............................................................................ 257 Table V-13. Comparison of Average Attorney Satisfaction in Program
and Control Groups in Fresno ................................................................................ 258
xiv
Table V-14. Comparison of Average Attorney Satisfaction in Program and Control Groups in Fresno, by Case Type ........................................................ 260
Table V-15. Litigant Costs and Attorney Hours for Unlimited
Program-Group Cases ............................................................................................ 264 Table V-16. Litigant Costs and Attorney Hours for Limited Program-Group ............... 264
Table V-17. Savings in Litigant Costs and Attorney Hours From Resolving at ............ 266
Table V-18. Average Number of Pretrial Court Events (Per Case) for Unlimited Program-Group Cases in Fresno, by Program Subgroup...................... 269
Table V-19. Average Number of Pretrial Court Events (Per Case) for Limited
Program-Group Cases in Fresno, by Program Subgroup....................................... 270 Table V-20. Comparison of Average Number of Pretrial Court Events
(Per Case) in Program-and Control Group Cases Filed in 2001 ............................ 271 Table V-21. Comparison of Average Number of Pretrial Court Events
(Per Case) in Program and Control Groups in Fresno, by Case Type ................... 274 Table V-22. Impact of Changes in Court's Workload on Judicial Time
in Fresno................................................................................................................. 275 Table VI-1. Stipulated Cases in Contra Costa—Subgroup Breakdown ......................... 293
Table VI-2. Proportion of Unlimited Cases Settled at Mediation in Contra Costa........................................................................................................... 294
Table VI-3. Attorney Opinions of Mediation’s Importance to Post-Mediation
Settlement in Contra Costa..................................................................................... 294 Table VI-4. Pre-/Post-Program Comparison of Trial Rate in Contra Costa ................... 296
Table VI-5. Comparison of Trial Rates in Stipulated and Nonstipulated Cases in Contra Costa........................................................................................................... 296
Table VI-6. Comparison of Trial Rate in Stipulated and Nonstipulated Cases in
Contra Costa Disposed of Within Six Months and After Six Months ................... 297 Table VI-7. Pre-/Post-Program Comparison of Disposition Time (in Days)
in Contra Costa....................................................................................................... 300 Table VI-8. Average Case Disposition Time (in Days) for Stipulated Cases
in Contra Costa, by Subgroups............................................................................... 302
xv
Table VI-9. Comparison of Case Disposition Time (in Days) in Stipulated and
Nonstipulated Cases in Contra Costa ..................................................................... 302 Table VI-10. Comparison of Case Disposition Time in Stipulated and
Nonstipulated Cases in Contra Costa Disposed of Within Six Months and After Six Months ............................................................................................. 303
Table VI-11. Party and Attorney Perceptions of Fairness and Willingness to
Recommend or Use Mediation in Contra Costa (average agreement with statement) ....................................................................................................... 309
Table VI-12. Average Attorney Satisfaction in Stipulated Cases in
Contra Costa, by Subgroups................................................................................... 312 Table VI-13. Comparison of Average Attorney Satisfaction in Stipulated and
Nonstipulated Cases in Contra Costa ..................................................................... 312 Table VI-14. Comparison of Average Attorney Satisfaction in
Stipulated and Nonstipulated Cases in Contra Costa Disposed of in More than Six Months............................................................................................ 313
Table VI-15. Litigant Costs and Attorney Hours in Stipulated Cases,
by Subgroups.......................................................................................................... 317 Table VI-16. Comparison of Litigant Costs and Attorney Hours in
Stipulated and Nonstipulated Cases in Contra Costa ............................................. 318 Table VI-17. Comparison of Litigant Costs and Attorney Hours in
Stipulated and Nonstipulated Cases in Contra Costa Disposed of in More than Six Months............................................................................................ 319
Table VI-18. Savings in Litigant Costs and Attorney Hours From Resolving at
Mediation—Estimates by Attorneys ...................................................................... 321 Table VI-19. Pre-/Post-Program Comparison of Court's Workload in
Contra Costa........................................................................................................... 324 Table VI-20. Average Number of Various Pretrial Court Events
(Per Case) in Stipulated Cases in Contra Costa, by Subgroups ............................. 325 Table VI-21. Comparison of Average Number of Pretrial Court Events
(Per Case) in Stipulated and Nonstipulated Cases in Contra Costa ....................... 325
xvi
Table VI-22. Comparison of Average Number of Pretrial Court Events (Per Case) in Stipulated and Nonstipulated Cases in Contra Costa Disposed of Within Six Months and After Six Months ......................................... 326
Table VII-1. Attorney Opinions of Mediation’s Importance to Post-Mediation
Settlement in Sonoma............................................................................................. 342 Table VII-2. Pre-/Post-Program Comparison of Trial Rate in Sonoma.......................... 344
Table VII-3. Comparison of Trial Rates in Stipulated and Nonstipulated Cases in Sonoma............................................................................................................... 345
Table VII-4. Pre-/Post-Program Comparison of Disposition Time (in Days)
in Sonoma............................................................................................................... 348 Table VII-5. Comparison of Case Disposition Time (in Days) in Stipulated and
Nonstipulated Cases in Sonoma............................................................................. 351 Table VII-6. Comparison of Case Disposition Time in Stipulated and
Nonstipulated Cases in Sonoma Disposed of Within Six Months and After Six Months ............................................................................................. 351
Table VII-7. Party and Attorney Perceptions of Fairness and Willingness to
Recommend or Use Mediation in Sonoma (average agreement with statement) ....................................................................................................... 357
Table VII-8. Comparison of Average Attorney Satisfaction in Stipulated and
Nonstipulated Cases in Sonoma............................................................................. 359 Table VII-9. Comparison of Average Attorney Satisfaction in Stipulated and
Nonstipulated Cases in Sonoma Disposed of in More than Six Months ............... 360 Table VII-10. Savings in Litigant Costs and Attorney Hours from Mediation in
Sonoma—Estimates by Attorneys ......................................................................... 363 Table VII-11. Pre-/Post-Program Comparison of Average Number of
Pretrial Court Events (Per Case) in Sonoma .......................................................... 366 Table VII-12. Comparison of Average Number Pretrial Court Events
(Per Case) in Stipulated and Nonstipulated Cases in Sonoma ............................... 367 Table VII-13. Comparison of Average Number of Pretrial Court Events
(Per Case) in Stipulated and Nonstipulated Cases in Sonoma Disposed of Within Six Months and After Six Months ......................................................... 368
xvii
Table VII-14. Impact of Changes in Court’s Workload on Judicial Time in Sonoma ..................................................................................................... 369
Table D-1. Distribution and Response Rate of Postmediation Surveys ......................... 402
Table D-2. Distribution and Response Rate of Postdisposition Surveys........................ 404
Table D-3. Percentage Breakdown of Survey and Population Cases by Case Type.......................................................................................................... 405
Table D-4. Distribution and Response Rate of Durability Survey ................................. 406
Table D-5. Distribution and Response Rate of Mediator Survey ................................... 407
xviii
ACKNOWLEDGMENTS We thank the California Legislature and the Governor for authorizing the establishment of the Early Mediation Pilot Programs and for providing the funding to support these programs. In particular, we thank Assembly member Hannah-Beth Jackson for authoring the legislation that established these pilot programs. We also extend our sincere thanks to all those who have contributed their expertise to this project, particularly Michael Bergeisen, Melissa Johnson, Kenneth Kann, Alan Wiener, Dag MacLeod, Melissa Levitt, Lisa Lightman, Carolyn McGovern, Fran Haselsteiner, Christine Micklas, Lura Dymond, Lisa McLaughlin, Cynthia Agno, and Meredith Anderson. Special thanks and appreciation go to the Superior Courts of San Diego, Los Angeles, Fresno, Contra Costa, and Sonoma Counties for their participation as the host courts for the Early Mediation Pilot Programs. In particular, we thank the presiding judges and executive officers of these courts for supporting the programs in their courts and the civil department judges and staff for their participation in implementing the pilot programs. Finally, thank you to the staff in Superior Courts of San Diego, Los Angeles, Fresno, Contra Costa, and Sonoma Counties who took the lead in administering the Early Mediation Pilot Programs. We gratefully acknowledge and thank Ellen Miller, Julie Bronson, Dan DeSantis, Mimi Lyster, Gary Weiner, and Robin Siefkin. This study could not have been conducted without their expertise and assistance.
xix
Executive Summary Introduction and Background This is a report about five court-annexed civil mediation programs in California: three mandatory programs operating in the Superior Courts in Fresno, Los Angeles, and San Diego counties and two voluntary programs operating in the Superior Courts in Contra Costa and Sonoma counties. These five programs, called Early Mediation Pilot Programs, were implemented under a statutory mandate, which authorized early referrals to mediation. The statute required the Judicial Council of California to study the five programs and to report the results of the study to the California Legislature and Governor. This report was prepared to fulfill that statutory mandate. It describes the results of a 30-month study of these five separate mediation programs. The findings reported below focus primarily on the pilot programs’ impact in five areas: (1) the trial rate; (2) the time to disposition; (3) the litigants’ satisfaction with the dispute resolution process; (4) the litigants’ costs; and (5) the courts’ workload.
Overview of Findings Based on the criteria established by the Early Mediation Pilot Programs legislation, all five of the Early Mediation Pilot Programs were successful, resulting in substantial benefits to both litigants and the courts. These benefits included reductions in trial rates, case disposition time, and the courts’ workload, increases in litigant satisfaction with the court’s services, and decreases in litigant costs in cases that resolved at mediation in some or all of the participating courts. • Mediation referrals and settlements—A very large number of parties and attorneys
were exposed to and educated about the mediation process through participation in the five Early Mediation Pilot Programs. More than 25,000 cases filed in 2000 and 2001 were eligible for possible referral to mediation in the five Early Mediation Pilot Programs. More than 6,300 unlimited civil cases and almost 1,600 limited cases participated in pilot program mediations. On average, 58 percent of the unlimited cases and 71 percent of the limited cases settled as a direct result of early mediation. The mandatory and voluntary pilot programs generally followed the expected pattern: a higher percentage of cases were referred to mediation in the mandatory programs than in the voluntary programs, but a lower percentage of cases reached settlement in the mandatory programs than in the voluntary programs. However, the referral, mediation, and settlement patterns in the San Diego (mandatory) and Contra Costa (voluntary) programs were similar to each other, suggesting that mandatory mediation programs may be able to achieve high resolution rates when courts consider party preferences in making referrals to mediation, as they did in the San Diego pilot program, and that voluntary mediation programs may be able to achieve high referral
xx
rates when courts urge parties to consider mediation and provide some financial incentive to use the court’s mediation program, as they did in the Contra Costa pilot program. The low percentage of limited cases that stipulated to mediation in Sonoma’s voluntary pilot program model, in which the parties paid for the mediation, suggests that incentives are needed to encourage litigants in smaller-value cases to participate in mediation.
• Trial rate—In San Diego and Los Angeles, where the courts had relatively short
times to disposition and there were good comparison groups, the study found that the pilot programs reduced the proportion of cases going to trial by a substantial 24 to 30 percent. By helping litigants in more cases reach resolution without going to trial, these pilot programs saved a substantial amount of court time. In San Diego, the total potential time saving from the pilot program was estimated to be 521 trial days per year (with an estimated monetary value of $1.6 million); in Los Angeles, the potential saving was estimated to be 670 trial days per year (with an estimated monetary value of approximately $2 million). These results suggest that early mediation programs can help courts save valuable judicial time that can be devoted to the other cases that need judges’ attention.
• Disposition time—All five pilot programs had some positive impact on reducing the time required for cases to reach disposition. The largest reductions in average disposition time occurred in those courts that had the longest overall disposition times before the pilot program began. In all the programs, there were indications that dispositions accelerated around the time that the mediation took place, which was largely attributable to cases settling earlier at mediation than similar cases that were not in the program. There were also indications that early case management conferences and early referrals to mediation played important roles in improving time to disposition. However, the study also found that not settling at mediation resulted in longer disposition times. Overall, these results suggest that careful assessment of cases for referral to mediation is important and that early case management conferences and early mediations are important elements to incorporate into the program to improve disposition time; however, courts that have relatively long disposition times are more likely to experience dramatic reductions in disposition time as a result of implementing an early mediation program than courts with relatively short disposition times.
• Litigant satisfaction—All five pilot programs had positive effects on attorneys’
satisfaction with the services provided by the court, with the litigation process, or with both. The levels of satisfaction with the courts’ services reported by attorneys who participated in the San Diego, Los Angeles, Fresno, and Contra Costa pilot programs were 10 to 15 percent higher than those reported by attorneys in nonprogram cases.1 Similarly, attorneys’ satisfaction with the litigation process was
1 In the San Diego pilot program, because of offsetting decreases in satisfaction among unlimited program-group cases that were not referred to mediation or that were removed from mediation, this impact was evident only for limited cases.

xxi
about 6 percent higher in program cases in the San Diego, Fresno, Contra Costa, and Sonoma pilot programs than in nonprogram cases.2 Attorneys’ satisfaction with the outcome of their cases was linked to whether those cases settled at mediation—attorneys were more satisfied with the outcome in cases that settled and less satisfied in cases that did not. Attorneys were also generally more satisfied with the litigation process when their cases settled at mediation. However, attorneys whose cases were mediated were more satisfied with the services provided by the court regardless of whether their cases settled at the mediation. These results indicate that the experience of participating in pilot program mediation increased attorneys’ satisfaction with the services provided by the court, even if the case did not resolve at mediation. In all five of the pilot programs, both parties and attorneys who participated in mediations expressed high satisfaction with their mediation experience; their highest levels of satisfaction were with the performance of the mediators. They also strongly agreed that the mediator and the mediation process were fair and that they would recommend both to others.
• Litigant costs—In the Contra Costa pilot program, estimated actual litigant costs
were 60 percent lower and average attorney hours were 43 percent lower in program cases than in nonprogram cases. In the San Diego, Contra Costa, and Fresno pilot programs (where it was possible to break down program cases into subgroups based on their different experiences in the pilot program) the study found that the estimated actual litigation costs incurred by parties, hours spent by the attorney in reaching resolution, or both were lower in program cases that settled at mediation than in similar nonprogram cases. The percentage savings in litigant costs calculated through regression analysis were 50 percent in the Contra Costa pilot program; savings in attorney hours were 40 percent in the Contra Costa pilot program, 20 percent in the Fresno pilot program, and 16 percent in the San Diego pilot program. In all five pilot programs, attorneys in program cases that settled at mediation estimated savings ranging from 61 to 68 percent in litigant costs and 57 to 62 percent in attorney hours from the use of mediation to reach settlement. Based on these attorney estimates, the total estimated savings in litigant costs in all of the 2000 and 2001 cases that settled at pilot program mediations ranged from $1,769,040 in the Los Angeles pilot program to $24,784,254 in the San Diego pilot program. The total estimated attorney hours saved ranged from 9,240 hours in the Los Angeles pilot program to 135,300 in the San Diego pilot program. The total estimated savings calculated based on these attorneys estimates in 2000 and 2001 cases that settled at mediation in all five programs was considerable: $49,409,385 in litigant costs and 250,229 attorney hours.
• Court workload—The pilot programs in San Diego, Los Angeles, Fresno, and
Sonoma reduced the number of motions, the number of other pretrial court events, or both in program cases. The reductions were substantial, ranging from 18 to 48 percent for motions and from 11 to 32 percent for other pretrial hearings. Reductions in cases that settled at mediation were even larger, ranging from 30 to 65 percent, compared to similar nonprogram cases. In Fresno, because of special conferences
2 In the San Diego pilot program, because of offsetting decreases in satisfaction among unlimited program-group cases that were not referred to mediation, this impact was evident only for limited cases.
xxii
required under pilot program’s procedures, these decreases were offset by increases in the number of case management conferences in program cases.3 However, in the San Diego, Los Angeles, and Sonoma programs, these reductions resulted in overall savings in court time. The total potential time savings from reduced numbers of court events were estimated to be 479 judge days per year in San Diego (with an estimated monetary value of approximately $1.4 million), 132 days in Los Angeles (with an estimated monetary value of approximately $400,000), and 3 days in Sonoma (with an estimated monetary value of approximately $9,700). These estimates suggest that early mediation programs can help courts save valuable judicial time that can be devoted to other cases requiring judges’ attention. In addition, survey results indicate that there were fewer postdisposition compliance problems and fewer new proceedings initiated in program cases, suggesting that the pilot programs not only reduced court workload in the short term but also may have reduced the court’s future workload.
Summary of Findings Concerning San Diego Pilot Program There is strong evidence that the mandatory pilot program in San Diego reduced the trial rate, case disposition time, and the court’s workload, improved litigant satisfaction with the court’s services, and lowered litigant costs in cases that resolved at mediation. • Mediation referrals and settlements—7,507 cases that were filed in the Superior
Court of San Diego County in 2000 and 2001 (5,394 unlimited and 2,112 limited) were referred to mediation, and 5,035 of those cases (3,676 unlimited and 1,358 limited cases) were mediated under the pilot program. Of the unlimited cases mediated, 51 percent settled at the mediation and another 7 percent settled later as a direct result of the mediation, for a total resolution rate of approximately 58 percent. Among limited cases, 62 percent settled at mediation and another 14 percent settled later as a direct result of the mediation, for a total resolution rate of approximately 76 percent. In survey responses, 74 percent of attorneys whose cases did not settle at mediation indicated that the mediation was important to the ultimate settlement of the case.
• Trial rate—The trial rates for both limited and unlimited cases in the program group were reduced by approximately 25 percent compared to those cases in the control group. This reduction translates to a potential saving of more than 500 days per year in judicial time that could be devoted to other cases needing judges’ time and attention. While this time savings does not translate into a fungible cost saving that can be reallocated to other purposes, its monetary value is equivalent to approximately $1.6 million per year.
• Disposition time—The average time to disposition for unlimited cases in the program group was 12 days shorter than that for cases in the control group and 10 days shorter for limited cases in the program group. The median time to disposition
3 The Superior Court of Fresno County has since changed its case management procedures so that additional case management conferences are not required in program cases.
xxiii
was 19 days shorter for unlimited cases in the program group and 25 days shorter for limited cases in the program group. For unlimited cases, program and control-group cases were disposed of with similar speed from filing until about the time of the case management conference, when the pace of dispositions for program-group cases quickened and the percentage of program-group cases reaching disposition exceeded that of control-group cases. For limited cases, program-group cases were being disposed of faster than control-group cases well before the time of the early case management conference, suggesting that the possibility of attending the conference and being referred to mediation may have increased dispositions. Program-group cases, both unlimited and limited, were disposed of fastest around the time of the mediation. Comparisons with similar cases in the control group confirmed that when program-group cases were settled at mediation, the average disposition time was shorter, but also indicated that when cases were mediated and did not settle at the mediation, the disposition time was longer.
• Litigant satisfaction—Attorneys in limited program-group cases were more satisfied with the court’s services than attorneys in limited control-group cases. Attorneys’ levels of satisfaction with the court’s services, the litigation process, and the outcome of the case were all higher in both limited and unlimited program-group cases that settled at mediation than in similar control-group cases. Attorneys in program-group cases that went to mediation and did not settle at mediation were also more satisfied with the court’s services than attorneys in similar control-group cases. This suggests that participating in mediation increased attorneys’ satisfaction with the court’s services, regardless of whether their cases settled at mediation. Both parties and attorneys who participated in pilot program mediations expressed high satisfaction with their mediation experience, particularly with the performance of the mediators. They also strongly agreed that the mediator and the mediation process were fair and that they would recommend both to others.
• Litigant costs—Estimates of actual attorney time spent in reaching resolution were 16 percent lower in program-group cases that settled at mediation than for similar cases in the control group. Comparisons between program-group cases that settled at mediation and similar control-group cases also suggested that litigant costs were lower in program-group cases that settled at mediation. In cases that settled at mediation, 87 percent of attorneys responding to the study survey estimated some savings in both litigant costs and attorney hours from using mediation to reach settlement. Average savings estimated by attorneys per settled case was $9,159 in litigant costs and 50 hours in attorney time. Based on these attorney estimates, the total estimated savings in litigant costs in all 2000 and 2001 cases that settled at mediation was $24,784,254 and the total estimated savings in attorney hours was 135,300.
• Court workload—The pilot program in San Diego reduced the court’s workload. In addition to the reduction in trials discussed above, the pilot program reduced the average number of pretrial court events by 16 percent for unlimited cases and 22 percent for limited cases in the program group. This translates to a potential saving of
xxiv
479 days per year in judicial time that could be devoted to other cases needing judges’ time and attention. While this time savings does not translate into a fungible cost saving that can be reallocated to other purposes, its monetary value is equivalent to approximately $1.4 million per year. There was strong evidence of even larger reductions in pretrial events—between 40 and 45 percent—in cases that resolved at mediation. In addition, there were fewer postdisposition compliance problems and fewer new proceedings initiated in program-group cases, suggesting that the pilot program may have reduced the court’s future workload.
Summary of Findings Concerning Los Angeles Pilot Program There is strong evidence that the mandatory pilot program in Los Angeles reduced the trial rate, case disposition time, and court workload, improved litigant satisfaction with the court’s services, and lowered litigant costs in cases that resolved at mediation. • Mediation referrals and settlements—560 unlimited cases that were filed in the
Superior Court of Los Angeles County between April and December 2001 were referred to mediation, and 399 of these cases were mediated under the pilot program. Of the unlimited cases mediated, 35 percent settled at the mediation and another 14 percent settled later as a direct result of the mediation, for a total resolution rate of approximately 49 percent. In survey responses, 78 percent of attorneys whose cases did not settle at mediation indicated that the mediation was important to the ultimate settlement of the case.
• Trial rate—The trial rate for unlimited civil cases in the program was reduced by
approximately 30 percent compared to cases in the control groups. This reduction translates to a potential savings of more than 670 days in judicial time that could be devoted to other cases needing judges’ time and attention. While this time saving does not translate into a fungible cost saving that can be reallocated to other purposes, its monetary value is equivalent to approximately $2 million per year.
• Time to disposition—The overall average time to disposition for program-group
cases was approximately 19 days shorter and the median time to disposition was 23 days shorter, than for cases in the control departments. The disposition rate in the program group was higher than that in either control group for the entire study period. The pace of dispositions rose for program cases, reaching its fastest pace, both around the time when case management conferences were held and when mediations were completed in the program group, suggesting that both the case management conference and the mediation may have increased dispositions. Among cases that settled at mediation, cases in the pilot program took less time to reach disposition than like cases in either control group that settled in the Civil Action Mediation program established by Code of Civil Procedure sections 1775-1775.16 (1775 program). Among cases that did not settle at mediation, program-group cases took more time to reach disposition than like cases in either control group under the 1775 program.
xxv
• Litigant satisfaction—Attorneys in program-group cases were more satisfied with the court’s services than attorneys in control-group cases. Attorneys whose cases settled at mediation under the pilot program were also more satisfied with both the outcome of the case and with the services of the court compared to attorneys in cases that settled at mediation under the 1775 program. However, attorneys whose cases did not settle at mediation under the Early Mediation Pilot Program were less satisfied with outcome of the case than attorneys whose cases did not settle at mediation under the 1775 program. Both parties and attorneys who participated in pilot program mediations expressed high satisfaction with their mediation experience, particularly with the performance of the mediators. They also strongly agreed that the mediator and the mediation process were fair and that they would recommend both to others.
• Litigant costs—In cases that settled at mediation, 75 percent of attorneys responding
to the study survey estimated some savings in both litigant costs and attorney hours from using mediation to reach settlement. Average savings per settled case estimated by attorneys was $12,636 in litigant costs and 66 hours in attorney time. Based on these attorney estimates, the total estimated savings in litigant costs in all 2001 cases that were settled at mediation was $1,769,039 and total estimated savings in attorney hours was 9,240. There was also evidence that both litigant costs and attorney hours were lower in program cases that settled at mediation under the Early Mediation Pilot Program compared to like cases in the control departments that settled at mediation under the 1775 program; both litigant costs and attorney hours were approximately 60 percent lower in program-group cases that settled at mediation compared to similar cases in the control groups.
• Court workload—The pilot program in Los Angeles reduced the court’s workload.
In addition to the reduction in trials discussed above, the pilot program reduced the average number of “other” pretrial hearings in program cases by 11 percent compared to control cases in the participating departments and may also have reduced motion hearings in program-group cases compared to cases in both control groups. These decreases were partially offset by a 16 percent increase in the number of case management conferences (CMCs) in the program group compared to control cases in the participating departments. However, because motions and “other” pretrial hearings take more judicial time on average than case management conferences, the changes in the number of pretrial court events caused by the pilot program resulted in saving judicial time. The total potential time savings from the reduced number of court events was estimated at 132 judicial days per year (with a monetary value of $395,000 per year).
• Comparison of mandatory pilot program mediation and voluntary mediation in Los Angeles—The statutes establishing the Early Mediation Pilot Programs required the Judicial Council report to compare court-ordered mediation under the pilot program with voluntary mediation in Los Angeles County. In comparisons between cases valued over $50,000 referred to mediation under pilot program (court-ordered referrals) and cases valued at over $50,000 referred to mediation under (voluntary
xxvi
referrals) in Los Angeles, the study found lower trial rates, disposition time, and court workload in those cases valued over $50,000 referred to mediation under the 1775 program pilot program compared to the 1775 program. The trial rate for these pilot program cases was approximately 31 percent lower than in these 1775 program cases, disposition time was approximately 20 to 30 days shorter in the pilot program cases, and there were 10 percent fewer pretrial court events on average in these pilot program cases. Results of the study also suggested that attorneys’ satisfaction with the court’s services and the litigation process may have been higher in those cases valued over $50,000 referred to mediation under pilot program than under the 1775 program. However, it is not clear whether these differences were due to the mandatory referrals to mediation in the pilot program versus the voluntary referrals under the 1775 program or due to other differences between these two programs, such as the pilot program’s earlier case management conferences and mediations.
Summary of Findings Concerning Fresno Pilot Program There is strong evidence that the mandatory pilot program in Fresno reduced case disposition time, improved litigant satisfaction with the court’s services and the litigation process, and decreased litigant costs in cases that resolved at mediation. • Mediation referrals and settlements—Almost 1,300 cases that were filed in the
Superior Court of Fresno County in 2000 and 2001 (871 unlimited and 414 limited) were referred to mediation, and more than 700 of these cases (514 unlimited and 214 limited) were mediated under the pilot program. Of the unlimited cases mediated, 47 percent settled at the mediation and another 8 percent settled later as a direct result of the mediation, for a total resolution rate of approximately 55 percent. Among limited cases, 58 percent settled at mediation and another 3 percent settled later as a direct result of the mediation, for a total resolution rate of approximately 61 percent. In survey responses, 67 percent of attorneys whose cases did not settle at mediation indicated that the mediation was important to the ultimate settlement of the case.
• Trial rate—Because a large proportion of the cases being studied had not yet reached
disposition, there was not sufficient data to determine whether the pilot program in Fresno had an impact on the trial rate.
• Disposition time—In direct comparisons between unlimited cases filed in 2001 in the
program and control groups, the average time to disposition in the program group was 39 days shorter than in the control group and the median time to disposition was 50 days shorter. For limited cases filed in 2001, the average time to disposition for cases in the program group was 26 days shorter than for cases in the control group and the median time to disposition was 6 days shorter. The results of regression analysis that accounted for case type differences suggest that the average time to disposition in the program group was 40 days shorter than in the control group for both unlimited and limited cases. For both unlimited and limited program-group cases, starting at about the time that pilot program mediations occurred on average, the pace of dispositions outstripped that of cases in the control group, suggesting that the mediations
xxvii
contributed to shortening the time to disposition. Comparisons with similar cases in the control group indicate that when program-group cases were settled at mediation, the average disposition time was shorter, but when cases were mediated and did not settle at the mediation, the disposition time was longer.
• Litigant satisfaction—Attorneys in both unlimited and limited program-group cases
were more satisfied with both the litigation process and the court’s services than attorneys in control-group cases. Attorneys’ satisfaction with the court’s services, the litigation process, and the outcome of the case were all higher in program-group cases that settled at mediation than in similar control-group cases. While attorneys whose cases did not settle at mediation were less satisfied with the outcome of the case, they were still more satisfied with both the litigation process and the services provided by the court than attorneys in like cases in the control group. This suggests that participating in mediation increased attorneys’ satisfaction with both the litigation process and the court’s services, regardless of whether the case settled at mediation. Both parties and attorneys who participated in pilot program mediations expressed high satisfaction with their mediation experiences, particularly with the performance of the mediators. They strongly agreed that the mediator and the mediation process were fair and that they would recommend both to others.
• Litigation costs—There was evidence that both litigant costs and attorney time were
reduced when cases resolved at mediation. In cases that settled at mediation, 89 percent of attorneys responding to the study survey estimated some savings in both litigant costs and attorney hours from using mediation to reach settlement. Average savings estimated by attorneys per settled case was $9,915 in litigant costs and 50 hours in attorney time. Based on these attorney estimates, the total estimated savings in litigant costs in all 2000 and 2001 cases that settled at mediation was $3,619,136 and the total estimated savings in attorney hours was 24,455.
• Court workload—Unlimited program-group cases filed in 2001 had 13 percent
fewer motion hearings than cases in the control group, and limited program-group cases had 48 percent fewer motion hearings. However, this decrease in motions was completely offset by an increase in the number of case management conferences and other pretrial hearings in pilot program cases so that, overall, there was an increase in the total number of pretrial court events in the program group and a small increase in the judicial time spent on program cases during the study period. The increase in the number of case management conferences for program cases was understandable given court procedures (since changed) that required conferences in all program cases that did not settle at mediation and in most program cases when the parties wanted their case removed from the mediation track. The court’s procedures did not generally require case management conferences in other cases. Unlimited program-group cases that settled at mediation had 45 percent fewer court events overall compared to similar cases in the control group. This overall reduction stemmed from reductions in motion and other hearings; there were 80 percent fewer motion hearings and 60 percent fewer other hearings in unlimited program cases that settled at mediation compared to like cases in the control group.

xxviii
Summary of Findings Concerning Contra Costa Pilot Program There is evidence that the voluntary pilot program in Contra Costa reduced disposition time and litigant costs and increased attorney satisfaction with the litigation process and the services provided by the court. • Mediation referrals, mediations, and settlements—1,650 cases that were filed in
the Superior Court of Contra Costa County in 2000 and 2001 were referred to mediation and almost 1,200 of these cases were mediated under the pilot program. Of the cases mediated, 53 percent settled at the mediation and another 7 percent settled later as a direct result of the mediation, for a total resolution rate of approximately 60 percent. In survey responses, 75 percent of attorneys whose cases did not settle at mediation indicated that the mediation was important to the ultimate settlement of the case.
• Trial rate—No statistically significant reduction in the trial rate was found either in comparisons between cases filed before and after the program began or in comparisons between cases in which the litigants stipulated to mediation and those in which they did not. However, this does not necessarily indicate that the pilot program had no impact on the trial rate; there were limitations associated with the comparisons that made it difficult to evaluate whether the program affected trial rates.
• Disposition time—There was evidence that the pilot program decreased disposition time. Pre-/post-program comparisons suggested that the median disposition time for cases filed after the pilot program began was shorter than the median disposition time for cases filed before the program began. These comparisons also showed that the disposition rate for post-program cases was higher than that for pre-program cases for the entire 34-month period studied, but most noticeably between 6 and 12 months after filing, when it ranged from about 1.5 to 3 percent higher than that for pre-program cases. Comparisons between disposition rates in cases in which the litigants stipulated to mediation and cases in which they did not showed that while nonstipulated cases began to resolve earlier than stipulated cases, from 9 to 18 months after filing, stipulated cases were disposed of at a faster pace than nonstipulated cases and ultimately more stipulated than nonstipulated cases had reached disposition by the end of 18 months after filing. The pace of dispositions for stipulated cases was fastest at 9 months after filing, about the time that mediations took place, suggesting that mediations increased the pace of dispositions among stipulated cases. Comparisons with similar stipulated and nonstipulated cases confirmed that when cases were settled at mediation, the average disposition time was shorter, but also indicated that when cases were mediated and did not settle at the mediation, the disposition time was longer.
• Litigant satisfaction—Attorneys in cases in which the litigants stipulated to mediation cases were more satisfied with the overall litigation process and services provided by the court than attorneys in cases in which the litigants did not stipulate to mediation. They were, however, less satisfied with outcome of the case compared to attorneys in nonstipulated cases. Attorneys’ levels of satisfaction with the court’s
xxix
services, the litigation process, and with the outcome of the case were all higher in stipulated cases that settled at mediation than in similar nonstipulated cases. Attorneys in stipulated cases that went to mediation but did not settle at mediation were also more satisfied with the court’s services than attorneys in similar nonstipulated cases. This suggests that participating in mediation increased attorneys’ satisfaction with the court’s services, regardless of whether their cases settled at mediation. Both parties and attorneys who participated in pilot program mediations expressed high satisfaction with their mediation experience, particularly with the performance of the mediators. They also strongly agreed that the mediator and the mediation process were fair and that they would recommend both to others.
• Litigant costs—There was evidence that the pilot program reduced both litigant costs and attorney time, particularly in cases that settled at mediation. Litigant costs in were approximately $7,500 lower in cases in which the litigants stipulated to mediation compared to those in which the litigants did not stipulate to mediation. Both direct comparisons between stipulated and nonstipulated cases disposed of in over six months and comparisons between litigant costs and attorney hours in stipulated cases and nonstipulated cases with similar characteristics using regression analysis suggested that litigant costs and attorney hours were reduced in stipulated cases. Regression analysis also suggested that litigant costs were reduced by approximately 50 percent and attorney hours were reduced by 40 percent in both cases that were settled at mediation and in cases that did not settle at mediation compared to similar nonstipulated cases. In cases that settled at mediation, 87 percent of attorneys responding to the study survey estimated some savings in both litigant costs and attorney hours from using mediation to reach settlement. Average savings estimated by attorneys per settled case was $16,197 in litigant costs and 78 hours in attorney time. Based on these attorney estimates, the total estimated litigant cost savings in all 2000 and 2001 cases that settled at mediation was $9,993,839 and the total estimated savings in attorney hours was 48,126.
• Court workload—The evidence concerning the Contra Costa pilot program’s impact on the court’s workload was mixed. In pre-/post-program comparisons, the average number of case management conferences held per case was 27 percent higher and the number of “other” pretrial hearings was 11 percent higher the year after the program began compared to a year before the pilot program began. The increase in case management conferences may have been due, at least in part, to the introduction of the Complex Litigation Pilot Program in 2000. In comparisons of stipulated and nonstipulated cases, stipulated cases had fewer motion hearings but more case management conferences than nonstipulated cases, so that the total number of all pretrial events was essentially the same in both groups. However, comparisons of only those cases disposed of in over six months suggested that the total number of hearings may have been lower in the stipulated group. In addition, when cases settled at mediation, the total number of court events was 20 percent lower, on average, in stipulated cases compared to nonstipulated cases with similar characteristics. Conversely, similar comparisons suggested that the number of pretrial hearings might have increased when cases did not settle at mediation.
xxx
Summary of Findings Concerning Sonoma Pilot Program There is evidence that the voluntary pilot program in Sonoma reduced disposition time, reduced the court’s workload, increased attorney satisfaction with the litigation process and the court’s services, and reduced litigant costs in cases that settled at mediation. • Mediation referrals, mediations, and settlements—737 cases that were filed in the
Superior Court of Sonoma County in 2000 and 2001 were referred to mediation and 574 of these cases were mediated under the pilot program. Of the unlimited cases mediated, 62 percent settled at the mediation. In survey responses, 90 percent of attorneys whose cases did not settle at mediation indicated that the mediation was important to the ultimate settlement of the case.
• Trial rate—Because a large proportion of the cases being studied had not yet reached
disposition, there was not sufficient data to determine whether the pilot program in Sonoma had an impact on the trial rate.
• Disposition time—The pilot program had a positive impact on case disposition time
for both limited and unlimited cases. The average disposition time for limited cases filed after the program began was 37 days shorter than the average for limited cases filed before the program began. The disposition rate for unlimited post-program cases was higher than for pre-program cases for the entire 34-month follow-up period. The pace of dispositions for limited post-program cases accelerated about the time when, under the court’s rules, early mediation status conferences were set, suggesting that this conference played a role in improving disposition time. Comparisons of the disposition rates in stipulated and nonstipulated cases showed that while nonstipulated cases begin to resolve earlier, once stipulated cases begin reaching disposition, they were disposed of faster than nonstipulated cases and ultimately more stipulated than nonstipulated cases reached disposition by the end of 34 months. The fact that stipulated cases were disposed of fastest between 6 and 12 months after filing, about the time that mediations would have occurred under the court’s pilot program rules, suggests that participation in mediation may have increased the rate of disposition for stipulated cases.
• Litigant satisfaction—Attorneys in stipulated cases were more satisfied with the overall litigation process and services provided by the court. Both parties and attorneys expressed high satisfaction when they used mediation through the Sonoma pilot program, particularly with the services of the mediators. They also strongly agreed that the mediator and the mediation process were fair and that they would recommend both to others.
• Litigant costs—There was evidence that both litigant costs and attorney time were
reduced when cases resolved at mediation. In cases that settled at mediation, 95 percent of attorneys responding to the study survey estimated some savings in both litigant costs and attorney hours from using mediation to reach settlement. Average savings estimated by attorneys per settled case were $25,965 in litigant costs and 93 hours in attorney time. Based on these attorney estimates, a total of $9,243,430 in
xxxi
litigant costs and 33,108 in attorney hours was estimated to have been saved in all 2000 and 2001 cases that were settled at mediation.
• Court workload—There was evidence that the pilot program reduced the court’s workload. Comparisons between cases filed before and after the pilot program began indicated that average number of “other” pretrial hearings was 15 percent lower in unlimited cases filed after the pilot program began than in unlimited cases filed before the program began. Comparisons between stipulated and nonstipulated cases using regression analysis to control for differences in case characteristics indicated that the average number of motion hearings was 50 percent lower in cases in which the parties stipulated to mediation compared to similar cases in which the parties did not stipulate to mediation and that the average number of “other” pretrial hearings was 45 percent lower. The smaller number of court events in program cases means that the time that judges would have been spent on these events could be devoted to other cases needing judicial time and attention. The total time saving from the reduced number of court events in program cases compared to cases filed before the program began was estimated at 3.2 judge days per year (with an estimated monetary value of approximately $9,700 per year).

xxxii

1
I. Introduction This is a report about five court-annexed civil mediation programs that operated in California trial courts between 2000 and 2003. These five programs, called Early Mediation Pilot Programs, were implemented under a statutory mandate. The statute also required the Judicial Council of California to study the five programs and to report the results of the study to the California Legislature and Governor. This report was prepared to fulfill that statutory mandate. It describes the results of a 30-month study of these five separate mediation programs. To fulfill the Judicial Council’s statutory mandate, this study focuses primarily on the programs’ impact on:
1. the proportion of cases that went to trial; 2. the time it took for cases to reach disposition; 3. the litigants’ satisfaction with the dispute resolution process; 4. the litigants’ costs; and 5. the courts’ workload.
Based on these criteria, all five of the Early Mediation Pilot Programs were successful, resulting in substantial benefits to both litigants and the courts, including reductions in trial rates, case disposition time, and the courts’ workload, increases in litigant satisfaction with the court’s services, and decreases in litigant costs in cases that resolved at mediation in some or all of the participating courts. The sections below provide background information about the Early Mediation Pilot Program legislation, the courts that were selected to implement these pilot programs, and the different mediation program models that were adopted by these courts. This background information is followed by a description of the data and analytical methods used in this study. The discussion of the study results begins in Section II with an overview of the findings in all five pilot programs. Sections III–VII provide detailed descriptions of the individual pilot programs and the study findings concerning each of these programs.

2
A. Background
The Legislation Establishing the Early Mediation Pilot Programs Legislation enacted in July 19994 required the Judicial Council of California to establish Early Mediation Pilot Programs for general civil cases5 in four superior courts.6 The statutes outlined a basic framework for the pilot programs: in two of the four pilot programs, the court was to have the authority to make mandatory referrals to mediation; in the other two programs, participation in mediation was to be voluntary.7 This report refers to these courts or programs as, respectively, “mandatory” and “voluntary” courts or programs. The statutes authorized all four of these courts to hold an initial conference with the parties in a case earlier than is generally permitted under California law as early: as 90 days after the filing of the case rather than the 120–150 days permitted in other courts.8 At this conference the court was to confer with the parties about alternative dispute resolution (ADR) options. In the mandatory courts, after considering the willingness of the parties to participate in the mediation, the court was given the power to order the case to mediation. The statutes further required the mandatory courts to establish panels of mediators.9 The parties were free to choose any mediator for their case, whether or not that mediator was on the court’s panel. However, if the parties chose a mediator from the court’s panel, the services of that mediator were to be provided at no cost to the parties.10 The statutes generally required that mediations be scheduled within 60 days of the early case management conference.11 At the end of the mediation, the mediator was required to file with the court a form indicating whether the mediation ended in full resolution of the case, partial resolution, or no resolution.12 4 Title 11.5 of California Code Civ. Proc., § 1730 et seq. (Stats. 1999, ch. 67, § 4 (AB. 1105)). See Appendix A for a copy of these code sections. 5 As used in this legislation, “general civil case” means all civil cases except probate, guardianship, conservatorship, family law (including proceedings under the Family Law Act, Uniform Parentage Act, and Uniform Child Custody Jurisdiction Act; freedom from parental custody and control proceedings; and adoption proceedings), and juvenile court proceedings; small claims cases; and other civil petitions, including petitions for a writ of mandate or prohibition, temporary restraining orders, harassment restraining orders, domestic violence restraining orders, writs of possession, appointment of a receiver, release of property from lien, and change of name. 6 Superior courts are California’s trial courts of general jurisdiction. 7 Code Civ. Proc., § 1730. 8 Id., § 1734. See also Gov. Code, § 68616. 9 Code Civ. Proc., § 1735. 10 Ibid. 11 Id., § 1736. 12 Code Civ. Proc., § 1739; Cal. Rules of Court, rule 1640.8; and Judicial Council form ADR-100, Statement of Agreement or Nonagreeement.
3
The statutes stated that the purpose of the pilot programs was to assess the benefits of early mediation of civil cases.13 As noted above, the statutes required that the Judicial Council conduct a study of the pilot programs and report its results to the Legislature and the Governor.14 The statutes specifically required that the study examine the pilot programs’ impact on:
1. The settlement rate; 2. The timing of settlement; 3. The litigants’ satisfaction with the dispute resolution process; and 4. The costs to the litigants and the courts.15
The statutes gave the Judicial Council responsibility for selecting the four pilot program courts16 and for adopting rules of court to implement the programs.17 The Early Mediation Pilot Program statutes were amended in 2000.18 The new legislation provided that, in addition to the other four pilot courts, the Judicial Council was required to establish another mandatory Early Mediation Pilot Program in the Superior Court of Los Angeles County. Instead of a court-wide pilot program as in the other courts, the Los Angeles pilot program was to be established in only 10 civil departments in the main, downtown Los Angeles courthouse Central District. The legislation also required that the Judicial Council’s study include a comparison of court-ordered mediation under the pilot program and voluntary mediation in Los Angeles County.19
The Pilot Courts Selected by the Judicial Council After the 1999 legislation’s enactment, the Judicial Council solicited proposals for Early Mediation Pilot Programs from all 58 superior courts in California. Proposals were particularly encouraged from both courts in large urban centers and in less-populated, suburban areas.20 The Judicial Council received 11 responses. A variety of factors were considered in reviewing these proposals, including the quality of the mediation program proposed; the court’s ability to implement the program within the required time; the court’s ability to meet the program’s data collection requirements; the need for mediation services within
13 Code Civ. Proc., § 1730. 14 Id., § 1742. 15 Ibid. The report was originally required to be submitted on or before January 1, 2003. This deadline was extended to allow cases filed during the study period to reach final disposition. At the end of 2002, the data revealed that a significant proportion of cases in some courts had not reached final disposition and thus information about the settlement rate, time to disposition, etc. was not available for these cases. 16 Code Civ. Proc., § 1730. 17 Id., §§ 1732, 1735, 1739, and 1742. The implementing rules of court adopted by the Judicial Council are Cal. Rules of Court, rules 1640–1640.8. See Appendix B for a copy of these rules. 18 Stats 2000, ch. 127 (AB. 2866). 19 Code Civ. Proc., § 1742. 20 Proposals from courts with very small civil caseloads were not encouraged, because one of the requirements for selection was a sufficiently large sample of cases for purposes of the legislatively mandated study.

4
the court and the county served by the court; and the reasonableness of the proposed program budget. Ultimately, the Superior Courts of Fresno and San Diego Counties were selected as the mandatory courts and the Superior Courts of Contra Costa and Sonoma Counties were selected as the voluntary courts. These four pilot programs began operation in the first quarter of 2000. As noted above, legislation subsequently adopted in 2000 required the Judicial Council to establish another mandatory pilot program in the Central District of the Superior Court of Los Angeles County. The Los Angeles pilot program began operation in June 2001.
The Program Models Adopted by the Pilot Courts As discussed above, the Early Mediation Pilot Program statutes outlined the pilot programs’ basic framework. However, both the statutes and the implementing rules of court gave the pilot courts considerable latitude in determining the structural and procedural details of their programs. Thus, while the five pilot programs shared some common features, they varied significantly from one another in numerous other respects, including timing of case management conferences, the mediation referral process, the role of judges in mediation referrals, and the qualifications and compensation of participating mediators. The court environments into which each of these programs was placed also varied. San Diego and Los Angeles are large, urban courts with large civil caseloads; Contra Costa, Fresno, and Sonoma are smaller courts with smaller civil caseloads. The San Diego, Los Angeles, and Contra Costa courts had offered court-annexed mediation programs before they implemented the pilot program; the Fresno and Sonoma courts had not. Of those that already had mediation programs, Los Angeles and Contra Costa retained their programs along side the pilot program while San Diego did not. At the time the pilot programs were implemented, the San Diego, Los Angeles, and Contra Costa courts had relatively short disposition times, with most civil cases reaching disposition within 24 months of filing; in Fresno and Sonoma a substantial proportion of cases took longer than 24 months to reach disposition. The differences in the structure and court environments of the pilot programs mean that each of the five programs is unique: they cannot simply be lumped together and viewed generically as “mediation programs” or as “voluntary” or “mandatory” programs. While we report below on each pilot program’s impact on the same outcome measures (settlement rate, time to settlement, and so forth), the results reflect the unique nature of the particular program. Any cross-program comparisons must therefore take into account the impact of programmatic and environmental differences on these results. To make it easier to see some of the similarities and differences between the five pilot programs, Table I-1 compares the pilot programs’ key features. More detailed descriptions of each program are presented in the report chapter focusing on that pilot program.
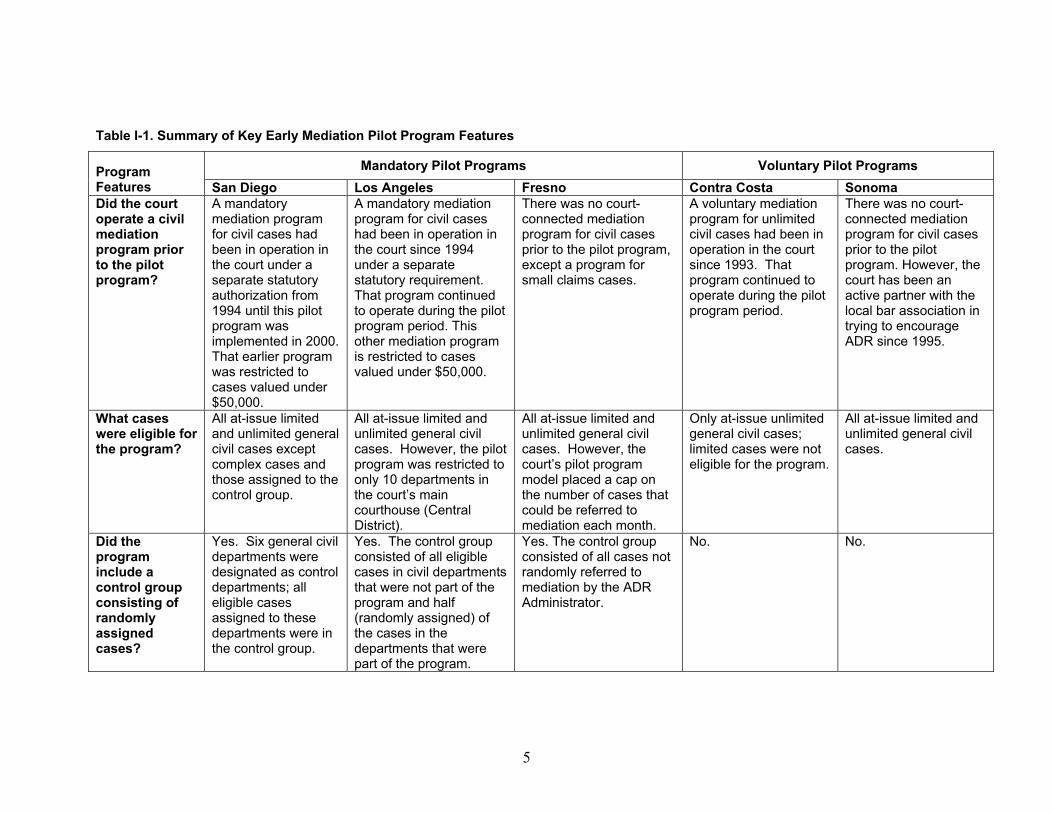
5
Table I-1. Summary of Key Early Mediation Pilot Program Features
Mandatory Pilot Programs Voluntary Pilot Programs Program Features San Diego Los Angeles Fresno Contra Costa Sonoma Did the court operate a civil mediation program prior to the pilot program?
A mandatory mediation program for civil cases had been in operation in the court under a separate statutory authorization from 1994 until this pilot program was implemented in 2000. That earlier program was restricted to cases valued under $50,000.
A mandatory mediation program for civil cases had been in operation in the court since 1994 under a separate statutory requirement. That program continued to operate during the pilot program period. This other mediation program is restricted to cases valued under $50,000.
There was no court-connected mediation program for civil cases prior to the pilot program, except a program for small claims cases.
A voluntary mediation program for unlimited civil cases had been in operation in the court since 1993. That program continued to operate during the pilot program period.
There was no court-connected mediation program for civil cases prior to the pilot program. However, the court has been an active partner with the local bar association in trying to encourage ADR since 1995.
What cases were eligible for the program?
All at-issue limited and unlimited general civil cases except complex cases and those assigned to the control group.
All at-issue limited and unlimited general civil cases. However, the pilot program was restricted to only 10 departments in the court’s main courthouse (Central District).
All at-issue limited and unlimited general civil cases. However, the court’s pilot program model placed a cap on the number of cases that could be referred to mediation each month.
Only at-issue unlimited general civil cases; limited cases were not eligible for the program.
All at-issue limited and unlimited general civil cases.
Did the program include a control group consisting of randomly assigned cases?
Yes. Six general civil departments were designated as control departments; all eligible cases assigned to these departments were in the control group.
Yes. The control group consisted of all eligible cases in civil departments that were not part of the program and half (randomly assigned) of the cases in the departments that were part of the program.
Yes. The control group consisted of all cases not randomly referred to mediation by the ADR Administrator.
No. No.
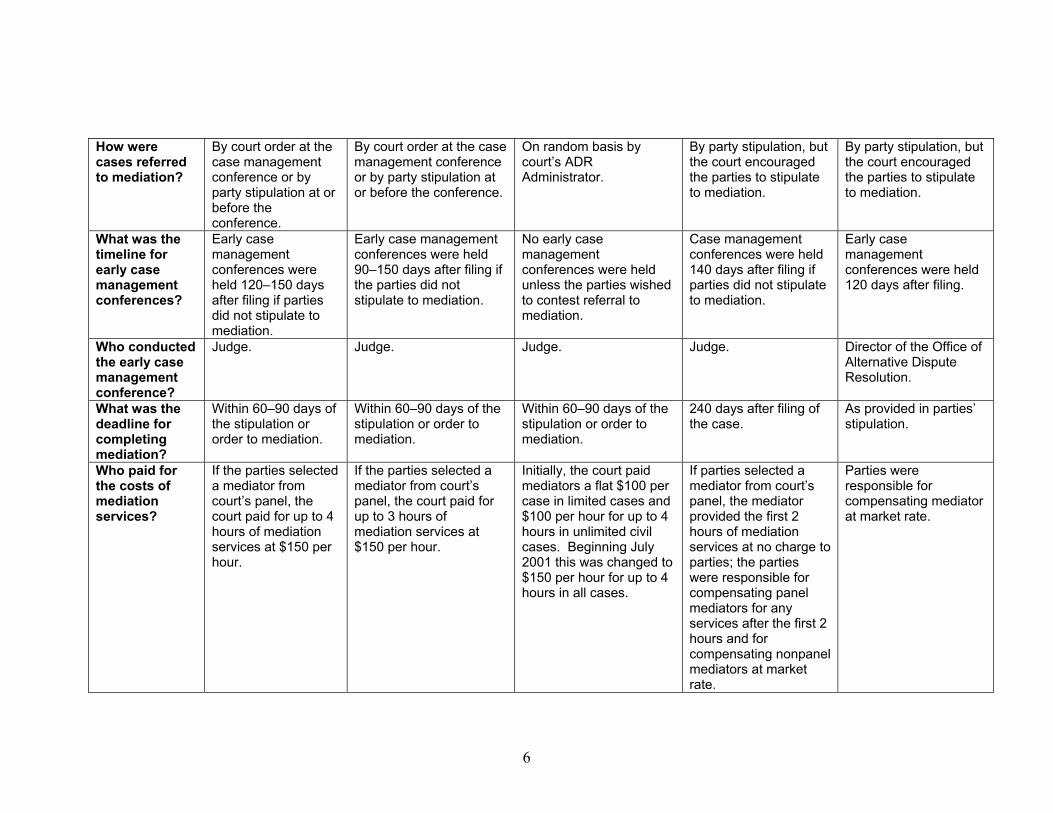
6
How were cases referred to mediation?
By court order at the case management conference or by party stipulation at or before the conference.
By court order at the case management conference or by party stipulation at or before the conference.
On random basis by court’s ADR Administrator.
By party stipulation, but the court encouraged the parties to stipulate to mediation.
By party stipulation, but the court encouraged the parties to stipulate to mediation.
What was the timeline for early case management conferences?
Early case management conferences were held 120–150 days after filing if parties did not stipulate to mediation.
Early case management conferences were held 90–150 days after filing if the parties did not stipulate to mediation.
No early case management conferences were held unless the parties wished to contest referral to mediation.
Case management conferences were held 140 days after filing if parties did not stipulate to mediation.
Early case management conferences were held 120 days after filing.
Who conducted the early case management conference?
Judge. Judge. Judge. Judge. Director of the Office of Alternative Dispute Resolution.
What was the deadline for completing mediation?
Within 60–90 days of the stipulation or order to mediation.
Within 60–90 days of the stipulation or order to mediation.
Within 60–90 days of the stipulation or order to mediation.
240 days after filing of the case.
As provided in parties’ stipulation.
Who paid for the costs of mediation services?
If the parties selected a mediator from court’s panel, the court paid for up to 4 hours of mediation services at $150 per hour.
If the parties selected a mediator from court’s panel, the court paid for up to 3 hours of mediation services at $150 per hour.
Initially, the court paid mediators a flat $100 per case in limited cases and $100 per hour for up to 4 hours in unlimited civil cases. Beginning July 2001 this was changed to $150 per hour for up to 4 hours in all cases.
If parties selected a mediator from court’s panel, the mediator provided the first 2 hours of mediation services at no charge to parties; the parties were responsible for compensating panel mediators for any services after the first 2 hours and for compensating nonpanel mediators at market rate.
Parties were responsible for compensating mediator at market rate.
7
B. Measurement of Program Impacts, Data, and Methods This section describes how program impacts required to be examined by the Early Mediation Pilot Program statutes were measured in this study, what data were used in measuring these impacts, and what methods were used to analyze this data.
How Program Impacts Were Measured As noted above, the Early Mediation Pilot Program statutes specifically required this study to examine the pilot programs’ impact on:
1. the settlement rate; 2. the timing of settlement; 3. the litigants’ satisfaction with the dispute resolution process; and 4. the costs to the litigants and the courts.
For the Los Angles pilot program, the Early Mediation Pilot Programs statutes also required the Judicial Council report to compare court-ordered mediation under the pilot program with voluntary mediation in Los Angeles County. This section describes how each of these impacts was measured in this study.
Settlement/Trial Rate To measure whether the pilot programs had an impact on the settlement rate, this study examined the opposite—the proportion of cases that did not settle and went to trial. The available data on trials in the pilot courts were generally more reliable than the data concerning voluntary settlements. A reduction in the trial rate appeared to be an appropriate proxy measure for an increased settlement rate: if fewer cases went to trial under the mediation pilot program, it is reasonable to assume that this reduction represents an increase in the settlement rate. Furthermore, trial rates also provided a better measure of the programs’ impact on the courts’ workload. The trial rate was calculated by dividing the number of cases that went to trial by the total number of cases that reached disposition during the study period. The programs’ overall impact on trial rate was measured by comparing the difference in trial rates between two groups of cases (comparison groups). In the mandatory courts, the comparison groups were cases in the “program group” and the “control group.” In the voluntary courts, the comparison groups were one of two types: (1) cases filed before the pilot program began and cases filed after the pilot program began (“pre-/post-program”) or (2) cases in which the litigants stipulated to mediation under the pilot program (“stipulated”) and cases in which the litigants did not stipulate to mediation (“nonstipulated”).21 For purposes of this study, a case was considered to have “gone to trial” when a trial event was held for the case; a case did not necessarily have to go through a full trial.
21 See the discussion in the section “What Methods Were Used to Examine the Data” for additional explanation of these comparisons.

8
Timing of Settlement/Disposition Time To measure whether the pilot programs had an impact on the timing of settlement, this study examined how long it took for cases to reach disposition (“disposition time”). Disposition time was calculated as the number of days elapsed from the filing of a case until the case’s final disposition as shown by the entry of dismissal or judgment in the court’s case management system. Overall program impact on disposition time was measured by comparing the difference between the average (and median) disposition times for cases in the available comparison groups (program/control, pre-/post-program, stipulated/nonstipulated). As a supplement to time to disposition, this study also examines the disposition rate—the proportion of filed cases that reached disposition within a specified time from filing—to measure whether the pilot programs had an impact on the timing of settlement. The disposition rate was calculated by dividing the number of cases filed during the study period that reached disposition during a specified time period (x months from filing) by the total number of cases filed during the study period.
Litigant Satisfaction To measure whether the pilot programs had an impact on litigants’ satisfaction, this study examined party and attorney responses to questions about their satisfaction with various aspects of their mediation and litigation experiences. Attorneys in the available comparison groups (program/control, stipulated/nonstipulated) were asked the following questions:
How satisfied or dissatisfied are you with the following: a. outcome of this case b. services provided by the court for this case c. litigation process in this case from filing through case resolution
Overall program impact on litigant satisfaction was measured by comparing the average attorney satisfaction scores on these questions for cases in the comparison groups. In addition, both parties and attorneys in cases that participated in mediation in the pilot programs were asked to rate their satisfaction regarding the process of mediation and the performance of the mediator. They were also asked to indicate their level of agreement with statements about the fairness of the mediator, the mediation process, and the outcome of the mediation and their willingness to recommend or use mediation again. Responses to these questions provided additional descriptive information about litigants’ satisfaction with mediation.
Costs for Litigants and the Court Cost for litigants and the courts were measured in different ways and the findings concerning impacts in these areas are reported separately.
9
Litigant Costs To measure whether the pilot programs had an impact on litigant costs, this study examined attorneys’ estimates of their clients’ litigation costs and, as a second proxy measure of litigant costs, the attorneys’ estimates of the time they spent on the case. Attorneys in the available comparison groups (program/control, stipulated/nonstipulated) were asked the following question:
Please give us your best estimates of the amount of time you spent on the case and the costs to your clients. Total costs include attorney fees and other costs but not the cost of settlement paid.
Overall program impact on litigant costs was measured by comparing the average litigant costs and attorney time estimated by attorneys for cases in these comparison groups. Differences between the comparison groups served as an objective measure of program impact on litigant costs. In addition, attorneys in cases that resolved at mediation were asked to estimate what they believed the litigation cost and attorney hours would have been had they not used mediation to resolve the case. These attorneys were asked:
Considering the typical litigation process this case would have gone through without mediation, please give us your best estimates of how much time and cost would have been required if mediation had not been used.
The difference between the attorneys’ estimates of the actual costs and time expended in reaching resolution and their estimates of time and costs had they not used mediation served as a subjective measure of how settling at mediation affected litigant costs. Court Costs/Workload To measure whether the pilot programs had an impact on court costs, this study examined whether the workload of judges in the pilot court changed as a result of the pilot program and then estimated the potential monetary value of any change identified. Two measures of court workload were examined: (1) the trial rate and (2) the average number of pretrial hearings per case that were conducted by judges. As noted above, the trial rate was calculated by dividing the number of cases that went to trial by the total number of cases that reached disposition. Program impact on trial rate was measured by comparing the difference in trial rates between the available comparison groups (program/control, pre-/post-program, stipulated/nonstipulated). In calculating the average number of pretrial hearings conducted by judges, three different types of pretrial hearings were separately counted: (1) case management conferences, (2) motion hearings, and (3) all other pretrial hearings. Overall program impact on the average number of pretrial hearings was measured by comparing the

10
average number of each hearing held by judges in cases in the available comparison groups (program/control, pre-/post-program, stipulated/nonstipulated). When overall program impact on either the trial rate or the average number of pretrial hearings was found, the average number of days spent per trial and the average number of minutes spent per hearing were used to calculate the number of judge days saved (or added). The monetary value of judge-days saved (or added) was then estimated.
Comparison of Court-Ordered Mediation under Pilot Program and Voluntary Mediation in Los Angeles To compare court-ordered mediation under the pilot program with voluntary mediation in Los Angeles county, this report compares cases valued at over $50,000 referred to mediation in the Early Mediation Pilot Program and cases valued at over $50,000 referred to mediation in the Civil Action Mediation program established by Code of Civil Procedure sections 1775–1775.16 (1775 program). In the Early Meditation Pilot Program, judges could order cases of any value to mediation, so cases valued at over $50,000 were subject to court-ordered mediation in the pilot program. In contrast, in the 1775 program, judges were only authorized to order cases valued at $50,000 or less to mediation, but parties could stipulate to mediation in cases valued at over $50,000, so cases valued at over $50,000 had access to voluntary mediation in the 1775 program. Thus, comparing cases valued at over $50,000 referred to mediation in these two programs in Los Angeles is one way of comparing court-ordered mediation under the pilot program to voluntary mediation in Los Angeles County. Cases valued over $50,000 in the 1775 program were used as the measure of voluntary mediation in this study primarily because data on trial rates, disposition time, litigant satisfaction, litigant costs, and court workload was available on these cases.22 This permitted cases in the pilot program and the 1775 program to be compared on all of the same outcome measures used to compare program and non-program cases. However, these comparisons do not provide a clear answer to whether court-ordered and voluntary referrals to mediation result in different outcomes. The pilot program and 1775 program differed from each other not only in terms of the authority to order cases valued over $50,000 to mediation, but in other ways as well, including: • The early mediation status conferences in the pilot program were held approximately
one to two months earlier, on average, than the regular case management conferences in the 1775 program;
• Mediations in the pilot program were held approximately one to two months earlier,
on average, than mediations under the 1775 program; • Mediators on the court’s pilot program panel were required to meet higher
qualification standards than mediators on the court’s 1775 program panel, including 22 In theory, pilot program cases could, instead, have been compared to cases voluntarily mediated outside the court system or to cases in which the parties stipulated to use mediation within the court system. However, data on case outcomes in these other potential comparison groups was not available.
11
five more hours of mediation training and specific requirements for simulations/observations of mediations and completion of at least eight mediations within the past three years; and
• In the pilot program, mediators from the court’s panel were compensated by the court
for their first three hours of mediation services, whereas mediators in the 1775 program were not compensated for their first three hours of mediation services.
Comparisons between cases valued at over $50,000 in the pilot program and 1775 program thus do not isolate differences in outcomes based on whether the mediation referrals were court-ordered or voluntary, but show the differences in outcomes that result from all of the differences between the entire pilot program model and the entire 1775 program model.
What Data Was Used to Measure These Impacts This section describes the data that was used to measure each of the outcomes or impacts being studied. The data used to measure program impacts came mainly from two sources: • The courts’ computerized case management systems (CMSs); and • Surveys of the parties, attorneys, and judges.
Data on Trial Rate, Disposition Time, and Court Workload The primary source of data for assessing the pilot programs’ impact on trial rate, time to disposition, and court workload was the courts’ computerized case management systems (CMSs).23 These are essentially computerized court dockets that record the major court events in each case. California does not have a single, uniform CMS, and each of the pilot courts had different systems. Although the nature and form of the information recorded in each pilot court’s system varied significantly,24 all contained data on the date of filing, the court hearings that took place in the case,25 whether the case reached trial,
23 In addition to CMS data, some courts used a standalone database to capture additional information on the cases in the pilot program, for example, outcome of mediation. Data from both database systems were merged in this study. 24 Each court’s CMS had its own set of codes representing different court events. In addition each CMS had different codes to indicate whether a scheduled hearing had been set, held, continued, or dropped off the calendar. 25 Different methods were required to identify the different types of pretrial hearings held in each of the pilot courts. Some courts provided a list of event codes that clearly identified each hearing type. Where hearing types were not clearly separated into different categories, the researchers reviewed the descriptions provided for each event code and categorized the events based on best judgment. The docket code information from Sonoma’s case management data could not be used to identify the hearings; instead, the study relied on minute orders recorded in the case management system. The study counted as a hearing each minute order issued and recorded in the case management system and searched the minute order texts to identify motion hearings and other types of hearings.
12
and the date of final disposition. This information was used to calculate trial rates, time to disposition, and frequency of various pretrial hearings. The data used in these analyses were generally limited to cases in which the defendants responded to the complaint (the case became “at issue”); cases that proceeded by default were excluded from both the program and nonprogram comparison groups.26 Only at-issue cases were analyzed because only in these cases were there opposing parties who might participate in and be influenced by the elements of the pilot program, such as the case management conference and the mediation. The pilot courts provided CMS data for all cases filed since the pilot programs began, and relevant court events were tracked until June 2003.27 In most of the analyses in this report, however, only data concerning cases filed in 2000 and 2001 were used because there was insufficient follow-up time to track the final outcomes of cases filed more recently.28 Because the pilot program in Los Angeles was not authorized or implemented until approximately a year after the other pilot programs, only cases filed since April 2001 were eligible for that program. Analysis of program impact in Los Angeles was therefore limited to cases filed since April 2001. The pilot courts also provided CMS data for cases filed the year before the pilot program began (“pre-program cases”). These data were used to calculate trial rates, time to disposition, and frequency of various pretrial hearings for pre-program cases.
Data on Litigant Satisfaction and Costs The primary source of data for assessing the pilot programs’ impact on litigant satisfaction and litigant costs was two surveys conducted as part of this study: a postmediation survey and a postdisposition survey.29 Postmediation Survey The postmediation survey was distributed to persons who participated in mediation under the pilot programs between July 2001 and June 2002. The survey’s main purposes were to obtain information about participants’ experiences in the mediation process and their satisfaction with both their mediation and litigation experiences, and, if the case resolved at mediation, to obtain information about litigant costs. Two different questionnaires were used in this survey. Parties who were represented by attorneys were asked to fill out a two-page postmediation party survey form that requested information about the following: the respondents’ prior experience with litigation and their relationship with the other parties; their perception of the mediation process; their satisfaction with the mediation, the outcome of the case, the services 26 This restriction was not applied to unlimited cases in Los Angeles, however, because there was insufficient information to consistently identify at-issue cases. 27 Supplemental data was also obtained from the Superior Court of Fresno County in November 2003. 28 There are only about 180 days between December 2002, when the last 2002 case could have been filed, and June 2003, when data collection for this study ended. This is not sufficient time for most cases to reach final disposition. 29 See Appendix C for all survey instruments used in this study.
13
provided by the court, and the litigation process, and, if the case settled at mediation, how much money they spent on reaching resolution in the case. Attorneys, self-represented parties, and any insurance adjusters participating in the mediation were asked to fill out a similar postmediation attorney survey form that also asked for the following information: the respondent’s prior experience with mediation; the characteristics of the case (such as number of parties, complexity, hostility of the parties, amount of damages); how important various factors were to the case being mediated, and, if the case settled at mediation, the respondent’s estimate of how much time he or she actually spent on the case and the total actual litigation costs as well as an estimate of the time and costs had mediation not been used. Mediators were asked to have the participants complete the survey forms when the mediation was concluded. Participants were asked to either give the completed survey form to the mediator before leaving the last mediation session or mail the response to the “evaluation research project” staff at the court that were tracking survey responses.30 Postdisposition Survey The postdisposition survey was distributed to attorneys and parties whose cases reached disposition between July 2001 and June 2002. The main purposes of this survey were to collect information about litigants’ experiences in the litigation process, their satisfaction with these experiences, and their litigation costs. Postdisposition surveys were sent to all (or a random sample of all) eligible cases disposed of during this period, not just cases in the program group or cases that went to mediation. Cases that resolved at mediation were not sent these surveys since they had already been asked to provide this type of information, including litigant cost information, in the postmediation survey. As with the postmediation surveys, two different questionnaires were used. Parties who were represented by attorneys were asked to fill out a two-page postdisposition party survey form that asked for information about the following: the respondents’ litigation experience; their satisfaction with the outcome of the case, the services provided by the court, and the litigation process; and how much money the party spent on reaching resolution in the case. Attorneys and self-represented parties were asked to fill out a similar postmediation attorney survey form that also asked for the following information: the characteristics of the case (such as number of parties, case complexity, hostility of the parties, amount of damages); how important various factors were to the case being resolved; how much discovery was competed in the case; the settlement outcome; and the respondent’s estimate of how much time he or she actually spent on the case and the total actual litigation costs. The courts mailed the postdisposition attorney surveys to the attorneys shortly after cases reached disposition. Because the courts did not have contact information for parties, they could not mail the party survey forms immediately. Instead, attorneys were asked to provide their clients’ contact information so the courts could distribute the party survey-forms. Most attorneys, however, did not provide this information. As a result, only a small number of responses to the postdisposition survey were received from parties and 30 Please see Appendix D for survey distribution and response rate information.
14
comparisons of party satisfaction or party estimates of their costs using post-disposition survey information could not be made. Therefore, all comparisons regarding litigant satisfaction and litigant costs were based only on attorney responses to the postdisposition attorney survey. It should also be noted that the postdisposition survey data on litigant costs and attorney hours were affected by the existence of “outlier” cases—cases reporting extremely large values. Outlier cases tend to skew averages and can lead to distorted conclusions about the data. Two measures were taken to address this problem. First, 1 percent of the outlier cases located at both ends of the distribution (i.e., cases with extremely large and small values) was dropped from the final analysis sample. Second, in addition to averages, the values for costs and attorney hours were organized into percentiles—at the 25th percentile (25 percent of the cases had lower values), at the 50th percentile (half of the cases had lower values), and at the 75th percentile (75 percent of the cases had lower values). These percentile measures provided a more comprehensive view of the program’s impact on litigant costs. Despite these measures, the range of the data was so broad that in four of the five pilot courts, none of the differences found in overall comparisons between litigant costs or attorney hours in program cases and nonprogram cases were statistically significant—it was not possible to tell if the observed differences were real or simply due to chance.
Other Data In addition to these data, the study collected supplementary information from the CMSs, surveys, and other sources. Data on Case Characteristics As noted briefly above, both the postmediation and postdisposition attorney surveys included questions about the characteristics of the case. Attorneys were asked to specify:
• The number of parties in the case; • Whether an insurance carrier was involved in resolving the case; • The legal and factual complexity of the case; • The initial hostility between the parties; • The likelihood that the parties would have an ongoing relationship; and • The amount of damages sought in the case.
Each court’s CMS also provided information on case types—automobile personal injury (Auto PI), other personal injury (Non-Auto PI), contract, and other civil cases. As discussed below, this information on case characteristics was used in regression analyses to try to make comparisons between cases with similar characteristics. Data on Judicial Time Spent on Pretrial Hearings In order to translate information about the pilot programs’ impact on the number of pretrial hearings into information about the number of judicial days saved (or added), information was needed concerning the average amount of judge time spent on these pretrial hearings. Surveys distributed in May and October 2003 asked judges in the five
15
pilot courts to estimate the average amount of time they spent on the three types of pretrial hearings examined in this study: case management conferences, motion hearings, and other pretrial hearings. The surveys varied somewhat from court to court to reflect differences in the hearing information recorded in each court’s CMS. Data From Litigant Focus Groups and Interviews With Judges To get more in-depth, qualitative information about the pilot programs’ impacts, researchers conducted focus-group discussions with parties and attorneys and interviewed judges in the pilot courts from May to July 2002. Major topics discussed with the three groups differed slightly. In party focus groups, the discussions focused on the participants’ understanding of mediation’s benefits and their decision to use mediation; their perceptions about the fairness of the process and outcome of mediation; and the costs and time involved in using mediation to resolve their disputes. The attorney focus groups discussed the factors that made a case more amenable to mediation, how mediation affected the practice of discovery, and the overall impact of the pilot program. The interviews with judges also addressed cases’ amenability to mediation and how they decided whether to refer a case to mediation. Other topics included the programs’ impact on judges’ workload, its possible impact on the community’s legal culture, and suggestions for improvement. Data on Mediators’ Perceptions of Factors Affecting Resolution at Mediation Mediators from the panels in all five pilot program courts were also surveyed to attempt to identify factors affecting the probability of resolution at mediation. The September 2002 survey asked for the mediators’ views on whether factors, such as the subject matter of the case or the timing of the mediation referral, affected the likelihood that the parties would resolve their disputes in mediation. The survey also asked how the mediators usually conducted their mediation sessions and the extent to which the mediators believed that their methods influenced the outcome of the mediation. Lastly, the survey asked for mediators’ opinions about the pilot program’s long-term impacts. Data on the Long-Term Impacts of Mediation It has been suggested that mediation not only may have immediate benefits in terms of resolving cases, but also may have continuing benefits in terms of reducing future disputes and promoting a more cooperative dispute resolution culture. To try to assess these potential long-term impacts of mediation, attorneys in a random sample of cases that had been closed for more than six months were surveyed. Survey questions focused on whether the parties had complied with the terms of the decision or settlement in the case and whether the attorneys had modified their litigation practices based on their mediation experience. The surveys were distributed by mail in two cycles, the first in July 2002 and the second in April 2003. Attorneys in both mediated and nonmediated cases were surveyed.
What Methods Were Used to Examine the Data Two main methods were used in this study to examine the data and measure the impact of the pilot programs on the outcomes being studied:
16
• Direct comparisons of outcomes—trial rate, disposition time, number of pretrial hearings, litigant satisfaction, and litigant costs—between different groups of cases (e.g. cases that participated in the pilot program and cases that did not).
• Regression analysis comparing outcomes—trial rate, disposition time, number of
pretrial hearings, litigant satisfaction, and litigant costs—in cases with similar characteristics (“like” cases) within different groups of cases (e.g., cases that stipulated to mediation and cases that did not).
These two methods and how they were used to examine the data from different pilot programs are discussed in detail below.
Direct Comparisons of Outcomes As noted above, one of the main methods used to examine the data collected in this study was direct comparison of the outcomes in two (or more) groups of cases. Description of Method Cases for which outcome data were available were separated into groups based on an aspect of their pilot program experience or their characteristics that was the focus of examination in the study (such as whether or not the case participated in the program) and the outcomes in these groups were compared. This comparison provided information about how the particular program experience or case characteristic affected the outcome. To make these comparisons, data on the outcome in individual cases within each of the comparison groups was first converted to a measure representing the overall or typical outcome in that group of cases. Three different types of calculations were used to measure the overall outcome for a group of cases: • Average—Also called the “mean,” this is calculated by adding together all of the
scores of all of the cases or responses in a group and dividing that sum by the number of items in the group.
• Median—This is calculated by locating the value at the center (50th percentile) of a distribution so that half of the cases in a group have values below the median and half of the cases have values above the median. In certain types of data sets (such as data sets with a skewed distribution where there are a small number of cases with extremely large or small values (“outliers”)), median values are more representative of “typical” cases in a group than average values.
• Rate—This is calculated by counting the number of cases in a group that meet certain criteria and dividing that number by the total number of cases in the group. For example, to find the trial rate, cases that went to trial were counted and then divided the total by the total number of cases in the group. Rates are expressed as percentages or proportions. A method called “survival analysis” was used to calculate the cumulative disposition rate used in this study. This method has several
17
advantages, including that it can take into account varying follow-up time in different cases.31
The averages, medians, or rates in the different comparison groups were then compared to one another, and differences in outcomes in the comparison groups were calculated. For each comparison, a measure of the reliability of the results—called “statistical significance”—was also calculated.32 Statistical significance indicates the degree to which an observed difference between comparison groups reflects a true difference between the groups or could be simply due to chance (a “fluke”). The statistical significance is expressed in probability terms (p-value). For example, a probability value of .05 associated with a finding means there is only a 5 percent probability that the finding is due to pure chance. In this report, p-values are provided in all tables showing direct comparisons of outcomes. Statistical significance is also reported for comparisons of disposition rates over time, which is displayed as graphs. Adhering to conventions of statistical interpretation, results with a p-value of .05 or lower (i.e., a probability of 5 percent or less that results are due to pure chance) are considered very reliable, providing strong evidence of program impact. Results with p-values greater than .05 but smaller than .10 (i.e., 5 to 10 percent probability that the results are due to pure chance) are regarded as providing moderate evidence of program impact. Results with p-values between .10 and .20 (i.e., 10 to 20 percent probability that the results are due to pure chance) are generally regarded as weak evidence of the presence, or likely direction of, program impact. Any results showing a p-value greater than .20 are considered to indicate no program impact. How Direct Comparisons are Used in This Report Direct comparisons of outcomes are used in three main ways in this report: • To show the overall impact of the pilot program as a whole in a particular court:
direct comparisons of the outcomes in cases that participated in a pilot program (“program cases”) and cases that did not (“nonprogram cases”) were used to provide information about the overall impact of implementing that whole pilot program in that court.
• To examine whether pilot program impacts varied across case types: direct
comparisons of the outcomes in different types of cases were used to examine the patterns of overall program impact across case types. Based on information from the courts’ case management systems, cases were grouped into four case types: (1) Auto PI, (2) Non-Auto PI, (3) contract, and (4) all others. The average outcomes of
31 Survival analysis takes into account all eligible cases rather than only closed cases, so there is a larger number of cases available for comparisons, and the results are less susceptible to influences of yet unknown patterns of pending cases. 32 T-tests were used to examine the equality of average values between comparison groups; chi-squared tests were used to test the equality of median values and ratios (for trial rate) between comparison groups; and log-rank tests were used to examine the equality of disposition rates (survival functions) between comparison groups.
18
program and nonprogram cases within each case-type category were calculated and compared.
• To compare court-ordered mediation under the pilot program with voluntary
mediation in Los Angeles county: direct comparisons of the outcomes in cases valued over $50,000 referred to mediation in the pilot program (court-ordered referrals mediation) and in the 1775 program (voluntary referrals to meditation) were used to make this comparison.
While the case-type and special Los Angeles comparisons are fairly straightforward, the comparison used to show the overall impact of the pilot program requires some additional explanation. In all five courts, the Early Mediation Pilot Programs included not only the mediation process but also other program elements, such as distribution of educational materials about mediation and procedures for assessing/referring cases to mediation. Litigants and the courts are likely to have been affected by all of these program elements, not just by participation in the mediation process. To capture the combined effects of all program elements, the study attempts to compare outcomes in all cases that participated in any element of the pilot program to the outcomes in cases that did not participate in any of the pilot program elements. Such comparisons provide information about the impact of introducing an entire pilot program, with all of its program elements, into a particular court. Because of differences in program structures, different groups of cases were used to try to make this comparison in different pilot programs, and so the results of these comparisons therefore have somewhat different meanings. Mandatory Programs For purposes of this study, the Judicial Council required the pilot courts implementing a mandatory mediation program model to randomly assign portions of eligible cases to a “program group” and a “control group.” Program-group cases were exposed to one or more elements of the pilot program in that court; control-group cases were not exposed to any of these pilot program elements but were otherwise subject to the same court procedures as the cases in the program group. Thus, each of the mandatory pilot programs in San Diego, Los Angeles, and Fresno had a program group and a control group, and those groups were used in making the direct comparisons of overall pilot program impact. While these three mandatory programs used similar random assignment procedures to form their program and control groups, there were also important differences between cases in these groups in each pilot program: • San Diego—The program group consisted of all cases that were eligible to be
considered for possible referral to mediation under the pilot program. Control-group
19
cases were not eligible to be considered for referral to mediation under the pilot program or any other court program.
• Los Angeles—The program group consisted of all cases that were eligible to be
considered for possible referral to mediation under the pilot program. While cases in the control group were not eligible to be considered for mediation referrals under the pilot program, they were eligible to be considered for mediation referrals under a different court mediation program, the Civil Action Mediation Program authorized by Code of Civil Procedure sections 1775–1775.16 (“1775 program”). The 1775 program authorized mandatory referrals in cases valued under $50,000 and voluntary referrals in cases valued over $50,000. Cases in the program group were also eligible to be considered for referral to mediation in the 1775 program.
• Fresno—The program group consisted of all cases referred to mediation under the
pilot program; for the pilot program study period, cases were randomly selected for referral to mediation under the pilot program. The control group was cases not referred to mediation under the pilot program.
Because of the different composition of these groups in each of these pilot programs, the meaning of “program impact”—that is, the differences in outcomes between the program and control groups—was somewhat different in each program: • San Diego—Program impact means a difference in outcome attributable to cases
being eligible to be considered for possible referral to mediation under the pilot program, compared to not being eligible to be considered for such a referral. Some cases in the program group were referred to mediation and some were not.
• Los Angeles—Program impact means a difference in outcome attributable to cases
being eligible to be considered for possible referral to mediation under the pilot program, compared to being eligible to be considered for possible referral to mediation under the 1775 program. Under either program, some cases in the program group were referred to mediation and some were not.
• Fresno—Program impact means a difference in outcome attributable to cases being
referred to mediation under the pilot program compared to not being referred to mediation under the pilot program. All cases in the program group were referred to mediation; some were mediated and some were not.
Voluntary Programs Unlike the mandatory programs, the voluntary pilot programs in Contra Costa and Sonoma did not adopt a random assignment procedure to form a program and control groups. Different groups of cases therefore had to be used as the “program cases” and “nonprogram cases” in the comparisons made to identify overall program impact. For voluntary programs, comparisons were between:

20
• Cases filed before the pilot program began and cases filed after the pilot program began (“pre-program” and “post-program” case comparisons); and
• Cases in which the litigants stipulated to mediation under the pilot program and cases
in which the litigants did not stipulate to mediation (“stipulated” and “nonstipulated” case comparisons).
These comparisons are each described in more detail below.
Pre-/Post-program Comparisons As noted earlier, the primary source of data for assessing the pilot program’s impact on trial rate, disposition time, and court workload was the courts’ case management systems. These systems contained trial rate, disposition time, and workload information not only from during the pilot program period, but from before the program began. To assess the overall impact of the voluntary pilot programs on trial rates, disposition time, and workload, direct comparisons were made between these outcomes in cases filed in 1999, one year before the pilot programs started (“pre-program cases”), and cases filed in 2000, the first year after the pilot programs began operation (“post-program cases”). The validity of pre-/post-program comparisons relies on two conditions. First, cases filed during the pre-/post-program periods (1999 and 2000) must have similar characteristics. If case characteristics changed significantly during the period, it would be difficult to determine whether any observed differences in the outcome measured were due to the impact of the program or to differences in case characteristics. Second, there must be no significant changes in court procedures between the pre-/post-program periods except for the introduction of the pilot program in 2000. When both conditions are met (i.e., pre-/post-program cases have comparable characteristics and underwent similar procedures), any observed differences in outcomes can be reliably attributed to the changes introduced by the pilot program in the post-program period. However, the length of the potential follow-up time for cases filed in 1999 is longer than that for cases filed in 2000. There are about 1,610 days (53 months) between January 1999, when the first 1999 case was filed, and June 2003 when the data collection for this study was completed. There are only about 1,245 days (41 months) between January 2000, when the first 2000 case was filed, and June 2003. Thus, the data for all cases filed in 1999 includes information about cases that took over 1,245 days to reach disposition—cases that will have a long disposition time and are likely to have higher trial rates and numbers of court events—while the data for cases filed in 2000 does not include these cases. To ensure that similar groups of cases were being compared, in pre-/post-program comparisons of trial rates, disposition time, and court workload, cases with a minimum follow-up time of approximately 900 days and maximum of 1,200 follow-up time were used.33 33 Similarly, where information about cases filed in 2001 is included in pre-post comparisons, only cases that were closed within 540 days are compared, as this is the maximum follow-up time between cases filed in December 2001 and the end of the data collection in June 2003.
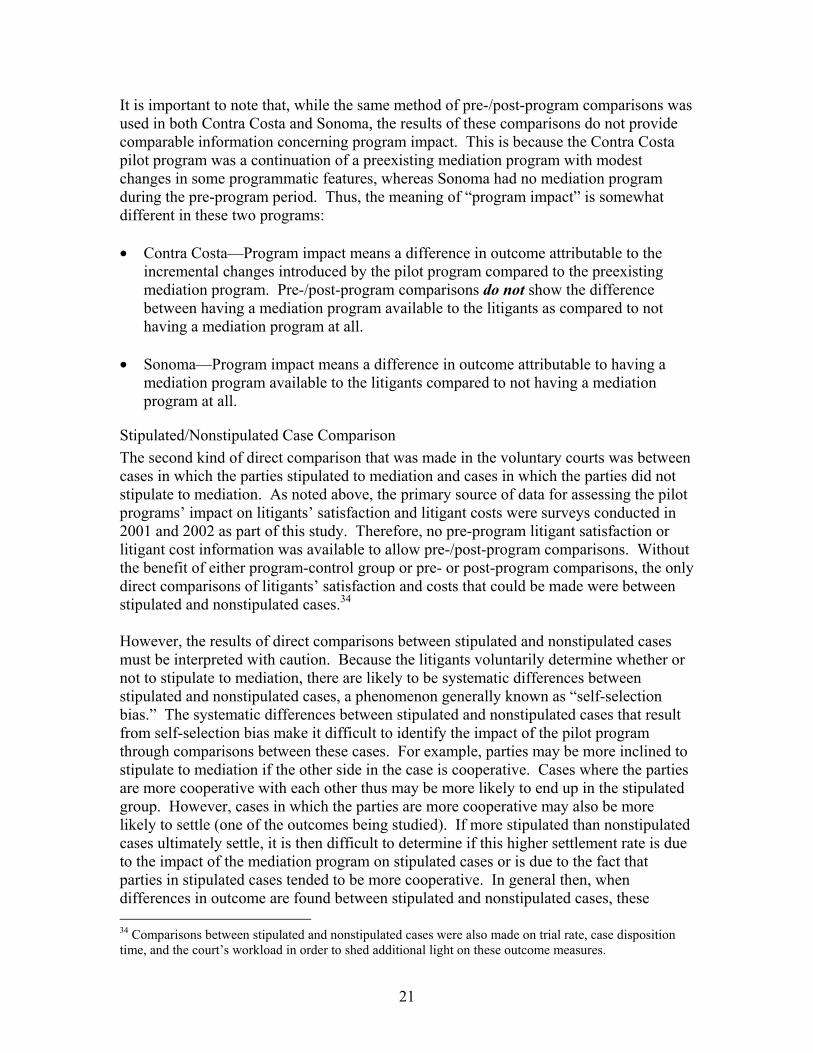
21
It is important to note that, while the same method of pre-/post-program comparisons was used in both Contra Costa and Sonoma, the results of these comparisons do not provide comparable information concerning program impact. This is because the Contra Costa pilot program was a continuation of a preexisting mediation program with modest changes in some programmatic features, whereas Sonoma had no mediation program during the pre-program period. Thus, the meaning of “program impact” is somewhat different in these two programs: • Contra Costa—Program impact means a difference in outcome attributable to the
incremental changes introduced by the pilot program compared to the preexisting mediation program. Pre-/post-program comparisons do not show the difference between having a mediation program available to the litigants as compared to not having a mediation program at all.
• Sonoma—Program impact means a difference in outcome attributable to having a
mediation program available to the litigants compared to not having a mediation program at all.
Stipulated/Nonstipulated Case Comparison The second kind of direct comparison that was made in the voluntary courts was between cases in which the parties stipulated to mediation and cases in which the parties did not stipulate to mediation. As noted above, the primary source of data for assessing the pilot programs’ impact on litigants’ satisfaction and litigant costs were surveys conducted in 2001 and 2002 as part of this study. Therefore, no pre-program litigant satisfaction or litigant cost information was available to allow pre-/post-program comparisons. Without the benefit of either program-control group or pre- or post-program comparisons, the only direct comparisons of litigants’ satisfaction and costs that could be made were between stipulated and nonstipulated cases.34 However, the results of direct comparisons between stipulated and nonstipulated cases must be interpreted with caution. Because the litigants voluntarily determine whether or not to stipulate to mediation, there are likely to be systematic differences between stipulated and nonstipulated cases, a phenomenon generally known as “self-selection bias.” The systematic differences between stipulated and nonstipulated cases that result from self-selection bias make it difficult to identify the impact of the pilot program through comparisons between these cases. For example, parties may be more inclined to stipulate to mediation if the other side in the case is cooperative. Cases where the parties are more cooperative with each other thus may be more likely to end up in the stipulated group. However, cases in which the parties are more cooperative may also be more likely to settle (one of the outcomes being studied). If more stipulated than nonstipulated cases ultimately settle, it is then difficult to determine if this higher settlement rate is due to the impact of the mediation program on stipulated cases or is due to the fact that parties in stipulated cases tended to be more cooperative. In general then, when differences in outcome are found between stipulated and nonstipulated cases, these 34 Comparisons between stipulated and nonstipulated cases were also made on trial rate, case disposition time, and the court’s workload in order to shed additional light on these outcome measures.
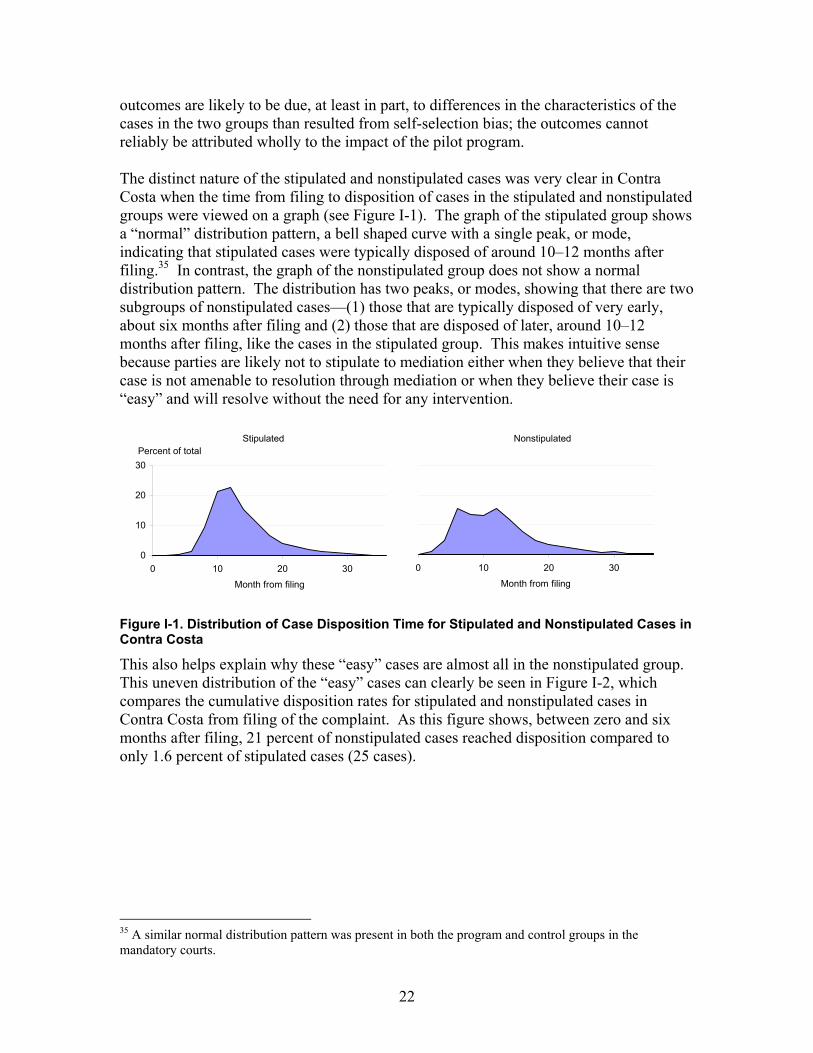
22
outcomes are likely to be due, at least in part, to differences in the characteristics of the cases in the two groups than resulted from self-selection bias; the outcomes cannot reliably be attributed wholly to the impact of the pilot program. The distinct nature of the stipulated and nonstipulated cases was very clear in Contra Costa when the time from filing to disposition of cases in the stipulated and nonstipulated groups were viewed on a graph (see Figure I-1). The graph of the stipulated group shows a “normal” distribution pattern, a bell shaped curve with a single peak, or mode, indicating that stipulated cases were typically disposed of around 10–12 months after filing.35 In contrast, the graph of the nonstipulated group does not show a normal distribution pattern. The distribution has two peaks, or modes, showing that there are two subgroups of nonstipulated cases—(1) those that are typically disposed of very early, about six months after filing and (2) those that are disposed of later, around 10–12 months after filing, like the cases in the stipulated group. This makes intuitive sense because parties are likely not to stipulate to mediation either when they believe that their case is not amenable to resolution through mediation or when they believe their case is “easy” and will resolve without the need for any intervention.
Figure I-1. Distribution of Case Disposition Time for Stipulated and Nonstipulated Cases in Contra Costa
This also helps explain why these “easy” cases are almost all in the nonstipulated group. This uneven distribution of the “easy” cases can clearly be seen in Figure I-2, which compares the cumulative disposition rates for stipulated and nonstipulated cases in Contra Costa from filing of the complaint. As this figure shows, between zero and six months after filing, 21 percent of nonstipulated cases reached disposition compared to only 1.6 percent of stipulated cases (25 cases).
35 A similar normal distribution pattern was present in both the program and control groups in the mandatory courts.
Stipulated
0
10
20
30
0 10 20 30
Month from filing
Percent of total Nonstipulated
0 10 20 30
Month from filing
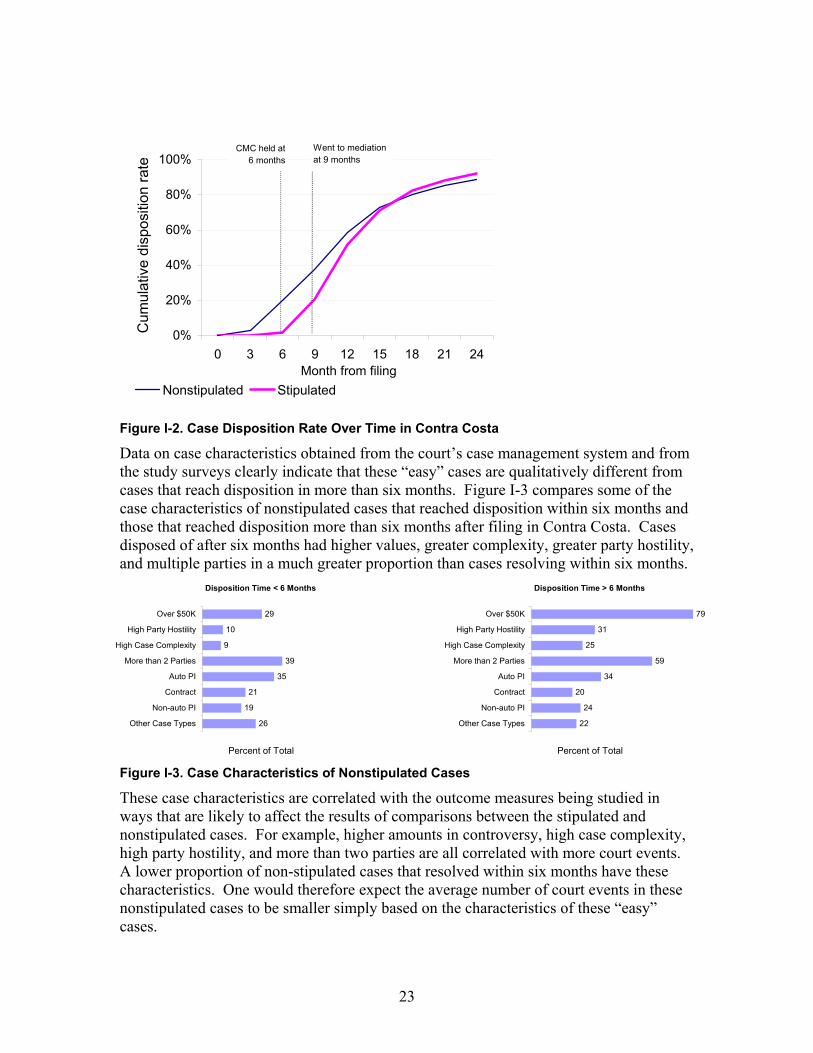
23
Figure I-2. Case Disposition Rate Over Time in Contra Costa
Data on case characteristics obtained from the court’s case management system and from the study surveys clearly indicate that these “easy” cases are qualitatively different from cases that reach disposition in more than six months. Figure I-3 compares some of the case characteristics of nonstipulated cases that reached disposition within six months and those that reached disposition more than six months after filing in Contra Costa. Cases disposed of after six months had higher values, greater complexity, greater party hostility, and multiple parties in a much greater proportion than cases resolving within six months.
Figure I-3. Case Characteristics of Nonstipulated Cases
These case characteristics are correlated with the outcome measures being studied in ways that are likely to affect the results of comparisons between the stipulated and nonstipulated cases. For example, higher amounts in controversy, high case complexity, high party hostility, and more than two parties are all correlated with more court events. A lower proportion of non-stipulated cases that resolved within six months have these characteristics. One would therefore expect the average number of court events in these nonstipulated cases to be smaller simply based on the characteristics of these “easy” cases.
Percent of Total Percent of Total
Disposition Time > 6 Months
22
24
20
34
59
25
31
79
Other Case Types
Non-auto PI
Contract
Auto PI
More than 2 Parties
High Case Complexity
High Party Hostility
Over $50K
Disposition Time < 6 Months
26
19
21
35
39
9
10
29
Other Case Types
Non-auto PI
Contract
Auto PI
More than 2 Parties
High Case Complexity
High Party Hostility
Over $50K
0%
20%
40%
60%
80%
100%
0 3 6 9 12 15 18 21 24Month from filing
Cum
ulat
ive
disp
ositi
on ra
te
Nonstipulated Stipulated
CMC held at 6 months
Went to mediation at 9 months
24
The case characteristics and correlations discussed above are those about which data is available in this study. It is almost certain that, in addition to the characteristics shown in Figure I-3, cases that reach disposition within six months of filing also differ from the remaining nonstipulated cases (and from the stipulated cases) in other ways. While it is almost certain that these “unknown” characteristics exist and that they impacted not just time to disposition, but also the other outcome measures being studied (court workload, litigant costs, and litigant satisfaction), there is no data on these characteristics that can be used to directly measure or control for the nature and extent of their impact. Overall, the distinct characteristics (known and unknown) of these “easy” cases and their uneven distribution create concerns about comparability between the stipulated and nonstipulated groups. The fact that a large percentage of the nonstipulated group is composed of cases that are unlike the cases in the stipulated group raises a concern that differences between outcomes in the stipulated and nonstipulated groups reflect these differences in case characteristics, not the impact of the pilot program. Two methods were used to try to account for these comparability problems. First, the average scores on various outcome measures for nonstipulated cases that reached disposition within six months and for those that reached disposition in more than six months were calculated separately. Comparisons were then made between only those stipulated cases and nonstipulated cases that reached disposition in more than six months. Matching cases based on disposition time is a crude way of trying to enhance the comparability between stipulated and nonstipulated cases. The second method that was used to address the comparability problems between stipulated cases and nonstipulated cases was regression analysis, which is described below.
Regression Analysis As indicated above, the second main method used to examine the data collected in this study was regression analysis. Description of Method In regression analysis, a statistical model is constructed to predict or explain changes in an outcome of interest (such as litigant satisfaction or costs) based on information concerning all relevant variables (in this study, these variables are case characteristics). The analysis produces a figure that indicates the independent impact of each variable on the outcome when other variables are held constant. When the impacts of all known variables (case characteristics) are held constant, outcomes in the first group of cases can be compared to outcomes in “like” cases in the second group. These comparisons essentially identify any difference in the outcome being studied that is not attributable to the influence of the variables (case characteristics) included in the regression model. Because the influence of these other variables (case characteristics) has been taken into account, any remaining difference found can be more reliably attributed to the impact of the pilot program.
25
As with direct comparisons of outcomes, a measure of the reliability—the statistical significance—of any difference found through regression analysis is also calculated.36 As noted above, statistical significance indicates the degree to which an observed difference between comparison groups reflects a true difference between the groups or could be simply due to chance (a “fluke”). The statistical significance is expressed in probability terms (p-value). Adhering to conventions of statistical interpretation, regression results with a p-value of .05 or lower (i.e., a probability of 5 percent or lower that results are due to pure chance) are considered very reliable, and are reported in this study as providing strong evidence of program impact. Regression results with p-values greater than .05 but smaller than .10 (i.e., 5 to 10 percent probability that the results are due to pure chance) are considered reliable and are reported in this study as providing evidence of program impact. Results with p-values between .10 and .20 (i.e., 10 to 20 percent probability that the results are due to pure chance) are generally regarded as weak evidence of the presence, or likely direction of, program impact, and are reported in this study as suggesting program impact but with the size of that impact unknown. Any results showing a p-value greater than .20 are considered to indicate no program impact and are reported in this study as a finding of no statistically significant difference. In this study, the regression models used information on case characteristics that was derived from attorney surveys and the court’s case management system, including: • the case type (Auto PI, Non-Auto PI, contract, and others); • the number of parties involved in the case; • whether or not an insurance carrier was involved in resolution of the case; • the factual and legal complexity of the case; • the initial hostility between the parties; • the likelihood of an ongoing relationship between the parties; and • the damage amount originally demanded in the case. In addition, in comparisons between stipulated and nonstipulated cases, to try to account for those “unknown” characteristics of “easy” cases, the regression analyses regarding trial rates, litigant satisfaction, litigant costs and attorney time, and court workload also controlled for disposition of cases within six months of filing. To take account of the possible “unknown” characteristics of very “hard” cases on the other end of the disposition spectrum, these regression analyses also controlled for disposition after 18 months.37 A slightly different approach was taken in the analysis of time to disposition:38
36 Similar in principle to simple t-test procedures evaluating the equality of averages between two groups, the statistical significance of each variable in the regression model is evaluated against the "null hypothesis" that the effect size is equal to zero, i.e., assuming no impact from the variable on the specific outcome variable being studied. The statistics used to evaluate this null hypothesis are either t-statistic or z-statistic scores, depending on the specific regression models being used. 37 While cases that reached disposition after 18 months appeared to be fairly evenly distributed between the stipulated and nonstipulated groups, in Contra Costa there was a change in the rate of disposition in both the stipulated and nonstipulated groups at approximately 18 months after filing. This suggests that, like cases disposed of within six months, cases disposed of after 18 months may be qualitatively different from cases disposed of more quickly. 38 The regression analysis on time to disposition could not be done in the same way as for the other outcomes because time to disposition cannot be both a variable and the outcome in the same analysis.
26
two separate regression analyses were done, one with all nonstipulated cases included and one that excluded nonstipulated cases that reached disposition within six months from the analysis. It is important to note that the reliability of the regression models depends on including sufficient information on relevant variables to adequately explain or predict changes in the in the outcome being studied. If important variables are missing from the regression model, it will not be as reliable in isolating the differences in outcomes that are the result of the program. While the regression analyses in this study included all available information on case characteristics in an attempt to account for comparability problems between comparison groups, it is almost certain that there were some relevant case characteristics (known or unknown) for which information was not available in this study. These characteristics, or variables, that could not be included in the regression models could affect some of the outcome measures. Without this information included in the regression models, the program impact estimated through the regression method may still be “tainted” by differences in the characteristics of the cases in the comparison groups. This is particularly a concern for the regression analyses, described below, comparing stipulated and nonstipulated cases, as the predictive capability of the regression models was low.39 In addition, for the regression analyses involving the mandatory programs, direct comparisons between the program and control groups already provided reliable information concerning the overall program impact. With sufficient confidence in the overall program impact, regression analysis involving subgroups of program and control cases could be used to examine how these subgroups might have contributed to that overall impact. However, in the voluntary programs—at least with respect to litigant satisfaction—regression analysis is being used as the primary tool to assess the overall program impact. Without certainty concerning the overall program impact, interpretation of the regression results becomes more difficult. Given this limitation, the results from regression analysis in this study should be viewed with caution. How Regression Analysis Was Used in This Report Regression analysis was used in this report to make comparisons between groups of cases in which it was known that there were likely to be systematic differences in overall case characteristics. It had two main applications in this report. First, regression analysis was used to show overall pilot program impact on litigant satisfaction, as well as other outcome measures, in the voluntary pilot programs. As discussed above, comparison of stipulated and nonstipulated cases was the only method available to assess overall program impact on litigant satisfaction in the voluntary courts, and these two groups of cases had different characteristics. Regression analysis was therefore used to compare litigant satisfaction in stipulated cases to that in “like” nonstipulated cases. Regression analysis was also used in the comparisons of other
39 When all characteristics from the surveys and court’s case management system were used in a regression model to predict the parties’ decision to stipulate to mediation, the regression model had a low explanatory power, accounting for less than 7 percent of the variances in predicted outcomes. This suggests that the regression model did not appropriately account for important factors that influenced the parties’ decision.
27
outcomes between stipulated and nonstipulated cases included in this study. For the reasons outlined above, the results of these analyses should be viewed with caution. Second, regression analysis was used to examine whether pilot program impacts varied across subgroups of cases within the program group that experienced different pilot program elements. As discussed above, comparisons of program cases and nonprogram cases were used to examine the overall impact of the pilot program in each court. However, subgroups of program cases were exposed to different elements of the pilot programs and thus had very different dispute resolution experiences: some program cases participated in case management conferences but were not referred to mediation; some were referred to mediation but did not participate in mediation, either because they were settled before mediation or were removed from the mediation track; some were mediated but did not reach settlement at the mediation; and some were mediated and settled at mediation. To better understand how the program cases in these subgroups were affected by their exposure to different pilot program elements, comparisons were made between the cases in these subgroups and nonparticipating cases. As with stipulated and nonstipulated cases, however, because of self-selection bias, the cases in these subgroups had different characteristics. Regression analysis was therefore used to compare outcomes in program cases in each of these subgroups to the outcomes in “like” nonprogram cases.

28

29
II. Overview of Study Findings
A. Summary of Findings Based on the criteria established by the Early Mediation Pilot Programs legislation, all five of the Early Mediation Pilot Programs were successful, resulting in substantial benefits to both litigants and the courts. These benefits included reductions in trial rates, case disposition time, and the courts’ workload, increases in litigant satisfaction with the court’s services, and decreases in litigant costs in cases that resolved at mediation in some or all of the participating courts. • Mediation referrals and settlements—A very large number of parties and attorneys
were exposed to and educated about the mediation process through participation in the five Early Mediation Pilot Programs. More than 25,000 cases filed in 2000 and 2001 were eligible for possible referral to mediation in the five Early Mediation Pilot Programs. More than 6,300 unlimited civil cases and almost 1,600 limited cases participated in pilot program mediations. On average, 58 percent of the unlimited cases and 71 percent of the limited cases settled as a direct result of early mediation. The mandatory and voluntary pilot programs generally followed the expected pattern: a higher percentage of cases were referred to mediation in the mandatory programs than in the voluntary programs, but a lower percentage of cases reached settlement in the mandatory programs than in the voluntary programs. However, the referral, mediation, and settlement patterns in the San Diego (mandatory) and Contra Costa (voluntary) programs were similar to each other, suggesting that mandatory mediation programs may be able to achieve high resolution rates when courts consider party preferences in making referrals to mediation, as they did in the San Diego pilot program, and that voluntary mediation programs may be able to achieve high referral rates when courts urge parties to consider mediation and provide some financial incentive to use the court’s mediation program, as they did in the Contra Costa pilot program. The low percentage of limited cases that stipulated to mediation in Sonoma’s voluntary pilot program model, in which the parties paid for the mediation, suggests that incentives are needed to encourage litigants in smaller-value cases to participate in mediation.
• Trial rate—In San Diego and Los Angeles, where the courts had relatively short
times to disposition and there were good comparison groups, the study found that the pilot programs reduced the proportion of cases going to trial by a substantial 24 to 30 percent. By helping litigants in more cases reach resolution without going to trial, these pilot programs saved a substantial amount of court time. In San Diego, the total potential time saving from the pilot program was estimated to be 521 trial days per year (with an estimated monetary value of $1.6 million); in Los Angeles, the potential saving was estimated to be 670 trial days per year (with an estimated monetary value of approximately $2 million). These results suggest that early mediation programs can help courts save valuable judicial time that can be devoted to the other cases that need judges’ attention.
30
• Disposition time—All five pilot programs had some positive impact on reducing the time required for cases to reach disposition. The largest reductions in average disposition time occurred in those courts that had the longest overall disposition times before the pilot program began. In all the programs, there were indications that dispositions accelerated around the time that the mediation took place, which was largely attributable to cases settling earlier at mediation than similar cases that were not in the program. There were also indications that early case management conferences and early referrals to mediation played important roles in improving time to disposition. However, the study also found that not settling at mediation resulted in longer disposition times. Overall, these results suggest that careful assessment of cases for referral to mediation is important and that early case management conferences and early mediations are important elements to incorporate into the program to improve disposition time; however, courts that have relatively long disposition times are more likely to experience dramatic time reductions time as a result of implementing an early mediation program than courts with relatively short disposition times.
• Litigant satisfaction—All five pilot programs had positive effects on attorneys’
satisfaction with the services provided by the court, with the litigation process, or with both. Regarding the court’s services, satisfaction levels reported by attorneys who participated in the San Diego, Los Angeles, Fresno, and Contra Costa pilot programs were 10 to 15 percent higher than those reported by attorneys in nonprogram cases.40 Similarly, attorneys’ satisfaction with the litigation process was about 6 percent higher in program cases in the San Diego, Fresno, Contra Costa, and Sonoma pilot programs than in nonprogram cases. 41 Attorneys’ satisfaction with the outcome of their cases corresponded to whether those cases settled at mediation—attorneys were more satisfied with the outcome in cases that settled and less satisfied in cases that did not. Attorneys were also generally more satisfied with the litigation process when their cases settled at mediation. However, attorneys whose cases were mediated were more satisfied with the services provided by the court regardless of whether their cases settled at the mediation. These results indicate that the experience of participating in pilot program mediation increased attorneys’ satisfaction with the services provided by the court, even if the case did not resolve at mediation. In all five of the pilot programs, both parties and attorneys who participated in mediations expressed high satisfaction with their mediation experience; their highest levels of satisfaction were with the performance of the mediators and their lowest were with the outcome of the mediation process. They also strongly agreed that the mediator and the mediation process were fair and that they would recommend both to others.
• Litigant costs—In the Contra Costa pilot program, estimated actual litigant costs
were 60 percent lower and average attorney hours were 43 percent lower in program
40 In the San Diego pilot program, because of offsetting decreases in satisfaction among unlimited program-group cases that were not referred to mediation or that were removed from mediation, this impact was evident only for limited cases. 41 In the San Diego pilot program, because of offsetting decreases in satisfaction among unlimited program-group cases that were not referred to mediation, this impact was evident only for limited cases.
31
cases than in nonprogram cases. In the San Diego, Contra Costa, and Fresno pilot programs (where it was possible to break down program cases into subgroups based on their different experiences in the program) the study found that the estimated actual litigation costs incurred by parties, hours spent by the attorney in reaching resolution, or both were lower in program cases that settled at mediation than similar nonprogram cases. Litigant cost savings calculated through regression analysis were 50 percent in the Contra Costa pilot program; savings in attorney hours were 40 percent in the Contra Costa pilot program, 20 percent in the Fresno pilot program, and 16 percent in the San Diego pilot program. In all five programs, attorneys in program cases that settled at mediation estimated savings ranging from 61 to 68 percent in litigant costs and 57 to 62 percent in attorney hours from the use of mediation to reach settlement. Based on these attorney estimates, the total estimated savings in litigant costs in all of the 2000 and 2001 cases that settled at pilot program mediations ranged from $1,769,040 in the Los Angeles pilot program to $24,784,254 in the San Diego pilot program. The total estimated attorney hours saved ranged from 9,240 hours in the Los Angeles pilot program to 135,300 in the San Diego pilot program. The total estimated savings calculated based on these attorneys estimates in 2000 and 2001 cases that settled at mediation in all five programs was considerable: $49,409,385 in litigant costs and 250,229 attorney hours.
• Court workload—The pilot programs in San Diego, Los Angeles, Fresno, and
Sonoma reduced the number of motions, the number of other pretrial hearings, or both in program cases. The reductions were substantial, ranging from 18 to 48 percent for motions and from 11 to 32 percent for “other” pretrial hearings. Reductions in cases that settled at mediation were even larger, ranging from 30 to 65 percent, compared to similar nonprogram cases. In Fresno, because of special conferences required under its pilot program’s procedures, these decreases were offset by increases in the number of case management conferences in program cases.42 However, in the San Diego, Los Angeles, and Sonoma programs, these reductions resulted in overall savings in court time. The total potential time savings from reduced numbers of court events were estimated to be 479 judge days per year in San Diego (with an estimated monetary value of approximately $1.4 million), 132 days in Los Angeles (with an estimated monetary value of approximately $400,000), and 3 days in Sonoma (with an estimated monetary value of approximately $9,700). These estimates suggest that early mediation programs can help courts save valuable judicial time that can be devoted to other cases requiring judges’ attention. In addition, survey results indicate that there were fewer postdisposition compliance problems and fewer new proceedings initiated in program cases, suggesting that the pilot programs not only reduced court workload in the short term but also may have reduced the court’s future workload.
42 The Superior Court of Fresno County has since changed its case management procedures so that additional case management conferences are not required in program cases.

32
B. Introduction This section provides an overview of the study findings concerning all five Early Mediation Pilot Programs: the three mandatory programs operating in the Superior Courts of Fresno, Los Angeles, and San Diego Counties and the two voluntary programs operating in the Superior Courts of Contra Costa and Sonoma Counties. While the specific findings concerning the individual pilot programs varied, based on the criteria established by the Early Mediation Pilot Program legislation, all five Early Mediation Pilot Programs were successful, resulting in substantial benefits to both litigants and the courts. As noted above, the statutes establishing the Early Mediation Pilot Programs specified the areas that were required to be covered in this study. Based on this mandate, the findings reported below focus primarily on the pilot programs’ impact in five areas: 1. the trial rate; 2. the time to disposition; 3. the litigants’ satisfaction with the dispute resolution process; 4. the litigants’ costs; and 5. the courts’ workload. To provide context for the findings in these areas and an understanding of the pilot programs’ scope, this section begins with a discussion of the total number of cases participating in the pilot programs, referred to mediation, mediated, and settled as a result of mediation. The study findings concerning the five statutorily mandated topic areas are then discussed. Finally, as required by the pilot program statutes, a comparison of court-ordered mediation under the pilot program and voluntary mediation in Los Angeles County43 is discussed. It is important to be aware of several things when reviewing these findings. First, this study examines the impact of implementing a mediation program in a court, not just the impact of using mediation. In all five courts, the Early Mediation Pilot Programs included other program elements in addition to the mediation process, including distribution of educational materials about mediation and procedures for assessing and referring cases to mediation. Litigants and the courts are likely to have been affected by all these program elements, not just by participating in the mediation process. For example, simply being referred to mediation may have encouraged some litigants to settle before the mediation took place. To capture the combined effects of all the program elements, wherever possible, outcomes (trial rate, disposition time, etc.) for all cases that participated in any element of the pilot program were compared to outcomes for cases that did not participate in any of the pilot program elements. Thus, the overall comparisons discussed below generally provide information about the impact of introducing an entire pilot program, with all of its program elements, into a particular court, and not just the impact of mediation proceedings.
43 Code Civ. Proc., § 1742.

33
It is also important to understand, however, that different “program” cases were exposed to different elements of the pilot programs and thus had very different dispute resolution experiences. Some cases participated in case management conferences but were not referred to mediation; some were referred to mediation but did not participate in mediation, either because they were settled before mediation or were removed from the mediation track; some were mediated but did not reach settlement at the mediation; and some were mediated and settled at mediation. The average outcomes—disposition time, litigant satisfaction, and so forth—were different in each of these subgroups of program cases. For example, the disposition time in program cases that settled at mediation was shorter than in program cases that went to mediation but did not settle. In overall comparisons, the outcomes in all these subgroups were added together to calculate an overall measure (average, median, or rate) for the outcome in program cases as a whole. As a result, within these overall outcome measures, positive outcomes in some subgroups of cases—such as shorter disposition time in cases that settled at mediation—were often offset by less positive outcomes in other subgroups. To better understand how program cases in these subgroups were affected by their exposure to different pilot program elements, comparisons were made between cases in these subgroups and non-participating cases with similar case characteristics.44 Readers who are interested in the impact of specific pilot program elements, such as the mediation process, should pay particular attention to these subgroup analyses. It is also important to keep in mind that the Early Mediation Pilot Program statutes emphasized early assessment and potential referral to mediation and early participation in mediation. These statutes authorized the pilot courts to hold initial case management conferences as early as 90 days after filing when other courts were prohibited from holding conferences before 120 to 150 days after filing. The statutes also provided that the mediation was generally to occur within 60 days of the conference, potentially as early as 150 days after filing. Thus, this study addresses only the impact of programs that include such early referrals and early mediation; it does not address how cases might have responded to a program with later referrals or later mediation. Finally, while findings on the same outcome measures (trial rate, time to disposition, etc.) are reported below for all the pilot programs, it is important to remember that the results concerning each pilot program are likely to reflect the unique nature of the particular program and the particular court environment. Cross-program comparisons of particular outcomes must, therefore, be done with caution. In the discussion below, we have tried to identify how programmatic and environmental differences may help explain some of the differences in findings across the five pilot programs.
44 The regression analysis method described in Section I.B. was used to make these subgroup comparisons.
34
C. Program Cases—Mediation Referrals, Mediations, and Settlements
To provide context for the findings in this study and an understanding of the pilot programs’ scope, this section discusses the total number of cases participating in the pilot programs, referred to mediation, mediated, and settled as a result of participating in mediation in the five Early Mediation Pilot Programs.
Summary More than 25,000 cases filed in 2000 and 2001 were eligible for possible referral to mediation in mediation pilot programs. The litigants in all these cases were exposed to and educated about the mediation process through participation in the pilot programs. More than 6,300 unlimited civil cases and almost 1,600 limited civil cases participated in pilot program mediations, and, on average, 58 percent of the unlimited cases and 71 percent of the limited cases settled as a result of early mediation. The mandatory and voluntary pilot programs generally followed the expected pattern of mediation referrals and settlements: a higher proportion of cases was referred to mediation in the mandatory programs than in the voluntary programs, but a lower proportion reached settlement in the mandatory programs than in the voluntary programs. However, the referral, mediation, and settlement patterns in the San Diego (mandatory) and Contra Costa (voluntary) programs were similar to each other. These outcomes suggest that mandatory mediation programs can achieve high resolution rates when courts consider party preferences in making referrals to mediation, as they did in the San Diego pilot program, and that voluntary mediation programs can achieve high referral rates when courts urge parties to consider mediation and provide some financial incentive to use the court’s mediation program, as they did in the Contra Costa pilot program. The very low percentage of limited cases that stipulated to mediation in the Sonoma pilot program model, in which the parties paid for mediation, suggests that incentives may be needed to encourage litigants in smaller-value cases to participate in mediation.
Litigants in a Substantial Number of Cases Were Exposed to and Educated About Mediation, and Many Cases Were Resolved Under the Pilot Programs Simply in terms of the number of parties who participated in, were exposed to, and were educated about the mediation process, and the number of cases that were resolved as a result of mediation, these pilot programs had substantial impact on both litigants and the courts. Table II-1 shows the number of unlimited civil cases filed in 2000 and 200145 that were eligible for possible referral to mediation under each of the pilot programs and the number and percentage of these cases referred to mediation, mediated, and settled at or as
45 Because the Los Angeles pilot program was authorized and implemented about a year after the other pilot programs, the figures for Los Angeles reflect cases filed between April and December 2001 only.
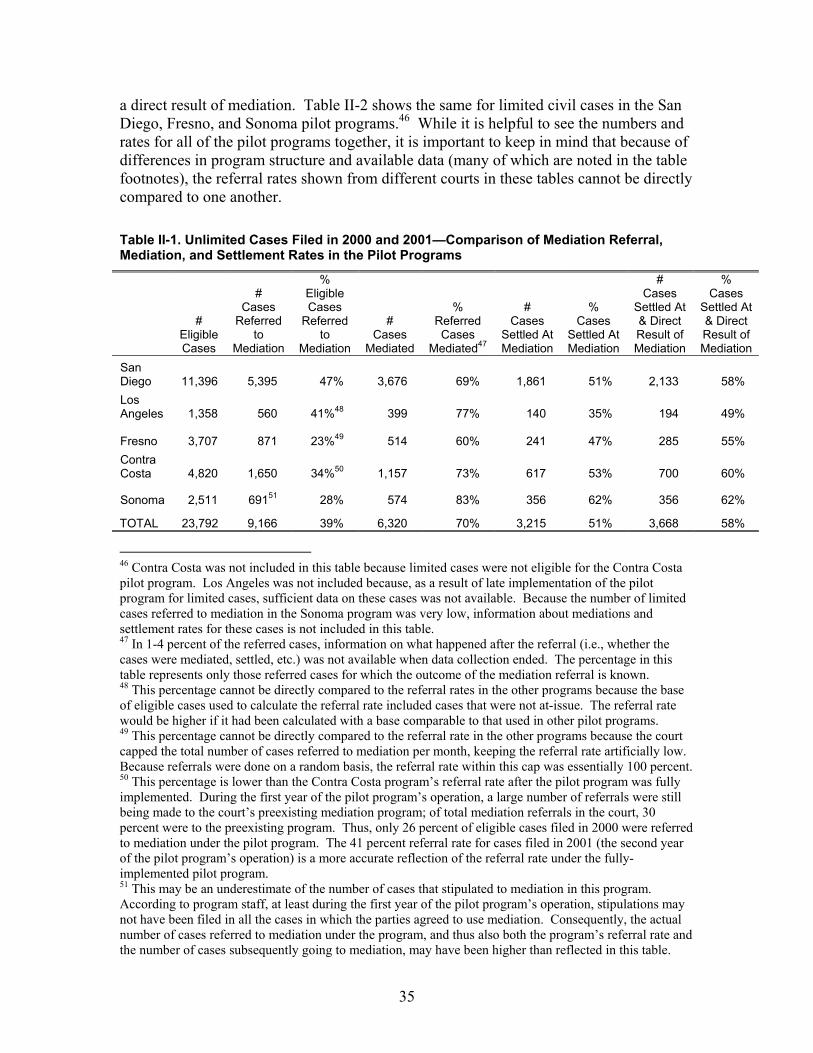
35
a direct result of mediation. Table II-2 shows the same for limited civil cases in the San Diego, Fresno, and Sonoma pilot programs.46 While it is helpful to see the numbers and rates for all of the pilot programs together, it is important to keep in mind that because of differences in program structure and available data (many of which are noted in the table footnotes), the referral rates shown from different courts in these tables cannot be directly compared to one another. Table II-1. Unlimited Cases Filed in 2000 and 2001—Comparison of Mediation Referral, Mediation, and Settlement Rates in the Pilot Programs
# Eligible Cases
# Cases
Referred to
Mediation
% Eligible Cases
Referred to
Mediation
# Cases
Mediated
% Referred Cases
Mediated47
# Cases
Settled At Mediation
% Cases
Settled At Mediation
# Cases
Settled At & Direct Result of Mediation
% Cases
Settled At & Direct Result of Mediation
San Diego 11,396 5,395 47% 3,676 69% 1,861 51% 2,133 58% Los Angeles 1,358 560 41%48 399 77% 140 35% 194 49%
Fresno 3,707 871 23%49 514 60% 241 47% 285 55% Contra Costa 4,820 1,650 34%50 1,157 73% 617 53% 700 60%
Sonoma 2,511 69151 28% 574 83% 356 62% 356 62%
TOTAL 23,792 9,166 39% 6,320 70% 3,215 51% 3,668 58%
46 Contra Costa was not included in this table because limited cases were not eligible for the Contra Costa pilot program. Los Angeles was not included because, as a result of late implementation of the pilot program for limited cases, sufficient data on these cases was not available. Because the number of limited cases referred to mediation in the Sonoma program was very low, information about mediations and settlement rates for these cases is not included in this table. 47 In 1-4 percent of the referred cases, information on what happened after the referral (i.e., whether the cases were mediated, settled, etc.) was not available when data collection ended. The percentage in this table represents only those referred cases for which the outcome of the mediation referral is known. 48 This percentage cannot be directly compared to the referral rates in the other programs because the base of eligible cases used to calculate the referral rate included cases that were not at-issue. The referral rate would be higher if it had been calculated with a base comparable to that used in other pilot programs. 49 This percentage cannot be directly compared to the referral rate in the other programs because the court capped the total number of cases referred to mediation per month, keeping the referral rate artificially low. Because referrals were done on a random basis, the referral rate within this cap was essentially 100 percent. 50 This percentage is lower than the Contra Costa program’s referral rate after the pilot program was fully implemented. During the first year of the pilot program’s operation, a large number of referrals were still being made to the court’s preexisting mediation program; of total mediation referrals in the court, 30 percent were to the preexisting program. Thus, only 26 percent of eligible cases filed in 2000 were referred to mediation under the pilot program. The 41 percent referral rate for cases filed in 2001 (the second year of the pilot program’s operation) is a more accurate reflection of the referral rate under the fully-implemented pilot program. 51 This may be an underestimate of the number of cases that stipulated to mediation in this program. According to program staff, at least during the first year of the pilot program’s operation, stipulations may not have been filed in all the cases in which the parties agreed to use mediation. Consequently, the actual number of cases referred to mediation under the program, and thus also both the program’s referral rate and the number of cases subsequently going to mediation, may have been higher than reflected in this table.
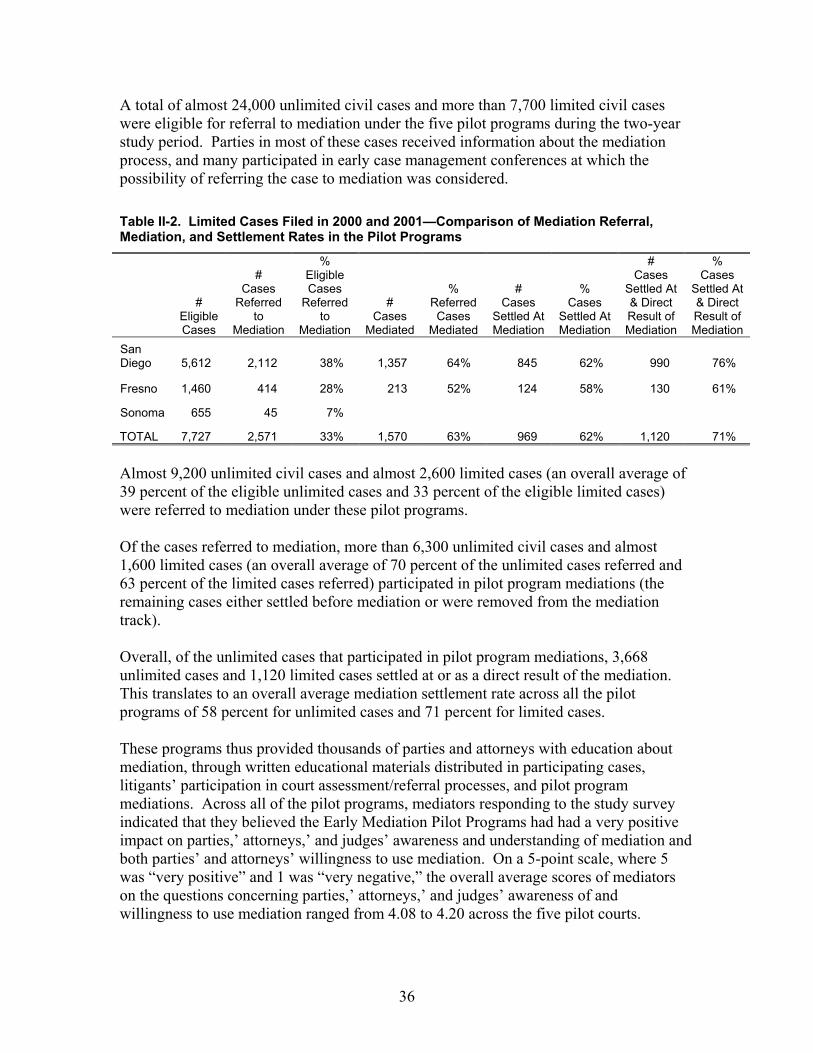
36
A total of almost 24,000 unlimited civil cases and more than 7,700 limited civil cases were eligible for referral to mediation under the five pilot programs during the two-year study period. Parties in most of these cases received information about the mediation process, and many participated in early case management conferences at which the possibility of referring the case to mediation was considered. Table II-2. Limited Cases Filed in 2000 and 2001—Comparison of Mediation Referral, Mediation, and Settlement Rates in the Pilot Programs
# Eligible Cases
# Cases
Referred to
Mediation
% Eligible Cases
Referred to
Mediation
# Cases
Mediated
% Referred Cases
Mediated
# Cases
Settled At Mediation
% Cases
Settled At Mediation
# Cases
Settled At & Direct Result of Mediation
% Cases
Settled At & Direct Result of Mediation
San Diego 5,612 2,112 38% 1,357 64% 845 62% 990 76%
Fresno 1,460 414 28% 213 52% 124 58% 130 61%
Sonoma 655 45 7%
TOTAL 7,727 2,571 33% 1,570 63% 969 62% 1,120 71% Almost 9,200 unlimited civil cases and almost 2,600 limited cases (an overall average of 39 percent of the eligible unlimited cases and 33 percent of the eligible limited cases) were referred to mediation under these pilot programs. Of the cases referred to mediation, more than 6,300 unlimited civil cases and almost 1,600 limited cases (an overall average of 70 percent of the unlimited cases referred and 63 percent of the limited cases referred) participated in pilot program mediations (the remaining cases either settled before mediation or were removed from the mediation track). Overall, of the unlimited cases that participated in pilot program mediations, 3,668 unlimited cases and 1,120 limited cases settled at or as a direct result of the mediation. This translates to an overall average mediation settlement rate across all the pilot programs of 58 percent for unlimited cases and 71 percent for limited cases. These programs thus provided thousands of parties and attorneys with education about mediation, through written educational materials distributed in participating cases, litigants’ participation in court assessment/referral processes, and pilot program mediations. Across all of the pilot programs, mediators responding to the study survey indicated that they believed the Early Mediation Pilot Programs had had a very positive impact on parties,’ attorneys,’ and judges’ awareness and understanding of mediation and both parties’ and attorneys’ willingness to use mediation. On a 5-point scale, where 5 was “very positive” and 1 was “very negative,” the overall average scores of mediators on the questions concerning parties,’ attorneys,’ and judges’ awareness of and willingness to use mediation ranged from 4.08 to 4.20 across the five pilot courts.
37
Differences in Referrals, Mediations, and Settlements Among Individual Pilot Programs Table II-1 shows that each of the pilot programs had somewhat different patterns in terms of mediation referrals, mediations, and settlements for unlimited civil cases. For example, at 60 percent, the Fresno pilot program had by far the lowest rate of mediations among those cases that were referred to mediation (10 percent lower than the 70 percent overall average), as well as the second lowest mediation resolution rate at 55 percent. Part of the reason for this pattern in Fresno may be, unlike in any of the other pilot programs, cases in Fresno were referred to mediation on a random basis; they were not assessed for amenability to mediation before being referred. As a result, some kinds of cases that were screened out before referral in the other pilot programs were probably referred to mediation in Fresno and either dropped out before the mediation took place or were mediated but did not resolve at the mediation. The settlement rates for unlimited cases in the Los Angeles pilot program also had a very different pattern than the settlement rates for unlimited cases in the other pilot programs. The rate of settlement at mediation52 was only 35 percent, 16 percent lower than the 51 percent overall average settlement rate at mediation in all of the programs, 12 percent lower than the program with the next lowest rate (Fresno). While Los Angeles’ overall settlement rate for cases that either resolved at mediation or were settled later as a direct result of the mediation increased substantially to 49 percent, this was still considerably lower than the overall average of 58 percent. Some information suggests that the lower settlement rate in Los Angeles may stem from differences in the culture and perceptions concerning the timing of mediation in Los Angeles. First, while pilot program mediations in Los Angeles took place at about the same time as pilot program mediations in San Diego (approximately eight months after filing), a much higher proportion of attorneys in Los Angeles than in San Diego indicated that they did not have sufficient time to prepare for mediation (12 percent in Los Angeles compared to only 3 percent in San Diego) or conduct sufficient discovery before the mediation (26 percent in Los Angeles compared to only 9 percent in San Diego). A higher percentage of mediators in Los Angeles also indicated that cases were referred to mediation early (64 percent in Los Angeles compared to only 48 percent in San Diego) and that these early referrals were very important in cases not resolving at the mediation (54 percent in Los Angeles compared to only 29 percent in San Diego). A higher percentage of mediators in Los Angeles also indicated that early deadlines for completion of mediation were set (56 percent in Los Angeles compared to only 38 percent in San Diego) and that these early deadlines for completion of mediation were very important in cases not resolving at mediation (41 percent in Los Angeles compared to only 17 percent in San Diego). This suggests that the local legal culture and perceptions about the timing of mediation can be important factors in determining whether cases reach settlement in an early mediation program.
52 These are cases that reached settlement at the mediation session; this does not include cases that reached settlement after the mediation ended but as a direct result of the mediation.
38
Differences Between Mandatory and Voluntary Programs The information in Table II-1 indicates that the proportion of cases referred to mediation in two of the mandatory programs (San Diego and Los Angeles)53 was higher than the proportion of cases that stipulated to mediation in the two voluntary programs (Contra Costa and Sonoma) while the mediation settlement rates in these two mandatory programs were lower than in the two voluntary programs. The San Diego program had the highest referral rate at 47 percent, while the Sonoma program had the lowest referral rate at 28 percent. In contrast, Sonoma had the highest mediation settlement rate at 62 percent, while the Los Angeles program had the lowest mediation settlement rate at 49 percent. This type of pattern for mandatory versus voluntary programs is generally expected—fewer litigants are likely to opt for voluntary mediation, but more are likely to settle their cases in the mediation process when they have agreed to participate in that process. While this general pattern appears to hold true across the pilot programs, particularly in the case of the Sonoma program, the mediation referral and settlement rates in most of the programs are actually quite similar to each other. The referral rate in Contra Costa’s voluntary program, which reached 41 percent for cases filed in 2001, was only 6 percent lower than the 47 percent referral rate in San Diego’s mandatory program. Similarly, the 58 percent mediation settlement rate in San Diego’s mandatory program was only 2 percent lower than the 60 percent settlement rate in Contra Costa’s voluntary program and only 4 percent lower than the 62 percent rate in Sonoma’s program. In fact, overall, the referral, mediation, and settlement patterns in San Diego are quite similar to those in Contra Costa. These similar patterns may reflect the fact that, in practice, referrals in both programs resulted from a similar combination of judicial pressure, party preferences, and financial incentives. In San Diego, the court had the authority to order cases to mediation but took party preferences into account in deciding whether to issue such orders. In Contra Costa, the parties chose whether to stipulate to mediation, but the court urged parties to use the mediation program. In both programs, the court subsidized the cost of mediation; in San Diego the court paid the mediators for the first four hours of service, and in Contra Costa the court required the mediators to provide two hours of mediation services at no cost. This suggests that referral, mediation, and settlement rates are less affected by whether a program is mandatory or voluntary than by its specific procedures. That is, mandatory mediation programs may be able to achieve high-resolution rates when courts consider party preferences in making referrals to mediation, and voluntary mediation programs may be able to achieve high referral rates when courts urge parties to consider mediation and provide some financial incentive to use the court’s mediation program.
53 For reasons outlined in the footnotes to Table II-1, the referral rate in Fresno cannot be compared to those rates in the other programs because referrals were capped at a set number per month.
39
Differences in Referrals, Mediations, and Settlement for Unlimited and Limited Cases Table II-1 and Table II-2 show apparent differences between unlimited and limited cases in the rates of mediation referrals, mediations, and settlements. For limited cases, both the percentages of eligible cases referred to mediation and the percentages of referred cases that were mediated are lower than for unlimited cases in the same pilot programs, while the percentages of mediated cases settled at or as a direct result of mediation were higher. This suggests that an early mediation program may have different influences on smaller-value cases than on larger-value cases. More smaller-value cases may be likely to settle on their own, without the need for much intervention, and litigants in more of these smaller-value cases may want to avoid the expenses associated with participating in mediation.54 These factors likely led judges in the San Diego program to refer fewer limited cases to mediation and litigants in Sonoma to stipulate to mediation in fewer limited cases. These factors also likely led more litigants in limited cases in San Diego and Fresno to settle before the mediation or to seek removal from the mediation track. With the cases that participate in mediation narrowed, it makes sense that the resolution rate was higher. The heightened desire to avoid additional costs in these smaller-value cases may also have encouraged additional settlements once litigants committed their time and money to participating in mediation. As shown in Table II-2, the percentage of limited cases that stipulated to mediation in Sonoma’s voluntary program was extremely low—only 7 percent. Judges of the Superior Court of Sonoma County indicated in focus-group discussions that the parties, particularly insurers, in these smaller-value cases were not willing to mediate. While the proportions of limited cases that participated in mediation under the San Diego and Fresno pilot programs were lower than the proportion of unlimited cases that participated in these programs, they were substantially higher than in Sonoma. In focus-group discussions, both judges and attorneys in San Diego said that the court’s subsidy of the first few hours of services was important in getting parties to participate in mediation; the attorneys specifically suggested that smaller-value cases would not go to mediation without this subsidy. Taken together, this information suggests that where a voluntary program does not provide a financial incentive to use mediation, as in Sonoma, the vast majority of litigants in smaller-value cases may not opt to use mediation. Clearly, however, including these cases in the San Diego and Fresno pilot program benefited both litigants and the courts. As discussed below, the study found that the San Diego pilot program reduced trial rates for limited cases, that limited cases participating in the San Diego and Fresno programs took less time to reach disposition and had fewer motion and other pretrial hearings, and that litigants in these cases were more satisfied with the services provided by the court. If these benefits are to be realized in limited cases, incentives encouraging litigants in limited cases to participate in early mediation programs may be needed.
54 Even where the cost of the mediators’ services are subsidized by the court, litigants are likely to have expenses such as attorneys fees or missed work, associated with participating in mediation.
40
Conclusion Litigants in more than 25,000 cases were exposed to and educated about the mediation process through participation in the five Early Mediation Pilot Programs. More than 6,300 unlimited civil cases and almost 1,600 limited cases participated in pilot program mediations. Of these mediated cases, an average of 58 percent of the unlimited cases and 71 percent of the limited cases settled as a result of mediation. The mandatory and voluntary pilot programs generally followed the expected pattern: a higher proportion of cases was referred to mediation in the mandatory programs than in the voluntary programs, but a lower proportion of cases reached settlement in the mandatory programs. However, the referral, mediation, and settlement patterns in the mandatory San Diego program were similar to those in the voluntary Contra Costa program. This suggests that mandatory mediation programs can achieve high resolution rates when courts consider party preferences in making referrals to mediation, as they did in the San Diego pilot program, and that voluntary mediation programs can achieve high referral rates when courts urge parties to consider mediation and provide some financial incentive to use the court’s mediation program, as they did in the Contra Costa pilot program. The very low percentage of limited cases that stipulated to mediation in the Sonoma pilot program suggests that incentives are needed to encourage litigants in smaller-value cases to participate in mediation.
41
D. Findings Concerning the Impact of Pilot Programs on Trial Rates
This section examines the impact of the pilot programs on the participating courts’ trial rates.
Summary In two of the participating courts, both of which had relatively short times to disposition and good comparison groups, the pilot programs substantially reduced the percentage of cases going to trial. The pilot programs in San Diego and Los Angeles reduced the trial rates in program cases by a substantial 24 to 30 percent. By helping litigants in more cases reach resolution without going to trial, these pilot programs saved a substantial amount of court time. In San Diego, the total potential time saving from the pilot program was estimated to be 521 trial days per year (with an estimated monetary value of approximately $1.6 million) and in Los Angeles, it was estimated to be 670 trial days per year (with an estimated monetary value of approximately $2 million). These estimates suggest that early mediation programs may be able to help courts free up valuable judicial time that can be devoted to other cases requiring judges’ time and attention.
The Pilot Programs in San Diego and Los Angeles Reduced Trial Rates In the Superior Court of San Diego County, the pilot program reduced the trial rate for unlimited civil cases in the program by 24 percent (the trial rate for the program group was 5.7 percent compared to 7.5 percent for the control group) and reduced the trial rate for limited civil cases in the program by 27 percent (the trial rate for the program group was 4.8 percent compared to 6.6 percent for the control group). In the Superior Court of Los Angeles County, the pilot program reduced the trial rate for unlimited cases in the program by 30 percent (the trial rate for the program group was 2.9 percent compared to approximately 4.1 percent in the control groups). By helping litigants in more cases reach resolution without going to trial, the pilot programs in San Diego and Los Angeles saved court time. In San Diego, at the lower trial rates, approximately 301 fewer 2000 and 2001 cases were tried (97 limited and 204 unlimited cases). This reduction in trials translates into a total potential time saving of 695 trial days during the study period. If the pilot program had also been available to cases in the control group, an estimated 221 fewer cases would have been tried per year, raising the total potential time savings to 521 trial days per year. Similarly, in Los Angeles, approximately 15 fewer cases filed between April and December 2001 were tried in the nine pilot program departments, which translates into a total potential time saving of 48 trial days during the study period. If the pilot program had also been available to control cases and cases that were in other civil departments in Los Angeles’ Central District, an estimated 227 fewer cases would have been tried per year, which translates into a total potential times saving of 670 trial days per year. Because many court costs, including judicial salaries, are fixed, this judicial time saving from the reduced trial rates does not translate into a fungible cost saving that can be

42
reallocated to cover other court expenses. Instead, the time saved allowed the judges in these courts to focus on other cases that needed judicial time and attention, which is likely to have improved court services in these other cases. To help understand the value of the potential time savings from trial rate reductions produced by these pilot programs; however, the estimated monetary value of this time was calculated. Based on an estimated cost of $2,990 per day for a judgeship,55 the monetary value of saving 521 trial days per year in San Diego is estimated to be approximately $1.6 million per year, and the monetary value of saving 670 trial days per year in Los Angeles is estimated to be approximately $2 million per year. Expressed in these monetary terms, the time saving realized by these pilot programs provided a valuable benefit.
Because of Limitations in the Data, It Was Not Possible to Definitively Identify Whether the Other Pilot Programs Affected Trial Rates This study found statistically significant reductions in trial rates only in the San Diego and Los Angeles pilot programs; it did not show reduced trial rates in Contra Costa, Fresno, or Sonoma. However, this does not necessarily mean that the pilot programs in these courts had no impact on trial rates; rather, it is most likely the result of limitations in the data available to analyze trial rates in these three courts. In both Fresno and Sonoma, the numbers of study cases that had reached trial by the end of the data collection period were too small to allow any valid conclusions about the programs’ impact on trial rates.56 The numbers of tried cases were small for a combination of reasons. First, the total civil caseloads in Fresno and Sonoma are relatively modest. Second, program cases represented only a fraction of the courts’ civil caseloads. Thirdly, the proportions of civil cases that go to trial, in these and all other California trial courts are generally very small, typically ranging from 3 to 10 percent. Applying a small trial rate to a small number of cases, the total number of cases that is ultimately likely to be tried is fairly small. Finally, and most importantly, a relatively large percentage of the study cases in Fresno and Sonoma had not reached disposition when data collection ended thus trial rate information was not available for these cases.57 55 This estimated cost includes salaries for a judge and associated support staff but not facilities or general overhead costs. In Fiscal Year 2001-2002 Budget Change Proposal for 30 new judgeships, the Finance Division of the Administrative Office of the Courts estimated that each new judgeship would have a total annual cost of $642,749. This figure includes the total cost of salaries, benefits, and operating expenses for each new judgeship and its complement of support staff: a bailiff, a court reporter, two courtroom clerks, a legal secretary, and a research attorney. (Judicial Council of Cal., Fiscal Year 2001-2002 Budget Change Proposal, No. TC18.) 56 In Fresno, by the end of the data collection period, only 11 unlimited and 1 limited program-group cases filed in 2000 and only 19 unlimited 2001 program-group cases had gone to trial. In Sonoma, only 16 unlimited and 9 limited pre-program cases had gone to trial within the 900-day follow-up period; only 11 unlimited cases that stipulated to mediation (and no limited cases) had gone to trial by the end of the data collection period. 57 Of the eligible cases filed in 2000 in Fresno, approximately 20 percent of unlimited cases and 10 percent of limited cases were shown as still pending in the court’s case management system at the end of November 2003. For unlimited cases filed in 2001, the proportion of still-pending cases was even higher–almost 15 percent in the program group and 25 percent in the control group were shown as still pending in
43
It is reasonable to expect that many of these pending cases will ultimately go to trial. Thus, with a longer follow-up period, a larger number of cases are likely to have been tried and the impact of the Fresno and Sonoma pilot programs on trial rates could probably be assessed. In Contra Costa, determining whether the pilot program affected trial rates was made difficult by the lack of a good comparison group—a group of cases having characteristics similar to cases in the program but without access to the program. As explained in Section I.B., a pre- and post program comparison was the main method used in this study to identify the voluntary pilot programs’ impact on trial rates. Because the pilot program in Contra Costa was primarily a continuation of an existing mediation program, with some changes in program design, pre-/post-program comparisons show only the added impact of the changes introduced by the pilot program. Given the incremental nature of these changes, no impact on trial rates were found in this pre-/post-program comparison.
Conclusion The pilot programs in San Diego and Los Angeles reduced the program cases going to trial by a substantial 24 to 30 percent. By helping litigants in more cases reach resolution without going to trial, these pilot programs saved a substantial amount of court time. In San Diego, the total potential time saving from the pilot program was estimated to be 521 trial days per year (with an estimated monetary value of $1.6 million), and in Los Angeles, the potential saving was estimated to be 670 trial days per year (with an estimated monetary value of approximately $2 million). These estimates suggest that early mediation programs can help courts free up valuable judicial time that can be devoted to other cases that need judges’ time and attention.
the court’s case management system. Similarly, in Sonoma, within the same 900-day follow-up period for both pre-/post-program cases, nearly 20 percent of the cases in both groups remained pending.
44
E. Findings Concerning the Impact of Pilot Programs on Disposition Time
This section examines the pilot programs’ impact on the time that cases took to reach disposition.
Summary All five pilot programs reduced disposition time. The largest reductions in disposition time came in those courts that had the longest overall disposition times before the pilot programs began. In all the pilot programs, the pace of disposition accelerated around the time that the program mediations took place. In the three courts for which sufficient data were available, comparisons of program cases that settled at mediation and similar nonprogram cases confirmed that settling at early mediation reduced disposition time. However, similar comparisons showed that not settling at mediation resulted in longer disposition times. Overall, these results suggest that it is important to carefully assess cases for referral to mediation and that courts that have relatively long disposition times are more likely to see disposition time reductions as a result of implementing an early mediation program than courts with relatively short disposition times. Early case management conferences and early referrals to mediation appear to have played an important role in improving time to disposition. The study found that, in pilot programs that used case management conferences to assess cases for referral to mediation, cases reached disposition at a faster pace around the time of those conferences. Even before the case management conferences, higher proportions of limited cases in the San Diego program and of unlimited cases in the Los Angeles program reached disposition compared to nonprogram cases. This supports the hypothesis that some cases may settle earlier simply because they are faced with the possibility of an early case management conference and referral to early mediation. Finally, examination of the relationship between disposition time and the timing of case management conferences, mediation referrals, and mediations suggests, as might have been expected, that earlier conferences, referrals, and mediations result in earlier dispositions. In all five pilot programs, the pace of disposition accelerated around the time that the mediation took place. Overall, these findings indicate that early case management conferences, early mediation referrals, and early mediations in appropriate cases are important elements to incorporate into a mediation program to achieve improved disposition time.
All Five Pilot Programs Had Some Positive Impact on Reducing the Overall Disposition Time for Cases in the Program The impact of the pilot programs on disposition time was measured in two ways: (1) by comparing average and median disposition times for program cases and nonprogram cases and (2) by comparing cumulative disposition rates—the proportion of all the filed cases that reached disposition within a specified time from filing—in these same groups of cases. The latter comparison provides a fuller picture of the differences between program and nonprogram cases because it shows disposition rates at different points in

45
time from filing, rather than summarizing disposition time in a single number. Table II-3 summarizes the results of these comparisons for unlimited cases in all five pilot programs. Table II-4 summarizes the same results for limited civil cases in the San Diego, Fresno, and Sonoma pilot programs.58 While it is helpful to see the results of these comparisons and examine the impacts for all of the pilot programs together, it is important to note that, because of differences in program structure and available data (many of which are noted in the table footnotes), the specific disposition times shown from different courts in these tables cannot be directly compared to each other. As these tables show, all the pilot programs had positive impacts on disposition time. With exception of the Sonoma program, all programs showed a statistically significant decrease in the average or median disposition time for unlimited civil cases (or both). The reductions ranged from 8 days in Contra Costa’s median disposition time to 50 days in Fresno’s median disposition time.59 In all programs, the cumulative disposition rate was also higher for program cases for most, if not all, of the study period. At the point when this difference was largest in each program, the disposition rates for program cases ranged from 3 percent higher than for nonprogram cases in Contra Costa to 17 percent higher in Fresno. Once it surpassed the rate for nonprogram cases, the cumulative disposition rate for program cases typically stayed higher for the entire follow-up period or until the rates in both groups of cases began to level off. Similarly, as indicated in Table II-4, all programs showed a statistically significant decrease in the average or median disposition time for limited civil cases (or both).60 The reductions in the average disposition time ranged from 10 days in San Diego to 37 days in Sonoma.61 The cumulative disposition rate was also higher for program cases in all pilot programs during some portion of the study period. The increases in the disposition rate were all about the same size, 9 to 12 percent at their largest in each program. In San Diego, the rate was significantly higher from the third month after filing until the disposition rates in both the program and control groups leveled off. In Fresno, the rate was higher from nine months after filing until the end of the follow-up period (24 months), and in Sonoma it was higher for the entire follow-up period (34 months).
58 As previously noted, data on limited cases in Contra Costa and Los Angeles are not reported because limited cases were not eligible for the Contra Costa pilot program and, because of late implementation of the pilot program in limited cases in Los Angeles, sufficient data concerning those cases during the study period are not available. 59 Regression analysis controlling for different proportions of case types in the program and control groups in Fresno indicates that the reduction in average disposition time was 40 days. 60 While the differences shown in the direct comparisons for Fresno were not statistically significant, the regression analysis did show a statistically significant difference. 61 See footnote 59.
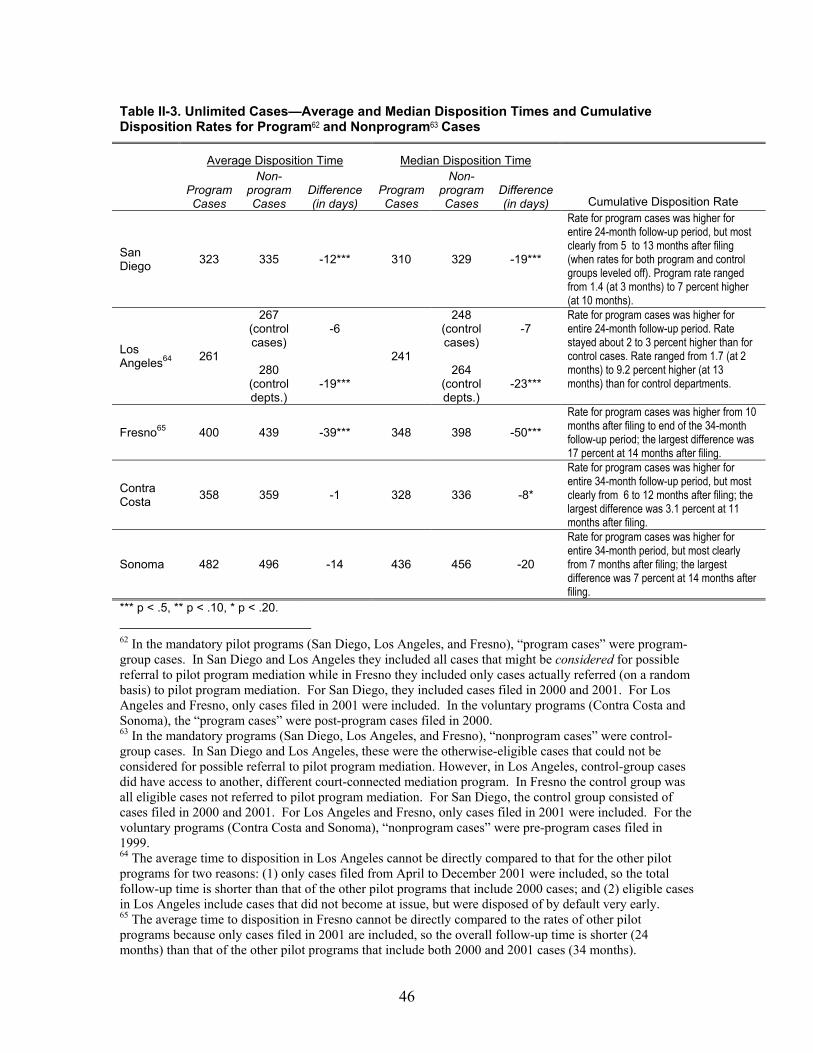
46
Table II-3. Unlimited Cases—Average and Median Disposition Times and Cumulative Disposition Rates for Program62 and Nonprogram63 Cases
Average Disposition Time Median Disposition Time
Program Cases
Non-program Cases
Difference (in days)
Program Cases
Non-program Cases
Difference (in days) Cumulative Disposition Rate
San Diego 323 335 -12*** 310 329 -19***
Rate for program cases was higher for entire 24-month follow-up period, but most clearly from 5 to 13 months after filing (when rates for both program and control groups leveled off). Program rate ranged from 1.4 (at 3 months) to 7 percent higher (at 10 months).
Los Angeles64 261
267 (control cases)
280
(control depts.)
-6
-19***
241
248 (control cases)
264
(control depts.)
-7
-23***
Rate for program cases was higher for entire 24-month follow-up period. Rate stayed about 2 to 3 percent higher than for control cases. Rate ranged from 1.7 (at 2 months) to 9.2 percent higher (at 13 months) than for control departments.
Fresno65 400 439 -39*** 348 398 -50***
Rate for program cases was higher from 10 months after filing to end of the 34-month follow-up period; the largest difference was 17 percent at 14 months after filing.
Contra Costa 358 359 -1 328 336 -8*
Rate for program cases was higher for entire 34-month follow-up period, but most clearly from 6 to 12 months after filing; the largest difference was 3.1 percent at 11 months after filing.
Sonoma 482 496 -14 436 456 -20
Rate for program cases was higher for entire 34-month period, but most clearly from 7 months after filing; the largest difference was 7 percent at 14 months after filing.
*** p < .5, ** p < .10, * p < .20.
62 In the mandatory pilot programs (San Diego, Los Angeles, and Fresno), “program cases” were program-group cases. In San Diego and Los Angeles they included all cases that might be considered for possible referral to pilot program mediation while in Fresno they included only cases actually referred (on a random basis) to pilot program mediation. For San Diego, they included cases filed in 2000 and 2001. For Los Angeles and Fresno, only cases filed in 2001 were included. In the voluntary programs (Contra Costa and Sonoma), the “program cases” were post-program cases filed in 2000. 63 In the mandatory programs (San Diego, Los Angeles, and Fresno), “nonprogram cases” were control-group cases. In San Diego and Los Angeles, these were the otherwise-eligible cases that could not be considered for possible referral to pilot program mediation. However, in Los Angeles, control-group cases did have access to another, different court-connected mediation program. In Fresno the control group was all eligible cases not referred to pilot program mediation. For San Diego, the control group consisted of cases filed in 2000 and 2001. For Los Angeles and Fresno, only cases filed in 2001 were included. For the voluntary programs (Contra Costa and Sonoma), “nonprogram cases” were pre-program cases filed in 1999. 64 The average time to disposition in Los Angeles cannot be directly compared to that for the other pilot programs for two reasons: (1) only cases filed from April to December 2001 were included, so the total follow-up time is shorter than that of the other pilot programs that include 2000 cases; and (2) eligible cases in Los Angeles include cases that did not become at issue, but were disposed of by default very early. 65 The average time to disposition in Fresno cannot be directly compared to the rates of other pilot programs because only cases filed in 2001 are included, so the overall follow-up time is shorter (24 months) than that of the other pilot programs that include both 2000 and 2001 cases (34 months).
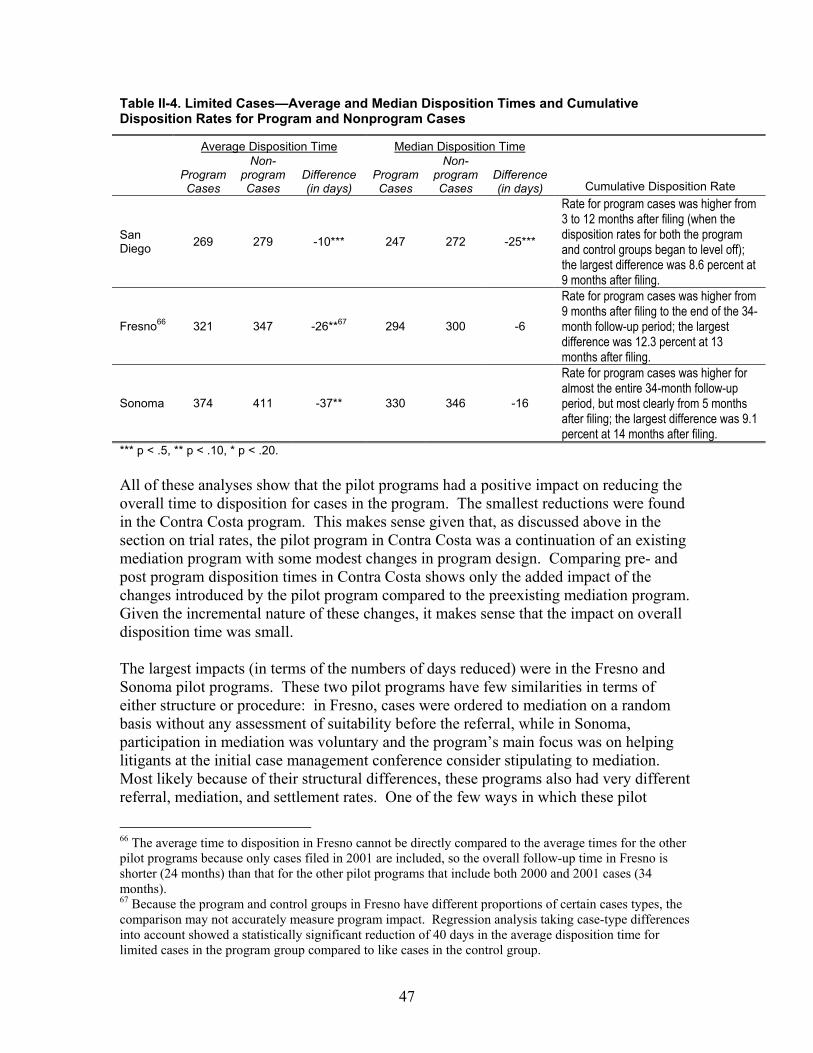
47
Table II-4. Limited Cases—Average and Median Disposition Times and Cumulative Disposition Rates for Program and Nonprogram Cases
Average Disposition Time Median Disposition Time
Program Cases
Non-program Cases
Difference (in days)
Program Cases
Non-program Cases
Difference (in days) Cumulative Disposition Rate
San Diego 269 279 -10*** 247 272 -25***
Rate for program cases was higher from 3 to 12 months after filing (when the disposition rates for both the program and control groups began to level off); the largest difference was 8.6 percent at 9 months after filing.
Fresno66 321 347 -26**67 294 300 -6
Rate for program cases was higher from 9 months after filing to the end of the 34-month follow-up period; the largest difference was 12.3 percent at 13 months after filing.
Sonoma 374 411 -37** 330 346 -16
Rate for program cases was higher for almost the entire 34-month follow-up period, but most clearly from 5 months after filing; the largest difference was 9.1 percent at 14 months after filing.
*** p < .5, ** p < .10, * p < .20. All of these analyses show that the pilot programs had a positive impact on reducing the overall time to disposition for cases in the program. The smallest reductions were found in the Contra Costa program. This makes sense given that, as discussed above in the section on trial rates, the pilot program in Contra Costa was a continuation of an existing mediation program with some modest changes in program design. Comparing pre- and post program disposition times in Contra Costa shows only the added impact of the changes introduced by the pilot program compared to the preexisting mediation program. Given the incremental nature of these changes, it makes sense that the impact on overall disposition time was small. The largest impacts (in terms of the numbers of days reduced) were in the Fresno and Sonoma pilot programs. These two pilot programs have few similarities in terms of either structure or procedure: in Fresno, cases were ordered to mediation on a random basis without any assessment of suitability before the referral, while in Sonoma, participation in mediation was voluntary and the program’s main focus was on helping litigants at the initial case management conference consider stipulating to mediation. Most likely because of their structural differences, these programs also had very different referral, mediation, and settlement rates. One of the few ways in which these pilot
66 The average time to disposition in Fresno cannot be directly compared to the average times for the other pilot programs because only cases filed in 2001 are included, so the overall follow-up time in Fresno is shorter (24 months) than that for the other pilot programs that include both 2000 and 2001 cases (34 months). 67 Because the program and control groups in Fresno have different proportions of certain cases types, the comparison may not accurately measure program impact. Regression analysis taking case-type differences into account showed a statistically significant reduction of 40 days in the average disposition time for limited cases in the program group compared to like cases in the control group.

48
programs were alike was their time to disposition before introduction of their pilot programs. As noted in the individual program descriptions in the chapters below, both the Fresno and Sonoma courts had historically taken a relatively long time to dispose of civil cases. These longer disposition timelines might have allowed more room for larger reductions in time to disposition as a result of the pilot programs. However, all impacts on disposition times in the pilot programs, including those in Fresno and Sonoma, were relatively modest, with reductions in average or median disposition time that ranged from 8 days to 50 out of total disposition times that ranged from 261 to 496 days. In considering this result, it is important to remember, as noted in the introduction, that the overall average disposition time for program cases examined in these analyses was calculated by adding together the different disposition times for cases in all of the program subgroups—cases that were not referred to mediation; cases referred to mediation but that did not participate in mediation, either because they were settled before mediation or were removed from the mediation track; cases that were mediated but did not reach settlement at the mediation; and cases that were mediated and settled at mediation. As discussed below, in some of the programs, larger reductions in disposition time in cases that were settled before and at mediation were offset to some degree by increases in disposition time in cases that did not settle at mediation.
Settling at Early Mediation Reduced Disposition Time, But Not Settling at Mediation Increased Disposition Time In all three of the pilot programs in which the program cases could be broken down into subgroups and compared with like cases in the nonprogram group,68 the study found evidence that settling at mediation reduced disposition time.69 The average disposition time for limited cases in the San Diego that settled at pilot program mediation was 30 days shorter than the average for similar cases in the control group. The average disposition time for limited cases that settled at mediations in the Fresno pilot program was 80 days shorter than for similar cases in the comparison group. Similarly, in the Fresno program, the average disposition time for unlimited program-group cases that settled at pilot program mediation was 90 days shorter than the average for similar cases in the control group. In San Diego and Contra Costa, regression analysis also provided evidence that disposition time was reduced for unlimited program cases that settled at mediation, but the size of the reduction was not clear. The study also found evidence that not settling at the pilot program mediation resulted in longer disposition times. In San Diego, the average disposition time for limited program-group cases that were mediated under the pilot program but did not settle at the mediation was 80 days longer than the average for similar cases in the control group, and the average for unlimited program-group cases that did not settle at mediation was 50 days longer. Similarly, in Fresno and Contra Costa, the average disposition times for
68 Subgroup information was not available for the Sonoma pilot program and comparisons in Los Angeles were to cases that participated in the court’s other mediation program. 69 The regression analysis method described in the methods Section I.B. was used to make these subgroup comparisons.
49
unlimited cases that did not settle at mediation were 57 days and 67 days longer, respectively, than the average for similar cases in the comparison group. These findings make intuitive sense. When mediations are conducted relatively early and cases are settled at those early mediations, one would expect that the average time to disposition for the settled cases would be reduced when compared to similar cases that were not mediated and settled under the pilot program. It also makes sense that reaching disposition in program cases that do not settle at mediation generally takes longer than it does in similar nonprogram cases. These program cases essentially detoured off the litigation path to participate in mediation and then came back to the litigation path when the cases did not settle at mediation; it is understandable that this detour required some additional time. This finding highlights the importance of the court’s careful selection of cases it refers to mediation. It is important to note, however, that the increases in average disposition time in cases that did not settle at mediation did not outweigh the positive impact that the pilot program had on other cases; as discussed above, all five pilot programs reduced the overall disposition time for program cases as a whole. The biggest reductions in disposition time for cases settled at mediation were in Fresno. Like the reductions in overall disposition time discussed above, these results may be tied to differences in how quickly Fresno cases were being disposed of before the pilot program’s introduction. The Superior Courts of San Diego and Contra Costa Counties were already disposing of their civil cases relatively quickly, so there was a smaller amount of time that could be saved through early mediation settlements. In contrast, in Fresno, as noted above, the court had historically taken a relatively long time to dispose of civil cases. With a relatively long average time to disposition, more time could potentially be saved from resolving at early mediation. This suggests that courts that have relatively long disposition times are more likely to experience dramatic drops in disposition time as a result of implementing an early mediation program than courts with relatively short disposition times.
Early Case Management Conferences, Mediation Referrals, and Mediations All Appear to Have Affected Disposition Time In each of the pilot programs, this study examined whether there were any changes in the cumulative disposition rate that occurred at the same times at which important pilot program elements took place. This comparison suggests that the disposition rates for program cases were improved by both early mediation and early case management conferences. In all five pilot programs, the time70 when the early mediations took place71 corresponded with a point at which the disposition rate for program cases accelerated, suggesting that the pace of dispositions increased as a result of mediation. In San Diego, Los Angeles, 70 Timing was measured in terms of elapsed time from filing. 71 In San Diego, Fresno, Los Angeles, and Contra Costa, the average actual elapsed time from filing to the pilot program mediation was used for this comparison. In Sonoma, data on the actual timing of the mediations were not available, so the timeframe for mediation that was required by the program rules was therefore used for this analysis.
50
and Contra Costa, as well as for unlimited cases in Fresno,72 the mediation timeframe corresponded with the point at which the pace of dispositions for program cases rose to its highest level—more program cases reached disposition during the month in which mediations typically took place than at any other point. In addition, for both unlimited and limited cases in Fresno, the disposition rate for program cases began to surpass that for nonprogram cases during the month in which the mediations took place. In Sonoma, there was also an increase in the pace of dispositions around the time when the mediations were to take place under the program rules, but the relationship is not as clear. This may be because data on the actual timing of mediations in Sonoma were not available. Similarly, in three of the four pilot programs in which case management conferences were used to assess cases for referrals to mediation, the time when the early case management conferences took place73 also corresponded with a point at which the pace of dispositions quickened. In San Diego, Los Angeles, and Contra Costa, the conference timeframe corresponded to a point at which the pace of dispositions for program cases increased and dispositions were occurring faster for program cases than for nonprogram cases. For unlimited cases in San Diego, the case management conference timeframe also corresponded with the point at which the cumulative disposition rate for program cases began to clearly surpass that for nonprogram cases (before the time of the conference, the rates were very close, with the rate for the program cases fractionally higher). These results suggest that early case management conferences helped improve the pace of dispositions in these courts. In Sonoma no clear relationship was found; however, this again may be because data on the actual timing of first case management conferences in Sonoma were not available. For limited cases in San Diego and for the pilot program in Los Angeles, the disposition rate for program cases actually significantly surpassed the rate for nonprogram cases even before the timeframe for the case management conferences, suggesting that some cases may resolve more quickly simply because they are faced with the possibility of an early case management conference and the possibility of being referred to early mediation. Clear differences in the disposition rates for program and nonprogram cases in these courts began to emerge between two and three months after filing, well before the case management conferences typically took place. Additional support for the conclusion that reductions in disposition time are attributable to early mediation referrals and early mediations comes from the Fresno pilot program. During the study period, the Fresno court changed both its overall civil case management procedures and its timeframe for referring cases to mediation. The court started setting earlier case management conferences in all cases and started making mediation referrals approximately 80 days earlier. These changes provided an opportunity to examine the
72 For Fresno, only cases filed in 2001 were considered. 73 In San Diego, Fresno, Los Angeles, and Contra Costa, the average actual elapsed timing from filing to the first case management conference was used for this comparison. In Sonoma, data on the actual timing of the mediations were not available, so the timeframe for mediation that was required by the program rules was therefore used for this analysis.
51
relationship between disposition time and the timing of case management conferences, mediation referrals, and mediations. This examination found that when case management conferences were held earlier (moving from approximately 500 to 150 days after filing), the proportion of unlimited cases that reached disposition within 12 months of filing became larger (increasing from approximately 25 to 45 percent), expediting disposition for all unlimited civil cases in Fresno. The examination also revealed that when mediation referrals and mediations took place earlier (moving from approximately 230 to 150 days after filing and from 370 to 295 days after filing, respectively), the proportion of pilot program cases that reached disposition within 12 months of filing became even larger (increasing from approximately 30 percent to 50 percent), resulting in earlier disposition for cases in the program group.74 Comparisons of disposition time for program and control cases filed in 2000, showed no program impact on the average disposition time. However, comparisons of disposition time for program and control cases filed in 2001, when referrals and mediations were taking place approximately two and a half months earlier, showed a 39-day reduction in average disposition time for unlimited program cases. This indicates that, above and beyond the overall gains attributable to the new early case management conference procedures, program cases experienced additional reductions in disposition time that are attributable to earlier mediation referrals and mediations. All of this suggests that early case management conferences, early mediation referrals, and early mediations are important elements to incorporate into a mediation program to achieve reduced case disposition time.
Conclusion The study found that all five pilot programs had a positive impact on disposition time. The largest reductions in disposition time came in those courts that had the longest overall disposition times before the pilot program began. In all five pilot programs, the disposition rate accelerated around the time when mediations took place. In the three courts for which sufficient data was available, comparisons of program cases that settled at mediation and like nonprogram cases confirmed that settling at early mediation reduced disposition time. However, similar comparisons also found that not settling at mediation resulted in longer disposition times. Overall, these results suggest that courts should carefully select cases for referral to mediation and that courts that have relatively long disposition times are more likely to see dramatic reductions in disposition time as a result of implementing an early mediation program than courts with relatively short disposition times. There were also indications that early case management conferences and early referrals to mediation played an important role in improving time to disposition. In those pilot programs that used case management conferences to assess cases for referral to
74 It is interesting to note that holding mediations approximately two and a half months earlier did not appreciably change the settlement rate in pilot program mediations. The settlement rate for limited cases dropped slightly, from 60 percent for cases filed in 2000 to 56 percent for cases filed in 2001, but the settlement rate for unlimited cases increased slightly, from 44 percent for cases filed in 2000 to 48 percent for cases filed in 2001.
52
mediation, program cases resolved at a faster pace around the time of these conferences than before the conferences. The study also found that limited cases in the San Diego program and unlimited cases in the Los Angeles program reached disposition more quickly than nonprogram cases even before the case management conference, supporting the hypothesis that some cases may settle earlier simply because they are faced with the possibility of attending an early case management conference and being referred to early mediation. Finally, examination of the relationship between disposition time and the timing of case management conferences, mediation referrals, and mediations suggests that earlier conferences, referrals, and mediations result in earlier dispositions. Overall, this suggests that a mediation program can foster reduced disposition time by incorporating early case management conferences, early mediation referrals, and early mediations.
53
F. Findings Concerning the Impact of Pilot Programs on Litigant Satisfaction
This section examines the pilot programs’ impact on litigants’ satisfaction with their dispute resolution experiences.
Summary In all five pilot programs, attorneys in program cases reported greater satisfaction than attorneys in nonprogram cases with the services provided by the court, with the litigation process, or with both. 75 In San Diego, Los Angeles, Fresno, and Contra Costa, attorneys in program cases expressed levels of satisfaction with court services that ranged from 10 to 15 percent higher than the satisfaction levels expressed by attorneys in nonprogram cases.76 Similarly, in San Diego, Fresno, Contra Costa, and Sonoma, attorneys’ satisfaction with the litigation process was about 6 percent higher in program cases than in nonprogram cases.77 As might have been expected, attorneys’ satisfaction with the outcome in program cases corresponded to whether those cases settled at mediation; settling at mediation increased their satisfaction with the outcome, but not settling at mediation decreased their satisfaction compared to that of attorneys in similar nonprogram cases. The study found that attorneys were generally more satisfied with both the courts’ services and with the litigation process when their cases settled at mediation; settling at mediation generally made attorneys happier with all aspects of their experience. However, the study also found that attorneys whose cases were mediated and did not settle at mediation were also generally more satisfied with the services provided by the court. This indicates that the experience of participating in pilot program mediation increased attorneys’ satisfaction with the services provided by the court, even if the case did not resolve at mediation. In all five pilot programs, both parties and attorneys who participated in mediation expressed high satisfaction with their mediation experience. They also strongly agreed that the mediator and the mediation process were fair and that they would recommend both to others. While parties and attorneys were both generally very pleased with their mediation experience, attorneys were more satisfied than parties. This may reflect attorneys’ greater understanding of what to expect from the mediation process and may suggest the need for additional educational efforts targeted at parties. It may also reflect the fact that parties’ satisfaction with the court and the mediation was more closely tied than attorneys’ to what happened during the mediation process—whether they felt heard, whether the mediation helped with their communication or relationship with the other party, and whether the cost of using mediation was affordable.
75Because of low response rates to surveys from parties in nonprogram cases, it was not possible to compare the satisfaction levels of parties in program and nonprogram cases. 76 For the San Diego pilot program, because of offsetting decreases in satisfaction in unlimited program-group cases that were not referred to mediation or that were removed from the mediation track, this impact was evident only for limited cases. 77 For the San Diego pilot program, because of offsetting decreases in satisfaction in unlimited program-group cases that were not referred to mediation, this impact was evident for only for limited cases.
54
All of the Pilot Programs Increased Attorneys’ Overall Satisfaction with the Courts’ Services, the Litigation Process, or Both To measure the pilot programs’ impact on attorneys’ satisfaction, attorneys who provided representation in both program and nonprogram cases78 were asked to rate their satisfaction with the outcome of their cases, the services provided by the court in their cases, and the litigation process from filing through disposition.79 Satisfaction was rated on a scale from 1 to 7 where 1 is “highly dissatisfied” and 7 are “highly satisfied.” The responses of attorneys in program and nonprogram cases were then compared. Table II-5 summarizes the results of this comparison for unlimited cases in each of the five pilot programs. Table II-6 summarizes the same results for limited civil cases in the San Diego and Fresno pilot programs. While it is helpful to see the results of these comparisons and examine them for all of the pilot programs together, because of differences in program structure and available data (many of which are noted in the table footnotes), the satisfaction scores reported in these tables are not directly comparable to one another. As these tables show, all five pilot programs increased attorneys’ overall satisfaction with the services provided by the court, the litigation process, or both. The San Diego, Los Angeles, Fresno, and Contra Costa pilot programs all showed statistically significant increases in attorneys’ overall average satisfaction with the courts’ services in pilot program cases compared to nonprogram cases (for the San Diego pilot program, this impact was evident for limited cases but not for unlimited cases). The increases ranged from .5 point on the satisfaction scale in Los Angeles to .7 point in Fresno and Contra Costa. Expressed as percentages, these increases ranged from almost 10 percent in Los Angeles to almost 15 percent in Contra Costa. The tables also indicate that the San Diego, Fresno, Contra Costa, and Sonoma pilot programs increased attorneys’ satisfaction with the litigation process (for the San Diego pilot program, this impact was evident for limited cases, but not for unlimited cases). The increases in attorney satisfaction with the litigation process were all approximately .3 point on the satisfaction scale. Expressed as percentages, these were approximately 6 percent increases.
78 See Appendix C for copies of the surveys used and Appendix D for survey distribution and response rate information. 79 Parties in both program and non-program cases were also asked similar questions. However, because of low response rates to surveys from parties in non-program cases, it was not possible to compare the satisfaction levels of parties in program and non-program cases.
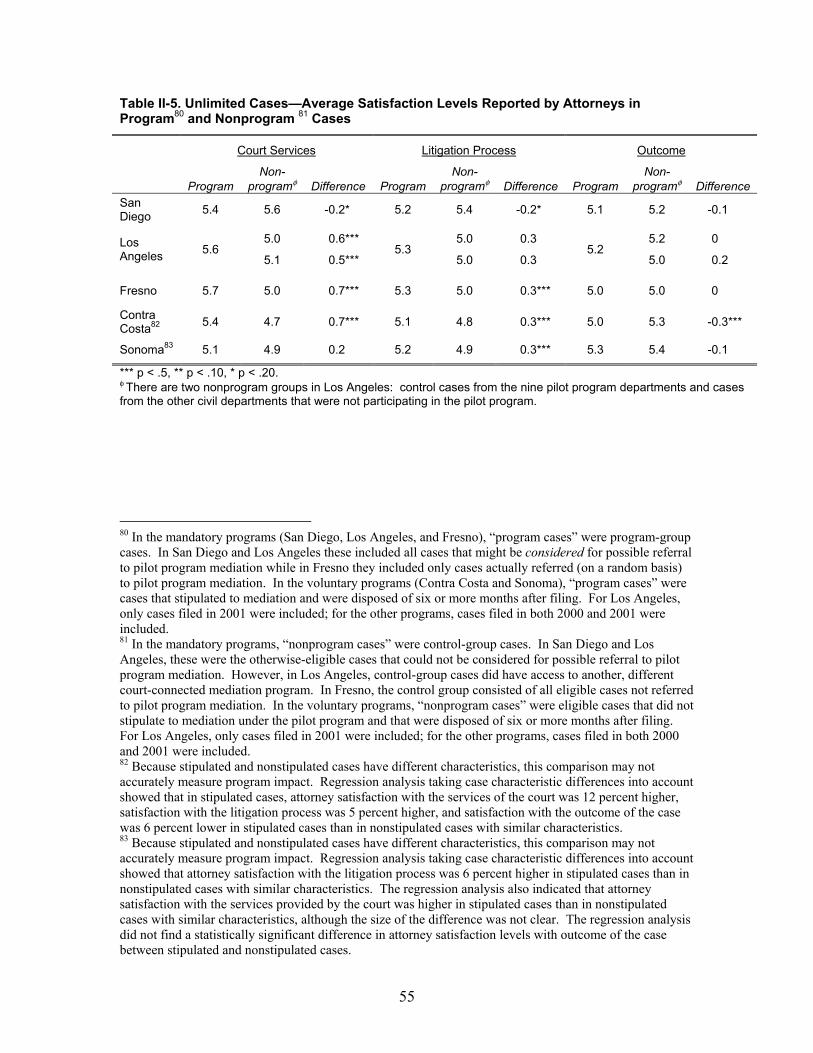
55
Table II-5. Unlimited Cases—Average Satisfaction Levels Reported by Attorneys in Program80 and Nonprogram 81 Cases
Court Services Litigation Process Outcome
Program Non-
programφ Difference Program Non-
programφ Difference Program Non-
programφ Difference San Diego 5.4 5.6 -0.2* 5.2 5.4 -0.2* 5.1 5.2 -0.1
Los Angeles 5.6
5.0
5.1
0.6***
0.5*** 5.3
5.0
5.0
0.3
0.3 5.2
5.2
5.0
0
0.2
Fresno 5.7 5.0 0.7*** 5.3 5.0 0.3*** 5.0 5.0 0
Contra Costa82 5.4 4.7 0.7*** 5.1 4.8 0.3*** 5.0 5.3 -0.3***
Sonoma83 5.1 4.9 0.2 5.2 4.9 0.3*** 5.3 5.4 -0.1
*** p < .5, ** p < .10, * p < .20. φ There are two nonprogram groups in Los Angeles: control cases from the nine pilot program departments and cases from the other civil departments that were not participating in the pilot program.
80 In the mandatory programs (San Diego, Los Angeles, and Fresno), “program cases” were program-group cases. In San Diego and Los Angeles these included all cases that might be considered for possible referral to pilot program mediation while in Fresno they included only cases actually referred (on a random basis) to pilot program mediation. In the voluntary programs (Contra Costa and Sonoma), “program cases” were cases that stipulated to mediation and were disposed of six or more months after filing. For Los Angeles, only cases filed in 2001 were included; for the other programs, cases filed in both 2000 and 2001 were included. 81 In the mandatory programs, “nonprogram cases” were control-group cases. In San Diego and Los Angeles, these were the otherwise-eligible cases that could not be considered for possible referral to pilot program mediation. However, in Los Angeles, control-group cases did have access to another, different court-connected mediation program. In Fresno, the control group consisted of all eligible cases not referred to pilot program mediation. In the voluntary programs, “nonprogram cases” were eligible cases that did not stipulate to mediation under the pilot program and that were disposed of six or more months after filing. For Los Angeles, only cases filed in 2001 were included; for the other programs, cases filed in both 2000 and 2001 were included. 82 Because stipulated and nonstipulated cases have different characteristics, this comparison may not accurately measure program impact. Regression analysis taking case characteristic differences into account showed that in stipulated cases, attorney satisfaction with the services of the court was 12 percent higher, satisfaction with the litigation process was 5 percent higher, and satisfaction with the outcome of the case was 6 percent lower in stipulated cases than in nonstipulated cases with similar characteristics. 83 Because stipulated and nonstipulated cases have different characteristics, this comparison may not accurately measure program impact. Regression analysis taking case characteristic differences into account showed that attorney satisfaction with the litigation process was 6 percent higher in stipulated cases than in nonstipulated cases with similar characteristics. The regression analysis also indicated that attorney satisfaction with the services provided by the court was higher in stipulated cases than in nonstipulated cases with similar characteristics, although the size of the difference was not clear. The regression analysis did not find a statistically significant difference in attorney satisfaction levels with outcome of the case between stipulated and nonstipulated cases.
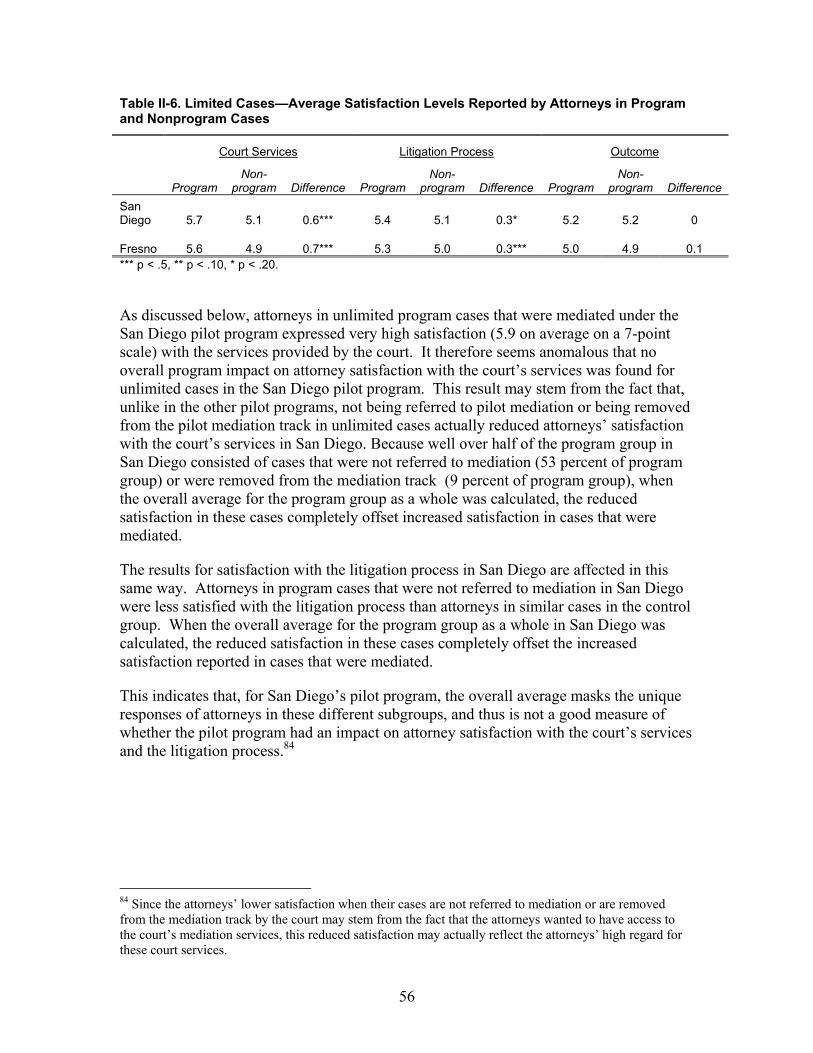
56
Table II-6. Limited Cases—Average Satisfaction Levels Reported by Attorneys in Program and Nonprogram Cases
Court Services Litigation Process Outcome
Program
Non-program Difference Program
Non-program Difference Program
Non-program Difference
San Diego 5.7 5.1 0.6*** 5.4 5.1 0.3* 5.2 5.2 0
Fresno 5.6 4.9 0.7*** 5.3 5.0 0.3*** 5.0 4.9 0.1 *** p < .5, ** p < .10, * p < .20.
As discussed below, attorneys in unlimited program cases that were mediated under the San Diego pilot program expressed very high satisfaction (5.9 on average on a 7-point scale) with the services provided by the court. It therefore seems anomalous that no overall program impact on attorney satisfaction with the court’s services was found for unlimited cases in the San Diego pilot program. This result may stem from the fact that, unlike in the other pilot programs, not being referred to pilot mediation or being removed from the pilot mediation track in unlimited cases actually reduced attorneys’ satisfaction with the court’s services in San Diego. Because well over half of the program group in San Diego consisted of cases that were not referred to mediation (53 percent of program group) or were removed from the mediation track (9 percent of program group), when the overall average for the program group as a whole was calculated, the reduced satisfaction in these cases completely offset increased satisfaction in cases that were mediated.
The results for satisfaction with the litigation process in San Diego are affected in this same way. Attorneys in program cases that were not referred to mediation in San Diego were less satisfied with the litigation process than attorneys in similar cases in the control group. When the overall average for the program group as a whole in San Diego was calculated, the reduced satisfaction in these cases completely offset the increased satisfaction reported in cases that were mediated.
This indicates that, for San Diego’s pilot program, the overall average masks the unique responses of attorneys in these different subgroups, and thus is not a good measure of whether the pilot program had an impact on attorney satisfaction with the court’s services and the litigation process.84
84 Since the attorneys’ lower satisfaction when their cases are not referred to mediation or are removed from the mediation track by the court may stem from the fact that the attorneys wanted to have access to the court’s mediation services, this reduced satisfaction may actually reflect the attorneys’ high regard for these court services.
57
Attorneys’ Satisfaction with Case Outcome Corresponded to Whether Their Cases Settled at Mediation, But Attorneys’ Satisfaction with the Courts’ Services Was Generally Higher in Cases that Were Mediated Regardless of Whether the Cases Settled at Mediation
In all three of the pilot programs in which the program cases could be broken down into subgroups,85 the study found that attorneys’ satisfaction with the outcome in program cases corresponded to whether or not their cases settled at mediation. As might have been expected, attorneys were more satisfied with the outcome when their cases settled and less satisfied when their cases did not settle.86 For program cases that settled at mediation, attorney satisfaction with the outcome ranged from 9 percent higher in unlimited cases in the San Diego pilot program to 20 percent higher for both limited and unlimited cases in the Fresno pilot program compared to similar nonprogram cases. However, for program cases that were mediated but did not settle at mediation, attorney satisfaction with outcomes was lower, ranging from 10 percent lower for both limited and unlimited cases in the Fresno program to 21 percent lower for limited cases in the San Diego program compared to similar nonprogram cases. In all of the programs except Fresno, the percentage decrease in satisfaction with the outcome from not settling at mediation was larger than the increase from settling at mediation. The offsetting results in cases that settled and did not settle at mediation helps explain why satisfaction with outcome in program cases as a whole was not appreciably different from that in nonprogram cases. Attorneys in cases that settled at mediation were more satisfied not only with the outcome, but also with the litigation process and the courts’ services as well. In the San Diego, Fresno, and Contra Costa pilot programs, attorneys’ satisfaction with the litigation process ranged from 5 percent higher in unlimited program cases that settled at mediation in the San Diego pilot program to 17 percent higher for unlimited program cases that settled at mediation in the Fresno pilot program compared to similar nonprogram cases.87 In the San Diego, Fresno, and Contra Costa pilot programs, attorneys’ satisfaction with the courts’ services ranged from 8 percent higher in unlimited cases that settled at mediation in the San Diego pilot program to 23 percent higher in limited cases that settled at mediation in the San Diego pilot program compared to similar nonprogram cases.88 Thus, settling at mediation appears to have generally made attorneys happier with all aspects of their dispute resolution experience. What is interesting and significant, however, is that satisfaction with the courts’ services did not go down when cases did not settle at mediation. In fact, in all the programs for
85 Subgroup information was not available for the Sonoma pilot program and comparisons in Los Angeles were to cases that participated in the court’s other mediation program. 86 The regression analysis method described in Section I.B. was used to make these subgroup comparisons. 87 As discussed above, in San Diego, this increase was offset by a 5 percent decrease in satisfaction with the litigation process in unlimited cases that were not referred to mediation. 88 As discussed above, in San Diego, the increase in satisfaction with the court services for unlimited cases was offset by an 8 percent decrease in satisfaction with the courts’ services in cases that were not referred to mediation and a 10 percent decrease for cases that were removed from mediation.
58
which these subgroup comparisons could be made, when cases participated in mediation but did not settle at mediation, there was a statistically significant increase in attorneys’ satisfaction with the courts’ services. Attorneys’ satisfaction with the courts’ services ranged from 9 percent higher in limited cases in the San Diego pilot program to 16 percent higher for limited cases in the Fresno pilot program that did not settle at mediation compared to similar non-program cases. Thus, it was the experience of participating in a pilot program mediation that was the key to increasing attorneys’ satisfaction with the services of the court—attorneys whose cases were mediated were more satisfied with the services provided by the court regardless of whether or not their cases settled at the mediation.
Both Parties and Attorneys in Cases That Used Pilot Program Mediation Expressed High Satisfaction with Their Mediation Experience Both parties and attorneys who participated in mediations in all five pilot programs expressed high satisfaction with their mediation experience. Litigants who participated in mediation were asked to rate their level of satisfaction with the mediator’s performance, the mediation process, the outcome of the mediation, the litigation process, and the services provided by the court on a scale from 1 to 7 where 1 is “highly dissatisfied” and 7 is “highly satisfied.” Table II-7 shows the average satisfaction scores given on each of these satisfaction questions by both parties and attorneys in unlimited cases in all five pilot programs. Table II-8 summarizes the same results for limited civil cases in the San Diego and Fresno programs.89 As these tables show, most of the scores were in the highly satisfied range (above 5.0) and all of the average satisfaction scores were above the middle of the satisfaction scale (4.0). The patterns of responses were virtually identical in all of the pilot programs and for both unlimited and limited cases. Both parties and attorneys were most satisfied with the performance of mediators (average score of 5.8 or above for parties and 6.0 or above for attorneys). They were also highly satisfied with both the mediation process (average score of 5.0 or above for parties and 5.7 or above for attorneys) and services provided by the court (average score of 5.2 or above for parties and 5.3 or above for attorneys). In general, both parties and attorneys were least satisfied with the outcome of the case (average score of 4.0 or above for parties and 4.9 or above for attorneys). The one exception was parties in Sonoma: they were least satisfied with court services. This anomaly may have resulted because the Sonoma pilot program was the only program in which the court did not provide any kind of financial subsidy for mediation services; parties in Sonoma had to pay the full cost of mediation themselves.
89 For the reasons outlined above in footnote 58, data on limited cases was not available from Contra Costa or Los Angeles. In addition, because of the small number of limited cases referred to mediation in Sonoma, the number of postmediation survey responses was not sufficient to provide data here.
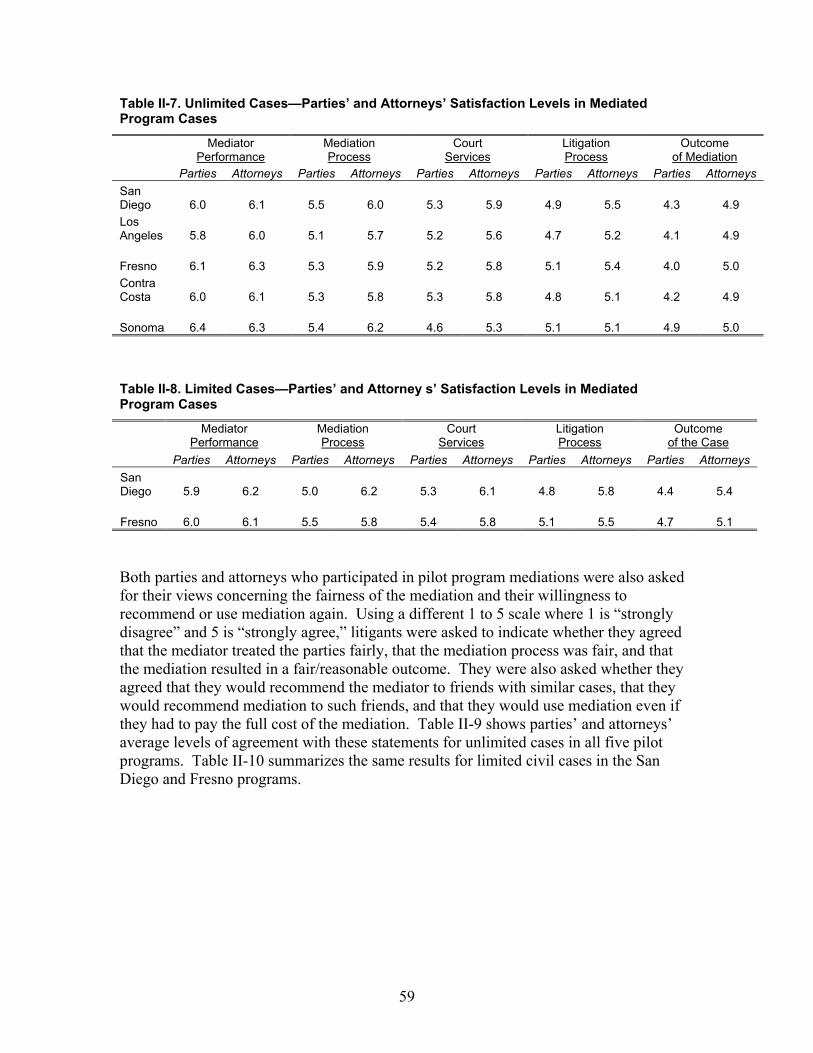
59
Table II-7. Unlimited Cases—Parties’ and Attorneys’ Satisfaction Levels in Mediated Program Cases
Mediator
Performance Mediation Process
Court Services
Litigation Process
Outcome of Mediation
Parties Attorneys Parties Attorneys Parties Attorneys Parties Attorneys Parties Attorneys San Diego 6.0 6.1 5.5 6.0 5.3 5.9 4.9 5.5 4.3 4.9 Los Angeles 5.8 6.0 5.1 5.7 5.2 5.6 4.7 5.2 4.1 4.9
Fresno 6.1 6.3 5.3 5.9 5.2 5.8 5.1 5.4 4.0 5.0 Contra Costa 6.0 6.1 5.3 5.8 5.3 5.8 4.8 5.1 4.2 4.9
Sonoma 6.4 6.3 5.4 6.2 4.6 5.3 5.1 5.1 4.9 5.0 Table II-8. Limited Cases—Parties’ and Attorney s’ Satisfaction Levels in Mediated Program Cases
Mediator Performance
Mediation Process
Court Services
Litigation Process
Outcome of the Case
Parties Attorneys Parties Attorneys Parties Attorneys Parties Attorneys Parties Attorneys San Diego 5.9 6.2 5.0 6.2 5.3 6.1 4.8 5.8 4.4 5.4
Fresno 6.0 6.1 5.5 5.8 5.4 5.8 5.1 5.5 4.7 5.1 Both parties and attorneys who participated in pilot program mediations were also asked for their views concerning the fairness of the mediation and their willingness to recommend or use mediation again. Using a different 1 to 5 scale where 1 is “strongly disagree” and 5 is “strongly agree,” litigants were asked to indicate whether they agreed that the mediator treated the parties fairly, that the mediation process was fair, and that the mediation resulted in a fair/reasonable outcome. They were also asked whether they agreed that they would recommend the mediator to friends with similar cases, that they would recommend mediation to such friends, and that they would use mediation even if they had to pay the full cost of the mediation. Table II-9 shows parties’ and attorneys’ average levels of agreement with these statements for unlimited cases in all five pilot programs. Table II-10 summarizes the same results for limited civil cases in the San Diego and Fresno programs.
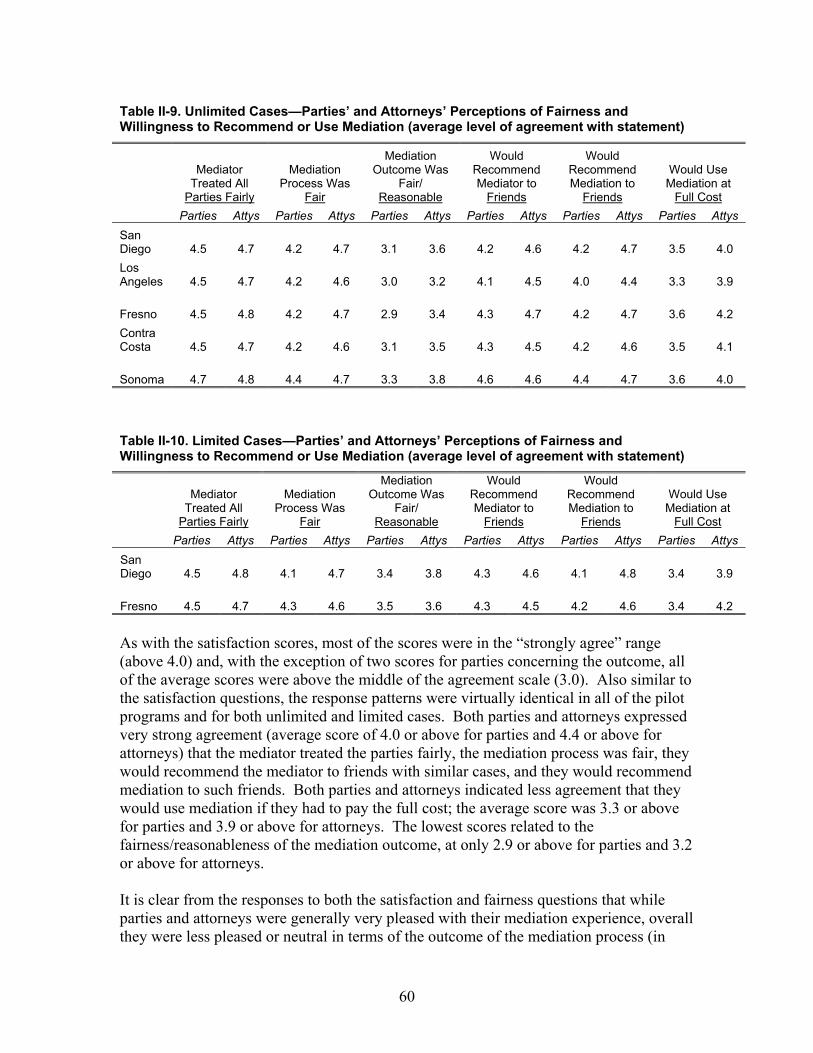
60
Table II-9. Unlimited Cases—Parties’ and Attorneys’ Perceptions of Fairness and Willingness to Recommend or Use Mediation (average level of agreement with statement)
Mediator Treated All
Parties Fairly
Mediation Process Was
Fair
Mediation Outcome Was
Fair/ Reasonable
Would Recommend Mediator to
Friends
Would Recommend Mediation to
Friends
Would Use Mediation at
Full Cost Parties Attys Parties Attys Parties Attys Parties Attys Parties Attys Parties Attys San Diego 4.5 4.7 4.2 4.7 3.1 3.6 4.2 4.6 4.2 4.7 3.5 4.0 Los Angeles 4.5 4.7 4.2 4.6 3.0 3.2 4.1 4.5 4.0 4.4 3.3 3.9
Fresno 4.5 4.8 4.2 4.7 2.9 3.4 4.3 4.7 4.2 4.7 3.6 4.2 Contra Costa 4.5 4.7 4.2 4.6 3.1 3.5 4.3 4.5 4.2 4.6 3.5 4.1
Sonoma 4.7 4.8 4.4 4.7 3.3 3.8 4.6 4.6 4.4 4.7 3.6 4.0 Table II-10. Limited Cases—Parties’ and Attorneys’ Perceptions of Fairness and Willingness to Recommend or Use Mediation (average level of agreement with statement)
Mediator Treated All
Parties Fairly
Mediation Process Was
Fair
Mediation Outcome Was
Fair/ Reasonable
Would Recommend Mediator to
Friends
Would Recommend Mediation to
Friends
Would Use Mediation at
Full Cost Parties Attys Parties Attys Parties Attys Parties Attys Parties Attys Parties Attys San Diego 4.5 4.8 4.1 4.7 3.4 3.8 4.3 4.6 4.1 4.8 3.4 3.9
Fresno 4.5 4.7 4.3 4.6 3.5 3.6 4.3 4.5 4.2 4.6 3.4 4.2 As with the satisfaction scores, most of the scores were in the “strongly agree” range (above 4.0) and, with the exception of two scores for parties concerning the outcome, all of the average scores were above the middle of the agreement scale (3.0). Also similar to the satisfaction questions, the response patterns were virtually identical in all of the pilot programs and for both unlimited and limited cases. Both parties and attorneys expressed very strong agreement (average score of 4.0 or above for parties and 4.4 or above for attorneys) that the mediator treated the parties fairly, the mediation process was fair, they would recommend the mediator to friends with similar cases, and they would recommend mediation to such friends. Both parties and attorneys indicated less agreement that they would use mediation if they had to pay the full cost; the average score was 3.3 or above for parties and 3.9 or above for attorneys. The lowest scores related to the fairness/reasonableness of the mediation outcome, at only 2.9 or above for parties and 3.2 or above for attorneys. It is clear from the responses to both the satisfaction and fairness questions that while parties and attorneys were generally very pleased with their mediation experience, overall they were less pleased or neutral in terms of the outcome of the mediation process (in
61
fact, on both outcome questions, about one-quarter of the parties and attorneys responded that they were neutral). In evaluating about this result, it is important to note that this survey was administered at the end of the mediation and that in a large proportion of cases a settlement was not reached at end of the mediation. As might have been expected, based on the discussions above concerning satisfaction with the outcome, the way parties and attorneys responded to the two outcome questions depended largely on whether their cases settled at mediation. Average satisfaction with the outcome in cases that settled at mediation was 6.0 for attorneys and 5.2 for parties, more than 50 percent higher than the average scores of 4.0 for attorneys and 3.3 for parties in cases that did not settle at mediation. Similarly, average responses concerning the fairness/reasonableness of the outcome were 4.3 for attorneys and 3.8 for parties in cases settled at mediation, more than 60 percent higher than the 2.6 for attorneys and 2.4 for parties in cases that did not settle at mediation. When the scores in both cases that settled and that did not settle at mediation were added together to calculate the overall average scores concerning the outcome, the higher scores in cases that settled were offset by those in cases that did not. It is also clear from the responses to both the satisfaction and fairness questions, that while both parties and attorneys were generally very pleased with their mediation experience, attorneys were more pleased than parties. Attorneys’ average scores were consistently higher than those of parties on all of these questions.90 This may reflect attorneys’ greater understanding about what to expect from the mediation process. Many attorneys, particularly those in San Diego, Los Angeles, and Contra Costa (where there were pre-existing mediation programs), are likely to have participated in mediations before, so they are likely to have been familiar with the mediation process and to have based their expectations about the process on this knowledge. Parties are less likely to have participated in previous mediations and may not have known what to expect from the mediation process. In focus groups, several parties indicated that they had received almost no information from their attorneys about the mediation process and did not know how the process would work. This may suggest the need for additional educational efforts targeted at parties, rather than attorneys. The higher scores for attorneys may also reflect that parties’ and attorneys’ satisfaction was associated with different aspects of their mediation experiences. In all of the pilot programs, attorneys’ responses on only four of the survey questions were strongly or moderately correlated with their responses concerning satisfaction with the mediation process—whether they believed that the mediation process was fair, that the mediation resulted in a fair/reasonable outcome, that the mediation helped move the case toward resolution quickly, and that the mediator treated all parties fairly.91 In contrast, parties’
90 The one exception was the rate of satisfaction with the mediator’s performance in Sonoma, where the average score for parties was 6.4 and 6.3 for attorneys. 91 Correlation measures how strongly two variables are associated with each other,—i.e., whether when one of the variables changes, how likely the other is to change (this does not necessarily mean that the change in one caused the change in the other, but just that they tend to move together). Correlation coefficients range from–1 to 1; a value of 0 means that there was no relationship between the variables, a value of 1 means there is a total positive relationship (when one variable changes the other always changes the same direction), and a value of–1 means a total negative relationship (when one changes the other always changes in the opposite direction). A correlation coefficient of .5 or above is considered to show a high

62
satisfaction with the mediation process was also strongly correlated with whether they believed that the mediation helped improve communication between the parties, that the cost of using mediation was affordable, and that the mediator treated all the parties fairly. The parties’ satisfaction was also moderately correlated with whether they believed they had had an adequate opportunity to tell their side of the story during the mediation.92 Attorneys’ responses to only two of the survey questions were closely correlated with their responses regarding satisfaction with the outcome of the mediation—whether they believed that the mediation resulted in a fair/reasonable outcome and that the mediation helped move the case toward resolution quickly.93 In contrast, parties’ satisfaction with the mediation outcome was also strongly correlated with whether they believed that the mediation helped improve communication between the parties, that the cost of using mediation was affordable, and that the mediation helped preserve the parties’ relationship, and it was moderately correlated with whether they believed the mediation process was fair.94 Finally, there was no strong or even moderate correlation between any of the attorneys’ responses to these survey questions and their satisfaction with either the litigation process or the services provided by the court. In contrast, parties’ satisfaction with the litigation process was correlated with whether they believed that the mediation helped move the case toward resolution quickly, that the mediation resulted in a fair/reasonable outcome, that the mediation helped improve communication between the parties, that the mediation process was fair, and that the cost of using mediation was affordable.95 Similarly, parties’ satisfaction with the court services was correlated with whether they believed that the mediation process was fair and that the cost of using mediation was affordable.96 All of this indicates that, compared to attorneys, parties’ satisfaction with both the court and with the mediation was much more closely associated with what happened during the mediation process—whether they felt heard, whether they felt the mediation helped with their communication or relationship with the other party, and whether they believed that the cost of mediation was affordable. While most parties indicated that they had had an adequate opportunity to tell their story in the mediation (84 percent gave responses that were above the neutral point on the scale), fewer parties thought that the mediation had improved the communication between the parties (57 percent) or preserved the parties’ relationship (32 percent),97 and fewer thought that the cost of mediation was affordable
correlation. The correlation coefficients of these questions with attorneys’ satisfaction with the mediation process were .55, .55, .57, and .47, respectively. 92Correlation coefficients of .57, .53, .55, and .48, respectively, with parties’ satisfaction with the mediation process. 93Correlation coefficients of .78 and .73, respectively, with attorneys’ satisfaction with the outcome. 94Correlation coefficients of .63, .50, .51, and .49, respectively, with parties’ satisfaction with the outcome. 95Correlation coefficients of .47, .49, .46, .48, and .48, respectively with parties’ satisfaction with the litigation process. 96Correlation coefficients of .47 and .48, respectively, with parties’ satisfaction with the courts’ services. 97 Note that in many types of cases, such as Auto PI cases, this simply may not have been relevant; 41 percent of parties and 55 percent of attorneys gave the neutral response to this question.
63
(60 percent). These perceptions therefore may have contributed to parties’ lower satisfaction scores.
Conclusion The study found that all five of the pilot programs improved attorneys’ overall satisfaction with the services provided by the court, with the litigation process, or with both. 98 Attorneys in program cases in San Diego, Los Angeles, Fresno, and Contra Costa expressed satisfaction levels with the services provided by the court that ranged from 10 to 15 percent higher than the satisfaction levels expressed by attorneys in nonprogram cases.99 Similarly, attorneys’ satisfaction with the litigation process was about 6 percent higher in program cases in the San Diego, Fresno, Contra Costa, and Sonoma pilot programs than in non-program cases. 100 As might have been expected, attorneys’ satisfaction with the outcome in program cases corresponded to whether their cases settled at mediation; settling at mediation increased their satisfaction with the outcome, but not settling at mediation decreased their satisfaction compared to the satisfaction of attorneys in similar nonprogram cases. In addition, the study found that attorneys were generally more satisfied with both the court services and with the litigation process when their cases settled at mediation; settling at mediation generally made attorneys happier with all aspects of their experience. However, the study also found that attorneys whose cases were mediated and did not settle at mediation were also generally more satisfied with the services provided by the court than attorneys in similar nonprogram cases. This indicates that the experience of participating in pilot program mediation increased attorneys’ satisfaction with the services provided by the court, even if the case did not resolve at mediation. In all five pilot programs, both parties and attorneys who participated in mediations expressed high satisfaction with their mediation experience; their highest levels of satisfaction were with the performance of the mediators and their lowest were with the outcome of the mediation process. They also strongly agreed that the mediator and the mediation process were fair and that they would recommend both to others. Parties and attorneys were less satisfied with the outcome of the mediation process and were more neutral about whether the outcome was fair/reasonable; this, again, corresponded to whether or not the case settled at mediation. While both parties and attorneys were generally very pleased with their mediation experience, attorneys were more satisfied than parties. This may reflect attorneys’ greater understanding about what to expect from the mediation process and suggest the need for additional educational efforts targeted at parties. It may also reflect the fact that parties’
98 Because of low response rates to surveys from parties in nonprogram cases, it was not possible to compare the satisfaction levels of parties in program and nonprogram cases. 99 For the San Diego pilot program, because of offsetting decreases in satisfaction among unlimited program-group cases that were not referred to mediation or that were removed from mediation, this impact was evident only for limited cases. 100 For the San Diego pilot program, because of offsetting decreases in satisfaction among unlimited program-group cases that were not referred to mediation, this impact was evident only for limited cases.

64
satisfaction with both the court and with the mediation was much more closely tied than attorneys’ satisfaction to what happened within the mediation process—whether they felt heard, whether the mediation helped their communication or relationship with the other party, and whether the cost of mediation was affordable.
65
G. Findings Concerning the Impact of Pilot Programs on Litigant Costs
This section examines the pilot programs’ impact on litigant costs and the number of hours spent by attorneys in resolving cases.
Summary In the Contra Costa pilot program, estimated actual litigant costs were 60 percent lower and average attorney hours were 43 percent lower in program cases than in nonprogram cases. In the San Diego, Contra Costa, and Fresno pilot programs (where it was possible to break down program cases into subgroups based on their different experiences in the program), the study found that the estimated actual costs incurred by parties or the estimated actual hours spent by attorneys in reaching resolution (or both) were lower in program cases that settled at mediation compared to similar nonprogram cases. The percentage savings in litigant cost calculated through regression analysis were estimated to be 50 percent in the Contra Costa program and savings in attorney hours were 40 percent in the Contra Costa program, 20 percent in the Fresno program, and 16 percent in the San Diego program. In all of the programs, attorneys in program cases that settled at mediation also estimated savings, ranging from 61 to 68 percent in litigant costs and 57 to 62 percent in attorney hours, from using mediation to reach settlement. Based on these attorneys estimates, total estimated savings in litigant costs in all of the 2000 and 2001 cases that settled at pilot program mediations ranged from $1,769,040 in the Los Angeles program to $24,784,254 in the San Diego program; and the total estimated attorney hours saved ranged from 9,240 hours in the Los Angeles program to 135,300 in the San Diego program. From all of the five pilot programs added together, the total estimated savings calculated based on attorney estimates of savings in 2000 and 2001 cases that settled at pilot program mediations was considerable: $49,409,698 in litigant cost savings and 250,229 in attorney hours savings.
Estimated Actual Litigant Costs, Attorney Hours, or Both Were Lower in Program Cases That Settled at Mediation Than in Similar Nonprogram Cases The pilot programs’ impact on litigant costs was measured by comparing the responses of attorneys in program cases and in nonprogram cases to survey questions asking them to estimate the time they had actually spent on the case and their clients’ actual litigation costs in reaching resolution. In the Contra Costa pilot program, estimated actual litigant costs were 60 percent lower and attorney hours were 43 percent lower in program cases than in nonprogram cases. In the other pilot programs, however, overall comparisons did not show statistically significant differences in litigant costs or attorney hours in program and nonprogram cases. As was discussed in the Section I.B., the survey data on litigant costs and attorney time had a very skewed distribution: a few cases had very large litigant cost and attorney time estimates (“outlier” cases) that extended the data’s range. While several methods were used to try to account for this skewed distribution, the range of the data was so
66
broad that none of the differences found in overall comparisons between program cases and nonprogram cases in the other four courts were statistically significant—it was not possible to tell if the observed differences were real or simply due to chance. However, when the program cases were broken down into subgroups based upon their different experiences in the program101 and compared to nonprogram cases with similar characteristics,102 statistically significant results were found. In the San Diego, Contra Costa, and Fresno pilot programs,103 the costs actually incurred by parties, the attorney hours actually spent, or both were found to be lower in program cases that settled at mediation compared to similar nonprogram cases. In Contra Costa, litigant costs were 50 percent lower and attorney hours were 40 percent lower in stipulated cases that were settled at mediation compared to similar nonstipulated cases. In the San Diego program, attorney hours were 16 percent lower in program-group cases that settled at mediation than in similar control-group cases; the analysis also indicated that litigant costs were also lower, but the size of this reduction was not clear. Finally, in the Fresno program, attorney hours were 20 percent lower in program-group cases that settled at mediation than similar cases in the control group. In the Contra Costa pilot program, there was also evidence that litigant costs and attorney hours were lower in program cases that did not settle at mediation when compared to similar nonprogram cases. Litigant costs were 68 percent lower and attorney hours 40 percent lower in stipulated cases that did not settle at mediation compared to similar cases in the nonstipulated group. Overall, these results suggest that both actual litigant costs and attorney hours were reduced when cases are settled at early mediation and that these costs and hours may also have been reduced when cases participate in mediation even if settlement is not reached.
Attorneys’ Estimated Savings in Both Litigant Costs and Attorney Hours When Cases Settled at Mediation In addition to estimates of actual litigant costs and attorney hours, attorneys in the subgroup of program cases that settled at mediation were asked to provide an estimate of the time they would have spent and what the costs to their clients would have been had they not used mediation. The difference between the estimated actual costs and attorney hours and the potential costs and attorney time had mediation not been used represents the attorneys’ subjective estimate of the impact of mediation settlement on litigant costs and attorney hours.
101 The subgroups were: 1) cases not referred to mediation (this subgroups was present only in San Diego and Los Angeles); 2) cases referred to mediation but settled before the mediation took place; 3) cases removed from the mediation track; 4) cases mediated but not settled at mediation; and 5) cases mediated and settled at the mediation 102 These subgroup comparisons were made using the regression analysis method described in Section I.B. 103 Subgroup information was not available for the Sonoma pilot program and comparisons in Los Angeles were to cases that participated in the court’s other mediation program.
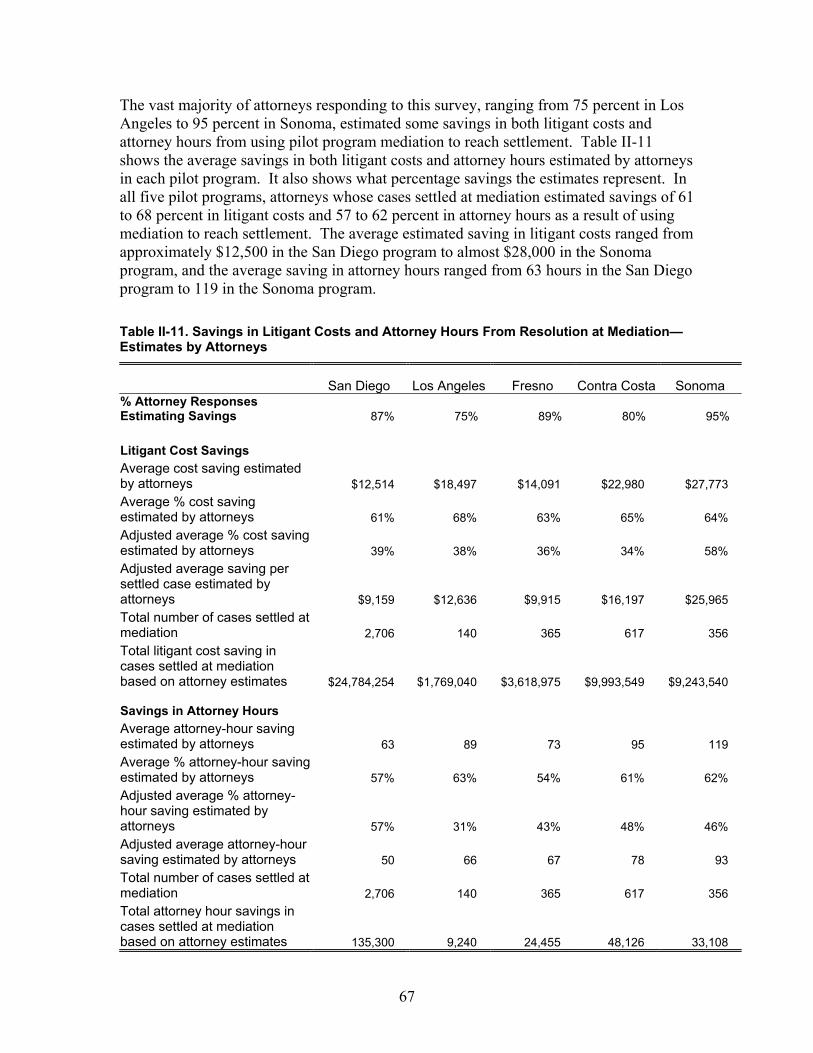
67
The vast majority of attorneys responding to this survey, ranging from 75 percent in Los Angeles to 95 percent in Sonoma, estimated some savings in both litigant costs and attorney hours from using pilot program mediation to reach settlement. Table II-11 shows the average savings in both litigant costs and attorney hours estimated by attorneys in each pilot program. It also shows what percentage savings the estimates represent. In all five pilot programs, attorneys whose cases settled at mediation estimated savings of 61 to 68 percent in litigant costs and 57 to 62 percent in attorney hours as a result of using mediation to reach settlement. The average estimated saving in litigant costs ranged from approximately $12,500 in the San Diego program to almost $28,000 in the Sonoma program, and the average saving in attorney hours ranged from 63 hours in the San Diego program to 119 in the Sonoma program. Table II-11. Savings in Litigant Costs and Attorney Hours From Resolution at Mediation—Estimates by Attorneys
San Diego Los Angeles Fresno Contra Costa Sonoma % Attorney Responses Estimating Savings 87% 75% 89% 80% 95% Litigant Cost Savings Average cost saving estimated by attorneys $12,514 $18,497 $14,091 $22,980 $27,773 Average % cost saving estimated by attorneys 61% 68% 63% 65% 64% Adjusted average % cost saving estimated by attorneys 39% 38% 36% 34% 58% Adjusted average saving per settled case estimated by attorneys $9,159 $12,636 $9,915 $16,197 $25,965 Total number of cases settled at mediation 2,706 140 365 617 356 Total litigant cost saving in cases settled at mediation based on attorney estimates $24,784,254 $1,769,040 $3,618,975 $9,993,549 $9,243,540 Savings in Attorney Hours Average attorney-hour saving estimated by attorneys 63 89 73 95 119 Average % attorney-hour saving estimated by attorneys 57% 63% 54% 61% 62% Adjusted average % attorney-hour saving estimated by attorneys 57% 31% 43% 48% 46% Adjusted average attorney-hour saving estimated by attorneys 50 66 67 78 93 Total number of cases settled at mediation 2,706 140 365 617 356 Total attorney hour savings in cases settled at mediation based on attorney estimates 135,300 9,240 24,455 48,126 33,108
68
In all of the pilot programs, some of the attorneys responding to the survey estimated either that there was no saving in litigant costs or attorney hours or that litigant costs and attorney hours were increased compared to what would have been expended had mediation not been used to resolve the case. Taking these cases into account, adjusted averages for litigant cost and attorney-hour savings per case settled at mediation were calculated. Using this adjusted average, the total savings in all 2000 and 2001 cases that settled at pilot program mediation in each of the programs during the study period was calculated. Based on these attorney estimates, the total litigant cost savings estimated ranged from $1,769,040 in the Los Angeles program to $24,784,254 in the San Diego program. The total estimated attorney hours saved ranged from 9,240 hours in the Los Angeles program to 135,300 in the San Diego program. From all of the five pilot programs added together, the total savings calculated based on these attorney estimates of savings in 2000 and 2001 cases that settled at pilot program mediations was considerable: $49,409,385 in litigant cost savings and 250,229 in attorney hours savings. It should be cautioned that these figures are based on attorneys’ estimates of savings; they are not calculations of actual savings. In some of the pilot programs, the percentage savings calculated by comparing estimates of actual costs and attorney hours in program cases that settled at mediation and in similar nonprogram cases using regression analysis were different from the savings estimated by attorneys. Litigant cost savings calculated through regression analysis were 50 percent in the Contra Costa program compared to 34 percent based upon attorney estimates. Similarly, attorney-hour savings calculated through the regression method were 40 percent in the Contra Costa program, 20 percent in the Fresno program, and 16 percent in the San Diego program, compared to 31, 43, and 57 percent, respectively, based upon attorney estimates. Thus, the actual litigant cost and attorney-hour savings could be somewhat higher or lower than the attorney estimates. It should also be cautioned that these estimated savings are for cases settled at mediation only, not for all cases in the pilot programs. The regression results discussed above suggest that, in at least two of the pilot programs, there may also have been litigant cost and attorney-hour savings in program cases that were mediated but were not settled at mediation.104 There may also have been savings or increases in litigant costs or attorney hours in other subgroups of program cases, such as those that were referred to mediation but settled before the mediation took place or that were removed from the mediation track. Data on program impacts in these subgroups were not available.
104 Additional support for the conclusion that mediation may reduce costs even in cases that do not settle at mediation comes from approximately 230 postmediation survey responses in which attorneys in cases that did not settle at mediation provided information about litigant costs and attorney hours even though this information had not been requested. Approximately 60 percent of these survey responses indicated some savings in litigant costs and attorney hours in these cases that were mediated but did not settle at mediation. Taking into account those responses that estimated no savings or increased costs, the attorneys in cases that did not settle at mediation estimated average savings of 30 percent in litigant costs (45 percent median savings) and 33 percent in attorney hours (50 percent median savings).
69
Conclusion In the Contra Costa pilot program, estimated actual litigant costs were 60 percent lower and average attorney hours were 43 percent lower in program cases than in nonprogram cases. In the San Diego, Contra Costa, and Fresno programs (where it was possible to break down program cases into subgroups based on their different experiences in the program), the study found that the estimated actual costs incurred by parties or the estimated actual hours spent by attorneys in reaching resolution (or both) were lower in program cases that settled at mediation compared to similar nonprogram cases. Litigant cost savings calculated through regression analysis were 50 percent in the Contra Costa program, and attorney-hour savings were 40 percent in the Contra Costa program, 20 percent in the Fresno program, and 16 percent in the San Diego program. In all five pilot programs, attorneys in program cases that settled at mediation also estimated savings, ranging from 61 to 68 percent in litigant costs and from 57 to 62 percent in attorney hours, from using mediation to reach settlement. Adjusting these estimates downward to account for cases in which attorneys estimated no savings or increased costs and hours based on attorney estimates, total savings in litigant costs in all of the 2000 and 2001 cases that settled at pilot program mediations ranged from $1,769,040 in the Los Angeles program to $24,784,254 in the San Diego program, and the total estimated attorney hours saved ranged from 9,240 hours in the Los Angeles program to 135,300 in the San Diego program. From all of the five pilot programs added together, the total estimated savings calculated based on attorney estimates of savings in 2000 and 2001 cases that settled at pilot program mediations was considerable: $49,409,358 in litigant cost savings and 250,229 in attorney hours savings.
70
H. Findings Concerning the Impact of Pilot Programs on Court Workload
This section examines the pilot programs’ impact on the number of pretrial events conducted by the courts.
Summary In four of the five pilot programs—those in San Diego, Los Angeles, Fresno, and Sonoma—there was evidence that the program reduced the number of motions, the number of “other” pretrial hearings, or both. The reductions were substantial, ranging from 18 to 48 percent for motions and 11 to 32 percent for “other” pretrial hearings. Because of special conferences required under the Fresno pilot program’s procedures, these decreases were completely offset in Fresno by increases in the number of case management conferences in program cases.105 However, in the San Diego, Los Angeles, and Sonoma programs, these reductions resulted in overall savings in court time. The total potential time savings from reduced numbers of court events were estimated to be 479 judge days per year in San Diego (with an estimated monetary value of approximately $1.4 million), 132 days in Los Angeles (with an estimated monetary value of approximately $395,000), and 3 days in Sonoma (with an estimated monetary value of approximately $9,700). In the San Diego, Contra Costa, and Fresno pilot programs (where it was possible to break down program cases into subgroups based on their different experiences in the pilot programs) the study found that total pretrial events were substantially reduced in program cases that settled at mediation; reductions ranged from 30 to 65 percent compared to similar nonprogram cases. The study also found evidence that court events were reduced in program cases that were mediated but did not settle and in program cases that settled before mediation in some pilot programs. In addition, survey results indicated that there were fewer postdisposition compliance problems and fewer new proceedings initiated in program cases. This suggests that the pilot programs not only reduced court workload in the short term but may also have reduced the court’s future workload. All of these results suggest that early mediation programs may be able to help courts free up valuable judicial time that can be devoted to other cases that need judges’ attention.
In Four of the Five Pilot Programs, There Was Evidence That the Program Reduced the Number of Motions, “Other” Pretrial Hearings, or Both. The pilot programs’ impact on court workload was measured by comparing the average number of case management conferences,106 motions, and other pretrial hearings in program cases and nonprogram cases. Table II-12 summarizes the results of these
105 The Fresno court has since changed its case management procedures so that additional case management conferences are not required in program cases. 106 Only case management conferences conducted by judges were examined in this comparison.
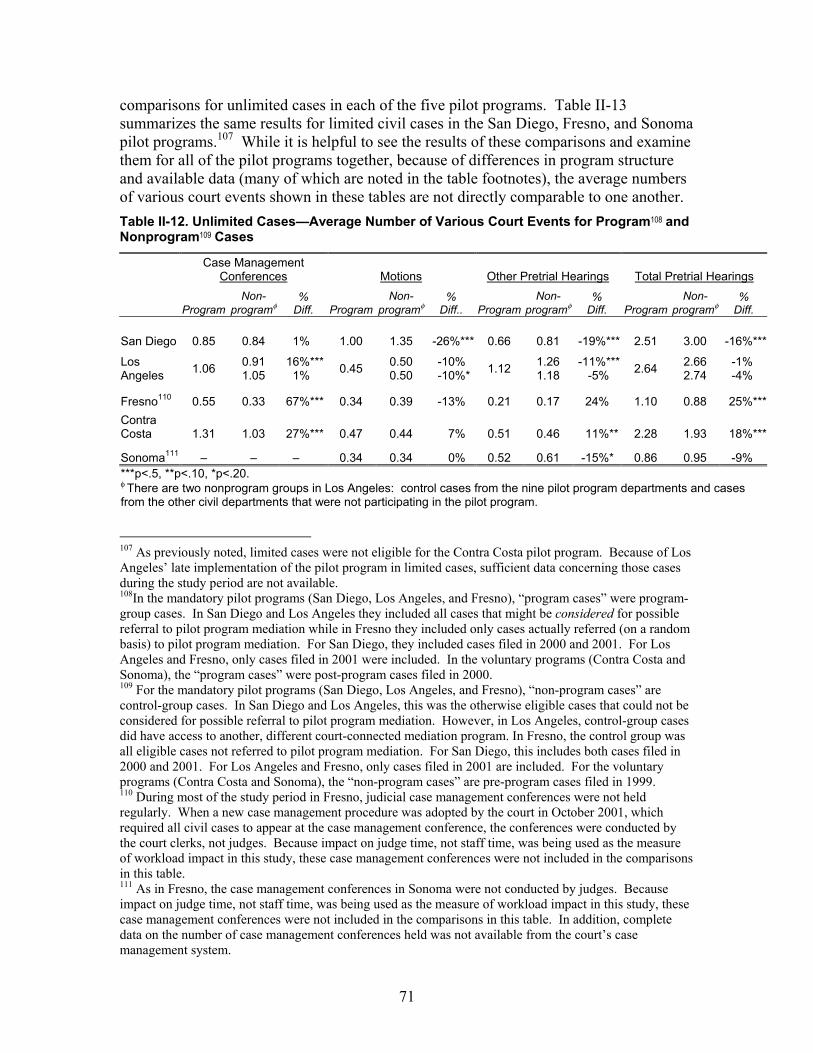
71
comparisons for unlimited cases in each of the five pilot programs. Table II-13 summarizes the same results for limited civil cases in the San Diego, Fresno, and Sonoma pilot programs.107 While it is helpful to see the results of these comparisons and examine them for all of the pilot programs together, because of differences in program structure and available data (many of which are noted in the table footnotes), the average numbers of various court events shown in these tables are not directly comparable to one another. Table II-12. Unlimited Cases—Average Number of Various Court Events for Program108 and Nonprogram109 Cases
Case Management Conferences Motions Other Pretrial Hearings Total Pretrial Hearings
Program Non-
programφ %
Diff. ProgramNon-
programφ%
Diff.. ProgramNon-
programφ %
Diff. ProgramNon-
programφ%
Diff.
San Diego 0.85 0.84 1% 1.00 1.35 -26%*** 0.66 0.81 -19%*** 2.51 3.00 -16%***
Los Angeles 1.06 0.91
1.05 16%*** 1% 0.45 0.50
0.50 -10% -10%* 1.12 1.26
1.18 -11%***
-5% 2.64 2.66 2.74
-1% -4%
Fresno110 0.55 0.33 67%*** 0.34 0.39 -13% 0.21 0.17 24% 1.10 0.88 25%***Contra Costa 1.31 1.03 27%*** 0.47 0.44 7% 0.51 0.46 11%** 2.28 1.93 18%***
Sonoma111 – – – 0.34 0.34 0% 0.52 0.61 -15%* 0.86 0.95 -9% ***p<.5, **p<.10, *p<.20. φ There are two nonprogram groups in Los Angeles: control cases from the nine pilot program departments and cases from the other civil departments that were not participating in the pilot program.
107 As previously noted, limited cases were not eligible for the Contra Costa pilot program. Because of Los Angeles’ late implementation of the pilot program in limited cases, sufficient data concerning those cases during the study period are not available. 108In the mandatory pilot programs (San Diego, Los Angeles, and Fresno), “program cases” were program-group cases. In San Diego and Los Angeles they included all cases that might be considered for possible referral to pilot program mediation while in Fresno they included only cases actually referred (on a random basis) to pilot program mediation. For San Diego, they included cases filed in 2000 and 2001. For Los Angeles and Fresno, only cases filed in 2001 were included. In the voluntary programs (Contra Costa and Sonoma), the “program cases” were post-program cases filed in 2000. 109 For the mandatory pilot programs (San Diego, Los Angeles, and Fresno), “non-program cases” are control-group cases. In San Diego and Los Angeles, this was the otherwise eligible cases that could not be considered for possible referral to pilot program mediation. However, in Los Angeles, control-group cases did have access to another, different court-connected mediation program. In Fresno, the control group was all eligible cases not referred to pilot program mediation. For San Diego, this includes both cases filed in 2000 and 2001. For Los Angeles and Fresno, only cases filed in 2001 are included. For the voluntary programs (Contra Costa and Sonoma), the “non-program cases” are pre-program cases filed in 1999. 110 During most of the study period in Fresno, judicial case management conferences were not held regularly. When a new case management procedure was adopted by the court in October 2001, which required all civil cases to appear at the case management conference, the conferences were conducted by the court clerks, not judges. Because impact on judge time, not staff time, was being used as the measure of workload impact in this study, these case management conferences were not included in the comparisons in this table. 111 As in Fresno, the case management conferences in Sonoma were not conducted by judges. Because impact on judge time, not staff time, was being used as the measure of workload impact in this study, these case management conferences were not included in the comparisons in this table. In addition, complete data on the number of case management conferences held was not available from the court’s case management system.

72
Table II-13. Limited Cases—Average Number of Various Court Events for Program and Nonprogram Cases
Case Management Conferences Motions Other Pretrial Hearings Total Pretrial Hearings
Program
Non- program
% Diff. Program
Non- program
% Diff. Program
Non- program
% Diff.
Program
Non- program
% Diff.
San Diego 0.65 0.75 -13%*** 0.27 0.33 -18%*** 0.52 0.77 -32%*** 1.44 1.85 -22%***
Fresno 0.61 0.25 144%*** 0.11 0.21 -48%*** 0.08 0.06 33% 0.80 0.53 51%***
Sonoma – – – 0.23 0.18 28% 0.45 0.55 -18% 0.68 0.73 -7% ***p<.5, **p<.10, *p<.20. As shown in Table II-12 and Table II-13, in four of the five pilot programs—San Diego, Los Angeles, Fresno, and Sonoma—there was evidence that the pilot program reduced the number of motions, the number of other pretrial hearings, or both. Both the San Diego and Fresno programs showed statistically significant decreases in the overall average number of motions among program cases compared to nonprogram cases (for the Fresno program, this impact was evident for limited cases but not for unlimited cases). The decreases were 26 percent for unlimited cases and 18 percent for limited cases in the San Diego program and 48 percent for limited cases in the Fresno program. There was also evidence that the number of motions may have been reduced in the Los Angeles program compared to cases in the control departments. The San Diego and Los Angeles programs also showed statistically significant decreases in the overall average number of other pretrial hearings among pilot program cases compared to nonprogram cases. The decreases were 19 percent for unlimited cases and 32 percent for limited cases in the San Diego program and 11 percent for unlimited cases in the Los Angeles program.112 There was also evidence that the number of other pretrial hearings may have been reduced for unlimited cases in the Sonoma program. While all four of these pilot programs showed decreases in motions, other hearings or both, only the San Diego pilot program showed a statistically significant decrease in the overall average number of all pretrial events. In the Los Angeles and Fresno programs, this was because there were also significant increases in the numbers of case management conferences that offset the decreases in motions or other hearings.113 112 This difference is between program-group cases and control cases in the participating departments in the Los Angeles program. 113 In Fresno in particular, the increase in case management conferences in program cases was large–67 percent in unlimited cases and 144 percent in limited cases. This finding is understandable given the case management and pilot program procedures that were in place in Fresno until October 2001. Up until October 2001, case management conferences were not held in most cases. However, in program-group cases (cases referred to mediation), if the parties did not want to go to mediation, they were generally required to attend an early mediation status conference in order to be removed from the mediation track. Similarly, in cases that did not settle at mediation (almost 30 percent of the program-group cases), postmediation status conferences were held. Thus, for a large percentage of program cases in Fresno, the pilot program procedures required additional, special court conferences, that were not required in the control group. The Superior Court of Fresno County has since changed its case management procedures so that additional case management conferences are not required in program cases.
73
In the Contra Costa program, the comparison of court events in cases filed before and after the pilot program began did not show decreases in motion or other hearings and showed a statistically significant increase in case management conferences This increase in case management conferences may reflect new procedures adopted by the court in 2000 for certain complex cases. In addition to this pre-/post-program comparison, a comparison was done between the number of court events in cases in which the parties stipulated to mediation and similar cases in which they did not.114 No statistically significant differences in the numbers of court events in stipulated cases and similar nonstipulated cases were found. By reducing the total number of court events in program cases, the pilot program in San Diego saved judges’ time. In San Diego, at these lower pretrial event rates, approximately 344 judge days per year were saved in program cases during the study period. If the pilot program had also been available to cases in the control group, an additional estimated 135 judge days per year could have been saved. Thus, the total potential time saving from the workload reduction attributable to the pilot program in San Diego was estimated to be 479 judge days per year. While the total number of court events in Los Angeles was not reduced, because “other” pretrial hearings take more judicial time on average than case management conferences, the reductions in these “other” hearings offset the increases in the time spent on additional case management conferences, and, overall, the pilot program still resulted in time savings to the court. At these lower pretrial event rates in Los Angeles, approximately 5 judge days per year were saved in program cases during the study period. If the pilot program had also been available to cases in the control groups, an additional estimated 122 judge days per year could have been saved in the Central District of Los Angeles. Thus, the total potential time saving from the workload reduction attributable to the pilot program in Los Angeles was estimated to be 132 judge days per year. Similarly, in Sonoma, while the reduction in total court events was not statistically significant, at the lower pretrial event rate, a total of 3 judge days per year were potentially saved. As noted above in the discussion of judicial time savings associated with reductions in the trial rate, many court costs, including judicial salaries, are fixed. Therefore, judicial time savings from the reduced number of pretrial events do not translate into a fungible cost saving that can be reallocated to cover other court expenses. Instead, the time saved allowed the judges in these courts to give more time to other cases that needed judicial attention. To help understand the value of the potential time savings from reductions in pretrial events, however, the estimated monetary value of this time was calculated. Based on an estimated cost of $2,990 per day for a judgeship,115 the monetary value of saving 479
114 The regression analysis method described in the methods section was used to make these comparisons. 115 This estimated cost includes salaries for a judge and associated support staff but not facilities or general overhead costs. In its Fiscal Year 2001—2002 Budget Change Proposal for 30 new judgeship, the Finance Division of the Administrative Office of the Courts estimated that each new judgeship would have a total
74
judge days per year in San Diego was estimated to be approximately $1.4 million per year, the monetary value of saving 132 judge days per year in Los Angeles was estimated to be approximately $395,000 per year, and the monetary value of saving 3 judge days per year in Sonoma was estimated to be $9,770.
Total Pretrial Events Were Lower in Program Cases That Settled at Mediation Compared to Similar Nonprogram Cases In the San Diego, Contra Costa, and Fresno pilot programs (where it was possible to break down program cases into subgroups based on their different experiences in the program) the study found that total pretrial events were substantially reduced in program cases that settled at mediation (in Fresno, this finding was evident for unlimited cases, but not for limited cases). In San Diego, unlimited program-group cases that settled at mediation had an average of 45 percent fewer total pretrial court events than the average for similar cases in the control group and limited cases had an average of 40 percent fewer. For unlimited cases in the Fresno program, the average number of events in cases settled at mediation was 65 percent lower, and for those in Contra Costa it was 20 percent lower than the average number for similar nonprogram cases. The study also found evidence that court events were reduced in program cases that were mediated but did not settle and in program cases that settled before mediation in some pilot programs. In the San Diego pilot programs, the number of “other” pretrial hearings were reduced in cases that were mediated but did not settle compared to similar nonprogram cases. Finally, there was evidence that the number of motions was reduced in unlimited cases that settled before mediation in the San Diego program and that the number of “other” pretrial hearings was also reduced in such cases in both the San Diego and Fresno programs. Overall, the results of these analyses support the conclusions that (1) settlement at mediation reduced the courts’ workload in the form of fewer total pretrial events and (2) positive impacts on the courts’ workload might also have resulted when cases were referred to mediation but settled before mediation or when cases were mediated but did not settle at mediation.
The Pilot Programs May Have Had a Positive Long-term Impact on the Courts’ Workload The above analysis of the pilot programs’ impact on the courts’ workload focused on various court events that took place before cases reached disposition. To try to determine if the programs also had long-term impacts on the courts’ workload after cases reached disposition, attorneys in both program and nonprogram cases were surveyed approximately six months after their cases had reached disposition to see if there were differences in compliance or the finality of the disposition. Among other things,
annual cost of $642,749. This figure includes the total cost of salaries, benefits, and operating expenses for each new judgeship and its complement of support staff: a bailiff, a court reporter, two courtroom clerks, a legal secretary, and a research attorney. (Judicial Council of Cal., Fiscal Year 2001—2002 Budget Change Proposal, No. TC18.)
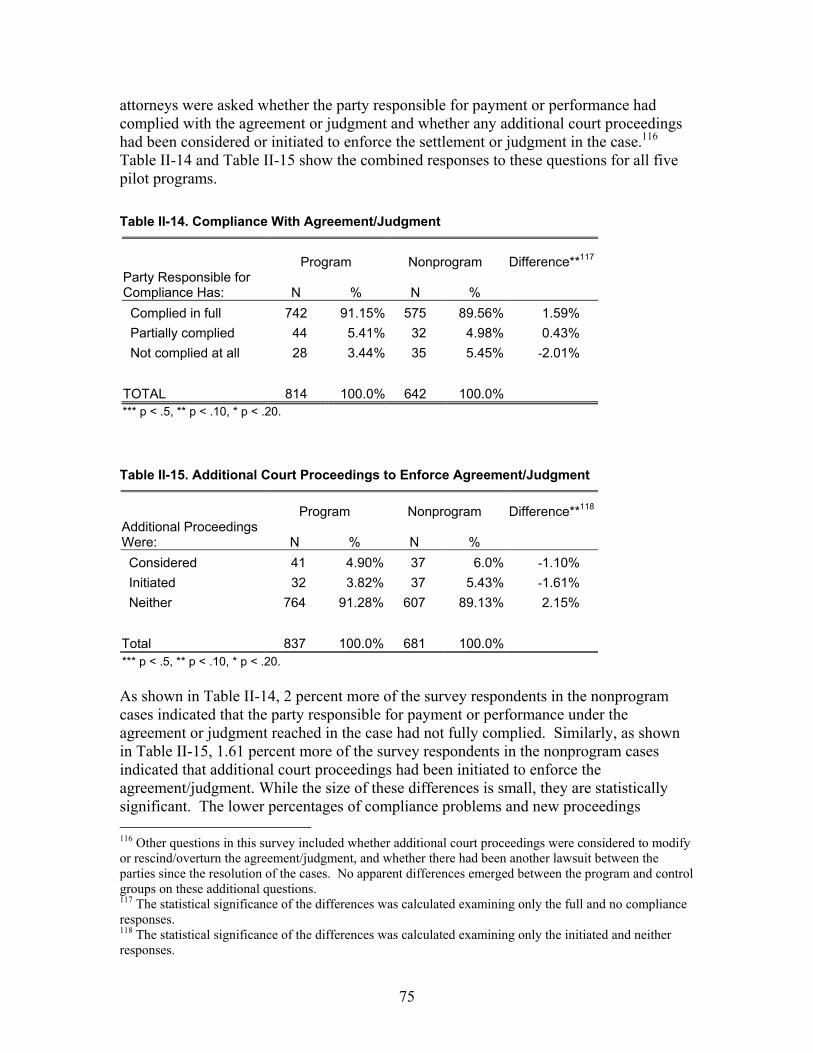
75
attorneys were asked whether the party responsible for payment or performance had complied with the agreement or judgment and whether any additional court proceedings had been considered or initiated to enforce the settlement or judgment in the case.116 Table II-14 and Table II-15 show the combined responses to these questions for all five pilot programs. Table II-14. Compliance With Agreement/Judgment
Program Nonprogram
Difference**117 Party Responsible for Compliance Has: N % N % Complied in full 742 91.15% 575 89.56% 1.59% Partially complied 44 5.41% 32 4.98% 0.43% Not complied at all 28 3.44% 35 5.45% -2.01% TOTAL 814 100.0% 642 100.0%*** p < .5, ** p < .10, * p < .20.
Table II-15. Additional Court Proceedings to Enforce Agreement/Judgment
Program Nonprogram Difference**118 Additional Proceedings Were: N % N % Considered 41 4.90% 37 6.0% -1.10% Initiated 32 3.82% 37 5.43% -1.61% Neither 764 91.28% 607 89.13% 2.15% Total 837 100.0% 681 100.0% *** p < .5, ** p < .10, * p < .20. As shown in Table II-14, 2 percent more of the survey respondents in the nonprogram cases indicated that the party responsible for payment or performance under the agreement or judgment reached in the case had not fully complied. Similarly, as shown in Table II-15, 1.61 percent more of the survey respondents in the nonprogram cases indicated that additional court proceedings had been initiated to enforce the agreement/judgment. While the size of these differences is small, they are statistically significant. The lower percentages of compliance problems and new proceedings 116 Other questions in this survey included whether additional court proceedings were considered to modify or rescind/overturn the agreement/judgment, and whether there had been another lawsuit between the parties since the resolution of the cases. No apparent differences emerged between the program and control groups on these additional questions. 117 The statistical significance of the differences was calculated examining only the full and no compliance responses. 118 The statistical significance of the differences was calculated examining only the initiated and neither responses.
76
initiated in program cases suggest that the pilot programs not only reduced court workload in the short term but may also have reduced the courts’ future workload. Even this small percentage decrease in compliance problems and additional proceedings, like a small drop in the trial rate, could make an important difference in the courts’ workload when applied to all civil cases that reach disposition each year.
Conclusion The pilot programs in San Diego, Los Angeles, Fresno, and Sonoma reduced the number of motions, the number of “other” pretrial hearings, or both in program cases. The reductions were substantial, ranging from 18 to 48 percent for motions and 11 to 32 percent for “other” pretrial hearings. Because of special conferences required under the Fresno pilot program procedures, these decreases were completely offset in Fresno by increases in the number of case management conferences in program cases.119 However, in the San Diego, Los Angeles, and Sonoma programs, these reductions resulted in savings of court time. The total potential time savings from the reduced number of court events was estimated to be 479 judge days per year in San Diego (with an estimated monetary value of approximately $1.4 million), 132 days in Los Angeles (with an estimated monetary value of approximately $395,000), and 3 days in Sonoma (with an estimated monetary value of approximately $9,700). This suggests that early mediation programs may be able to help courts save valuable judicial time that can be devoted to other cases that need judges’ attention. In the San Diego, Contra Costa, and Fresno pilot programs (where it was possible to break program cases down into subgroups based on their different experiences in the program) the study found that total pretrial events were substantially reduced in program cases that settled at mediation. Reductions in cases that settled at mediation ranged from 30 to 65 percent compared to similar nonprogram cases. The study also found evidence that court events were reduced in program cases that were mediated but did not settle and in program cases that settled before mediation in some pilot programs. In addition, survey results indicate that there were fewer postdisposition compliance problems and fewer new proceedings initiated in program cases. This suggests that the pilot programs not only reduced court workload in the short term but may also have reduced the court’s future workload.
119 The Superior Court of Fresno County has since changed its procedures so that additional case management conferences are not required in program cases.

77
I. Comparison of Court-Ordered Mediation Under Pilot Program and Voluntary Mediation in Los Angeles
As noted in the introduction, the statutes establishing the Early Mediation Pilot Programs required that the Judicial Council compare court-ordered mediation conducted under the pilot program with voluntary mediation in Los Angeles County. To fulfill this requirement, this report compares outcomes in cases valued at over $50,000 that were referred to mediation under the Early Mediation Pilot Program with cases valued at over $50,000 referred to mediation in the Civil Action Mediation Program established by Code of Civil Procedure sections 1775–1775.16 (“1775 program”). In the Early Meditation Pilot Program, judges could order cases of any value to mediation, so cases valued at over $50,000 were subject to court-ordered mediation in the pilot program. In contrast, in the 1775 program, judges were only authorized to order cases to mediation that were valued at $50,000 or less, but parties could stipulate to mediation in cases valued at over $50,000, so cases valued at over $50,000 had access to voluntary mediation in the 1775 program. Thus, comparing cases valued at over $50,000 that were referred to mediation in these two programs is one way of comparing court-ordered mediation under the pilot program to voluntary mediation.120 These two groups of cases were compared on all of the same outcome measures used to compare program and non-program cases—trial rates, disposition time, litigant satisfaction, litigant costs, and court workload—employing the same data sources and methods used for the other comparisons in this study. The study found lower trial rates, disposition time, and court workload in those cases valued over $50,000 referred to mediation under pilot program (court-ordered referrals) compared to the 1775 program (voluntary referrals). The trial rate for these pilot program cases (court-ordered referrals) was approximately 31 percent lower than in the 1775 program cases (voluntary referrals), disposition time was approximately 20 to 30 days shorter in the pilot program cases, and there were 10 percent fewer court events on average in these pilot program cases. Results of the study also suggested that attorneys satisfaction with the court’s services and the litigation process may have been higher in those cases valued over $50,000 referred to mediation under pilot program than under the 1775 program.121 Table II-16 through Table II-19 show the results of these comparisons.
120 In theory, pilot program cases could, instead, have been compared to cases voluntarily mediated outside the court system or to cases in which the parties stipulated to use mediation within the court system. However, data on case outcomes in these other potential comparison groups was not available. Data on trial rates, disposition time, litigant satisfaction, litigant costs, and court workload was available on the cases in both the Early Mediation Pilot and 1775 programs. 121 As noted in Section I.B. on the data and methods used in the study, there were two “control groups” in Los Angeles—control cases from the nine pilot program departments and cases from the other civil departments that were not participating in the pilot program. These tables show comparisons between the outcomes in program cases and both these control groups.
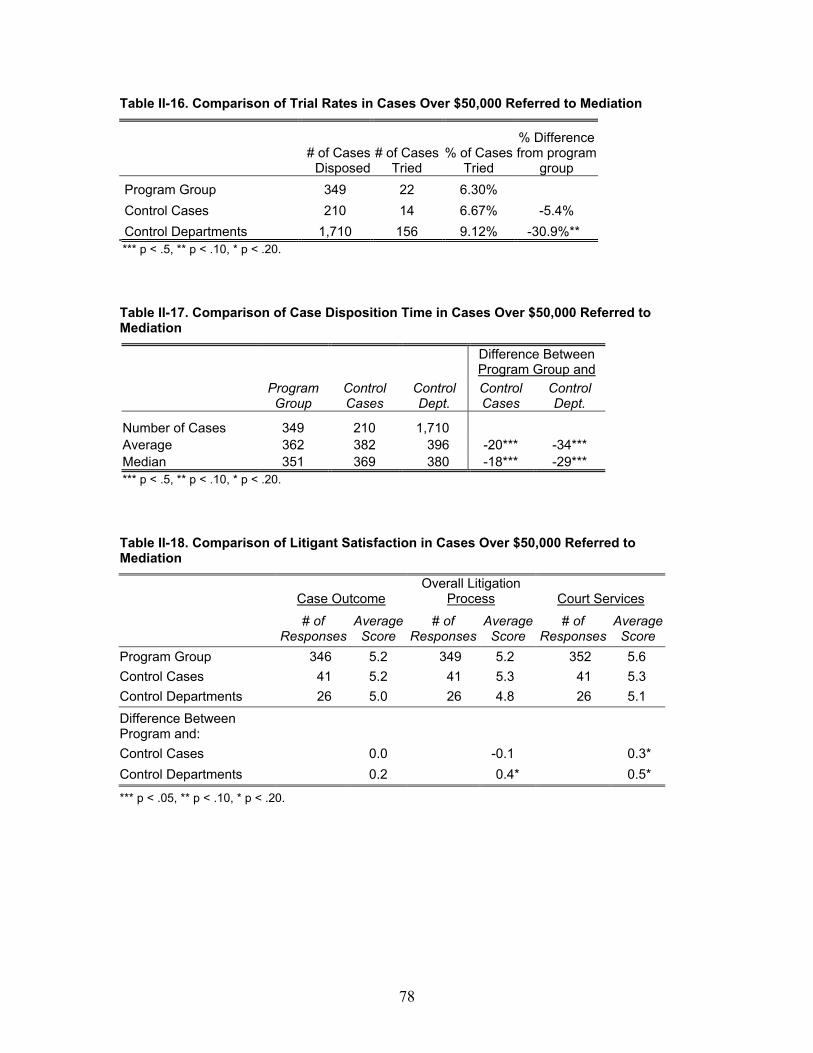
78
Table II-16. Comparison of Trial Rates in Cases Over $50,000 Referred to Mediation
# of Cases
Disposed# of Cases
Tried % of Cases
Tried
% Difference from program
group Program Group 349 22 6.30% Control Cases 210 14 6.67% -5.4% Control Departments 1,710 156 9.12% -30.9%** *** p < .5, ** p < .10, * p < .20.
Table II-17. Comparison of Case Disposition Time in Cases Over $50,000 Referred to Mediation
Difference Between Program Group and
Program Group
Control Cases
Control Dept.
Control Cases
Control Dept.
Number of Cases 349 210 1,710 Average 362 382 396 -20*** -34*** Median 351 369 380 -18*** -29*** *** p < .5, ** p < .10, * p < .20.
Table II-18. Comparison of Litigant Satisfaction in Cases Over $50,000 Referred to Mediation
Case Outcome Overall Litigation
Process Court Services
# of
ResponsesAverage
Score # of
ResponsesAverage
Score # of
Responses Average
Score Program Group 346 5.2 349 5.2 352 5.6 Control Cases 41 5.2 41 5.3 41 5.3 Control Departments 26 5.0 26 4.8 26 5.1 Difference Between Program and: Control Cases 0.0 -0.1 0.3* Control Departments 0.2 0.4* 0.5*
*** p < .05, ** p < .10, * p < .20.
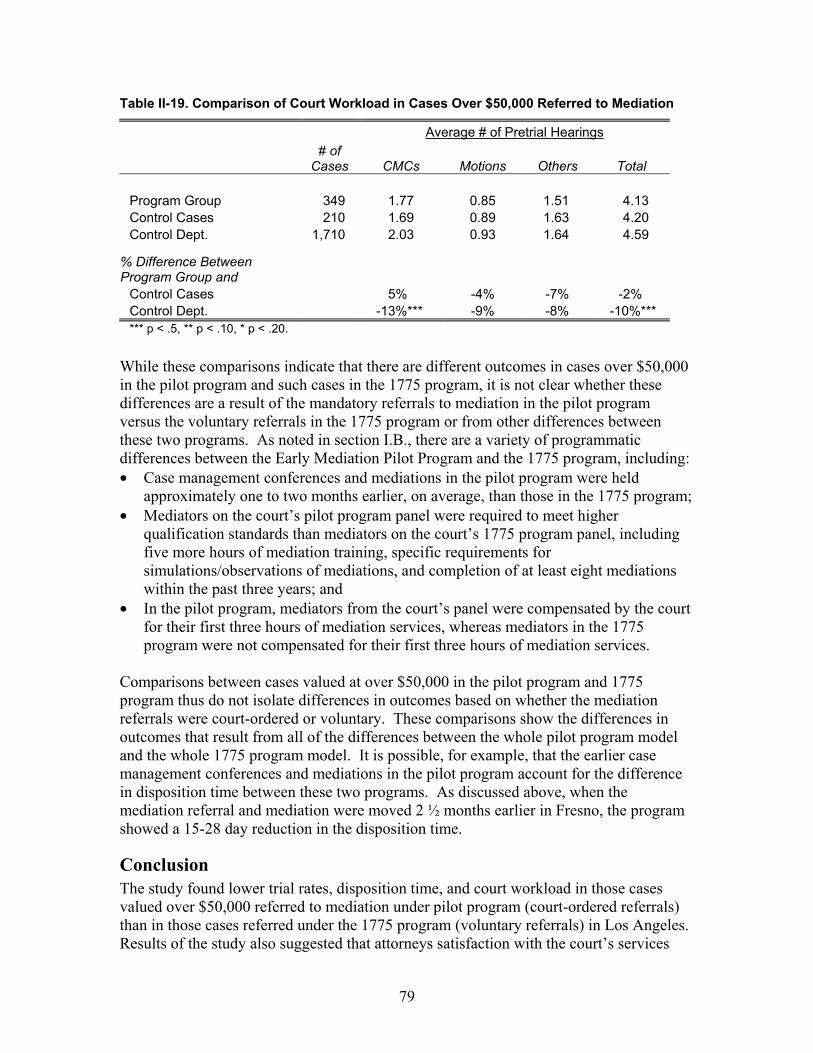
79
Table II-19. Comparison of Court Workload in Cases Over $50,000 Referred to Mediation
Average # of Pretrial Hearings
# of
Cases CMCs Motions Others Total
Program Group 349 1.77 0.85 1.51 4.13 Control Cases 210 1.69 0.89 1.63 4.20 Control Dept. 1,710 2.03 0.93 1.64 4.59
% Difference Between Program Group and
Control Cases 5% -4% -7% -2% Control Dept. -13%*** -9% -8% -10%*** *** p < .5, ** p < .10, * p < .20.
While these comparisons indicate that there are different outcomes in cases over $50,000 in the pilot program and such cases in the 1775 program, it is not clear whether these differences are a result of the mandatory referrals to mediation in the pilot program versus the voluntary referrals in the 1775 program or from other differences between these two programs. As noted in section I.B., there are a variety of programmatic differences between the Early Mediation Pilot Program and the 1775 program, including: • Case management conferences and mediations in the pilot program were held
approximately one to two months earlier, on average, than those in the 1775 program; • Mediators on the court’s pilot program panel were required to meet higher
qualification standards than mediators on the court’s 1775 program panel, including five more hours of mediation training, specific requirements for simulations/observations of mediations, and completion of at least eight mediations within the past three years; and
• In the pilot program, mediators from the court’s panel were compensated by the court for their first three hours of mediation services, whereas mediators in the 1775 program were not compensated for their first three hours of mediation services.
Comparisons between cases valued at over $50,000 in the pilot program and 1775 program thus do not isolate differences in outcomes based on whether the mediation referrals were court-ordered or voluntary. These comparisons show the differences in outcomes that result from all of the differences between the whole pilot program model and the whole 1775 program model. It is possible, for example, that the earlier case management conferences and mediations in the pilot program account for the difference in disposition time between these two programs. As discussed above, when the mediation referral and mediation were moved 2 ½ months earlier in Fresno, the program showed a 15-28 day reduction in the disposition time.
Conclusion The study found lower trial rates, disposition time, and court workload in those cases valued over $50,000 referred to mediation under pilot program (court-ordered referrals) than in those cases referred under the 1775 program (voluntary referrals) in Los Angeles. Results of the study also suggested that attorneys satisfaction with the court’s services

80
and the litigation process may also have been higher in those cases valued over $50,000 referred to mediation under pilot program than under the 1775 program. However, it is not clear whether these differences were due to the mandatory referrals to mediation in the pilot program versus the voluntary referrals under the 1775 program or due to other differences between these two programs, such as the pilot program’s earlier case management conferences and mediations.

81
III. San Diego Pilot Program
A. Summary of Findings Concerning San Diego Pilot Program There is strong evidence that the Early Mediation Pilot Program in San Diego reduced the trial rate, case disposition time, and the court’s workload, improved litigant satisfaction with the court’s services, and lowered litigant costs in cases that resolved at mediation. • Mediation referrals and settlements—7,507 cases that were filed in the Superior
Court of San Diego County in 2000 and 2001 (5,394 unlimited and 2,112 limited) were referred to mediation, and 5,035 of those cases (3,676 unlimited and 1,358 limited cases) were mediated under the pilot program. Of the unlimited cases mediated, 51 percent settled at the mediation and another 7 percent settled later as a direct result of the mediation, for a total resolution rate of approximately 58 percent. Among limited cases, 62 percent settled at mediation and another 14 percent settled later as a direct result of the mediation, for a total resolution rate of approximately 76 percent. In survey responses, 74 percent of attorneys whose cases did not settle at mediation indicated that the mediation was important to the ultimate settlement of the case.
• Trial rate—The trial rates for both limited and unlimited cases in the program group
were reduced by approximately 25 percent compared to those cases in the control group. This reduction translates to a potential saving of more than 500 days per year in judicial time that could be devoted to other cases needing judges’ time and attention. While this time savings does not translate into a fungible cost saving that can be reallocated to other purposes, its monetary value is equivalent to approximately $1.6 million per year.
• Disposition time—The average time to disposition for unlimited cases in the
program group was 12 days shorter than that for cases in the control group and 10 days shorter for limited cases in the program group. The median time to disposition was 19 days shorter for unlimited cases in the program group and 25 days shorter for limited cases in the program group. For unlimited cases, program and control-group cases were disposed of with similar speed from filing until about the time of the case management conference, when the pace of dispositions for program-group cases quickened and the percentage of program-group cases reaching disposition exceeded that of control-group cases. For limited cases, program-group cases were being disposed of faster than control-group cases well before the time of the early case management conference, suggesting that the possibility of attending the conference and being referred to mediation may have increased dispositions. Program-group cases, both unlimited and limited, were disposed of fastest around the time of the mediation. Comparisons with similar cases in the control group confirmed that when program-group cases were settled at mediation, the average disposition time was shorter, but also indicated that when cases were mediated and did not settle at the mediation, the disposition time was longer.
82
• Litigant satisfaction—Attorneys in limited program-group cases were more satisfied with the court’s services than attorneys in limited control-group cases. Attorneys’ levels of satisfaction with the court’s services, the litigation process, and the outcome of the case were all higher in both limited and unlimited program-group cases that settled at mediation than in similar control-group cases. Attorneys in program-group cases that went to mediation and did not settle at mediation were also more satisfied with the court’s services than attorneys in similar control-group cases. This suggests that participating in mediation increased attorneys’ satisfaction with the court’s services, regardless of whether their cases settled at mediation. Both parties and attorneys who participated in pilot program mediations expressed high satisfaction with their mediation experience, particularly with the performance of the mediators. They also strongly agreed that the mediator and the mediation process were fair and that they would recommend both to others.
• Litigant costs—Estimates of actual attorney time spent in reaching resolution were
16 percent lower in program-group cases that settled at mediation than for similar cases in the control group. Comparisons between program-group cases that settled at mediation and similar control-group cases also suggested that litigant costs were lower in program-group cases that settled at mediation. In cases that settled at mediation, 87 percent of attorneys responding to the study survey estimated some savings in both litigant costs and attorney hours from using mediation to reach settlement. Average savings estimated by attorneys per settled case was $9,159 in litigant costs and 50 hours in attorney time. Based on these attorney estimates, the total estimated savings in litigant costs in all 2000 and 2001 cases that settled at mediation was $24,784,254 and the total estimated savings in attorney hours was 135,300.
• Court workload— The pilot program in San Diego reduced the court’s workload. In
addition to the reduction in trials discussed above, the pilot program reduced the average number of pretrial hearings by 16 percent for unlimited cases and 22 percent for limited cases in the program group. This translates to a potential saving of 479 days per year in judicial time that could be devoted to other cases needing judges’ time and attention. While this time savings does not translate into a fungible cost saving that can be reallocated to other purposes, its monetary value is equivalent to approximately $1.4 million per year. There was strong evidence of even larger reductions in pretrial events—between 40 and 45 percent—in cases that resolved at mediation. In addition, there were fewer postdisposition compliance problems and fewer new proceedings initiated in program-group cases, suggesting that the pilot program may have reduced the court’s future workload.
83
B. Introduction This section of the report discusses the study’s findings concerning the Early Mediation Pilot Program in the Superior Court of San Diego County. Based on the criteria established by the Early Mediation Pilot Program legislation, this was a highly successful program, resulting in benefits to both litigants and the courts in the form of lower trial rates, reduced disposition time, improved litigant satisfaction with the court’s services and the litigation process, fewer pretrial court events, and lower litigant costs in cases that resolved at mediation. As further discussed below in the program description, the San Diego pilot program included five main elements: • Information about the pilot program was required to be distributed to litigants at the
time of filing; • The court held an initial case management conference approximately five months
after filing to assess the case’s amenability to early mediation; • The court had the authority to order litigants to participate in early mediation; • Litigants in cases that were referred to mediation were required to complete
mediation within 60–90 days of the mediation order or stipulation; and • If litigants selected a mediator from the court’s panel, the court paid the mediator for
up to four hours of mediation services. For purposes of this study, at the time of filing the court divided the cases that met the general pilot program eligibility requirements into two groups: 75 percent of eligible cases were designated as “program-group” cases, and the remaining 25 percent were designated as “control-group” cases. “Program-group” cases were exposed to one or more of the program elements described above, including consideration for possible referral to mediation under the pilot program; “control-group” cases were not exposed to any of these program elements. Comparisons of the disposition time, litigant satisfaction, and other outcome measures between the program group and the control group show the overall impact of implementing this pilot program, with all of its program elements, in the Superior Court of San Diego County. It is important to remember that, throughout this section, “program group” means cases exposed to any of the pilot program elements; it does not mean cases that were referred to mediation or cases that were mediated. The program group includes cases that participated in the early case management conference but were not referred to mediation. It also includes cases that were referred to mediation but that ultimately did not go to mediation, either because they were later removed from the mediation track by the court or because they settled before the mediation took place. In is also important to remember that program-group cases exposed to different pilot program elements had very different dispute resolution experiences and different outcomes in terms of the areas being studied (disposition time, litigant satisfaction, and the other outcomes). In overall comparisons, the outcomes in all these subgroups of program-group cases were added together to calculate an overall average for the program
84
group as a whole. As a result, within these overall averages, positive outcomes in some subgroups of cases, such as shorter disposition time in cases that settled at mediation, were often offset by less positive outcomes in other subgroups. To provide a better understanding of how program-group cases in these subgroups may have been influenced by their exposure to different pilot program elements, comparisons were made between cases in these subgroups and control-group cases with similar case characteristics. Readers who are interested in the impacts of specific pilot program elements, such as the early mediation process, should pay particular attention to these subgroup analyses. Finally, it is important to remember that the emphasis in this pilot program was on early referral to and early participation in mediation: cases were referred to mediation approximately five months after filing and went to mediation approximately eight months after filing. Thus, this study addresses only how cases responded to such early referrals and early mediation. It does not address how cases might have responded to later referrals or later mediation.
85
C. San Diego Pilot Program Description This section provides a brief description of the Superior Court of San Diego County and its Early Mediation Pilot Program. This description is intended to provide context for understanding the study findings presented later in this chapter.
The Court Environment in San Diego San Diego is a large urban county with a population of approximately 2.8 million. With 128 authorized judgeships the Superior Court of San Diego County is one of the largest trial courts in California. In 2000, the year that the pilot program began, approximately 13,000 unlimited general civil cases and 34,000 limited civil cases were filed in the Superior Court of San Diego County.122 The Superior Court of San Diego County has had a long-standing focus on efficiently managing civil litigation and reducing delay in civil case processing. The court has dedicated 24 of its 128 judges (“departments”) to handling general civil cases. Upon filing, all general civil cases, both limited and unlimited, are assigned, at random, to one of these 24 departments. The court uses an individual calendaring system: the same judge handles all aspects of a case from filing through disposition. Before the court implemented the pilot program, these judges used a system of case management conferences, with the first conference set approximately 150 days after filing, to establish a schedule for trial and other relevant court events. The court historically has disposed of civil cases relatively quickly: in 1999, the year before the Early Mediation Pilot Program was implemented, the court disposed of approximately 76–79 percent of its unlimited civil cases within one year of filing, 94–95 percent within 18 months, and 98 percent within two years of filing. Similarly, the court disposed of 91 percent of its limited civil cases within one year of filing, 96–97 percent within 18 months, and 97–99 percent within 24 months. From 1994 until it implemented the pilot program in 2000, the Superior Court of San Diego County had a mandatory mediation program for civil cases valued at $50,000 or less.123 Under this program, judges were authorized to order the parties in these smaller-valued cases to participate in mediation as an alternative to court-annexed nonbinding arbitration (called “judicial arbitration”). The court compensated the mediators in this program at a rate of $150 per case. In 1998, the court referred 831 cases to mediation under this program. Thus, both the court and the local bar had prior experience with mandatory court-ordered mediation of civil cases before the pilot program began.
122 Judicial Council of Cal., Admin. Off. of Cts., Rep. on Court Statistics (2001) Fiscal Year 1990–1991 Through 1999–2000 Statewide Caseload Trends, p. 46. See the glossary for definitions of “unlimited civil case,” “limited civil case,” and “general civil case.” 123 This program was authorized by Code of Civil Procedure section 1775 et seq.
86
The Early Mediation Pilot Program Model Adopted in San Diego
The General Program Model The Superior Court of San Diego County adopted a mandatory mediation model for its pilot program. As noted in the introduction, under the Early Mediation Pilot Program statutes, judges in courts with mandatory mediation programs were given statutory authority to order eligible cases to mediation. The program implemented in San Diego included the following basic elements: • Information about the pilot program was required to be distributed to litigants at the
time of filing; • The court set an early case management conference approximately 120 days after
filing in at-issue cases to assess the case’s amenability to mediation (on average, with resets, these conferences actually took place at approximately 150 days after filing);
• The court had the authority to order litigants to participate in early mediation; • Litigants in cases that were referred to mediation were required to complete
mediation within 60–90 days of the mediation order or stipulation; and • If litigants selected a mediator from the court’s panel, the court paid the mediator for
up to four hours of mediation services.
What Cases Were Eligible for the Program Most general civil cases,124 both limited and unlimited, were eligible for the San Diego pilot program. General civil cases that were not eligible for the program included complex cases (such as construction defect cases) and class actions.
How Cases Were Assigned to the Program and Control Groups As noted above in the introduction, for purposes of this study, the Judicial Council required the pilot courts implementing a mandatory mediation program model to provide for random assignment of a portion of eligible cases to a “program group” and another portion to a “control group.” “Program-group” cases were exposed to one or more of the program elements described above; “control-group” cases were not exposed to any of these program elements but were otherwise subject to the same court procedures as the cases in the program group. As noted above, it is important to remember that, throughout this section, “program group” means cases exposed to any of the pilot program elements, including consideration of possible referral to early mediation; it does not mean only cases that were referred to mediation or cases that were mediated. Under San Diego’s model, 75 percent of all cases that met the basic eligibility criteria for the program were randomly assigned to the program group at the time of filing, and the remaining 25 percent were assigned to the control group. The court accomplished this by designating 18 of its 24 general civil departments as program departments and designating the remaining 6 departments as control departments. Cases assigned to a program department were in the “program group;” cases assigned to a control department were in the “control group.”
124 See the glossary for a definition of “general civil cases.”
87
How Cases Were Referred to Mediation Only cases in which the defendant responded to the complaint (cases that became “at issue”) were eligible for referral to mediation. Mediation requires participation of both sides to a case. This participation is not possible if the defendant has not responded to the complaint. As in all the pilot courts, a large percentage of eligible cases in San Diego (approximately 30 percent of unlimited and 70 percent of limited cases) never became at issue and thus were not eligible for referral to mediation. As noted above, at the time of filing, plaintiffs whose cases were assigned to the program group were given information about the mediation program and were required to serve this information on all defendants along with the summons and complaint. This information included notice that they might be required to attend an early case management conference approximately 120 days after filing. All program cases that were at issue within 90–105 days after filing were set for an early case management conference. If the case was not at issue at that time, it was set for a regular case management conference. On average, early case management conferences took place 153 days after filing; the median time was 136 days after filing.125 On average, regular case management conferences took place 209 days after filing; the median time was 186 days after filing. The information package given to parties at filing notified them that they could stipulate to mediation before the case management conference and that, if they filed such a stipulation, they would not be required to attend the conference. The information packet also included a blank mediation stipulation form. Approximately 15 percent of the cases ultimately referred to mediation during the study period were cases in which the parties stipulated to mediation before the scheduled case management conference. If parties did not stipulate to mediation, they were required to attend the case management conference. At this conference, the assigned judge conferred with the parties about mediation and other alternative dispute resolution (ADR) options and considered whether to order the case to mediation. Under the Early Mediation Pilot Program statutes, the court was required to consider the willingness of the parties to mediate in determining whether to refer a case to mediation. The court also had experience with mandatory referrals under its previous mediation program and had developed an appreciation for the need to assess party interests rather than unilaterally ordering cases to mediation. In focus-group discussions conducted in San Diego as part of this study, both judges and attorneys indicated that the litigants’ willingness to participate in mediation was very important to the decision to make a referral to mediation under the pilot program; they indicated that cases were rarely ordered to mediation over the parties’ objections. Thus, while the pilot program in San Diego was mandatory in design, the wishes of the litigants played an important role in the mediation referral process, just as they would in a voluntary program. Approximately 85 percent of
125 These average and median times are the times that the conferences were actually held, not the originally scheduled dates. Conferences originally set for closer to 120 days after filing may have been subsequently reset.
88
the cases ultimately referred to mediation during the study period were referred at the case management conference. At the case management conference, the court, in addition to making referrals to mediation, set dates for trials and other litigation events should the case not settle at mediation. Program-group cases that were not referred to mediation under the pilot program (as well as control-group cases) could be referred to judicial arbitration or settlement conferences within the court or could choose to use private mediation or other ADR processes outside the court.
How Mediators Were Selected and Compensated When a case was referred to mediation, either by court order or by party stipulation, parties were required to select a mediator and two alternates. Parties were free to select any mediator, whether or not that mediator was from the court’s panel. However, the Early Mediation Pilot Program statutes provided that, if parties selected a mediator from the court’s panel, they would not be required to pay a fee for the mediator’s services. Thus, the parties could receive up to four hours of mediation services at no cost to them if they selected a mediator from the court’s panel. A majority of the mediations were conducted by mediators from the court’s panel. Mediators on the court panel were required to complete 30 hours of mediation training, to have conducted at least eight mediations (four of these in the civil arena) in the past two years, participate in at least four hours of continuing mediation education annually, and adhere to the court’s ethical standards for mediators. Under the pilot program, the court paid its panel mediators for the first four hours of mediation services at a fixed hourly rate of $150. At the end of this four-hour period, the parties were free to continue the mediation on a voluntary basis, but the parties were responsible for paying the mediator for these additional services at that mediator’s individual market rate.
When Mediation Sessions Were Held If parties stipulated to mediation, the mediation was required to be completed within 60 days of the stipulation. If the parties were ordered to mediation, the mediation was required to be completed within 60–90 days of the court’s order. If the mediation completion date was originally set at 60 days, the mediator was given the authority to grant the parties a 30-day extension of the completion date for good cause. If the parties wanted an extension beyond the 90-day period, they were required to request this extension, by an ex parte appearance or by stipulation, from the judge to whom the case was assigned. On average, mediations in both limited and unlimited cases took place approximately eight months after filing.
What Happened After the Mediation At the conclusion of the mediation, the mediator was required to submit a form to the court indicating whether the case was fully resolved, partially resolved, or not resolved at the mediation session. If the mediator indicated that the case was fully resolved at the mediation, the court placed the case on a 45-day dismissal track and notified the parties. If the mediator indicated that the case was not resolved or only partially resolved or that
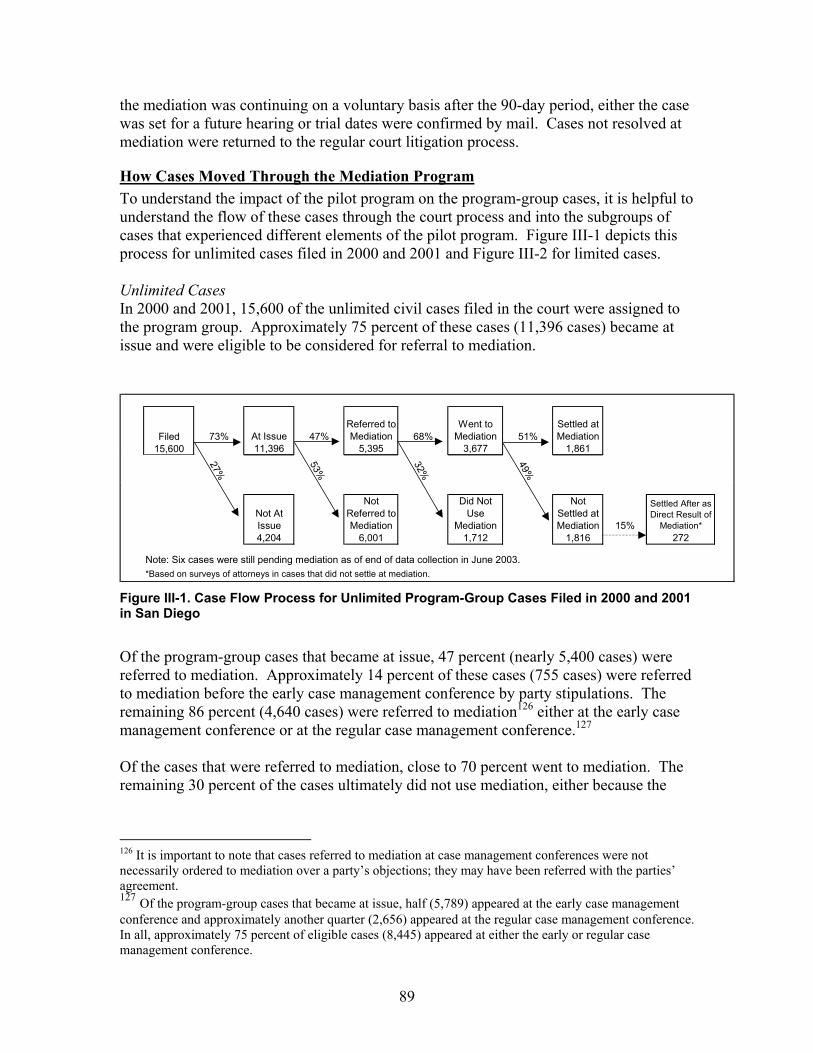
89
the mediation was continuing on a voluntary basis after the 90-day period, either the case was set for a future hearing or trial dates were confirmed by mail. Cases not resolved at mediation were returned to the regular court litigation process.
How Cases Moved Through the Mediation Program To understand the impact of the pilot program on the program-group cases, it is helpful to understand the flow of these cases through the court process and into the subgroups of cases that experienced different elements of the pilot program. Figure III-1 depicts this process for unlimited cases filed in 2000 and 2001 and Figure III-2 for limited cases. Unlimited Cases In 2000 and 2001, 15,600 of the unlimited civil cases filed in the court were assigned to the program group. Approximately 75 percent of these cases (11,396 cases) became at issue and were eligible to be considered for referral to mediation.
Figure III-1. Case Flow Process for Unlimited Program-Group Cases Filed in 2000 and 2001 in San Diego
Of the program-group cases that became at issue, 47 percent (nearly 5,400 cases) were referred to mediation. Approximately 14 percent of these cases (755 cases) were referred to mediation before the early case management conference by party stipulations. The remaining 86 percent (4,640 cases) were referred to mediation126 either at the early case management conference or at the regular case management conference.127 Of the cases that were referred to mediation, close to 70 percent went to mediation. The remaining 30 percent of the cases ultimately did not use mediation, either because the
126 It is important to note that cases referred to mediation at case management conferences were not necessarily ordered to mediation over a party’s objections; they may have been referred with the parties’ agreement. 127 Of the program-group cases that became at issue, half (5,789) appeared at the early case management conference and approximately another quarter (2,656) appeared at the regular case management conference. In all, approximately 75 percent of eligible cases (8,445) appeared at either the early or regular case management conference.
Filed 73% At Issue 47%Referred to Mediation 68%
Went to Mediation 51%
Settled at Mediation
15,600 11,396 5,395 3,677 1,861
27%
53%
32%
49%
Not At Issue
Not Referred to Mediation
Did Not Use
Mediation
Not Settled at Mediation 15%
Settled After as Direct Result of
Mediation*4,204 6,001 1,712 1,816 272
Note: Six cases were still pending mediation as of end of data collection in June 2003.*Based on surveys of attorneys in cases that did not settle at mediation.
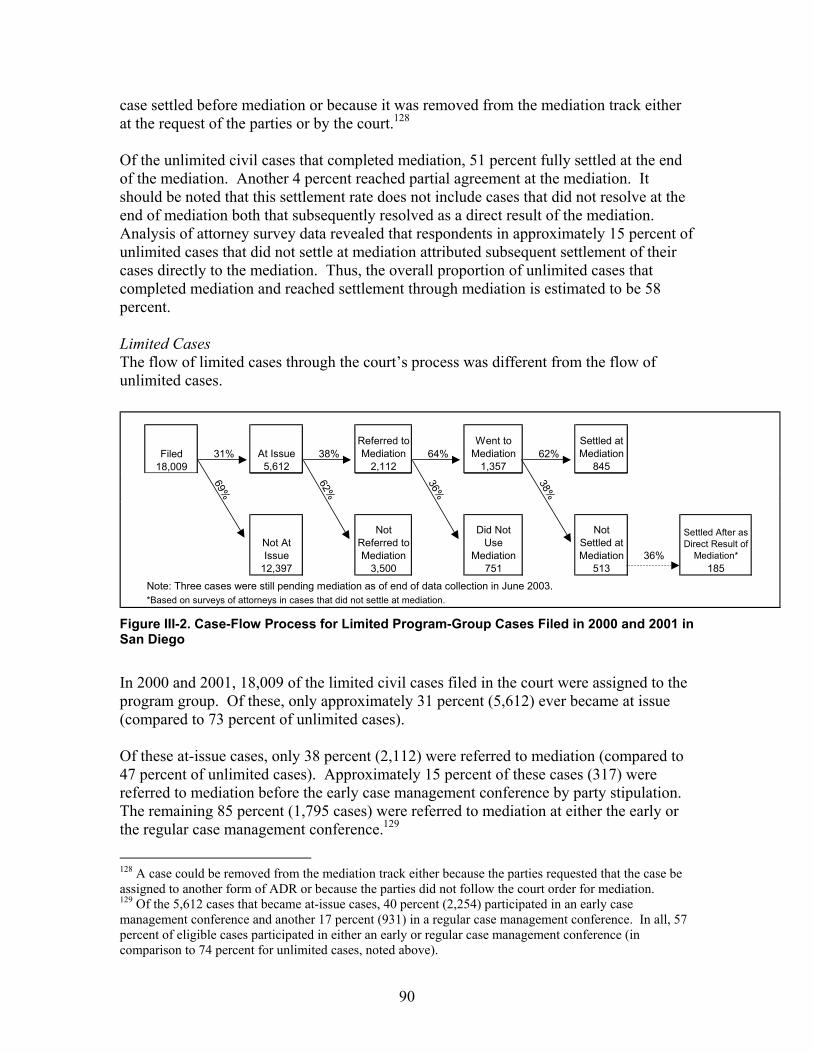
90
case settled before mediation or because it was removed from the mediation track either at the request of the parties or by the court.128 Of the unlimited civil cases that completed mediation, 51 percent fully settled at the end of the mediation. Another 4 percent reached partial agreement at the mediation. It should be noted that this settlement rate does not include cases that did not resolve at the end of mediation both that subsequently resolved as a direct result of the mediation. Analysis of attorney survey data revealed that respondents in approximately 15 percent of unlimited cases that did not settle at mediation attributed subsequent settlement of their cases directly to the mediation. Thus, the overall proportion of unlimited cases that completed mediation and reached settlement through mediation is estimated to be 58 percent. Limited Cases The flow of limited cases through the court’s process was different from the flow of unlimited cases.
Figure III-2. Case-Flow Process for Limited Program-Group Cases Filed in 2000 and 2001 in San Diego
In 2000 and 2001, 18,009 of the limited civil cases filed in the court were assigned to the program group. Of these, only approximately 31 percent (5,612) ever became at issue (compared to 73 percent of unlimited cases). Of these at-issue cases, only 38 percent (2,112) were referred to mediation (compared to 47 percent of unlimited cases). Approximately 15 percent of these cases (317) were referred to mediation before the early case management conference by party stipulation. The remaining 85 percent (1,795 cases) were referred to mediation at either the early or the regular case management conference.129
128 A case could be removed from the mediation track either because the parties requested that the case be assigned to another form of ADR or because the parties did not follow the court order for mediation. 129 Of the 5,612 cases that became at-issue cases, 40 percent (2,254) participated in an early case management conference and another 17 percent (931) in a regular case management conference. In all, 57 percent of eligible cases participated in either an early or regular case management conference (in comparison to 74 percent for unlimited cases, noted above).
Filed 31% At Issue 38%Referred to Mediation 64%
Went to Mediation 62%
Settled at Mediation
18,009 5,612 2,112 1,357 845
69%
62%
36%
38%
Not At Issue
Not Referred to Mediation
Did Not Use
Mediation
Not Settled at Mediation 36%
Settled After as Direct Result of
Mediation*12,397 3,500 751 513 185
Note: Three cases were still pending mediation as of end of data collection in June 2003.*Based on surveys of attorneys in cases that did not settle at mediation.
91
Approximately 65 percent of the limited cases referred to mediation went to mediation, which was similar to the 68 percent rate for unlimited cases. Of those limited cases that completed mediation, 62 percent reached agreement at the end of mediation (compared to 51 percent of unlimited cases). In addition, in survey responses, 36 percent of attorneys whose cases did not settle at the mediation attributed subsequent settlement of their cases directly to mediation. Thus, the overall proportion of limited cases completing mediation that reached settlement through mediation is estimated to be 76 percent (compared to 58 percent for unlimited cases).
Conclusion As noted in the introduction to this report, each of the pilot mediation programs examined in this study is different. In reviewing the results for the San Diego pilot program, please keep in mind the unique characteristics of this court and its pilot program, including that the program group includes cases that were not referred to mediation.

92
D. Data and Methods Used in Study of San Diego Pilot Program This section provides a brief description of the data and methods used in the analysis of the San Diego pilot program. (See Section I.B. for more information on the overall data and methods used in this report.)
Data Several data sources were used in this study of the San Diego Pilot Program.
Data on Trial Rate, Disposition Time, and Court Workload As more fully described in Section I.B., the primary source of data for assessing the pilot program’s impact on trial rate, disposition time, and court workload was the court’s case management system. Only data concerning cases filed in 2000130 and 2001 were used; cases filed more recently were not used because there was not sufficient follow-up time for tracking their final outcomes. As noted above, civil cases in Superior Court of San Diego County are disposed of in a relatively short time. Of the cases examined in this study, 97 percent of unlimited cases and 99 percent of limited cases in both the program and control groups had reached disposition by the end of data collection in June 2003. This high disposition rate enhances the overall reliability of the study’s results; the final outcomes of almost all the cases in the study group are known so the study results are unlikely to be affected by the ultimate outcomes in the small remaining percentage of cases that had not yet reached disposition. The overall size of the court’s civil caseload also contributes to the reliability of the study’s results. The court’s large civil caseload ensured that there were enough cases in both the program and control groups to make reliable comparisons.
Data on Litigant Satisfaction and Costs As more fully described in Section I.B., analysis of program impact on litigant satisfaction and costs was based on data from surveys distributed (1) to attorneys and parties who went to mediation between July 2001 and June 2002 (“postmediation survey”) and (2) to parties and attorneys in program and control-group cases that reached disposition during the same period (“postdisposition survey”).131 130 When the program started operation in March 2000, only cases that were filed on or after February 28, 2000, were eligible for the program. Therefore, only cases filed after that date were included in the sample, and all references to 2000 cases in San Diego in this report represent the case filed from February 28 to December 31. 131 It should be noted that approximately 25 percent of the attorneys who responded to the postdisposition survey in San Diego did not provide valid information on litigant costs and attorney hours. To ensure that there were no systematic differences in the cost information that was provided between cases in the program group and the control group, the proportions of responses in the program and control groups were compared. In addition, to ensure there were no systematic differences between the cases in which cost information was provided and the general population of cases eligible for the program, the proportions of responses coming from cases of different types were compared to the proportions of cases of these types in the general population of eligible cases. These comparisons did not reveal any systematic differences.
93
Methods Several methods were used in the study of the San Diego pilot program.
Comparisons of Outcomes in Program and Control-Group Cases As is more fully described in Section 1.B., the main method of analysis used to study the San Diego pilot program was direct comparison of the outcomes in the program group and the control group. As noted above, cases were assigned to the program group and control group in San Diego through a random assignment process generated automatically by the case management system. Because this assignment process ensured that the characteristics of the cases in the program group and control group would be similar, differences found in direct comparisons between these groups can reliably be attributed to impact from the pilot program.132 It is important to remember that comparisons between the program group and control group in San Diego identify the impact of the pilot program as a whole, not just the impact of mediation. As discussed above in the pilot program description, San Diego’s pilot program had many elements, including the distribution of information about the mediation program, the possibility of an early case management conference, the possibility of being ordered to early mediation, and the possibility of participating in the mediation process itself. Not every case in the program group was mediated. The program group is made up of subgroups of cases that experienced different elements of the pilot program—that is, cases that participated in an early case management conference but were not referred to mediation; cases that were referred to mediation but did not experience mediation, either because they settled before mediation or were removed from the mediation track; and cases that actually went through mediation and either settled or did not settle at mediation. In overall comparisons between the program group and control group, the program group includes all of these different subgroups of cases put together. To help understand this, the discussion of each of the outcome measures beings studied (disposition time, litigant satisfaction, and so forth) starts with a table showing the average outcome score in each subgroup and in the program group as a whole.
Analysis of Subgroups of Cases Within the Program Group While the average outcome score for each subgroup provides helpful descriptive information, comparisons between the average scores in different subgroups or between the subgroups and the control group as a whole do not provide accurate information about 132 While case assignment to departments was completely random, the selection of the judges in the program and control departments was not. Instead, judges were selected to participate in the program based on their prior experience with mediation. In general, judges in the program were more familiar with the process of mediation. To ensure that differences in case outcomes between the program and control groups were not due to any preexisting differences between the judges in the program and control departments, an analysis was done of case outcomes in historical cases that were filed one year prior to the inception of the program. No patterns were found in the historical data that would call into question the study’s findings regarding the program impact: trial rates in the control-group departments prior to the inception of the program were the same, the time to disposition in the control departments was slightly faster than in program departments prior to the program, and the number of hearings was slightly higher. In 2000, all three measures improved in the program group compared to the control group.
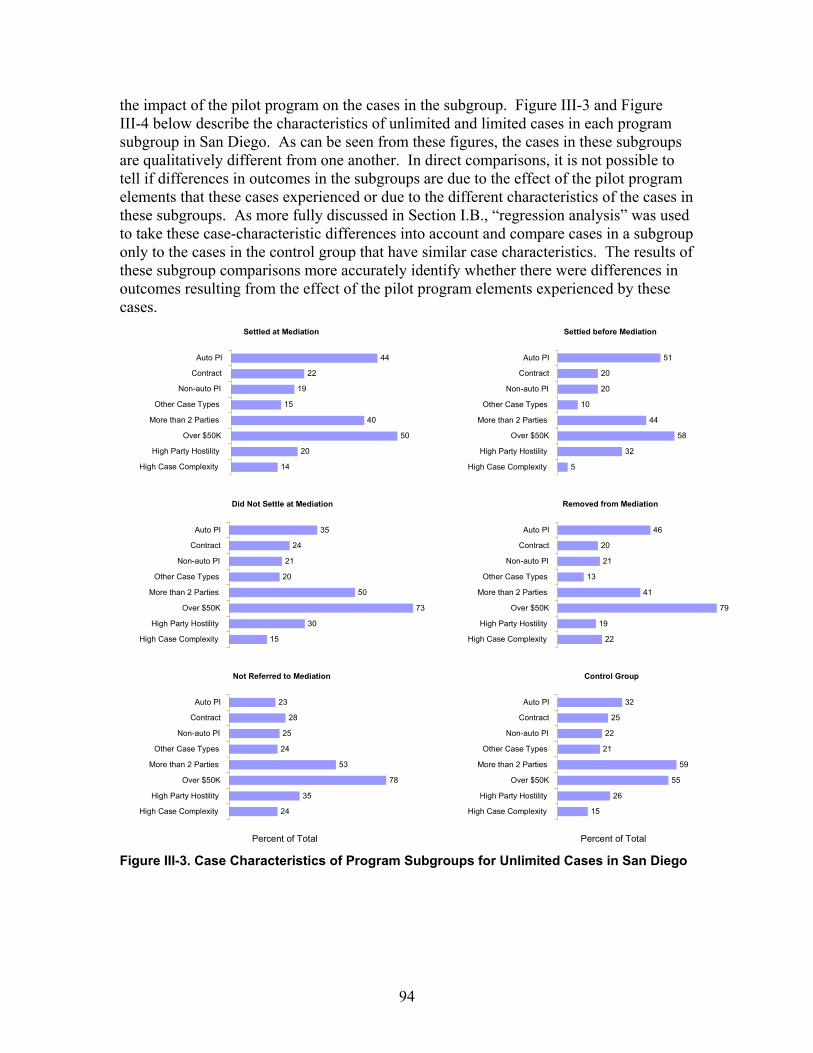
94
the impact of the pilot program on the cases in the subgroup. Figure III-3 and Figure III-4 below describe the characteristics of unlimited and limited cases in each program subgroup in San Diego. As can be seen from these figures, the cases in these subgroups are qualitatively different from one another. In direct comparisons, it is not possible to tell if differences in outcomes in the subgroups are due to the effect of the pilot program elements that these cases experienced or due to the different characteristics of the cases in these subgroups. As more fully discussed in Section I.B., “regression analysis” was used to take these case-characteristic differences into account and compare cases in a subgroup only to the cases in the control group that have similar case characteristics. The results of these subgroup comparisons more accurately identify whether there were differences in outcomes resulting from the effect of the pilot program elements experienced by these cases.
Figure III-3. Case Characteristics of Program Subgroups for Unlimited Cases in San Diego
Percent of Total Percent of Total
Settled at Mediation
14 20
50
40
15 19
22 44
High Case Complexity High Party Hostility
Over $50K More than 2 Parties
Other Case Types Non-auto PI
Contract Auto PI
Settled before Mediation
5 32
58
44
10 20 20
51
High Case Complexity
High Party Hostility
Over $50K
More than 2 Parties
Other Case Types
Non-auto PI
Contract
Auto PI
Did Not Settle at Mediation
15 30
73
50
20 21
24 35
High Case Complexity High Party Hostility
Over $50K More than 2 Parties
Other Case Types Non-auto PI
Contract Auto PI
Removed from Mediation
22 19
79
41 13
21 20
46
High Case Complexity
High Party Hostility
Over $50K
More than 2 Parties
Other Case Types
Non-auto PI
Contract
Auto PI
Not Referred to Mediation
24 35
78
53
24 25
28 23
High Case Complexity High Party Hostility
Over $50K More than 2 Parties
Other Case Types Non-auto PI
Contract Auto PI
Control Group
15 26
55
59
21 22
25 32
High Case Complexity
High Party Hostility
Over $50K
More than 2 Parties
Other Case Types
Non-auto PI
Contract
Auto PI
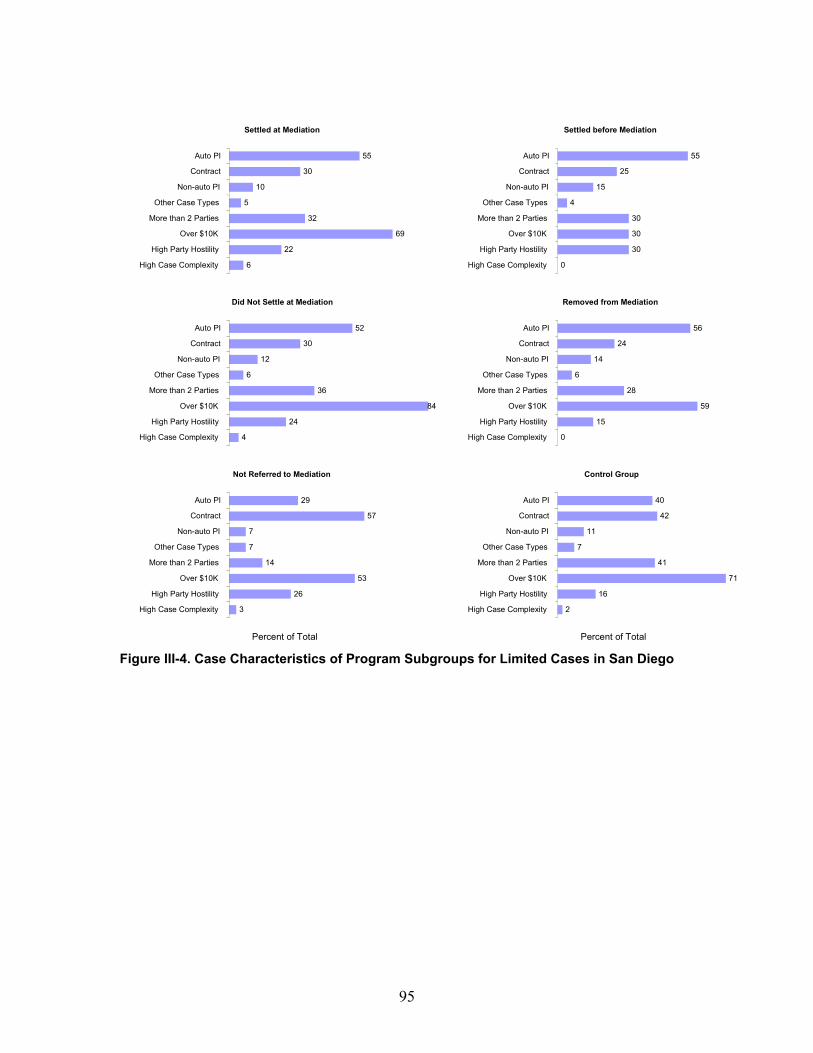
95
Figure III-4. Case Characteristics of Program Subgroups for Limited Cases in San Diego
Percent of Total Percent of Total
Settled at Mediation
6 22
69
32 5
10 30
55
High Case Complexity High Party Hostility
Over $10K More than 2 Parties
Other Case Types Non-auto PI
Contract Auto PI
Removed from Mediation
0
15 59
28 6
14 24
56
High Case Complexity
High Party Hostility
Over $10K
More than 2 Parties
Other Case Types
Non-auto PI
Contract
Auto PI
Settled before Mediation
0
30 30 30
4 15
25 55
High Case Complexity
High Party Hostility
Over $10K
More than 2 Parties
Other Case Types
Non-auto PI
Contract
Auto PI
Not Referred to Mediation
3
26 53
14 7 7
57
29
High Case Complexity High Party Hostility
Over $10K More than 2 Parties
Other Case Types Non-auto PI
Contract Auto PI
Did Not Settle at Mediation
4 24
84
36 6
12 30
52
High Case Complexity High Party Hostility
Over $10K More than 2 Parties
Other Case Types Non-auto PI
Contract Auto PI
Control Group
2
16 71
41
7 11
42
40
High Case Complexity
High Party Hostility
Over $10K
More than 2 Parties
Other Case Types
Non-auto PI
Contract
Auto PI
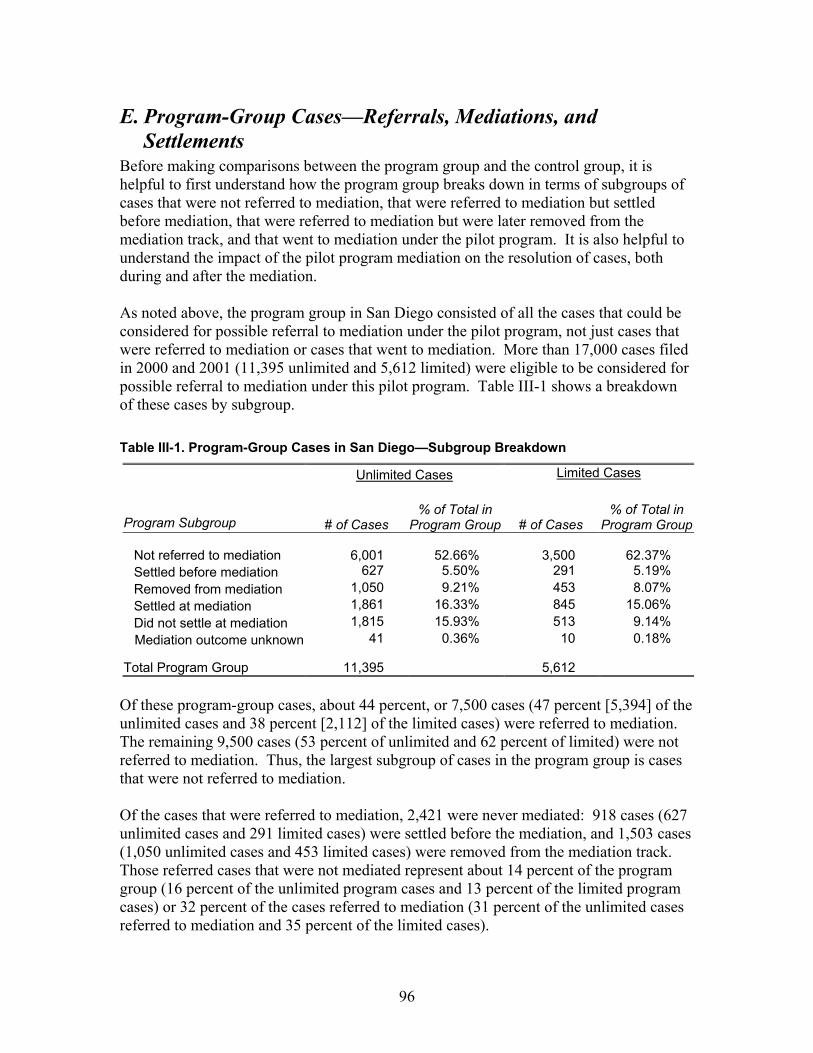
96
E. Program-Group Cases—Referrals, Mediations, and Settlements
Before making comparisons between the program group and the control group, it is helpful to first understand how the program group breaks down in terms of subgroups of cases that were not referred to mediation, that were referred to mediation but settled before mediation, that were referred to mediation but were later removed from the mediation track, and that went to mediation under the pilot program. It is also helpful to understand the impact of the pilot program mediation on the resolution of cases, both during and after the mediation. As noted above, the program group in San Diego consisted of all the cases that could be considered for possible referral to mediation under the pilot program, not just cases that were referred to mediation or cases that went to mediation. More than 17,000 cases filed in 2000 and 2001 (11,395 unlimited and 5,612 limited) were eligible to be considered for possible referral to mediation under this pilot program. Table III-1 shows a breakdown of these cases by subgroup. Table III-1. Program-Group Cases in San Diego—Subgroup Breakdown
Unlimited Cases Limited Cases
Program Subgroup # of Cases % of Total in
Program Group # of Cases % of Total in
Program Group
Not referred to mediation 6,001 52.66% 3,500 62.37% Settled before mediation 627 5.50% 291 5.19% Removed from mediation 1,050 9.21% 453 8.07% Settled at mediation 1,861 16.33% 845 15.06% Did not settle at mediation 1,815 15.93% 513 9.14%
Mediation outcome unknown 41 0.36% 10 0.18%
Total Program Group 11,395
5,612 Of these program-group cases, about 44 percent, or 7,500 cases (47 percent [5,394] of the unlimited cases and 38 percent [2,112] of the limited cases) were referred to mediation. The remaining 9,500 cases (53 percent of unlimited and 62 percent of limited) were not referred to mediation. Thus, the largest subgroup of cases in the program group is cases that were not referred to mediation. Of the cases that were referred to mediation, 2,421 were never mediated: 918 cases (627 unlimited cases and 291 limited cases) were settled before the mediation, and 1,503 cases (1,050 unlimited cases and 453 limited cases) were removed from the mediation track. Those referred cases that were not mediated represent about 14 percent of the program group (16 percent of the unlimited program cases and 13 percent of the limited program cases) or 32 percent of the cases referred to mediation (31 percent of the unlimited cases referred to mediation and 35 percent of the limited cases).

97
A total of 5,035 cases (3,676 unlimited cases and 1,358 limited cases) went to mediation under the pilot program; this represents approximately 30 percent of the program group (32 percent of the unlimited program cases and 24 percent of the limited program cases) or 67 percent of the cases that were referred to mediation (68 percent of the unlimited cases that were referred to mediation and 64 percent of the limited cases). As shown in Table III-2, of the unlimited cases that were mediated, 1,861 cases (approximately 51 percent) reached full agreement at the mediation, and another 165 cases (approximately 4 percent) reached partial agreement at the mediation. Of the limited cases that were mediated, 845 (62 percent) reached full agreement at mediation and another 34 cases (approximately 3 percent) reached partial agreement at the mediation. Table III-2. Proportion of Program-Group Cases Settled at Mediation in San Diego
Unlimited Limited
# of
Cases % of Mediated
Cases # of Cases% of Mediated
Cases Agreement 1,861 50.68% 845 62.22% Partial agreement 165 4.49% 34 2.50% Nonagreement 1,650 44.89% 479 35.27% Total 3,676 100.00% 1,358 100.00% Even when cases did not reach settlement at mediation, the mediation was still likely to have played an important role, either in the later settlement of the cases or in other ways. Table III-3 shows that approximately 20 percent of attorneys in cases that were mediated under the pilot program but did not reach settlement at mediation indicated that the ultimate settlement of the case was a direct result of participating in the pilot program mediation.133 Another 27 percent indicated that mediation played a very important role, and still another 27 percent indicated that mediation was somewhat important to the ultimate settlement of the case. All together, attorneys responding to the survey indicated that subsequent settlement of the case benefited from mediation in approximately 74 percent of the cases in which the parties did not reach agreement at the end of the mediation session. Only 26 percent of the survey respondents indicated that mediation was of “little importance” to the case reaching settlement. Focus-group discussions with attorneys in San Diego also confirmed benefits even in cases that did not settle at the mediation. Attorneys in these focus groups indicated that they always received something out of the mediation process, even when cases did not settle, including increased client involvement and earlier information exchange.
133 Data from both limited and unlimited cases were combined in order to provide a larger number of cases for this analysis.
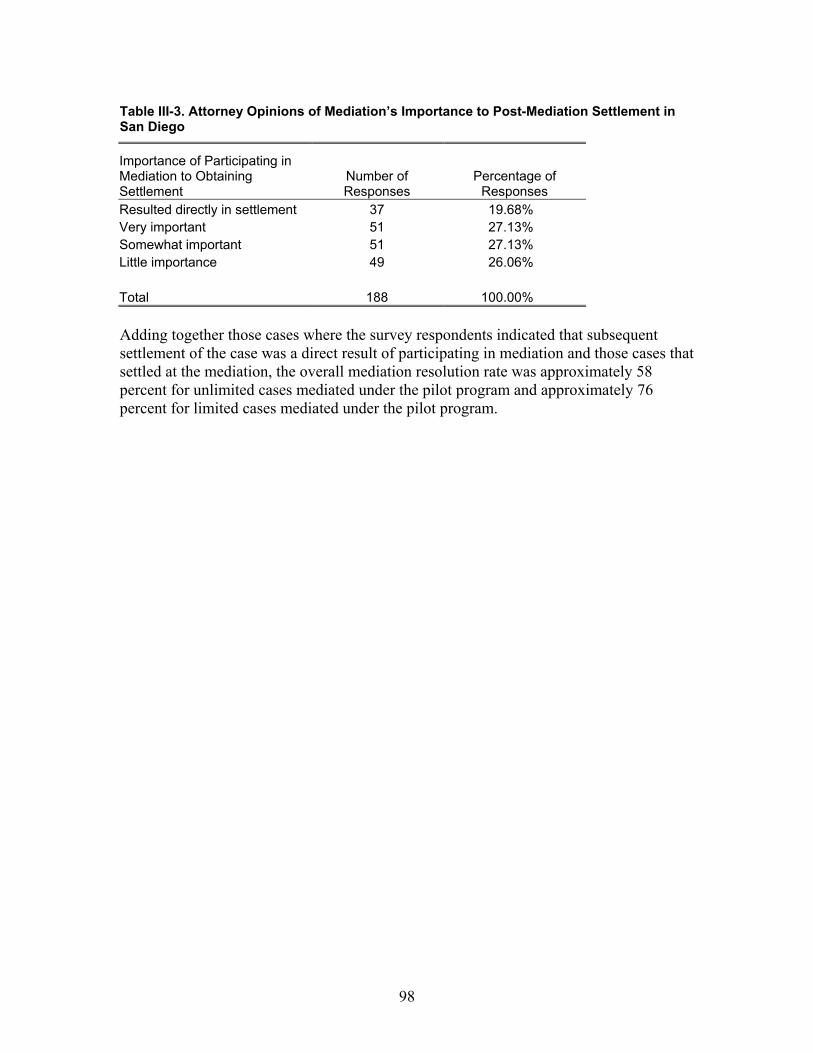
98
Table III-3. Attorney Opinions of Mediation’s Importance to Post-Mediation Settlement in San Diego
Importance of Participating in Mediation to Obtaining Settlement
Number of Responses
Percentage of Responses
Resulted directly in settlement 37 19.68% Very important 51 27.13% Somewhat important 51 27.13% Little importance 49 26.06% Total 188 100.00% Adding together those cases where the survey respondents indicated that subsequent settlement of the case was a direct result of participating in mediation and those cases that settled at the mediation, the overall mediation resolution rate was approximately 58 percent for unlimited cases mediated under the pilot program and approximately 76 percent for limited cases mediated under the pilot program.

99
F. Impact of San Diego’s Pilot Program on Trial Rates
Summary of Findings The pilot program in San Diego significantly reduced the proportion of cases that went to trial. The reduction in trial rates was consistent for both limited and unlimited cases and across all major case types: • The trial rate for unlimited cases in the program group was 24 percent lower than the
trial rate for unlimited cases in the control group; the trial rate for the program group was 5.7 percent compared to 7.5 percent for the control group. The trial rate for limited cases in the program group was 27 percent lower than the trial rate for these cases in the control group; the trial rate for the program group was 4.8 percent compared to 6.6 percent for the control group.
• At these lower trial rates, approximately 89 fewer 2000 cases were tried (18 limited
and 71 unlimited cases) and 212 fewer 2001 cases were tried in the program group (86 limited and 126 unlimited cases). This reduction in trials translates into total potential time savings of 247 trial days for 2000 cases and 448 trial days for 2001 cases. Annualizing the program group reductions and adding potential reductions if the program were available to cases that were in the control group, an estimated 221 fewer cases would be tried each year. This potential reduction in trials translates into total potential time savings of 521 trial days per year.
• While this time saving does not translate into fungible cost savings that can be
reallocated for other purposes, the monetary value of the time saved is approximately $1.6 million per year.
Introduction This section examines the impact of the pilot program in San Diego on the trial rate. It compares the proportion of disposed cases that went to trial in the program group134 with the proportion of disposed cases that went to trial in the control group. It also breaks down the analysis by case type to see whether the program impact on trial rate was different for different case types. Finally, this section analyzes the implications of this reduced trial rate by estimating the amount of judicial time potentially saved through the reduced number of trials and the monetary value of that time.
Overall Comparisons of Trial Rate in Program and Control Groups The pilot program in San Diego significantly reduced the trial rates for both unlimited and limited civil cases. As shown in Table III-4, the trial rate for unlimited cases in the program group was 24 percent lower than the trial rate for unlimited cases in the control group; the trial rate for the program group was 5.7 percent compared to 7.5 percent for the control group. Similarly, the trial rate for limited cases in the program group was 27 134 It is important to remember that program-group cases include all cases that experienced any element of the pilot program, including cases that were not referred to mediation.
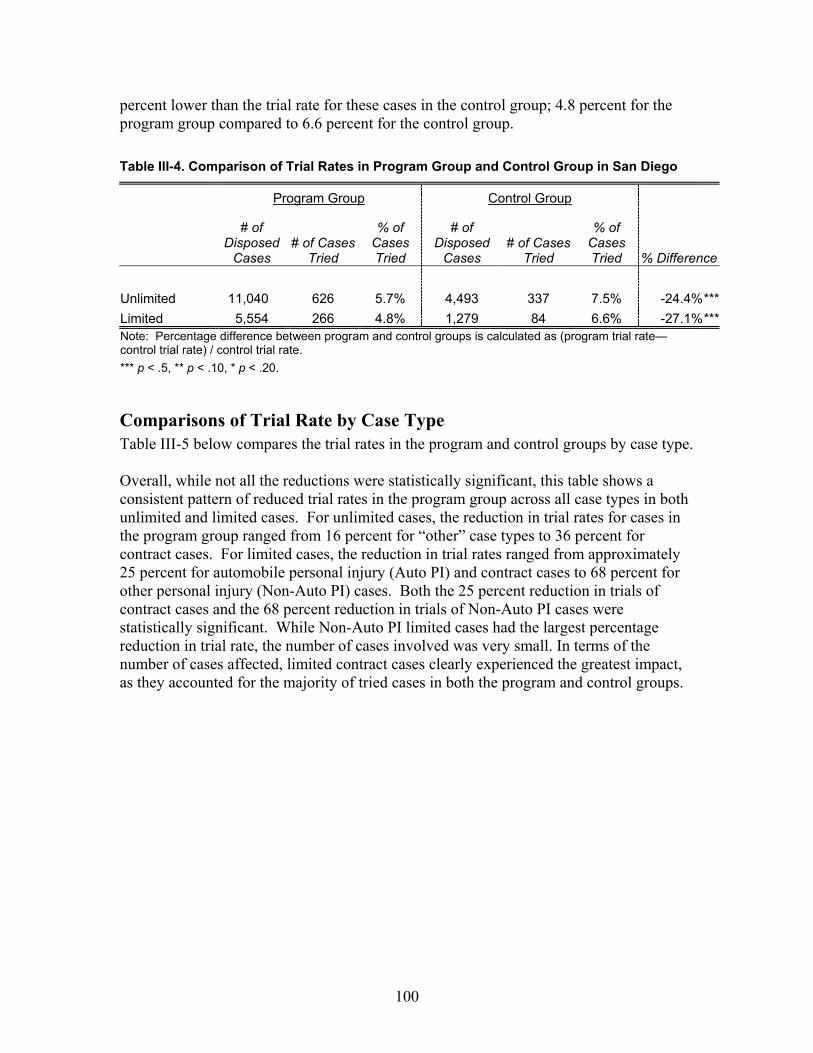
100
percent lower than the trial rate for these cases in the control group; 4.8 percent for the program group compared to 6.6 percent for the control group. Table III-4. Comparison of Trial Rates in Program Group and Control Group in San Diego
Program Group Control Group
# of Disposed
Cases # of Cases
Tried
% of Cases Tried
# of Disposed
Cases # of Cases
Tried
% of Cases Tried % Difference
Unlimited 11,040 626 5.7% 4,493 337 7.5% -24.4%***Limited 5,554 266 4.8% 1,279 84 6.6% -27.1%***Note: Percentage difference between program and control groups is calculated as (program trial rate—control trial rate) / control trial rate. *** p < .5, ** p < .10, * p < .20.
Comparisons of Trial Rate by Case Type Table III-5 below compares the trial rates in the program and control groups by case type. Overall, while not all the reductions were statistically significant, this table shows a consistent pattern of reduced trial rates in the program group across all case types in both unlimited and limited cases. For unlimited cases, the reduction in trial rates for cases in the program group ranged from 16 percent for “other” case types to 36 percent for contract cases. For limited cases, the reduction in trial rates ranged from approximately 25 percent for automobile personal injury (Auto PI) and contract cases to 68 percent for other personal injury (Non-Auto PI) cases. Both the 25 percent reduction in trials of contract cases and the 68 percent reduction in trials of Non-Auto PI cases were statistically significant. While Non-Auto PI limited cases had the largest percentage reduction in trial rate, the number of cases involved was very small. In terms of the number of cases affected, limited contract cases clearly experienced the greatest impact, as they accounted for the majority of tried cases in both the program and control groups.
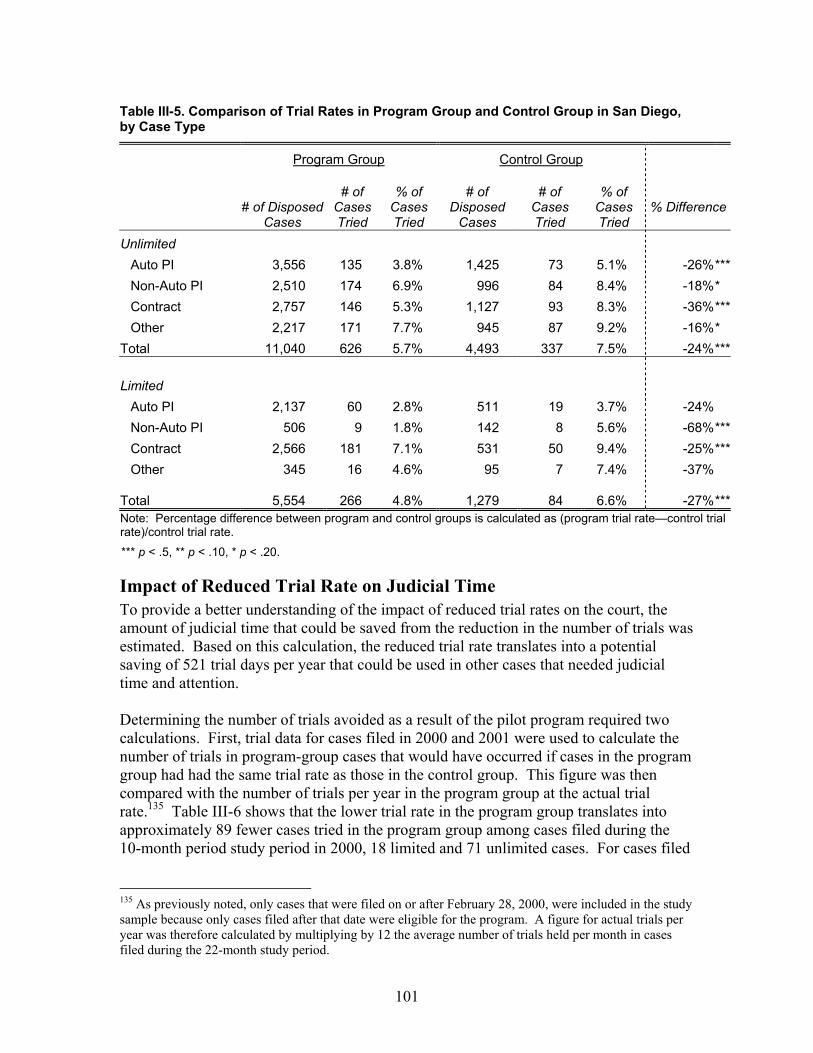
101
Table III-5. Comparison of Trial Rates in Program Group and Control Group in San Diego, by Case Type
Program Group Control Group
# of Disposed
Cases
# of Cases Tried
% of Cases Tried
# of Disposed
Cases
# of Cases Tried
% of Cases Tried
% Difference
Unlimited Auto PI 3,556 135 3.8% 1,425 73 5.1% -26%***Non-Auto PI 2,510 174 6.9% 996 84 8.4% -18%* Contract 2,757 146 5.3% 1,127 93 8.3% -36%***Other 2,217 171 7.7% 945 87 9.2% -16%*
Total 11,040 626 5.7% 4,493 337 7.5% -24%*** Limited
Auto PI 2,137 60 2.8% 511 19 3.7% -24% Non-Auto PI 506 9 1.8% 142 8 5.6% -68%***Contract 2,566 181 7.1% 531 50 9.4% -25%***Other 345 16 4.6% 95 7 7.4% -37%
Total 5,554 266 4.8% 1,279 84 6.6% -27%***Note: Percentage difference between program and control groups is calculated as (program trial rate—control trial rate)/control trial rate.
*** p < .5, ** p < .10, * p < .20.
Impact of Reduced Trial Rate on Judicial Time To provide a better understanding of the impact of reduced trial rates on the court, the amount of judicial time that could be saved from the reduction in the number of trials was estimated. Based on this calculation, the reduced trial rate translates into a potential saving of 521 trial days per year that could be used in other cases that needed judicial time and attention. Determining the number of trials avoided as a result of the pilot program required two calculations. First, trial data for cases filed in 2000 and 2001 were used to calculate the number of trials in program-group cases that would have occurred if cases in the program group had had the same trial rate as those in the control group. This figure was then compared with the number of trials per year in the program group at the actual trial rate.135 Table III-6 shows that the lower trial rate in the program group translates into approximately 89 fewer cases tried in the program group among cases filed during the 10-month period study period in 2000, 18 limited and 71 unlimited cases. For cases filed
135 As previously noted, only cases that were filed on or after February 28, 2000, were included in the study sample because only cases filed after that date were eligible for the program. A figure for actual trials per year was therefore calculated by multiplying by 12 the average number of trials held per month in cases filed during the 22-month study period.
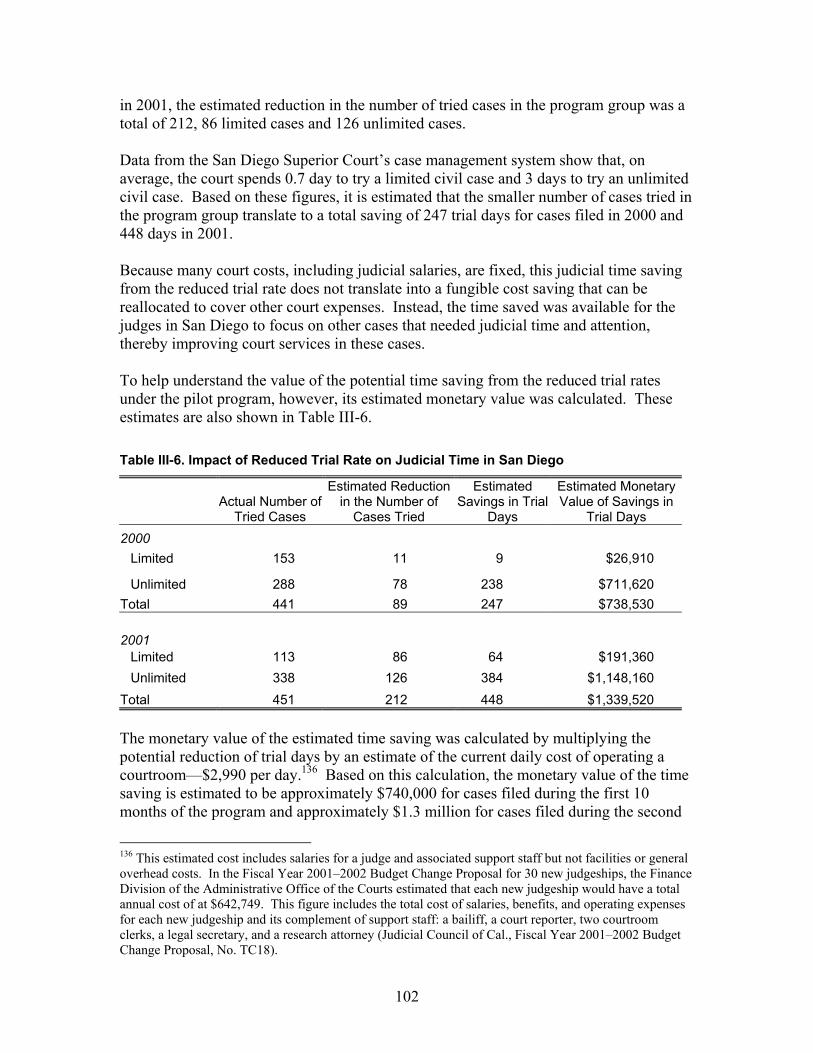
102
in 2001, the estimated reduction in the number of tried cases in the program group was a total of 212, 86 limited cases and 126 unlimited cases. Data from the San Diego Superior Court’s case management system show that, on average, the court spends 0.7 day to try a limited civil case and 3 days to try an unlimited civil case. Based on these figures, it is estimated that the smaller number of cases tried in the program group translate to a total saving of 247 trial days for cases filed in 2000 and 448 days in 2001. Because many court costs, including judicial salaries, are fixed, this judicial time saving from the reduced trial rate does not translate into a fungible cost saving that can be reallocated to cover other court expenses. Instead, the time saved was available for the judges in San Diego to focus on other cases that needed judicial time and attention, thereby improving court services in these cases. To help understand the value of the potential time saving from the reduced trial rates under the pilot program, however, its estimated monetary value was calculated. These estimates are also shown in Table III-6. Table III-6. Impact of Reduced Trial Rate on Judicial Time in San Diego
Actual Number of
Tried Cases
Estimated Reduction in the Number of
Cases Tried
Estimated Savings in Trial
Days
Estimated Monetary Value of Savings in
Trial Days 2000
Limited 153 11 9 $26,910
Unlimited 288 78 238 $711,620 Total 441 89 247 $738,530 2001
Limited 113 86 64 $191,360 Unlimited 338 126 384 $1,148,160
Total 451 212 448 $1,339,520 The monetary value of the estimated time saving was calculated by multiplying the potential reduction of trial days by an estimate of the current daily cost of operating a courtroom—$2,990 per day.136 Based on this calculation, the monetary value of the time saving is estimated to be approximately $740,000 for cases filed during the first 10 months of the program and approximately $1.3 million for cases filed during the second
136 This estimated cost includes salaries for a judge and associated support staff but not facilities or general overhead costs. In the Fiscal Year 2001–2002 Budget Change Proposal for 30 new judgeships, the Finance Division of the Administrative Office of the Courts estimated that each new judgeship would have a total annual cost of at $642,749. This figure includes the total cost of salaries, benefits, and operating expenses for each new judgeship and its complement of support staff: a bailiff, a court reporter, two courtroom clerks, a legal secretary, and a research attorney (Judicial Council of Cal., Fiscal Year 2001–2002 Budget Change Proposal, No. TC18).
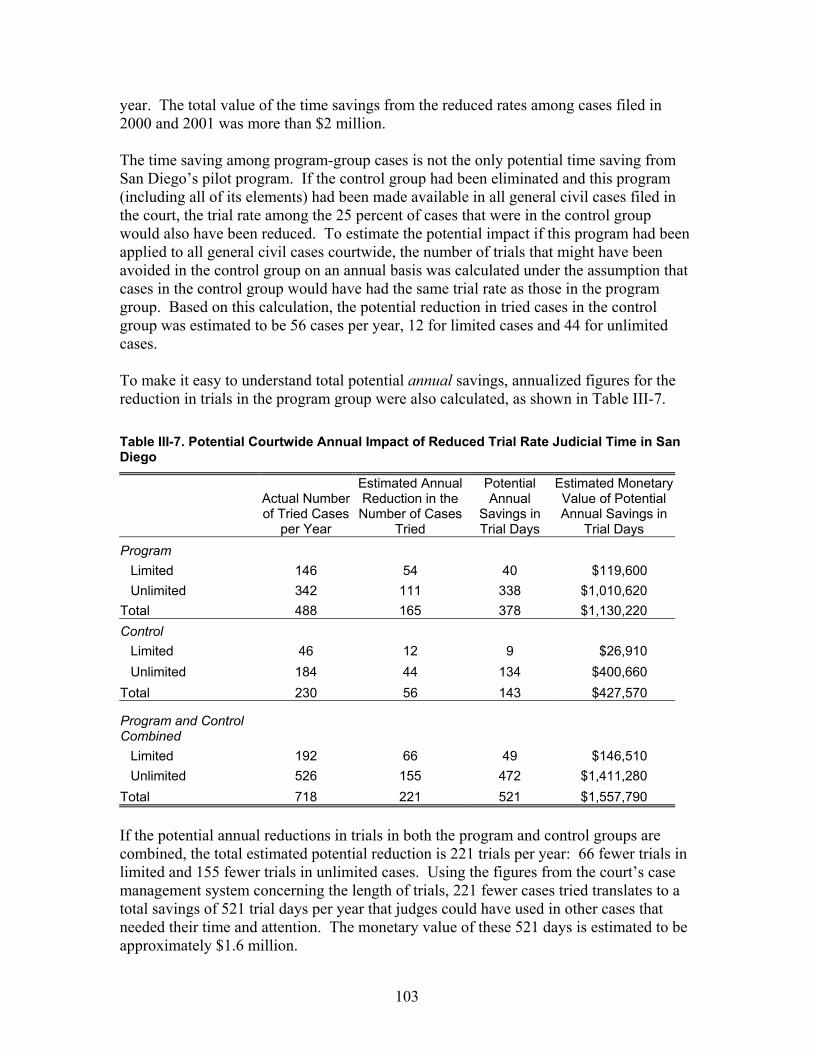
103
year. The total value of the time savings from the reduced rates among cases filed in 2000 and 2001 was more than $2 million. The time saving among program-group cases is not the only potential time saving from San Diego’s pilot program. If the control group had been eliminated and this program (including all of its elements) had been made available in all general civil cases filed in the court, the trial rate among the 25 percent of cases that were in the control group would also have been reduced. To estimate the potential impact if this program had been applied to all general civil cases courtwide, the number of trials that might have been avoided in the control group on an annual basis was calculated under the assumption that cases in the control group would have had the same trial rate as those in the program group. Based on this calculation, the potential reduction in tried cases in the control group was estimated to be 56 cases per year, 12 for limited cases and 44 for unlimited cases. To make it easy to understand total potential annual savings, annualized figures for the reduction in trials in the program group were also calculated, as shown in Table III-7. Table III-7. Potential Courtwide Annual Impact of Reduced Trial Rate Judicial Time in San Diego
Actual Number of Tried Cases
per Year
Estimated Annual Reduction in the Number of Cases
Tried
Potential Annual
Savings in Trial Days
Estimated Monetary Value of Potential Annual Savings in
Trial Days Program
Limited 146 54 40 $119,600 Unlimited 342 111 338 $1,010,620
Total 488 165 378 $1,130,220 Control
Limited 46 12 9 $26,910 Unlimited 184 44 134 $400,660
Total 230 56 143 $427,570
Program and Control Combined
Limited 192 66 49 $146,510 Unlimited 526 155 472 $1,411,280
Total 718 221 521 $1,557,790 If the potential annual reductions in trials in both the program and control groups are combined, the total estimated potential reduction is 221 trials per year: 66 fewer trials in limited and 155 fewer trials in unlimited cases. Using the figures from the court’s case management system concerning the length of trials, 221 fewer cases tried translates to a total savings of 521 trial days per year that judges could have used in other cases that needed their time and attention. The monetary value of these 521 days is estimated to be approximately $1.6 million.
104
Conclusion There is strong evidence that the pilot program reduced the trial rate in San Diego. The trial rate was 24 percent lower for unlimited cases and 27 percent lower for limited cases in the program group than the trial rate for comparable cases in the control group. Further comparisons by case types indicate that the program impact is consistent across all case types but is most pronounced for limited Non-Auto PI and contract cases and unlimited contract cases. By helping litigants in more cases reach resolution without going to trial, this pilot program saved a substantial amount of court time. With fewer cases going to trial, a potential saving of 521 trial days per year (with a monetary value of approximately $1.6 million) could be realized for all general civil cases filed per year. This is valuable judicial time that can be devoted to other cases that need judges’ time and attention.
105
G. Impact of San Diego’s Pilot Program on Case Disposition Time
Summary of Findings The pilot program in San Diego reduced case disposition time in both limited and unlimited cases. • The average time to disposition in the program group137 was reduced by 12 days for
unlimited cases and 10 days for limited cases compared to the rates in the control group.
• The median time to disposition in the program group was reduced by 19 days and 25
days for unlimited and limited cases, respectively, compared to the rates in the control group.
• For both unlimited and limited program-group cases, the pace of dispositions
quickened about the time of the early case management conference and program-group cases were disposed of at their fastest rate around the time of the early mediation, suggesting that the conference and mediation contributed to the reduced time to disposition. Limited program-group cases were disposed of faster than control-group cases well before the time of the early case management conference, suggesting that the possibility of attendance at the early case management conference and referral to early mediation may also have increased dispositions.
• The average disposition time for limited cases in the program group that settled at
mediation was 30 days shorter than the disposition time of like cases in the control group. Conversely, data suggest an increase of approximately 50 days in disposition time when unlimited program-group cases did not settle at mediation and 80 days when limited program-group cases did not settle at mediation compared to like cases in the control group. This highlights the importance of carefully selecting cases for referral to mediation.
• The pilot program’s positive impact on case disposition time was consistent across all
case types for unlimited cases. For limited cases, the pilot program impact was evident only for contract cases.
Introduction This section of the report examines the impact of the San Diego pilot program on time to disposition. First, the time to disposition in program-group cases as a whole and in each of the program subgroups is discussed. Second, the different patterns of case disposition time between cases in the program and control groups are compared, including the 137 It is important to remember that program-group cases include all cases that experienced any element of the pilot program, including cases that were not referred to mediation. It is also important to remember that only at-issue cases in the program group and control group were included in these comparisons.
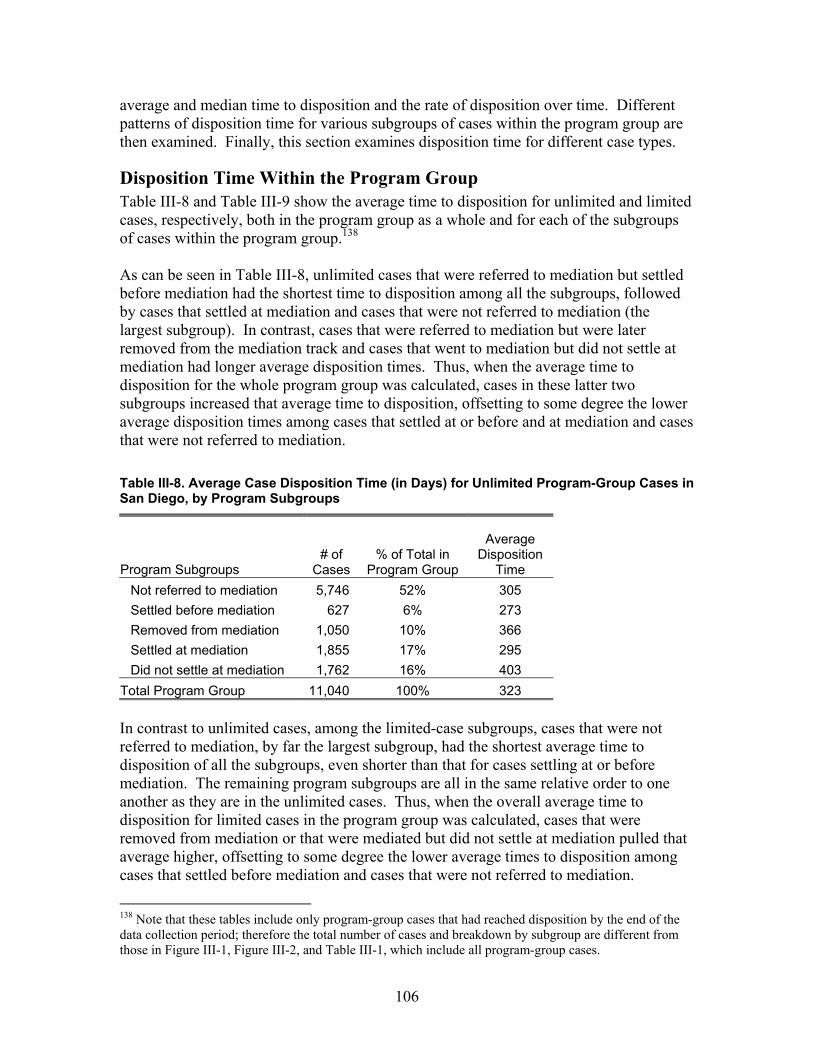
106
average and median time to disposition and the rate of disposition over time. Different patterns of disposition time for various subgroups of cases within the program group are then examined. Finally, this section examines disposition time for different case types.
Disposition Time Within the Program Group Table III-8 and Table III-9 show the average time to disposition for unlimited and limited cases, respectively, both in the program group as a whole and for each of the subgroups of cases within the program group.138 As can be seen in Table III-8, unlimited cases that were referred to mediation but settled before mediation had the shortest time to disposition among all the subgroups, followed by cases that settled at mediation and cases that were not referred to mediation (the largest subgroup). In contrast, cases that were referred to mediation but were later removed from the mediation track and cases that went to mediation but did not settle at mediation had longer average disposition times. Thus, when the average time to disposition for the whole program group was calculated, cases in these latter two subgroups increased that average time to disposition, offsetting to some degree the lower average disposition times among cases that settled at or before and at mediation and cases that were not referred to mediation. Table III-8. Average Case Disposition Time (in Days) for Unlimited Program-Group Cases in San Diego, by Program Subgroups
Program Subgroups # of
Cases % of Total in
Program Group
Average Disposition
Time Not referred to mediation 5,746 52% 305 Settled before mediation 627 6% 273 Removed from mediation 1,050 10% 366 Settled at mediation 1,855 17% 295 Did not settle at mediation 1,762 16% 403
Total Program Group 11,040 100% 323 In contrast to unlimited cases, among the limited-case subgroups, cases that were not referred to mediation, by far the largest subgroup, had the shortest average time to disposition of all the subgroups, even shorter than that for cases settling at or before mediation. The remaining program subgroups are all in the same relative order to one another as they are in the unlimited cases. Thus, when the overall average time to disposition for limited cases in the program group was calculated, cases that were removed from mediation or that were mediated but did not settle at mediation pulled that average higher, offsetting to some degree the lower average times to disposition among cases that settled before mediation and cases that were not referred to mediation.
138 Note that these tables include only program-group cases that had reached disposition by the end of the data collection period; therefore the total number of cases and breakdown by subgroup are different from those in Figure III-1, Figure III-2, and Table III-1, which include all program-group cases.
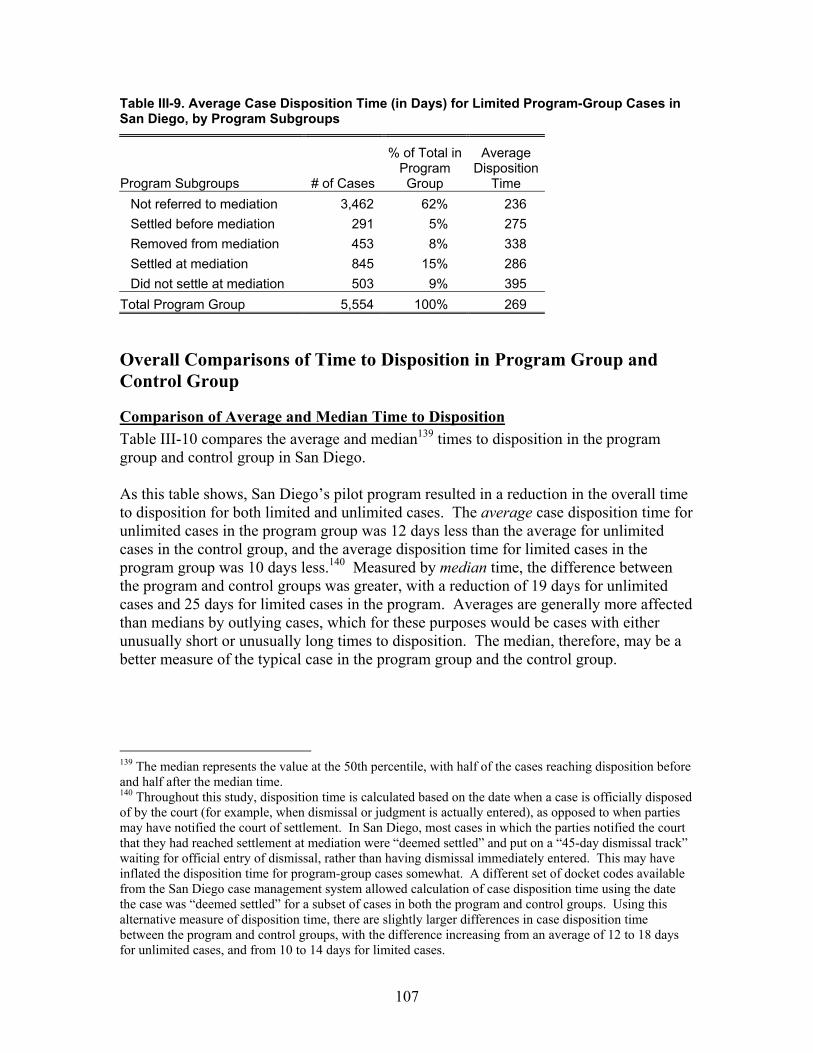
107
Table III-9. Average Case Disposition Time (in Days) for Limited Program-Group Cases in San Diego, by Program Subgroups
Program Subgroups # of Cases
% of Total in Program Group
Average Disposition
Time Not referred to mediation 3,462 62% 236 Settled before mediation 291 5% 275 Removed from mediation 453 8% 338 Settled at mediation 845 15% 286 Did not settle at mediation 503 9% 395
Total Program Group 5,554 100% 269
Overall Comparisons of Time to Disposition in Program Group and Control Group
Comparison of Average and Median Time to Disposition Table III-10 compares the average and median139 times to disposition in the program group and control group in San Diego. As this table shows, San Diego’s pilot program resulted in a reduction in the overall time to disposition for both limited and unlimited cases. The average case disposition time for unlimited cases in the program group was 12 days less than the average for unlimited cases in the control group, and the average disposition time for limited cases in the program group was 10 days less.140 Measured by median time, the difference between the program and control groups was greater, with a reduction of 19 days for unlimited cases and 25 days for limited cases in the program. Averages are generally more affected than medians by outlying cases, which for these purposes would be cases with either unusually short or unusually long times to disposition. The median, therefore, may be a better measure of the typical case in the program group and the control group.
139 The median represents the value at the 50th percentile, with half of the cases reaching disposition before and half after the median time. 140 Throughout this study, disposition time is calculated based on the date when a case is officially disposed of by the court (for example, when dismissal or judgment is actually entered), as opposed to when parties may have notified the court of settlement. In San Diego, most cases in which the parties notified the court that they had reached settlement at mediation were “deemed settled” and put on a “45-day dismissal track” waiting for official entry of dismissal, rather than having dismissal immediately entered. This may have inflated the disposition time for program-group cases somewhat. A different set of docket codes available from the San Diego case management system allowed calculation of case disposition time using the date the case was “deemed settled” for a subset of cases in both the program and control groups. Using this alternative measure of disposition time, there are slightly larger differences in case disposition time between the program and control groups, with the difference increasing from an average of 12 to 18 days for unlimited cases, and from 10 to 14 days for limited cases.

108
Table III-10. Comparison of Case Disposition Time (in Days) in Program Group and Control Group in San Diego
Program Control
Difference = Program—
Control Average
Unlimited 323 335 -12*** Limited 269 279 -10***
Median Unlimited 310 329 -19*** Limited 247 272 -25***
Number of Cases Unlimited 11,040 4,493 Limited 5,554 1,279
*** p < .5, ** p < .10, * p < .20. Both the overall average and median measures show only a modest impact from the pilot program on the time to disposition for all cases in the program group as a whole. The relatively small size of this difference may seem counterintuitive given the large reduction in the program-group trial rate discussed in the previous section. Tried cases typically take the longest time to reach disposition, so reducing the proportion of these cases should have reduced the overall time to disposition. However, tried cases represent a relatively small proportion of the cases within the program group. Although the trial rate in the program group was reduced to 5.7 compared to 7.5 in the control group, this reduction did not affect the remaining majority of cases in the program group. It is also important to remember that, as discussed above in the pilot program description, the program group does not consist just of mediated cases; it includes cases in all of the subgroups listed in Table III-8 and Table II-9. As shown in these tables and discussed above, the cases in these subgroups had very different average times to disposition that offset one another to some degree when the overall average time to disposition in the program group was calculated.
Comparison of Case Disposition Timing To better understand at what point in the litigation process the pilot program had its impact on the overall time to disposition, the patterns of case disposition rate over time were examined. This analysis also provides information about whether the program impact on time to disposition occurred around the time when certain program elements, such as case management conferences and mediations, generally took place. Figure III-5 compares the timing of case disposition in the program group and control group.141 The horizontal axis represent time (in months) from filing until disposition of a
141 We combined the data for cases filed in 2000 and 2001, as the data for both years as showed similar patterns in disposition rate over time.

109
case, and the vertical axis represent the cumulative proportion of cases disposed (or disposition rate). The wider, purple line represents the program-group disposition rate, and the thinner, black line represents the control-group disposition rate. The gap between these two lines represents the difference in the disposition rates in the program group and control group at a given time from the filing of a complaint. The slope of the lines represents the pace at which cases were reaching disposition at a particular point in time; a steeper slope indicates that more cases were reaching disposition at that time.
Figure III-5. Comparison of Case Disposition Rate Over Time in Program Group and Control Group San Diego
For unlimited cases, Figure III-5 shows that from filing to approximately 5 months after filing cases in the program group and control group were disposed of at about the same rate (the disposition rate in the program group is actually slightly higher for the entire 24-month follow-up period). At 5 months after filing, about the time when (on average) the early case management conferences took place, the pace of dispositions in the program group increased and the disposition rate in the program group began to outstrip the rate in the control group. Between 5 and 13 months after filing (when disposition rates for both the program group and the control group leveled off), cases in the program group were disposed of at a higher rate compared to the control group, indicating that the
Unlimited Cases
Limited Cases
Program Control
0%
20%
40%
60%
80%
100%
1 3 5 7 9 11 13 15 17 19 21 23
Month from filing
Cum
ulat
ive
disp
ositi
on ra
te
Went to mediation at 8 months
EMSC held at 5 months
0%
20%
40%
60%
80%
100%
1 3 5 7 9 11 13 15 17 19 21 23
Month from filing
Cum
ulat
ive
disp
ositi
on ra
te
Went to mediation at 8 months
EMSC held at 5 months
110
pilot program reduced the disposition time for program-group cases. The difference in disposition rate between the two groups was largest at approximately 10 months after filing, when 46 percent of the unlimited cases in the program group had been disposed of compared to only 39 percent in the control group. Program-group cases were disposed of at their fastest pace starting at 8 months after filing, about the time when (on average) the pilot program mediations took place. The quickening in the pace of dispositions at the time of the early case management conference and of the mediation supports the hypothesis that, for unlimited cases, participation in the program’s early case management conference and early mediation expedited the time to disposition. Figure III-5 shows that limited cases in the program group began to have a higher disposition rate than cases in the control group very early in the litigation process. A significant difference between the program and control groups first appeared at 3 months after filing and continued until 12 months after filing (when the disposition rates for both the program group and control group began to level off). The difference between the program-group and control-group disposition rates was largest at approximately 9 months after filing, when 57 percent of the limited cases in the program group had been disposed of compared to only 49 percent in the control group. As with unlimited cases, the pace of dispositions in the program group quickened at 5 months after filing (the time of the early case management conference) and was at its fastest at 8 months after filing (the time of pilot program mediations). The fact that limited cases in the program group began to have a faster disposition rate so early in the litigation process suggests that San Diego’s pilot program influenced some of these cases well before the cases were ready for mediation referrals, even before case management conferences were held in most cases. It supports the hypothesis that the possibility of attending an early case management conference, along with the possibility of being referred to mediation, may have expedited case dispositions for limited cases. As with unlimited cases, the quickening in the pace of dispositions at the time of the early case management conference and the mediation suggests that participation in these program elements also expedited the time to disposition for limited program-group cases.
Analysis of Subgroups Within the Program Group To better understand how different cases within the program were influenced by the elements of the pilot program that they experienced, the disposition time of cases in each of the subgroups within the program group was compared to the disposition time of similar cases in the control group.142 The results of this comparison suggest that the pilot program reduced the time to disposition for limited program cases that settled at mediation. Limited program-group cases that settled at pilot program mediations had an average disposition time that was 30 days shorter than the average for similar cases in the control group.
142 The regression analysis method described in the methods Section I.B. was used to make these subgroup comparisons.
111
The comparison also found evidence that not settling at the pilot program mediation resulted in longer disposition time. Limited program-group cases that were mediated under the pilot program but did not settle at the mediation had an average disposition time that was 80 days longer than the average for similar cases in the control group. Similarly, unlimited cases in the program group that did not settle at mediation had an average disposition time that was 50 days longer than similar cases in the control group. Overall, these regression analyses support the conclusion that cases were disposed of more quickly when they were resolved at mediation; but they also indicate that it took longer to reach disposition if cases did not resolve at mediation than if they had not been mediated. These findings make intuitive sense. When mediations are conducted relatively early and cases are settled at those early mediations, one would expect that the average time to disposition in those cases would be less than that in similar cases that were not mediated and did not reach settlement in mediation. It also makes sense that, on average, it generally took longer to reach disposition in program-group cases that did not settle at mediation compared to similar cases not in the program group. These program-group cases essentially took a detour off the litigation path to participate in mediation and then came back to the litigation path when they did not settle at mediation; it is understandable that this detour required some additional time. This finding suggests the importance of trying to identify and refer to mediation those cases that are most amenable to settlement at an early mediation process. It is important to note, however, that the increases in average disposition time in cases that did not settle at mediation did not outweigh the positive impact that the pilot program had on other cases; as discussed above, the pilot program reduced the overall disposition time for program-group cases as a whole.
Additional Analysis of Cases That Did Not Resolve at Mediation As noted at the beginning of this chapter, 74 percent of attorneys in cases in which the parties did not reach agreement at the end of the mediation session indicated that subsequent settlement of the case benefited from mediation. In only 26 percent of the survey responses received in these cases did attorneys indicate that mediation was of “little importance” to their cases’ settlement. To examine whether there was a relationship between the time to disposition and the importance of mediation to later settlement, program-group cases that were mediated but did not resolve at mediation were broken down based on the importance attorneys gave to mediation in their cases’ ultimate resolution. The time to disposition for these cases was then examined. Data from both limited and unlimited cases were combined for this analysis to provide a larger number of cases. Table III-11 shows this breakdown. The differences in case disposition time among these subgroups were not statistically significant.143 However, there appears to be some relationship between the importance of mediation to subsequent settlement and case disposition time. Specifically, for those program-group cases in which the attorneys reported that mediation had little importance
143 There was a 20 percent probability that the different patterns among the groups could be due to chance.
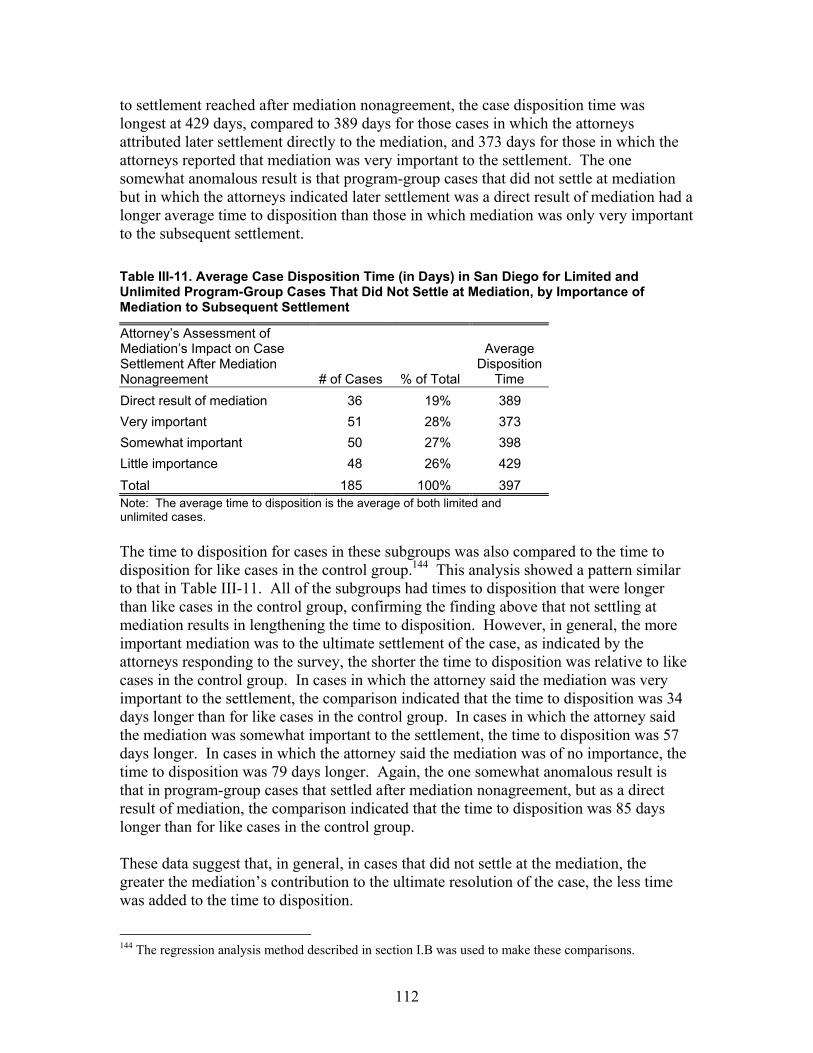
112
to settlement reached after mediation nonagreement, the case disposition time was longest at 429 days, compared to 389 days for those cases in which the attorneys attributed later settlement directly to the mediation, and 373 days for those in which the attorneys reported that mediation was very important to the settlement. The one somewhat anomalous result is that program-group cases that did not settle at mediation but in which the attorneys indicated later settlement was a direct result of mediation had a longer average time to disposition than those in which mediation was only very important to the subsequent settlement. Table III-11. Average Case Disposition Time (in Days) in San Diego for Limited and Unlimited Program-Group Cases That Did Not Settle at Mediation, by Importance of Mediation to Subsequent Settlement
Attorney’s Assessment of Mediation’s Impact on Case Settlement After Mediation Nonagreement # of Cases % of Total
Average Disposition
Time Direct result of mediation 36 19% 389 Very important 51 28% 373 Somewhat important 50 27% 398 Little importance 48 26% 429 Total 185 100% 397 Note: The average time to disposition is the average of both limited and unlimited cases. The time to disposition for cases in these subgroups was also compared to the time to disposition for like cases in the control group.144 This analysis showed a pattern similar to that in Table III-11. All of the subgroups had times to disposition that were longer than like cases in the control group, confirming the finding above that not settling at mediation results in lengthening the time to disposition. However, in general, the more important mediation was to the ultimate settlement of the case, as indicated by the attorneys responding to the survey, the shorter the time to disposition was relative to like cases in the control group. In cases in which the attorney said the mediation was very important to the settlement, the comparison indicated that the time to disposition was 34 days longer than for like cases in the control group. In cases in which the attorney said the mediation was somewhat important to the settlement, the time to disposition was 57 days longer. In cases in which the attorney said the mediation was of no importance, the time to disposition was 79 days longer. Again, the one somewhat anomalous result is that in program-group cases that settled after mediation nonagreement, but as a direct result of mediation, the comparison indicated that the time to disposition was 85 days longer than for like cases in the control group. These data suggest that, in general, in cases that did not settle at the mediation, the greater the mediation’s contribution to the ultimate resolution of the case, the less time was added to the time to disposition.
144 The regression analysis method described in section I.B was used to make these comparisons.
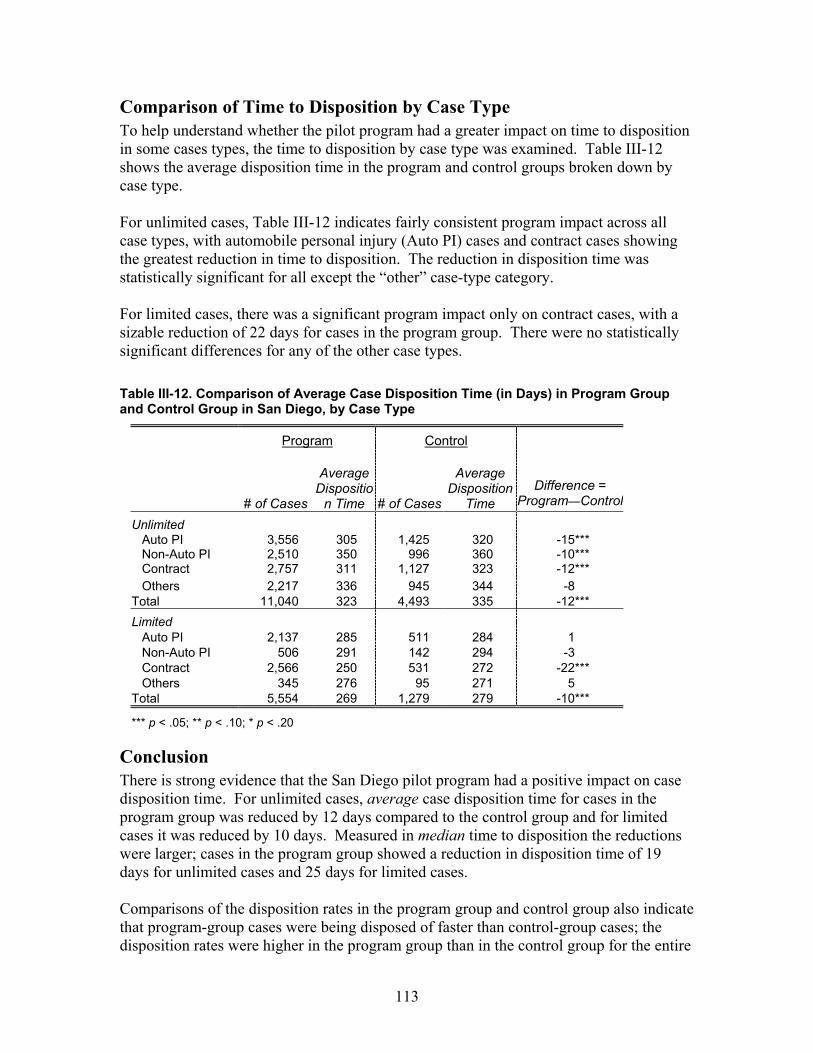
113
Comparison of Time to Disposition by Case Type To help understand whether the pilot program had a greater impact on time to disposition in some cases types, the time to disposition by case type was examined. Table III-12 shows the average disposition time in the program and control groups broken down by case type. For unlimited cases, Table III-12 indicates fairly consistent program impact across all case types, with automobile personal injury (Auto PI) cases and contract cases showing the greatest reduction in time to disposition. The reduction in disposition time was statistically significant for all except the “other” case-type category. For limited cases, there was a significant program impact only on contract cases, with a sizable reduction of 22 days for cases in the program group. There were no statistically significant differences for any of the other case types. Table III-12. Comparison of Average Case Disposition Time (in Days) in Program Group and Control Group in San Diego, by Case Type
Program Control
# of Cases
Average Dispositio
n Time # of Cases
Average Disposition
Time Difference =
Program—Control
Unlimited Auto PI 3,556 305 1,425 320 -15*** Non-Auto PI 2,510 350 996 360 -10*** Contract 2,757 311 1,127 323 -12*** Others 2,217 336 945 344 -8
Total 11,040 323 4,493 335 -12*** Limited
Auto PI 2,137 285 511 284 1 Non-Auto PI 506 291 142 294 -3 Contract 2,566 250 531 272 -22*** Others 345 276 95 271 5
Total 5,554 269 1,279 279 -10***
*** p < .05; ** p < .10; * p < .20
Conclusion There is strong evidence that the San Diego pilot program had a positive impact on case disposition time. For unlimited cases, average case disposition time for cases in the program group was reduced by 12 days compared to the control group and for limited cases it was reduced by 10 days. Measured in median time to disposition the reductions were larger; cases in the program group showed a reduction in disposition time of 19 days for unlimited cases and 25 days for limited cases. Comparisons of the disposition rates in the program group and control group also indicate that program-group cases were being disposed of faster than control-group cases; the disposition rates were higher in the program group than in the control group for the entire
114
follow-up period. In addition, these comparisons indicate that for both unlimited and limited program-group cases, the pace of dispositions quickened about the time of the early case management conference and program-group cases were disposed of fastest around the time of the early mediation, suggesting that the conference and mediation contributed to shortening the time to disposition. Limited program-group cases were also disposed of significantly faster than control-group cases well before the time of the early case management conference, suggesting that the possibility of attendance at the early case management conference and referral to early mediation may have increased dispositions in some of these cases. The data also suggest that the impact of the mediation on time to disposition depended on whether cases settled or did not settle at the mediation. With case characteristics controlled for, the data suggest that limited cases that settled at mediation had a significantly shorter disposition time compared to like cases in the control group. On the other hand, the data suggests that disposition time for both limited and unlimited cases were increased when the case did not reach settlement at mediation. This finding suggests the importance of trying to identify and refer to mediation those cases that are most amenable to settlement at an early mediation process.
115
H. Impact of San Diego’s Pilot Program on Litigant Satisfaction
Summary of Findings The pilot program in San Diego increased attorney satisfaction with the court’s services in limited cases and participating in mediation increased attorney satisfaction with the court’s services in both limited and unlimited cases. • Both parties and attorneys in the San Diego program group expressed high
satisfaction when they used pilot program mediation. They were particularly satisfied with the performance of the mediators; both parties and attorneys showed an average satisfaction score of approximately 6 on a 7-point scale. They also strongly agreed that the mediator and the mediation process were fair and that they would recommend both to others.
• Attorneys in limited program-group cases were more satisfied with the court’s
services than attorneys in limited control-group cases. • Attorneys in both unlimited and limited program-group cases that settled at early
mediation were significantly more satisfied with the outcome of their case, their litigation experience, and with the services provided by the court compared to attorneys in like cases in the control group.
• While attorneys whose cases did not settle at mediation were less satisfied with the
outcome of the case, they were more satisfied with the court’s services than attorneys in similar control-group cases. This suggests that participating in mediation increased attorneys’ satisfaction with the court’s services, regardless of whether their cases settled at mediation.
• When unlimited program-group cases were not referred to mediation, attorneys’
satisfaction with the court’s services and the litigation process was lower compared to like cases in the control group. The reduced satisfaction among these cases offset the increased satisfaction among cases settled at mediation so that comparisons between unlimited cases in the program group and control group as a whole did not show significant differences in overall satisfaction with the court’s services or the litigation process.
Introduction This section examines the impact of San Diego’s pilot program on litigant satisfaction. As described in detail in Section I.B., data on litigant satisfaction were collected in two ways. First, in a survey administered at the end of the mediation in cases that went to mediation between July 2001 and June 2002 (“postmediation survey”), both parties and attorneys were asked about their satisfaction with various aspects of their mediation and litigation experiences. Second, in a separate survey administered shortly after cases reached disposition in cases disposed of between July 2001 and June 2002
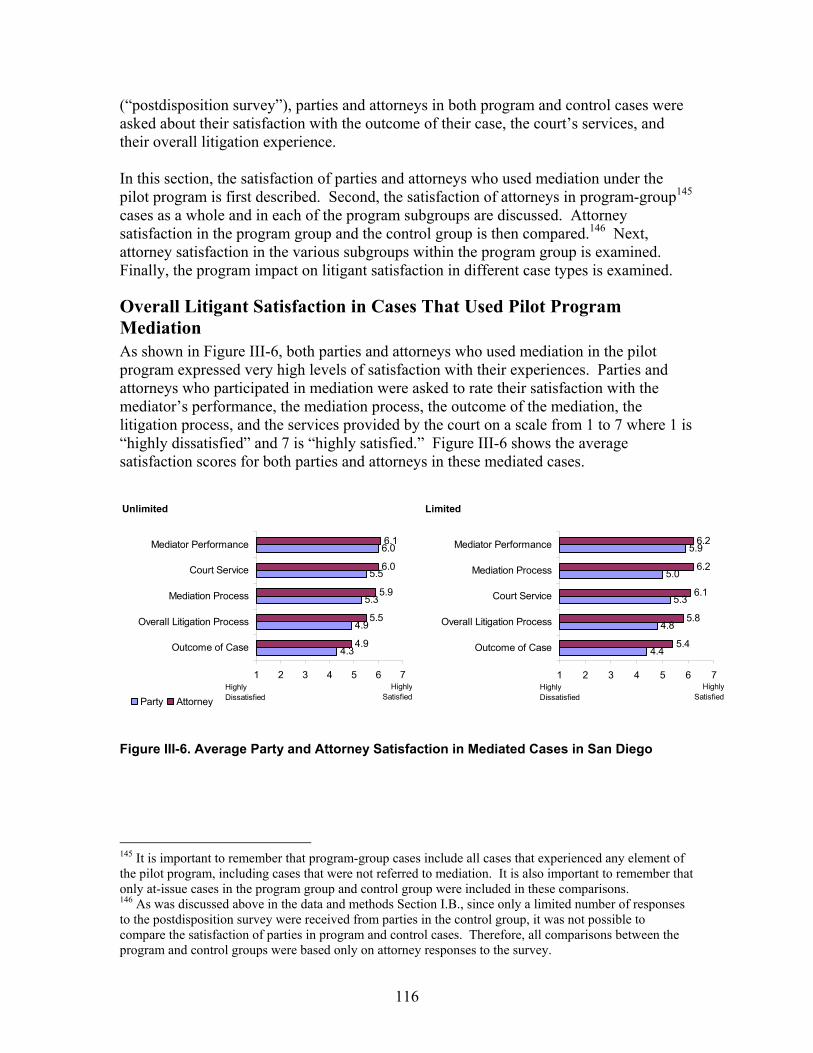
116
(“postdisposition survey”), parties and attorneys in both program and control cases were asked about their satisfaction with the outcome of their case, the court’s services, and their overall litigation experience. In this section, the satisfaction of parties and attorneys who used mediation under the pilot program is first described. Second, the satisfaction of attorneys in program-group145 cases as a whole and in each of the program subgroups are discussed. Attorney satisfaction in the program group and the control group is then compared.146 Next, attorney satisfaction in the various subgroups within the program group is examined. Finally, the program impact on litigant satisfaction in different case types is examined.
Overall Litigant Satisfaction in Cases That Used Pilot Program Mediation As shown in Figure III-6, both parties and attorneys who used mediation in the pilot program expressed very high levels of satisfaction with their experiences. Parties and attorneys who participated in mediation were asked to rate their satisfaction with the mediator’s performance, the mediation process, the outcome of the mediation, the litigation process, and the services provided by the court on a scale from 1 to 7 where 1 is “highly dissatisfied” and 7 is “highly satisfied.” Figure III-6 shows the average satisfaction scores for both parties and attorneys in these mediated cases.
Figure III-6. Average Party and Attorney Satisfaction in Mediated Cases in San Diego
145 It is important to remember that program-group cases include all cases that experienced any element of the pilot program, including cases that were not referred to mediation. It is also important to remember that only at-issue cases in the program group and control group were included in these comparisons. 146 As was discussed above in the data and methods Section I.B., since only a limited number of responses to the postdisposition survey were received from parties in the control group, it was not possible to compare the satisfaction of parties in program and control cases. Therefore, all comparisons between the program and control groups were based only on attorney responses to the survey.
Unlimited Limited
4.3
4.9
5.3
5.5
6.0
4.9
5.5
5.9
6.0
6.1
1 2 3 4 5 6 7
Outcome of Case
Overall Litigation Process
Mediation Process
Court Service
Mediator Performance
Party AttorneyHighly
SatisfiedHighly Dissatisfied
4.4
4.8
5.3
5.0
5.9
5.4
5.8
6.1
6.2
6.2
1 2 3 4 5 6 7
Outcome of Case
Overall Litigation Process
Court Service
Mediation Process
Mediator Performance
Highly Satisfied
Highly Dissatisfied

117
It is clear from this figure that parties and attorneys who used mediation services in the pilot program were highly satisfied with all aspects of the mediation experience. Most of the scores were in the highly satisfied range (5.0 or above) and none was below 4.3. Both parties and attorneys were most satisfied with the performance of mediators, with average satisfaction scores of 6.1–6.2 for attorneys and 5.9–6.0 for parties. They were also highly satisfied with the mediation process and services provided by the court, with average satisfaction scores of about 6 for attorneys and 5–5.5 for parties. Both parties and attorneys were least satisfied with the outcome of the case; average outcome satisfaction scores were 4.9–5.4 for attorneys and 4.3–4.4 for parties. Both parties and attorneys who participated in pilot program mediations were also asked for their views concerning the fairness of the mediation and their willingness to recommend or use mediation again. Using a 1–5 scale, where 1 is “strongly disagree” and 5 is “strongly agree,” litigants were asked to indicate whether they agreed that the mediator treated the parties fairly, that the mediation process was fair, and that the mediation resulted in a fair/reasonable outcome. They were also asked whether they agreed that they would recommend the mediator to friends with similar cases, that they would recommend mediation to such friends, and that they would use mediation even if they had to pay the full cost of the mediation. Table III-13 shows parties’ and attorneys’ average level of agreement with these statements in unlimited and limited program-group cases. Table III-13. Party and Attorney Perceptions of Fairness and Willingness to Recommend or Use Mediation in San Diego (average agreement with statement)
Mediator Treated All
Parties Fairly
Mediation Process Was
Fair
Mediation Outcome Was Fair/
Reasonable
Would Recommend Mediator to
Friends
Would Recommend Mediation to
Friends
Would Use Mediation at
Full Cost
Parties Attys Parties Attys Parties Attys Parties Attys Parties Attys Parties Attys
Unlimited Cases 4.5 4.7 4.2 4.7 3.1 3.6 4.2 4.6 4.2 4.7 3.5 4.0
Limited Cases 4.5 4.8 4.1 4.7 3.4 3.8 4.3 4.6 4.1 4.8 3.4 3.9
As with the satisfaction scores, most of the scores were in the “strongly agree” range (above 4.0) and all of the average scores were above the middle of the agreement scale (3.0).147 For both parties and attorneys there was very strong agreement (average score of 4.1 or above for parties and 4.6 or above for attorneys) that the mediator treated the parties fairly, that the mediation process was fair, that they would recommend the mediator to friends with similar cases, and that that they would recommend mediation to such friends. Both parties and attorneys indicated less agreement that they would use mediation if they had to pay the full cost; the average score was 3.4–3.5 for parties and
147 A 5-point scale was used for these survey questions, rather than the 7-point scale used in the satisfaction question.

118
3.9–4.0 for attorneys. The lowest scores related to the fairness/reasonableness of the mediation outcome, at only 3.1–3.4 for parties and 3.6–3.8 for attorneys. It is clear from the responses to both these sets of questions that while parties and attorneys were generally very pleased with their mediation experiences, overall they were less pleased or neutral in terms of the outcome of the mediation process (in fact, on both outcome questions, about more than 20 percent of the parties and attorneys responded that they were neutral). In evaluating this result, it is important to remember that this survey was administered at the end of the mediation and that in a large proportion of cases a settlement was not reached at end of the mediation. Not surprisingly, the way parties and attorneys responded to the two outcome questions depended largely on whether their cases settled at mediation. Average satisfaction with the outcome in program-group cases that settled at mediation was 5.99 for attorneys and 5.16 for parties on a 7-point scale, more than 50 percent higher than the average scores of 3.79 for attorneys and 3.27 for parties in cases that did not settle at mediation. Similarly, responses concerning the fairness/reasonableness of the outcome averaged 4.37 for attorneys and 3.73 for parties on a 5-point scale, in cases settled at mediation, approximately 60 percent higher than the 2.63 for attorneys and 2.34 for parties in cases that did not settle at mediation. When the scores in both cases settled and not settled at mediation were added together to calculate the overall average, the higher scores in cases that settled were offset by those in cases that did not, pulling the overall average lower. It is also clear from the responses to both these sets of questions that while both parties and attorneys were generally very pleased with their pilot program mediation experiences, attorneys were more pleased than parties. Attorneys’ average scores were consistently higher than those of parties on all of these questions. Attorney satisfaction scores in limited cases ranged from .8 higher than party scores (for court services) to 1.2 higher (for mediation process); in unlimited cases attorney scores were generally only .5 higher. The higher attorney satisfaction may reflect a greater understanding on the part of attorneys about what to expect from the mediation process. Given that there was a court-connected mediation program in San Diego before the pilot program was introduced, many attorneys are likely to have participated in mediations before, so they are likely to have been familiar with the mediation process and to have based their expectations about the process on this knowledge. Parties are less likely to have participated in previous mediations and may not have known what to expect from the mediation process. This may suggest the need for additional educational efforts targeted at parties, rather than attorneys. The higher scores by attorneys may also, in part, reflect the fact that attorneys and parties’ satisfaction was associated with different aspects of their mediation experiences. Attorneys’ responses on only four of the survey questions were strongly correlated with their responses concerning satisfaction with the mediation process—whether they believed that the mediation process was fair, that the mediation resulted in a fair/reasonable outcome, that the mediation helped move the case toward resolution
119
quickly, and that the mediator treated all parties fairly.148 In contrast, parties’ satisfaction with the mediation process was also strongly correlated with whether they believed that they had had an adequate opportunity to tell their side of the story during the mediation, that the mediation helped improve communication between the parties, that the mediation helped preserve the parties’ relationship, and that the cost of using mediation was affordable.149 Attorneys’ responses to only two of the survey questions were strongly correlated with their responses regarding satisfaction with the outcome of the mediation—whether they believed that the mediation resulted in a fair/reasonable outcome and that the mediation helped move the case toward resolution quickly.150 In contrast, parties’ satisfaction with the mediation outcome was also strongly correlated with whether they believed that the mediation helped improve communication between the parties, that the cost of using mediation was affordable, that the mediation helped preserve the parties’ relationship, and that the mediation process was fair.151 Finally, for attorneys, there was no strong or even moderate correlation between any of their responses to these survey questions and their satisfaction with either the litigation process or the services provided by the court. In contrast, parties’ satisfaction with the litigation process was correlated with whether they believed that they had had an adequate opportunity to tell their side of the story during the mediation, that the mediation helped improve communication between the parties, that the mediation helped preserve the parties’ relationship, that the mediation helped move the case toward resolution quickly, that the mediation resulted in a fair/reasonable outcome, and that the cost of using mediation was affordable.152 Similarly, parties’ satisfaction with the court services was correlated with their responses to all of these same questions except whether they believed the mediation helped move the case toward resolution quickly.153
148 Correlation measures how strongly two variables are associated with each other, i.e., when one of the variables changes, how likely is the other to change (this does not necessarily mean that the change in one caused the change in the other, but just that they tend to move together). Correlation coefficients range from –1 to 1; a value of 0 means that there was no relationship between the variables, a value of 1 means there was a total positive relationship (when one variable changes, the other always changes the same direction), and a value of–1 means a total negative relationship (when one changes, the other always changes in the opposite direction. A correlation coefficient of .5 or above is considered to show a high correlation. The correlation coefficients of these questions with attorneys’ satisfaction with the mediation process were .54 and .58, .54 and .57, .56 and .62, and .52 and .56, respectively, in unlimited and limited cases. 149The correlation coefficients of these questions with parties’ satisfaction with the mediation process were .48 and .58, .60 and .77, .50 and .65, and .69 and .69, respectively, in unlimited and limited cases. 150The correlation coefficients of these questions with attorneys’ satisfaction with the outcome were .79 and .77 and .75 and .73, respectively, in unlimited and limited cases. 151The correlation coefficients of these questions with parties’ satisfaction with the outcome were .70 and .70, .53 and .54, .58 and .63, and .50 and .52, respectively, in unlimited and limited cases. 152The correlation coefficients of these questions with parties’ satisfaction with the litigation process were .34 and .54, .50 and .68, .40 and .59, .50 and .49, .55 and .53, and .51 and .61, respectively, in unlimited and limited cases. 153The correlation coefficients of these questions with parties’ satisfaction with the courts’ services were .41 and .58, .36 and .65, .31 and .54, .38 and .36, .41 and .51, and .50 and .61, respectively, in unlimited and limited cases.
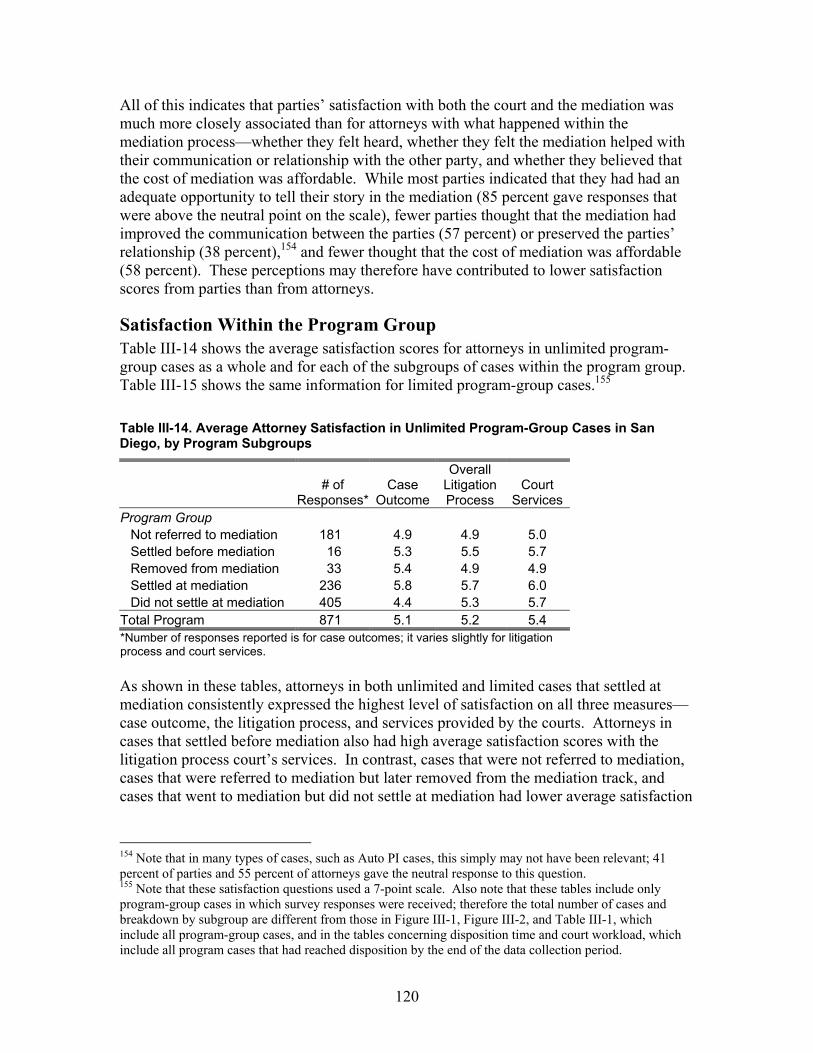
120
All of this indicates that parties’ satisfaction with both the court and the mediation was much more closely associated than for attorneys with what happened within the mediation process—whether they felt heard, whether they felt the mediation helped with their communication or relationship with the other party, and whether they believed that the cost of mediation was affordable. While most parties indicated that they had had an adequate opportunity to tell their story in the mediation (85 percent gave responses that were above the neutral point on the scale), fewer parties thought that the mediation had improved the communication between the parties (57 percent) or preserved the parties’ relationship (38 percent),154 and fewer thought that the cost of mediation was affordable (58 percent). These perceptions may therefore have contributed to lower satisfaction scores from parties than from attorneys.
Satisfaction Within the Program Group Table III-14 shows the average satisfaction scores for attorneys in unlimited program-group cases as a whole and for each of the subgroups of cases within the program group. Table III-15 shows the same information for limited program-group cases.155 Table III-14. Average Attorney Satisfaction in Unlimited Program-Group Cases in San Diego, by Program Subgroups
# of
Responses*Case
Outcome
Overall Litigation Process
Court Services
Program Group Not referred to mediation 181 4.9 4.9 5.0 Settled before mediation 16 5.3 5.5 5.7 Removed from mediation 33 5.4 4.9 4.9 Settled at mediation 236 5.8 5.7 6.0 Did not settle at mediation 405 4.4 5.3 5.7
Total Program 871 5.1 5.2 5.4 *Number of responses reported is for case outcomes; it varies slightly for litigation process and court services. As shown in these tables, attorneys in both unlimited and limited cases that settled at mediation consistently expressed the highest level of satisfaction on all three measures—case outcome, the litigation process, and services provided by the courts. Attorneys in cases that settled before mediation also had high average satisfaction scores with the litigation process court’s services. In contrast, cases that were not referred to mediation, cases that were referred to mediation but later removed from the mediation track, and cases that went to mediation but did not settle at mediation had lower average satisfaction
154 Note that in many types of cases, such as Auto PI cases, this simply may not have been relevant; 41 percent of parties and 55 percent of attorneys gave the neutral response to this question. 155 Note that these satisfaction questions used a 7-point scale. Also note that these tables include only program-group cases in which survey responses were received; therefore the total number of cases and breakdown by subgroup are different from those in Figure III-1, Figure III-2, and Table III-1, which include all program-group cases, and in the tables concerning disposition time and court workload, which include all program cases that had reached disposition by the end of the data collection period.
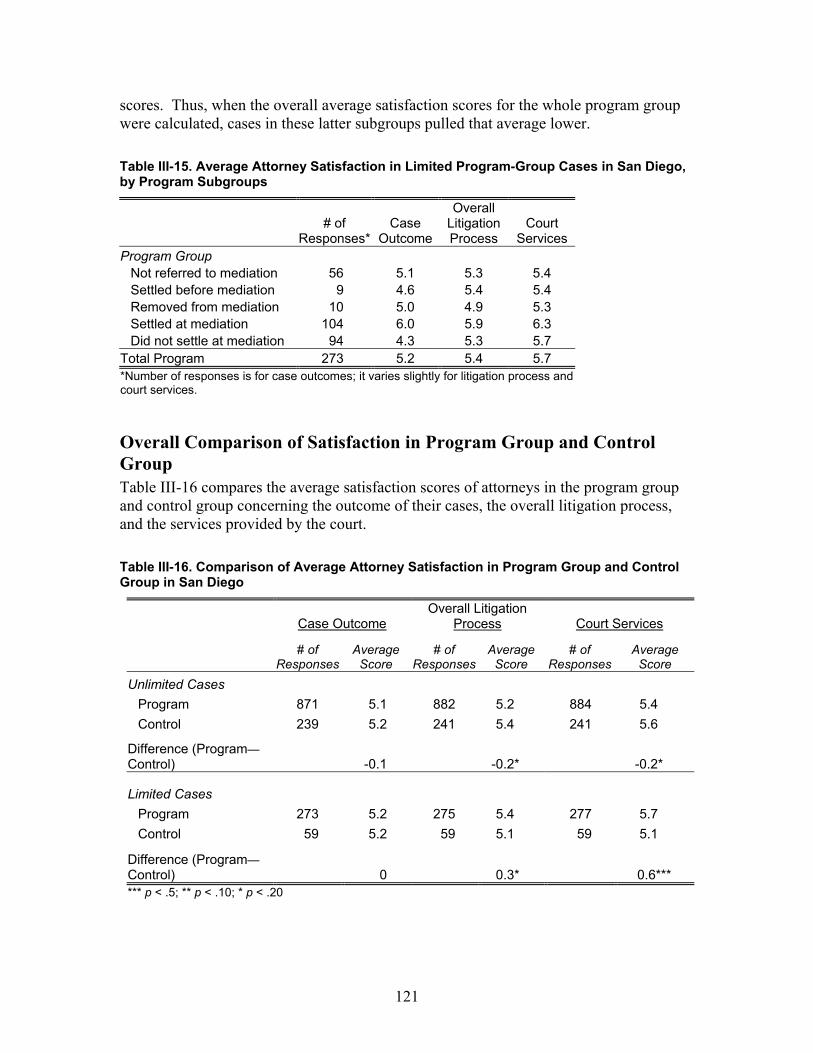
121
scores. Thus, when the overall average satisfaction scores for the whole program group were calculated, cases in these latter subgroups pulled that average lower. Table III-15. Average Attorney Satisfaction in Limited Program-Group Cases in San Diego, by Program Subgroups
# of
Responses*Case
Outcome
Overall Litigation Process
Court Services
Program Group Not referred to mediation 56 5.1 5.3 5.4 Settled before mediation 9 4.6 5.4 5.4 Removed from mediation 10 5.0 4.9 5.3 Settled at mediation 104 6.0 5.9 6.3 Did not settle at mediation 94 4.3 5.3 5.7
Total Program 273 5.2 5.4 5.7 *Number of responses is for case outcomes; it varies slightly for litigation process and court services.
Overall Comparison of Satisfaction in Program Group and Control Group Table III-16 compares the average satisfaction scores of attorneys in the program group and control group concerning the outcome of their cases, the overall litigation process, and the services provided by the court. Table III-16. Comparison of Average Attorney Satisfaction in Program Group and Control Group in San Diego
Case Outcome Overall Litigation
Process Court Services
# of
ResponsesAverage
Score # of
ResponsesAverage
Score # of
Responses Average
Score Unlimited Cases
Program 871 5.1 882 5.2 884 5.4 Control 239 5.2 241 5.4 241 5.6
Difference (Program—Control) -0.1 -0.2* -0.2*
Limited Cases Program 273 5.2 275 5.4 277 5.7 Control 59 5.2 59 5.1 59 5.1
Difference (Program—Control) 0 0.3* 0.6*** *** p < .5; ** p < .10; * p < .20
122
In limited cases, attorneys in the program group were more satisfied with the services provided by the court than attorneys in the control group; the average satisfaction with court services in the program group was 5.7 compared to 5.1 in the control group. The comparison also suggests that attorneys in limited program-group cases were more satisfied with the litigation process than attorneys in control-group cases. In unlimited cases, attorneys in the program group had slightly lower average satisfaction scores on all three measures compared to attorneys in the control group.
As discussed above, attorneys in unlimited program-group cases that were mediated under the San Diego pilot program expressed very high satisfaction (5.9 on average) with the services provided by the court. It therefore seems anomalous that some positive program impact on attorney satisfaction with the court’s services was not found for unlimited cases in the San Diego pilot program. It appears that this result stems from the fact that, unlike in other pilot programs, not being referred to pilot mediation or being removed from the pilot mediation track in unlimited cases actually reduced attorneys’ satisfaction with the court’s services in San Diego.156 Because well over half of the program group in San Diego consisted of cases that were not referred to mediation (53 percent of program group) or were removed from mediation (9 percent of program group), when the overall average for the program group as a whole was calculated, the reduced satisfaction in these cases completely offset increased satisfaction with the court’s services in cases that were mediated.
The results for satisfaction with the litigation process in San Diego are affected in this same way. Attorneys in program-group cases that were not referred to mediation in San Diego were less satisfied with the litigation process than attorneys in similar cases in the control group. When the overall average for the program group as a whole in San Diego was calculated, the reduced satisfaction in these cases completely offset increased satisfaction with the litigation process in cases that were mediated.
This indicates that, for San Diego’s pilot program, the overall average is not a good measure of the pilot program impact on attorney satisfaction with the court’s services and litigation process, because it masks the unique responses of attorneys in these different subgroups.157
Analysis of Subgroups Within the Program Group As was done with time to disposition, to better understand how different cases within the program were affected by the elements of the pilot program that they experienced, attorney satisfaction in each of the subgroups within the program group was compared to attorney satisfaction in similar cases in the control group.158
156 As discussed below, this finding comes from comparisons made using regression analysis. 157 The attorneys’ lower level of satisfaction when they were not referred to mediation or were removed from the mediation track by the court may stem from their desire to have access to the court’s mediation services. Therefore, the lower rating may actually reflect the attorneys’ high regard for these court services. 158 The regression analysis method described in Section I.B. was used to make these subgroup comparisons.

123
The results of these comparisons provide strong support for the conclusion that settling at mediation increased attorney satisfaction on all three satisfaction measures. In unlimited program-group cases, attorney satisfaction with the outcome of the cases was 9 percent higher in cases that settled at mediation compared to like cases in the control group, attorney satisfaction with the litigation process was 5 percent higher, and attorney satisfaction with the services of the court was 8 percent higher. Similarly, in limited program-group cases, attorney satisfaction with the outcome was 16 percent higher, satisfaction with the litigation process was 16 percent higher, and satisfaction with the services of the court was 23 percent higher in cases that settled at mediation compared to like cases in the control group.159 As might have been expected, attorneys’ satisfaction with the outcome in program cases corresponded to whether or not their cases settled at mediation; while satisfaction with the outcome was higher in program-group cases that settled at mediation, it was lower in program-group cases that did not settle at mediation compared to similar cases in the control group. For unlimited program-group cases that did not settle at mediation, attorney satisfaction with the outcome of the case was 15 percent lower than for similar cases in the control group. For limited program cases that did not settle at mediation, attorney satisfaction with the outcome of the case was 21 percent lower than for similar cases in the control group. However, satisfaction with the courts’ services was not tied to whether cases settled at mediation; while satisfaction with the court’s services was higher in program-group cases that settled at mediation, it was also higher in program-group cases that participated in mediation but did not settle at mediation. In limited program-group cases, attorney satisfaction with the services provided by the court was 9 percent higher for cases that were mediated but did not settle at the mediation compared to like cases in the control group. In unlimited program-group cases that did not settle at mediation, the comparison also suggested that satisfaction with the court’s services was higher than for like cases in the control group, although the size of the difference was not clear. These results suggest that it was the experience of participating in a pilot program mediation that was the key to increasing attorneys’ satisfaction with the services of the court; attorneys whose cases were mediated were more satisfied with the court’s services regardless of whether their cases settled or did not settle at the mediation. These comparisons also show that satisfaction with court’s services was lower in cases that either were not referred to mediation under the pilot program or were removed from the mediation track. Attorney satisfaction with the court services in limited program-group cases that were removed from mediation was 13 percent lower than in similar cases in the control group. For unlimited program-group cases, attorneys in both cases that were not referred to mediation and cases that were removed from the mediation track were less satisfied with the court’s services than attorneys in similar control-group cases; attorney satisfaction with the court’s services was 8 percent lower in unlimited program-
159 No statistically significant differences were found in the regression analysis between program-group cases that were settled before mediation and similar cases in the control group in terms of any of the satisfaction measures.
124
group cases that were not referred to mediation and 10 percent lower in unlimited program-group cases that were removed from mediation compared to like cases in the control group. As noted above, when the overall average satisfaction with the court’s services for unlimited cases in the program group as a whole was calculated, the reduced satisfaction in these cases completely offset the increased satisfaction in unlimited program-group cases that were mediated. Similarly, these comparisons showed that attorney satisfaction with the litigation process was 5 percent lower in unlimited program-group cases that were not referred mediation compared to similar cases in the control group. Overall, the results of this subgroup analysis support the following conclusions: • The experience of reaching settlement at mediation significantly increased attorneys’
satisfaction with all aspects of their dispute resolution experiences. • Attorneys’ satisfaction with the outcome in program cases was tied to whether or not
their cases settled at mediation, but the experience of mediation increased attorneys’ satisfaction with the services of the court, even if the case did not resolve at mediation.
• Not being referred to mediation or being removed from the mediation track had a
negative impact on attorneys’ satisfaction with the court’s services, the litigation process, or both.
Comparison of Attorney Satisfaction by Case Type Table III-17 compares the different patterns of attorney satisfaction by case type. Consistent with the overall comparisons between the program group and control group, the average satisfaction scores for unlimited cases in the program group were slightly lower than those in the control group for most case types. Also consistent with that overall comparison, the scores for satisfaction with the court’s services in limited cases in the program group were higher than in the control group for most case types. Table III-17 shows that in the “other” case type for limited cases, the average attorney scores for satisfaction with the litigation process and court services were more than 2 points higher in the program group than in the control group. In limited Auto PI cases, attorneys’ satisfaction with the services of the court was .8 point higher and satisfaction with the overall litigation process was .6 higher than in the control group.
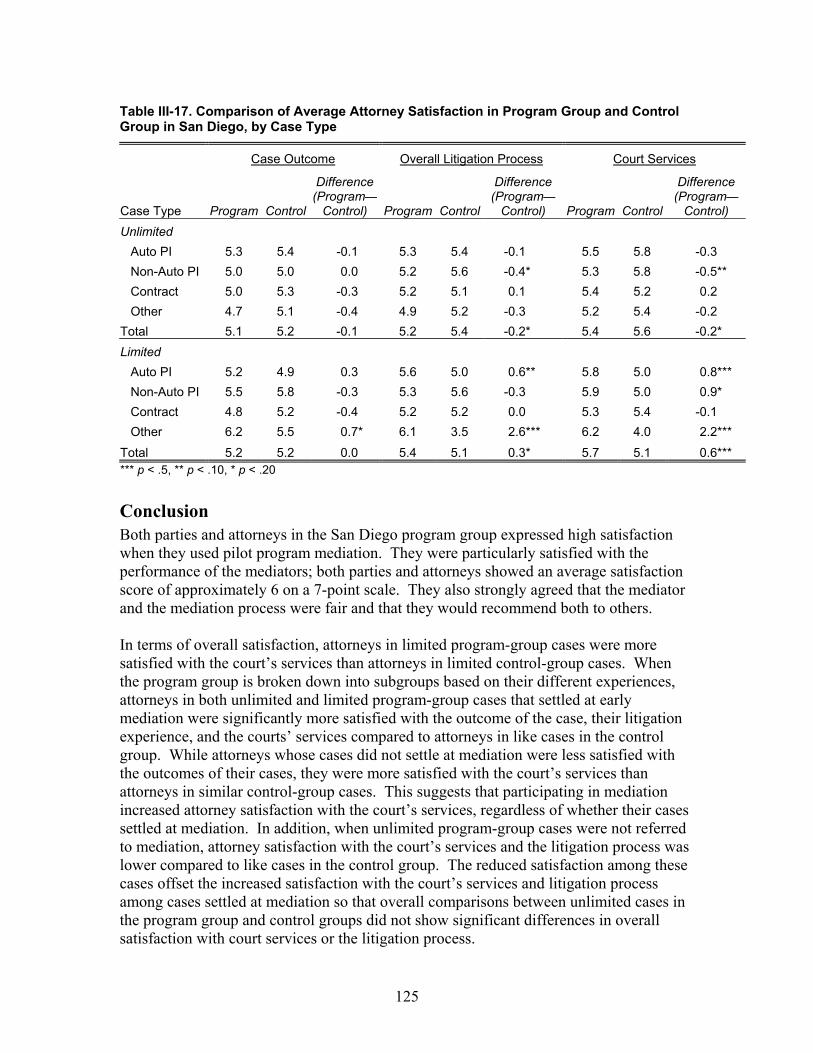
125
Table III-17. Comparison of Average Attorney Satisfaction in Program Group and Control Group in San Diego, by Case Type
Case Outcome Overall Litigation Process Court Services
Case Type Program Control
Difference (Program—
Control) Program Control
Difference (Program—
Control) Program Control
Difference (Program—
Control) Unlimited
Auto PI 5.3 5.4 -0.1 5.3 5.4 -0.1 5.5 5.8 -0.3 Non-Auto PI 5.0 5.0 0.0 5.2 5.6 -0.4* 5.3 5.8 -0.5** Contract 5.0 5.3 -0.3 5.2 5.1 0.1 5.4 5.2 0.2 Other 4.7 5.1 -0.4 4.9 5.2 -0.3 5.2 5.4 -0.2
Total 5.1 5.2 -0.1 5.2 5.4 -0.2* 5.4 5.6 -0.2* Limited
Auto PI 5.2 4.9 0.3 5.6 5.0 0.6** 5.8 5.0 0.8*** Non-Auto PI 5.5 5.8 -0.3 5.3 5.6 -0.3 5.9 5.0 0.9* Contract 4.8 5.2 -0.4 5.2 5.2 0.0 5.3 5.4 -0.1 Other 6.2 5.5 0.7* 6.1 3.5 2.6*** 6.2 4.0 2.2***
Total 5.2 5.2 0.0 5.4 5.1 0.3* 5.7 5.1 0.6*** *** p < .5, ** p < .10, * p < .20
Conclusion Both parties and attorneys in the San Diego program group expressed high satisfaction when they used pilot program mediation. They were particularly satisfied with the performance of the mediators; both parties and attorneys showed an average satisfaction score of approximately 6 on a 7-point scale. They also strongly agreed that the mediator and the mediation process were fair and that they would recommend both to others. In terms of overall satisfaction, attorneys in limited program-group cases were more satisfied with the court’s services than attorneys in limited control-group cases. When the program group is broken down into subgroups based on their different experiences, attorneys in both unlimited and limited program-group cases that settled at early mediation were significantly more satisfied with the outcome of the case, their litigation experience, and the courts’ services compared to attorneys in like cases in the control group. While attorneys whose cases did not settle at mediation were less satisfied with the outcomes of their cases, they were more satisfied with the court’s services than attorneys in similar control-group cases. This suggests that participating in mediation increased attorney satisfaction with the court’s services, regardless of whether their cases settled at mediation. In addition, when unlimited program-group cases were not referred to mediation, attorney satisfaction with the court’s services and the litigation process was lower compared to like cases in the control group. The reduced satisfaction among these cases offset the increased satisfaction with the court’s services and litigation process among cases settled at mediation so that overall comparisons between unlimited cases in the program group and control groups did not show significant differences in overall satisfaction with court services or the litigation process.
126
I. Impact of San Diego’s Pilot Program on Litigant Costs
Summary of Findings Litigants’ costs and the attorney hours spent in reaching resolution were reduced in cases that settled at pilot program mediations in San Diego. • The actual time attorneys estimated they spent in reaching resolution was 16 percent
lower in program-group cases that settled at mediation than in similar cases in the control group. Comparisons between program-group cases that settled at mediation and similar control-group cases also suggested that actual litigant costs estimated by attorneys were lower in program-group cases that settled at mediation.
• In cases that settled at mediation, 87 percent of attorneys responding to the study
survey estimated some savings in both litigant costs and attorney hours from using mediation to reach settlement. Average savings estimated by attorneys per settled case were $9,159 in litigant costs and 50 hours in attorney time. Based on these attorney estimates, a total of $24,784,254 in litigant costs and 135,300 in attorney hours was estimated to have been saved in all 2000 and 2001 cases that were settled at mediation in San Diego.
Introduction This section examines the impact of the pilot program on litigants’ costs. As described in detail in Section I.B., information on litigant costs was collected in two ways. First, in a survey distributed at the end of the mediation in cases that went to mediation between July 2001 and June 2002 (“postmediation survey”), attorneys in the subset of cases that resolved at mediation were asked to provide (1) an estimate of the time they had actually spent on the cases and their clients’ actual litigation costs; and (2) an estimate of the time they would have spent and what the costs to their clients would have been had they not used mediation. The difference between these estimates represents the attorneys’ subjective estimate of the litigant cost and attorney time savings when the case settled at the mediation. Second, in a separate survey administered shortly after disposition in both program and control cases between July 2001 and June 2002 (“postdisposition survey”), attorneys were asked to provide an estimate of the time they had actually spent on the case and their clients’ actual litigation costs. Comparisons between these actual time and cost estimates in the program and control groups provide a more objective measure of the pilot program’s impact on litigant costs. As was discussed in the data and methods section, however, the data on litigant costs and attorney time from the postdisposition survey had a very skewed distribution: there were a few cases with very large litigant cost and attorney time estimates (“outlier” cases) that stretched out the data’s range. While several methods were used to try to account for this skewed distribution, the range of the data was so broad that none of the differences found in direct comparisons between the program and control groups as a whole or in the case-type comparison were statistically significant—it was not possible to tell with sufficient
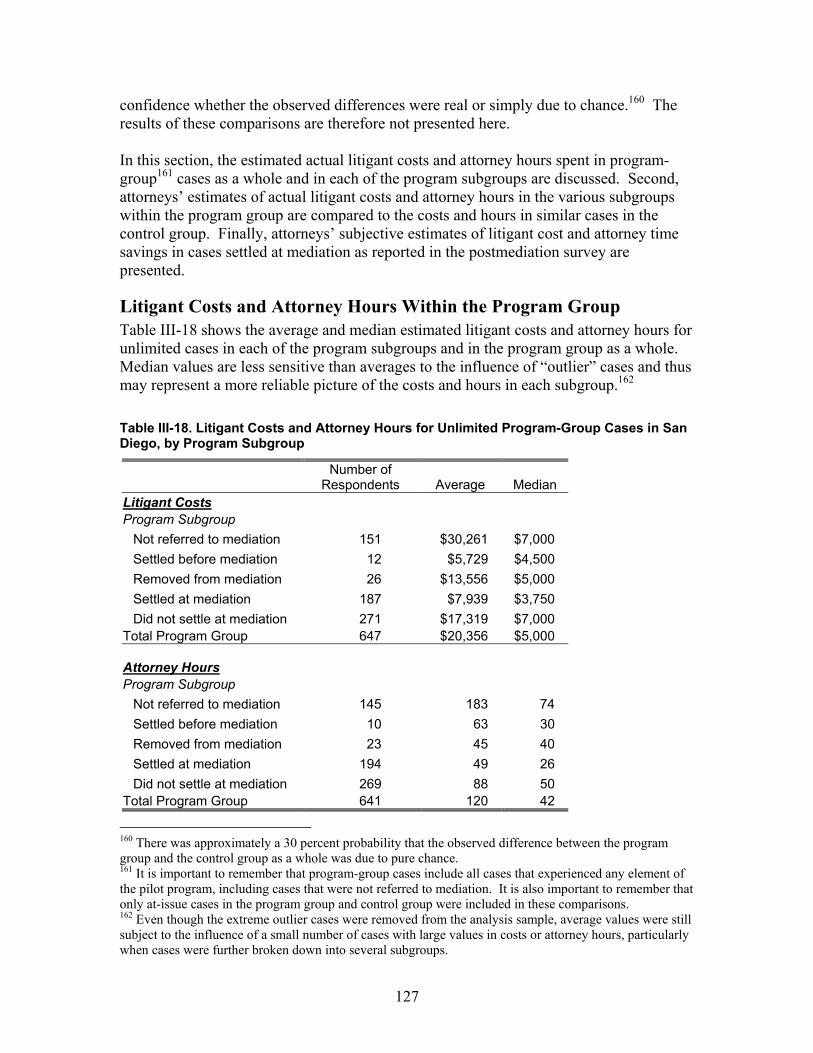
127
confidence whether the observed differences were real or simply due to chance.160 The results of these comparisons are therefore not presented here. In this section, the estimated actual litigant costs and attorney hours spent in program-group161 cases as a whole and in each of the program subgroups are discussed. Second, attorneys’ estimates of actual litigant costs and attorney hours in the various subgroups within the program group are compared to the costs and hours in similar cases in the control group. Finally, attorneys’ subjective estimates of litigant cost and attorney time savings in cases settled at mediation as reported in the postmediation survey are presented.
Litigant Costs and Attorney Hours Within the Program Group Table III-18 shows the average and median estimated litigant costs and attorney hours for unlimited cases in each of the program subgroups and in the program group as a whole. Median values are less sensitive than averages to the influence of “outlier” cases and thus may represent a more reliable picture of the costs and hours in each subgroup.162 Table III-18. Litigant Costs and Attorney Hours for Unlimited Program-Group Cases in San Diego, by Program Subgroup
Number of
Respondents Average Median Litigant Costs Program Subgroup
Not referred to mediation 151 $30,261 $7,000 Settled before mediation 12 $5,729 $4,500 Removed from mediation 26 $13,556 $5,000 Settled at mediation 187 $7,939 $3,750 Did not settle at mediation 271 $17,319 $7,000
Total Program Group 647 $20,356 $5,000 Attorney Hours Program Subgroup
Not referred to mediation 145 183 74 Settled before mediation 10 63 30 Removed from mediation 23 45 40 Settled at mediation 194 49 26 Did not settle at mediation 269 88 50
Total Program Group 641 120 42
160 There was approximately a 30 percent probability that the observed difference between the program group and the control group as a whole was due to pure chance. 161 It is important to remember that program-group cases include all cases that experienced any element of the pilot program, including cases that were not referred to mediation. It is also important to remember that only at-issue cases in the program group and control group were included in these comparisons. 162 Even though the extreme outlier cases were removed from the analysis sample, average values were still subject to the influence of a small number of cases with large values in costs or attorney hours, particularly when cases were further broken down into several subgroups.
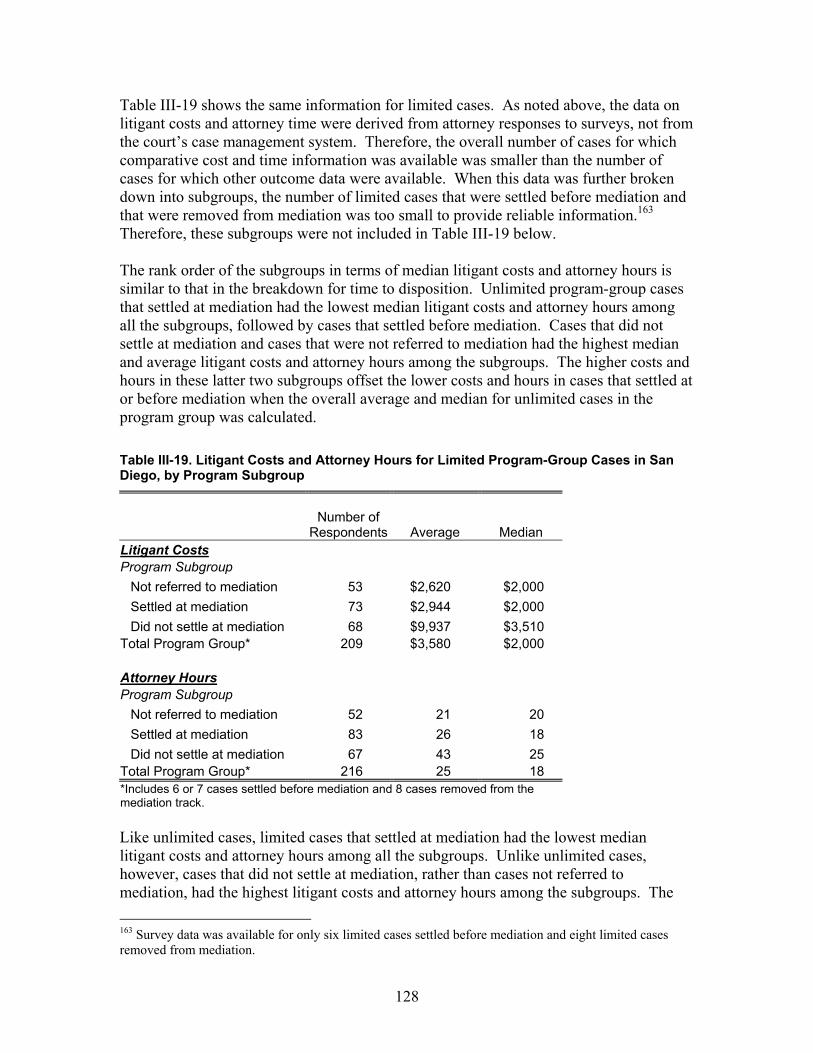
128
Table III-19 shows the same information for limited cases. As noted above, the data on litigant costs and attorney time were derived from attorney responses to surveys, not from the court’s case management system. Therefore, the overall number of cases for which comparative cost and time information was available was smaller than the number of cases for which other outcome data were available. When this data was further broken down into subgroups, the number of limited cases that were settled before mediation and that were removed from mediation was too small to provide reliable information.163 Therefore, these subgroups were not included in Table III-19 below. The rank order of the subgroups in terms of median litigant costs and attorney hours is similar to that in the breakdown for time to disposition. Unlimited program-group cases that settled at mediation had the lowest median litigant costs and attorney hours among all the subgroups, followed by cases that settled before mediation. Cases that did not settle at mediation and cases that were not referred to mediation had the highest median and average litigant costs and attorney hours among the subgroups. The higher costs and hours in these latter two subgroups offset the lower costs and hours in cases that settled at or before mediation when the overall average and median for unlimited cases in the program group was calculated. Table III-19. Litigant Costs and Attorney Hours for Limited Program-Group Cases in San Diego, by Program Subgroup
Number of
Respondents Average Median Litigant Costs Program Subgroup
Not referred to mediation 53 $2,620 $2,000 Settled at mediation 73 $2,944 $2,000 Did not settle at mediation 68 $9,937 $3,510
Total Program Group* 209 $3,580 $2,000 Attorney Hours Program Subgroup
Not referred to mediation 52 21 20 Settled at mediation 83 26 18 Did not settle at mediation 67 43 25
Total Program Group* 216 25 18 *Includes 6 or 7 cases settled before mediation and 8 cases removed from the mediation track. Like unlimited cases, limited cases that settled at mediation had the lowest median litigant costs and attorney hours among all the subgroups. Unlike unlimited cases, however, cases that did not settle at mediation, rather than cases not referred to mediation, had the highest litigant costs and attorney hours among the subgroups. The 163 Survey data was available for only six limited cases settled before mediation and eight limited cases removed from mediation.
129
higher costs and hours in this subgroup offset the lower costs and hours in cases that settled at mediation when the overall average and median for limited cases in the program group were calculated.
Analysis of Subgroups Within the Program Group As was done with time to disposition and litigant satisfaction, to better understand how different cases within the program were influenced by the elements of the pilot program that they experienced, average litigant costs and attorney hours in each of the subgroups within the program group were compared to the costs and hours in similar cases in the control group.164 However, unlimited and limited cases were not analyzed separately; the data on both types of cases were combined for this analysis.165 The results of this comparison support the conclusion that settling at mediation reduced litigant costs and attorney time. Attorney hours were 16 percent lower in program-group cases that settled at mediation than in cases in the control group with similar characteristics. The analysis also indicated that litigant costs were lower in program-group cases that settled at mediation compared to similar cases in the control group, but the size of this reduction was not clear. These results are consistent with the study results showing positive impacts on time to disposition and satisfaction when cases settled at mediation.
Attorneys’ Estimates of Mediation Resolution’s Impact on Litigant Costs and Attorney Hours Attorneys whose cases resolved at mediation overwhelmingly believed that the mediation had saved their clients money. Of the attorneys whose cases settled at mediation and who responded to the postmediation survey, 87 percent estimated some cost savings for their clients. Table III-20 shows the average savings in both litigant costs and attorney hours estimated by these attorneys. It also shows what percentage savings these estimates represent. As shown in this table, in those cases in which the attorneys reported savings from resolving at mediation, they estimated average cost saving per client of approximately $12,500; average saving in attorney hours was estimated to be 63 hours. These attorney estimates represent a saving of approximately 60 percent, on average, in both litigant costs and attorney time.
164 The regression analysis method described in Section I.B. was used to make these subgroup comparisons. 165 The reliability of the regression analysis, like the direct comparisons between the program and control groups, was affected by the skewed distribution of the litigant cost and attorney time data. With the program group divided into unlimited and limited cases the analysis produced no statistically significant results. Combining all unlimited and limited cases created a larger sample size that increased the reliability of the regression results. Note that whether the case was unlimited or limited was accounted for in the combined analysis by making this unlimited/limited designation one of the variables used in the regression/analysis. In addition, before the data on unlimited and limited cases were combined, separate regression analyses were performed on unlimited and limited cases. These separate analyses suggested the same types of program impacts in the same subgroups as those occurring in the combined analysis; however, the statistical significance of the observed differences was lower than in the combined analysis.
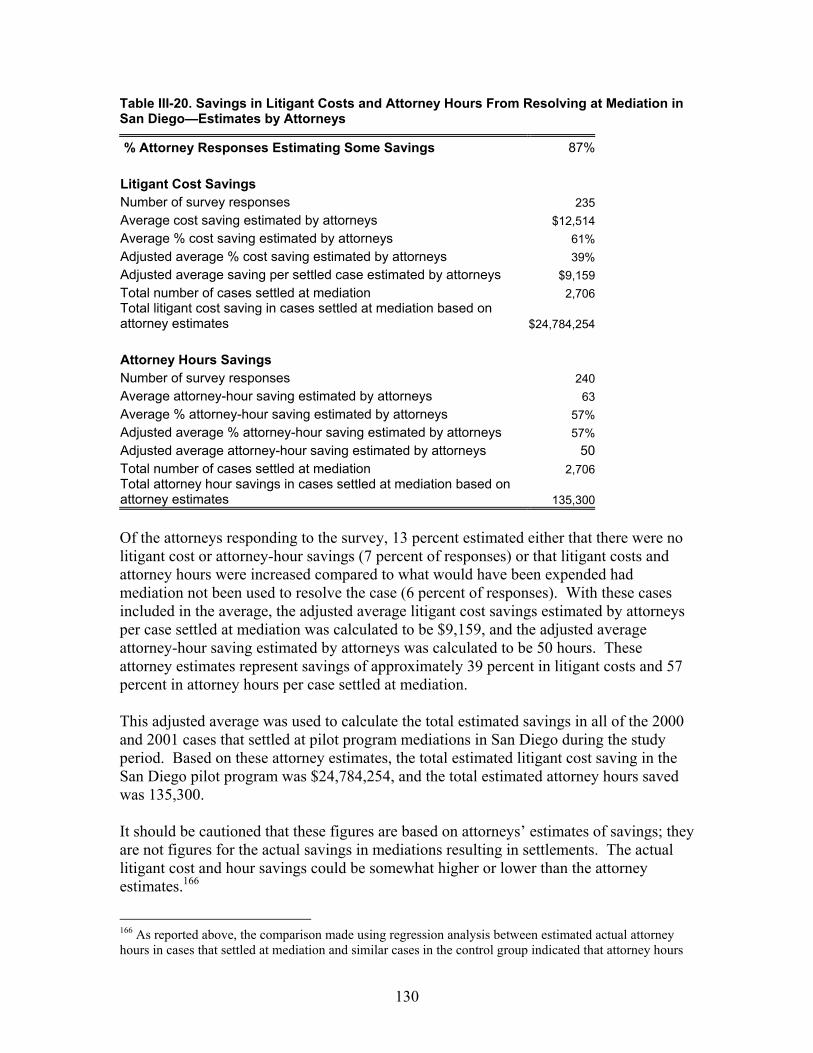
130
Table III-20. Savings in Litigant Costs and Attorney Hours From Resolving at Mediation in San Diego—Estimates by Attorneys
% Attorney Responses Estimating Some Savings 87% Litigant Cost Savings Number of survey responses 235Average cost saving estimated by attorneys $12,514Average % cost saving estimated by attorneys 61%Adjusted average % cost saving estimated by attorneys 39%Adjusted average saving per settled case estimated by attorneys $9,159 Total number of cases settled at mediation 2,706Total litigant cost saving in cases settled at mediation based on attorney estimates $24,784,254 Attorney Hours Savings Number of survey responses 240Average attorney-hour saving estimated by attorneys 63Average % attorney-hour saving estimated by attorneys 57%Adjusted average % attorney-hour saving estimated by attorneys 57%Adjusted average attorney-hour saving estimated by attorneys 50Total number of cases settled at mediation 2,706Total attorney hour savings in cases settled at mediation based on attorney estimates 135,300
Of the attorneys responding to the survey, 13 percent estimated either that there were no litigant cost or attorney-hour savings (7 percent of responses) or that litigant costs and attorney hours were increased compared to what would have been expended had mediation not been used to resolve the case (6 percent of responses). With these cases included in the average, the adjusted average litigant cost savings estimated by attorneys per case settled at mediation was calculated to be $9,159, and the adjusted average attorney-hour saving estimated by attorneys was calculated to be 50 hours. These attorney estimates represent savings of approximately 39 percent in litigant costs and 57 percent in attorney hours per case settled at mediation. This adjusted average was used to calculate the total estimated savings in all of the 2000 and 2001 cases that settled at pilot program mediations in San Diego during the study period. Based on these attorney estimates, the total estimated litigant cost saving in the San Diego pilot program was $24,784,254, and the total estimated attorney hours saved was 135,300. It should be cautioned that these figures are based on attorneys’ estimates of savings; they are not figures for the actual savings in mediations resulting in settlements. The actual litigant cost and hour savings could be somewhat higher or lower than the attorney estimates.166
166 As reported above, the comparison made using regression analysis between estimated actual attorney hours in cases that settled at mediation and similar cases in the control group indicated that attorney hours
131
It should also be cautioned that these estimated savings are for cases settled at mediation only, not for all cases in the program group. There may also have been savings or increases in litigant cost or attorney hours in other subgroups of program cases, such as those that were referred to mediation but settled before the mediation took place or cases that were mediated but did not settle at the mediation.167
Conclusion There was evidence that both litigant costs and attorney time were reduced when cases resolved at mediation. The actual time attorneys estimated they spent on resolving cases was 16 percent lower in program-group cases that settled at mediation than in cases in the control group with similar case characteristics. Comparisons between program-group cases and similar cases in the control group also indicated that actual litigant costs estimated by attorneys were lower in program-group cases that settled at mediation, but the size of this reduction was not clear. Attorneys in cases that resolved at mediation had a strong favorable perception about the cost-saving benefit of mediation; 87 percent of attorneys responding to the survey estimated some savings in both litigant costs and attorney hours from using mediation to reach settlement. Average savings estimated by attorneys per case settled at mediation were $9,159 in litigant costs and 50 hours in attorney time. Based on these attorney estimates, a total savings of $24,784,254 in litigant costs and 135,300 in attorney hours were estimated for all 2000 and 2001 cases that were settled at mediation.
were 16 percent lower in program-group cases that settled at mediation, while the attorneys estimated and savings of 57 percent. 167 Some support for the conclusion that mediation may have reduced costs even in cases that did not settle at mediation comes from 59 postmediation survey responses in which attorneys in cases that did not settle at mediation provided litigant cost and attorney-hour information even though it had not been requested. Approximately 60 percent of these survey responses indicated some savings in litigant costs, attorney hours, or both in these cases that were mediated but did not settle at mediation. When responses that estimated no savings or increased costs are also taken into account, the attorneys in these cases estimated average savings of 45 percent in litigant costs (50 percent median savings) and 41 percent in attorney hours (50 percent median savings) in cases that did not settle at mediation.
132
J. Impact of San Diego’s Pilot Program on the Court’s Workload
Summary of Findings There is strong evidence that the pilot program in San Diego significantly reduced the court’s workload. • In addition to the reduction in trials discussed above, the pilot program reduced the
average number of pretrial court events by approximately 16 percent for unlimited cases and 22 percent for limited cases in the program group compared to the control group.
• The reductions were larger for cases that settled at mediation; the average number of
court events was reduced by 40–45 percent for both limited and unlimited cases in the program group that settled at mediation compared to like cases in the control group.
• The smaller number of court events in the program group means that the time that
judges would have been spent on these events could be devoted to other cases needing judicial time and attention; the total time savings were 306 judge days for program-group cases filed in 2000 and 337 judge days for program-group cases filed in 2001.
• When the program-group reductions were annualized and potential reductions if the
program were available to control-group cases are added, the total potential time saving from the reduced number of court events was estimated at 479 judge days per year (with an estimated monetary value of approximately $1.4 million per year).
• Reductions in court workload were most pronounced for unlimited automobile
personal injury cases and limited contract cases. • There were also fewer postdisposition compliance problems and fewer new
proceedings initiated in program-group cases, suggesting that the pilot program may have reduced the court’s future workload.
Introduction In an earlier section, this report discussed the substantial impact the San Diego pilot program had on the court’s workload by reducing the number of cases tried. In this section, the pilot program impacts on the court’s workload are further examined by comparing the frequency of various pretrial court events in the program group and control group. The analysis in this section focuses on three major types of court events: (1) case management conferences (CMCs), (2) motion hearings,168 and (3) other pretrial
168 Motion hearings are grouped into three distinct types in the San Diego court’s case management system: quick, medium, and heavy motions. Examples of quick motions are ex parte, motions to dismiss, and simple discovery motions; medium motions include motions to continue trial and longer discovery motions; and heavy motions include demurrers and motions for summary judgment.
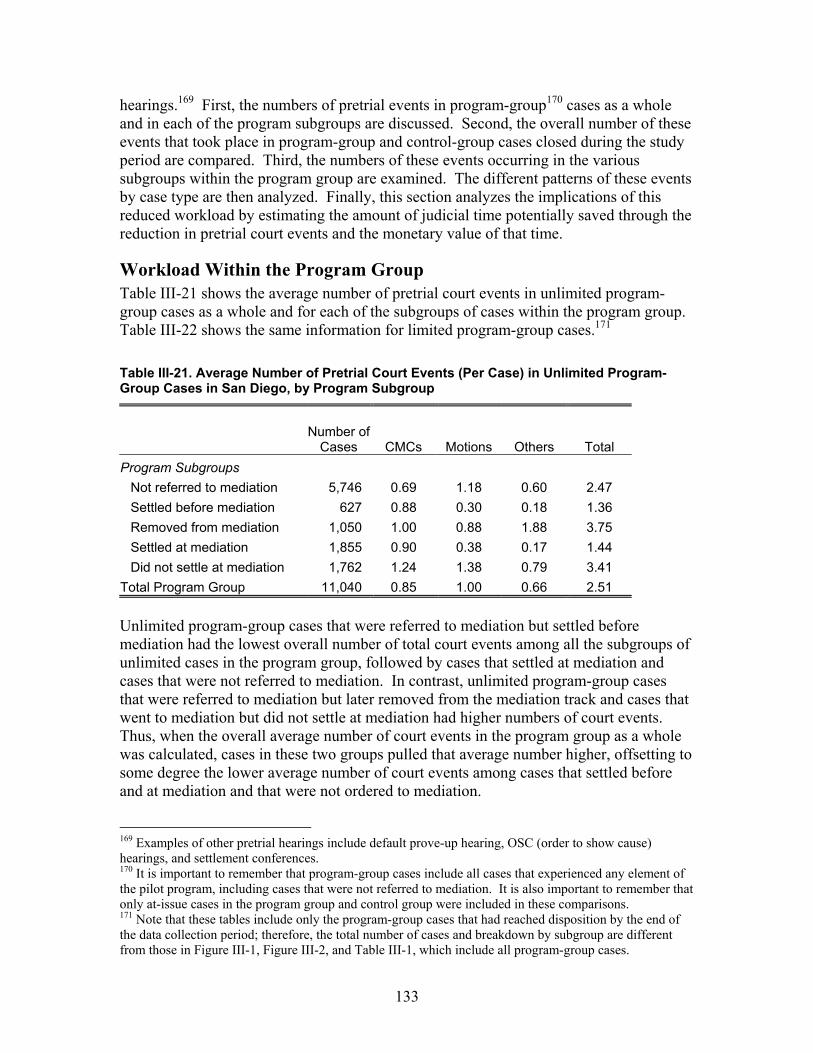
133
hearings.169 First, the numbers of pretrial events in program-group170 cases as a whole and in each of the program subgroups are discussed. Second, the overall number of these events that took place in program-group and control-group cases closed during the study period are compared. Third, the numbers of these events occurring in the various subgroups within the program group are examined. The different patterns of these events by case type are then analyzed. Finally, this section analyzes the implications of this reduced workload by estimating the amount of judicial time potentially saved through the reduction in pretrial court events and the monetary value of that time.
Workload Within the Program Group Table III-21 shows the average number of pretrial court events in unlimited program-group cases as a whole and for each of the subgroups of cases within the program group. Table III-22 shows the same information for limited program-group cases.171 Table III-21. Average Number of Pretrial Court Events (Per Case) in Unlimited Program-Group Cases in San Diego, by Program Subgroup
Number of
Cases CMCs Motions Others Total Program Subgroups
Not referred to mediation 5,746 0.69 1.18 0.60 2.47 Settled before mediation 627 0.88 0.30 0.18 1.36 Removed from mediation 1,050 1.00 0.88 1.88 3.75 Settled at mediation 1,855 0.90 0.38 0.17 1.44 Did not settle at mediation 1,762 1.24 1.38 0.79 3.41
Total Program Group 11,040 0.85 1.00 0.66 2.51 Unlimited program-group cases that were referred to mediation but settled before mediation had the lowest overall number of total court events among all the subgroups of unlimited cases in the program group, followed by cases that settled at mediation and cases that were not referred to mediation. In contrast, unlimited program-group cases that were referred to mediation but later removed from the mediation track and cases that went to mediation but did not settle at mediation had higher numbers of court events. Thus, when the overall average number of court events in the program group as a whole was calculated, cases in these two groups pulled that average number higher, offsetting to some degree the lower average number of court events among cases that settled before and at mediation and that were not ordered to mediation.
169 Examples of other pretrial hearings include default prove-up hearing, OSC (order to show cause) hearings, and settlement conferences. 170 It is important to remember that program-group cases include all cases that experienced any element of the pilot program, including cases that were not referred to mediation. It is also important to remember that only at-issue cases in the program group and control group were included in these comparisons. 171 Note that these tables include only the program-group cases that had reached disposition by the end of the data collection period; therefore, the total number of cases and breakdown by subgroup are different from those in Figure III-1, Figure III-2, and Table III-1, which include all program-group cases.

134
This pattern—low numbers of events in cases that settled at or before mediation and high numbers of events in cases that were removed from or did not settle at mediation—was fairly consistent across all three types of court events, with one exception: cases that were not referred to mediation had the lowest number of CMCs of all the subgroups. Table III-22. Average Number of Pretrial Court Events (Per Case) in Limited Program-Group Cases in San Diego, by Program Subgroup
Number of
Cases CMCs Motions Others Total Program Subgroups
Not referred to mediation 3,462 0.42 0.25 0.44 1.12 Settled before mediation 291 0.90 0.13 0.26 1.30 Removed from mediation 453 1.00 0.49 1.70 3.19 Settled at mediation 845 0.89 0.14 0.17 1.19 Did not settle at mediation 503 1.34 0.54 0.74 2.61
Total Program Group 5,554 0.65 0.27 0.52 1.44 With one exception, the pattern of court events among the subgroups of limited program-group cases was similar to that in unlimited cases. In contrast to unlimited cases, limited program-group cases that were not referred to mediation, by far the largest subgroup, had the smallest overall average number of court events of all the subgroups, even smaller than for cases that settled at or before mediation. This low overall number of court events appears to stem largely from the low number of CMCs in cases not referred to mediation.
Overall Comparison of Workload in Program and Control Groups Table III-23 compares the average number of CMCs, motion hearings, and other pretrial hearings in the program and control groups in San Diego. As shown in this table, the pilot program in San Diego resulted in substantial reductions in the overall number of pretrial events for both limited and unlimited cases in the program. For unlimited cases, Table III-23 shows that average number of all pretrial events was 16 percent lower in the program group than in the control group. The pilot program had the greatest impact on motion hearings in unlimited cases, with a reduction of 25 percent for program cases compared to cases in the control group. Other pretrial hearings were reduced by 16 percent. There was virtually no difference in the numbers of CMCs conducted in unlimited program- and control-group cases. For limited cases, the overall average number of pretrial events was 22 percent lower in the program group than in the control group. In contrast to unlimited cases, for limited cases the pilot program in San Diego consistently reduced all three event types. Table

135
III-23 shows that the average number of CMCs for limited cases in the program was reduced by 15 percent compared to cases in the control group; the average number of motion hearings was lower by 19 percent; and other hearings for program cases experienced a substantial 32 percent reduction. Table III-23. Comparison of Average Number of Pretrial Court Events (Per Case) in Program-Group and Control-Group Cases in San Diego
Average # of Pretrial Hearings
# of Cases CMCs Motions Others Total Unlimited
Program 11,040 0.85 1.00 0.66 2.51 Control 4,493 0.84 1.35 0.81 3.00
% Difference 1% -26%*** -19%*** -16%***
Limited Program 5,554 0.65 0.27 0.52 1.44 Control 1,279 0.75 0.33 0.77 1.85
% Difference -13%*** -18%*** -32%*** -22%*** Note: Percentage difference between program and control is calculated as (program—control) / control. *** p < .5, ** p < .10, * p < .20.
Analysis of Subgroups Within the Program Group As was done with time to disposition, litigant satisfaction, and litigants costs, to better understand how different cases within the program group were influenced by the elements of the pilot program that they experienced, the average number of pretrial court events in each of the subgroups within the program group was compared to the number of such events in similar cases in the control group.172 Overall, these comparisons provide strong support for the conclusion that, for both limited and unlimited cases, the court’s workload was reduced when settlement was reached at mediation. Unlimited program-group cases that settled at mediation had 45 percent fewer court events overall compared to similar cases in the control group. Similarly, limited program-group cases that settled at mediation had 40 percent fewer court events overall compared to like cases in the control group. These comparisons also support the conclusion that the court’s workload was reduced when cases settled before mediation; unlimited program-group cases that settled before mediation had 45 percent fewer court events overall compared to similar cases in the control group.173
172 The regression analysis method described in Section I.B. was used to make these subgroup comparisons. 173 Because of the small number of limited cases that settled before mediation in the survey sample (only 10 cases), the regression analysis did not produce conclusive results about whether limited cases that settled before mediation had fewer court events.
136
The reduction in the total number of court events in cases that settled at or before mediation stemmed from reductions in the numbers of motion hearings and other pretrial hearings, not from any reduction in the number of CMCs. The analysis showed that unlimited cases that settled at mediation had 75 percent fewer motion hearing, and 70 fewer other pretrial hearings than similar cases in the control group, but that unlimited program-group cases that settled at mediation actually had 16 percent more CMCs than like cases in the control group. Similarly, limited cases that settled at mediation had 70 percent fewer motion hearings and 90 percent fewer other pretrial hearings but 50 percent more CMCs compared to like cases in the control group. Similarly, unlimited program-group cases that settled before mediation had 80 percent fewer motion hearings but also had 16 percent more CMCs compared to like cases in the control group. Interestingly, these comparisons did not find an increase in the court’s overall workload when cases did not settle at mediation. No statistically significant difference was found in the overall total number of pretrial events in cases that went to mediation but did not settle at mediation compared to similar cases in the control group. It appears that while there were increases in the number of CMCs in these cases, this increase was offset by decreases in the number of other hearings. In unlimited program-group cases, the number of CMCs was 48 percent higher in cases that did not settle at mediation compared to similar cases in the control group, but the number of other pretrial hearings was lower than for similar cases in the control group (the size of this difference was not clear). Similarly, for limited program-group cases, the number of CMCs was 97 percent higher in cases that did not settle at mediation compared to similar cases in the control group, but the number of other pretrial hearings in these cases was 40 percent lower than in similar control-group cases. For cases that were not referred to mediation or were removed from the mediation track, the results of the subgroup comparisons were different in unlimited and limited cases. No statistically significant difference was found between unlimited program-group cases that were not referred to mediation and similar control-group cases in terms of the number of CMCs, motions, or other hearings. However, for limited program-group cases, the comparison suggested a reduction in the number of motion hearings in cases that were not referred to mediation compared to similar control-group cases. For unlimited program-group cases that were removed from mediation, the comparisons show no statistically significant difference in the total number of pretrial events compared to similar cases in the control group; increases in the number of CMCs and other pretrial hearings in these cases were offset by decreases in the number of motion hearings. However, for limited program-group cases, the total number of court events was higher in cases that were removed from the mediation track compared to similar cases in the control group; in contrast to unlimited cases, there was no decrease in the number of motion hearings to offset the increase in CMCs in these cases. Overall, the results of this subgroup analysis support the following conclusions: • When cases were settled at or before mediation, the number of motions and other
hearings were significantly reduced.
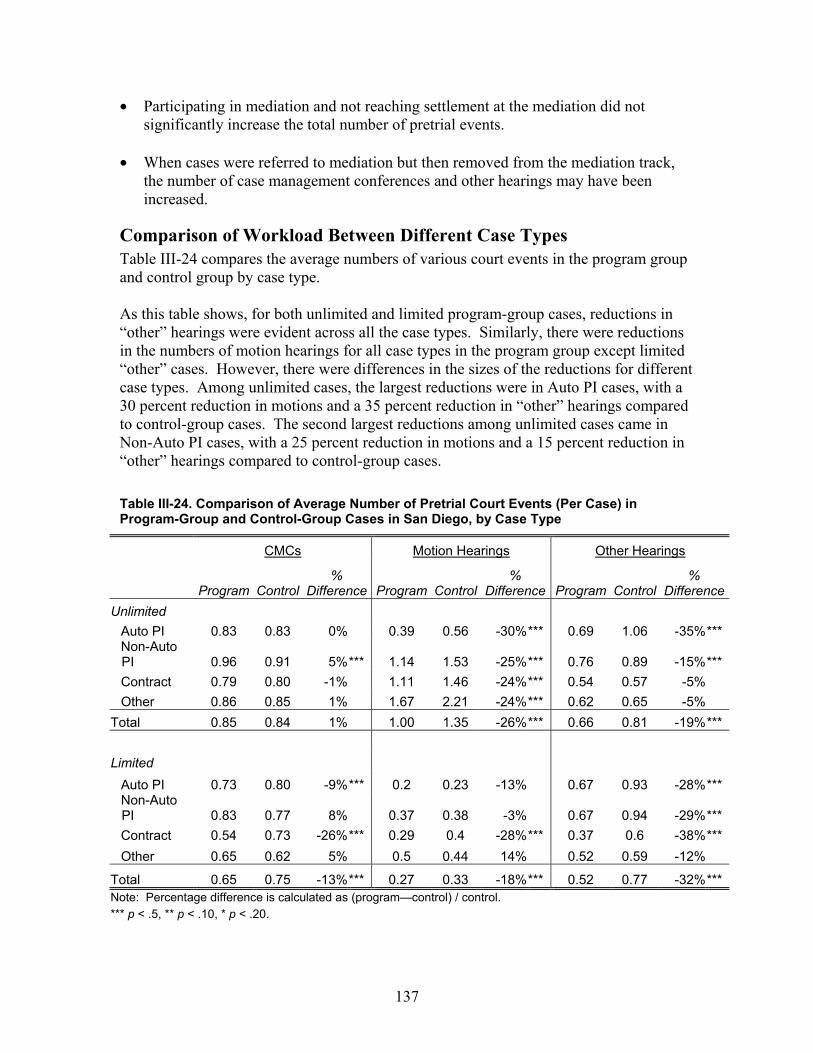
137
• Participating in mediation and not reaching settlement at the mediation did not significantly increase the total number of pretrial events.
• When cases were referred to mediation but then removed from the mediation track,
the number of case management conferences and other hearings may have been increased.
Comparison of Workload Between Different Case Types Table III-24 compares the average numbers of various court events in the program group and control group by case type. As this table shows, for both unlimited and limited program-group cases, reductions in “other” hearings were evident across all the case types. Similarly, there were reductions in the numbers of motion hearings for all case types in the program group except limited “other” cases. However, there were differences in the sizes of the reductions for different case types. Among unlimited cases, the largest reductions were in Auto PI cases, with a 30 percent reduction in motions and a 35 percent reduction in “other” hearings compared to control-group cases. The second largest reductions among unlimited cases came in Non-Auto PI cases, with a 25 percent reduction in motions and a 15 percent reduction in “other” hearings compared to control-group cases. Table III-24. Comparison of Average Number of Pretrial Court Events (Per Case) in Program-Group and Control-Group Cases in San Diego, by Case Type
CMCs Motion Hearings Other Hearings
Program Control %
Difference Program Control%
Difference Program Control%
DifferenceUnlimited
Auto PI 0.83 0.83 0% 0.39 0.56 -30%*** 0.69 1.06 -35%***Non-Auto
PI 0.96 0.91 5%*** 1.14 1.53 -25%*** 0.76 0.89 -15%***Contract 0.79 0.80 -1% 1.11 1.46 -24%*** 0.54 0.57 -5% Other 0.86 0.85 1% 1.67 2.21 -24%*** 0.62 0.65 -5%
Total 0.85 0.84 1% 1.00 1.35 -26%*** 0.66 0.81 -19%*** Limited
Auto PI 0.73 0.80 -9%*** 0.2 0.23 -13% 0.67 0.93 -28%***Non-Auto
PI 0.83 0.77 8% 0.37 0.38 -3% 0.67 0.94 -29%***Contract 0.54 0.73 -26%*** 0.29 0.4 -28%*** 0.37 0.6 -38%***Other 0.65 0.62 5% 0.5 0.44 14% 0.52 0.59 -12%
Total 0.65 0.75 -13%*** 0.27 0.33 -18%*** 0.52 0.77 -32%***Note: Percentage difference is calculated as (program—control) / control. *** p < .5, ** p < .10, * p < .20.
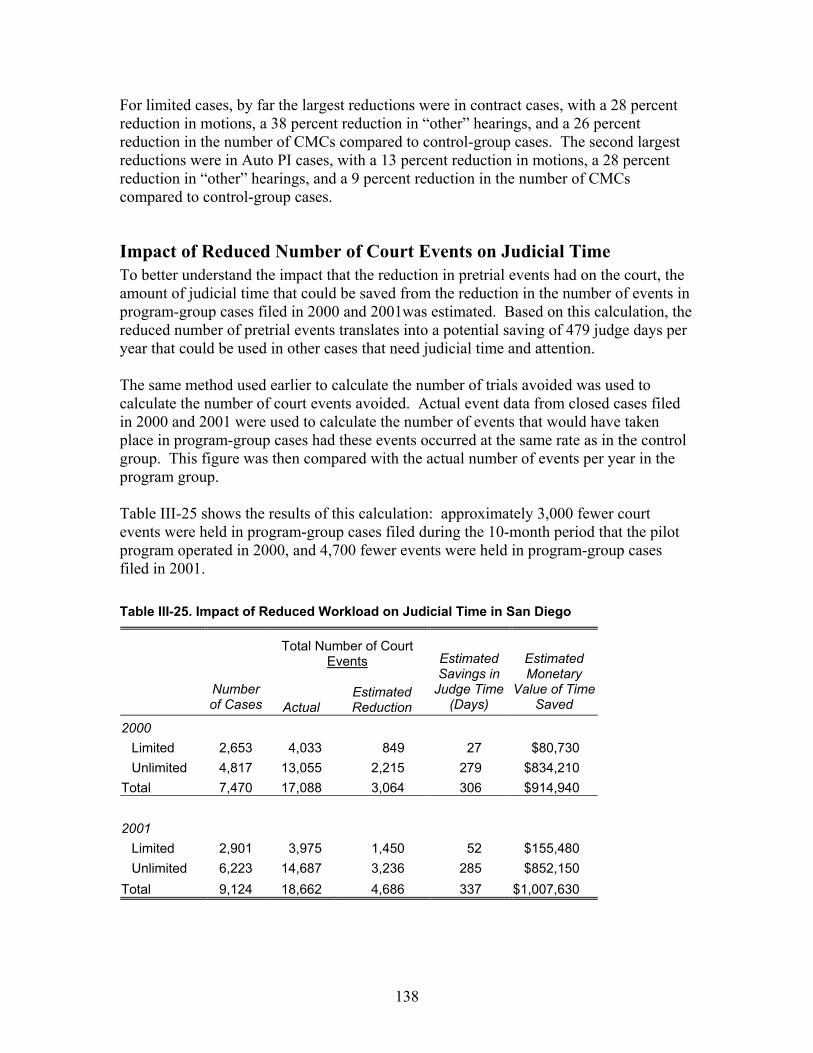
138
For limited cases, by far the largest reductions were in contract cases, with a 28 percent reduction in motions, a 38 percent reduction in “other” hearings, and a 26 percent reduction in the number of CMCs compared to control-group cases. The second largest reductions were in Auto PI cases, with a 13 percent reduction in motions, a 28 percent reduction in “other” hearings, and a 9 percent reduction in the number of CMCs compared to control-group cases.
Impact of Reduced Number of Court Events on Judicial Time To better understand the impact that the reduction in pretrial events had on the court, the amount of judicial time that could be saved from the reduction in the number of events in program-group cases filed in 2000 and 2001was estimated. Based on this calculation, the reduced number of pretrial events translates into a potential saving of 479 judge days per year that could be used in other cases that need judicial time and attention. The same method used earlier to calculate the number of trials avoided was used to calculate the number of court events avoided. Actual event data from closed cases filed in 2000 and 2001 were used to calculate the number of events that would have taken place in program-group cases had these events occurred at the same rate as in the control group. This figure was then compared with the actual number of events per year in the program group. Table III-25 shows the results of this calculation: approximately 3,000 fewer court events were held in program-group cases filed during the 10-month period that the pilot program operated in 2000, and 4,700 fewer events were held in program-group cases filed in 2001. Table III-25. Impact of Reduced Workload on Judicial Time in San Diego
Total Number of Court Events
Number of Cases Actual
Estimated Reduction
Estimated Savings in
Judge Time (Days)
Estimated Monetary
Value of Time Saved
2000 Limited 2,653 4,033 849 27 $80,730 Unlimited 4,817 13,055 2,215 279 $834,210
Total 7,470 17,088 3,064 306 $914,940 2001
Limited 2,901 3,975 1,450 52 $155,480 Unlimited 6,223 14,687 3,236 285 $852,150
Total 9,124 18,662 4,686 337 $1,007,630
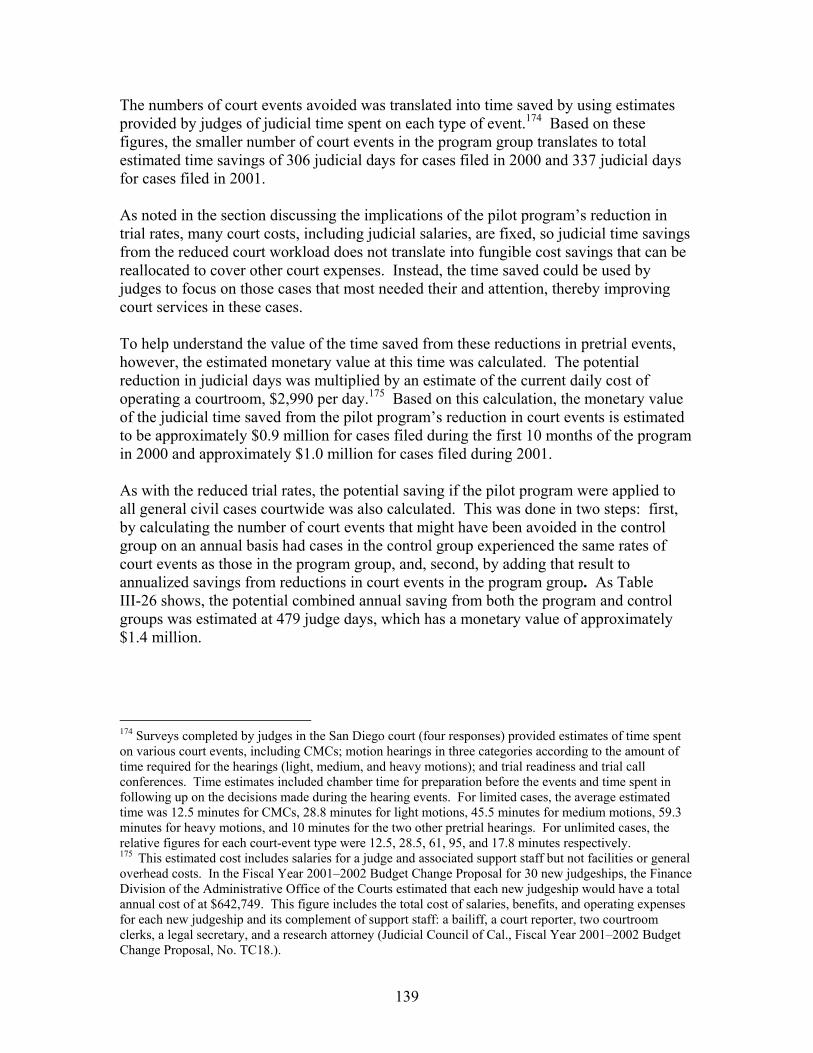
139
The numbers of court events avoided was translated into time saved by using estimates provided by judges of judicial time spent on each type of event.174 Based on these figures, the smaller number of court events in the program group translates to total estimated time savings of 306 judicial days for cases filed in 2000 and 337 judicial days for cases filed in 2001. As noted in the section discussing the implications of the pilot program’s reduction in trial rates, many court costs, including judicial salaries, are fixed, so judicial time savings from the reduced court workload does not translate into fungible cost savings that can be reallocated to cover other court expenses. Instead, the time saved could be used by judges to focus on those cases that most needed their and attention, thereby improving court services in these cases. To help understand the value of the time saved from these reductions in pretrial events, however, the estimated monetary value at this time was calculated. The potential reduction in judicial days was multiplied by an estimate of the current daily cost of operating a courtroom, $2,990 per day.175 Based on this calculation, the monetary value of the judicial time saved from the pilot program’s reduction in court events is estimated to be approximately $0.9 million for cases filed during the first 10 months of the program in 2000 and approximately $1.0 million for cases filed during 2001. As with the reduced trial rates, the potential saving if the pilot program were applied to all general civil cases courtwide was also calculated. This was done in two steps: first, by calculating the number of court events that might have been avoided in the control group on an annual basis had cases in the control group experienced the same rates of court events as those in the program group, and, second, by adding that result to annualized savings from reductions in court events in the program group. As Table III-26 shows, the potential combined annual saving from both the program and control groups was estimated at 479 judge days, which has a monetary value of approximately $1.4 million.
174 Surveys completed by judges in the San Diego court (four responses) provided estimates of time spent on various court events, including CMCs; motion hearings in three categories according to the amount of time required for the hearings (light, medium, and heavy motions); and trial readiness and trial call conferences. Time estimates included chamber time for preparation before the events and time spent in following up on the decisions made during the hearing events. For limited cases, the average estimated time was 12.5 minutes for CMCs, 28.8 minutes for light motions, 45.5 minutes for medium motions, 59.3 minutes for heavy motions, and 10 minutes for the two other pretrial hearings. For unlimited cases, the relative figures for each court-event type were 12.5, 28.5, 61, 95, and 17.8 minutes respectively. 175 This estimated cost includes salaries for a judge and associated support staff but not facilities or general overhead costs. In the Fiscal Year 2001–2002 Budget Change Proposal for 30 new judgeships, the Finance Division of the Administrative Office of the Courts estimated that each new judgeship would have a total annual cost of at $642,749. This figure includes the total cost of salaries, benefits, and operating expenses for each new judgeship and its complement of support staff: a bailiff, a court reporter, two courtroom clerks, a legal secretary, and a research attorney (Judicial Council of Cal., Fiscal Year 2001–2002 Budget Change Proposal, No. TC18.).
140
Table III-26. Potential Courtwide Annual Impact of Reduced Workload on Judicial Time in San Diego
Total Number of Court Events
Number of Cases Actual
Estimated Potential
Reduction
Estimated Potential
Savings in Judge Time
(Days)
Estimated Monetary Value of Potential
Time Saving
Program Limited 3,030 4,364 1,212 41 $122,590 Unlimited 6,022 15,116 2,950 303 $905,970
Total 9,052 19,480 4,162 344 $1,028,560 Control
Limited 698 1,285 279 10 $29,900 Unlimited 2,451 7,353 1,200 125 $373,750
Total 3,149 8,638 1,479 135 $403,650
Program and Control Combined
Limited 3,728 5,649 1,491 51 $152,490 Unlimited 8,473 22,469 4,150 428 $1,279,720
Total 12,201 28,118 5,641 479 $1,432,210
Long-Term Program Impact on Court’s Workload The above analysis of the San Diego program’s impact on the court’s workload focused on various court events that took place before cases reached disposition. To determine if there was also long-term program impact on court workload after the cases reached disposition, attorneys in both the program group and control group were surveyed approximately six months after their cases had reached disposition to see if there were differences in compliance or finality of the disposition. Among other things, attorneys were asked whether the party responsible for payment or performance had complied with the agreement or judgment and whether any additional court proceedings had been considered or initiated to enforce the settlement or judgment in the case.176 Table III-27 and Table III-28 compare the responses of attorneys in program- and control-group cases to these questions. As shown in Table III-27, 2 percent more of the survey respondents in the control-group cases indicated that the party responsible for payment or performance under the agreement or judgment reached in the case had not fully complied. Similarly,
176 Other questions in this survey asked whether additional court proceedings were considered to modify or rescind/overturn the agreement/judgment, and whether there had been another lawsuit between the parties since the resolution of the cases. No apparent differences emerged between the program and control groups on these additional questions.
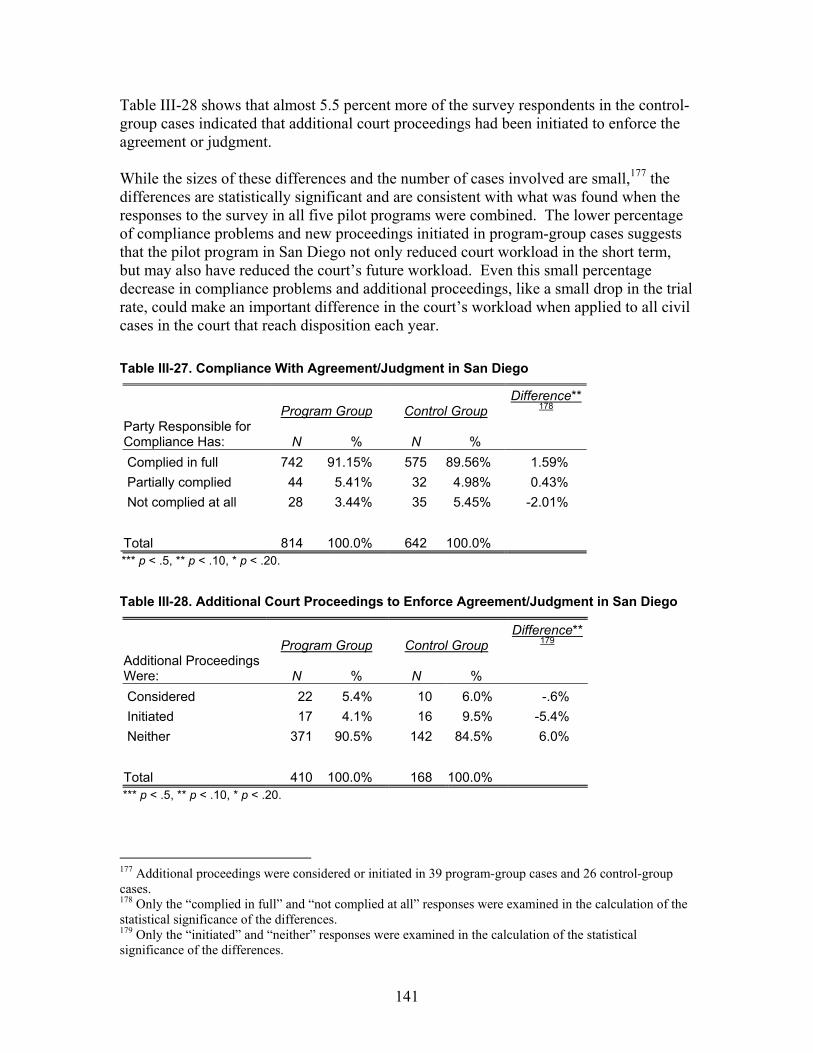
141
Table III-28 shows that almost 5.5 percent more of the survey respondents in the control-group cases indicated that additional court proceedings had been initiated to enforce the agreement or judgment. While the sizes of these differences and the number of cases involved are small,177 the differences are statistically significant and are consistent with what was found when the responses to the survey in all five pilot programs were combined. The lower percentage of compliance problems and new proceedings initiated in program-group cases suggests that the pilot program in San Diego not only reduced court workload in the short term, but may also have reduced the court’s future workload. Even this small percentage decrease in compliance problems and additional proceedings, like a small drop in the trial rate, could make an important difference in the court’s workload when applied to all civil cases in the court that reach disposition each year. Table III-27. Compliance With Agreement/Judgment in San Diego
Program Group Control Group Difference**
178 Party Responsible for Compliance Has: N % N % Complied in full 742 91.15% 575 89.56% 1.59% Partially complied 44 5.41% 32 4.98% 0.43% Not complied at all 28 3.44% 35 5.45% -2.01% Total 814 100.0% 642 100.0% *** p < .5, ** p < .10, * p < .20. Table III-28. Additional Court Proceedings to Enforce Agreement/Judgment in San Diego
Program Group Control Group Difference**
179 Additional Proceedings Were: N % N % Considered 22 5.4% 10 6.0% -.6% Initiated 17 4.1% 16 9.5% -5.4% Neither 371 90.5% 142 84.5% 6.0% Total 410 100.0% 168 100.0% *** p < .5, ** p < .10, * p < .20.
177 Additional proceedings were considered or initiated in 39 program-group cases and 26 control-group cases. 178 Only the “complied in full” and “not complied at all” responses were examined in the calculation of the statistical significance of the differences. 179 Only the “initiated” and “neither” responses were examined in the calculation of the statistical significance of the differences.
142
Conclusion There is strong evidence indicating that the pilot program in San Diego significantly reduced the court’s workload. In addition to the reduction in trials discussed above, the pilot program reduced the average number of pretrial court events by approximately 16 percent in unlimited cases and 22 percent in limited cases compared to cases in the control group. The reductions were larger for cases that settled at mediation; the average number of court events was reduced by 40–45 percent for both limited and unlimited program-group cases that settled at mediation compared to like cases in the control group. The total annual potential time saving from this reduced number of court events is estimated at 479 judge days per year (with a monetary value of approximately $1.4 million per year). In addition, survey results indicate that there were fewer postdisposition compliance problems and fewer new proceedings initiated in program-group cases. This suggests that the pilot program not only reduced the court’s workload in the short term but may also have reduced the court’s future workload.
143
IV. Los Angeles Pilot Program
A. Summary of Findings There is strong evidence that the Early Mediation Pilot Program in Los Angeles reduced the trial rate, case disposition time, and the court’s workload; improved litigant satisfaction with the court’s services; and lowered litigant costs in cases that resolved at mediation. • Mediation referrals and settlements—560 unlimited cases that were filed in the
Superior Court of Los Angeles County between April and December 2001 were referred to mediation, and 399 of these cases were mediated under the pilot program. Of the unlimited cases mediated, 35 percent settled at the mediation and another 14 percent settled later as a direct result of the mediation, for a total resolution rate of approximately 49 percent. In survey responses, 78 percent of attorneys whose cases did not settle at mediation indicated that the mediation was important to the ultimate settlement of the case.
• Trial rate—The trial rate for unlimited civil cases in the program was reduced by
approximately 30 percent compared to cases in the control groups. This reduction translates to a potential savings of more than 670 days in judicial time that could be devoted to other cases needing judges’ time and attention. While this time saving does not translate into a fungible cost saving that could be reallocated to other purposes, its monetary value is equivalent to approximately $2 million per year.
• Disposition time—The overall average time to disposition for program-group cases
was approximately 19 days shorter than for cases in the control departments, and the median time to disposition was 23 days shorter. The disposition rate in the program group was also higher than that in either control group for the entire study period. The pace of dispositions rose for program cases, reaching its fastest pace, both around the time when case management conferences were held and when mediations were held in the program group, suggesting that both the case management conference and the mediation may have increased dispositions. Among cases that settled at mediation, cases that settled in the pilot program mediations took less time to reach disposition than like cases in either control group that settled in the Civil Action Mediation program established by Code of Civil Procedure sections 1775 - 1775.16 (1775 program mediations). However, among cases that did not settle at mediation, program-group cases took more time to reach disposition than like cases in either control group.
• Litigant satisfaction—Attorneys in program-group cases were more satisfied with the court’s services than attorneys in control-group cases. Attorneys whose cases settled at mediation under the pilot program were also more satisfied with both the outcome of the case and with the services of the court compared to attorneys in cases that settled at mediation under the 1775 program. However, attorneys whose cases
144
did not settle at mediation under the pilot program were less satisfied with outcome of the case than attorneys whose cases did not settle at mediation under the 1775 program. Both parties and attorneys who participated in pilot program mediations expressed high satisfaction with their mediation experience, particularly with the performance of the mediators. They also strongly agreed that the mediator and the mediation process were fair and that they would recommend both to others.
• Litigant costs—In cases that settled at mediation, 75 percent of attorneys responding
to the study survey estimated some savings in both litigant costs and attorney hours from using mediation to reach settlement. Average savings per settled case estimated by attorneys was $12,636 in litigant costs and 66 hours in attorney time. Based on these attorney estimates, the total estimated savings in litigant costs in all 2001 cases that were settled at mediation was $1,769,039 and total estimated savings in attorney hours was 9,240. There was also evidence that both the actual litigant costs and actual attorney hours estimated by attorneys were lower in cases that settled at mediation under the pilot program compared to like cases in the control departments that settled at mediation under the 1775 program; both actual litigant costs and actual attorney hours estimated by attorneys were approximately 60 percent lower in program-group cases that settled at mediation compared to similar cases in the control groups.
• Court workload—The pilot program in Los Angeles reduced the court’s workload.
In addition to the reduction in trials discussed above, the pilot program reduced the average number of “other” pretrial hearings in program cases by 11 percent compared to control cases in the participating departments and may also have reduced motion hearings in program-group cases compared to cases in both control groups. These decreases were partially offset by a 16 percent increase in the number of case management conferences in the program group compared to control cases in the participating departments. However, because motions and “other” pretrial hearings take more judicial time on average than case management conferences, the changes in the number of pretrial court events caused by the pilot program resulted in saving judicial time. The total potential time savings from the reduced number of court events was estimated at 132 judicial days per year (with a monetary value of approximately $395,000 per year).
145
B. Introduction This section of the report discusses the study’s findings concerning the Early Mediation Pilot Program in the Superior Court of Los Angeles County, which operated in 10 of the court’s 69 civil departments at its central courthouse. Based on the criteria established by the Early Mediation Pilot Program legislation, this was a highly successful program, resulting in benefits to both litigants and the courts in the form of reduced trial rates, reduced disposition time, increased litigant satisfaction with the court’s services, reduced pretrial court events, and reduced litigant costs in cases that resolved at mediation. As further discussed below in the program description, the Los Angeles pilot program included five main elements: • Information about the pilot program was required to be distributed to litigants at the
time of filing; • The court held an initial case management conference approximately five months
after filing to assess the case’s amenability to early mediation; • The court had the authority to order litigants to participate in early mediation; • Litigants in cases that were referred to mediation were required to complete
mediation within 60–90 days of the mediation order or stipulation, and the court set a follow-up conference shortly after this date; and
• If litigants selected a mediator from the court’s panel, the court paid the mediator for up to three hours of mediation services.
For purposes of this study, the court divided its unlimited civil cases into program-group cases and control-group cases. “Program-group” cases were exposed to one or more of the program elements described above, including being considered for possible referral to mediation under the pilot program; “control-group” cases were not exposed to any of these pilot program elements. Unlike in the other mandatory programs, the court in Los Angeles established two different “control groups”: the 53 unlimited civil departments in the central Los Angeles courthouse that were not participating in the pilot program (“control departments”) and one half of the cases randomly assigned to the 9 participating unlimited civil departments (“control cases”). Comparisons of disposition time, litigant satisfaction, and other outcome measures in the program group and the two control groups were used to show the overall impact of implementing this pilot program, with all of its elements, in the Los Angeles court. It is important to remember that, while control-group cases were not eligible to participate in the pilot program, these cases were still eligible to participate in a different court mediation program established by Code of Civil Procedure section 1775 (“1775 program”). Therefore, comparisons between the program- and control-group cases in Los Angeles show the difference in outcomes attributable to being eligible for possible referral to mediation under the pilot program versus being eligible for possible referral to mediation under the 1775 program; they do not show the impact of having the pilot program as opposed to no mediation program at all.
146
It is also important to remember that, throughout this section, “program group” means cases exposed to any of the pilot program elements; it does not mean only cases that were referred to mediation or cases that were mediated. The program group includes cases that participated in the early case management conference but were not referred to mediation. It also includes cases that were referred mediation, but did not ultimately go to mediation, either because they were later removed from the mediation track by the court or because they settled before the mediation took place. In addition, it is important to remember that the program-group cases exposed to different pilot program elements had very different dispute resolution experiences and different outcomes in terms of the areas being studied (disposition time, litigant satisfaction, etc.). In overall comparisons, the outcomes in all these subgroups of program-group cases were added together to calculate an overall average for the entire program group as a whole. As a result, within these overall averages, positive outcomes in some subgroups of cases—such as shorter disposition times in cases that settled at mediation—were often offset by less positive outcomes in other subgroups. Because in Los Angeles, unlike in the other pilot programs, both cases in the program group and in the control groups had access to a court mediation program, it was possible to compare the disposition time for cases in each program subgroup with the disposition time for control-group cases in the same subgroup. These subgroup comparisons provided information about the relative impact of the pilot program and the 1775 program on cases in the subgroups. For example, comparisons between cases in the program and control groups that settled at mediation provided information about whether the time to disposition in cases that settled at mediation in the pilot program was shorter than the time to disposition in similar cases that settled at mediation in the 1775 program. Unlike the other pilot program, these subgroup comparisons did not provide information about the whether the time to disposition in cases that settled at mediation in the pilot program was shorter than the time to disposition in similar cases that did not experience being mediated and reaching settlement at mediation. Finally, it is important to remember that the emphasis in this pilot program was on early referral to and early participation in mediation. Cases were referred to mediation at approximately five months after filing and went to mediation at approximately eight months after filing. Thus, this study only addresses how cases responded to such early referrals and early mediation. It does not address how cases might have responded to later referrals or later mediation.
147
C. Los Angeles Mediation Pilot Program Description This section provides a brief description of the Superior Court of Los Angeles County and its Early Mediation Pilot Program. This description is intended to provide context for understanding the study findings presented later in this chapter.
The Court Environment in Los Angeles Los Angeles is the most populous county in California, with approximately 9.5 million residents. The Superior Court of Los Angeles County is the largest court in California. It has a total of 429 authorized judgeships, representing nearly one-third of all authorized judgeships in the state.180 In 2000, the year before this mediation pilot program began, approximately 49,000 unlimited general civil cases181 were filed in Los Angeles, accounting for about one-fourth of the total unlimited cases filed statewide. A total of 168,000 limited civil cases were filed in the same year, representing 35 percent of the statewide total.182 At its central courthouse, or Central District, where the pilot program operated, the Superior Court of Los Angeles County assigns different judges (departments) to handle limited and unlimited civil cases. Of the 169 departments in the Central District, the court has dedicated 68 departments to handling civil cases: 6 to limited cases, and 62 to unlimited cases. Upon filing, cases are assigned at random to one of the limited or unlimited departments. For both limited and unlimited cases, the court uses an individual calendaring system—the same judge handles all aspects of a case from filing through disposition. In unlimited cases, judges in Los Angeles generally use a system of case management conferences, with the first conference set approximately 150–180 days after filing, to establish a schedule for trial and other relevant court events. This system of case management conferences is followed to a lesser extent for limited cases. The Superior Court of Los Angeles County has historically disposed of civil cases relatively quickly. In 2000, the year before the Early Mediation Pilot Program was implemented in Los Angeles, the superior court disposed of approximately 60 percent of its unlimited civil cases within one year, 83 percent within 18 months, and 93 percent within two years of filing. Similarly, the court disposed of 78 percent of its limited civil cases within one year, 88 percent within 18 months, and 93 percent within 24 months of filing.
180 The Superior Court of Los Angeles County also has 167 commissioner and referee positions, for a total of 596 judicial officers. 181 General civil cases include motor vehicle personal injury/property damage/wrongful death cases, other personal injury/property damage/wrongful death cases, and other civil complaints, including contract cases. General unlimited civil cases do not include probate cases, family law cases, or other civil petitions. 182 Judicial Council of Cal., Admin. Off. of Cts., Rep. on Court Statistics (2001) Fiscal Year 1990–1991 Through 1999–2000 Statewide Caseload Trends, p. 46. See the glossary for definitions of “unlimited civil case” and “general civil case.”
148
Since 1994, the Superior Court of Los Angeles County has had a statutorily required mandatory mediation program for civil cases valued at $50,000 or less.183 Under this program, known as the Civil Action Mediation Program or 1775 program, judges are authorized to order the parties in these smaller-valued cases to participate in mediation. The mediators in this program provide three hours of mediation services at no charge in each case; after three hours, the parties can choose whether to continue the mediation at the mediator’s market rate. In 2000, the year before the court implemented the pilot program, the court referred approximately 13,500 cases to mediation under the 1775 program. Thus, both the court and the attorneys who regularly practice in the court had prior experience with mandatory court-ordered mediation of civil cases before the pilot program was put in place. In addition to the 1775 program, the Superior Court of Los Angeles County offers litigants a variety of other alternative dispute resolution (ADR) options, including nonbinding arbitration (called judicial arbitration), voluntary and mandatory settlement conferences, mediation and settlement conferences for noncustody disputes in family law matters, and voluntary mediation for civil harassment disputes. In addition to the cases referred to the 1775 mediation program in 2000, another 10,500 cases were referred to one of these other court ADR options that year.
The Early Mediation Pilot Program Model Adopted in Los Angeles
The General Program Model The Superior Court of Los Angeles County was required by statute to implement a mandatory mediation pilot program model. The statute also restricted the pilot program to only 10 departments in the court’s central courthouse location in downtown Los Angeles (the Central District). The court selected one department for limited cases and nine departments for unlimited cases to implement the pilot program. As noted in the introduction, under the Early Mediation Pilot Program statutes, in courts with mandatory mediation programs, the judges were given statutory authority to order eligible cases to mediation. The basic elements of the program implemented in the 10 departments in Los Angeles’ Central District included: • Information about the pilot program was required to be distributed to litigants at the
time of filing; • The court held an initial case management conference approximately five months
after filing to assess the case’s amenability to early mediation; • The court had the authority to order litigants to participate in early mediation; • Litigants in cases that were referred to mediation were required to complete
mediation within 60–90 days of the mediation order or stipulation, and the court set a follow-up conference shortly after this date; and
• If litigants selected a mediator from the court’s panel, the court paid the mediator for up to three hours of mediation services.
183 This program is authorized by Code Civ. Proc.,§ 1775 et. seq.
149
What Cases Were Eligible for the Program Most general civil cases 184 filed after April 1, 2001, both limited and unlimited, were eligible for the program in Los Angeles. General civil cases that were not eligible for the program included complex cases and class actions. As will be discussed below, however, because of delays in implementing the pilot program for limited cases, the number of limited civil cases filed in 2001 that were referred to mediation under the pilot program during the study period was very small (19 cases). Because of this small number of cases, it was not possible to make any meaningful comparisons between the program group and the control group for limited cases. Therefore, this report does not discuss the impact of the pilot program on limited civil cases in Los Angeles.
How Cases Were Assigned to the Program and Control Groups As noted in the introduction, for purposes of this study, the Judicial Council required the pilot courts implementing a mandatory mediation program model to provide for random assignment of a portion of eligible cases to a program group that participated in the pilot program and a portion of cases to a control group that was not eligible to participate in the pilot program. For unlimited cases in Los Angeles, the court established two different “control groups”—control departments and control cases. As noted above, unlimited cases filed in the Superior Court of Los Angeles County are assigned randomly to different departments. Since only 9 of the 62 unlimited civil departments in the Central District were designated to participate in the pilot program, all unlimited cases assigned to the other 53 nonparticipating departments in the Central District formed the first “control group.”185 These nonparticipating departments are called “control departments” in this report. The second control group for unlimited cases consisted of cases assigned to the nine participating unlimited departments from April to December of 2001 that were not eligible for the pilot program. When the court first implemented the pilot program in June of 2001, it decided to limit pilot program participation to only one half of the unlimited cases filed in the nine participating departments. All unlimited cases filed in the participating departments with case numbers ending in odd numbers were eligible for the pilot program; cases ending in even numbers were not eligible. 186 In this report,
184 See the glossary for a definition of “general civil cases.” Although the court did not began holding early case management conferences and making referrals to mediation under the pilot program until June 2001, since these conferences were set for between 90 and 150 days after filing, cases filed starting in April 2001 were included in the program. 185 When the pilot program was first implemented in June of 2001, the court selected five unlimited departments to serve as a comparison group. The five departments were selected because usage of mediation services under the 1775 program in these departments tended to be lower historically than in other departments. t was believed that, in assessing the impact of the pilot mediation program relative to comparable cases with little or no use of mediation, these departments might serve as an appropriate baseline. Data revealed, however, that some sizable numbers of cases were referred to mediation under the 1775 program in these departments during the study period. Since information on mediation referrals and various case outcomes were available for unlimited cases in all nonparticipating departments in the Central District, it appeared more appropriate to examine the outcomes in all these departments. 186 This control group within the participating departments was eliminated in January 2002.

150
these ineligible even-number cases in the participating departments are called “control cases.” While cases in the control departments and control cases in the participating departments were not eligible to participate in the pilot program, these cases were still eligible to participate in the preexisting 1775 program (as were cases in the program group). Because the pilot program was limited to only a small fraction of the civil departments in the Superior Court of Los Angeles County and because the court was required by statute to operate the 1775 program, the court did not stop the 1775 program when it implemented the Early Mediation Pilot Program. Both mediation programs operated simultaneously in the court during the pilot program period. Thus, cases in the 53 nonparticipating departments, as well as cases in the 9 participating departments, were eligible for mandatory referral to mediation under the 1775 program if they were valued at $50,000 or less or for voluntary participation in mediation if they were valued at more than $50,000.
How Cases Were Referred to Mediation in the Pilot Program In unlimited cases, parties whose cases were assigned to the program group were given information about the pilot program at the time of filing. The information included a notice of assignment to the pilot program, a notice that they might be required to attend an early case management conference, a case management conference statement form, and a form for stipulating to participate in mediations. All program cases were set for an early case management conference between 90 and 150 days after filing (the average time for this conference was 134 days after filing). In unlimited cases, if the parties filed a stipulation to mediation at least five days before the scheduled conference, the judge assigned to the case could cancel or continue the conference. At the case management conference, the assigned judge conferred with the parties about ADR options and considered whether to order the case to mediation. Under the Early Mediation Pilot Program statutes, the court was required to consider the willingness of the parties to mediate in determining whether to refer a case to mediation. Thus, while the pilot program in Los Angeles was mandatory in design, the wishes of the litigants played an important role in the mediation referral process, just as they would in a voluntary program.
How Mediators Were Selected and Compensated When a case was referred to mediation, either by court order or by party stipulation, parties were required to select a mediator. Parties were free to select any mediator, whether or not that mediator was from the court’s panel. However, the Early Mediation Pilot Program statutes provided that, if parties selected a mediator from the court’s panel, they would not be required to pay a fee for the mediator’s services. Thus, the parties could receive up to three hours of mediation services at no cost to them if they selected a mediator from the court’s panel. If the parties wanted to select a mediator who was not
151
on the court’s panel, they were required to get court approval at the case management conference. Mediators on the Superior Court of Los Angeles County’s pilot program panel were required to have 30 hours of approved mediation training, to have completed at least 8 mediations (at least 4 of which were in a court-annexed program), and to participate in at least 4 hours of continuing mediation education annually. Under the pilot program, the court paid its panel mediators for the first three hours of mediation services at a fixed hourly rate of $150. At the end of this 3-hour period, the parties were free to continue the mediation on a voluntary basis, but the parties were responsible for paying the mediator at the mediator’s individual market rate.
When Mediation Sessions Were Held If parties stipulated or were ordered to mediation, they were generally required to complete mediation within 60 days of that stipulation or order. If the parties wanted an extension beyond the original completion date set, they were required to request this extension from the judge to whom the case was assigned.
What Happened After the Mediation All cases referred to mediation under the pilot program were set for a postmediation status conference. At the conclusion of the mediation, the mediator was required to submit a form to the court indicating whether the case was fully or partially resolved at the mediation session. If this form indicated that the case was fully resolved, the assigned judge could cancel the status conference. If this form indicated that the case was not resolved or only partially resolved, or if the mediator indicated that the mediation was continuing on a voluntary basis after the completion date, the status conference was held and the case was returned to the regular court litigation process.
How Cases Moved Through the Pilot Program To understand the impact of the pilot program, it is helpful to understand the flow of cases through the court process and into the subgroups at cases that experienced different elements of the pilot program. Figure IV-1 provides a comparison of the case-flow process for unlimited civil cases in the program group and control cases in the participating departments. As noted above, while control cases were not eligible for the pilot program, they were eligible for potential referral to mediation under the preexisting 1775 program. Therefore Figure IV-1 reflects the flow through the 1775 program for control cases. Figure IV-1 shows that from April to December 2001, a total of 1,358 unlimited cases in the program group were eligible for the pilot program, compared to 1,390 control cases eligible for the 1775 program in the participating departments.187 About 40 percent (560 cases) of the cases in the program group were referred to mediation under the pilot 187Case management conferences were held for approximately 60 percent of the total cases in the program group compared to 50 percent in the control group. Of the cases that were referred to mediation, a small percentage (5 percent) in the program were referred to mediation before any case management conferences were held, compared to 17 percent in the control group.
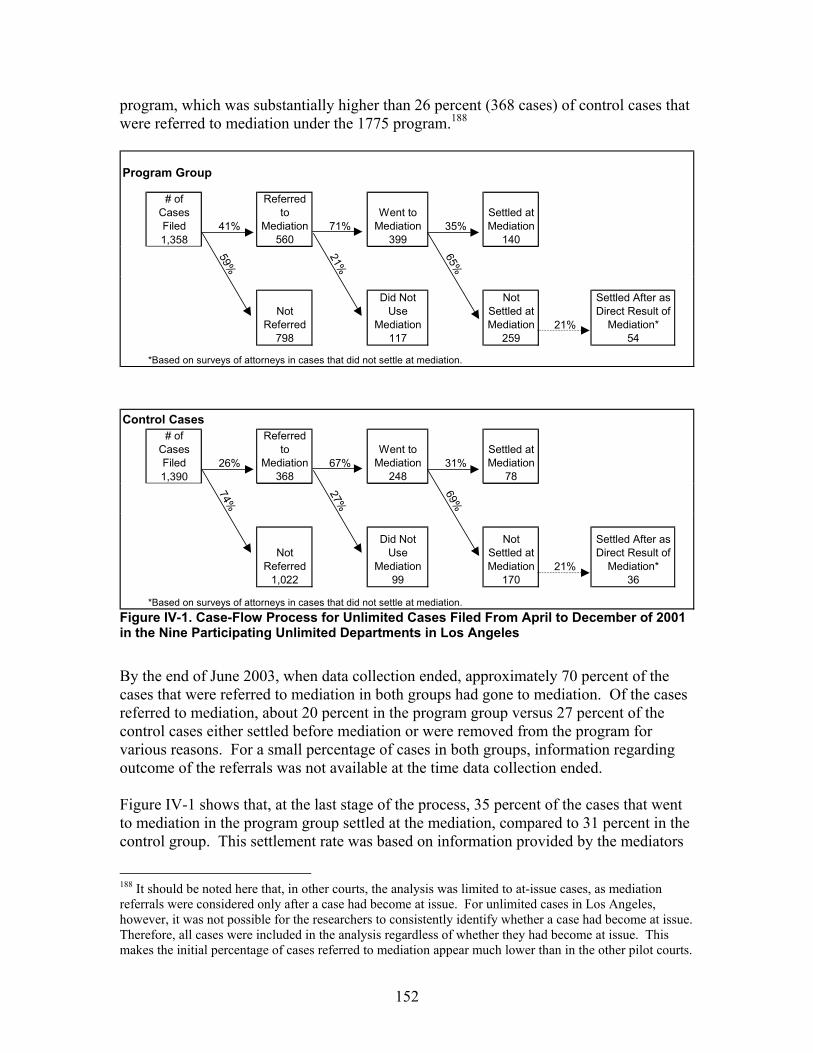
152
program, which was substantially higher than 26 percent (368 cases) of control cases that were referred to mediation under the 1775 program.188
Figure IV-1. Case-Flow Process for Unlimited Cases Filed From April to December of 2001 in the Nine Participating Unlimited Departments in Los Angeles
By the end of June 2003, when data collection ended, approximately 70 percent of the cases that were referred to mediation in both groups had gone to mediation. Of the cases referred to mediation, about 20 percent in the program group versus 27 percent of the control cases either settled before mediation or were removed from the program for various reasons. For a small percentage of cases in both groups, information regarding outcome of the referrals was not available at the time data collection ended. Figure IV-1 shows that, at the last stage of the process, 35 percent of the cases that went to mediation in the program group settled at the mediation, compared to 31 percent in the control group. This settlement rate was based on information provided by the mediators
188 It should be noted here that, in other courts, the analysis was limited to at-issue cases, as mediation referrals were considered only after a case had become at issue. For unlimited cases in Los Angeles, however, it was not possible for the researchers to consistently identify whether a case had become at issue. Therefore, all cases were included in the analysis regardless of whether they had become at issue. This makes the initial percentage of cases referred to mediation appear much lower than in the other pilot courts.
Program Group
# of Cases Filed 41%
Referred to
Mediation 71%Went to
Mediation 35%Settled at Mediation
1,358 560 399 140
59%
21%
65%
Not Referred
Did Not Use
Mediation
Not Settled at Mediation 21%
Settled After as Direct Result of
Mediation*798 117 259 54
*Based on surveys of attorneys in cases that did not settle at mediation.
Control Cases# of
Cases Filed 26%
Referred to
Mediation 67%Went to
Mediation 31%Settled at Mediation
1,390 368 248 78
74%
27%
69%
Not Referred
Did Not Use
Mediation
Not Settled at Mediation 21%
Settled After as Direct Result of
Mediation*1,022 99 170 36
*Based on surveys of attorneys in cases that did not settle at mediation.

153
after the mediation session ended. Based on survey data provided by the attorneys, approximately 20 percent of the respondents indicated that while the case did not reach settlement at the end of the mediation session, mediation was directly responsible for subsequent settlement of the cases. With these cases included, the total mediation settlement rate (either at the end of the mediation session or as a direct result of the mediation) is estimated to be 49 percent in the program group and 46 percent in the control group.
Conclusion As noted in the introduction, each of the pilot programs examined in this study is different. In reviewing the results for the Los Angeles program, it is important to keep in mind the unique characteristics of this court and its pilot program. In particular, it is important to remember that mediation services under the preexisting 1775 program were still available to control-group cases. Therefore, comparisons of the program and control groups in Los Angeles show the differential impact of the pilot program compared to the 1775 program; they do not show the difference between the pilot program and no court mediation program at all.
154
D. Data and Methods Used in Study of Los Angeles Pilot Program
This section provides a brief description of the data and methods used to analyze the Los Angeles pilot program in this study. (See Section I.B. for more information on the overall data and methods used in this report.)
Data Data from several sources were used for this study of the Los Angeles pilot program.
Data on Trial Rate, Case Disposition Time and Court’s Workload As more fully described in the Section I.B. on the overall data and methods used in this study, the primary source of data for assessing the pilot program’s impact on trial rate, disposition time, and court workload was the court’s case management system. Only data concerning cases filed in the Los Angeles Superior Court’s Central District from April to December of 2001 was used; cases filed more recently were not used because there was insufficient follow-up time to track the final case outcomes.189 Although data were collected on both limited and unlimited cases, only the data on unlimited cases is discussed in this report. As noted above, because of late implementation of the pilot program for limited cases, the number of limited cases filed between April and December 2001 that were referred to mediation under the pilot program during the study period (only 19 cases) was too small to make any valid comparisons. Data on limited cases filed in 2002 could not viably be used to supplement the data on 2001 cases for two reasons. First, the length of follow-up time available for cases filed in 2002 was insufficient to fully assess the various program impacts. Second, a new judge took over the limited civil cases pilot program department in October 2002. When patterns of case disposition for cases filed prior to the inception of the pilot program were examined, the data revealed differences between this new pilot program judge and other judges. Therefore, after the change in judges, it was difficult to determine whether differences between the limited program- and control-groups cases were due to the impact of the pilot program or reflected the management practices of the new pilot program judge. As noted above, civil cases in the Superior Court of Los Angeles County are disposed of in a relatively short time. However, because the Los Angeles court did not begin its pilot program until 2001, there was less follow up time for cases in this pilot program than in the other pilot programs. As of the end of the data collection period (July 2003), 88 percent of all the unlimited cases filed from April to December 2001 in the program group had been disposed of, compared to 87 percent of the control cases in the participating departments and 83 percent of the cases in the control departments. Because 12 to 17 percent of the cases had not reached disposition at the time the data 189 There was only a six-month follow-up period between December 2002, when the last 2002 cases were filed, and July 2003, when data collection ended. This was not sufficient time for most cases to have reached disposition.

155
collection ended, outcomes in these still-pending cases could ultimately affect the findings regarding pilot program impact, particularly on trial rates and court workload. However, because cases in the program and control groups both had the same follow-up time, the comparisons made between these groups are valid reflections of the differences in these groups within a minimum follow-up period of approximately 540 days.
Data on Litigant Costs and Satisfaction As is also more fully described in Section I.B., analysis of program impact on litigant satisfaction and litigant costs was based on data from surveys distributed: (1) to attorneys and parties who went to mediation between July 2001 and June 2002190 (postmediation survey); and (2) to parties and attorneys in program and control-group cases that reached disposition during the same period (postdisposition survey).
Methods Several methods were used in the study of the Los Angeles pilot program.
Comparisons of Outcomes in Program- and Control-Group Cases The main method of analysis used in the study of the Los Angeles pilot program was direct comparison of the outcomes in the program group with the outcomes in the two control groups: control cases and control departments. As noted above, cases were assigned randomly to the program and control groups in Los Angeles. Because this random assignment process ensured that the case characteristics between the program and control groups would be equivalent, the results derived from direct comparisons between these groups are very reliable. With the same judges handling both program and control cases, differences between the program group and control cases in the participating departments may more clearly represent the impact of the pilot program. There are two important things to note about these program/control-group comparisons in Los Angeles. First, as discussed in the program description, both control cases in the participating departments and cases in the control departments were still eligible for referral to mediation under the 1775 program. Therefore, comparisons between the program group and the control groups in Los Angeles do not show the impact of having a mandatory mediation program compared to having no court mediation program; these comparisons show the differential impact of the Early Mediation Pilot Program and the 1775 program. The principal differences between these two programs were: • Early mediation status conferences in the pilot program were held approximately one
to two months earlier, on average, than the regular case management conferences in the 1775 program;
• Judges in the pilot program could order any case to mediation regardless of the amount in controversy, whereas judges in the 1775 program could only order to mediation cases in which the amount in controversy was $50,000 or less;
• Mediations in the pilot program were held approximately one to two months earlier, on average, than mediations under the 1775 program;
190 Additional surveys were also distributed in March 2003 to increase the sample size for comparison cases.
156
• Mediators on the court’s pilot program panel were required to meet higher qualification standards than mediators on the court’s 1775 panel, including five more hours of mediation training, specific requirements for simulations/observations of mediations, and completion of at least eight mediations within the past three years; and
• In the pilot program, mediators from the court’s panel were compensated by the court for their first three hours of mediation services, whereas mediators in the 1775 program were not compensated for their first three hours of mediation services.
Comparisons of the program and control groups in Los Angeles thus show the impact of these differences between the Early Mediation Pilot Program and the 1775 program. Second, it is also important to remember that comparisons between the program and control groups in Los Angeles identify the impact of the pilot program as a whole, not just the impact of mediation. As discussed above in pilot program description, Los Angeles’s pilot program had many elements, including the distribution of information about the mediation program, the possibility of an early case management conference, the possibility of being ordered to early mediation, and the possibility of participating in the mediation process itself. Not every case in the “program group” was mediated. The program group was made up of subgroups of cases that experienced different elements of the pilot program, that is, cases that participated in an early case management conference but were not referred to mediation at all; cases that were referred to mediation but did not experience mediation, either because they settled before mediation or were removed from the mediation track; and cases that actually went through mediation and either settled or did not settle at mediation. In the overall comparisons between the program group and control group, the program group includes all of these different subgroups of cases put together. To help understand this, the discussion of each of the outcome measures beings studied (disposition time, litigant satisfaction, etc.) starts with a table showing the average outcome score in each subgroup and in the program group as a whole.
Analysis of Subgroups of Cases Within the Program Group In Los Angeles, unlike in the other pilot programs, both cases in the program group and in the two control groups had access to a court mediation program—program-group cases could be considered for referral to the pilot program and control-group cases could be considered for referral to the 1775 program. Therefore, in Los Angeles, unlike in any other pilot programs, it is possible to compare the outcomes for cases in each program subgroup with the outcomes for control-group cases in the same subgroup. For example, the average disposition time of program-group cases that settled at mediation in the pilot program could be compared to the average disposition time of control-group cases that settled at mediation in the 1775 program. Similar comparisons could be performed for other subgroups. While the average outcome score for each subgroup in the program and control groups provides helpful descriptive information, comparisons between these average scores do not provide accurate information about the impact of the pilot program on the cases in the subgroup. Figure IV-2 below describes the characteristics of unlimited cases in the three

157
largest subgroups in both the program group and for control cases in Los Angeles. As can be seen from this figure, the cases in these subgroups are qualitatively different from one other—the case in different subgroups in the program group and within the same subgroup in the program and control groups have different characteristics. Therefore, in direct comparisons of these subgroups, it is not possible to tell if differences in outcomes are due to the effect of the pilot program elements that these cases experienced or are due to these differences in case characteristics of cases in these subgroups.
Figure IV-2. Case Characteristics of Subgroups for Unlimited Cases in Los Angeles
As more fully discussed in Section I.B., a method called regression analysis was used to take these case characteristics differences into account and compare cases in the program subgroups only to the cases in the same subgroup in the control groups that have similar case characteristics. However, in Los Angeles, because the cases in the control groups had access to another court mediation program (the 1775 program), the results of this
Program Group Control Cases in Participating Departments
Percent of Total Percent of Total
Not Referred to Mediation
30
9
47
14
55
29
36
72
Other Case Types
Non-auto PI
Contract
Auto PI
More than 2 Parties
High Case Complexity
High Party Hostility
Over $50K
Settled at Mediation
40
14
29
16
48
10
28
70
Other Case Types
Non-auto PI
Contract
Auto PI
More than 2 Parties
High Case Complexity
High Party Hostility
Over $50K
Did Not Settle at Mmediation
28
18
33
21
45
20
38
78
Other Case Types
Non-auto PI
Contract
Auto PI
More than 2 Parties
High Case Complexity
High Party Hostility
Over $50K
Not Referred to Mediation
29
13
45
13
50
15
22
57
Other Case Types
Non-auto PI
Contract
Auto PI
More than 2 Parties
High Case Complexity
High Party Hostility
Over $50K
Settled at Mediation
32
9
41
18
45
0
29
71
Other Case Types
Non-auto PI
Contract
Auto PI
More than 2 Parties
High Case Complexity
High Party Hostility
Over $50K
Did Not Settle at Mmediation
22
18
31
29
64
18
57
91
Other Case Types
Non-auto PI
Contract
Auto PI
More than 2 Parties
High Case Complexity
High Party Hostility
Over $50K
158
comparison provide information about the relative impact of the pilot program and the 1775 program on cases in the subgroups. For example, comparisons of the time to disposition for program- and control-group cases that settled at mediation provide information about whether the time to disposition in cases that settled at mediation in the pilot program was shorter than the time to disposition for similar cases that settled at mediation in the 1775 program. Unlike in the chapters on the other pilot programs, these subgroup comparisons do not provide information about whether the time to disposition in cases that settled at mediation was shorter than the time to disposition in similar cases that did not experience being mediated and reaching settlement at mediation. A couple of other limitations of this regression analysis should be also noted. First, because the information about case characteristics used for this analysis came from survey responses, the overall number of cases available for analysis was limited and the sample size in each subgroup was therefore relatively small. With these small sample sizes, there is a risk that the survey data may not be representative of the cases in the overall population within each subgroup. Second, postdisposition surveys were distributed to only five control departments, rather than all control departments. Therefore, differences between the program group and the control departments in regression analysis may not accurately reflect the differences between the program group and all control departments. Because of these limitations, the regression results should be interpreted with caution.
Comparisons of Outcomes in Cases Valued Over $50,000 in the Pilot Program and in the 1775 Program As noted in the introduction, for the Los Angeles pilot program, the statutes establishing the Early Mediation Pilot Programs required the Judicial Council to report not only the same outcome measures as for the other four pilot programs—settlement rate, time to settlement, litigants’ satisfaction with the dispute resolution process, and costs to the litigants and the courts—but also to compare court-ordered mediation under the pilot program with voluntary mediation in Los Angeles County. To fulfill this statutory requirement, this report compares outcomes in cases valued at over $50,000 referred to mediation in the Early Mediation Pilot Program and in the 1775 program. In the Early Mediation Pilot Program, judges could order cases of any value to mediation, so cases valued at over $50,000 were subject to court-ordered mediation in the pilot program. In contrast, in the 1775 program, judges were only authorized to order cases valued at $50,000 or less to mediation, but parties could stipulate to mediation in cases valued at over $50,000, so cases valued at over $50,000 had access to voluntary mediation in the 1775 program. Thus, comparing cases valued at over $50,000 referred to mediation in these two programs is one way of comparing court-ordered mediation under the pilot program to voluntary mediation.191
191 In theory, pilot program cases could, instead, have been compared to cases voluntarily mediated outside the court system or to cases in which the parties stipulated to use mediation within the court system. However, data on case outcomes in these other potential comparison groups was not available. Data on
159
However, these comparisons do not provide a clear answer to whether court-ordered and voluntary referrals to mediation result in different outcomes. As outlined above, the pilot program and 1775 program differed from each other not only in terms of the authority to order cases valued at over $50,000 to mediation, but in other ways as well. Comparisons between cases valued at over $50,000 in the pilot program and 1775 program thus do not isolate differences in outcomes based on whether the mediation referrals were court-ordered or voluntary, but show the differences in outcomes that result from all of the differences between the whole pilot program model and the whole 1775 program model.
trial rates, disposition time, litigant satisfaction, litigant costs, and court workload was available on the cases in both the Early Mediation Pilot Program and the 1775 programs.
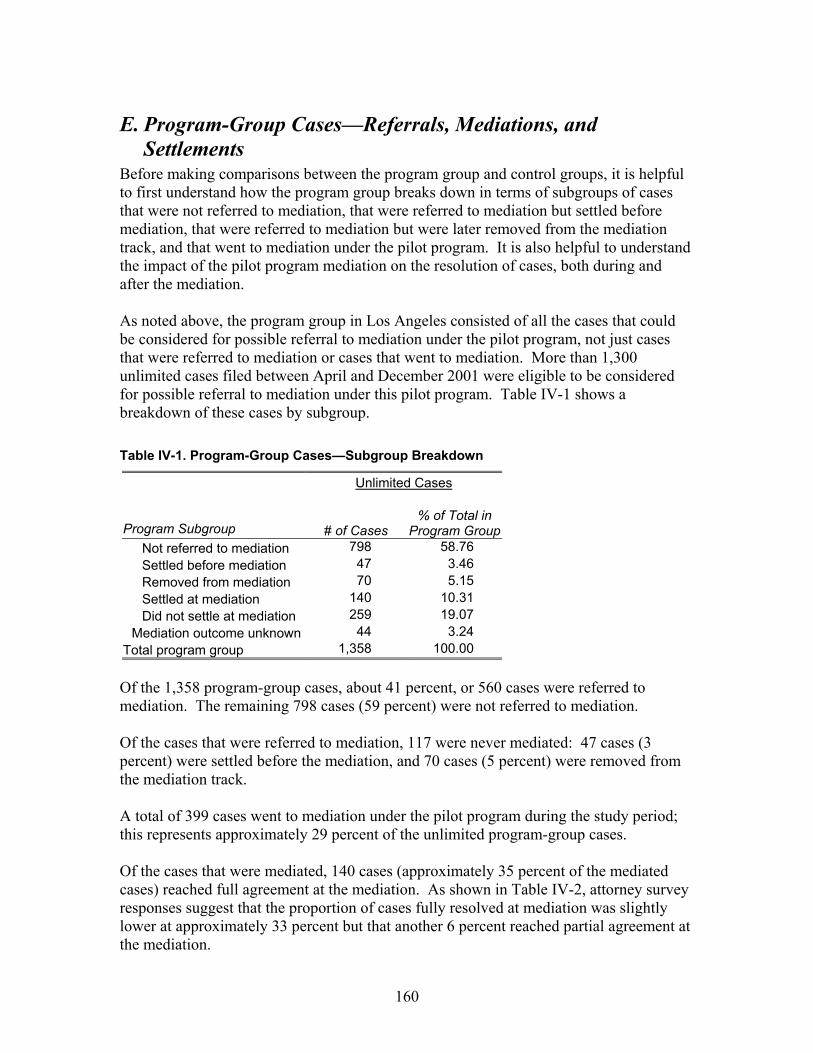
160
E. Program-Group Cases—Referrals, Mediations, and Settlements
Before making comparisons between the program group and control groups, it is helpful to first understand how the program group breaks down in terms of subgroups of cases that were not referred to mediation, that were referred to mediation but settled before mediation, that were referred to mediation but were later removed from the mediation track, and that went to mediation under the pilot program. It is also helpful to understand the impact of the pilot program mediation on the resolution of cases, both during and after the mediation. As noted above, the program group in Los Angeles consisted of all the cases that could be considered for possible referral to mediation under the pilot program, not just cases that were referred to mediation or cases that went to mediation. More than 1,300 unlimited cases filed between April and December 2001 were eligible to be considered for possible referral to mediation under this pilot program. Table IV-1 shows a breakdown of these cases by subgroup. Table IV-1. Program-Group Cases—Subgroup Breakdown
Unlimited Cases
Program Subgroup # of Cases % of Total in
Program GroupNot referred to mediation 798 58.76 Settled before mediation 47 3.46 Removed from mediation 70 5.15 Settled at mediation 140 10.31 Did not settle at mediation 259 19.07
Mediation outcome unknown 44 3.24 Total program group 1,358 100.00 Of the 1,358 program-group cases, about 41 percent, or 560 cases were referred to mediation. The remaining 798 cases (59 percent) were not referred to mediation. Of the cases that were referred to mediation, 117 were never mediated: 47 cases (3 percent) were settled before the mediation, and 70 cases (5 percent) were removed from the mediation track. A total of 399 cases went to mediation under the pilot program during the study period; this represents approximately 29 percent of the unlimited program-group cases. Of the cases that were mediated, 140 cases (approximately 35 percent of the mediated cases) reached full agreement at the mediation. As shown in Table IV-2, attorney survey responses suggest that the proportion of cases fully resolved at mediation was slightly lower at approximately 33 percent but that another 6 percent reached partial agreement at the mediation.
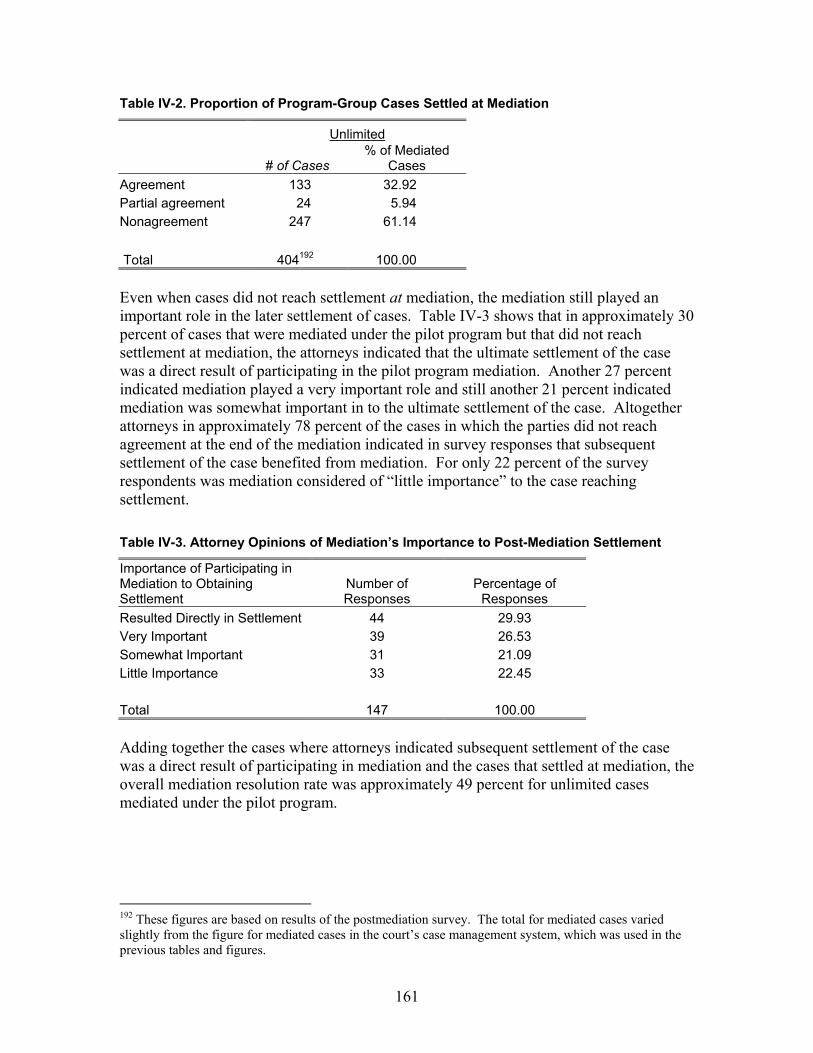
161
Table IV-2. Proportion of Program-Group Cases Settled at Mediation
Unlimited
# of Cases % of Mediated
Cases Agreement 133 32.92 Partial agreement 24 5.94 Nonagreement 247 61.14 Total 404192 100.00 Even when cases did not reach settlement at mediation, the mediation still played an important role in the later settlement of cases. Table IV-3 shows that in approximately 30 percent of cases that were mediated under the pilot program but that did not reach settlement at mediation, the attorneys indicated that the ultimate settlement of the case was a direct result of participating in the pilot program mediation. Another 27 percent indicated mediation played a very important role and still another 21 percent indicated mediation was somewhat important in to the ultimate settlement of the case. Altogether attorneys in approximately 78 percent of the cases in which the parties did not reach agreement at the end of the mediation indicated in survey responses that subsequent settlement of the case benefited from mediation. For only 22 percent of the survey respondents was mediation considered of “little importance” to the case reaching settlement. Table IV-3. Attorney Opinions of Mediation’s Importance to Post-Mediation Settlement
Importance of Participating in Mediation to Obtaining Settlement
Number of Responses
Percentage of Responses
Resulted Directly in Settlement 44 29.93 Very Important 39 26.53 Somewhat Important 31 21.09 Little Importance 33 22.45 Total 147 100.00 Adding together the cases where attorneys indicated subsequent settlement of the case was a direct result of participating in mediation and the cases that settled at mediation, the overall mediation resolution rate was approximately 49 percent for unlimited cases mediated under the pilot program.
192 These figures are based on results of the postmediation survey. The total for mediated cases varied slightly from the figure for mediated cases in the court’s case management system, which was used in the previous tables and figures.
162
F. Impact of Los Angeles’ Pilot Program on Trial Rates
Summary of Findings The pilot program in Los Angeles significantly reduced the proportion of cases that went to trial. • The trial rate for unlimited cases in the program group was approximately 30 percent
lower than the trial rate for either control cases in the participating departments or for cases in the control departments: the trial rate for the program group was 2.9 percent compared to 4.2 percent in control cases and 4.1 percent in the control departments.
• At these lower trial rates, approximately 16 fewer 2001 cases were tried in the
program group. This reduction in trials translates into a total potential time savings of 48 trial days. Annualizing the program-group reductions and adding potential reductions if the program were available to cases that were in the control groups, an estimated 227 fewer cases would be tried each year in the Central District. This potential reduction in trials translates into a total potential time savings of 670 trial days per year in the unlimited departments in the Central District of the Superior Court of Los Angeles County.
• While this time saving does not translate into a fungible cost saving that can be
reallocated for other purposes, the monetary value of the time saved is approximately $2 million per year.
• The trial rate in cases valued over $50,000 that were referred to mediation under the
pilot program (court-ordered referrals) was approximately 31 percent lower than the trial rate of cases valued over $50,000 that were referred to mediation under the 1775 program (voluntary referrals) in the control departments.
Introduction This section examines the impact of the pilot program in Los Angeles on the trial rate. First, it compares the proportion of disposed cases that went to trial in the program and control groups. Second, it breaks down the analysis by case type to see whether the program impact on trial rate was different for different case types. The amount of judicial time potentially saved through the reduction in the number of trials is then estimated. Finally, trial rates in cases valued over $50,000 that were referred to mediation under the Early Mediation Pilot Program (court-ordered referrals) and such cases that referred to mediation under the 1775 program (voluntary referrals) are compared.
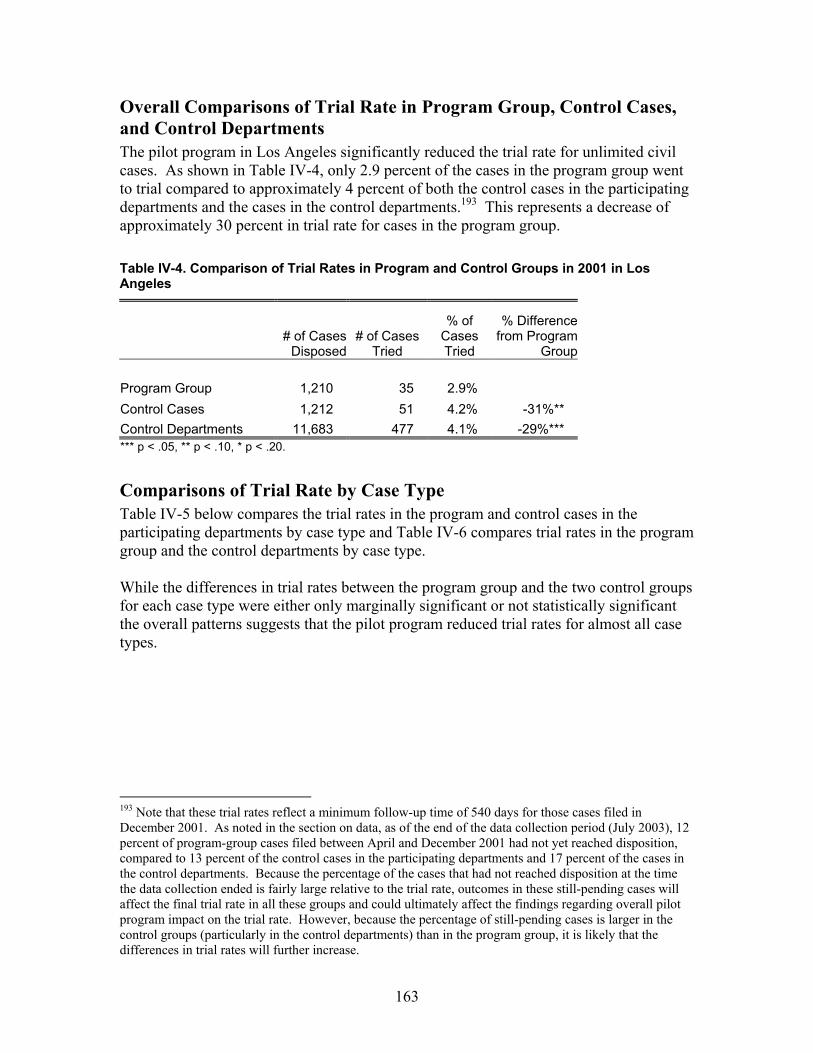
163
Overall Comparisons of Trial Rate in Program Group, Control Cases, and Control Departments The pilot program in Los Angeles significantly reduced the trial rate for unlimited civil cases. As shown in Table IV-4, only 2.9 percent of the cases in the program group went to trial compared to approximately 4 percent of both the control cases in the participating departments and the cases in the control departments.193 This represents a decrease of approximately 30 percent in trial rate for cases in the program group. Table IV-4. Comparison of Trial Rates in Program and Control Groups in 2001 in Los Angeles
# of Cases
Disposed# of Cases
Tried
% of Cases Tried
% Difference from Program
Group Program Group 1,210 35 2.9% Control Cases 1,212 51 4.2% -31%** Control Departments 11,683 477 4.1% -29%*** *** p < .05, ** p < .10, * p < .20.
Comparisons of Trial Rate by Case Type Table IV-5 below compares the trial rates in the program and control cases in the participating departments by case type and Table IV-6 compares trial rates in the program group and the control departments by case type. While the differences in trial rates between the program group and the two control groups for each case type were either only marginally significant or not statistically significant the overall patterns suggests that the pilot program reduced trial rates for almost all case types.
193 Note that these trial rates reflect a minimum follow-up time of 540 days for those cases filed in December 2001. As noted in the section on data, as of the end of the data collection period (July 2003), 12 percent of program-group cases filed between April and December 2001 had not yet reached disposition, compared to 13 percent of the control cases in the participating departments and 17 percent of the cases in the control departments. Because the percentage of the cases that had not reached disposition at the time the data collection ended is fairly large relative to the trial rate, outcomes in these still-pending cases will affect the final trial rate in all these groups and could ultimately affect the findings regarding overall pilot program impact on the trial rate. However, because the percentage of still-pending cases is larger in the control groups (particularly in the control departments) than in the program group, it is likely that the differences in trial rates will further increase.

164
Table IV-5. Comparison of Trial Rates in Program and Control Cases Within the Participating Departments, by Case Type
Program Group Control Cases
# of Disposed
Cases
# of Cases Tried
% of Cases Tried
# of Disposed Cases
# of Cases Tried
% of Cases Tried % Difference
Auto PI 203 4 2.0% 201 8 4.0% -50% Non-Auto PI 141 4 2.8% 165 4 2.4% 17% Contract 496 15 3.0% 513 24 4.7% -35%* Other 370 12 3.2% 333 15 4.5% -28%
Total
1,210 35 2.9% 1,212 51 4.2% -31%** *** p < .05, ** p < .10, * p < .20. Table IV-6. Comparison of Trial Rates in Program Group and Control Departments, by Case Type
Program Group Control Departments
# of Disposed
Cases
# of Cases Tried
% of Cases Tried
# of Disposed
Cases
# of Cases Tried
% of Cases Tried % Difference
Auto PI 203 4 2.0% 1,505 84 5.6% -65%* Non-Auto PI 141 4 2.8% 1,980 75 3.8% -25%* Contract 496 15 3.0% 4,789 156 3.3% -7% Other 370 12 3.2% 3,409 162 4.8% -32%*
Total 1,210 35 2.9% 11,683 477 4.1% -29%*** *** p < .05, ** p < .10, * p < .20.
Impact of Reduced Trial Rate on Judicial Time To better understand the impact of the reduced trial rate on the court, the amount of judicial time that could be saved from the reduction in the number of trials was estimated. Based on this calculation, the reduced trial rate translates into a potential savings of 670 trial days per year that could be used in other cases that need judicial time and attention. To calculate the number of trials avoided due to the pilot program, trial data for cases filed between April and December of 2001 was used to calculate the number of trials that would have occurred in program-group cases if cases in the program group had had the
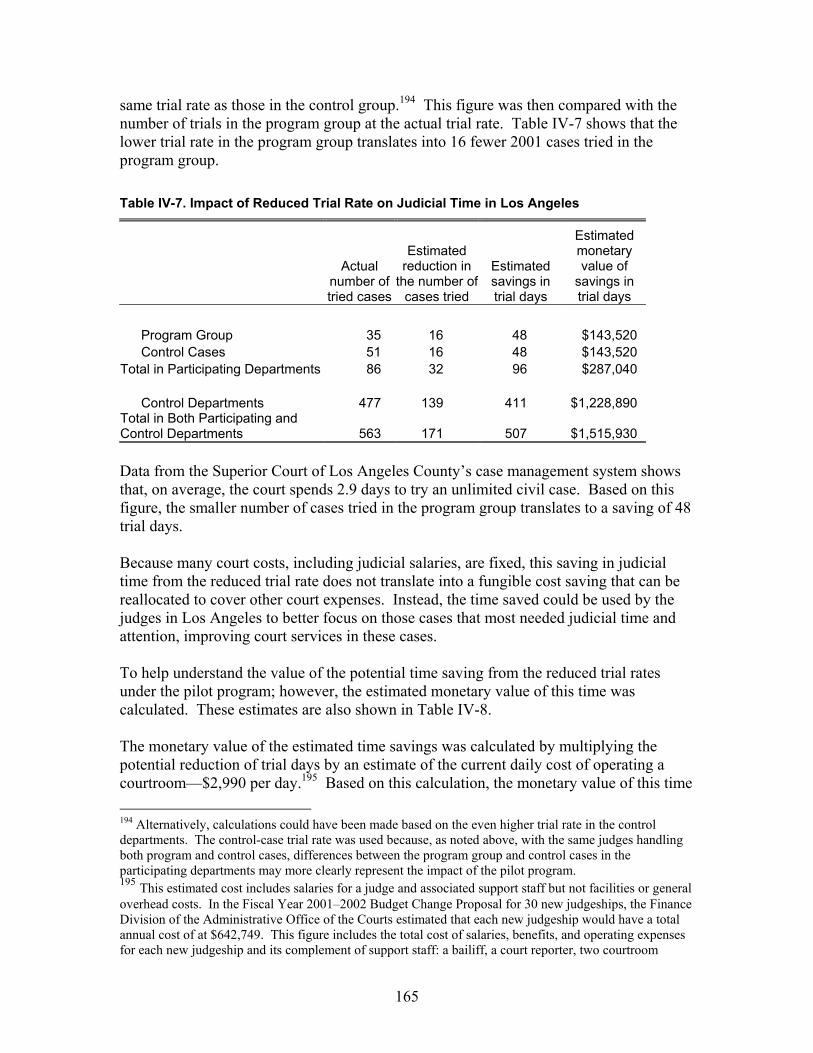
165
same trial rate as those in the control group.194 This figure was then compared with the number of trials in the program group at the actual trial rate. Table IV-7 shows that the lower trial rate in the program group translates into 16 fewer 2001 cases tried in the program group. Table IV-7. Impact of Reduced Trial Rate on Judicial Time in Los Angeles
Actual number of tried cases
Estimated reduction in
the number of cases tried
Estimated savings in trial days
Estimated monetary value of
savings in trial days
Program Group 35 16 48 $143,520 Control Cases 51 16 48 $143,520
Total in Participating Departments 86 32 96 $287,040 Control Departments 477 139 411 $1,228,890
Total in Both Participating and Control Departments 563 171 507 $1,515,930 Data from the Superior Court of Los Angeles County’s case management system shows that, on average, the court spends 2.9 days to try an unlimited civil case. Based on this figure, the smaller number of cases tried in the program group translates to a saving of 48 trial days. Because many court costs, including judicial salaries, are fixed, this saving in judicial time from the reduced trial rate does not translate into a fungible cost saving that can be reallocated to cover other court expenses. Instead, the time saved could be used by the judges in Los Angeles to better focus on those cases that most needed judicial time and attention, improving court services in these cases. To help understand the value of the potential time saving from the reduced trial rates under the pilot program; however, the estimated monetary value of this time was calculated. These estimates are also shown in Table IV-8. The monetary value of the estimated time savings was calculated by multiplying the potential reduction of trial days by an estimate of the current daily cost of operating a courtroom—$2,990 per day.195 Based on this calculation, the monetary value of this time 194 Alternatively, calculations could have been made based on the even higher trial rate in the control departments. The control-case trial rate was used because, as noted above, with the same judges handling both program and control cases, differences between the program group and control cases in the participating departments may more clearly represent the impact of the pilot program. 195 This estimated cost includes salaries for a judge and associated support staff but not facilities or general overhead costs. In the Fiscal Year 2001–2002 Budget Change Proposal for 30 new judgeships, the Finance Division of the Administrative Office of the Courts estimated that each new judgeship would have a total annual cost of at $642,749. This figure includes the total cost of salaries, benefits, and operating expenses for each new judgeship and its complement of support staff: a bailiff, a court reporter, two courtroom
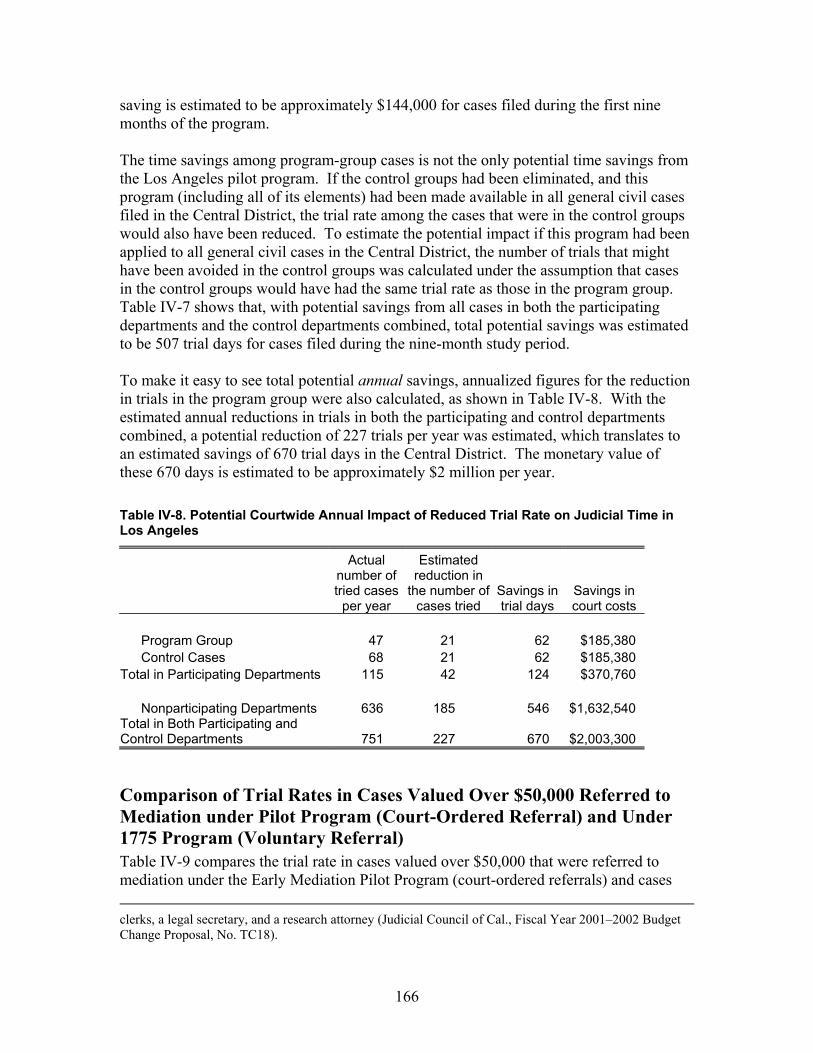
166
saving is estimated to be approximately $144,000 for cases filed during the first nine months of the program. The time savings among program-group cases is not the only potential time savings from the Los Angeles pilot program. If the control groups had been eliminated, and this program (including all of its elements) had been made available in all general civil cases filed in the Central District, the trial rate among the cases that were in the control groups would also have been reduced. To estimate the potential impact if this program had been applied to all general civil cases in the Central District, the number of trials that might have been avoided in the control groups was calculated under the assumption that cases in the control groups would have had the same trial rate as those in the program group. Table IV-7 shows that, with potential savings from all cases in both the participating departments and the control departments combined, total potential savings was estimated to be 507 trial days for cases filed during the nine-month study period. To make it easy to see total potential annual savings, annualized figures for the reduction in trials in the program group were also calculated, as shown in Table IV-8. With the estimated annual reductions in trials in both the participating and control departments combined, a potential reduction of 227 trials per year was estimated, which translates to an estimated savings of 670 trial days in the Central District. The monetary value of these 670 days is estimated to be approximately $2 million per year. Table IV-8. Potential Courtwide Annual Impact of Reduced Trial Rate on Judicial Time in Los Angeles
Actual number of tried cases
per year
Estimated reduction in
the number of cases tried
Savings in trial days
Savings in court costs
Program Group 47 21 62 $185,380 Control Cases 68 21 62 $185,380
Total in Participating Departments 115 42 124 $370,760 Nonparticipating Departments 636 185 546 $1,632,540
Total in Both Participating and Control Departments 751 227 670 $2,003,300
Comparison of Trial Rates in Cases Valued Over $50,000 Referred to Mediation under Pilot Program (Court-Ordered Referral) and Under 1775 Program (Voluntary Referral) Table IV-9 compares the trial rate in cases valued over $50,000 that were referred to mediation under the Early Mediation Pilot Program (court-ordered referrals) and cases clerks, a legal secretary, and a research attorney (Judicial Council of Cal., Fiscal Year 2001–2002 Budget Change Proposal, No. TC18).
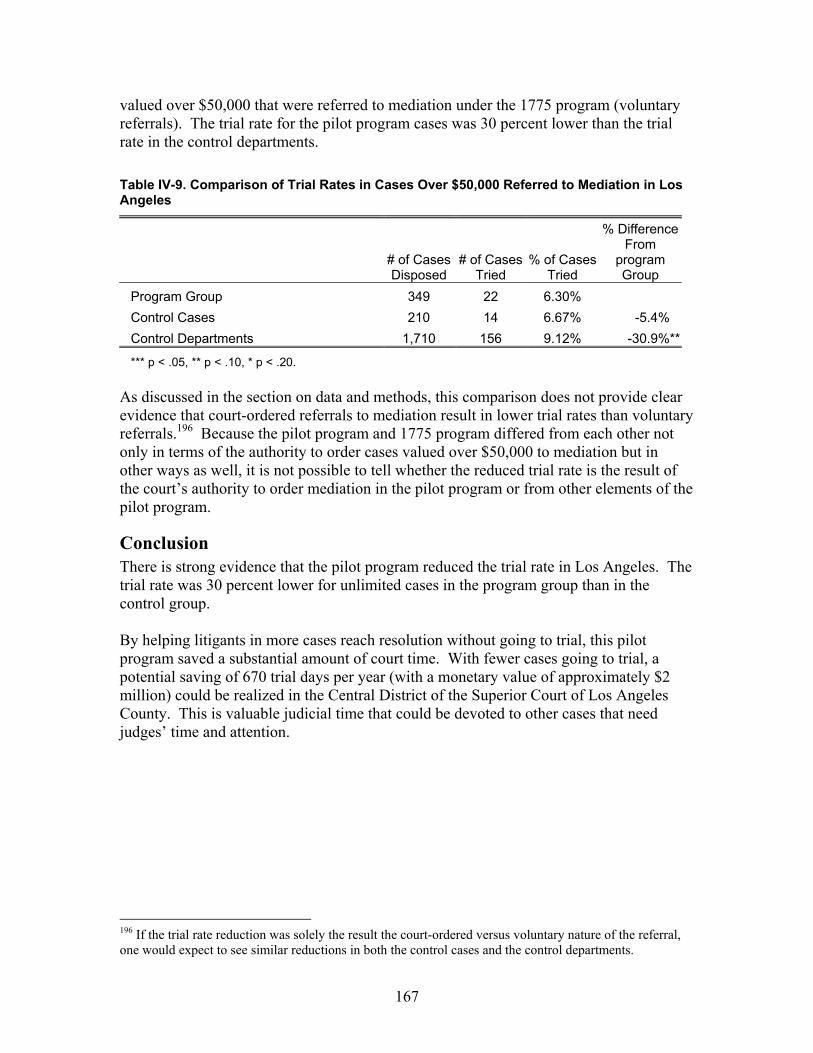
167
valued over $50,000 that were referred to mediation under the 1775 program (voluntary referrals). The trial rate for the pilot program cases was 30 percent lower than the trial rate in the control departments. Table IV-9. Comparison of Trial Rates in Cases Over $50,000 Referred to Mediation in Los Angeles
# of Cases Disposed
# of Cases Tried
% of Cases Tried
% Difference From
program Group
Program Group 349 22 6.30% Control Cases 210 14 6.67% -5.4% Control Departments 1,710 156 9.12% -30.9%**
*** p < .05, ** p < .10, * p < .20. As discussed in the section on data and methods, this comparison does not provide clear evidence that court-ordered referrals to mediation result in lower trial rates than voluntary referrals.196 Because the pilot program and 1775 program differed from each other not only in terms of the authority to order cases valued over $50,000 to mediation but in other ways as well, it is not possible to tell whether the reduced trial rate is the result of the court’s authority to order mediation in the pilot program or from other elements of the pilot program.
Conclusion There is strong evidence that the pilot program reduced the trial rate in Los Angeles. The trial rate was 30 percent lower for unlimited cases in the program group than in the control group. By helping litigants in more cases reach resolution without going to trial, this pilot program saved a substantial amount of court time. With fewer cases going to trial, a potential saving of 670 trial days per year (with a monetary value of approximately $2 million) could be realized in the Central District of the Superior Court of Los Angeles County. This is valuable judicial time that could be devoted to other cases that need judges’ time and attention.
196 If the trial rate reduction was solely the result the court-ordered versus voluntary nature of the referral, one would expect to see similar reductions in both the control cases and the control departments.
168
G. Impact of Los Angeles’ Pilot Program on Case Disposition Time
Summary of Findings The pilot program in Los Angeles reduced case disposition time: • The average time to disposition in the program group was reduced by 19 days
compared to cases in the control departments. • The median time to disposition in the program was reduced by 23 days compared to
cases in the control departments. • The pace of dispositions quickened and program-group cases were disposed of fastest
about the time of the early case management conference and early mediation, suggesting that the conference and mediation contributed to shortening that time to disposition. Program-group cases were also disposed of faster than control-group cases well before the time of the early case management conference, suggesting that the possibility of attending the early case management conference and being referred to early mediation may also have increased dispositions.
• There is evidence that cases that settled at mediation in the pilot program may have
taken less time to reach disposition than like cases in either of the control groups that settled at mediation in the 1775 program, although the size of this difference is not clear. However, there is also evidence indicating that among cases that did not settle at mediation, cases that went through the pilot program took more time to reach disposition than like cases in the control groups that did not settle in mediation under the 1775 program.
• The greatest differences in disposition time were found between non-automobile
personal injury cases (Non-Auto PI) and “other” cases in the program group compared to these case types in the control departments.
• The time to disposition in cases valued over $50,000 referred to mediation under pilot
program (court-ordered referrals) was shorter than in such cases referred to mediation under the 1775 program (voluntary referrals).
Introduction This section of the report examines the impact of the Los Angeles pilot program on time to disposition. First, the time to disposition in program group197cases as a whole and in each of the program subgroups in discussed. Second, the different patterns of case
197 It is important to remember that program-group cases include all cases that experienced any element of the pilot program, including cases that were not referred to mediation.
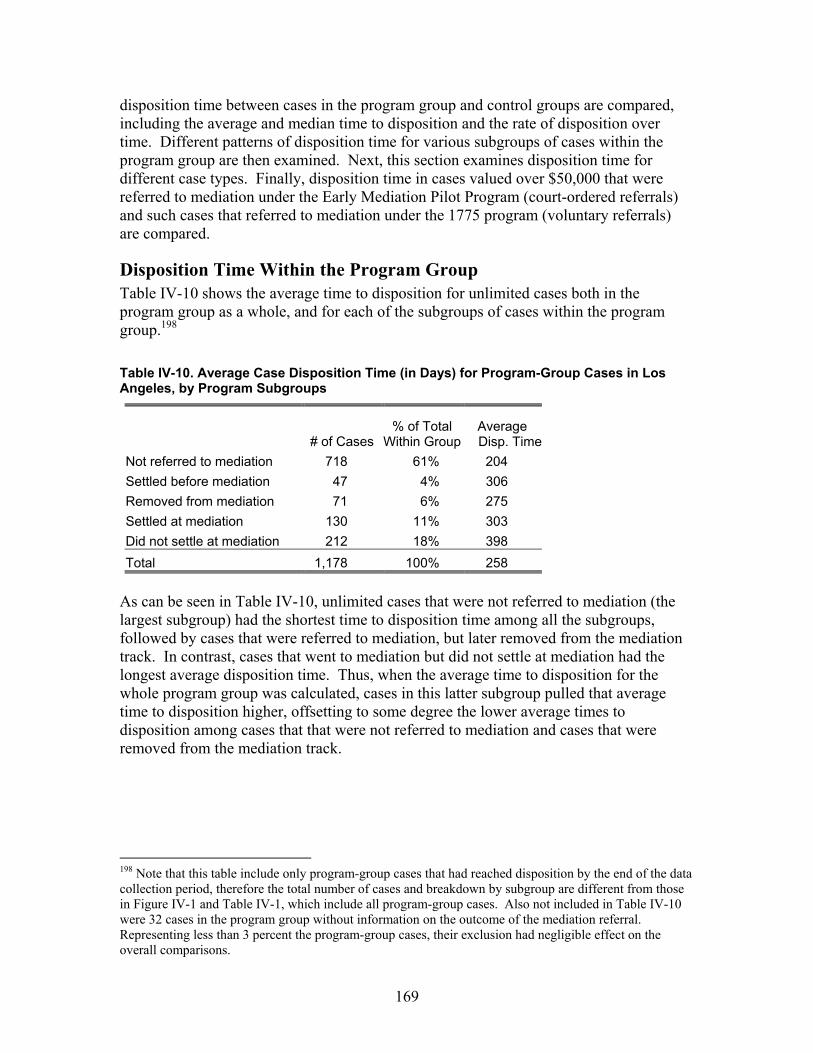
169
disposition time between cases in the program group and control groups are compared, including the average and median time to disposition and the rate of disposition over time. Different patterns of disposition time for various subgroups of cases within the program group are then examined. Next, this section examines disposition time for different case types. Finally, disposition time in cases valued over $50,000 that were referred to mediation under the Early Mediation Pilot Program (court-ordered referrals) and such cases that referred to mediation under the 1775 program (voluntary referrals) are compared.
Disposition Time Within the Program Group Table IV-10 shows the average time to disposition for unlimited cases both in the program group as a whole, and for each of the subgroups of cases within the program group.198 Table IV-10. Average Case Disposition Time (in Days) for Program-Group Cases in Los Angeles, by Program Subgroups
# of Cases % of Total
Within GroupAverage Disp. Time
Not referred to mediation 718 61% 204 Settled before mediation 47 4% 306 Removed from mediation 71 6% 275 Settled at mediation 130 11% 303 Did not settle at mediation 212 18% 398 Total 1,178 100% 258
As can be seen in Table IV-10, unlimited cases that were not referred to mediation (the largest subgroup) had the shortest time to disposition time among all the subgroups, followed by cases that were referred to mediation, but later removed from the mediation track. In contrast, cases that went to mediation but did not settle at mediation had the longest average disposition time. Thus, when the average time to disposition for the whole program group was calculated, cases in this latter subgroup pulled that average time to disposition higher, offsetting to some degree the lower average times to disposition among cases that that were not referred to mediation and cases that were removed from the mediation track.
198 Note that this table include only program-group cases that had reached disposition by the end of the data collection period, therefore the total number of cases and breakdown by subgroup are different from those in Figure IV-1 and Table IV-1, which include all program-group cases. Also not included in Table IV-10 were 32 cases in the program group without information on the outcome of the mediation referral. Representing less than 3 percent the program-group cases, their exclusion had negligible effect on the overall comparisons.
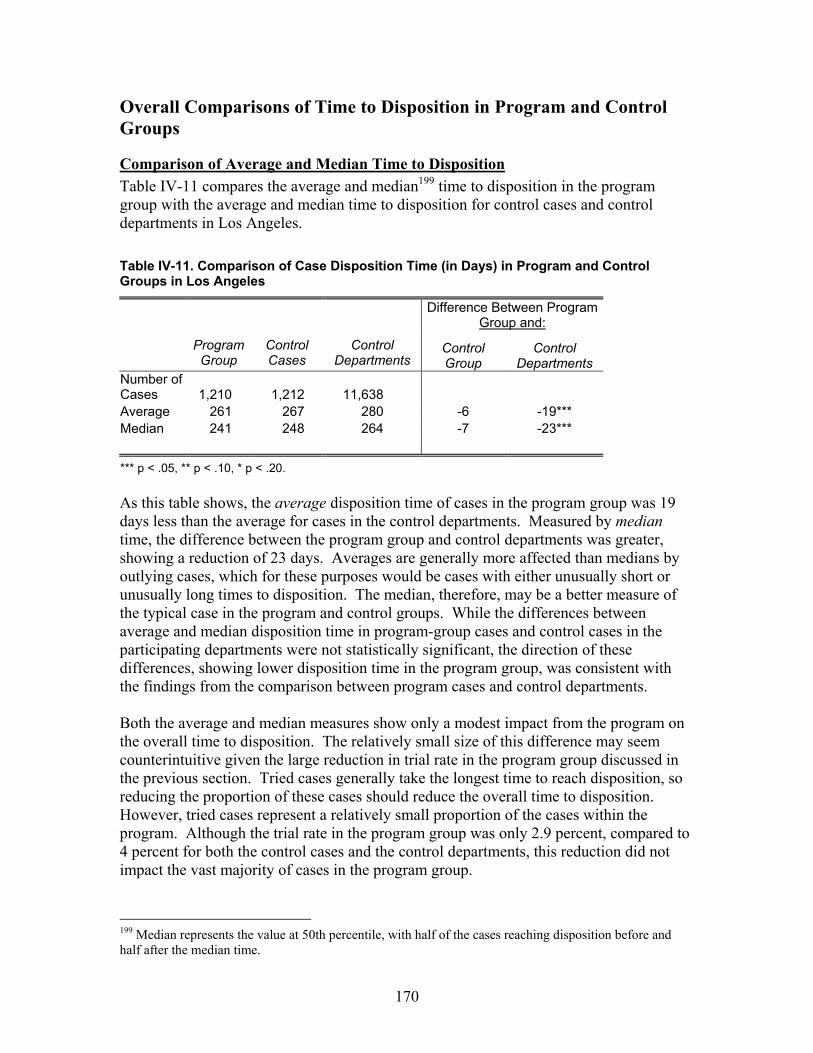
170
Overall Comparisons of Time to Disposition in Program and Control Groups
Comparison of Average and Median Time to Disposition Table IV-11 compares the average and median199 time to disposition in the program group with the average and median time to disposition for control cases and control departments in Los Angeles. Table IV-11. Comparison of Case Disposition Time (in Days) in Program and Control Groups in Los Angeles
Difference Between Program
Group and:
Program Group
Control Cases
Control Departments
Control Group
Control Departments
Number of Cases 1,210 1,212 11,638 Average 261 267 280 -6 -19*** Median 241 248 264 -7 -23*** *** p < .05, ** p < .10, * p < .20. As this table shows, the average disposition time of cases in the program group was 19 days less than the average for cases in the control departments. Measured by median time, the difference between the program group and control departments was greater, showing a reduction of 23 days. Averages are generally more affected than medians by outlying cases, which for these purposes would be cases with either unusually short or unusually long times to disposition. The median, therefore, may be a better measure of the typical case in the program and control groups. While the differences between average and median disposition time in program-group cases and control cases in the participating departments were not statistically significant, the direction of these differences, showing lower disposition time in the program group, was consistent with the findings from the comparison between program cases and control departments. Both the average and median measures show only a modest impact from the program on the overall time to disposition. The relatively small size of this difference may seem counterintuitive given the large reduction in trial rate in the program group discussed in the previous section. Tried cases generally take the longest time to reach disposition, so reducing the proportion of these cases should reduce the overall time to disposition. However, tried cases represent a relatively small proportion of the cases within the program. Although the trial rate in the program group was only 2.9 percent, compared to 4 percent for both the control cases and the control departments, this reduction did not impact the vast majority of cases in the program group.
199 Median represents the value at 50th percentile, with half of the cases reaching disposition before and half after the median time.
171
In addition, it should be noted that a relatively large percentage of the cases had not reached disposition by the end of the data collection period in July 2003: 12 percent of program-group cases, 13 percent of the control cases in the participating departments and 17 percent of the cases in the control departments. The outcomes in these still-pending cases will ultimately affect the final average time to disposition in all these groups and could affect the findings regarding pilot program impact on disposition time. However, because the percentage of still-pending cases is larger in the control groups (particularly in the control departments) than in the program group, it is likely that the differences in disposition time between the program and control groups will further increase. Finally, it is also important to remember that, as discussed above in the pilot program description, the program group does not consist just of mediated cases; it includes cases in all of the subgroups listed in Table IV-10. As shown in that table, the cases in these subgroups had very different average times to disposition which offset each other to some degree when the overall average time to disposition in the program group was calculated.
Comparison of Case Disposition Timing To better understand at what point in the litigation process the pilot program had its impact on the overall time to disposition, the disposition rate over time from the filing of the complaint was examined. This analysis also provides information about whether the program impact on disposition time occurred around the time when certain program elements, such as the case management conference, generally took place. Figure IV-3 below compares the timing of case disposition in the program group and in the two control groups. The horizontal axis represent time (in months) from filing until disposition of a case and the vertical axis represent the cumulative proportion of cases disposed (or disposition rate). The wider, purple line represents the program group disposition rate and the thinner, black line the control group disposition rate. The gap between these two lines represents the difference in the disposition rates in the program group and control group at a given time from the filing of a complaint. The slope of the lines represents the pace at which cases were reaching disposition at a particular point in time; a steeper slope indicates more cases were reaching disposition at that time. In addition to the timing of case disposition, the chart also shows when the case management conferences were held and mediation sessions were completed in the program and control groups.200 Case management conferences were held earlier in the program group: approximately five months after filing compared to six months for control cases in the participating departments and cases in the control departments. Mediation was also completed earlier in the program group: approximately eight months after filing compared to nine months for control cases and close to ten months in the control departments.
200 Data on mediation dates were not available. Instead, case management data provided dates when the mediator filed with the court the Statement of Agreement and Nonagreement after the mediation session had been completed.

172
Figure IV-3. Comparison of Case Disposition Rate Over Time in Program and Control Groups in Los Angeles
Looking first at the disposition rate in the program group, there were two points at which the pace of dispositions rose for program cases, reaching its fastest pace. The first of these points was at 5 months after filing—about the time, on average, when case management conferences were held in the program group. The second was at seven to eight months after filing—about the time, on average, when mediations were conducted and completed in the program group. The higher disposition rates close to the time when the case management conferences and mediations occurred in the program group supports the hypothesis that early conferences and early mediations expedited case disposition. Turning to the comparison between the program group and control cases in the participating departments, although it is difficult to see in Figure IV-3, the disposition rate in the program group was higher than the rate for control cases for the entire 24-month follow up period, indicating that the pilot program increased the disposition rate.
Program Control Departments
Program Control Cases
0%
20%
40%
60%
80%
100%
1 3 5 7 9 11 13 15 17 19
Month from filing
Cum
ulat
ive
disp
ositi
on ra
te
CMC held Completed mediation
0%
20%
40%
60%
80%
100%
1 3 5 7 9 11 13 15 17 19
Month from filing
Cum
ulat
ive
disp
ositi
on ra
te
CMC held Completed mediation
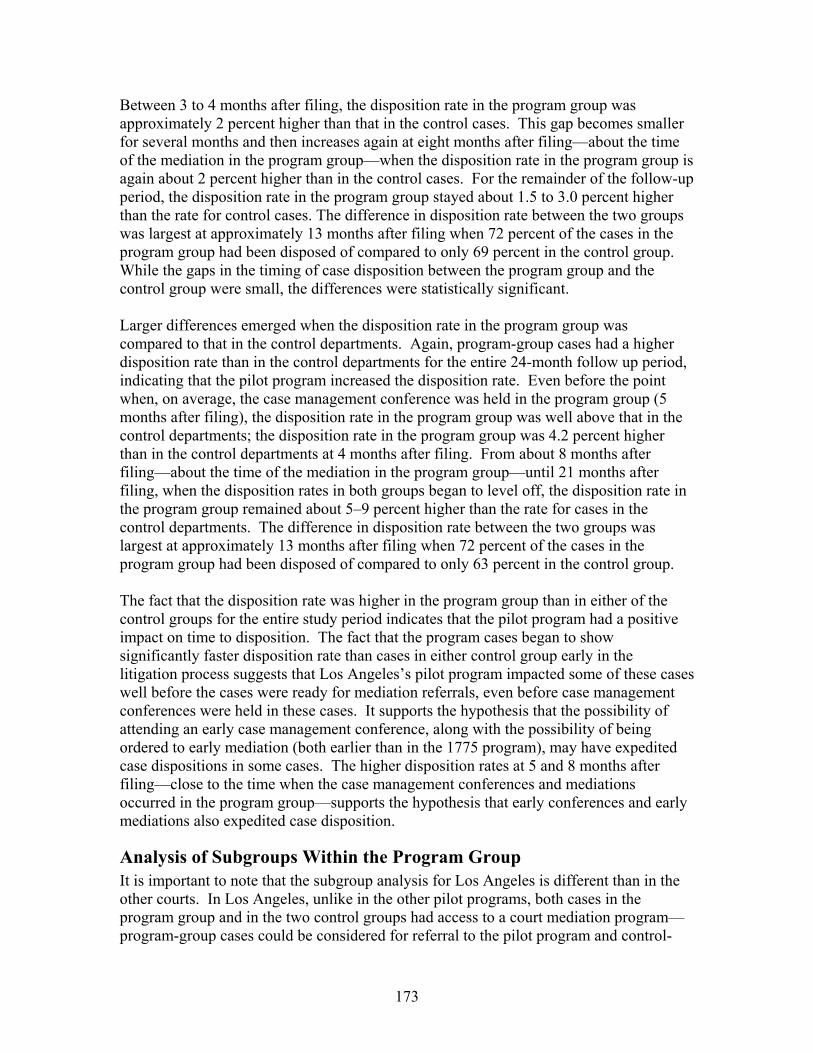
173
Between 3 to 4 months after filing, the disposition rate in the program group was approximately 2 percent higher than that in the control cases. This gap becomes smaller for several months and then increases again at eight months after filing—about the time of the mediation in the program group—when the disposition rate in the program group is again about 2 percent higher than in the control cases. For the remainder of the follow-up period, the disposition rate in the program group stayed about 1.5 to 3.0 percent higher than the rate for control cases. The difference in disposition rate between the two groups was largest at approximately 13 months after filing when 72 percent of the cases in the program group had been disposed of compared to only 69 percent in the control group. While the gaps in the timing of case disposition between the program group and the control group were small, the differences were statistically significant. Larger differences emerged when the disposition rate in the program group was compared to that in the control departments. Again, program-group cases had a higher disposition rate than in the control departments for the entire 24-month follow up period, indicating that the pilot program increased the disposition rate. Even before the point when, on average, the case management conference was held in the program group (5 months after filing), the disposition rate in the program group was well above that in the control departments; the disposition rate in the program group was 4.2 percent higher than in the control departments at 4 months after filing. From about 8 months after filing—about the time of the mediation in the program group—until 21 months after filing, when the disposition rates in both groups began to level off, the disposition rate in the program group remained about 5–9 percent higher than the rate for cases in the control departments. The difference in disposition rate between the two groups was largest at approximately 13 months after filing when 72 percent of the cases in the program group had been disposed of compared to only 63 percent in the control group. The fact that the disposition rate was higher in the program group than in either of the control groups for the entire study period indicates that the pilot program had a positive impact on time to disposition. The fact that the program cases began to show significantly faster disposition rate than cases in either control group early in the litigation process suggests that Los Angeles’s pilot program impacted some of these cases well before the cases were ready for mediation referrals, even before case management conferences were held in these cases. It supports the hypothesis that the possibility of attending an early case management conference, along with the possibility of being ordered to early mediation (both earlier than in the 1775 program), may have expedited case dispositions in some cases. The higher disposition rates at 5 and 8 months after filing—close to the time when the case management conferences and mediations occurred in the program group—supports the hypothesis that early conferences and early mediations also expedited case disposition.
Analysis of Subgroups Within the Program Group It is important to note that the subgroup analysis for Los Angeles is different than in the other courts. In Los Angeles, unlike in the other pilot programs, both cases in the program group and in the two control groups had access to a court mediation program—program-group cases could be considered for referral to the pilot program and control-
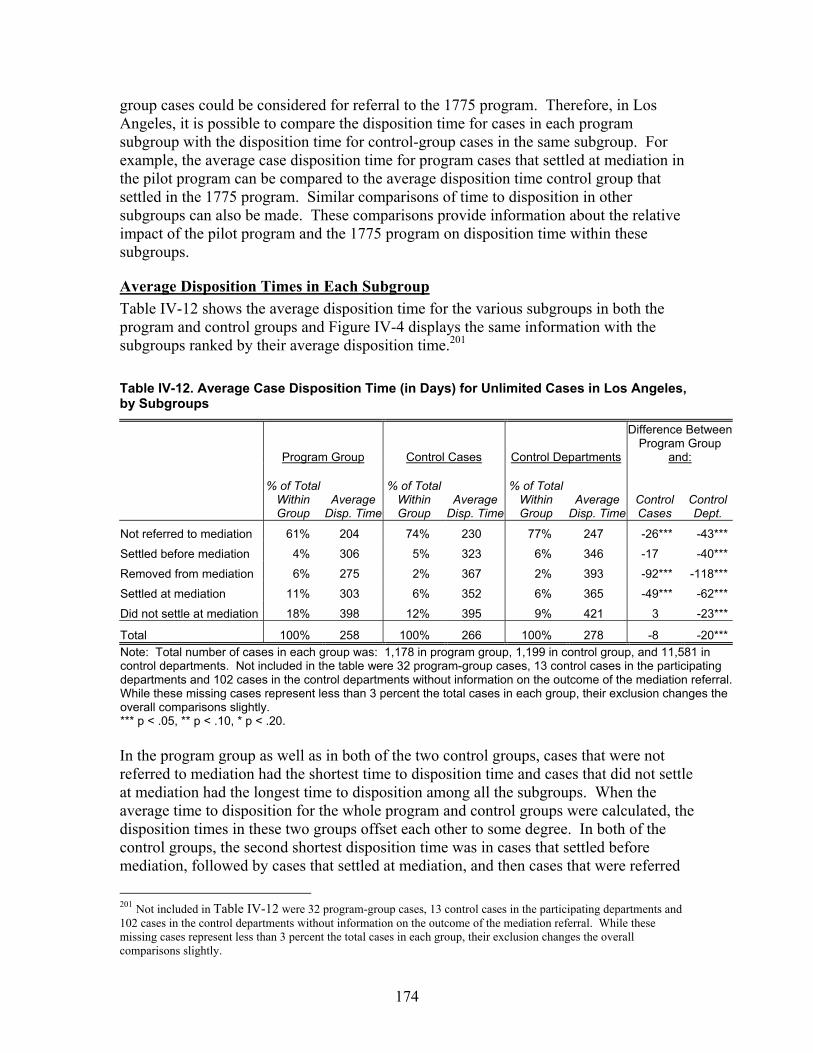
174
group cases could be considered for referral to the 1775 program. Therefore, in Los Angeles, it is possible to compare the disposition time for cases in each program subgroup with the disposition time for control-group cases in the same subgroup. For example, the average case disposition time for program cases that settled at mediation in the pilot program can be compared to the average disposition time control group that settled in the 1775 program. Similar comparisons of time to disposition in other subgroups can also be made. These comparisons provide information about the relative impact of the pilot program and the 1775 program on disposition time within these subgroups.
Average Disposition Times in Each Subgroup Table IV-12 shows the average disposition time for the various subgroups in both the program and control groups and Figure IV-4 displays the same information with the subgroups ranked by their average disposition time.201 Table IV-12. Average Case Disposition Time (in Days) for Unlimited Cases in Los Angeles, by Subgroups
Program Group Control Cases Control Departments
Difference Between Program Group
and:
% of Total Within Group
Average Disp. Time
% of Total Within Group
Average Disp. Time
% of Total Within Group
Average Disp. Time
Control Cases
Control Dept.
Not referred to mediation 61% 204 74% 230 77% 247 -26*** -43***
Settled before mediation 4% 306 5% 323 6% 346 -17 -40***
Removed from mediation 6% 275 2% 367 2% 393 -92*** -118***
Settled at mediation 11% 303 6% 352 6% 365 -49*** -62***
Did not settle at mediation 18% 398 12% 395 9% 421 3 -23***
Total 100% 258 100% 266 100% 278 -8 -20***Note: Total number of cases in each group was: 1,178 in program group, 1,199 in control group, and 11,581 in control departments. Not included in the table were 32 program-group cases, 13 control cases in the participating departments and 102 cases in the control departments without information on the outcome of the mediation referral. While these missing cases represent less than 3 percent the total cases in each group, their exclusion changes the overall comparisons slightly. *** p < .05, ** p < .10, * p < .20. In the program group as well as in both of the two control groups, cases that were not referred to mediation had the shortest time to disposition time and cases that did not settle at mediation had the longest time to disposition among all the subgroups. When the average time to disposition for the whole program and control groups were calculated, the disposition times in these two groups offset each other to some degree. In both of the control groups, the second shortest disposition time was in cases that settled before mediation, followed by cases that settled at mediation, and then cases that were referred
201 Not included in Table IV-12 were 32 program-group cases, 13 control cases in the participating departments and 102 cases in the control departments without information on the outcome of the mediation referral. While these missing cases represent less than 3 percent the total cases in each group, their exclusion changes the overall comparisons slightly.
175
to mediation, but later removed from the mediation track. In contrast, in the program group, this rank order was reversed: cases that were referred to mediation, but later removed from the mediation track had the second shortest time to disposition, followed by cases that settled at mediation, and then cases that settled before mediation.
Figure IV-4. Average Case Disposition Time (in Days) for Unlimited Cases in Los Angeles, by Subgroups
Looking for patterns across the program and control groups, Figure IV-4 shows that, with one exception, the average case disposition time was noticeably shorter in the program group in all subgroups compared to both the control cases and the control departments.202 In trying to understand how these subgroups contributed to the overall average time to disposition in the program group and in the two control groups, it is important to note not just the differences in the average time to disposition in each subgroup, but also the differences in the proportion of cases within each subgroup in the program group compared to two control groups. For example, Figure IV-4 shows that cases not referred to mediation had the shortest time to disposition of any of the subgroups in both the program and control groups. However, this subgroup represented a smaller portion of the program group than of the control groups: approximately 61 percent of all cases in the program group were not referred to mediation compared to 74 percent of the control cases in the participating departments and 77 percent of the cases in the control departments.203 Since the control groups had more of these cases with short times to disposition, the overall average time to disposition in the control groups was shortened compared to the overall average in the program group.
202 Program cases that did not settle at mediation had a slightly longer disposition time than control cases in the participating departments that did not settle at mediation. 203 These differences in mediation referral rate among the three comparison groups are likely the result of judges in pilot program having greater authority to order larger cases to mediation.
0 100 200 300 400 500
Not referred to mediation
Total in program and control groups
Removed from mediation
Settled at mediation
Settled before mediation
Not settled at mediation
Average Case Disposition Time (Days)
Control Dept.
Control Cases
Program Group
176
Similarly, cases that were referred to mediation but that did not settle at mediation had the longest disposition time among all the subgroups in both the program and control groups. These cases represented a larger proportion of the program group (18 percent) than of either the control cases (12 percent) or the control departments (9 percent). Since the program group had more of these cases with longer times to disposition, the overall average time to disposition in the program group was lengthened compared to the control cases and control departments. Thus, the relative distribution of these cases in the program and control groups resulted in pulling the overall average time to disposition in the program group higher and pulling overall average in the two control groups lower, narrowing the gap between these overall averages. This narrowing effect was offset to some degree by the fact that proportion of cases that settled at mediation, which had a relatively short time to disposition, was higher in the program group (11 percent) than in either the control cases or the control departments (6 percent), pulling the overall average time to disposition in the program group lower. However, overall the difference between the average time to disposition in the program group as a whole and in the two control groups was smaller because the program group had a lower proportion of non-referred cases and the higher proportion of cases that did not settle at mediation.
Program Impact on Time to Disposition in Each Subgroup While the above breakdown of disposition time by subgroups provides helpful descriptive information concerning different patterns of case disposition time in each subgroup and their contribution to the overall average time to disposition in the program and control groups, it does not necessarily show the degree to which differences in the average disposition time in the program and control subgroups are due to the impact of the pilot program. As noted in the discussion of data and methods, this is due to the possibility that program cases in a given subgroup are qualitatively different (have different case characteristics) from control-group cases in that same subgroup. In order to better isolate the impact of the pilot program from the impact of these differences in case characteristics, regression analysis was used to compare the disposition time of program cases in each of the subgroups to the disposition time of similar control-group cases in the same subgroup. 204 These regression results show differences in disposition time between cases in the Early Mediation Pilot Program and cases in the 1775 program that are in the same subgroup. The results of these comparisons205 suggest that, among cases that settled at mediation, cases that settled in the pilot program took less time to reach disposition than like cases in either of the control groups that settled in the 1775 program, although the size of this 204 Please see Section I.B. for a description of the regression analysis method. 205 No statistically significant difference was found between the disposition time for cases that were not referred to mediation in the pilot program and the disposition time of cases not referred to mediation in the 1775 program. Because regression analysis relies on case characteristic information that was gathered through surveys, sample size was too small for the subgroups of cases that settled before mediation or were removed from mediation to produce meaningful regression results for these subgroups.
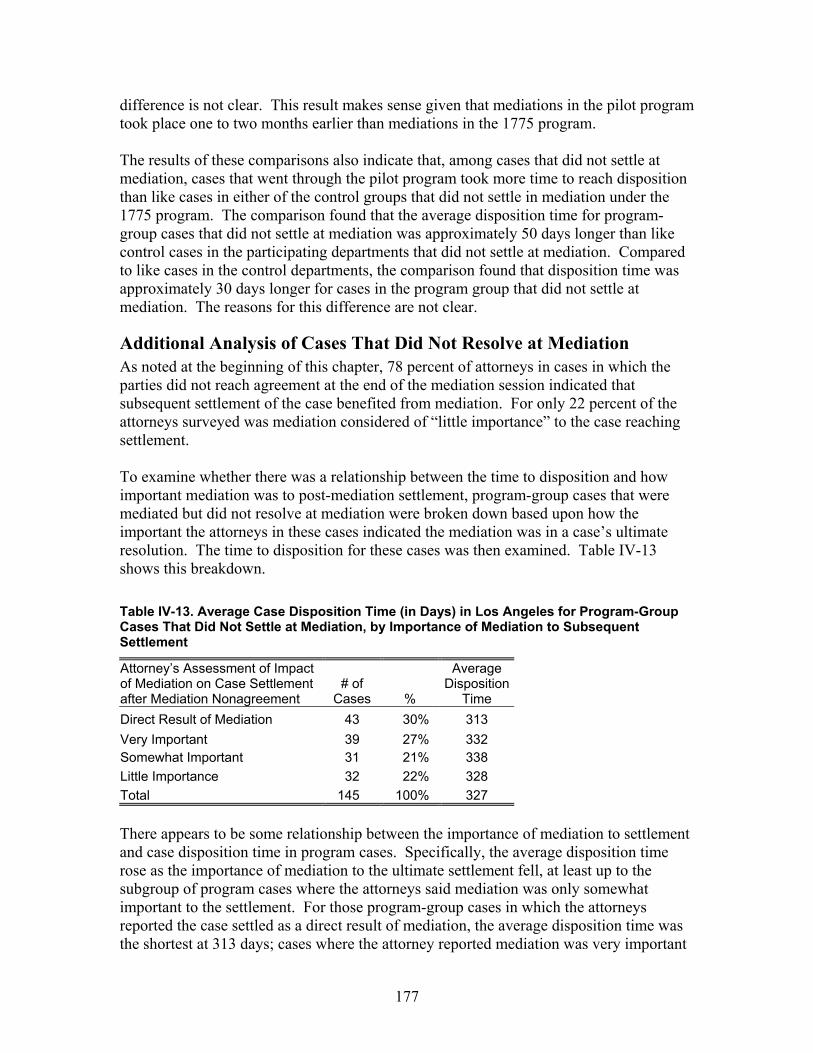
177
difference is not clear. This result makes sense given that mediations in the pilot program took place one to two months earlier than mediations in the 1775 program. The results of these comparisons also indicate that, among cases that did not settle at mediation, cases that went through the pilot program took more time to reach disposition than like cases in either of the control groups that did not settle in mediation under the 1775 program. The comparison found that the average disposition time for program-group cases that did not settle at mediation was approximately 50 days longer than like control cases in the participating departments that did not settle at mediation. Compared to like cases in the control departments, the comparison found that disposition time was approximately 30 days longer for cases in the program group that did not settle at mediation. The reasons for this difference are not clear.
Additional Analysis of Cases That Did Not Resolve at Mediation As noted at the beginning of this chapter, 78 percent of attorneys in cases in which the parties did not reach agreement at the end of the mediation session indicated that subsequent settlement of the case benefited from mediation. For only 22 percent of the attorneys surveyed was mediation considered of “little importance” to the case reaching settlement. To examine whether there was a relationship between the time to disposition and how important mediation was to post-mediation settlement, program-group cases that were mediated but did not resolve at mediation were broken down based upon how the important the attorneys in these cases indicated the mediation was in a case’s ultimate resolution. The time to disposition for these cases was then examined. Table IV-13 shows this breakdown. Table IV-13. Average Case Disposition Time (in Days) in Los Angeles for Program-Group Cases That Did Not Settle at Mediation, by Importance of Mediation to Subsequent Settlement
Attorney’s Assessment of Impact of Mediation on Case Settlement after Mediation Nonagreement
# of Cases %
Average Disposition
Time Direct Result of Mediation 43 30% 313 Very Important 39 27% 332 Somewhat Important 31 21% 338 Little Importance 32 22% 328 Total 145 100% 327 There appears to be some relationship between the importance of mediation to settlement and case disposition time in program cases. Specifically, the average disposition time rose as the importance of mediation to the ultimate settlement fell, at least up to the subgroup of program cases where the attorneys said mediation was only somewhat important to the settlement. For those program-group cases in which the attorneys reported the case settled as a direct result of mediation, the average disposition time was the shortest at 313 days; cases where the attorney reported mediation was very important
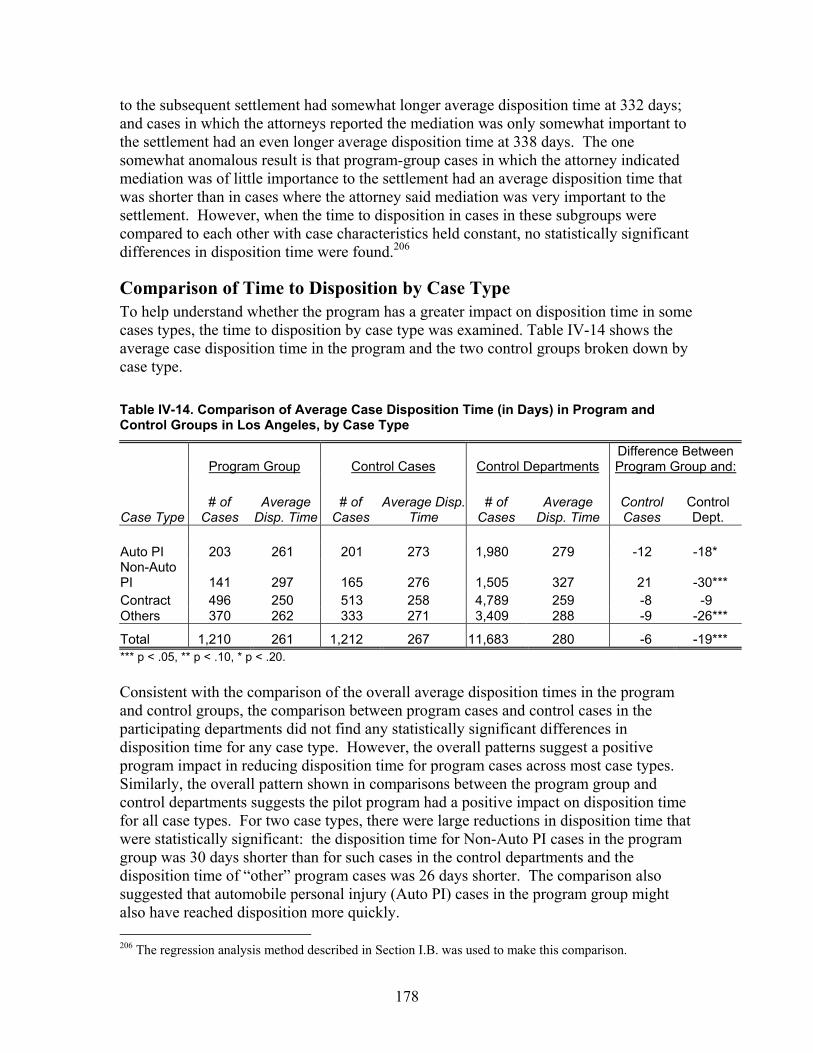
178
to the subsequent settlement had somewhat longer average disposition time at 332 days; and cases in which the attorneys reported the mediation was only somewhat important to the settlement had an even longer average disposition time at 338 days. The one somewhat anomalous result is that program-group cases in which the attorney indicated mediation was of little importance to the settlement had an average disposition time that was shorter than in cases where the attorney said mediation was very important to the settlement. However, when the time to disposition in cases in these subgroups were compared to each other with case characteristics held constant, no statistically significant differences in disposition time were found.206
Comparison of Time to Disposition by Case Type To help understand whether the program has a greater impact on disposition time in some cases types, the time to disposition by case type was examined. Table IV-14 shows the average case disposition time in the program and the two control groups broken down by case type. Table IV-14. Comparison of Average Case Disposition Time (in Days) in Program and Control Groups in Los Angeles, by Case Type
Program Group Control Cases Control Departments Difference Between Program Group and:
Case Type # of
Cases Average
Disp. Time # of
Cases Average Disp.
Time # of
Cases Average
Disp. Time Control Cases
Control Dept.
Auto PI 203 261 201 273 1,980 279 -12 -18* Non-Auto PI 141 297 165 276 1,505 327 21 -30*** Contract 496 250 513 258 4,789 259 -8 -9 Others 370 262 333 271 3,409 288 -9 -26***
Total 1,210 261 1,212 267 11,683 280 -6 -19*** *** p < .05, ** p < .10, * p < .20. Consistent with the comparison of the overall average disposition times in the program and control groups, the comparison between program cases and control cases in the participating departments did not find any statistically significant differences in disposition time for any case type. However, the overall patterns suggest a positive program impact in reducing disposition time for program cases across most case types. Similarly, the overall pattern shown in comparisons between the program group and control departments suggests the pilot program had a positive impact on disposition time for all case types. For two case types, there were large reductions in disposition time that were statistically significant: the disposition time for Non-Auto PI cases in the program group was 30 days shorter than for such cases in the control departments and the disposition time of “other” program cases was 26 days shorter. The comparison also suggested that automobile personal injury (Auto PI) cases in the program group might also have reached disposition more quickly. 206 The regression analysis method described in Section I.B. was used to make this comparison.

179
Comparison of Case Disposition Time in Cases Valued Over $50,000 Referred to Mediation under Pilot Program (Court-Ordered Referral) and under 1775 program (Voluntary Referral) Table IV-15 compares the time to disposition in cases valued over $50,000 that were referred to mediation under the Early Mediation Pilot Program (court-ordered referrals) and such cases referred to mediation under the 1775 program (voluntary referrals). Table IV-15. Comparison of Case Disposition Time in Cases Over $50,000 Referred to Mediation in Los Angeles
Difference Between Program Group and:
Program Group
Control Cases
Control Dept.
Control Cases
Control Dept.
Number of Cases 349 210 1,710 Average 362 382 396 -20*** -34*** Median 351 369 380 -18*** -29*** *** p < .05, ** p < .10, * p < .20.
This table indicates that cases valued at over $50,000 referred to early mediation under the pilot program, measured by both average and median disposition times, were disposed of more quickly than cases valued over $50,000 that were referred to mediation under the 1775 program. However, it is not clear whether these differences are a result of a mandatory referral to mediation in the pilot program versus voluntary referral in the 1775 program or at other differences between the pilot program and the 1775 program. As noted in Section I.B., there are a variety of programmatic differences between the Early Mediation Pilot Program and the 1775 program, including that case management conferences and mediations occur 1–2 months earlier in the pilot program. Comparisons between cases in these two programs therefore show the differences in time to disposition that result from all of the differences between the whole pilot program model and the 1775 program model. It is quite possible, for example, that the earlier case management conferences and mediations in the pilot program account for the difference in disposition time between these two programs. As discussed below in the chapter concerning the pilot program in Fresno, when the mediation referral and mediation were moved 2 ½ months earlier in Fresno, the program showed a 15–28 day reduction in the disposition time.
Conclusion There is strong evidence that the pilot program in Los Angeles had a positive impact in reducing case disposition time. The average time to disposition in the program group was reduced by 19 days compared to cases in the control departments and the median time to disposition in the program was reduced by 23 days compared to cases in the control departments. The data also indicates that the pace of dispositions quickened and program-group cases were disposed of fastest about the time of the early case management conference and
180
early mediation, suggesting that the conference and mediation contributed to shortening the time to disposition. Program cases were also disposed of faster than control-group cases well before the time of the early case management conference, suggesting that the possibility of attending the early case management conference and being referred to early mediation may also have increased dispositions. Among cases that settled at mediation, there is evidence that suggests cases that settled in the pilot program took less time to reach disposition than like cases in either of the control groups that settled in the 1775 program, although the size of this difference is not clear. However, there is also evidence indicating that among cases that did not settle at mediation, cases that went through the pilot program took more time to reach disposition than like cases in either of the control groups that did not settle in mediation under the 1775 program.
181
H. Impact of Los Angeles’ Pilot Program on Litigant Satisfaction
Summary of Findings The pilot program in Los Angeles increased attorney satisfaction with the court’s services: • Both parties and attorneys in the Los Angeles program expressed high satisfaction
when they used mediation under the pilot program. They were particularly satisfied with the performance of the mediators, with both parties and attorneys showing an average satisfaction score of approximately 6 on a 7-point scale. They also strongly agreed that the mediator and the mediation process were fair and that they would recommend both to others.
• Attorneys in program-group cases were more satisfied with the services provided by
the court than attorneys in control-group cases. • In comparisons of like cases in the program and control groups, attorneys whose
cases settled at mediation under the Early Mediation Pilot Program were significantly more satisfied with both the outcome of the case and with the services of the court compared to attorneys in cases that settled at mediation under the 1775 program. Conversely, attorneys whose cases did not settle at mediation under the Early Mediation Pilot Program were less satisfied with the outcome of the case than attorneys whose cases did not settle at mediation under the 1775 program. Among cases that were not referred to mediation, attorneys in pilot program cases were more satisfied with the litigation process and services provided by the court than attorneys in 1775 program cases.
• Attorneys across all case types except for automobile personal injury cases were
generally more satisfied with the outcome, litigation process, and court’s services in the Early Mediation Pilot Program.
• There was evidence suggesting that attorneys in cases valued over $50,000 referred to
mediation under pilot program (court-ordered referrals) may have been more satisfied with the services provided by the court than attorneys in cases valued over $50,000 referred to mediation under the 1775 program (voluntary referrals).
Introduction This section examines the impact of Los Angeles’ pilot program on litigant satisfaction. As described in detail in Section I.B. concerning the data and methods used in this study, data on litigant satisfaction was collected in two ways. First, in a survey administered at the end of the mediation in cases that went to mediation under the pilot program between July 2001 and June 2002 (postmediation survey), both parties and attorneys were asked about their satisfaction with various aspects of the mediation process. Second, in a separate survey administered shortly after cases reached disposition in cases disposed of
182
between July 2001 and June 2002 (postdisposition survey), parties and attorneys in both program and control cases were asked about their satisfaction with the outcome of their case, the court’s services, and their overall litigation experience. In this section, the satisfaction of parties and attorneys who used mediation under the pilot program as reported in the postmediation survey is first described. Second, the satisfaction of attorneys in program-group cases as a whole and in each of the program subgroups in discussed. Attorney satisfaction in the program group and two-control group is then compared.207 Next, attorney satisfaction in the various subgroups within the program is examined. This is followed by an examination of the program impact on litigant satisfaction in different case types. Finally, attorney satisfaction in cases valued over $50,000 that were referred to mediation under the Early Mediation Pilot Program (court-ordered referrals) and such cases that referred to mediation under the 1775 program (voluntary referrals) are compared.
Overall Litigant Satisfaction for Cases That Used Pilot Program Mediation As shown in Figure IV-5 below, both parties and attorneys who used mediation services in the pilot program expressed high satisfaction with all aspects of their mediation experience. Parties and attorneys who participated in mediation were asked to rate their satisfaction with the mediator’s performance, the mediation process, the outcome of the mediation, the litigation process, and the services provided by the court on a scale from 1 to 7 where 1 is “highly dissatisfied” and 7 is “highly satisfied.” Figure IV-5 shows the average satisfaction scores for both parties and attorneys in these mediated cases. It is clear from this figure that parties and attorneys who used mediation services in the pilot program were highly satisfied with all aspects of the mediation experience. Most of the average satisfaction scores were in the “highly satisfied” range (5.0 or above) and none was below 4.1. Both parties and attorneys were most satisfied with the performance of mediators, with average satisfaction scores of 6.0 for attorneys and 5.8 for parties. They were also highly satisfied with the mediation services and services provided by the court, with average satisfaction scores about 5.7 for attorneys and 5.2 for parties. Both parties and attorneys were least satisfied with the outcome of the case; average outcome satisfaction scores were 4.9 for attorneys and 4.1 for parties. 207 As was discussed above in Section I.B., since we received only a small number of party responses to the postdisposition survey in the control group, it was not possible to compare party satisfaction in the program and control groups. Therefore, all comparisons between the program and control groups were based only on attorney responses to this survey.
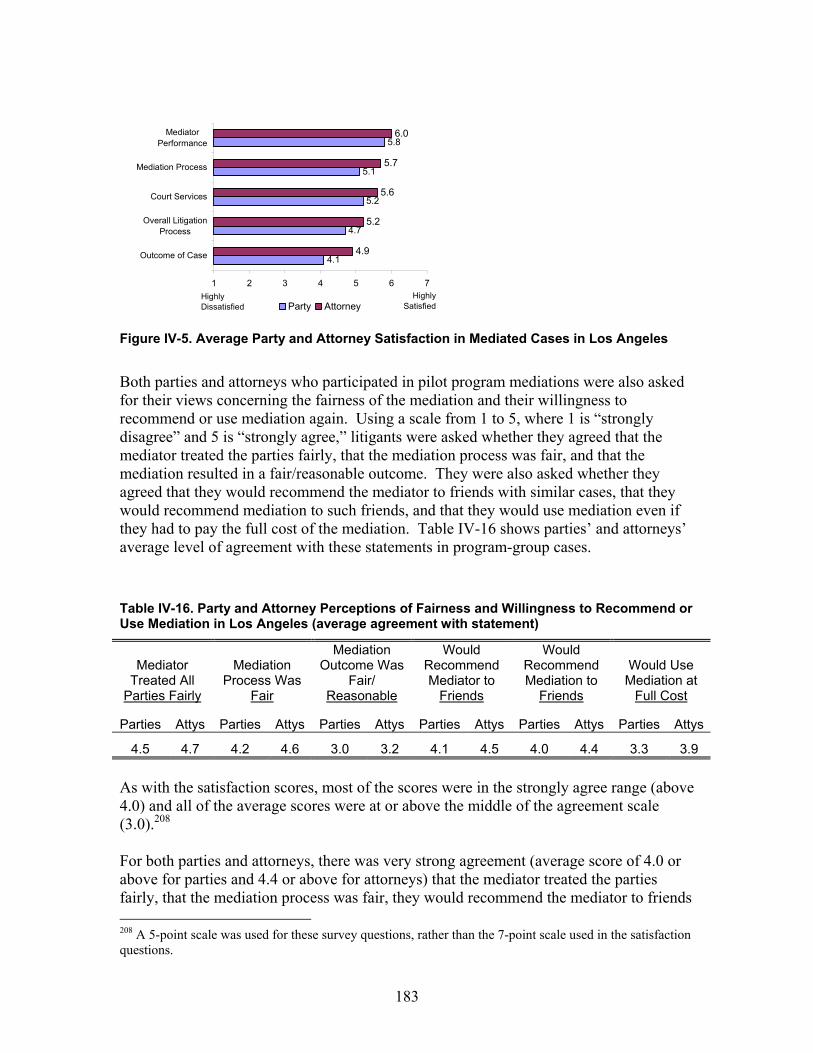
183
Figure IV-5. Average Party and Attorney Satisfaction in Mediated Cases in Los Angeles
Both parties and attorneys who participated in pilot program mediations were also asked for their views concerning the fairness of the mediation and their willingness to recommend or use mediation again. Using a scale from 1 to 5, where 1 is “strongly disagree” and 5 is “strongly agree,” litigants were asked whether they agreed that the mediator treated the parties fairly, that the mediation process was fair, and that the mediation resulted in a fair/reasonable outcome. They were also asked whether they agreed that they would recommend the mediator to friends with similar cases, that they would recommend mediation to such friends, and that they would use mediation even if they had to pay the full cost of the mediation. Table IV-16 shows parties’ and attorneys’ average level of agreement with these statements in program-group cases. Table IV-16. Party and Attorney Perceptions of Fairness and Willingness to Recommend or Use Mediation in Los Angeles (average agreement with statement)
Mediator Treated All
Parties Fairly
Mediation Process Was
Fair
Mediation Outcome Was
Fair/ Reasonable
Would Recommend Mediator to
Friends
Would Recommend Mediation to
Friends
Would Use Mediation at
Full Cost
Parties Attys Parties Attys Parties Attys Parties Attys Parties Attys Parties Attys
4.5 4.7 4.2 4.6 3.0 3.2 4.1 4.5 4.0 4.4 3.3 3.9 As with the satisfaction scores, most of the scores were in the strongly agree range (above 4.0) and all of the average scores were at or above the middle of the agreement scale (3.0).208 For both parties and attorneys, there was very strong agreement (average score of 4.0 or above for parties and 4.4 or above for attorneys) that the mediator treated the parties fairly, that the mediation process was fair, they would recommend the mediator to friends 208 A 5-point scale was used for these survey questions, rather than the 7-point scale used in the satisfaction questions.
4.1
4.7
5.2
5.1
5.8
4.9
5.2
5.6
5.7
6.0
1 2 3 4 5 6 7
Outcome of Case
Overall LitigationProcess
Court Services
Mediation Process
MediatorPerformance
Party AttorneyHighly
SatisfiedHighly Dissatisfied

184
with similar cases, and that that they would recommend mediation to such friends. Both parties and attorneys indicated less agreement that they would use mediation if they had to pay the full cost; the average score was 3.3 for parties and 3.9 for attorneys. The lowest scores related to the fairness/reasonableness of the mediation outcome, at only 3.0 for parties and 3.9 for attorneys. It is clear from the responses to both these sets of questions that while parties and attorneys were generally very pleased with their mediation experience, overall they were less pleased or neutral in terms of the outcome of the mediation process (in fact, on both outcome questions, about 30 percent of the parties and attorneys responded that they were neutral). In evaluating this result, it is important to remember that this survey was administered at the end of the mediation and that in a large proportion of cases a settlement was not reached at end of the mediation. Not surprisingly, the way parties and attorneys responded to the two outcome questions depended largely on whether their cases settled at mediation. Average satisfaction with the outcome in program-group cases that settled at mediation was 6.09 for attorneys and 5.09 for parties, 50 percent higher than the average scores of 4.05 for attorneys and 3.4 for parties in cases that did not settle at mediation. Similarly, average attorney responses concerning the fairness/reasonableness of the outcome were 73 percent higher in cases that settled at mediation than in cases that did not (4.30 compared to 2.48) and party responses were almost 60 percent higher in cases that settled at mediation (3.74 compared to 2.36). When the scores in both cases settled and not settled at mediation were added together to calculate the overall average satisfaction with the outcome, the higher scores in cases that settled were offset by those in cases that did not, pulling the overall average lower. It is also clear from the responses to both these sets of questions that while both parties and attorneys were generally very pleased with their pilot program mediation experience, attorneys were more pleased than parties. Attorneys’ average scores were consistently higher than those for parties on all of these questions. The gap between attorney and party satisfaction scores ranged from 0.2 for mediator performance to 0.8 for outcome of the case. The higher attorney satisfaction may, in part, reflect a greater understanding on the part of attorneys about what to expect from the pilot program mediation process. Given the fact that there was a court-connected mediation program in Los Angeles before the pilot program was introduced, many attorneys are likely to have participated in mediations before, so they are likely to have been familiar with the mediation process and to have based their expectations about the process on this knowledge. Parties are less likely to have participated in previous mediations and may not have known what to expect from the mediation process. This may suggest the need for additional educational efforts targeted at parties, rather than attorneys. The higher scores for attorneys may also, in part, reflect the fact that attorneys’ and parties’ satisfaction were associated with different aspects of their mediation experiences. Attorneys’ responses on only three of the survey questions were strongly correlated with their responses concerning satisfaction the mediation process—whether they believed that mediation process was fair, that mediation resulted in a fair/reasonable outcome, and
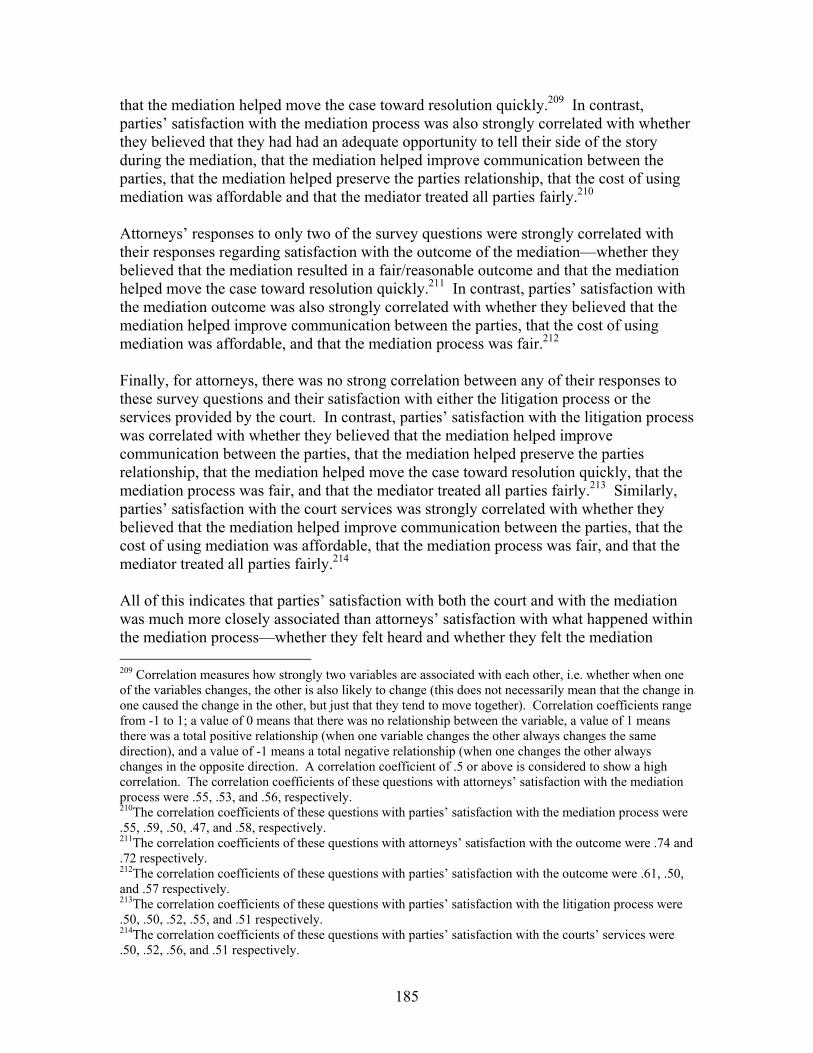
185
that the mediation helped move the case toward resolution quickly.209 In contrast, parties’ satisfaction with the mediation process was also strongly correlated with whether they believed that they had had an adequate opportunity to tell their side of the story during the mediation, that the mediation helped improve communication between the parties, that the mediation helped preserve the parties relationship, that the cost of using mediation was affordable and that the mediator treated all parties fairly.210 Attorneys’ responses to only two of the survey questions were strongly correlated with their responses regarding satisfaction with the outcome of the mediation—whether they believed that the mediation resulted in a fair/reasonable outcome and that the mediation helped move the case toward resolution quickly.211 In contrast, parties’ satisfaction with the mediation outcome was also strongly correlated with whether they believed that the mediation helped improve communication between the parties, that the cost of using mediation was affordable, and that the mediation process was fair.212 Finally, for attorneys, there was no strong correlation between any of their responses to these survey questions and their satisfaction with either the litigation process or the services provided by the court. In contrast, parties’ satisfaction with the litigation process was correlated with whether they believed that the mediation helped improve communication between the parties, that the mediation helped preserve the parties relationship, that the mediation helped move the case toward resolution quickly, that the mediation process was fair, and that the mediator treated all parties fairly.213 Similarly, parties’ satisfaction with the court services was strongly correlated with whether they believed that the mediation helped improve communication between the parties, that the cost of using mediation was affordable, that the mediation process was fair, and that the mediator treated all parties fairly.214 All of this indicates that parties’ satisfaction with both the court and with the mediation was much more closely associated than attorneys’ satisfaction with what happened within the mediation process—whether they felt heard and whether they felt the mediation 209 Correlation measures how strongly two variables are associated with each other, i.e. whether when one of the variables changes, the other is also likely to change (this does not necessarily mean that the change in one caused the change in the other, but just that they tend to move together). Correlation coefficients range from -1 to 1; a value of 0 means that there was no relationship between the variable, a value of 1 means there was a total positive relationship (when one variable changes the other always changes the same direction), and a value of -1 means a total negative relationship (when one changes the other always changes in the opposite direction. A correlation coefficient of .5 or above is considered to show a high correlation. The correlation coefficients of these questions with attorneys’ satisfaction with the mediation process were .55, .53, and .56, respectively. 210The correlation coefficients of these questions with parties’ satisfaction with the mediation process were .55, .59, .50, .47, and .58, respectively. 211The correlation coefficients of these questions with attorneys’ satisfaction with the outcome were .74 and .72 respectively. 212The correlation coefficients of these questions with parties’ satisfaction with the outcome were .61, .50, and .57 respectively. 213The correlation coefficients of these questions with parties’ satisfaction with the litigation process were .50, .50, .52, .55, and .51 respectively. 214The correlation coefficients of these questions with parties’ satisfaction with the courts’ services were .50, .52, .56, and .51 respectively.
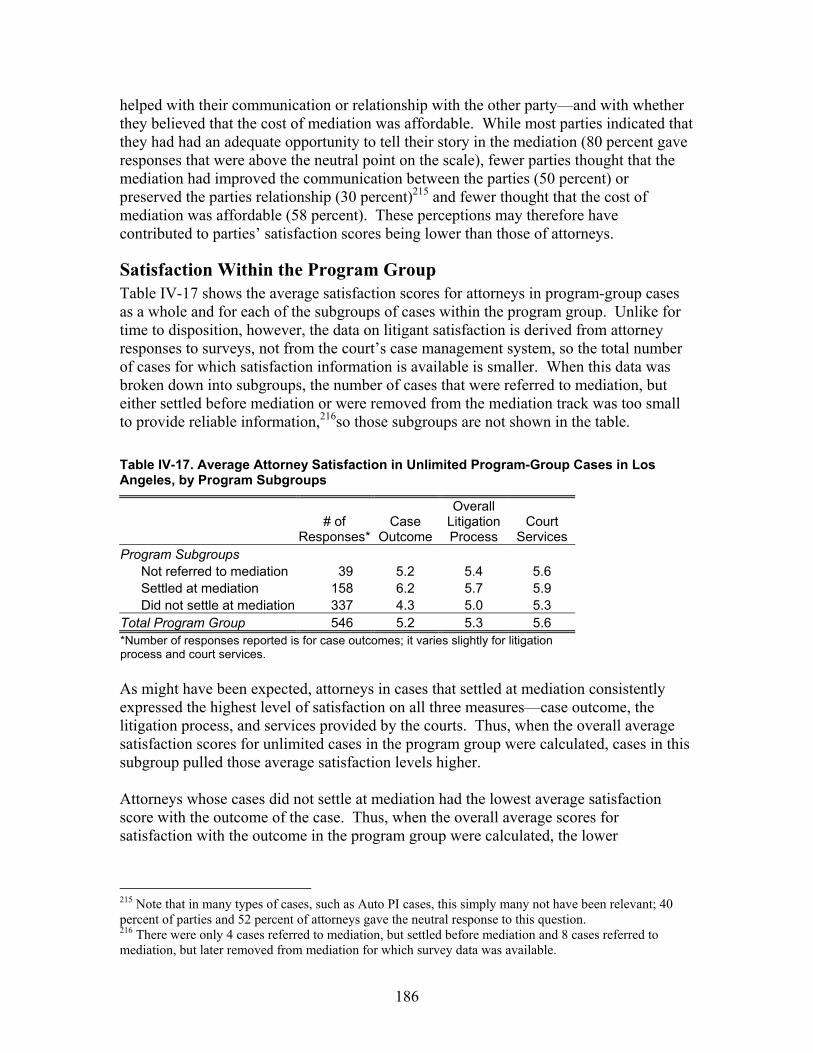
186
helped with their communication or relationship with the other party—and with whether they believed that the cost of mediation was affordable. While most parties indicated that they had had an adequate opportunity to tell their story in the mediation (80 percent gave responses that were above the neutral point on the scale), fewer parties thought that the mediation had improved the communication between the parties (50 percent) or preserved the parties relationship (30 percent)215 and fewer thought that the cost of mediation was affordable (58 percent). These perceptions may therefore have contributed to parties’ satisfaction scores being lower than those of attorneys.
Satisfaction Within the Program Group Table IV-17 shows the average satisfaction scores for attorneys in program-group cases as a whole and for each of the subgroups of cases within the program group. Unlike for time to disposition, however, the data on litigant satisfaction is derived from attorney responses to surveys, not from the court’s case management system, so the total number of cases for which satisfaction information is available is smaller. When this data was broken down into subgroups, the number of cases that were referred to mediation, but either settled before mediation or were removed from the mediation track was too small to provide reliable information,216so those subgroups are not shown in the table. Table IV-17. Average Attorney Satisfaction in Unlimited Program-Group Cases in Los Angeles, by Program Subgroups
# of
Responses*Case
Outcome
Overall Litigation Process
Court Services
Program Subgroups Not referred to mediation 39 5.2 5.4 5.6 Settled at mediation 158 6.2 5.7 5.9 Did not settle at mediation 337 4.3 5.0 5.3
Total Program Group 546 5.2 5.3 5.6 *Number of responses reported is for case outcomes; it varies slightly for litigation process and court services. As might have been expected, attorneys in cases that settled at mediation consistently expressed the highest level of satisfaction on all three measures—case outcome, the litigation process, and services provided by the courts. Thus, when the overall average satisfaction scores for unlimited cases in the program group were calculated, cases in this subgroup pulled those average satisfaction levels higher. Attorneys whose cases did not settle at mediation had the lowest average satisfaction score with the outcome of the case. Thus, when the overall average scores for satisfaction with the outcome in the program group were calculated, the lower
215 Note that in many types of cases, such as Auto PI cases, this simply many not have been relevant; 40 percent of parties and 52 percent of attorneys gave the neutral response to this question. 216 There were only 4 cases referred to mediation, but settled before mediation and 8 cases referred to mediation, but later removed from mediation for which survey data was available.
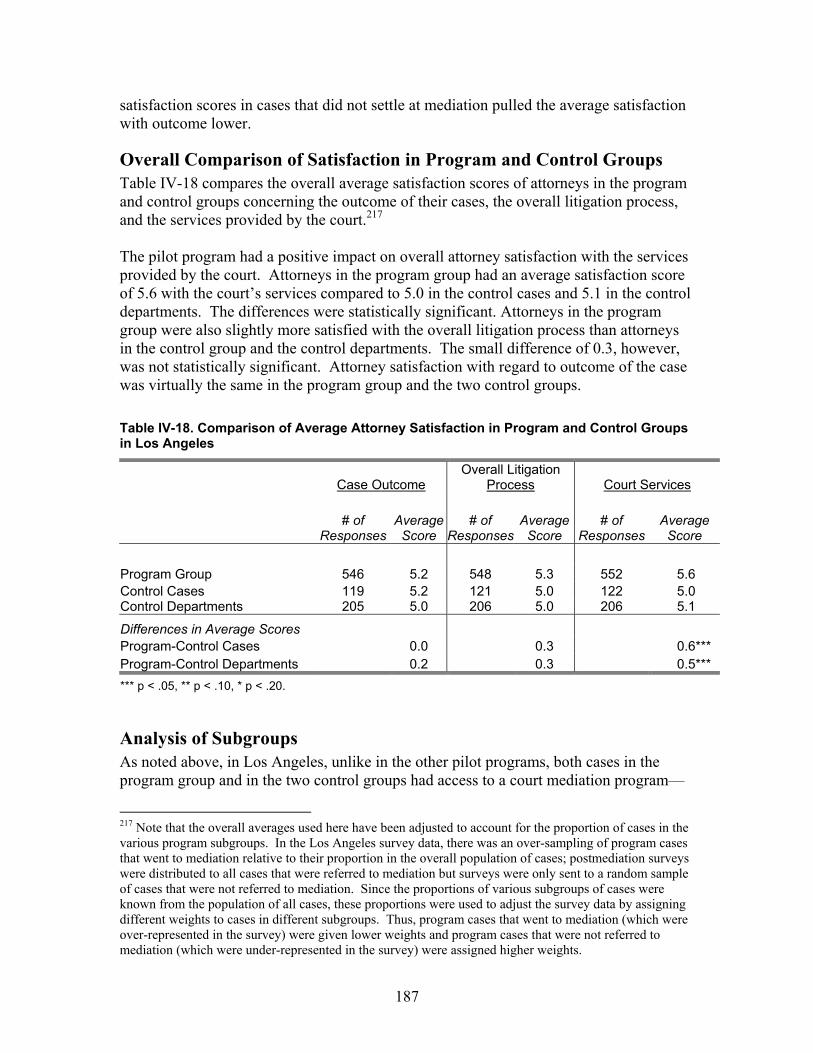
187
satisfaction scores in cases that did not settle at mediation pulled the average satisfaction with outcome lower.
Overall Comparison of Satisfaction in Program and Control Groups Table IV-18 compares the overall average satisfaction scores of attorneys in the program and control groups concerning the outcome of their cases, the overall litigation process, and the services provided by the court.217 The pilot program had a positive impact on overall attorney satisfaction with the services provided by the court. Attorneys in the program group had an average satisfaction score of 5.6 with the court’s services compared to 5.0 in the control cases and 5.1 in the control departments. The differences were statistically significant. Attorneys in the program group were also slightly more satisfied with the overall litigation process than attorneys in the control group and the control departments. The small difference of 0.3, however, was not statistically significant. Attorney satisfaction with regard to outcome of the case was virtually the same in the program group and the two control groups. Table IV-18. Comparison of Average Attorney Satisfaction in Program and Control Groups in Los Angeles
Case Outcome Overall Litigation
Process Court Services
# of
ResponsesAverage
Score # of
ResponsesAverage
Score # of
Responses Average
Score Program Group 546 5.2 548 5.3 552 5.6 Control Cases 119 5.2 121 5.0 122 5.0 Control Departments 205 5.0 206 5.0 206 5.1
Differences in Average Scores Program-Control Cases 0.0 0.3 0.6*** Program-Control Departments 0.2 0.3 0.5*** *** p < .05, ** p < .10, * p < .20.
Analysis of Subgroups As noted above, in Los Angeles, unlike in the other pilot programs, both cases in the program group and in the two control groups had access to a court mediation program—
217 Note that the overall averages used here have been adjusted to account for the proportion of cases in the various program subgroups. In the Los Angeles survey data, there was an over-sampling of program cases that went to mediation relative to their proportion in the overall population of cases; postmediation surveys were distributed to all cases that were referred to mediation but surveys were only sent to a random sample of cases that were not referred to mediation. Since the proportions of various subgroups of cases were known from the population of all cases, these proportions were used to adjust the survey data by assigning different weights to cases in different subgroups. Thus, program cases that went to mediation (which were over-represented in the survey) were given lower weights and program cases that were not referred to mediation (which were under-represented in the survey) were assigned higher weights.

188
program-group cases could be considered for referral to the pilot program and control-group cases could be considered for referral to the 1775 program. Therefore, in Los Angeles, is possible to compare the satisfaction levels of attorneys in cases in each program subgroup with the satisfaction levels of attorneys in control-group cases in the same subgroup. These comparisons provide information about the relative impact of the pilot program and the 1775 program on attorney satisfaction within these subgroups.
Average Satisfaction Scores in Each Subgroup Table IV-19 compares the average attorney satisfaction scores on the three satisfaction measures in each of the subgroups in the program and control groups. The same data is also shown in Figure IV-6 with the subgroups sorted by the average satisfaction score. Table IV-19. Average Attorney Satisfaction in Los Angeles, by Subgroups
Difference
Program Group
Control Cases Control Dept.
Control Cases
Control Dept.
Outcome Not referred to mediation 5.2 5.2 5.1 0.0 0.1 Settled at mediation 6.2 5.0 5.1 1.2*** 1.1*** Did not settle at mediation 4.3 5.1 5.1 -0.8*** -0.8***
Total 5.2 5.2 5.0 0.0 0.2 Overall Litigation Process
Not referred to mediation 5.4 4.9 5.0 0.5* 0.4* Settled at mediation 5.7 5.3 5.3 0.4 0.4* Did not settle at mediation 5.0 5.2 5.3 -0.2 -0.3*
Total 5.3 5.0 5.0 0.3 0.3 Court Services
Not referred to mediation 5.6 4.9 5.0 0.7*** 0.6*** Settled at mediation 5.9 5.5 5.6 0.4** 0.3* Did not settle at mediation 5.3 5.3 5.5 0.0 -0.2
Total 5.6 5.0 5.1 0.6*** 0.5*** Number of Cases
Not referred to mediation 39 59 137 Settled at mediation 158 20 27 Did not settle at mediation 337 21 23
Total 546 119 205 Note: Number of responses reported is for case outcomes; it varies slightly for litigation process and court services. Totals also include cases that were referred to mediation but settled before mediation (4 cases in the program group,16 control cases, and 15 control department cases) and cases that were referred to mediation but were later removed from the mediation track (8 cases in the program group, 3 control cases, and 3 control department cases). *** p < .05, ** p < .10, * p < .20. Looking first at patterns in terms of the rank order of the subgroups, in the program group as well as in both control groups, with one exception,218 cases that settled at mediation had the highest satisfaction scores on all three measures—case outcome, the litigation
218 Among control cases, attorneys in cases that were not referred to mediation actually had the highest satisfaction with the outcome.
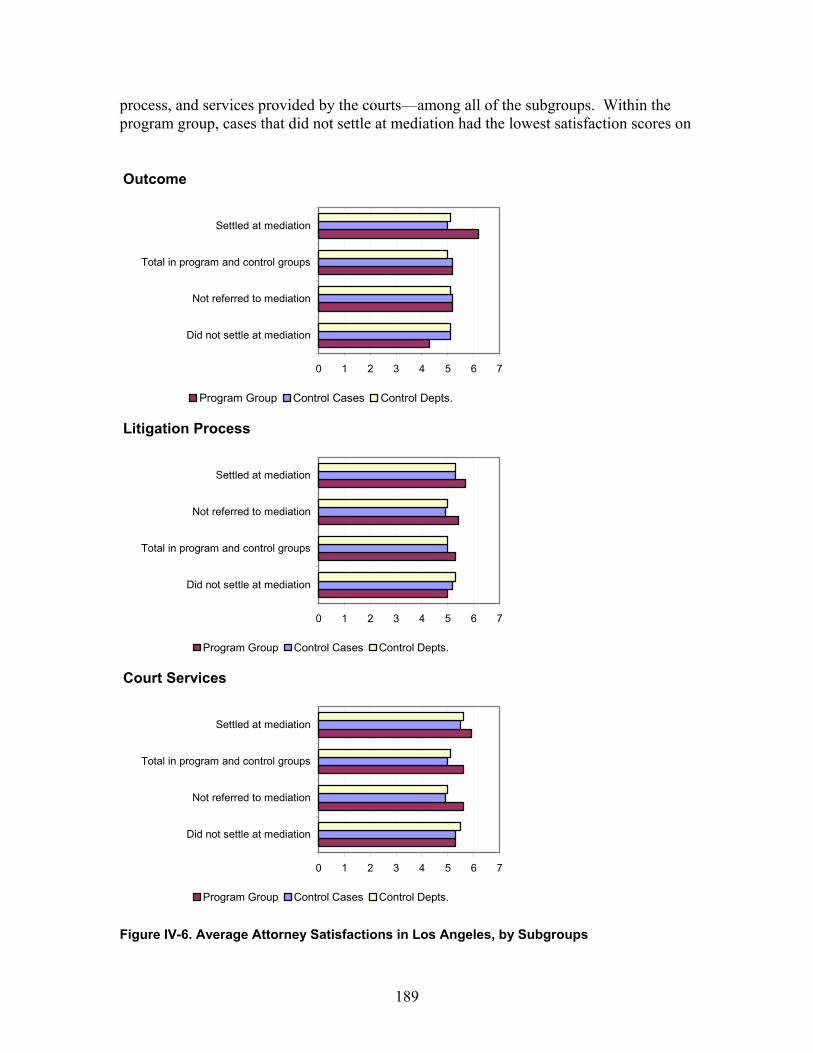
189
process, and services provided by the courts—among all of the subgroups. Within the program group, cases that did not settle at mediation had the lowest satisfaction scores on
Figure IV-6. Average Attorney Satisfactions in Los Angeles, by Subgroups
Outcome
Litigation Process
Court Services
0 1 2 3 4 5 6 7
Did not settle at mediation
Not referred to mediation
Total in program and control groups
Settled at mediation
Program Group Control Cases Control Depts.
0 1 2 3 4 5 6 7
Did not settle at mediation
Total in program and control groups
Not referred to mediation
Settled at mediation
Program Group Control Cases Control Depts.
0 1 2 3 4 5 6 7
Did not settle at mediation
Not referred to mediation
Total in program and control groups
Settled at mediation
Program Group Control Cases Control Depts.
190
all three measures among all of the subgroups. However, in the two control groups, it was cases that were not referred to mediation that had the lowest satisfaction with the litigation process and with the services provided by the court. Interestingly, in the two control groups, the average satisfaction scores with the outcome were almost the same in all three subgroups and the satisfaction with the litigation process and court services were almost the same in cases that were mediated, but did not resolve at mediation and cases that were mediated and resolved at mediation. Looking at patterns across the program and control groups, on all three satisfaction measures—case outcome, the litigation process, and services provided by the courts—the satisfaction scores were higher in the program group than in either of control groups in every one of the subgroups except cases that did not resolve at mediation. For cases that did not settle at mediation, the satisfaction scores for the program group on all three-satisfaction measures were uniformly lower than the scores in the control groups. Within cases that settled at mediation, the satisfaction scores were substantially higher for cases in the program group. In trying to understand how these subgroups contributed to the overall average satisfaction scores in the program group and in the two control groups, it is important to note not just the differences in the average satisfaction in each subgroup, but also the differences in the proportion of cases within each subgroup in the program group compared to two control groups. For example, Table IV-19 shows that cases that were not referred to mediation had the lowest scores for satisfaction with the litigation process and the court’s services in both of the control groups. As discussed in the section on time to disposition, cases not referred to mediation represent a larger portion of the control groups than of the program group: approximately 60 percent of all cases in the program group were not referred to mediation compared to 74 percent of the control cases in the participating departments and 77 percent of the cases in the control departments.219 Since the control groups had more of these cases with lower satisfaction with the litigation process and the court’s services, the overall average satisfaction on these two measures was pulled lower in the control groups compared to the overall average in the program group. This was offset to some degree by the fact that proportion of cases that were referred to mediation but that did not settle at mediation was also higher in the program group. Cases that did not settle at mediation had the lowest satisfaction scores among all the subgroups in the program group and the lowest satisfaction with the outcome among the subgroups in both the control groups. These cases represented a larger proportion of the program group (18 percent) than of either the control cases (12 percent) or the control departments (9 percent). Since the program group had more of these cases with lower satisfaction scores, the overall average satisfaction scores in the program group were pulled lower compared to the control groups, particularly the score for satisfaction with outcome.
219 These differences in mediation referral rates among the three comparison groups are likely the result of judges in pilot program having greater authority to order larger cases to mediation.
191
Program Impact on the Attorney Satisfaction in Each Subgroup As previously discussed, while the above breakdown of attorney satisfaction by subgroups provides helpful descriptive information concerning different patterns of attorney satisfaction in each subgroup and their contribution to the overall average satisfaction levels in the program and control groups, it does not necessarily show the degree to which differences in the average satisfaction levels in the program and control subgroups are due to the impact of the pilot program. As noted in the discussion of data and methods, this is due to the possibility that program cases in a given subgroup are qualitatively different (have different case characteristics) from control-group cases in that same subgroup. In order to better isolate the impact of the pilot program from the impact of these differences in case characteristics, regression analysis was used to compare the attorney satisfaction levels in program cases in each of the subgroups to the attorney satisfaction levels in similar control-group cases in the same subgroup. 220 These regression results show differences in satisfaction between cases in the Early Mediation Pilot Program and cases in the 1775 program. The differences in satisfaction levels found in the regression analysis were similar to those that appear in Figure IV-6.221 Among cases that settled at mediation, attorney satisfaction with the outcome of the case was 18 percent higher in program cases that settled at mediation in the Early Mediation Pilot Program compared to like cases in both control groups that settled at mediation in the 1775 program. Attorney satisfaction with the court services was also approximately 10 percent higher in cases that settled at mediation in the pilot program compared to like cases in the control group that settled at mediation in the 1775 program. No statistically significant differences were found between attorney satisfaction with the litigation process in program and control-group cases that settled at mediation. Among cases that did not settle at mediation, attorney satisfaction with outcome of the case was approximately 20 percent lower in cases that did not settle at mediation in the Early Mediation Pilot Program, compared to like cases in both comparison groups that did not settle in the 1775 program. There was also some evidence suggesting that attorney satisfaction with the overall litigation process was lower in cases that did not settle at mediation in the pilot program compared to like cases in the control departments, although the size of the impact is not clear. No statistically significant differences were found between attorney satisfaction with the court’s services in program and control-group cases that did not settle at mediation. Among cases that were not referred to mediation, attorney satisfaction with the litigation process was 10 percent higher in program cases that were not referred to mediation under the Early Mediation Pilot Program compared to like control cases in the participating departments that were not referred to mediation in the 1775 program. Attorney 220 See Section I.B. for a description of the regression analysis method. 221 Again, sample size was too small for the subgroups of cases that settled before mediation or were removed from mediation to produce meaningful regression results for these subgroups.
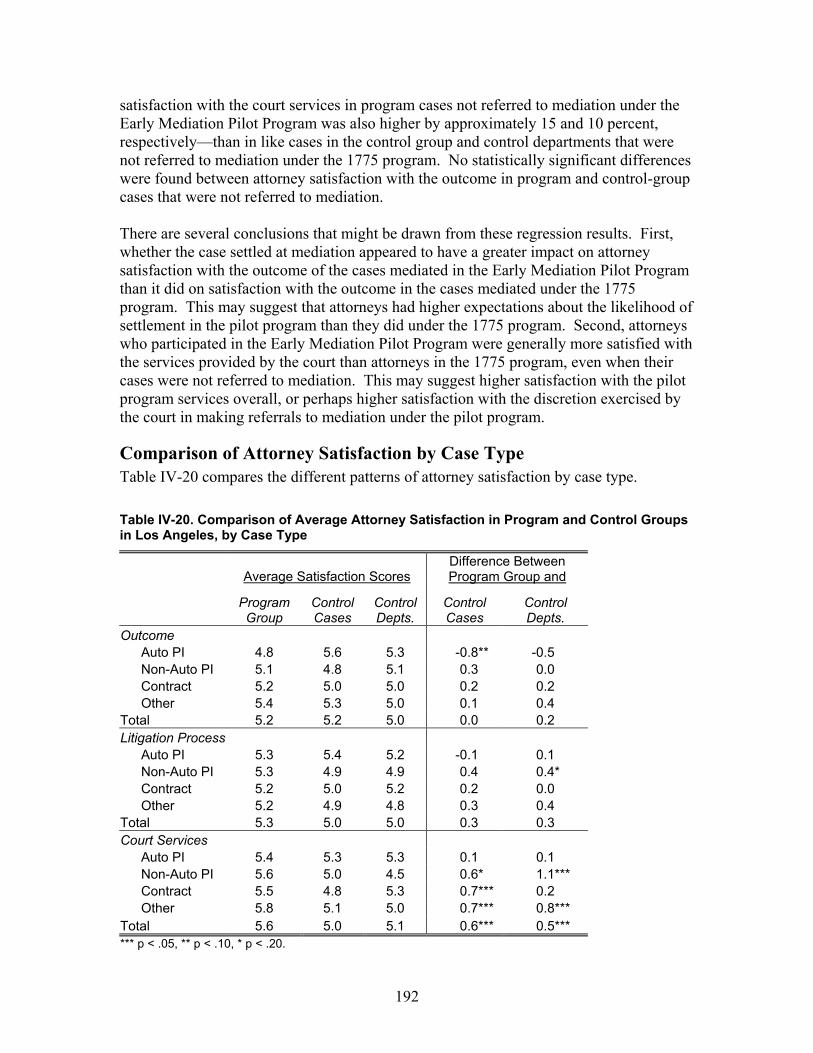
192
satisfaction with the court services in program cases not referred to mediation under the Early Mediation Pilot Program was also higher by approximately 15 and 10 percent, respectively—than in like cases in the control group and control departments that were not referred to mediation under the 1775 program. No statistically significant differences were found between attorney satisfaction with the outcome in program and control-group cases that were not referred to mediation. There are several conclusions that might be drawn from these regression results. First, whether the case settled at mediation appeared to have a greater impact on attorney satisfaction with the outcome of the cases mediated in the Early Mediation Pilot Program than it did on satisfaction with the outcome in the cases mediated under the 1775 program. This may suggest that attorneys had higher expectations about the likelihood of settlement in the pilot program than they did under the 1775 program. Second, attorneys who participated in the Early Mediation Pilot Program were generally more satisfied with the services provided by the court than attorneys in the 1775 program, even when their cases were not referred to mediation. This may suggest higher satisfaction with the pilot program services overall, or perhaps higher satisfaction with the discretion exercised by the court in making referrals to mediation under the pilot program.
Comparison of Attorney Satisfaction by Case Type Table IV-20 compares the different patterns of attorney satisfaction by case type. Table IV-20. Comparison of Average Attorney Satisfaction in Program and Control Groups in Los Angeles, by Case Type
Average Satisfaction Scores Difference Between Program Group and
Program Group
Control Cases
Control Depts.
Control Cases
Control Depts.
Outcome Auto PI 4.8 5.6 5.3 -0.8** -0.5 Non-Auto PI 5.1 4.8 5.1 0.3 0.0 Contract 5.2 5.0 5.0 0.2 0.2 Other 5.4 5.3 5.0 0.1 0.4
Total 5.2 5.2 5.0 0.0 0.2 Litigation Process
Auto PI 5.3 5.4 5.2 -0.1 0.1 Non-Auto PI 5.3 4.9 4.9 0.4 0.4* Contract 5.2 5.0 5.2 0.2 0.0 Other 5.2 4.9 4.8 0.3 0.4
Total 5.3 5.0 5.0 0.3 0.3 Court Services
Auto PI 5.4 5.3 5.3 0.1 0.1 Non-Auto PI 5.6 5.0 4.5 0.6* 1.1*** Contract 5.5 4.8 5.3 0.7*** 0.2 Other 5.8 5.1 5.0 0.7*** 0.8***
Total 5.6 5.0 5.1 0.6*** 0.5*** *** p < .05, ** p < .10, * p < .20.
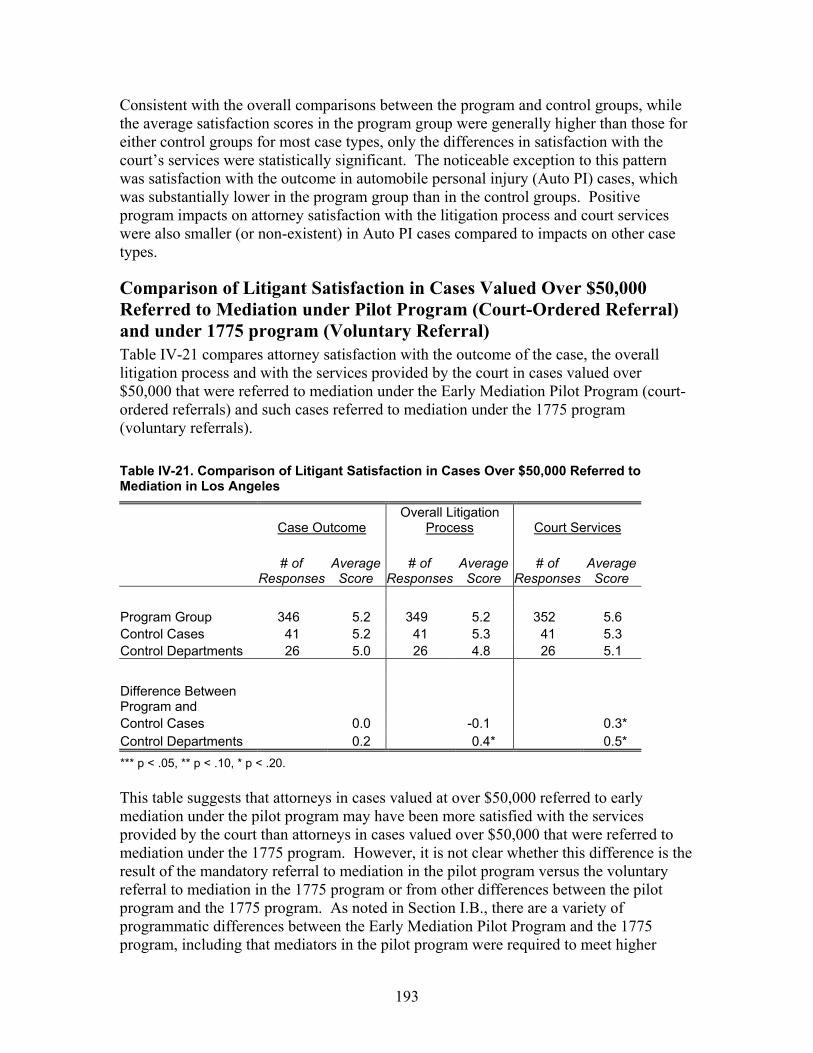
193
Consistent with the overall comparisons between the program and control groups, while the average satisfaction scores in the program group were generally higher than those for either control groups for most case types, only the differences in satisfaction with the court’s services were statistically significant. The noticeable exception to this pattern was satisfaction with the outcome in automobile personal injury (Auto PI) cases, which was substantially lower in the program group than in the control groups. Positive program impacts on attorney satisfaction with the litigation process and court services were also smaller (or non-existent) in Auto PI cases compared to impacts on other case types.
Comparison of Litigant Satisfaction in Cases Valued Over $50,000 Referred to Mediation under Pilot Program (Court-Ordered Referral) and under 1775 program (Voluntary Referral) Table IV-21 compares attorney satisfaction with the outcome of the case, the overall litigation process and with the services provided by the court in cases valued over $50,000 that were referred to mediation under the Early Mediation Pilot Program (court-ordered referrals) and such cases referred to mediation under the 1775 program (voluntary referrals). Table IV-21. Comparison of Litigant Satisfaction in Cases Over $50,000 Referred to Mediation in Los Angeles
Case Outcome Overall Litigation
Process Court Services
# of
Responses Average
Score # of
ResponsesAverage
Score # of
ResponsesAverage
Score Program Group 346 5.2 349 5.2 352 5.6 Control Cases 41 5.2 41 5.3 41 5.3 Control Departments 26 5.0 26 4.8 26 5.1 Difference Between Program and Control Cases 0.0 -0.1 0.3* Control Departments 0.2 0.4* 0.5* *** p < .05, ** p < .10, * p < .20. This table suggests that attorneys in cases valued at over $50,000 referred to early mediation under the pilot program may have been more satisfied with the services provided by the court than attorneys in cases valued over $50,000 that were referred to mediation under the 1775 program. However, it is not clear whether this difference is the result of the mandatory referral to mediation in the pilot program versus the voluntary referral to mediation in the 1775 program or from other differences between the pilot program and the 1775 program. As noted in Section I.B., there are a variety of programmatic differences between the Early Mediation Pilot Program and the 1775 program, including that mediators in the pilot program were required to meet higher
194
training and experience requirements. Comparisons between cases in these two programs therefore show the differences in attorney satisfaction that result from all of the differences between the whole pilot program model and the 1775 program model. It is quite possible, for example, that attorneys were more satisfied with the court’s services in the pilot program because of the higher qualifications of the mediators in that program.
Conclusion Both parties and attorneys in the Los Angeles program expressed high satisfaction when they used mediation under the pilot program. They were particularly satisfied with the performance of the mediators, with both parties and attorneys showing an average satisfaction score of approximately 6 on a 7-point scale. They also strongly agreed that the mediator and the mediation process were fair and that they would recommend both to others. The pilot program increased attorney satisfaction with the court’s services; overall attorney satisfaction with the services provided by the court was higher in the pilot program group than in either of the control groups. Attorneys expressed the highest satisfaction with the court’s services, the litigation process, and with the outcome in pilot program cases that settled at mediation. As might have been expected, attorneys’ satisfaction with the outcome in program cases appeared to be tied to whether or not their cases settled at mediation: parties and attorneys were more satisfied when their cases settled and less satisfied when they did not. Whether the case settled at mediation also appeared to have a greater impact on attorney satisfaction with the outcome of the cases mediated in the Early Mediation Pilot Program than it did on satisfaction with the outcome in the cases mediated under the 1775 program. In comparisons of like cases in the program and control groups, attorneys whose cases settled at mediation under the Early Mediation Pilot Program were significantly more satisfied with the outcome of the case compared to attorneys in cases that settled at mediation under the 1775 program. Conversely, attorneys whose cases did not settle at mediation under the Early Mediation Pilot Program were less satisfied with outcome of the case than attorneys whose cases did not settle at mediation under the 1775 program. Attorneys who participated in the Early Mediation Pilot Program were also generally more satisfied with the services provided by the court than attorneys in the 1775 program, even when their cases were not referred to mediation. Among cases that were not referred to mediation, attorneys in pilot program cases were more satisfied with the litigation process and services provided by the court than attorneys in 1775 program cases. Similarly, attorneys in cases that settled at mediation in the pilot program were also more satisfied with the services provided by the court than attorneys in like cases settled at mediation in the 1775 program.
195
I. Impact of Los Angeles’ Pilot Program on Litigant Costs
Summary of Findings There was evidence that litigants’ costs and the attorney hours spent in reaching resolution were reduced in cases that settled at pilot program mediations in Los Angeles: • There was evidence that both actual litigant costs and actual attorney hours estimated
by attorneys were lower in program cases that settled at mediation under the Early Mediation Pilot Program compared to like cases in the control departments that settled at mediation under the 1775 program; both litigant costs and attorney hours were approximately 60 percent lower in cases that settled at mediation in the pilot program compared to similar cases in the control departments.
• In cases that resolved at mediation, 75 percent of attorneys responding to the study
survey estimated some savings in both litigant costs and attorney hours from using mediation to reach settlement. Average savings estimated by attorneys per settled case was $12,636 in litigant costs and 66 hours in attorney time. Based on these attorney estimates, the total estimated savings in litigant costs in all 2001 cases that were settled at mediation was $1,769,039 and total estimated savings in attorney hours was 9,240.
• No statistically significant difference was found between litigant costs in those cases
valued over $50,000 referred to mediation under the pilot program (court-ordered referrals) and under the 1775 program (voluntary referrals).
Introduction This section examines the impact of the Los Angeles pilot program on litigants’ costs. As described in detail in Section I.B., information on litigant costs was collected in two ways. First, in a survey distributed at the end of the mediation in program cases that went to mediation between July 2001 and June 2002 (postmediation survey), attorneys in the subset of cases that resolved at mediation were asked to provide: (1) an estimate of the time they had actually spent on the case and their clients’ actual litigation costs; and (2) an estimate of the time they would have spent and what the costs to their clients would have been had they not used mediation. The difference between these estimates of the actual litigant cost and attorney time and the potential costs and attorney time without using mediation represents the attorneys’ subjective estimate of the litigant cost and attorney time savings when the case settled at the mediation. Second, in a separate survey administered shortly after disposition in both program and control-group cases disposed of between July 2001 and June 2002 (postdisposition survey), attorneys were asked to provide an estimate of the time they had actually spent on the case and their clients’ actual litigation costs. Comparisons between the time and cost estimates in the program and control groups provide an objective measure of the pilot program’s impact on litigant costs.
196
It is important to note that, as was discussed in the data and methods section, the data on litigant costs and attorney time had a very skewed distribution: there were a few cases with very large litigant cost and attorney time estimates (“outlier” cases) that stretched out the data’s range. While several methods were used to try to account for this skewed distribution, the range of the data was so broad that none of the differences found in direct comparisons between the program and control groups were statistically significant—it was not possible to tell with sufficient confidence whether the observed differences were real or simply due to chance.222 The results of these comparisons are therefore not presented here. In this section, the estimated actual litigant costs and attorney hours spent in program-group cases as a whole and in each of the program subgroups are discussed. Second, attorneys’ estimates of actual litigant costs and attorney hours in the various subgroups within the program are compared to the costs and hours in similar cases in the control group. Attorneys’ subjective estimates of litigant cost and attorney time savings in cases settled at mediation are then presented. Finally, litigant costs and attorney hours in cases valued over $50,000 that were referred to mediation under the Early Mediation Pilot Program (court-ordered referrals) and such cases that were referred to mediation under the 1775 program (voluntary referrals) are discussed.
Litigant Costs and Attorney Hours Within the Program Group Table IV-22 shows the average and median actual litigant costs and attorney hours estimated by attorneys for cases in each of the program subgroups and in the program group as a whole. Median values are less sensitive than averages to the influence of “outlier” cases and thus may represent a more reliable picture of litigant costs and attorney hours in each subgroup.223 As with the data on litigant satisfaction, the data on litigant costs and attorney time was derived from attorney responses to surveys, not from the court’s case management system. Therefore, the overall number of cases for which comparative cost and time information is available is smaller than the number for which disposition time and court workload information is available. When this limited data was further broken down into subgroups, the number of cases that were referred to mediation, but settled before mediation or were removed from mediation was too small to provide reliable information.224 Therefore, these subgroups were not included in the tables or discussion below. Program-group cases that settled at mediation had the lowest median litigant costs and attorney hours among all the subgroups. Cases that were not referred to mediation had the highest median and average litigant costs and attorney hours among all the subgroups. 222There was a 90 percent probability that the observed differences found in direct comparisons between the program group and control cases in the participating departments were purely due to chance and a 60 percent probability that the observed differences between the program group and the control departments were due to pure chance. 223 Even though the extreme outlier cases were removed from our analysis sample, average values were still subject to the influence of a small number of cases with large values in costs or attorney hours, particularly when cases were further broken down into several subgroups. 224 There were only 4 cases that settled before mediation and 5 cases that were removed from mediation in the program group for which survey data was available
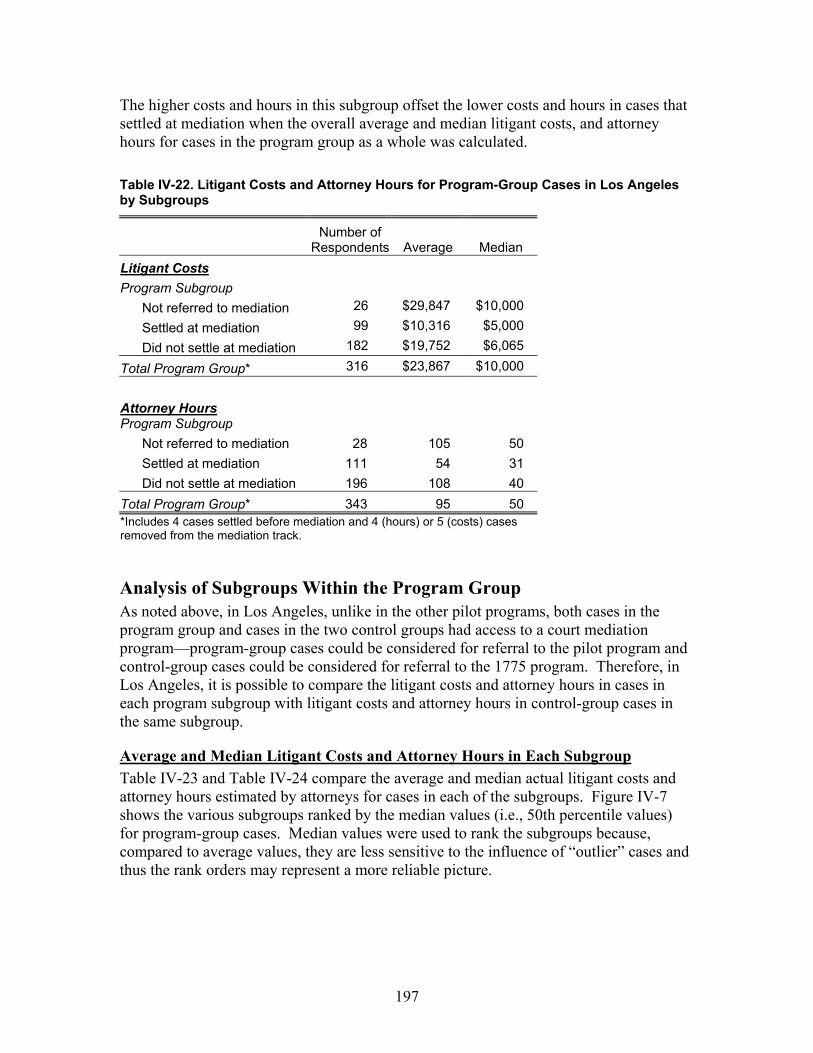
197
The higher costs and hours in this subgroup offset the lower costs and hours in cases that settled at mediation when the overall average and median litigant costs, and attorney hours for cases in the program group as a whole was calculated. Table IV-22. Litigant Costs and Attorney Hours for Program-Group Cases in Los Angeles by Subgroups
Number of
Respondents Average Median Litigant Costs Program Subgroup
Not referred to mediation 26 $29,847 $10,000
Settled at mediation 99 $10,316 $5,000
Did not settle at mediation 182 $19,752 $6,065
Total Program Group* 316 $23,867 $10,000 Attorney Hours Program Subgroup
Not referred to mediation 28 105 50 Settled at mediation 111 54 31 Did not settle at mediation 196 108 40
Total Program Group* 343 95 50 *Includes 4 cases settled before mediation and 4 (hours) or 5 (costs) cases removed from the mediation track.
Analysis of Subgroups Within the Program Group As noted above, in Los Angeles, unlike in the other pilot programs, both cases in the program group and cases in the two control groups had access to a court mediation program—program-group cases could be considered for referral to the pilot program and control-group cases could be considered for referral to the 1775 program. Therefore, in Los Angeles, it is possible to compare the litigant costs and attorney hours in cases in each program subgroup with litigant costs and attorney hours in control-group cases in the same subgroup.
Average and Median Litigant Costs and Attorney Hours in Each Subgroup Table IV-23 and Table IV-24 compare the average and median actual litigant costs and attorney hours estimated by attorneys for cases in each of the subgroups. Figure IV-7 shows the various subgroups ranked by the median values (i.e., 50th percentile values) for program-group cases. Median values were used to rank the subgroups because, compared to average values, they are less sensitive to the influence of “outlier” cases and thus the rank orders may represent a more reliable picture.
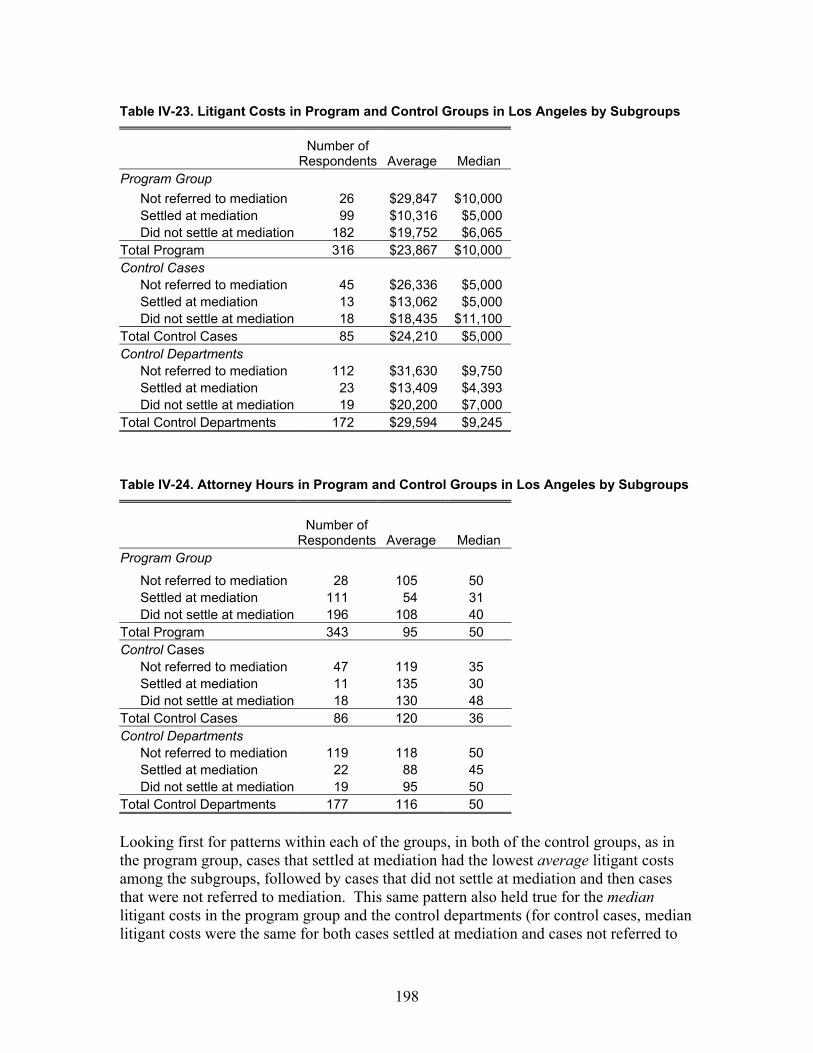
198
Table IV-23. Litigant Costs in Program and Control Groups in Los Angeles by Subgroups
Number of
Respondents Average Median Program Group
Not referred to mediation 26 $29,847 $10,000 Settled at mediation 99 $10,316 $5,000 Did not settle at mediation 182 $19,752 $6,065
Total Program 316 $23,867 $10,000 Control Cases
Not referred to mediation 45 $26,336 $5,000 Settled at mediation 13 $13,062 $5,000 Did not settle at mediation 18 $18,435 $11,100
Total Control Cases 85 $24,210 $5,000 Control Departments
Not referred to mediation 112 $31,630 $9,750 Settled at mediation 23 $13,409 $4,393 Did not settle at mediation 19 $20,200 $7,000
Total Control Departments 172 $29,594 $9,245 Table IV-24. Attorney Hours in Program and Control Groups in Los Angeles by Subgroups
Number of
Respondents Average Median Program Group
Not referred to mediation 28 105 50 Settled at mediation 111 54 31 Did not settle at mediation 196 108 40
Total Program 343 95 50 Control Cases
Not referred to mediation 47 119 35 Settled at mediation 11 135 30 Did not settle at mediation 18 130 48
Total Control Cases 86 120 36 Control Departments
Not referred to mediation 119 118 50 Settled at mediation 22 88 45 Did not settle at mediation 19 95 50
Total Control Departments 177 116 50 Looking first for patterns within each of the groups, in both of the control groups, as in the program group, cases that settled at mediation had the lowest average litigant costs among the subgroups, followed by cases that did not settle at mediation and then cases that were not referred to mediation. This same pattern also held true for the median litigant costs in the program group and the control departments (for control cases, median litigant costs were the same for both cases settled at mediation and cases not referred to

199
mediation). In both the program and control groups, cases that were not referred to mediation had the highest average litigant costs.225 This same pattern also held true for the median litigant costs in the program group and control departments. In terms of attorney hours spent on cases, in each group, the rank order of the subgroups was different.
Figure IV-7. Median Litigant Costs and Attorney Hours in Program and Control Groups in Los Angeles by Subgroups
It was difficult to find any clear pattern to the differences between the program and control groups, however. As Table IV-23 shows, between the program and two control groups, none consistently had the lowest litigant costs or attorney hours across all of the subgroups. In addition, in most subgroups, the average and median litigant costs and hours did not follow the same patterns. For example, while among cases that settled at mediation, cases in the pilot program group had lower average litigant costs than cases in
225 Note that the number of control cases settled at mediation for which we have survey responses is fairly small–13 cases for litigant costs and 11 cases for attorney time–so the results for this group may be less reliable than for the other groups.
Litigant Costs
Attorney Hours
$0 $2,000 $4,000 $6,000 $8,000 $10,000 $12,000
Settled atmediation
Did not settle atmediation
Not referred tomediation
Total in programand control groups
Program Group Control Cases Control Depts.
0 10 20 30 40 50 60
Settled atmediation
Did not settle atmediation
Not referred tomediation
Total in programand control groups
Program Group Control Cases Control Depts.

200
either control group, median litigant costs were higher in the program group than in the control departments. Because the litigant cost and attorney hours data did not follow a consistent pattern, it is more difficult to assess how the subgroups contributed to the overall average and median litigant costs and attorney hours in the program group and in the two control groups. Looking only at the potential impact of cases that were not referred to mediation, since these make up the largest proportion of cases in all of the groups, Table IV-23 shows that, among the program and control groups, control cases in the participating departments had the lowest average and median litigant costs. As discussed in the section on time to disposition, cases not referred to mediation represented a larger portion of the control groups than of the program group: approximately 60 percent of all cases in the program group were not referred to mediation compared to 74 percent of the control cases in the participating departments and 77 percent of the cases in the control departments. Since the control cases in the participating departments had more of these cases with lower average and median litigant costs, the overall average and median litigant costs for control cases was pushed lower compared to the overall average and median in the program group.
Program Impact on Litigant Costs and Attorney Hours in Each Subgroup As previously discussed, while the above breakdown provides helpful descriptive information about the different patterns of litigant costs and attorney hours in the various subgroups and their contribution to the overall average/median litigant costs and attorney hours, it does not necessarily show the degree to which these averages/medians are due to the impact of the pilot program. As noted in the discussion of data and methods, this is due to the possibility that program cases in a given subgroup are qualitatively different (have different case characteristics) from control-group cases in that same subgroup. In order to better isolate the impact of the pilot program from the impact of these differences in case characteristics, regression analysis was used to compare the actual litigant costs and attorney hours estimated by attorneys in program cases in each of the subgroups to actual cost and hours in similar control-group cases in the same subgroup.226 These regression results show differences in actual litigant costs and attorney hours estimated by attorney in cases in the Early Mediation Pilot Program and cases in the 1775 program. The regression results provided evidence to support the conclusion that both actual litigant costs and attorney hours estimated by attorneys were lower in program cases that settled at mediation under the Early Mediation Pilot Program compared to like cases in the control departments that settled at mediation under the 1775 program. 227 Both
226 Please see Section I.B. for a description of the regression analysis method. 227 No statistically significant difference was found in the litigant cost and attorney hours in comparisons between pilot program cases that were not referred to mediation and similar control-group cases. Again, sample size was too small for the subgroups of cases that settled before mediation or were removed from mediation to produce meaningful regression results for these subgroups.
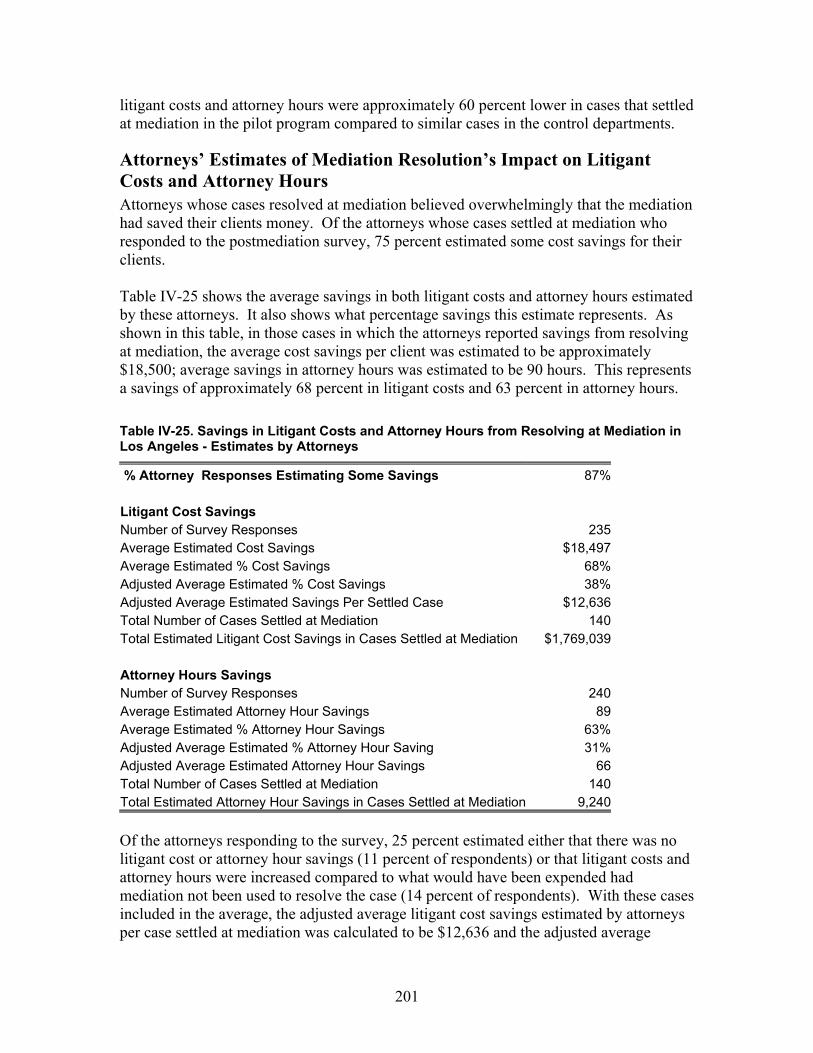
201
litigant costs and attorney hours were approximately 60 percent lower in cases that settled at mediation in the pilot program compared to similar cases in the control departments.
Attorneys’ Estimates of Mediation Resolution’s Impact on Litigant Costs and Attorney Hours Attorneys whose cases resolved at mediation believed overwhelmingly that the mediation had saved their clients money. Of the attorneys whose cases settled at mediation who responded to the postmediation survey, 75 percent estimated some cost savings for their clients. Table IV-25 shows the average savings in both litigant costs and attorney hours estimated by these attorneys. It also shows what percentage savings this estimate represents. As shown in this table, in those cases in which the attorneys reported savings from resolving at mediation, the average cost savings per client was estimated to be approximately $18,500; average savings in attorney hours was estimated to be 90 hours. This represents a savings of approximately 68 percent in litigant costs and 63 percent in attorney hours. Table IV-25. Savings in Litigant Costs and Attorney Hours from Resolving at Mediation in Los Angeles - Estimates by Attorneys
% Attorney Responses Estimating Some Savings 87% Litigant Cost Savings Number of Survey Responses 235Average Estimated Cost Savings $18,497Average Estimated % Cost Savings 68%Adjusted Average Estimated % Cost Savings 38%Adjusted Average Estimated Savings Per Settled Case $12,636 Total Number of Cases Settled at Mediation 140Total Estimated Litigant Cost Savings in Cases Settled at Mediation $1,769,039 Attorney Hours Savings Number of Survey Responses 240Average Estimated Attorney Hour Savings 89Average Estimated % Attorney Hour Savings 63%Adjusted Average Estimated % Attorney Hour Saving 31%Adjusted Average Estimated Attorney Hour Savings 66Total Number of Cases Settled at Mediation 140Total Estimated Attorney Hour Savings in Cases Settled at Mediation 9,240 Of the attorneys responding to the survey, 25 percent estimated either that there was no litigant cost or attorney hour savings (11 percent of respondents) or that litigant costs and attorney hours were increased compared to what would have been expended had mediation not been used to resolve the case (14 percent of respondents). With these cases included in the average, the adjusted average litigant cost savings estimated by attorneys per case settled at mediation was calculated to be $12,636 and the adjusted average
202
attorney hour savings was calculated to be 66 hours. This represents estimated savings of approximately 38 percent in litigant costs and 31 percent in attorney hours. Using this adjusted average for savings estimated by attorneys, a figure for the total estimated savings in all of the 2001 cases that settled at pilot program mediations in Los Angeles during the study period was calculated. Based on these attorney estimates, the total estimated litigant cost savings in the Los Angeles pilot program was $1,769,039 and the total estimated attorney hours saved was 9,240. It should be cautioned that these figures are based on attorneys’ estimates of savings; they are not figures for the actual savings in mediations resulting in settlements. The actual litigant cost and hour savings could be somewhat higher or lower than the attorney estimates. It should also be cautioned that these estimated savings are for cases settled at mediation only, not for all cases in the program group. There may also have been savings or increases in litigant cost or attorney hours in other subgroups of program cases, such as those that were referred to mediation but settled before the mediation took place or cases that were mediated but did not settle at the mediation.228
Comparison of Litigant Costs and Attorney Hours in Cases Valued Over $50,000 Referred to Mediation under Pilot Program (Court-Ordered Referral) and under 1775 program (Voluntary Referral) Attorney estimates of actual litigant costs and attorney hours in cases valued over $50,000 that were referred to mediation under the Early Mediation Pilot Program (court-ordered referrals) were compared to these estimates in cases valued over $50,000 referred to mediation under the 1775 program (voluntary referrals). No statistically significant difference was found between actual litigant costs or attorney hours estimated by attorneys in these cases.
Conclusion There was evidence that cases that settled at mediation under the Early Mediation Pilot Program had lower litigant costs and used less attorney time compared to like cases in the control departments that were settled at mediation under the 1775 program. Both actual litigant costs and attorney hours estimated by attorneys were approximately 60 percent lower in cases that settled at mediation in the pilot program compared to similar cases in the control departments.
228 Some support for the conclusion that mediation may have reduced costs even in cases that did not settle at mediation comes from 65 postmediation survey responses in which attorneys in cases that did not settle at mediation provided litigant cost and attorney hours information even though this information had not been requested. More than 50 percent of these survey responses indicated some savings in litigant costs, attorney hours, or both in these cases that were mediated but did not settle at mediation. Taking into account those responses that estimated no savings or increased costs as well, the attorneys in these cases estimated average savings of 19 percent in litigant costs (39 percent median savings) and 21 percent in attorney hours (47 percent median savings) in these cases that did not settle at mediation.

203
Attorneys in cases that resolved at mediation had a strong favorable perception about the cost-saving benefit of mediation. In cases resolved at mediation, 75 percent of attorneys responding to the study survey estimated some savings in both litigant costs and attorney hours from using mediation to reach settlement. Average savings estimated by attorneys per settled case was $12,636 in litigant costs and 66 hours in attorney time. Based on these attorney estimates, the total estimated savings in litigant costs in all 2001 cases that were settled at mediation was $1,769,039, and total estimated savings in attorney hours was 9,240.
204
J. Impact of Los Angeles’ Pilot Program on the Court’s Workload
Summary of Findings There is evidence indicating that the pilot program in Los Angeles reduced the court’s workload for unlimited cases in the program: • In addition to the reduction in trials discussed above, the pilot program reduced the
average number of “other” pretrial hearings in program cases by 11 percent compared to control cases in the participating departments and may also have reduced motion hearings in program-group cases compared to cases in both control groups. However, there were also 16 percent more case management conferences in the program group compared to control cases in the participating departments. The increase in case management conferences offset the decrease in other pretrial events so that the overall reduction in pretrial court events was small and not statistically significant.
• Even though there was not a statistically significant reduction in the total number of
pretrial events, because motions and “other” pretrial hearings take more judicial time on average than case management conferences, the changes in the number of pretrial court events caused by the pilot program resulted in saving judicial time. In the 9 participating departments during the first 9 months of the program, a total of 4 judicial days worth of time was saved that could be devoted to other cases needing judges’ time and attention.
• Annualizing the program group reductions and adding potential reductions if the
program were available to cases that were in the control groups, the total potential time savings in the Central District from the reduced number of court events is estimated at 132 judicial days per year (with a monetary value of $395,000 per year).
• The regression results support the conclusion that court workload was reduced in cases that went to mediation under the Early Mediation Pilot Program compared to like cases in the control groups that went to mediation under the 1775 program, regardless of whether the parties settled or did not settle at mediation.
• The average number of pretrial court events in cases valued over $50,000 referred to
mediation under the pilot program (court-ordered referrals) was smaller than in such cases referred to mediation under the 1775 program (voluntary referrals).
Introduction In an earlier section, this report discussed the impact the Los Angeles pilot program had on the court’s workload by reducing the number of cases tried. In this section, the program impacts on the court’s workload are further examined by comparing the frequency of various pretrial court events in the program and control groups. The analysis in this section focuses on three major types of court events: (1) case
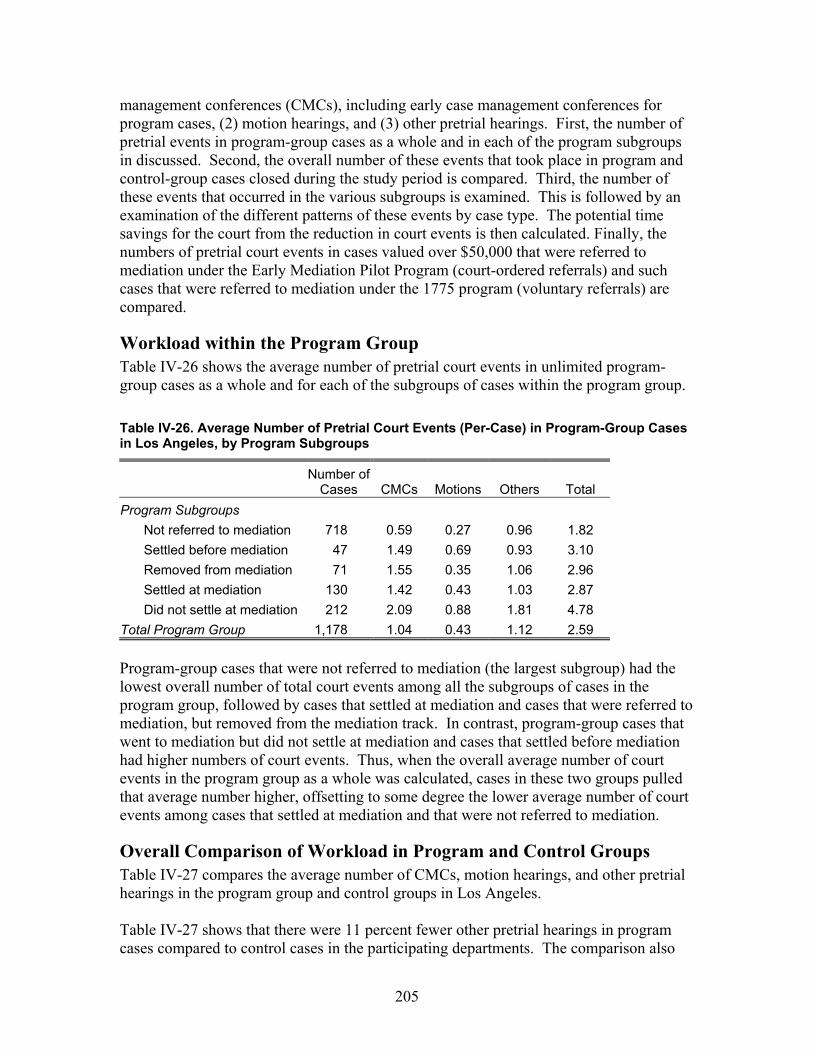
205
management conferences (CMCs), including early case management conferences for program cases, (2) motion hearings, and (3) other pretrial hearings. First, the number of pretrial events in program-group cases as a whole and in each of the program subgroups in discussed. Second, the overall number of these events that took place in program and control-group cases closed during the study period is compared. Third, the number of these events that occurred in the various subgroups is examined. This is followed by an examination of the different patterns of these events by case type. The potential time savings for the court from the reduction in court events is then calculated. Finally, the numbers of pretrial court events in cases valued over $50,000 that were referred to mediation under the Early Mediation Pilot Program (court-ordered referrals) and such cases that were referred to mediation under the 1775 program (voluntary referrals) are compared.
Workload within the Program Group Table IV-26 shows the average number of pretrial court events in unlimited program-group cases as a whole and for each of the subgroups of cases within the program group. Table IV-26. Average Number of Pretrial Court Events (Per-Case) in Program-Group Cases in Los Angeles, by Program Subgroups
Number of
Cases CMCs Motions Others Total Program Subgroups
Not referred to mediation 718 0.59 0.27 0.96 1.82 Settled before mediation 47 1.49 0.69 0.93 3.10 Removed from mediation 71 1.55 0.35 1.06 2.96 Settled at mediation 130 1.42 0.43 1.03 2.87 Did not settle at mediation 212 2.09 0.88 1.81 4.78
Total Program Group 1,178 1.04 0.43 1.12 2.59 Program-group cases that were not referred to mediation (the largest subgroup) had the lowest overall number of total court events among all the subgroups of cases in the program group, followed by cases that settled at mediation and cases that were referred to mediation, but removed from the mediation track. In contrast, program-group cases that went to mediation but did not settle at mediation and cases that settled before mediation had higher numbers of court events. Thus, when the overall average number of court events in the program group as a whole was calculated, cases in these two groups pulled that average number higher, offsetting to some degree the lower average number of court events among cases that settled at mediation and that were not referred to mediation.
Overall Comparison of Workload in Program and Control Groups Table IV-27 compares the average number of CMCs, motion hearings, and other pretrial hearings in the program group and control groups in Los Angeles. Table IV-27 shows that there were 11 percent fewer other pretrial hearings in program cases compared to control cases in the participating departments. The comparison also
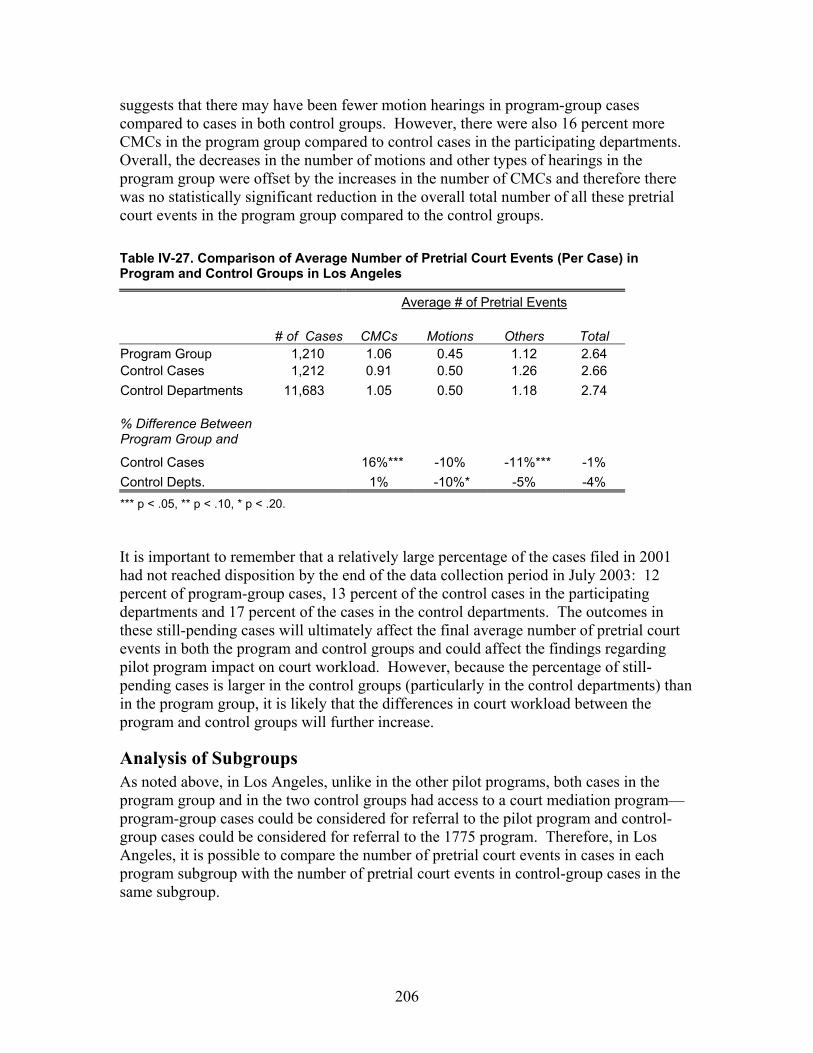
206
suggests that there may have been fewer motion hearings in program-group cases compared to cases in both control groups. However, there were also 16 percent more CMCs in the program group compared to control cases in the participating departments. Overall, the decreases in the number of motions and other types of hearings in the program group were offset by the increases in the number of CMCs and therefore there was no statistically significant reduction in the overall total number of all these pretrial court events in the program group compared to the control groups. Table IV-27. Comparison of Average Number of Pretrial Court Events (Per Case) in Program and Control Groups in Los Angeles
Average # of Pretrial Events
# of Cases CMCs Motions Others Total Program Group 1,210 1.06 0.45 1.12 2.64 Control Cases 1,212 0.91 0.50 1.26 2.66 Control Departments 11,683 1.05 0.50 1.18 2.74
% Difference Between Program Group and
Control Cases 16%*** -10% -11%*** -1% Control Depts. 1% -10%* -5% -4% *** p < .05, ** p < .10, * p < .20.
It is important to remember that a relatively large percentage of the cases filed in 2001 had not reached disposition by the end of the data collection period in July 2003: 12 percent of program-group cases, 13 percent of the control cases in the participating departments and 17 percent of the cases in the control departments. The outcomes in these still-pending cases will ultimately affect the final average number of pretrial court events in both the program and control groups and could affect the findings regarding pilot program impact on court workload. However, because the percentage of still-pending cases is larger in the control groups (particularly in the control departments) than in the program group, it is likely that the differences in court workload between the program and control groups will further increase.
Analysis of Subgroups As noted above, in Los Angeles, unlike in the other pilot programs, both cases in the program group and in the two control groups had access to a court mediation program—program-group cases could be considered for referral to the pilot program and control-group cases could be considered for referral to the 1775 program. Therefore, in Los Angeles, it is possible to compare the number of pretrial court events in cases in each program subgroup with the number of pretrial court events in control-group cases in the same subgroup.
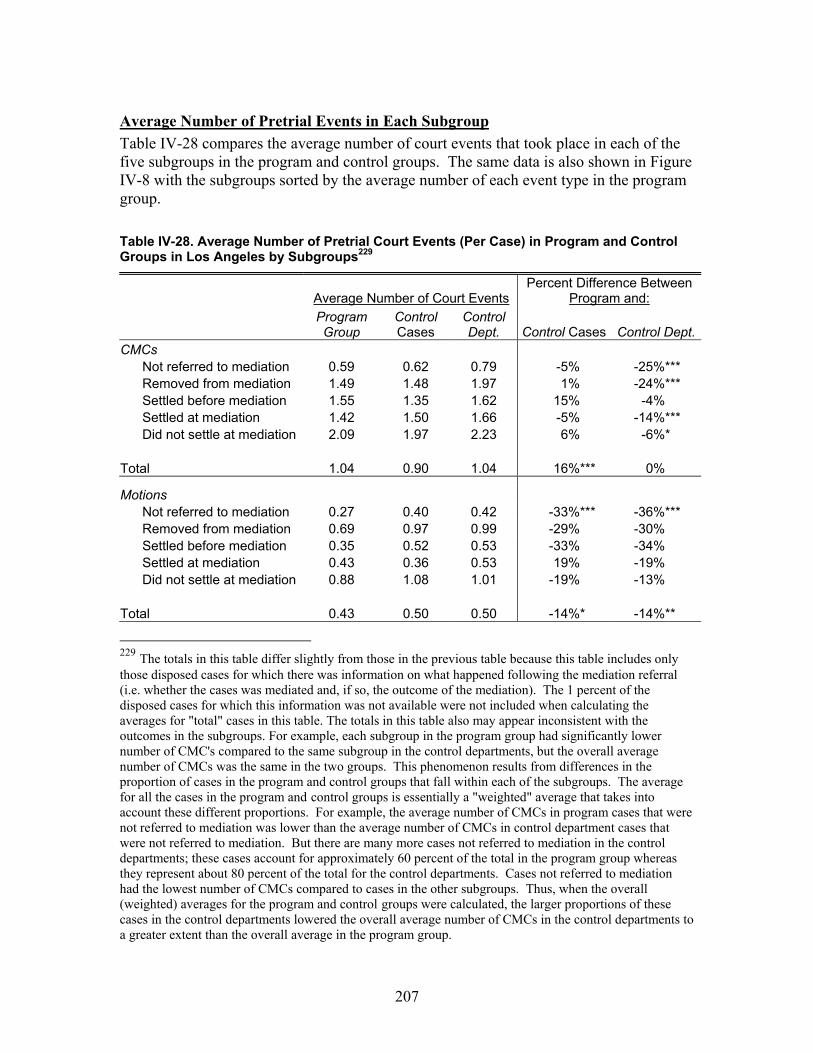
207
Average Number of Pretrial Events in Each Subgroup Table IV-28 compares the average number of court events that took place in each of the five subgroups in the program and control groups. The same data is also shown in Figure IV-8 with the subgroups sorted by the average number of each event type in the program group. Table IV-28. Average Number of Pretrial Court Events (Per Case) in Program and Control Groups in Los Angeles by Subgroups229
Average Number of Court Events Percent Difference Between
Program and:
Program Group
Control Cases
Control Dept. Control Cases Control Dept.
CMCs Not referred to mediation 0.59 0.62 0.79 -5% -25%*** Removed from mediation 1.49 1.48 1.97 1% -24%*** Settled before mediation 1.55 1.35 1.62 15% -4% Settled at mediation 1.42 1.50 1.66 -5% -14%*** Did not settle at mediation 2.09 1.97 2.23 6% -6%*
Total 1.04 0.90 1.04 16%*** 0%
Motions Not referred to mediation 0.27 0.40 0.42 -33%*** -36%*** Removed from mediation 0.69 0.97 0.99 -29% -30% Settled before mediation 0.35 0.52 0.53 -33% -34% Settled at mediation 0.43 0.36 0.53 19% -19% Did not settle at mediation 0.88 1.08 1.01 -19% -13%
Total 0.43 0.50 0.50 -14%* -14%**
229 The totals in this table differ slightly from those in the previous table because this table includes only those disposed cases for which there was information on what happened following the mediation referral (i.e. whether the cases was mediated and, if so, the outcome of the mediation). The 1 percent of the disposed cases for which this information was not available were not included when calculating the averages for "total" cases in this table. The totals in this table also may appear inconsistent with the outcomes in the subgroups. For example, each subgroup in the program group had significantly lower number of CMC's compared to the same subgroup in the control departments, but the overall average number of CMCs was the same in the two groups. This phenomenon results from differences in the proportion of cases in the program and control groups that fall within each of the subgroups. The average for all the cases in the program and control groups is essentially a "weighted" average that takes into account these different proportions. For example, the average number of CMCs in program cases that were not referred to mediation was lower than the average number of CMCs in control department cases that were not referred to mediation. But there are many more cases not referred to mediation in the control departments; these cases account for approximately 60 percent of the total in the program group whereas they represent about 80 percent of the total for the control departments. Cases not referred to mediation had the lowest number of CMCs compared to cases in the other subgroups. Thus, when the overall (weighted) averages for the program and control groups were calculated, the larger proportions of these cases in the control departments lowered the overall average number of CMCs in the control departments to a greater extent than the overall average in the program group.
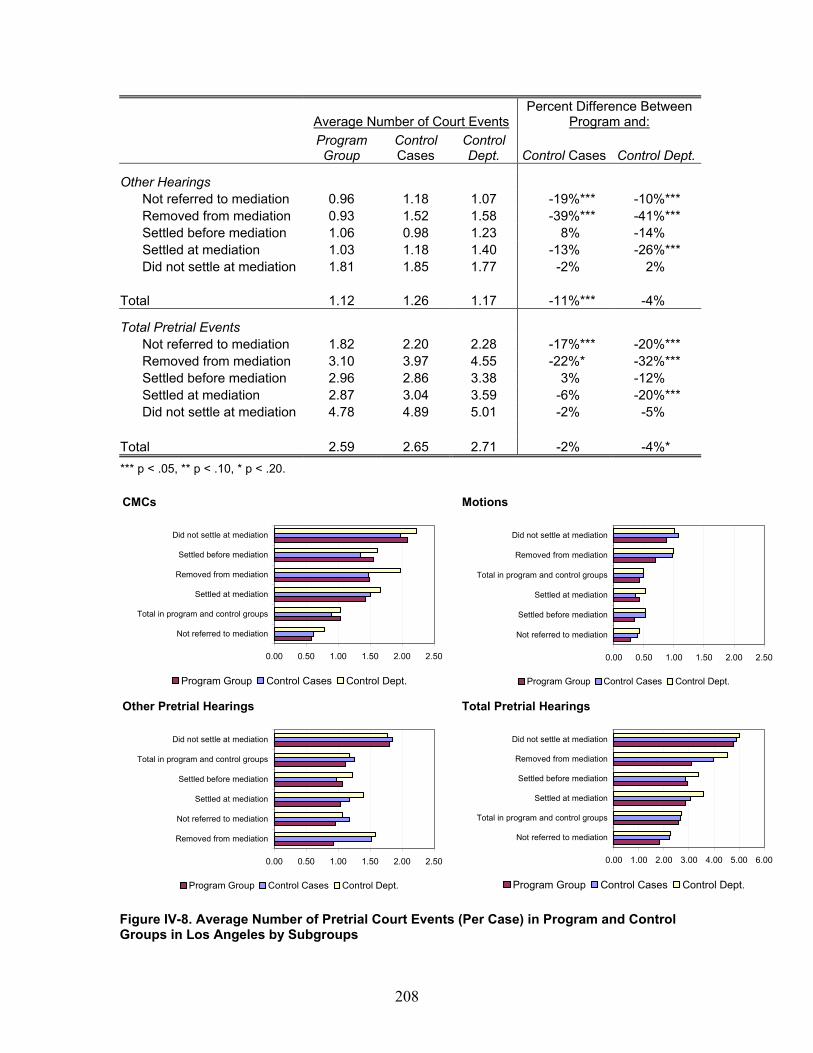
208
Average Number of Court Events Percent Difference Between
Program and:
Program Group
Control Cases
Control Dept. Control Cases Control Dept.
Other Hearings Not referred to mediation 0.96 1.18 1.07 -19%*** -10%*** Removed from mediation 0.93 1.52 1.58 -39%*** -41%*** Settled before mediation 1.06 0.98 1.23 8% -14% Settled at mediation 1.03 1.18 1.40 -13% -26%*** Did not settle at mediation 1.81 1.85 1.77 -2% 2%
Total 1.12 1.26 1.17 -11%*** -4%
Total Pretrial Events Not referred to mediation 1.82 2.20 2.28 -17%*** -20%*** Removed from mediation 3.10 3.97 4.55 -22%* -32%*** Settled before mediation 2.96 2.86 3.38 3% -12% Settled at mediation 2.87 3.04 3.59 -6% -20%*** Did not settle at mediation 4.78 4.89 5.01 -2% -5%
Total 2.59 2.65 2.71 -2% -4%* *** p < .05, ** p < .10, * p < .20.
Figure IV-8. Average Number of Pretrial Court Events (Per Case) in Program and Control Groups in Los Angeles by Subgroups
CMCs Motions
Other Pretrial Hearings Total Pretrial Hearings
0.00 0.50 1.00 1.50 2.00 2.50
Not referred to mediation
Total in program and control groups
Settled at mediation
Removed from mediation
Settled before mediation
Did not settle at mediation
Program Group Control Cases Control Dept.
0.00 0.50 1.00 1.50 2.00 2.50
Not referred to mediation
Settled before mediation
Settled at mediation
Total in program and control groups
Removed from mediation
Did not settle at mediation
Program Group Control Cases Control Dept.
0.00 0.50 1.00 1.50 2.00 2.50
Removed from mediation
Not referred to mediation
Settled at mediation
Settled before mediation
Total in program and control groups
Did not settle at mediation
Program Group Control Cases Control Dept.
0.00 1.00 2.00 3.00 4.00 5.00 6.00
Not referred to mediation
Total in program and control groups
Settled at mediation
Settled before mediation
Removed from mediation
Did not settle at mediation
Program Group Control Cases Control Dept.
209
Looking first for patterns within each of the groups, in the program group as well as in both of the control groups, cases that were not referred to mediation had the lowest average of total pretrial events among all the subgroups, followed by cases settled at and before mediation. Cases that did not settle at mediation had the highest number of total pretrial events, followed by cases that were removed from the mediation track. Thus, when the overall average of court events was calculated in all of the groups, the low number of events in cases that settled at or before mediation or that were not referred to mediation was offset to some degree by the high number of events in cases that were removed from mediation or that did not settle at mediation. This same pattern—cases not referred to mediation having the lowest number of events followed closely by cases that settled at or before mediation while cases that were removed from or did not settle at mediation had high numbers of court events—was fairly consistent across all three types of court events. The two exceptions to this pattern were: (1) program cases that settled before mediation had more CMCs than program cases that were removed from mediation; and (2) program cases that were removed from mediation had the lowest number of “other” pretrial hearings than any other subgroup. Looking for patterns across the different groups, program-group cases had fewer of all three types of pretrial court events than cases in the control departments in every single subgroup except one. The one exception was for “other” pretrial hearings in cases that did not settle at mediation where the number of hearings was 2 percent higher in the program group. Program-group cases also had fewer total pretrial events and fewer motion hearings than control cases in the participating departments with two exceptions: program cases that settled at mediation had more motion hearings than control cases and program cases that settled before mediation had more total court events than control cases. In trying to understand how these subgroups contributed to the overall average number of various court events in the program group and in the two control groups, it is important to note not just the differences in the average number of court events in each subgroup, but also the differences in the proportion of cases within each subgroup in the program group compared to two control groups. For example, the control groups had a higher proportion of cases not referred to mediation than the program group. Cases not referred to mediation had the lowest number of CMCs, therefore this subgroup pulled the overall average number of CMCs lower in the control departments to a greater extent than in the program group. Similarly, the program group had a higher proportion of cases that did not settle at mediation. Cases that did not settle at mediation had the highest number of CMCs, therefore this subgroup pulled the overall average number of CMCs higher in the program group to a greater extent than in the control departments.
Program Impact on the Number of Court Events in Each Subgroup As previously discussed, while the above breakdown provides helpful descriptive information about the different patterns of pretrial court events in the various subgroups and their contribution to the overall numbers of these events, it does not necessarily show the degree to which these averages are due to the impact of the pilot program. As noted
210
in the discussion of data and methods, this is due to the possibility that program cases in a given subgroup are qualitatively different (have different case characteristics) from control-group cases in that same subgroup. In order to better isolate the impact of the pilot program from the impact of these differences in case characteristics, regression analysis was used to compare the numbers of pretrial events in program cases in each of the subgroups to the numbers of such events in similar control-group cases in the same subgroup.230 These regression results show differences in court workload between cases in the Early Mediation Pilot Program and cases in the 1775 program. The regression results provided support for the conclusion that court workload was reduced in cases that went to mediation under the Early Mediation Pilot Program compared to like cases in the control groups that went to mediation under the 1775 program, regardless of whether the parties settled or did not settle at mediation. 231 Among cases that went to mediation and settled at the mediation, there were 38 percent fewer CMCs in program-group cases that settled at mediation under the Early Mediation Pilot Program compared to control cases in the participating departments that settled at mediation under the 1775 program. The number of “other” pretrial hearings in program-group cases that settled at mediation were also lower than the number of these events in either control group that settled at mediation: program cases that settled at mediation in the Early Mediation Pilot Program had 60 percent fewer “other” hearings than cases in the control departments that settled at mediation under the 1775 program and the comparison with control cases in the participating departments that settled at 1775 program mediations also suggested that program cases had fewer “other” hearings, although the size of this reduction was not clear. Among cases that went to mediation and did not settle at the mediation, there were 20 percent fewer pretrial events in program-group cases that did not settle at mediation in the Early Mediation Pilot Program compared to like cases in the control departments that did not settle at mediation in the 1775 program. There were also 27 percent fewer CMCs in program-group cases that did not settle at mediation compared to like cases in the control departments. Thus, these comparisons indicate that there were fewer pretrial events in program cases that were mediated both when the cases settled at mediation and when the cases did not. The regression analysis found offsetting decreases in different types of pretrial events among program cases that were not referred to mediation. Program cases that were not referred to mediation had 80 percent fewer “other” hearings compared to cases in the control departments that were not referred to mediation. There was also evidence suggesting some reduction in the number of CMCs for program cases not referred to mediation, although the size of the impact was not clear. On the other hand, the regression results also indicated that the number of motion hearings for program cases
230 Please see Section I.B. for a description of the regression analysis method. 231 This regression analysis relied on case characteristic information that was gathered through surveys. The number of survey responses for the subgroups of cases that settled before mediation or were removed from mediation was too small to produce meaningful regression results for these subgroups.
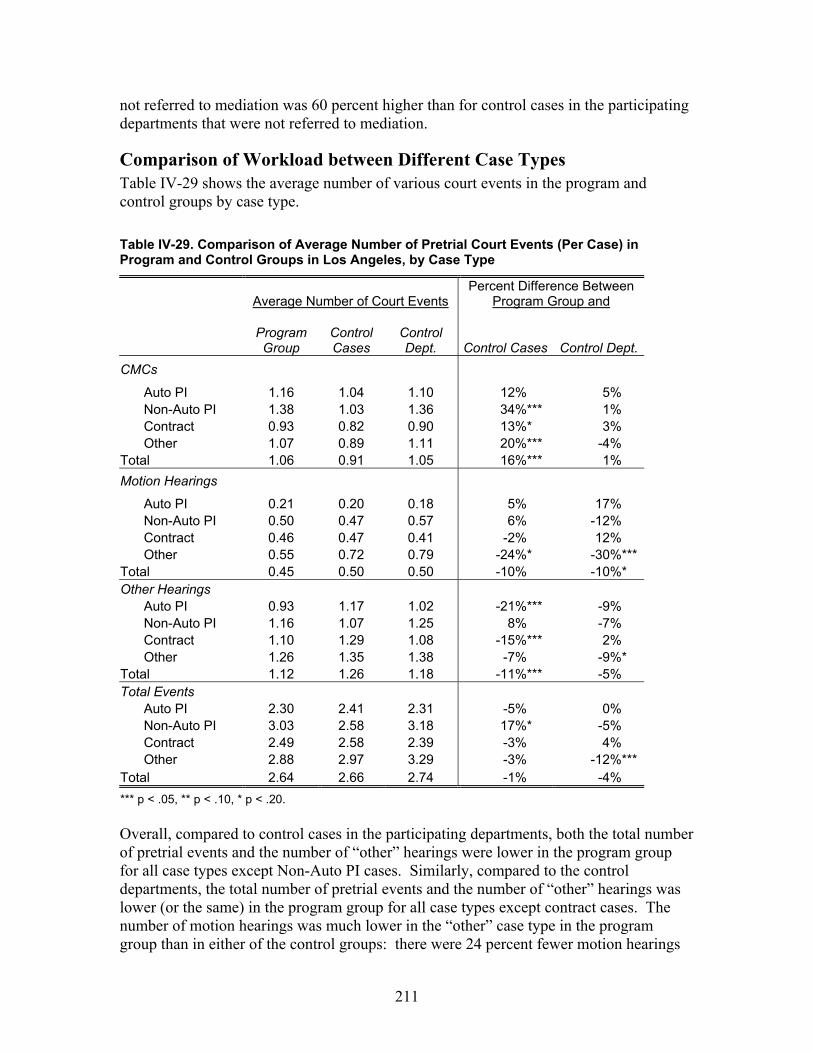
211
not referred to mediation was 60 percent higher than for control cases in the participating departments that were not referred to mediation.
Comparison of Workload between Different Case Types Table IV-29 shows the average number of various court events in the program and control groups by case type. Table IV-29. Comparison of Average Number of Pretrial Court Events (Per Case) in Program and Control Groups in Los Angeles, by Case Type
Average Number of Court Events Percent Difference Between
Program Group and
Program Group
Control Cases
Control Dept. Control Cases Control Dept.
CMCs
Auto PI 1.16 1.04 1.10 12% 5% Non-Auto PI 1.38 1.03 1.36 34%*** 1% Contract 0.93 0.82 0.90 13%* 3% Other 1.07 0.89 1.11 20%*** -4%
Total 1.06 0.91 1.05 16%*** 1% Motion Hearings
Auto PI 0.21 0.20 0.18 5% 17% Non-Auto PI 0.50 0.47 0.57 6% -12% Contract 0.46 0.47 0.41 -2% 12% Other 0.55 0.72 0.79 -24%* -30%***
Total 0.45 0.50 0.50 -10% -10%* Other Hearings
Auto PI 0.93 1.17 1.02 -21%*** -9% Non-Auto PI 1.16 1.07 1.25 8% -7% Contract 1.10 1.29 1.08 -15%*** 2% Other 1.26 1.35 1.38 -7% -9%*
Total 1.12 1.26 1.18 -11%*** -5% Total Events
Auto PI 2.30 2.41 2.31 -5% 0% Non-Auto PI 3.03 2.58 3.18 17%* -5% Contract 2.49 2.58 2.39 -3% 4% Other 2.88 2.97 3.29 -3% -12%***
Total 2.64 2.66 2.74 -1% -4% *** p < .05, ** p < .10, * p < .20. Overall, compared to control cases in the participating departments, both the total number of pretrial events and the number of “other” hearings were lower in the program group for all case types except Non-Auto PI cases. Similarly, compared to the control departments, the total number of pretrial events and the number of “other” hearings was lower (or the same) in the program group for all case types except contract cases. The number of motion hearings was much lower in the “other” case type in the program group than in either of the control groups: there were 24 percent fewer motion hearings
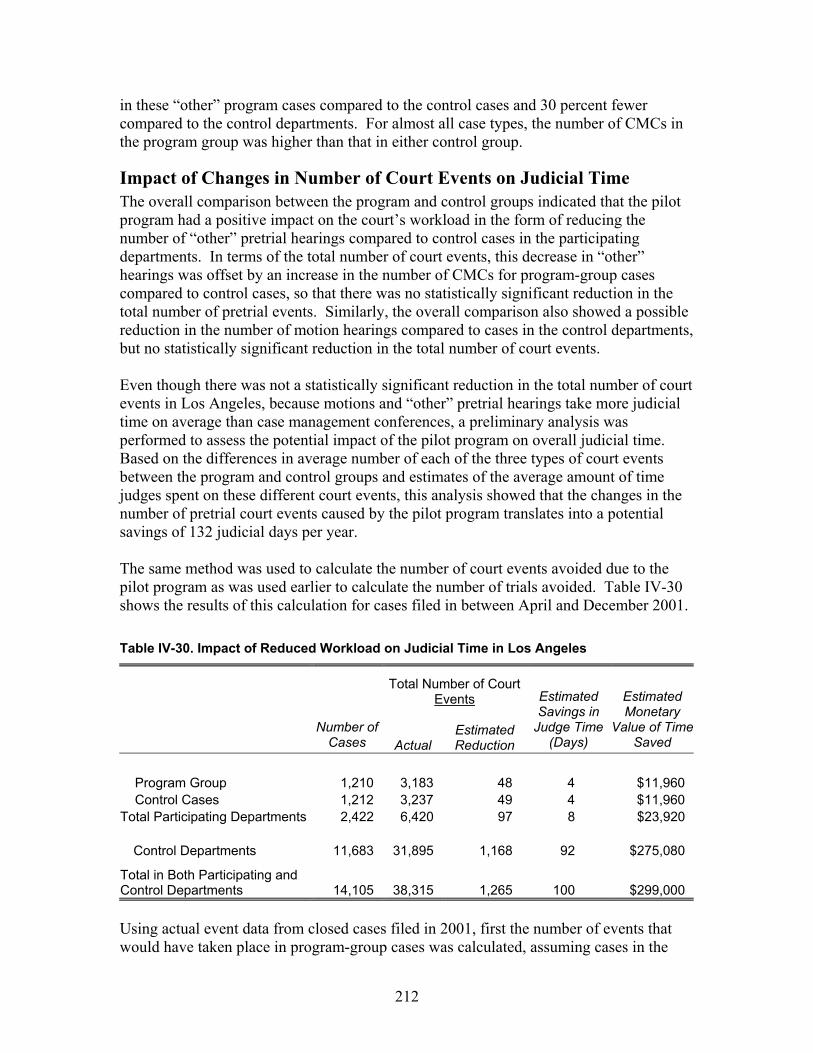
212
in these “other” program cases compared to the control cases and 30 percent fewer compared to the control departments. For almost all case types, the number of CMCs in the program group was higher than that in either control group.
Impact of Changes in Number of Court Events on Judicial Time The overall comparison between the program and control groups indicated that the pilot program had a positive impact on the court’s workload in the form of reducing the number of “other” pretrial hearings compared to control cases in the participating departments. In terms of the total number of court events, this decrease in “other” hearings was offset by an increase in the number of CMCs for program-group cases compared to control cases, so that there was no statistically significant reduction in the total number of pretrial events. Similarly, the overall comparison also showed a possible reduction in the number of motion hearings compared to cases in the control departments, but no statistically significant reduction in the total number of court events. Even though there was not a statistically significant reduction in the total number of court events in Los Angeles, because motions and “other” pretrial hearings take more judicial time on average than case management conferences, a preliminary analysis was performed to assess the potential impact of the pilot program on overall judicial time. Based on the differences in average number of each of the three types of court events between the program and control groups and estimates of the average amount of time judges spent on these different court events, this analysis showed that the changes in the number of pretrial court events caused by the pilot program translates into a potential savings of 132 judicial days per year. The same method was used to calculate the number of court events avoided due to the pilot program as was used earlier to calculate the number of trials avoided. Table IV-30 shows the results of this calculation for cases filed in between April and December 2001. Table IV-30. Impact of Reduced Workload on Judicial Time in Los Angeles
Total Number of Court Events
Number of
Cases Actual Estimated Reduction
Estimated Savings in
Judge Time (Days)
Estimated Monetary
Value of Time Saved
Program Group 1,210 3,183 48 4 $11,960 Control Cases 1,212 3,237 49 4 $11,960 Total Participating Departments 2,422 6,420 97 8 $23,920
Control Departments 11,683 31,895 1,168 92 $275,080
Total in Both Participating and Control Departments 14,105 38,315 1,265 100 $299,000 Using actual event data from closed cases filed in 2001, first the number of events that would have taken place in program-group cases was calculated, assuming cases in the
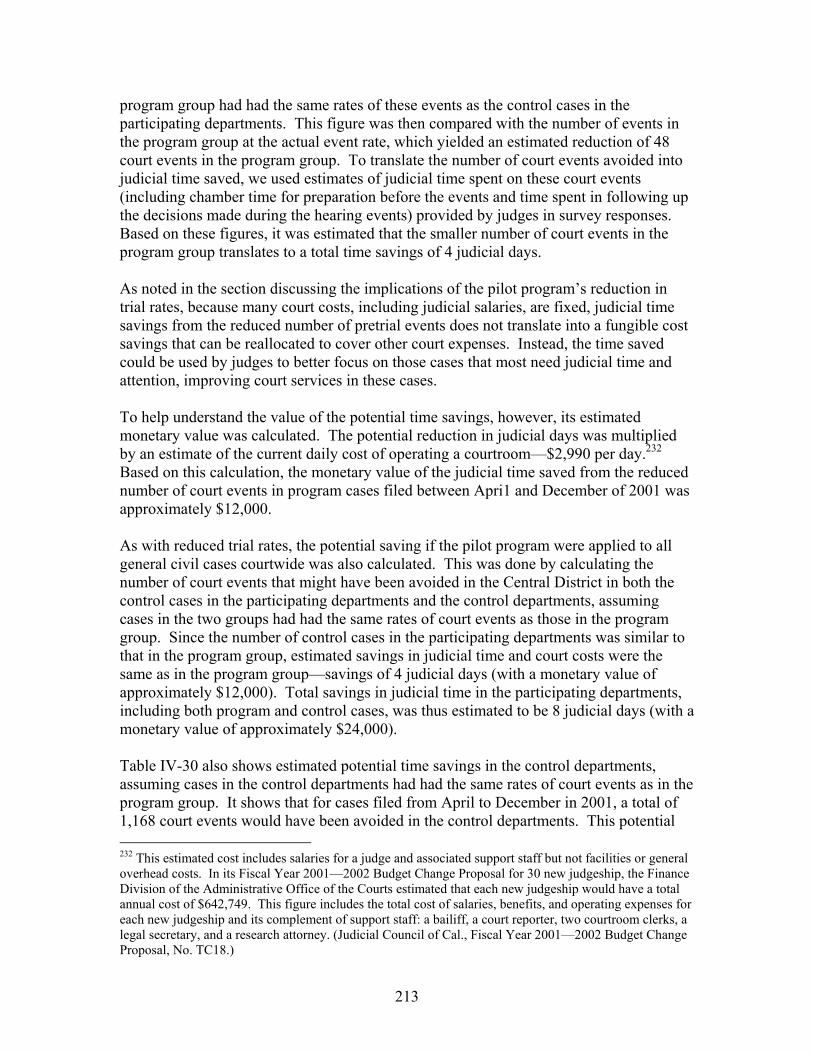
213
program group had had the same rates of these events as the control cases in the participating departments. This figure was then compared with the number of events in the program group at the actual event rate, which yielded an estimated reduction of 48 court events in the program group. To translate the number of court events avoided into judicial time saved, we used estimates of judicial time spent on these court events (including chamber time for preparation before the events and time spent in following up the decisions made during the hearing events) provided by judges in survey responses. Based on these figures, it was estimated that the smaller number of court events in the program group translates to a total time savings of 4 judicial days. As noted in the section discussing the implications of the pilot program’s reduction in trial rates, because many court costs, including judicial salaries, are fixed, judicial time savings from the reduced number of pretrial events does not translate into a fungible cost savings that can be reallocated to cover other court expenses. Instead, the time saved could be used by judges to better focus on those cases that most need judicial time and attention, improving court services in these cases. To help understand the value of the potential time savings, however, its estimated monetary value was calculated. The potential reduction in judicial days was multiplied by an estimate of the current daily cost of operating a courtroom—$2,990 per day.232 Based on this calculation, the monetary value of the judicial time saved from the reduced number of court events in program cases filed between Apri1 and December of 2001 was approximately $12,000. As with reduced trial rates, the potential saving if the pilot program were applied to all general civil cases courtwide was also calculated. This was done by calculating the number of court events that might have been avoided in the Central District in both the control cases in the participating departments and the control departments, assuming cases in the two groups had had the same rates of court events as those in the program group. Since the number of control cases in the participating departments was similar to that in the program group, estimated savings in judicial time and court costs were the same as in the program group—savings of 4 judicial days (with a monetary value of approximately $12,000). Total savings in judicial time in the participating departments, including both program and control cases, was thus estimated to be 8 judicial days (with a monetary value of approximately $24,000). Table IV-30 also shows estimated potential time savings in the control departments, assuming cases in the control departments had had the same rates of court events as in the program group. It shows that for cases filed from April to December in 2001, a total of 1,168 court events would have been avoided in the control departments. This potential 232 This estimated cost includes salaries for a judge and associated support staff but not facilities or general overhead costs. In its Fiscal Year 2001—2002 Budget Change Proposal for 30 new judgeship, the Finance Division of the Administrative Office of the Courts estimated that each new judgeship would have a total annual cost of $642,749. This figure includes the total cost of salaries, benefits, and operating expenses for each new judgeship and its complement of support staff: a bailiff, a court reporter, two courtroom clerks, a legal secretary, and a research attorney. (Judicial Council of Cal., Fiscal Year 2001—2002 Budget Change Proposal, No. TC18.)

214
reduction in the number of court events translates into savings of 92 judicial days (with a monetary value of approximately $275,000). Combining this with the potential savings from the participating departments, the total potential time savings from cases filed from April to December 2001 in all unlimited departments in Central District was estimated to be 100 judicial days (with a monetary value of approximately $299,000). To better understand the potential impact of the Los Angeles pilot program on an annual basis, Table IV-31 translated all the time savings calculations based on estimated number of cases filed during a twelve-month period. With cases in all unlimited departments combined, total potential annual savings in judicial time was estimated to be 132 judicial days (with a monetary value of approximately $395,000). Table IV-31. Potential Courtwide Annual Impact of Reduced Workload on Judicial Time in Los Angeles
Total Number of Court Events
Number of
Cases Actual Estimated Reduction
Estimated Potential
Savings in Judge Time
(Days)
Estimated Monetary Value of Potential
Time Saving
Program Group 1,613 4,244 64 5 $14,950 Control Cases 1,616 4,315 64 5 $14,950
Total Participating Departments 3,229 8,559 128 10 $29,900
Control Departments 15,577 42,527 1,558 122 $364,780 Total in Both Participating and Control Departments 18,807 51,086 1,686 132 $394,680
Comparison of Court Workload in Cases Valued Over $50,000 Referred to Mediation under Pilot Program (Court-Ordered Referral) and under 1775 program (Voluntary Referral) Table IV-32 compares the average number of pretrial events in cases valued over $50,000 that were referred to mediation under the Early Mediation Pilot Program (court-ordered referrals) and such cases referred to mediation under the 1775 program (voluntary referrals). This table indicates that there were fewer pretrial court events, particularly CMCs, in cases valued at over $50,000 referred to early mediation under the pilot program than in cases valued over $50,000 that were referred to mediation under the 1775 program. However, it is not clear whether these differences are a result of the mandatory referrals to mediation in the pilot program versus voluntary referral to mediation in the 1775 program or from other differences between the pilot program and the 1775 program. As noted in Section I.B., there are a variety of programmatic differences between the Early Mediation Pilot Program and the 1775 program, including that mediators in the pilot program were required to meet higher training and experience requirements.
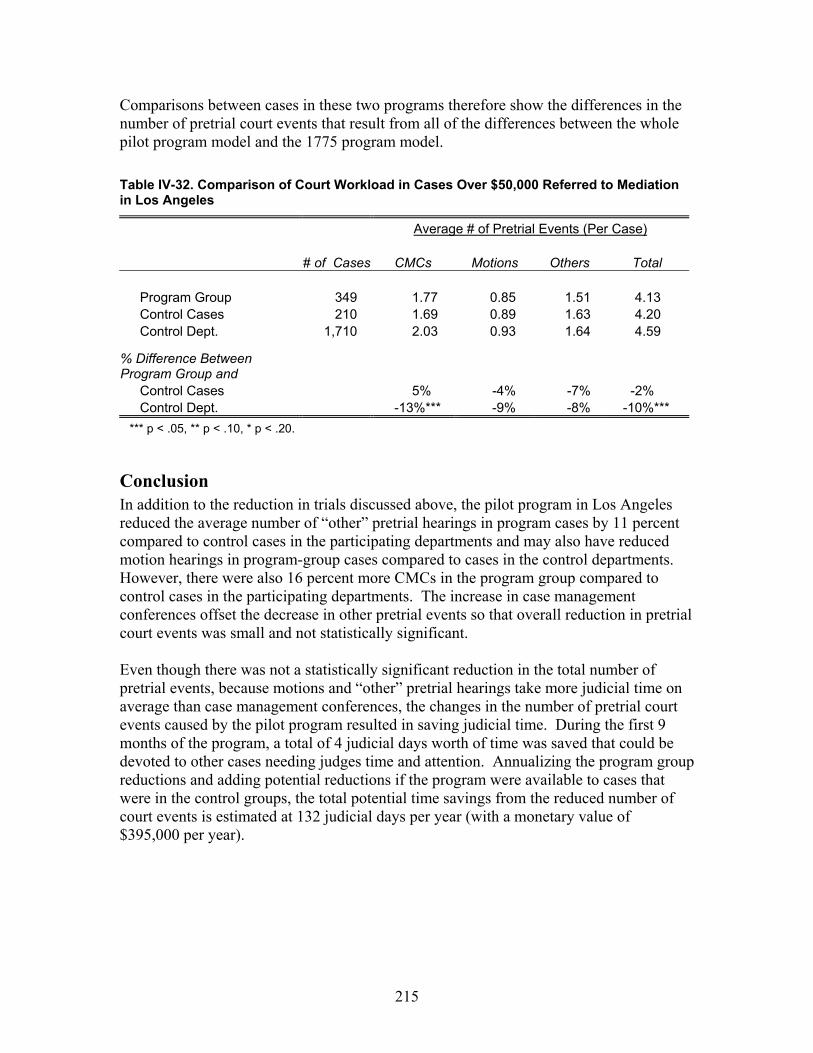
215
Comparisons between cases in these two programs therefore show the differences in the number of pretrial court events that result from all of the differences between the whole pilot program model and the 1775 program model. Table IV-32. Comparison of Court Workload in Cases Over $50,000 Referred to Mediation in Los Angeles
Average # of Pretrial Events (Per Case)
# of Cases CMCs Motions Others Total
Program Group 349 1.77 0.85 1.51 4.13 Control Cases 210 1.69 0.89 1.63 4.20 Control Dept. 1,710 2.03 0.93 1.64 4.59
% Difference Between Program Group and
Control Cases 5% -4% -7% -2% Control Dept. -13%*** -9% -8% -10%***
*** p < .05, ** p < .10, * p < .20.
Conclusion In addition to the reduction in trials discussed above, the pilot program in Los Angeles reduced the average number of “other” pretrial hearings in program cases by 11 percent compared to control cases in the participating departments and may also have reduced motion hearings in program-group cases compared to cases in the control departments. However, there were also 16 percent more CMCs in the program group compared to control cases in the participating departments. The increase in case management conferences offset the decrease in other pretrial events so that overall reduction in pretrial court events was small and not statistically significant. Even though there was not a statistically significant reduction in the total number of pretrial events, because motions and “other” pretrial hearings take more judicial time on average than case management conferences, the changes in the number of pretrial court events caused by the pilot program resulted in saving judicial time. During the first 9 months of the program, a total of 4 judicial days worth of time was saved that could be devoted to other cases needing judges time and attention. Annualizing the program group reductions and adding potential reductions if the program were available to cases that were in the control groups, the total potential time savings from the reduced number of court events is estimated at 132 judicial days per year (with a monetary value of $395,000 per year).

216
217
V. Fresno Pilot Program
A. Summary of Study Findings There is strong evidence that the Early Mediation Pilot Program in Fresno reduced case disposition time, improved litigant satisfaction with the court’s services and the litigation process, and decreased litigant costs in cases that resolved at mediation. • Mediation referrals and settlements—Almost 1,300 cases that were filed in the
Superior Court of Fresno County in 2000 and 2001 (871 unlimited and 414 limited) were referred to mediation, and more than 700 of these cases (514 unlimited and 214 limited) were mediated under the pilot program. Of the unlimited cases mediated, 47 percent settled at the mediation and another 8 percent settled later as a direct result of the mediation, for a total resolution rate of approximately 55 percent. Among limited cases, 58 percent settled at mediation and another 3 percent settled later as a direct result of the mediation, for a total resolution rate of approximately 61 percent. In survey responses, 67 percent of attorneys whose cases did not settle at mediation indicated that the mediation was important to the ultimate settlement of the case.
• Trial rate—Because a large proportion of the cases being studied had not yet reached
disposition, there was not sufficient data to determine whether the pilot program in Fresno had an impact on the trial rate.
• Disposition time—In direct comparisons between unlimited cases filed in 2001 in the
program and control groups, the average time to disposition in the program group was 39 days shorter than in the control group and the median time to disposition was 50 days shorter. For limited cases filed in 2001, the average time to disposition for cases in the program group was 26 days shorter than for cases in the control group and the median time to disposition was 6 days shorter. The results of regression analysis that accounted for case type differences suggest that the average time to disposition in the program group was 40 days shorter than in the control group for both unlimited and limited cases. For both unlimited and limited program-group cases, starting at about the time that pilot program mediations occurred on average, the pace of dispositions outstripped that of cases in the control group, suggesting that the mediations contributed to shortening the time to disposition. Comparisons with similar cases in the control group indicate that when program-group cases were settled at mediation, the average disposition time was shorter, but when cases were mediated and did not settle at the mediation, the disposition time was longer.
• Litigant satisfaction—Attorneys in both unlimited and limited program-group cases
were more satisfied with both the litigation process and the court’s services than attorneys in control-group cases. Attorneys’ satisfaction with the court’s services, the litigation process, and the outcome of the case were all higher in program-group cases that settled at mediation than in similar control-group cases. While attorneys whose cases did not settle at mediation were less satisfied with the outcome of the case, they
218
were still more satisfied with both the litigation process and the services provided by the court than attorneys in like cases in the control group. This suggests that participating in mediation increased attorneys’ satisfaction with both the litigation process and the court’s services, regardless of whether the case settled at mediation. Both parties and attorneys who participated in pilot program mediations expressed high satisfaction with their mediation experiences, particularly with the performance of the mediators. They strongly agreed that the mediator and the mediation process were fair and that they would recommend both to others.
• Litigation costs—There was evidence that both litigant costs and attorney time were
reduced when cases resolved at mediation. In cases that settled at mediation, 89 percent of attorneys responding to the study survey estimated some savings in both litigant costs and attorney hours from using mediation to reach settlement. Average savings estimated by attorneys per settled case was $9,915 in litigant costs in all 2000 and 2001 cases that settled at mediation and 50 hours in attorney time. Based on these attorney estimates, the total estimated savings in litigant costs was $3,619,136 and the total estimated savings in attorney hours was 24,455.
• Court workload—Unlimited program-group cases filed in 2001 had 13 percent
fewer motion hearings than cases in the control group, and limited program-group cases had 48 percent fewer motion hearings. However, this decrease in motions was completely offset by an increase in the number of case management conferences and other pretrial hearings in pilot program cases so that, overall, there was an increase in the total number of pretrial court events in the program group and a small increase in the judicial time spent on program cases during the study period. The increase in the number of case management conferences for program cases was understandable given court procedures (since changed) that required conferences in all program cases that did not settle at mediation and in most program cases when the parties wanted their case removed from the mediation track. The court’s procedures did not generally require case management conferences in other cases. Unlimited program-group cases that settled at mediation had 45 percent fewer court events overall compared to similar cases in the control group. This overall reduction stemmed from reductions in motion and other hearings; there were 80 percent fewer motion hearings and 60 percent fewer other hearings in unlimited program cases that settled at mediation compared to like cases in the control group.
219
B. Introduction This section of the report discusses the study’s findings concerning the Early Mediation Pilot Program in the Superior Court of Fresno County. Based on the criteria established by the Early Mediation Pilot Program legislation, this was a successful program, resulting in benefits to both litigants and the courts in the form of reduced disposition time, improved litigant satisfaction with the court’s services and the litigation process, and lower litigant costs in cases that resolved at mediation. As further discussed below in the program description, the Fresno pilot program included four main elements: • Cases were referred to early mediation on a random basis; they were not assessed for
amenability to mediation before referral; • Litigants could consent to the referral or, typically by attending a case management
conference, could request that the court remove the case from the mediation track; • The court had the authority to order the litigants to participate in early mediation; and • If litigants selected a mediator from the court’s panel, the court paid the mediator for
up to four hours of mediation services. For purposes of this study, the cases randomly referred to early mediation are called the “program group.” The remaining cases that were otherwise eligible but were not referred to early mediation are called the “control group.” Comparisons of the disposition time, litigant satisfaction, and other outcome measures in the program group and the control group was used to show the overall impact of implementing this pilot program, with all of its program elements, in the Fresno court. It is important to remember that, throughout this section, “program group” means cases referred to mediation; it does not mean cases that were mediated. The program group includes cases that were referred to mediation but that did not ultimately go to mediation, either because they were later removed from the mediation track by the court or because they settled before the mediation took place. It is also important to remember that the program-group cases that were mediated and not mediated and that settled and did not settle at mediation had very different dispute resolution experiences and different outcomes in terms of the areas being studied (disposition time, litigant satisfaction, etc.). In overall comparisons, the outcomes in all these subgroups of program cases were added together to calculate an overall average for the program group as a whole. As a result, within these overall averages, positive outcomes in some subgroups of cases—such as shorter disposition time in cases that settled at mediation—were often offset by less positive outcomes in other subgroups. To better understand how program-group cases in these subgroups may have been influenced by their exposure to different pilot program elements, comparisons were made between cases in these subgroups and control-group cases with similar case characteristics. Readers who are interested in the impact of specific pilot program

220
elements, such as the early mediation process, should pay particular attention to these subgroup analyses. Finally, it is important to remember that the emphasis in this pilot program was on early referral to and early participation in mediation—cases were referred to mediation at 5–6 months after filing and went to mediation at 9–10 months after filing. Thus, this study only addresses how cases responded to such early referrals and early mediation. It does not address how cases might have responded to later referrals or later mediation.
221
C. Fresno Pilot Program Description This section provides a brief description of the Superior Court of Fresno County and its Early Mediation Pilot Program. This description is intended to provide context for understanding the study findings presented later in this chapter.
The Court Environment in Fresno Fresno is a largely rural county with one large urban center. It is one of the fastest growing counties in California with a current population of approximately 800,000. The superior court in Fresno County has 36 authorized judgeships. In 2000, the year this mediation pilot program began, approximately 9,000 unlimited general civil cases and 12,000 limited civil cases were filed in the Superior Court of Fresno County.233 The Superior Court of Fresno County has historically had limited resources for managing civil cases. The civil case docket was managed according to a master-calendar system, in which different judges were assigned to handle different aspects of a civil case, based on the judge who was available when the particular task needed to be performed. During the program period, one judge was assigned full time to hold law and motion hearings. Other judges, assigned mainly to hear criminal cases, were assigned to handle other aspects of civil cases as they were available. It was not until January 2003 that four judges were assigned to handle civil cases exclusively. During most of the pilot program period, case management conferences were rarely conducted by judges. In October 2001, a new case management procedure was adopted in which case management conferences were set in all civil cases approximately 120 days after filing. These initial case management conferences, however, were conducted by court clerks and focused primarily on setting dates for mandatory settlement conferences, trial readiness hearings, and trials. It has historically taken a relatively long time for unlimited civil cases in Fresno to reach disposition. In 1999, the year before the Early Mediation Pilot Program was implemented, the Superior Court of Fresno County disposed of 56 percent of its unlimited civil cases within one year of filing, 80 percent within 18 months, and 91 percent within two years. Disposition of limited cases was faster. The court disposed of 96 percent of its limited civil cases within one year of filing, 99 percent within 18 months, and 99 percent within 24 months. Prior to the implementation of the pilot program in 2000, the court did not have any alternative dispute resolution (ADR) program for general civil cases. The only ADR program available was mediation services for small claims cases provided by the local
233 Judicial Council of Cal., Admin. Off. of Cts., Rep. on Court Statistics (2001) Fiscal Year 1990-1991. Through 1999-2000 Statewide Caseload Trends, p. 46. See the glossary for definitions of “unlimited civil case,” “limited civil case,” and “general civil case.”
222
Better Business Bureau. Thus, the pilot mediation program for limited and unlimited civil cases represented a new experience for both the court and the local bar association.
The Early Mediation Pilot Program Model Adopted in Fresno
The General Program Model The Superior Court of Fresno County adopted a mandatory mediation pilot program model. As noted in the introduction, under the Early Mediation Pilot Program statutes, in courts with mandatory mediation programs, the judges were given statutory authority to order eligible cases to mediation. The basic elements of the program implemented in Fresno included: • The court’s ADR Administrator selected cases for referral to mediation on a random
basis from eligible at-issue cases; cases were not assessed for amenability to mediation before being referred;
• Litigants were sent a notice when their case was referred to mediation under the pilot program;
• An early mediation status conference was set approximately 60 days after the notice of referral to mediation was sent to the parties;
• Litigants were given the option of consenting to the mediation referral by filing a stipulation to participate; the early mediation status conference was canceled in the event of such a stipulation;
• Parties could ask the court to void the referral to mediation (remove the case from the mediation track); this typically had to be done by attending the early mediation status conference and showing the judge good cause why the case was not appropriate for mediation;
• The court had the authority to order litigants to participate in early mediation; • Litigants in cases that were referred to mediation were required to complete
mediation within 60–90 days of the mediation order or stipulation; • If litigants selected a mediator from the court’s panel, the court paid the mediator for
up to four hours of mediation services; and • If the case did not settle at mediation, the court set a follow-up conference shortly
after mediation.
What Cases Were Eligible for the Program Most general civil cases,234 both limited and unlimited, were eligible for the program in Fresno. General civil cases that were not eligible for the program included complex cases and class actions.
How Cases Were Assigned to the Program and Control Groups For purposes of this study, the Judicial Council required the pilot courts implementing a mandatory mediation program model to provide for random assignment of a portion of eligible cases to a “program group” and a portion of cases to a “control group.” “Program-group” cases were exposed to one or more of the program elements described above; “control-group” cases were not exposed to any of these program elements, but 234 See the glossary for a definition of “general civil cases.”

223
were otherwise subject to the same court procedures as the cases in the program group. It is important to remember that, throughout this section, “program group” means cases exposed to any of the pilot program elements, which in Fresno means that they received a notice from the court indicating that they had been selected for referral to mediation in the program, etc. It does not necessarily mean cases that were mediated. In the Fresno pilot program, assignment to the program and control groups was determined by the referral to mediation under the pilot program. From a pool of at-issue cases eligible for the program, the court’s ADR Administrator selected cases for referral to mediation. Cases referred to mediation were the program group and cases not referred to mediation were the control group. The case assignment and mediation referral process went through two phases: before and after October 2001 when the court’s new case management procedure was adopted. During the first phase, before October 2001, on a weekly basis, the ADR Administrator reviewed the files of eligible civil cases in which the complaint had been filed approximately 90–120 days earlier to see if the defendant had responded (whether the case was at issue). The case files were arranged based upon the date of filing, and the ADR Administrator did not review the cases to determine their potential amenability to mediation or the parties’ preferences concerning participation in mediation. The ADR Administrator simply selected eligible, at-issue cases for referral to mediation in the order they appeared until a predetermined number of cases had been selected for mediation. However, the ADR Administrator did try to ensure that a variety of case types and cases involving a variety of attorneys were referred to mediation. For example, if many automobile personal injury (Auto PI) cases had already been selected, a few Auto PI case files would be skipped so that some less common case types (such as medical malpractice cases) could be referred to mediation under the program. Similarly, if multiple cases involving a particular attorney had already been selected, the ADR Administrator would skip cases involving that attorney. This case selection process resulted in the proportion of various case types in the program group differing from the proportion of these cases in the overall population of eligible cases. Thus, the case selection process during the first phase may not be considered completely random. However, the process was random within each case type, as no factor other than case types and attorneys associated with the cases influenced the case selection process. In the second phase, after October 2001,235 the case selection process was modified to integrate it with the new case management procedure. The ADR Administrator used weekly computer printouts of cases scheduled for appearance at case management conferences as the basis for selecting cases for referral to mediation. While the printouts contained information on whether a case had become at issue, there was no information on case type. Cases were randomly selected from these printouts for referral to 235 Note that since the new case management conferences were set for approximately 120 days after filing of the complaint, these new procedures affected cases filed beginning in May or June 2001.
224
mediation. Therefore, after October 2001, the case selection process was completely random, without regard to case type or attorneys associated with the cases.
How Cases Were Referred to Mediation Only cases in which the defendant responded to the complaint (cases that became at issue) were eligible for referral to mediation. Mediation requires participation of both sides to a case. This participation is not possible if the defendant has not responded to the complaint. As in all of the pilot courts, a large proportion of eligible cases in Fresno (approximately 40 percent of unlimited cases and 85 percent of limited cases) never became at issue and thus were not eligible for referral to mediation. As noted above, eligible at-issue cases in the Fresno program were referred to mediation on a random basis. Parties whose cases were referred to mediation were sent a notice of referral and information about the pilot program. This information package included notice of an early mediation status conference set within approximately 60 days. The package informed parties that they could consent to the mediation referral by filing a Stipulation to Participate in Lieu of Early Mediation Status Conference, a blank copy of which was in the package, and that, if they filed this form, they would not have to appear at the status conference. If parties wanted to void the referral to mediation, however, they generally had to appear at the status conference and show the judge good cause why the case was not appropriate for mediation.236 In only approximately 10 percent of the cases (both limited and unlimited) were cases removed from mediation. Since the referrals to mediation were made without any case assessment and only a small proportion of the referred cases sought to opt out of mediation, judges’ views concerning cases’ amenability to mediation and parties’ wishes concerning mediation did not play an important role in the mediation referral process. This is a significant difference from the other two mandatory programs in this study (San Diego and Los Angeles) in which judicial assessment of case amenability was an integral element of the program design.
How Mediators Were Selected and Compensated When a case was referred to mediation, parties were required to select a mediator. Parties were free to select any mediator, whether or not that mediator was from the court’s panel. However, the Early Mediation Pilot Program statutes provided that, if parties selected a mediator from the court’s panel, they would not be required to pay a fee for the mediator’s services. Thus, the parties could receive up to four hours of mediation services at no cost to them if they selected a mediator from the court’s panel. Mediators on the Superior Court of Fresno County panel were required to have a minimum of 25 hours of formal mediation training.237 The court provided a 25-hour
236 In some circumstances, such as when one of the parties declared bankruptcy, cases were removed from the mediation track without the court holding an early mediation status conference. 237 During the first year of the program, attorneys could join the panel without first having completed any formal mediation training while non-attorneys were required to have a minimum of 25 hours of formal mediation training prior to joining the panel. After one year, all panel members, both attorneys and non-attorneys, were required to have completed 25 hours of formal mediation training.
225
training program to potential panelists, but training was also available from other sources.238 Potential panelists were also required to attend a mediator orientation program developed by the court that provided information about the legislation that created the pilot program and local procedures. The court paid the panel mediators for the first four hours of mediation services. Initially mediators in unlimited civil cases were paid $100 per hour, up to a maximum of four hours, and mediators in limited civil cases were paid a flat $100 per case. Beginning July 2001, this rate structure was changed to $150 per hour, up to a maximum of four hours, for all cases. At the end of this four-hour period, the parties were free to continue the mediation on a voluntary basis, but the parties were responsible for paying the mediator at the mediator’s individual market rate.
When Mediation Sessions Were Held In general, parties were required to complete the mediation within 60 days of either the stipulation to participate or the court’s order to mediation following the early mediation status conference. However, parties could get an extension for the mediation completion deadline of up to 150 days from the court’s ADR Administrator for any reason. Such extensions were common.
What Happened After the Mediation Before October 2001 when the court started holding case management conferences, the court would schedule a mediation status conference about the time the mediation was scheduled to be completed—approximately 60 days after the stipulation to participate was filed or the case was ordered to mediation in a early mediation status conference. At the conclusion of the mediation, the mediator was required to submit a form to the court indicating whether the case was fully or partially resolved at the mediation session. If the case settled, in mediation or before mediation, the status conference would be canceled and the case would be calendared for a dismissal hearing. If the case did not settle in the mediation, it would go to the status conference and be set for trial. After the court started holding case management conferences in October 2001, the postmediation status conferences were no longer set. Every case was given a trial date at the first case management conference, so the parties did not need to return for a conference after the mediation to get a trial date.
How Cases Moved Through the Pilot Program To understand the impact of this pilot program, it is helpful to understand the flow of cases through the court process and into the subgroups of cases that experienced different elements of the pilot program. Figure V-1 below depicts this process for unlimited cases filed in 2000 and 2001and Figure V-2 depicts the same process for limited cases.
238 Mediation training from Fresno Pacific University, San Joaquin College of Law, the Better Business Bureau, and Pepperdine University was accepted by the court.
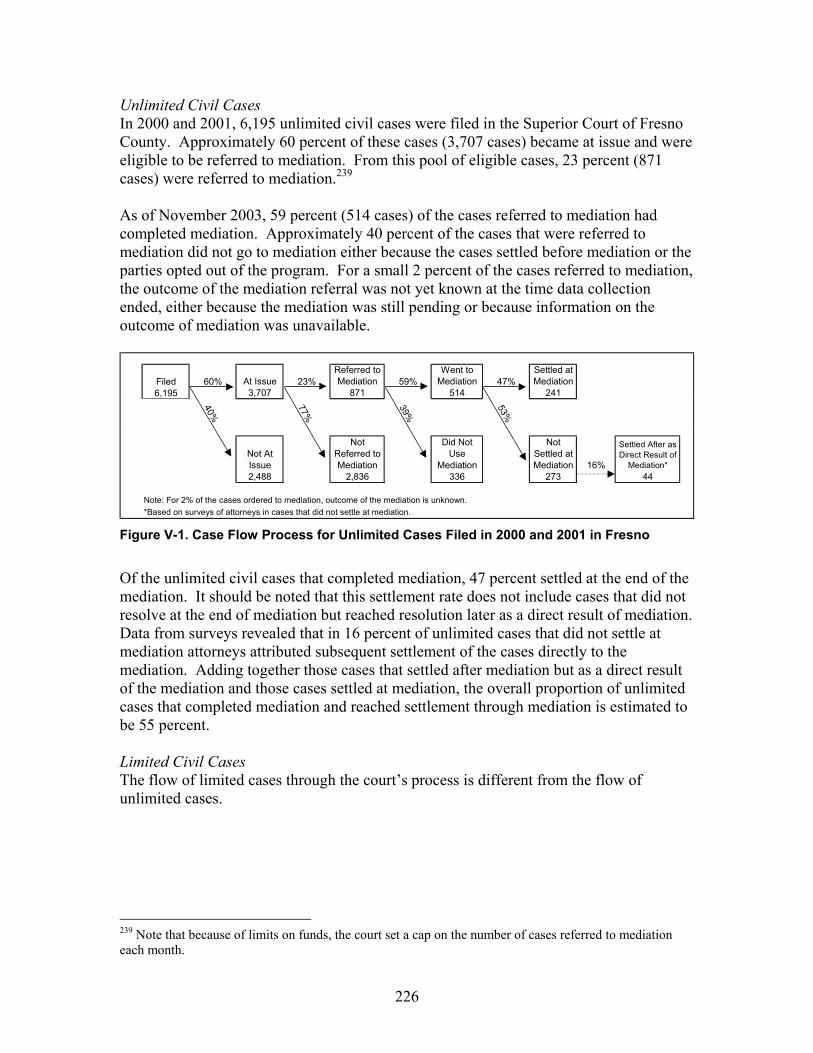
226
Unlimited Civil Cases In 2000 and 2001, 6,195 unlimited civil cases were filed in the Superior Court of Fresno County. Approximately 60 percent of these cases (3,707 cases) became at issue and were eligible to be referred to mediation. From this pool of eligible cases, 23 percent (871 cases) were referred to mediation.239 As of November 2003, 59 percent (514 cases) of the cases referred to mediation had completed mediation. Approximately 40 percent of the cases that were referred to mediation did not go to mediation either because the cases settled before mediation or the parties opted out of the program. For a small 2 percent of the cases referred to mediation, the outcome of the mediation referral was not yet known at the time data collection ended, either because the mediation was still pending or because information on the outcome of mediation was unavailable.
Figure V-1. Case Flow Process for Unlimited Cases Filed in 2000 and 2001 in Fresno
Of the unlimited civil cases that completed mediation, 47 percent settled at the end of the mediation. It should be noted that this settlement rate does not include cases that did not resolve at the end of mediation but reached resolution later as a direct result of mediation. Data from surveys revealed that in 16 percent of unlimited cases that did not settle at mediation attorneys attributed subsequent settlement of the cases directly to the mediation. Adding together those cases that settled after mediation but as a direct result of the mediation and those cases settled at mediation, the overall proportion of unlimited cases that completed mediation and reached settlement through mediation is estimated to be 55 percent. Limited Civil Cases The flow of limited cases through the court’s process is different from the flow of unlimited cases.
239 Note that because of limits on funds, the court set a cap on the number of cases referred to mediation each month.
Filed 60% At Issue 23%Referred to Mediation 59%
Went to Mediation 47%
Settled at Mediation
6,195 3,707 871 514 241
40%
77%
39%
53%
Not At Issue
Not Referred to Mediation
Did Not Use
Mediation
Not Settled at Mediation 16%
Settled After as Direct Result of
Mediation*2,488 2,836 336 273 44
Note: For 2% of the cases ordered to mediation, outcome of the mediation is unknown.*Based on surveys of attorneys in cases that did not settle at mediation.
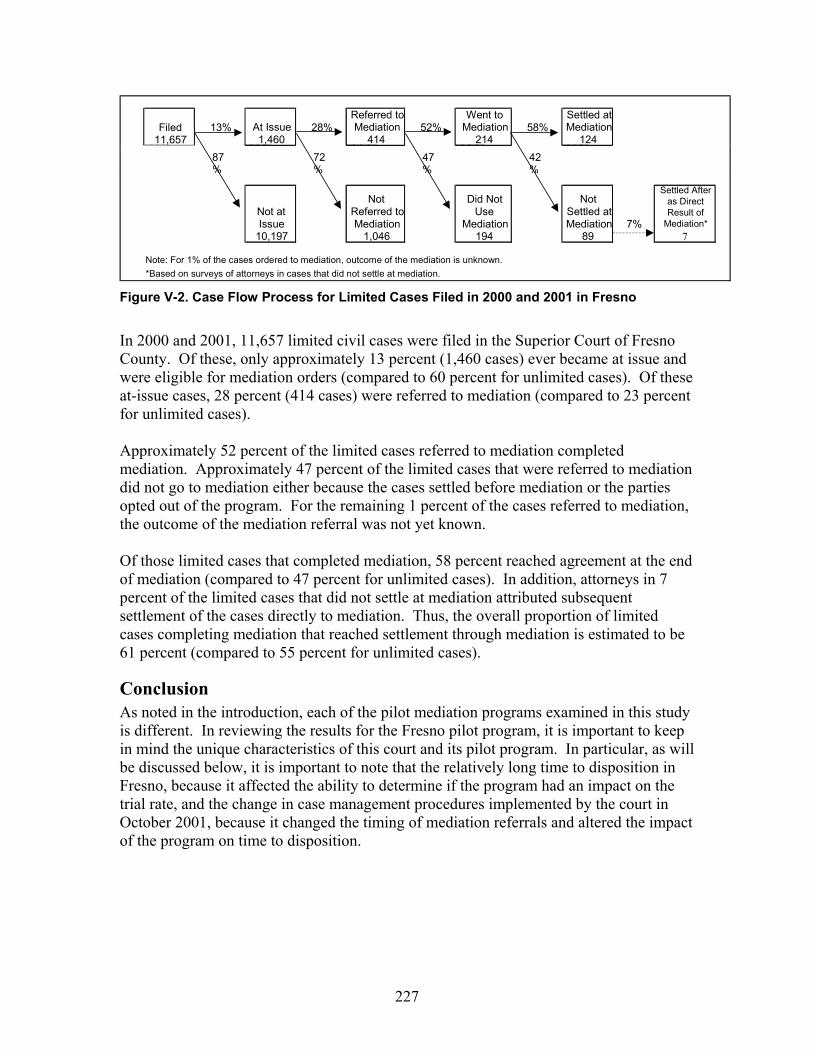
227
Figure V-2. Case Flow Process for Limited Cases Filed in 2000 and 2001 in Fresno
In 2000 and 2001, 11,657 limited civil cases were filed in the Superior Court of Fresno County. Of these, only approximately 13 percent (1,460 cases) ever became at issue and were eligible for mediation orders (compared to 60 percent for unlimited cases). Of these at-issue cases, 28 percent (414 cases) were referred to mediation (compared to 23 percent for unlimited cases). Approximately 52 percent of the limited cases referred to mediation completed mediation. Approximately 47 percent of the limited cases that were referred to mediation did not go to mediation either because the cases settled before mediation or the parties opted out of the program. For the remaining 1 percent of the cases referred to mediation, the outcome of the mediation referral was not yet known. Of those limited cases that completed mediation, 58 percent reached agreement at the end of mediation (compared to 47 percent for unlimited cases). In addition, attorneys in 7 percent of the limited cases that did not settle at mediation attributed subsequent settlement of the cases directly to mediation. Thus, the overall proportion of limited cases completing mediation that reached settlement through mediation is estimated to be 61 percent (compared to 55 percent for unlimited cases).
Conclusion As noted in the introduction, each of the pilot mediation programs examined in this study is different. In reviewing the results for the Fresno pilot program, it is important to keep in mind the unique characteristics of this court and its pilot program. In particular, as will be discussed below, it is important to note that the relatively long time to disposition in Fresno, because it affected the ability to determine if the program had an impact on the trial rate, and the change in case management procedures implemented by the court in October 2001, because it changed the timing of mediation referrals and altered the impact of the program on time to disposition.
Filed 13% At Issue 28%
Referred to Mediation 52%
Went to Mediation 58%
Settled at Mediation
11,657 1,460 414 214 124 87%
72%
47%
42%
Not at Issue
Not Referred to Mediation
Did Not Use
Mediation
Not Settled at Mediation 7%
Settled After as Direct Result of
Mediation*10,197 1,046 194 89 7
Note: For 1% of the cases ordered to mediation, outcome of the mediation is unknown.*Based on surveys of attorneys in cases that did not settle at mediation.
228
D. Data and Methods Used in Study of Fresno Pilot Program This section provides a brief description of the data and methods used to analyze the Fresno pilot program in this study. (See Section I.B. for more information on the overall data and methods used in this report.)
Data Several data sources were used in this study of the Fresno Pilot Program.
Data on Trial Rate, Disposition Time, and Court Workload As more fully described in Section I.B., the primary source of data for assessing the pilot program’s impact on trial rate, disposition time, and court workload was the court’s case management system. It is important to note three issues about this data that may affect the analysis of the program impact in Fresno: (1) the court’s case management system was converted during the study period and some data on court events was lost during this conversion; (2) a large proportion of cases being studied had not reached disposition by the end of the data collection period; and (3) some cases that are shown as still pending in the court’s case management system may actually have reached disposition but not have been properly closed in the case management system. Limitations of Data in the Court’s Case Management System As noted earlier, data from the court’s case management system was used to measure the program impact on the trial rate, case disposition time, and court workload. During the study period, the court changed to a new case management system. The change took place in July 2000 for unlimited cases and in April 2001 for limited cases. During the conversion process, some of the information in the old case management system concerning the number of court events was not completely transferred into the new system. The conversion also affected information on case disposition time and trial rate. Because of these conversion issues, the number of cases disposed of, the number of cases that went to trial, and the number of court events in cases filed before the conversion were likely to be underreported in the case management system. These data problems appear to have had a greater impact on cases filed in 2000 than those filed in 2001. To address this, cases filed in 2000 and 2001 are examined separately in this report. Proportion of Cases That Had Not Reached Disposition Even with a follow-up time in the range of 15 to 40 months since filing, the court’s case management data indicated that a significant proportion of cases included in this study had not reached disposition by November 2003 when the data collection period for this study ended.240 Of the cases filed in 2000, the case management data indicated that approximately 20 percent of unlimited cases and 12 percent of limited cases remained pending at the end of the data collection period. For cases filed in 2001, the proportion of
240 Data collection initially ended in June 2003 for all courts. Additional data was obtained from the Fresno pilot court in November to allow for longer follow-up on case disposition.
229
still-pending cases was approximately 20 percent for unlimited cases and 15 percent for limited cases.241 While, in an absolute sense, the percentage of pending cases does not seem high (more than 80 percent of the cases had reached disposition), particularly for examination of trial rates, where the number and percentage of tried cases is very small, accurately identifying program impact is difficult when data on 20 percent of the cases is not available. Because the cases in both program and control groups had the same follow-up time, the comparisons made in this report between the program and control groups are valid reflections of the differences in these groups within a minimum follow-up period of approximately 15 months. However, the final trial rate, time to disposition, and court workload in both the program and control groups is likely to change when still-pending cases reach disposition and their outcomes are known. Outcomes in pending cases could also affect the final levels of litigant satisfaction and costs. Therefore, the final outcome of comparisons made between the program and control groups when all of the cases in both groups have reached disposition may be different from the outcome reported in this study. Because the percentage of still-pending cases is larger in the control group than in the program group, the way in which these pending cases are likely to impact the comparisons between the program and control groups can be projected for some of the outcome measures being studied. For example, with the data now available, the average case disposition time in the program group is shorter than that in the control group. Since the control group has a larger proportion of pending cases, when the final disposition times in all the pending cases are added in, the control group’s average case disposition time is likely to increase to a greater extent than the average time to disposition in the program group. Thus, the difference between the program and control groups is likely to further increase—the disposition time in the program group will be lower than in the control group by an even larger percentage—when all the cases in both groups have reached disposition. Similar results could be expected in comparisons on trial rate and court workload, since it is likely that cases that take longer to reach disposition have somewhat higher trial rates and more court events. It is harder to predict how outcomes in the pending cases might affect the results relating to litigant satisfaction and costs. It is possible, however, that the court’s case management system data also shows some cases as pending that have actually reached disposition. A fairly large number of the cases shown as pending in the court’s case management system showed no court activities for at least a year. Superior court staff confirmed that these cases might have reached disposition without being properly coded as closed in the case management system. To try to account for that possibility in this report, separate analyses were done on overall time to disposition and court workload using figures for closed cases and disposition time that assumed that all cases that had been pending for a year or more without any court event had actually reached disposition as of the date of the last court
241 Cases in the program group had disposition rates that were approximately 4 to 8 percent higher than cases in the control group by the end of data collection.

230
event shown in the case management system. The results of these separate analyses are reported in footnotes in the sections on time to disposition and court workload.
Data on Litigant Costs and Litigant Satisfaction As is more fully described in Section I.B., analysis of program impact on litigant satisfaction and costs was based on data from surveys distributed (1) to attorneys and parties who went to mediation between July 2001 and June 2002242 (postmediation survey) and (2) to parties and attorneys in program- and control-group cases that reached disposition during the same period (postdisposition survey).
Methods Several methods were used in the study of the Fresno pilot program.
Comparisons of Outcomes in Program- and Control-Group Cases As is more fully described in Section I.B., the main method of analysis used in the study of the Fresno pilot program is direct comparison of the outcomes in the program group as a whole with the outcomes in the control group. Cases were assigned to the program and control groups in Fresno through a process that, with the exception of case type, was random.243 Because this assignment process ensured that the characteristics of the cases in the program and control groups would be similar, differences found in direct comparisons between these groups can reliably be attributed to impact from the pilot program.244 It is important to remember that comparisons between the program group and control group in Fresno identify the impact of the pilot program as a whole, not just the impact of mediation. As discussed above in the pilot program description, Fresno’s pilot program had many elements, including the referral to mediation, the possibility of an early case management conference, the possibility of being ordered to early mediation, and the possibility of participating in the mediation process itself. Not every case in the program group was mediated. The program group is made up of subgroups of cases that experienced different elements of the pilot program—that is, cases that were referred to mediation but did not ultimately go to mediation, either because they were later removed from the mediation track by the court or because they settled before the mediation took place, and cases that actually went through mediation and either settled or did not settle at mediation. In overall comparisons between the program group and control group, the program group includes all of these different subgroups of cases put together. To help understand this, the discussion of each of the outcome measures beings studied (disposition time, litigant satisfaction, etc.) starts with a table showing the average outcome score in each subgroup and in the program group as a whole.
242 Additional surveys were distributed in March 2003 to increase the sample size for comparison cases. 243 As was noted in the program description, because, up until October 2001, the ADR Administrator tried to ensure that a variety of case types and cases involving a variety of attorneys were referred to mediation, there was an overrepresentation of certain case types in the program group. 244 Comparisons were also done using regression analysis to take into account the different proportions of various case types in the program and control groups.
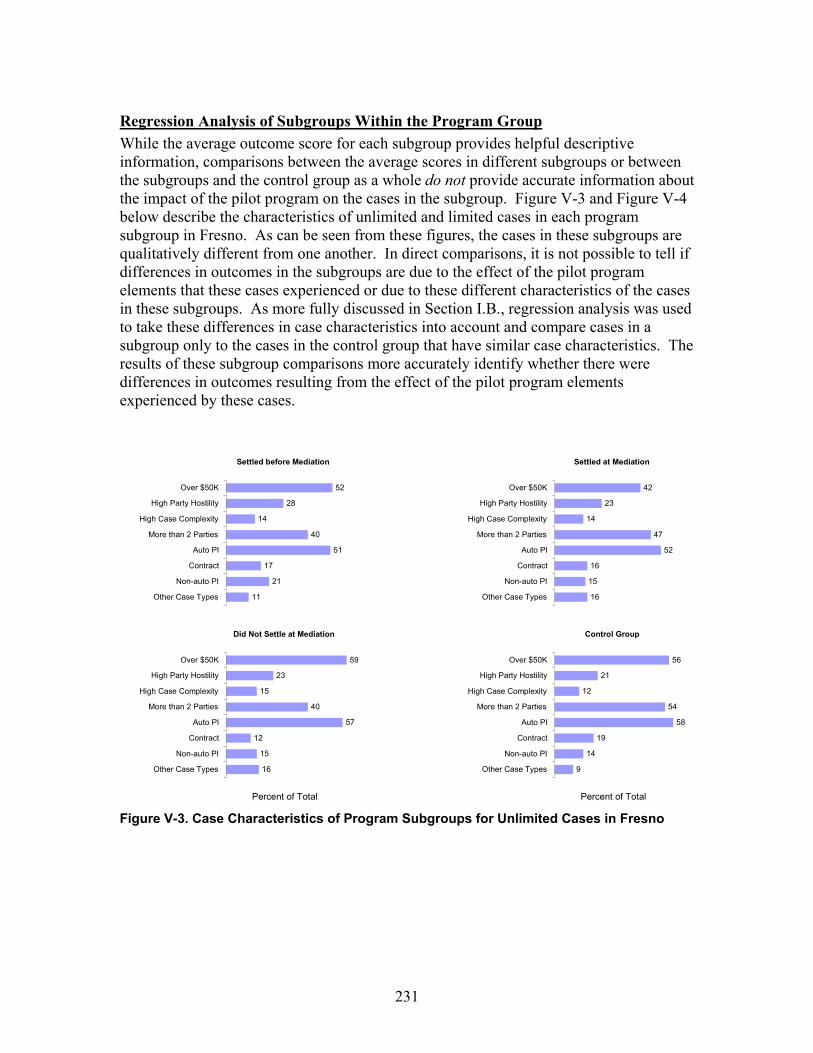
231
Regression Analysis of Subgroups Within the Program Group While the average outcome score for each subgroup provides helpful descriptive information, comparisons between the average scores in different subgroups or between the subgroups and the control group as a whole do not provide accurate information about the impact of the pilot program on the cases in the subgroup. Figure V-3 and Figure V-4 below describe the characteristics of unlimited and limited cases in each program subgroup in Fresno. As can be seen from these figures, the cases in these subgroups are qualitatively different from one another. In direct comparisons, it is not possible to tell if differences in outcomes in the subgroups are due to the effect of the pilot program elements that these cases experienced or due to these different characteristics of the cases in these subgroups. As more fully discussed in Section I.B., regression analysis was used to take these differences in case characteristics into account and compare cases in a subgroup only to the cases in the control group that have similar case characteristics. The results of these subgroup comparisons more accurately identify whether there were differences in outcomes resulting from the effect of the pilot program elements experienced by these cases.
Figure V-3. Case Characteristics of Program Subgroups for Unlimited Cases in Fresno
Percent of Total Percent of Total
Settled before Mediation
11 21
17 51
40 14
28 52
Other Case Types Non-auto PI
Contract Auto PI
More than 2 Parties High Case Complexity
High Party Hostility Over $50K
Settled at Mediation
16 15 16
52
47
14 23
42
Other Case Types
Non-auto PI
Contract
Auto PI
More than 2 Parties
High Case Complexity
High Party Hostility
Over $50K
Did Not Settle at Mediation
16 15
12 57
40 15
23 59
Other Case Types Non-auto PI
Contract Auto PI
More than 2 Parties High Case Complexity
High Party Hostility Over $50K
Control Group
9 14
19 58
54
12 21
56
Other Case Types
Non-auto PI
Contract
Auto PI
More than 2 Parties
High Case Complexity
High Party Hostility
Over $50K
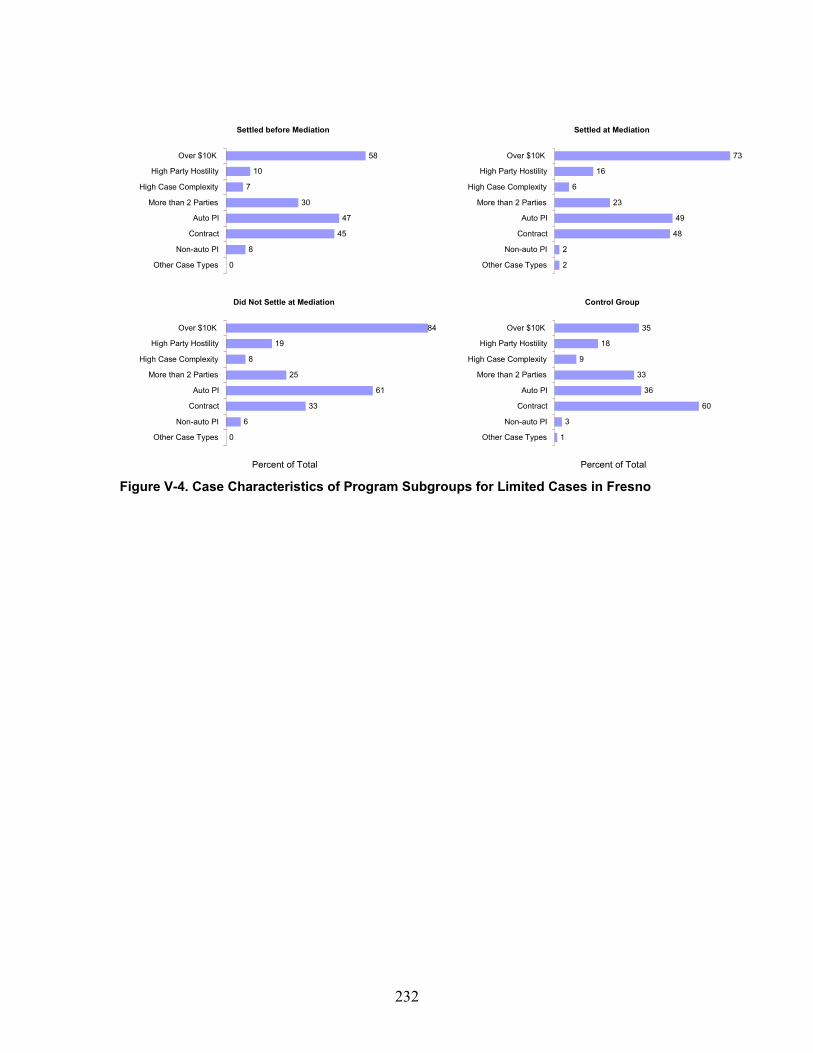
232
Figure V-4. Case Characteristics of Program Subgroups for Limited Cases in Fresno
Percent of Total Percent of Total
Settled at Mediation
2
2
48
49
23 6
16 73
Other Case Types
Non-auto PI
Contract
Auto PI
More than 2 Parties
High Case Complexity
High Party Hostility
Over $10K
Settled before Mediation
0 8
45
47
30 7
10 58
Other Case Types Non-auto PI
Contract Auto PI
More than 2 Parties High Case Complexity
High Party Hostility Over $10K
Did Not Settle at Mediation
0 6
33 61
25 8
19 84
Other Case Types Non-auto PI
Contract Auto PI
More than 2 Parties High Case Complexity
High Party Hostility Over $10K
Control Group
1
3
60
36 33
9 18
35
Other Case Types
Non-auto PI
Contract
Auto PI
More than 2 Parties
High Case Complexity
High Party Hostility
Over $10K
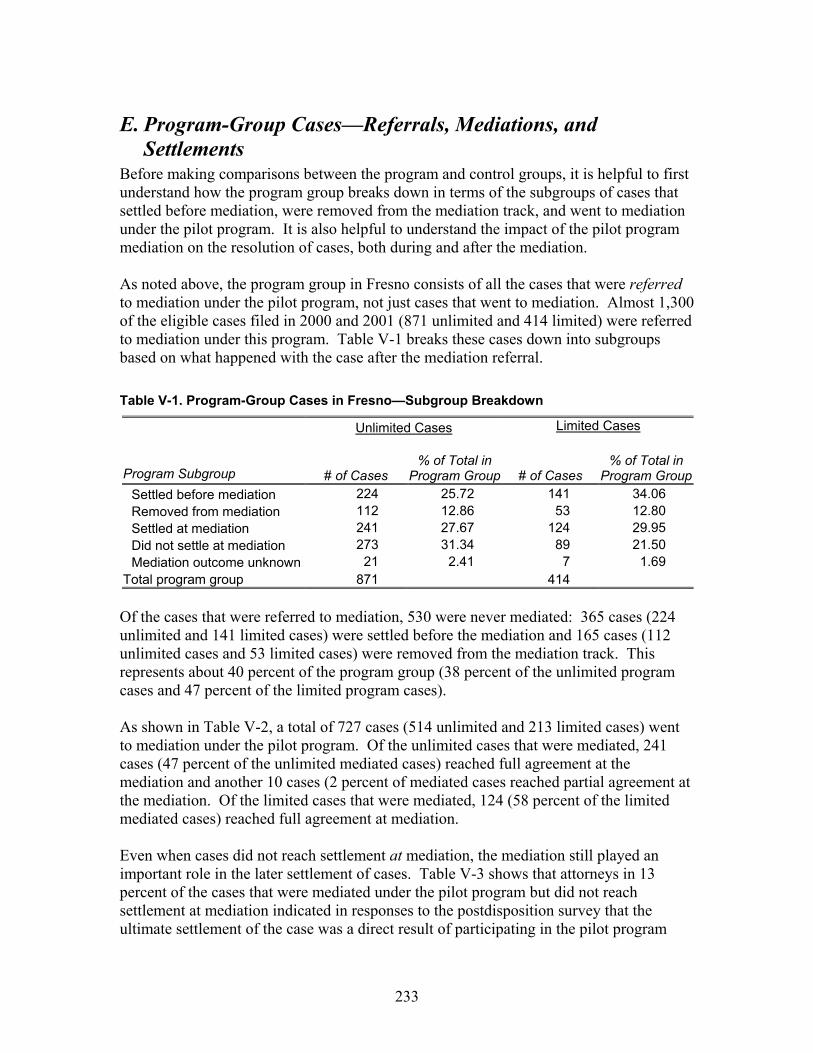
233
E. Program-Group Cases—Referrals, Mediations, and Settlements
Before making comparisons between the program and control groups, it is helpful to first understand how the program group breaks down in terms of the subgroups of cases that settled before mediation, were removed from the mediation track, and went to mediation under the pilot program. It is also helpful to understand the impact of the pilot program mediation on the resolution of cases, both during and after the mediation. As noted above, the program group in Fresno consists of all the cases that were referred to mediation under the pilot program, not just cases that went to mediation. Almost 1,300 of the eligible cases filed in 2000 and 2001 (871 unlimited and 414 limited) were referred to mediation under this program. Table V-1 breaks these cases down into subgroups based on what happened with the case after the mediation referral. Table V-1. Program-Group Cases in Fresno—Subgroup Breakdown
Unlimited Cases Limited Cases
Program Subgroup # of Cases % of Total in
Program Group # of Cases % of Total in
Program GroupSettled before mediation 224 25.72 141 34.06 Removed from mediation 112 12.86 53 12.80 Settled at mediation 241 27.67 124 29.95 Did not settle at mediation 273 31.34 89 21.50 Mediation outcome unknown 21 2.41 7 1.69
Total program group 871 414 Of the cases that were referred to mediation, 530 were never mediated: 365 cases (224 unlimited and 141 limited cases) were settled before the mediation and 165 cases (112 unlimited cases and 53 limited cases) were removed from the mediation track. This represents about 40 percent of the program group (38 percent of the unlimited program cases and 47 percent of the limited program cases). As shown in Table V-2, a total of 727 cases (514 unlimited and 213 limited cases) went to mediation under the pilot program. Of the unlimited cases that were mediated, 241 cases (47 percent of the unlimited mediated cases) reached full agreement at the mediation and another 10 cases (2 percent of mediated cases reached partial agreement at the mediation. Of the limited cases that were mediated, 124 (58 percent of the limited mediated cases) reached full agreement at mediation. Even when cases did not reach settlement at mediation, the mediation still played an important role in the later settlement of cases. Table V-3 shows that attorneys in 13 percent of the cases that were mediated under the pilot program but did not reach settlement at mediation indicated in responses to the postdisposition survey that the ultimate settlement of the case was a direct result of participating in the pilot program
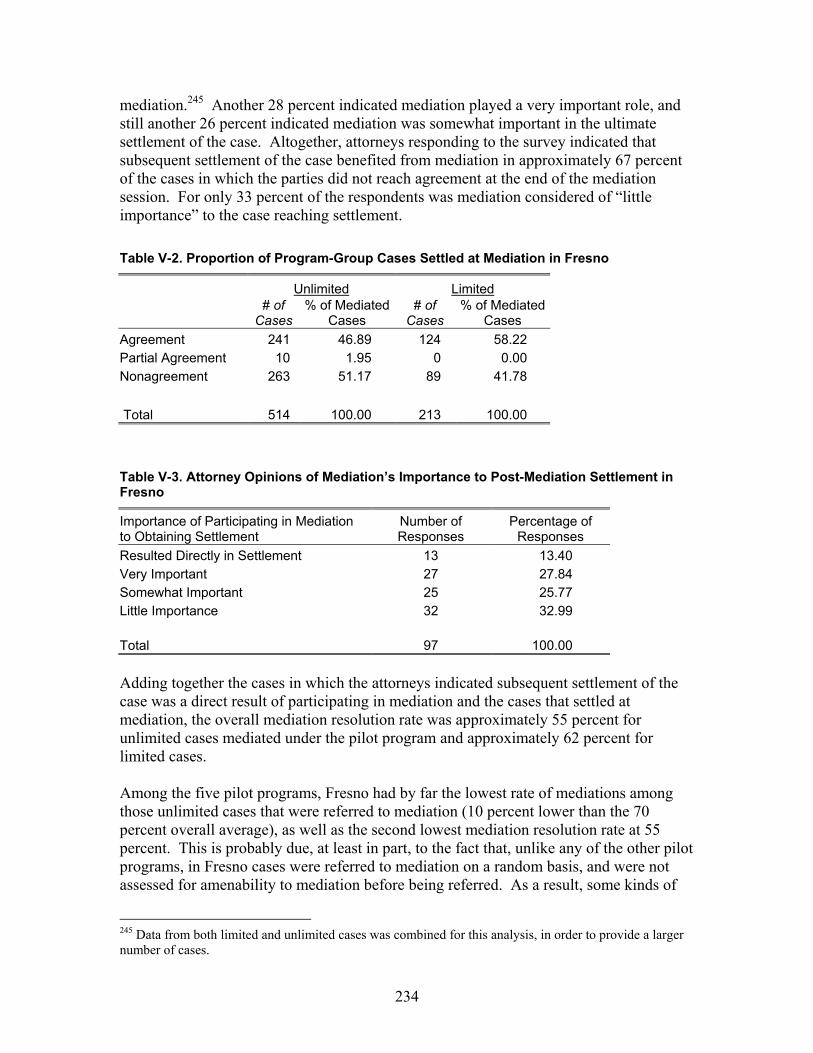
234
mediation.245 Another 28 percent indicated mediation played a very important role, and still another 26 percent indicated mediation was somewhat important in the ultimate settlement of the case. Altogether, attorneys responding to the survey indicated that subsequent settlement of the case benefited from mediation in approximately 67 percent of the cases in which the parties did not reach agreement at the end of the mediation session. For only 33 percent of the respondents was mediation considered of “little importance” to the case reaching settlement. Table V-2. Proportion of Program-Group Cases Settled at Mediation in Fresno
Unlimited Limited
# of
Cases % of Mediated
Cases # of
Cases % of Mediated
Cases Agreement 241 46.89 124 58.22 Partial Agreement 10 1.95 0 0.00 Nonagreement 263 51.17 89 41.78 Total 514 100.00 213 100.00 Table V-3. Attorney Opinions of Mediation’s Importance to Post-Mediation Settlement in Fresno
Importance of Participating in Mediation to Obtaining Settlement
Number of Responses
Percentage of Responses
Resulted Directly in Settlement 13 13.40 Very Important 27 27.84 Somewhat Important 25 25.77 Little Importance 32 32.99 Total 97 100.00 Adding together the cases in which the attorneys indicated subsequent settlement of the case was a direct result of participating in mediation and the cases that settled at mediation, the overall mediation resolution rate was approximately 55 percent for unlimited cases mediated under the pilot program and approximately 62 percent for limited cases. Among the five pilot programs, Fresno had by far the lowest rate of mediations among those unlimited cases that were referred to mediation (10 percent lower than the 70 percent overall average), as well as the second lowest mediation resolution rate at 55 percent. This is probably due, at least in part, to the fact that, unlike any of the other pilot programs, in Fresno cases were referred to mediation on a random basis, and were not assessed for amenability to mediation before being referred. As a result, some kinds of
245 Data from both limited and unlimited cases was combined for this analysis, in order to provide a larger number of cases.

235
cases that were screened out before referral in the other pilot programs were probably referred to mediation in Fresno and either dropped out before the mediation took place or were mediated but did not resolve at the mediation.
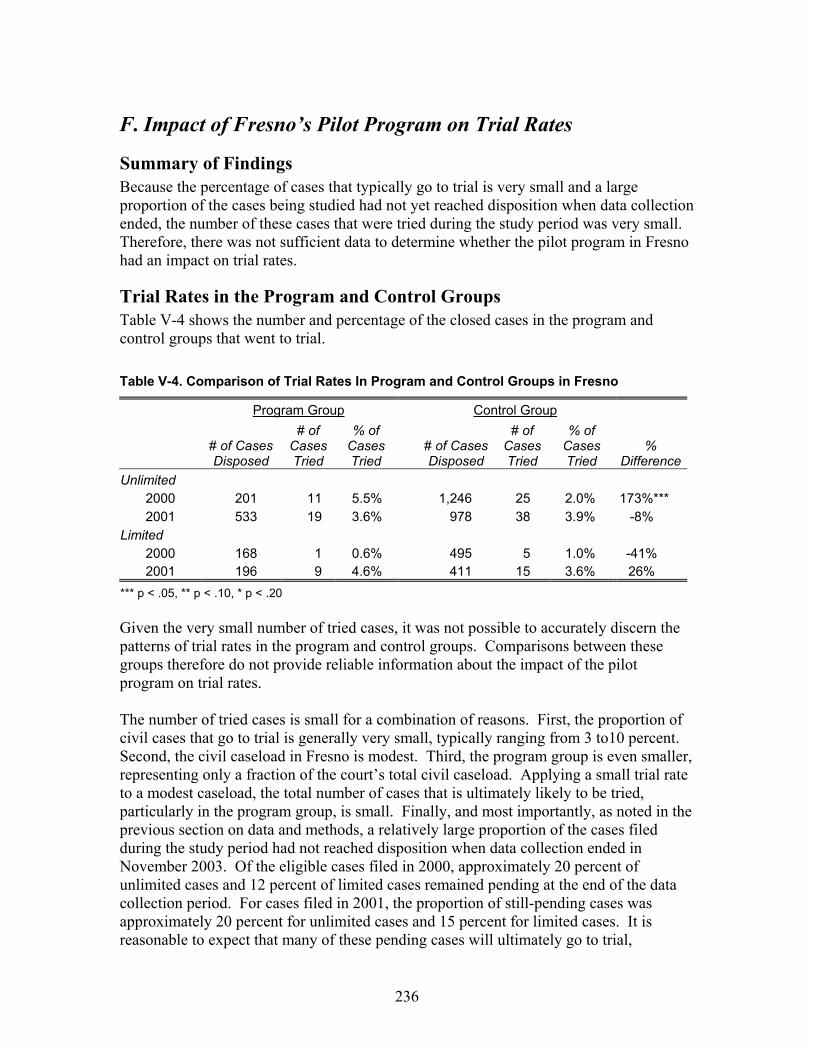
236
F. Impact of Fresno’s Pilot Program on Trial Rates
Summary of Findings Because the percentage of cases that typically go to trial is very small and a large proportion of the cases being studied had not yet reached disposition when data collection ended, the number of these cases that were tried during the study period was very small. Therefore, there was not sufficient data to determine whether the pilot program in Fresno had an impact on trial rates.
Trial Rates in the Program and Control Groups Table V-4 shows the number and percentage of the closed cases in the program and control groups that went to trial. Table V-4. Comparison of Trial Rates In Program and Control Groups in Fresno
Program Group Control Group
# of Cases Disposed
# of Cases Tried
% of Cases Tried
# of Cases Disposed
# of Cases Tried
% of Cases Tried
% Difference
Unlimited 2000 201 11 5.5% 1,246 25 2.0% 173%*** 2001 533 19 3.6% 978 38 3.9% -8%
Limited 2000 168 1 0.6% 495 5 1.0% -41% 2001 196 9 4.6% 411 15 3.6% 26%
*** p < .05, ** p < .10, * p < .20 Given the very small number of tried cases, it was not possible to accurately discern the patterns of trial rates in the program and control groups. Comparisons between these groups therefore do not provide reliable information about the impact of the pilot program on trial rates. The number of tried cases is small for a combination of reasons. First, the proportion of civil cases that go to trial is generally very small, typically ranging from 3 to10 percent. Second, the civil caseload in Fresno is modest. Third, the program group is even smaller, representing only a fraction of the court’s total civil caseload. Applying a small trial rate to a modest caseload, the total number of cases that is ultimately likely to be tried, particularly in the program group, is small. Finally, and most importantly, as noted in the previous section on data and methods, a relatively large proportion of the cases filed during the study period had not reached disposition when data collection ended in November 2003. Of the eligible cases filed in 2000, approximately 20 percent of unlimited cases and 12 percent of limited cases remained pending at the end of the data collection period. For cases filed in 2001, the proportion of still-pending cases was approximately 20 percent for unlimited cases and 15 percent for limited cases. It is reasonable to expect that many of these pending cases will ultimately go to trial,

237
particularly since tried cases typically require a longer time to reach final disposition. With a longer follow-up period, a larger number of cases will have been tried and the program impact on trial rates in Fresno could be assessed.

238
G. Impact of Fresno’s Pilot Program on Case Disposition Time
Summary of Findings The pilot program in Fresno reduced case disposition time for both limited and unlimited cases. The impact was more pronounced, however, for cases filed during 2001, the second year of the pilot program’s operation. • For unlimited cases filed in 2001, the average time to disposition in the program
group was 39 days shorter than in the control group and the median time to disposition was 50 days shorter. For limited cases, the average time to disposition for cases in the program group was 26 days shorter than in the control group and the median time to disposition was 6 days shorter. The results of regression analysis that accounted for case-type differences suggest that the average time to disposition in the program group was 40 days shorter than in the control group for both unlimited and limited cases.
• The shorter case disposition time for program-group cases in 2001 appeared to be
largely due to cases being ordered to mediation earlier, by an average of more than two months, compared to cases filed in 2000. The earlier time frame for mediation referrals in 2001 was in turn the result of a new early case management procedure adopted in 2001, which generally improved case processing for all general civil cases.
• For both unlimited and limited program-group cases, the pace of dispositions in the
program group outstripped that in the control group at about the time of the pilot program mediations, suggesting that the mediation contributed to shortening the time to disposition.
• The average disposition time for unlimited cases in the program group that settled at
mediation was 90 days shorter than the disposition time of like cases in the control group, and for unlimited cases that settled before mediation it was 144 days shorter than for like cases in the control group. Similarly, limited program-group cases that settled at or before pilot program mediations had an average disposition time that was 80 days shorter than the average for similar cases in the control group. Conversely, data suggests an increase of approximately 57 days in disposition time when unlimited program-group cases did not settle at mediation and 88 days when limited program-group cases did not settle at mediation compared to like cases in the control group. This highlights the importance of carefully selecting cases for referral to mediation.
• The program had a significant impact on disposition time in both limited and
unlimited automobile personal injury cases as well as other types of unlimited personal injury cases. Case disposition time for these case types in the program group was almost 50 days shorter than for cases in the control group.
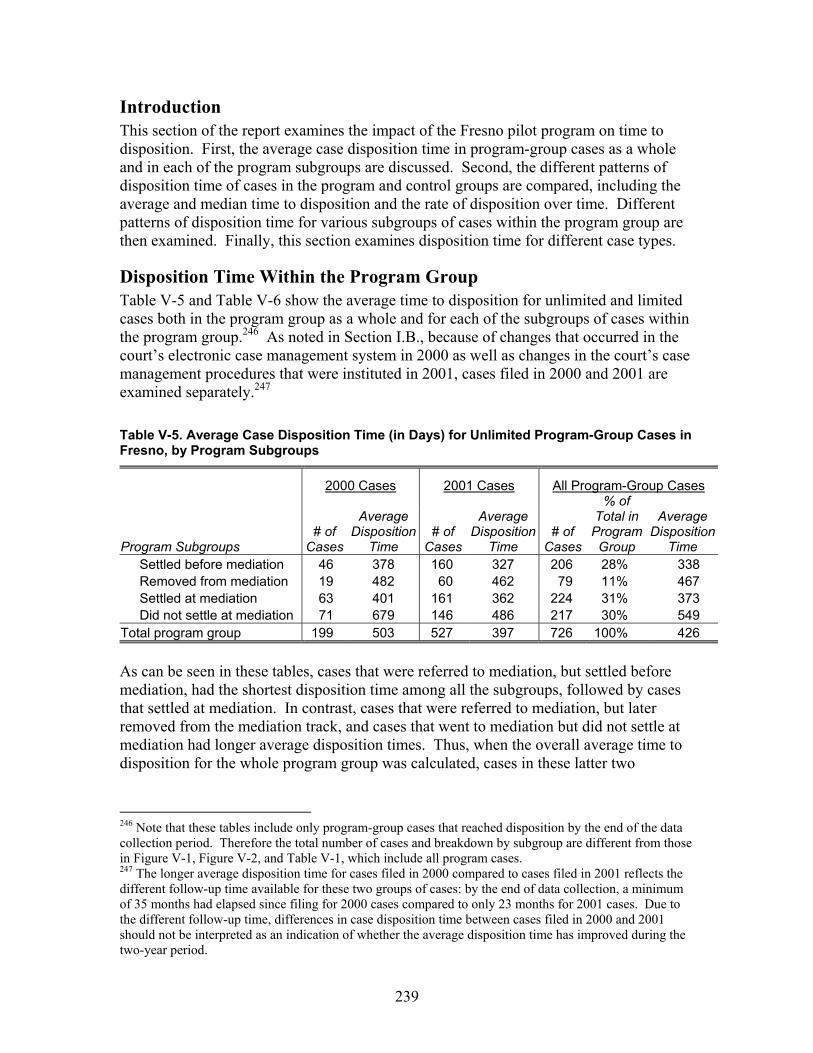
239
Introduction This section of the report examines the impact of the Fresno pilot program on time to disposition. First, the average case disposition time in program-group cases as a whole and in each of the program subgroups are discussed. Second, the different patterns of disposition time of cases in the program and control groups are compared, including the average and median time to disposition and the rate of disposition over time. Different patterns of disposition time for various subgroups of cases within the program group are then examined. Finally, this section examines disposition time for different case types.
Disposition Time Within the Program Group Table V-5 and Table V-6 show the average time to disposition for unlimited and limited cases both in the program group as a whole and for each of the subgroups of cases within the program group.246 As noted in Section I.B., because of changes that occurred in the court’s electronic case management system in 2000 as well as changes in the court’s case management procedures that were instituted in 2001, cases filed in 2000 and 2001 are examined separately.247 Table V-5. Average Case Disposition Time (in Days) for Unlimited Program-Group Cases in Fresno, by Program Subgroups
2000 Cases 2001 Cases All Program-Group Cases
Program Subgroups # of
Cases
Average
Disposition Time
# of Cases
Average
Disposition Time
# of Cases
% of Total in Program Group
Average Disposition
Time Settled before mediation 46 378 160 327 206 28% 338 Removed from mediation 19 482 60 462 79 11% 467 Settled at mediation 63 401 161 362 224 31% 373 Did not settle at mediation 71 679 146 486 217 30% 549
Total program group 199 503 527 397 726 100% 426 As can be seen in these tables, cases that were referred to mediation, but settled before mediation, had the shortest disposition time among all the subgroups, followed by cases that settled at mediation. In contrast, cases that were referred to mediation, but later removed from the mediation track, and cases that went to mediation but did not settle at mediation had longer average disposition times. Thus, when the overall average time to disposition for the whole program group was calculated, cases in these latter two
246 Note that these tables include only program-group cases that reached disposition by the end of the data collection period. Therefore the total number of cases and breakdown by subgroup are different from those in Figure V-1, Figure V-2, and Table V-1, which include all program cases. 247 The longer average disposition time for cases filed in 2000 compared to cases filed in 2001 reflects the different follow-up time available for these two groups of cases: by the end of data collection, a minimum of 35 months had elapsed since filing for 2000 cases compared to only 23 months for 2001 cases. Due to the different follow-up time, differences in case disposition time between cases filed in 2000 and 2001 should not be interpreted as an indication of whether the average disposition time has improved during the two-year period.
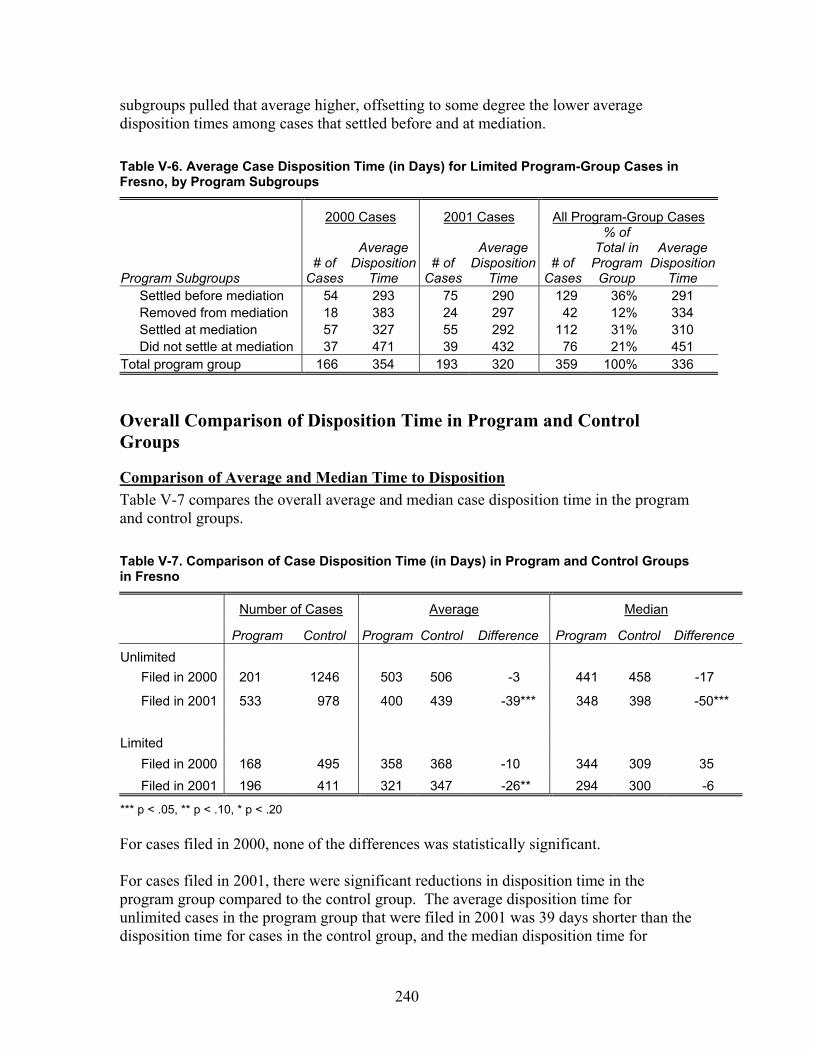
240
subgroups pulled that average higher, offsetting to some degree the lower average disposition times among cases that settled before and at mediation. Table V-6. Average Case Disposition Time (in Days) for Limited Program-Group Cases in Fresno, by Program Subgroups
2000 Cases 2001 Cases All Program-Group Cases
Program Subgroups # of
Cases
Average
Disposition Time
# of Cases
Average
Disposition Time
# of Cases
% of Total in Program Group
Average Disposition
Time Settled before mediation 54 293 75 290 129 36% 291 Removed from mediation 18 383 24 297 42 12% 334 Settled at mediation 57 327 55 292 112 31% 310 Did not settle at mediation 37 471 39 432 76 21% 451
Total program group 166 354 193 320 359 100% 336
Overall Comparison of Disposition Time in Program and Control Groups
Comparison of Average and Median Time to Disposition Table V-7 compares the overall average and median case disposition time in the program and control groups. Table V-7. Comparison of Case Disposition Time (in Days) in Program and Control Groups in Fresno
Number of Cases Average Median
Program Control Program Control Difference Program Control Difference Unlimited
Filed in 2000 201 1246 503 506 -3 441 458 -17
Filed in 2001 533 978 400 439 -39*** 348 398 -50*** Limited
Filed in 2000 168 495 358 368 -10 344 309 35 Filed in 2001 196 411 321 347 -26** 294 300 -6
*** p < .05, ** p < .10, * p < .20 For cases filed in 2000, none of the differences was statistically significant. For cases filed in 2001, there were significant reductions in disposition time in the program group compared to the control group. The average disposition time for unlimited cases in the program group that were filed in 2001 was 39 days shorter than the disposition time for cases in the control group, and the median disposition time for
241
program cases was 50 days shorter. The average time to disposition for limited program cases filed in 2001 was 26 days shorter than in the control group.248 As was noted above in the program description, for cases filed before May or June of 2001, the ADR Administrator tried to ensure that a variety of case types were referred to mediation. This resulted in there being a different proportion of some case types in the program and the control groups. As the average case disposition time tended to vary across different case types, the overall differences in case disposition time between the program and the control groups could be affected by the different proportion of case types in these groups. To isolate the impact of the program from these case type differences, regression analysis was done on time to disposition in the program and control groups, controlling for the case type.249 For cases filed in 2000, the regression analysis did not find a statistically significant difference in the average time to disposition between the program and control groups for either limited or unlimited cases. For cases filed in 2001, the regression analysis indicated, with a high degree of confidence, that the average disposition time for cases in the program group was 40 days shorter than in the control group for both limited and unlimited cases. At least two factors may help explain why a positive program impact on case disposition time was evident only for cases filed in 2001. First, 2000 was the first year of operation for Fresno’s pilot program and the first year of operation for any court-connected civil mediation program in Fresno. It seems likely that, without prior experience with a mediation program for general civil cases, an initial learning phase was required to streamline the various program procedures. As the process improved, the program impact may have increased. Both the ADR Administrator and attorneys in focus group discussions confirmed the occurrence of this initial learning phase. Second, and perhaps more significant, was the new case management procedure implemented by the court in October 2001 for all general civil cases filed starting in May or June 2001. Under the new procedure, a case management conference was scheduled approximately 120 days after filing. At this conference, the dates of various court events were assigned, including the dates for settlement conferences and trials. As discussed below, overall case-processing time improved significantly after the adoption of the new procedure and the mediation referrals and mediations occurred approximately two months earlier than they had in 2000 cases. It is also important to note that, for unlimited cases filed in 2001, the proportion of cases that had been disposed of in the program group by the end of the data collection period was significantly higher than that in the control group—85 percent of program-group 248 As noted in the section on data and methods above, a large number of pending cases was found in the case management system that showed no docket activities for more than a year. Using the assumption that all these cases had actually reached disposition as of the date of the last court event shown in the case management system, a separate comparison of the time to disposition in the program and control groups was done. The results for unlimited cases filed in 2001 remained largely unchanged. However, the difference in case disposition rate between the program and control groups for limited cases filed in 2001 was no longer present. 249 See also the comparison of the program and control groups broken down by case type below.
242
cases had been disposed of compared to 78 percent of control-group cases. Given the higher proportion of pending cases in the control group, average disposition time in the control group can be expected to increase more than in the program group when all cases have reached disposition. Thus, the gap in disposition time between the program and control group should grow even larger once all the 2000 and 2001 cases have reached disposition.
Comparison of Case Disposition Timing To better understand at what point in the litigation process the pilot program had its impact on the overall time to disposition, the patterns of case disposition rate over time from the filing of the complaint were examined. This analysis also provides information about whether the program impact on time to disposition occurred around the time when certain program elements, such as mediation referrals and mediations, generally took place. Figure V-5 compares the timing of case disposition in the program and control groups.250 The horizontal axis represent time (in months) from filing until disposition of a case, and the vertical axis represent the cumulative proportion of cases disposed (or disposition rate). The wider, purple line represents the program group disposition rate and the thinner, blue line the control group disposition rate. The gap between these two lines represents the difference in the disposition rates in the program group and control group at a given time from the filing of a complaint. The slope of the lines represents the pace at which cases were reaching disposition at a particular point in time; a steeper slope indicates more cases were reaching disposition at that time. Figure V-5 shows that for cases filed in 2000, the patterns of case disposition in the program and control groups were very similar. From filing to about 12 months after filing, the disposition rate in the program group lagged slightly behind that in the control group. After 12 months from filing, around the time when mediation took place, program-group cases were disposed of at a slightly higher rate than those in the control group. The overall pattern, however, was too similar to discern any significant program impact on case disposition time. The disposition pattern for program-group cases filed in 2001 was dramatically different. At approximately 10 months after filing, about the time when unlimited program-group cases filed that year began to go to mediation, the pace of dispositions in the program group increased to its highest level and the proportion of program-group cases disposed of began to outstrip that in the control group. The difference in disposition rate between the two groups was largest at approximately 14 months after filing, when 58 percent of unlimited cases in the program group had been disposed of, compared to approximately 41 percent in the control group. The quickening in the pace of dispositions at the time of the mediation supports the hypothesis that, for unlimited cases, participation in the program’s early mediation expedited the time to disposition. 250 As was done for the overall comparison of disposition time in the program and control groups, the analysis on timing of case disposition was also separated for 2000 and 2001.

243
Figure V-5. Disposition Rate Over Time in Unlimited and Limited Program- and Control-Group Cases in Fresno.
The patterns for limited cases were similar to those for unlimited cases. There were no significant differences between the program and control groups for cases filed in 2000, but for cases filed in 2001 the program group showed a higher disposition rate beginning about the time mediations took place. For cases filed in 2001, at approximately 9 months after filing, about the time when limited program cases went to mediation on average, the proportion of cases disposed of in the program group began to rise faster than in the control group. At 13 months after filing, approximately 12 percent more cases in the program group had been disposed of than in the control group.251 The higher disposition 251 The higher disposition rate shown here for limited cases in the program filed in 2001 could be exaggerated due to incomplete disposition data in the court’s case management system. A large number of pending cases in the case management system showed no docket activities for well over a year during the study period. The court staff in Fresno confirmed that some cases may have reached disposition but the disposition information might not have been properly entered into the case management system. To assess the impact of these cases on our analyses, a separate comparison was performed with all cases that had had no docket activities for more than 12 months coded as if they had been closed as of the date of the last coded court event. With these cases treated as closed, the difference in case disposition rate between the
Unlimited Cases Filed in 2000 Filed in 2001
Limited Cases
Program Group Control Group
0%
20%
40%
60%
80%
100%
1 4 7 10 13 16 19 22
Cum
ulat
ive
disp
ositi
on ra
teWent to mediation at 13 months
Referred to mediation at 7
months
0%
20%
40%
60%
80%
100%
1 4 7 10 13 16 19 22
Went to mediation at 10 months
Referred to mediation at 6
months
0%
20%
40%
60%
80%
100%
1 4 7 10 13 16 19 22
Month from filing
Cum
ulat
ive
disp
ositi
on ra
te
Went to mediation at 9 months
Referred to mediation at 5
months
0%
20%
40%
60%
80%
100%
1 4 7 10 13 16 19 22
Month from filing
Went to mediation at 9 months
Referred to mediation at
5 months
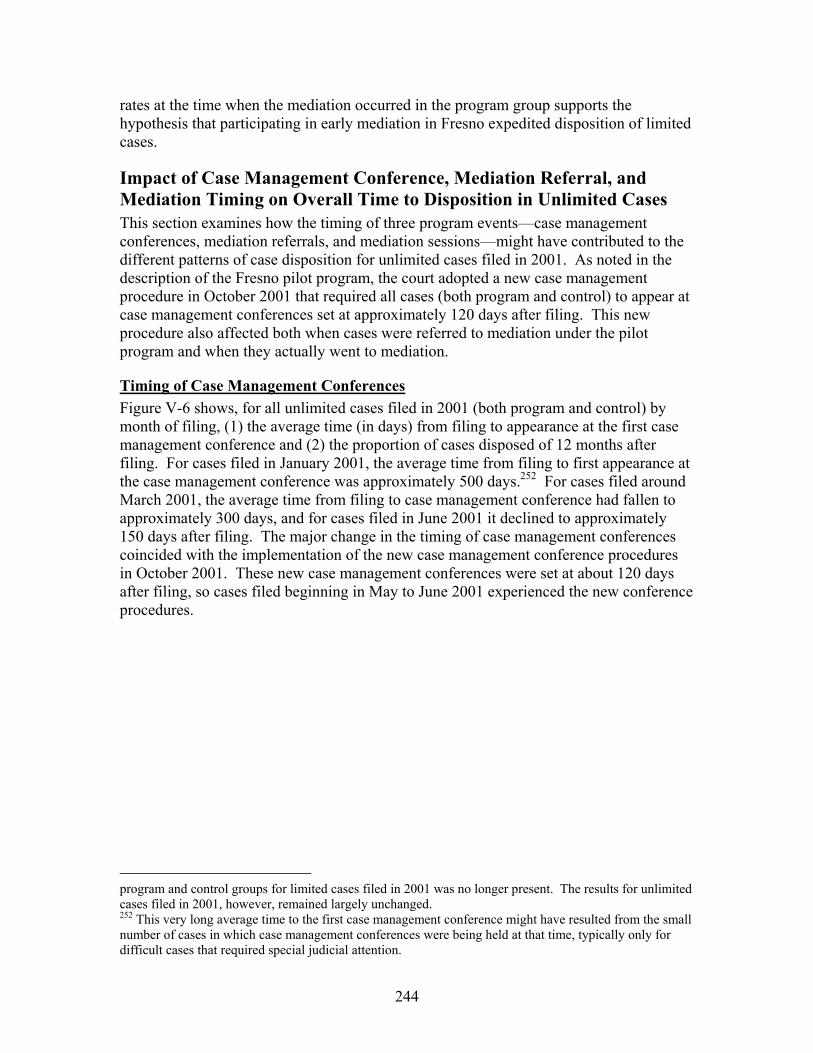
244
rates at the time when the mediation occurred in the program group supports the hypothesis that participating in early mediation in Fresno expedited disposition of limited cases.
Impact of Case Management Conference, Mediation Referral, and Mediation Timing on Overall Time to Disposition in Unlimited Cases This section examines how the timing of three program events—case management conferences, mediation referrals, and mediation sessions—might have contributed to the different patterns of case disposition for unlimited cases filed in 2001. As noted in the description of the Fresno pilot program, the court adopted a new case management procedure in October 2001 that required all cases (both program and control) to appear at case management conferences set at approximately 120 days after filing. This new procedure also affected both when cases were referred to mediation under the pilot program and when they actually went to mediation.
Timing of Case Management Conferences Figure V-6 shows, for all unlimited cases filed in 2001 (both program and control) by month of filing, (1) the average time (in days) from filing to appearance at the first case management conference and (2) the proportion of cases disposed of 12 months after filing. For cases filed in January 2001, the average time from filing to first appearance at the case management conference was approximately 500 days.252 For cases filed around March 2001, the average time from filing to case management conference had fallen to approximately 300 days, and for cases filed in June 2001 it declined to approximately 150 days after filing. The major change in the timing of case management conferences coincided with the implementation of the new case management conference procedures in October 2001. These new case management conferences were set at about 120 days after filing, so cases filed beginning in May to June 2001 experienced the new conference procedures. program and control groups for limited cases filed in 2001 was no longer present. The results for unlimited cases filed in 2001, however, remained largely unchanged. 252 This very long average time to the first case management conference might have resulted from the small number of cases in which case management conferences were being held at that time, typically only for difficult cases that required special judicial attention.
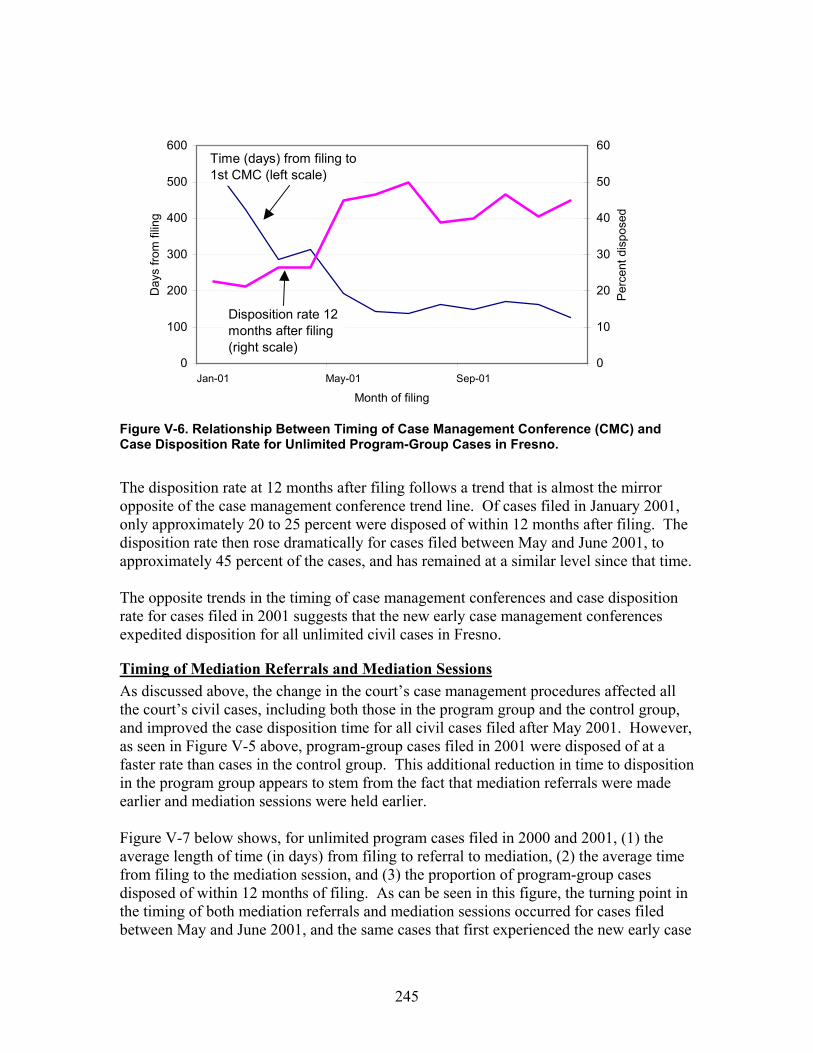
245
Figure V-6. Relationship Between Timing of Case Management Conference (CMC) and Case Disposition Rate for Unlimited Program-Group Cases in Fresno.
The disposition rate at 12 months after filing follows a trend that is almost the mirror opposite of the case management conference trend line. Of cases filed in January 2001, only approximately 20 to 25 percent were disposed of within 12 months after filing. The disposition rate then rose dramatically for cases filed between May and June 2001, to approximately 45 percent of the cases, and has remained at a similar level since that time. The opposite trends in the timing of case management conferences and case disposition rate for cases filed in 2001 suggests that the new early case management conferences expedited disposition for all unlimited civil cases in Fresno.
Timing of Mediation Referrals and Mediation Sessions As discussed above, the change in the court’s case management procedures affected all the court’s civil cases, including both those in the program group and the control group, and improved the case disposition time for all civil cases filed after May 2001. However, as seen in Figure V-5 above, program-group cases filed in 2001 were disposed of at a faster rate than cases in the control group. This additional reduction in time to disposition in the program group appears to stem from the fact that mediation referrals were made earlier and mediation sessions were held earlier. Figure V-7 below shows, for unlimited program cases filed in 2000 and 2001, (1) the average length of time (in days) from filing to referral to mediation, (2) the average time from filing to the mediation session, and (3) the proportion of program-group cases disposed of within 12 months of filing. As can be seen in this figure, the turning point in the timing of both mediation referrals and mediation sessions occurred for cases filed between May and June 2001, and the same cases that first experienced the new early case
0
100
200
300
400
500
600
Jan-01 May-01 Sep-01
Month of filing
Day
s fro
m fi
ling
0
10
20
30
40
50
60
Per
cent
dis
pose
d
Disposition rate 12 months after filing (right scale)
Time (days) from filing to 1st CMC (left scale)
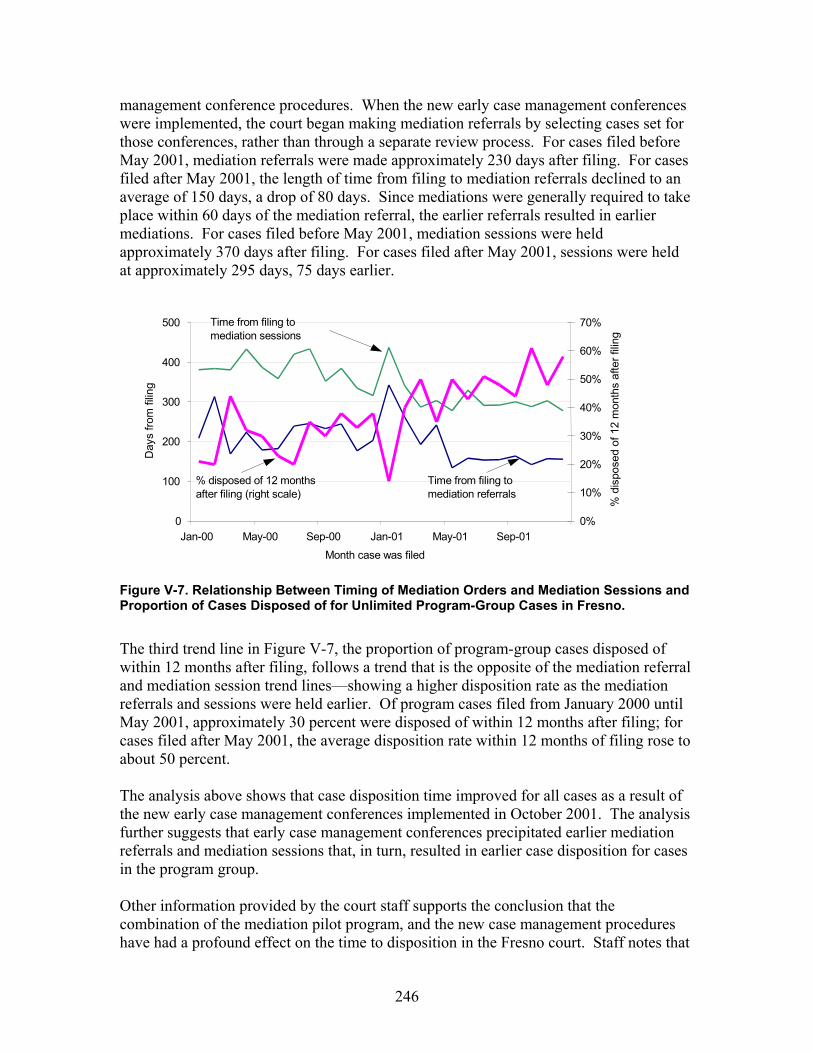
246
management conference procedures. When the new early case management conferences were implemented, the court began making mediation referrals by selecting cases set for those conferences, rather than through a separate review process. For cases filed before May 2001, mediation referrals were made approximately 230 days after filing. For cases filed after May 2001, the length of time from filing to mediation referrals declined to an average of 150 days, a drop of 80 days. Since mediations were generally required to take place within 60 days of the mediation referral, the earlier referrals resulted in earlier mediations. For cases filed before May 2001, mediation sessions were held approximately 370 days after filing. For cases filed after May 2001, sessions were held at approximately 295 days, 75 days earlier.
Figure V-7. Relationship Between Timing of Mediation Orders and Mediation Sessions and Proportion of Cases Disposed of for Unlimited Program-Group Cases in Fresno.
The third trend line in Figure V-7, the proportion of program-group cases disposed of within 12 months after filing, follows a trend that is the opposite of the mediation referral and mediation session trend lines—showing a higher disposition rate as the mediation referrals and sessions were held earlier. Of program cases filed from January 2000 until May 2001, approximately 30 percent were disposed of within 12 months after filing; for cases filed after May 2001, the average disposition rate within 12 months of filing rose to about 50 percent. The analysis above shows that case disposition time improved for all cases as a result of the new early case management conferences implemented in October 2001. The analysis further suggests that early case management conferences precipitated earlier mediation referrals and mediation sessions that, in turn, resulted in earlier case disposition for cases in the program group. Other information provided by the court staff supports the conclusion that the combination of the mediation pilot program, and the new case management procedures have had a profound effect on the time to disposition in the Fresno court. Staff notes that
0
100
200
300
400
500
Jan-00 May-00 Sep-00 Jan-01 May-01 Sep-01
Month case was filed
Day
s fro
m fi
ling
0%
10%
20%
30%
40%
50%
60%
70%
% d
ispo
sed
of 1
2 m
onth
s af
ter f
iling
Time from filing to mediation referrals
Time from filing to mediation sessions
% disposed of 12 months after filing (right scale)
247
the court’s civil case backlog has now been virtually eliminated. At the beginning of 2003, there were approximately 120 cases ready for trial for which no courtroom was available. All of these cases had to be continued, delaying disposition. As of the end of 2003, the court anticipates that there will be fewer than 20 cases ready for trial that remain pending on the court’s calendar.
Analysis of Subgroups Within the Program Group As discussed above in the section on methods, to better understand how different cases within the program were influenced by the elements of the pilot program that they experienced, the disposition time of cases in each of the subgroups within the program group was compared to the disposition time of similar cases in the control group.253 The results of this comparison suggest that the pilot program reduced the time to disposition for both unlimited and limited program cases that settled at or before mediation. Unlimited program-group cases that settled at pilot program mediations had an average disposition time that was 90 days shorter than the average for similar cases in the control group, and program-group cases that settled before mediation had an average disposition time that was 144 days shorter. Similarly, limited program-group cases that settled at or before pilot program mediations had an average disposition time that was 80 days shorter than the average for similar cases in the control group. The comparison also found evidence that not settling at the pilot program mediation resulted in a longer disposition time. Unlimited program-group cases that were mediated under the pilot program but did not settle at the mediation had an average disposition time that was 57 days longer than the average for similar cases in the control group. Similarly, limited cases in the program group that did not settle at mediation had an average disposition time that was 88 days longer than similar cases in the control group. Overall, these regression results support the conclusion that cases are disposed of more quickly than they otherwise would have been when they are resolved at or before mediation, but that it takes even longer to reach disposition if cases do not resolve at mediation than it would have if the cases had not been mediated at all. These findings make intuitive sense. When mediations are conducted relatively early and cases are settled at or before those early mediations, one would expect that the average time to disposition for those settled cases would be reduced when compared to similar cases that were not mediated and settled under the pilot program. It also makes sense that, on average, it generally takes longer to reach disposition in program-group cases that do not settle at mediation compared to similar cases that were not in the program group. These program-group cases essentially took a detour off the litigation path to participate in mediation and then came back to the litigation path when the cases did not settle at mediation; it is understandable that this detour took some additional time. This finding highlights the importance of trying to carefully select cases for referral to mediation. It is important to note, however, that the increases in average disposition time in cases that did not settle at mediation did not outweigh the positive impact that the pilot program had on
253 These subgroup comparisons were made using the regression analysis method described in Section I.B.
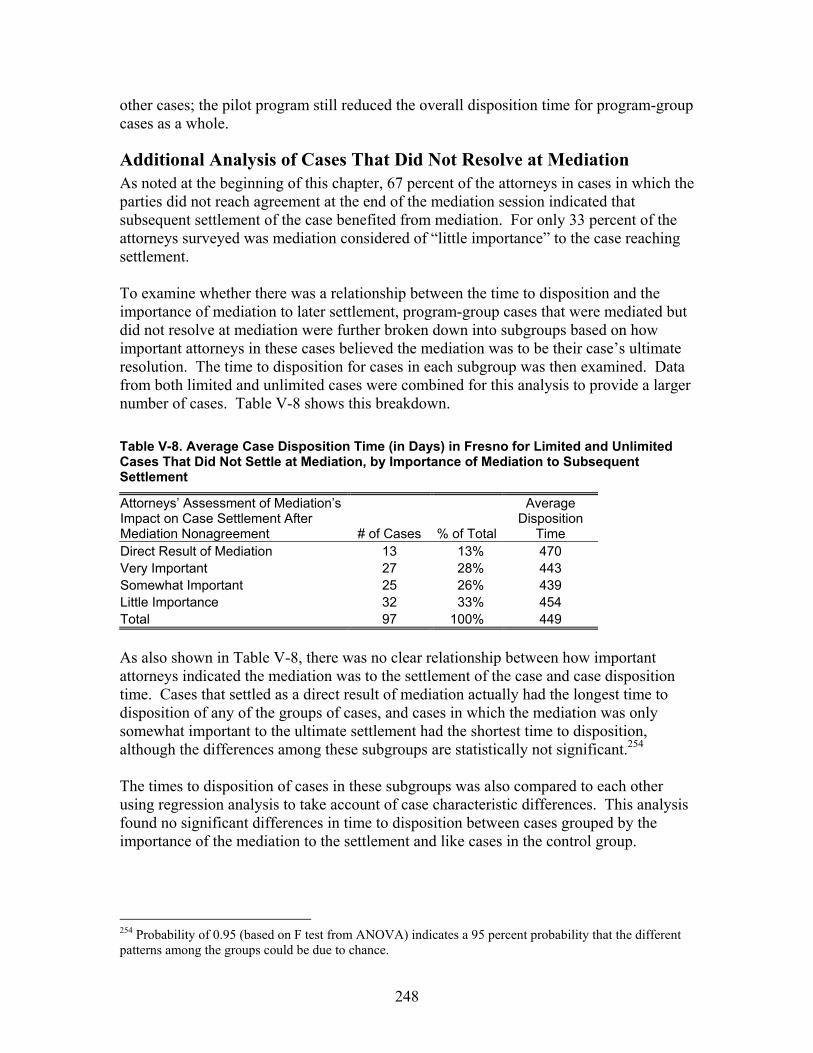
248
other cases; the pilot program still reduced the overall disposition time for program-group cases as a whole.
Additional Analysis of Cases That Did Not Resolve at Mediation As noted at the beginning of this chapter, 67 percent of the attorneys in cases in which the parties did not reach agreement at the end of the mediation session indicated that subsequent settlement of the case benefited from mediation. For only 33 percent of the attorneys surveyed was mediation considered of “little importance” to the case reaching settlement. To examine whether there was a relationship between the time to disposition and the importance of mediation to later settlement, program-group cases that were mediated but did not resolve at mediation were further broken down into subgroups based on how important attorneys in these cases believed the mediation was to be their case’s ultimate resolution. The time to disposition for cases in each subgroup was then examined. Data from both limited and unlimited cases were combined for this analysis to provide a larger number of cases. Table V-8 shows this breakdown. Table V-8. Average Case Disposition Time (in Days) in Fresno for Limited and Unlimited Cases That Did Not Settle at Mediation, by Importance of Mediation to Subsequent Settlement
Attorneys’ Assessment of Mediation’s Impact on Case Settlement After Mediation Nonagreement # of Cases % of Total
Average Disposition
Time Direct Result of Mediation 13 13% 470 Very Important 27 28% 443 Somewhat Important 25 26% 439 Little Importance 32 33% 454 Total 97 100% 449 As also shown in Table V-8, there was no clear relationship between how important attorneys indicated the mediation was to the settlement of the case and case disposition time. Cases that settled as a direct result of mediation actually had the longest time to disposition of any of the groups of cases, and cases in which the mediation was only somewhat important to the ultimate settlement had the shortest time to disposition, although the differences among these subgroups are statistically not significant.254 The times to disposition of cases in these subgroups was also compared to each other using regression analysis to take account of case characteristic differences. This analysis found no significant differences in time to disposition between cases grouped by the importance of the mediation to the settlement and like cases in the control group.
254 Probability of 0.95 (based on F test from ANOVA) indicates a 95 percent probability that the different patterns among the groups could be due to chance.
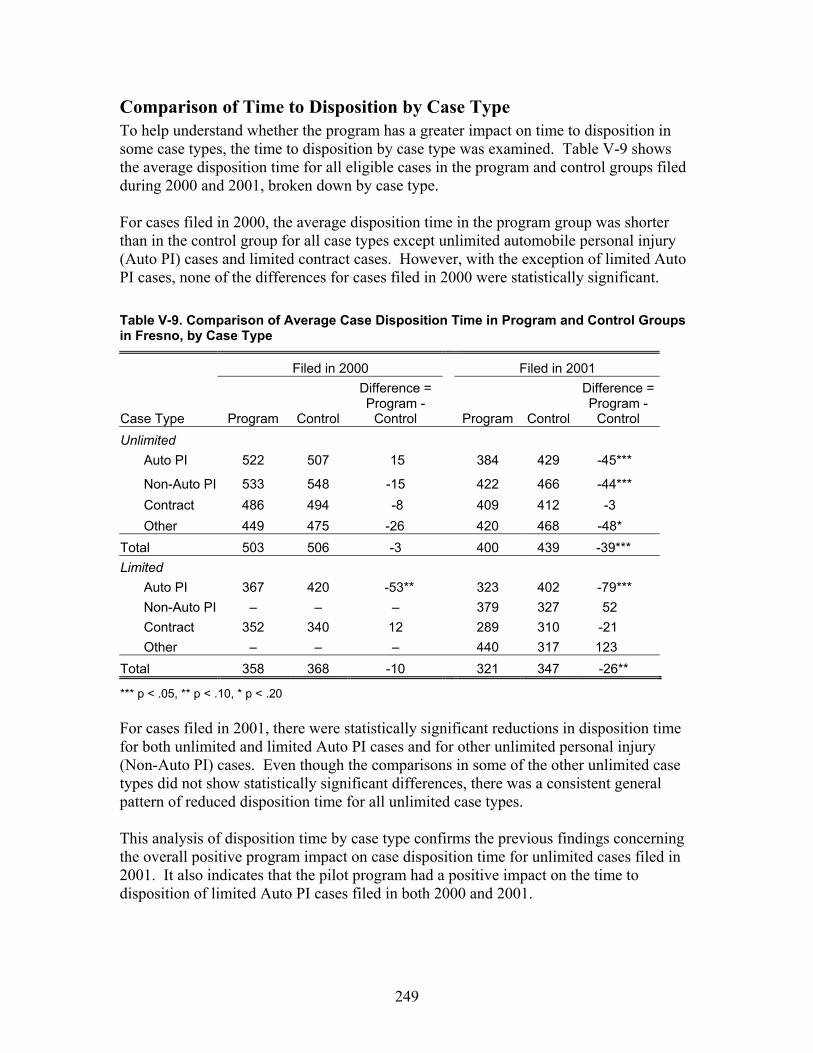
249
Comparison of Time to Disposition by Case Type To help understand whether the program has a greater impact on time to disposition in some case types, the time to disposition by case type was examined. Table V-9 shows the average disposition time for all eligible cases in the program and control groups filed during 2000 and 2001, broken down by case type. For cases filed in 2000, the average disposition time in the program group was shorter than in the control group for all case types except unlimited automobile personal injury (Auto PI) cases and limited contract cases. However, with the exception of limited Auto PI cases, none of the differences for cases filed in 2000 were statistically significant. Table V-9. Comparison of Average Case Disposition Time in Program and Control Groups in Fresno, by Case Type
Filed in 2000 Filed in 2001
Case Type Program Control
Difference = Program -
Control Program Control
Difference = Program -
Control Unlimited
Auto PI 522 507 15 384 429 -45***
Non-Auto PI 533 548 -15 422 466 -44*** Contract 486 494 -8 409 412 -3 Other 449 475 -26 420 468 -48*
Total 503 506 -3 400 439 -39*** Limited
Auto PI 367 420 -53** 323 402 -79*** Non-Auto PI – – – 379 327 52 Contract 352 340 12 289 310 -21 Other – – – 440 317 123
Total 358 368 -10 321 347 -26**
*** p < .05, ** p < .10, * p < .20 For cases filed in 2001, there were statistically significant reductions in disposition time for both unlimited and limited Auto PI cases and for other unlimited personal injury (Non-Auto PI) cases. Even though the comparisons in some of the other unlimited case types did not show statistically significant differences, there was a consistent general pattern of reduced disposition time for all unlimited case types. This analysis of disposition time by case type confirms the previous findings concerning the overall positive program impact on case disposition time for unlimited cases filed in 2001. It also indicates that the pilot program had a positive impact on the time to disposition of limited Auto PI cases filed in both 2000 and 2001.
250
Conclusion There is strong evidence that the Fresno pilot program had a positive impact on case disposition time. The impact was more pronounced, however, for cases filed during 2001, the second year of the pilot program’s operation, than for cases filed during 2000. For cases filed in 2001, based upon regression analysis results, the average time to disposition in the program group was 40 days shorter for both limited and unlimited cases than in the control group. Several factors may have led to the more pronounced program impact for cases filed in 2001. Given that 2000 was the first year of the pilot program’s operation, an initial learning phase may have been required to streamline the various program procedures. As the process improved, benefits of the program emerged. Both the program administrator and attorneys in focus group discussions confirmed this initial learning process. Perhaps more significant, however, was the new case management procedure implemented by the court in October 2001 for all general civil cases. The data shows that case-processing time for all cases in the court improved significantly after the adoption of the new procedure. Furthermore, it appears that the new procedure helped reduce case disposition time for unlimited cases in the program group even further by shortening the time from filing to mediation referrals and mediation sessions. This combination also appears to have helped the court eliminate its civil case backlog. For both unlimited and limited program-group cases, the pace of dispositions in the program group outstripped that in the control group about the time when the pilot program mediations took place on average, suggesting that the mediation contributed to shortening the time to disposition. The data also suggests that the overall impact of the mediation pilot program on time to disposition depended on whether cases settled at the mediation. With case characteristics controlled for, the data suggests that both unlimited and limited cases that settled at mediation had a significantly shorter disposition time compared to like cases in the control group. On the other hand, the data also suggests that disposition time for both limited and unlimited cases were increased when the case did not reach settlement at mediation. This finding suggests the importance of trying to identify and refer to mediation those cases most amenable to settlement in an early mediation process.

251
H. Impact of Fresno’s Pilot Program on Litigant Satisfaction
Summary of Findings The pilot program in Fresno increased attorney satisfaction with both the court’s services and with the litigation process, and settling at mediation significantly increased attorney satisfaction with the outcome, the litigation process, and the court’s services. • Both parties and attorneys in the Fresno program expressed high satisfaction when
they used mediation under the pilot program. They were particularly satisfied with the performance of the mediators, with both parties and attorneys showing an average satisfaction score of approximately 6 or more on a 7-point scale. They also strongly agreed that the mediator and the mediation process were fair and that they would recommend both to others.
• Attorneys in program-group cases were more satisfied with both the litigation process
and with services provided by the court than attorneys in control-group cases. • Attorneys in both unlimited and limited program-group cases that settled at early
mediation were significantly more satisfied with the outcome of the case, their litigation experience, and the services provided by the court compared to attorneys in like cases in the control group.
• While attorneys whose cases did not settle at mediation were less satisfied with the
outcome of the case, they were still more satisfied with both the litigation process and with the services provided by the court than attorneys in similar control-group cases. This suggests that participating in mediation increased attorneys’ satisfaction with both the litigation process and the court’s services, regardless of whether their cases settled at mediation.
• Attorneys in unlimited automobile personal injury cases in the program group were
more satisfied with all aspects of their experience—the case outcome, the litigation process, and the court’s services—than attorneys in such cases in the control group. Attorneys in other unlimited personal injury cases and limited contract cases were also significantly more satisfied with the court’s services.
Introduction This section examines the impact of Fresno’s pilot program on litigant satisfaction. As described in detail in Section I.B., data on litigant satisfaction were collected in two ways. First, in a survey administered at the end of the mediation in cases that went to mediation between July 2001 and June 2002 (postmediation survey), both parties and attorneys were asked about their satisfaction with various aspects of their mediation and litigation experiences. Second, in a separate survey administered shortly after cases reached disposition in cases disposed of between July 2001 and June 2002
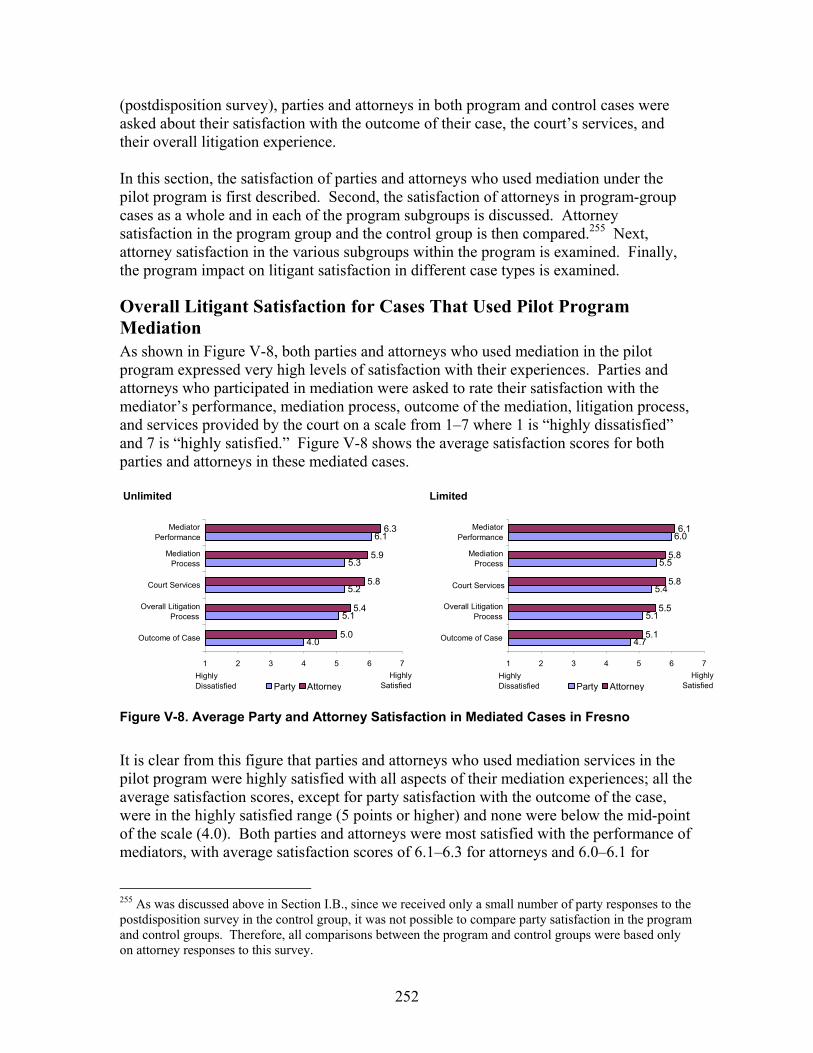
252
(postdisposition survey), parties and attorneys in both program and control cases were asked about their satisfaction with the outcome of their case, the court’s services, and their overall litigation experience. In this section, the satisfaction of parties and attorneys who used mediation under the pilot program is first described. Second, the satisfaction of attorneys in program-group cases as a whole and in each of the program subgroups is discussed. Attorney satisfaction in the program group and the control group is then compared.255 Next, attorney satisfaction in the various subgroups within the program is examined. Finally, the program impact on litigant satisfaction in different case types is examined.
Overall Litigant Satisfaction for Cases That Used Pilot Program Mediation As shown in Figure V-8, both parties and attorneys who used mediation in the pilot program expressed very high levels of satisfaction with their experiences. Parties and attorneys who participated in mediation were asked to rate their satisfaction with the mediator’s performance, mediation process, outcome of the mediation, litigation process, and services provided by the court on a scale from 1–7 where 1 is “highly dissatisfied” and 7 is “highly satisfied.” Figure V-8 shows the average satisfaction scores for both parties and attorneys in these mediated cases.
Figure V-8. Average Party and Attorney Satisfaction in Mediated Cases in Fresno
It is clear from this figure that parties and attorneys who used mediation services in the pilot program were highly satisfied with all aspects of their mediation experiences; all the average satisfaction scores, except for party satisfaction with the outcome of the case, were in the highly satisfied range (5 points or higher) and none were below the mid-point of the scale (4.0). Both parties and attorneys were most satisfied with the performance of mediators, with average satisfaction scores of 6.1–6.3 for attorneys and 6.0–6.1 for
255 As was discussed above in Section I.B., since we received only a small number of party responses to the postdisposition survey in the control group, it was not possible to compare party satisfaction in the program and control groups. Therefore, all comparisons between the program and control groups were based only on attorney responses to this survey.
Unlimited Limited
4.0
5.1
5.2
5.3
6.1
5.0
5.4
5.8
5.9
6.3
1 2 3 4 5 6 7
Outcome of Case
Overall Litigation Process
Court Services
Mediation Process
Mediator Performance
Party AttorneyHighly
SatisfiedHighly Dissatisfied
4.7
5.1
5.4
5.5
6.0
5.1
5.5
5.8
5.8
6.1
1 2 3 4 5 6 7
Outcome of Case
Overall LitigationProcess
Court Services
MediationProcess
MediatorPerformance
Party Attorney Highly
SatisfiedHighly Dissatisfied
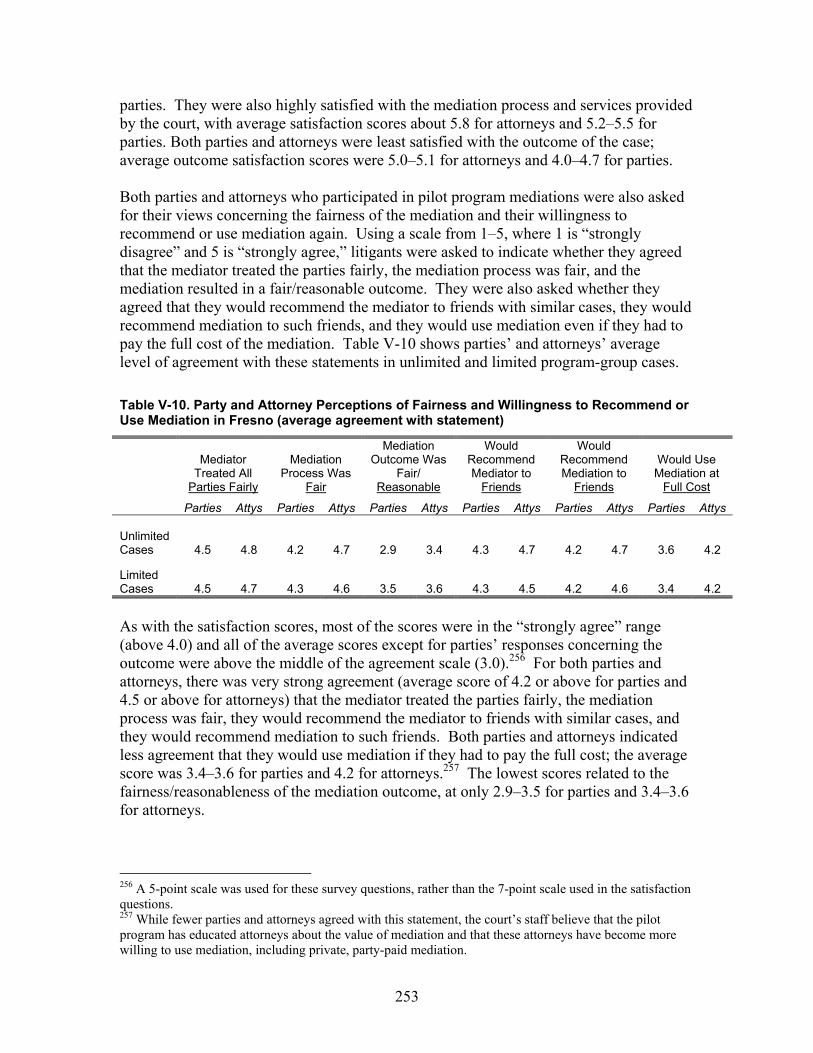
253
parties. They were also highly satisfied with the mediation process and services provided by the court, with average satisfaction scores about 5.8 for attorneys and 5.2–5.5 for parties. Both parties and attorneys were least satisfied with the outcome of the case; average outcome satisfaction scores were 5.0–5.1 for attorneys and 4.0–4.7 for parties. Both parties and attorneys who participated in pilot program mediations were also asked for their views concerning the fairness of the mediation and their willingness to recommend or use mediation again. Using a scale from 1–5, where 1 is “strongly disagree” and 5 is “strongly agree,” litigants were asked to indicate whether they agreed that the mediator treated the parties fairly, the mediation process was fair, and the mediation resulted in a fair/reasonable outcome. They were also asked whether they agreed that they would recommend the mediator to friends with similar cases, they would recommend mediation to such friends, and they would use mediation even if they had to pay the full cost of the mediation. Table V-10 shows parties’ and attorneys’ average level of agreement with these statements in unlimited and limited program-group cases. Table V-10. Party and Attorney Perceptions of Fairness and Willingness to Recommend or Use Mediation in Fresno (average agreement with statement)
Mediator Treated All
Parties Fairly
Mediation Process Was
Fair
Mediation Outcome Was
Fair/ Reasonable
Would Recommend Mediator to
Friends
Would Recommend Mediation to
Friends
Would Use Mediation at
Full Cost
Parties Attys Parties Attys Parties Attys Parties Attys Parties Attys Parties Attys
Unlimited Cases 4.5 4.8 4.2 4.7 2.9 3.4 4.3 4.7 4.2 4.7 3.6 4.2
Limited Cases 4.5 4.7 4.3 4.6 3.5 3.6 4.3 4.5 4.2 4.6 3.4 4.2
As with the satisfaction scores, most of the scores were in the “strongly agree” range (above 4.0) and all of the average scores except for parties’ responses concerning the outcome were above the middle of the agreement scale (3.0).256 For both parties and attorneys, there was very strong agreement (average score of 4.2 or above for parties and 4.5 or above for attorneys) that the mediator treated the parties fairly, the mediation process was fair, they would recommend the mediator to friends with similar cases, and they would recommend mediation to such friends. Both parties and attorneys indicated less agreement that they would use mediation if they had to pay the full cost; the average score was 3.4–3.6 for parties and 4.2 for attorneys.257 The lowest scores related to the fairness/reasonableness of the mediation outcome, at only 2.9–3.5 for parties and 3.4–3.6 for attorneys.
256 A 5-point scale was used for these survey questions, rather than the 7-point scale used in the satisfaction questions. 257 While fewer parties and attorneys agreed with this statement, the court’s staff believe that the pilot program has educated attorneys about the value of mediation and that these attorneys have become more willing to use mediation, including private, party-paid mediation.
254
It is clear from the responses to both these sets of questions that while parties and attorneys were generally very pleased with their mediation experiences, overall they were less pleased or neutral in terms of the outcome of the mediation process (in fact, on both outcome questions, about 25 percent of the parties and attorneys responded that they were neutral). In evaluating this result, it is important to remember that this survey was administered at the end of the mediation and that in a large proportion of cases a settlement was not reached at the end of the mediation. Not surprisingly, the way parties and attorneys responded to the two outcome questions depended largely on whether their cases settled at mediation. Average satisfaction with the outcome in program-group cases that settled at mediation was 6.00 for attorneys and 5.20 for parties on a 7-point scale, approximately 50 percent higher than the average scores of 4.08 for attorneys and 3.34 for parties in cases that did not settle at mediation. Similarly, responses concerning the fairness/reasonableness of the outcome averaged approximately 60 percent higher for both attorneys (4.28 compared to 2.66 on a 5-point scale) and parties (3.83 compared to 2.41) in cases settled at mediation than in cases that did not settle at mediation. When the scores in both cases settled and not settled at mediation were added together to calculate the overall average, the higher scores in cases that settled were offset by those in cases that did not, pulling the overall average score for satisfaction with the outcome toward the lower. It is also clear from the responses to both these sets of questions that while both parties and attorneys were generally very pleased with their pilot program mediation experiences, attorneys were more pleased than parties. Attorneys’ average scores were consistently higher than those for parties on all of these questions. The gap between attorney and party satisfaction scores ranged from 0.1 for mediator performance in limited cases to 1.0 for outcome of the case in unlimited cases. The higher attorney satisfaction may reflect a greater understanding on the part of attorneys about what to expect from the mediation process. Many attorneys are likely to have participated in mediations before, so they are likely to have been familiar with the mediation process and to have based their expectations about the process on this knowledge. Parties are less likely to have participated in previous mediations and may not have known what to expect from the mediation process. This may suggest the need for additional educational efforts targeted at parties, rather than attorneys. The higher scores for attorneys may also, in part, reflect the fact that attorneys’ and parties’ satisfaction was associated with different aspects of their mediation experiences. Attorneys’ responses on only four of the survey questions were strongly correlated with their responses concerning satisfaction with the mediation process—whether they believed the mediation process was fair, whether they believed the mediation resulted in a fair/reasonable outcome, whether they believed the mediation helped move the case toward resolution quickly, and whether they believed the mediator treated all parties fairly.258 In contrast, parties’ satisfaction with the mediation process was also strongly or
258 Correlation measures how strongly two variables are associated with each other, i.e., when one of the variables changes, how likely is the other to change (this does not necessarily mean that the change in one caused the change in the other, but just that they tend to move together). Correlation coefficients range from -1 to 1; a value of 0 means that there was no relationship between the variable, a value of 1 means
255
moderately correlated with whether they believed that they had had an adequate opportunity to tell their side of the story during the mediation, that the mediation helped improve communication between the parties, that the mediation helped preserve the parties’ relationship, and that the cost of using mediation was affordable.259 For attorneys, responses to only two of the survey questions were strongly correlated with attorneys’ responses regarding satisfaction with the outcome of the mediation—whether they believed the mediation resulted in a fair/reasonable outcome and that the mediation helped move the case toward resolution quickly.260 In contrast, parties’ satisfaction with the mediation outcome was also strongly or moderately correlated with whether they believed that the mediation helped improve communication between the parties, that the cost of using mediation was affordable, that the mediation helped preserve the parties’ relationship, and that the mediation process was fair.261 Finally, for attorneys, responses to only one of the survey questions was even moderately correlated with attorneys’ responses regarding satisfaction with the courts’ services—whether they believed the mediation resulted in a fair/reasonable outcome.262 Only three attorney responses were moderately correlated with satisfaction with the overall litigation process—whether they believed that the mediation helped improve communication between the parties, that the mediation helped move the case toward resolution quickly, and that the mediation resulted in a fair/reasonable outcome.263 In contrast, parties’ satisfaction with the litigation process was also correlated with whether they believed that the mediation helped preserve the parties’ relationship, that the cost of using mediation was affordable, and that the mediation process was fair.264 Similarly, parties’ satisfaction with the court services was correlated with whether they believed that the mediation helped improve communication between the parties, that the mediation helped preserve the parties’ relationship, that the mediation helped move the case toward resolution
there was a total positive relationship (when one variable changes, the other always changes in the same direction), and a value of -1 means a total negative relationship (when one changes, the other always changes in the opposite direction). A correlation coefficient of .5 or above is considered to show a high correlation. The correlation coefficients of these questions with attorneys’ satisfaction with the mediation process were .58 and .66, .51 and .47, .51 and .40, and .48 and .65, respectively in unlimited and limited cases. 259The correlation coefficients of these questions with parties’ satisfaction with the mediation process were .42 and .43, .54 and .60, .42 and .48, and .53 and .66, respectively in unlimited and limited cases. 260The correlation coefficients of these questions with attorneys’ satisfaction with the outcome were .76 and .81, and .70 and .70, respectively in unlimited and limited cases. 261The correlation coefficients of these questions with parties’ satisfaction with the outcome were .59 and .48, .44 and .57, .73 and .62, and .37 and .57, respectively in unlimited and limited cases. 262 The correlation coefficient of this question with attorneys’ satisfaction with the court’s services was .43 and .27, respectively in unlimited and limited cases. 263 The correlation coefficients of this question with attorneys’ satisfaction with the litigation process were .38 and .48, .42 and .21, and .43 and .34, respectively in unlimited and limited cases. 264The correlation coefficients of these questions with parties’ satisfaction with the litigation process were .36 and .41, .44 and .56, .53 and .59, respectively in unlimited and limited cases.

256
quickly, that the cost of using mediation was affordable, that the mediation process was fair, and that the mediator was fair.265 All of this indicates that parties’ satisfaction with both the court and with the mediation was much more closely associated than attorneys’ satisfaction with what happened within the mediation process—whether they felt heard and whether they felt the mediation helped their communication or relationship with the other party—and with whether they believed that the cost of mediation was affordable. While most parties indicated that they had had an adequate opportunity to tell their story in the mediation (86 percent gave responses that were above the neutral point on the scale), fewer parties thought that the mediation had improved the communication between the parties (58 percent) or preserved the parties’ relationship (31 percent)266 and fewer thought that the cost of mediation was affordable (58 percent). These perceptions may therefore have contributed to parties’ satisfaction scores being lower than those of attorneys.
Satisfaction Within the Program Group Table V-11 shows the average satisfaction scores for attorneys in unlimited program-group cases as a whole and for each of the subgroups of cases within the program group. Table V-12 shows the same information for limited program-group cases. Unlike for time to disposition, however, the data on litigant satisfaction is derived from attorney responses to surveys, not from the court’s case management system, so the total number of cases for which satisfaction information is available is smaller. When this data was broken down into subgroups, the number of cases that were removed from mediation was too small to provide reliable information,267so that subgroup is not shown in the tables. Table V-11. Average Attorney Satisfaction in Unlimited Program-Group Cases in Fresno, by Program Subgroup
Number of
RespondentsCase
Outcome
Overall Litigation Process
Court Services
Settled before mediation 61 5.0 4.9 5.0 Settled at mediation 157 6.0 5.8 6.2 Did not settle at mediation 245 4.4 5.1 5.5
Total Program Group* 466 5.0 5.3 5.7 Note: Sample sizes vary slightly for each satisfaction measure. *Includes 3 cases removed from the mediation track. As might have been expected, attorneys in cases that settled at mediation consistently expressed the highest level of satisfaction on all three measures—case outcome, litigation process, and services provided by the courts. Thus, when the overall average satisfaction 265The correlation coefficients of these questions with parties’ satisfaction with the courts’ services were .37 and .44, .29 and .42, .44 and .51, .53 and .60, .49 and .58, and .40 and .45, respectively in unlimited and limited cases. 266 Note that in many types of cases, such as Auto PI cases, this simply many not have been relevant; 41 percent of parties and 57 percent of attorneys gave the neutral response to this question. 267 There were only three unlimited cases and eight limited cases in the program group that were removed from mediation for which survey data was available.

257
scores for unlimited cases in the program group were calculated, cases in this subgroup pulled those average satisfaction levels higher. Table V-12. Average Attorney Satisfaction in Limited Program-Group Cases in Fresno, by Program Subgroup
Number of
RespondentsCase
Outcome
Overall Litigation Process
Court Services
Settled before mediation 29 5.0 4.8 5.0 Settled at mediation 64 5.8 5.6 5.8 Did not settle at mediation 94 4.4 5.3 5.6
Total Program Group* 195 5.0 5.3 5.6 Note: Sample sizes vary slightly for each satisfaction measure. *Includes 8 cases removed from the mediation track. Attorneys whose cases did not settle at mediation had the lowest average satisfaction scores with the outcome of the case. Thus, when the overall average scores for satisfaction with the outcome in the program group were calculated, the lower satisfaction scores in cases that did not settle at mediation pulled the average satisfaction with outcome lower. In contrast, it was in cases that settled before mediation that attorneys expressed the lowest average satisfaction with both the litigation process and the services provided by the court. Thus, when the overall average scores for satisfaction with the outcome in the program group were calculated, the lower satisfaction scores in cases that settled before mediation pulled the average satisfaction with the litigation process and the court’s services lower.
Overall Comparison of Satisfaction in Program and Control Groups Table V-13 compares the average satisfaction scores of attorneys in the program and control groups concerning the outcome of their cases, the overall litigation process, and the services provided by the court. The pilot program had a positive impact on overall attorney satisfaction with the litigation process and with the services provided by the court in both unlimited and limited cases. Attorneys in the program group had an average satisfaction score of 5.3 with the litigation process compared to the average score of 5.0 in the control group; the .3 difference was statistically significant. There was an even greater impact on satisfaction with the services provided by the court. The average satisfaction score in the program group was 5.7 for unlimited cases and 5.6 for limited cases compared to 5.0 for unlimited cases and 4.9 for limited cases in the control group. The .7 difference in these scores was statistically significant. Overall attorney satisfaction with outcome, however, was virtually the same in the program group and the control group.268 268 As discussed above, satisfaction with the outcome in the program group was dependent on whether the case resolved at mediation.
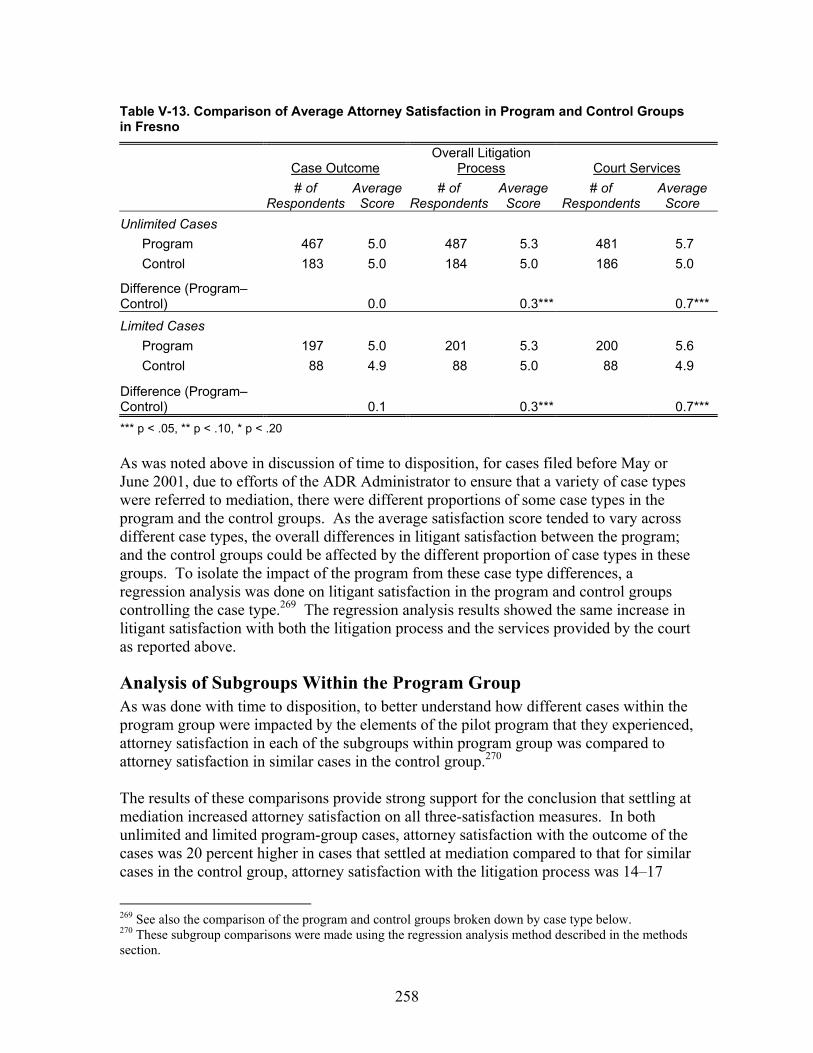
258
Table V-13. Comparison of Average Attorney Satisfaction in Program and Control Groups in Fresno
Case Outcome Overall Litigation
Process Court Services
# of
RespondentsAverage
Score # of
RespondentsAverage
Score # of
Respondents Average
Score Unlimited Cases
Program 467 5.0 487 5.3 481 5.7 Control 183 5.0 184 5.0 186 5.0
Difference (Program–Control) 0.0 0.3*** 0.7***
Limited Cases Program 197 5.0 201 5.3 200 5.6 Control 88 4.9 88 5.0 88 4.9
Difference (Program–Control) 0.1 0.3*** 0.7*** *** p < .05, ** p < .10, * p < .20 As was noted above in discussion of time to disposition, for cases filed before May or June 2001, due to efforts of the ADR Administrator to ensure that a variety of case types were referred to mediation, there were different proportions of some case types in the program and the control groups. As the average satisfaction score tended to vary across different case types, the overall differences in litigant satisfaction between the program; and the control groups could be affected by the different proportion of case types in these groups. To isolate the impact of the program from these case type differences, a regression analysis was done on litigant satisfaction in the program and control groups controlling the case type.269 The regression analysis results showed the same increase in litigant satisfaction with both the litigation process and the services provided by the court as reported above.
Analysis of Subgroups Within the Program Group As was done with time to disposition, to better understand how different cases within the program group were impacted by the elements of the pilot program that they experienced, attorney satisfaction in each of the subgroups within program group was compared to attorney satisfaction in similar cases in the control group.270 The results of these comparisons provide strong support for the conclusion that settling at mediation increased attorney satisfaction on all three-satisfaction measures. In both unlimited and limited program-group cases, attorney satisfaction with the outcome of the cases was 20 percent higher in cases that settled at mediation compared to that for similar cases in the control group, attorney satisfaction with the litigation process was 14–17
269 See also the comparison of the program and control groups broken down by case type below. 270 These subgroup comparisons were made using the regression analysis method described in the methods section.
259
percent higher, and attorney satisfaction with the services of the court was 15 percent higher. 271 As might have been expected, attorney satisfaction with the outcomes in program cases was tied to whether or not their cases settled at mediation. While satisfaction with the outcome was higher in program-group cases that settled at mediation, it was 10 percent lower in unlimited program-group cases that did not settle at mediation compared to similar cases in the control group. However, satisfaction with the court’s services and the litigation process was not tied to whether cases settled at mediation; while satisfaction with both the court’s services and the litigation process was higher for program-group cases that settled at mediation, these measures were also higher for program-group cases that participated in mediation but did not settle at mediation. Attorney satisfaction with the services provided by the court was 10 percent higher for unlimited program-group cases that were mediated but did not settle at the mediation and 15 percent higher for such limited program-group cases than for similar cases in the control group. Similarly, satisfaction with the litigation process was 10 percent higher for limited program-group cases that participated in mediation but did not settle at the mediation than for similar cases in the control group. The comparison also suggested that satisfaction with the litigation process was higher for unlimited cases that did not settle at mediation than for similar cases in the control group, but the size of the difference was not clear. These results suggest that it was the experience of participating in a pilot program mediation that was the key to increasing attorney satisfaction with the services of the court and the litigation process. Attorneys whose cases were mediated were more satisfied with the court’s services and the litigation process regardless of whether their cases settled or did not settle at the mediation. Overall, the results of these regression analyses support the conclusions that • The experience of reaching settlement at mediation significantly increased attorney
satisfaction with all aspects of their dispute resolution experiences. • Attorney satisfaction with the outcomes in program cases was tied to whether or not
the cases settled at mediation. • The experience of mediating a case increased attorney satisfaction with both the
litigation process and the services of the court, even if the case did not resolve at mediation.
Comparison of Attorney Satisfaction by Case Type Table V-14 compares the different patterns of attorney satisfaction by case type. This table shows that the pilot program significantly increased attorney satisfaction in
271 No statistically significant differences were found between attorney satisfaction levels in program-group cases that were settled before mediation and similar cases in the control group.
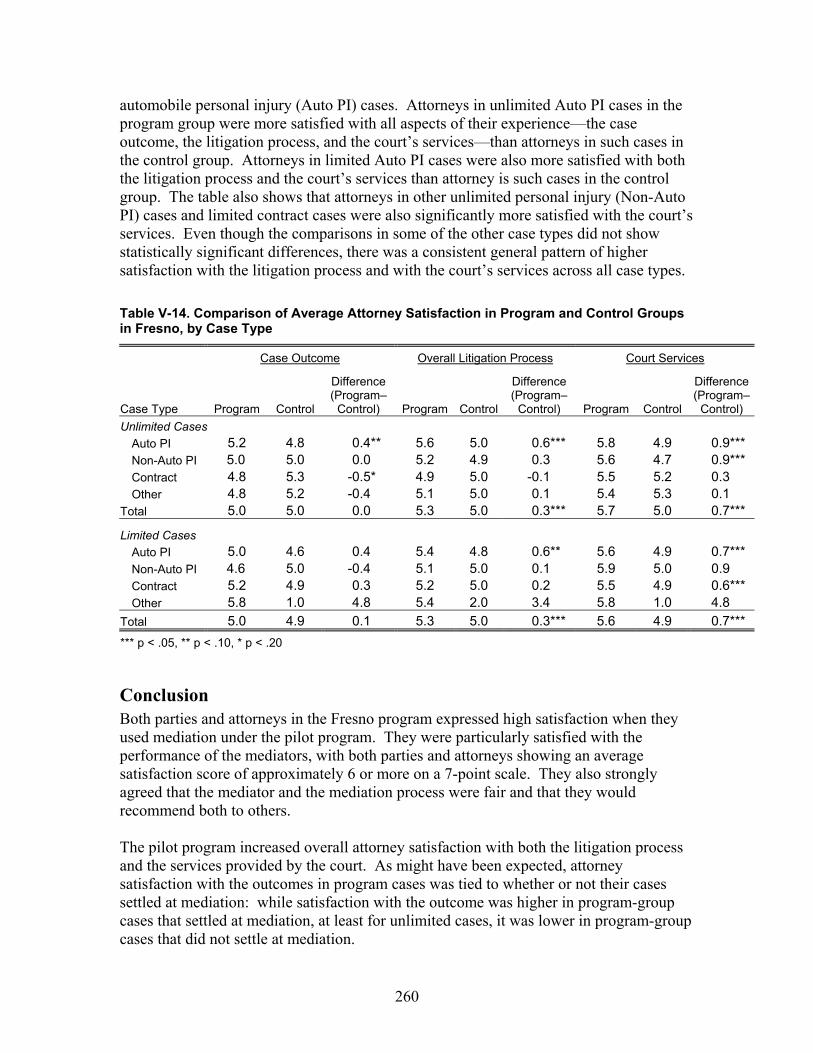
260
automobile personal injury (Auto PI) cases. Attorneys in unlimited Auto PI cases in the program group were more satisfied with all aspects of their experience—the case outcome, the litigation process, and the court’s services—than attorneys in such cases in the control group. Attorneys in limited Auto PI cases were also more satisfied with both the litigation process and the court’s services than attorney is such cases in the control group. The table also shows that attorneys in other unlimited personal injury (Non-Auto PI) cases and limited contract cases were also significantly more satisfied with the court’s services. Even though the comparisons in some of the other case types did not show statistically significant differences, there was a consistent general pattern of higher satisfaction with the litigation process and with the court’s services across all case types. Table V-14. Comparison of Average Attorney Satisfaction in Program and Control Groups in Fresno, by Case Type
Case Outcome Overall Litigation Process Court Services
Case Type Program Control
Difference (Program–
Control) Program Control
Difference (Program–
Control) Program Control
Difference (Program–
Control) Unlimited Cases
Auto PI 5.2 4.8 0.4** 5.6 5.0 0.6*** 5.8 4.9 0.9*** Non-Auto PI 5.0 5.0 0.0 5.2 4.9 0.3 5.6 4.7 0.9*** Contract 4.8 5.3 -0.5* 4.9 5.0 -0.1 5.5 5.2 0.3 Other 4.8 5.2 -0.4 5.1 5.0 0.1 5.4 5.3 0.1
Total 5.0 5.0 0.0 5.3 5.0 0.3*** 5.7 5.0 0.7***
Limited Cases Auto PI 5.0 4.6 0.4 5.4 4.8 0.6** 5.6 4.9 0.7*** Non-Auto PI 4.6 5.0 -0.4 5.1 5.0 0.1 5.9 5.0 0.9 Contract 5.2 4.9 0.3 5.2 5.0 0.2 5.5 4.9 0.6*** Other 5.8 1.0 4.8 5.4 2.0 3.4 5.8 1.0 4.8
Total 5.0 4.9 0.1 5.3 5.0 0.3*** 5.6 4.9 0.7*** *** p < .05, ** p < .10, * p < .20
Conclusion Both parties and attorneys in the Fresno program expressed high satisfaction when they used mediation under the pilot program. They were particularly satisfied with the performance of the mediators, with both parties and attorneys showing an average satisfaction score of approximately 6 or more on a 7-point scale. They also strongly agreed that the mediator and the mediation process were fair and that they would recommend both to others. The pilot program increased overall attorney satisfaction with both the litigation process and the services provided by the court. As might have been expected, attorney satisfaction with the outcomes in program cases was tied to whether or not their cases settled at mediation: while satisfaction with the outcome was higher in program-group cases that settled at mediation, at least for unlimited cases, it was lower in program-group cases that did not settle at mediation.
261
Attorneys whose cases settled at mediation were significantly more satisfied with the outcome of the case, their litigation experience, and with the services of the court compared to attorneys in similar cases in the control group. However, while attorneys whose cases did not settle at mediation were less satisfied with outcome of the case, they were still more satisfied with both the litigation process and with the services provided by court than attorneys in similar cases in the control group. Overall, these results indicate that participating in mediation increased attorney satisfaction with both the litigation process and the court’s services, regardless of whether the case settled at mediation. Attorneys in unlimited automobile personal injury cases in the program group were more satisfied with all aspects of their experience—the case outcome, the litigation process, and the court’s services—than attorneys in such cases in the control group. Attorneys in other unlimited personal injury cases and limited contract cases were also significantly more satisfied with the court’s services.
262
I. Impact of Fresno’s Pilot Program on Litigant Costs
Summary of Findings There was evidence that litigants’ costs and the attorney hours spent in reaching resolution were reduced in cases that settled at pilot program mediations in Fresno. • Estimates of actual attorney time spent in reaching resolution were 20 percent lower
in program-group cases that settled at mediation than for similar cases in the control group.
• In cases that settled at mediation, 89 percent of attorneys responding to the study
survey estimated some savings in both litigant costs and attorney hours from using mediation to reach settlement. Average savings estimated by attorneys per settled case was $9,915 in litigant costs and 50 hours in attorney time. Based on these attorney estimates, a total of $3,619,136 in litigant costs and 24,455 in attorney hours was estimated to have been saved in all 2000 and 2001 cases that were settled at mediation.
Introduction This section examines the impact of the Fresno pilot program on litigant costs. As described in detail in Section I.B. information on litigant costs was collected in two ways. First, in a survey distributed at the end of the mediation in cases that went to mediation between July 2001 and June 2002 (postmediation survey), attorneys in the subset of cases that resolved at mediation were asked to provide (1) an estimate of the time they had actually spent on the case and their clients’ actual litigation costs and (2) an estimate of the time they would have spent and what the costs to their clients would have been had they not used mediation. The difference between these estimates represents the attorneys’ subjective estimate of the litigant cost and attorney time savings when the case settled at the mediation. Second, in a separate survey administered shortly after disposition in both program and control cases disposed of between July 2001 and June 2002 (postdisposition survey), attorneys were asked to provide an estimate of the actual time they had actually spent on the case and their clients’ actual litigation costs. Comparisons between the actual time and cost estimates in the program and control groups provide an objective measure of the pilot program’s impact on litigant costs. As discussed in the data and methods section, however, the data on actual litigant costs and attorney time had a very skewed distribution: there were a few cases with very large litigant cost and attorney time estimates (“outlier” cases) that stretched out the data’s range. While several methods were used to try to account for this skewed distribution, the range of the data was so broad that none of the differences found in direct comparisons between the program and control groups were statistically significant—it was not possible to tell with sufficient confidence whether the observed differences were
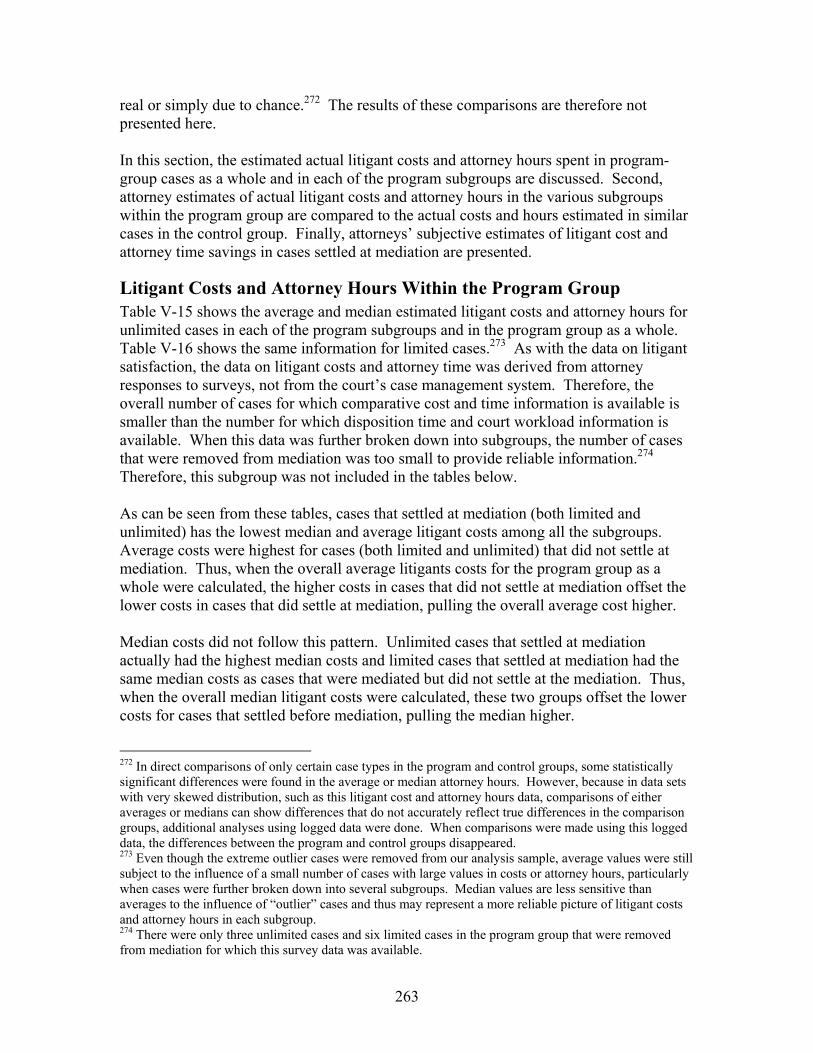
263
real or simply due to chance.272 The results of these comparisons are therefore not presented here. In this section, the estimated actual litigant costs and attorney hours spent in program-group cases as a whole and in each of the program subgroups are discussed. Second, attorney estimates of actual litigant costs and attorney hours in the various subgroups within the program group are compared to the actual costs and hours estimated in similar cases in the control group. Finally, attorneys’ subjective estimates of litigant cost and attorney time savings in cases settled at mediation are presented.
Litigant Costs and Attorney Hours Within the Program Group Table V-15 shows the average and median estimated litigant costs and attorney hours for unlimited cases in each of the program subgroups and in the program group as a whole. Table V-16 shows the same information for limited cases.273 As with the data on litigant satisfaction, the data on litigant costs and attorney time was derived from attorney responses to surveys, not from the court’s case management system. Therefore, the overall number of cases for which comparative cost and time information is available is smaller than the number for which disposition time and court workload information is available. When this data was further broken down into subgroups, the number of cases that were removed from mediation was too small to provide reliable information.274 Therefore, this subgroup was not included in the tables below. As can be seen from these tables, cases that settled at mediation (both limited and unlimited) has the lowest median and average litigant costs among all the subgroups. Average costs were highest for cases (both limited and unlimited) that did not settle at mediation. Thus, when the overall average litigants costs for the program group as a whole were calculated, the higher costs in cases that did not settle at mediation offset the lower costs in cases that did settle at mediation, pulling the overall average cost higher. Median costs did not follow this pattern. Unlimited cases that settled at mediation actually had the highest median costs and limited cases that settled at mediation had the same median costs as cases that were mediated but did not settle at the mediation. Thus, when the overall median litigant costs were calculated, these two groups offset the lower costs for cases that settled before mediation, pulling the median higher.
272 In direct comparisons of only certain case types in the program and control groups, some statistically significant differences were found in the average or median attorney hours. However, because in data sets with very skewed distribution, such as this litigant cost and attorney hours data, comparisons of either averages or medians can show differences that do not accurately reflect true differences in the comparison groups, additional analyses using logged data were done. When comparisons were made using this logged data, the differences between the program and control groups disappeared. 273 Even though the extreme outlier cases were removed from our analysis sample, average values were still subject to the influence of a small number of cases with large values in costs or attorney hours, particularly when cases were further broken down into several subgroups. Median values are less sensitive than averages to the influence of “outlier” cases and thus may represent a more reliable picture of litigant costs and attorney hours in each subgroup. 274 There were only three unlimited cases and six limited cases in the program group that were removed from mediation for which this survey data was available.
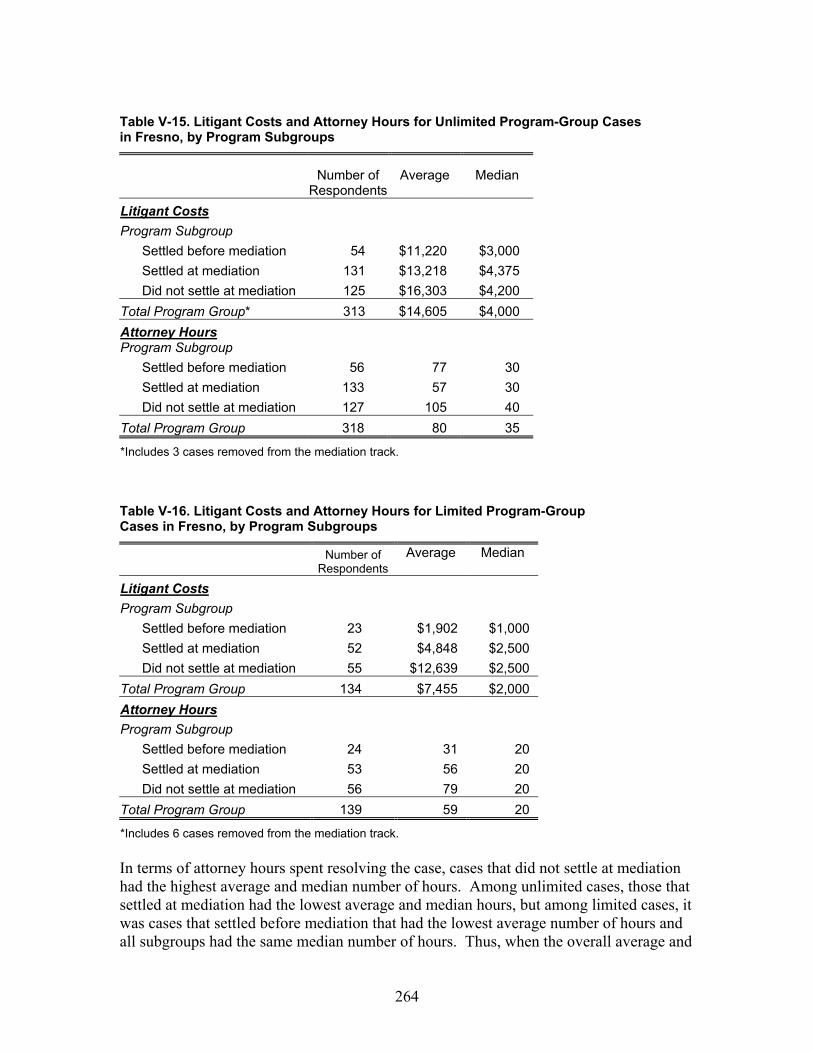
264
Table V-15. Litigant Costs and Attorney Hours for Unlimited Program-Group Cases in Fresno, by Program Subgroups
Number of
RespondentsAverage
Median
Litigant Costs Program Subgroup
Settled before mediation 54 $11,220 $3,000 Settled at mediation 131 $13,218 $4,375 Did not settle at mediation 125 $16,303 $4,200
Total Program Group* 313 $14,605 $4,000 Attorney Hours Program Subgroup
Settled before mediation 56 77 30 Settled at mediation 133 57 30 Did not settle at mediation 127 105 40
Total Program Group 318 80 35
*Includes 3 cases removed from the mediation track. Table V-16. Litigant Costs and Attorney Hours for Limited Program-Group Cases in Fresno, by Program Subgroups
Number of
RespondentsAverage
Median
Litigant Costs Program Subgroup
Settled before mediation 23 $1,902 $1,000 Settled at mediation 52 $4,848 $2,500 Did not settle at mediation 55 $12,639 $2,500
Total Program Group 134 $7,455 $2,000 Attorney Hours Program Subgroup
Settled before mediation 24 31 20 Settled at mediation 53 56 20 Did not settle at mediation 56 79 20
Total Program Group 139 59 20
*Includes 6 cases removed from the mediation track. In terms of attorney hours spent resolving the case, cases that did not settle at mediation had the highest average and median number of hours. Among unlimited cases, those that settled at mediation had the lowest average and median hours, but among limited cases, it was cases that settled before mediation that had the lowest average number of hours and all subgroups had the same median number of hours. Thus, when the overall average and
265
median number of attorney hours spent in reaching resolution were calculated, these two groups offset the higher number of hours for cases that did not settle at mediation, pulling the average and median lower.
Analysis of Subgroups Within the Program As was done with time to disposition and litigant satisfaction, to better understand how different cases within the program were impacted by the elements of the pilot program that they experienced, average litigant costs and attorney hours in each of the subgroups within the program group was compared to the costs and hours in similar cases in the control group.275 In order to increase the sample size and thus the reliability of the results, however, instead of analyzing unlimited and limited cases separately, the data on both types of cases was combined for this analysis.276 Even with this combined analysis, only one statistically significant finding emerged from the regression analysis. For unlimited cases, the regression analysis indicated that attorney time spent on cases that settled at mediation was reduced by 20 percent compared to similar cases in the control group. These results are consistent with the other study results showing positive impacts on time to disposition and satisfaction when cases settled at mediation.
Attorney Estimates of Mediation Resolution’s Impact on Litigant Costs and Attorney Hours Attorneys whose cases resolved at mediation believed overwhelmingly that mediation had saved their clients money. Of the attorneys whose cases settled at mediation who responded to the postmediation survey, 89 percent estimated some cost savings for their clients. Table V-17, shows the average savings in both litigant costs and attorney hours estimated by these attorneys. It also shows what percentage savings these estimates represent. As shown in this table, in those cases in which the attorneys reported savings from resolving at mediation, the average cost saving per client was estimated to be approximately $14,000; the average saving in attorney hours was estimated to be about 70 hours. These attorney estimates represent a cost saving of approximately 60 percent, on average, and a time saving of about 55 percent. 275 These subgroup comparisons were made using the regression analysis method described in Section I.B. 276 The reliability of the regression analysis, like the direct comparisons between the program and control groups, was affected by the skewed distribution of the litigant cost and attorney time data. With the program group divided into unlimited and limited cases, the analysis produced no statistically significant results. Combining all unlimited and limited cases created a larger sample size that increased the reliability of the regression results. Note that whether the case was unlimited or limited was accounted for in the combined analysis by making this unlimited/limited designation one of the variables used in the regression. In addition, before the data on unlimited and limited cases was combined, separate regression analyses were performed on unlimited and limited cases. These separate analyses suggested program impacts of the same type in the same subgroups as the combined analysis, however, the statistical significance of the observed differences was lower than in the combined analysis.
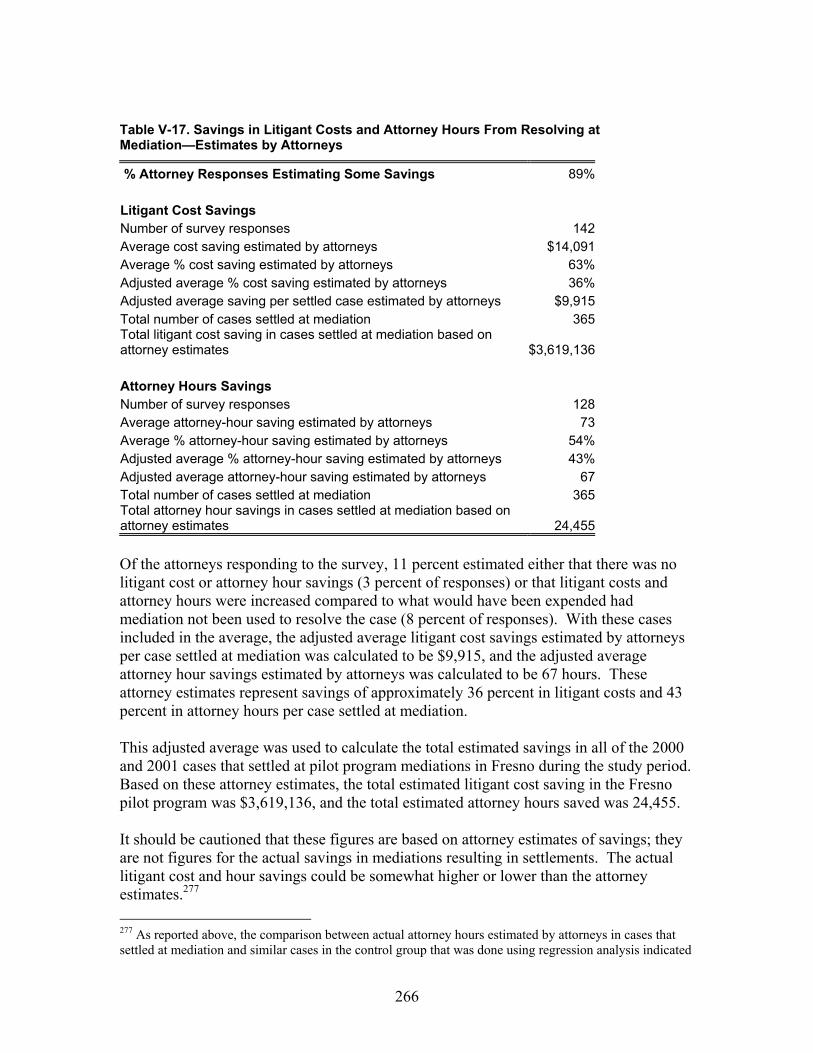
266
Table V-17. Savings in Litigant Costs and Attorney Hours From Resolving at Mediation—Estimates by Attorneys
% Attorney Responses Estimating Some Savings 89% Litigant Cost Savings Number of survey responses 142Average cost saving estimated by attorneys $14,091Average % cost saving estimated by attorneys 63%Adjusted average % cost saving estimated by attorneys 36%Adjusted average saving per settled case estimated by attorneys $9,915 Total number of cases settled at mediation 365Total litigant cost saving in cases settled at mediation based on attorney estimates $3,619,136 Attorney Hours Savings Number of survey responses 128Average attorney-hour saving estimated by attorneys 73Average % attorney-hour saving estimated by attorneys 54%Adjusted average % attorney-hour saving estimated by attorneys 43%Adjusted average attorney-hour saving estimated by attorneys 67Total number of cases settled at mediation 365Total attorney hour savings in cases settled at mediation based on attorney estimates 24,455 Of the attorneys responding to the survey, 11 percent estimated either that there was no litigant cost or attorney hour savings (3 percent of responses) or that litigant costs and attorney hours were increased compared to what would have been expended had mediation not been used to resolve the case (8 percent of responses). With these cases included in the average, the adjusted average litigant cost savings estimated by attorneys per case settled at mediation was calculated to be $9,915, and the adjusted average attorney hour savings estimated by attorneys was calculated to be 67 hours. These attorney estimates represent savings of approximately 36 percent in litigant costs and 43 percent in attorney hours per case settled at mediation. This adjusted average was used to calculate the total estimated savings in all of the 2000 and 2001 cases that settled at pilot program mediations in Fresno during the study period. Based on these attorney estimates, the total estimated litigant cost saving in the Fresno pilot program was $3,619,136, and the total estimated attorney hours saved was 24,455. It should be cautioned that these figures are based on attorney estimates of savings; they are not figures for the actual savings in mediations resulting in settlements. The actual litigant cost and hour savings could be somewhat higher or lower than the attorney estimates.277 277 As reported above, the comparison between actual attorney hours estimated by attorneys in cases that settled at mediation and similar cases in the control group that was done using regression analysis indicated
267
It should also be cautioned that these estimated savings are for cases that settled at mediation only, not for all cases in the program group. There may also have been savings or increases in litigant cost or attorney hours in other subgroups of program cases, such as those that were referred to mediation but settled before the mediation took place or cases that were mediated but did not settle at the mediation.278
Conclusion There was evidence that both litigant costs and attorney time spent before reaching resolution was reduced when cases resolved at mediation. Estimates of actual attorney time spent in reaching resolution were 20 percent lower in program-group cases that settled at mediation than for similar cases in the control group. In cases that resolved at pilot program mediations, 89 percent of attorneys responding to the study survey estimated some savings in both litigant costs and attorney hours from using mediation to reach settlement. Average savings estimated by attorneys per case settled at mediation was $9,915 in litigant costs and 67 hours in attorney time. Based on these attorney estimates, total savings of $3,619,136 in litigant costs and 24,455 in attorney hours were estimated for all 2000 and 2001 cases that were settled at mediation.
that attorney hours were 20 percent lower in program-group cases that settled at mediation, rather than the 43 percent lower estimated by attorneys. 278 Some support for the conclusion that mediation may have reduced costs even in cases that did not settle at mediation comes from 49 postmediation survey responses in which attorneys in cases that did not settle at mediation provided litigant cost and attorney hours information even though this information had not been requested. Of these survey responses, 69 percent indicated some savings in litigant costs, attorney hours, or both in cases that were mediated but did not settle at mediation. Taking into account those responses that estimated no savings or increased costs as well, the attorneys in these cases estimated average savings of 36 percent in litigant costs (40 percent median savings) and 38 percent in attorney hours (50 percent median savings) in cases that did not settle at mediation.
268
J. Impact of Fresno’s Pilot Program on the Court’s Workload
Summary of Findings There is strong evidence that the pilot program in Fresno reduced the number of motion hearings for cases in the program. However, this reduction in court workload was offset by an increase in the number of case management conferences required under the procedures initially followed by the court during the study period. • There were 48 percent fewer motion hearings in limited 2001 program-group cases
than in limited control-group cases. Comparisons between unlimited program- and control-group cases also showed 13 percent fewer motions in program cases, but this difference was not statistically significant. However, the average number of case management conferences and “other” pretrial hearings was higher in the program group than in the control group for both unlimited and limited cases. The increase in case management conferences and “other” hearings completely offset the decrease in motion hearings so that, overall, there was an increase in the total number of pretrial court events in the program group and a small increase in the judicial time spent on program cases during the study period.
• The increases in the number of case management conferences for program-group
cases was understandable given the court procedures (since changed) that required case management conferences in all program-group cases that did not settle at mediation and in most program-group cases when the parties wanted their cases removed from the mediation track, but did not generally require case management conferences in other cases.
• Unlimited program-group cases that settled at mediation had 45 percent fewer court events overall compared to similar cases in the control group. This overall reduction stemmed from reductions in motion and “other” hearings. There were 80 percent fewer motion hearings and 60 percent fewer “other” hearings in the unlimited program cases that settled at mediation compared to similar cases in the control group. Not settling at mediation did not seem to have a negative impact on the number of pretrial events.
• The number of case management conferences was significantly higher across all case
types in the program group. There was also a consistent general pattern of decreases in motion hearings in limited cases and increases in “other” hearings in both limited and unlimited cases across all types of program cases, although the differences for each case type were not statistically significant or were only marginally significant.
Introduction This section examines the impact of the pilot program in Fresno on the court’s workload by comparing the frequency of various pretrial court events in the program and control groups. The analysis in this section focuses on the following three major types of court
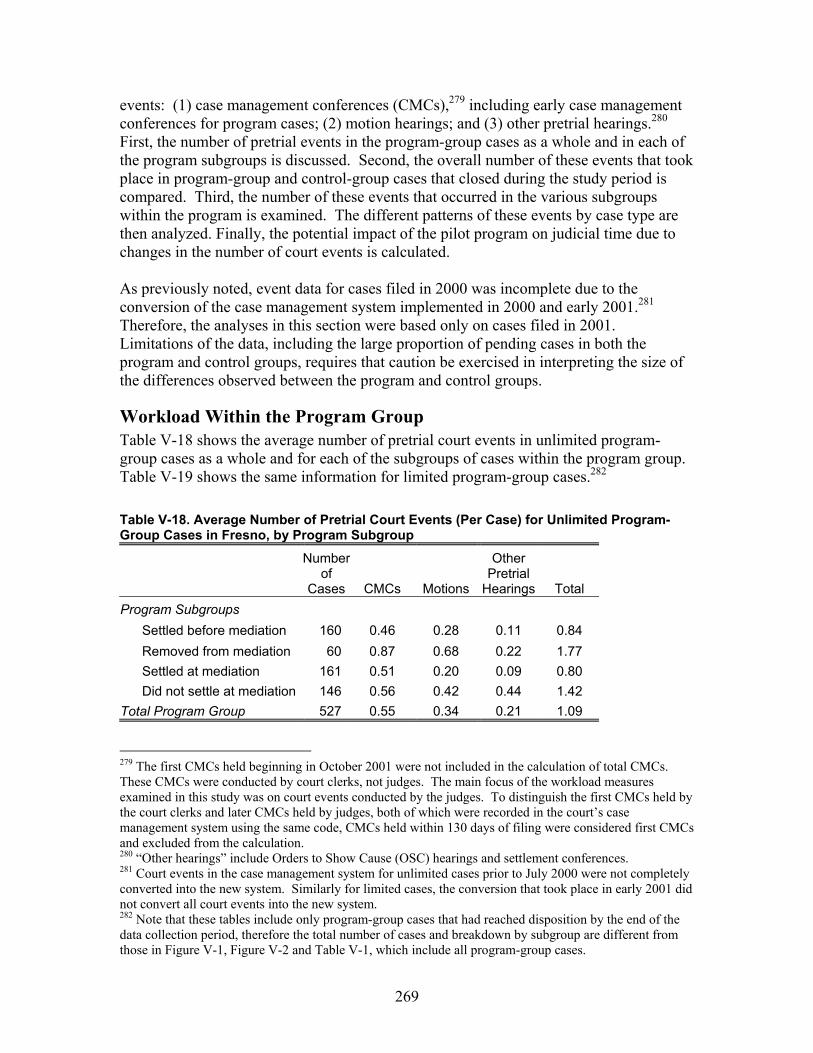
269
events: (1) case management conferences (CMCs),279 including early case management conferences for program cases; (2) motion hearings; and (3) other pretrial hearings.280 First, the number of pretrial events in the program-group cases as a whole and in each of the program subgroups is discussed. Second, the overall number of these events that took place in program-group and control-group cases that closed during the study period is compared. Third, the number of these events that occurred in the various subgroups within the program is examined. The different patterns of these events by case type are then analyzed. Finally, the potential impact of the pilot program on judicial time due to changes in the number of court events is calculated. As previously noted, event data for cases filed in 2000 was incomplete due to the conversion of the case management system implemented in 2000 and early 2001.281 Therefore, the analyses in this section were based only on cases filed in 2001. Limitations of the data, including the large proportion of pending cases in both the program and control groups, requires that caution be exercised in interpreting the size of the differences observed between the program and control groups.
Workload Within the Program Group Table V-18 shows the average number of pretrial court events in unlimited program-group cases as a whole and for each of the subgroups of cases within the program group. Table V-19 shows the same information for limited program-group cases.282 Table V-18. Average Number of Pretrial Court Events (Per Case) for Unlimited Program-Group Cases in Fresno, by Program Subgroup
Numberof
Cases CMCs Motions
Other Pretrial
Hearings Total Program Subgroups
Settled before mediation 160 0.46 0.28 0.11 0.84 Removed from mediation 60 0.87 0.68 0.22 1.77 Settled at mediation 161 0.51 0.20 0.09 0.80 Did not settle at mediation 146 0.56 0.42 0.44 1.42
Total Program Group 527 0.55 0.34 0.21 1.09 279 The first CMCs held beginning in October 2001 were not included in the calculation of total CMCs. These CMCs were conducted by court clerks, not judges. The main focus of the workload measures examined in this study was on court events conducted by the judges. To distinguish the first CMCs held by the court clerks and later CMCs held by judges, both of which were recorded in the court’s case management system using the same code, CMCs held within 130 days of filing were considered first CMCs and excluded from the calculation. 280 “Other hearings” include Orders to Show Cause (OSC) hearings and settlement conferences. 281 Court events in the case management system for unlimited cases prior to July 2000 were not completely converted into the new system. Similarly for limited cases, the conversion that took place in early 2001 did not convert all court events into the new system. 282 Note that these tables include only program-group cases that had reached disposition by the end of the data collection period, therefore the total number of cases and breakdown by subgroup are different from those in Figure V-1, Figure V-2 and Table V-1, which include all program-group cases.
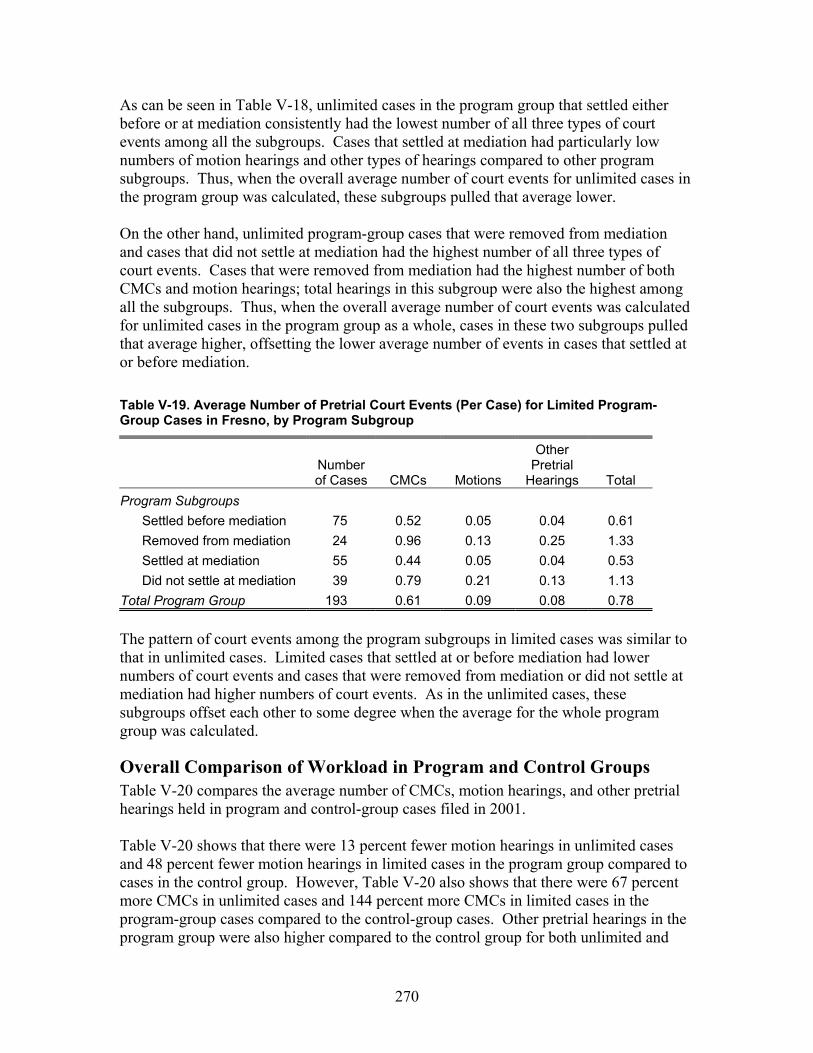
270
As can be seen in Table V-18, unlimited cases in the program group that settled either before or at mediation consistently had the lowest number of all three types of court events among all the subgroups. Cases that settled at mediation had particularly low numbers of motion hearings and other types of hearings compared to other program subgroups. Thus, when the overall average number of court events for unlimited cases in the program group was calculated, these subgroups pulled that average lower. On the other hand, unlimited program-group cases that were removed from mediation and cases that did not settle at mediation had the highest number of all three types of court events. Cases that were removed from mediation had the highest number of both CMCs and motion hearings; total hearings in this subgroup were also the highest among all the subgroups. Thus, when the overall average number of court events was calculated for unlimited cases in the program group as a whole, cases in these two subgroups pulled that average higher, offsetting the lower average number of events in cases that settled at or before mediation. Table V-19. Average Number of Pretrial Court Events (Per Case) for Limited Program-Group Cases in Fresno, by Program Subgroup
Number of Cases CMCs Motions
Other Pretrial
Hearings Total Program Subgroups
Settled before mediation 75 0.52 0.05 0.04 0.61 Removed from mediation 24 0.96 0.13 0.25 1.33 Settled at mediation 55 0.44 0.05 0.04 0.53 Did not settle at mediation 39 0.79 0.21 0.13 1.13
Total Program Group 193 0.61 0.09 0.08 0.78 The pattern of court events among the program subgroups in limited cases was similar to that in unlimited cases. Limited cases that settled at or before mediation had lower numbers of court events and cases that were removed from mediation or did not settle at mediation had higher numbers of court events. As in the unlimited cases, these subgroups offset each other to some degree when the average for the whole program group was calculated.
Overall Comparison of Workload in Program and Control Groups Table V-20 compares the average number of CMCs, motion hearings, and other pretrial hearings held in program and control-group cases filed in 2001. Table V-20 shows that there were 13 percent fewer motion hearings in unlimited cases and 48 percent fewer motion hearings in limited cases in the program group compared to cases in the control group. However, Table V-20 also shows that there were 67 percent more CMCs in unlimited cases and 144 percent more CMCs in limited cases in the program-group cases compared to the control-group cases. Other pretrial hearings in the program group were also higher compared to the control group for both unlimited and

271
limited cases. Overall, the decrease in the number of motion hearings was offset by the increases in the number of CMCs and other pretrial hearings, and therefore the total of all these pretrial court events was 25 percent higher for unlimited cases and 51 percent higher for limited cases in the program group than the overall number of events in the control-group cases.283 Table V-20. Comparison of Average Number of Pretrial Court Events (Per Case) in Program-and Control Group Cases Filed in 2001
Average # of Pretrial Events
# of
Cases CMCs Motions Others Total Unlimited
Program 533 0.55 0.34 0.21 1.10 Control 978 0.33 0.39 0.17 0.88
% Difference 67%*** -13% 24%* 25%***
Limited Program 196 0.61 0.11 0.08 0.80 Control 411 0.25 0.21 0.06 0.53
% Difference 144%*** -48%*** 33% 51%***
*** p < .05, ** p < .10, * p < .20 As was noted above in the discussion of time to disposition, for cases filed before May or June 2001, due to efforts of the ADR Administrator to ensure that a variety of case types were referred to mediation, there were different proportions of some case types in the program and control groups. As the number of court events may vary across different case types, the overall differences in the number of events between the program and control groups could be affected by the different proportions of case types in these groups. To isolate the impact of the pilot program from these case type differences, a regression analysis was done on the number of events in the program and control groups, controlling for case type.284 The regression analysis results were very similar to the results of the program/control comparison above. They showed similarly large increases in number of CMCs as reported above, with slightly more for limited cases and slightly less for unlimited cases. The regression also showed the same decline in the number of motion hearings for limited cases in the program group. For unlimited cases, however, the regression showed no difference in the number of motion hearings between the 283 As noted in the section on data and methods a large number of pending cases was found in the case management system that showed no court events for at least one year. Under the assumption that all these cases had actually reached disposition as of the date of the last court event shown in the case management system, a separate comparison of the number of court events in program- and control-group cases was done. The percentage of additional case management conferences in the program group increased to 77 percent, and the percentage decrease in motion hearings went down to 9 percent, but otherwise the results for unlimited cases filed in 2001 remained largely unchanged. Similarly, small changes also occurred for limited cases: the percentage increase in case management conferences in the program group went up to 150 percent, and the percentage decrease in motion hearings went down to 44 percent. 284 See also the comparison of the program and control groups broken down by case type below.
272
program and control groups. Overall, the regression showed similar increases in the total number of court events, at 46 percent for limited cases and 29 percent for unlimited cases. The finding that there were more case management conferences in program cases is understandable given the case management and pilot program procedures that were in place in Fresno until October 2001. Up until October 2001, case management conferences were not held in most cases in Fresno.285 However, in program-group cases (cases referred to mediation), if the parties did not want to go to mediation, they were generally required to attend an early mediation status conference in order to be removed from the mediation track (almost 13 percent of program cases were removed from this track). No similar conference was required for control-group cases. Likewise, in cases that did not settle at mediation (almost 30 percent of the program-group cases), a postmediation status conference was held. No similar conference was required for control-group cases. Thus, for a large percentage of program cases in Fresno, the pilot program procedures required additional, special court conferences that were not required in the control group. As a result, on average there were more court events (increased court workload) in program cases during the study period. The Superior Court of Fresno County has since changed its case management procedures so that additional case management conferences are not required in program cases. As with the analysis of case disposition time in the previous section, it is also important to note that a significant proportion of cases in both the program and control groups had not reached final disposition by the end of the data collection period and thus the court events for these pending cases were not included in this analysis. Since the proportion of pending cases is larger in the control group than in the program group, the overall average number of various court events is likely to increase more for cases in the control group than for those in the program group when all cases have reached disposition. The ultimate impact of these pending cases on the final comparisons of court events between the program and control groups is uncertain.
Analysis of Subgroups Within the Program Group As was done with time to disposition, litigant satisfaction, and litigants costs, to better understand how different cases within the program were impacted by the elements of the pilot program that they experienced, the average number of pretrial court events in each of the subgroups within the program group was compared to the number of such events in similar cases in the control group.286 Overall, for unlimited cases, these comparisons provide strong support for the conclusion that when settlement is reached at mediation, the court’s workload is reduced. Unlimited program-group cases that settled at mediation had 45 percent fewer court events overall compared to similar cases in the control group. This overall reduction stemmed from reductions in motion and “other” hearings. Motion hearings in unlimited cases that 285 As indicated in the program description, the court instituted a new case management conference procedure in October 2001, so that such conferences are now held in most cases. 286 These subgroup comparisons were made using the regression analysis method described in Section I.B.
273
settled at mediation were reduced by approximately 60 percent and “other” hearings were reduced by more than 80 percent compared to similar cases in the control group. The comparisons also found 20 percent fewer “other” hearings in cases that settled before mediation than in similar cases in the control group. On the other hand, there is also strong support for the conclusion that not settling at mediation increases the overall number of court events in unlimited cases. The comparisons showed that in unlimited cases that did not settle at mediation, the overall number of court events increased by about 65 percent compared to similar cases in the control group. This increase was largely due to an increase in the number of CMCs. The comparison indicated that the average number of CMCs for unlimited cases that did not settle at mediation was more than two times higher than that for similar cases in the control group. Again, this finding makes sense in terms of the program procedures, which, until October 2001, required a postmediation status conference in all cases that did not resolve at mediation. Similarly, limited cases that did not settle at mediation had more court events overall than similar cases in the control group. The comparison showed that in limited cases that did not settle at mediation, the overall number of court events increased by almost 300 percent compared to similar cases in the control group. Again, as with unlimited cases, this increase in court events was largely due to an increase in CMCs; the comparison showed that there were over eight times more CMCs in limited cases that did not settle at mediation compared to like cases in the control group. However, unlike unlimited cases, the number of CMCs was also more than three times higher in limited program-group cases that settled at or before mediation. This may reflect the fact that CMCs were so rarely held in limited cases that even a few such conferences in limited cases constituted a large percentage increase. Overall, the results of these regression analyses support the following conclusions: • Settling at mediation had a positive impact on reducing the court’s workload in
unlimited cases in the form of fewer motion and “other” pretrial hearings; • Settling the dispute before mediation may have had a similar positive impact in
reducing the number of “other” hearings in unlimited cases; and • Not settling at mediation had a large negative effect on the number of CMCs in both
unlimited and limited cases; this was probably due to the fact that a postmediation conference was required in all cases that did not settle at mediation.
Comparison of Workload Between Different Case Types Table V-21 shows the average number of various court events for cases in the program and control groups by case type. The number of CMCs in both limited and unlimited program-group cases was consistently higher than that in the control group across all case types, with increases
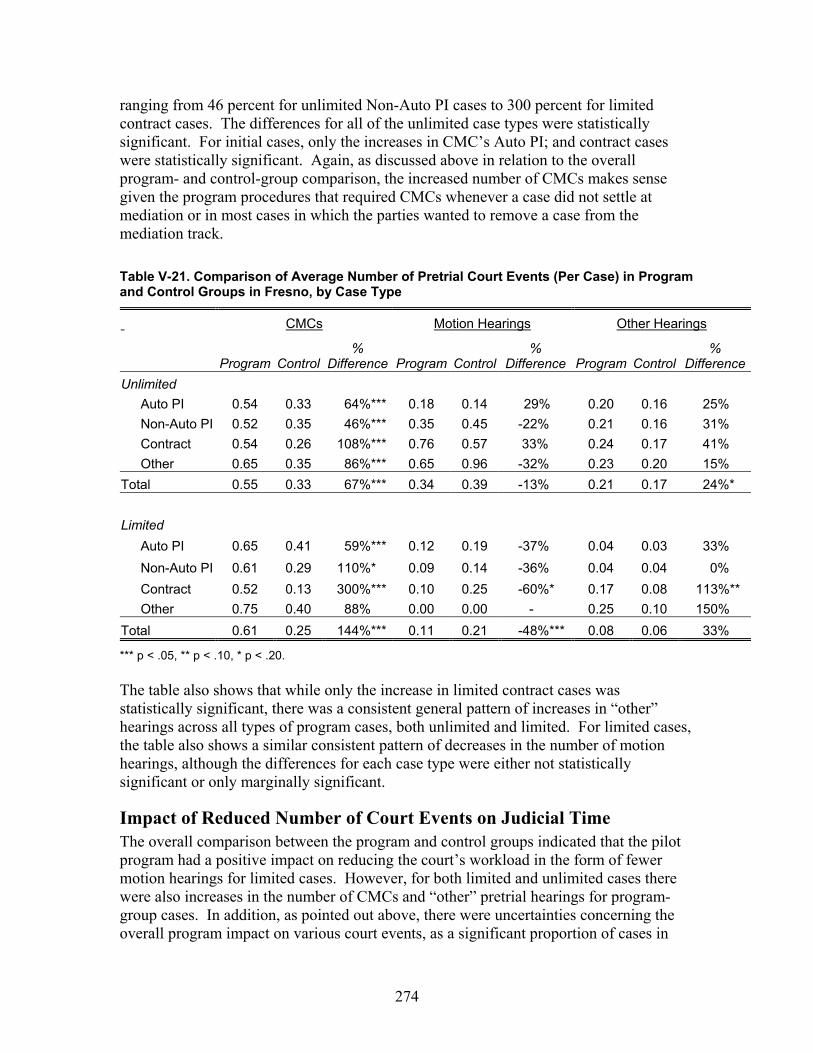
274
ranging from 46 percent for unlimited Non-Auto PI cases to 300 percent for limited contract cases. The differences for all of the unlimited case types were statistically significant. For initial cases, only the increases in CMC’s Auto PI; and contract cases were statistically significant. Again, as discussed above in relation to the overall program- and control-group comparison, the increased number of CMCs makes sense given the program procedures that required CMCs whenever a case did not settle at mediation or in most cases in which the parties wanted to remove a case from the mediation track. Table V-21. Comparison of Average Number of Pretrial Court Events (Per Case) in Program and Control Groups in Fresno, by Case Type
CMCs Motion Hearings Other Hearings
Program Control %
Difference Program Control%
Difference Program Control%
DifferenceUnlimited
Auto PI 0.54 0.33 64%*** 0.18 0.14 29% 0.20 0.16 25% Non-Auto PI 0.52 0.35 46%*** 0.35 0.45 -22% 0.21 0.16 31% Contract 0.54 0.26 108%*** 0.76 0.57 33% 0.24 0.17 41% Other 0.65 0.35 86%*** 0.65 0.96 -32% 0.23 0.20 15%
Total 0.55 0.33 67%*** 0.34 0.39 -13% 0.21 0.17 24%* Limited
Auto PI 0.65 0.41 59%*** 0.12 0.19 -37% 0.04 0.03 33% Non-Auto PI 0.61 0.29 110%* 0.09 0.14 -36% 0.04 0.04 0% Contract 0.52 0.13 300%*** 0.10 0.25 -60%* 0.17 0.08 113%** Other 0.75 0.40 88% 0.00 0.00 - 0.25 0.10 150%
Total 0.61 0.25 144%*** 0.11 0.21 -48%*** 0.08 0.06 33%
*** p < .05, ** p < .10, * p < .20. The table also shows that while only the increase in limited contract cases was statistically significant, there was a consistent general pattern of increases in “other” hearings across all types of program cases, both unlimited and limited. For limited cases, the table also shows a similar consistent pattern of decreases in the number of motion hearings, although the differences for each case type were either not statistically significant or only marginally significant.
Impact of Reduced Number of Court Events on Judicial Time The overall comparison between the program and control groups indicated that the pilot program had a positive impact on reducing the court’s workload in the form of fewer motion hearings for limited cases. However, for both limited and unlimited cases there were also increases in the number of CMCs and “other” pretrial hearings for program-group cases. In addition, as pointed out above, there were uncertainties concerning the overall program impact on various court events, as a significant proportion of cases in
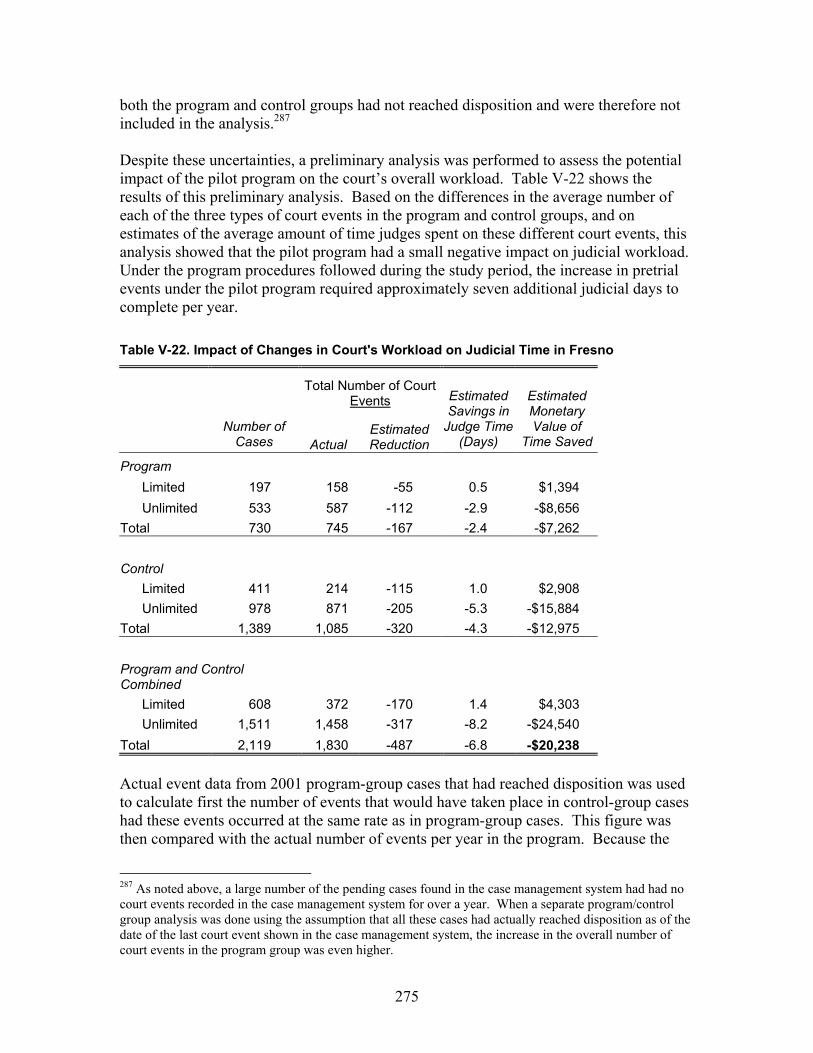
275
both the program and control groups had not reached disposition and were therefore not included in the analysis.287 Despite these uncertainties, a preliminary analysis was performed to assess the potential impact of the pilot program on the court’s overall workload. Table V-22 shows the results of this preliminary analysis. Based on the differences in the average number of each of the three types of court events in the program and control groups, and on estimates of the average amount of time judges spent on these different court events, this analysis showed that the pilot program had a small negative impact on judicial workload. Under the program procedures followed during the study period, the increase in pretrial events under the pilot program required approximately seven additional judicial days to complete per year. Table V-22. Impact of Changes in Court's Workload on Judicial Time in Fresno
Total Number of Court Events
Number of
Cases Actual Estimated Reduction
Estimated Savings in
Judge Time (Days)
Estimated Monetary Value of
Time Saved
Program Limited 197 158 -55 0.5 $1,394 Unlimited 533 587 -112 -2.9 -$8,656
Total 730 745 -167 -2.4 -$7,262 Control
Limited 411 214 -115 1.0 $2,908 Unlimited 978 871 -205 -5.3 -$15,884
Total 1,389 1,085 -320 -4.3 -$12,975
Program and Control Combined
Limited 608 372 -170 1.4 $4,303 Unlimited 1,511 1,458 -317 -8.2 -$24,540
Total 2,119 1,830 -487 -6.8 -$20,238 Actual event data from 2001 program-group cases that had reached disposition was used to calculate first the number of events that would have taken place in control-group cases had these events occurred at the same rate as in program-group cases. This figure was then compared with the actual number of events per year in the program. Because the
287 As noted above, a large number of the pending cases found in the case management system had had no court events recorded in the case management system for over a year. When a separate program/control group analysis was done using the assumption that all these cases had actually reached disposition as of the date of the last court event shown in the case management system, the increase in the overall number of court events in the program group was even higher.

276
decreases in motion hearings were offset by increases in case management conferences and other hearings, Table V-22 shows increases (negative numbers for estimated reductions in court events) in the total number of court events due to the pilot program’s impact. The number of court events were translated into judicial time saved or added, using estimates of judicial time spent on these court events, including chamber time for preparation before the events and the time spent in following up on the decisions made during the hearing events.288 Despite the increase in the total number of court events, increases in the court’s workload were minimal when the number of court events was translated into judicial time spent on these court events. This is because, in general, the estimated amount of judicial time required for motion hearings (which were reduced in the program group) was substantially higher than the time for CMCs and “other” pretrial hearings (which increased in the program group). Thus, the additional judicial time required because of the greater number of CMCs and “other” pretrial hearings in program cases was almost completely offset by the time saved from the reduced number of motion hearings. In fact, for limited cases, the pilot program resulted in an overall reduction in judicial time. Overall, however, between both unlimited and limited cases, this preliminary analysis suggests that the increases in court events required an additional 2.4 days of judicial time. Because many court costs, including judicial salaries, are fixed, increases in judicial workload do not necessarily translate into cost increases. Instead, the increased time takes away from the time that judges can spend on trials and other matters that require their attention. To help understand the value of the potential time increases, however, their estimated monetary value was calculated. The potential changes in judicial days were multiplied by an estimate of the current daily cost of operating a courtroom—$2,990 per day.289 Based on this calculation, the monetary value of the additional judicial time actually spent during the pilot program was $7,262. In addition, the potential impact on court workload if the pilot program were to be applied to all general civil cases courtwide was also calculated. This was done by calculating the number of court events that might have been avoided (or increased) in the control group, assuming these events occurred at the same rate in the control group as in the program group. While this analysis indicated some negative program impact on the
288 Judges in the five pilot courts provided estimates of the amount of time they spent on different types of court events. For limited cases, the average estimated time was 8 minutes for CMCs and 53 minutes for motion hearings. For unlimited cases, the figures were 18 and 72 minutes for CMCs and motion hearings, respectively. For all other hearings, which were not included in the judges’ survey, a conservative estimate was used, with 5 minutes allotted for limited and 10 minutes for unlimited cases. 289 This estimated cost includes salaries for a judge and associated support staff but not facilities or general overhead costs. In the fiscal year 2001–2002 budget change proposal for 30 new judgeships, the Finance Division of the Administrative Office of the Courts estimated that each new judgeship would have a total annual cost of at $642,749. This figure includes the total cost of salaries, benefits, and operating expenses for each new judgeship and its complement of support staff, including a bailiff, a court reporter, two courtroom clerks, a legal secretary, and a research attorney (Judicial Council of Cal., fiscal year 2001–2002 budget change proposal, No. TC18).
277
court’s workload, the size of the impact was relatively small. Table V-22 shows that increases in total judicial time, including that for control-group cases had these cases also been eligible for the pilot program, amounted to about eight days per year, which has an estimated monetary value of approximately $20,000. The analysis above, although preliminary in nature due to various uncertainties, suggests that while the pilot program required more judicial time to be devoted to case management, the net impact on the court’s workload was almost neutral because of the positive program impact in reducing the number of motion hearings. Note also that the court has now changed its proceedings so that additional special case management conferences are no longer held in program cases.
Conclusion There is strong evidence that the pilot program in Fresno reduced the number of motion hearings for limited cases in the program. There were 48 percent fewer motion hearings in limited 2001 program-group cases compared to cases in the control group. The number of motion hearings was consistently lower for limited cases in the program group across all case types. Reductions in the overall number of motion hearings could be attributed primarily to the positive impact from cases that settled at mediation. Unlimited program-group cases that settled at mediation had 80 percent fewer motion hearings compared to similar cases in the control group. They also had 60 percent fewer “other” hearings and 45 percent fewer court events overall compared to similar cases in the control group. However, this reduction in motions was offset by an increase in the number of case management conferences and other hearings required under the procedures followed by the court during the study period; the average number of case management conferences and “other” pretrial hearings was higher in the program group than in the control group for both unlimited and limited cases. The increase in case management conferences and “other” hearings offset the decrease in motion hearings, so that, overall, there was an increase in the total number of pretrial court events in the program group and a small increase in the judicial time spent on program cases during the study period. The increases in the number of case management conferences for program cases was understandable given the court procedures (since changed) that required conferences in all program cases that did not settle at mediation and in most program cases when the parties wanted their case removed from the mediation track, but did not generally require case management conferences in other cases.

278
279
VI. Contra Costa Pilot Program
A. Summary of Study Findings There is evidence that the pilot program in Contra Costa reduced disposition time and litigant costs and increased attorney satisfaction with the litigation process and the services provided by the court. • Mediation referrals, mediations, and settlements—1,650 cases that were filed in
the Superior Court of Contra Costa County in 2000 and 2001 were referred to mediation and almost 1,200 of these cases were mediated under the pilot program. Of the cases mediated, 53 percent settled at the mediation and another 7 percent settled later as a direct result of the mediation, for a total resolution rate of approximately 60 percent. In survey responses, 75 percent of attorneys whose cases did not settle at mediation indicated that the mediation was important to the ultimate settlement of the case.
• Trial rate—No statistically significant reduction in the trial rate was found either in
comparisons between cases filed before and after the program began or in comparisons between cases in which the litigants stipulated to mediation and cases in which they did not. However, this does not necessarily indicate that the pilot program had no impact on the trial rate; there were limitations associated with these comparisons that made it difficult to evaluate whether the program affected trial rates.
• Disposition time—There was evidence that the pilot program decreased disposition
time. Pre-/post-program comparisons suggested that the median disposition time for cases filed after the pilot program began was shorter than the median disposition time for cases filed before the program began. These comparisons also showed that the disposition rate for program cases was higher than that for pre-program cases for the entire 34-month period studied, but most noticeably between 6 and 12 months after filing, when it ranged from about 1.5 to 3 percent higher than that for pre-program cases. Comparisons between disposition rates in cases in which the litigants stipulated to mediation and cases in which they did not showed that while nonstipulated cases began to resolve earlier than stipulated cases, from 9 to 18 months after filing, stipulated cases were disposed of at a faster pace than nonstipulated cases and ultimately more stipulated than nonstipulated cases had reached disposition by the end of 18 months after filing. The pace of dispositions for stipulated cases was fastest at 9 months after filing, about the time that mediations took place, suggesting that mediations increased the pace of dispositions among stipulated cases. Comparisons between similar stipulated and nonstipulated cases confirmed that when cases were settled at mediation, the average disposition time was shorter, but also indicated that when cases were mediated and did not settle at the mediation, the disposition time was longer.
280
• Litigant satisfaction—Attorneys in cases in which the litigants stipulated to mediation were more satisfied with the overall litigation process and services provided by the court than attorneys in cases in which the litigants did not stipulate to mediation. Attorneys in stipulated cases were, however, less satisfied with outcome of the case compared to attorneys in nonstipulated cases. Attorneys’ satisfaction with the court’s services, the litigation process, and with the outcome of the case were all higher in stipulated cases that settled at mediation than in similar nonstipulated cases. While attorneys whose cases did not settle at mediation were less satisfied with the outcome of the case, they were still more satisfied with the court’s services than attorneys in similar nonstipulated cases. This suggests that participating in mediation increased attorneys’ satisfaction with the court’s services, regardless of whether their cases settled at mediation. Both parties and attorneys who participated in pilot program mediations expressed high satisfaction with their mediation experience, particularly with the performance of the mediators. They also strongly agreed that the mediator and the mediation process were fair and that they would recommend both to others.
• Litigant costs—There was evidence that the pilot program reduced both litigant costs
and attorney time, particularly in cases that settled at mediation. Actual litigant costs estimated by attorneys were approximately $7,500 lower in cases in which the litigants stipulated to mediation compared to those in which the litigants did not stipulate to mediation. Both direct comparisons of actual litigant costs and attorney hours estimated by attorneys in stipulated and nonstipulated cases disposed of in over six months and comparisons between actual litigant costs and attorney hours in stipulated cases and nonstipulated cases with similar characteristics using regression analysis suggested that litigant costs and attorney hours were reduced in stipulated cases. Regression analysis suggested that litigant costs were reduced by approximately 50 percent and attorney hours were reduced by 40 percent in both cases that were settled at mediation and in cases that did not settle at mediation compared to similar nonstipulated cases. In cases that settled at mediation, 87 percent of attorneys responding to the study survey estimated some savings in both litigant costs and attorney hours from using mediation to reach settlement. Average savings estimated by attorneys per settled case was $16,197 in litigant costs and 78 hours in attorney time. Based on these attorney estimates, the total estimated litigant cost savings in all 2000 and 2001 cases that settled at mediation was $9,993,839; and the total estimated savings in attorney hours was 48,126.
• Court workload—The evidence concerning the Contra Costa pilot program’s impact
on the court’s workload was mixed. In pre-/post-program comparisons, the average number of case management conferences held per case was 27 percent higher and the number of “other” pretrial hearings was 11 percent higher the year after the program began compared to a year before the pilot program began. The increase in case management conferences may have been due, at least in part, to the introduction of the Complex Litigation Pilot Program in the court in 2000. In comparisons of stipulated and nonstipulated cases, stipulated cases had fewer motion hearings but more case management conferences than nonstipulated cases, so that the total number

281
of all pretrial events was essentially the same in both groups. However, comparisons of only those cases disposed of in over six months suggested that the total number of hearings may have been lower in the stipulated group. In addition, when cases settled at mediation, the total number of court events was 20 percent lower, on average, in stipulated cases compared to nonstipulated cases with similar characteristics. Conversely, similar comparisons suggested that the number of pretrial hearings may have increased when cases did not settle at mediation.
282
B. Introduction This section of the report discusses the study’s findings concerning the Early Mediation Pilot Program in the Superior Court of Contra Costa County. Based on the criteria established by the Early Mediation Pilot Program legislation, this was a successful program, resulting in benefits to both litigants and the courts in the form of reduced disposition time, improved litigant satisfaction with the court’s services and the litigation process, and lower litigant costs. However, it was difficult to measure the full impact of the pilot program because there was not a good comparison group–a group of cases with similar characteristics as those participating in the program but without access to the program – against which to measure these impacts. As outlined below in the program description, the Contra Costa pilot program had four main elements: • The court distributed ADR information at the time of filing; • The court set an initial case management conference approximately 140 days
(approximately 5 months) after filing to assess case amenability for mediation or another form of ADR;290
• Litigants chose whether to participate in early mediation; the court did not have the authority to order the litigants to participate in early mediation; and
• If litigants selected a mediator from the court’s panel, the mediator provided between two and three hours of mediation services at no cost to the parties.
For purposes of this study, cases that were filed the year before the pilot program began that would have met the program eligibility requirements are called “pre-program” cases. Eligible cases filed after the program began are called “program” cases. The cases in which the parties stipulated to participate in early mediation are called “stipulated cases.” The remaining cases that were otherwise eligible for referral to mediation but in which the parties did not stipulate to early mediation are called “nonstipulated cases.” Overall comparisons of trial rates, disposition time, and other outcome measures between pre-program and program cases and between stipulated and nonstipulated cases were used to try to identify the impact of the pilot program in Contra Costa. However, it is important to keep in mind that both of these comparisons had limitations that restricted their capacity to identify the full impact of Contra Costa’s mediation pilot program. Because the pilot program in Contra Costa was a continuation of an existing court mediation program with some changes in program design, comparisons between pre-program and program cases in Contra Costa show only the added impact of these incremental changes to the mediation program. Pre-/post-program comparisons in Contra Costa do not provide information about the impact of having voluntary mediation services available to the litigants compared to having no mediation program at all. Comparisons between stipulated and nonstipulated cases similarly do not provide information about the impact of having voluntary mediation services available to the
290 These conferences actually took place at six months after filing, on average.
283
litigants compared to having no mediation program at all. Ideally, these comparisons show the impact of agreeing to go to early mediation. However, because stipulated and nonstipulated cases are qualitatively different from each other, any differences in outcome are likely to be due, at least in part, to these qualitative differences. One of the clearest differences between stipulated and nonstipulated cases and in Contra Costa was that the nonstipulated group included a large percentage of cases that reached disposition within six months of filing with few court events and very few trials (“easy” cases) while the stipulated group included almost none of these cases. Two additional comparisons that were made to try to account for the differences in the characteristics of stipulated and nonstipulated cases: (1) comparisons of outcomes in only those stipulated and nonstipulated cases that reached disposition in more than six months; and (2) comparisons made using regression analysis between stipulated cases and nonstipulated cases with similar case characteristics. In addition, it is important to remember that, throughout this section, “program” or “stipulated” cases does not mean cases that were mediated. Program cases include all the cases filed after the pilot program was implemented that met the program eligibility requirements, including both stipulated and nonstipulated cases. Stipulated cases include cases in which the parties stipulated to mediation, but that did not ultimately go to mediation, either because they were later removed from the mediation track by the court or because they settled before the mediation took place. It is also important to remember that program cases in which the parties did not stipulate to mediation and stipulated cases that participated and did not participate in mediation or that were settled and not settled at mediation were exposed to different pilot program elements. These cases had very different dispute resolution experiences and different outcomes in terms of the areas being studied (disposition time, litigant satisfaction, and the other outcomes). In overall comparisons using pre-program and program cases, the outcomes in all eligible cases, both stipulated and nonstipulated, were added together to calculate an overall average for the program group as a whole. Similarly, in overall comparisons using stipulated and nonstipulated cases, the outcomes in all these subgroups of stipulated cases were added together to calculate an overall average for the stipulated group as a whole. As a result, within these overall averages, positive outcomes in some subgroups of cases, such as shorter disposition time in cases that settled at mediation, were often offset by less positive outcomes in other subgroups. To provide a better understanding of how stipulated cases in these subgroups may have been influenced by their different experiences and exposure to different pilot program elements, comparisons were made between cases in these subgroups and non-stipulated cases with similar case characteristics. Readers who are interested in the impacts of specific pilot program elements, such as the early mediation process, should pay particular attention to these subgroup analyses. Finally, it is important to remember that the emphasis in this pilot program was on early referral to and early participation in mediation. Cases were referred to mediation about six months after filing and went to mediation about nine months after filing. Thus, this

284
study addresses only how cases responded to such early referrals and early mediation; it does not address how cases might have responded to later referrals or later mediation.
285
C. Contra Costa Pilot Program Description This section provides a brief description of the Superior Court of Contra Costa County and its Early Mediation Pilot Program. This description is intended to provide context for understanding the study findings presented later in this chapter.
The Court Environment in Contra Costa Contra Costa County is a fairly large county that combines urban, suburban and rural/agricultural regions. The county has a total population of slightly less than 1 million people. The Superior Court of Contra Costa County is of medium size compared to other trial courts in California, with 33 authorized judgeships. In 2000, the year that this mediation pilot program began, approximately 7,828 unlimited general civil cases and 10,130 limited civil cases were filed in the Superior Court of Contra Costa County.291 The Superior Court of Contra Costa County manages its limited and unlimited civil cases separately. Unlimited civil cases are assigned to one of 5 judges (departments) that handle civil cases in the court’s main location. These judges use an individual (direct) calendaring system for unlimited civil cases–meaning that the same judge handles all aspects of a case from filing through disposition. An initial case management conference is held in unlimited civil cases approximately 140 days after filing to establish a schedule for trial and other relevant court events. The court has historically disposed of its unlimited civil cases relatively quickly: in fiscal year 1998-1999, shortly before the Early Mediation Pilot Program was implemented, the Contra Costa Superior court reported that it disposed of 80 percent of its unlimited civil cases within one year, 94 percent within 18 months, and 96 percent within two years of filing. The Superior Court of Contra Costa County has had a long-standing commitment to offering its civil litigants alternative dispute resolution (ADR) options, including mediation. Since 1993, the court has had a voluntary mediation program called EASE (Extra Assistance to Settle Early) for unlimited civil cases. The option of participating in the EASE program was typically discussed at the initial case management conference and, in many cases, the assigned judge would urge the parties to stipulate to this program. The court maintained a panel of mediators who agreed to provide the first 2 hours of EASE mediation services to litigants at no charge; any mediation services provided after the initial 2-hours were paid for by the parties at the mediator’s standard market rate. In 1999, the year before the pilot program was implemented, stipulations to EASE were filed in approximately 1,000 cases. Thus, both the court and the local bar had prior experience with court-annexed, voluntary mediation of civil cases before the pilot program was put in place. In addition to the EASE program, the Contra Costa Superior Court also offers litigants a variety of other ADR options, including neutral case evaluation (called SCAN - Summary
291 Judicial Council of Cal., Admin. Off. of Cts., Rep. on Court Statistics (2001) Fiscal Year 1990–1991 Through 1999–2000 Statewide Caseload Trends, p. 46. Please see the glossary for definitions of “unlimited civil case” and “general civil case.”
286
Case Assessment by Neutrals), non-binding arbitration (called judicial arbitration), settlement conferences conducted by experienced trial attorneys (called SMART - Special Mentors Actively Resolving Trials), and trials conducted by attorneys appointed as pro tem judges (called TOT - Trials On Time).
The Early Mediation Pilot Program Model Adopted in Contra Costa
The General Program Model The Superior Court of Contra Costa County adopted a voluntary mediation pilot program model. The program was essentially an expansion of the court’s preexisting mediation program (EASE), and incorporated the main features of that program. The basic elements of the program implemented in Contra Costa included: • The court distributed ADR information at the time of filing; • The court set an initial case management conference approximately 140 days
(approximately 5 months) after filing to assess case amenability for mediation or another form of ADR;292
• Litigants chose whether to participate in early mediation; the court did not have the authority to order the litigants to participate in early mediation;
• In cases where the litigants stipulated to mediation, attorneys were required to confer with ADR program staff as soon as possible following the stipulation; and
• If litigants selected a mediator from the court’s panel, the mediator provided up to two hours of mediation services at no cost to the parties.
What Cases Were Eligible for the Program Only unlimited cases were eligible for the program in Contra Costa. While all unlimited general civil cases293 were eligible, certain case types, including complex cases, had few or no cases referred to mediation under the pilot program.
How Cases Were Referred to Mediation Only cases in which the defendant responded to the complaint (cases that became “at issue”) were eligible for referral to mediation. Mediation requires participation of both sides to a case. This participation is not possible if the defendant has not responded to the complaint. As in all the pilot courts, a large percentage of eligible cases in Contra Costa (approximately 30 percent of unlimited cases) never became at issue and thus were not eligible for referral to mediation.294 Parties were encouraged to stipulate to mediation at the earliest possible opportunity, either before, at, or within two weeks after the initial case management conference. At the time of filing, parties were given a notice regarding the pilot program, a blank form that could be used to stipulate to mediation under the program and a notice of their initial case management date, which was set about the five months from filing. The information
292 These conferences actually took place at 6 months after filing, on average. 293 See the glossary for a definition of “unlimited case” and “general civil case.” 294 As discussed below, cases that never became at issue (cases that were disposed of through default) were not included among the nonstipulated group for purposes of this study.
287
package also notified litigants that if they filed a stipulation to mediation before the case management conference, they would not be required to attend that conference. If parties did not stipulate to mediation before the initial case management conference, they were required to attend the conference. At these conferences, which were typically held approximately six months after filing, the assigned judge conferred with the parties about ADR options offered by the court, including mediation. The judge did not have the authority to order parties to participate in mediation, but in many cases, the assigned judge would strongly urge the parties to stipulate to mediation. Thus, while the pilot program in Contra Costa was voluntary in design, litigants often felt pressured to participate in the mediation process, just as they would in a mandatory program.
How Mediators Were Selected and Compensated Within 15 days of filing the stipulation, parties were required to identify a mediator and submit a declaration to the court confirming the selection of the mediator. Parties were free to select any mediator, whether or not that mediator was from the court’s panel. However, mediators on the court’s panel were required to provide litigants with up to three hours of services (one hour of preparation time and two hours of mediation time) at no charge. Thus, the parties could receive some mediation services at no cost to them if they selected a mediator from the court’s panel. Mediators on the Superior Court of Contra Costa County panel were required to have 25 hours of mediation training, to have completed at least 10 mediations, and to participate in the court’s mediator orientation program.
When Mediation Sessions Were Held Parties were required to complete mediation within 90-100 days of their stipulation to mediation. On average, cases went to mediation at approximately nine months after filing.
What Happened After the Mediation Under the Early Mediation Pilot Program statutes, at the conclusion of the mediation, the mediator was required to submit a form to the court indicating whether the case was fully or partially resolved at the mediation session. If this form was not returned shortly after the mediation deadline, the court’s ADR program staff would follow up with the mediator. If the mediator indicated that the case was not resolved or only partially resolved, or if the mediator indicated that the mediation was continuing after the 90-day period, the case was set for another case management conference.
How Cases Moved Through the Pilot Program To understand the impact of this pilot program, it is helpful to understand the flow of cases through the court process. Figure VI-1 below depicts this for unlimited cases filed in Contra Costa in 2000 and 2001. As shown in Figure VI-1, a total of 6,838 unlimited civil cases were filed in Contra Costa Superior Court during 2000 and 2001. Of the total unlimited cases filed, 70 percent
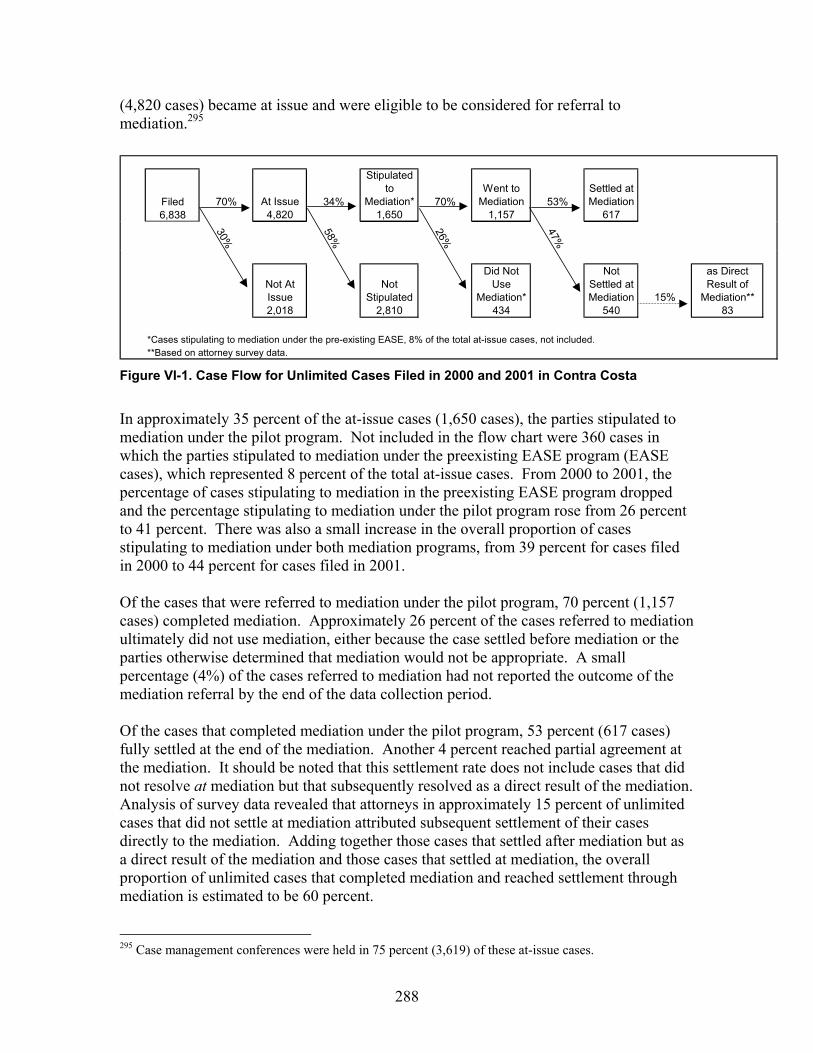
288
(4,820 cases) became at issue and were eligible to be considered for referral to mediation.295
Figure VI-1. Case Flow for Unlimited Cases Filed in 2000 and 2001 in Contra Costa
In approximately 35 percent of the at-issue cases (1,650 cases), the parties stipulated to mediation under the pilot program. Not included in the flow chart were 360 cases in which the parties stipulated to mediation under the preexisting EASE program (EASE cases), which represented 8 percent of the total at-issue cases. From 2000 to 2001, the percentage of cases stipulating to mediation in the preexisting EASE program dropped and the percentage stipulating to mediation under the pilot program rose from 26 percent to 41 percent. There was also a small increase in the overall proportion of cases stipulating to mediation under both mediation programs, from 39 percent for cases filed in 2000 to 44 percent for cases filed in 2001. Of the cases that were referred to mediation under the pilot program, 70 percent (1,157 cases) completed mediation. Approximately 26 percent of the cases referred to mediation ultimately did not use mediation, either because the case settled before mediation or the parties otherwise determined that mediation would not be appropriate. A small percentage (4%) of the cases referred to mediation had not reported the outcome of the mediation referral by the end of the data collection period. Of the cases that completed mediation under the pilot program, 53 percent (617 cases) fully settled at the end of the mediation. Another 4 percent reached partial agreement at the mediation. It should be noted that this settlement rate does not include cases that did not resolve at mediation but that subsequently resolved as a direct result of the mediation. Analysis of survey data revealed that attorneys in approximately 15 percent of unlimited cases that did not settle at mediation attributed subsequent settlement of their cases directly to the mediation. Adding together those cases that settled after mediation but as a direct result of the mediation and those cases that settled at mediation, the overall proportion of unlimited cases that completed mediation and reached settlement through mediation is estimated to be 60 percent.
295 Case management conferences were held in 75 percent (3,619) of these at-issue cases.
Filed 70% At Issue 34%
Stipulated to
Mediation* 70%Went to
Mediation 53%Settled at Mediation
6,838 4,820 1,650 1,157 617
30%
58%
26%
47%
Not At Issue
Not Stipulated
Did Not Use
Mediation*
Not Settled at Mediation 15%
as Direct Result of
Mediation**2,018 2,810 434 540 83
*Cases stipulating to mediation under the pre-existing EASE, 8% of the total at-issue cases, not included. **Based on attorney survey data.
289
Conclusion As noted in the introduction, each of the pilot programs examined in this study is different. In reviewing the results for the Contra Costa Superior Court program, it is important to keep in mind the unique characteristics of this court and its pilot program. It is particularly important to remember that the pilot program was essentially an expansion of the court’s preexisting mediation program, because this was significant for whether it was possible to measure the pilot program’s full impact through pre-/post-program comparisons.
290
D. Data and Methods Used in Study of Contra Costa Pilot Program
This section provides a brief description of the data and methods used in the analysis of the Contra Costa pilot program in this study. (See Section I.B. for more information on the overall data and methods used in this report.)
Data Several data sources were used in this study of the Contra Costa Pilot Program.
Data on Trial Rate, Disposition Time, and Court’s Workload As more fully described in Section I.B., the primary source of data for assessing the pilot program’s impact on trial rate, disposition time, and court workload was the court’s case management system. For program cases, only data concerning cases filed in 2000 and 2001 were used; cases filed more recently were not used because there was not sufficient follow-up time for tracking their final outcomes. In order to do pre-/post-program comparisons, data on cases filed in 1999 was also used. While all general civil cases were eligible for referral to mediation, certain case types, such as complex cases, had few or no cases referred to mediation under the pilot program. These case types were excluded from the analysis sample. As noted above, civil cases in Contra Costa Superior Court have historically been disposed of in a relatively short time. By the end of data collection for this study in June 2003, the court had disposed of 97 percent of the eligible cases filed in 1999, 95 percent of those filed in 2000, and 90 percent of those filed in 2001. This high disposition rate enhances the overall reliability of the study’s results because the final outcomes of almost all the cases in the study group are known.
Data on Litigant Satisfaction and Costs As is also more fully described in Section I.B., analysis of program impact on litigant satisfaction and costs was based on data from surveys distributed (1) to attorneys and parties who went to mediation between July 2001 and June 2002 (“postmediation survey”) and (2) to parties and attorneys in stipulated and nonstipulated cases that reached disposition during the same period (“postdisposition survey”).
Methods Unlike in the pilot courts with mandatory programs, in Contra Costa, there was no randomly assigned control group of cases in which the pilot program was not available, so program-control group comparisons could not be used to examine the impacts of the Contra Costa pilot program. Instead, two other types of comparisons were used: (1) comparisons between cases filed before the pilot program began and cases filed after the program began (pre-/post-program comparisons), and (2) comparisons between cases in which the parties stipulated to mediation and those in which the parties did not stipulate
291
to mediation. Both of these methods had limitations in determining the impact of Contra Costa’s pilot program.
Pre-/Post-program Comparisons Pre-/post-program comparisons were used to examine the Contra Costa pilot program’s impact on the trial rate, time to disposition, and court workload. As noted in Section I.B. in pre-/post-program comparisons, data concerning a particular outcome measure, such as the trial rate, for all cases filed in 1999 that would have met the program eligibility criteria (pre-program cases) is compared with data on that outcome measure for all eligible cases filed in 2000 (program cases). Other things being equal, any observed difference in the outcome between 1999 and 2000 cases can be attributed to the impact of the pilot program. There are two things to note about the use of this method in examining the Contra Costa program. First, the pre-/post-program comparison method measures the impact of the changes that were introduced in the “post” program period. However, in Contra Costa, as noted above in program description, the pilot program was a continuation of an existing mediation program with some changes in program design, including higher qualification requirements for panel mediators and a greater emphasis on parties’ voluntary use of the mediation. Many of the basic mediation program features, including the timelines for case management conferences and mediation sessions, remained largely same in both the “pre” and “post” program periods. Thus, in Contra Costa, the results from pre-/post-program comparisons do not provide information about the impact of having voluntary mediation services available to the litigants compared to no mediation program at all; these results show only the added impact of the incremental changes introduced by the pilot program compared to the preexisting mediation program. Because these changes were fairly small, the differences found in the pre-/post-program comparisons are also fairly small. Second, in order for differences in the outcomes found in these pre-/post-program comparisons to be attributable to the impact of the pilot program, the only difference in the nature or treatment of the pre-program and the program cases must be the introduction of the pilot program. In Contra Costa Superior Court, there were no known differences in the characteristics of the cases filed in 1999 and 2000.296 However, there was one other change in civil case management practices introduced in 2000 that may have impacted the pre-/post-program comparisons, particularly those concerning court workload. In 2000, the court implemented a Complex Litigation Pilot Program. While cases that were designated as complex cases in the court’s case management system were identified and excluded from the pre-/post-program comparison in this study, there were some cases in the post-program period that were included in the Complex Litigation Pilot Program but that could not be screened out from the pre-/post-program comparison. Since the Complex Litigation Pilot Program involves intensive case management by the court, these cases were far more likely to have had larger numbers of case management conferences.
296 Comparisons showed that the proportion of different case types filed in each year was the same.
292
Comparisons Between Stipulated and Nonstipulated Cases Comparisons between eligible cases in which the parties stipulated to mediation and eligible cases in which the parties did not stipulate to mediation were used to examine the Contra Costa pilot program’s impact on litigant costs and satisfaction, as well as to provide additional information about trial rates, time to disposition, and court workload. As discussed in Section I.B., there are important limitations to these comparisons because stipulated and nonstipulated cases are qualitatively different from each other. One of the clearest differences between these two groups in Contra Costa was that the nonstipulated group included a large percentage of cases that reached disposition within six months of filing with few court events and very few trials (“easy” cases) while the stipulated group included almost none of these cases. Two additional comparisons were therefore made to try to account for the differences in the characteristics of stipulated and nonstipulated cases. First, outcomes in only those stipulated and nonstipulated cases that reached disposition in more than six months were compared. Second, using regression analysis, comparisons were made between stipulated cases and nonstipulated cases with similar case characteristics. In this regression analysis, the variables taken into account included all the case characteristics about which data was available in this study as well as whether the case resolved within 6 months of filing or in over 18 months after filing. However, as noted in the methods Section I.B., it is almost certain that there were additional “unknown” case characteristics that were not appropriately accounted for in these regressions. Therefore, the findings from regression analyses reported below should be interpreted with caution.
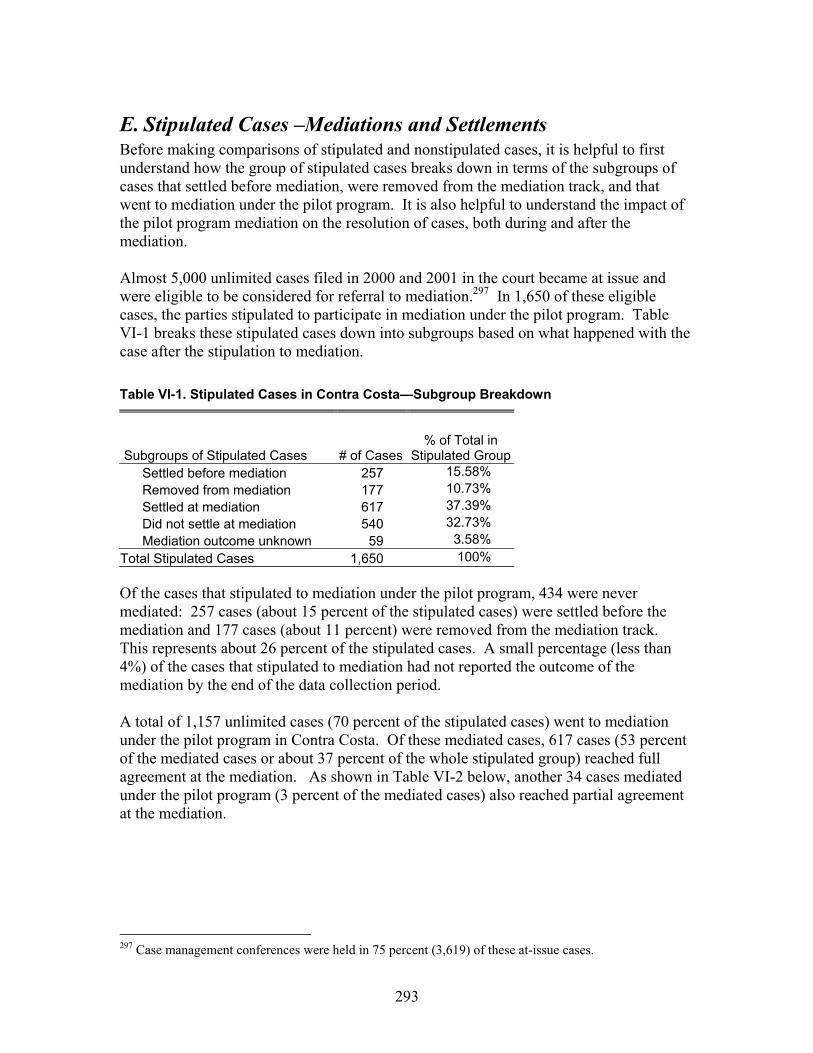
293
E. Stipulated Cases –Mediations and Settlements Before making comparisons of stipulated and nonstipulated cases, it is helpful to first understand how the group of stipulated cases breaks down in terms of the subgroups of cases that settled before mediation, were removed from the mediation track, and that went to mediation under the pilot program. It is also helpful to understand the impact of the pilot program mediation on the resolution of cases, both during and after the mediation. Almost 5,000 unlimited cases filed in 2000 and 2001 in the court became at issue and were eligible to be considered for referral to mediation.297 In 1,650 of these eligible cases, the parties stipulated to participate in mediation under the pilot program. Table VI-1 breaks these stipulated cases down into subgroups based on what happened with the case after the stipulation to mediation. Table VI-1. Stipulated Cases in Contra Costa—Subgroup Breakdown
Subgroups of Stipulated Cases # of Cases% of Total in
Stipulated GroupSettled before mediation 257 15.58% Removed from mediation 177 10.73% Settled at mediation 617 37.39% Did not settle at mediation 540 32.73% Mediation outcome unknown 59 3.58%
Total Stipulated Cases 1,650 100% Of the cases that stipulated to mediation under the pilot program, 434 were never mediated: 257 cases (about 15 percent of the stipulated cases) were settled before the mediation and 177 cases (about 11 percent) were removed from the mediation track. This represents about 26 percent of the stipulated cases. A small percentage (less than 4%) of the cases that stipulated to mediation had not reported the outcome of the mediation by the end of the data collection period. A total of 1,157 unlimited cases (70 percent of the stipulated cases) went to mediation under the pilot program in Contra Costa. Of these mediated cases, 617 cases (53 percent of the mediated cases or about 37 percent of the whole stipulated group) reached full agreement at the mediation. As shown in Table VI-2 below, another 34 cases mediated under the pilot program (3 percent of the mediated cases) also reached partial agreement at the mediation.
297 Case management conferences were held in 75 percent (3,619) of these at-issue cases.
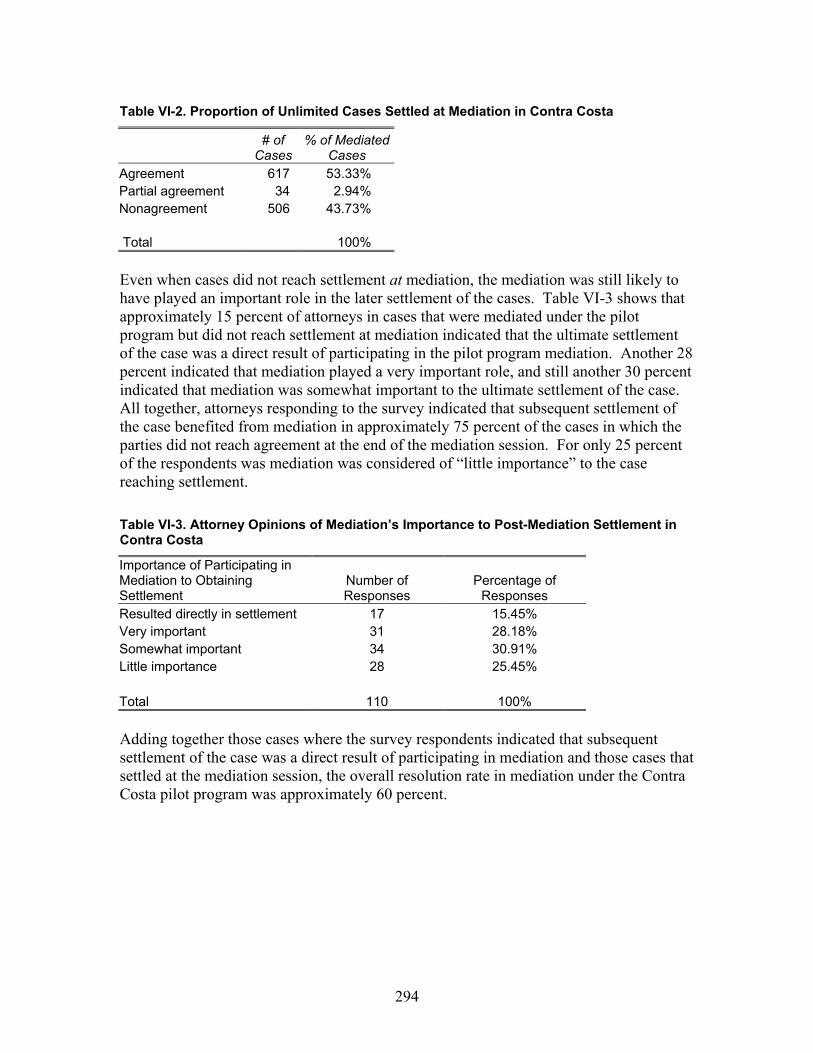
294
Table VI-2. Proportion of Unlimited Cases Settled at Mediation in Contra Costa
# of
Cases % of Mediated
Cases Agreement 617 53.33% Partial agreement 34 2.94% Nonagreement 506 43.73% Total 100% Even when cases did not reach settlement at mediation, the mediation was still likely to have played an important role in the later settlement of the cases. Table VI-3 shows that approximately 15 percent of attorneys in cases that were mediated under the pilot program but did not reach settlement at mediation indicated that the ultimate settlement of the case was a direct result of participating in the pilot program mediation. Another 28 percent indicated that mediation played a very important role, and still another 30 percent indicated that mediation was somewhat important to the ultimate settlement of the case. All together, attorneys responding to the survey indicated that subsequent settlement of the case benefited from mediation in approximately 75 percent of the cases in which the parties did not reach agreement at the end of the mediation session. For only 25 percent of the respondents was mediation was considered of “little importance” to the case reaching settlement. Table VI-3. Attorney Opinions of Mediation’s Importance to Post-Mediation Settlement in Contra Costa
Importance of Participating in Mediation to Obtaining Settlement
Number of Responses
Percentage of Responses
Resulted directly in settlement 17 15.45% Very important 31 28.18% Somewhat important 34 30.91% Little importance 28 25.45% Total 110 100% Adding together those cases where the survey respondents indicated that subsequent settlement of the case was a direct result of participating in mediation and those cases that settled at the mediation session, the overall resolution rate in mediation under the Contra Costa pilot program was approximately 60 percent.
295
F. Impact of Contra Costa’s Pilot Program on Trial Rates
Summary of Findings No statistically significant reduction in the trial rate in Contra Costa was found in this study: • In a pre-/post-program comparison, the trial rate for all eligible cases filed in 2000
(the first year of the pilot program) was virtually the same, at four percent, as for cases filed in 1999 (the year before the pilot program began).
• The trial rate among cases in which the litigants stipulated to mediation and that
reached disposition in more than 6 months was lower than the trial rate among nonstipulated cases that reached disposition in the same period, but the differences in trial rates between these two groups was not statistically significant.
However, this does not necessarily indicate that the pilot program had no impact on the trial rate; there were limitations associated with both these comparisons that made it difficult to clearly see all program impacts.
Introduction This section examines the impact of the pilot program in Contra Costa on the trial rate. First, a comparison between the proportion of pre-program and program cases that went to trial (pre-/post-program comparisons) is presented. Second, trial rates in stipulated and nonstipulated cases filed in 2000 and 2001 are compared, including comparisons of cases that reached disposition in six or more months and comparisons made using regression analysis. However, for the reasons noted above in Section I.B., there are important limitations on the results of both these comparisons.
Pre-/Post-Program Comparison of Trial Rates Table VI-4 compares the trial rates for closed cases filed in 1999, the year before the pilot program began, and 2000, the first year of the pilot program. There was no statistically significant difference in the trial rates in these two groups; the trial rates are nearly identical at 4.20 percent for cases filed in 1999 and 4.13 percent for cases filed in 2000. It is important to remember, as discussed in Section I.B., that because the pilot program in Contra Costa was an expansion of a preexisting court mediation program with some incremental changes in program design, this pre-/post-program comparison shows only the impact on the trial rate that is attributable to the new program features introduced by the pilot program – the higher mediator qualifications and greater emphasis on voluntary agreement to mediate. The similarity in trial rates in the pre-/post-program periods indicate only that these changes in program design did not appreciably impact the overall trial rate in the court, it does not necessarily mean that the courts’ mediation pilot program had no impact on the trial rate.
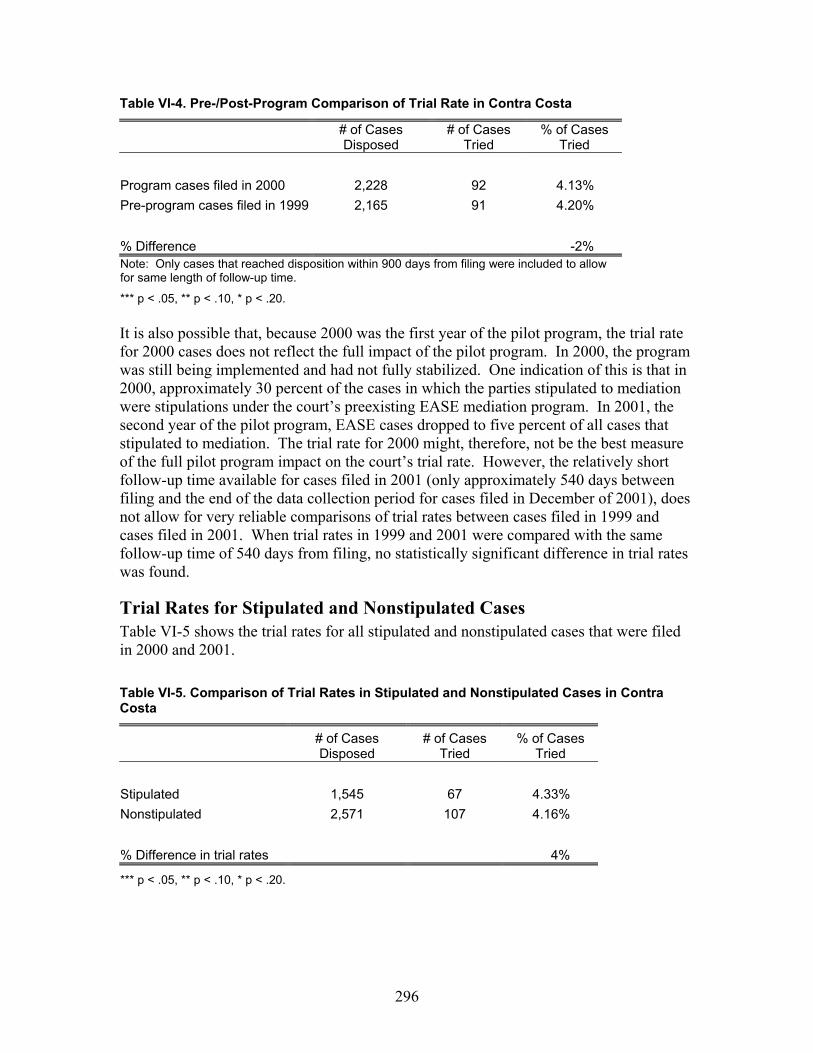
296
Table VI-4. Pre-/Post-Program Comparison of Trial Rate in Contra Costa
# of Cases Disposed
# of Cases Tried
% of Cases Tried
Program cases filed in 2000 2,228 92 4.13% Pre-program cases filed in 1999 2,165 91 4.20% % Difference -2% Note: Only cases that reached disposition within 900 days from filing were included to allow for same length of follow-up time.
*** p < .05, ** p < .10, * p < .20. It is also possible that, because 2000 was the first year of the pilot program, the trial rate for 2000 cases does not reflect the full impact of the pilot program. In 2000, the program was still being implemented and had not fully stabilized. One indication of this is that in 2000, approximately 30 percent of the cases in which the parties stipulated to mediation were stipulations under the court’s preexisting EASE mediation program. In 2001, the second year of the pilot program, EASE cases dropped to five percent of all cases that stipulated to mediation. The trial rate for 2000 might, therefore, not be the best measure of the full pilot program impact on the court’s trial rate. However, the relatively short follow-up time available for cases filed in 2001 (only approximately 540 days between filing and the end of the data collection period for cases filed in December of 2001), does not allow for very reliable comparisons of trial rates between cases filed in 1999 and cases filed in 2001. When trial rates in 1999 and 2001 were compared with the same follow-up time of 540 days from filing, no statistically significant difference in trial rates was found.
Trial Rates for Stipulated and Nonstipulated Cases Table VI-5 shows the trial rates for all stipulated and nonstipulated cases that were filed in 2000 and 2001. Table VI-5. Comparison of Trial Rates in Stipulated and Nonstipulated Cases in Contra Costa
# of Cases Disposed
# of Cases Tried
% of Cases Tried
Stipulated 1,545 67 4.33% Nonstipulated 2,571 107 4.16% % Difference in trial rates 4%
*** p < .05, ** p < .10, * p < .20.
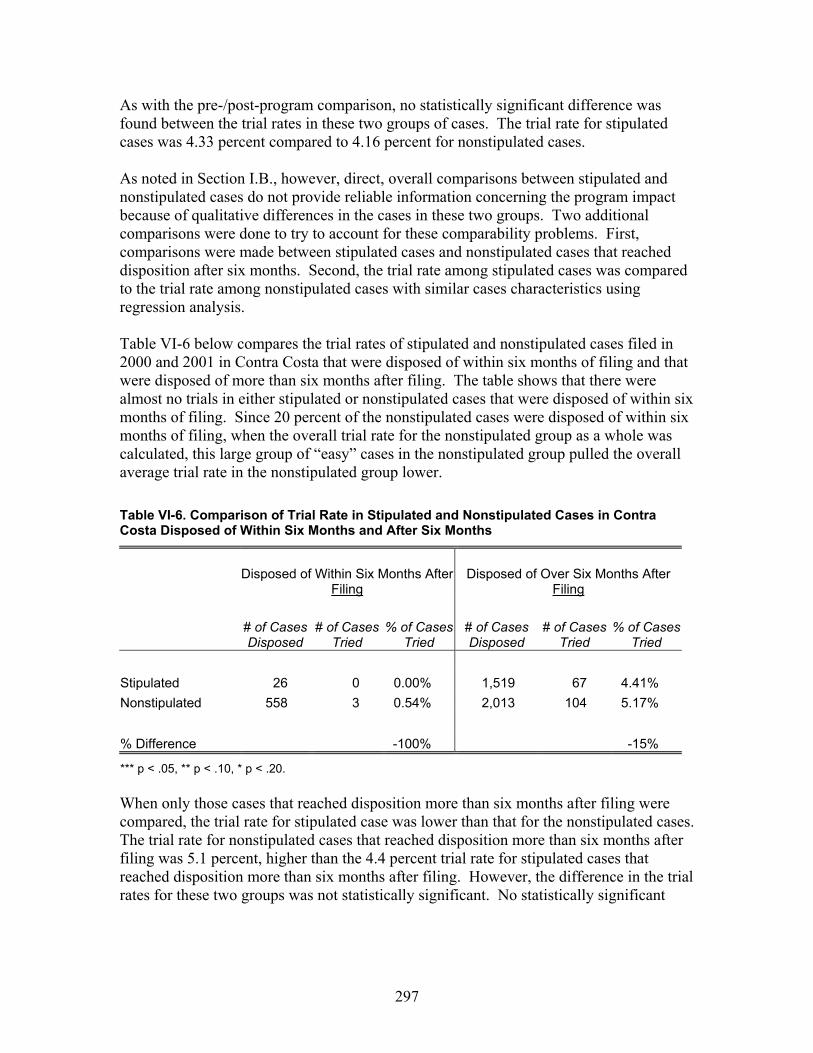
297
As with the pre-/post-program comparison, no statistically significant difference was found between the trial rates in these two groups of cases. The trial rate for stipulated cases was 4.33 percent compared to 4.16 percent for nonstipulated cases. As noted in Section I.B., however, direct, overall comparisons between stipulated and nonstipulated cases do not provide reliable information concerning the program impact because of qualitative differences in the cases in these two groups. Two additional comparisons were done to try to account for these comparability problems. First, comparisons were made between stipulated cases and nonstipulated cases that reached disposition after six months. Second, the trial rate among stipulated cases was compared to the trial rate among nonstipulated cases with similar cases characteristics using regression analysis. Table VI-6 below compares the trial rates of stipulated and nonstipulated cases filed in 2000 and 2001 in Contra Costa that were disposed of within six months of filing and that were disposed of more than six months after filing. The table shows that there were almost no trials in either stipulated or nonstipulated cases that were disposed of within six months of filing. Since 20 percent of the nonstipulated cases were disposed of within six months of filing, when the overall trial rate for the nonstipulated group as a whole was calculated, this large group of “easy” cases in the nonstipulated group pulled the overall average trial rate in the nonstipulated group lower. Table VI-6. Comparison of Trial Rate in Stipulated and Nonstipulated Cases in Contra Costa Disposed of Within Six Months and After Six Months
Disposed of Within Six Months After
Filing Disposed of Over Six Months After
Filing
# of Cases Disposed
# of Cases Tried
% of Cases Tried
# of Cases Disposed
# of Cases Tried
% of Cases Tried
Stipulated 26 0 0.00% 1,519 67 4.41% Nonstipulated 558 3 0.54% 2,013 104 5.17% % Difference -100% -15%
*** p < .05, ** p < .10, * p < .20. When only those cases that reached disposition more than six months after filing were compared, the trial rate for stipulated case was lower than that for the nonstipulated cases. The trial rate for nonstipulated cases that reached disposition more than six months after filing was 5.1 percent, higher than the 4.4 percent trial rate for stipulated cases that reached disposition more than six months after filing. However, the difference in the trial rates for these two groups was not statistically significant. No statistically significant
298
difference was found either when stipulated cases were compared to nonstipulated cases with similar characteristics using regression analysis.298 There are similarities between the Contra Costa pilot program and the programs in San Diego and Los Angeles that suggest that this result may simply reflect the difficulties in making comparisons between stipulated and nonstipulated cases. The Contra Costa pilot program shared many features with the programs in San Diego and Los Angeles programs. All these programs used case management conferences conducted by judges to consider mediation referrals, the conferences were conducted at similar times (approximately five months after filing on average in San Diego and Los Angeles and six months after filing in Contra Costa), the rate of referrals to mediation were similar (47 percent in San Diego and 41299 percent in Los Angeles and Contra Costa300), the rate of mediations among referred cases were similar (68 percent in San Diego, 71 percent in Los Angeles, and percent in 70 Contra Costa), these mediations were held at similar times (approximately eight months on average after filing in San Diego and Los Angeles and nine months after filing in Contra Costa), and the mediation settlement rates in San Diego (58 percent) and Contra Costa (60 percent) were similar. All of these courts also had prior experience with court mediation programs and generally disposed of their civil cases relatively quickly. Given these similarities, there is a strong possibility that not finding a statistically significant difference in the trial rates of stipulated and nonstipulated cases in Contra Costa does not show that the pilot program had no impact on trial rates, but instead reflects the difficulties in identifying program impact through this stipulated/nonstipulated case comparison.
Conclusion No statistically significant reduction in the trial rate was found either in comparisons between cases filed before and after the program began or in comparisons between cases in which the litigants stipulated to mediation and those in which they did not. However, this does not necessarily indicate that the pilot program had no impact on the trial rate; there were limitations associated with the comparisons that made it difficult to clearly see program impacts.
298 As noted in Section I.B., this analysis controlled for those case characteristics about which data was available from the case management system. However, it is almost certain that there were additional “unknown” case characteristics that were not appropriately accounted for in these regressions. Therefore, findings from these analyses should be interpreted with caution. 299 As noted above, the referral rate in Los Angeles would be higher if it were calculated in the same way as for the other courts (using only at-issue cases as the base number of eligible cases), but it was not possible to accurately identify at-issue cases from the courts case management system data. 300 As noted above, this was the referral rate during the second year of the Contra Costa pilot program. During the first year of the program, a substantial number of cases were still being referred to the court’s preexisting program.
299
G. Impact of Contra Costa’s Pilot Program on Case Disposition Time
Summary of Findings The pilot program in Contra Costa had a positive impact on case disposition time, although the size of the impact was small: • The pre-/post-program comparison suggests that the median disposition time for cases
filed after the pilot program began was shorter than the median disposition time for cases filed before the program began.
• The disposition rate for post-program cases was higher than that for pre-program
cases for the entire 34-month follow-up period, indicating that the pilot program reduced disposition time. The higher disposition rate for post-program cases was clearest between 6 and 12 months after filing, when it ranged from about 1.5 to 3 percent higher than that for pre-program cases.
• In overall, direct comparisons, cases in which the parties stipulated to mediation had a
longer average disposition time compared to nonstipulated cases. However, in direct comparisons of only those cases disposed of in over six months, there was essentially no difference in either the average or median time to disposition in the stipulated and nonstipulated groups.
• While nonstipulated cases began to resolve earlier than stipulated cases, from 9 to 18
months after filing, stipulated cases were disposed of at a faster pace than nonstipulated cases and ultimately more stipulated than nonstipulated cases had reached disposition by the end of 18 months after filing. The pace of dispositions for stipulated cases was fastest at 9 months after filing, about the time that mediations took place, suggesting that mediations increased the pace of dispositions among stipulated cases.
• The data suggests that average disposition time for stipulated cases that settled at
mediation was shorter than the disposition time of that like nonstipulated cases. Conversely, the data indicates that stipulated cases that did not settle at mediation took longer to reach disposition than similar nonstipulated cases. This suggests the importance of carefully selecting cases for referral to mediation.
Introduction This section presents an analysis of the Contra Costa pilot program’s impact on time to disposition. Similar to the previous section on trial rates, a pre-/post-program comparison is presented first, including comparisons both of the average and median time to disposition and the rate of disposition over time. Second, comparisons of case disposition time in cases that stipulated to mediation and those that did not stipulate to
300
mediation are presented, including both the average and median time to disposition and the rate of disposition over time. Finally, different patterns of disposition time for various subgroups of cases within the stipulated group are also presented.
Overall Comparisons of Disposition Time in Pre-/Post-Program Cases
Comparison of Average and Median Disposition Time Table VI-7 below compares the average and median301 time to disposition for cases filed in 1999, the year before the pilot program started (pre-program cases), and 2000, the year after the pilot program started (program cases). Table VI-7. Pre-/Post-Program Comparison of Disposition Time (in Days) in Contra Costa
Number of
cases Average Median Program cases filed in 2000 2,228 358 328 Pre-program cases filed in 1999 2,165 359 336 Differences -1 -8* *** p < .5, ** p < .10, * p < .20. As this table shows, the median disposition time for cases filed after the pilot program began was 8 days shorter than the median disposition time for cases filed before the program began, but the difference was only marginally statistically significant. This suggests that Contra Costa’s pilot program may have resulted in a small reduction in the overall median disposition time for unlimited cases.
Comparison of Case Disposition Timing To better understand at what point in the litigation process the pilot program had its impact on the overall time to disposition, the patterns of case disposition rate over time from the filing of the complaint were examined. This analysis also provides information about whether the program impact on time to disposition happened around the time when certain program elements, such as case management conferences and mediations, generally took place. Figure VI-2 compares the timing of case disposition among pre-program and post-program cases.302 The horizontal axis represent time (in months) from filing until disposition of a case, and the vertical axis represent the cumulative proportion of cases disposed (or disposition rate). The wider, purple line represents the post-program disposition rate, and the thinner, black line represents the pre-program disposition rate. The gap between these two lines represents the difference in the disposition rates among pre-program and post-program cases at a given time from the filing of a complaint. The
301 Median represents the value at the 50th percentile, with half of the cases reaching disposition before and half after the median time. 302 We combined the data for cases filed in 2000 and 2001, as the data for both years as showed similar patterns in disposition rate over time.

301
slope of the lines represents the pace at which cases were reaching disposition at a particular point in time; a steeper slope indicates that more cases were reaching disposition at that time.
Figure VI-2. Comparison of Case Disposition Rate for Cases Filed Before and After Program in Contra Costa
The overall pattern of case disposition rates in the two groups is very similar. However, the disposition rate for post-program cases was actually higher than that for pre-program cases for the entire 34-month follow-up period, indicating that the pilot program reduced disposition time. The higher disposition rate for post-program cases is clearest between 6 and 12 months after filing. During this period, the disposition rate for post-program cases ranged from about 1.5 to 3 percent higher than that for pre-program cases. This difference was largest at 11 months after filing, when 48 percent of the post-program cases had reached disposition compared to only 45 percent in the pre-program group. While this difference is small, it is statistically significant. Near the end of the 34-month follow-up period, post-program cases also had a slightly higher disposition rate compared to pre-program cases. However, this difference, a little more than one percent higher for post-program cases, is not statistically significant. As with trial rates, the general similarity in the overall average and median disposition time and in the patterns of case disposition rates between pre-/post-program cases appears to reflect the fact that the pilot program was an expansion of a mediation program that was already operating in the court in 1999.
Filed in 2000 and 2001 Filed in 1999
0%
20%
40%
60%
80%
100%
1 3 5 7 9 11 13 15 17 19 21 23 25 27 29 31 33
Month from filing
Cum
ulat
ive
disp
ositi
on ra
te
CMC held at 6 months
Went to mediation at 9 months
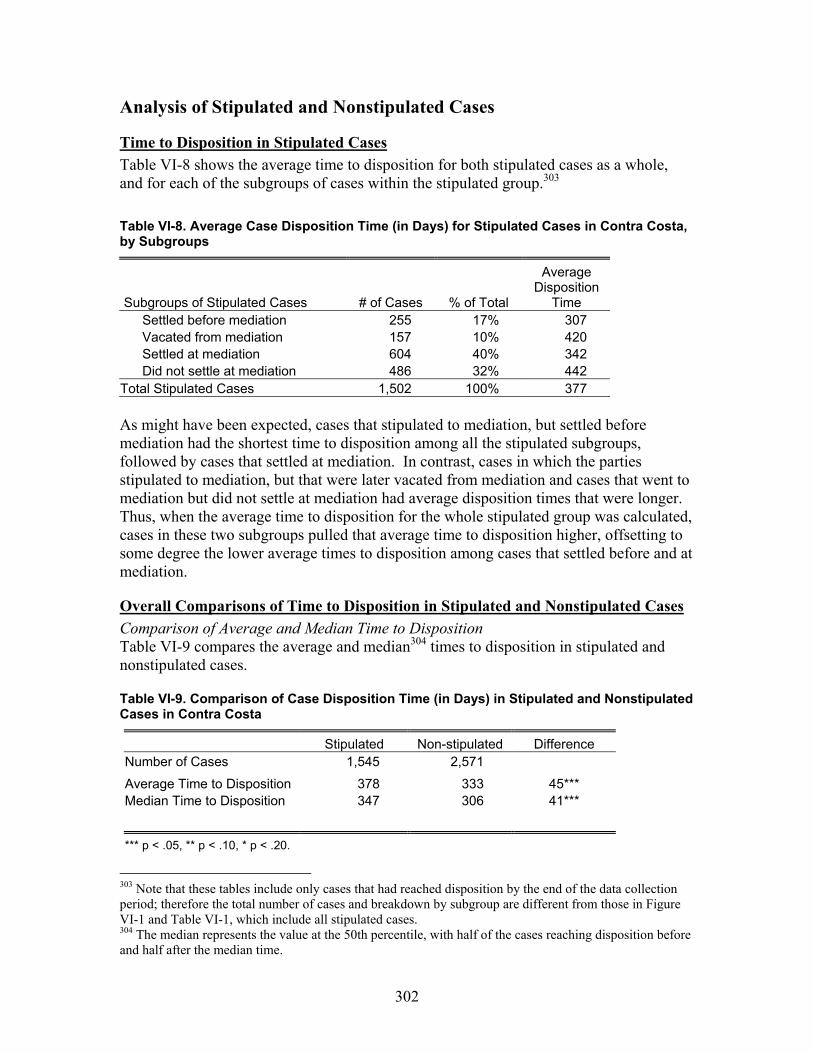
302
Analysis of Stipulated and Nonstipulated Cases
Time to Disposition in Stipulated Cases Table VI-8 shows the average time to disposition for both stipulated cases as a whole, and for each of the subgroups of cases within the stipulated group.303 Table VI-8. Average Case Disposition Time (in Days) for Stipulated Cases in Contra Costa, by Subgroups
Subgroups of Stipulated Cases # of Cases % of Total
Average Disposition
Time Settled before mediation 255 17% 307 Vacated from mediation 157 10% 420 Settled at mediation 604 40% 342 Did not settle at mediation 486 32% 442
Total Stipulated Cases 1,502 100% 377 As might have been expected, cases that stipulated to mediation, but settled before mediation had the shortest time to disposition among all the stipulated subgroups, followed by cases that settled at mediation. In contrast, cases in which the parties stipulated to mediation, but that were later vacated from mediation and cases that went to mediation but did not settle at mediation had average disposition times that were longer. Thus, when the average time to disposition for the whole stipulated group was calculated, cases in these two subgroups pulled that average time to disposition higher, offsetting to some degree the lower average times to disposition among cases that settled before and at mediation.
Overall Comparisons of Time to Disposition in Stipulated and Nonstipulated Cases Comparison of Average and Median Time to Disposition Table VI-9 compares the average and median304 times to disposition in stipulated and nonstipulated cases.
Table VI-9. Comparison of Case Disposition Time (in Days) in Stipulated and Nonstipulated Cases in Contra Costa
Stipulated Non-stipulated Difference Number of Cases 1,545 2,571
Average Time to Disposition 378 333 45*** Median Time to Disposition 347 306 41***
*** p < .05, ** p < .10, * p < .20.
303 Note that these tables include only cases that had reached disposition by the end of the data collection period; therefore the total number of cases and breakdown by subgroup are different from those in Figure VI-1 and Table VI-1, which include all stipulated cases. 304 The median represents the value at the 50th percentile, with half of the cases reaching disposition before and half after the median time.
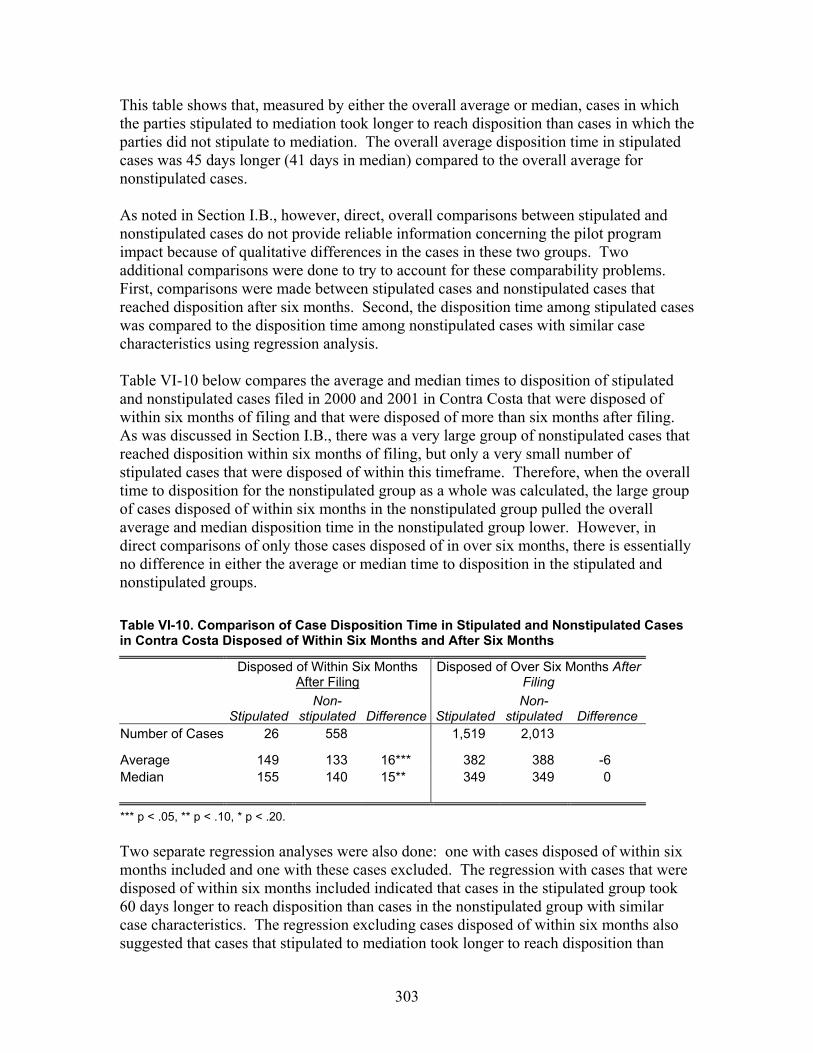
303
This table shows that, measured by either the overall average or median, cases in which the parties stipulated to mediation took longer to reach disposition than cases in which the parties did not stipulate to mediation. The overall average disposition time in stipulated cases was 45 days longer (41 days in median) compared to the overall average for nonstipulated cases. As noted in Section I.B., however, direct, overall comparisons between stipulated and nonstipulated cases do not provide reliable information concerning the pilot program impact because of qualitative differences in the cases in these two groups. Two additional comparisons were done to try to account for these comparability problems. First, comparisons were made between stipulated cases and nonstipulated cases that reached disposition after six months. Second, the disposition time among stipulated cases was compared to the disposition time among nonstipulated cases with similar case characteristics using regression analysis. Table VI-10 below compares the average and median times to disposition of stipulated and nonstipulated cases filed in 2000 and 2001 in Contra Costa that were disposed of within six months of filing and that were disposed of more than six months after filing. As was discussed in Section I.B., there was a very large group of nonstipulated cases that reached disposition within six months of filing, but only a very small number of stipulated cases that were disposed of within this timeframe. Therefore, when the overall time to disposition for the nonstipulated group as a whole was calculated, the large group of cases disposed of within six months in the nonstipulated group pulled the overall average and median disposition time in the nonstipulated group lower. However, in direct comparisons of only those cases disposed of in over six months, there is essentially no difference in either the average or median time to disposition in the stipulated and nonstipulated groups. Table VI-10. Comparison of Case Disposition Time in Stipulated and Nonstipulated Cases in Contra Costa Disposed of Within Six Months and After Six Months
Disposed of Within Six Months
After Filing Disposed of Over Six Months After
Filing
Stipulated Non-
stipulated Difference Stipulated Non-
stipulated Difference Number of Cases 26 558 1,519 2,013
Average 149 133 16*** 382 388 -6 Median 155 140 15** 349 349 0 *** p < .05, ** p < .10, * p < .20. Two separate regression analyses were also done: one with cases disposed of within six months included and one with these cases excluded. The regression with cases that were disposed of within six months included indicated that cases in the stipulated group took 60 days longer to reach disposition than cases in the nonstipulated group with similar case characteristics. The regression excluding cases disposed of within six months also suggested that cases that stipulated to mediation took longer to reach disposition than
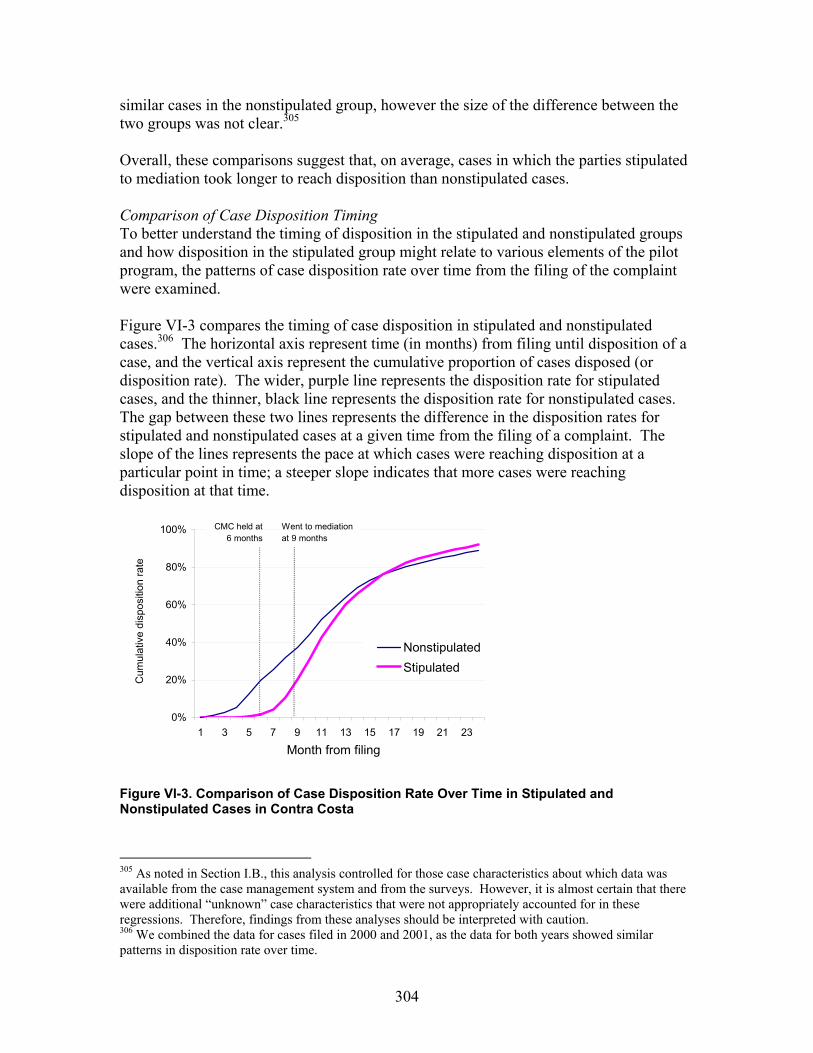
304
similar cases in the nonstipulated group, however the size of the difference between the two groups was not clear.305 Overall, these comparisons suggest that, on average, cases in which the parties stipulated to mediation took longer to reach disposition than nonstipulated cases. Comparison of Case Disposition Timing To better understand the timing of disposition in the stipulated and nonstipulated groups and how disposition in the stipulated group might relate to various elements of the pilot program, the patterns of case disposition rate over time from the filing of the complaint were examined. Figure VI-3 compares the timing of case disposition in stipulated and nonstipulated cases.306 The horizontal axis represent time (in months) from filing until disposition of a case, and the vertical axis represent the cumulative proportion of cases disposed (or disposition rate). The wider, purple line represents the disposition rate for stipulated cases, and the thinner, black line represents the disposition rate for nonstipulated cases. The gap between these two lines represents the difference in the disposition rates for stipulated and nonstipulated cases at a given time from the filing of a complaint. The slope of the lines represents the pace at which cases were reaching disposition at a particular point in time; a steeper slope indicates that more cases were reaching disposition at that time.
Figure VI-3. Comparison of Case Disposition Rate Over Time in Stipulated and Nonstipulated Cases in Contra Costa
305 As noted in Section I.B., this analysis controlled for those case characteristics about which data was available from the case management system and from the surveys. However, it is almost certain that there were additional “unknown” case characteristics that were not appropriately accounted for in these regressions. Therefore, findings from these analyses should be interpreted with caution. 306 We combined the data for cases filed in 2000 and 2001, as the data for both years showed similar patterns in disposition rate over time.
0%
20%
40%
60%
80%
100%
1 3 5 7 9 11 13 15 17 19 21 23
Month from filing
Cum
ulat
ive
disp
ositi
on ra
te
NonstipulatedStipulated
CMC held at 6 months
Went to mediation at 9 months
305
Figure VI-3 shows several things. First, it shows, as discussed in Section I.B., that six months after filing, approximately 20 percent of nonstipulated cases had already reached disposition whereas almost none of stipulated cases had reached disposition by that time. It also shows that the pace of dispositions accelerated to its fastest level at about 9 months after filing, about the time that the mediations occurred among stipulated cases, and then stayed higher than for nonstipulated cases until about 18 months after filing. Finally, this figure shows that at approximately 18 months after filing, the cumulative proportion of stipulated cases disposed of surpassed that for nonstipulated cases. Overall, this figure shows that while nonstipulated cases began to resolve earlier, beginning at about the time when, on average, mediations took place, stipulated cases were disposed of faster than nonstipulated cases and ultimately more stipulated than nonstipulated cases had reached disposition by the end of 18 months. The fact that the pace of dispositions among stipulated cases accelerated to its fastest level at about 9 months after filing suggests that participation in mediation may increase the rate of disposition for stipulated cases.
Analysis of Subgroups Within the Stipulated Group To better understand how different cases within the program were influenced by the elements of the pilot program that they experienced, the disposition time of stipulated cases in each of the subgroups was compared to the disposition time of similar nonstipulated cases.307 Two separate comparisons were done: one with cases disposed of within six months included and one with these cases excluded. The comparison that includes cases that were disposed of within six months indicated that cases in the stipulated group that went to mediation but did not resolve at mediation took 102 days longer to reach disposition than cases in the nonstipulated group with similar case characteristics. The comparison excluding cases disposed of within six months also suggested a negative impact on time to disposition when cases did not resolve at mediation, showing that cases that went to mediation but did not resolve at mediation took 67 days longer to reach disposition than cases in the nonstipulated group with similar case characteristics. In addition, this second comparison also suggested that there was a positive impact on the time to disposition for cases that settled at mediation compared to similar cases in the nonstipulated group, however the size of this impact was not clear.308 Overall, these results suggest that cases that resolve at mediation may be disposed of more quickly than they otherwise would have been, but that it takes even longer to reach disposition if cases do not resolve at mediation than it would have if the cases had not been mediated at all.
307 The regression analysis method described in the methods Section I.B. was used to make these subgroup comparisons. However, because it is almost certain that there were additional “unknown” case characteristics that were not appropriately accounted for in these regressions, the findings from these analyses should be interpreted with caution. 308 No statistically significant differences in the time to disposition were found between cases that settled before mediation or cases that were vacated from mediation and similar cases in the nonstipulated group.
306
Conclusion The pilot program in Contra Costa had a positive impact on case disposition time, although the size of the impact was small. In pre-/post-program comparisons, the median disposition time for cases filed after the pilot program began was shorter than the median disposition time for cases filed before the program began. These comparisons also showed that the disposition rate for post-program cases was higher than that for pre-program cases for the entire 34-month period studied, but most noticeably between 6 and 12 months after filing, when it ranged from about 1.5 to 3 percent higher than that for pre-program cases. Overall comparisons between stipulated and nonstipulated cases did not show any reduction in average disposition time. However, comparisons between disposition rates in these two groups showed that while nonstipulated cases began to resolve earlier than stipulated cases, from 9 to 18 months after filing, stipulated cases were disposed of at a faster pace than nonstipulated cases and ultimately more stipulated than nonstipulated cases had reached disposition by the end of 18 months after filing. The pace of dispositions for stipulated cases was fastest at 9 months after filing, about the time that mediations took place, suggesting that mediations increased the pace of dispositions among stipulated cases. The analysis also suggested that average disposition time for stipulated cases that settled at mediation was shorter than the disposition time of like nonstipulated cases. Conversely, the analysis suggested longer disposition time when stipulated cases did not settle at mediation. This suggests the importance of carefully selecting cases for referral to mediation.
307
H. Impact of Contra Costa’s Pilot Program on Litigant Satisfaction
Summary of Findings The pilot program in Contra Costa increased attorney satisfaction with the court’s services and the litigation process, and settling at mediation increased attorney satisfaction with the outcome, the litigation process, and the court’s services. • Both parties and attorneys in Contra Costa expressed high satisfaction when they used
mediation. They were particularly satisfied with the performance of the mediators; both parties and attorneys showed an average satisfaction score of approximately 6 on a 7-point scale. They also strongly agreed that the mediator and the mediation process were fair and that they would recommend both to others.
• Attorneys in stipulated cases were more satisfied with the overall litigation process
and services provided by the court compared to attorneys in nonstipulated cases; however, they were less satisfied with outcome of the case.
• Attorneys whose cases settled at mediation were significantly more satisfied with the
outcome of the case, their litigation experience, and with the services of the court compared to attorneys in like cases in the nonstipulated group.
• While attorneys whose cases did not settle at mediation were less satisfied with the
outcome of the case, they were still more satisfied with the court’s services than attorneys in similar nonstipulated cases. This suggests that participating in mediation increased attorneys’ satisfaction with the court’s services, regardless of whether their cases settled at mediation.
Introduction This section examines the impact of Contra Costa’s pilot program on litigant satisfaction. As described in detail in Section I.B., data on litigant satisfaction were collected in two ways. First, in a survey administered at the end of the mediation in cases that went to mediation between July 2001 and June 2002 (“postmediation survey”), both parties and attorneys were asked about their satisfaction with various aspects of their mediation and litigation experiences. Second, in a separate survey administered shortly after cases reached disposition in cases disposed of between July 2001 and June 2002 (“postdisposition survey”), parties and attorneys in both stipulated and nonstipulated cases were asked about their satisfaction with the outcome of their case, the court’s services, and their overall litigation experience. In this section, the satisfaction of parties and attorneys who used mediation under the pilot program is first described. Second, attorney satisfaction in stipulated and

308
nonstipulated cases, is compared.309 Finally, attorney satisfaction in the various subgroups within the stipulated group is examined.
Overall Litigant Satisfaction for Cases That Used Mediation As shown in Figure VI-4, both parties and attorneys who used mediation in the pilot program expressed very high levels of satisfaction with their experiences. Parties and attorneys who participated in mediation were asked to rate their satisfaction with the mediator’s performance, the mediation process, the outcome of the mediation, the litigation process, and the services provided by the court on a scale from 1 to 7 where 1 is “highly dissatisfied” and 7 is “highly satisfied.” Figure VI-4 shows the average satisfaction scores for both parties and attorneys in these mediated cases.
Figure VI-4. Average Party and Attorney Satisfaction in Mediated Cases in Contra Costa
It is clear from this figure that parties and attorneys who used mediation services in the pilot program were highly satisfied with all aspects of the mediation experience. Most of the scores were in the highly satisfied range (5.0 or above) and none was below 4.2. Both parties and attorneys were most satisfied with the performance of mediators, with average satisfaction scores of 6.1 for attorneys and 6.0 for parties. They were also highly satisfied with the mediation process and the services provided by the court, with average satisfaction scores about 5.4-5.8 for attorneys and 5.3 for parties. Both parties and attorneys were least satisfied with the outcome of the case; average outcome satisfaction scores were 4.9 for attorneys and 4.2 for parties. Both parties and attorneys who participated in pilot program mediations were also asked for their views concerning the fairness of the mediation and their willingness to
309 As was discussed above in Section I.B., since only a limited number of party responses to the postdisposition survey were received in nonstipulated cases, it was not possible to compare the satisfaction of parties in stipulated and nonstipulated cases. Therefore, all comparisons between stipulated and nonstipulated cases were based only on attorney responses to this survey.
4.2
4.8
5.3
5.3
6.0
4.9
5.1
5.4
5.8
6.1
1 2 3 4 5 6 7
Outcome of Case
Overall LitigationProcess
Court Services
MediationProcess
MediatorPerformance
Party AttorneyHighly
SatisfiedHighly Dissatisfied

309
recommend or use mediation again. Using a 1–5 scale, where 1 is “strongly disagree” and 5 is “strongly agree,” litigants were asked to indicate whether they agreed that the mediator treated the parties fairly, that the mediation process was fair, and that the mediation resulted in a fair/reasonable outcome. They were also asked whether they agreed that they would recommend the mediator to friends with similar cases, that they would recommend mediation to such friends, and that they would use mediation even if they had to pay the full cost of the mediation. Table VI-11 shows parties’ and attorneys’ average level of agreement with these statements. Table VI-11. Party and Attorney Perceptions of Fairness and Willingness to Recommend or Use Mediation in Contra Costa (average agreement with statement)
Mediator Treated All
Parties Fairly
Mediation Process Was
Fair
Mediation Outcome Was
Fair/ Reasonable
Would Recommend Mediator to
Friends
Would Recommend Mediation to
Friends
Would Use Mediation at
Full Cost
Parties Attys Parties Attys Parties Attys Parties Attys Parties Attys Parties Attys
4.5 4.7 4.2 4.6 3.1 3.5 4.3 4.5 4.2 4.6 3.5 4.1 As with the satisfaction scores, most of the scores were in the “strongly agree” range (above 4.0) and all of the average scores were above the middle of the agreement scale (3.0). .310 For both parties and attorneys there was very strong agreement (average score of 4.2 or above for parties and 4.5 or above for attorneys) that the mediator treated the parties fairly, that the mediation process was fair, that they would recommend the mediator to friends with similar cases, and that that they would recommend mediation to such friends. Both parties and attorneys indicated less agreement that they would use mediation if they had to pay the full cost; the average score was 3.5 for parties and 4.1 for attorneys. The lowest scores related to the fairness/reasonableness of the mediation outcome, at only 3.1 for parties and 3.5 for attorneys. It is clear from the responses to both these sets of questions that while parties and attorneys were generally very pleased with their mediation experiences, overall they were less pleased or neutral in terms of the outcome of the mediation process (in fact, on both outcome questions, about more than 20 percent of the parties and attorneys responded that they were neutral). In evaluating this result, it is important to remember that this survey was administered at the end of the mediation and that in a large proportion of cases a settlement was not reached at end of the mediation. Not surprisingly, the way parties and attorneys responded to the two outcome questions depended largely on whether their cases settled at mediation. Average satisfaction with the outcome in cases that settled at pilot program mediations was 5.93 for attorneys and 5.15 for parties on a 7-point scale, almost 60 percent higher than the average scores of 3.78 for attorneys and 3.22 for parties in cases that did not settle at mediation. Similarly, in cases settled at mediation, responses concerning the fairness/reasonableness of the outcome averaged 4.24 for attorneys and 3.79 for parties on a 5-point scale, more than 60 percent higher 310 A 5-point scale was used for these survey questions, rather than the 7-point scale used in the satisfaction questions.
310
than the 2.58 for attorneys and 2.32 for parties in cases that did not settle at mediation. When the scores in both cases settled and not settled at mediation were added together to calculate the overall average, the higher scores in cases that settled were offset by those in cases that did not, pulling the overall average lower. It is also clear from the responses to both these sets of questions that while both parties and attorneys were generally very pleased with their pilot program mediation experiences, attorneys were more pleased than parties. Attorneys’ average scores were consistently higher than those of parties on all of these questions. Attorney satisfaction scores ranged from .1 higher than party scores (for satisfaction with the mediator’s performance) to .7 higher (for satisfaction with the outcome). The higher attorney satisfaction may reflect a greater understanding on the part of attorneys about what to expect from the mediation process. Given that there was a court-connected mediation program in Contra Costa before the pilot program was introduced, many attorneys are likely to have participated in mediations before, so they are likely to have been familiar with the mediation process and to have based their expectations about the process on this knowledge. Parties are less likely to have participated in previous mediations and may not have known what to expect from the mediation process. This may suggest the need for additional educational efforts targeted at parties, rather than attorneys. The higher scores by attorneys may also, in part, reflect the fact that attorneys’ and parties’ satisfaction was associated with different aspects of their mediation experiences. Attorneys’ responses on only three of the survey questions were strongly correlated with their responses concerning satisfaction with the mediation process—whether they believed that the mediation process was fair, that the mediation resulted in a fair/reasonable outcome, and that the mediation helped move the case toward resolution quickly.311 In contrast, parties’ satisfaction with the mediation process was also strongly correlated with whether they believed that the mediation helped improve communication between the parties, that the mediator treated all parties fairly, and that the cost of using mediation was affordable.312 Attorneys’ responses to only two of the survey questions were strongly correlated with their responses regarding satisfaction with the outcome of the mediation—whether they believed that the mediation resulted in a fair/reasonable outcome and that the mediation helped move the case toward resolution quickly.313 In contrast, parties’ satisfaction with 311 Correlation measures how strongly two variables are associated with each other, i.e., when one of the variables changes, how likely is the other to change (this does not necessarily mean that the change in one caused the change in the other, but just that they tend to move together). Correlation coefficients range from -1 to 1; a value of 0 means that there was no relationship between the variables, a value of 1 means there was a total positive relationship (when one variable changes, the other always changes the same direction), and a value of -1 means a total negative relationship (when one changes, the other always changes in the opposite direction). A correlation coefficient of .5 or above is considered to show a high correlation. The correlation coefficients of these questions with attorneys’ satisfaction with the mediation process were .54, .58, and .60, respectively. 312The correlation coefficients of these questions with parties’ satisfaction with the mediation process were .58, .50, and .58, respectively. 313The correlation coefficients of these questions with attorneys’ satisfaction with the outcome were .79 and .73, respectively.

311
the mediation outcome was also strongly correlated with whether they believed that the mediation helped improve communication between the parties and that the cost of using mediation was affordable.314 Finally, for attorneys, there was no strong or even moderate correlation between any of their responses to these survey questions and their satisfaction with either the litigation process or the services provided by the court. In contrast, parties’ satisfaction with the litigation process was moderately correlated with whether they believed that the mediation helped improve communication between the parties, helped preserved the parties’ relationship, helped move the case toward resolution quickly, resulted in a fair/reasonable outcome, was affordable, and was fair.315 Similarly, parties’ satisfaction with the court services was correlated with their responses to whether they believed the that mediation process was fair and that the cost of using mediation was affordable.316 All of this indicates that parties’ satisfaction with both the court and the mediation was much more closely associated than for attorneys with what happened within the mediation process—whether they felt the mediation helped with their communication or relationship with the other party—and whether they believed that the cost of mediation was affordable. Only moderate percentages of parties thought that the mediation had improved the communication between the parties (58 percent) or preserved the parties’ relationship (28 percent),317 and only a moderate percentage thought that the cost of mediation was affordable (62 percent). These perceptions may therefore have contributed to lower satisfaction scores from parties than from attorneys.
Attorney Satisfaction in Stipulated Cases Table VI-12 shows the average satisfaction scores for attorneys in stipulated cases as a whole and for each of the subgroups of stipulated cases. As can be seen in Table VI-12, cases that settled at mediation had the highest satisfaction scores on all three satisfaction measures–outcome of the case, the services provided by the court, and the litigation process. Satisfaction with the outcome and the litigation process was also high in cases that settled before mediation. In addition, satisfaction with the court’s services was relatively high in cases that did not settle at mediation. In contrast, cases that did not settle at mediation had the lowest average satisfaction with the outcome of the case. The lower satisfaction with the outcome in this subgroup helps explain the relatively low overall satisfaction with the outcome for the stipulated group as a whole: when the average for the whole stipulated group was calculated, cases in this subgroup pulled that average satisfaction score lower, offsetting to some degree the higher average satisfaction in cases that settled before and at mediation. 314The correlation coefficients of these questions with parties’ satisfaction with the outcome were .60 and .51, respectively. 315The correlation coefficients of these questions with parties’ satisfaction with the litigation process were .45, .40, .45, .49, .45, and .45, respectively. 316The correlation coefficients of these questions with parties’ satisfaction with the courts’ services were .40 and .42, respectively. 317 Note that in many types of cases, such as Auto PI cases, this simply may not have been relevant; 43 percent of parties and 57 percent of attorneys gave the neutral response to this question.
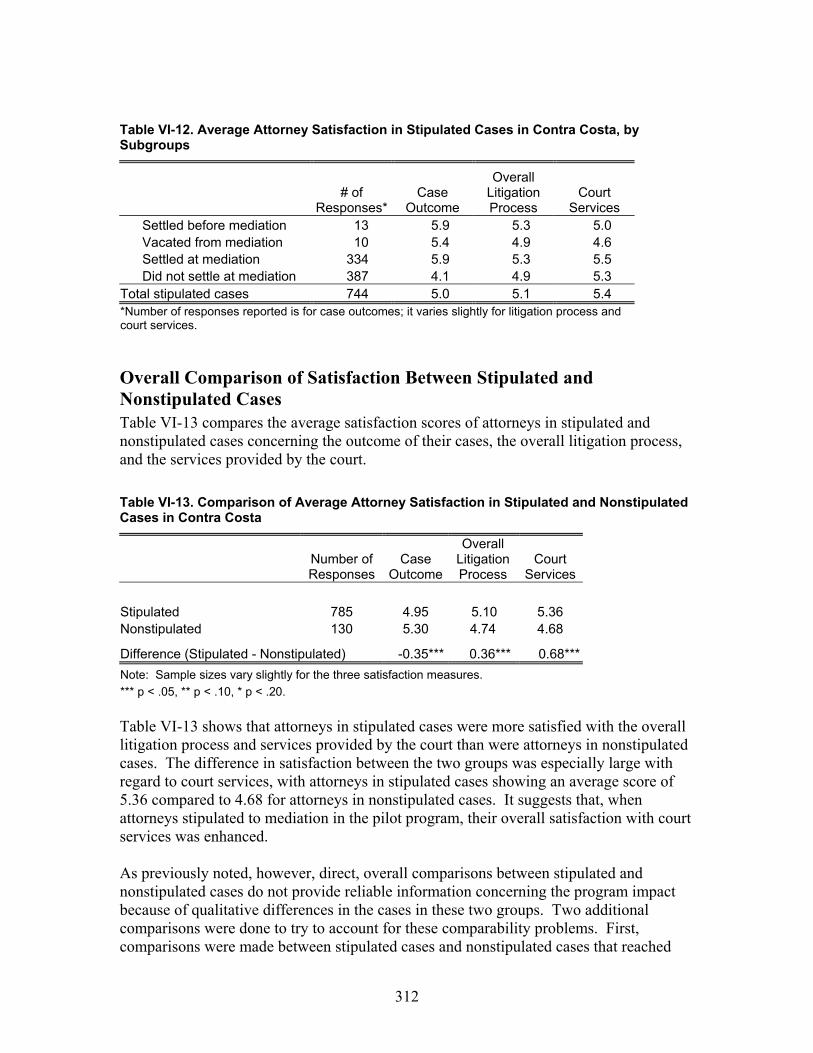
312
Table VI-12. Average Attorney Satisfaction in Stipulated Cases in Contra Costa, by Subgroups
# of
Responses*Case
Outcome
Overall Litigation Process
Court Services
Settled before mediation 13 5.9 5.3 5.0 Vacated from mediation 10 5.4 4.9 4.6 Settled at mediation 334 5.9 5.3 5.5 Did not settle at mediation 387 4.1 4.9 5.3
Total stipulated cases 744 5.0 5.1 5.4 *Number of responses reported is for case outcomes; it varies slightly for litigation process and court services.
Overall Comparison of Satisfaction Between Stipulated and Nonstipulated Cases Table VI-13 compares the average satisfaction scores of attorneys in stipulated and nonstipulated cases concerning the outcome of their cases, the overall litigation process, and the services provided by the court. Table VI-13. Comparison of Average Attorney Satisfaction in Stipulated and Nonstipulated Cases in Contra Costa
Number of Responses
Case Outcome
Overall Litigation Process
Court Services
Stipulated 785 4.95 5.10 5.36 Nonstipulated 130 5.30 4.74 4.68
Difference (Stipulated - Nonstipulated) -0.35*** 0.36*** 0.68*** Note: Sample sizes vary slightly for the three satisfaction measures. *** p < .05, ** p < .10, * p < .20. Table VI-13 shows that attorneys in stipulated cases were more satisfied with the overall litigation process and services provided by the court than were attorneys in nonstipulated cases. The difference in satisfaction between the two groups was especially large with regard to court services, with attorneys in stipulated cases showing an average score of 5.36 compared to 4.68 for attorneys in nonstipulated cases. It suggests that, when attorneys stipulated to mediation in the pilot program, their overall satisfaction with court services was enhanced. As previously noted, however, direct, overall comparisons between stipulated and nonstipulated cases do not provide reliable information concerning the program impact because of qualitative differences in the cases in these two groups. Two additional comparisons were done to try to account for these comparability problems. First, comparisons were made between stipulated cases and nonstipulated cases that reached
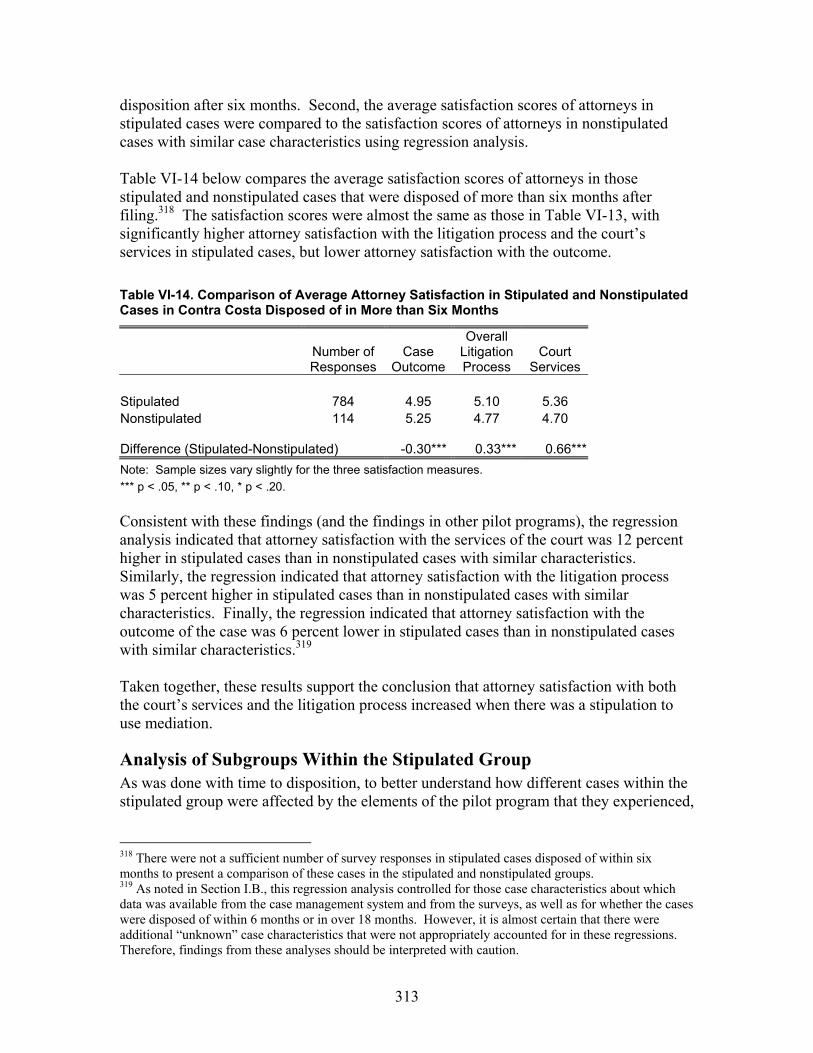
313
disposition after six months. Second, the average satisfaction scores of attorneys in stipulated cases were compared to the satisfaction scores of attorneys in nonstipulated cases with similar case characteristics using regression analysis. Table VI-14 below compares the average satisfaction scores of attorneys in those stipulated and nonstipulated cases that were disposed of more than six months after filing.318 The satisfaction scores were almost the same as those in Table VI-13, with significantly higher attorney satisfaction with the litigation process and the court’s services in stipulated cases, but lower attorney satisfaction with the outcome. Table VI-14. Comparison of Average Attorney Satisfaction in Stipulated and Nonstipulated Cases in Contra Costa Disposed of in More than Six Months
Number of Responses
Case Outcome
Overall Litigation Process
Court Services
Stipulated 784 4.95 5.10 5.36 Nonstipulated 114 5.25 4.77 4.70
Difference (Stipulated-Nonstipulated) -0.30*** 0.33*** 0.66*** Note: Sample sizes vary slightly for the three satisfaction measures. *** p < .05, ** p < .10, * p < .20. Consistent with these findings (and the findings in other pilot programs), the regression analysis indicated that attorney satisfaction with the services of the court was 12 percent higher in stipulated cases than in nonstipulated cases with similar characteristics. Similarly, the regression indicated that attorney satisfaction with the litigation process was 5 percent higher in stipulated cases than in nonstipulated cases with similar characteristics. Finally, the regression indicated that attorney satisfaction with the outcome of the case was 6 percent lower in stipulated cases than in nonstipulated cases with similar characteristics.319 Taken together, these results support the conclusion that attorney satisfaction with both the court’s services and the litigation process increased when there was a stipulation to use mediation.
Analysis of Subgroups Within the Stipulated Group As was done with time to disposition, to better understand how different cases within the stipulated group were affected by the elements of the pilot program that they experienced,
318 There were not a sufficient number of survey responses in stipulated cases disposed of within six months to present a comparison of these cases in the stipulated and nonstipulated groups. 319 As noted in Section I.B., this regression analysis controlled for those case characteristics about which data was available from the case management system and from the surveys, as well as for whether the cases were disposed of within 6 months or in over 18 months. However, it is almost certain that there were additional “unknown” case characteristics that were not appropriately accounted for in these regressions. Therefore, findings from these analyses should be interpreted with caution.
314
attorney satisfaction in each of the subgroups of stipulated cases was compared to attorney satisfaction in nonstipulated cases with similar characteristics.320 As in the other pilot programs, the results of these comparisons provide strong support for the conclusion that settling at mediation increased attorney satisfaction on all three satisfaction measures. In stipulated cases that settled at mediation, attorney satisfaction with the outcome of the case was 13 percent higher compared to like nonstipulated cases, attorney satisfaction with the litigation process was 9 percent higher, and attorney satisfaction with the services of the court was 15 percent higher. As might have been expected, attorneys’ satisfaction with the outcome in stipulated cases corresponded to whether or not their cases settled at mediation. While satisfaction with the outcome was 13 percent higher in stipulated cases that settled at mediation, it was 20 percent lower in stipulated cases that did not settle at mediation compared to similar nonstipulated cases. However, satisfaction with the court’s services was not tied to whether cases settled at mediation. Not only was satisfaction with the court’s services 15 percent higher in stipulated cases that settled at mediation compared to like nonstipulated cases, it was also 11 percent higher in stipulated cases that participated in mediation but did not settle at mediation. These results suggest that it was the experience of participating in a pilot program mediation that was the key to increasing attorneys’ satisfaction with the services of the court: attorneys whose cases were mediated were more satisfied with the court’s services regardless of whether their cases settled or did not settle at the mediation.321 Overall, the results of this subgroup analysis support the following conclusions: • The experience of reaching settlement at mediation significantly increased attorneys’
satisfaction with all aspects of their dispute resolution experiences. • Attorneys’ satisfaction with the outcome in stipulated cases corresponded to whether
or not their cases settled at mediation, but the experience of mediation increased attorneys’ satisfaction with the services of the court, even if the case did not resolve at mediation.
Conclusion Both parties and attorneys in the Contra Costa program expressed high satisfaction when they used pilot program mediation. They were particularly satisfied with the performance of the mediators, with both parties and attorneys showing an average satisfaction score of approximately 6 on a 7-point scale.
320 The regression analysis method described in Section I.B. was used to make these subgroup comparisons. For the reasons noted in the preceding footnote, the findings from these analyses should be interpreted with caution. 321 No statistically significant differences on any of the satisfaction measures were found between stipulated cases that were settled before mediation or that were vacated from mediation and similar cases in the nonstipulated group.
315
Attorneys in stipulated cases were also more satisfied with the overall litigation process and services provided by the court compared to attorneys in nonstipulated cases; however, they were less satisfied with outcome of the case. When the stipulated group was broken down into subgroups, the analysis indicated that attorneys whose cases settled at mediation were significantly more satisfied with the outcome of the cases, their litigation experience, and with the services of the court compared to attorneys in like cases in the nonstipulated group. While attorneys whose cases did not settle at mediation were less satisfied with the outcomes of their cases, they were still more satisfied with the court’s services than attorneys in similar nonstipulated cases. This suggests that participating in mediation increased attorney satisfaction with the court’s services, regardless of whether their cases settled at mediation.
316
I. Impact of Contra Costa’s Pilot Program on Litigant Costs
Summary of Findings The pilot program reduced litigant costs and the number of hours attorneys spent on cases, particularly in cases that settled at mediation. • In direct comparisons between stipulated and nonstipulated cases, average actual
litigant costs estimated by attorneys were approximately $7,500 lower in cases in which the litigants stipulated to mediation compared to those in which the litigants did not stipulate to mediation. Both direct comparisons between stipulated and nonstipulated cases disposed of in over six months and comparisons between litigant costs and attorney hours in stipulated cases and nonstipulated cases with similar characteristics using regression analysis also suggested that both actual litigant costs and attorney hours estimated by attorneys were reduced in stipulated cases.
• Litigant costs and attorney hours were lower in both stipulated cases that settled at
mediation and in stipulated cases that did not settle at mediation compared to nonstipulated cases with similar characteristics.
• In cases that settled at mediation, 80 percent of attorneys responding to the study
survey estimated some savings in both litigant costs and attorney hours from using mediation to reach settlement. Average savings estimated by attorney per settled case were $16,197 in litigant costs and 78 hours in attorney time. Based on these attorney estimates, a total of $9,993,839 in litigant costs and 48,126 in attorney hours was estimated to have been saved in all 2000 and 2001 cases that were settled at mediation.
Introduction This section examines the impact of the Contra Costa pilot program on litigants’ costs. As described above in Section I.B., information on litigant costs was collected in two ways. First, in a survey distributed at the end of the mediation in cases that went to mediation between July 2001 and June 2002 (“postmediation survey”), attorneys in the subset of cases that resolved at mediation were asked to provide (1) an estimate of the time they had actually spent on the cases and their clients’ actual litigation costs; and (2) an estimate of the time they would have spent and what the costs to their clients would have been had they not used mediation. The difference between these estimates represents the attorneys’ subjective estimate of the litigant cost and attorney time savings when the case settled at the mediation. Second, in a separate survey administered shortly after disposition in both stipulated and nonstipulated cases between July 2001 and June 2002 (“postdisposition survey”), attorneys were asked to provide an estimate of the time they had actually spent on the case and their clients’ actual litigation costs. Comparisons between the time and cost estimates in the program cases and nonprogram cases provide an objective measure of the pilot program’s impact on litigant costs.
317
Because data on litigant costs was gathered through surveys conducted only in 2001 and 2002, pre-/post-program comparisons concerning litigant costs were not possible, so comparisons of stipulated and nonstipulated cases were used to try to identify the impact of the pilot program on litigant costs and attorney hours. This section first discusses the estimated actual litigant costs and attorney hours spent in stipulated cases as a whole and in the subgroups of stipulated cases. Second, overall comparisons between attorneys’ estimates of actual cost and attorney time in stipulated and nonstipulated cases are presented. Third, litigant costs and attorney hours in the various subgroups within the stipulated group are examined. Finally, attorneys’ subjective estimates of litigant cost and attorney time savings in cases settled at mediation as reported in the postmediation survey are presented.
Litigant Costs and Attorney Hours in Stipulated Cases Table VI-15 shows the average and median estimated litigant costs and attorney hours for stipulated cases in the various subgroups and in the stipulated group as a whole. As noted above, the data on litigant costs and attorney time were derived from attorney responses to surveys, not from the court’s case management system. Therefore, the overall number of cases for which comparative cost and time information was available was smaller than the number of cases for which other outcome data were available. When this data was further broken down into subgroups, the number of cases that were settled before mediation and that were vacated from mediation was too small to provide reliable information.322 Therefore, these subgroups were not included in this table. Table VI-15. Litigant Costs and Attorney Hours in Stipulated Cases, by Subgroups
# of
Responses Average Median
Litigant Costs Settled at mediation 204 $12,904 $5,500 Did not settle at mediation 186 $18,107 $5,000
Total stipulated cases* 403 $15,207 $5,500 *This total includes 8 cases settled before mediation and 5 cases vacated from mediation
Attorney Hours Settled at mediation 227 52 30 Did not settle at mediation 197 110 35
Total stipulated cases* 440 80 35 *This total includes 9 cases settled before mediation and 7 cases vacated from mediation As can be seen in Table VI-15, both average litigant costs and average and median attorney hours were lower in cases that settled at mediation than in cases that did not
322 Survey data on litigant costs and attorney hours was available for only 8-9 cases settled before mediation and 5-7 cases vacated from mediation.

318
settle at mediation. The litigant costs and attorney hours in these two categories of cases offset each other to some degree when the overall average litigant cost and attorney hours for all stipulated cases was calculated.
Overall Comparison of Estimated Litigant Costs and Attorney Hours in Stipulated and Nonstipulated Cases Table VI-16 compares attorney estimates of actual litigant cost and attorneys hours in stipulated and nonstipulated cases. Table VI-16. Comparison of Litigant Costs and Attorney Hours in Stipulated and Nonstipulated Cases in Contra Costa
Number of
Respondents Average Median Litigation Cost
Stipulated 424 $14,843 $5,500 Nonstipulated 104 $22,349 $8,000
Difference (Stipulated - Nonstipulated) -$7,506** -$2,500
Attorney Hours Stipulated 460 79 35 Nonstipulated 106 99 50
Difference (Stipulated - Nonstipulated) -20 -15
*** p < .05, ** p < .10, * p < .20. This table shows that, unlike in any of the other pilot programs, in Contra Costa, average litigant costs estimated by attorneys in stipulated cases were significantly lower than those in nonstipulated cases. Average litigant costs in stipulated cases was approximately $7,500 (or about 33 percent) lower than in nonstipulated cases. While the table also shows reductions in median litigant costs and in both average and median attorney hours, none of these differences is statistically significant. However, as noted above in the Section I.B., direct comparisons between the overall average of stipulated and nonstipulated cases do not provide reliable information concerning the program impact because of differences in the cases in these two groups. Two additional comparisons were done to try to account for these comparability problems. First, comparisons were made between stipulated cases and nonstipulated cases that reached disposition after six months. Second, the average litigant costs and attorney hours spent in stipulated cases was compared to the litigant costs and attorney hours in nonstipulated cases with similar case characteristics using regression analysis. Table VI-17 below compares the average and median litigant costs and attorney hours in stipulated and nonstipulated cases filed in 2000 and 2001 in Contra Costa that were
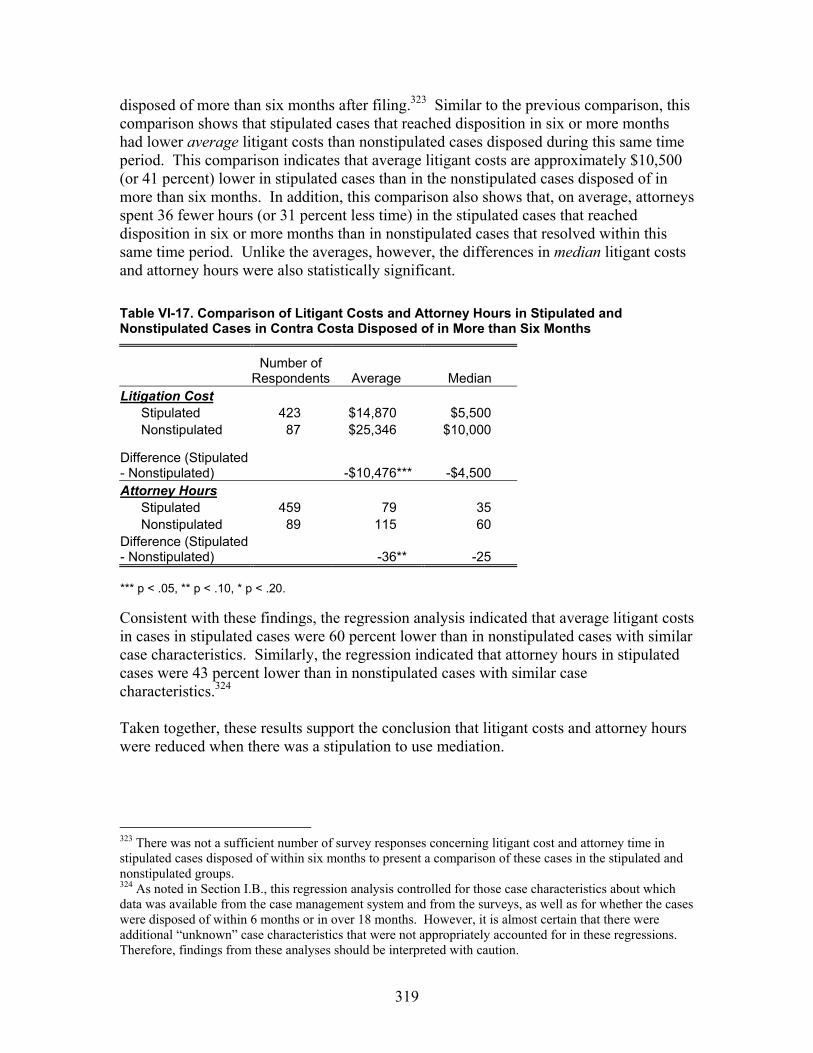
319
disposed of more than six months after filing.323 Similar to the previous comparison, this comparison shows that stipulated cases that reached disposition in six or more months had lower average litigant costs than nonstipulated cases disposed during this same time period. This comparison indicates that average litigant costs are approximately $10,500 (or 41 percent) lower in stipulated cases than in the nonstipulated cases disposed of in more than six months. In addition, this comparison also shows that, on average, attorneys spent 36 fewer hours (or 31 percent less time) in the stipulated cases that reached disposition in six or more months than in nonstipulated cases that resolved within this same time period. Unlike the averages, however, the differences in median litigant costs and attorney hours were also statistically significant. Table VI-17. Comparison of Litigant Costs and Attorney Hours in Stipulated and Nonstipulated Cases in Contra Costa Disposed of in More than Six Months
Number of
Respondents Average Median Litigation Cost
Stipulated 423 $14,870 $5,500 Nonstipulated 87 $25,346 $10,000
Difference (Stipulated - Nonstipulated) -$10,476*** -$4,500 Attorney Hours
Stipulated 459 79 35 Nonstipulated 89 115 60
Difference (Stipulated - Nonstipulated) -36** -25
*** p < .05, ** p < .10, * p < .20. Consistent with these findings, the regression analysis indicated that average litigant costs in cases in stipulated cases were 60 percent lower than in nonstipulated cases with similar case characteristics. Similarly, the regression indicated that attorney hours in stipulated cases were 43 percent lower than in nonstipulated cases with similar case characteristics.324 Taken together, these results support the conclusion that litigant costs and attorney hours were reduced when there was a stipulation to use mediation.
323 There was not a sufficient number of survey responses concerning litigant cost and attorney time in stipulated cases disposed of within six months to present a comparison of these cases in the stipulated and nonstipulated groups. 324 As noted in Section I.B., this regression analysis controlled for those case characteristics about which data was available from the case management system and from the surveys, as well as for whether the cases were disposed of within 6 months or in over 18 months. However, it is almost certain that there were additional “unknown” case characteristics that were not appropriately accounted for in these regressions. Therefore, findings from these analyses should be interpreted with caution.
320
Analysis of Subgroups Within the Stipulated Group As was done with time to disposition and litigant satisfaction, to better understand how different cases within the program were influenced by the elements of the pilot program that they experienced, average litigant costs and attorney hours in each of the subgroups of stipulated cases were compared to the costs and hours in similar nonstipulated cases.325 The results of this comparison support the conclusion that settling at mediation reduced litigant costs and attorney time. The comparison indicated that actual litigant costs estimated by attorneys were 50 percent lower in stipulated cases that were settled at mediation compared to nonstipulated cases with similar characteristics. Similarly, actual attorney hours estimated by attorneys were 40 percent lower in stipulated cases that settled at mediation than in nonstipulated cases with similar characteristics. These results are consistent with the study results on litigant costs and attorney hours in the other pilot programs. They are also consistent with the earlier Contra Costa program study results showing positive impacts on time to disposition and satisfaction when cases settled at mediation. Unlike in the other pilot programs, however, the analysis in Contra Costa also indicated that litigant costs were lower in stipulated cases that did not settle at mediation compared to nonstipulated cases with similar characteristics. The comparison indicated that litigant costs were 68 percent lower and that attorney hours were 40 percent lower in stipulated cases that did not settle at mediation compared to nonstipulated cases with similar characteristics. Overall, these regression results suggest that participating in mediation, whether the case settles at mediation or not, reduced litigant costs and attorney time.
Attorneys’ Estimates of Mediation Resolution’s Impact on Litigant Costs and Attorney Hours Attorneys whose cases resolved at mediation overwhelmingly believed that the mediation had saved their clients money. Of the attorneys whose cases settled at mediation and who responded to the postmediation survey, 80 percent estimated some cost savings for their clients. Table VI-18 shows the average savings in both litigant costs and attorney hours estimated by these attorneys. It also shows what percentage savings these estimates represent. As shown in this table, in those cases in which the attorneys reported savings from resolving at mediation, the average cost saving per client they estimated was approximately $23,000; average saving in attorney hours was estimated to be 95 hours. These attorney estimates represent a saving of more than 60 percent, on average, in both litigant costs and attorney time.
325 The regression analysis method described in Section I.B. was used to make these subgroup comparisons. For the reasons outlined in the preceding footnote, the findings from these analyses should be interpreted with caution.
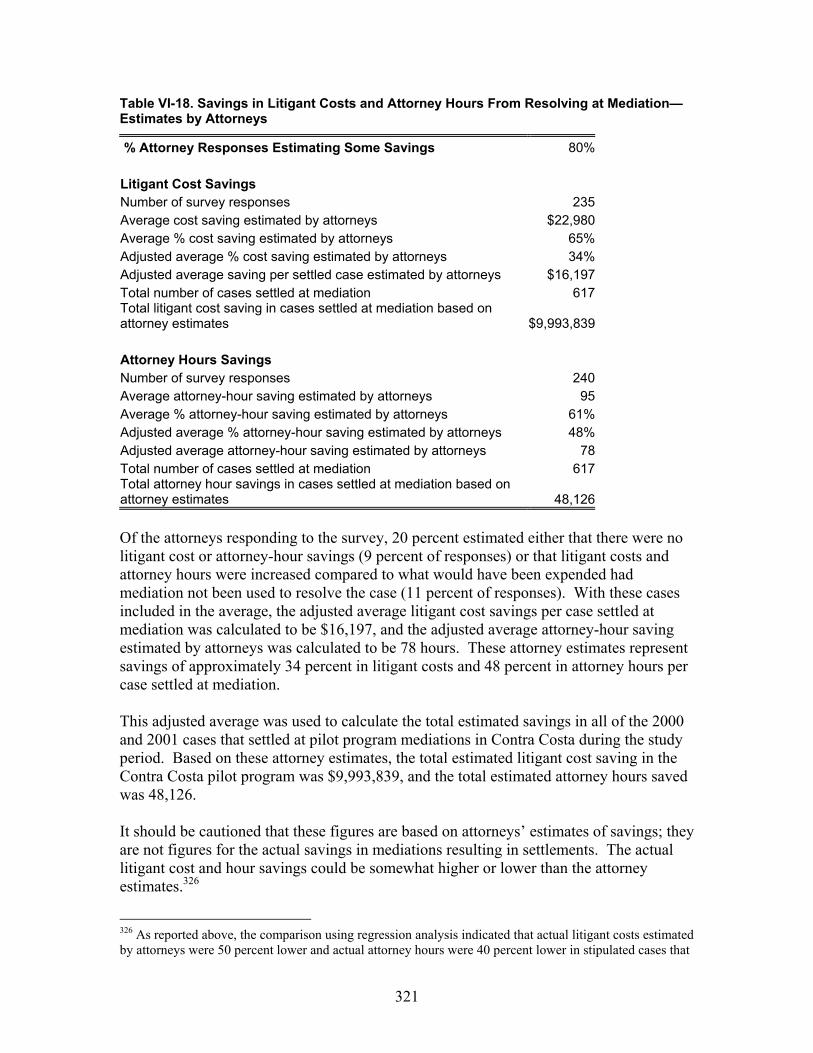
321
Table VI-18. Savings in Litigant Costs and Attorney Hours From Resolving at Mediation—Estimates by Attorneys
% Attorney Responses Estimating Some Savings 80% Litigant Cost Savings Number of survey responses 235Average cost saving estimated by attorneys $22,980Average % cost saving estimated by attorneys 65%Adjusted average % cost saving estimated by attorneys 34%Adjusted average saving per settled case estimated by attorneys $16,197 Total number of cases settled at mediation 617Total litigant cost saving in cases settled at mediation based on attorney estimates $9,993,839 Attorney Hours Savings Number of survey responses 240Average attorney-hour saving estimated by attorneys 95Average % attorney-hour saving estimated by attorneys 61%Adjusted average % attorney-hour saving estimated by attorneys 48%Adjusted average attorney-hour saving estimated by attorneys 78Total number of cases settled at mediation 617Total attorney hour savings in cases settled at mediation based on attorney estimates 48,126 Of the attorneys responding to the survey, 20 percent estimated either that there were no litigant cost or attorney-hour savings (9 percent of responses) or that litigant costs and attorney hours were increased compared to what would have been expended had mediation not been used to resolve the case (11 percent of responses). With these cases included in the average, the adjusted average litigant cost savings per case settled at mediation was calculated to be $16,197, and the adjusted average attorney-hour saving estimated by attorneys was calculated to be 78 hours. These attorney estimates represent savings of approximately 34 percent in litigant costs and 48 percent in attorney hours per case settled at mediation. This adjusted average was used to calculate the total estimated savings in all of the 2000 and 2001 cases that settled at pilot program mediations in Contra Costa during the study period. Based on these attorney estimates, the total estimated litigant cost saving in the Contra Costa pilot program was $9,993,839, and the total estimated attorney hours saved was 48,126. It should be cautioned that these figures are based on attorneys’ estimates of savings; they are not figures for the actual savings in mediations resulting in settlements. The actual litigant cost and hour savings could be somewhat higher or lower than the attorney estimates.326
326 As reported above, the comparison using regression analysis indicated that actual litigant costs estimated by attorneys were 50 percent lower and actual attorney hours were 40 percent lower in stipulated cases that
322
It should also be cautioned that these estimated savings are for cases settled at mediation only, not for all cases in the program. There may also have been savings or increases in litigant costs or attorney hours in other subgroups of stipulated cases, such as those that stipulated to mediation but settled before the mediation took place or cases that were mediated but did not settle at the mediation.327
Conclusion There is evidence that the pilot program in Contra Costa reduced costs for litigants and the hours attorney were required to spend to reach resolution in cases, particularly in cases that settled at mediation. In direct comparisons between stipulated and nonstipulated cases, average actual litigant costs estimated by attorneys were approximately $7,500 lower in cases in which the parties stipulated to mediation compared to those in which the parties did not stipulate to mediation. Both direct comparisons between stipulated and nonstipulated cases disposed of in over six months and comparisons between litigant costs and attorney hours in stipulated cases and nonstipulated cases with similar characteristics using regression analysis also suggested that both actual litigant costs and attorney hours were reduced in stipulated cases. Both actual litigant costs and attorney hours estimated by attorneys were significantly lower in stipulated cases that settled at mediation, as well as in stipulated cases that did not settle at mediation, compared to nonstipulated cases with similar characteristics. In cases that settled at mediation, 80 percent of attorneys responding to the study survey estimated some savings in both litigant costs and attorney hours from using mediation to reach settlement. Average savings estimated by attorney per settled case were $16,197 in litigant costs and 78 hours in attorney time. Based on these attorney estimates, a total of $9,993,839 in litigant costs and 48,126 in attorney hours was estimated to have been saved in all 2000 and 2001 cases that were settled at pilot program mediations in Contra Costa.
settled at mediation compared to nonstipulated cases with similar characteristics, in comparison to the savings of 34 percent in litigant costs and 48 percent in attorney time estimated by attorneys. 327 As reported above, the comparison using regression analysis indicated that stipulated cases that did not settle at mediation had actual litigant cost estimates that were 68 percent lower and attorney hours that were 40 percent lower than those in nonstipulated cases with similar characteristics. Additional support for the conclusion that mediation may have reduced litigant costs even in cases that did not settle at mediation comes from 54 postmediation survey responses in which attorneys in cases that did not settle at mediation provided litigant cost and attorney-hour information even though it had not been requested. Approximately 50 percent of these survey responses indicated some savings in litigant costs, attorney hours, or both in these cases that were mediated but did not settle at mediation. When responses that estimated no savings or increased costs are also taken into account, the attorneys in these cases estimated average savings of 18 percent in litigant costs (0 percent median savings) and 32 percent in attorney hours (50 percent median savings) in cases that did not settle at mediation.
323
J. Impact of Contra Costa’s Pilot Program on the Court’s Workload
Summary of Findings The evidence concerning the Contra Costa pilot program’s impact on the court’s workload was mixed: • There was evidence that the court’s workload increased the year after the pilot
program was instituted. The average number of case management conferences held per case was 27 percent higher in 2000, the year after the pilot program began, compared to 1999, the year before the pilot program began and the average number of “other” pretrial hearings was 11 percent higher. There was no statistically significant difference in the number of motion hearings. The increase in case management conferences may have been due, at least in part, to the introduction of the Complex Litigation Pilot Program in the court in 2000.
• In overall, direct comparisons of stipulated and nonstipulated cases, stipulated cases had fewer motion hearings but more CMCs than nonstipulated cases, so that the total number of all pretrial events was essentially the same in both groups. However, comparisons of only those cases disposed of in over six months suggested that the total number of hearings may have been lower in the stipulated group.
• The court’s workload was reduced when cases settled at mediation. The total number
of court events was 20 percent lower, on average, in stipulated cases that settled at mediation compared to nonstipulated cases with similar characteristics. Conversely, similar comparisons suggested that the number of pretrial hearings may have been increased when cases did not settle at mediation.
Introduction In this section, the impact of the Contra Costa pilot program on the court’s workload is examined by looking at the frequency of various pretrial court events. The analysis focuses on three major types of court events: (1) case management conferences (CMCs),328 (2) motion hearings,329 and (3) other pretrial hearings.330 As in the sections on trial rate and disposition time, a pre-/post-program comparison is presented first. Second, the number of pretrial events in stipulated cases as a whole and in each subgroup of stipulated cases is discussed. This is followed by comparisons of court workload in cases that stipulated to mediation and those that did not stipulate to mediation are
328 CMCs include three types of conferences as captured by the docket codes in the case management system in Contra Costa: First Status Conference, Case Management Conference, and Further Case Management Conference. 329 Motion hearings include summary judgment motions and all other motions. 330 Examples of other pretrial hearings include Order to Show Cause (OSC), Default Hearing, and Issue Conference Hearing.
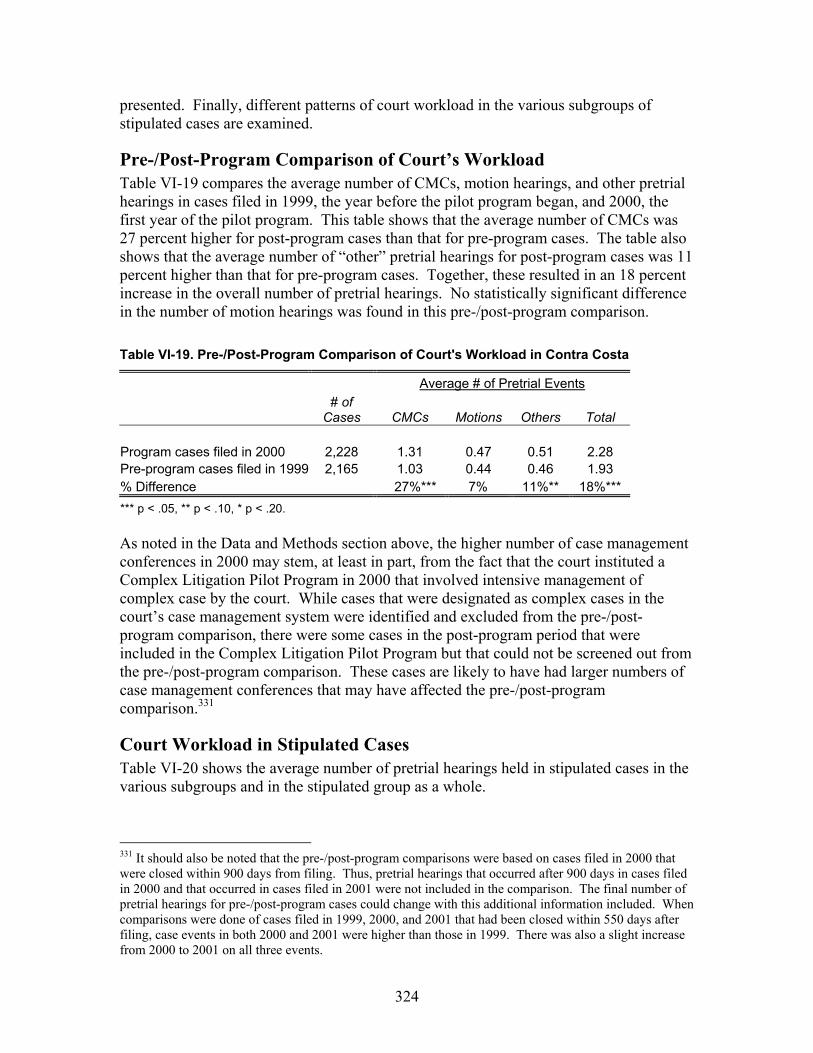
324
presented. Finally, different patterns of court workload in the various subgroups of stipulated cases are examined.
Pre-/Post-Program Comparison of Court’s Workload Table VI-19 compares the average number of CMCs, motion hearings, and other pretrial hearings in cases filed in 1999, the year before the pilot program began, and 2000, the first year of the pilot program. This table shows that the average number of CMCs was 27 percent higher for post-program cases than that for pre-program cases. The table also shows that the average number of “other” pretrial hearings for post-program cases was 11 percent higher than that for pre-program cases. Together, these resulted in an 18 percent increase in the overall number of pretrial hearings. No statistically significant difference in the number of motion hearings was found in this pre-/post-program comparison. Table VI-19. Pre-/Post-Program Comparison of Court's Workload in Contra Costa
Average # of Pretrial Events
# of
Cases CMCs Motions Others Total Program cases filed in 2000 2,228 1.31 0.47 0.51 2.28 Pre-program cases filed in 1999 2,165 1.03 0.44 0.46 1.93 % Difference 27%*** 7% 11%** 18%*** *** p < .05, ** p < .10, * p < .20. As noted in the Data and Methods section above, the higher number of case management conferences in 2000 may stem, at least in part, from the fact that the court instituted a Complex Litigation Pilot Program in 2000 that involved intensive management of complex case by the court. While cases that were designated as complex cases in the court’s case management system were identified and excluded from the pre-/post-program comparison, there were some cases in the post-program period that were included in the Complex Litigation Pilot Program but that could not be screened out from the pre-/post-program comparison. These cases are likely to have had larger numbers of case management conferences that may have affected the pre-/post-program comparison.331
Court Workload in Stipulated Cases Table VI-20 shows the average number of pretrial hearings held in stipulated cases in the various subgroups and in the stipulated group as a whole.
331 It should also be noted that the pre-/post-program comparisons were based on cases filed in 2000 that were closed within 900 days from filing. Thus, pretrial hearings that occurred after 900 days in cases filed in 2000 and that occurred in cases filed in 2001 were not included in the comparison. The final number of pretrial hearings for pre-/post-program cases could change with this additional information included. When comparisons were done of cases filed in 1999, 2000, and 2001 that had been closed within 550 days after filing, case events in both 2000 and 2001 were higher than those in 1999. There was also a slight increase from 2000 to 2001 on all three events.

325
As can be seen in this table, cases that settled at or before mediation had the smallest number of court events among all the stipulated subgroups. In contrast, cases in which the parties stipulated to mediation, but that were later vacated from mediation and cases that went to mediation but did not settle at mediation had more CMCs and hearings overall. The larger number of court events in these last two subgroups helps explain the relatively high overall number of pretrial hearings for the stipulated group as a whole. When the average for the whole stipulated group was calculated, cases in these two subgroups pulled that average number of court events higher, offsetting to some degree the lower average number of court events among cases that settled before and at mediation. Table VI-20. Average Number of Various Pretrial Court Events (Per Case) in Stipulated Cases in Contra Costa, by Subgroups
# of Cases CMCs Motions Others Total Settled before mediation 255 1.03 0.09 0.40 1.52 Vacated from mediation 157 1.82 0.57 0.78 3.16 Settled at mediation 604 1.13 0.18 0.29 1.60 Did not settle at mediation 486 1.79 0.66 0.77 3.21
Total stipulated cases 1,502 1.40 0.36 0.51 2.27
Overall Comparisons of Court Workload in Stipulated and Nonstipulated Cases Table VI-21 shows the average number of CMCs, motion hearings, and other pretrial hearings held in cases in which the litigants stipulated to mediation and cases in which the litigants did not stipulate to mediation. Table VI-21. Comparison of Average Number of Pretrial Court Events (Per Case) in Stipulated and Nonstipulated Cases in Contra Costa
Average # of Pretrial Events
# of Cases CMCs Motions Others Total Stipulated 1,545 1.42 0.37 0.52 2.31 Nonstipulated 2,571 1.27 0.49 0.48 2.23 % Difference 12%*** -24%*** 8%* 4% *** p < .05, ** p < .10, * p < .20. Cases in which the parties stipulated to mediation had fewer motion hearings, but more CMCs and other pretrial hearings compared to nonstipulated cases. The overall average number of pretrial hearings was slightly higher for stipulated cases than for nonstipulated cases, but the difference was not statistically significant.
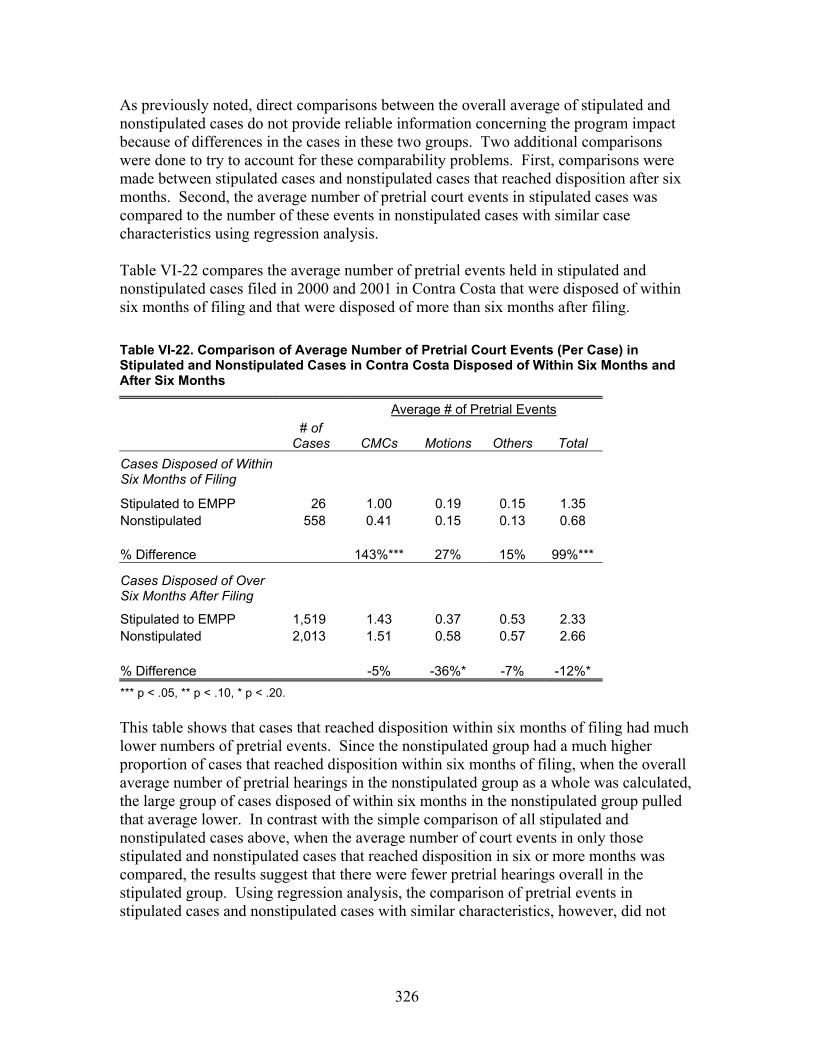
326
As previously noted, direct comparisons between the overall average of stipulated and nonstipulated cases do not provide reliable information concerning the program impact because of differences in the cases in these two groups. Two additional comparisons were done to try to account for these comparability problems. First, comparisons were made between stipulated cases and nonstipulated cases that reached disposition after six months. Second, the average number of pretrial court events in stipulated cases was compared to the number of these events in nonstipulated cases with similar case characteristics using regression analysis. Table VI-22 compares the average number of pretrial events held in stipulated and nonstipulated cases filed in 2000 and 2001 in Contra Costa that were disposed of within six months of filing and that were disposed of more than six months after filing. Table VI-22. Comparison of Average Number of Pretrial Court Events (Per Case) in Stipulated and Nonstipulated Cases in Contra Costa Disposed of Within Six Months and After Six Months
Average # of Pretrial Events
# of
Cases CMCs Motions Others Total Cases Disposed of Within Six Months of Filing
Stipulated to EMPP 26 1.00 0.19 0.15 1.35 Nonstipulated 558 0.41 0.15 0.13 0.68 % Difference 143%*** 27% 15% 99%***
Cases Disposed of Over Six Months After Filing
Stipulated to EMPP 1,519 1.43 0.37 0.53 2.33 Nonstipulated 2,013 1.51 0.58 0.57 2.66 % Difference -5% -36%* -7% -12%* *** p < .05, ** p < .10, * p < .20. This table shows that cases that reached disposition within six months of filing had much lower numbers of pretrial events. Since the nonstipulated group had a much higher proportion of cases that reached disposition within six months of filing, when the overall average number of pretrial hearings in the nonstipulated group as a whole was calculated, the large group of cases disposed of within six months in the nonstipulated group pulled that average lower. In contrast with the simple comparison of all stipulated and nonstipulated cases above, when the average number of court events in only those stipulated and nonstipulated cases that reached disposition in six or more months was compared, the results suggest that there were fewer pretrial hearings overall in the stipulated group. Using regression analysis, the comparison of pretrial events in stipulated cases and nonstipulated cases with similar characteristics, however, did not
327
find any statistically significant differences in the number of pretrial hearings in these groups.332
Analysis of Subgroups Within the Stipulated Group As was done with time to disposition, litigant satisfaction, and litigant costs, to better understand how different cases within the program were influenced by the elements of the pilot program that they experienced, the average number of pretrial court events in each of the subgroups of stipulated cases was compared to the number of these events in similar nonstipulated cases.333 As in the other pilot courts, the results of this comparison support the conclusion that when cases settled at mediation, the court’s workload was reduced. The comparison indicated that stipulated cases that settled at mediation had 20 percent few pretrial hearings overall than nonstipulated cases with similar case characteristics. The reduction in the total number of court events in cases that settled at mediation stemmed from reductions in the numbers of motion hearings and other pretrial hearings, not from CMCs. The analysis showed that stipulated cases that settled at mediation had 40 percent fewer motion hearings and 45 percent fewer other pretrial hearings than similar nonstipulated cases. However, no statistically significant difference in the number of CMCs was found in this comparison. This comparison also indicated, however, that cases in the stipulated group that went to mediation but did not resolve at mediation had 30 percent more pretrial hearings overall than cases in the nonstipulated group with similar case characteristics. This comparison found approximately 90 percent more motion hearings in stipulated cases that did not settle at mediation compared to nonstipulated cases with similar characteristics and also indicated that there were more other pretrial hearings in these cases, but the size of this difference was not clear.334 Overall, these regression results suggest that cases that resolve at mediation may have fewer pretrial hearings than they otherwise would have but that cases do not resolve at mediation may have more court events than they would have if the cases had not been mediated at all.
332 As noted in Section I.B., this regression analysis controlled for those case characteristics about which data was available from the case management system and from the surveys, as well as for whether the cases were disposed of within 6 months or in over 18 months. However, it is almost certain that there were additional “unknown” case characteristics that were not appropriately accounted for in these regressions. Therefore, findings from these analyses should be interpreted with caution. 333 The regression analysis method described in Section I.B. was used to make these subgroup comparisons. For the reasons outlined in the preceding footnote, the findings from these analyses should be interpreted with caution. 334 No statistically significant differences were found in the numbers of pretrial events in cases that settled before mediation or cases that were vacated from mediation when compared with similar cases in the nonstipulated group.
328
Conclusion The evidence concerning the Contra Costa pilot program’s impact on the court’s workload was mixed. There was evidence that the court’s workload increased the year after the pilot program was instituted. The average number of case management conferences held per case was 27 percent higher in 2000 compared to 1999, the year before the pilot program began and the average number of “other” pretrial hearings was 11 percent higher. The increase in case management conferences may have been due, at least in part, to the introduction of the Complex Litigation Pilot Program in 2000. In overall, direct comparisons of stipulated and nonstipulated cases, stipulated cases had fewer motion hearings but more CMCs than nonstipulated cases, so that the total number of all pretrial events was essentially the same in both groups. However, comparisons of only those cases disposed of in over six months suggested that the total number of events may have been lower in the stipulated group. The court’s workload was reduced when cases settled at mediation. The total number of court events was 20 percent lower, on average, in stipulated cases that settled at mediation compared to nonstipulated cases with similar characteristics. Conversely, similar comparisons suggested that the number of pretrial events may have been increased when cases did not settle at mediation.
329
VII. Sonoma Pilot Program
A. Summary of Study Findings There is evidence that the pilot program in Sonoma reduced disposition time, reduced the court’s workload, increased attorney satisfaction with the litigation process and the court’s services, and reduced litigant costs in cases that settled at mediation. • Mediation referrals, mediations, and settlements—737 cases that were filed in the
Superior Court of Sonoma County in 2000 and 2001 were referred to mediation and 574 of these cases were mediated under the pilot program. Of the unlimited cases mediated, 62 percent settled at the mediation. In survey responses, 90 percent of attorneys whose cases did not settle at mediation indicated that the mediation was important to the ultimate settlement of the case.
• Trial rate—Because a large proportion of the cases being studied had not yet reached
disposition, there was not sufficient data to determine whether the pilot program in Sonoma had an impact on the trial rate.
• Disposition time—The pilot program had a positive impact on case disposition time
for both limited and unlimited cases. The average disposition time for limited cases filed after the program began was 37 days shorter than the average for limited cases filed before the program began. The disposition rate for unlimited post-program cases was also higher than for pre-program cases for the entire 34-month follow-up period. The pace of dispositions for limited post-program cases accelerated about the time when, under the court’s rules, early mediation status conferences were set, suggesting that this conference played a role in improving disposition time. Comparisons of the disposition rates in stipulated and nonstipulated cases showed that while nonstipulated cases begin to resolve earlier, once stipulated cases begin reaching disposition, they were disposed of faster than nonstipulated cases and ultimately more stipulated than nonstipulated cases reached disposition by the end of 34 months. The fact that stipulated cases were disposed of fastest between 6 and 12 months after filing, about the time that mediations would have occurred under the court’s pilot program rules, suggests that participation in mediation may have increased the rate of disposition for stipulated cases.
• Litigant satisfaction—Attorneys in stipulated cases were more satisfied with the overall litigation process and services provided by the court than attorneys in nonstipulated cases. Both parties and attorneys expressed high satisfaction when they used mediation through the Sonoma pilot program, particularly with the services of the mediators. They also strongly agreed that the mediator and the mediation process were fair and that they would recommend both to others.
• Litigant costs—There was evidence that both litigant costs and attorney time were
reduced when cases resolved at mediation. In cases that settled at mediation, 95

330
percent of attorneys responding to the study survey estimated some savings in both litigant costs and attorney hours from using mediation to reach settlement. Average savings estimated by attorneys per settled case were $25,965 in litigant costs and 93 hours in attorney time. Based on these attorney estimates, a total of $9,243,430 in litigant costs and 33,108 in attorney hours was estimated to have been saved in all 2000 and 2001 cases that were settled at mediation.
• Court workload—There was evidence that the pilot program reduced the court’s workload. Comparisons between cases filed before and after the pilot program began indicated that average number of “other” pretrial hearings was 15 percent lower in unlimited cases filed after the pilot program began than in unlimited cases filed before the program began. Comparisons between stipulated and nonstipulated cases using regression analysis to control for differences in case characteristics indicated that the average number of motion hearings was 50 percent lower in cases in which the parties stipulated to mediation compared to similar cases in which the parties did not stipulate to mediation and that the average number of “other” pretrial hearings was 45 percent lower. The smaller number of court events in program cases means that the time that judges would have been spent on these events could be devoted to other cases needing judicial time and attention. The total time saving from the reduced number of court events in program cases compared with in cases filed before the program began was estimated at 3.2 judge days per year (with an estimated monetary value of approximately $9,700 per year).

331
B. Introduction This section of the report discusses the study’s findings concerning the Early Mediation Pilot Program in the Superior Court of Sonoma County. Based on the criteria established by the Early Mediation Pilot Program legislation, this was a successful program, resulting in benefits to both litigants and the courts in the form of reduced disposition time, reduced court workload, improved litigant satisfaction with the court’s services and the litigation process, and lower litigant costs in cases that resolved at mediation. However, limitations of the data available made it difficult to identify the pilot program elements that contributed to these positive impacts. As further discussed below in the program description, the Sonoma pilot program included five main elements: • The court distributed alternative dispute resolution (ADR) information at the time of
filing; • The court set an initial case management conference approximately 120 days
(approximately 4 months) after filing; • The director of the Office of Alternative Dispute Resolution (ADR Director)
conducted the initial case management conference and used mediation techniques to try to help the parties reach agreement on a case management plan, including ADR use and discovery;
• Litigants chose whether to participate in early mediation; the court did not have the authority to order the litigants to participate in early mediation; and
• If litigants chose to participate in mediation, they paid the full cost of the mediation services.
For purposes of this study, cases that were filed the year before the pilot program began that would have met the program eligibility requirements are called “pre-program” cases. Eligible cases filed after the program began are called “program” cases. The cases in which the parties stipulated to participate in early mediation are called “stipulated cases.” The remaining cases that were otherwise eligible but in which the parties did not stipulate to early mediation are called “nonstipulated cases.” Overall comparisons between pre-program and program cases were used to try to identify the impact of the pilot program in Sonoma on trial rates, disposition time, and court workload. Because, unlike in Contra Costa, the Superior Court of Sonoma County did not have a mediation program before the pilot program was introduced, these pre-/post-program comparisons worked fairly well to identify the impact of introducing the pilot program, with all of its features, into the court. Overall comparisons between stipulated and nonstipulated cases were used to try to identify the impact of the pilot program in Sonoma on litigant satisfaction and costs. Unlike the pre-/post-program comparisons, these stipulated-nonstipulated comparisons do not provide information about the impact of having voluntary mediation services available to the litigants compared to having no mediation program at all. Ideally, these comparisons show the impact of agreeing to go to early mediation. However, because

332
stipulated and nonstipulated cases are qualitatively different from each other, any differences in outcome are likely to be due, at least in part, to these qualitative differences. Therefore, two additional comparisons were made to try to account for the differences in the characteristics of stipulated and nonstipulated cases: (1) comparisons of outcomes in only those stipulated and nonstipulated cases that reached disposition in more than six months and (2) comparisons made using regression analysis between stipulated cases and nonstipulated cases with similar case characteristics. In addition, it is important to remember that, throughout this section, “program” or “stipulated” cases does not mean cases that were mediated. Program cases include all the cases filed after the pilot program was implemented that met the program eligibility requirements, including both stipulated and nonstipulated cases. Stipulated cases include cases in which the parties stipulated to mediation, but did not ultimately go to mediation, either because the case was later removed from the mediation track by the court or because it settled before the mediation took place. Finally, it is important to remember that program cases in which the parties did not stipulate to mediation and stipulated cases that were mediated and not mediated and that settled and did not settle at mediation were exposed to different pilot program elements. These cases had very different dispute resolution experiences and different outcomes in terms of the areas being studied (disposition time, litigant satisfaction, and the other outcomes). In overall comparisons using pre-program and program cases, the outcomes in all eligible cases, both stipulated and nonstipulated, were added together to calculate an overall average for the program group as a whole. Similarly, in overall comparisons between stipulated and nonstipulated cases, the outcomes in all the subgroups of stipulated cases—those that were settled before mediation, those removed from the mediation track, those that went to mediation but did not settle at mediation, and those that settled at mediation—were added together to calculate an overall average for the stipulated group as a whole. As a result, within these overall averages, positive outcomes in some subgroups of cases, such as shorter disposition time in cases that settled at mediation, were probably offset by less positive outcomes in other subgroups. Unlike in the other pilot programs, however, because many of the mediators who conducted mediations under this program did not provide information about the outcome of the mediation process to the court, there was not sufficient data in Sonoma to break stipulated cases down into these subgroups. Therefore, unlike in the chapters concerning the other pilot program, readers will not find any analysis in this chapter of the unique outcomes within the subgroups of program cases. Without this mediation outcome information, the court also did not have data on when mediations actually took place. In addition, because the court’s case management system contained the date case management conferences were set, not when they were actually held, the court did not have information about when these conferences took place. Without this data on case management and mediation timing, it was difficult to determine what impact these events may have had on disposition time.
333
C. Sonoma Pilot Program Description This section provides a brief description of the Superior Court of Sonoma County and its Early Mediation Pilot Program. This description is intended to provide context for understanding the study findings presented later in this chapter.
The Court Environment in Sonoma Sonoma County is a medium-size county with a total population of slightly less than half a million. The Superior Court in Sonoma County is the smallest of the five pilot program sites, with 16 authorized judgeships. In 2000, the year that this mediation pilot program began, approximately 4,600 unlimited general civil cases and 3,900 limited civil cases were filed in Superior Court of Sonoma County.335 Seven of the 16 judges in the Superior Court are assigned to handle civil cases. Civil cases are managed using a master-calendar system in which different judges are assigned to handle different aspects of a civil case based on what judge is available at the time a particular task needs to be performed in the case. Before the court implemented the pilot program, initial case management conferences were generally scheduled at approximately 200 days after filing. It has historically taken a relatively long time for unlimited civil cases in Sonoma to reach disposition. In 1999, the year before the Early Mediation Pilot Program was implemented, the Superior Court of Sonoma County reported that it disposed of 48 percent of its unlimited civil cases within one year, 70 percent within 18 months, and 82 percent within two years of filing. Limited cases were disposed of more quickly: the court disposed of 87 percent of its limited civil cases within one year, 94 percent within 18 months, and 98 percent within two years of filing. Before the pilot program was implemented, the court did not have a mediation program for general civil cases. However, the local bar association had been actively involved in providing education on ADR and promoting the use of private mediation since the early 1990s. Approximately five years before the pilot program began, the local bar association worked with the court to develop a local rule that required attorneys to advise their clients about ADR and to certify to the court that they had done so. Two years before the pilot program began, representatives from the dispute resolution section of the local bar association began to attend case management conferences at the court to provide litigants with information on ADR and referrals for ADR services. Thus, while the pilot program was new to the court, the bar had some prior experience with assessment and referral to ADR in civil cases.
335 Judicial Council of Cal., Admin. Off. of Cts., Rep. on Court Statistics (2001) Fiscal Year 1990–1991 Through 1999–2000 Statewide Caseload Trends, p. 46. Please see the glossary for definitions of “unlimited civil case” and “general civil case.”
334
The Early Mediation Pilot Program Model Adopted in Sonoma
The General Program Model The Superior Court of Sonoma County adopted a voluntary mediation pilot program model. The basic elements of the program implemented in Sonoma included: • The court distributed ADR information at the time of filing; • The court set an initial case management conference approximately 120 days
(approximately 4 months) after filing; • The ADR Director conducted the initial case management conference and used
mediation techniques to try to help the parties reach agreement on a case management plan, including ADR use and discovery;
• Litigants chose whether to participate in early mediation, the court did not have the authority to order the litigants to participate in early mediation; and
• If litigants chose to participate in mediation, they paid the full cost of the mediation services.
What Cases Were Eligible for the Program All general civil cases, including both limited and unlimited cases, were eligible for the program in Sonoma.336
How Cases Were Referred to Mediation Only cases in which the defendant responded to the complaint (cases that became “at issue”) were eligible for referral to mediation. Mediation requires participation of both sides to a case. This participation is not possible if the defendant has not responded to the complaint. As in all the pilot courts, a large percentage of eligible cases in Sonoma (approximately 35 percent of unlimited cases and 80 percent of limited cases) never became at issue and thus were not eligible for referral to mediation.337 Parties were encouraged to stipulate to mediation at the earliest possible opportunity. At the time of filing, parties were given a notice regarding the pilot program, a blank form that could be used to stipulate to mediation, and a notice indicating the date of their initial case management conference (called an Early Mediation Status Conference [EMSC]). The information package also notified litigants that if they filed a stipulation to mediation before the EMSC, they would not be required to attend this conference. If parties did not stipulate to mediation, they were required to attend the initial EMSC. At this conference, the ADR Director conferred with the parties about whether the case was amenable to mediation or other forms of ADR. Since the court did not have the statutory authority to make mandatory referrals to mediation, participation in mediation was based entirely on the voluntary choice of the parties. The ADR Director also used mediation techniques to try to help the litigants reach agreement on an overall case management plan, addressing discovery, motions, and other matters.
336 See the glossary for a definition of “general civil cases.” 337 As discussed below, cases that never became at issue (cases that were disposed of through default) were not included among the nonstipulated group for purposed of this study.
335
How Mediators Were Selected and Compensated If the parties stipulated to mediation, they were required to select a mediator; the stipulation form included a space for the name of the mediator selected. The court contracted with the local bar association to maintain a panel mediators on behalf of the court. However, parties were free to select any mediator, whether or not that mediator was from the bar’s panel. The court generally did not recommend specific mediators unless the parties could not agree on a mediator on their own. Many parties selected mediators who were not on the local bar association panel. Parties were required to pay the full costs for the mediators’ services at market rate.
When Mediation Sessions Were Held The court generally set an initial deadline for the parties to complete mediation within 60 to 90 days of their stipulation to mediation. However, parties could request an extension on the time to complete mediation by filing a written request or requesting the extension in person when they attended the “review hearing” following the expiration of the mediation deadline. The ADR Director rarely denied such extension requests.
What Happened After the Mediation When parties stipulated to mediation, the ADR Director generally set the case for a review hearing shortly after the date set for completion of the mediation. If the parties filed a dismissal or notice of settlement at least 10 days before the date for this review hearing, the hearing was cancelled. If the review hearing took place, the ADR Director discussed the status of the case with the attorneys. In cases that had gone to mediation, but did not settle at mediation, the ADR Director worked with the parties to try to overcome any remaining obstacles to settlement. In many cases, this resulted in settlement at or shortly after the review hearing. In other cases, the matter was set for a later settlement conference with the ADR Director. Under the pilot program statutes, at the conclusion of the mediation, the mediator was required to submit a form to the court indicating whether the case was fully or partially resolved at the mediation session. However, in a large number of the cases that stipulated to mediation in Sonoma these forms were not submitted to the court by mediators.338 Without these forms, in many cases, the court was not able to determine whether the mediation took place and, if so, what the outcome of the mediation was. The court followed-up on stipulated cases through surveys and telephone calls to obtain this information, but complete information about many of these cases was never obtained.
How Cases Moved Through the Mediation Program To understand the impact of Sonoma’s pilot program, it is helpful to understand the flow of cases through this program and the court process. Figure VII-1 below depicts this for
338 This may be due, at least in part, to the fact that many parties chose to use mediators who were not on the panel of mediators maintained by the local bar association for the court. These non-panel mediators are less likely to have been familiar with the court’s mediation policies and procedures.
336
unlimited cases filed from March 2000 to December 2001 and Figure VII-2 for limited cases filed during the same period.339 Several limitations of these caseflow charts should be noted. First, according to court staff, stipulations may not have been filed in all the cases in which the parties agreed to use mediation, at least during the first year of the pilot program. Therefore, the figures presented in these charts for cases stipulating to mediation (and subsequently going to mediation as well) may be an underestimate. Second, because, as discussed above, complete mediation outcome data was not obtained from the mediators in Sonoma, in Figure VII-1, the number of unlimited cases that went to mediation and the number of cases that subsequently settled at mediation were extrapolated from a sample of cases in which the attorneys responded to requests for information through telephone interviews and surveys.340 Because this mediation outcome information was supplied by attorneys, rather than mediators, it is possible that the number of settlements at mediation may be over-reported; attorneys may have reported cases as settled at mediation when the resolution was actually reached shortly after the mediation session, but as a result of mediation.341 Finally, for limited cases, there was not sufficient on the outcomes of mediations to complete the latter half of the chart. Unlimited Cases As shown in Figure VII-1, a total of 3,839 unlimited civil cases were filed in Superior Court of Sonoma County from March 2000 to December 2001. Of the total unlimited cases filed, 65 percent (2,511 cases) became at issue and were eligible to be considered for referral to mediation.342 Of the cases that became at issue, parties in approximately 28 percent (691 cases) stipulated to mediation.343 Based on a sample of cases with available information on mediation outcomes, it was estimated that approximately 83 percent of the cases in which the parties stipulated to mediation actually went to mediation. From this sample, it was also estimated that 62 percent of the cases that went to mediation reached settlement at the mediation.
339 Since the pilot program began in March of 2000, in this report all references to cases filed in 2000 include only cases filed from March to December during the year. 340 The court took several measures to try to fill this information data gap, including telephone interviews with attorneys in July 2001 and letters sent to attorneys in June 2002 requesting information on the outcome of mediation. A follow-up survey was also mailed to attorneys in March 2003. All of this information was used in estimating the proportion of cases that went to mediation and the proportion that settled and did not settle at mediation. 341 When mediators use the standard Judicial Council ADR-100 form Statement of Agreement or Nonagreement to report outcomes of the mediation, the outcomes were reported as of the end of the last mediation session. Survey data from other courts indicated consistently that approximately 15 to 20 percent of the cases that originally did not settle at mediation attributed subsequent resolution of the case directly to the mediation. Without complete outcome information in Sonoma, it was not possible to obtain similar information on these cases in Sonoma based on follow-up surveys. 342 Early mediation status conferences were held for 62 percent (1,569 cases) of cases that became at issue. 343 Of those stipulating to mediation, approximately 20 percent stipulated before the first EMSC was held.
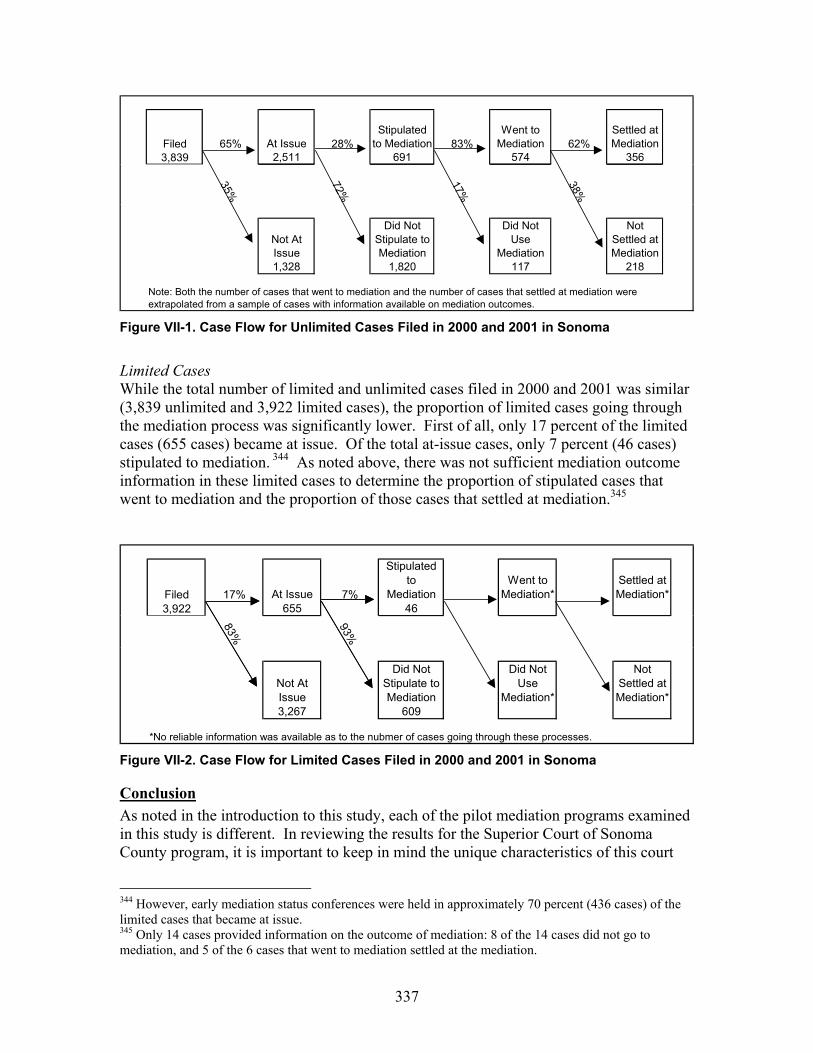
337
Figure VII-1. Case Flow for Unlimited Cases Filed in 2000 and 2001 in Sonoma
Limited Cases While the total number of limited and unlimited cases filed in 2000 and 2001 was similar (3,839 unlimited and 3,922 limited cases), the proportion of limited cases going through the mediation process was significantly lower. First of all, only 17 percent of the limited cases (655 cases) became at issue. Of the total at-issue cases, only 7 percent (46 cases) stipulated to mediation. 344 As noted above, there was not sufficient mediation outcome information in these limited cases to determine the proportion of stipulated cases that went to mediation and the proportion of those cases that settled at mediation.345
Figure VII-2. Case Flow for Limited Cases Filed in 2000 and 2001 in Sonoma
Conclusion As noted in the introduction to this study, each of the pilot mediation programs examined in this study is different. In reviewing the results for the Superior Court of Sonoma County program, it is important to keep in mind the unique characteristics of this court
344 However, early mediation status conferences were held in approximately 70 percent (436 cases) of the limited cases that became at issue. 345 Only 14 cases provided information on the outcome of mediation: 8 of the 14 cases did not go to mediation, and 5 of the 6 cases that went to mediation settled at the mediation.
Filed 65% At Issue 28%Stipulated
to Mediation 83%Went to
Mediation 62%Settled at Mediation
3,839 2,511 691 574 356
35%
72%
17%
38%Not At Issue
Did Not Stipulate to Mediation
Did Not Use
Mediation
Not Settled at Mediation
1,328 1,820 117 218
Note: Both the number of cases that went to mediation and the number of cases that settled at mediation were extrapolated from a sample of cases with information available on mediation outcomes.
Filed 17% At Issue 7%
Stipulated to
MediationWent to
Mediation*Settled at Mediation*
3,922 655 46
83%
93%
Not At Issue
Did Not Stipulate to Mediation
Did Not Use
Mediation*
Not Settled at Mediation*
3,267 609
*No reliable information was available as to the nubmer of cases going through these processes.

338
and its pilot program, particularly the program’s focus on case management conferences and the relatively long disposition time, as that impacted the availability of complete data on the outcome of cases in the study.
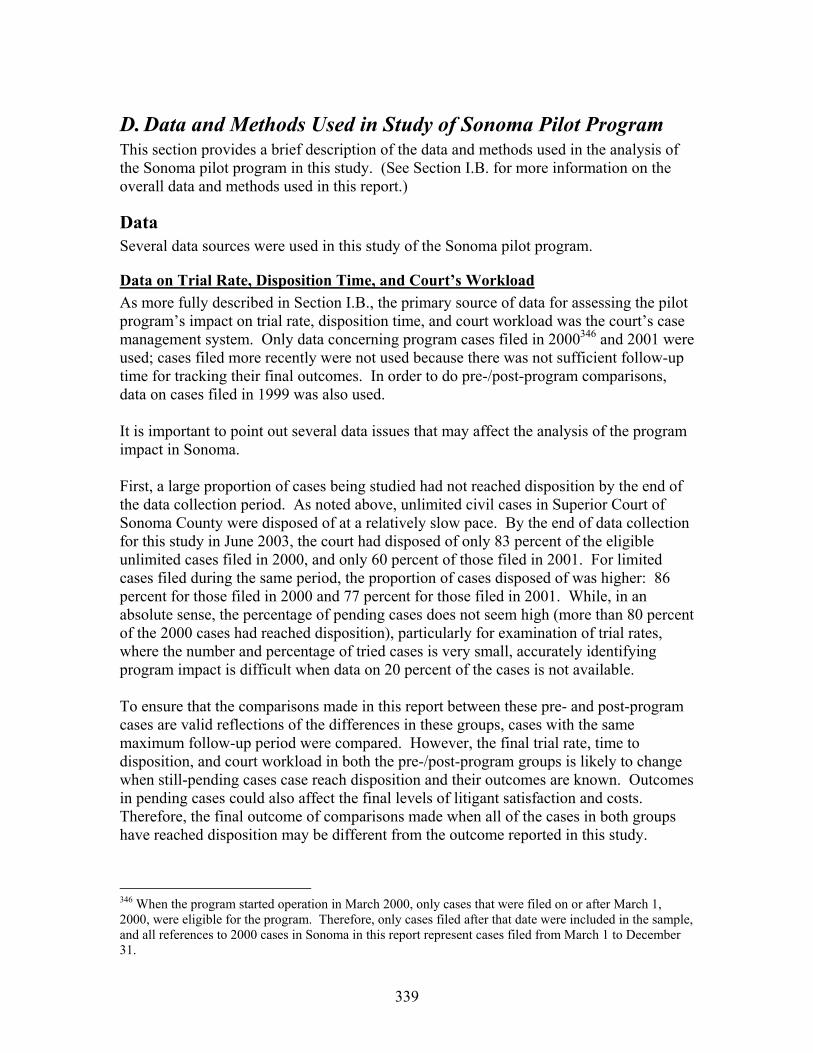
339
D. Data and Methods Used in Study of Sonoma Pilot Program This section provides a brief description of the data and methods used in the analysis of the Sonoma pilot program in this study. (See Section I.B. for more information on the overall data and methods used in this report.)
Data Several data sources were used in this study of the Sonoma pilot program.
Data on Trial Rate, Disposition Time, and Court’s Workload As more fully described in Section I.B., the primary source of data for assessing the pilot program’s impact on trial rate, disposition time, and court workload was the court’s case management system. Only data concerning program cases filed in 2000346 and 2001 were used; cases filed more recently were not used because there was not sufficient follow-up time for tracking their final outcomes. In order to do pre-/post-program comparisons, data on cases filed in 1999 was also used. It is important to point out several data issues that may affect the analysis of the program impact in Sonoma. First, a large proportion of cases being studied had not reached disposition by the end of the data collection period. As noted above, unlimited civil cases in Superior Court of Sonoma County were disposed of at a relatively slow pace. By the end of data collection for this study in June 2003, the court had disposed of only 83 percent of the eligible unlimited cases filed in 2000, and only 60 percent of those filed in 2001. For limited cases filed during the same period, the proportion of cases disposed of was higher: 86 percent for those filed in 2000 and 77 percent for those filed in 2001. While, in an absolute sense, the percentage of pending cases does not seem high (more than 80 percent of the 2000 cases had reached disposition), particularly for examination of trial rates, where the number and percentage of tried cases is very small, accurately identifying program impact is difficult when data on 20 percent of the cases is not available. To ensure that the comparisons made in this report between these pre- and post-program cases are valid reflections of the differences in these groups, cases with the same maximum follow-up period were compared. However, the final trial rate, time to disposition, and court workload in both the pre-/post-program groups is likely to change when still-pending cases case reach disposition and their outcomes are known. Outcomes in pending cases could also affect the final levels of litigant satisfaction and costs. Therefore, the final outcome of comparisons made when all of the cases in both groups have reached disposition may be different from the outcome reported in this study.
346 When the program started operation in March 2000, only cases that were filed on or after March 1, 2000, were eligible for the program. Therefore, only cases filed after that date were included in the sample, and all references to 2000 cases in Sonoma in this report represent cases filed from March 1 to December 31.
340
Second, as noted above, complete, reliable mediation outcome information was not available in Sonoma. Nor was there any “pre-program” information about the number of cases filed in 1999 in which the parties stipulated to or used mediation. Without this information, it was not possible to look separately at all post-program cases that settled before mediation, settled at mediation, and did not settle at mediation to see how these subgroups of cases affected the overall group of stipulated cases or to see how these different groups of cases might have been affected by their pilot program experiences. It was also not possible to compare the mediation stipulation rate or mediation use rate before and after the introduction of the pilot program. For the subgroup of mediated cases in which mediation outcome information was available, information about time to disposition and court workload in cases that settled and did not settle at mediation is provided. Third, the small number of limited cases that stipulated to mediation—22 cases in 2000 and 27 cases in 2001—makes it difficult to draw reliable conclusions from comparisons between stipulated and nonstipulated limited cases. Finally, the court’s case management system did not contain complete information about the number and dates of case management conferences, actually held; the system recorded conferences set, but not whether and when those set were actually held. It was therefore not possible to include information about case management conferences in the analysis of court workload.
Data on Litigant Satisfaction and Costs As is also more fully described in Section I.B., analysis of program impact on litigant satisfaction and costs was based on data from surveys distributed (1) to attorneys and parties who went to mediation between July 2001 and June 2002 (“postmediation survey”) and (2) to parties and attorneys in stipulated and nonstipulated cases that reached disposition during the same period (“postdisposition survey”). The number of survey responses received in limited cases in which the parties stipulated to mediation was too small (18 survey responses) to make use of this data either for comparisons with stipulated cases or for purposes of regression analyses. Therefore, comparisons of litigant satisfaction and litigant costs in stipulated and nonstipulated cases and all regression results were based on unlimited cases only.
Methods Unlike in the pilot courts with mandatory programs, in Sonoma, there was no randomly assigned control group of cases in which the pilot program was not available, so program-control group comparisons could not be used to examine the impacts of the Sonoma pilot program. Instead, two other types of comparisons were used: (1) comparisons between cases filed before the pilot program began and cases filed after the program began (pre-/post-program comparisons), and (2) comparisons between cases in which the parties stipulated to mediation and those in which the parties did not stipulate to mediation.
341
Pre-/Post-program Comparisons Pre-/post-program comparisons were used as the primary method to examine the Sonoma pilot program’s impact on the trial rate, time to disposition, and court workload. Because, unlike in Contra Costa, the Superior Court of Sonoma County did not have a mediation program before the pilot program was introduced, to the extent that full data on the outcomes was available, these pre-/post-program comparisons worked fairly well to identify the impact of introducing the pilot program, with all of its program features, into the Superior Court of Sonoma County.
Comparisons Between Stipulated and Nonstipulated Cases Comparisons between eligible cases in which the parties stipulated to mediation and eligible cases in which the parties did not stipulate to mediation were used to examine the Sonoma pilot program’s impact on litigant costs and satisfaction, as well as to provide additional information about trial rates, time to disposition, and court workload. As discussed in Section I.B., there are important limitations to these comparisons because stipulated and nonstipulated cases are qualitatively different from each other. As in Contra Costa, one of the differences between these two groups was that the nonstipulated group included a larger percentage of “easy” cases—cases that reached disposition within six months of filing with few court events and very few trials—than the stipulated group.347 Two additional comparisons were therefore made to try to account for the differences in the characteristics of stipulated and nonstipulated cases. First, outcomes in only those stipulated and nonstipulated cases that reached disposition in more than six months were compared. Second, using regression analysis, comparisons were made between stipulated cases and nonstipulated cases with similar case characteristics. In this regression analysis, the variables taken into account included all the case characteristics about which data was available in this study as well as whether the case resolved within 6 months or in over 18 months. However, as noted in the methods Section I.B., it is almost certain that there were additional “unknown” case characteristics that were not appropriately accounted for in these regressions. Therefore, the findings from regression analyses reported below should be interpreted with caution.
347 The difference in the proportion of these “easy” cases in the stipulated and nonstipulated groups was smaller in Sonoma than in Contra Costa. This was probably due to the longer average disposition time in Sonoma; there were simply very few unlimited cases reached disposition within six months in Sonoma.
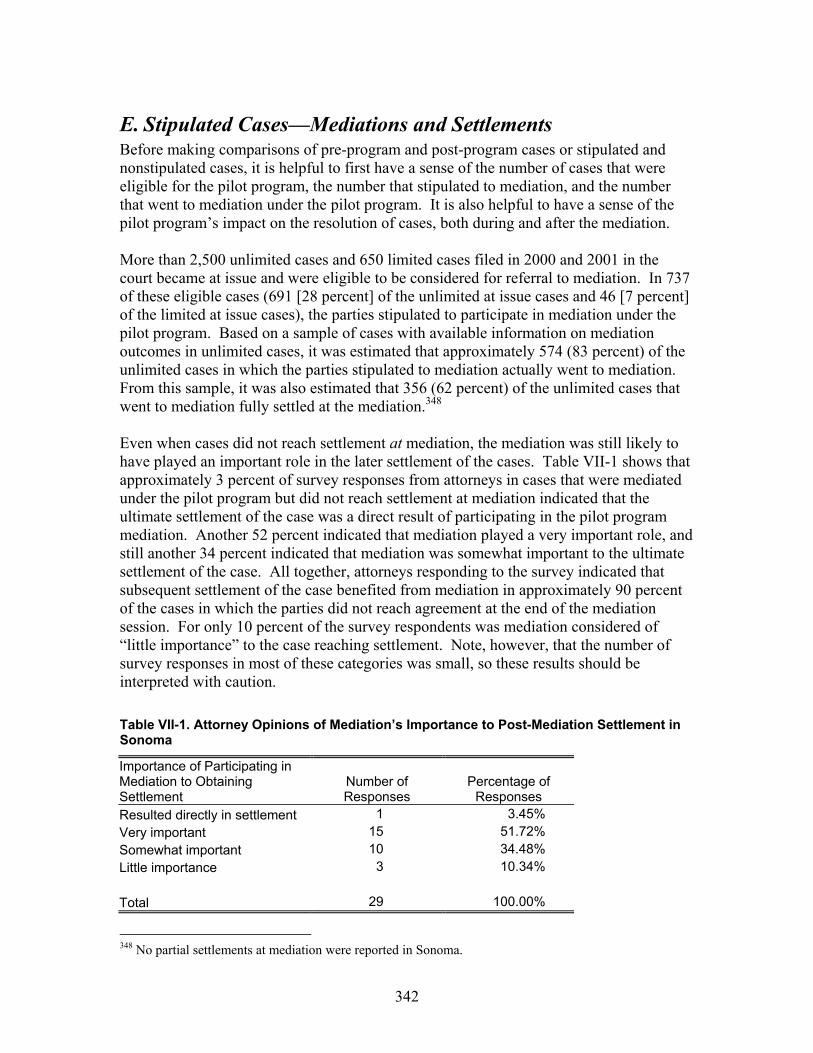
342
E. Stipulated Cases—Mediations and Settlements Before making comparisons of pre-program and post-program cases or stipulated and nonstipulated cases, it is helpful to first have a sense of the number of cases that were eligible for the pilot program, the number that stipulated to mediation, and the number that went to mediation under the pilot program. It is also helpful to have a sense of the pilot program’s impact on the resolution of cases, both during and after the mediation. More than 2,500 unlimited cases and 650 limited cases filed in 2000 and 2001 in the court became at issue and were eligible to be considered for referral to mediation. In 737 of these eligible cases (691 [28 percent] of the unlimited at issue cases and 46 [7 percent] of the limited at issue cases), the parties stipulated to participate in mediation under the pilot program. Based on a sample of cases with available information on mediation outcomes in unlimited cases, it was estimated that approximately 574 (83 percent) of the unlimited cases in which the parties stipulated to mediation actually went to mediation. From this sample, it was also estimated that 356 (62 percent) of the unlimited cases that went to mediation fully settled at the mediation.348 Even when cases did not reach settlement at mediation, the mediation was still likely to have played an important role in the later settlement of the cases. Table VII-1 shows that approximately 3 percent of survey responses from attorneys in cases that were mediated under the pilot program but did not reach settlement at mediation indicated that the ultimate settlement of the case was a direct result of participating in the pilot program mediation. Another 52 percent indicated that mediation played a very important role, and still another 34 percent indicated that mediation was somewhat important to the ultimate settlement of the case. All together, attorneys responding to the survey indicated that subsequent settlement of the case benefited from mediation in approximately 90 percent of the cases in which the parties did not reach agreement at the end of the mediation session. For only 10 percent of the survey respondents was mediation considered of “little importance” to the case reaching settlement. Note, however, that the number of survey responses in most of these categories was small, so these results should be interpreted with caution. Table VII-1. Attorney Opinions of Mediation’s Importance to Post-Mediation Settlement in Sonoma
Importance of Participating in Mediation to Obtaining Settlement
Number of Responses
Percentage of Responses
Resulted directly in settlement 1 3.45% Very important 15 51.72% Somewhat important 10 34.48% Little importance 3 10.34% Total 29 100.00%
348 No partial settlements at mediation were reported in Sonoma.

343
Adding together those cases where the survey respondents indicated that subsequent settlement of the case was a direct result of participating in mediation and those cases that settled at the mediation session, the overall resolution rate in mediation under the Sonoma pilot program was estimated to be 62 percent.
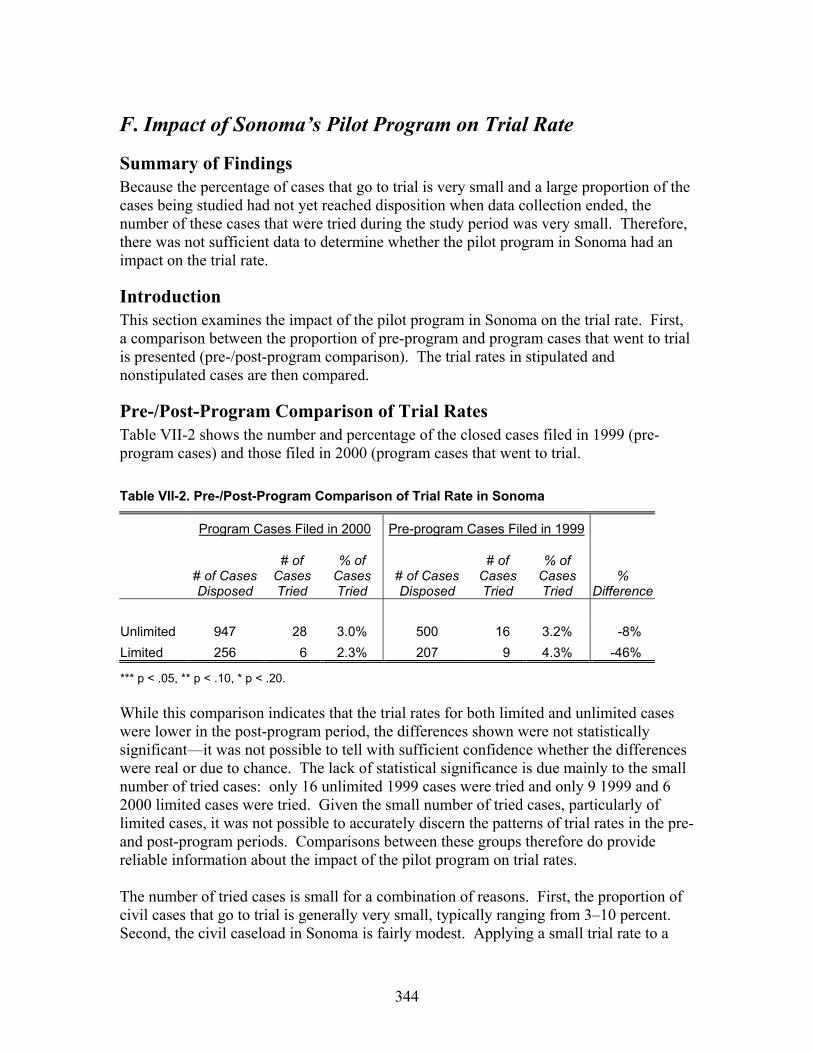
344
F. Impact of Sonoma’s Pilot Program on Trial Rate
Summary of Findings Because the percentage of cases that go to trial is very small and a large proportion of the cases being studied had not yet reached disposition when data collection ended, the number of these cases that were tried during the study period was very small. Therefore, there was not sufficient data to determine whether the pilot program in Sonoma had an impact on the trial rate.
Introduction This section examines the impact of the pilot program in Sonoma on the trial rate. First, a comparison between the proportion of pre-program and program cases that went to trial is presented (pre-/post-program comparison). The trial rates in stipulated and nonstipulated cases are then compared.
Pre-/Post-Program Comparison of Trial Rates Table VII-2 shows the number and percentage of the closed cases filed in 1999 (pre-program cases) and those filed in 2000 (program cases that went to trial. Table VII-2. Pre-/Post-Program Comparison of Trial Rate in Sonoma
Program Cases Filed in 2000 Pre-program Cases Filed in 1999
# of Cases Disposed
# of Cases Tried
% of Cases Tried
# of Cases Disposed
# of Cases Tried
% of Cases Tried
% Difference
Unlimited 947 28 3.0% 500 16 3.2% -8% Limited 256 6 2.3% 207 9 4.3% -46%
*** p < .05, ** p < .10, * p < .20. While this comparison indicates that the trial rates for both limited and unlimited cases were lower in the post-program period, the differences shown were not statistically significant—it was not possible to tell with sufficient confidence whether the differences were real or due to chance. The lack of statistical significance is due mainly to the small number of tried cases: only 16 unlimited 1999 cases were tried and only 9 1999 and 6 2000 limited cases were tried. Given the small number of tried cases, particularly of limited cases, it was not possible to accurately discern the patterns of trial rates in the pre- and post-program periods. Comparisons between these groups therefore do provide reliable information about the impact of the pilot program on trial rates. The number of tried cases is small for a combination of reasons. First, the proportion of civil cases that go to trial is generally very small, typically ranging from 3–10 percent. Second, the civil caseload in Sonoma is fairly modest. Applying a small trial rate to a
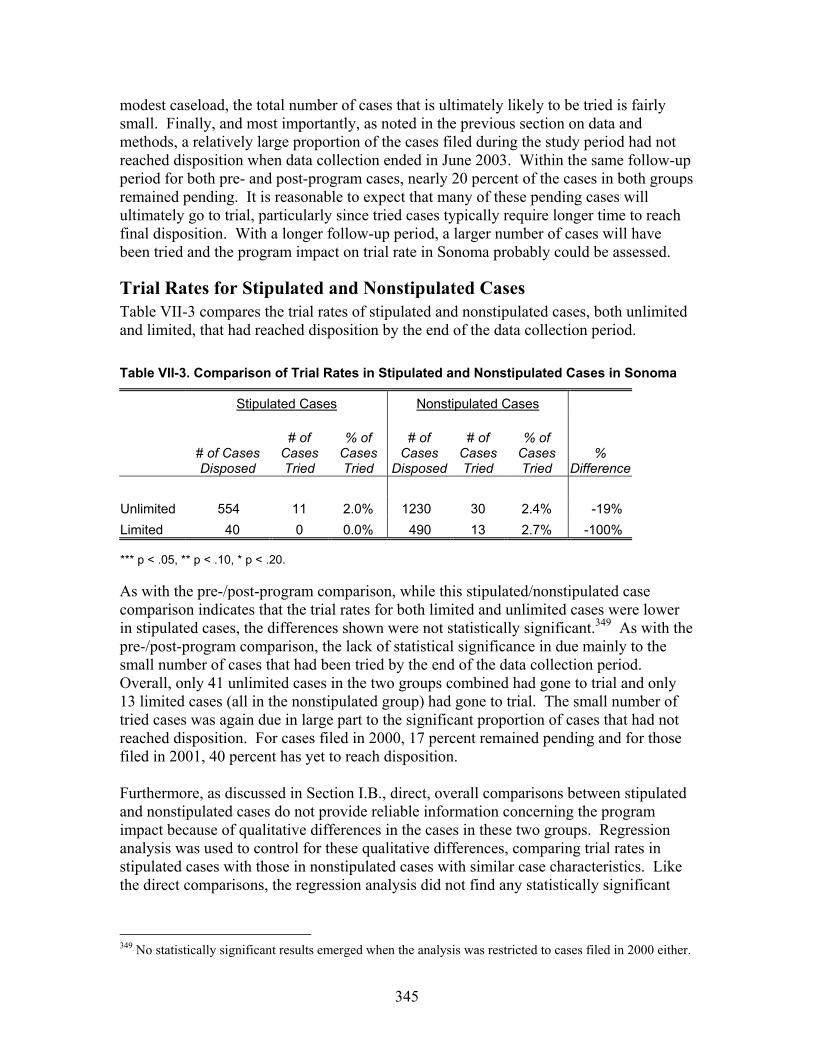
345
modest caseload, the total number of cases that is ultimately likely to be tried is fairly small. Finally, and most importantly, as noted in the previous section on data and methods, a relatively large proportion of the cases filed during the study period had not reached disposition when data collection ended in June 2003. Within the same follow-up period for both pre- and post-program cases, nearly 20 percent of the cases in both groups remained pending. It is reasonable to expect that many of these pending cases will ultimately go to trial, particularly since tried cases typically require longer time to reach final disposition. With a longer follow-up period, a larger number of cases will have been tried and the program impact on trial rate in Sonoma probably could be assessed.
Trial Rates for Stipulated and Nonstipulated Cases Table VII-3 compares the trial rates of stipulated and nonstipulated cases, both unlimited and limited, that had reached disposition by the end of the data collection period. Table VII-3. Comparison of Trial Rates in Stipulated and Nonstipulated Cases in Sonoma
Stipulated Cases Nonstipulated Cases
# of Cases Disposed
# of Cases Tried
% of Cases Tried
# of Cases
Disposed
# of Cases Tried
% of Cases Tried
% Difference
Unlimited 554 11 2.0% 1230 30 2.4% -19% Limited 40 0 0.0% 490 13 2.7% -100%
*** p < .05, ** p < .10, * p < .20. As with the pre-/post-program comparison, while this stipulated/nonstipulated case comparison indicates that the trial rates for both limited and unlimited cases were lower in stipulated cases, the differences shown were not statistically significant.349 As with the pre-/post-program comparison, the lack of statistical significance in due mainly to the small number of cases that had been tried by the end of the data collection period. Overall, only 41 unlimited cases in the two groups combined had gone to trial and only 13 limited cases (all in the nonstipulated group) had gone to trial. The small number of tried cases was again due in large part to the significant proportion of cases that had not reached disposition. For cases filed in 2000, 17 percent remained pending and for those filed in 2001, 40 percent has yet to reach disposition. Furthermore, as discussed in Section I.B., direct, overall comparisons between stipulated and nonstipulated cases do not provide reliable information concerning the program impact because of qualitative differences in the cases in these two groups. Regression analysis was used to control for these qualitative differences, comparing trial rates in stipulated cases with those in nonstipulated cases with similar case characteristics. Like the direct comparisons, the regression analysis did not find any statistically significant
349 No statistically significant results emerged when the analysis was restricted to cases filed in 2000 either.
346
difference in the trial rates for stipulated and nonstipulated cases.350 Again, this is most likely due to the small number of tried cases available for analysis.
Conclusion Although both the pre-/post-program comparison and the stipulated-nonstipulated case comparisons showed reductions in the trial rate, these results were not statistically significant—it was not possible to tell with sufficient confidence whether the differences shown were real or due to chance. The lack of statistical significance stemmed from the fact that the number of cases tried during the study period was very small. The number of tried cases is small mainly because, as noted in the previous section on data and methods, a large proportion of the cases being studied had not reached disposition when data collection ended. With a longer follow-up period, a larger number of cases will have been tried and the program impact on trial rate in Sonoma could probably be assessed.
350 As noted in Section I.B., this regression analysis controlled for those case characteristics about which data was available from the case management system and from the surveys, as well as for whether the cases were disposed of within 6 months or in over 18 months. However, it is almost certain that there were additional “unknown” case characteristics that were not appropriately accounted for in these regressions. Therefore, findings from these analyses should be interpreted with caution.
347
G. Impact of Sonoma’s Pilot Program on Case Disposition Time
Summary of Findings The pilot program in Sonoma had a positive impact on case disposition time for both limited and unlimited cases: • The average disposition time for limited cases filed after the pilot program began was
37 days shorter than the average for limited cases filed the year before the program began.
• The disposition rate for unlimited post-program cases was higher than for pre-
program cases for the entire 34-month follow-up period. The pace of dispositions for limited cases accelerated about the time when, under the court’s rules, early mediation status conferences were set, suggesting that these conferences played an important role in improving disposition time.
• Comparisons between stipulated and nonstipulated cases found no significant
difference in average disposition time for the two groups. However, comparisons of the disposition rates in these groups showed that while nonstipulated cases begin to resolve earlier, once stipulated cases began reaching disposition, they were disposed of faster than nonstipulated cases and ultimately more stipulated than nonstipulated cases reached disposition by the end of 34 months. The fact that stipulated cases were disposed of fastest between 6 and 12 months after filing, about the time that mediations were to occur under the court’s pilot program rules, suggests that participation in mediation may have increased the rate of disposition for stipulated cases.
• Cases that settled at mediation were resolved an average of 131 days faster than cases
that did not settle at mediation.
Introduction This section presents an analysis of the Sonoma pilot program’s impact on time to disposition. Similar to the previous section on trial rates, a pre-/post-program comparison is presented first, including comparisons of both the average and median time to disposition and the rate of disposition over time. Second, comparisons of case disposition time in cases that stipulated to mediation and those that did not stipulate to mediation are presented, including both the average and median time to disposition and the rate of disposition over time.
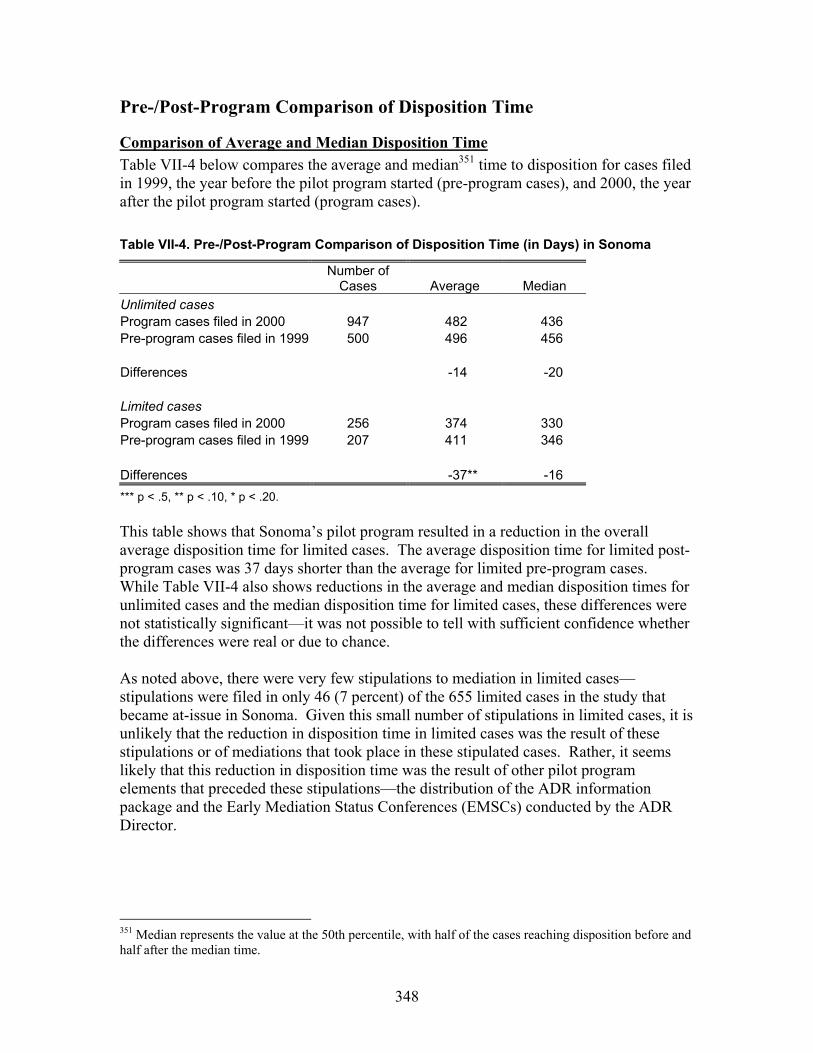
348
Pre-/Post-Program Comparison of Disposition Time
Comparison of Average and Median Disposition Time Table VII-4 below compares the average and median351 time to disposition for cases filed in 1999, the year before the pilot program started (pre-program cases), and 2000, the year after the pilot program started (program cases). Table VII-4. Pre-/Post-Program Comparison of Disposition Time (in Days) in Sonoma
Number of
Cases Average Median Unlimited cases Program cases filed in 2000 947 482 436 Pre-program cases filed in 1999 500 496 456 Differences -14 -20 Limited cases Program cases filed in 2000 256 374 330 Pre-program cases filed in 1999 207 411 346 Differences -37** -16 *** p < .5, ** p < .10, * p < .20. This table shows that Sonoma’s pilot program resulted in a reduction in the overall average disposition time for limited cases. The average disposition time for limited post-program cases was 37 days shorter than the average for limited pre-program cases. While Table VII-4 also shows reductions in the average and median disposition times for unlimited cases and the median disposition time for limited cases, these differences were not statistically significant—it was not possible to tell with sufficient confidence whether the differences were real or due to chance. As noted above, there were very few stipulations to mediation in limited cases—stipulations were filed in only 46 (7 percent) of the 655 limited cases in the study that became at-issue in Sonoma. Given this small number of stipulations in limited cases, it is unlikely that the reduction in disposition time in limited cases was the result of these stipulations or of mediations that took place in these stipulated cases. Rather, it seems likely that this reduction in disposition time was the result of other pilot program elements that preceded these stipulations—the distribution of the ADR information package and the Early Mediation Status Conferences (EMSCs) conducted by the ADR Director. 351 Median represents the value at the 50th percentile, with half of the cases reaching disposition before and half after the median time.
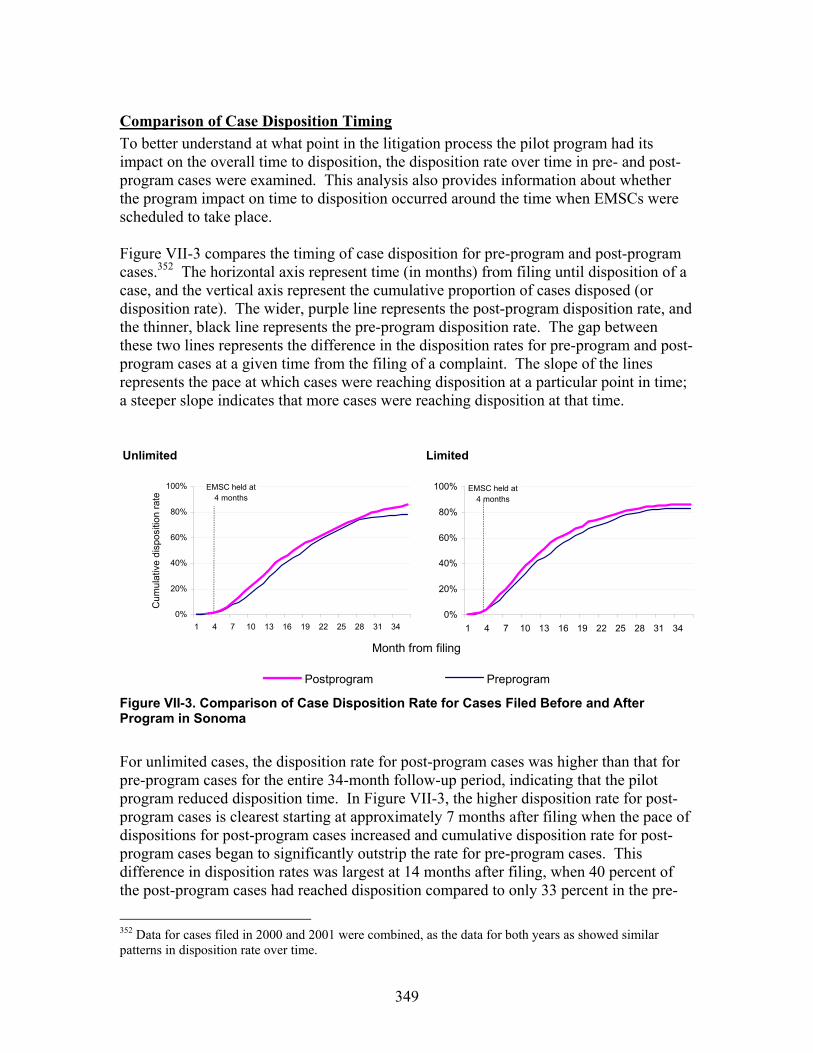
349
Comparison of Case Disposition Timing To better understand at what point in the litigation process the pilot program had its impact on the overall time to disposition, the disposition rate over time in pre- and post-program cases were examined. This analysis also provides information about whether the program impact on time to disposition occurred around the time when EMSCs were scheduled to take place. Figure VII-3 compares the timing of case disposition for pre-program and post-program cases.352 The horizontal axis represent time (in months) from filing until disposition of a case, and the vertical axis represent the cumulative proportion of cases disposed (or disposition rate). The wider, purple line represents the post-program disposition rate, and the thinner, black line represents the pre-program disposition rate. The gap between these two lines represents the difference in the disposition rates for pre-program and post-program cases at a given time from the filing of a complaint. The slope of the lines represents the pace at which cases were reaching disposition at a particular point in time; a steeper slope indicates that more cases were reaching disposition at that time.
Figure VII-3. Comparison of Case Disposition Rate for Cases Filed Before and After Program in Sonoma
For unlimited cases, the disposition rate for post-program cases was higher than that for pre-program cases for the entire 34-month follow-up period, indicating that the pilot program reduced disposition time. In Figure VII-3, the higher disposition rate for post-program cases is clearest starting at approximately 7 months after filing when the pace of dispositions for post-program cases increased and cumulative disposition rate for post-program cases began to significantly outstrip the rate for pre-program cases. This difference in disposition rates was largest at 14 months after filing, when 40 percent of the post-program cases had reached disposition compared to only 33 percent in the pre-
352 Data for cases filed in 2000 and 2001 were combined, as the data for both years as showed similar patterns in disposition rate over time.
Unlimited Limited
Postprogram Preprogram
0%
20%
40%
60%
80%
100%
1 4 7 10 13 16 19 22 25 28 31 34
Cum
ulat
ive
disp
ositi
on ra
te
EMSC held at 4 months
0%
20%
40%
60%
80%
100%
1 4 7 10 13 16 19 22 25 28 31 34
EMSC held at 4 months
Month from filing
350
program group. These differences in disposition rates were statistically significant. Similarly, for limited cases, the disposition rate for post-program cases was higher than that for pre-program cases for the entire 34-month follow-up period. The higher disposition rate for post-program cases is clearest starting at about 5 months after filing when the pace of dispositions for post-program cases increased and cumulative disposition rate for post-program cases began to pull away from that for pre-program cases. This difference in disposition rates was largest at 14 months after filing, when 57 percent of the post-program cases had reached disposition compared to only 48 percent in the pre-program group. Unlike for unlimited cases, however, the difference between the disposition rates for pre- and post-program limited cases was not statistically significant. Figure VII-3 also shows the time period at which early mediation status conferences would have taken place under the court’s rules353—at about four months after filing. This is about the same point at which pace of dispositions among the post-program limited cases began to rise sharply. This timing suggests that the status conferences had a positive impact on expediting limited case disposition. It is important to remember that in this pre-/post-program comparison, all eligible civil cases are included in the post-program group, not just those that stipulated to mediation. Thus, the program impact on time to disposition seen in Figure VII-3 and the apparent impact of the early mediation status conference in limited cases extends to all the eligible civil cases, including those that did not stipulate to mediation.
Overall Comparison of Time to Disposition in Stipulated and Nonstipulated Cases
Comparison of Average and Median Disposition Time Table VII-5 compares the average and median354 times to disposition in stipulated and nonstipulated cases. As this table shows, no statistically significant differences were found between the average or median disposition times for stipulated and nonstipulated cases—while the table shows that the average disposition times for both unlimited and limited stipulated cases were longer than those for nonstipulated cases, it was not possible to tell with sufficient confidence whether these differences were real or due to chance. As noted in Section I.B., however, direct, overall comparisons between stipulated and nonstipulated cases do not provide reliable information concerning the program impact because of qualitative differences in the cases in these two groups. Two additional comparisons were done to try to account for these comparability problems. First, comparisons were made between stipulated cases and nonstipulated cases that reached disposition after six months. Second, the disposition time in stipulated cases was
353 As discussed in the section on data and methods, data on when initial case management conferences were actually held, as opposed to when they were originally set, was not available in Sonoma. Patterns in the other pilot courts indicated that, on average, these conferences typically took place later than the time period provided under the courts’ rules. 354 The median represents the value at the 50th percentile, with half of the cases reaching disposition before and half after the median time.
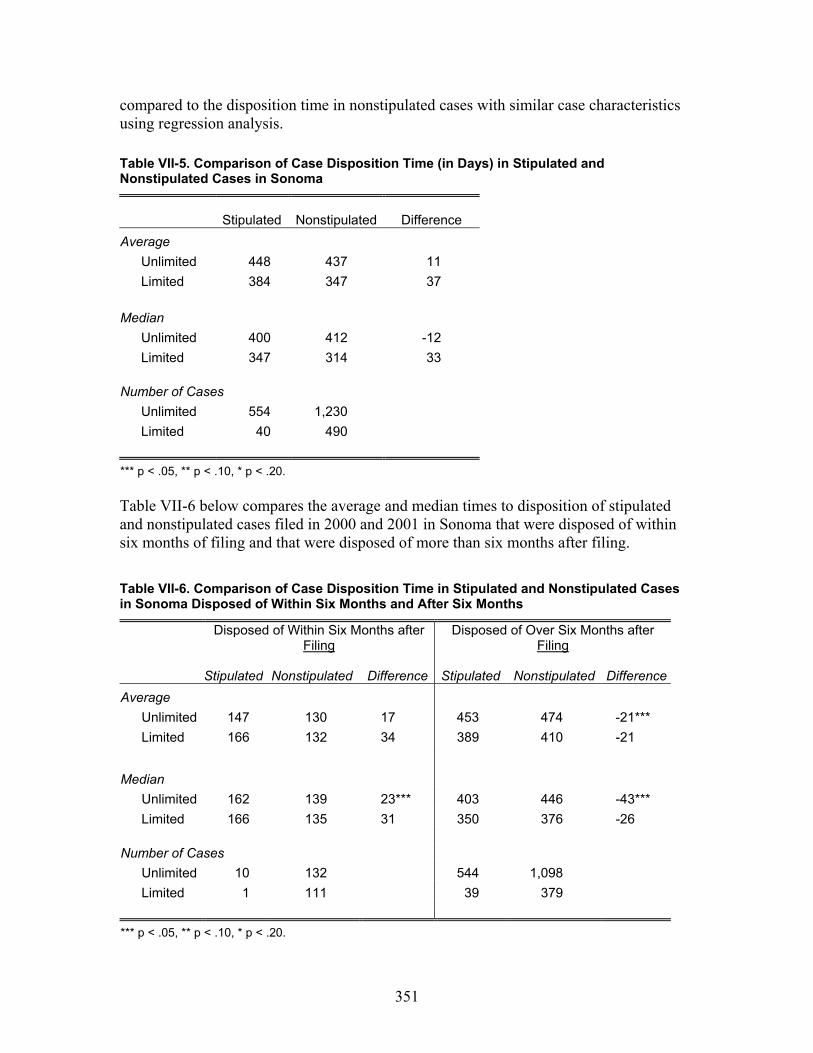
351
compared to the disposition time in nonstipulated cases with similar case characteristics using regression analysis.
Table VII-5. Comparison of Case Disposition Time (in Days) in Stipulated and Nonstipulated Cases in Sonoma
Stipulated Nonstipulated Difference Average
Unlimited 448 437 11 Limited 384 347 37
Median
Unlimited 400 412 -12 Limited 347 314 33
Number of Cases
Unlimited 554 1,230 Limited 40 490
*** p < .05, ** p < .10, * p < .20. Table VII-6 below compares the average and median times to disposition of stipulated and nonstipulated cases filed in 2000 and 2001 in Sonoma that were disposed of within six months of filing and that were disposed of more than six months after filing. Table VII-6. Comparison of Case Disposition Time in Stipulated and Nonstipulated Cases in Sonoma Disposed of Within Six Months and After Six Months
Disposed of Within Six Months after
Filing Disposed of Over Six Months after
Filing
Stipulated Nonstipulated Difference Stipulated Nonstipulated DifferenceAverage
Unlimited 147 130 17 453 474 -21*** Limited 166 132 34 389 410 -21
Median
Unlimited 162 139 23*** 403 446 -43*** Limited 166 135 31 350 376 -26
Number of Cases
Unlimited 10 132 544 1,098 Limited 1 111 39 379
*** p < .05, ** p < .10, * p < .20.
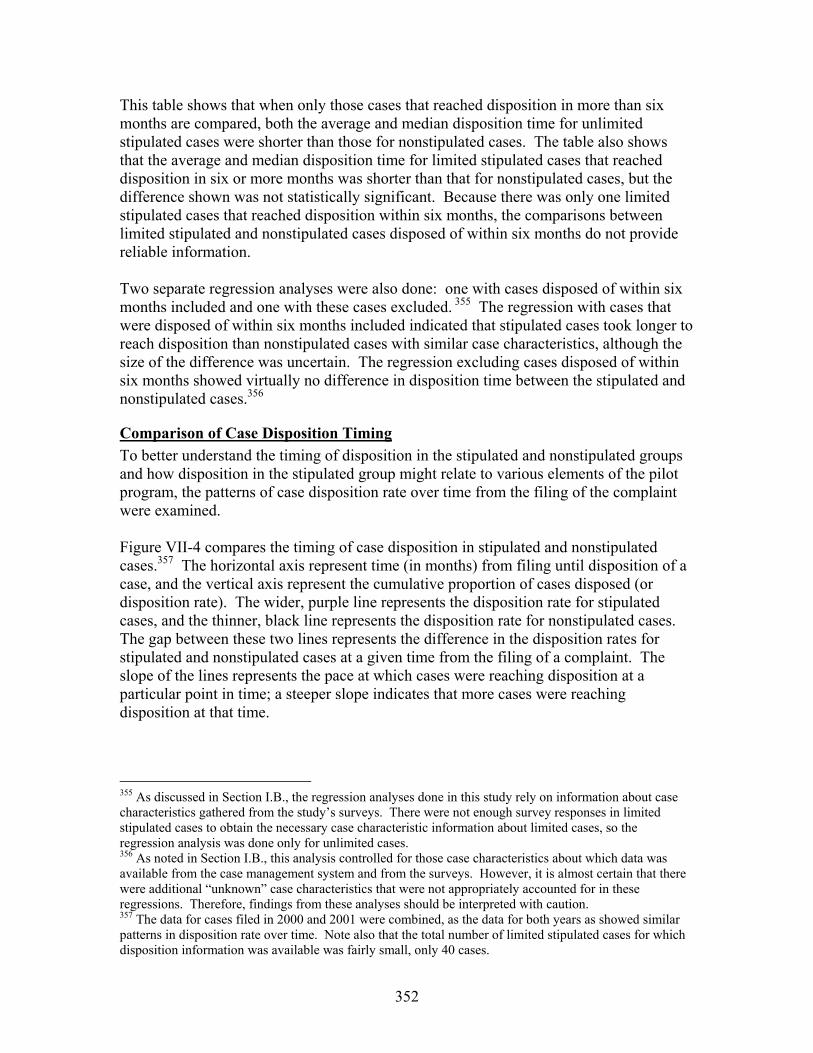
352
This table shows that when only those cases that reached disposition in more than six months are compared, both the average and median disposition time for unlimited stipulated cases were shorter than those for nonstipulated cases. The table also shows that the average and median disposition time for limited stipulated cases that reached disposition in six or more months was shorter than that for nonstipulated cases, but the difference shown was not statistically significant. Because there was only one limited stipulated cases that reached disposition within six months, the comparisons between limited stipulated and nonstipulated cases disposed of within six months do not provide reliable information. Two separate regression analyses were also done: one with cases disposed of within six months included and one with these cases excluded. 355 The regression with cases that were disposed of within six months included indicated that stipulated cases took longer to reach disposition than nonstipulated cases with similar case characteristics, although the size of the difference was uncertain. The regression excluding cases disposed of within six months showed virtually no difference in disposition time between the stipulated and nonstipulated cases.356
Comparison of Case Disposition Timing To better understand the timing of disposition in the stipulated and nonstipulated groups and how disposition in the stipulated group might relate to various elements of the pilot program, the patterns of case disposition rate over time from the filing of the complaint were examined. Figure VII-4 compares the timing of case disposition in stipulated and nonstipulated cases.357 The horizontal axis represent time (in months) from filing until disposition of a case, and the vertical axis represent the cumulative proportion of cases disposed (or disposition rate). The wider, purple line represents the disposition rate for stipulated cases, and the thinner, black line represents the disposition rate for nonstipulated cases. The gap between these two lines represents the difference in the disposition rates for stipulated and nonstipulated cases at a given time from the filing of a complaint. The slope of the lines represents the pace at which cases were reaching disposition at a particular point in time; a steeper slope indicates that more cases were reaching disposition at that time.
355 As discussed in Section I.B., the regression analyses done in this study rely on information about case characteristics gathered from the study’s surveys. There were not enough survey responses in limited stipulated cases to obtain the necessary case characteristic information about limited cases, so the regression analysis was done only for unlimited cases. 356 As noted in Section I.B., this analysis controlled for those case characteristics about which data was available from the case management system and from the surveys. However, it is almost certain that there were additional “unknown” case characteristics that were not appropriately accounted for in these regressions. Therefore, findings from these analyses should be interpreted with caution. 357 The data for cases filed in 2000 and 2001 were combined, as the data for both years as showed similar patterns in disposition rate over time. Note also that the total number of limited stipulated cases for which disposition information was available was fairly small, only 40 cases.
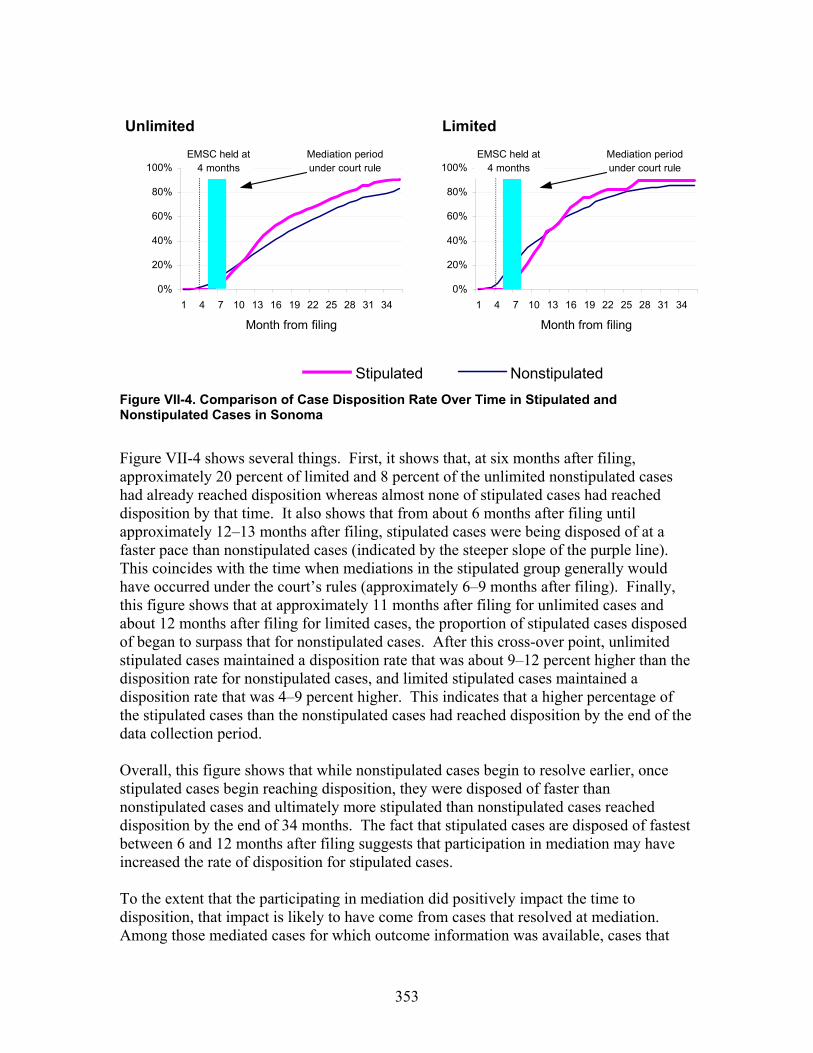
353
Figure VII-4. Comparison of Case Disposition Rate Over Time in Stipulated and Nonstipulated Cases in Sonoma
Figure VII-4 shows several things. First, it shows that, at six months after filing, approximately 20 percent of limited and 8 percent of the unlimited nonstipulated cases had already reached disposition whereas almost none of stipulated cases had reached disposition by that time. It also shows that from about 6 months after filing until approximately 12–13 months after filing, stipulated cases were being disposed of at a faster pace than nonstipulated cases (indicated by the steeper slope of the purple line). This coincides with the time when mediations in the stipulated group generally would have occurred under the court’s rules (approximately 6–9 months after filing). Finally, this figure shows that at approximately 11 months after filing for unlimited cases and about 12 months after filing for limited cases, the proportion of stipulated cases disposed of began to surpass that for nonstipulated cases. After this cross-over point, unlimited stipulated cases maintained a disposition rate that was about 9–12 percent higher than the disposition rate for nonstipulated cases, and limited stipulated cases maintained a disposition rate that was 4–9 percent higher. This indicates that a higher percentage of the stipulated cases than the nonstipulated cases had reached disposition by the end of the data collection period. Overall, this figure shows that while nonstipulated cases begin to resolve earlier, once stipulated cases begin reaching disposition, they were disposed of faster than nonstipulated cases and ultimately more stipulated than nonstipulated cases reached disposition by the end of 34 months. The fact that stipulated cases are disposed of fastest between 6 and 12 months after filing suggests that participation in mediation may have increased the rate of disposition for stipulated cases. To the extent that the participating in mediation did positively impact the time to disposition, that impact is likely to have come from cases that resolved at mediation. Among those mediated cases for which outcome information was available, cases that
Unlimited Limited
Stipulated Nonstipulated
0%
20%
40%
60%
80%
100%
1 4 7 10 13 16 19 22 25 28 31 34
Month from filing
EMSC held at 4 months
Mediation period under court rule
0%
20%
40%
60%
80%
100%
1 4 7 10 13 16 19 22 25 28 31 34
Month from filing
EMSC held at 4 months
Mediation period under court rule
354
settled at mediation reached disposition 131 days faster than cases that did not settle at mediation: the average disposition time for cases settled at mediation was 366 days compared to 497 days for cases that did not settle at mediation.
Conclusion Based on comparisons between cases filed before and after the pilot program began, there was clear evidence showing that the overall case disposition rate improved after the pilot program was implemented by the court. For limited cases, the overall average time to disposition was 37 days shorter in program cases than in pre-program cases. For unlimited cases, the disposition rate for program cases was higher than that for pre-program cases for the entire 34-month follow-up period. Since these pre-/post-comparisons examine impacts on all cases that were eligible for the program, these positive results suggest that the pilot program expedited disposition for both stipulated and nonstipulated cases. The fact that the pace of dispositions for limited cases accelerated about the time when, under the court’s rules, early mediation status conferences were set suggests that this conference played a role in improving disposition time. In direct comparisons between stipulated and nonstipulated cases in the program, no significant difference was found between the average or median time to disposition in the two groups for either limited or unlimited cases. Similarly, regression analysis that controlled for differences in case characteristics between the stipulated and nonstipulated groups did not provide any conclusive evidence that there was any difference in average case disposition time between the two groups. However, comparisons of the disposition rates in stipulated and nonstipulated cases showed that while nonstipulated cases begin to resolve earlier, once stipulated cases begin reaching disposition, they were disposed of faster than nonstipulated cases and ultimately more stipulated than nonstipulated cases reached disposition by the end of 34 months. The fact that stipulated cases were disposed of fastest between 6 and 12 months after filing, about the time that mediations would have occurred under the court’s pilot program rules, suggests that participation in mediation may have increased the rate of disposition for stipulated cases.
355
H. Impact of Sonoma’s Pilot Program on Litigant Satisfaction
Summary of Findings There is evidence that the pilot program in Sonoma increased litigant satisfaction with the both litigation process and the services provided by the court. • Both parties and attorneys in Sonoma expressed high satisfaction when they used
mediation under the pilot program. They were particularly satisfied with the performance of the mediators, with both parties and attorneys showing an average satisfaction score of more than 6 on a 7-point scale. They also strongly agreed that the mediator and the mediation process were fair and that they would recommend both to others.
• Attorneys in stipulated cases were more satisfied with the litigation process and
services provided by the court compared to attorneys in nonstipulated cases. • Attorneys in cases that settled at mediation were much more satisfied with the
outcome of the case than attorneys in cases that did not settle at mediation—average satisfaction with the outcome was 6.0 in cases that settled at mediation but only 4.5 in cases that did not. Satisfaction with the litigation process and the court’s services was also higher in cases that settled at mediation than in cases that did not.
Introduction This section examines the impact of Sonoma’s pilot program on litigant satisfaction. As described in detail in Section I.B., data on litigant satisfaction was collected in two ways. First, in a survey administered at the end of the mediation in cases that went to mediation between July 2001 and June 2002 (“postmediation survey”), both parties and attorneys were asked about their satisfaction with various aspects of their mediation and litigation experiences. Second, in a separate survey administered shortly after cases reached disposition in cases disposed of between July 2001 and June 2002 (“postdisposition survey”), parties and attorneys in both stipulated and nonstipulated cases were asked about their satisfaction with the outcome of their case, the court’s services, and their overall litigation experience. In this section, the satisfaction of parties and attorneys who used mediation under the pilot program are first described. Attorney satisfaction in stipulated and nonstipulated cases is then compared.358
358 As was discussed above in Section I.B., since only a limited number of party responses to the postdisposition survey were received in nonstipulated cases, it was not possible to compare the satisfaction of parties in stipulated and nonstipulated cases. Therefore, all comparisons between stipulated and nonstipulated cases were based only on attorney responses to this survey.
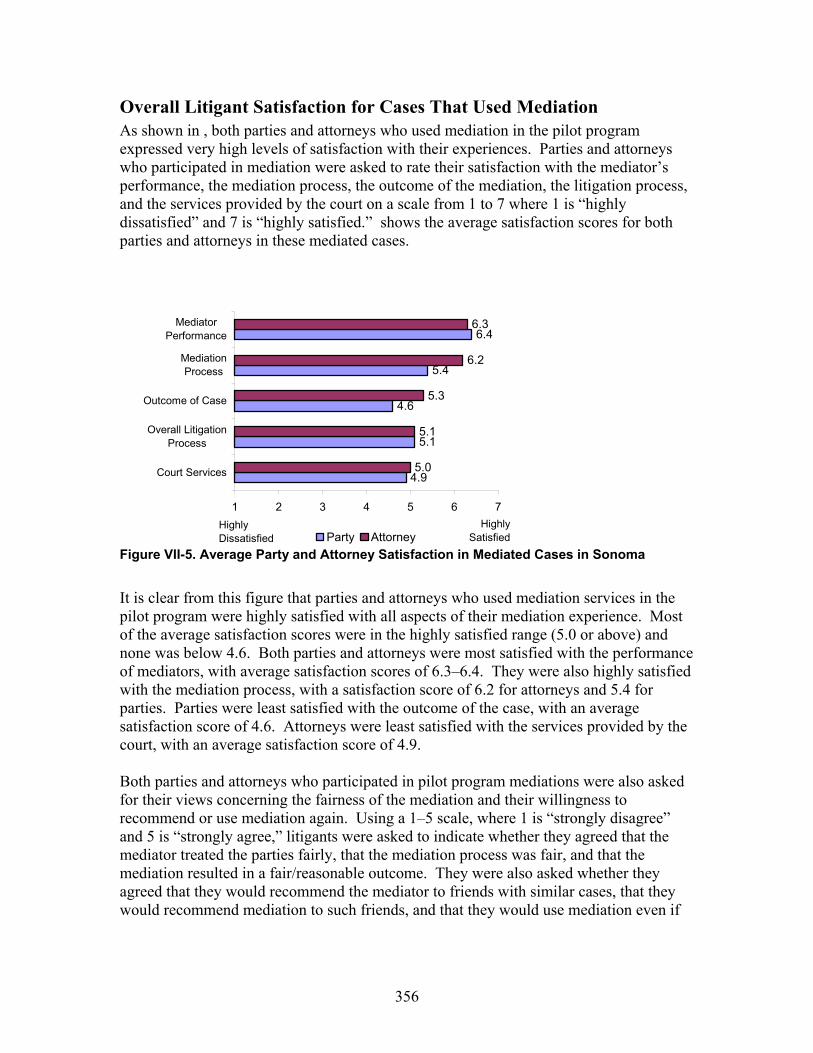
356
Overall Litigant Satisfaction for Cases That Used Mediation As shown in , both parties and attorneys who used mediation in the pilot program expressed very high levels of satisfaction with their experiences. Parties and attorneys who participated in mediation were asked to rate their satisfaction with the mediator’s performance, the mediation process, the outcome of the mediation, the litigation process, and the services provided by the court on a scale from 1 to 7 where 1 is “highly dissatisfied” and 7 is “highly satisfied.” shows the average satisfaction scores for both parties and attorneys in these mediated cases.
Figure VII-5. Average Party and Attorney Satisfaction in Mediated Cases in Sonoma
It is clear from this figure that parties and attorneys who used mediation services in the pilot program were highly satisfied with all aspects of their mediation experience. Most of the average satisfaction scores were in the highly satisfied range (5.0 or above) and none was below 4.6. Both parties and attorneys were most satisfied with the performance of mediators, with average satisfaction scores of 6.3–6.4. They were also highly satisfied with the mediation process, with a satisfaction score of 6.2 for attorneys and 5.4 for parties. Parties were least satisfied with the outcome of the case, with an average satisfaction score of 4.6. Attorneys were least satisfied with the services provided by the court, with an average satisfaction score of 4.9. Both parties and attorneys who participated in pilot program mediations were also asked for their views concerning the fairness of the mediation and their willingness to recommend or use mediation again. Using a 1–5 scale, where 1 is “strongly disagree” and 5 is “strongly agree,” litigants were asked to indicate whether they agreed that the mediator treated the parties fairly, that the mediation process was fair, and that the mediation resulted in a fair/reasonable outcome. They were also asked whether they agreed that they would recommend the mediator to friends with similar cases, that they would recommend mediation to such friends, and that they would use mediation even if
4.9
5.1
4.6
5.4
6.4
5.0
5.1
5.3
6.2
6.3
1 2 3 4 5 6 7
Court Services
Overall LitigationProcess
Outcome of Case
MediationProcess
MediatorPerformance
Party AttorneyHighly
SatisfiedHighly Dissatisfied

357
they had to pay the full cost of the mediation. Table VII-7 shows parties’ and attorneys’ average level of agreement with these statements.359 Table VII-7. Party and Attorney Perceptions of Fairness and Willingness to Recommend or Use Mediation in Sonoma (average agreement with statement)
Mediator Treated All
Parties Fairly
Mediation Process Was
Fair
Mediation Outcome Was
Fair/ Reasonable
Would Recommend Mediator to
Friends
Would Recommend Mediation to
Friends
Would Use Mediation at
Full Cost
Parties Attys Parties Attys Parties Attys Parties Attys Parties Attys Parties Attys
4.7 4.8 4.4 4.7 3.3 3.8 4.6 4.6 4.4 4.7 3.6 4.0
As with the satisfaction scores, most of the scores were in the “strongly agree” range (above 4.0) and all of the average scores were above the middle of the agreement scale (3.0).360 For both parties and attorneys there was very strong agreement (average score of 4.4 or above for parties and 4.6 or above for attorneys) that the mediator treated the parties fairly, that the mediation process was fair, that they would recommend the mediator to friends with similar cases, and that that they would recommend mediation to such friends. Both parties and attorneys indicated less agreement that they would use mediation if they had to pay the full cost; the average score was 3.6 for parties and 4.0 for attorneys. The lowest scores related to the fairness/reasonableness of the mediation outcome, at only 3.3 for parties and 3.8 for attorneys. It is clear from the responses to both these sets of questions that while parties and attorneys were generally very pleased with their mediation experiences, overall they were less pleased or neutral in terms of the outcome of the mediation process (in fact, on both outcome questions, more than 20 percent of the parties and 12 percent of the attorneys responded that they were neutral). In evaluating this result, it is important to remember that this survey was administered at the end of the mediation and that in a large proportion of cases a settlement was not reached at end of the mediation. Not surprisingly, the way parties and attorneys responded to the two outcome questions depended largely on whether their cases settled at mediation. Average satisfaction with the outcome in cases that settled at pilot program mediations was 6.17 for attorneys and 5.20 for parties on a 7-point scale, about 40 percent higher than the average scores of 4.55 for attorneys and 3.64 for parties in cases that did not settle at mediation. Similarly, in cases settled at mediation, responses concerning the fairness/reasonableness of the outcome averaged 4.51 for attorneys and 3.94 for parties on a 5-point scale, 40 and 66 percent higher, respectively, than the 3.22 for attorneys and 2.38 for parties in cases that did not settle at mediation. When the scores in both cases settled and not settled at mediation were added together to calculate the overall average, the higher scores in cases that settled were offset by those in cases that did not, pulling the overall average lower.
359 Please keep in mind that a 5-point scale was used for these survey questions, rather than the 7-point scale used in the satisfaction questions. 360 A 5-point scale was used for these survey questions, rather than the 7-point scale used in the satisfaction questions.
358
It is also clear from the responses to both sets of questions that while both parties and attorneys were generally very pleased with their pilot program mediation experiences, attorneys were generally more pleased than parties. Attorneys’ average scores were consistently higher than those of parties on all of these questions with the exception of the one concerning satisfaction with the mediator’s performance. Attorney satisfaction scores ranged from .1 higher than party scores (for satisfaction with the court’s services) to .7 higher (for satisfaction with the outcome). The higher attorney satisfaction may reflect a greater understanding on the part of attorneys about what to expect from the mediation process. Many attorneys are likely to have participated in mediations before, so they are likely to have been familiar with the mediation process and to have based their expectations about the process on this knowledge. Parties are less likely to have participated in previous mediations and may not have known what to expect from the mediation process. This may suggest the need for additional educational efforts targeted at parties, rather than attorneys. The higher scores by attorneys may also, in part, reflect the fact that attorneys and parties’ satisfaction was associated with different aspects of their mediation experiences. Attorneys’ responses on only two of the survey questions were strongly correlated with their responses concerning satisfaction with the mediation process—whether they believed that the mediation resulted in a fair/reasonable outcome and that the mediation helped move the case toward resolution quickly.361 In contrast, parties’ satisfaction with the mediation process was also strongly correlated with whether they believed that they had had an adequate opportunity to tell their side of the story during the mediation, that the mediation process was fair, and that the mediator treated all parties fairly.362 Attorneys’ responses to the same two survey questions noted above—whether they believed the mediation resulted in a fair/reasonable outcome and that the mediation helped move the case toward resolution quickly—were also the only responses strongly correlated with their responses regarding satisfaction with the outcome of the mediation.363 In contrast, parties’ satisfaction with the mediation outcome was also strongly correlated with whether they believed that the cost of using mediation was affordable, that the mediation process was fair, and that the mediator treated all parties fairly.364
361 Correlation measures how strongly two variables are associated with each other, i.e., when one of the variables changes, how likely is the other to change (this does not necessarily mean that the change in one caused the change in the other, but just that they tend to move together). Correlation coefficients range from -1 to 1; a value of 0 means that there was no relationship between the variables, a value of 1 means there was a total positive relationship (when one variable changes, the other always changes the same direction), and a value of -1 means a total negative relationship (when one changes, the other always changes in the opposite direction. A correlation coefficient of .5 or above is considered to show a high correlation. The correlation coefficients of these questions with attorneys’ satisfaction with the mediation process were .60 and .66, respectively. 362The correlation coefficients of these questions with parties’ satisfaction with the mediation process were .51, .72, and .68, respectively. 363The correlation coefficients of these questions with attorneys’ satisfaction with the outcome were .86 and .75, respectively. 364The correlation coefficients of these questions with parties’ satisfaction with the outcome were .55, .58, and .54, respectively.
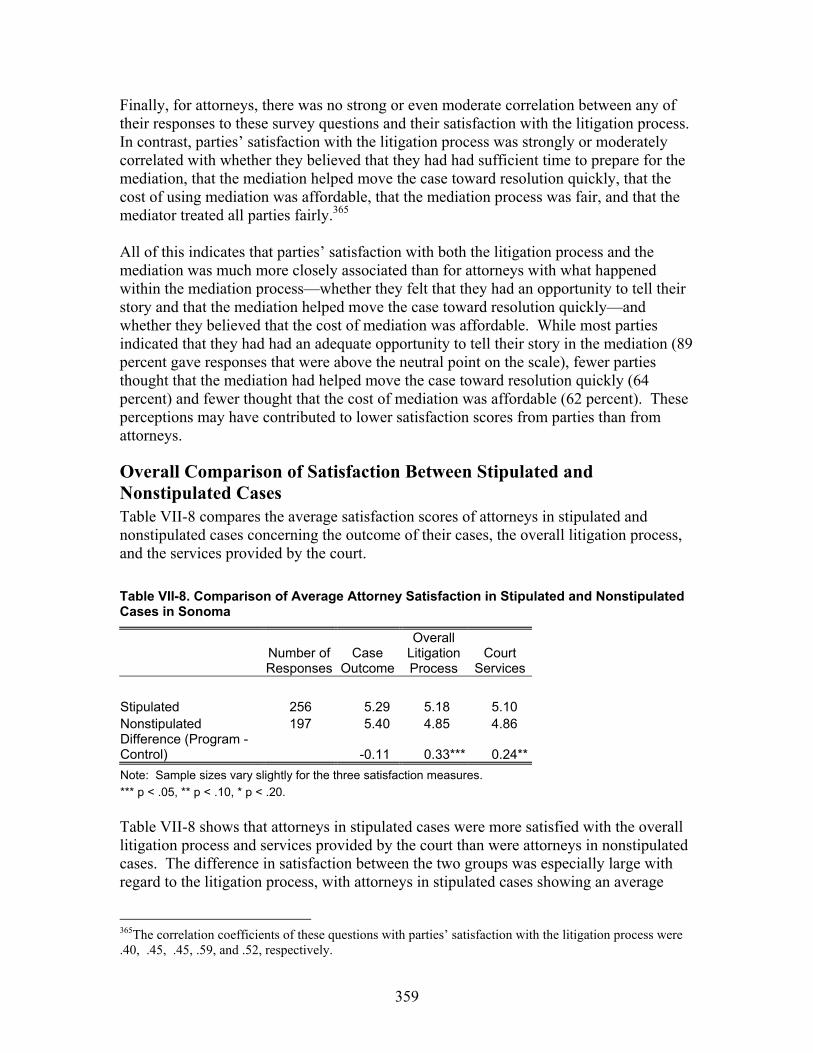
359
Finally, for attorneys, there was no strong or even moderate correlation between any of their responses to these survey questions and their satisfaction with the litigation process. In contrast, parties’ satisfaction with the litigation process was strongly or moderately correlated with whether they believed that they had had sufficient time to prepare for the mediation, that the mediation helped move the case toward resolution quickly, that the cost of using mediation was affordable, that the mediation process was fair, and that the mediator treated all parties fairly.365 All of this indicates that parties’ satisfaction with both the litigation process and the mediation was much more closely associated than for attorneys with what happened within the mediation process—whether they felt that they had an opportunity to tell their story and that the mediation helped move the case toward resolution quickly—and whether they believed that the cost of mediation was affordable. While most parties indicated that they had had an adequate opportunity to tell their story in the mediation (89 percent gave responses that were above the neutral point on the scale), fewer parties thought that the mediation had helped move the case toward resolution quickly (64 percent) and fewer thought that the cost of mediation was affordable (62 percent). These perceptions may have contributed to lower satisfaction scores from parties than from attorneys.
Overall Comparison of Satisfaction Between Stipulated and Nonstipulated Cases Table VII-8 compares the average satisfaction scores of attorneys in stipulated and nonstipulated cases concerning the outcome of their cases, the overall litigation process, and the services provided by the court. Table VII-8. Comparison of Average Attorney Satisfaction in Stipulated and Nonstipulated Cases in Sonoma
Number of Responses
Case Outcome
Overall Litigation Process
Court Services
Stipulated 256 5.29 5.18 5.10 Nonstipulated 197 5.40 4.85 4.86 Difference (Program - Control) -0.11 0.33*** 0.24**Note: Sample sizes vary slightly for the three satisfaction measures. *** p < .05, ** p < .10, * p < .20. Table VII-8 shows that attorneys in stipulated cases were more satisfied with the overall litigation process and services provided by the court than were attorneys in nonstipulated cases. The difference in satisfaction between the two groups was especially large with regard to the litigation process, with attorneys in stipulated cases showing an average
365The correlation coefficients of these questions with parties’ satisfaction with the litigation process were .40, .45, .45, .59, and .52, respectively.
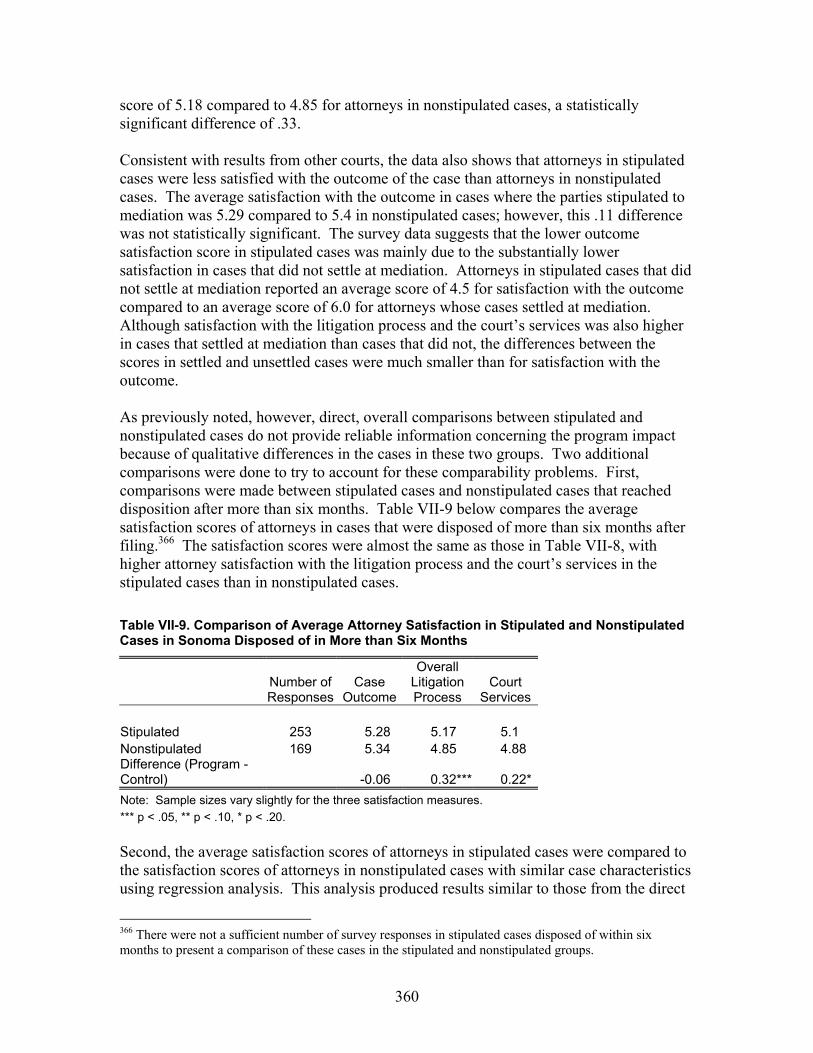
360
score of 5.18 compared to 4.85 for attorneys in nonstipulated cases, a statistically significant difference of .33. Consistent with results from other courts, the data also shows that attorneys in stipulated cases were less satisfied with the outcome of the case than attorneys in nonstipulated cases. The average satisfaction with the outcome in cases where the parties stipulated to mediation was 5.29 compared to 5.4 in nonstipulated cases; however, this .11 difference was not statistically significant. The survey data suggests that the lower outcome satisfaction score in stipulated cases was mainly due to the substantially lower satisfaction in cases that did not settle at mediation. Attorneys in stipulated cases that did not settle at mediation reported an average score of 4.5 for satisfaction with the outcome compared to an average score of 6.0 for attorneys whose cases settled at mediation. Although satisfaction with the litigation process and the court’s services was also higher in cases that settled at mediation than cases that did not, the differences between the scores in settled and unsettled cases were much smaller than for satisfaction with the outcome. As previously noted, however, direct, overall comparisons between stipulated and nonstipulated cases do not provide reliable information concerning the program impact because of qualitative differences in the cases in these two groups. Two additional comparisons were done to try to account for these comparability problems. First, comparisons were made between stipulated cases and nonstipulated cases that reached disposition after more than six months. Table VII-9 below compares the average satisfaction scores of attorneys in cases that were disposed of more than six months after filing.366 The satisfaction scores were almost the same as those in Table VII-8, with higher attorney satisfaction with the litigation process and the court’s services in the stipulated cases than in nonstipulated cases. Table VII-9. Comparison of Average Attorney Satisfaction in Stipulated and Nonstipulated Cases in Sonoma Disposed of in More than Six Months
Number of Responses
Case Outcome
Overall Litigation Process
Court Services
Stipulated 253 5.28 5.17 5.1 Nonstipulated 169 5.34 4.85 4.88 Difference (Program - Control) -0.06 0.32*** 0.22*Note: Sample sizes vary slightly for the three satisfaction measures. *** p < .05, ** p < .10, * p < .20. Second, the average satisfaction scores of attorneys in stipulated cases were compared to the satisfaction scores of attorneys in nonstipulated cases with similar case characteristics using regression analysis. This analysis produced results similar to those from the direct
366 There were not a sufficient number of survey responses in stipulated cases disposed of within six months to present a comparison of these cases in the stipulated and nonstipulated groups.
361
comparison. It indicated that attorney satisfaction with the overall litigation process was 6 percent higher in stipulated cases than in nonstipulated cases with similar characteristics. It also indicated that attorney satisfaction with the court’s services was higher in stipulated cases than in nonstipulated cases with similar characteristics, although the size of the difference was not clear. No statistically significant difference in attorney satisfaction with outcome of the case was found between stipulated and nonstipulated cases.367 Together, the regression results and the results of the comparison of average satisfaction in cases disposed of in over 6 months support the conclusion that attorneys were more satisfied with the court’s services and with the litigation process when there was a stipulation to use mediation.
Conclusion Both parties and attorneys who used mediation in the program expressed high satisfaction with their mediation experience. They were particularly satisfied with the performance of the mediators, with an average satisfaction score over 6 on a 7-point scale. They also strongly agreed that the mediator and the mediation process were fair and that they would recommend both to others. Attorneys in cases that settled at mediation were much more satisfied with the outcome of the case than attorneys in cases that did not settle at mediation––average satisfaction with the outcome was 6.0 in cases that settled at mediation but only 4.5 in cases that did not. Although satisfaction with the litigation process and the court’s services was also higher in cases that settled at mediation than cases that did not, the differences between the scores in settled and unsettled cases were much smaller than for satisfaction with the outcome. Results from both direct comparisons of stipulated and nonstipulated cases and regression analyses controlling for differences in the characteristics of the cases in these two groups indicated that attorneys in stipulated cases were more satisfied with both the overall litigation process and services provided by the court compared to attorneys in nonstipulated cases. There was no significant difference in attorney satisfaction between the two groups with regard to outcome of the case.
367 As noted in Section I.B., this regression analysis controlled for those case characteristics about which data was available from the case management system and from the surveys, as well as for whether the cases were disposed of within 6 months or in over 18 months. However, it is almost certain that there were additional “unknown” case characteristics that were not appropriately accounted for in these regressions. Therefore, findings from these analyses should be interpreted with caution.
362
I. Impact of Sonoma’s Pilot Program on Litigant Costs
Summary of Findings There is evidence that the pilot program reduced litigant costs and the number of hours attorneys spent in cases that settled at mediation. In cases that settled at mediation, 95 percent of attorneys who responded to the study survey estimated some savings in both litigant costs and attorney hours from using mediation to reach settlement. Average savings estimated by attorneys per settled case were $25,965 in litigant costs and 93 hours in attorney time. Based on these attorney estimates, a total of $9,243,430 in litigant costs and 33,108 in attorney hours was estimated to have been saved in all 2000 and 2001 cases that were settled at mediation.
Introduction This section examines the impact of Sonoma’s pilot program on litigants’ costs. As described above in Section I.B., information on litigant costs was collected in two ways. First, in a survey distributed at the end of the mediation in cases that went to mediation between July 2001 and June 2002 (“postmediation survey”), attorneys in the subset of cases that resolved at mediation were asked to provide (1) an estimate of the time they had actually spent on the cases and their clients’ actual litigation costs and (2) an estimate of the time they would have spent and what the costs to their clients would have been had they not used mediation. The difference between these estimates represents the attorneys’ subjective estimate of the litigant cost and attorney time savings when the case settled at the mediation. Second, in a separate survey administered shortly after disposition in both stipulated and nonstipulated cases that reached disposition between July 2001 and June 2002 (“postdisposition survey”), attorneys were asked to provide an estimate of the time they had actually spent on the case and their clients’ actual litigation costs. Comparisons between the time and cost estimates in the program cases and nonprogram cases provide an objective measure of the pilot program’s impact on litigant costs. Because data on litigant costs was gathered through surveys conducted only in 2001 and 2002, pre-/post-program comparisons concerning litigant costs were not possible, so comparisons of stipulated and nonstipulated cases were used to try to identify the impact of the pilot program on litigant costs and attorney hours. However, as was discussed in section I.B., the data on litigant costs and attorney time had a very skewed distribution: there were a few cases with very large litigant cost and attorney time estimates (“outlier” cases) that stretched out the data’s range. While several methods were used to try to account for this skewed distribution, the range of the data was so broad that the differences found in direct comparisons between stipulated and nonstipulated cases as a whole were not statistically significant—it was not possible to tell with sufficient confidence whether the observed differences were real or simply due to chance. The results of these comparisons are therefore not presented here. What are presented in this section are attorneys’ subjective estimates of litigant cost and attorney time savings in unlimited cases that settled at mediation.
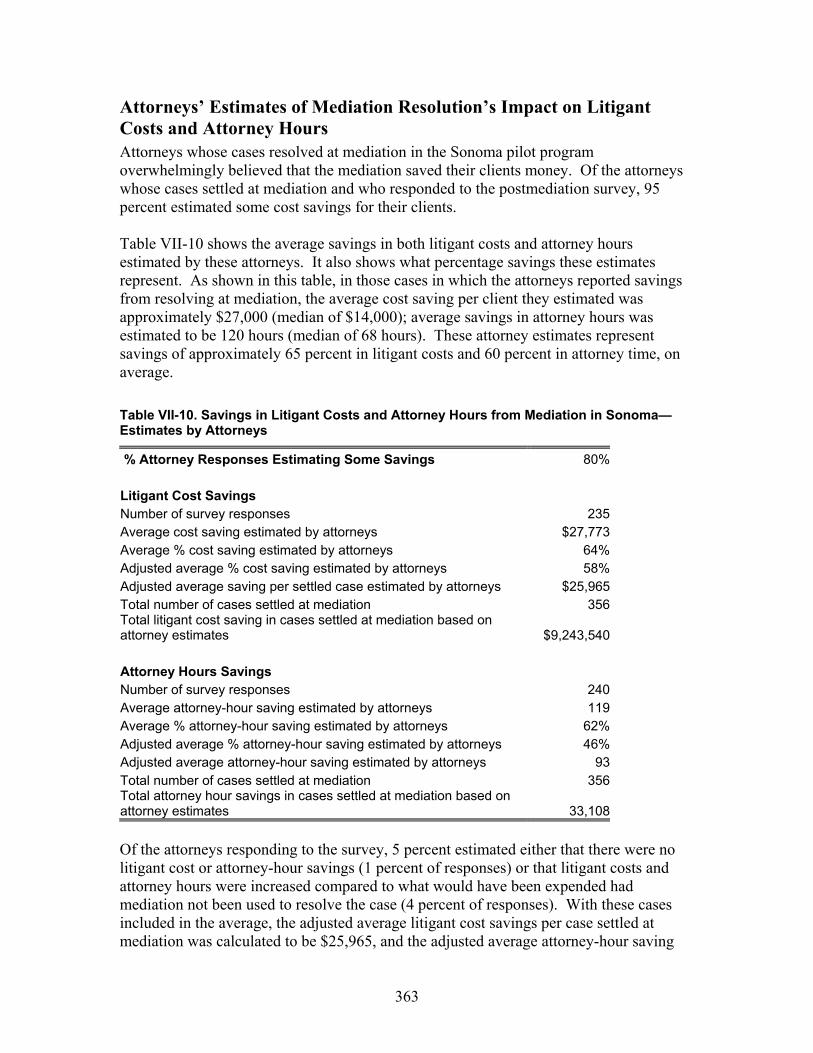
363
Attorneys’ Estimates of Mediation Resolution’s Impact on Litigant Costs and Attorney Hours Attorneys whose cases resolved at mediation in the Sonoma pilot program overwhelmingly believed that the mediation saved their clients money. Of the attorneys whose cases settled at mediation and who responded to the postmediation survey, 95 percent estimated some cost savings for their clients. Table VII-10 shows the average savings in both litigant costs and attorney hours estimated by these attorneys. It also shows what percentage savings these estimates represent. As shown in this table, in those cases in which the attorneys reported savings from resolving at mediation, the average cost saving per client they estimated was approximately $27,000 (median of $14,000); average savings in attorney hours was estimated to be 120 hours (median of 68 hours). These attorney estimates represent savings of approximately 65 percent in litigant costs and 60 percent in attorney time, on average. Table VII-10. Savings in Litigant Costs and Attorney Hours from Mediation in Sonoma—Estimates by Attorneys
% Attorney Responses Estimating Some Savings 80% Litigant Cost Savings Number of survey responses 235Average cost saving estimated by attorneys $27,773Average % cost saving estimated by attorneys 64%Adjusted average % cost saving estimated by attorneys 58%Adjusted average saving per settled case estimated by attorneys $25,965 Total number of cases settled at mediation 356Total litigant cost saving in cases settled at mediation based on attorney estimates $9,243,540 Attorney Hours Savings Number of survey responses 240Average attorney-hour saving estimated by attorneys 119Average % attorney-hour saving estimated by attorneys 62%Adjusted average % attorney-hour saving estimated by attorneys 46%Adjusted average attorney-hour saving estimated by attorneys 93Total number of cases settled at mediation 356Total attorney hour savings in cases settled at mediation based on attorney estimates 33,108 Of the attorneys responding to the survey, 5 percent estimated either that there were no litigant cost or attorney-hour savings (1 percent of responses) or that litigant costs and attorney hours were increased compared to what would have been expended had mediation not been used to resolve the case (4 percent of responses). With these cases included in the average, the adjusted average litigant cost savings per case settled at mediation was calculated to be $25,965, and the adjusted average attorney-hour saving
364
estimated by attorneys was calculated to be 90 hours. These attorney estimates represent savings of approximately 58 percent in litigant costs and 46 percent in attorney hours per case settled at mediation. This adjusted average was used to calculate the total estimated savings in all of the 2000 and 2001 cases that settled at pilot program mediations in Sonoma during the study period. Based on these attorney estimates, the total estimated litigant cost saving in the Sonoma pilot program was $9,243,430; and the total estimated attorney hours saved was 33,108. It should be cautioned that these figures are based on attorneys’ estimates of savings; they are not figures for the actual savings in mediations resulting in settlements. The actual litigant cost and hour savings could be somewhat higher or lower than the attorney estimates. It should also be cautioned that these estimated savings are for cases settled at mediation only, not for all cases in the program. There may also have been savings or increases in litigant cost or attorney hours in other subgroups of stipulated cases, such as those that stipulated to mediation but settled before the mediation took place or cases that were mediated but did not settle at the mediation.368
Conclusion Attorneys whose cases resolved at mediation overwhelmingly believed that the mediation saved their clients money. The vast majority—95 percent—of attorneys whose cases settled at mediation who responded to the study survey estimated some cost savings for their clients. Average savings estimated by attorneys per settled case were $25,965 in litigant costs and 93 hours in attorney time. Based on these attorney estimates, a total of $9,243,430 in litigant costs and 33,108 in attorney hours was estimated to have been saved in all 2000 and 2001 cases that were settled at mediation.
368 Some support for the conclusion that mediation may have reduced costs even in cases that did not settle at mediation comes from 14 postmediation survey responses in which attorneys in cases that did not settle at mediation provided litigant cost and attorney-hour information even though it had not been requested. All except one of these survey responses indicated some savings in litigant costs, attorney hours, or both in these cases that were mediated but did not settle at mediation. When the response that estimated no savings was also taken into account, the attorneys in these cases estimated average savings of 62 percent in litigant costs (60 percent median savings) and 29 percent in attorney hours (55 percent median savings) in cases that did not settle at mediation.
365
J. Impact of Sonoma’s Pilot Program on Court’s Workload
Summary of Findings There was evidence that the pilot program in Sonoma reduced the court’s workload. • There was evidence suggesting that the court’s workload decreased after the pilot
program was instituted. The average number of “other” pretrial hearings was 15 percent lower in unlimited cases filed after the pilot program began than in unlimited cases filed before the program began.
• There was also evidence suggesting that the court’s workload decreased in cases in
which parties stipulated to mediation. Cases in which the parties stipulated to mediation had fewer motion and other pretrial hearings compared to nonstipulated cases. Regression analysis controlling for differences in case characteristics indicated that the average number of motion hearings was 50 percent lower in cases in which the parties stipulated to mediation compared to similar cases in which the parties did not stipulate to mediation and that the average number of “other” pretrial hearings was 45 percent lower.
• The smaller number of court events in program cases means that the time that judges
would have been spent on these events could be devoted to other cases needing judicial time and attention. The total time saving from the reduced number of court events in program cases compared to cases filed before the program began was estimated at 3.2 judge days per year (with an estimated monetary value of approximately $9,700 per year).
Introduction In this section, the impact of the Sonoma pilot program on the court’s workload is examined by looking at the frequency of various pretrial court events. The analysis focuses on two major types of court events: (1) motion hearings and (2) other pretrial hearings. Unlike in the other pilot courts, case management conferences are not included in this examination. As noted in the discussion of data available in Sonoma, the court’s case management system did not contain sufficient information concerning case management conferences for comparison purposes. As in the previous sections on trial rates and case disposition time, a pre-/post-program comparison is presented first. Comparisons of court workload in cases that stipulated to mediation and those that did not stipulate to mediation are then presented.
Pre-/Post-Program Comparison of Court’s Workload Table VII-11 compares the average number of motion hearings and other pretrial hearings in cases filed in 1999, the year before the pilot program began, and 2000, the first year of the pilot program’s operation.
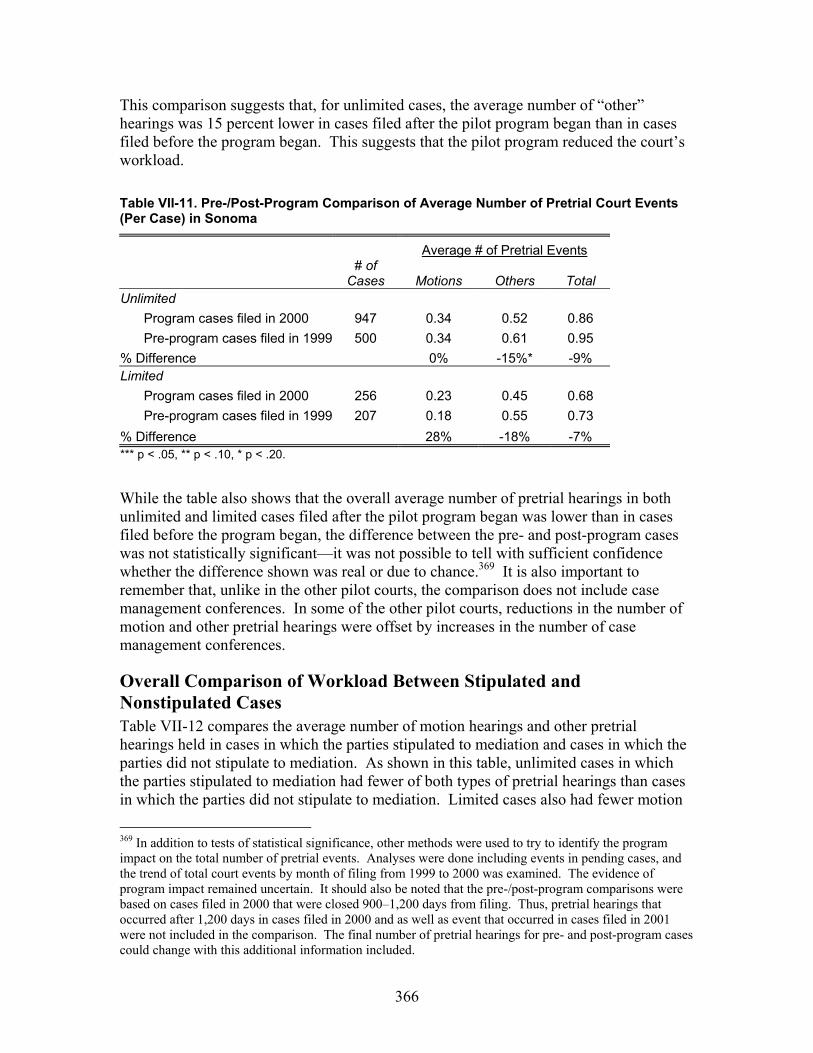
366
This comparison suggests that, for unlimited cases, the average number of “other” hearings was 15 percent lower in cases filed after the pilot program began than in cases filed before the program began. This suggests that the pilot program reduced the court’s workload. Table VII-11. Pre-/Post-Program Comparison of Average Number of Pretrial Court Events (Per Case) in Sonoma
Average # of Pretrial Events
# of
Cases Motions Others Total Unlimited
Program cases filed in 2000 947 0.34 0.52 0.86 Pre-program cases filed in 1999 500 0.34 0.61 0.95
% Difference 0% -15%* -9% Limited
Program cases filed in 2000 256 0.23 0.45 0.68 Pre-program cases filed in 1999 207 0.18 0.55 0.73
% Difference 28% -18% -7% *** p < .05, ** p < .10, * p < .20.
While the table also shows that the overall average number of pretrial hearings in both unlimited and limited cases filed after the pilot program began was lower than in cases filed before the program began, the difference between the pre- and post-program cases was not statistically significant—it was not possible to tell with sufficient confidence whether the difference shown was real or due to chance.369 It is also important to remember that, unlike in the other pilot courts, the comparison does not include case management conferences. In some of the other pilot courts, reductions in the number of motion and other pretrial hearings were offset by increases in the number of case management conferences.
Overall Comparison of Workload Between Stipulated and Nonstipulated Cases Table VII-12 compares the average number of motion hearings and other pretrial hearings held in cases in which the parties stipulated to mediation and cases in which the parties did not stipulate to mediation. As shown in this table, unlimited cases in which the parties stipulated to mediation had fewer of both types of pretrial hearings than cases in which the parties did not stipulate to mediation. Limited cases also had fewer motion
369 In addition to tests of statistical significance, other methods were used to try to identify the program impact on the total number of pretrial events. Analyses were done including events in pending cases, and the trend of total court events by month of filing from 1999 to 2000 was examined. The evidence of program impact remained uncertain. It should also be noted that the pre-/post-program comparisons were based on cases filed in 2000 that were closed 900–1,200 days from filing. Thus, pretrial hearings that occurred after 1,200 days in cases filed in 2000 and as well as event that occurred in cases filed in 2001 were not included in the comparison. The final number of pretrial hearings for pre- and post-program cases could change with this additional information included.

367
hearings, but the difference in the overall number of court events in stipulated and nonstipulated limited cases was not statistically significant.370 Table VII-12. Comparison of Average Number Pretrial Court Events (Per Case) in Stipulated and Nonstipulated Cases in Sonoma
Average # of Pretrial Hearings Events
# of Cases Motions Others Total Unlimited Stipulated 554 0.18 0.30 0.48 Nonstipulated 1,230 0.36 0.57 0.93 % Difference -50%*** -47%*** -48%*** Limited Stipulated 40 0.00 0.45 0.45 Nonstipulated 490 0.24 0.47 0.71 % Difference -100%*** -4% -36%
*** p < .05, ** p < .10, * p < .20. As previously noted, however, direct comparisons between the overall average of stipulated and nonstipulated cases do not provide reliable information about program impact because of differences in the cases in these two groups. Two additional comparisons were done to try to account for these comparability problems. First, comparisons were made between stipulated cases and nonstipulated cases that reached disposition after more than six months. Second, the average number of pretrial court events in stipulated cases was compared to the number of these events in nonstipulated cases with similar case characteristics using regression analysis. Table VII-13 compares the average number of pretrial hearings held in stipulated and nonstipulated cases filed in 2000 and 2001 in Sonoma that were disposed of within six months of filing and that were disposed of more than six months after filing. The results from the comparison of only those stipulated and nonstipulated cases that reached disposition after six months were similar to the results when all stipulated and
370 As noted in the introduction to this chapter on the Sonoma pilot program, it is important to remember that stipulated cases include cases that had very different pilot program/litigation experiences, including cases that did not go to mediation, cases that went to mediation and settled, and cases that went to mediation and did not settle at mediation. Unlike in the other pilot programs, because insufficient mediation outcome information was available, it was not possible to provide a complete breakdown of court workload in these different subgroups of stipulated cases. However, among stipulated cases for which outcome information was available, the number of motion hearings was 68 percent lower in unlimited cases that settled at mediation than in unlimited cases that went to mediation but did not settle. Thus, when the number of court events in these two groups were added together to calculate the overall average number of events for stipulated cases as a whole, the lower number of events in cases that settled in mediation was offset to same degree by the higher number of events in cases that did not settle, pulling the overall average higher.

368
nonstipulated cases were compared. Unlimited cases in which the parties stipulated to mediation had fewer motion hearings and fewer “other” pretrial hearings than cases in which the parties did not stipulate to mediation. Limited cases in which the parties stipulated to mediation also had fewer motion hearings. Unlike the prior comparison, however, this comparison also indicated that the overall number of court events in limited stipulated cases was lower than for limited nonstipulated cases. Table VII-13. Comparison of Average Number of Pretrial Court Events (Per Case) in Stipulated and Nonstipulated Cases in Sonoma Disposed of Within Six Months and After Six Months
Cases Disposed of Within Six Months after
Filing Cases Disposed of Over Six Months after
Filing Average # of Pretrial Events Average # of Pretrial Events
# of
Cases Motions Others Total # of
Cases Motions Others Total Unlimited Stipulated 10 0.00 0.00 0.00 544 0.19 0.30 0.49 Nonstipulated 132 0.09 0.09 0.18 1,098 0.40 0.63 1.02 % Difference -100% -100% -100% -53%*** -52%*** -52%***
Limited Stipulated 1 0.00 0.00 0.00 39 0.00 0.46 0.46 Nonstipulated 111 0.11 0.03 0.14 379 0.28 0.60 0.88 % Difference -100% -100% -100% -100%*** -23% -48%** *Statistically significant at 95 percent confidence level.
The regression analysis also produced similar results. This analysis showed that the average number of motion hearings was 50 percent lower in cases in which the parties stipulated to mediation compared to similar cases in which the parties did not stipulate to mediation and that the average number of “other” pretrial hearings was 45 percent lower.371 Taken together, these results supports the conclusion that the court’s workload was reduced when parties stipulated to participate in mediation.
Impact of Reduced Number of Court Events on Judicial Time The overall comparison between cases filed before and after the pilot program began indicated that the pilot program had a positive impact in reducing the court’s workload in 371 The variable for disposition time in the regression analyses had little impact on the estimates of program impact on motion hearings. It had a significant impact on the estimate of program impact on other hearings. Without the time variable, other hearings were estimated to be 30 percent lower in nonstipulated cases, with 80 percent confidence level. With the disposition variable included, the size of the estimated impact increased to 45 percent and confidence level increased to 94 percent. As noted in Section I.B., however, this regression analysis controlled for those case characteristics about which data was available from the case management system and from the surveys, as well as for whether the cases were disposed of within 6 months or in over 18 months. However, it is almost certain that there were additional “unknown” case characteristics that were not appropriately accounted for in these regressions. Therefore, findings from these analyses should be interpreted with caution.
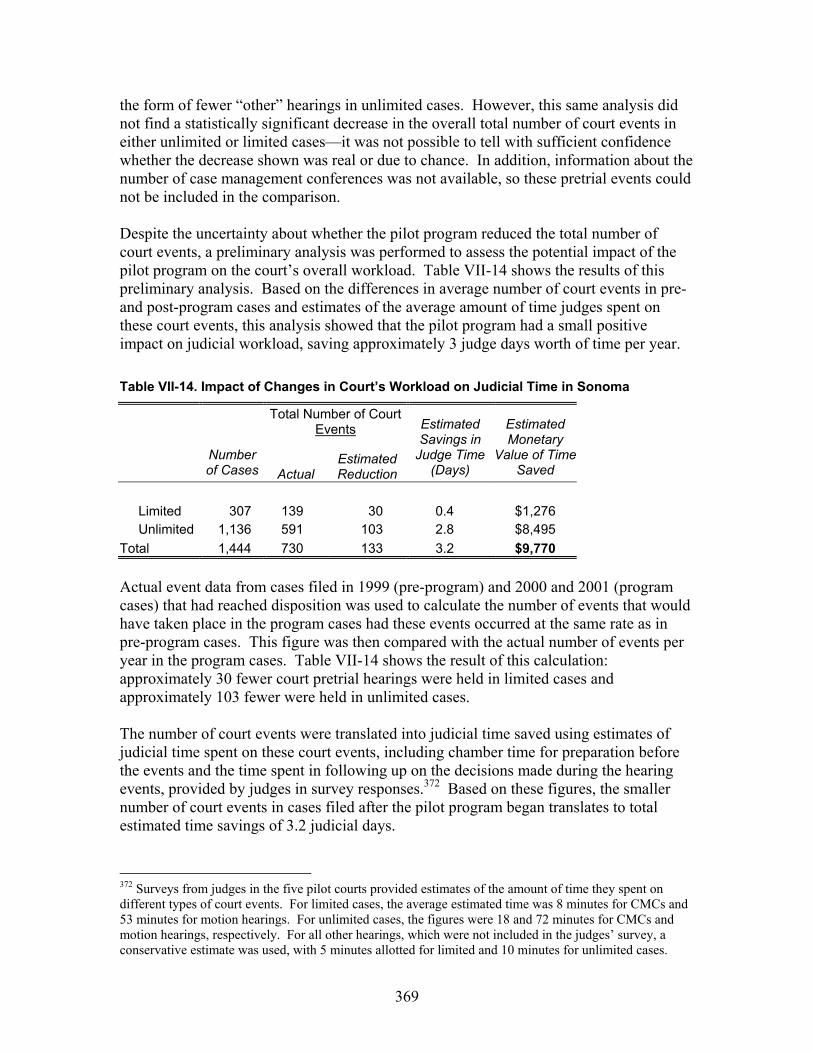
369
the form of fewer “other” hearings in unlimited cases. However, this same analysis did not find a statistically significant decrease in the overall total number of court events in either unlimited or limited cases—it was not possible to tell with sufficient confidence whether the decrease shown was real or due to chance. In addition, information about the number of case management conferences was not available, so these pretrial events could not be included in the comparison. Despite the uncertainty about whether the pilot program reduced the total number of court events, a preliminary analysis was performed to assess the potential impact of the pilot program on the court’s overall workload. Table VII-14 shows the results of this preliminary analysis. Based on the differences in average number of court events in pre-and post-program cases and estimates of the average amount of time judges spent on these court events, this analysis showed that the pilot program had a small positive impact on judicial workload, saving approximately 3 judge days worth of time per year. Table VII-14. Impact of Changes in Court’s Workload on Judicial Time in Sonoma
Total Number of Court Events
Number of Cases Actual
Estimated Reduction
Estimated Savings in
Judge Time (Days)
Estimated Monetary
Value of Time Saved
Limited 307 139 30 0.4 $1,276 Unlimited 1,136 591 103 2.8 $8,495
Total 1,444 730 133 3.2 $9,770 Actual event data from cases filed in 1999 (pre-program) and 2000 and 2001 (program cases) that had reached disposition was used to calculate the number of events that would have taken place in the program cases had these events occurred at the same rate as in pre-program cases. This figure was then compared with the actual number of events per year in the program cases. Table VII-14 shows the result of this calculation: approximately 30 fewer court pretrial hearings were held in limited cases and approximately 103 fewer were held in unlimited cases. The number of court events were translated into judicial time saved using estimates of judicial time spent on these court events, including chamber time for preparation before the events and the time spent in following up on the decisions made during the hearing events, provided by judges in survey responses.372 Based on these figures, the smaller number of court events in cases filed after the pilot program began translates to total estimated time savings of 3.2 judicial days.
372 Surveys from judges in the five pilot courts provided estimates of the amount of time they spent on different types of court events. For limited cases, the average estimated time was 8 minutes for CMCs and 53 minutes for motion hearings. For unlimited cases, the figures were 18 and 72 minutes for CMCs and motion hearings, respectively. For all other hearings, which were not included in the judges’ survey, a conservative estimate was used, with 5 minutes allotted for limited and 10 minutes for unlimited cases.
370
Because many court costs, including judicial salaries, are fixed, judicial time savings from the reduced court workload does not translate into fungible cost savings that can be reallocated to cover other court expenses. Instead, the time saved could be used by judges to focus on other cases that needed their time and attention, thereby improving court services in these cases. To help understand the value of the potential time savings, however, its estimated monetary value was calculated. The potential reduction in judicial days was multiplied by an estimate of the current daily cost of operating a courtroom, $2,990 per day.373 Based on this calculation, the monetary value of the judicial time saved from the pilot program’s reduction in court events is estimated to be $9,770. The analysis above, although preliminary in nature due to various uncertainties, suggests that the Sonoma pilot program decreased the court’s workload, freeing up judges’ time for other cases needing judicial time and attention.
Conclusion There was evidence suggesting that the court’s workload decreased after the pilot program was instituted. The average number of “other” pretrial hearings was 15 percent lower in unlimited cases filed after the pilot program began than in unlimited cases filed before the program began. There was also evidence that stipulating to mediation reduced the court’s workload. Cases in which the parties stipulated to mediation had fewer motion and other pretrial hearings compared to nonstipulated cases. Regression analysis controlling for differences in case characteristics indicated that average number of motion hearings was 50 percent lower in cases in which the parties stipulated to mediation compared to similar cases in which the parties did not stipulate to mediation and that the average number of “other” pretrial hearings was 45 percent lower. The smaller number of court events in program cases means that the time that judges would have been spent on these events could be devoted to other cases needing judicial time and attention. The total time saving from the reduced number of court events in program cases compared to cases filed before the program began was estimated at 3.2 judge days per year (with an estimated monetary value of approximately $9,700 per year).
373 This estimated cost includes salaries for a judge and associated support staff but not facilities or general overhead costs. In the Fiscal Year 2001–2002 Budget Change Proposal for 30 new judgeships, the Finance Division of the Administrative Office of the Courts estimated that each new judgeship would have a total annual cost of at $642,749. This figure includes the total cost of salaries, benefits, and operating expenses for each new judgeship and its complement of support staff: a bailiff, a court reporter, two courtroom clerks, a legal secretary, and a research attorney (Judicial Council of Cal., Fiscal Year 2001–2002 Budget Change Proposal, No. TC18.).
371
VIII. Glossary At Issue A case is considered at issue when a defendant named in a complaint responded to the complaint by filing an answer or other responsive pleading with the court. In the pilot programs, only at-issue cases were considered for referrals to mediation, as mediation requires parties on both sides to participate in the resolution process.
Control Group A group of cases established through a process of random assignment for purpose of evaluating the impact of a particular program. Program procedures are applied to cases in the program group but not to those in the control group.
Disposition Termination of a case pending before the court after all issues and parties involved in the case have reached final resolution. This was indicated in the court’s docket as judgment or dismissal entered.
Disposition Rate The proportion (percentage) of cases filed during a given period that reached final disposition within a given follow-up period.
Disposition Time Total elapsed time (measured in days or months) from filing of a complaint to final disposition of the case based on court’s docket record.
Early Mediation Status Conference Conducted by judges (or ADR Director in Sonoma), Early Mediation Status Conferences were used primarily to assess case amenability to mediation and to encourage parties to use mediation at an early stage of the litigation process. Early Mediation Status Conferences were typically held earlier than regular case management conferences.
Eligible Case Cases that met the eligibility requirements for the pilot programs established by statutes and the rules of the court.
Follow-up Time A period of time during which information concerning status of a case is available. It starts from a specific event (for example, filing date) until data collection ends. Thus, with longer follow-up time, information on final status of the cases would be more complete and reliable.
General Civil Case As defined by Code of Civil Procedure Section 1731(b), general civil case means all civil cases except probate, guardianship, conservatorship, family law (including proceedings under the Family Law Act, Uniform Parentage Act, and Uniform Child Custody Jurisdiction Act; freedom from parental custody and control proceedings; and adoption proceedings), juvenile court proceedings, small claims, and other civil petitions, as
372
defined by the Judicial Council on the effective date of this section, including petitions for a writ of mandate or prohibition, temporary restraining orders, harassment restraining orders, domestic violence restraining orders, writs of possession, appointment of a receiver, release of property from lien, and change of name.
Limited Civil Case General civil cases in which the amount of damages are valued under $25,000.
Mandatory Program A pilot program in which the judges were given statutory authority to order cases to mediation.
Mediation A process in which a neutral person facilitates communication between disputants to assist them in reaching a mutually acceptable agreement.
Program Group A group of cases established through a process of random assignment for purpose of evaluating the impact of a particular program. A program group consists of those cases that participated in any element of the pilot program.
Random Assignment A procedure used to create two (or more) comparable (statistically equivalent) groups for purpose of evaluating program impacts. Through random assignment a case is assigned to either the program or control group without considering characteristics of the cases, thus assuring the comparability of the cases in the groups.
Regression Analysis A statistical procedure used to predict or explain changes in an outcome of interest based on information concerning all relevant variables. The analysis produces a figure that indicates the independent impact of each variable on the outcome when other variables are held constant.
Self-Selection Bias Self-selection bias arises when characteristics of a case may have influenced the initial placement of a case into the program or comparison group. In voluntary programs, for example, a party may decide to participate (self-select) in the program because of the perceived benefit of mediation in their case, willingness of the parties in their case to settle the dispute, and numerous other characteristics of their case. Therefore, observed differences between stipulated and nonstipulated cases could be due to the impact of the program or they could be due to the characteristics of the cases that motivated the parties to make the decision to participate in the program. Thus, self-selection bias makes it difficult to reliably isolate the program impact.
Statistical Significance (p-value) Statistical significance indicates the degree to which an observed difference between comparison groups reflect a true difference between the groups or is simply due to chance (a “fluke”). Expressed in probability terms, the level of statistical significance provides a measure to assess the reliability of study findings. For example, a probability value of .05 associated with a finding means that there is only a 5 percent probability that
373
the finding could be due to pure chance, which indicates high reliability of the study result.
Stipulation to Mediation Voluntary agreement reached by parties to use mediation.
Survival Analysis A statistical procedure used to assess the impact of a program by comparing the “survival (or failure) rate” between two or more groups within a given follow-up period. Each case in the comparison groups is tracked from the time it entered the analysis (e.g., when a case was filed) until a specific event occurs (e.g., when a case reached final disposition). At different intervals of time during a given follow-up period (e.g., each month after the filing of a case), the proportion of cases in a group that experiences the particular event being studied is calculated. Survival (failure) rates over time between two or more groups can then be compared to assess the overall impact of a program on the different groups. Given that the survival (failure) rates are being tracked continually during the follow-up period, the timing of the impact from a program can also examined.
Trial Rate The proportion of disposed cases that went to trial (either by jury or bench) regardless of whether the entire trial proceedings were completed.
Unlimited Civil Case General civil cases in which the amount of damages claimed is valued over $25,000.
Voluntary Program A pilot program in which parties participate in the mediation on a voluntary basis.

374
375
Appendix A. Early Mediation Pilot Program Statutes CODE OF CIVIL PROCEDURE SECTION 1730-1743
1730. (a) The Judicial Council shall establish pilot programs in four superior courts to assess the benefits of early mediation of civil cases. In two of these pilot program courts, the court shall have the authority to make mandatory referrals to mediation, pursuant to this title. (b) The Judicial Council shall select the courts to participate in the pilot program. (c) In addition to the pilot programs established under subdivision (a), the Judicial Council shall establish a pilot program in the Los Angeles Superior Court in 10 departments handling civil cases. These departments shall have the authority to make mandatory referrals to mediation, pursuant to this title. The court shall be responsible for paying the mediator's fees, to the extent provided in Section 1735. 1731. As used in this title: (a) "Alternative dispute resolution process" or "ADR process" means a process in which parties meet with a third party neutral to assist them in resolving their dispute outside of formal litigation. (b) "General civil case" means all civil cases except probate, guardianship, conservatorship, family law (including proceedings under the Family Law Act, Uniform Parentage Act, and Uniform Child Custody Jurisdiction Act; freedom from parental custody and control proceedings; and adoption proceedings), juvenile court proceedings, small claims, and other civil petitions, as defined by the Judicial Council on the effective date of this section, including petitions for a writ of mandate or prohibition, temporary restraining orders, harassment restraining orders, domestic violence restraining orders, writs of possession, appointment of a receiver, release of property from lien, and change of name. (c) "Mediation" means a process in which a neutral person or persons facilitate communication between disputants to assist them in reaching a mutually acceptable agreement. 1732. (a) Except as otherwise provided by rule pursuant to subdivision (b), this title shall apply to all general civil cases filed in the pilot courts after January 1, 2000. (b) The Judicial Council may, by rule, exempt specified categories of general civil cases from the provisions of this title. 1733. Any party who has been ordered to mediation pursuant to this title, or who has participated in a voluntary mediation with all of the other parties, is exempt from being compelled to participate in any other judicially ordered arbitration or mediation. 1734. (a) Notwithstanding Section 68616 of the Government Code or any other provision of law, in cases subject to this title, the court may hold a status conference not earlier than 90 days and not later than 150 days after the filing of the complaint. However, at or before the conference, any party may request that the status conference be
376
continued on the grounds that the party has been unable to serve an essential party to the proceeding. (b) At this status conference, the court shall confer with the parties about alternative dispute resolution processes and, in Los Angeles Superior Court and the other two pilot program courts authorized to make mandatory referrals to mediation, the court may refer the parties to mediation in accordance with this title, if the court, in its discretion, determines there is good cause for ordering mediation. Before making a referral, the court shall consider the willingness of the parties to mediate. 1735. (a) Each pilot program court authorized to make mandatory referrals to mediation pursuant to this title shall establish a panel of mediators. (b) In cases referred to mediation pursuant to this title, the parties shall select the mediator. The mediator selected by the parties need not be from the court's panel of mediators. If the parties do not select a mediator within the time period specified in the rules adopted by the Judicial Council, a mediator shall be selected by the court from the court's panel of mediators. If a mediator from the court's panel is not available to mediate a case referred pursuant to this subdivision in a timely manner, this title shall not apply. (c) If the mediator is not from the court's panel, the court may approve compensation for the fees for that mediator's services from court funds pursuant to subdivision (d). Otherwise, the parties shall be responsible for paying any fees for the mediator's services, and each party to the proceeding shall share equally in the fee of the mediator, except where the parties agree otherwise. If the mediator is from the court's panel of mediators, the parties shall not be required to pay a fee for the mediator's services. (d) The Judicial Council shall adopt rules to implement this section, including rules establishing requirements for the panels of mediators, the procedures to be followed in selecting a mediator, and the compensation of mediators who conduct mediations pursuant to this title. 1736. The mediator shall schedule the early mediation within 60 days following the early status conference, unless any party requests a later date that is within 150 days following the early status conference or the court finds, for good cause, that a later date is necessary, or where counsel, a party, or the mediator is unavailable during that time period, or the court finds that discovery reasonably necessary for a meaningful mediation cannot be conducted prior to the end of that period. 1737. Trial counsel, parties, and persons with full authority to settle the case, shall personally attend the mediation, unless excused by the court for good cause. If any consent to settle is required for any reason, the party with the consent authority shall be personally present to the mediation. If no trial counsel, party, or person with full authority to settle a case is personally present at the mediation, unless excused for good cause, the party who is in compliance with this section may immediately terminate the mediation. 1738. (a) All statements made by the parties during a mediation under this title shall be subject to Sections 703.5 and 1152, and Chapter 2 (commencing with Section 1115) of Division 9 of, the Evidence Code.
377
(b) Any reference to a mediation or the statement of nonagreement filed pursuant to Section 1739 during any subsequent trial shall constitute an irregularity in the proceedings of the trial for the purposes of Section 657. 1739. (a) In the event that the parties to mediation are unable to reach a mutually acceptable agreement and any party to the mediation wishes to terminate the mediation at any time, then the mediator shall file a statement of nonagreement. This statement shall be in a form to be developed by the Judicial Council. (b) Upon the filing of a statement of nonagreement, the matter shall be calendared for trial, by court or jury, both as to law and fact, insofar as possible, so that the trial shall be given the same place on the active list as it had prior to mediation, or shall receive civil priority on the next setting calendar. 1740. (a) Submission of an action to mediation pursuant to this title shall not suspend the running of the time periods specified in Chapter 1.5 (commencing with Section 583.110) of Title 8 of Part 2, except as provided in this section. (b) If an action is or remains submitted to mediation pursuant to this title more than four years and six months after the plaintiff has filed the action, then the time beginning on the date four years and six months after the plaintiff has filed the action and ending on the date on which a statement of nonagreement is filed pursuant to this section shall not be included in computing the five-year period specified in Section 583.310. 1741. Any party who participates in mediation pursuant to this title shall retain the right to obtain discovery to the extent available under the Civil Discovery Act of 1986 (Article 3 (commencing with Section 2016) of Chapter 3 of Title 3 of Part 4). 1742. On or before January 1, 2003, the Judicial Council shall submit a report to the Legislature and to the Governor concerning the pilot programs conducted pursuant to this title. The report shall examine, among other things, the settlement rate, the timing of settlement, the litigants' satisfaction with the dispute resolution process and the costs to the litigants and the courts. The report shall also include a comparison of court ordered mediation, as provided in Section 1730, to voluntary mediation in Los Angeles County. The Judicial Council shall, by rule, require that each pilot program court provide the Judicial Council with the data that will enable the Judicial Council to submit the report required by this section. 1743. This title shall remain in effect only until January 1, 2004, an as of that date is repealed, unless a later enacted statute deletes or extends that date.

378
379
Appendix B. Early Mediation Pilot Program Rules CHAPTER 6. Mediation Pilot Program Rules
Title Five, Special Rules for Trial Courts-Division III, Alternative Dispute Resolution Rules for Civil Cases-Chapter 6 Mediation Pilot Program Rules renumbered effective January 1, 2001. Adopted as Chapter 3, effective January 1, 2000.
Rule 1640. Purpose and application
Rule 1640.1. Exemption from pilot program
Rule 1640.2. Cases exempt from mandatory referrals to mediation
Rule 1640.3. Panel of mediators
Rule 1640.4. Early mediation status conference
Rule 1640.5. Status conference statement
Rule 1640.6. Selection of mediator
Rule 1640.7. Compensation of mediators
Rule 1640.8. Filing of statement by mediator
Drafter's Notes
2000-New rules 1640-1640.8 establish (a) exemptions from the mediation pilot programs, (b) mediator selection and compensation requirements, and (c) other procedures for the mediation pilot programs.
Rule 1640. Purpose and application
The rules in this chapter implement title 11.5, commencing with section 1730, of part 3 of the Code of Civil Procedure, relating to mediation pilot programs and, as provided in section 1730, apply only to the pilot program courts selected by the Judicial Council.
Rule 1640 adopted effective January 1, 2000.
Rule 1640.1. Exemption from pilot program
The following types of actions are exempt from the mediation pilot programs under Code of Civil Procedure section 1730 et seq.:
380
(1) Class actions,
(2) Small claims actions,
(3) Unlawful detainer actions, and
(4) Actions subject to arbitration pursuant to subsection (d) of Code of Civil Procedure section 1141.11.
Rule 1640.1 adopted effective January 1, 2000.
Rule 1640.2. Cases exempt from mandatory referrals to mediation
The following cases are exempt from mandatory referral to mediation under Code of Civil Procedure section 1730 et seq. and these rules:
(1) Any case that has previously been ordered to mediation pursuant to Code of Civil Procedure section 1730 et seq.
(2) Any case in which the parties file a joint statement certifying that all parties have previously participated in a voluntary mediation.
(3) Any case in which a stipulation by all parties to participate in a mediation is filed at or before the early status conference.
Rule 1640.2 adopted effective January 1, 2000.
Rule 1640.3. Panel of mediators
(a) Each pilot program court shall maintain a panel of mediators.
(b) Each court, in consultation with local ADR providers and bar associations, shall establish the minimum qualifications required for a mediator to be included on the court's panel, including training and experience requirements. In developing these minimum requirements, the court shall take into consideration section 33 of the Standards of Judicial Administration and section 3622 of title 16, California Code of Regulations, relating to the Dispute Resolution Programs Act. The required qualifications shall not include membership in the State Bar or a local bar association.
(c) Each court shall adopt ethical standards applicable to the mediators on the court's panel. These ethical standards shall include, but not be limited to, provisions addressing mediator disclosure, impartiality and avoidance of bias or the appearance of bias, both during and after the mediation.
(d) In courts authorized to make voluntary referrals to mediation, as a condition for inclusion on the court's panel, each court shall require that mediators agree to serve
381
on a pro bono or reduced-fee basis in at least one case per year, if requested by the court.
Rule 1640.3 adopted effective January 1, 2000.
Rule 1640.4. Early mediation status conference
(a) A pilot program court may hold an early mediation status conference, as provided in Code of Civil Procedure section 1734.
(b) A pilot program court may provide by local rule for the cancellation or continuation of the early mediation status conference if the parties file a stipulation to participate in mediation or another ADR process.
Rule 1640.4 adopted effective January 1, 2000.
Rule 1640.5. Status conference statement
(a) In the two pilot program courts selected to make mandatory referrals to mediation, the court shall require, by local rule, that, prior to the status conference, the parties serve and file an early mediation status conference statement. This statement shall include:
(1) A discussion of the appropriateness of the case for referral to mediation; and
(2) A list of three nominees to serve as mediator.
(b) In the other pilot program courts, the court may provide for a status conference statement by local rule.
Rule 1640.5 adopted effective January 1, 2000.
Rule 1640.6. Selection of mediator
(a) Within 15 days of filing a stipulation to participate in mediation or of being ordered to mediation by the court, the parties shall select a mediator and provide the court with written notice of the name, address, and telephone number of the mediator selected. The mediator selected by the parties need not be from the panel of mediators maintained by the court under rule 1640.3.
(b) In the two pilot program courts selected to make mandatory referrals to mediation, if the parties do not select a mediator within the time period specified in subdivision (a) above, then no later than 20 days after the stipulation to mediation is filed or the case is ordered to mediation by the court, the court shall select a mediator from the panel of mediators provided for in rule1640.3.
382
(c) In the pilot program courts that are not authorized to make mandatory referrals to mediation, the court shall provide by local rule for the mediator selection procedure to be followed if the parties do not select a mediator within the time period specified in subdivision (a) above.
Rule 1640.6 adopted effective January 1, 2000.
Rule 1640.7. Compensation of mediators
(a) In the two pilot program courts selected to make mandatory referrals to mediation:
(1) The court shall provide for the compensation of mediators on its panel of mediators who provide mediation services in the pilot program. Parties ordered to mediation pursuant to Code of Civil Procedure section 1730 et seq. shall not be required to pay a fee for the services of a mediator on the court's panel of mediators.
(2) Unless the court specifically approves court compensation for a mediator who is not on the court's panel of mediators, the parties shall be responsible for any fees for such mediator's services. The court shall, by local rule, establish a procedure for parties to submit requests for court compensation of mediators who are not on the court's panel but who were selected by the parties to provide mediation services in cases ordered to mediation under Code of Civil Procedure section 1730 et seq. The rate of compensation paid to mediators who are not on the court's panel shall not be higher than the rate paid to mediators on the court's panel. The court may provide by local rule for a maximum amount of fees that it will pay to mediators who are not on the court's panel.
(b) In the other pilot program courts, unless otherwise provided by local rule, the parties shall be responsible for paying any fees for the mediator's services.
Rule 1640.7 adopted effective January 1, 2000.
Rule 1640.8. Filing of statement by mediator
Within ten days of the conclusion of the mediation, the mediator shall file a statement on Judicial Council Form ADR-100, advising the court whether the mediation ended in full agreement, partial agreement, or nonagreement.
Rule 1640.8 adopted effective January 1, 2000.

383
Appendix C. Survey Instruments
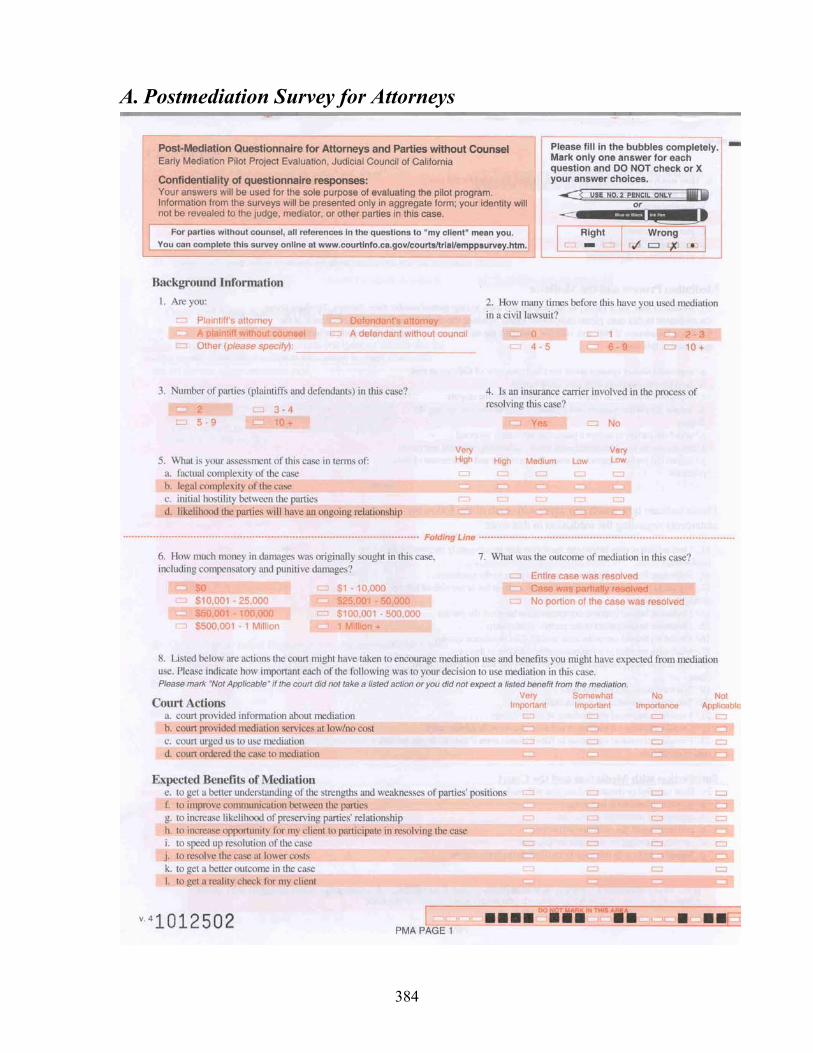
384
A. Postmediation Survey for Attorneys

385

386
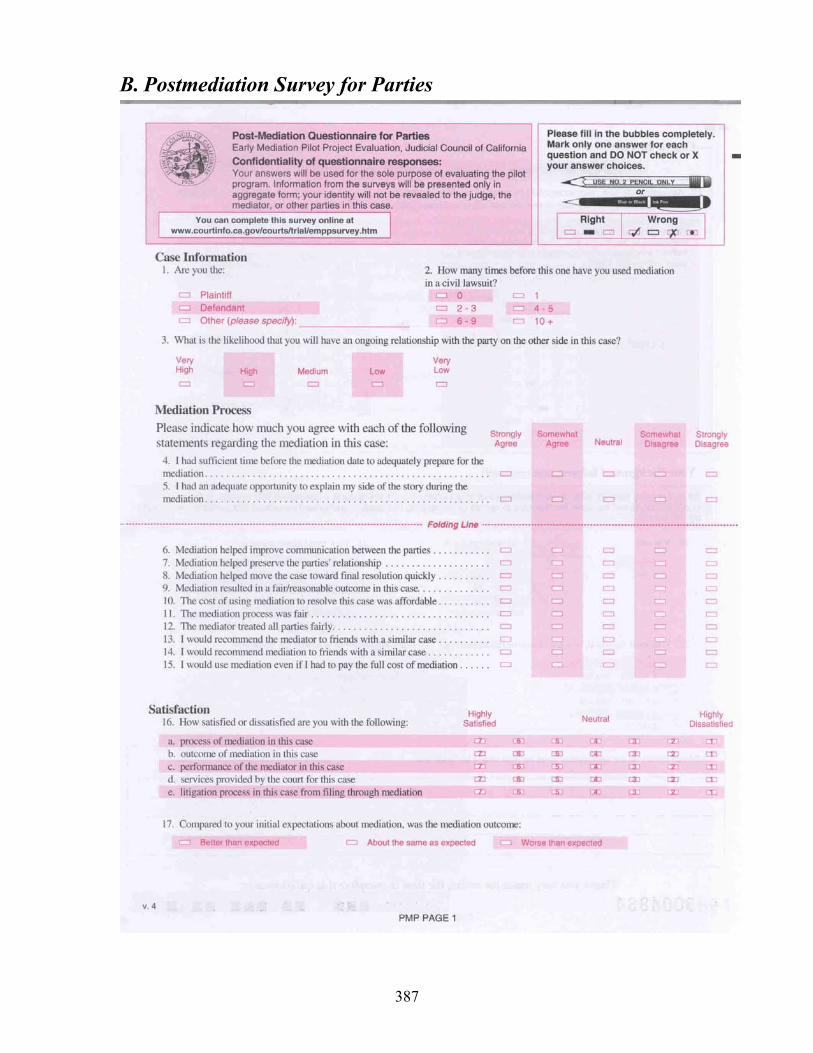
387
B. Postmediation Survey for Parties
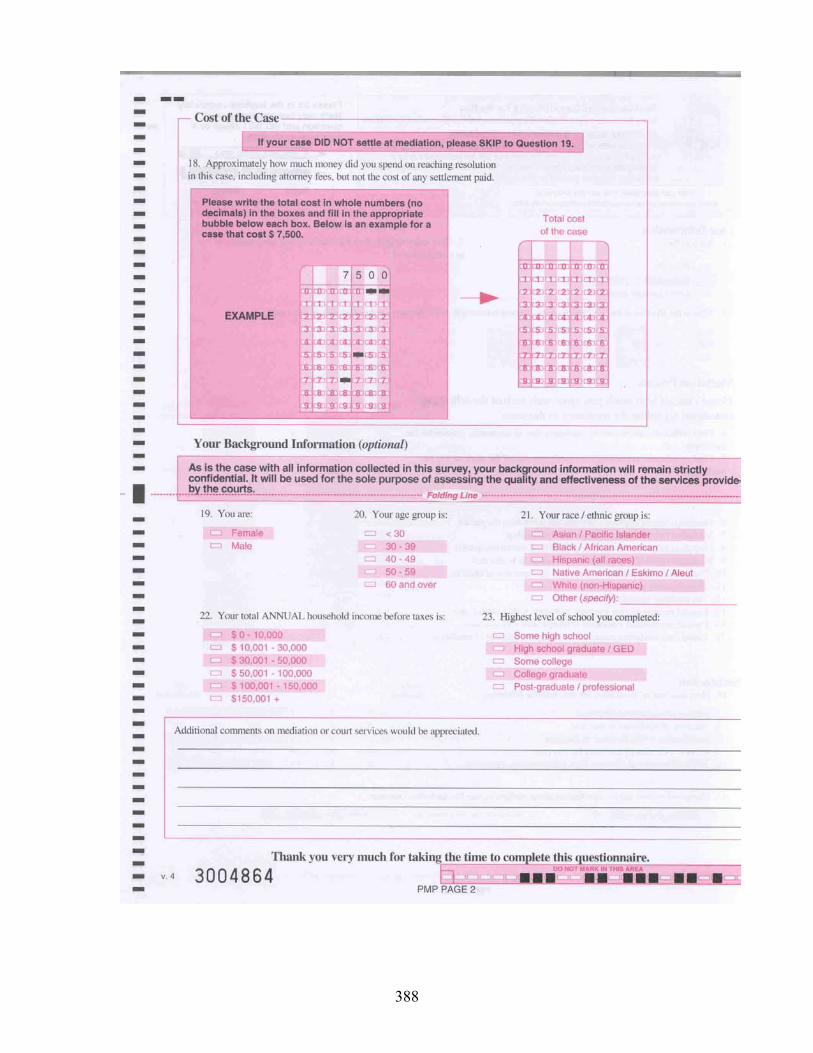
388
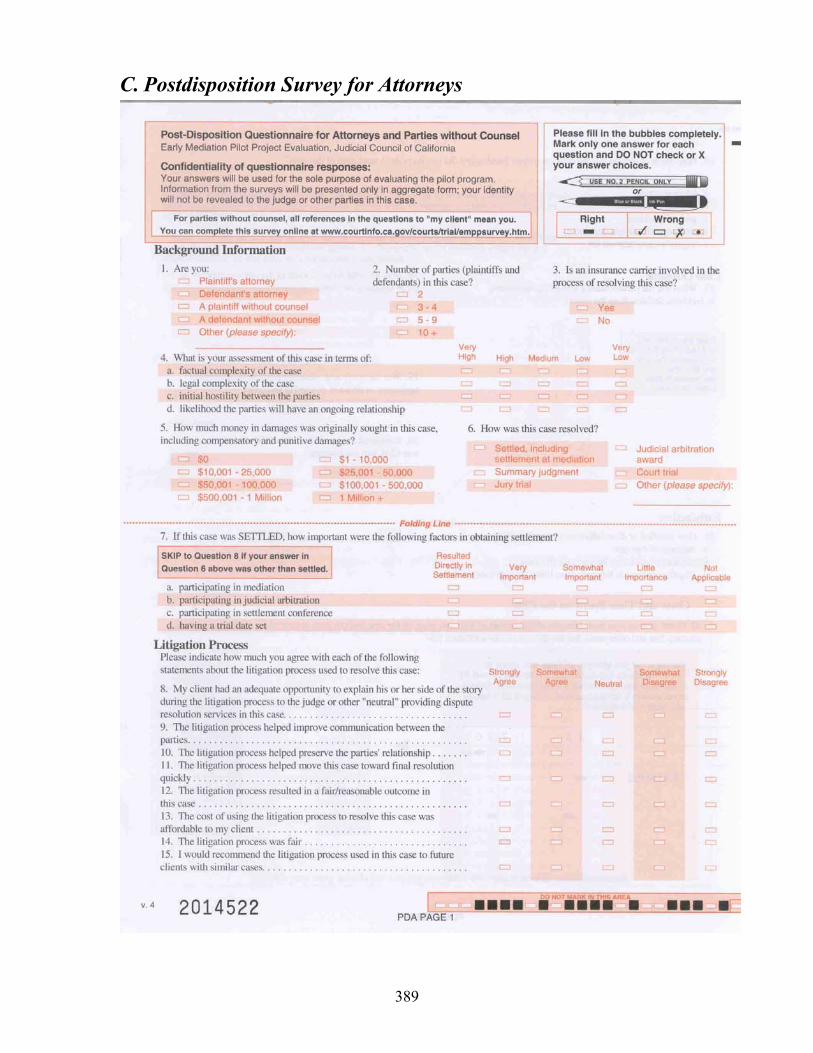
389
C. Postdisposition Survey for Attorneys
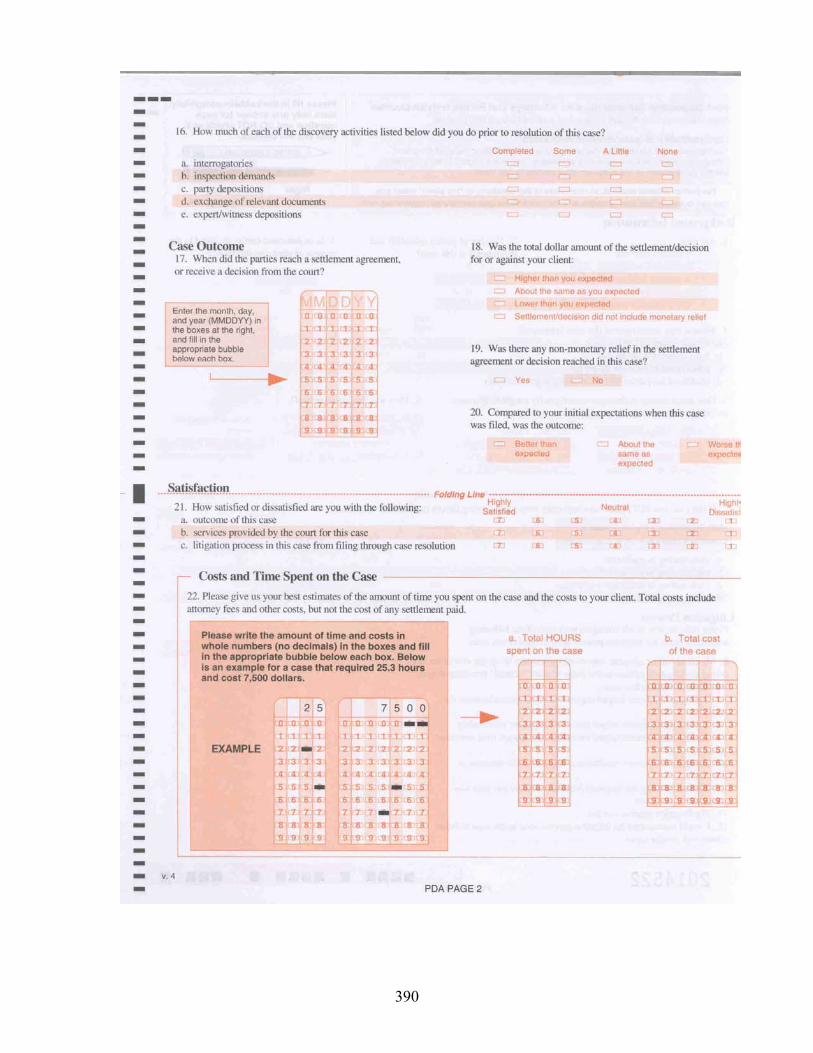
390
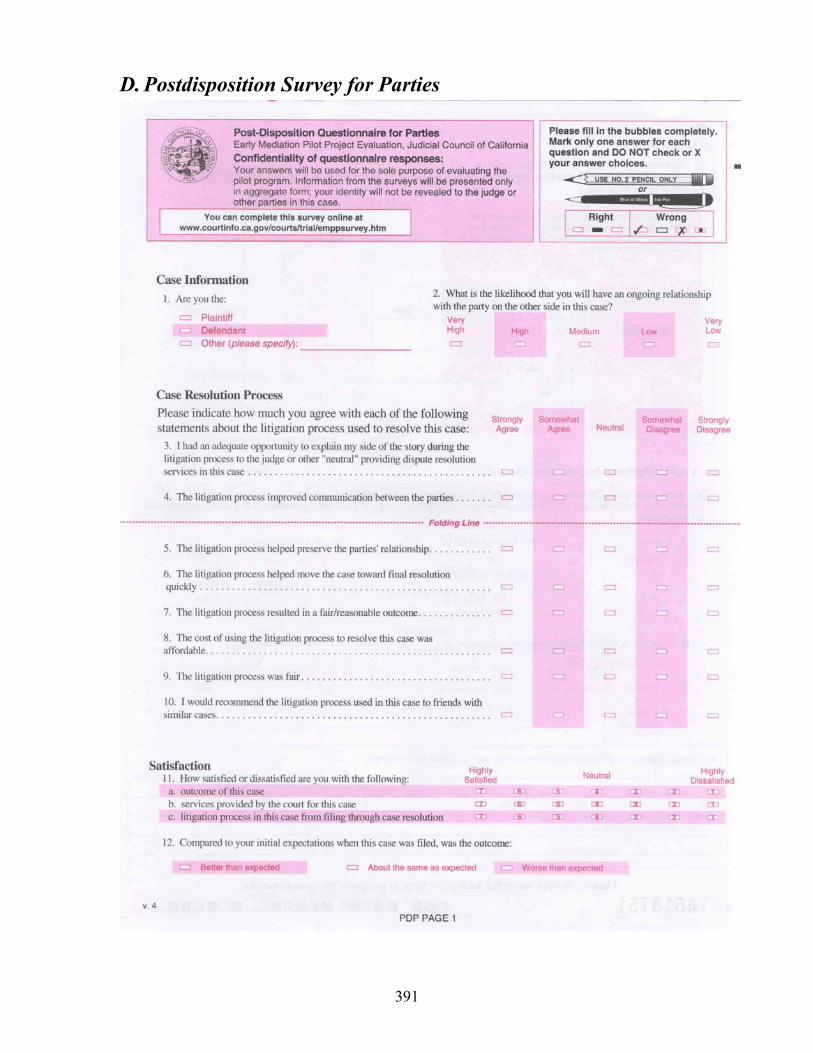
391
D. Postdisposition Survey for Parties
392

393
E. Durability Survey Under six months Six months to one year
1 How long has it been since the case was resolved? Over one year
To the best of your recollection, how was this case ultimately resolved?
Settlement at mediation Settlement after non-agreement at the mediation Other settlement without using mediation Entry of judicial arbitration award as judgment Verdict/judgment after trial Involuntary dismissal by court (e.g. default) SKIP TO 16
2
Other (please specify below):
If case was involuntarily dismissed by court (e.g. default), skip to 16. Otherwise, please continue.
A little Somewhat A lot
3 If the case was resolved by settlement, to what degree was your client involved in the process of settling the case:
Yes 4 Did the settlement/judgment in this
case include monetary damages? No SKIP TO 6
Substantially lower Somewhat lower About the same Somewhat higher
5 If yes, compared to the original amount sought, was the settlement or judgment amount:
Substantially higher
Yes 6 Was there any non-monetary relief in
the settlement agreement/judgment? No
In favor of my client In favor of other party Both
7 Was the relief provided by the settlement agreement or judgment in your client’s favor or other party’s favor?
In the agreement/judgment, was the requirement for payment or performance of other duties:
Immediate upon settlement/judgment Scheduled to be completed within six months Scheduled to be completed within one year Scheduled to be completed over a year
8
Other (please specify below):
Complied in full Partially complied Not complied at all
9 To date, has the party responsible for payment or performance under the agreement or judgment:
NA / DK
Do you feel that the agreement or judgment in this case fully addressed:
Yes a. The legal issues in the dispute between parties? No
Yes No
10
b. The emotional issues (if any) underlying dispute?
NA
After agreement was reached or judgment rendered:
Yes No
a. Did a dispute between parties over any legal issues involved in case continue or re-emerge?
Yes No
11
b. Did anger, resentment or other emotions that fueled the original dispute continue or re-emerge?
NA
None Some Many
12 After agreement was reached/judgment rendered, how many additional interactions between sides in the case were needed before compliance with agreement/judgment began?
Were any additional court proceedings considered or initiated in this case to:
Considered
Initiated Neither
a. Enforce agreement/judgment? b. Modify agreement/judgment?
c. Rescind/overturn the agreement or judgment?
13
d. Other? (please specify below):
Yes No
14 Is there or has there been another lawsuit between the parties about different issues since the resolution of this case?
Please answer the following using a scale from 1 to 5, where 1 = Not At All and 5 = Completely
Not at all Completely
DK NAOverall, was the outcome in this case fair?
DK NAOverall, was process for resolving this case fair?
DK NA
15
a.
b.
c. Are you satisfied with overall outcome?
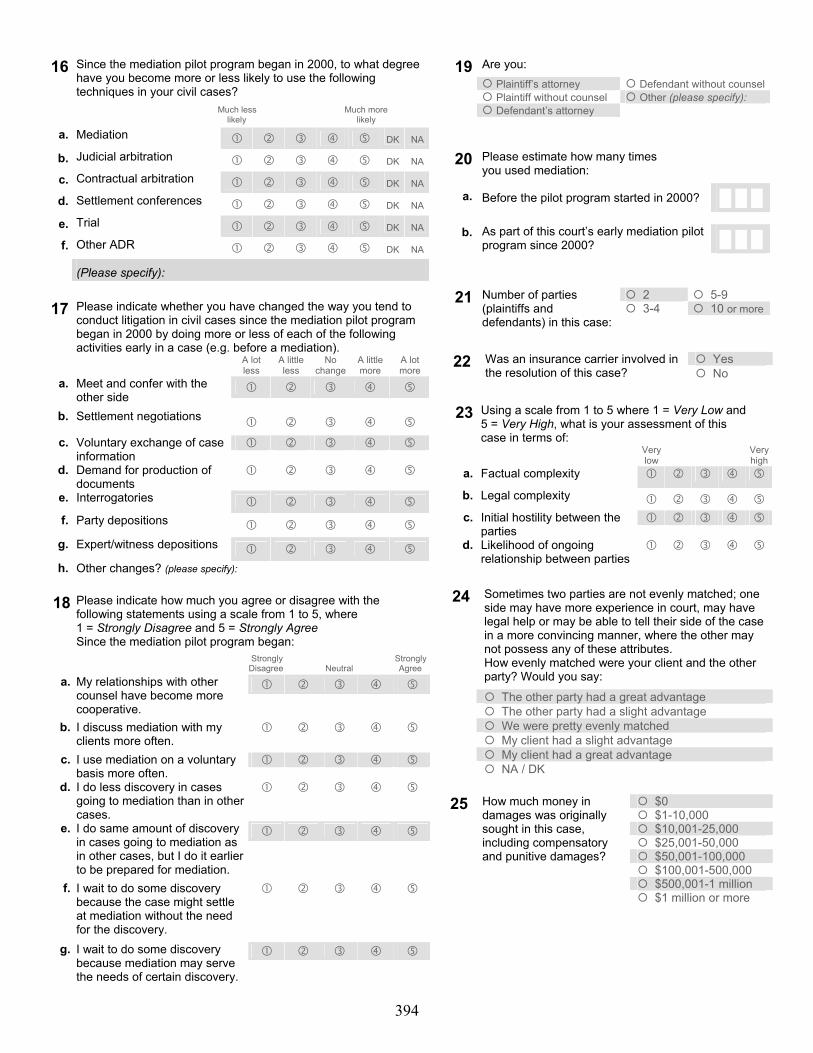
394
Since the mediation pilot program began in 2000, to what degree have you become more or less likely to use the following techniques in your civil cases?
Much less Much more likely likely
Mediation DK NA
Judicial arbitration DK NA
Contractual arbitration DK NA
Settlement conferences DK NA
Trial DK NA
16
a.
b.
c.
d.
e.
f. Other ADR
DK NA
(Please specify): 17
Please indicate whether you have changed the way you tend to conduct litigation in civil cases since the mediation pilot program began in 2000 by doing more or less of each of the following activities early in a case (e.g. before a mediation).
A lot less
A little less
No change
A little more
A lot more
a.
Meet and confer with the other side
b. Settlement negotiations c.
Voluntary exchange of case information
d.
Demand for production of documents
e. Interrogatories f. Party depositions
g. Expert/witness depositions h. Other changes? (please specify):
18 Please indicate how much you agree or disagree with the
following statements using a scale from 1 to 5, where 1 = Strongly Disagree and 5 = Strongly Agree Since the mediation pilot program began:
Strongly Strongly Disagree Neutral Agree
a. My relationships with other counsel have become more cooperative.
b. I discuss mediation with my clients more often.
c. I use mediation on a voluntary basis more often.
d. I do less discovery in cases going to mediation than in other cases.
e. I do same amount of discovery in cases going to mediation as in other cases, but I do it earlier to be prepared for mediation.
f. I wait to do some discovery because the case might settle at mediation without the need for the discovery.
g. I wait to do some discovery because mediation may serve the needs of certain discovery.
Are you:
Plaintiff’s attorney Defendant without counsel Plaintiff without counsel Other (please specify): Defendant’s attorney
19
Please estimate how many times you used mediation:
Before the pilot program started in 2000? █ █ █
█ █ █
20
a.
b. As part of this court’s early mediation pilot
program since 2000?
2 5-9 3-4 10 or more
21 Number of parties (plaintiffs and defendants) in this case:
Yes 22 Was an insurance carrier involved in
the resolution of this case? No
23
Using a scale from 1 to 5 where 1 = Very Low and 5 = Very High, what is your assessment of this case in terms of:
Very low
Very high
a. Factual complexity
b. Legal complexity
c. Initial hostility between the parties
d. Likelihood of ongoing relationship between parties
Sometimes two parties are not evenly matched; one side may have more experience in court, may have legal help or may be able to tell their side of the case in a more convincing manner, where the other may not possess any of these attributes. How evenly matched were your client and the other party? Would you say:
The other party had a great advantage The other party had a slight advantage We were pretty evenly matched My client had a slight advantage My client had a great advantage
24
NA / DK
$0 $1-10,000 $10,001-25,000 $25,001-50,000 $50,001-100,000 $100,001-500,000 $500,001-1 million
25 How much money in damages was originally sought in this case, including compensatory and punitive damages?
$1 million or more
395
F. Mediator Survey
Total hours of mediation training Under 20 21 – 40 41 – 80
1
More than 80
Number of cases in which have served as mediator Under 20 20 – 50 51 – 100
2
More than 100
Educational level High school graduate Some college College or university degree
3
Post-graduate degree
Which court(s) EMPP panel(s) are you on and how long have you been on the panel? Less
Than 12 Months
13 to 24 Months
More Than 24 Months
Contra Costa Fresno Los Angeles San Diego Sonoma
5
None
In how many of each type of case listed below were you appointed/selected as an EMPP mediator? (Please estimate if necessary) Auto PI Non-Auto PI Contract
6
All Others
How many times were you subsequently selected to conduct a private mediation by parties or attorneys for whom you served as an EMPP mediator?
0 1 – 2 3 – 5 6 - 10
7
More than 10 times
How often (if ever) did the following happen in your EMPP mediations and how important do you think each was in the cases NOT resolving in mediation?
Often Sometimes Rarely Never Very Important
Somewhat Important
Little or No Importance
a. The subject matter of the case did not seem appropriate for mediation.
b. The case was referred to mediation too early.
c. The deadline for completing mediation was too early.
d. The following participants appeared by telephone: Plaintiff(s) Plaintiff’s counsel Defendant(s) Defendant’s counsel
Insurance company representative(s)
e. The following were excused from participating in the mediation:
Plaintiff(s) Defendant(s)
Insurance company representative(s)
f. The following did not seem to understand the mediation process:
Plaintiff(s) Plaintiff’s counsel
Defendant(s)
Professional background (check all that apply) Full time dispute resolution neutral Retired Judge or bench officer Lawyer
4
Other (please specify)
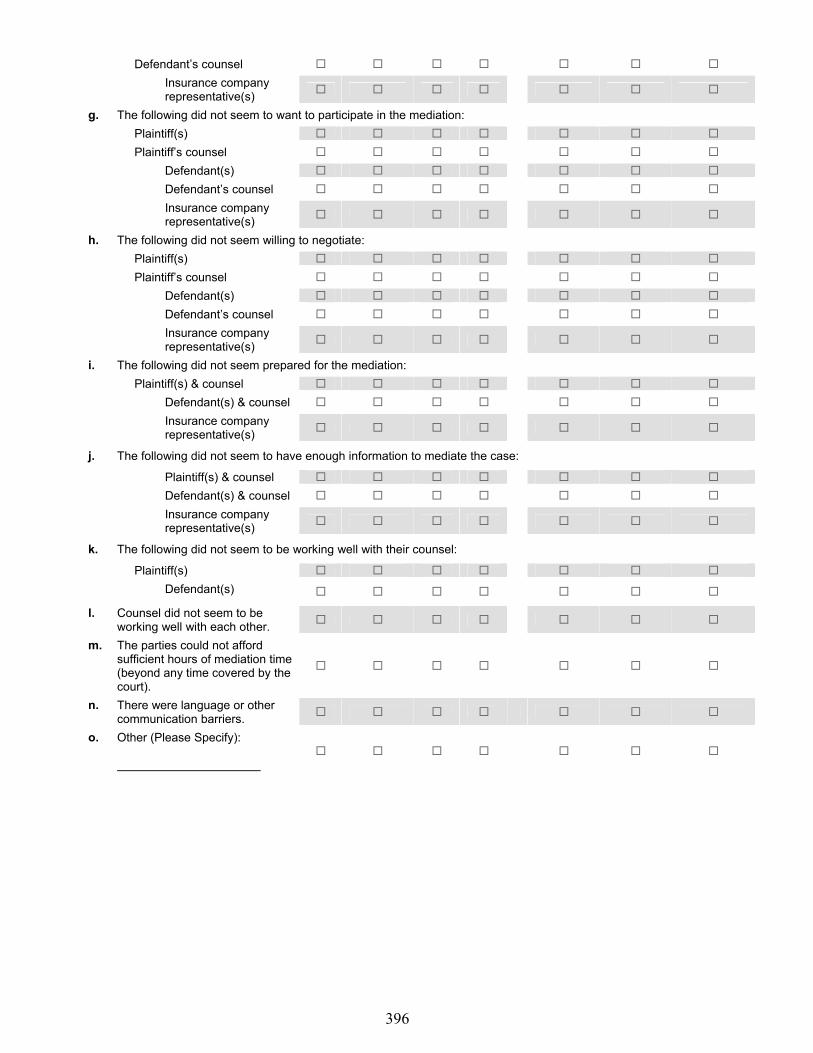
396
Defendant’s counsel Insurance company representative(s)
g. The following did not seem to want to participate in the mediation: Plaintiff(s) Plaintiff’s counsel
Defendant(s) Defendant’s counsel Insurance company representative(s)
h. The following did not seem willing to negotiate: Plaintiff(s) Plaintiff’s counsel
Defendant(s) Defendant’s counsel Insurance company representative(s)
i. The following did not seem prepared for the mediation: Plaintiff(s) & counsel
Defendant(s) & counsel Insurance company representative(s)
j. The following did not seem to have enough information to mediate the case:
Plaintiff(s) & counsel Defendant(s) & counsel Insurance company representative(s)
k. The following did not seem to be working well with their counsel:
Plaintiff(s) Defendant(s)
l. Counsel did not seem to be working well with each other.
m. The parties could not afford sufficient hours of mediation time (beyond any time covered by the court).
n. There were language or other communication barriers.
o. Other (Please Specify):

397
How often (if ever) did you do the following in your EMPP mediations, and how important do you think each was in the cases resolving in mediation?
Always Often Rarely Never Very
Important Somewhat Important
Little or No Importance
a. Met with counsel and parties in joint session
b. Met with some or all counsel or parties individually
c. Encouraged parties to communicate in each other’s presence
d. Encouraged parties to share their emotions
e. Encouraged parties to discuss concerns or interests underlying the dispute
f. Encouraged parties to explore solutions beyond those available through court
g. Provided an evaluation of the legal merits of the case
h. Provided an opinion or evaluation of the likely outcome of case at trial
9
i. Made recommendations regarding whether parties should settle
Please indicate whether you think the EMPP program has had a positive or negative impact on the following, where 5 = very positive and 1 = very negative.
Very positive
Very Negative
5 4 3 2 1 Increasing awareness and understanding of mediation by: a. Judges b. Attorneys c. Parties to
litigation
d. Insurance representatives
10
e. Public Increasing willingness to use mediation by: a. Attorneys b. Parties c. Insurance
representatives
11
d. Public
Increasing willingness to compensate mediators for their services by: a. Attorneys b. Parties c. Insurance
representatives
12
d. Public
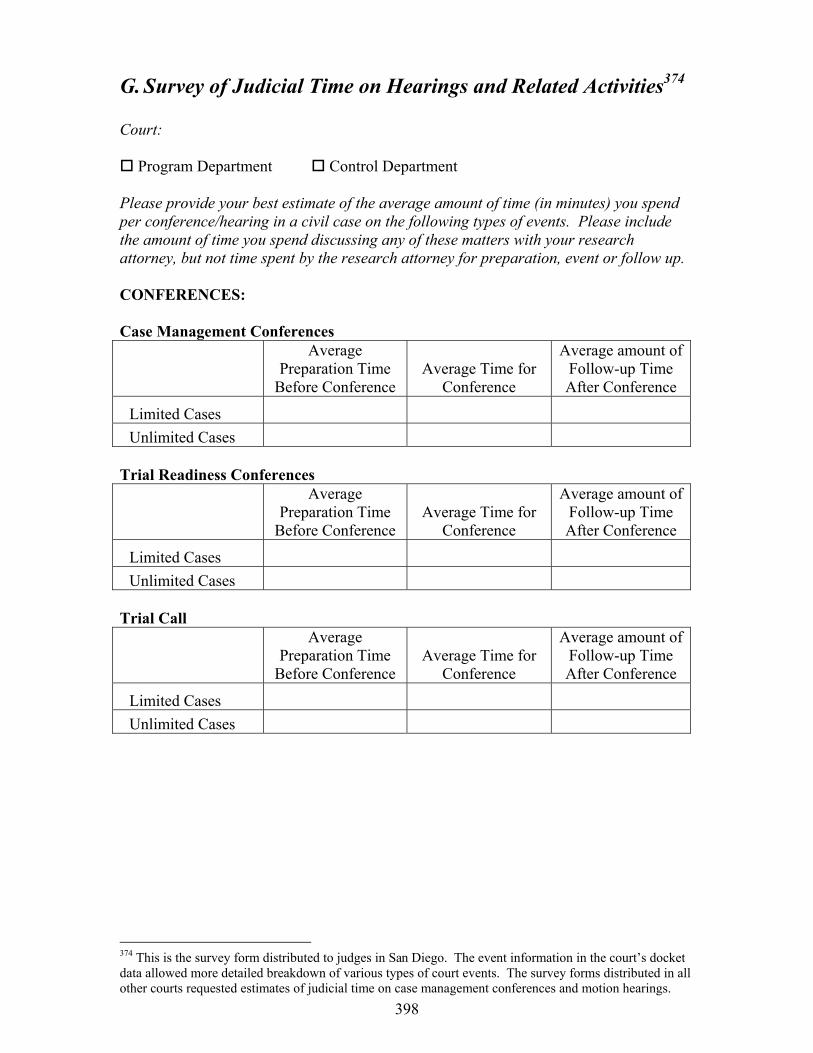
398
G. Survey of Judicial Time on Hearings and Related Activities374 Court:
Program Department Control Department Please provide your best estimate of the average amount of time (in minutes) you spend per conference/hearing in a civil case on the following types of events. Please include the amount of time you spend discussing any of these matters with your research attorney, but not time spent by the research attorney for preparation, event or follow up. CONFERENCES: Case Management Conferences Average
Preparation Time Before Conference
Average Time for Conference
Average amount of Follow-up Time After Conference
Limited Cases
Unlimited Cases Trial Readiness Conferences Average
Preparation Time Before Conference
Average Time for Conference
Average amount of Follow-up Time After Conference
Limited Cases
Unlimited Cases Trial Call Average
Preparation Time Before Conference
Average Time for Conference
Average amount of Follow-up Time After Conference
Limited Cases
Unlimited Cases
374 This is the survey form distributed to judges in San Diego. The event information in the court’s docket data allowed more detailed breakdown of various types of court events. The survey forms distributed in all other courts requested estimates of judicial time on case management conferences and motion hearings.
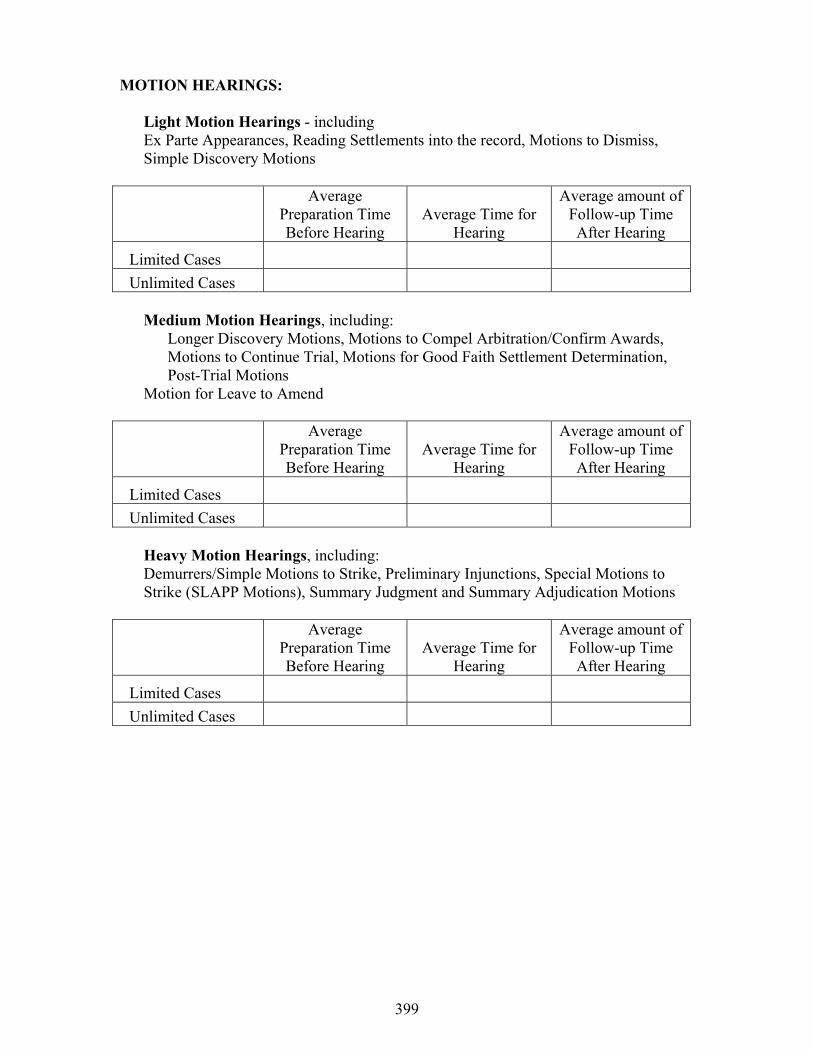
399
MOTION HEARINGS:
Light Motion Hearings - including Ex Parte Appearances, Reading Settlements into the record, Motions to Dismiss, Simple Discovery Motions
Average
Preparation Time Before Hearing
Average Time for Hearing
Average amount of Follow-up Time After Hearing
Limited Cases
Unlimited Cases
Medium Motion Hearings, including: Longer Discovery Motions, Motions to Compel Arbitration/Confirm Awards, Motions to Continue Trial, Motions for Good Faith Settlement Determination, Post-Trial Motions
Motion for Leave to Amend
Average Preparation Time Before Hearing
Average Time for Hearing
Average amount of Follow-up Time After Hearing
Limited Cases
Unlimited Cases Heavy Motion Hearings, including: Demurrers/Simple Motions to Strike, Preliminary Injunctions, Special Motions to Strike (SLAPP Motions), Summary Judgment and Summary Adjudication Motions
Average
Preparation Time Before Hearing
Average Time for Hearing
Average amount of Follow-up Time After Hearing
Limited Cases
Unlimited Cases
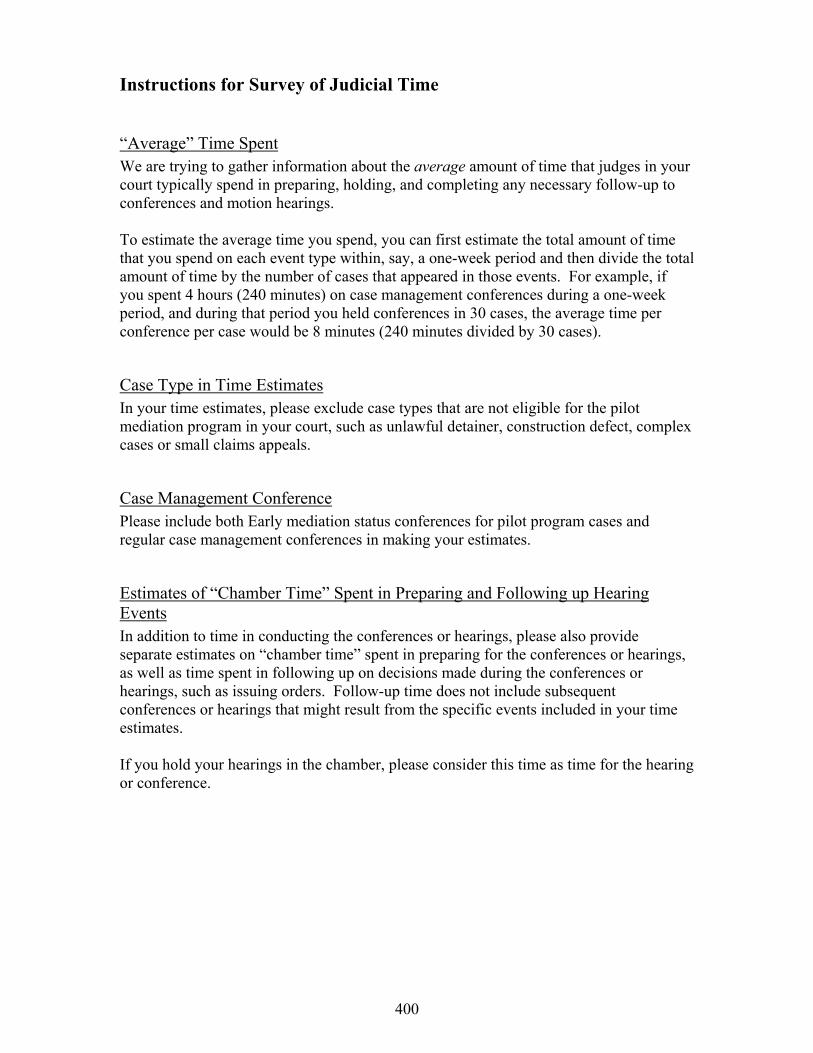
400
Instructions for Survey of Judicial Time
“Average” Time Spent We are trying to gather information about the average amount of time that judges in your court typically spend in preparing, holding, and completing any necessary follow-up to conferences and motion hearings. To estimate the average time you spend, you can first estimate the total amount of time that you spend on each event type within, say, a one-week period and then divide the total amount of time by the number of cases that appeared in those events. For example, if you spent 4 hours (240 minutes) on case management conferences during a one-week period, and during that period you held conferences in 30 cases, the average time per conference per case would be 8 minutes (240 minutes divided by 30 cases).
Case Type in Time Estimates In your time estimates, please exclude case types that are not eligible for the pilot mediation program in your court, such as unlawful detainer, construction defect, complex cases or small claims appeals.
Case Management Conference Please include both Early mediation status conferences for pilot program cases and regular case management conferences in making your estimates.
Estimates of “Chamber Time” Spent in Preparing and Following up Hearing Events In addition to time in conducting the conferences or hearings, please also provide separate estimates on “chamber time” spent in preparing for the conferences or hearings, as well as time spent in following up on decisions made during the conferences or hearings, such as issuing orders. Follow-up time does not include subsequent conferences or hearings that might result from the specific events included in your time estimates. If you hold your hearings in the chamber, please consider this time as time for the hearing or conference.
401
Appendix D. Survey Distribution and Response Rate
A. Postmediation Survey Postmediation surveys were filled out by parties and attorneys in program cases in that used mediation under the pilot program. Parties who were represented by attorneys were asked to fill out a shorter survey form (party forms); attorneys, parties without representation, and other mediation participants (mainly insurance representatives) were asked to fill out a longer survey form (attorney forms). The postmediation surveys were distributed to mediators from July 2001 to June 2002 as cases in the pilot programs were referred to mediation.375 When a case was referred to mediation, the courts sent a package of survey forms to the mediator along with other court documents.376 In San Diego, a random sample was drawn from the large number of cases referred to mediation. In all other courts, the samples for postmediation surveys included all cases that were referred to mediation during the survey period. The surveys were then distributed by mediators at the end of the mediation session to persons who participated in the mediation. Participants who received the survey forms were asked to either give the completed survey form to the mediator before leaving the last mediation session or to mail the response to the “evaluation research project” staff at the court. To track survey responses, all participants who received the survey forms were asked to fill out an “attendance sheet” with their name and address. This attendance sheet was mailed to the court by the mediator regardless of whether the survey form was completed. Using the names and addresses from the attendance sheets, two follow-up reminders were mailed to parties and attorneys who had received survey forms but had not returned completed surveys. The first reminder was a postcard mailed two weeks after the attendance sheets were received by the courts. The second reminder was mailed two weeks later to those who had not responded; a new survey form was also included in the second reminder. In all, the five pilot courts distributed approximately 15,000 postmediation survey forms (7,602 attorney forms and 7,480 party forms) to the mediators. However, as discussed in the report, many cases that were referred to mediation did not ultimately go to mediation, either because the case settled before the mediation took place or because the court removed the case from the mediation track. Of the 15,000 party and attorney surveys mailed to the mediators, 9,615 attendance sheets were received by the courts (4,926 for attorney forms and 4,689 for party forms). The number of attendance sheets received represents the total number of survey forms that were actually distributed by the mediators to mediation participants in the pilot programs.
375 To increase sample size in Sonoma, additional postmediation surveys were distributed in January 2003. 376 In Los Angeles, some mediators received a package of survey forms prior to case referrals and were asked to distribute the survey forms whenever a case went to mediation.
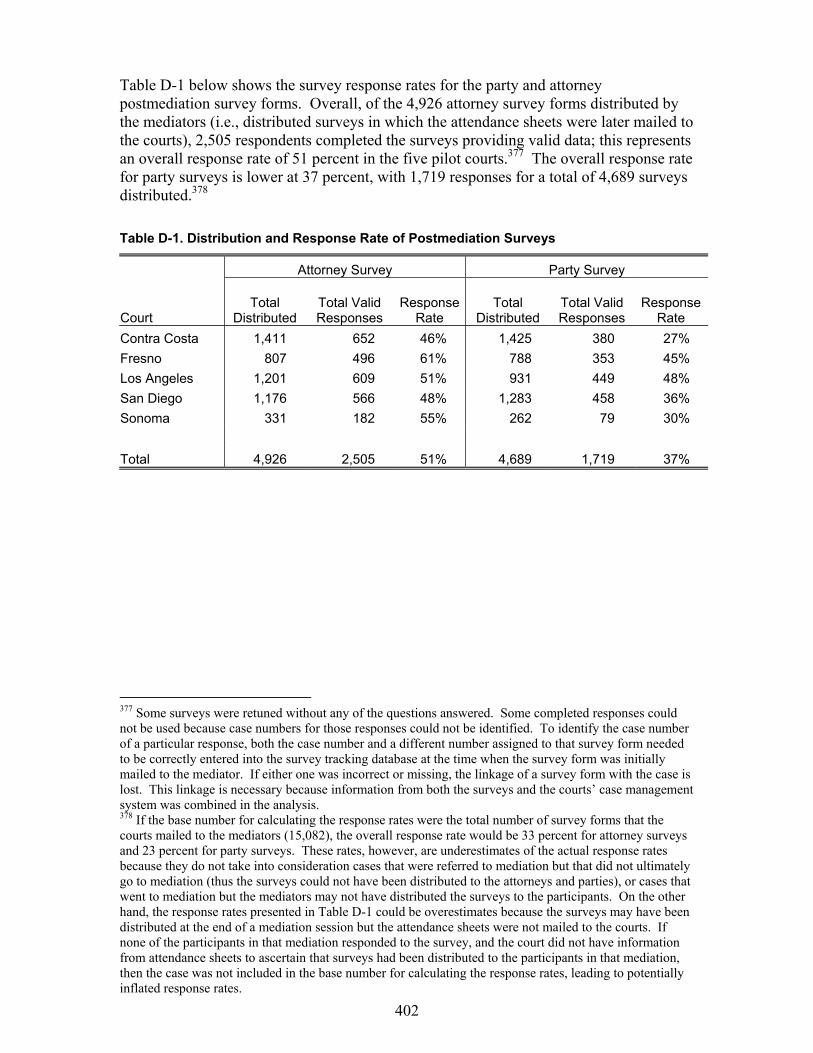
402
Table D-1 below shows the survey response rates for the party and attorney postmediation survey forms. Overall, of the 4,926 attorney survey forms distributed by the mediators (i.e., distributed surveys in which the attendance sheets were later mailed to the courts), 2,505 respondents completed the surveys providing valid data; this represents an overall response rate of 51 percent in the five pilot courts.377 The overall response rate for party surveys is lower at 37 percent, with 1,719 responses for a total of 4,689 surveys distributed.378 Table D-1. Distribution and Response Rate of Postmediation Surveys
Attorney Survey Party Survey
Court Total
Distributed Total Valid Responses
Response Rate
Total Distributed
Total Valid Responses
Response Rate
Contra Costa 1,411 652 46% 1,425 380 27% Fresno 807 496 61% 788 353 45% Los Angeles 1,201 609 51% 931 449 48% San Diego 1,176 566 48% 1,283 458 36% Sonoma 331 182 55% 262 79 30% Total 4,926 2,505 51% 4,689 1,719 37%
377 Some surveys were retuned without any of the questions answered. Some completed responses could not be used because case numbers for those responses could not be identified. To identify the case number of a particular response, both the case number and a different number assigned to that survey form needed to be correctly entered into the survey tracking database at the time when the survey form was initially mailed to the mediator. If either one was incorrect or missing, the linkage of a survey form with the case is lost. This linkage is necessary because information from both the surveys and the courts’ case management system was combined in the analysis. 378 If the base number for calculating the response rates were the total number of survey forms that the courts mailed to the mediators (15,082), the overall response rate would be 33 percent for attorney surveys and 23 percent for party surveys. These rates, however, are underestimates of the actual response rates because they do not take into consideration cases that were referred to mediation but that did not ultimately go to mediation (thus the surveys could not have been distributed to the attorneys and parties), or cases that went to mediation but the mediators may not have distributed the surveys to the participants. On the other hand, the response rates presented in Table D-1 could be overestimates because the surveys may have been distributed at the end of a mediation session but the attendance sheets were not mailed to the courts. If none of the participants in that mediation responded to the survey, and the court did not have information from attendance sheets to ascertain that surveys had been distributed to the participants in that mediation, then the case was not included in the base number for calculating the response rates, leading to potentially inflated response rates.
403
B. Postdisposition Survey Postdisposition surveys were mailed directly by the court to attorneys and parties from July 2001 to September of 2002.379 Random samples were drawn from eligible cases that had been filed since the pilot program began and had reached disposition as of the time sample selection. The only cases that were not selected for the postdisposition surveys were cases in the program that went to mediation and settled at mediation. These mediated cases that settled were already included in the postmediation survey. As with the postmediation survey, there were two different postdisposition survey forms: one for parties represented by attorneys and one for attorneys and self-represented parties. Based on information from the courts’ case management system, the attorney survey forms were first mailed to attorneys and self-represented parties. Contact information for parties who were represented by attorneys was not available in the courts’ case management system. Therefore, attorneys who were sent the postdisposition survey forms were asked to provide their clients’ names and addresses. Thereafter, party surveys were sent to those parties whose attorneys had responded to the attorney survey and provided their client contact information in the responses. As with the postmediation survey, two survey reminders were mailed for the postdisposition surveys. Two weeks after the initial mailing, a reminder postcard was mailed to those who had not responded; a reminder letter with another copy of the survey form was mailed again four weeks after the initial mailing. In all five courts, a total of 6,891 postdisposition surveys were mailed (6,173 to attorneys and 718 to parties), as shown in Table D-2. The overall response rate for attorney surveys was 45 percent, with 2,767 valid responses for 6,173 surveys mailed. Party surveys had a similar response rate at 42 percent, with 300 valid responses for 718 surveys mailed. While the response rates were similar for the attorney and party surveys, the sample size for party surveys was fairly small, as only a small proportion of attorney respondents provided their clients’ contact information. When Los Angeles began distribution of the postdisposition surveys in July of 2002, other courts had already completed their survey data collection. Based on party response data from these courts, it was realized that the postdisposition party surveys were unlikely to generate a large sample size. As a result, the postdisposition survey in Los Angeles did not include party surveys.
379 Since the pilot program in Los Angeles did not begin operation until June of 2001, more than a year later than in other courts, distribution of postdisposition surveys began in July of 2002 in Los Angeles to allow for sufficient time for program cases to reach disposition. To increase sample size, additional surveys were distributed again from February to April 2003 in Los Angeles, Fresno, and Sonoma, but for attorneys only.
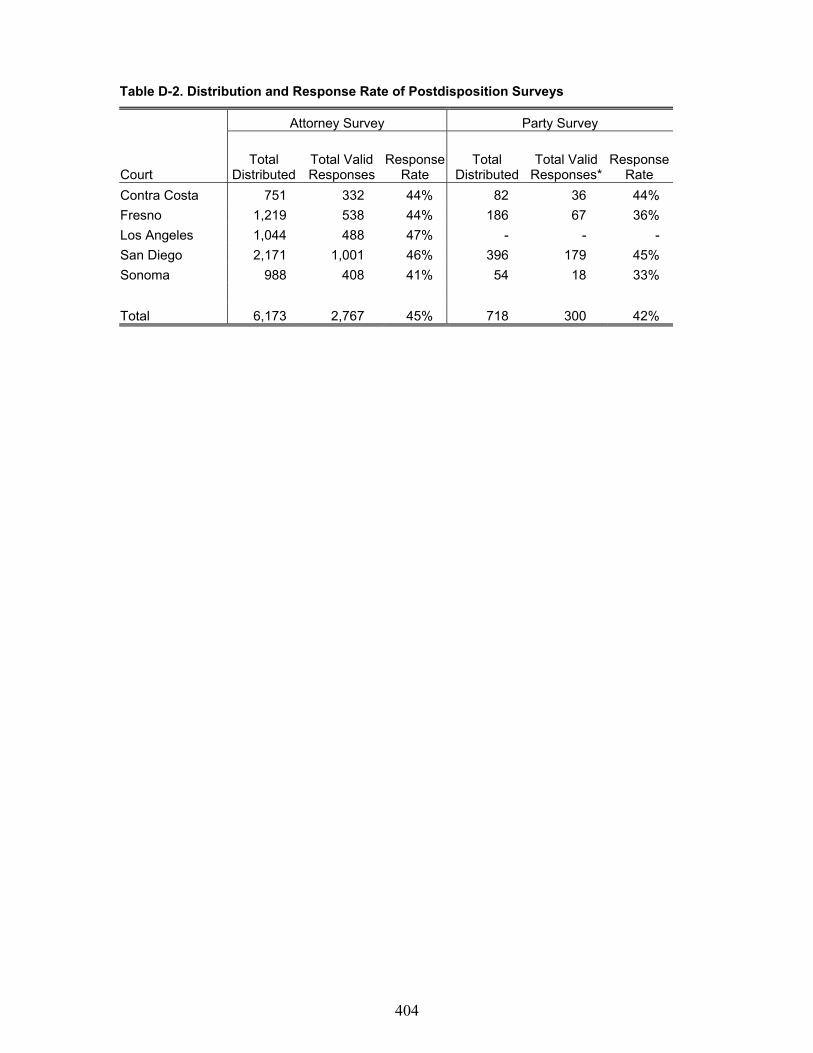
404
Table D-2. Distribution and Response Rate of Postdisposition Surveys
Attorney Survey Party Survey
Court Total
Distributed Total Valid Responses
Response Rate
Total Distributed
Total Valid Responses*
Response Rate
Contra Costa 751 332 44% 82 36 44% Fresno 1,219 538 44% 186 67 36% Los Angeles 1,044 488 47% - - - San Diego 2,171 1,001 46% 396 179 45% Sonoma 988 408 41% 54 18 33% Total 6,173 2,767 45% 718 300 42%
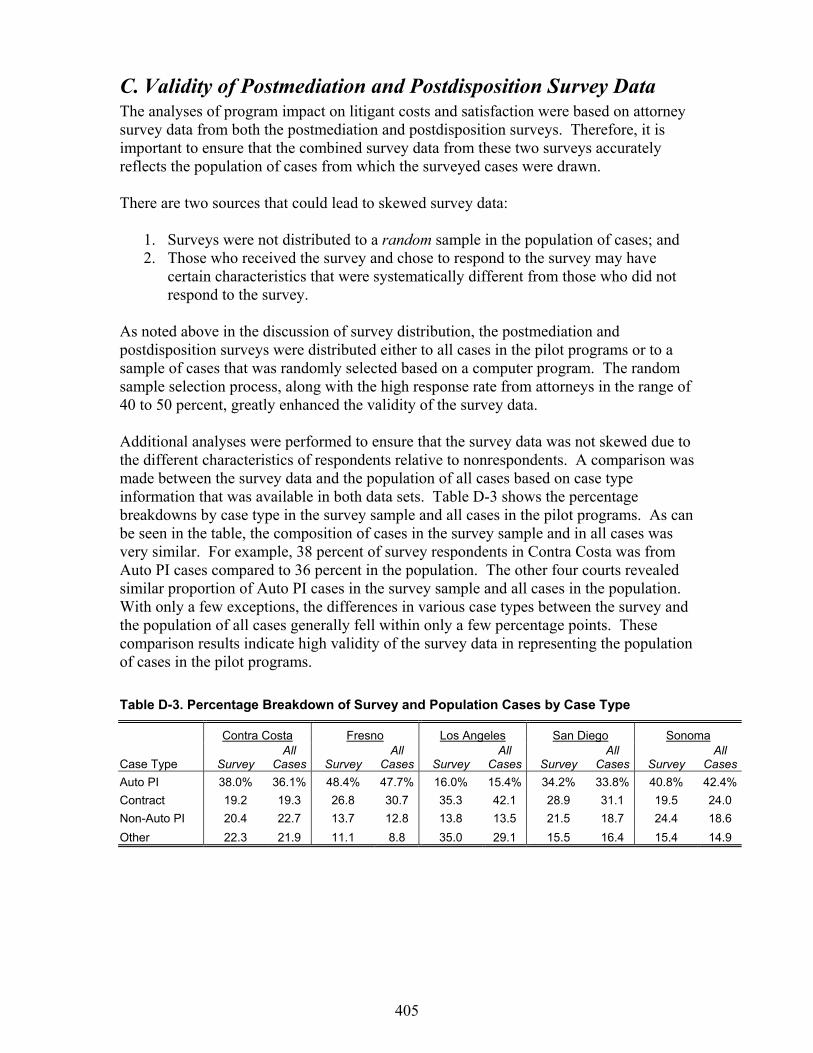
405
C. Validity of Postmediation and Postdisposition Survey Data The analyses of program impact on litigant costs and satisfaction were based on attorney survey data from both the postmediation and postdisposition surveys. Therefore, it is important to ensure that the combined survey data from these two surveys accurately reflects the population of cases from which the surveyed cases were drawn. There are two sources that could lead to skewed survey data:
1. Surveys were not distributed to a random sample in the population of cases; and 2. Those who received the survey and chose to respond to the survey may have
certain characteristics that were systematically different from those who did not respond to the survey.
As noted above in the discussion of survey distribution, the postmediation and postdisposition surveys were distributed either to all cases in the pilot programs or to a sample of cases that was randomly selected based on a computer program. The random sample selection process, along with the high response rate from attorneys in the range of 40 to 50 percent, greatly enhanced the validity of the survey data. Additional analyses were performed to ensure that the survey data was not skewed due to the different characteristics of respondents relative to nonrespondents. A comparison was made between the survey data and the population of all cases based on case type information that was available in both data sets. Table D-3 shows the percentage breakdowns by case type in the survey sample and all cases in the pilot programs. As can be seen in the table, the composition of cases in the survey sample and in all cases was very similar. For example, 38 percent of survey respondents in Contra Costa was from Auto PI cases compared to 36 percent in the population. The other four courts revealed similar proportion of Auto PI cases in the survey sample and all cases in the population. With only a few exceptions, the differences in various case types between the survey and the population of all cases generally fell within only a few percentage points. These comparison results indicate high validity of the survey data in representing the population of cases in the pilot programs. Table D-3. Percentage Breakdown of Survey and Population Cases by Case Type
Contra Costa Fresno Los Angeles San Diego Sonoma
Case Type Survey All
Cases Survey All
Cases Survey All
Cases Survey All
Cases Survey All
CasesAuto PI 38.0% 36.1% 48.4% 47.7% 16.0% 15.4% 34.2% 33.8% 40.8% 42.4%Contract 19.2 19.3 26.8 30.7 35.3 42.1 28.9 31.1 19.5 24.0 Non-Auto PI 20.4 22.7 13.7 12.8 13.8 13.5 21.5 18.7 24.4 18.6 Other 22.3 21.9 11.1 8.8 35.0 29.1 15.5 16.4 15.4 14.9
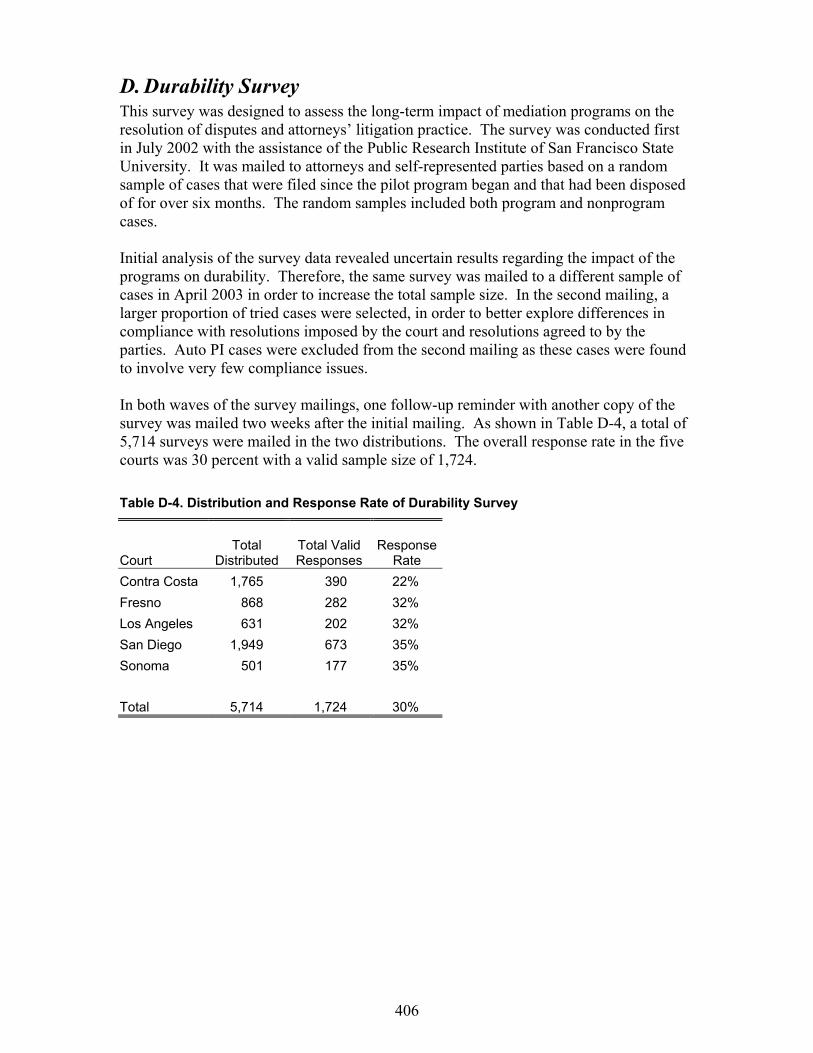
406
D. Durability Survey This survey was designed to assess the long-term impact of mediation programs on the resolution of disputes and attorneys’ litigation practice. The survey was conducted first in July 2002 with the assistance of the Public Research Institute of San Francisco State University. It was mailed to attorneys and self-represented parties based on a random sample of cases that were filed since the pilot program began and that had been disposed of for over six months. The random samples included both program and nonprogram cases. Initial analysis of the survey data revealed uncertain results regarding the impact of the programs on durability. Therefore, the same survey was mailed to a different sample of cases in April 2003 in order to increase the total sample size. In the second mailing, a larger proportion of tried cases were selected, in order to better explore differences in compliance with resolutions imposed by the court and resolutions agreed to by the parties. Auto PI cases were excluded from the second mailing as these cases were found to involve very few compliance issues. In both waves of the survey mailings, one follow-up reminder with another copy of the survey was mailed two weeks after the initial mailing. As shown in Table D-4, a total of 5,714 surveys were mailed in the two distributions. The overall response rate in the five courts was 30 percent with a valid sample size of 1,724. Table D-4. Distribution and Response Rate of Durability Survey
Court Total
Distributed Total Valid Responses
Response Rate
Contra Costa 1,765 390 22% Fresno 868 282 32% Los Angeles 631 202 32% San Diego 1,949 673 35% Sonoma 501 177 35% Total 5,714 1,724 30%
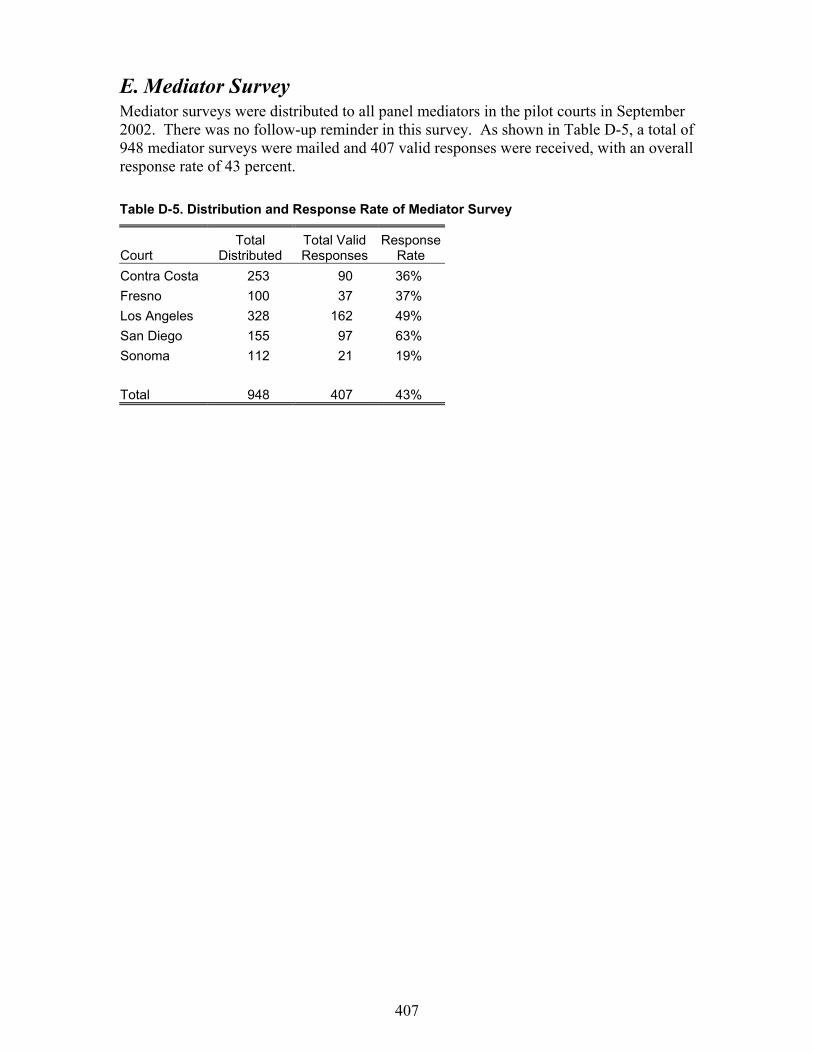
407
E. Mediator Survey Mediator surveys were distributed to all panel mediators in the pilot courts in September 2002. There was no follow-up reminder in this survey. As shown in Table D-5, a total of 948 mediator surveys were mailed and 407 valid responses were received, with an overall response rate of 43 percent. Table D-5. Distribution and Response Rate of Mediator Survey
Court Total
Distributed Total Valid Responses
Response Rate
Contra Costa 253 90 36% Fresno 100 37 37% Los Angeles 328 162 49% San Diego 155 97 63% Sonoma 112 21 19% Total 948 407 43%

408
F. Judge Time Survey The judge time survey was an informal survey asking for judges’ assistance in providing an estimate of the amount of time they spend on various court event. It is not intended to be a comprehensive and rigorous accounting of judges’ allocation of time. The surveys were distributed in May 2003 and in October 2003 to judges in the pilot courts whose caseload during the program period included civil cases. The survey was anonymous and there was no follow-up procedures adopted to track the response rates. Overall, a total of 14 responses were received from all the pilot courts.