Embed Size (px)
Citation preview
DI
SC
US
SI
ON
P
AP
ER
S
ER
IE
S
Forschungsinstitut zur Zukunft der ArbeitInstitute for the Study of Labor
Evaluation of the Impact of the Mother and Infant Health Project in Ukraine
IZA DP No. 4593
November 2009
Olena Y. NizalovaMaria Vyshnya
Evaluation of the Impact of the Mother
and Infant Health Project in Ukraine
Olena Y. Nizalova Kyiv Economics Institute,
Kyiv School of Economics and IZA
Maria Vyshnya Kyiv Economics Institute and
National University “Kyiv Mohyla Academy”
Discussion Paper No. 4593 November 2009
IZA
P.O. Box 7240 53072 Bonn
Germany
Phone: +49-228-3894-0 Fax: +49-228-3894-180
E-mail: [email protected]
Any opinions expressed here are those of the author(s) and not those of IZA. Research published in this series may include views on policy, but the institute itself takes no institutional policy positions. The Institute for the Study of Labor (IZA) in Bonn is a local and virtual international research center and a place of communication between science, politics and business. IZA is an independent nonprofit organization supported by Deutsche Post Foundation. The center is associated with the University of Bonn and offers a stimulating research environment through its international network, workshops and conferences, data service, project support, research visits and doctoral program. IZA engages in (i) original and internationally competitive research in all fields of labor economics, (ii) development of policy concepts, and (iii) dissemination of research results and concepts to the interested public. IZA Discussion Papers often represent preliminary work and are circulated to encourage discussion. Citation of such a paper should account for its provisional character. A revised version may be available directly from the author.
IZA Discussion Paper No. 4593 November 2009
ABSTRACT
Evaluation of the Impact of the Mother and Infant Health Project in Ukraine*
This paper exploits a unique opportunity to evaluate the impact of the quality change in the labor and delivery services on maternal and infant health. Since basic medical care has been universally available in Ukraine, implementation of the Mother and Infant Health Project allows addressing quality rather than quantity effect of medical care. Employing program evaluation methods we find that the administrative units participating in the Project have exhibited greater improvements in both maternal and infant health compared to the control rayons. Among the infant health outcomes, the MIHP impact is most pronounced for infant mortality resulted from deviations in perinatal period and respiratory system failures. As for the maternal health, the MIHP is the most effective at addressing anemia, blood circulation, and urinary-genital system complications, as well as late toxicosis. The analysis suggests that the effects are due to early attendance of antenatal clinics, lower share of C-sections, and greater share of normal deliveries, and these effects are causal. Preliminary cost-effectiveness analysis shows enormous benefit per dollar spent on the project: the cost to benefit ratio is one to 122 taking into account both maternal and infant lives saved as well as cost savings due to changes in labor and delivery practices. JEL Classification: I12, I18 Keywords: maternal health, maternal mortality, infant health, infant mortality, prenatal care Corresponding author: Olena Y. Nizalova 13 Yakira Str. Suite 320 Kyiv, 04119 Ukraine E-mail: [email protected]
* This research has been funded by the Global Development Network and the Bill & Melinda Gates Foundation, within the GDNs Fifth Global Research Project “Promoting Innovative Programs from the Developing World: Towards Realizing the Health MDGs in Africa and Asia.” The views expressed by the authors do not necessarily reflect those of the funding bodies. The authors would like to thank Nancy Quian, Andrew Jones, Jeffrey Smith, Lyn Squire, and the GDN project management team for their valuable comments and suggestions during the January 2009 GDN Project workshop in York, United Kingdom. The authors are also thankful to Helene Lefevre-Cholay and the entire MIHP-Ukraine team for their cooperation and constructive criticism, as well as to Tatiana Nizalova for medical guidance on pregnancy related conditions and outcomes.
1 Introduction
Infant mortality/morbidity has often been a focus of health economics
and medical research as a major indicator of a country’s well-being, while
maternal health outcomes have been much less investigated. Several reasons
are to be named for such a development. One is that the rates of maternal
deaths are quite low in developed countries. And the second is attributed
to the difficulty of measuring maternal health outcomes, the problem that
is most severe in developing countries. Nevertheless, the issue of maternal
health attracts considerable attention of society due to the fact that most of
maternal deaths and health deteriorations are preventable. Moreover, recent
evidence demonstrates that improvements in health outcomes for mothers and
infants are related not as much to the availability of care (structural quality),
but to the way this care is provided (process quality) (Barber and Gertler,
2002). Furthermore, some studies find that access to low quality providers
in fact contributes to higher child morbidity and mortality (Sodemann et al.,
1997).
Notwithstanding the importance of the matter, studies of the impact of
quality of prenatal care and labor and delivery services on maternal and in-
fant health outcomes are quite rare: it is difficult to find a setting that allows
separation of quality from quantity dimension. This paper contributes to
the literature analyzing the impact of exogenous change in the quality of la-
bor and delivery services caused by the Mother and Infant Health Project
(MIHP). Ukrainian setting creates a unique opportunity for an identifica-
tion of this quality impact: (i) unlike the situation in developing countries
(where health initiatives come together with new facilities), participation in
the Project has changed only quality dimension of services, since the basic
prenatal and obstetric care is universally available; (ii) unlike the situation
3
in developed countries (where population health compares favorably to the
rest of the world), the level of maternal and infant health outcomes is quite
poor leaving enough room for improvement and allowing for identification of
the impact; (iii) every maternity regularly reports information on maternal
and infant health outcomes to a regional health administration resulting in
a uniform data set of good quality. In addition, the study investigates the
mechanisms through which reductions in infant and maternal mortality and
morbidity take place via estimating the impact of the MIHP on prenatal care
use, intermediate health outcomes, and mortality components.
Using difference-in-difference methodology it is found that the MIHP par-
ticipating rayons observe greater improvements in maternal and infant health.
The results indicate that improvements in maternal morbidity (lower preva-
lence of anemia, blood circulation system, veins, and urinary-genital compli-
cations) and mortality may be due to earlier attendance of prenatal clinics,
increased rate of normal deliveries, and reduction in the rate of C-sections.
The same channels may be leading to improvements in infant health: the
MIHP participation significantly reduces total infant mortality through the
reductions in infant mortality resulted from deviations in perinatal period
and respiratory system failures.
The paper is structured as follows. Next section describes the system of
health care in Ukraine, the Mother and Infant Health Project, and provides an
overview of related literature. Section three focuses on the empirical method-
ology followed by the descriptive analysis in Section four. Basic estimation
results are offered in Section five. Section six follows with the robustness
checks and discussion. Cost-Benefit considerations are presented in Section
seven. Section eight concludes.
4
2 Background
2.1 Health Care System and Maternal Health Services in Ukraine
The right for free health care is one of the basic Constitutional rights in
Ukraine (Article 49). And, although the informal payments are widespread
(Allin, Davaki, and Mossialos, 2005), certain set of basic services can be
rendered by patients for free, and this is most evident with respect to mater-
nal and infant care. Majority of the health care establishments are publicly
owned and are subordinated to regional administration. By the end of 2000,
Ukraine had more than 24 thousand of health care facilities, including vari-
ous support units like medical statistical centers, medical treatment facilities,
spas, health resorts, blood transfusion centers, etc. At the same time only
about six thousand individuals and about one thousand of legal entities had
been licensed to practice medicine independently (Lekhan, Rudiy, and Nolte,
2004). According to the same source, only about 2% of the population had
medical insurance, although this number has been growing with the improve-
ment of economic conditions up to year 2008. However, the trend is likely to
reverse in the face of the current economic crisis. According to the Ministry
of Health Report the overall health care financing in year 2007 comprised
3.9% of the GDP compared to the 3.3% in year 2006 (MHCU, 2007), which
is considerably lower than in the EU and Eastern European countries (OECD
average is 8.9%).1
The network of reproductive facilities consists of maternities (approxi-
mately one per rayon2) and women’s clinics (about 1-3 per rayon) as well
1OECD Health Data 2009, www.oecd.org/health/healthdata.2Administratively, Ukraine consists of 25 large units - “oblast” - (including the Autonomous Republic
Crimea), and 2 cities of the country subordination (Kyiv and Sevastopol). An oblast consists of about 13-46small administrative units - “rayons”. Rural units as well as small towns are subject to rayon governance,while large towns and cities are subordinated to oblasts.
5
as pediatric clinics. Women’s clinics specialize in antenatal care including
(i) monthly patronage of pregnant women, (ii) routine tests (blood, pres-
sure, and urine) and measurements (weight and height), (iii) prevention of
complications during pregnancy, and (iv) family planning counseling. Rayon
maternities address delivery and postpartum issues, while oblast maternities
focus on complicated labor and delivery cases (those with severe anemia,
diseases of urinary-genital, blood circulation systems, etc.). Pediatric clinics
provide regular infant care including vaccination and routine monitoring in
the first year of life and thereafter as need arises.
2.2 Mother and Infant Health Project Description
The Mother and Infant Health Project (MIHP)3 is an eight-year project
advocating evidence-based medical practices aimed at improvement of
women’s reproductive and newborns’ health. With funding from the US-
AID and private sources, and with the support from the Ministry of Health
of Ukraine, the project is being implemented by the JSI Research and Train-
ing Institute. The first phase of the project has been initiated in Septem-
ber 2002 in four regions of Ukraine, but first four maternities have actually
joined the Project in mid-December 2003. By the end of 2006 the Project
expanded to 20 maternity hospitals in twelve pilot regions. Following the Mil-
lennium Development Goals for the country (MEU, 2005), the MIHP pioneers
to introduce new evidence-based medicine (EBM) standards: partner deliv-
eries; avoidance of unnecessary C-sections, amniotomies and episiotomies;
use of free position during delivery; immediate skin-to-skin contact; early
breastfeeding; and the rooming-in of mothers and newborns. In addition,
the Project actively supports the provision of trainings on effective perinatal
3http://www.mihp.com.ua/english/Home/homepage.html
6
technologies for the staff of the MIHP maternities, development of “cen-
ters of excellence” that serve as models in training/education of the medical
practitioners of the corresponding oblast, and organizing health awareness
campaign on healthy lifestyles.
The MIHP also aims to reinforce liaisons with local governmental institu-
tions. The Project works on integration of EBM standards into a package of
perinatal practices throughout Ukraine. It also targets revision of the cur-
rent curricula for medical universities and colleges in order to increase the
evidence base of educational programs for medical students and health care
providers.
The MIHP in Ukraine belongs to a family of maternal and infant health
improving initiatives throughout the world and builds upon their experience,
JSI MotherCare4 (1998-2000) being the largest among them. However, the
MIHP in Ukraine is unique both with respect to the institutional setting
and to its scope and length. Most of the earlier projects implemented by
the JSI have mainly focused on specific issues (e.g. pregnancy of adolescent
girls in Uganda and Zambia, anemia in Malawi) and have been short-term
(the longest have been two-year projects in Egypt, Pakistan, and Zambia).
Studying the MIHP impact in Ukraine has three advantages: (i) evaluation
of the change in the quality of services in a setting where the access to ba-
sic services has not changed, (ii) identification of the dynamics in the effect
of the MIHP participation over time, and (iii) documentation of the path-
ways through which the effect manifests itself by analyzing various final and
intermediate outcomes.
4http://www.jsi.com/JSIInternet/Publications/women.cfm
7
2.3 Related Literature
Although it is obvious that the determinants of maternal and infant health
are closely related, there are very few works where the issue of maternal
and infant health is considered jointly (Winikoff, 1988; Conway and Kuti-
nova, 2006). Moreover, most of the economic literature (both theoretical and
empirical, likewise in developed and developing countries) focuses on infant
health almost completely ignoring the issue of maternal health. Similar trend
has been observed in the medical literature (AbouZahr, 2003). Two reasons
are to be named for such a phenomena. One is that the rates of maternal
death are quite low in developed countries. And the second is attributed
to the difficulty of measuring maternal health outcomes, especially in devel-
oping countries. Nevertheless, even in the developed nations with their low
maternal mortality ratios (which are 2-3 time lower than those in Ukraine)
this issue draws considerable attention due to the fact that most of these
rare deaths are preventable. Moreover, as Haas, Udvarhelyi, and Epstein
(1993) claim “60 percent of women receive medical care for some complica-
tion of pregnancy and 30 percent suffer complications that result in serious
morbidity” (as cited in Conway and Kutinova (2006)).
MIHP is a program that targets quality of labor and delivery services
directly as well as quality of prenatal care indirectly, since most of the ob-
stetricians in Ukraine have joint appointments in maternities and antenatal
clinics. Therefore the expected impact of the MIHP can be inferred from ear-
lier literature on impact of antenatal and obstetric care. Antenatal care can
reduce maternal mortality and morbidity both directly, through detection
and treatment of pregnancy-related or intercurrent illnesses, and indirectly,
through detection of women at increased risk of complications of delivery
and referring them to a suitably equipped facility (Oxaal and Baden, 1996).
8
Analysis of historical data shows that a significant fall in maternal mortal-
ity ratios in the UK and the USA can be attributed to improved obstetric
care. In particular, Carroli, Rooney, and Villar (2001) emphasize that bet-
ter delivery care significantly reduces maternal mortality from infections and
hemorrhage. Laditka et al. (2005) in turn suggest that adequate prenatal care
may reduce potentially avoidable maternity complications. However, other
authors underline that the impact of prenatal care and/or certain interven-
tions during pregnancy is more difficult to assess due to a large number of
confounding factors not observed by researchers (Carroli, Rooney, and Vil-
lar, 2001). At the same time out of the socio-economic factors, only income
has been identified as a significant determinant in reducing the probability
of having a complication (Laditka et al., 2005).
An institutional determinant of infant health outcomes that usually re-
ceives a lot of attention from researchers is health care spending. But empiri-
cal evidence from a cross-country study of developing countries suggests that
the health care spending has no significant effect on child mortality while the
access to health care and the mother and infant health programs do. The
reason for the lack of the impact of spending on mortality may be inexpen-
siveness of effective interventions so that “they do not even show up in data
on ... public spending” (McGuire, 2006).
Similarly, using individual level data, Bhalotra (2007) finds no effect of
health care spending. However, when investigating separately the effect on
poor and rural households, spending does play a role in improving infant
health for those groups. Goldman and Grossman (1982) find that health care
spending and public policy programs in the US do have a significant impact
on infant mortality, and argue that this impact runs through improvements in
health of mothers, rather than the use of prenatal care per se. The evidence
9
also shows that infant and child mortality and morbidity are determined by
poverty and unemployment rate (Bhalotra, 2007; Currie and Grogger, 2000),
parental education, urban residence, and maternal health in general (Buckley,
2003; Chou et al., 2007).
It is common in health economics research to find little or no effect of pre-
natal care on infant health, which may be due to two reasons - endogeneity
and heterogeneity. Mothers anticipating poor birth outcomes are more likely
to seek more prenatal care and seek it earlier while still having poorer than
average outcomes. Authors that use exogenous variation in prenatal care,
such as “natural experiment”, find positive and significant impact of prena-
tal care use on birth outcomes (Evans and Lien, 2005). Conway and Deb
(2005) in addition to addressing the issue of endogeneity explore the possible
heterogeneity in the impact of prenatal care on birth outcomes. Looking at
all births simultaneously may obscure the effect of prenatal care on “nor-
mal” births. Some of the births result in poor outcomes due to bad maternal
behavior or poor fetus condition to begin with and cannot be remedied by
any prenatal care intervention. Therefore, lack of significant impact of pre-
natal care on infant health may be explained by data that do not distinguish
between “normal” and “problematic” pregnancies. Thus, Conway and Deb
(2005) find that prenatal care has a substantial effect on “normal” pregnan-
cies.
Despite serious shortcomings, such as misclassification of deaths and diffi-
culties with registering severe impairments related to pregnancies and births,
but not resulting into death outcomes, most common measure used in the
literature relying on statistical evidence is maternal mortality. With respect
to infant health outcomes, in addition to various measures of infant mortality
(e.g. perinatal, early and late neonatal, infant mortality etc.), birth weight
10
and early onset of breastfeeding are also used, although the latter outcome
measure is less common. However, for example birth weight is left beyond the
scope of this study merely because the data set contains too many missing
observations to allow for meaningful conclusions on that outcome.
Current study contributes to the literature in two ways: (i) by evaluating
causal impact of quality of labor and delivery services, (ii) by studying a wide
range of maternal and infant health outcomes simultaneously and identifying
the mechanism through which the MIHP impact manifests itself, and (iii) by
decomposing the impact of the MIHP over time since the start of the project.
The outcomes studied include those usually used in the literature, but also
a wide range of morbidity outcomes related to various complications in both
mothers and infants, and intermediate outcomes, such as a rate of C-sections
and an early onset of prenatal care. Concerning potential misreporting for
infant health outcomes in the Soviet Union and the NIS countries documented
in early studies (Brainerd, 2006; Anderson and Silver, 1986), it should not
have an impact on the results as long as misreporting is unrelated to the
treatment, which is very unlikely.
3 Empirical Strategy
The preliminary insider assessment of the Project shows positive trends in
maternal and infant health outcomes in the participating maternities along
various dimensions: neonatal mortality and morbidity, level of C-sections and
episiotomies, use of individual delivery rooms, companion presence, etc. How-
ever, this insider monitoring does not allow identifying the real effect of the
treatment for two reasons. One is that the Project may have a spillover effect
on the neighboring community, in which case the insider assessment would
11
give an underestimate of the true effect. The other reason is that analyzing
the data at the site of treatment does not allow separating the effect of the
Project from the changes in the outcome measures due to other confounding
factors, in which case it would be an overestimate or an underestimate of the
true effect depending on the sign of the correlation between the confounding
factors, the treatment variable, and the outcome.
Theoretically maternal and infant health (Conway and Kutinova, 2006) de-
pends on health inputs, including such intermediate determinants as prenatal
care and access to health services (McCarthy and Maine, 1992), mother and
infant health endowments, and socio-economic characteristics (distant deter-
minants). However, in the empirical specification we omit all of these vari-
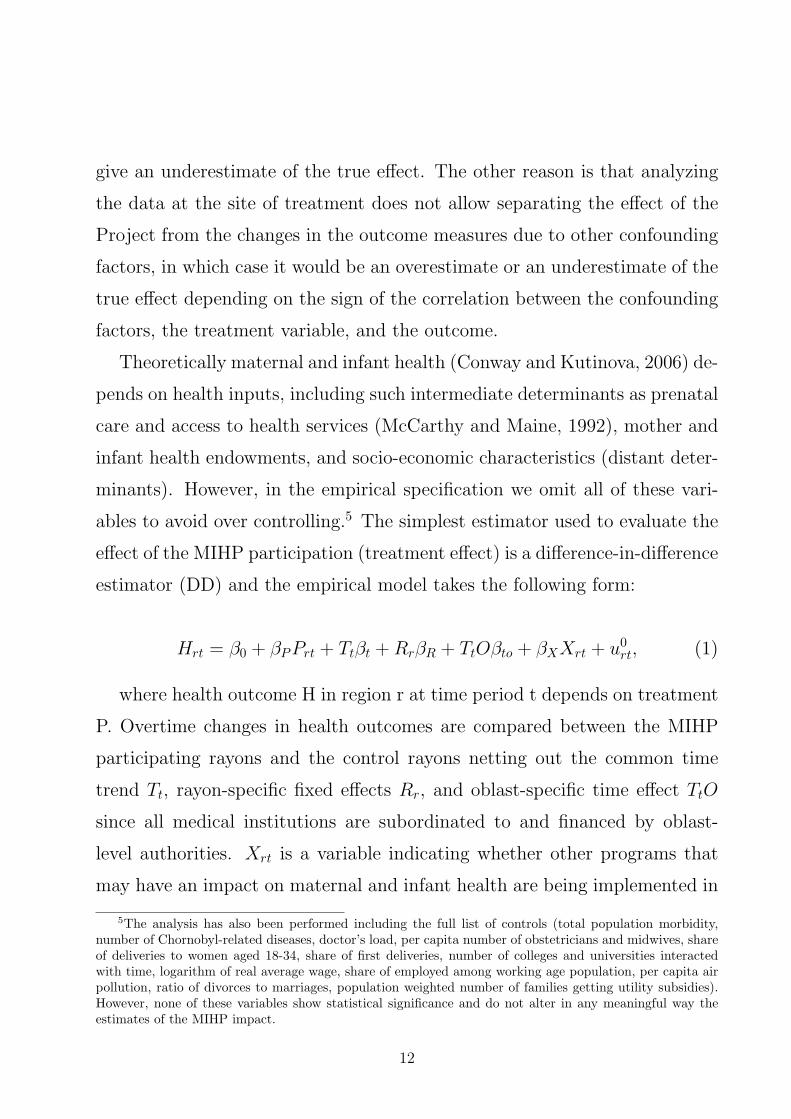
ables to avoid over controlling.5 The simplest estimator used to evaluate the
effect of the MIHP participation (treatment effect) is a difference-in-difference
estimator (DD) and the empirical model takes the following form:
Hrt = β0 + βPPrt + Ttβt + RrβR + TtOβto + βXXrt + u0rt, (1)
where health outcome H in region r at time period t depends on treatment
P. Overtime changes in health outcomes are compared between the MIHP
participating rayons and the control rayons netting out the common time
trend Tt, rayon-specific fixed effects Rr, and oblast-specific time effect TtO
since all medical institutions are subordinated to and financed by oblast-
level authorities. Xrt is a variable indicating whether other programs that
may have an impact on maternal and infant health are being implemented in
5The analysis has also been performed including the full list of controls (total population morbidity,number of Chornobyl-related diseases, doctor’s load, per capita number of obstetricians and midwives, shareof deliveries to women aged 18-34, share of first deliveries, number of colleges and universities interactedwith time, logarithm of real average wage, share of employed among working age population, per capita airpollution, ratio of divorces to marriages, population weighted number of families getting utility subsidies).However, none of these variables show statistical significance and do not alter in any meaningful way theestimates of the MIHP impact.
12
a rayon in a particular year 6. It should be mentioned that these programs are
rather different from the MIHP. Most of them are associated with significant
financial contributions, provision of new expensive equipment, etc., while the
MIHP emphasizes low cost of quality improvements. This makes it absolutely
necessary to control for the effect of these other programs and attempts to
compare it to the MIHP impact. In order to account for the remaining serial
correlation, the standard errors are clustered at the rayon level (Kezdi, 2004;
Stock and Watson, 2008).
In such a setting, the estimate of βP for the treatment dummy (MIHP
participating rayon) gives us the difference-in-difference (DD) estimate of the
treatment effect of the MIHP participation. However, this estimate may be
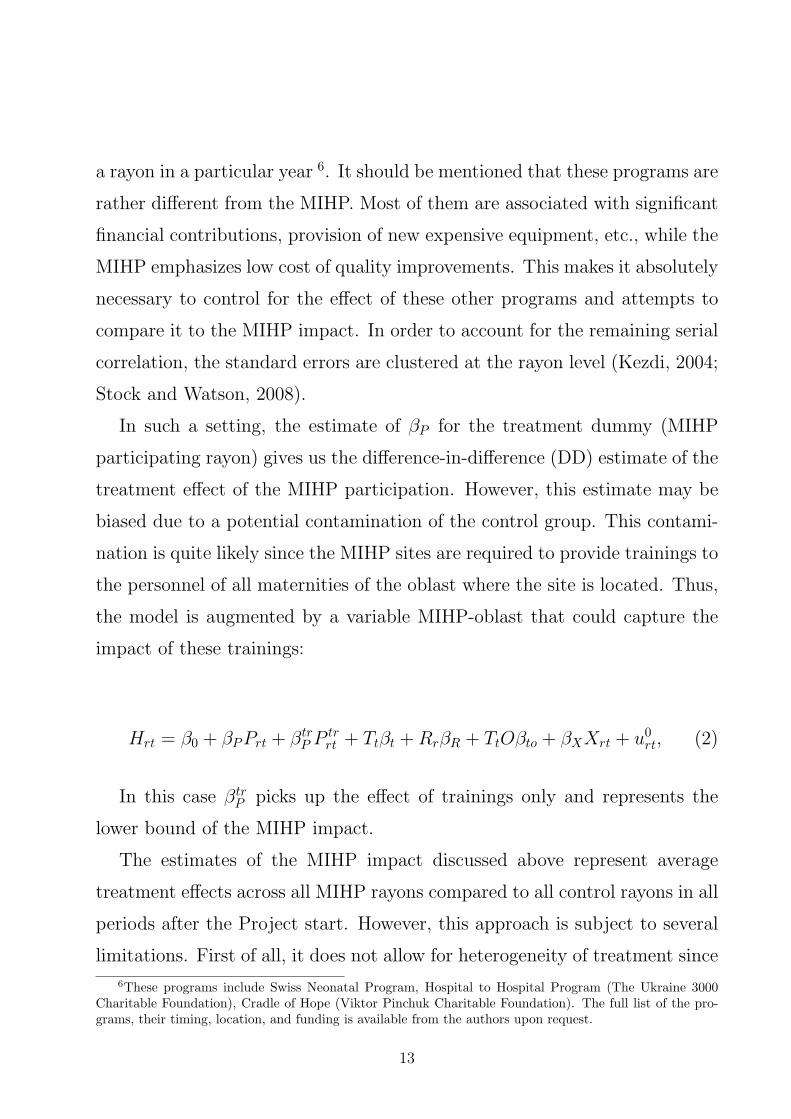
biased due to a potential contamination of the control group. This contami-
nation is quite likely since the MIHP sites are required to provide trainings to
the personnel of all maternities of the oblast where the site is located. Thus,
the model is augmented by a variable MIHP-oblast that could capture the
impact of these trainings:
Hrt = β0 + βPPrt + βtr
PP tr
rt+ Ttβt + RrβR + TtOβto + βXXrt + u0
rt, (2)
In this case βtr
Ppicks up the effect of trainings only and represents the
lower bound of the MIHP impact.
The estimates of the MIHP impact discussed above represent average
treatment effects across all MIHP rayons compared to all control rayons in all
periods after the Project start. However, this approach is subject to several
limitations. First of all, it does not allow for heterogeneity of treatment since
6These programs include Swiss Neonatal Program, Hospital to Hospital Program (The Ukraine 3000Charitable Foundation), Cradle of Hope (Viktor Pinchuk Charitable Foundation). The full list of the pro-grams, their timing, location, and funding is available from the authors upon request.
13

various components of the Project may be implemented in stages. Second, it
does not account for a possibility that the Project impact may depend on the
duration of participation. Finally, it does not refute the possibility that the
MIHP maternities are systematically different from the control group prior
to the treatment and whether this difference has an impact on the validity
of the Project impact estimates. To tackle these issues the MIHP indicator
in Equation (1) is replaced with a set of variables reflecting the timing of
the Project implementation: (T−3,T−2,T−1,T1,T2,T3). All these variables are
equal to zero for the control group outcomes and 1 for the treatment group at
various stages of the Project implementation: three years before, two years
before, one year before, one year after the Project start-up, two years after,
three and more years after respectively.
However, there still exists a possibility that the resulting estimates may
not reflect the true treatment effect, since the rayons could have experienced
other health affecting initiatives implemented simultaneously with the MIHP.
Thus, the estimated treatment effect of the MIHP would be upward-biased if
other initiatives’ influence on maternal and infant health outcomes is positive
and downward-biased otherwise. Triple difference procedure is usually used
in the literature to address this problem. However, it is impossible to directly
apply it in the current setting since most of the outcomes used in the study
are related to infants and females of fertile age only. Consequently, two
alternative estimation procedures are utilized as tests for the validity of the
DD strategy.
The first procedure applies the model described in Equation (1) to the
pregnancy unrelated (placebo) outcomes (e.g. prevalence of diabetes, hep-
atitis, etc.). Lack of statistically significant health improving effect on these
outcomes would confirm the validity of the DD estimates of the MIHP impact
14
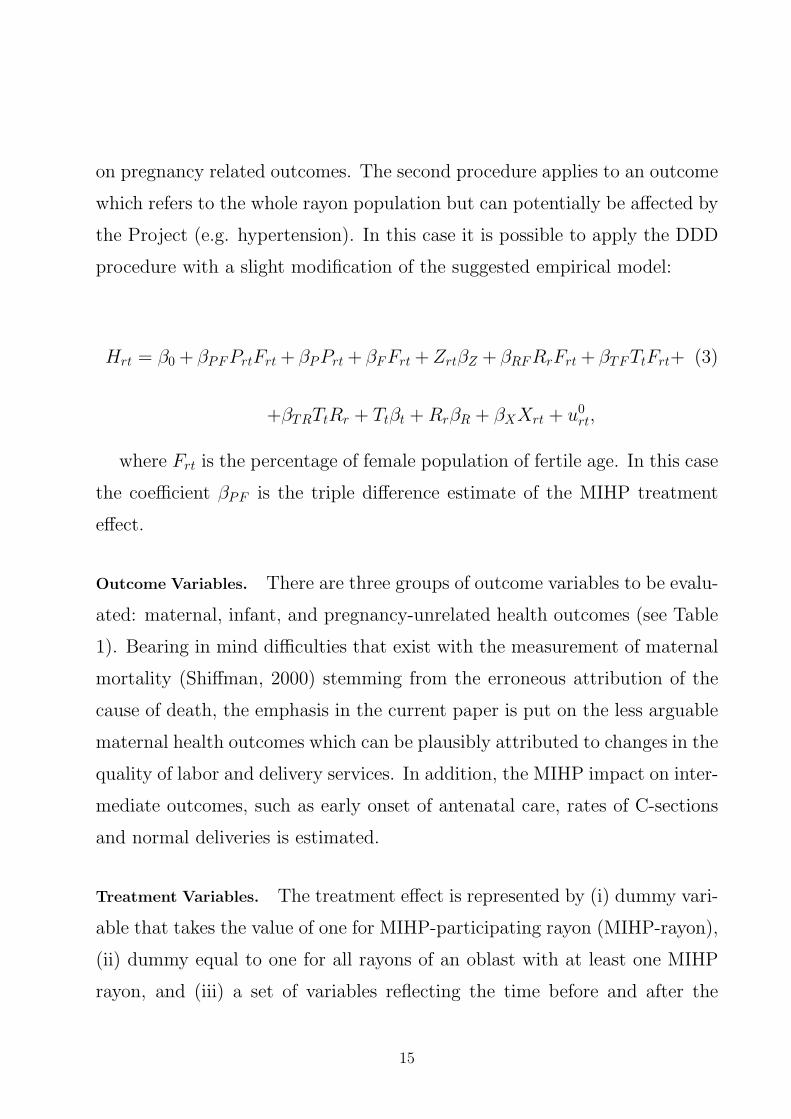
on pregnancy related outcomes. The second procedure applies to an outcome
which refers to the whole rayon population but can potentially be affected by
the Project (e.g. hypertension). In this case it is possible to apply the DDD
procedure with a slight modification of the suggested empirical model:
Hrt = β0 + βPFPrtFrt + βPPrt + βFFrt + ZrtβZ + βRFRrFrt + βTFTtFrt+ (3)
+βTRTtRr + Ttβt + RrβR + βXXrt + u0rt,
where Frt is the percentage of female population of fertile age. In this case
the coefficient βPF is the triple difference estimate of the MIHP treatment
effect.
Outcome Variables. There are three groups of outcome variables to be evalu-
ated: maternal, infant, and pregnancy-unrelated health outcomes (see Table
1). Bearing in mind difficulties that exist with the measurement of maternal
mortality (Shiffman, 2000) stemming from the erroneous attribution of the
cause of death, the emphasis in the current paper is put on the less arguable
maternal health outcomes which can be plausibly attributed to changes in the
quality of labor and delivery services. In addition, the MIHP impact on inter-
mediate outcomes, such as early onset of antenatal care, rates of C-sections
and normal deliveries is estimated.
Treatment Variables. The treatment effect is represented by (i) dummy vari-
able that takes the value of one for MIHP-participating rayon (MIHP-rayon),
(ii) dummy equal to one for all rayons of an oblast with at least one MIHP
rayon, and (iii) a set of variables reflecting the time before and after the
15
start-up of the Project in the treatment rayons.7
4 Data and Descriptive Analysis
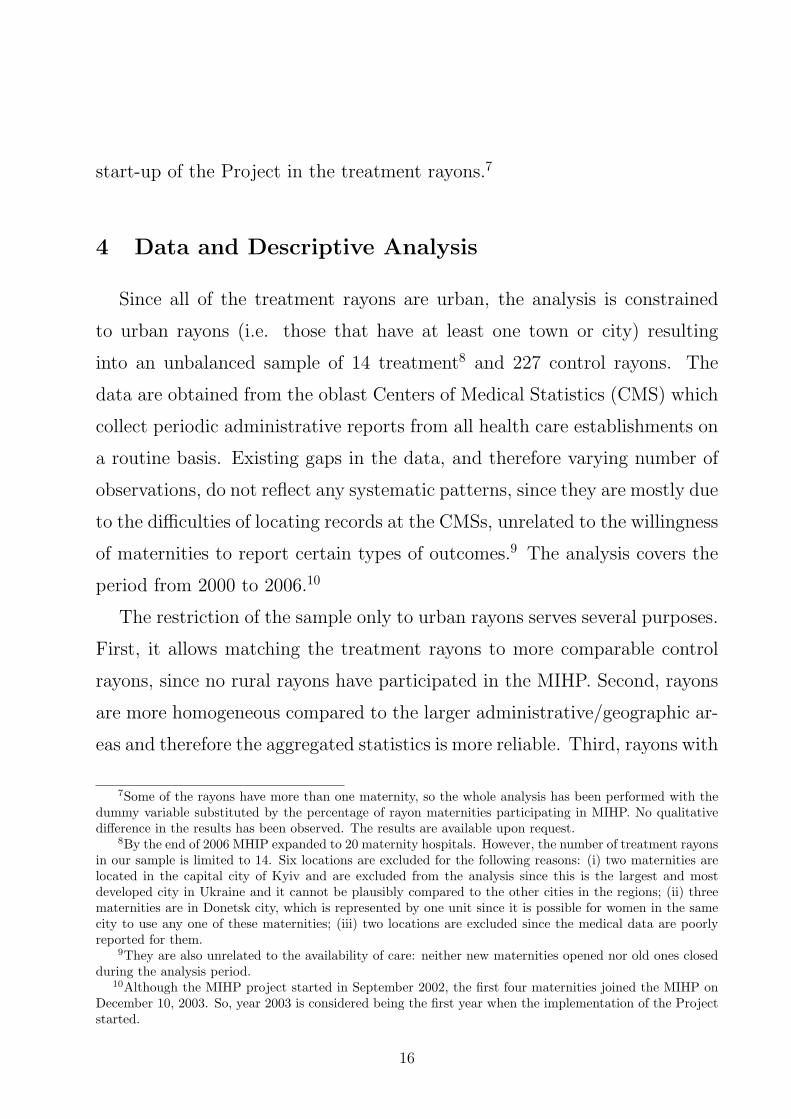
Since all of the treatment rayons are urban, the analysis is constrained
to urban rayons (i.e. those that have at least one town or city) resulting
into an unbalanced sample of 14 treatment8 and 227 control rayons. The
data are obtained from the oblast Centers of Medical Statistics (CMS) which
collect periodic administrative reports from all health care establishments on
a routine basis. Existing gaps in the data, and therefore varying number of
observations, do not reflect any systematic patterns, since they are mostly due
to the difficulties of locating records at the CMSs, unrelated to the willingness
of maternities to report certain types of outcomes.9 The analysis covers the
period from 2000 to 2006.10
The restriction of the sample only to urban rayons serves several purposes.
First, it allows matching the treatment rayons to more comparable control
rayons, since no rural rayons have participated in the MIHP. Second, rayons
are more homogeneous compared to the larger administrative/geographic ar-
eas and therefore the aggregated statistics is more reliable. Third, rayons with
7Some of the rayons have more than one maternity, so the whole analysis has been performed with thedummy variable substituted by the percentage of rayon maternities participating in MIHP. No qualitativedifference in the results has been observed. The results are available upon request.
8By the end of 2006 MHIP expanded to 20 maternity hospitals. However, the number of treatment rayonsin our sample is limited to 14. Six locations are excluded for the following reasons: (i) two maternities arelocated in the capital city of Kyiv and are excluded from the analysis since this is the largest and mostdeveloped city in Ukraine and it cannot be plausibly compared to the other cities in the regions; (ii) threematernities are in Donetsk city, which is represented by one unit since it is possible for women in the samecity to use any one of these maternities; (iii) two locations are excluded since the medical data are poorlyreported for them.
9They are also unrelated to the availability of care: neither new maternities opened nor old ones closedduring the analysis period.
10Although the MIHP project started in September 2002, the first four maternities joined the MIHP onDecember 10, 2003. So, year 2003 is considered being the first year when the implementation of the Projectstarted.
16

urban settlements are large enough to make it less likely that the individuals
living in the area would seek care outside the rayon.11
Sample Description. In the pre-treatment period the MIHP rayons are in
general characterized by poorer population health outcomes. Tables 2-3 pro-
vide summary statistics comparing the difference between MIHP and non-
MIHP rayons in year 2000 (pre-treatment period) and year 2006. For many
of the outcomes but a few there is no statistically significant difference be-
tween treatment and control rayons. Among those few outcomes that show
significant difference in the pre-treatment period are C-sections, late toxico-
sis, as well as complications related to the thyroid gland system for maternal
health, and stillbirths, perinatal, early neonatal mortality, infant mortality
due to perinatal deviations, infant morbidity due to respiratory system prob-
lems and congenital anomalies for infant health. However, for all these out-
comes the non-MIHP rayons compare more favorably to the treatment rayons.
This confirms that the selection into the MIHP is based on poor outcomes
suggesting that the estimates of the MIHP impact should be considered as
a lower bound since the selection on poorer pre-treatment outcomes leads to
an underestimation of the treatment effect.
Despite the pessimistic pre-project health conditions, after the implemen-
tation of the MIHP the majority of the maternal and infant health outcomes
have improved. Over the period from 2000 to 2006 a sharp decrease in mater-
nal mortality (from 24 to 4 in the MIHP rayons) and a drastic decline of the
full set of maternal morbidity indicators are observed. The total infant mor-
tality rate, which in 2000 exceeds the non-MHIP indicator by 2, has declined
from about 14 to 9 cases per 1000 live births, and is no longer statistically
11To test the last argument, a robustness check for the whole range of outcomes is performed on a set ofrayons that consist of oblast-subordinated cities (metropolitan areas). The results are discussed further.
17
different from the non-MIHP sites in year 2006. The only outcome that has
worsened is the percent of C-sections, for both MIHP and non-MIHP rayons,
which is an unexpected result. However, these are only simple comparisons
of means and they do not account for other factors that could have influenced
the outcomes.
5 Estimation Results
Maternal Health. Table 4 shows the impact of the MIHP and other programs
on the maternal health outcomes. The treatment variable is measured as an
indicator equal to one for the MIHP participating rayons in all time periods
after they joined the Project. Therefore, the estimated coefficient shows av-
erage treatment effect for all MIHP-participating rayons in all periods. As
could be seen from Column (1), the difference-in-difference estimate of the
MIHP impact is health improving for most outcomes, including intermediate
ones: women in the MIHP participating rayons are more likely to have nor-
mal deliveries and attend antenatal clinics prior to 12 weeks of gestation, and
are less likely to have C-sections. With respect to the complications related
to pregnancies, labor and delivery, as well as postpartum period, mothers
in the MIHP-participating rayons are less likely to experience anemia, prob-
lems with the blood circulation system, and late toxicosis. In line with the
explanations in Conway and Deb (2005), no effect is found on the problem-
atic12 and abnormal13 deliveries. This also indicates absence of selection of
healthier patients in the MIHP maternities after the start of the Project.
12Deliveries exhibiting ex ante deviations from the “norm” such as improper position of a fetus (face orbreech presentation), abnormally small pelvis, etc.
13Deliveries are classified as “abnormal” if a healthy woman suddenly experiences abnormal labor activi-ties, e.g.abrupt finish of labor pains during an active labor phase, too quick/too slow labor, uterus distortionsetc.
18
Family Planning. The lower part of Table 4 reveals positive effect of the
MIHP participation on abortion rates and on use of contraceptive pills, al-
though the effect disappears once the MIHP oblast effect is controlled for
(Columns (3)-(5) of Table 4). Nevertheless some positive impact on the
abortion rates may occur for at least two reasons. First, it may be suggestive
of the better and earlier diagnostics leading to abortions of defective fetus.
Second, women may become aware of better services provided in the MIHP
sites and therefore be attracted there for all kinds of procedures including
abortions. It would be interesting to evaluate the MIHP impact on abor-
tion measures by gestation age and types, but unfortunately such data is not
available at the moment.
Infant Health. As could be seen from Table 5, the MIHP impact on infant
mortality (total, stillbirths, and perinatal) is negative and statistically sig-
nificant. The evidence suggests that most of this effect is contributed by the
impact of the MIHP participation on infant mortality due to deviations in
perinatal period and congenital anomalies. The effect of the Project on most
other components of infant mortality is negative, but small in magnitude and
not statistically significant.
The lower part of the table presents the estimates of the MIHP impact
on infant morbidity. No significant treatment effect is found for total infant
morbidity and the only component of it being affected is morbidity due to
deviations in perinatal period. The effect is quite large in magnitude - average
treatment effect is a 12 percent decline compared to the baseline value of the
outcome (-0.43 reduction from 3.53 diseases per 100 infants in year 2000).
19
6 Robustness Checks and Discussion
To address various concerns related to the contamination of the control
group and causality of the MIHP impact, three variations to the basic spec-
ification have been pursued: (i) accounting for the trainings provided to the
medical personnel of the same oblast, (ii) exploration of the MIHP impact
over time, including pre-MIHP period, and (iii) estimation of the MIHP im-
pact on pregnancy unrelated (placebo) outcomes, including a triple difference
procedure.
Effect of MIHP Trainings. Columns (3) through (5) in Tables 4-5 show the es-
timates from the maternal and infant health regressions including the spillover
effect on the same oblast maternities which can be interpreted as the effect of
the MIHP trainings, the lower bound of the overall MIHP impact. As could
be seen, the MIHP impacts on most maternal health outcomes in Column
(3) become stronger what is expected in the case of addressing the issue of
contamination of the control group. At the same time, for infant health,
most of the estimates of the direct impact become statistically insignificant,
while the effect on infant mortality due to respiratory system failures and
perinatal deviations becomes stronger. For some outcomes (maternal mor-
tality, normal deliveries, and anemia) there exists a significant effect of the
MIHP trainings, although it is about twice smaller in magnitude for normal
deliveries and anemia, than the direct MIHP impact.
MIHP Effect Over Time. As Tables 6-7 show in most cases there is no sig-
nificant difference between treatment and control rayons in the years prior
to the Project implementation. This points to the causality of the MIHP
impact with respect to all of the maternal health outcomes. However, with
20
respect to the infant health, the situation is more complicated. For example,
contrary to the earlier descriptive results, the MIHP rayons have compared
favorably to the control rayons in perinatal, early and late neonatal, and
total infant mortality even long before the Project start. At the same time
the difference almost doubles after the start of the Project for total infant
mortality indicating some presence of the Project impact but substantially
undermining the confidence in the causality of these effects. At the same
time, there is a clear causal effect of the Project on infant mortality due to
deviations in perinatal period and respiratory system failures.
Another dimension that the reported estimates uncover is the dependence
of the MIHP impact on time. For example, share of normal deliveries in-
creases in the year of the Project start-up, the increase is even more pro-
nounced in the year after and decreases afterwards.14 The situation is dif-
ferent for C-sections, late toxicosis, anemia, and blood circulation system
complications - the health-improving effect seems to be almost linear over
time. As to the infant health, the MIHP impact increases over time for total
infant mortality and is slightly decreasing for infant mortality due to perinatal
deviations and respiratory system failures.
MIHP Effect on Placebo Outcomes. Table 8 presents the estimates of the
impact of the MIHP participation on placebo outcomes. As the estimates
indicate, no statistically significant health improving effect is observed for
such pregnancy unrelated outcomes as tuberculosis, diabetes, hepatitis, hy-
pertension, as well as for teenage morbidity. Since the pregnancy-unrelated
outcomes apply to the overall population, it is possible to test them further
14Statistical significance of the impact estimates three years after the start-up of the project may beimpacted to a great extent by small number of cases in this category. This issue shall be addressed in thefollow-up study when there will be relatively more maternities participating in the project more than threeyears.
21
using a triple difference specification in Equation (3). As Table 9 shows, there
is a significant negative impact of the MIHP on two seemingly unrelated out-
comes - hypertension and tuberculosis morbidity, which may be due to an
earlier onset of obstetric care. Somewhat surprising impact on the tuberculo-
sis morbidity may be related to the fact that in Ukraine husbands/partners of
pregnant women are required to have an X-ray exam for tuberculosis before
the delivery.
Of course, the best placebo outcomes would have been the ones which
relate only to men, but they are currently not available. However, this issue
will be addressed in the future work.
Other Selection Issues. Potential problem with the estimates of the MIHP
effect exists in case if the MIHP participating maternities after joining the
Project start selecting less complicated pregnancies, ensuring better outcomes
simply by the composition of the patients. However, as the evidence suggests,
many of the maternities that have joined the Project are second and third
level maternities, which are specially designated to deal with high risk preg-
nancies and therefore are legally obliged to admit all the high risk referrals
from the surrounding areas. Another issue is that the participating materni-
ties after joining the project could have attracted more women which could
have had normal deliveries in any case, leading again to a change in the pool
of patients not related to the MIHP impact. This preposition is tested by
looking at the impact of the MIHP participation on the number of deliveries
and comparing it to the estimates of the MIHP impact on the number of C-
sections, normal deliveries, and problematic deliveries. The estimate of the
impact on the number of deliveries is positive and statistically significant, but
very small in magnitude compared to the estimates for the normal deliveries
22
and C-sections. In addition, as Table 6 shows, the MIHP participating rayons
have always been rayons with a greater number of deliveries than the control
rayons. At the same time the impact on C-sections and normal deliveries
appears only after the start of the Project and therefore could be considered
as causal.
Furthermore, the estimates of the MIHP impact on problematic and abnor-
mal deliveries are not significant in all specifications suggesting lack of selec-
tion or self-selection of patients on potential outcomes. However, to address
the issue of self-selection further, a robustness check for the whole range of
outcomes is performed on a set of rayons that consists of oblast-subordinated
cities (metropolitan areas). Since there are much fewer oblast-subordinated
cities, they are located at quite a distance from each other, reducing the
possibility of massive movement of pregnant women. In addition, these are
larger cities with a better developed infrastructure and are more homoge-
neous in the quality of prenatal and obstetric care. Qualitatively the results
are similar from these regressions (Tables 11-18), but quantitatively they are
much stronger than in the basic analysis.
7 Cost-Benefit Considerations
A comprehensive cost-benefit analysis of the MIHP project is limited, since
the majority of maternal and infant health indicators are hard to assess in
monetary terms (e.g. increase in early neonatal visits of mothers; decrease in
the number of cases of late toxicosis and complicated deliveries; decrease in
infant morbidity due to various reasons etc.). Therefore, we focus on the most
“tangible” cost effectiveness indicators and compare (i) average annual per
maternity cost of the Project and (ii) average annual per maternity “tangible”
23
benefits.
The average annual per maternity cost is about 60,000 USD, and it is
calculated as an overall cost of the first phase of the project - 6 mln USD
- distributed over 20 treatment sites during 2002-2006 when the first MHIP
phase was implemented, including the first year of the Project setup. Set of
“tangible” benefits includes savings due to (i) a switch from C-sections to
vaginal deliveries, (ii) switch away from medicine-intensive ways of leading
both C-sections and vaginal deliveries, and (iii) saved lives of mothers and
infants due to the implementation of the MIHP practices. Table 10 provides
a summary of the benefits calculation. The estimates of the impact are taken
from the preferred specification in Tables 4-5, Column (3).
One of the major findings from the current analysis is that the number of
C-sections in the MIHP participating rayons decreases by 4.71% or by 132.17
deliveries on average per year. The difference in the average cost between
vaginal deliveries and C-sections is 92.35 UAH per patient15. Hence, the
aggregated savings from a “C-section towards vaginal deliveries switch” is
12,206.09 UAH (92.35 UAH times 132.17 patients).
Switch away from medicine-intensive ways of leading both C-sections and
vaginal deliveries is associated with considerable savings which are achieved
through a reduction in expenditures on tests, exams, and medicines during
labor and postpartum periods. According to the MIHP team’s analysis, the
implementation of the MIHP technologies has significantly reduced the cost
of both vaginal deliveries and C-sections. If the post-treatment year of 2005 is
compared to the pre-treatment 2002, per patient cost of vaginal deliveries has
15The average per patient cost of C-sections and vaginal deliveries has been calculated by the MIHPproject team (for further details see Appendix). Per patient here combines both cost for a mother and anewborn. The cost survey has been conducted in three MIHP participating maternities in years 2002 and2005. In the current cost-benefit calculation the average cost per delivery as estimated from these threematernities is taken as an average per delivery cost for all participating rayons.
24
dropped by 107.30 UAH, while per patient cost of C-sections has declined by
149.35 UAH. Since the average number of vaginal deliveries in 2005 is 2,464.69
and the average number of C-sections is 341.51, the aggregated savings total
to 315,465.95 UAH. Together with the cost savings due to a switch away from
C-sections this brings 327,672.03 UAH which is equivalent to 64,957.40 USD
of savings per year.
The reduction in maternal and infant mortality can be taken as a final
measure of the effectiveness of the Project. The estimates suggest that the
MIHP participation on average translates into 1.69 fewer maternal deaths
per maternity per year and 7.51 fewer infant deaths resulted from deviations
in perinatal period and respiratory system failures.16 The estimates of the
value of statistical life (VSL) do not exist in Ukraine. However, evaluated
at the conservative estimate of a VSL from the literature (Giergiczny (2008)
reports 0.79 mln USD for Poland, country most similar to Ukraine, with
existing estimates of the VSL), this would result in a tremendous benefits of
7.3 mln USD for the country, well surpassing the cost of the Project.
So overall, the project costs to benefits ratio is 1 to 122 (60 to 7,332
thousand USD) if one takes into account value of lives saved and it is 1 to
1.08 (60 to 65 thousand USD) if one considers only costs savings due to
change in C-section and vaginal delivery practices and switch away from C-
sections to vaginal deliveries. The latter represents the lowest bound of the
Project’s benefits, since it does not take into account any health-improving
impact of the MIHP. Although the range is quite wide and this preliminary
calculation suffers from several limitations, it seems unlikely that given the
16According to estimates from the preferred specification from Table 4, the estimated MIHP impacton maternal mortality is 63 per 100,000 live births. Evaluated at the average number of live births in aparticipating maternity in year 2005 - 2681,4 live births - this translates into 1.69 fewer maternal deaths.Similarly, 28 newborns saved per 10,000 live births translates into 7.51 fewer infant deaths per maternityper year.
25
estimated impact the true costs would exceed the true benefits.
8 Conclusion
Exploiting a unique opportunity provided by the Mother and Infant Health
Project in Ukraine this paper evaluates the impact of the improvement in the
quality of labor and delivery services on maternal and infant mortality and
morbidity. This has become possible for two reasons. First is that the ma-
ternal and infant health outcomes are lagging behind those in Europe, thus
allowing the identification of the effect of health-related interventions. Sec-
ond, and the most important, is that the labor delivery services and prenatal
care are universally available in Ukraine. So, the estimation of the effect of
the MIHP can be interpreted as an impact of the improvement in the quality
of services, which is a rare opportunity in the research.
Employing program evaluation methods it is found that the urban admin-
istrative units (rayons) participating in the Project have exhibited greater
improvement in both maternal and infant health compared to the control
rayons. At the same time no effect has been found on the pregnancy unre-
lated outcomes, such as diabetes, hepatitis, and teenage morbidity, indicating
the causality of the MIHP impact. The MIHP impact is most pronounced for
infant mortality resulting from deviations in perinatal period and respiratory
system failures and maternal mortality and morbidity related to late toxico-
sis, anemia, urinary-genital and blood circulation system complications. The
analysis suggests that the effect stems from the early attendance of antenatal
clinics, lower share of C-sections, and greater share of normal deliveries.
Decomposition of the MIHP impact over time supports the causality of
the main findings, since no effect has been found in the pre-Project period.
26
At the same time, among infant health outcomes only evidence on infant
mortality due to perinatal deviations and respiratory system failures can be
interpreted as causal.
Interestingly, the MIHP implied very little monetary intervention - all
of the provided equipment has been low cost, but most of the change has
occurred through trainings of the personnel and changes in their attitudes
and practices. The maternities participating in the Project have become
more mothers’ and family friendly, practicing active partner participation
in the process of labor and delivery, less involvement of medicines, and joint
mother-baby accommodation. As a result, even after controlling for the over-
all trend in the country and oblast-specific time trend, the rayons with the
MIHP-participating maternities do observe better maternal and infant health
outcomes. And the impact is more significant statistically and economically
for the outcomes directly related to the quality of labor and delivery services:
decrease in infant morbidity and mortality due to deviations in the perinatal
period and respiratory system failures, maternal mortality and various com-
plications experienced by mothers during pregnancy, labor and delivery, and
in postpartum period. It can also be attributed to the indirect impact of the
MIHP on the quality of prenatal care since most of the doctors employed by
maternities have dual appointments at the antenatal clinics.
As the preliminary cost-benefit calculation shows, the Mother and Infant
Health Project seems to be associated with a tremendous return to the coun-
try. The project costs to benefits ratio is 1 to 122 if one takes into account
value of lives saved and it is 1 to 1.08 if one considers only costs savings
due to changes in C-section and vaginal delivery practices and a switch away
from C-sections to vaginal deliveries. Even though these cost-benefit con-
siderations are quite rough, they indicate that the benefits of the MIHP are
27
much higher than the costs.
This study provides evidence on the effectiveness of a low-cost change in
the quality of the provision of labor and delivery services. Although this
evaluation is not without a fault, especially with respect to its ability to
separate the impact of various components of the Project, it provides some
guidelines to be used in the development of future interventions. At the
same time one should be cautious when considering the institutional setting
in which the MIHP has worked. First of all, Ukraine has a well-qualified
health care labor force: well trained doctors and nurses in all parts of the
country have regularly scheduled courses to upgrade their knowledge and
exams that follow them. Second, Ukraine has a well educated population
with 24% of women and 17% of men having high education (Ganguli and
Terrell, 2006). These two factors alone may be a sufficient explanation of
why an inexpensive change in the quality of services has been so successful in
Ukraine, and may prevent policy makers from direct implementation of the
Project in less developed countries. However, successful adoption of some
of the components, such as warm chain practices and presence of a partner
in the delivery room, may not require high skills of the personnel and well
educated mothers to be successfully adopted.
References
AbouZahr, Carla. 2003. “Global Burden of Maternal Death and Disability.” British Medical Bulletin
77:1–11.
Allin, Sara, Konstantina Davaki, and Elias Mossialos. 2005. “Paying for “Free” Health Care: the
Conundrum of Informal Payments in Post-Communist Europe.” http://www.transparency.
org/content/download/4847/28622/file/Part\%201_4_informal_payments.pdf.
28

Anderson, Barbara A and Brian S Silver. 1986. “Infant Mortality in the Soviet Union: Regional
Differences and Measurement Issues.” Population and Development Review 12 (4):705–738.
Barber, Sarah L and Paul J Gertler. 2002. “Child Health And The Quality of Medical Care.” Uni-
versity of California-Berkeley Working Paper http://faculty.haas.berkeley.edu/gertler/
working_papers/02.28.02_childheight.pdf.
Bhalotra, Sonia. 2007. “Spending to Save? State Health Expenditure and Infant Mortality in
India.” University of Bristol Working Paper No. 07/169. http://www.bristol.ac.uk/cmpo/
publications/papers/2007/wp169.pdf.
Brainerd, Elizabeth. 2006. “Reassessing the Standard of Living in the Soviet Union: An Analysis
Using Archival and Anthropometric Data.” IZA Discussion Paper No. 1958.
Buckley, Cynthia. 2003. “Children at Risk: Infant and Child Health in Central Asia.” William
Davidson Working Paper No. 523.
Carroli, Guillermo, Cleone Rooney, and Jose Villar. 2001. “How Effective is Antenatal Care in
Preventing Maternal Mortality and Serious Morbidity? An Overview of the Evidence.” Paediatric
and Perinatal Epidemiology 15 (1):1–42.
Chou, Shin-Yi, Jin-Tan Liu, Michael Grossman, and Theodore J. Joyce. 2007. “Parental Education
and Child Health: Evidence from a Natural Experiment in Taiwan.” NBER Working Paper No.
13466.
Conway, Karen and Partha Deb. 2005. “Is Prenatal Care Really Ineffective? Or, Is the Devil in
the Distribution?” Journal of Health Economics 3 (24):489–513.
Conway, Karen and Andrea Kutinova. 2006. “Maternal Health: Does Perinatal Care Make a
Difference?” Health Economics 15:461–88.
Currie, Janet and Jeffrey Grogger. 2000. “Medicaid Expansions and Welfare Contractions: Offset-
ting Effects on Prenatal Care and Infant Health?” NBER Working Paper No. 7667.
29

Evans, William N. and Diana S. Lien. 2005. “The Benefits of Prenatal Care: Evidence From the
PAT Bus Strike.” Journal of Econometrics 125:207–239.
Ganguli, Ina and Katherine Terrell. 2006. “Institutions, Markets and Men’s and Women’s Wage
Inequality: Evidence from Ukraine.” Journal of Comparative Economics 34 (2):200–227.
Giergiczny, Marek. 2008. “Value of a Statistical Lifethe Case of Poland.” Environmental and
Resource Economics 41 (2).
Goldman, Fred and Michael Grossman. 1982. “The Impact of Public Health Policy: The Case of
Community Health Centers.” NBER Working Paper No. 1020.
Haas, Jennifer S., Steven Udvarhelyi, and Arnold M. Epstein. 1993. “The Effect of Health Coverage
for Uninsured Pregnant Women on Maternal Health And the Use of Cesarean Section.” Journal
of American Medical Association 270 (1):61–64.
Kezdi, Gabor. 2004. “Robust Standard Error Estimation in Fixed-Effects Panel Models.” Hungar-
ian Statistical Review, Special English Volume 9:95–116.
Laditka, Sarah B., James N. Laditka, Melanie P. Mastanduno, Michele R. Lauria, and Tina C. Fos-
ter. 2005. “Potentially Avoidable Maternity Complications: An Indicator of Access to Prenatal
and Primary Care During Pregnancy.” Women and Health 3 (41):1–26.
Lefevre-Cholay, Helene, Idriss Alaoui, Sasch Lamstein, and Viktor Galayda. 2006. “Exploring the
Cost Impact of MIHP Intervention.” Mimeo.
Lekhan, Valeria, Volodomyr Rudiy, and Ellen Nolte. 2004. “Health care systems in transition:
Ukraine.” European Observatory on Health Systems and Policies 6 (7). http://www.euro.who.
int/Document/E84927.pdf.
McCarthy, James and Deborah Maine. 1992. “A Framework for Analyzing the Determinants of
Maternal Mortality.” Studies in Family Planning 1 (23):23–33.
McGuire, James M. 2006. “Basic Health Care Provision and Under-5 Mortality: A Cross-National
Study of Developing Countries.” World Development 3 (34):405–425.
30

MEU. 2005. “Millennium Development Goals. Ukraine.” Ministry of Economy of Ukraine http:
//www.undp.org.ua/download.php?id=1139.
MHCU. 2007. “Informational and Analytical Materials as to the Results Achieved by the Health
Care System in Ukraine in January-June 2007.” Ministry of Health Care of Ukraine http:
//www.moz.gov.ua/ua/main/docs/?docID=8252.
Oxaal, Zoe and Sally Baden. 1996. “Challenges to Women’s Reproductive Health: Maternal Mor-
tality.” Tech. Rep. 38, BRIDGE Report. http://www.bridge.ids.ac.uk/reports/re38c.pdf.
Shiffman, Jeremy. 2000. “Can Poor Countries Surmount High Maternal Mortality?” Studies in
Family Planning 4 (31):274–289.
Sodemann, M., M.S. Jakobson, I.C. Molbak, I.C. Alvarenga, and P. Aaby. 1997. “High Mortality
Despite Good Care-Seeking Behavior: a Community Study of Childhood Deaths in Guinea-
Bissau.” Bulletin of the World Health Organization 3 (75):205–12.
Stock, James H. and Mark W. Watson. 2008. “Heteroskedasticity-Robust Standard Errors for Fixed
Effects Panel Data Regression.” Econometrica 76 (1):155–174.
Winikoff, Beverly. 1988. “Women’s Health: An Alternative Perspective for Choosing Interventions.”
Studies in Family Planning 4 (19):197–214.
31
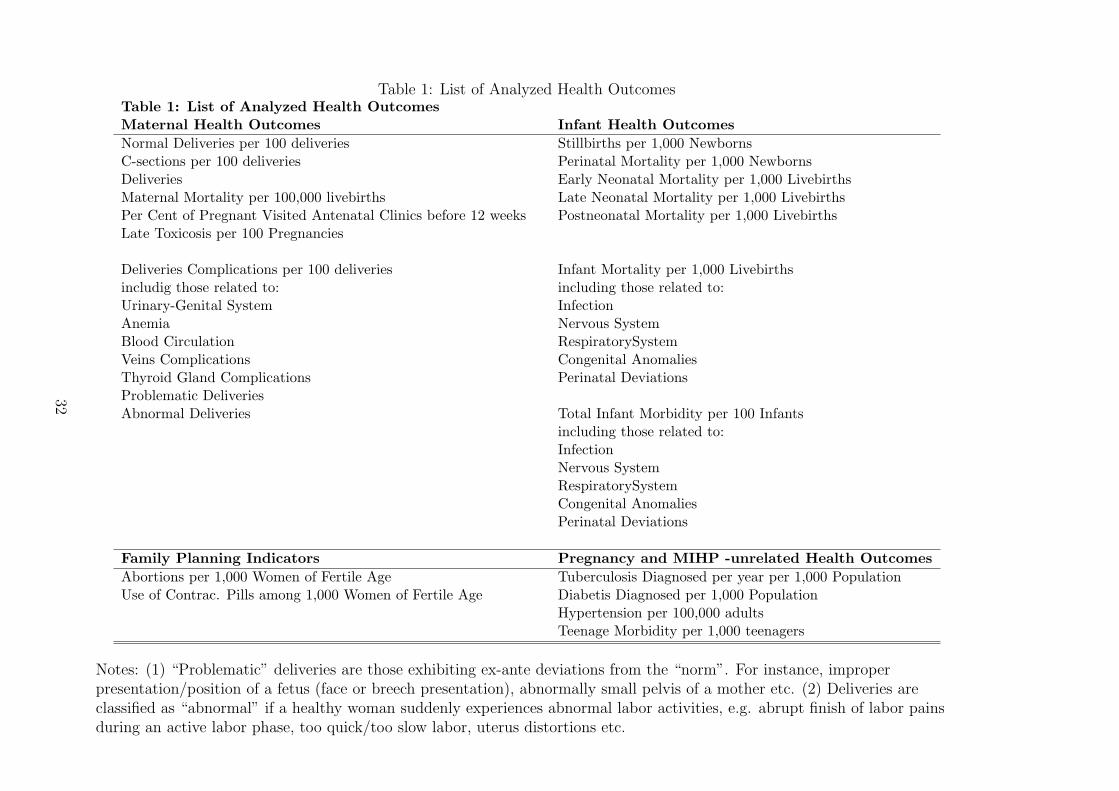
Table 1: List of Analyzed Health OutcomesTable 1: List of Analyzed Health OutcomesMaternal Health Outcomes Infant Health Outcomes
Normal Deliveries per 100 deliveries Stillbirths per 1,000 NewbornsC-sections per 100 deliveries Perinatal Mortality per 1,000 NewbornsDeliveries Early Neonatal Mortality per 1,000 LivebirthsMaternal Mortality per 100,000 livebirths Late Neonatal Mortality per 1,000 LivebirthsPer Cent of Pregnant Visited Antenatal Clinics before 12 weeks Postneonatal Mortality per 1,000 LivebirthsLate Toxicosis per 100 Pregnancies
Deliveries Complications per 100 deliveries Infant Mortality per 1,000 Livebirthsincludig those related to: including those related to:Urinary-Genital System InfectionAnemia Nervous SystemBlood Circulation RespiratorySystemVeins Complications Congenital AnomaliesThyroid Gland Complications Perinatal DeviationsProblematic DeliveriesAbnormal Deliveries Total Infant Morbidity per 100 Infants
including those related to:InfectionNervous SystemRespiratorySystemCongenital AnomaliesPerinatal Deviations
Family Planning Indicators Pregnancy and MIHP -unrelated Health Outcomes
Abortions per 1,000 Women of Fertile Age Tuberculosis Diagnosed per year per 1,000 PopulationUse of Contrac. Pills among 1,000 Women of Fertile Age Diabetis Diagnosed per 1,000 Population
Hypertension per 100,000 adultsTeenage Morbidity per 1,000 teenagers
Notes: (1) “Problematic” deliveries are those exhibiting ex-ante deviations from the “norm”. For instance, improperpresentation/position of a fetus (face or breech presentation), abnormally small pelvis of a mother etc. (2) Deliveries areclassified as “abnormal” if a healthy woman suddenly experiences abnormal labor activities, e.g. abrupt finish of labor painsduring an active labor phase, too quick/too slow labor, uterus distortions etc.
32
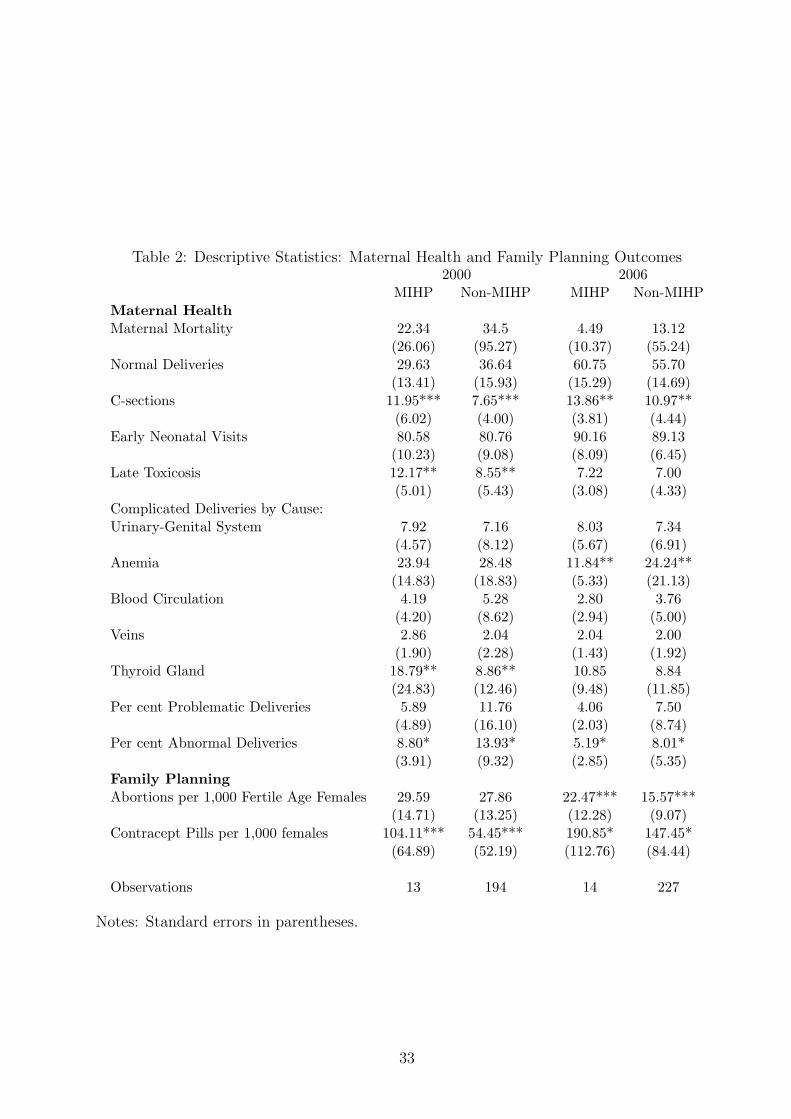
Table 2: Descriptive Statistics: Maternal Health and Family Planning Outcomes2000 2006
MIHP Non-MIHP MIHP Non-MIHPMaternal HealthMaternal Mortality 22.34 34.5 4.49 13.12
(26.06) (95.27) (10.37) (55.24)Normal Deliveries 29.63 36.64 60.75 55.70
(13.41) (15.93) (15.29) (14.69)C-sections 11.95*** 7.65*** 13.86** 10.97**
(6.02) (4.00) (3.81) (4.44)Early Neonatal Visits 80.58 80.76 90.16 89.13
(10.23) (9.08) (8.09) (6.45)Late Toxicosis 12.17** 8.55** 7.22 7.00
(5.01) (5.43) (3.08) (4.33)Complicated Deliveries by Cause:Urinary-Genital System 7.92 7.16 8.03 7.34
(4.57) (8.12) (5.67) (6.91)Anemia 23.94 28.48 11.84** 24.24**
(14.83) (18.83) (5.33) (21.13)Blood Circulation 4.19 5.28 2.80 3.76
(4.20) (8.62) (2.94) (5.00)Veins 2.86 2.04 2.04 2.00
(1.90) (2.28) (1.43) (1.92)Thyroid Gland 18.79** 8.86** 10.85 8.84
(24.83) (12.46) (9.48) (11.85)Per cent Problematic Deliveries 5.89 11.76 4.06 7.50
(4.89) (16.10) (2.03) (8.74)Per cent Abnormal Deliveries 8.80* 13.93* 5.19* 8.01*
(3.91) (9.32) (2.85) (5.35)Family PlanningAbortions per 1,000 Fertile Age Females 29.59 27.86 22.47*** 15.57***
(14.71) (13.25) (12.28) (9.07)Contracept Pills per 1,000 females 104.11*** 54.45*** 190.85* 147.45*
(64.89) (52.19) (112.76) (84.44)
Observations 13 194 14 227
Notes: Standard errors in parentheses.
33
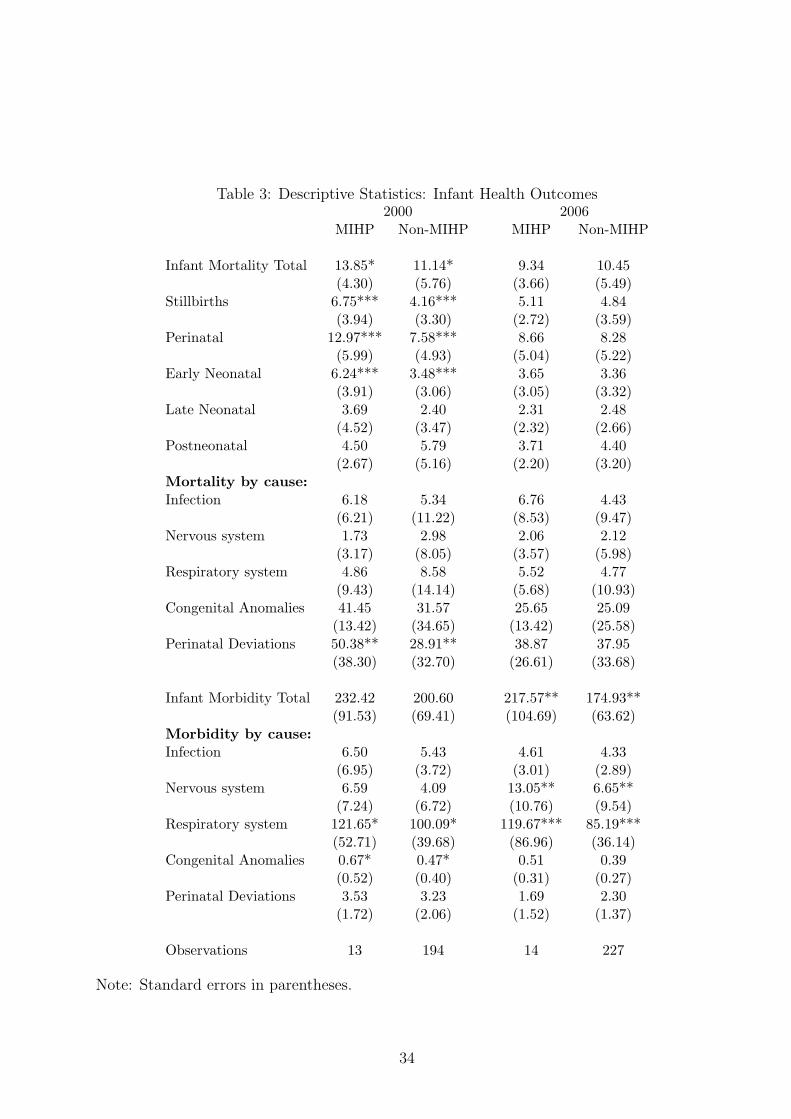
Table 3: Descriptive Statistics: Infant Health Outcomes2000 2006
MIHP Non-MIHP MIHP Non-MIHP
Infant Mortality Total 13.85* 11.14* 9.34 10.45(4.30) (5.76) (3.66) (5.49)
Stillbirths 6.75*** 4.16*** 5.11 4.84(3.94) (3.30) (2.72) (3.59)
Perinatal 12.97*** 7.58*** 8.66 8.28(5.99) (4.93) (5.04) (5.22)
Early Neonatal 6.24*** 3.48*** 3.65 3.36(3.91) (3.06) (3.05) (3.32)
Late Neonatal 3.69 2.40 2.31 2.48(4.52) (3.47) (2.32) (2.66)
Postneonatal 4.50 5.79 3.71 4.40(2.67) (5.16) (2.20) (3.20)
Mortality by cause:Infection 6.18 5.34 6.76 4.43
(6.21) (11.22) (8.53) (9.47)Nervous system 1.73 2.98 2.06 2.12
(3.17) (8.05) (3.57) (5.98)Respiratory system 4.86 8.58 5.52 4.77
(9.43) (14.14) (5.68) (10.93)Congenital Anomalies 41.45 31.57 25.65 25.09
(13.42) (34.65) (13.42) (25.58)Perinatal Deviations 50.38** 28.91** 38.87 37.95
(38.30) (32.70) (26.61) (33.68)
Infant Morbidity Total 232.42 200.60 217.57** 174.93**(91.53) (69.41) (104.69) (63.62)
Morbidity by cause:Infection 6.50 5.43 4.61 4.33
(6.95) (3.72) (3.01) (2.89)Nervous system 6.59 4.09 13.05** 6.65**
(7.24) (6.72) (10.76) (9.54)Respiratory system 121.65* 100.09* 119.67*** 85.19***
(52.71) (39.68) (86.96) (36.14)Congenital Anomalies 0.67* 0.47* 0.51 0.39
(0.52) (0.40) (0.31) (0.27)Perinatal Deviations 3.53 3.23 1.69 2.30
(1.72) (2.06) (1.52) (1.37)
Observations 13 194 14 227
Note: Standard errors in parentheses.
34
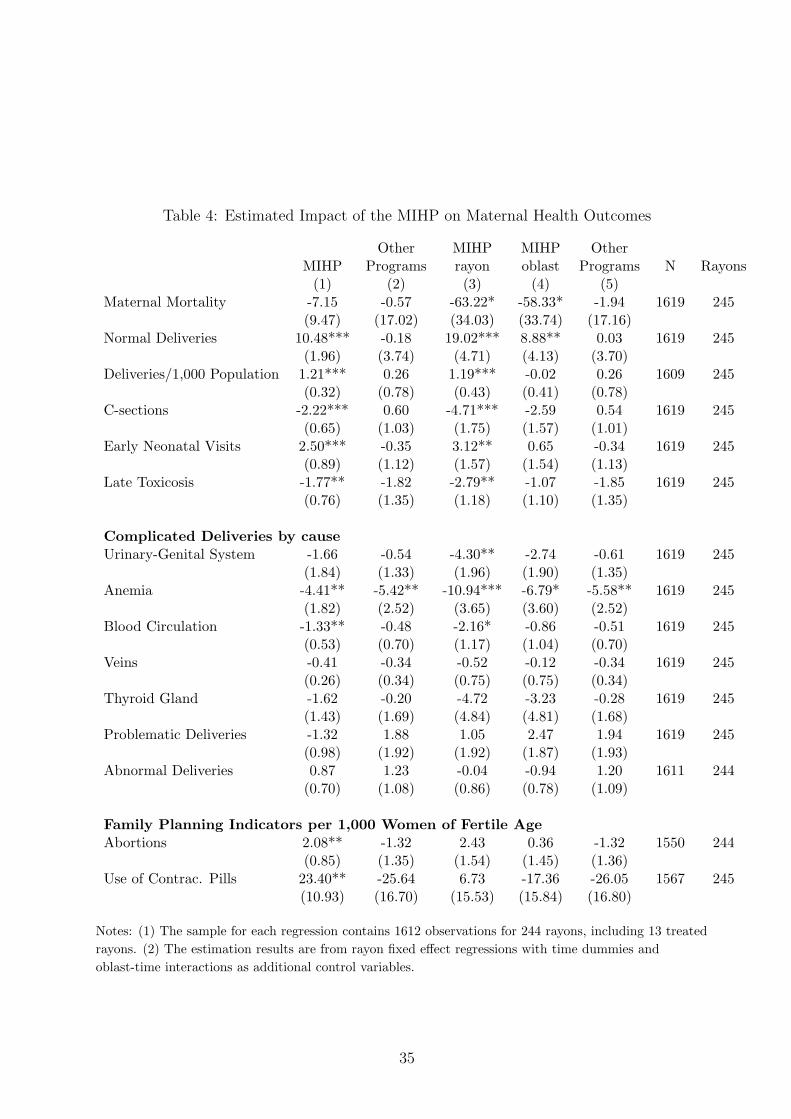
Table 4: Estimated Impact of the MIHP on Maternal Health Outcomes
Other MIHP MIHP OtherMIHP Programs rayon oblast Programs N Rayons
(1) (2) (3) (4) (5)Maternal Mortality -7.15 -0.57 -63.22* -58.33* -1.94 1619 245
(9.47) (17.02) (34.03) (33.74) (17.16)Normal Deliveries 10.48*** -0.18 19.02*** 8.88** 0.03 1619 245
(1.96) (3.74) (4.71) (4.13) (3.70)Deliveries/1,000 Population 1.21*** 0.26 1.19*** -0.02 0.26 1609 245
(0.32) (0.78) (0.43) (0.41) (0.78)C-sections -2.22*** 0.60 -4.71*** -2.59 0.54 1619 245
(0.65) (1.03) (1.75) (1.57) (1.01)Early Neonatal Visits 2.50*** -0.35 3.12** 0.65 -0.34 1619 245
(0.89) (1.12) (1.57) (1.54) (1.13)Late Toxicosis -1.77** -1.82 -2.79** -1.07 -1.85 1619 245
(0.76) (1.35) (1.18) (1.10) (1.35)
Complicated Deliveries by causeUrinary-Genital System -1.66 -0.54 -4.30** -2.74 -0.61 1619 245
(1.84) (1.33) (1.96) (1.90) (1.35)Anemia -4.41** -5.42** -10.94*** -6.79* -5.58** 1619 245
(1.82) (2.52) (3.65) (3.60) (2.52)Blood Circulation -1.33** -0.48 -2.16* -0.86 -0.51 1619 245
(0.53) (0.70) (1.17) (1.04) (0.70)Veins -0.41 -0.34 -0.52 -0.12 -0.34 1619 245
(0.26) (0.34) (0.75) (0.75) (0.34)Thyroid Gland -1.62 -0.20 -4.72 -3.23 -0.28 1619 245
(1.43) (1.69) (4.84) (4.81) (1.68)Problematic Deliveries -1.32 1.88 1.05 2.47 1.94 1619 245
(0.98) (1.92) (1.92) (1.87) (1.93)Abnormal Deliveries 0.87 1.23 -0.04 -0.94 1.20 1611 244
(0.70) (1.08) (0.86) (0.78) (1.09)
Family Planning Indicators per 1,000 Women of Fertile AgeAbortions 2.08** -1.32 2.43 0.36 -1.32 1550 244
(0.85) (1.35) (1.54) (1.45) (1.36)Use of Contrac. Pills 23.40** -25.64 6.73 -17.36 -26.05 1567 245
(10.93) (16.70) (15.53) (15.84) (16.80)
Notes: (1) The sample for each regression contains 1612 observations for 244 rayons, including 13 treated
rayons. (2) The estimation results are from rayon fixed effect regressions with time dummies and
oblast-time interactions as additional control variables.
35
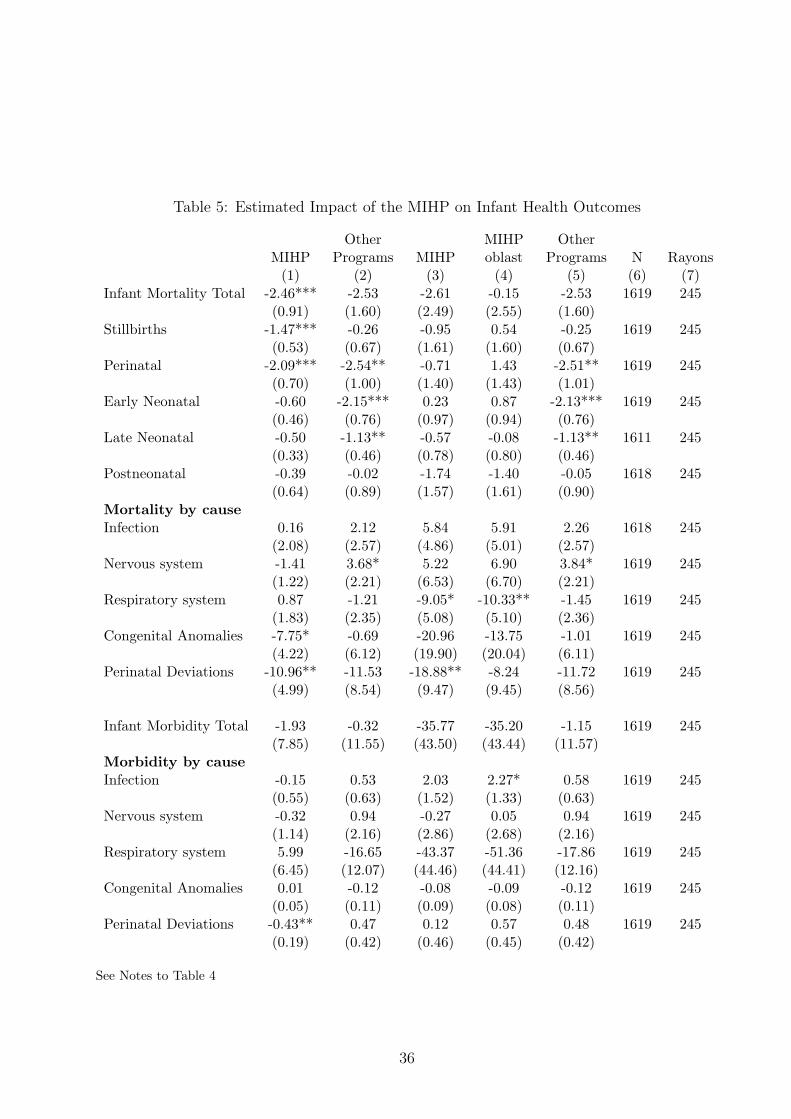
Table 5: Estimated Impact of the MIHP on Infant Health Outcomes
Other MIHP OtherMIHP Programs MIHP oblast Programs N Rayons
(1) (2) (3) (4) (5) (6) (7)Infant Mortality Total -2.46*** -2.53 -2.61 -0.15 -2.53 1619 245
(0.91) (1.60) (2.49) (2.55) (1.60)Stillbirths -1.47*** -0.26 -0.95 0.54 -0.25 1619 245
(0.53) (0.67) (1.61) (1.60) (0.67)Perinatal -2.09*** -2.54** -0.71 1.43 -2.51** 1619 245
(0.70) (1.00) (1.40) (1.43) (1.01)Early Neonatal -0.60 -2.15*** 0.23 0.87 -2.13*** 1619 245
(0.46) (0.76) (0.97) (0.94) (0.76)Late Neonatal -0.50 -1.13** -0.57 -0.08 -1.13** 1611 245
(0.33) (0.46) (0.78) (0.80) (0.46)Postneonatal -0.39 -0.02 -1.74 -1.40 -0.05 1618 245
(0.64) (0.89) (1.57) (1.61) (0.90)Mortality by causeInfection 0.16 2.12 5.84 5.91 2.26 1618 245
(2.08) (2.57) (4.86) (5.01) (2.57)Nervous system -1.41 3.68* 5.22 6.90 3.84* 1619 245
(1.22) (2.21) (6.53) (6.70) (2.21)Respiratory system 0.87 -1.21 -9.05* -10.33** -1.45 1619 245
(1.83) (2.35) (5.08) (5.10) (2.36)Congenital Anomalies -7.75* -0.69 -20.96 -13.75 -1.01 1619 245
(4.22) (6.12) (19.90) (20.04) (6.11)Perinatal Deviations -10.96** -11.53 -18.88** -8.24 -11.72 1619 245
(4.99) (8.54) (9.47) (9.45) (8.56)
Infant Morbidity Total -1.93 -0.32 -35.77 -35.20 -1.15 1619 245(7.85) (11.55) (43.50) (43.44) (11.57)
Morbidity by causeInfection -0.15 0.53 2.03 2.27* 0.58 1619 245
(0.55) (0.63) (1.52) (1.33) (0.63)Nervous system -0.32 0.94 -0.27 0.05 0.94 1619 245
(1.14) (2.16) (2.86) (2.68) (2.16)Respiratory system 5.99 -16.65 -43.37 -51.36 -17.86 1619 245
(6.45) (12.07) (44.46) (44.41) (12.16)Congenital Anomalies 0.01 -0.12 -0.08 -0.09 -0.12 1619 245
(0.05) (0.11) (0.09) (0.08) (0.11)Perinatal Deviations -0.43** 0.47 0.12 0.57 0.48 1619 245
(0.19) (0.42) (0.46) (0.45) (0.42)
See Notes to Table 4
36
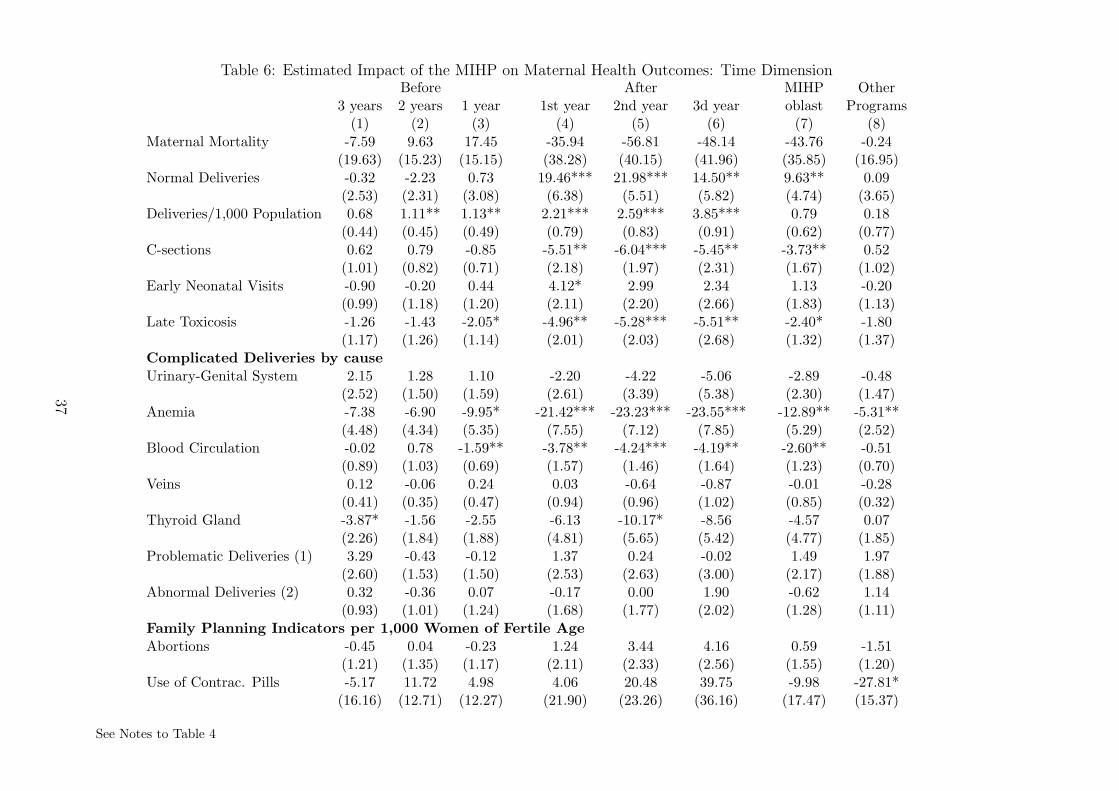
Table 6: Estimated Impact of the MIHP on Maternal Health Outcomes: Time DimensionBefore After MIHP Other
3 years 2 years 1 year 1st year 2nd year 3d year oblast Programs(1) (2) (3) (4) (5) (6) (7) (8)
Maternal Mortality -7.59 9.63 17.45 -35.94 -56.81 -48.14 -43.76 -0.24(19.63) (15.23) (15.15) (38.28) (40.15) (41.96) (35.85) (16.95)
Normal Deliveries -0.32 -2.23 0.73 19.46*** 21.98*** 14.50** 9.63** 0.09(2.53) (2.31) (3.08) (6.38) (5.51) (5.82) (4.74) (3.65)
Deliveries/1,000 Population 0.68 1.11** 1.13** 2.21*** 2.59*** 3.85*** 0.79 0.18(0.44) (0.45) (0.49) (0.79) (0.83) (0.91) (0.62) (0.77)
C-sections 0.62 0.79 -0.85 -5.51** -6.04*** -5.45** -3.73** 0.52(1.01) (0.82) (0.71) (2.18) (1.97) (2.31) (1.67) (1.02)
Early Neonatal Visits -0.90 -0.20 0.44 4.12* 2.99 2.34 1.13 -0.20(0.99) (1.18) (1.20) (2.11) (2.20) (2.66) (1.83) (1.13)
Late Toxicosis -1.26 -1.43 -2.05* -4.96** -5.28*** -5.51** -2.40* -1.80(1.17) (1.26) (1.14) (2.01) (2.03) (2.68) (1.32) (1.37)
Complicated Deliveries by causeUrinary-Genital System 2.15 1.28 1.10 -2.20 -4.22 -5.06 -2.89 -0.48
(2.52) (1.50) (1.59) (2.61) (3.39) (5.38) (2.30) (1.47)Anemia -7.38 -6.90 -9.95* -21.42*** -23.23*** -23.55*** -12.89** -5.31**
(4.48) (4.34) (5.35) (7.55) (7.12) (7.85) (5.29) (2.52)Blood Circulation -0.02 0.78 -1.59** -3.78** -4.24*** -4.19** -2.60** -0.51
(0.89) (1.03) (0.69) (1.57) (1.46) (1.64) (1.23) (0.70)Veins 0.12 -0.06 0.24 0.03 -0.64 -0.87 -0.01 -0.28
(0.41) (0.35) (0.47) (0.94) (0.96) (1.02) (0.85) (0.32)Thyroid Gland -3.87* -1.56 -2.55 -6.13 -10.17* -8.56 -4.57 0.07
(2.26) (1.84) (1.88) (4.81) (5.65) (5.42) (4.77) (1.85)Problematic Deliveries (1) 3.29 -0.43 -0.12 1.37 0.24 -0.02 1.49 1.97
(2.60) (1.53) (1.50) (2.53) (2.63) (3.00) (2.17) (1.88)Abnormal Deliveries (2) 0.32 -0.36 0.07 -0.17 0.00 1.90 -0.62 1.14
(0.93) (1.01) (1.24) (1.68) (1.77) (2.02) (1.28) (1.11)Family Planning Indicators per 1,000 Women of Fertile AgeAbortions -0.45 0.04 -0.23 1.24 3.44 4.16 0.59 -1.51
(1.21) (1.35) (1.17) (2.11) (2.33) (2.56) (1.55) (1.20)Use of Contrac. Pills -5.17 11.72 4.98 4.06 20.48 39.75 -9.98 -27.81*
(16.16) (12.71) (12.27) (21.90) (23.26) (36.16) (17.47) (15.37)
See Notes to Table 4
37

Table 7: Estimated Impact of the MIHP on Infant Health Outcomes: Time DimensionBefore After MIHP Other
3 years 2 years 1 year 1st year 2nd year 3d year oblast Programs(1) (2) (3) (4) (5) (6) (7) (8)
Infant Mortality total -0.13 -2.41** -2.68** -5.02* -7.15** -4.39 -1.98 -2.43(1.25) (1.07) (1.27) (2.91) (3.06) (3.40) (2.76) (1.61)
Stillbirths -0.29 -0.28 -0.40 -1.33 -1.56 -1.28 0.31 -0.23(0.79) (0.86) (0.81) (1.87) (1.90) (2.06) (1.72) (0.67)
Perinatal -1.58* -2.13** -1.68* -2.40 -3.14 -2.00 0.81 -2.43**(0.91) (0.93) (0.96) (1.78) (1.97) (2.39) (1.68) (0.96)
Early Neonatal -1.28** -1.90*** -1.35** -1.18 -1.66 -0.73 0.43 -2.07***(0.58) (0.56) (0.61) (1.25) (1.30) (1.54) (1.07) (0.74)
Late Neonatal -0.23 -0.52 -1.18** -1.81* -2.06** -2.07* -1.04 -1.12**(0.55) (0.50) (0.49) (0.99) (1.05) (1.15) (0.87) (0.46)
Postneonatal 1.28 -0.15 -0.80 -2.69 -2.89 -1.39 -2.29 -0.11(0.89) (0.90) (1.03) (1.92) (2.03) (2.15) (1.80) (0.89)
Mortality by causeInfection 2.07 -1.88 -5.93* -0.65 -2.30 2.98 0.67 2.14
(2.61) (2.83) (3.03) (5.87) (6.14) (7.45) (5.62) (2.31)Nervous system -0.83 1.81 -2.83 1.47 2.55 4.06 4.28 3.65*
(1.30) (1.82) (1.82) (6.71) (7.16) (7.36) (7.01) (2.06)Respiratory system 1.09 -1.74 -3.08 -13.16** -12.46* -8.20 -12.50** -1.66
(2.63) (2.73) (2.79) (6.26) (6.53) (6.86) (5.52) (2.30)Congenital Anomalies 1.47 -5.15 -5.12 -26.11 -29.45 -21.13 -17.11 -0.98
(7.44) (6.09) (6.45) (21.35) (21.43) (22.34) (20.64) (5.69)Perinatal Deviations -2.04 -8.23 -11.41** -31.58*** -33.56** -26.27* -15.86 -11.74
(6.13) (5.55) (5.64) (11.84) (13.40) (15.27) (10.72) (8.00)Morbidity Total -5.00 5.38 -4.51 -37.37 -44.67 -52.33 -41.29 -0.47
(12.21) (9.95) (9.38) (45.94) (45.56) (45.94) (43.96) (11.77)Morbidity by causeInfection -0.90 -0.84 -0.20 1.83 1.62 2.33 2.57* 0.62
(1.07) (0.85) (0.86) (2.01) (2.03) (2.09) (1.45) (0.64)Nervous system 2.98* 3.87** 2.14 2.28 0.92 5.62 0.75 0.82
(1.74) (1.86) (1.94) (3.67) (3.56) (3.80) (2.79) (2.26)Respiratory system -1.25 12.85 4.91 -36.18 -35.44 -59.47 -52.28 -17.45*
(10.30) (8.53) (7.78) (45.97) (45.06) (46.06) (44.48) (10.05)Congenital Anomalies 0.01 0.05 0.05 -0.02 -0.03 -0.02 -0.06 -0.12
(0.09) (0.09) (0.10) (0.15) (0.15) (0.16) (0.11) (0.11)Perinatal Deviations -0.08 -0.33 -0.55** -0.59 -0.38 -0.38 0.17 0.47
(0.26) (0.25) (0.25) (0.56) (0.57) (0.63) (0.48) (0.41)
See Notes to Table 4
38
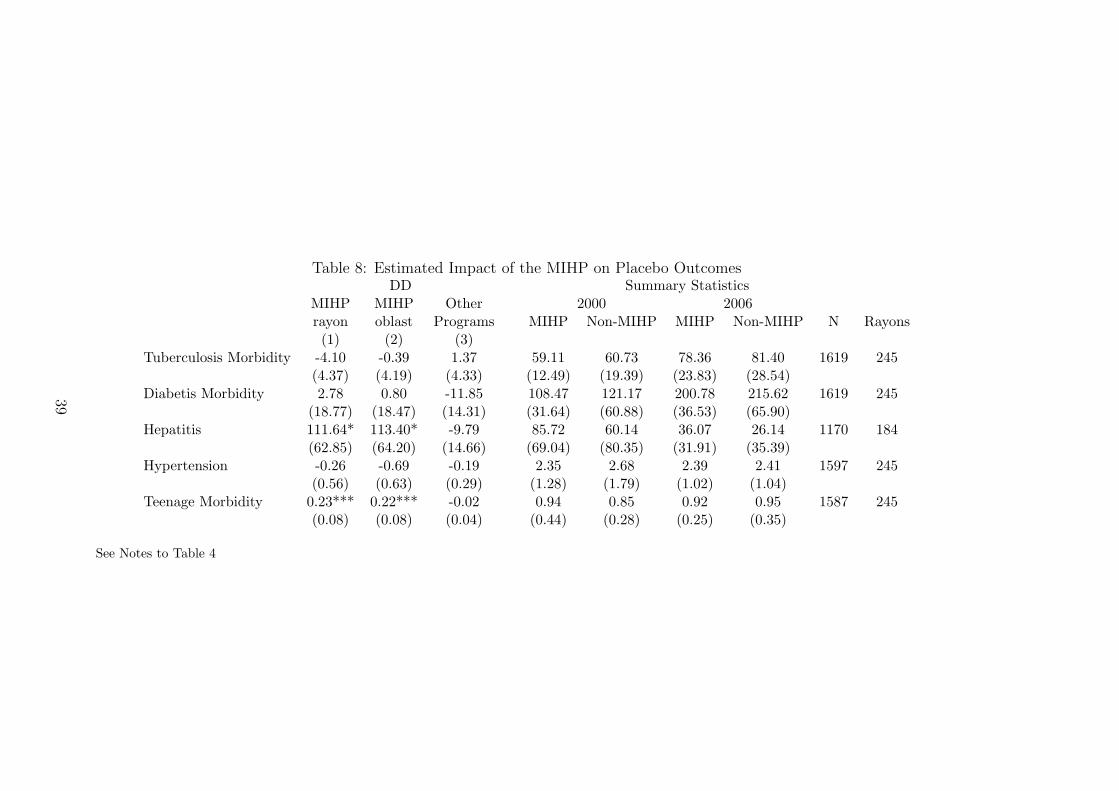
Table 8: Estimated Impact of the MIHP on Placebo OutcomesDD Summary Statistics
MIHP MIHP Other 2000 2006rayon oblast Programs MIHP Non-MIHP MIHP Non-MIHP N Rayons(1) (2) (3)
Tuberculosis Morbidity -4.10 -0.39 1.37 59.11 60.73 78.36 81.40 1619 245(4.37) (4.19) (4.33) (12.49) (19.39) (23.83) (28.54)
Diabetis Morbidity 2.78 0.80 -11.85 108.47 121.17 200.78 215.62 1619 245(18.77) (18.47) (14.31) (31.64) (60.88) (36.53) (65.90)
Hepatitis 111.64* 113.40* -9.79 85.72 60.14 36.07 26.14 1170 184(62.85) (64.20) (14.66) (69.04) (80.35) (31.91) (35.39)
Hypertension -0.26 -0.69 -0.19 2.35 2.68 2.39 2.41 1597 245(0.56) (0.63) (0.29) (1.28) (1.79) (1.02) (1.04)
Teenage Morbidity 0.23*** 0.22*** -0.02 0.94 0.85 0.92 0.95 1587 245(0.08) (0.08) (0.04) (0.44) (0.28) (0.25) (0.35)
See Notes to Table 4
39
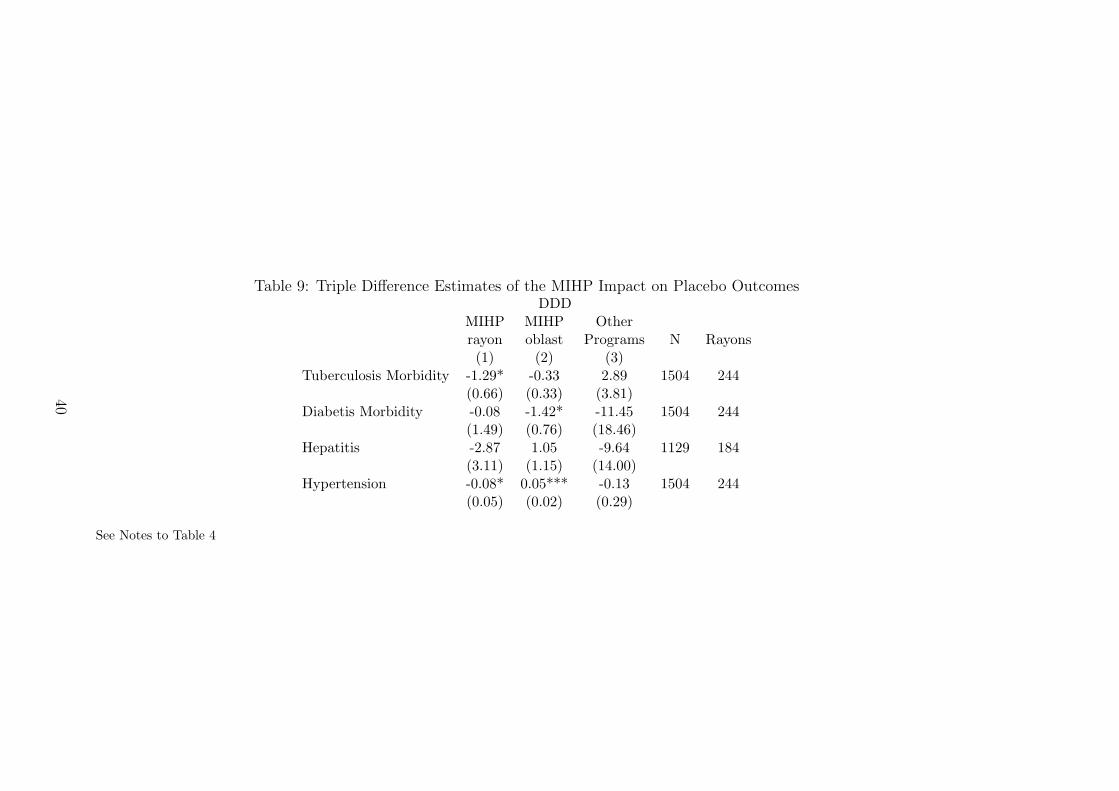
Table 9: Triple Difference Estimates of the MIHP Impact on Placebo OutcomesDDD
MIHP MIHP Otherrayon oblast Programs N Rayons(1) (2) (3)
Tuberculosis Morbidity -1.29* -0.33 2.89 1504 244(0.66) (0.33) (3.81)
Diabetis Morbidity -0.08 -1.42* -11.45 1504 244(1.49) (0.76) (18.46)
Hepatitis -2.87 1.05 -9.64 1129 184(3.11) (1.15) (14.00)
Hypertension -0.08* 0.05*** -0.13 1504 244(0.05) (0.02) (0.29)
See Notes to Table 4
40

Table 10: Per Mother and Child Cost Savings CalculationC-section (CS) Vaginal delivery (VD) CS-VD
Post-MIHP cost 2005, UAH 118.40 26.05 92.35Average number of deliveries in 2005 2,806.20Estimated impact on CS, percent -4.71Number of VD that would have been CS without the MIHP 132.17Cost Savings Due to a Switch from CS to VD 12,206.09
Pre-MIHP cost 2002, UAH 267.75 133.35 134.40Post-MIHP cost 2005, UAH 118.40 26.05 92.352002 to 2005 change in cost, UAH 149.35 107.30Average number of deliveries in 2005 341.51 2,464.69Cost savings due to a change in technology 51,005.20 264,460.75 315,465.95
Total, UAH 327,672.03Total, USD 64,885.55
Average number of live births in 2005, MIHP sites 2,681.40Mothers’ lives saved per year (63 per 100,000 livebirths) 1.69Newborns’ lives saved per year (28 per 10,000 livebirths) 7.51Total value of saved lives (VSL=0.79 mln USD) 7,267,432.78
Total Benefits (including saved lives) 7,332,318.33
Notes: (1) The cost includes the cost of the procedure for both mother and newborn. (2) The cost is given in 2005 prices. (3) Exchange rate for year
2005 is 5.05 UAH/USD. (4) Average number of deliveries and live births per rayon is calculated for all participating rayons in year 2005.
41
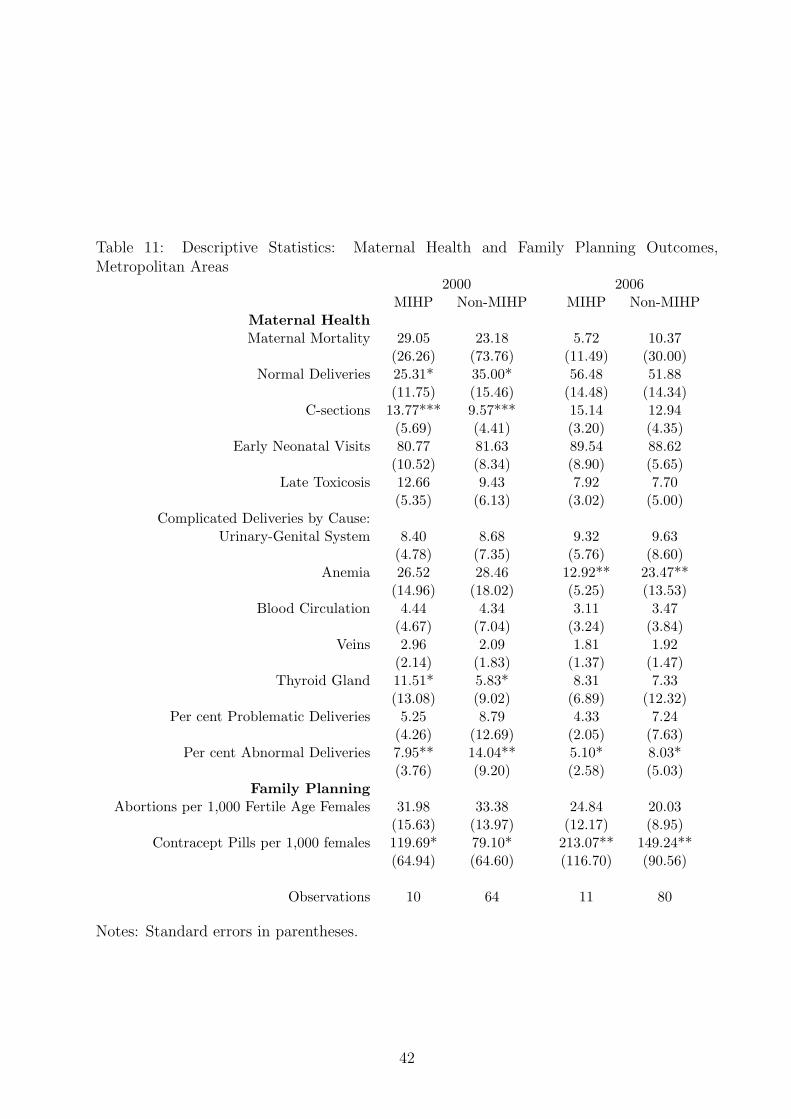
Table 11: Descriptive Statistics: Maternal Health and Family Planning Outcomes,Metropolitan Areas
2000 2006MIHP Non-MIHP MIHP Non-MIHP
Maternal HealthMaternal Mortality 29.05 23.18 5.72 10.37
(26.26) (73.76) (11.49) (30.00)Normal Deliveries 25.31* 35.00* 56.48 51.88
(11.75) (15.46) (14.48) (14.34)C-sections 13.77*** 9.57*** 15.14 12.94
(5.69) (4.41) (3.20) (4.35)Early Neonatal Visits 80.77 81.63 89.54 88.62
(10.52) (8.34) (8.90) (5.65)Late Toxicosis 12.66 9.43 7.92 7.70
(5.35) (6.13) (3.02) (5.00)Complicated Deliveries by Cause:
Urinary-Genital System 8.40 8.68 9.32 9.63(4.78) (7.35) (5.76) (8.60)
Anemia 26.52 28.46 12.92** 23.47**(14.96) (18.02) (5.25) (13.53)
Blood Circulation 4.44 4.34 3.11 3.47(4.67) (7.04) (3.24) (3.84)
Veins 2.96 2.09 1.81 1.92(2.14) (1.83) (1.37) (1.47)
Thyroid Gland 11.51* 5.83* 8.31 7.33(13.08) (9.02) (6.89) (12.32)
Per cent Problematic Deliveries 5.25 8.79 4.33 7.24(4.26) (12.69) (2.05) (7.63)
Per cent Abnormal Deliveries 7.95** 14.04** 5.10* 8.03*(3.76) (9.20) (2.58) (5.03)
Family PlanningAbortions per 1,000 Fertile Age Females 31.98 33.38 24.84 20.03
(15.63) (13.97) (12.17) (8.95)Contracept Pills per 1,000 females 119.69* 79.10* 213.07** 149.24**
(64.94) (64.60) (116.70) (90.56)
Observations 10 64 11 80
Notes: Standard errors in parentheses.
42

Table 12: Descriptive Statistics: Infant Health Outcomes, Metropolitan Areas2000 2006
MIHP Non-MIHP MIHP Non-MIHP
Infant Mortality Total 15.05* 11.83* 9.47 10.35(3.63) (5.77) (3.83) (5.70)
By time:Stillbirths 7.33** 4.73** 5.49 4.79
(4.19) (3.24) (2.96) (3.20)Perinatal 14.60*** 9.04*** 9.67 8.61
(5.86) (4.79) (5.26) (4.83)Early Neonatal 7.28*** 4.34*** 4.28 3.74
(3.85) (2.78) (3.13) (3.06)Late Neonatal 4.17 2.80 2.44 2.48
(4.96) (4.83) (2.40) (2.74)Postneonatal 4.08 5.03 3.43 4.06
(1.97) (3.51) (1.98) (2.85)By cause:Infection 6.36 3.63 5.77 4.23
(5.53) (7.56) (4.94) (8.13)Nervous system 1.21 3.45 2.62 2.44
(2.02) (7.59) (3.87) (5.83)Respiratory system 6.32 6.84 3.84 4.30
(10.41) (12.16) (5.06) (8.80)Congenital Anomalies 40.56 31.28 28.66 26.63
(13.19) (27.55) (13.45) (23.80)Perinatal Deviations 63.21* 38.10* 46.72 43.29
(33.97) (38.52) (24.13) (36.45)Infant Morbidity Total 250.81 217.23 221.03 182.49
(95.06) (78.14) (93.20) (74.31)By cause:Infection 7.07 5.52 5.11 4.38
(7.17) (3.52) (3.05) (2.63)Nervous system 7.84 5.70 16.01 12.05
(7.74) (8.54) (10.24) (13.09)Respiratory system 132.52 113.46 112.11* 86.15*
(55.19) (41.54) (68.78) (40.20)Congenital Anomalies 0.76 0.64 0.55 0.46
(0.56) (0.53) (0.32) (0.25)Perinatal Deviations 3.61 3.38 1.81 2.30
(1.88) (2.58) (1.65) (1.62)
Observations 10 64 11 80
Note: Standard errors in parentheses.
43
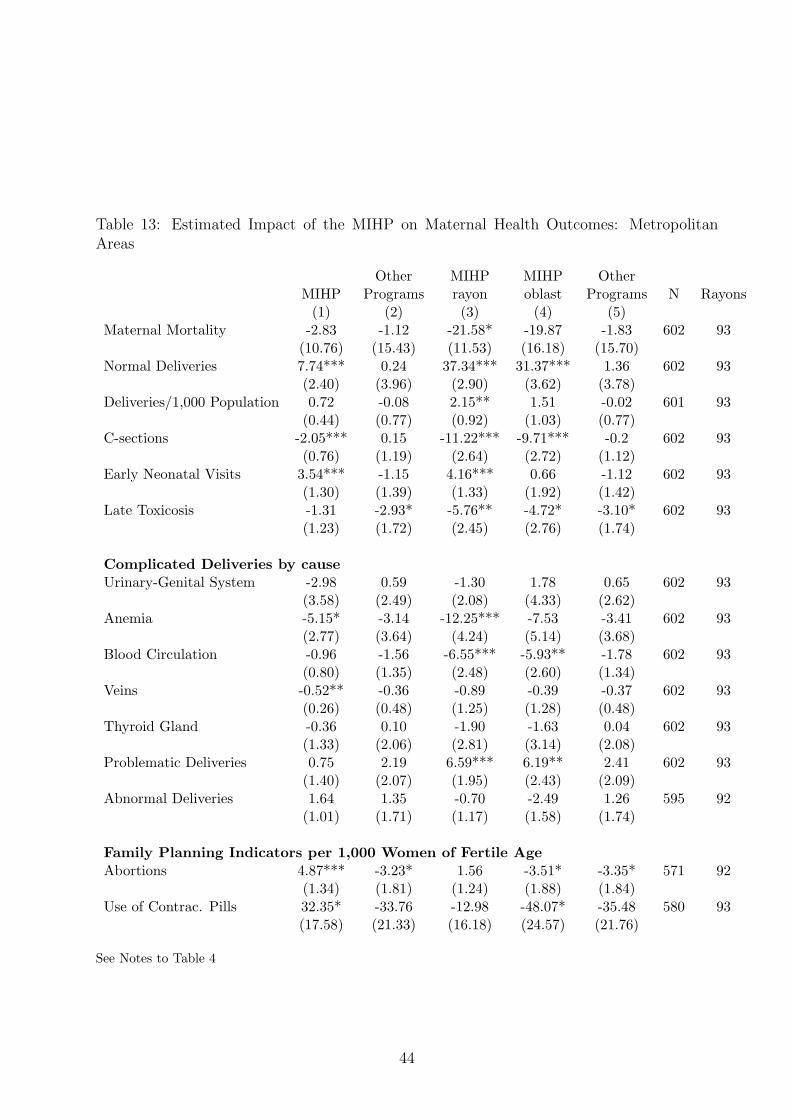
Table 13: Estimated Impact of the MIHP on Maternal Health Outcomes: MetropolitanAreas
Other MIHP MIHP OtherMIHP Programs rayon oblast Programs N Rayons
(1) (2) (3) (4) (5)Maternal Mortality -2.83 -1.12 -21.58* -19.87 -1.83 602 93
(10.76) (15.43) (11.53) (16.18) (15.70)Normal Deliveries 7.74*** 0.24 37.34*** 31.37*** 1.36 602 93
(2.40) (3.96) (2.90) (3.62) (3.78)Deliveries/1,000 Population 0.72 -0.08 2.15** 1.51 -0.02 601 93
(0.44) (0.77) (0.92) (1.03) (0.77)C-sections -2.05*** 0.15 -11.22*** -9.71*** -0.2 602 93
(0.76) (1.19) (2.64) (2.72) (1.12)Early Neonatal Visits 3.54*** -1.15 4.16*** 0.66 -1.12 602 93
(1.30) (1.39) (1.33) (1.92) (1.42)Late Toxicosis -1.31 -2.93* -5.76** -4.72* -3.10* 602 93
(1.23) (1.72) (2.45) (2.76) (1.74)
Complicated Deliveries by causeUrinary-Genital System -2.98 0.59 -1.30 1.78 0.65 602 93
(3.58) (2.49) (2.08) (4.33) (2.62)Anemia -5.15* -3.14 -12.25*** -7.53 -3.41 602 93
(2.77) (3.64) (4.24) (5.14) (3.68)Blood Circulation -0.96 -1.56 -6.55*** -5.93** -1.78 602 93
(0.80) (1.35) (2.48) (2.60) (1.34)Veins -0.52** -0.36 -0.89 -0.39 -0.37 602 93
(0.26) (0.48) (1.25) (1.28) (0.48)Thyroid Gland -0.36 0.10 -1.90 -1.63 0.04 602 93
(1.33) (2.06) (2.81) (3.14) (2.08)Problematic Deliveries 0.75 2.19 6.59*** 6.19** 2.41 602 93
(1.40) (2.07) (1.95) (2.43) (2.09)Abnormal Deliveries 1.64 1.35 -0.70 -2.49 1.26 595 92
(1.01) (1.71) (1.17) (1.58) (1.74)
Family Planning Indicators per 1,000 Women of Fertile AgeAbortions 4.87*** -3.23* 1.56 -3.51* -3.35* 571 92
(1.34) (1.81) (1.24) (1.88) (1.84)Use of Contrac. Pills 32.35* -33.76 -12.98 -48.07* -35.48 580 93
(17.58) (21.33) (16.18) (24.57) (21.76)
See Notes to Table 4
44
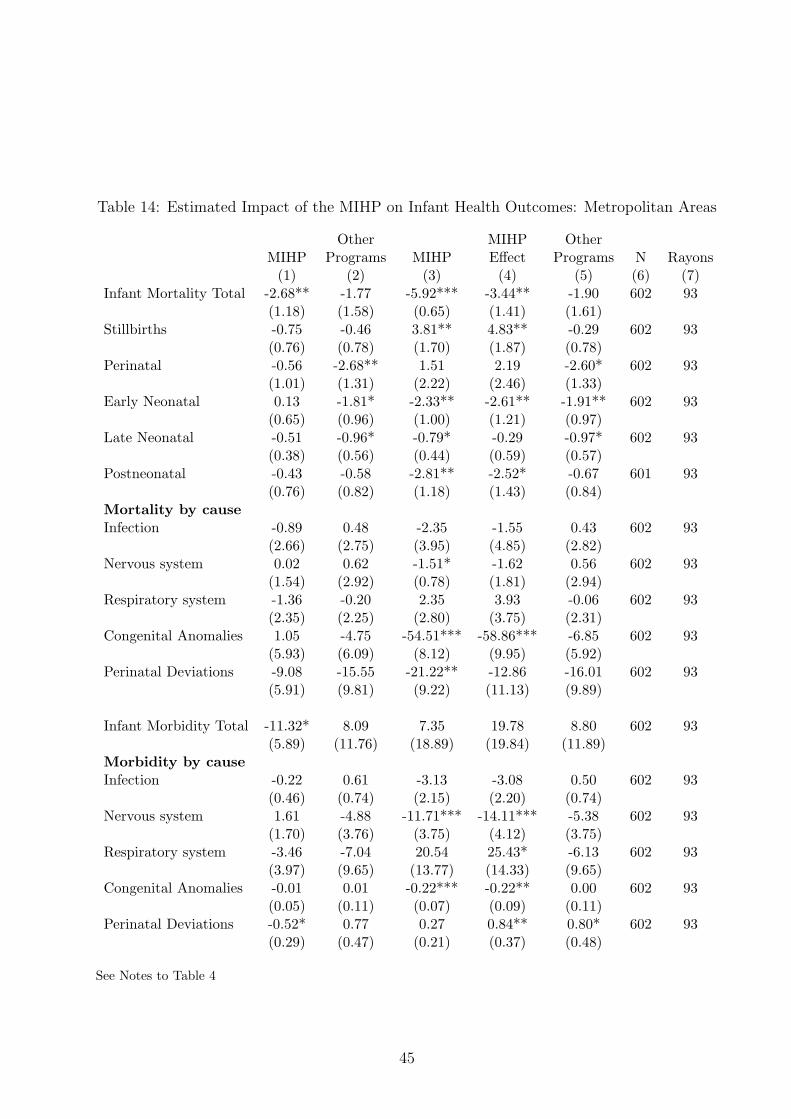
Table 14: Estimated Impact of the MIHP on Infant Health Outcomes: Metropolitan Areas
Other MIHP OtherMIHP Programs MIHP Effect Programs N Rayons
(1) (2) (3) (4) (5) (6) (7)Infant Mortality Total -2.68** -1.77 -5.92*** -3.44** -1.90 602 93
(1.18) (1.58) (0.65) (1.41) (1.61)Stillbirths -0.75 -0.46 3.81** 4.83** -0.29 602 93
(0.76) (0.78) (1.70) (1.87) (0.78)Perinatal -0.56 -2.68** 1.51 2.19 -2.60* 602 93
(1.01) (1.31) (2.22) (2.46) (1.33)Early Neonatal 0.13 -1.81* -2.33** -2.61** -1.91** 602 93
(0.65) (0.96) (1.00) (1.21) (0.97)Late Neonatal -0.51 -0.96* -0.79* -0.29 -0.97* 602 93
(0.38) (0.56) (0.44) (0.59) (0.57)Postneonatal -0.43 -0.58 -2.81** -2.52* -0.67 601 93
(0.76) (0.82) (1.18) (1.43) (0.84)Mortality by causeInfection -0.89 0.48 -2.35 -1.55 0.43 602 93
(2.66) (2.75) (3.95) (4.85) (2.82)Nervous system 0.02 0.62 -1.51* -1.62 0.56 602 93
(1.54) (2.92) (0.78) (1.81) (2.94)Respiratory system -1.36 -0.20 2.35 3.93 -0.06 602 93
(2.35) (2.25) (2.80) (3.75) (2.31)Congenital Anomalies 1.05 -4.75 -54.51*** -58.86*** -6.85 602 93
(5.93) (6.09) (8.12) (9.95) (5.92)Perinatal Deviations -9.08 -15.55 -21.22** -12.86 -16.01 602 93
(5.91) (9.81) (9.22) (11.13) (9.89)
Infant Morbidity Total -11.32* 8.09 7.35 19.78 8.80 602 93(5.89) (11.76) (18.89) (19.84) (11.89)
Morbidity by causeInfection -0.22 0.61 -3.13 -3.08 0.50 602 93
(0.46) (0.74) (2.15) (2.20) (0.74)Nervous system 1.61 -4.88 -11.71*** -14.11*** -5.38 602 93
(1.70) (3.76) (3.75) (4.12) (3.75)Respiratory system -3.46 -7.04 20.54 25.43* -6.13 602 93
(3.97) (9.65) (13.77) (14.33) (9.65)Congenital Anomalies -0.01 0.01 -0.22*** -0.22** 0.00 602 93
(0.05) (0.11) (0.07) (0.09) (0.11)Perinatal Deviations -0.52* 0.77 0.27 0.84** 0.80* 602 93
(0.29) (0.47) (0.21) (0.37) (0.48)
See Notes to Table 4
45
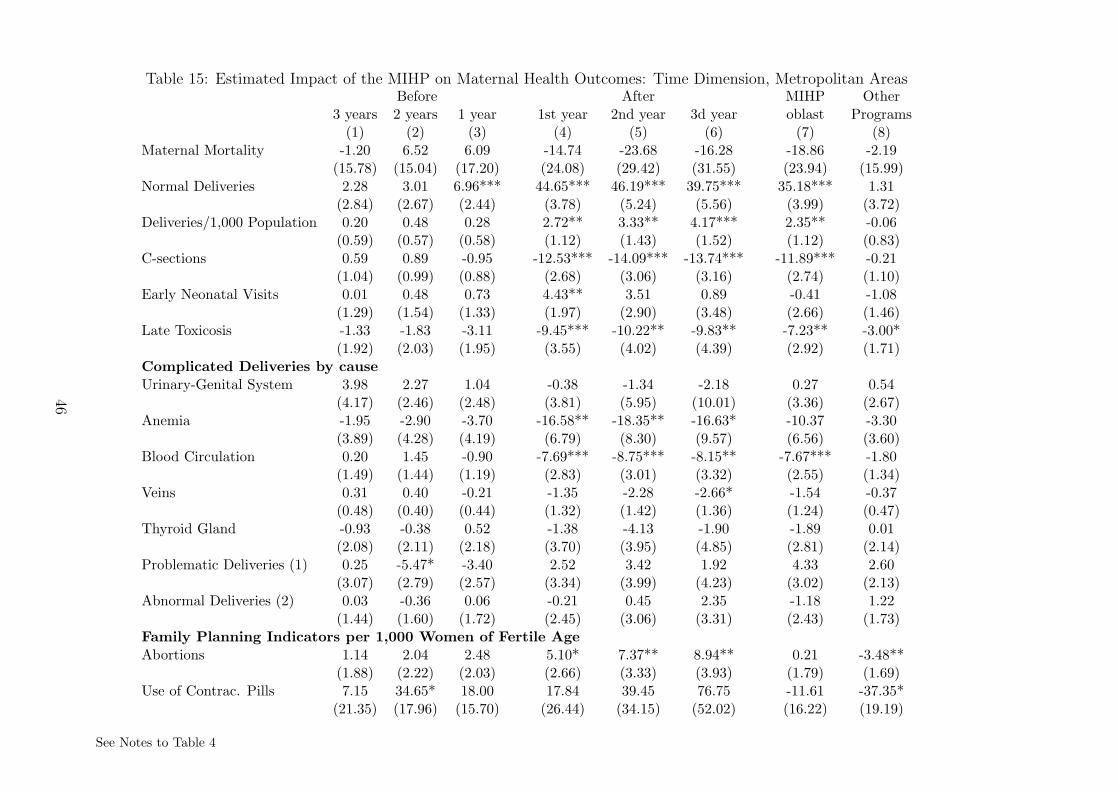
Table 15: Estimated Impact of the MIHP on Maternal Health Outcomes: Time Dimension, Metropolitan AreasBefore After MIHP Other
3 years 2 years 1 year 1st year 2nd year 3d year oblast Programs(1) (2) (3) (4) (5) (6) (7) (8)
Maternal Mortality -1.20 6.52 6.09 -14.74 -23.68 -16.28 -18.86 -2.19(15.78) (15.04) (17.20) (24.08) (29.42) (31.55) (23.94) (15.99)
Normal Deliveries 2.28 3.01 6.96*** 44.65*** 46.19*** 39.75*** 35.18*** 1.31(2.84) (2.67) (2.44) (3.78) (5.24) (5.56) (3.99) (3.72)
Deliveries/1,000 Population 0.20 0.48 0.28 2.72** 3.33** 4.17*** 2.35** -0.06(0.59) (0.57) (0.58) (1.12) (1.43) (1.52) (1.12) (0.83)
C-sections 0.59 0.89 -0.95 -12.53*** -14.09*** -13.74*** -11.89*** -0.21(1.04) (0.99) (0.88) (2.68) (3.06) (3.16) (2.74) (1.10)
Early Neonatal Visits 0.01 0.48 0.73 4.43** 3.51 0.89 -0.41 -1.08(1.29) (1.54) (1.33) (1.97) (2.90) (3.48) (2.66) (1.46)
Late Toxicosis -1.33 -1.83 -3.11 -9.45*** -10.22** -9.83** -7.23** -3.00*(1.92) (2.03) (1.95) (3.55) (4.02) (4.39) (2.92) (1.71)
Complicated Deliveries by causeUrinary-Genital System 3.98 2.27 1.04 -0.38 -1.34 -2.18 0.27 0.54
(4.17) (2.46) (2.48) (3.81) (5.95) (10.01) (3.36) (2.67)Anemia -1.95 -2.90 -3.70 -16.58** -18.35** -16.63* -10.37 -3.30
(3.89) (4.28) (4.19) (6.79) (8.30) (9.57) (6.56) (3.60)Blood Circulation 0.20 1.45 -0.90 -7.69*** -8.75*** -8.15** -7.67*** -1.80
(1.49) (1.44) (1.19) (2.83) (3.01) (3.32) (2.55) (1.34)Veins 0.31 0.40 -0.21 -1.35 -2.28 -2.66* -1.54 -0.37
(0.48) (0.40) (0.44) (1.32) (1.42) (1.36) (1.24) (0.47)Thyroid Gland -0.93 -0.38 0.52 -1.38 -4.13 -1.90 -1.89 0.01
(2.08) (2.11) (2.18) (3.70) (3.95) (4.85) (2.81) (2.14)Problematic Deliveries (1) 0.25 -5.47* -3.40 2.52 3.42 1.92 4.33 2.60
(3.07) (2.79) (2.57) (3.34) (3.99) (4.23) (3.02) (2.13)Abnormal Deliveries (2) 0.03 -0.36 0.06 -0.21 0.45 2.35 -1.18 1.22
(1.44) (1.60) (1.72) (2.45) (3.06) (3.31) (2.43) (1.73)Family Planning Indicators per 1,000 Women of Fertile AgeAbortions 1.14 2.04 2.48 5.10* 7.37** 8.94** 0.21 -3.48**
(1.88) (2.22) (2.03) (2.66) (3.33) (3.93) (1.79) (1.69)Use of Contrac. Pills 7.15 34.65* 18.00 17.84 39.45 76.75 -11.61 -37.35*
(21.35) (17.96) (15.70) (26.44) (34.15) (52.02) (16.22) (19.19)
See Notes to Table 4
46

Table 16: Estimated Impact of the MIHP on Infant Health Outcomes: Time Dimension, Metropolitan AreasBefore After MIHP Other
3 years 2 years 1 year 1st year 2nd year 3d year oblast Programs(1) (2) (3) (4) (5) (6) (7) (8)
Infant total 1.56 -1.11 -1.43 -7.64*** -10.30*** -7.92*** -5.81*** -1.94(1.14) (1.20) (1.53) (1.96) (2.46) (2.98) (2.00) (1.57)
Stillbirths -0.11 -0.14 0.01 3.98* 4.37* 4.93* 5.38** -0.30(1.03) (1.07) (1.08) (2.29) (2.65) (2.89) (2.24) (0.77)
Perinatal -0.41 -1.79* -1.06 0.40 -0.24 1.22 1.85 -2.58**(0.93) (0.97) (1.20) (2.98) (3.73) (3.89) (3.04) (1.26)
Early Neonatal -0.48 -1.78** -1.22 -3.76** -4.77** -3.78* -3.52** -1.87**(0.69) (0.71) (0.79) (1.58) (1.98) (2.17) (1.54) (0.95)
Late Neonatal -0.11 -0.05 -0.52 -1.48* -2.01** -2.03* -1.11 -0.96*(0.58) (0.56) (0.55) (0.77) (0.98) (1.11) (0.72) (0.57)
Postneonatal 2.37** 0.80 -0.39 -3.17* -3.45* -2.63 -3.53** -0.74(0.94) (0.91) (1.20) (1.75) (2.00) (2.17) (1.74) (0.83)
Mortality by causeInfection 5.12* 1.19 -2.47 -5.65 -8.60 -8.12 -7.21 0.35
(2.71) (2.90) (3.31) (5.57) (7.29) (8.07) (6.78) (2.79)Nervous system 1.65 3.36* 0.79 -0.07 0.67 3.05 -0.68 0.39
(1.42) (1.81) (1.91) (2.46) (3.79) (4.43) (3.19) (2.73)Respiratory system -2.09 -2.60 -4.53 -2.73 -4.94 -1.55 0.62 0.02
(3.61) (3.69) (3.78) (5.02) (5.80) (7.42) (3.80) (2.20)Congenital Anomalies 6.80 -1.44 -1.94 -56.61*** -61.90*** -55.65*** -63.23*** -7.06
(8.04) (6.90) (6.56) (11.79) (14.00) (16.75) (12.11) (5.82)Perinatal Deviations -2.67 -9.30 -9.43 -31.72** -42.39** -28.75 -20.92 -15.96*
(7.87) (6.79) (7.78) (14.28) (19.12) (19.94) (15.03) (9.13)Morbidity Total 2.53 -3.57 -3.50 1.11 -5.64 -11.80 9.78 9.05
(8.34) (8.82) (7.38) (21.90) (22.62) (23.85) (20.25) (12.28)Morbidity by causeInfection 0.88 0.13 1.01 -2.15 -3.37 -3.30 -3.21 0.47
(0.78) (0.75) (0.71) (2.62) (2.91) (3.12) (2.65) (0.70)Nervous system 3.60 4.21 1.21 -9.77** -11.95** -6.63 -14.35*** -5.68
(2.31) (2.95) (2.59) (3.84) (4.69) (4.53) (3.26) (3.74)Respiratory system -2.96 -1.95 -0.73 16.41 14.45 -3.23 17.86 -5.58
(5.62) (6.81) (6.80) (15.38) (16.15) (21.37) (13.76) (8.03)Congenital Anomalies 0.15* 0.20** 0.14 -0.07 -0.13 -0.18 -0.23 -0.01
(0.09) (0.08) (0.14) (0.17) (0.19) (0.21) (0.15) (0.10)Perinatal Deviations -0.01 -0.46 -0.53 -0.35 -0.19 -0.36 0.50 0.82*
(0.37) (0.37) (0.38) (0.48) (0.63) (0.71) (0.42) (0.48)
See Notes to Table 4
47
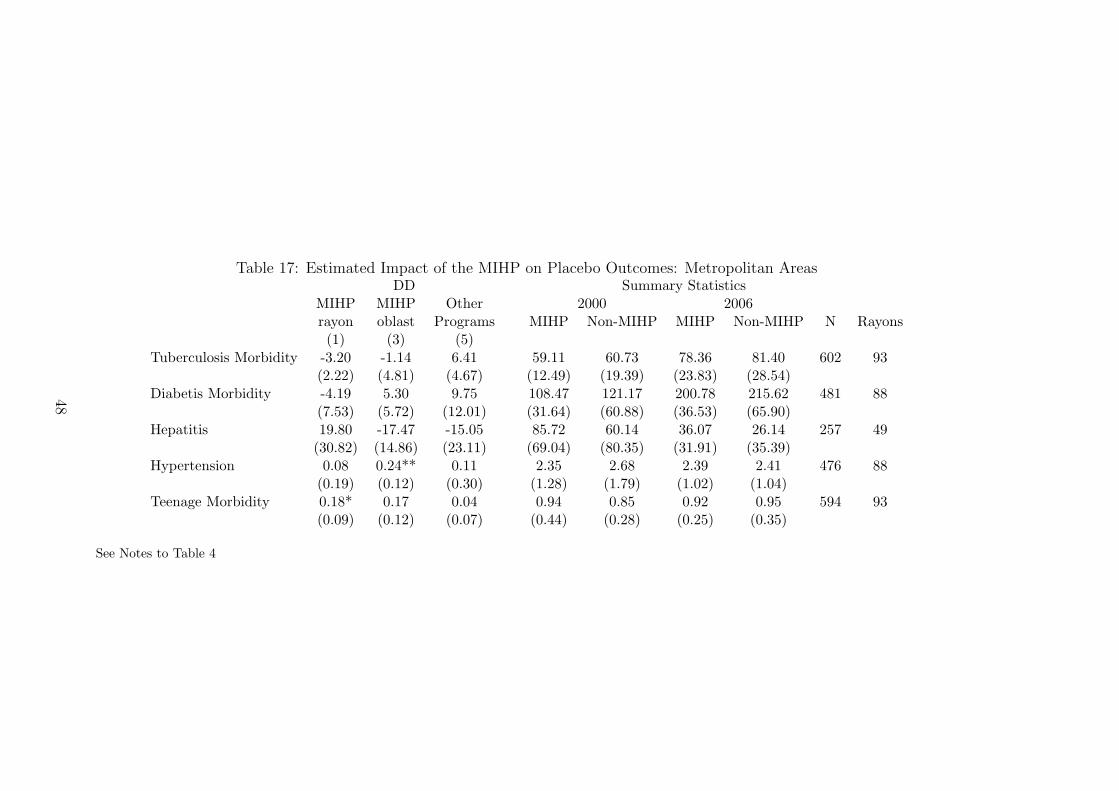
Table 17: Estimated Impact of the MIHP on Placebo Outcomes: Metropolitan AreasDD Summary Statistics
MIHP MIHP Other 2000 2006rayon oblast Programs MIHP Non-MIHP MIHP Non-MIHP N Rayons(1) (3) (5)
Tuberculosis Morbidity -3.20 -1.14 6.41 59.11 60.73 78.36 81.40 602 93(2.22) (4.81) (4.67) (12.49) (19.39) (23.83) (28.54)
Diabetis Morbidity -4.19 5.30 9.75 108.47 121.17 200.78 215.62 481 88(7.53) (5.72) (12.01) (31.64) (60.88) (36.53) (65.90)
Hepatitis 19.80 -17.47 -15.05 85.72 60.14 36.07 26.14 257 49(30.82) (14.86) (23.11) (69.04) (80.35) (31.91) (35.39)
Hypertension 0.08 0.24** 0.11 2.35 2.68 2.39 2.41 476 88(0.19) (0.12) (0.30) (1.28) (1.79) (1.02) (1.04)
Teenage Morbidity 0.18* 0.17 0.04 0.94 0.85 0.92 0.95 594 93(0.09) (0.12) (0.07) (0.44) (0.28) (0.25) (0.35)
See Notes to Table 4
48
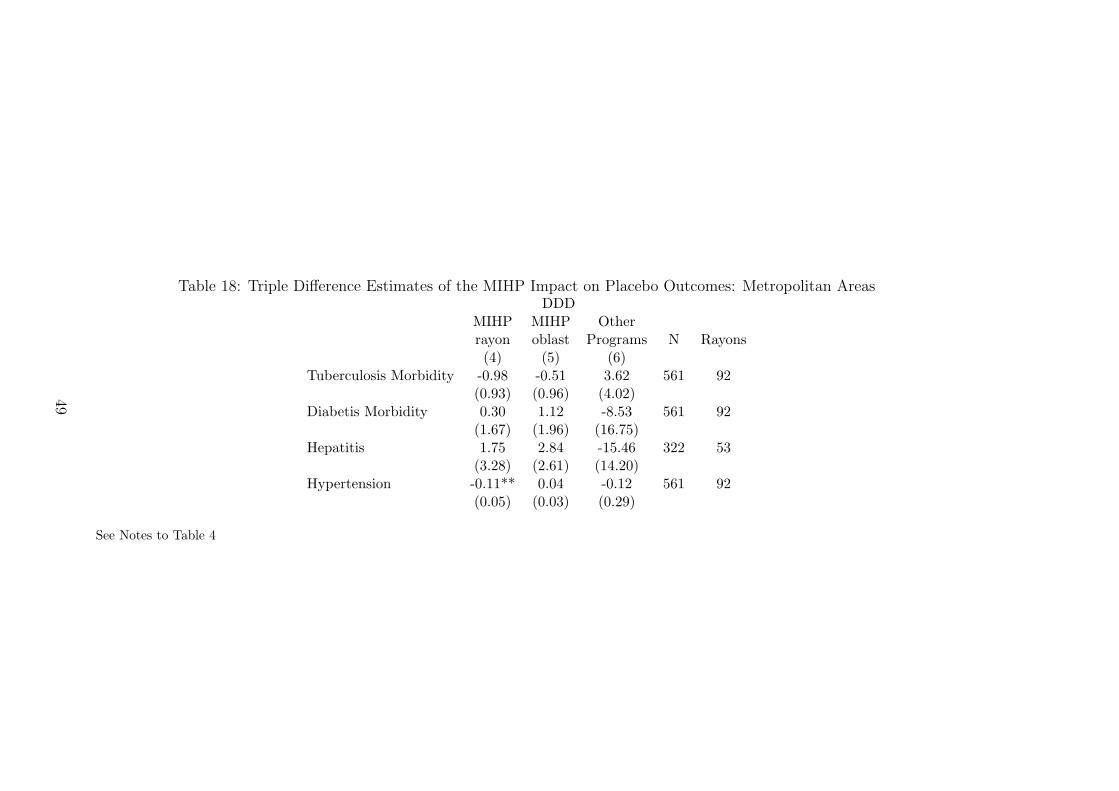
Table 18: Triple Difference Estimates of the MIHP Impact on Placebo Outcomes: Metropolitan AreasDDD
MIHP MIHP Otherrayon oblast Programs N Rayons(4) (5) (6)
Tuberculosis Morbidity -0.98 -0.51 3.62 561 92(0.93) (0.96) (4.02)
Diabetis Morbidity 0.30 1.12 -8.53 561 92(1.67) (1.96) (16.75)
Hepatitis 1.75 2.84 -15.46 322 53(3.28) (2.61) (14.20)
Hypertension -0.11** 0.04 -0.12 561 92(0.05) (0.03) (0.29)
See Notes to Table 4
49
A Description of the Cost Impact Study implemented
by the MIHP (Lefevre-Cholay et al., 2006)
The Cost Impact Study (CIS) was designed to evaluate the financial im-
pact of the MIHP interventions in the Project pilot maternities and to provide
health facilities and policy makers with information for replication of MIHP
practices.
The Project management team has selected three MIHP facilities: Lutsk,
Kovel, and Donetsk No.3. There were two criteria for selection. First, the
annual number of deliveries is to exceed 1,000 cases. Second, the maternities
are to be involved with the project since 2003.
For the purpose of CIS, the project management team has collected the
data using the following tools: the Patient Record Review Form, the Prices
and Supply Costs Form, and the Interview Guide.
The Patient Record Review Form was randomly offered to patients who
gave birth in the target facilities. A total of 200 records were reviewed in each
facility - 100 from 2002 and other 100 selected in 2005. The Form covered
topics such as admission and discharge time, type of delivery, types of lab
tests performed and medicines used, as well as other information helpful for
comparing delivery-related practices before and after MIHP interventions.
The Prices and Supply Costs Form was aimed at quantifying the resources
used for MIHP practices, which were revealed via the Patient Record Review
Form. The types of resources included drugs, injection supplies, lab tests
and diagnostic procedures, and infant formula. Initially, the study design
involved collecting prices of each resource from the facility pharmacies and
local pharmacies, and calculating an average price. However, this data was
extremely sensitive to local market imbalances. Thus, eventually it was de-
50
cided to use the ”standard prices” based on the lowest wholesale offers found
in the national electronic trading system (www.apteka.com.ua). Unit prices
were collected solely from 2005. This allows the analysis to isolate the changes
in costs due to changes in practices and resources used as opposed to changes
in prices.
The Interview of the facility staff was conducted to corroborate the use of
practices, drugs and supplies listed in the Patient Record Review Forms. It
was also aimed to reveal under-reporting, over-reporting, miss-reporting, and
unexpected practices that arose during the record review process. A total
of 3 senior obstetrics-gynecologists, 3 midwives, and 3 neonatologists at the
three MIHP pilot facilities were interviewed.
51