Embed Size (px)
Citation preview
INTERIM REPORT
EVALUATION OF THE INSTALLATIONAND INITIAL CONDITION OF
HYDRAULIC CEMENT CONCRETE OVERLAYSPLACED ON THREE PAVEMENTS IN VIRGINIA
MICHAEL M. SPRINKEL, P.E.Research Manager
CELIK OZYILDIRIM, Ph.D.Principal Research Scientist
V·I·R·G·I·N·I·A
TRANSPORTATION RESEARCH COUNCIL
VIRGINIA TRANSPORTATION RESEARCH COUNCIL
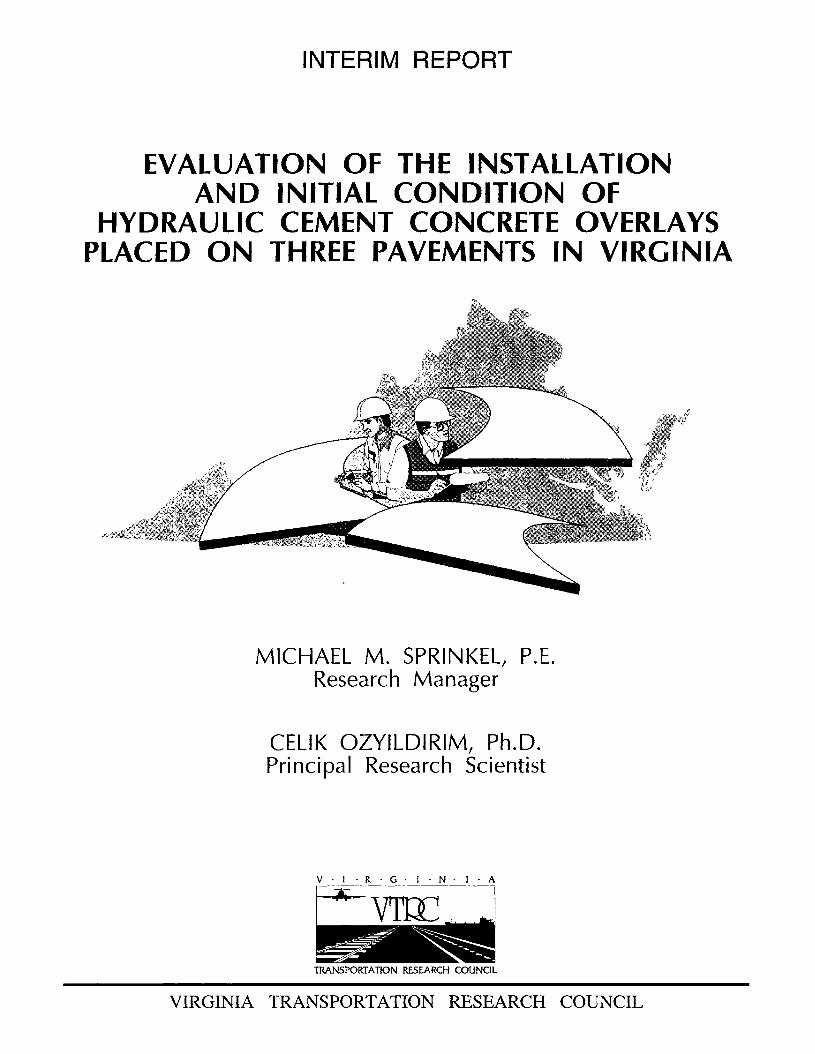
1. Report No.VTRC 99-IR3
Standard Title Page - Report on Federally Funded Project2. Government Accession No. 3. Recipient's Catalog No.
4. Title and SubtitleInterim Report: Evaluation of the Installation and Initial Condition ofHydraulic Cement Concrete Overlays Placed on Three Pavements in Virginia
7. Author(s)
Michael Sprinkel, Celik Ozyildirim
9. Performing Organization and Address
Virginia Transportation Research Council530 Edgemont RoadCharlottesville, VA 22903
5. Report DateApril 1999
6. Performing Organization Code
8. Performing Organization Report No.
10. Work Unit No. (TRAIS)
11. Contract or Grant No.00021549
12. Sponsoring Agencies' Name and Address
Virginia Department of Transportation1401 E. Broad StreetRichmond, VA 23219
15. Supplementary Notes
16. Abstract
FHWAP. O. Box 10249400 North 8th Street,Room 750Richmond, VA 23240
13. Type of Report and Period CoveredInterim, 1/95-3/99
14. Sponsoring Agency Code
Hydraulic cement concrete pavement overlays were placed in the summer of 1995 at the following locations in Virginia:
• 1-295 near Richmond
• 1-85 near Petersburg
• Rt. 29 near Charlottesville.
Overlays were placed on 1-295 SBL (near mile marker 29) and 1-85 SBL (near mile marker 51) in Virginia to prevent spalling causedby a shy cover over the reinforcement and to enhance the structural integrity. Both locations are continuously reinforced concretepavement. An overlay was also placed on Rt. 29 NBL (1.6 km south of Charlottesville) in Virginia to correct a rutted asphaltpavement.
The construction was funded with 20 percent Virginia Department of Transportation maintenance funds and 80 percent specialISTEA Section 6005 federal funds specifically allocated to demonstrate overlay technologies. ISTEA funds were also used toevaluate the installation and initial conditions of the overlays and to prepare the report. The variables in this study were concrete mixdesign, overlay thickness, and base material. Mineral admixtures and steel and plastic fibers were used to improve the mechanicalproperties and durability of the overlay concrete. Overlay thickness and base material were varied to determine their effect onoverlay performance.
17 Key Words
Overlay, Concrete, Pavement, White topping
18. Distribution StatementNo restrictions. This document is available to the public throughNTIS, Springfield, VA 22161.
19. Security Classif. (of this report)Unclassified
20. Security Classif. (of this page)Unclassified
21. No. of Pages39
22. Price
Form DOT F 1700.7 (8-72) Reproduction of completed page authorized
INTERIM REPORT
EVALUATION OF THE INSTALLATION AND INITIAL CONDITIONOF HYDRAULIC CEMENT CONCRETE OVERLAYS
PLACED ON THREE PAVEMENTS IN VIRGINIA
Michael M. Sprinkel, P.E.Research Manager
Celik Ozyildirim, Ph.D.Principal Research Scientist
(The opinions, findings, and conclusions expressed in thisreport are those of the authors and not necessarily those of
the sponsoring agencies.)
Virginia Transportation Research Council(A Cooperative Organization Sponsored Jointly by the
Virginia Department of Transportation andthe University of Virginia)
In Cooperation with the U.S. Department of TransportationFederal Highway Administration
Charlottesville, Virginia
April 1999VTRC 99-IR3

Copyright 1999 by the Virginia Department of Transportation.
ii
1. Project Introduction
1.1 Summary
Hydraulic cement concrete (HCC) pavement overlays were placed in the summer of 1995 at thefollowing locations in Virginia:
• 1-295 near Richmond• 1-85 near Petersburg• Rte. 29 near Charlottesville.
Overlays were placed on the 1-295 southbound lane (SBL) (near mile marker 29) and the 1-85SBL (near mile marker 51) to prevent spalling caused by a shy cover over the reinforcement andto enhance the structural integrity. Both locations are continuously reinforced concretepavement. An overlay was also placed on the Rte. 29 northbound land (NBL) (1.6 km south ofCharlottesville) to correct a rutted asphalt pavement.
The construction was funded with 20 percent Virginia Department of Transportation (VDOT)maintenance funds and 80 percent special ISTEA Section 6005 federal funds specificallyallocated to demonstrate overlay technologies. ISTEA funds were also used to evaluate theinstallation and initial conditions of the overlays and to prepare the report.
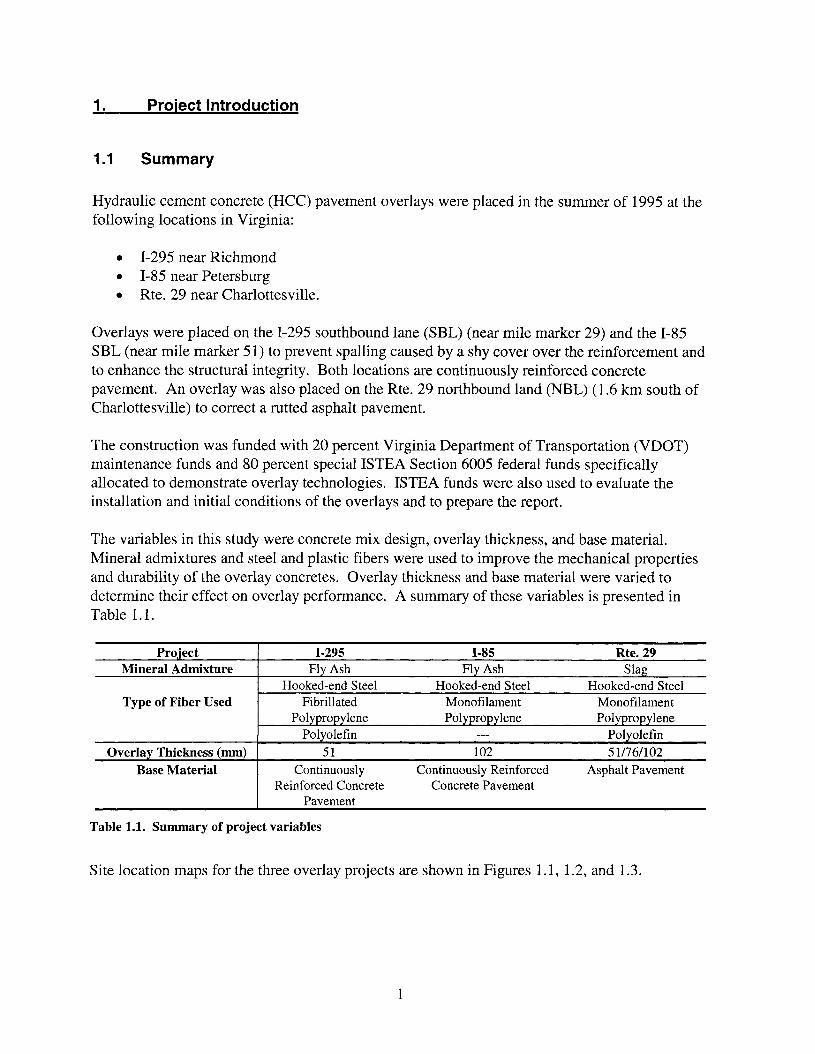
The variables in this study were concrete mix design, overlay thickness, and base material.Mineral admixtures and steel and plastic fibers were used to improve the mechanical propertiesand durability of the overlay concretes. Overlay thickness and base material were varied todetermine their effect on overlay performance. A summary of these variables is presented inTable 1.1.
Project 1-295 1-85 Rte.29Mineral Admixture Fly Ash Fly Ash Slag
Hooked-end Steel Hooked-end Steel Hooked-end SteelType of Fiber Used Fibrillated Monofilament Monofilament
Polypropylene Polypropylene PolypropylenePolyolefin --- Polyolefin
Overlay Thickness (mm) 51 102 51/76/102Base Material Continuously Continuously Reinforced Asphalt Pavement
Reinforced Concrete Concrete PavementPavement
Table 1.1. Summary of project variables
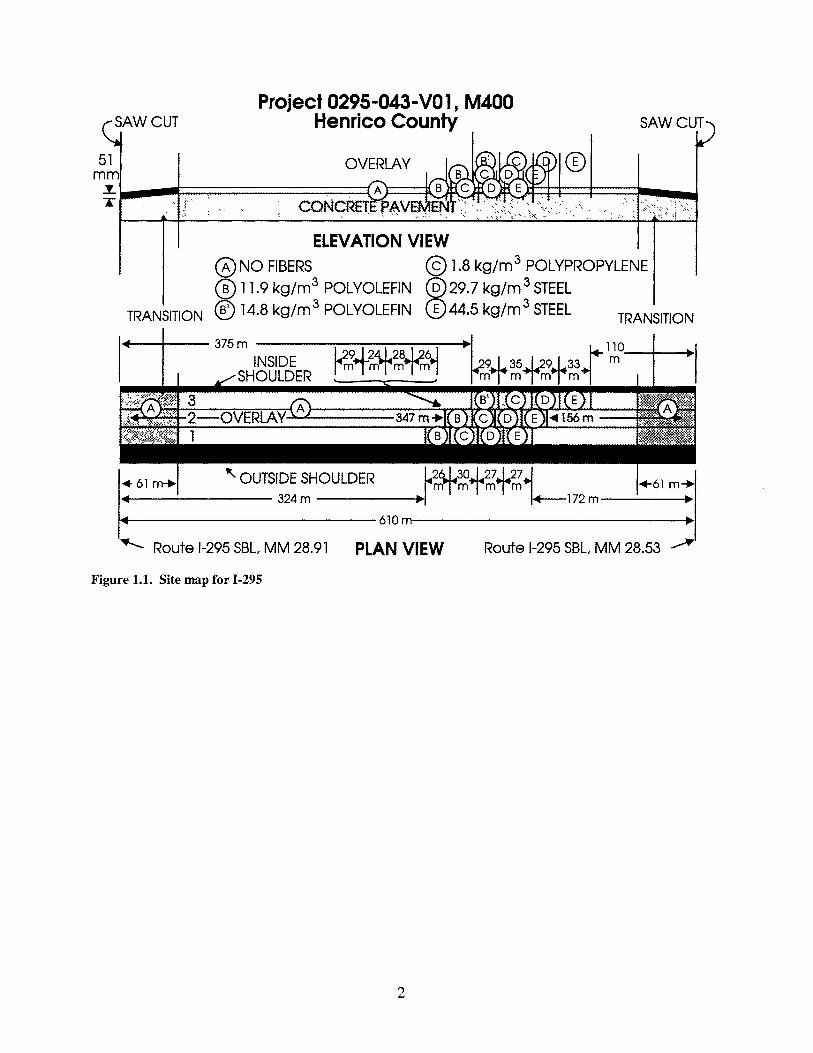
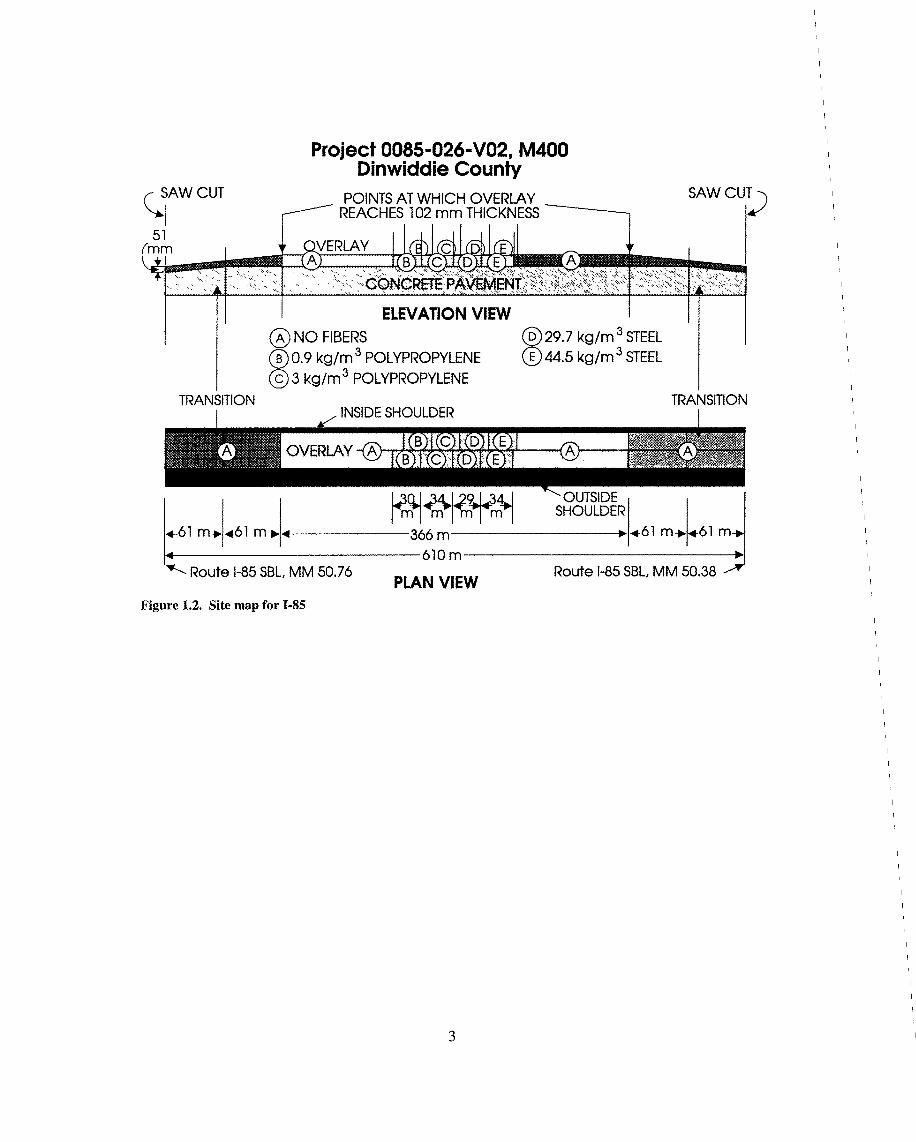
Site location maps for the three overlay projects are shown in Figures 1.1, 1.2, and 1.3.
1
CD
Project 0295-043-VO 1, M400Henrico CountySAW CUT
51 OVERLAY Cmm BCD
~I.-_~~========C=O=:;:N"C~R'e:::{rApIA\:lEA '3E
BN '?, ,,~,>:~A, F<,t=""t=",=,~=I, ==~,\~,~<,~.,~:".~~
:/'!!'It.V iVI .. .. ...... .. vo ..... ..":... .. ...... ~.. .... .. :: \ .......... t::( ...... : ...... .. -=--":. -:-
TRANSITIONTRANSITION
ELEVATION VIEWoNO FIBERS © 1.8 kg/m 3 POLYPROPYLENE® 11.9 kg/m3 POLYOLEFIN @29.7 kg/m 3 STEEL® 14.8 kg/m 3 POLYOLEFIN CD 44.5 kg/m 3 STEEL
~~~~+~+~L1.-------324 m -----...1 172m----a-I
...------------610m---------------....
~ Route 1-295 SBL, MM 28.91 PLAN VIEW Route 1-295 SBL, MM 28.53 ~
Figure 1.1. Site map for 1-295
2
I
I
I
I
I
I
I
I
I
I
I
I
I
I
I
I
I
I
I
I
I
I
I
I
I
I
I
I
I
I
I
I
I
I
I
I
I
I
I
I
I
I
I
I
I
I
I
I
I
I
I
I
I
I
I
I
I
I
I
I
I
I
I
I
I
I
I
I
I
I
I
I
I
I
I
I
I
I
I
I
I
TRANSITION
@29.7 kg/m 3 STEEL®44.5 kg/m 3 STEEL
Project 0085-026-V02, M400Dinwiddie County
POINTS AT WHICH OVERLAYREACHES 102 mm THICKNESS
ELEVATION VIEW@[email protected] kg/m 3 POLYPROPYLENE©3 kg/m 3 POLYPROPYLENE
TRANSITION
3
~m~~m~i,9fJ1 s~~G~g~R.-61 m...61 m....I.......------366m--------.......61 m...61 m..
••...------------610 m •~ Route 1-85 SBl, MM 50.76 Route 1-85 SBl, MM 50.38 ~
PLAN VIEW
c..iAWCUT51
mm VERLAY CI A B" C"'D, E A.~.~~__J,,?' -: ~,:,:~:' :,. ""':~':'"~" ,',,::',',' '" '~:~'~GR€TEJ~~j~~~1'~\~1~~~:~i~;~
Figure 1.2. Site map for 1-85
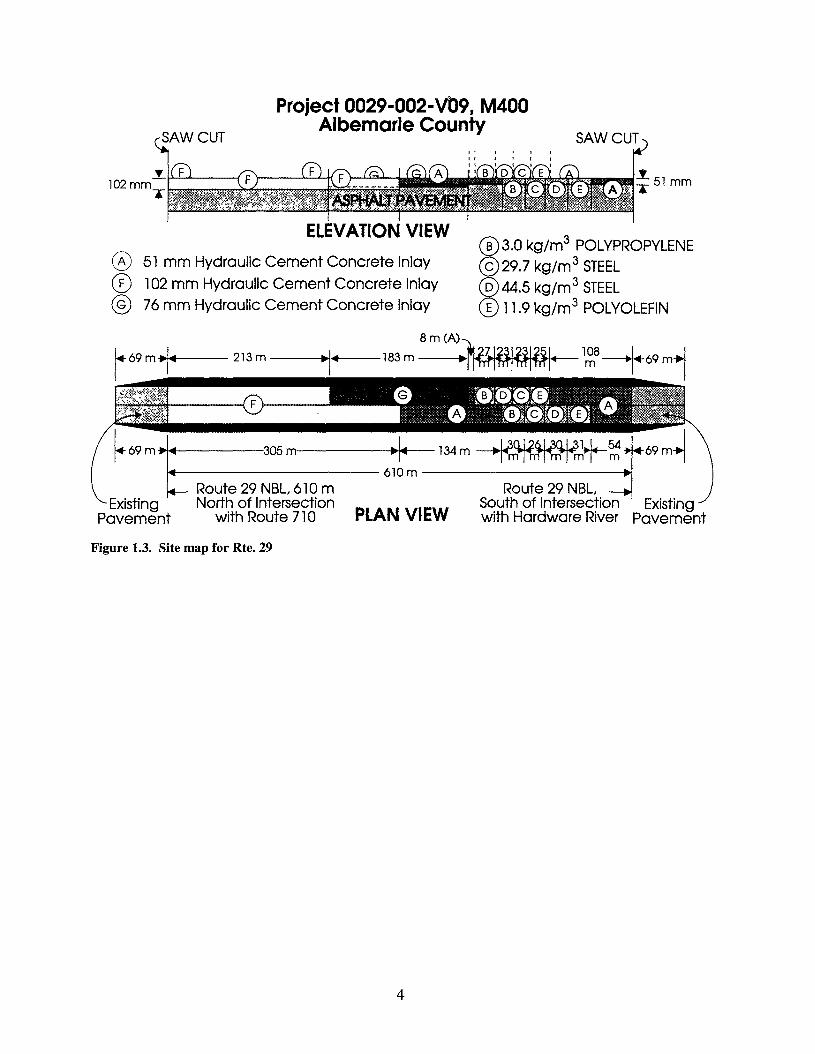
® 3.0 kg/m3 [email protected] kg/m3 [email protected] kg/m 3 STEEL® 11.9 kg/m3 POLYOLEFIN
Project 0029-002-vD9 J M400Albemarle County
ELEVATION VIEW
® 51 mm Hydraulic Cement Concrete Inlay
® 102 mm Hydraulic Cement Concrete Inlay® 76 mm Hydraulic Cement Concrete Inlay
Route 29 NBL,South of Intersection Existingwith Hardware River Pavement
~69m~---305m------...~~134 m ~_~~+-~~---------- 610 m -----------al
8m (A)
~-- 213m----.J~I,·...--183m ~+-1~8_+69m1
~------- G B' D'C E
B-C..~ .. ..
Route 29 NBL, 610 mExisting North of Intersection
Pavement with Route 710 PLAN VIEW
Figure 1.3. Site map for Rte. 29
4
1.2 Objective
The objective of this research is to evaluate HCC pavement overlays with pozzolans and slag andwith and without fibers constructed using ISTEA Section 6005 funds. The overlays were placedto correct for shy cover over the reinforcement or rutting and to enhance the structural integrity ofthe pavements.
1.3 Methodology
The objective is to be accomplished by completing the following tasks:
• Task 1: Evaluate conditions of each pavement before overlay is placed.• Task 2: Document the specifications used for each installation.• Task 3: Record results of quality assurance testing for each overlay.• Task 4: Evaluate initial conditions of each installation.• Task 5: Evaluate the condition of each installation annually.• Task 6: Evaluate final condition of installation in 1999.• Task 7: Submit draft and final report to the Federal Highway Administration (FHWA).
Tasks 1 through 5 are discussed in this report.
5
2. Evaluation of Conditions Prior to Installation
2.1 Map of Cracks and Patches
Maps of cracks and patches from a preinstallation survey are on file.
2.2 Permeability to Chloride Ion (AASHTO T 277)
Prior to placement of the overlays on 1-295 and 1-85, eight cores 102 mm (4 in) in diameter weretaken from the HCC pavement at each site. No cores were taken from the asphalt pavement onRt. 29.
Slice 51 mm (2 in) thick were cut from the top 51 mm and the next 51 mm of each core. Theslices were tested for permeability to chloride ion (AASHTO T 277). The results were asfollows:
1-295 top 51 mm, 1489 coulombs1-295 next 51 mm, 4463 coulombs1-85 top 51 mm, 1781 coulombs1-85 next 51 mm, 6473 coulombs.
The top part of both pavements had a low permeability and the next part a high permeability.The permeability is considered to be typical for pavements constructed without pozzolans or slag.
2.3 Falling Weight Deflectometer (ASTM D 4694)
See Section 5.2 for plots of composite stiffness vs. distance. These plots compare the compositestiffness of the pavement before and after the overlays were placed.
2.4 Preinstallation Photographic Record
A video of preplacement conditions is available.
6
3. Specifications for Installation
3.1 Site Preparation and Preoverlay Repairs
No patching was required on 1-295 and Rte. 29. A small area on 1-85 was patched prior toplacement of the overlay. The first and last 61 m of the 1-295 and 1-85 placements were milled toprovide for a 51-mm minimum thickness overlay at the beginning and end of each installation.Milling was used throughout the 610-m installation to remove the asphalt necessary to providethe required overlay (inlay) thickness.
3.2 Surface Preparation
The continuously reinforced concrete pavements were shotblasted to remove the top 3 Illill, andthe asphalt pavement was broomed to remove milling dust prior to placement of the overlays. Awater truck was used to flood the prepared surfaces and to maintain a saturated surface-drycondition as the overlays were placed.
3.3 Overlay Technology
Several overlay technologies were explored in this project. An evaluation of different concretesmodified with mineral admixtures was conducted by varying the amount of fly ash and slag inthe concretes. Different fiber types and amounts were added to each of the three overlayconcretes, allowing for comparison of the performance of concrete overlays with and withoutfibers. The overlay thickness was varied to compare cracking tendencies and patterns andpavement stiffness as determined by a falling weight deflectometer (See Section 5.2).
3.4 Fiber-Reinforced Concrete Symbolic Designations
The symbols in Table 3.1 will be used throughout the report to designate the types of fiberreinforced concrete (FRC) used in this project.
7
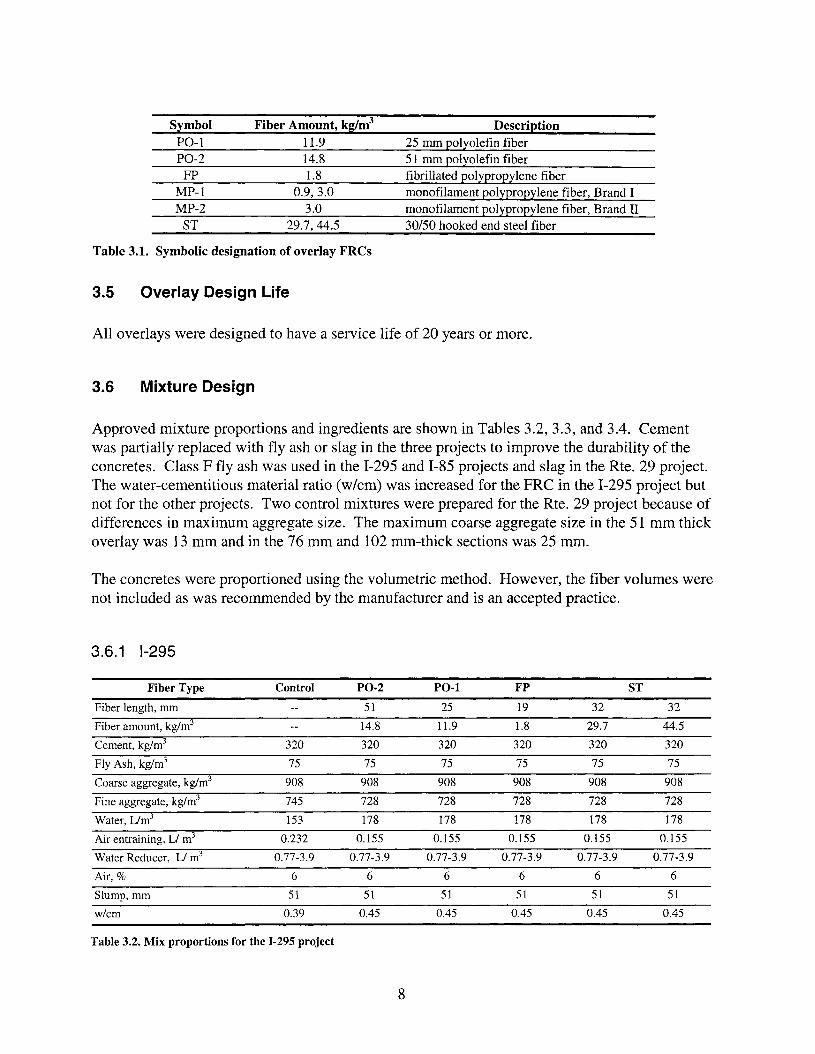
SymbolPO-1PO-2FP
MP-1MP-2
ST
Fiber Amount, kglm3
11.914.81.8
0.9,3.03.0
29.7,44.5
Description25 mm polyolefin fiber51 mm polyolefin fiberfibrillated polypropylene fibermonofilament polypropylene fiber, Brand Imonofilament polypropylene fiber, Brand II30/50 hooked end steel fiber
Table 3.1. Symbolic designation of overlay FRCs
3.5 Overlay Design Life
All overlays were designed to have a service life of 20 years or more.
3.6 Mixture Design
Approved mixture proportions and ingredients are shown in Tables 3.2,3.3, and 3.4. Cementwas partially replaced with fly ash or slag in the three projects to improve the durability of theconcretes. Class F fly ash was used in the 1-295 and 1-85 projects and slag in the Rte. 29 project.The water-cementitious material ratio (w/cm) was increased for the FRC in the 1-295 project butnot for the other projects. Two control mixtures were prepared for the Rte. 29 project because ofdifferences in maximum aggregate size. The maximum coarse aggregate size in the 51 mm thickoverlay was 13 mm and in the 76 mm and 102 mm-thick sections was 25 mm.
The concretes were proportioned using the volumetric method. However, the fiber volumes werenot included as was recommended by the manufacturer and is an accepted practice.
3.6.1 1-295
Fiber Type Control PO-2 PO-! FP ST
Fiber length, mm 51 25 19 32 32
Fiber amount, kg/m3 14.8 11.9 1.8 29.7 44.5
Cement, kg/m3 320 320 320 320 320 320
Fly Ash, kg/m3 75 75 75 75 75 75
Coarse aggregate, kg/m3 908 908 908 908 908 908
Fine aggregate, kg/m3 745 728 728 728 728 728
Water, L/m3 153 178 178 178 178 178
Air entraining, L/ m3 0.232 0.155 0.155 0.155 0.155 0.155
Water Reducer, L/ m3 0.77-3.9 0.77-3.9 0.77-3.9 0.77-3.9 0.77-3.9 0.77-3.9
Air, % 6 6 6 6 6 6
Slump, mm 51 51 51 51 51 51
w/cm 0.39 0.45 0.45 0.45 0.45 0.45
Table 3.2. Mix proportions for the 1-295 project
8
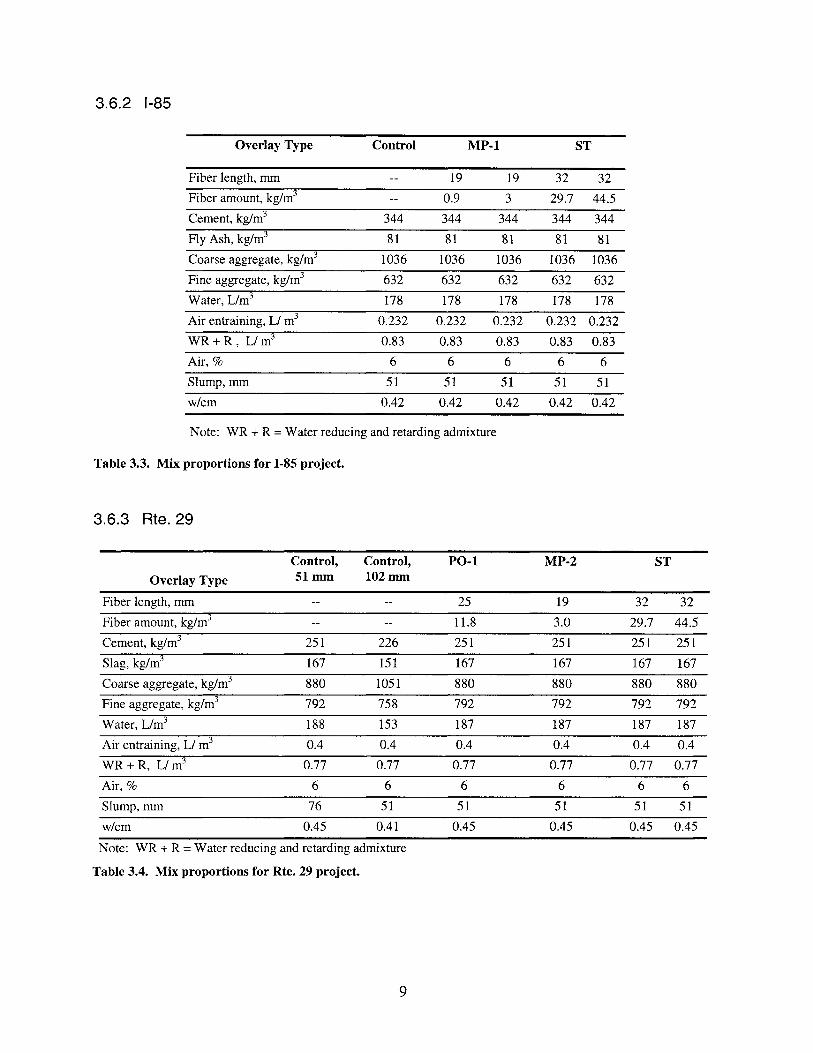
3.6.2 1-85
Overlay Type Control MP-l ST
Fiber length, mm 19 19 32 32Fiber amount, kg/m3 0.9 3 29.7 44.5Cement, kg/m3 344 344 344 344 344Fly Ash, kg/m3 81 81 81 81 81Coarse aggregate, kg/m3 1036 1036 1036 1036 1036Fine aggregate, kg/m3 632 632 632 632 632Water, L/m3 178 178 178 178 178Air entraining, L/ m3 0.232 0.232 0.232 0.232 0.232WR+R, L/m3 0.83 0.83 0.83 0.83 0.83Air, % 6 6 6 6 6Slump, mm 51 51 51 51 51w/cm 0.42 0.42 0.42 0.42 0.42
Note: WR + R =Water reducing and retarding admixture
Table 3.3. Mix proportions for 1-85 project.
3.6.3 Rte.29
Control, Control, PO-l MP-2 ST
Overlay Type 5lmm lO2mm
Fiber length, mm 25 19 32 32
Fiber amount, kg/m3 11.8 3.0 29.7 44.5
Cement, kg/m3 251 226 251 251 251 251
Slag, kg/m3 167 151 167 167 167 167
Coarse aggregate, kg/m3 880 1051 880 880 880 880
Fine aggregate, kg/m3 792 758 792 792 792 792
Water, L/m3 188 153 187 187 187 187
Air entraining, L/ m3 0.4 0.4 0.4 0.4 0.4 0.4
WR+R, L/m3 0.77 0.77 0.77 0.77 0.77 0.77
Air, % 6 6 6 6 6 6
Slump, mm 76 51 51 51 51 51
w/cm 0.45 0.41 0.45 0.45 0.45 0.45
Note: WR + R =Water reducing and retarding admixture
Table 3.4. Mix proportions for Rte. 29 project.
9
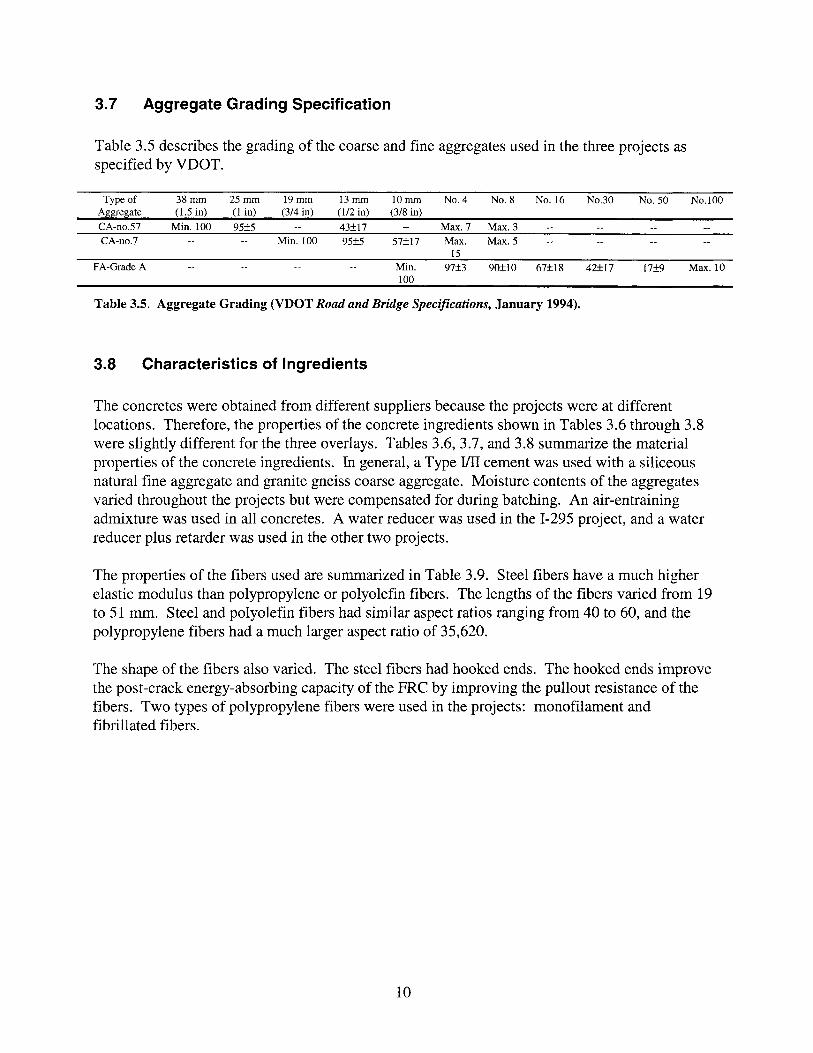
3.7 Aggregate Grading Specification
Table 3.5 describes the grading of the coarse and fine aggregates used in the three projects asspecified by VDOT.
Type of 38mm 25mm 19mm 13mm 10mm NO.4 No.8 No. 16 No.30Aggregate (1.5 in) (l in) (3/4 in) (1/2 in) (3/8 in)
CA-no.57 Min. 100 95±5 43±17 Max. 7 Max. 3CA-no.7 Min. 100 95±5 57±17 Max. Max. 5
15FA-Grade A Min. 97±3 90±10 67±18 42±17
100
Table 3.5. Aggregate Grading (VDOT Road and Bridge Specifications, January 1994).
No. 50 No.IOO
17±9 Max. 10
3.8 Characteristics of Ingredients
The concretes were obtained from different suppliers because the projects were at differentlocations. Therefore, the properties of the concrete ingredients shown in Tables 3.6 through 3.8were slightly different for the three overlays. Tables 3.6, 3.7, and 3.8 summarize the materialproperties of the concrete ingredients. In general, a Type IIII cement was used with a siliceousnatural fine aggregate and granite gneiss coarse aggregate. Moisture contents of the aggregatesvaried throughout the projects but were compensated for during batching. An air-entrainingadmixture was used in all concretes. A water reducer was used in the 1-295 project, and a waterreducer plus retarder was used in the other two projects.
The properties of the fibers used are summarized in Table 3.9. Steel fibers have a much higherelastic modulus than polypropylene or polyolefin fibers. The lengths of the fibers varied from 19to 51 mm. Steel and polyolefin fibers had similar aspect ratios ranging from 40 to 60, and thepolypropylene fibers had a much larger aspect ratio of 35,620.
The shape of the fibers also varied. The steel fibers had hooked ends. The hooked ends improvethe post-crack energy-absorbing capacity of the FRC by improving the pullout resistance of thefibers. Two types of polypropylene fibers were used in the projects: monofilament andfibrillated fibers.
10
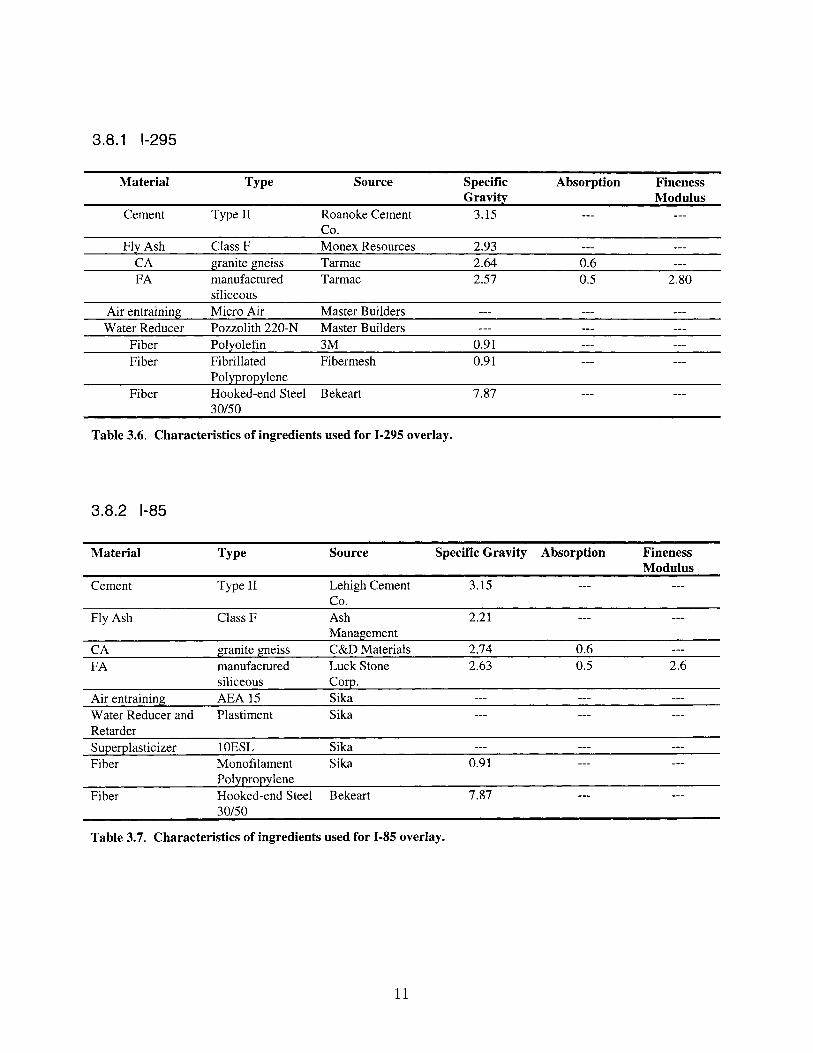
3.8.1 1-295
Material Type Source
Cement Type II Roanoke CementCo.
Fly Ash Class F Monex ResourcesCA granite gneiss TarmacFA manufactured Tarmac
siliceousAir entraining Micro Air Master BuildersWater Reducer Pozzolith 220-N Master Builders
Fiber Polyolefin 3MFiber Fibrillated Fibermesh
PolypropyleneFiber Hooked-end Steel Bekeart
30/50
Table 3.6. Characteristics of ingredients used for 1-295 overlay.
SpecificGravity
3.15
2.932.642.57
0.910.91
7.87
Absorption
0.60.5
FinenessModulus
2.80
3.8.2 1-85
Material Type Source
Cement Type II Lehigh CementCo.
Fly Ash Class F AshManagement
CA granite gneiss C&D MaterialsFA manufactured Luck Stone
siliceous Corp.Air entraining AEA 15 SikaWater Reducer and Plastiment SikaRetarderSuperplasticizer 10ESL SikaFiber Monofilament Sika
PolypropyleneFiber Hooked-end Steel Bekeart
30/50
Specific Gravity Absorption FinenessModulus
3.15
2.21
2.74 0.62.63 0.5 2.6
0.91
7.87
Table 3.7. Characteristics of ingredients used for 1-85 overlay.
11
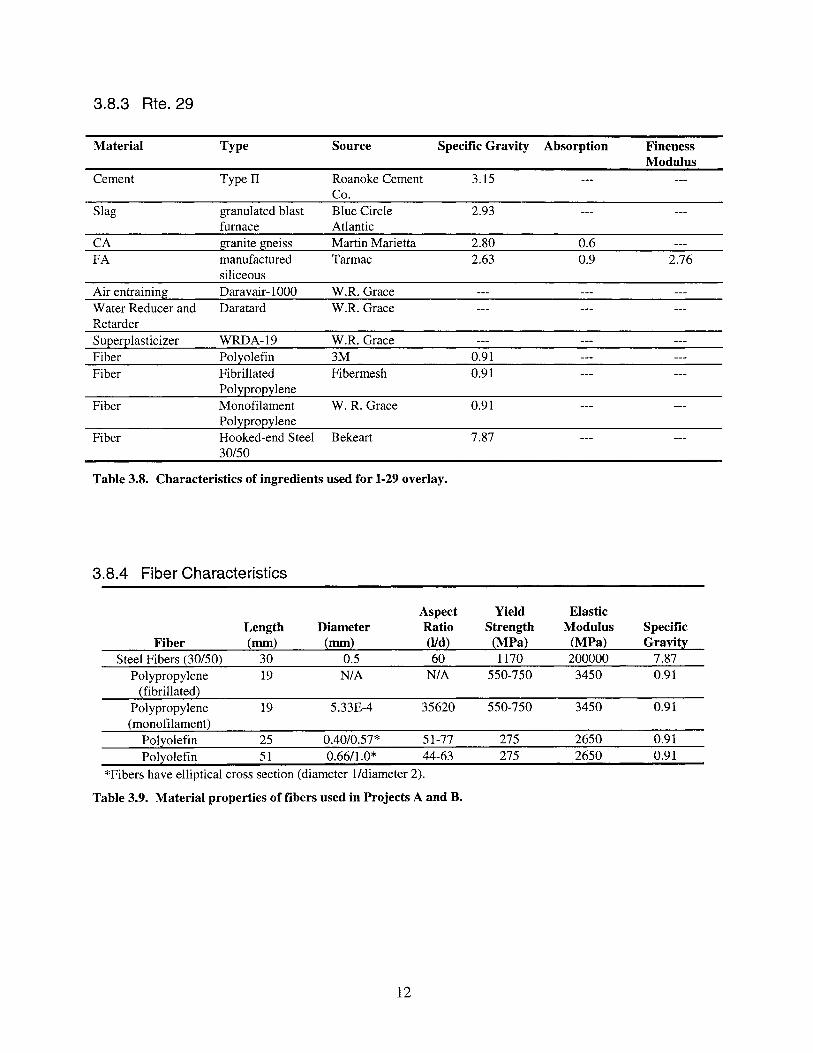
3.8.3 Rte.29
Material Type Source Specific Gravity Absorption FinenessModulus
Cement Type II Roanoke Cement 3.15Co.
Slag granulated blast Blue Circle 2.93furnace Atlantic
CA granite gneiss Martin Marietta 2.80 0.6FA manufactured Tarmac 2.63 0.9 2.76
siliceousAir entraining Daravair-1000 W.R. GraceWater Reducer and Daratard W.R. GraceRetarderSuperplasticizer WRDA-19 W.R. GraceFiber Polyolefin 3M 0.91Fiber Fibrillated Fibermesh 0.91
PolypropyleneFiber Monofilament W. R. Grace 0.91
PolypropyleneFiber Hooked-end Steel Bekeart 7.87
30/50
Table 3.8. Characteristics of ingredients used for 1-29 overlay.
3.8.4 Fiber Characteristics
Aspect Yield ElasticLength Diameter Ratio Strength Modulus Specific
Fiber (mm) (mm) (lid) (MPa) (MPa) GravitySteel Fibers (30/50) 30 0.5 60 1170 200000 7.87
Polypropylene 19 N/A N/A 550-750 3450 0.91(fibrillated)
Polypropylene 19 5.33E-4 35620 550-750 3450 0.91(monofilament)
Polyolefin 25 0.40/0.57* 51-77 275 2650 0.91Polyolefin 51 0.66/1.0* 44-63 275 2650 0.91
*Fibers have elliptical cross section (diameter 1/diameter 2).
Table 3.9. Material properties of fibers used in Projects A and B.
12
3.9 Curing Method and Time
A white pigmented liquid membrane curing material was sprayed onto the surface of the concretefollowing the tining operation for each project. Traffic was placed on the overlays after 6 days ofcure.
3.10 Bond Strength (VTM-92)
There was no standard specification for tensile bond strength.
3.11 Compressive Strength (ASTM C 39)
A minimum 28-day design compressive strength of 27.6 MPa (4000 psi) was required for theconcretes used in this project. This is higher than the 20.7 MPa (3000 psi) required for regularpaving concrete.
3.12 Grout
For each pavement overlay, the mortar fraction of the overlay concrete was broomed onto thebase asphalt or HCC. The coarse aggregate fraction was discarded.
13
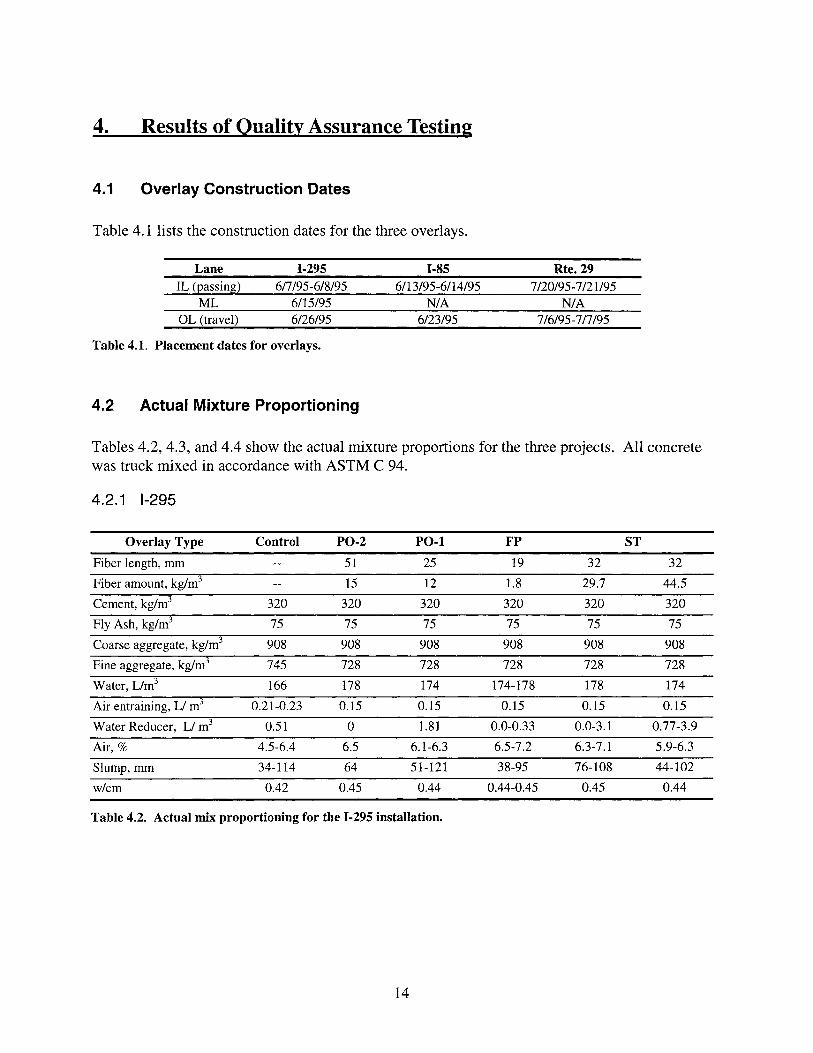
4. Results of Quality Assurance Testing
4.1 Overlay Construction Dates
Table 4.1 lists the construction dates for the three overlays.
LaneIL (passing)
MLOL (travel)
1-2956/7/95-6/8/95
6/15/956/26/95
1-856/13/95-6/14/95
N/A6/23/95
Rte.297/20/95-7/21/95
N/A7/6/95-7/7/95
Table 4.1. Placement dates for overlays.
4.2 Actual Mixture Proportioning
Tables 4.2, 4.3, and 4.4 show the actual mixture proportions for the three projects. All concretewas truck mixed in accordance with ASTM C 94.
4.2.1 1-295
Overlay Type Control PO-2 PO-l FP ST
Fiber length, mm 51 25 19 32 32
Fiber amount, kg/m3 15 12 1.8 29.7 44.5
Cement, kg/m3 320 320 320 320 320 320
Fly Ash, kg/m3 75 75 75 75 75 75
Coarse aggregate, kg/m3 908 908 908 908 908 908
Fine aggregate, kg/m3 745 728 728 728 728 728
Water, L/m3 166 178 174 174-178 178 174
Air entraining, L/ m3 0.21-0.23 0.15 0.15 0.15 0.15 0.15
Water Reducer, L/ m3 0.51 0 1.81 0.0-0.33 0.0-3.1 0.77-3.9
Air, % 4.5-6.4 6.5 6.1-6.3 6.5-7.2 6.3-7.1 5.9-6.3
Slump, mm 34-114 64 51-121 38-95 76-108 44-102
w/cm 0.42 0.45 0.44 0.44-0.45 0.45 0.44
Table 4.2. Actual mix proportioning for the 1-295 installation.
14
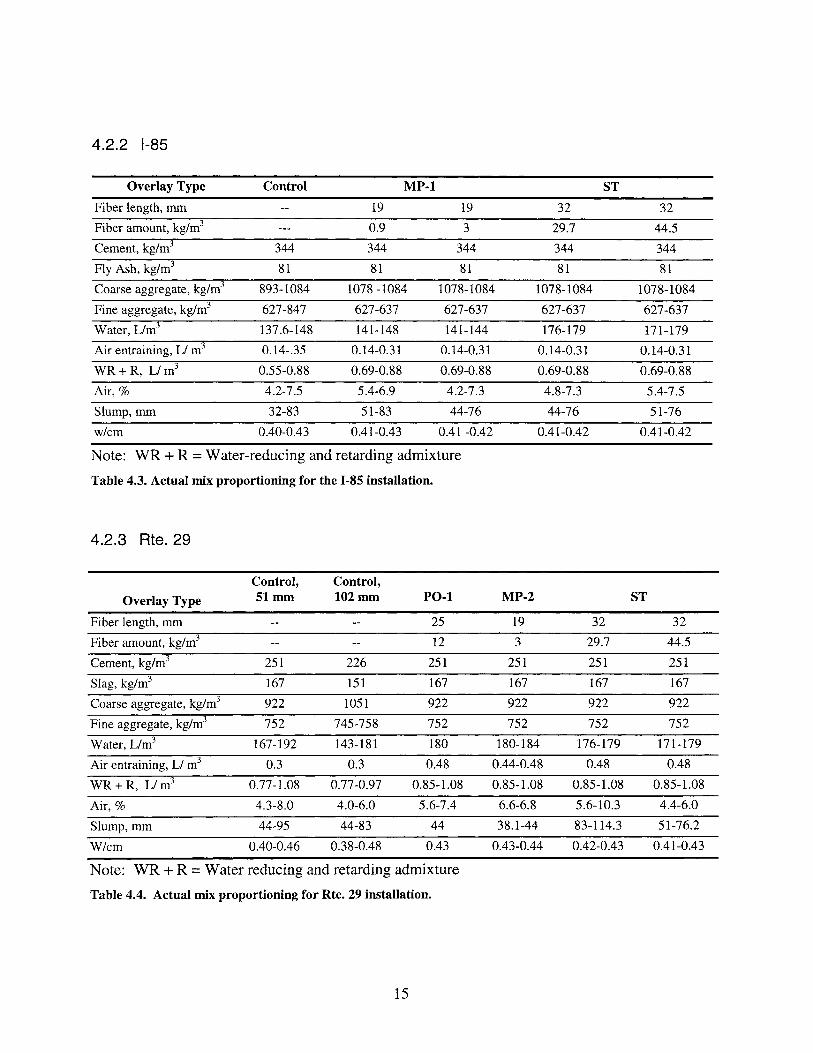
4.2.2 1-85
Overlay Type Control MP-l ST
Fiber length, mm 19 19 32 32
Fiber amount, kg/m3 0.9 3 29.7 44.5
Cement, kg/m3 344 344 344 344 344
Fly Ash, kg/m3 81 81 81 81 81
Coarse aggregate, kg/m3 893-1084 1078 -1084 1078-1084 1078-1084 1078-1084
Fine aggregate, kg/m3 627-847 627-637 627-637 627-637 627-637
Water, L/m3 137.6-148 141-148 141-144 176-179 171-179
Air entraining, LI m3 0.14-.35 0.14-0.31 0.14-0.31 0.14-0.31 0.14-0.31
WR+R, L/m3 0.55-0.88 0.69-0.88 0.69-0.88 0.69-0.88 0.69-0.88
Air, % 4.2-7.5 5.4-6.9 4.2-7.3 4.8-7.3 5.4-7.5
Slump, mm 32-83 51-83 44-76 44-76 51-76
w/cm 0.40-0.43 0.41-0.43 0.41 -0.42 0.41-0.42 0.41-0.42
Note: WR + R =Water-reducing and retarding admixture
Table 4.3. Actual mix proportioning for the 1-85 installation.
4.2.3 Rte.29
Control, Control,
Overlay Type 5lmm lO2mm PO-l MP-2 ST
Fiber length, mm 25 19 32 32
Fiber amount, kg/m3 12 3 29.7 44.5
Cement, kg/m3 251 226 251 251 251 251
Slag, kg/m3 167 151 167 167 167 167
Coarse aggregate, kg/m3 922 1051 922 922 922 922
Fine aggregate, kg/m3 752 745-758 752 752 752 752
Water, L/m3 167-192 143-181 180 180-184 176-179 171-179
Air entraining, LI m3 0.3 0.3 0.48 0.44-0.48 0.48 0.48
WR+R, L/m3 0.77-1.08 0.77-0.97 0.85-1.08 0.85-1.08 0.85-1.08 0.85-1.08
Air, 0/0 4.3-8.0 4.0-6.0 5.6-7.4 6.6-6.8 5.6-10.3 4.4-6.0
Slump, mm 44-95 44-83 44 38.1-44 83-114.3 51-76.2
W/cm 0.40-0.46 0.38-0.48 0.43 0.43-0.44 0.42-0.43 0.41-0.43
Note: WR + R =Water reducing and retarding admixture
Table 4.4. Actual mix proportioning for Rte. 29 installation.
15
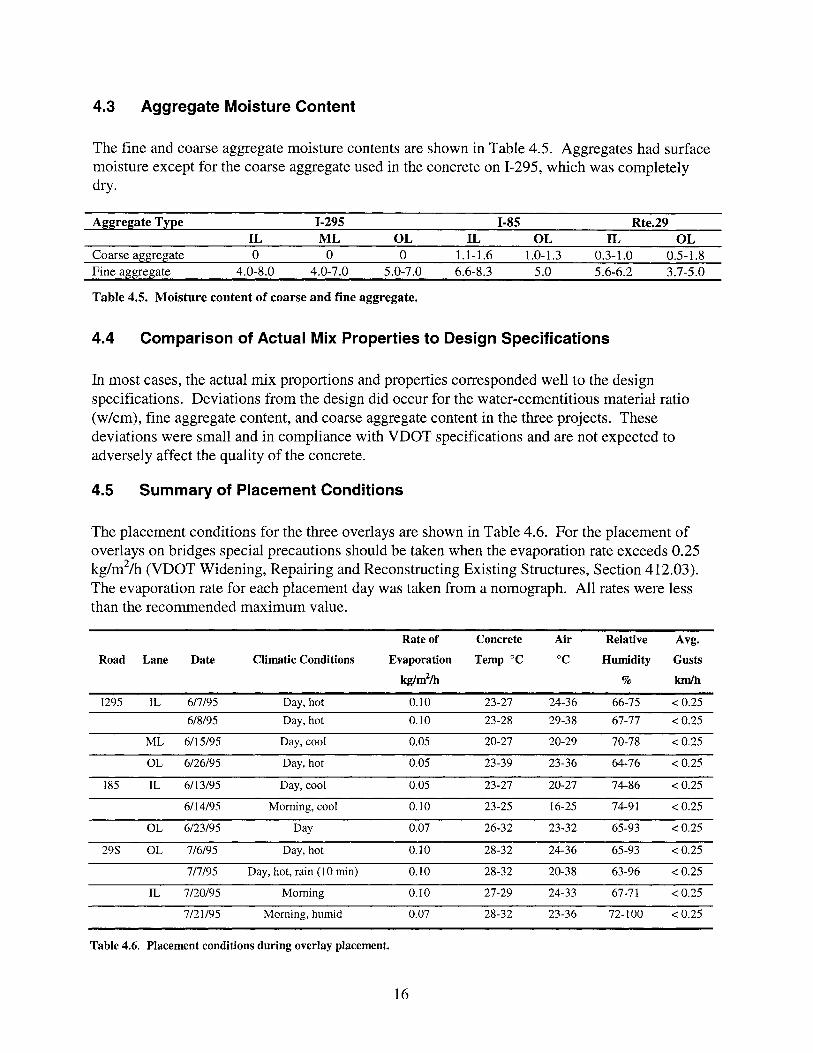
4.3 Aggregate Moisture Content
The fine and coarse aggregate moisture contents are shown in Table 4.5. Aggregates had surfacemoisture except for the coarse aggregate used in the concrete on 1-295, which was completelydry.
Aggregate Type 1-295 1-85 Rte.29IL ML OL IL OL IL OL
Coarse aggregate 0 0 0 1.1-1.6 1.0-1.3 0.3-1.0 0.5-1.8Fine aggregate 4.0-8.0 4.0-7.0 5.0-7.0 6.6-8.3 5.0 5.6-6.2 3.7-5.0
Table 4.5. Moisture content of coarse and fine aggregate.
4.4 Comparison of Actual Mix Properties to Design Specifications
In most cases, the actual mix proportions and properties corresponded well to the designspecifications. Deviations from the design did occur for the water-cementitious material ratio(w/cm), fine aggregate content, and coarse aggregate content in the three projects. Thesedeviations were small and in compliance with VDOT specifications and are not expected toadversely affect the quality of the concrete.
4.5 Summary of Placement Conditions
The placement conditions for the three overlays are shown in Table 4.6. For the placement ofoverlays on bridges special precautions should be taken when the evaporation rate exceeds 0.25kg/m2/h (VDOT Widening, Repairing and Reconstructing Existing Structures, Section 412.03).The evaporation rate for each placement day was taken from a nomograph. All rates were lessthan the recommended maximum value.
Rate of Concrete Air Relative Avg.
Road Lane Date Climatic Conditions Evaporation Temp °C °C Humidity Gusts
kg/m2/h % kmIh
1295 IL 6/7/95 Day, hot 0.10 23-27 24-36 66-75 <0.25
6/8/95 Day, hot 0.10 23-28 29-38 67-77 <0.25
ML 6/15/95 Day, cool 0.05 20-27 20-29 70-78 <0.25
OL 6/26/95 Day, hot 0.05 23-39 23-36 64-76 <0.25
185 IL 6/13/95 Day, cool 0.05 23-27 20-27 74-86 <0.25
6/14/95 Morning, cool 0.10 23-25 16-25 74-91 <0.25
OL 6/23/95 Day 0.07 26-32 23-32 65-93 <0.25
295 OL 7/6/95 Day, hot 0.10 28-32 24-36 65-93 <0.25
7/7/95 Day, hot, rain (10 min) 0.10 28-32 20-38 63-96 <0.25
IL 7/20/95 Morning 0.10 27-29 24-33 67-71 <0.25
7/21/95 Morning, humid 0.07 28-32 23-36 72-100 <0.25
Table 4.6. Placement conditions during overlay placement.
16
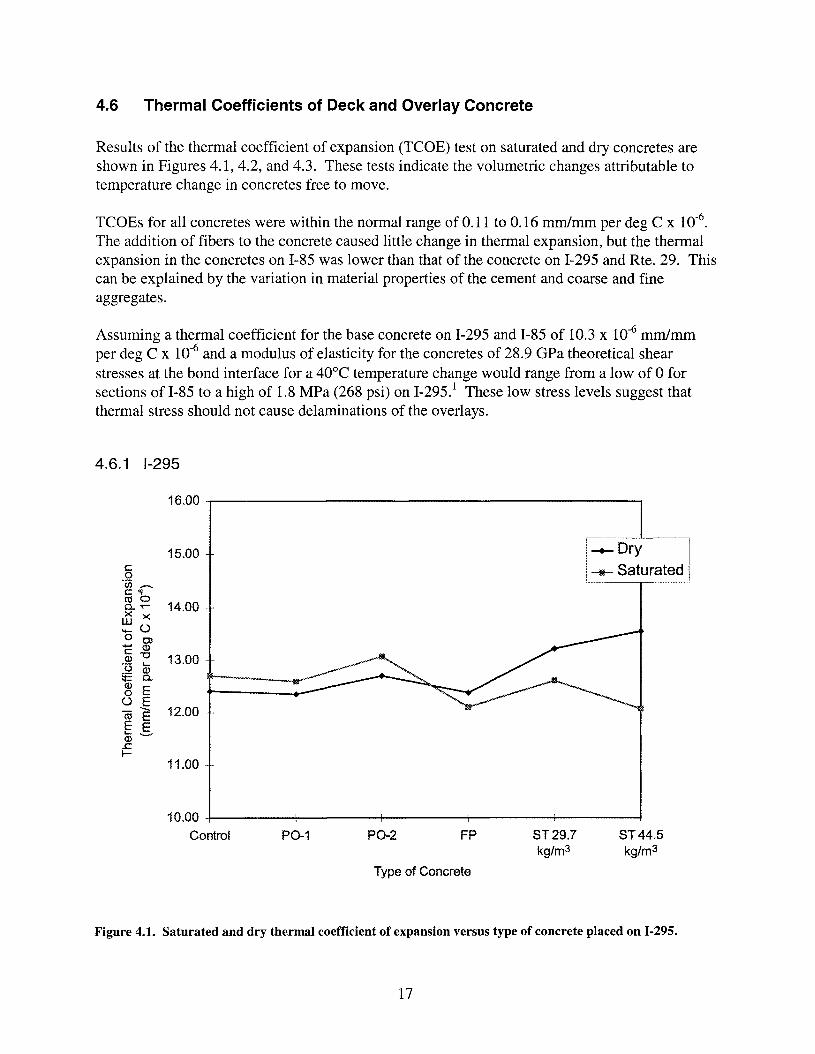
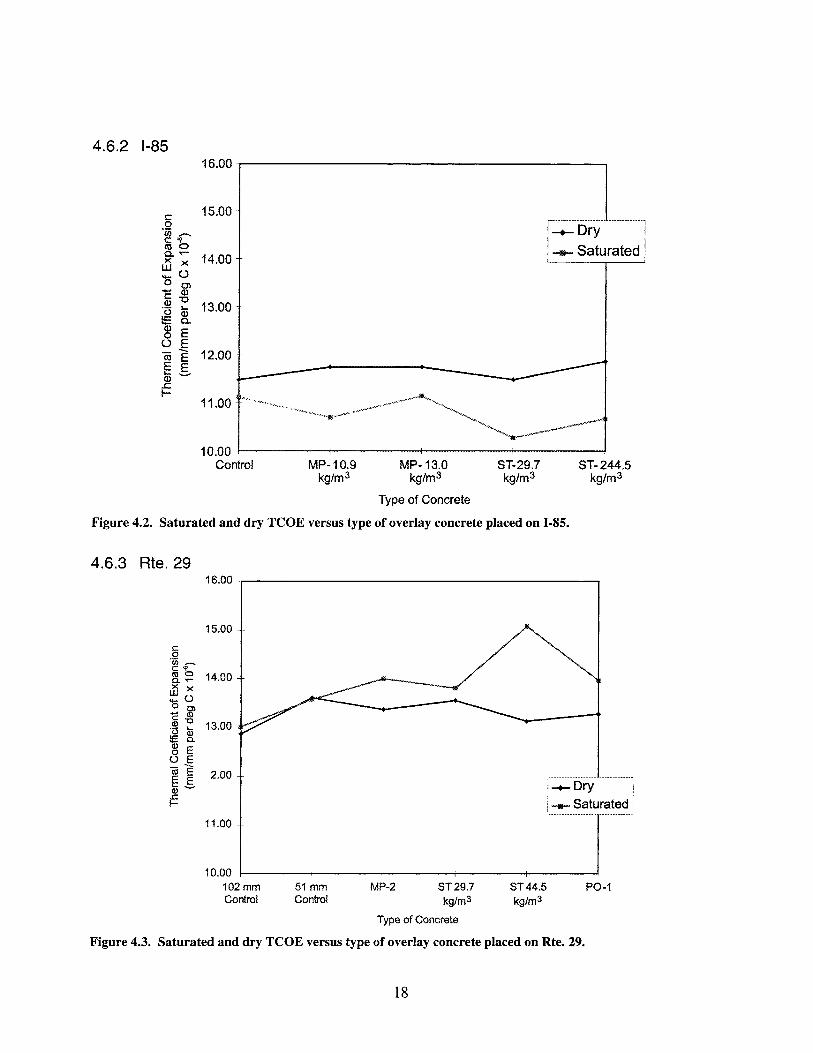
4.6 Thermal Coefficients of Deck and Overlay Concrete
Results of the thermal coefficient of expansion (TCOE) test on saturated and dry concretes areshown in Figures 4.1,4.2, and 4.3. These tests indicate the volumetric changes attributable totemperature change in concretes free to move.
TCOEs for all concretes were within the normal range of 0.11 to 0.16 mmlmm per deg C x 10-6.
The addition of fibers to the concrete caused little change in thermal expansion, but the thermalexpansion in the concretes on 1-85 was lower than that of the concrete on 1-295 and Rte. 29. Thiscan be explained by the variation in material properties of the cement and coarse and fineaggregates.
Assuming a thermal coefficient for the base concrete on 1-295 and 1-85 of 10.3 x 10⁻⁶ mmlmmper deg C x 10-6 and a modulus of elasticity for the concretes of 28.9 GPa theoretical shearstresses at the bond interface for a 40°C temperature change would range from a low of 0 forsections of 1-85 to a high of 1.8 MPa (268 psi) on 1-295.1 These low stress levels suggest thatthermal stress should not cause delaminations of the overlays.
4.6.1 1-295
16.00 -----------------------------.
15.00co
'Uj ...-.c ~
~ ~ 14.00x ><~oa 0)... (1)
~ '"0 13.00:Q astI= a.~ Eo Eco E 12.00E E03'-'
..c:to-
-+- Dry-tI- Saturated
11.00
ST44.5kg/m3
ST29.7kg/m3
FPPO-2PO-1
10.00 4-------+-------i-------+-------+O---------fControl
Type of Concrete
Figure 4.1. Saturated and dry thermal coefficient of expansion versus type of concrete placed on 1-295.
17
4.6.2 1-8516.00--,.----------------------
15.00
14.00
13.00 .
12.00
11.00
-+- Dry-It- Saturated
ST-244.5kg/m3
ST-29.7kg/m 3
MP-10.9kg/m 3
10.00 .t-------+------+--------+-----~Control MP-13.0
kg1m3
Type of Concrete
Figure 4.2. Saturated and dry TCOE versus type of overlay concrete placed on 1-85.
4.6.3 Rte. 2916.00 .r------------------------...,
15.00
co"cn_c esr(000.. ~)( ><:~uo 0)
.... Q)
55-0~ ~~ EU EcaEE E05-
..c:.-
14.00
13.00
2.00········································--········-1i-,- Dry
i-II- Saturated._-.---- _._-- - -.-----
11.00
PO-1ST44.5kg/m 3
51 mmControl
10.00102mmControl
MP-2 ST29.7kg/m3
Type of Concrete
Figure 4.3. Saturated and dry TCOE versus type of overlay concrete placed on Rte. 29.
18
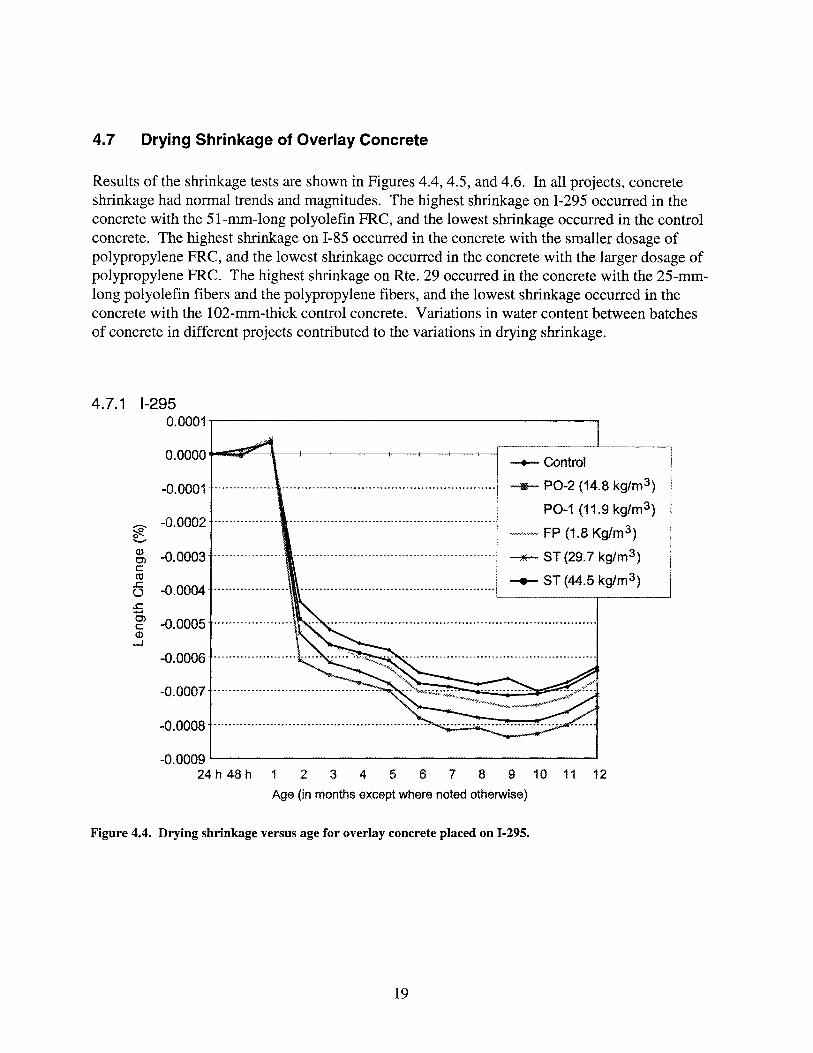
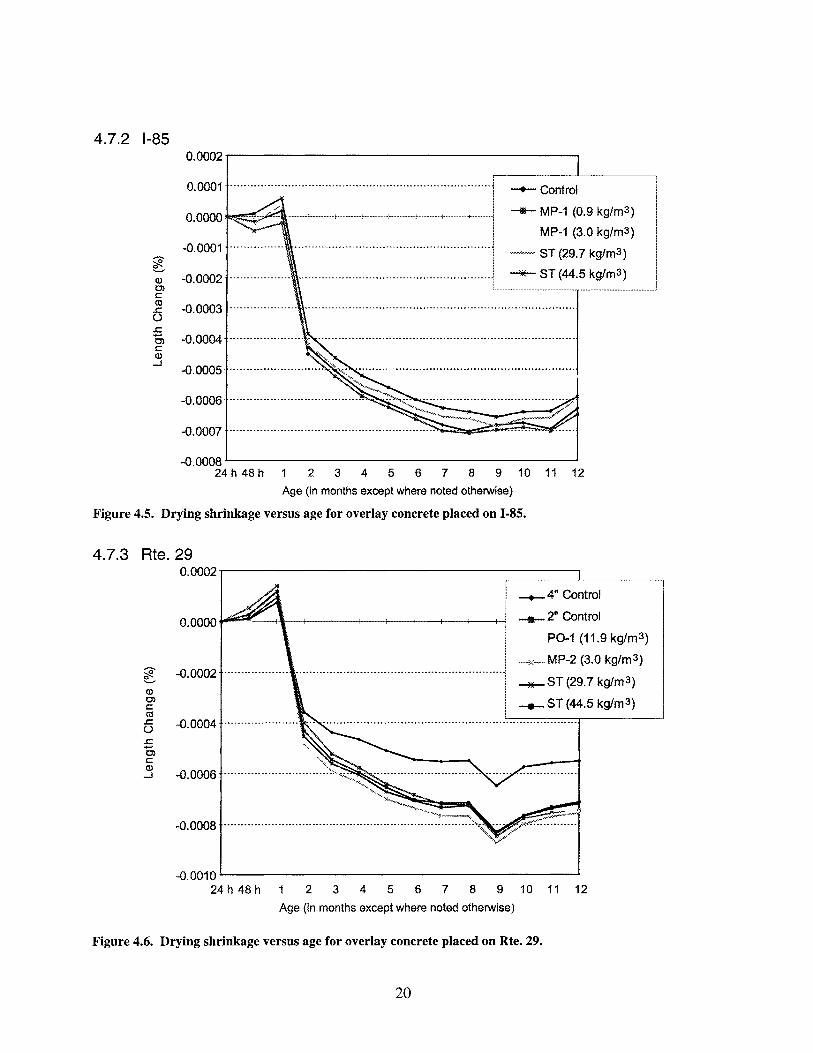
4.7 Drying Shrinkage of Overlay Concrete
Results of the shrinkage tests are shown in Figures 4.4, 4.5, and 4.6. In all projects, concreteshrinkage had normal trends and magnitudes. The highest shrinkage on 1-295 occurred in theconcrete with the 51-mm-Iong polyolefin FRC, and the lowest shrinkage occurred in the controlconcrete. The highest shrinkage on 1-85 occurred in the concrete with the smaller dosage ofpolypropylene FRC, and the lowest shrinkage occurred in the concrete with the larger dosage ofpolypropylene FRC. The highest shrinkage on Rte. 29 occurred in the concrete with the 25-mmlong polyolefin fibers and the polypropylene fibers, and the lowest shrinkage occurred in theconcrete with the 102-mm-thick control concrete. Variations in water content between batchesof concrete in different projects contributed to the variations in drying shrinkage.
4.7.1 1-2950.0001------------------------.
-+- Control
___ PO-2 (14.8 kg/m 3)
PO-1 (11.9 kg/m3 )
~~<<<~- FP (1.8 Kg/m 3)
~ ST (29.7 kg/m 3 )
___ ST (44.5 kg/m 3 )
-0.0007
-0.0006
o.0000 ......~c..--3-____i-_-+____I_-_+_-----1~_+____1
-0.0001
-0.0008
~ -0.0002~'-'""
~ -0.0003c:co6 -0.0004..c.......g> -0.0005Q)
.....J
-0.0009 -'--- ---a
24 h 48 h 1 2 3 4 5 6 7 8 9 10 11 12
Age (in months except where noted otherwise)
Figure 4.4. Drying shrinkage versus age for overlay concrete placed on 1-295.
19
4.7.2 1-850.0002
0.0001
0.0000
-0.0001'0"~Q) -0.0002Q')cco
-0.0003.c.0:5 -0.0004Q')
Co:Q)-J
-0.0007
·············································································1 --+- Control
~.••..:~ --_._.! --t- _+ _..f-- ,~ -II- MP-1 (0.9 kg/m3 )
I MP-1 (3.0 kg/m3 )................ . ~.................. . ...J~;;;.:~..;~;;.;._ j
-0.0008.&---------------------24 h 48 h 2 3 4 5 6 7 8 9 10 11 12
Age (in months except where noted otherwise)
Figure 4.5. Drying shrinkage versus age for overlay concrete placed on 1-85.
4.7.3 Rte. 290.0002--------------------------,
--+- 4" Control
____ 2" Control
PO-1 (11.9 kg/m 3)
~''''K-.v MP-2 (3.0 kg/m 3)
~ ST (29.7 kg/m 3)
___ ST (44.5 kg/rn 3)
0.0000
-0.0004' ...
-0.0002 _............. . ········l:
i
-0.0006
-0.0008
2 3 4 5 6 7 8 9 10 11 12
Age (in months except where noted otherwise)
-0.0010.L-----------------------.I24 h 48 h
Figure 4.6. Drying shrinkage versus age for overlay concrete placed on Rte. 29.
20
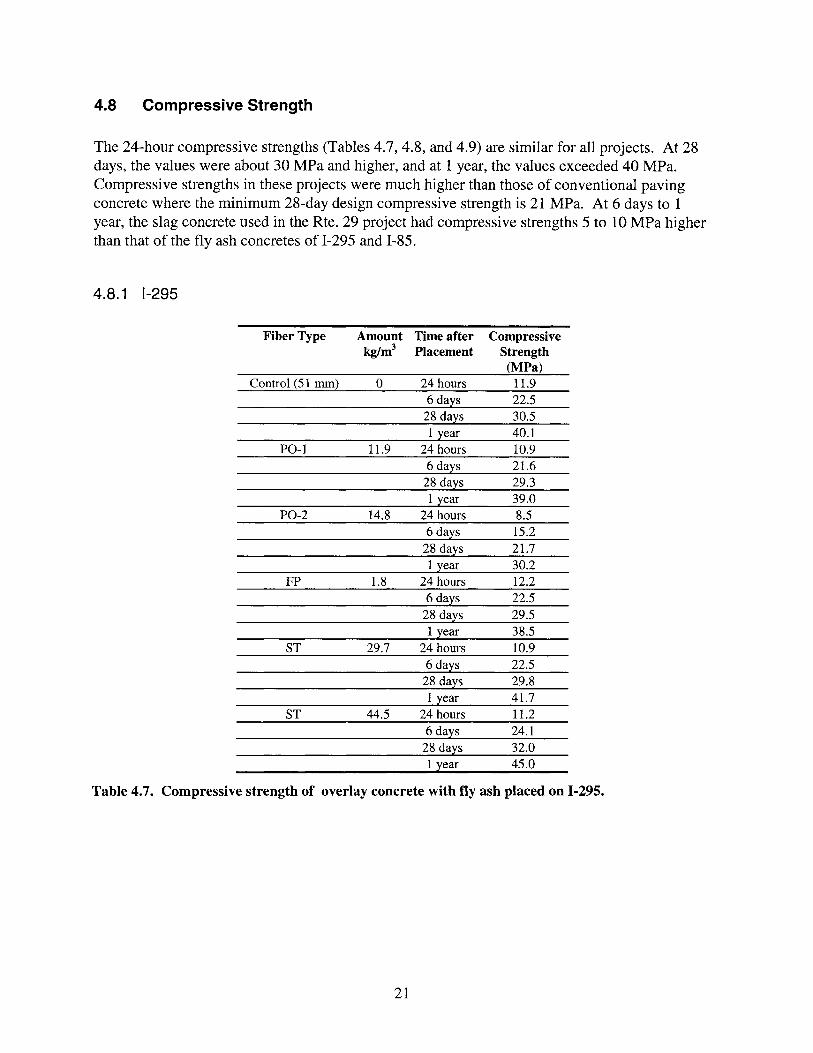
4.8 Compressive Strength
The 24-hour compressive strengths (Tables 4.7,4.8, and 4.9) are similar for all projects. At 28days, the values were about 30 MPa and higher, and at 1 year, the values exceeded 40 MPa.Compressive strengths in these projects were much higher than those of conventional pavingconcrete where the minimum 28-day design compressive strength is 21 MPa. At 6 days to 1year, the slag concrete used in the Rte. 29 project had compressive strengths 5 to 10 MPa higherthan that of the fly ash concretes of 1-295 and 1-85.
4.8.1 1-295
Fiber Type Amount Time after Compressivekg/m3 Placement Strength
(MPa)Control (51 nun) 0 24 hours 11.9
6 days 22.528 days 30.51 year 40.1
PO-1 11.9 24 hours 10.96 days 21.6
28 days 29.31 year 39.0
PO-2 14.8 24 hours 8.56 days 15.2
28 days 21.71 year 30.2
FP 1.8 24 hours 12.26 days 22.5
28 days 29.51 year 38.5
ST 29.7 24 hours 10.96 days 22.5
28 days 29.81 year 41.7
ST 44.5 24 hours 11.26 days 24.1
28 days 32.01 year 45.0
Table 4.7. Compressive strength of overlay concrete with fly ash placed on 1-295.
21
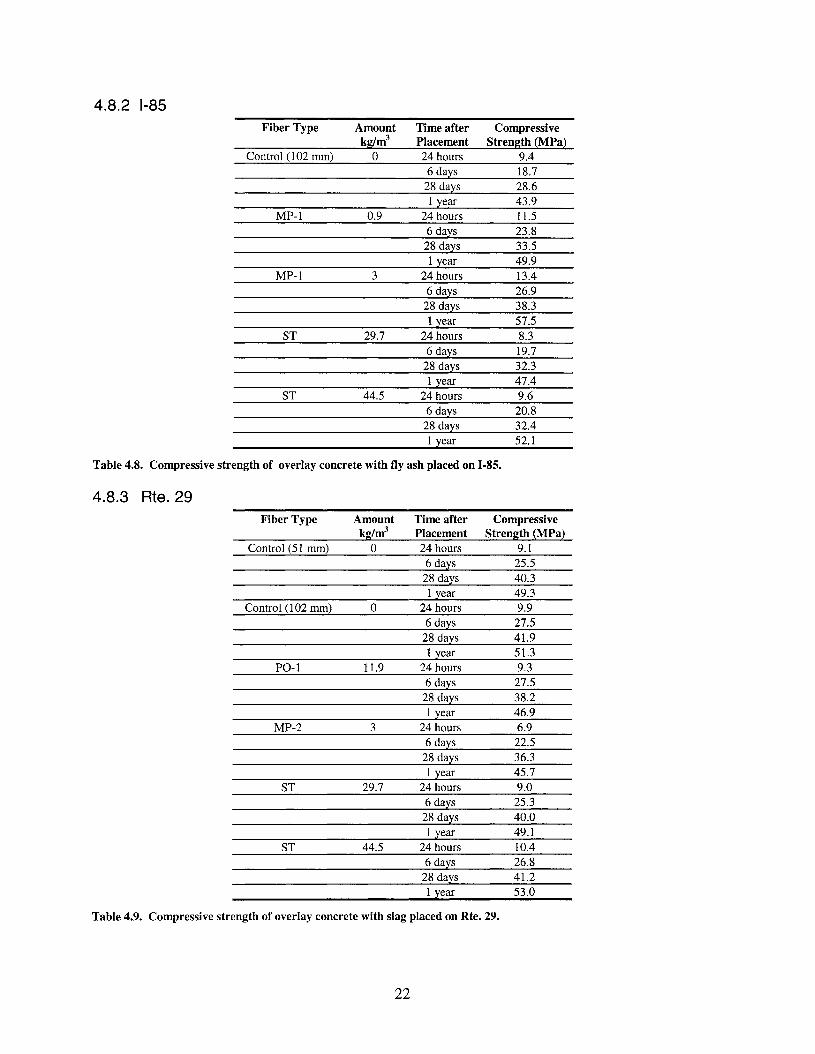
4.8.2 1-85Fiber Type Amount Time after Compressive
kglm3 Placement Strength (MPa)Control (102 mm) 0 24 hours 9.4
6 days 18.728 days 28.61 year 43.9
MP-l 0.9 24 hours 11.56 days 23.828 days 33.51 year 49.9
MP-l 3 24 hours 13.46 days 26.9
28 days 38.31 year 57.5
ST 29.7 24 hours 8.36 days 19.7
28 days 32.31 year 47.4
ST 44.5 24 hours 9.66 days 20.8
28 days 32.41 year 52.1
Table 4.8. Compressive strength of overlay concrete with fly ash placed on 1-85.
4.8.3 Rte.29Fiber Type Amount Time after Compressive
kglm3 Placement Strength (MPa)Control (51 mm) 0 24 hours 9.1
6 days 25.528 days 40.31 year 49.3
Control (102 mm) 0 24 hours 9.96 days 27.5
28 days 41.91 year 51.3
PO-l 11.9 24 hours 9.36 days 27.5
28 days 38.21 year 46.9
MP-2 3 24 hours 6.96 days 22.5
28 days 36.31 year 45.7
ST 29.7 24 hours 9.06 days 25.328 days 40.01 year 49.1
ST 44.5 24 hours 10.46 days 26.8
28 days 41.21 year 53.0
Table 4.9. Compressive strength of overlay concrete with slag placed on Rte. 29.
22
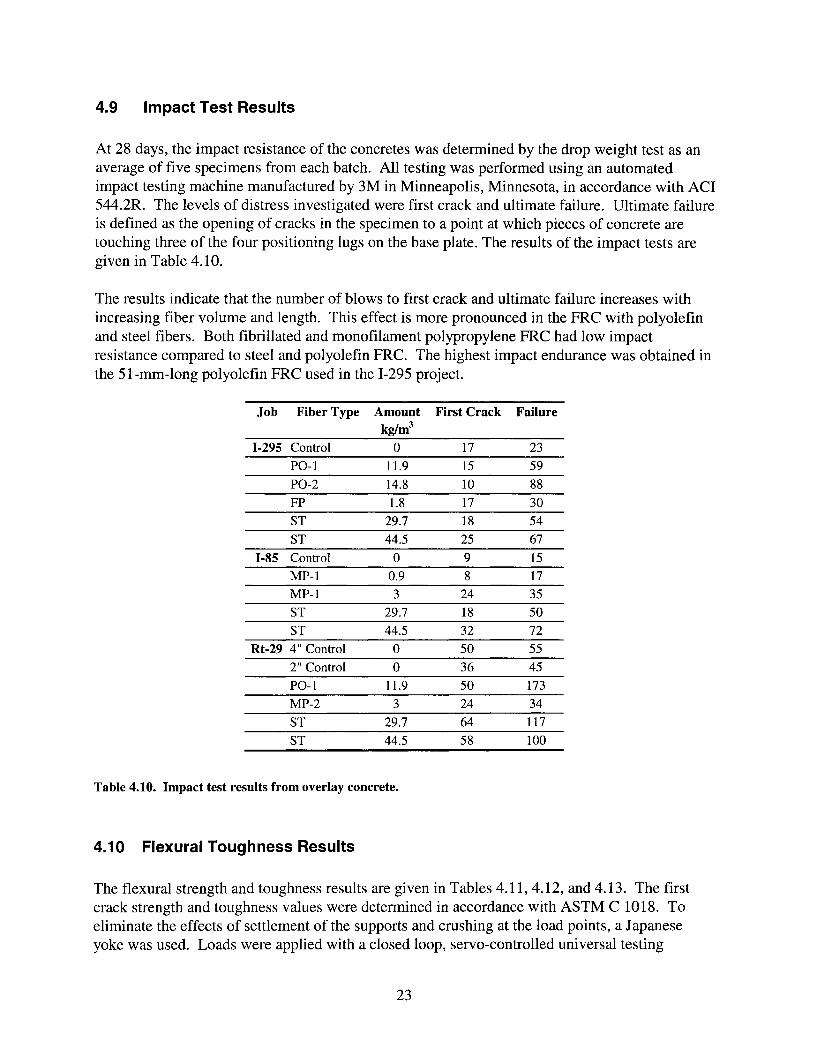
4.9 Impact Test Results
At 28 days, the impact resistance of the concretes was determined by the drop weight test as anaverage of five specimens from each batch. All testing was performed using an automatedimpact testing machine manufactured by 3M in Minneapolis, Minnesota, in accordance with ACI544.2R. The levels of distress investigated were first crack and ultimate failure. Ultimate failureis defined as the opening of cracks in the specimen to a point at which pieces of concrete aretouching three of the four positioning lugs on the base plate. The results of the impact tests aregiven in Table 4.10.
The results indicate that the number of blows to first crack and ultimate failure increases withincreasing fiber volume and length. This effect is more pronounced in the FRC with polyolefinand steel fibers. Both fibrillated and monofilament polypropylene FRC had low impactresistance compared to steel and polyolefin FRC. The highest impact endurance was obtained inthe 51-mm-Iong polyolefin FRC used in the 1-295 project.
Job Fiber Type Amount First Crack Failurekg/m3
1-295 Control 0 17 23
PO-1 11.9 15 59
PO-2 14.8 10 88
FP 1.8 17 30
ST 29.7 18 54
ST 44.5 25 67
1-85 Control 0 9 15MP-1 0.9 8 17
MP-1 3 24 35
ST 29.7 18 50
ST 44.5 32 72
Rt-29 4" Control 0 50 55
2" Control 0 36 45
PO-1 11.9 50 173
MP-2 3 24 34
ST 29.7 64 117
ST 44.5 58 100
Table 4.10. Impact test results from overlay concrete.
4.10 Flexural Toughness Results
The flexural strength and toughness results are given in Tables 4.11, 4.12, and 4.13. The firstcrack strength and toughness values were determined in accordance with ASTM C 1018. Toeliminate the effects of settlement of the supports and crushing at the load points, a Japaneseyoke was used. Loads were applied with a closed loop, servo-controlled universal testing
23
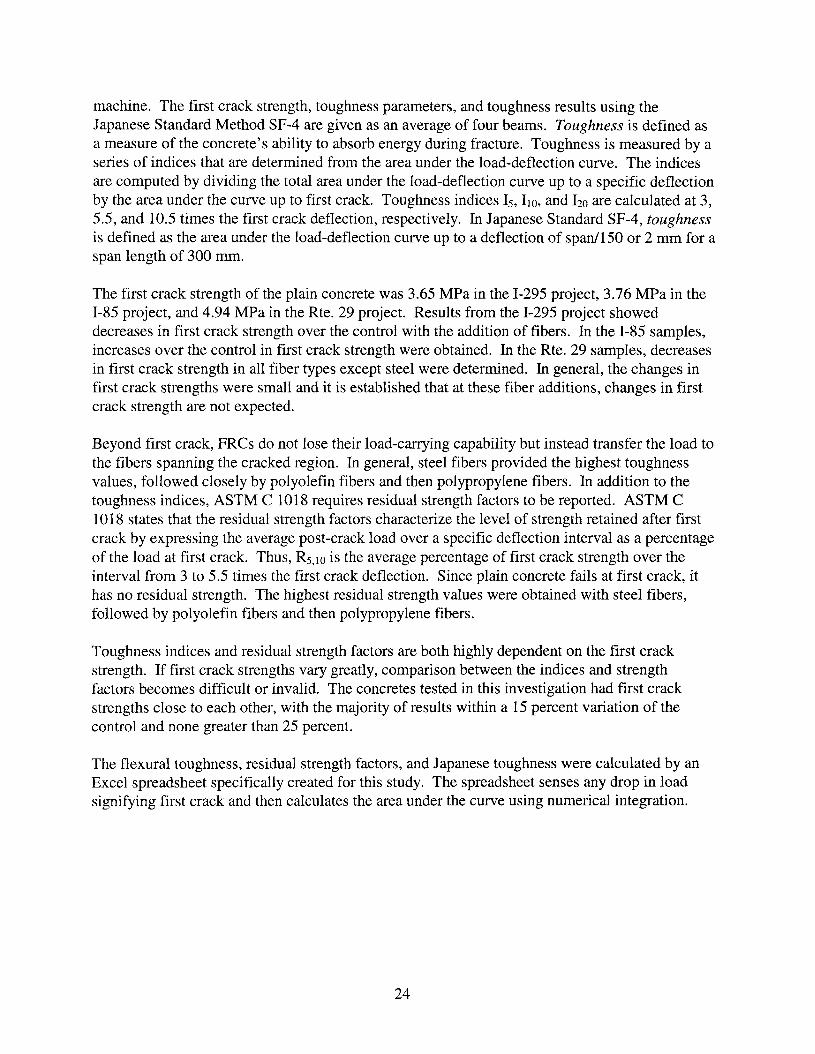
machine. The first crack strength, toughness parameters, and toughness results using theJapanese Standard Method SF-4 are given as an average of four beams. Toughness is defined asa measure of the concrete's ability to absorb energy during fracture. Toughness is measured by aseries of indices that are determined from the area under the load-deflection curve. The indicesare computed by dividing the total area under the load-deflection curve up to a specific deflectionby the area under the curve up to first crack. Toughness indices Is, 11o, and 120 are calculated at 3,5.5, and 10.5 times the first crack deflection, respectively. In Japanese Standard SF-4, toughnessis defined as the area under the load-deflection curve up to a deflection of span/150 or 2 mm for aspan length of 300 mm.
The first crack strength of the plain concrete was 3.65 MPa in the 1-295 project, 3.76 MPa in the1-85 project, and 4.94 MPa in the Rte. 29 project. Results from the 1-295 project showeddecreases in first crack strength over the control with the addition of fibers. In the 1-85 samples,increases over the control in first crack strength were obtained. In the Rte. 29 samples, decreasesin first crack strength in all fiber types except steel were determined. In general, the changes infirst crack strengths were small and it is established that at these fiber additions, changes in firstcrack strength are not expected.
Beyond first crack, FRCs do not lose their load-carrying capability but instead transfer the load tothe fibers spanning the cracked region. In general, steel fibers provided the highest toughnessvalues, followed closely by polyolefin fibers and then polypropylene fibers. In addition to thetoughness indices, ASTM C 1018 requires residual strength factors to be reported. ASTM C1018 states that the residual strength factors characterize the level of strength retained after firstcrack by expressing the average post-crack load over a specific deflection interval as a percentageof the load at first crack. Thus, RS,lo is the average percentage of first crack strength over theinterval from 3 to 5.5 times the first crack deflection. Since plain concrete fails at first crack, ithas no residual strength. The highest residual strength values were obtained with steel fibers,followed by polyolefin fibers and then polypropylene fibers.
Toughness indices and residual strength factors are both highly dependent on the first crackstrength. If first crack strengths vary greatly, comparison between the indices and strengthfactors becomes difficult or invalid. The concretes tested in this investigation had first crackstrengths close to each other, with the majority of results within a 15 percent variation of thecontrol and none greater than 25 percent.
The flexural toughness, residual strength factors, and Japanese toughness were calculated by anExcel spreadsheet specifically created for this study. The spreadsheet senses any drop in loadsignifying first crack and then calculates the area under the curve using numerical integration.
24
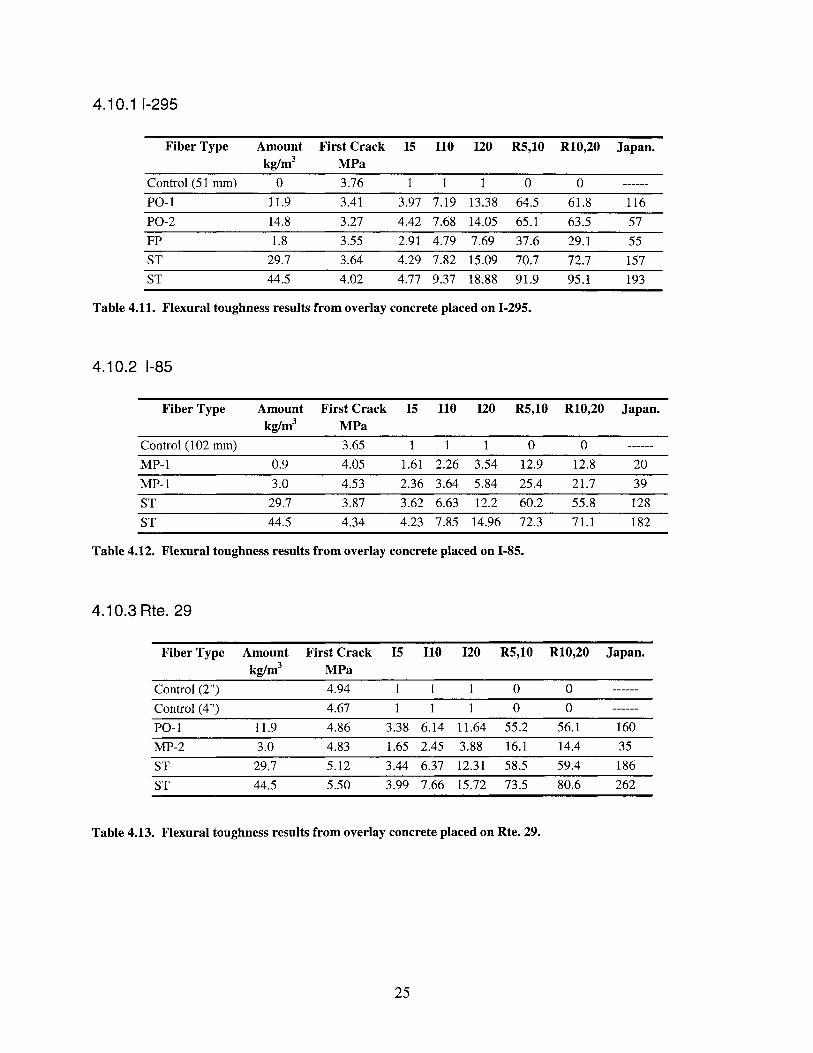
4.10.1 1-295
Fiber Type Amount First Crack 15 110 120 R5,10 R10,20 Japan.kg/m3 MPa
Control (51 mm) 0 3.76 1 1 1 0 0
PO-1 11.9 3.41 3.97 7.19 13.38 64.5 61.8 116
PO-2 14.8 3.27 4.42 7.68 14.05 65.1 63.5 57
FP 1.8 3.55 2.91 4.79 7.69 37.6 29.1 55
ST 29.7 3.64 4.29 7.82 15.09 70.7 72.7 157
ST 44.5 4.02 4.77 9.37 18.88 91.9 95.1 193
Table 4.11. Flexural toughness results from overlay concrete placed on 1-295.
4.10.2 1-85
Fiber Type Amount First Crack 15 110 120 R5,10 R10,20 Japan.kg/m3 MPa
Control (102 mm) 3.65 1 1 1 0 0
MP-1 0.9 4.05 1.61 2.26 3.54 12.9 12.8 20
MP-1 3.0 4.53 2.36 3.64 5.84 25.4 21.7 39
ST 29.7 3.87 3.62 6.63 12.2 60.2 55.8 128
ST 44.5 4.34 4.23 7.85 14.96 72.3 71.1 182
Table 4.12. Flexural toughness results from overlay concrete placed on 1-85.
4.1 0.3 Rte. 29
Fiber Type Amount First Crack 15 110 120 R5,10 R10,20 Japan.kg/m3 MPa
Control (2") 4.94 1 1 1 0 0
Control (4") 4.67 1 1 1 0 0
PO-1 11.9 4.86 3.38 6.14 11.64 55.2 56.1 160
MP-2 3.0 4.83 1.65 2.45 3.88 16.1 14.4 35
ST 29.7 5.12 3.44 6.37 12.31 58.5 59.4 186
ST 44.5 5.50 3.99 7.66 15.72 73.5 80.6 262
Table 4.13. Flexural toughness results from overlay concrete placed on Rte. 29.
25
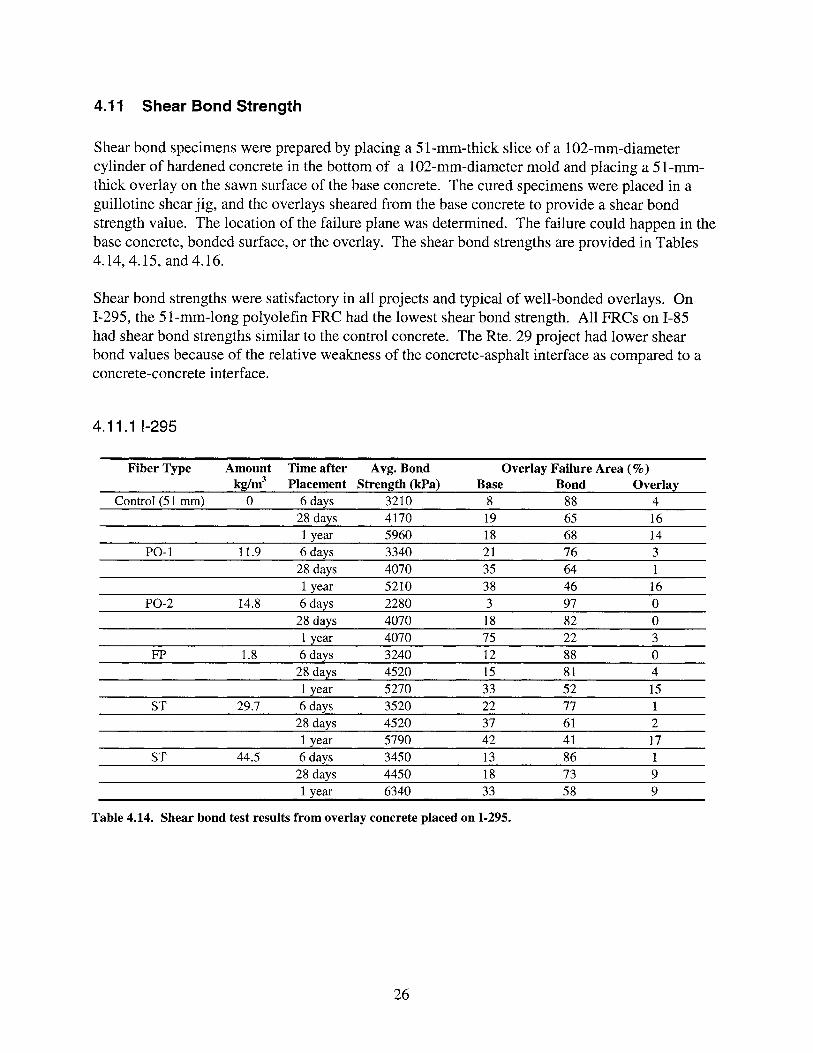
4.11 Shear Bond Strength
Shear bond specimens were prepared by placing a 51-mm-thick slice of a 102-mm-diametercylinder of hardened concrete in the bottom of a 102-mm-diameter mold and placing a 51-mmthick overlay on the sawn surface of the base concrete. The cured specimens were placed in aguillotine shear jig, and the overlays sheared from the base concrete to provide a shear bondstrength value. The location of the failure plane was determined. The failure could happen in thebase concrete, bonded surface, or the overlay. The shear bond strengths are provided in Tables4.14,4.15, and 4.16.
Shear bond strengths were satisfactory in all projects and typical of well-bonded overlays. On1-295, the 51-mm-Iong polyolefin FRC had the lowest shear bond strength. All FRCs on 1-85had shear bond strengths similar to the control concrete. The Rte. 29 project had lower shearbond values because of the relative weakness of the concrete-asphalt interface as compared to aconcrete-concrete interface.
4.11.1 1-295
Fiber Type Amount Time after Avg. Bond Overlay Failure Area (%)kglm3 Placement Strength (kPa) Base Bond Overlay
Control (51 mm) 0 6 days 3210 8 88 428 days 4170 19 65 161 year 5960 18 68 14
PO-l 11.9 6 days 3340 21 76 328 days 4070 35 64 11 year 5210 38 46 16
PO-2 14.8 6 days 2280 3 97 028 days 4070 18 82 01 year 4070 75 22 3
FP 1.8 6 days 3240 12 88 028 days 4520 15 81 41 year 5270 33 52 15
ST 29.7 6 days 3520 22 77 128 days 4520 37 61 21 year 5790 42 41 17
ST 44.5 6 days 3450 13 86 128 days 4450 18 73 91 year 6340 33 58 9
Table 4.14. Shear bond test results from overlay concrete placed on 1-295.
26
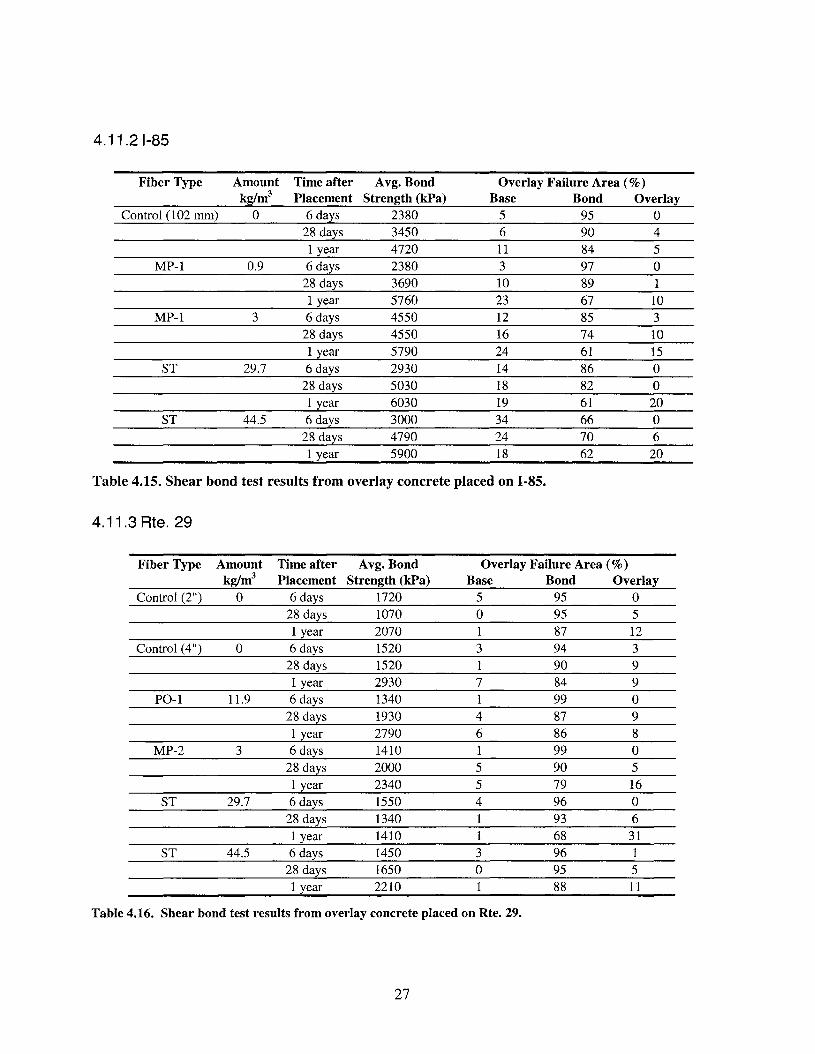
4.11.21-85
Fiber Type Amount Time after Avg. Bond Overlay Failure Area (%)kg/m3 Placement Strength (kPa) Base Bond Overlay
Control (102 mm) 0 6 days 2380 5 95 028 days 3450 6 90 41 year 4720 11 84 5
MP-l 0.9 6 days 2380 3 97 028 days 3690 10 89 11 year 5760 23 67 10
MP-l 3 6 days 4550 12 85 328 days 4550 16 74 101 year 5790 24 61 15
ST 29.7 6 days 2930 14 86 028 days 5030 18 82 01 year 6030 19 61 20
ST 44.5 6 days 3000 34 66 028 days 4790 24 70 61 year 5900 18 62 20
Table 4.15. Shear bond test results from overlay concrete placed on 1-85.
4.11.3 Rte. 29
Fiber Type Amount Time after Avg. Bond Overlay Failure Area (%)kg/m3 Placement Strength (kPa) Base Bond Overlay
Control (2") 0 6 days 1720 5 95 028 days 1070 0 95 51 year 2070 1 87 12
Control (4") 0 6 days 1520 3 94 328 days 1520 1 90 91 year 2930 7 84 9
PO-l 11.9 6 days 1340 1 99 028 days 1930 4 87 91 year 2790 6 86 8
MP-2 3 6 days 1410 1 99 028 days 2000 5 90 51 year 2340 5 79 16
ST 29.7 6 days 1550 4 96 028 days 1340 1 93 61 year 1410 1 68 31
ST 44.5 6 days 1450 3 96 128 days 1650 0 95 51 year 2210 1 88 11
Table 4.16. Shear bond test results from overlay concrete placed on Rte. 29.
27
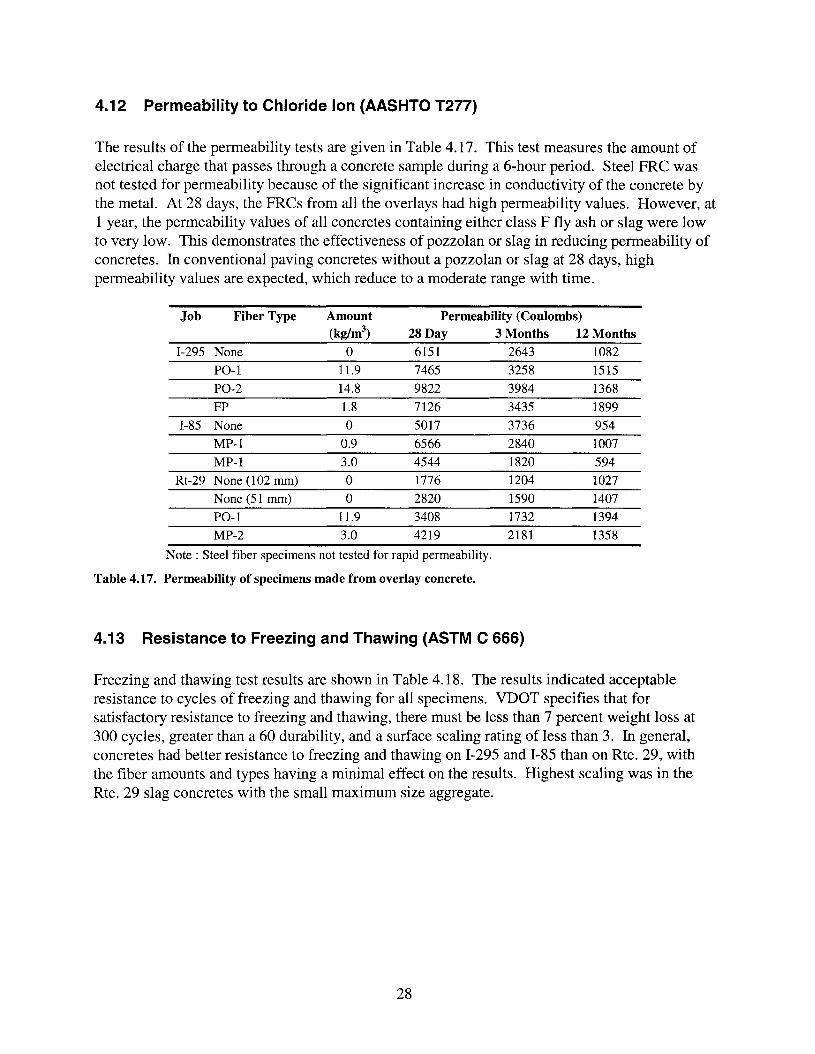
4.12 Permeability to Chloride Ion (AASHTO T277)
The results of the permeability tests are given in Table 4.17. This test measures the amount ofelectrical charge that passes through a concrete sample during a 6-hour period. Steel FRC wasnot tested for permeability because of the significant increase in conductivity of the concrete bythe metal. At 28 days, the FRCs from all the overlays had high permeability values. However, at1 year, the permeability values of all concretes containing either class F fly ash or slag were lowto very low. This demonstrates the effectiveness of pozzolan or slag in reducing permeability ofconcretes. In conventional paving concretes without a pozzolan or slag at 28 days, highpermeability values are expected, which reduce to a moderate range with time.
Job Fiber Type Amount Permeability (Coulombs)(kglm3
) 28 Day 3 Months 12 Months1-295 None 0 6151 2643 1082
PO-1 11.9 7465 3258 1515PO-2 14.8 9822 3984 1368FP 1.8 7126 3435 1899
1-85 None 0 5017 3736 954MP-1 0.9 6566 2840 1007MP-1 3.0 4544 1820 594
Rt-29 None (102 mm) 0 1776 1204 1027None (51 mm) 0 2820 1590 1407PO-1 11.9 3408 1732 1394MP-2 3.0 4219 2181 1358
Note: Steel fiber specimens not tested for rapid permeability.
Table 4.17. Permeability of specimens made from overlay concrete.
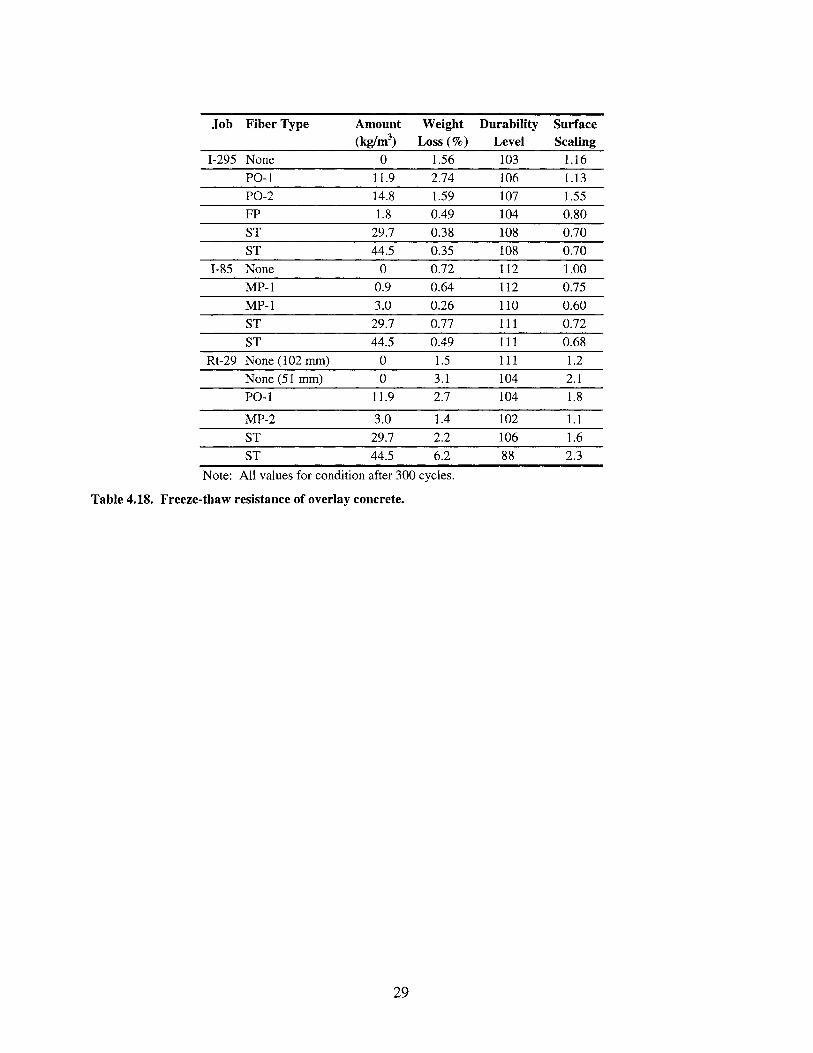
4.13 Resistance to Freezing and Thawing (ASTM C 666)
Freezing and thawing test results are shown in Table 4.18. The results indicated acceptableresistance to cycles of freezing and thawing for all specimens. VDOT specifies that forsatisfactory resistance to freezing and thawing, there must be less than 7 percent weight loss at300 cycles, greater than a 60 durability, and a surface scaling rating of less than 3. In general,concretes had better resistance to freezing and thawing on 1-295 and 1-85 than on Rte. 29, withthe fiber amounts and types having a minimal effect on the results. Highest scaling was in theRte. 29 slag concretes with the small maximum size aggregate.
28
Job Fiber Type Amount Weight Durability Surface(kglm3
) Loss (%) Level Scaling1-295 None 0 1.56 103 1.16
PO-1 11.9 2.74 106 1.13
PO-2 14.8 1.59 107 1.55
FP 1.8 0.49 104 0.80
ST 29.7 0.38 108 0.70
ST 44.5 0.35 108 0.70
1-85 None 0 0.72 112 1.00
MP-1 0.9 0.64 112 0.75
MP-1 3.0 0.26 110 0.60
ST 29.7 0.77 111 0.72
ST 44.5 0.49 111 0.68
Rt-29 None (102 mm) 0 1.5 111 1.2
None (51 mm) 0 3.1 104 2.1
PO-1 11.9 2.7 104 1.8
MP-2 3.0 1.4 102 1.1
ST 29.7 2.2 106 1.6
ST 44.5 6.2 88 2.3
Note: All values for condition after 300 cycles.
Table 4.18. Freeze-thaw resistance of overlay concrete.
29
5. Evaluation of Conditions after Installation
5.1 Location of Delaminations
No delaminations were found based on a chain drag of the overlays approximately 1 month afterthey were constructed.
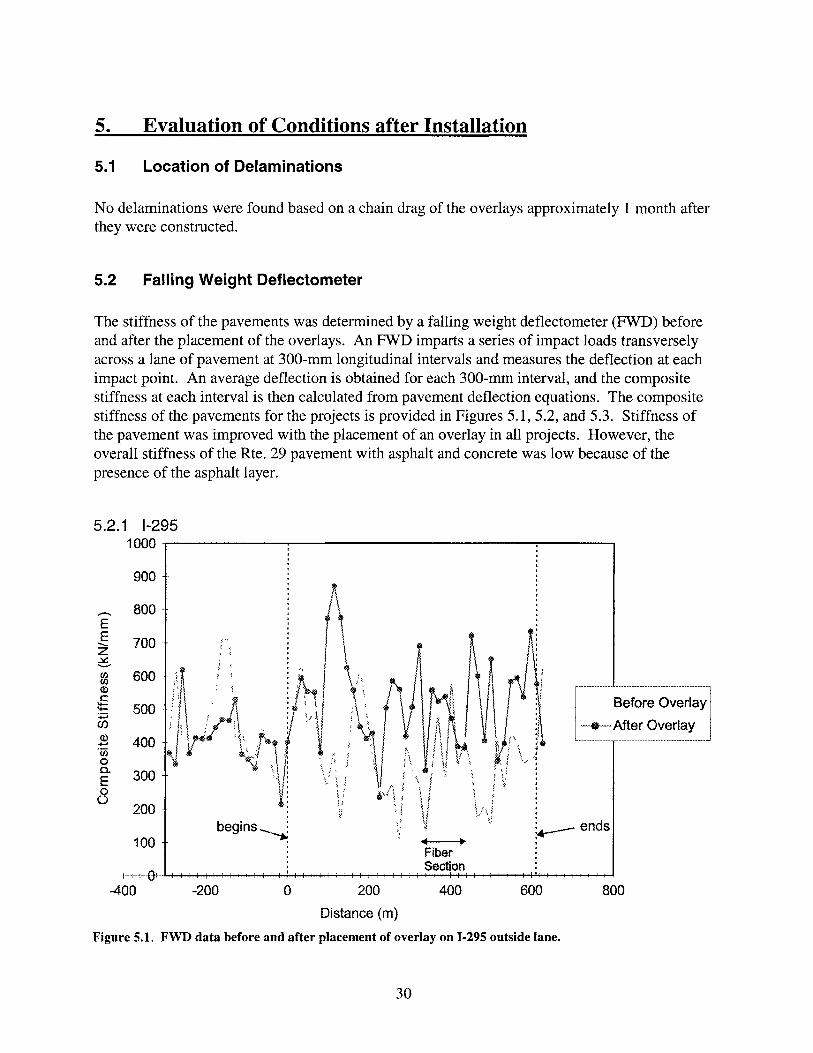
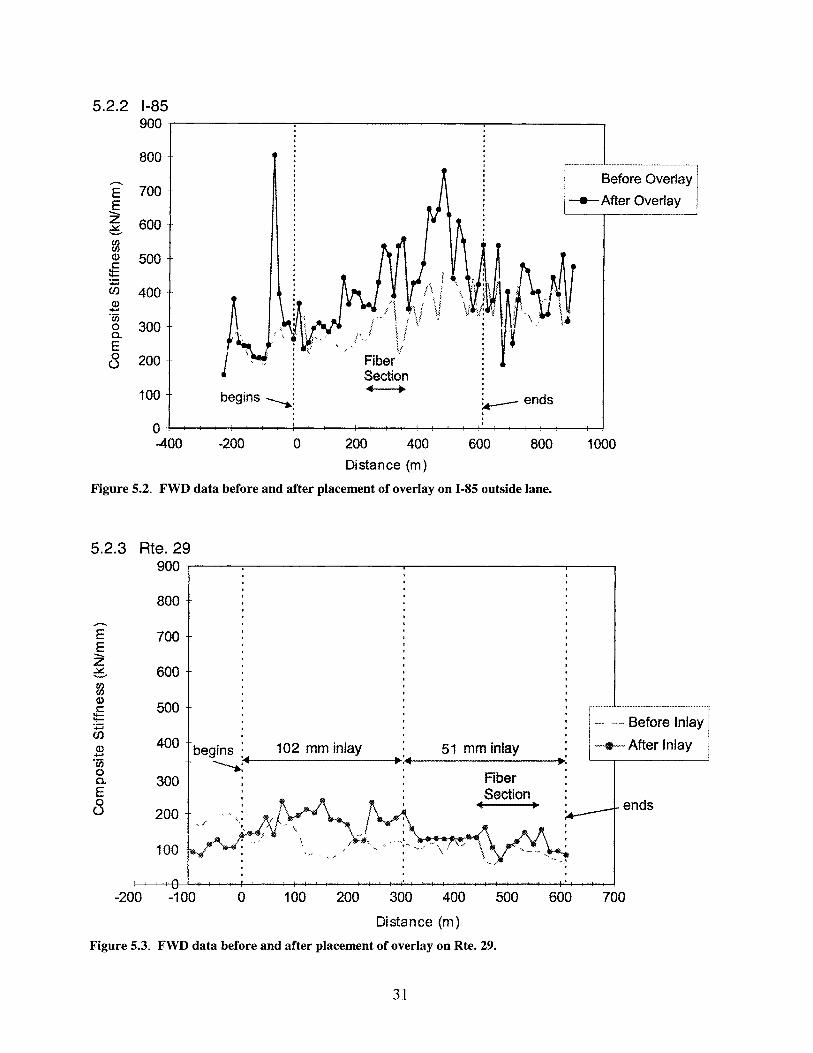
5.2 Falling Weight Deflectometer
The stiffness of the pavements was determined by a falling weight deflectometer (FWD) beforeand after the placement of the overlays. An FWD imparts a series of impact loads transverselyacross a lane of pavement at 300-mm longitudinal intervals and measures the deflection at eachimpact point. An average deflection is obtained for each 300-mm interval, and the compositestiffness at each interval is then calculated from pavement deflection equations. The compositestiffness of the pavements for the projects is provided in Figures 5.1, 5.2, and 5.3. Stiffness ofthe pavement was improved with the placement of an overlay in all projects. However, theoverall stiffness of the Rte. 29 pavement with asphalt and concrete was low because of thepresence of the asphalt layer.
5.2.1 1-2951000 .-r--------_-----------~--____.
900 .-
Before Overlay
---After Overlay
600 800
.~~.'
\ :~~.. ..:
Vends
400o
begins--.j
-200
700 ..
100
600
. ...FiberSection
f···+--+···Oj-_··~I--i-+.....j-j.-+-l---I-i-' .;-'+-i-'I--Io-~-;"";--I-I-+-+--+-+--+-i,,.-..+---+-+-+--+-+-.;.....+--1--+-=-+.'-+-+---+--+---+--+--4
-400
EE
........z~enen(l)c::::
+:ien(1)
+aI
"00aa.Eo()
800
200
Distance (m)
Figure 5.1. FWD data before and after placement of overlay on 1-295 outside lane.
30
1000
Before Overlay
--e-- After Overlay
800
~ends
600a
5.2.2 1-85900 .
800
.-....700E
E--.......z 600~"-"enen(1) 500c~
en 400CD.....,
"003000
a..E0 200()
100
O·-400 -200 200 400
Distance (m)
Figure 5.2. FWD data before and after placement of overlay on 1-85 outside lane.
5.2.3 Rte.29900
800
E 700E.........z~ 600"'--""
mQ)
500c:~:;::;(j)
400Q) begins:.......·en ~~0a. 300E00 200
100
102 mm inlay 51 mm inlay
FiberSection• •
...................................-- __ _ ..
-- --,- Before Inlay I--e-- After Inlay I
ends
-200 -100 o 100 200 300 400 500 600 700
Distance (m)
Figure 5.3. FWD data before and after placement of overlay on Rte. 29.
31
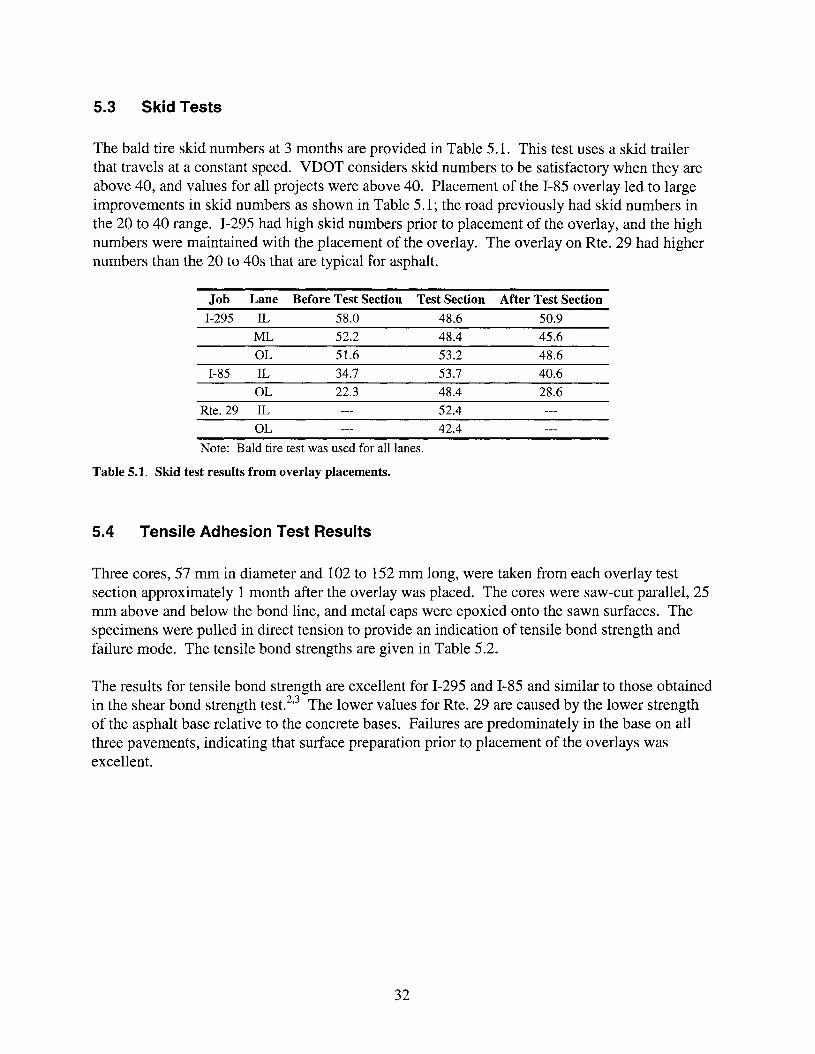
5.3 Skid Tests
The bald tire skid numbers at 3 months are provided in Table 5.1. This test uses a skid trailerthat travels at a constant speed. VDOT considers skid numbers to be satisfactory when they areabove 40, and values for all projects were above 40. Placement of the 1-85 overlay led to largeimprovements in skid numbers as shown in Table 5.1; the road previously had skid numbers inthe 20 to 40 range. 1-295 had high skid numbers prior to placement of the overlay, and the highnumbers were maintained with the placement of the overlay. The overlay on Rte. 29 had highernumbers than the 20 to 40s that are typical for asphalt.
Job
1-295
1-85
Rte.29
Lane Before Test Section Test Section After Test Section
IL 58.0 48.6 50.9
ML 52.2 48.4 45.6
OL 51.6 53.2 48.6
IL 34.7 53.7 40.6
OL 22.3 48.4 28.6
IL 52.4
OL 42.4
Note: Bald tire test was used for all lanes.
Table 5.1. Skid test results from overlay placements.
5.4 Tensile Adhesion Test Results
Three cores, 57 mm in diameter and 102 to 152 mm long, were taken from each overlay testsection approximately 1 month after the overlay was placed. The cores were saw-cut parallel, 25mm above and below the bond line, and metal caps were epoxied onto the sawn surfaces. Thespecimens were pulled in direct tension to provide an indication of tensile bond strength andfailure mode. The tensile bond strengths are given in Table 5.2.
The results for tensile bond strength are excellent for 1-295 and 1-85 and similar to those obtainedin the shear bond strength test. 2,3 The lower values for Rte. 29 are caused by the lower strengthof the asphalt base relative to the concrete bases. Failures are predominately in the base on allthree pavements, indicating that surface preparation prior to placement of the overlays wasexcellent.
32
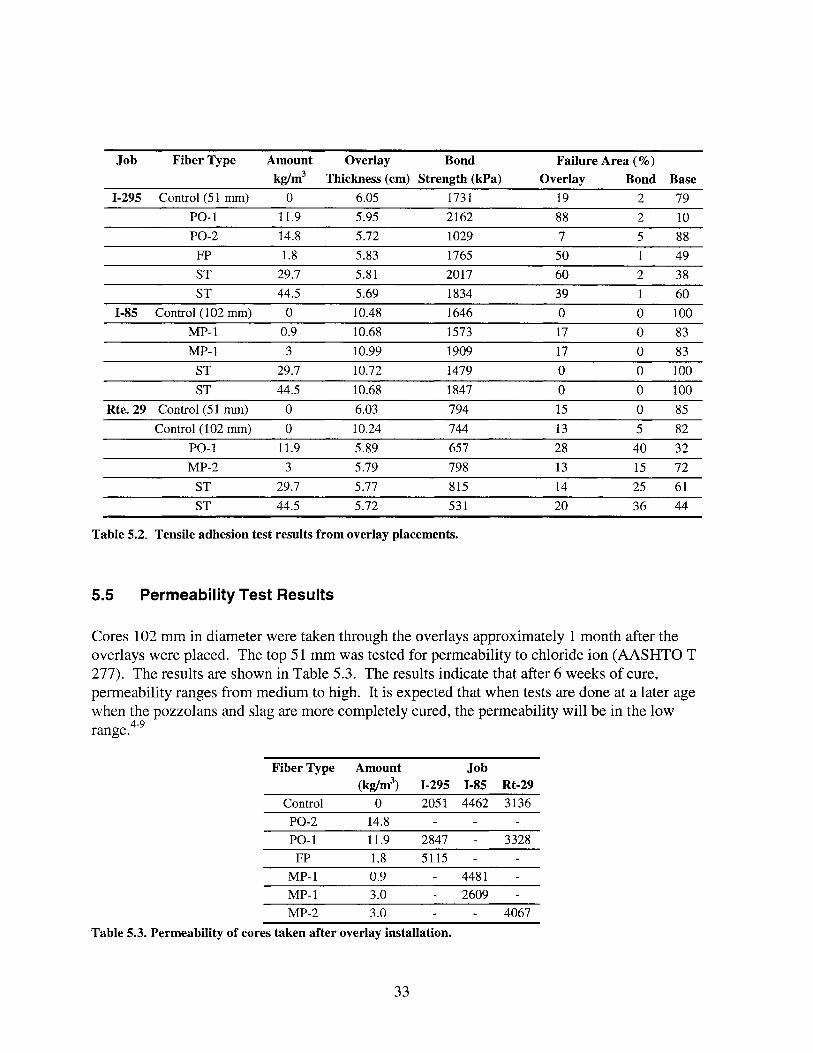
Job Fiber Type Amount Overlay Bond Failure Area (%)
kg/m3 Thickness (cm) Strength (kPa) Overlay Bond Base
1-295 Control (51 mm) 0 6.05 1731 19 2 79
PO-1 11.9 5.95 2162 88 2 10
PO-2 14.8 5.72 1029 7 5 88
FP 1.8 5.83 1765 50 1 49
ST 29.7 5.81 2017 60 2 38
ST 44.5 5.69 1834 39 1 60
1-85 Control (102 mm) 0 10.48 1646 0 0 100
MP-l 0.9 10.68 1573 17 0 83
MP-1 3 10.99 1909 17 0 83
ST 29.7 10.72 1479 0 0 100
ST 44.5 10.68 1847 0 0 100
Rte.29 Control (51 mm) 0 6.03 794 15 0 85
Control (102 mm) 0 10.24 744 13 5 82
PO-1 11.9 5.89 657 28 40 32
MP-2 3 5.79 798 13 15 72
ST 29.7 5.77 815 14 25 61
ST 44.5 5.72 531 20 36 44
Table 5.2. Tensile adhesion test results from overlay placements.
5.5 Permeability Test Results
Cores 102 mm in diameter were taken through the overlays approximately 1 month after theoverlays were placed. The top 51 mm was tested for permeability to chloride ion (AASHTO T277). The results are shown in Table 5.3. The results indicate that after 6 weeks of cure,permeability ranges from medium to high. It is expected that when tests are done at a later agewhen the pozzolans and slag are more completely cured, the permeability will be in the lowrange.4
-9
Fiber Type Amount Job(kg/m3
) 1-295 1-85 Rt-29
Control 0 2051 4462 3136
PO-2 14.8
PO-1 11.9 2847 3328
FP 1.8 5115
MP-1 0.9 4481
MP-1 3.0 2609
MP-2 3.0 4067
Table 5.3. Permeability of cores taken after overlay installation.
33
5.6 Post-Installation Photographic Record
A video of post-placement conditions is available.
5.7 Crack, Patch, and Test Location Map
Sketches of the cracks and patches before and after placement of the overlays are on file.
5.8 Cost of Overlay
Table 5.4 provides the cost for the placement of the concrete overlays for the projects. 1-295costs are less those for 1-85 because the overlay placed in 1-295 was 51 mm thick and requiredless material than the 102-mm overlay placed in 1-85. In this study, steel FRC was moreexpensive than polypropylene or polyolefin FRC. However, the cost does not reflect the marketprice of polyolefin FRC. Because of bidding and contractual stipulations, polyolefin fiber wasacquired at the cost of polypropylene fiber. The actual order of the cost from highest to lowestwas polyolefin FRC followed by steel FRC and then polypropylene FRC. Therefore, the actualcost of the polyolefin FRC would be higher than what was shown in Table 5.4.
The cost data show that a 102-mm overlay can be a much better buy than a 51-mm overlay.Especially for "white topping" as represented by Rte. 29, the cost of the 102-mm overlay is only8 percent more than that of the 51-mm overlay, but the thickness is double and the modulus isfour times greater.
An asphalt overlay 51 mm thick would cost approximately $3/m2. A 51-mm concrete overlay
would have to last 10 times longer than a 51-mm asphalt overlay to be competitive.Consequently, white topping would not typically be economical compared to placing asphalt onasphalt. Use of white topping could be justified at selected locations such as intersections whererutting of asphalt is severe and the asphalt requires frequent replacement that results in severedisruption of traffic.
Similarly, the use of HCC overlays on continuously reinforced concrete pavements would nottypically be economical compared to the use of asphalt, but it might be justified in specialsituations.
34
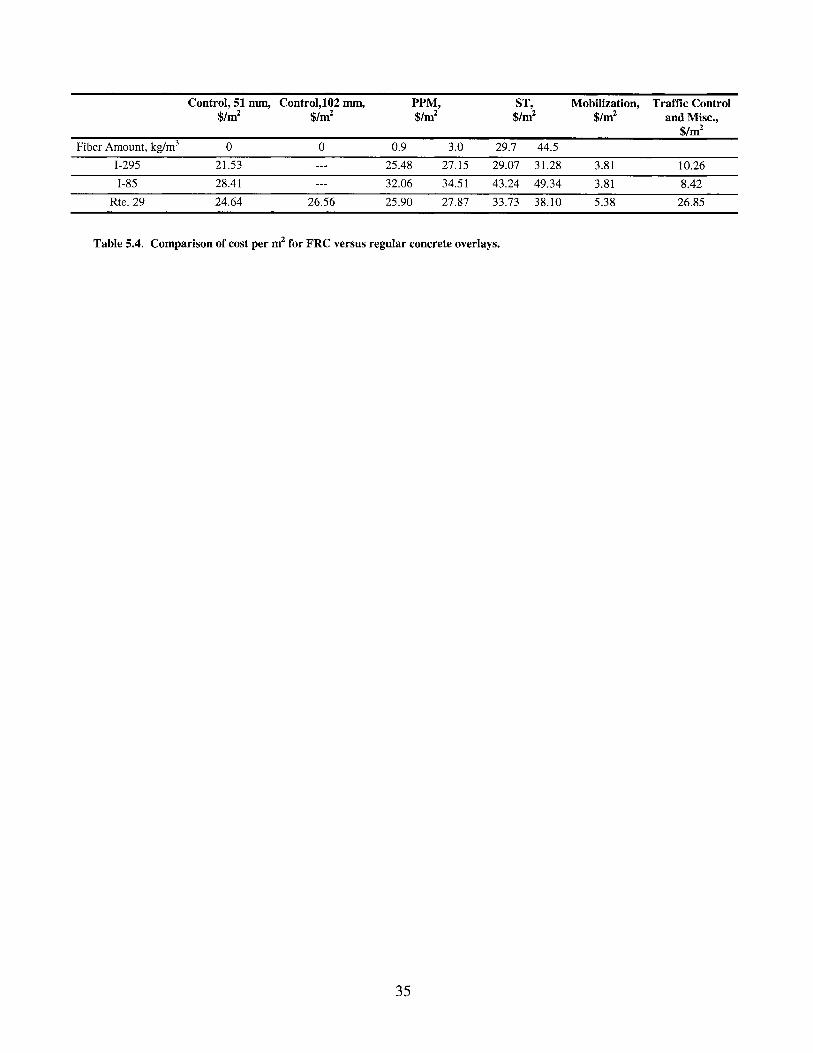
Control, 51 DlDl, Control,102 DlDl, PPM, ST, Mobilization, Traffic Control$/m2 $/m2 $/~ $/m2 $/m2 and Misc.,
$/m2
Fiber Amount, kg/m3 0 0 0.9 3.0 29.7 44.5
1-295 21.53 25.48 27.15 29.07 31.28 3.81 10.26
1-85 28.41 32.06 34.51 43.24 49.34 3.81 8.42
Rte.29 24.64 26.56 25.90 27.87 33.73 38.10 5.38 26.85
Table 5.4. Comparison of cost per m2 for FRC versus regular concrete overlays.
35
6. Conclusions
The high performance concrete overlays were successfully placed on continuously reinforcedconcrete and on asphalt pavements. The installation data and the I-year evaluation of concretesand the overlays indicate that:
1. Strong and low permeability concretes were obtained.
2. Addition of fibers increased the toughness index of the concretes. In the overlays thepresence of fibers appeared to control the widening of cracks.
3. Resistances to cycles of freezing and thawing of air-entrained concretes weresatisfactory.
4. Stiffness of the pavements was increased with the addition of the overlays.
5. Satisfactory skid numbers were achieved in all test sections.
6. The 51 mm thick overlays placed on asphalt cracked badly as soon as traffic wasapplied and are not likely to last long.
7. Compared to asphalt, HCC overlays will not typically be economical.
8. Because of the high cost of fibers, their use would not typically be economical.
36
7. Recommendations
1. HCC overlays 51 to 102 mm thick should be used to increase the cover overreinforcement, improve ride quality, and increase the stiffness of continuouslyreinforced concrete pavements when these benefits justify the cost.
2. HCC overlays 76 to 102 mm thick should be placed on asphalt to prevent ruttingwhen economically justified.
3. HCC overlays 51 mm thick should not be used on asphalt.
37

8. Acknowledgments
This research and 80% of the construction was done with ISTEA 6005 thin-bonded overlay fundsprovided by FHWA. Thanks to Vasant Mistry and Roger Larson of FHWA for administering thefunds.
38
9. References
1. Sprinkel, M. Polymer Concrete Overlay on Beulah Road Bridge. VHTRC 83-R26. VirginiaTransportation Research Council, Charlottesville, 1982.
2. Sprinkel, M. Twenty-Year Performance of Latex-Modified Concrete Overlays.Transportation Research Record 1335. Transportation Research Board, Washington, D.C.,1992.
3. McGee, K.H. and H.C. Ozyildirim. Construction of a Thin-Bonded Portland CementConcrete Overlay Using Accelerated Paving Techniques. Transportation Research Record1335. Transportation Research Board, Washington, D.C., 1992.
4. Ozyildirim, C. High-Performance Concrete for Transportation Structures. ConcreteInternational, January 1993, pp. 33-37.
5. Ozyildirim, C. Resistance to Penetration of Chlorides into Concretes Containing Latex, FlyAsh, Slag, and Silica Fume. Durability of Concrete. ACI SP-145. Detroit, 1994, pp. 503518.
6. Ozyildirim, C. Ensuring High Quality Silica Fume Concrete Overlays. Fly Ash, Silica Fume,Slag and Natural Pozzolans in Concrete. ACI SP-153, Vol. 2. Detroit, 1995, pp. 675-686.
7. Ozyildirim, C., C. Moen, and S. Hladky. Investigation of Fiber-Reinforced Concrete for Usein Transportation Structures. Transportation Research Record. Transportation ResearchBoard, Washington, D.C., pending publication.
8. Sprinkel, M. and C. Moen. Evaluation of the Installation and Initial Condition ofLatexModified and Silica fume Modified Concrete Overlays Placed on Six Bridges in Virginia.VTRC 99-IR2. Virginia Transportation Research Council, Charlottesville, 1999.
9. Sprinkel, M. and C. Ozyildirim. Evaluation of the Installation and Initial Condition ofHighPerformance Concrete Overlays Placed on Rte. 60 Over Lynnhaven Inlet in Virginia. VTRC99-IR4. Virginia Transportation Research Council, Charlottesville, 1999.
39