Embed Size (px)
Citation preview

EVALUATION OF THE POLYAD@ FB
AIR PURIFICATION AND
SOLVENT RECOVERY PROCESS
FOR STYRENE REMOVAL
OOZY.?O United States Environmental Plotection
Control Technology EPA-600/R-93-212
A a e w Center Research Triangle Park NC 2771 1 November 1903
.

This document is available to the public through the National Technical Informa- tion Service, Springfield, Virginia 22161.
61 . . . .
EPA REVIEW NOTICE
This report has been reviewed by the U.S. Environmental Protection Agency, and approved for publication. Approval does not rig* that the contents necessarily . reflect the views and policy of the Agency, not doeqhention of trade names or commercial products constitute endorrement of recorirmendation for uw.

EPA-600/R-93-212 November 1993
EVALUATION OF THE POLYAOO FB AIR PURIFICATION AND SOLVENT RECOVERY PROCESS
FOR STYRENE REMOVAL
Prepared by:
Lany Felix, Randy Merritt. and Ashley Williamson Southern Research Institute
Environmental Sciences Research Department P. 0. Box 55305
Birmingham, AL 35255-5305
€PA Contract Number 68-02-0062 Task No. 2
Task officer. Bobby E. Daniel Air and Energy Engineering Research Laboratory
U. S. Environmental Protection Agency Research Triangle Park. NC 2771 1
Prepared for:
C o n t r o l Technokgy Center U.S. Environmental Protection Agency
Research Triangle Park, NC 2n11

CONTROL TECHNOLOGY CENTER
Sponsored by:
Emission Standards Division Office of Air Quality Planning and Standards
U.S. Environmental Protection Agency Research Triangle Park, NC 2771 1
Air and Energy Engineering Research Laboratory U. S. Environmental Protection Agency
Research Triangle Park, NC 2771 1
Center for Environmental Research Information Office of Research and Development US. Environmental protect^^ Agency
Cincinnati, OH 45268
ABSTRACT
Manufacturing processes that involve the spraying of styrerebased resins have been identified as a possible signifiint source of volatile organic compound (VOC) emissions that may affect human health and contribute to the ozone non-attainment problem. Until recently, no known technokgy has been demonstrated to control such emissions of styrene. Now. two pmesses have been developed to control styrene emissions and a short-term field evaluation was planned to characterize the styrene removal efficiency of pilot-scale versions of each process. Unfortunately, because only one system could be made available for the proposed test penod, only one of these systems could be tested. This test was carried out at a facility (Eljer Plumbingware in W h . NC) that manufactures polyester bathtubs and shower stalls by spraying styrensbased resins onto molds in vented, open, spray booths. A side stream of air exhausted from one of the spray booths in the-gel coating part of the process was used for this test.
In this study the styrene removal efficiency of a pilot-scale version of the PolyacP fluidized bed (FB) air purification and solvent recovery system was quantifii by continuously measuring the total hydrocarbon (THC) content of spray booth exhaust air entering and exiting the Polyad FB device with THC analyzers and by collecting NIOSH Method 1501EPA Method 18 sampleg at the inlet and exit of the Polyad FB device. Styrene removal efficiencies greater than 90% were achieved.
This work was performed at the request of the Control Technology Center (CTC) steering cbmmittee to provide information to state and l o c a l agencies for use in responding to public concerns.
ii

TABLE OF CONTENTS
................................................................................................................................................ ii
L i of Figures ....................................................................................................................................... v
L i t of Tables ....................................................................................................................................... vi
Acknowledgments ............................................................................................................................... vii
Preface .... ’. .......................................................................................................................................... VIII
Metric to Nonmetric Conversions ......................................................................................................... ix
Section ........................................................................................................................................... Ea!B
1 . Introduction .................................................................................................................................... 1
2 . Project Description .................................................................... ; .................................................... 3 2.1 . fixpenmental Approach ........................................................................................................... 3 2.2 Elier Plumbingware Faclldy ..................................................................................................... 4 2.3 The Polyad@ FB Process ........................................................................................................ 7
2.3.1 Pilot-Scale Polyad@ FB Device ................................................................................... 11
2.4 Experimental Apparatus ........................................................................................................ 16 2.4.1 Connection to the Pilot-Scale Polyad FB Unit ............................................................. 16 2.1.2 Sampling Van ............................................................................................................ 16
2.5 Experimental Methods and Procedures ................................................................................. 21 2.5.1 Total Hydrocarbon Analyzers ..................................................................................... 21 2.5.2 Collection of Volatile Organic Compound Samples ..................................................... 22 2.5.3 Collection of Recovered Solvent Sample .................................................................... 23 2.5.4 Total Flow Rate Measurements ................................................................................. 24
3 . Data. Results. and Discussion ...................................................................................................... 25 3.1 Total Hydrocarbon Analyzer Data ......................................................................................... 25
3.1.1 Inlet Data .............................................................................................................. : .... 26 3.1.2 Outlet Data . . . . . . . . . . . . . . . . . . . . . . . . . . . . . . . . . . . . . . . . . . . . . . . . . . . . . . . . . . . . . . . . . . . . . . . . . . . . . . . . . . . . . . . . . . . . . . . . . . . . . . . . . . . . . . . . . 32
3.1.4 Estimated Styrene Emissions from Gel Coat Booth #2 ............................................... 46
...
..
2.3.2 Specific Test Conditions ............................................................................................ 14
3.1.3 Efficiency Data ........................................................................................................... 36
3.2 Volatile Organic Compound Data .......................................................................................... 48 3.2.1 Measurements at Spray Booth Exhaust Stacks .......................................................... 49 3.2.2 Measurements at the Inlet and Outlet of the Polyad FB Device .................................. 53
3.3 Analysis of Recovered Soivent Sample ................................................................................. 56 3.4 Total Flow Rate Data ............................................................................................................ 56 3.5 Styrene Capture by the Polyad FB Device ........................................... : ............................... 59
4 . Costs Associated with Applying the Polyad FB System to Styrene Removal ................................. 61
5 . Summary and Conclusions ........................................................................................................... 68
iii

TABLE OF CONTENTS. CONTINUED
Appendix A NiOSH Method t501 ....................................................................................................... 70
Appendix B Quality Control Evaluation Report ................................................................................... 78
Appendix C Total Hydrocarbon Analyzer Daily Results ....................................................................... 88
iv

c a
LIST OF FIGURES
Fiaure 1 . Layout of the Eljer Plumbingware Facilii ........................................................................................ 5 2 . Digramatic representation of the Polyad FB Air Purifiition and Solvent Recovery Process .......... 9 1
r 3 Schematic diagram of the pilot-scale Polyad FB unit tested at Eljer Plumbingware 12 4 . Component layout of the pilot-scale Polyad FB unit tested at Eljer Plumbingware ......................... 13
i 5 Overall arrangement for sampling at the Eljer Plumbingware Facilii 17 6 . Equipment arrangement used for sampling with THC analyzers .................................................... 18 7 . Equipment arrangement used for NIOSH Method 1501 sampling .................................................. 19 8 . Inlet hydrocarbon emissions. November 3. 1992 ........................................................................... 27 9 . Inlet hydrocarbon emissions. November 4. 1992 ........................................................................... 28
i 10 Inlet hydrocarbon emissions. November 5. 1992 29 11 . Inlet hydrocarbon emissions from 0910 to 0950. November 5. 1992 ............................................. 30 12 . Inlet hydrocarbon emissions from 11 10 to 11 50. November 5. 1992 ............................................. 31 13 . Outlet hydrocarbon emissions. November 3. 1992 ........................................................................ 33 14 . Outlet hydrocarbon emissions. November 4 . 1992 ........................................................................ 34 15 . Outlet hydrocarbon emissions. November 5. 1992 ........................................................................ 35
17 . Hydrocarbon removal efficiency. November 4. 1992 ..................................................................... 38 18 . Hydrocabn removal efficiency. November 5. 1992 ..................................................................... 39 19 . Average inlet and outlet hydroabon and styrene emissions for each period of spraying .............. 44 20 . Average hydrocarbon and styrene removal efficiency for each period of spraying ......................... 45
along with values for the 200. 000 sdm system proposed for W~er Plumbingware .......................... 66
!
. ........................ I
. .............................................
1
. ...........................................................................
1
i
16 . Hydrocarbon removal efficiency. November 3. 1992 ..................................................................... 37
21 . Total system cost as $/ton of styrene removed for a nine year lifetime for various inlet concentrations of styrene . Data for 20. 000 and 6O.OOO scfm inlet flow rates are shown
I 22 . Total system cost as Yscfm of inlet flow rate for a nine year lifetime for various inlet
'1 .......................... concentrations of styrene . Data for 20. 000 and 60. OOO scfm inlet flow rates are shown along with values for the 200. 000 scfm system proposed for Eljer Plumbingware 67
V

a
LIST OF TABLES
1 . 2 . 3 . 4 . 5 . 6 .
7 .
8 . 9 . 10 . 11 . 12 . 13 .
Daily Test Conditions .................................................................................................................. 15 Daily Averages and Grand Average of THC Analyzer Data. November 3 through 5. 1992 ........... 41 Summary of THC Analyzer Data, November 3 through 5. 1992 ................................................... 42
Summary of Estimated Styrene Emissions from Gel Coat Booth #2. THC Data ........................... 47
1 WNIOSH Method 1501 Sampling .............................................................................................. 50
Styrene Removal from THC Data. November 3 through 5. 1992 .................................................. 43
Sampling Conditions for Measurements made at the Outlet of Gel Coat Booth #2. First . Lay-Up Booth # 5. and Second Lay-Up Booth #7. October . November. 1992 . €PA Method
Styrene Concentrations Measured at the Outlet of Gel Coat Booth #2 . First Lay-Up Booth # 5. and Second Lay-Up Booth #7. October . November. 1992 . EPA Methad 18/NIOSH Method 1501 Sampling ............................................................................................................... 51 Results of EPA Method 1WNIOSH Method 1501 Samples Taken at the Inlet of the Polyad FB Device. November 3 to November 5. 1992 ............................................................................. Results of EPA Method 1 WNIOSH Method 1501 Samples Taken at the Outlet of the Polyad FB Device. November 3 to November 5. 1992 ............................................................................ 55 c;Ompounds Identified in Liquid Sample Recovered from the'$olyad FB Device .......................... 57 Flow Rate Measurements at the Inlet of the POryad FB Device .................................................... 58 Estimated Styrene Capture in the Polyad FB Device ...... ............................................................ 60 Design Assumptions and Price Quotes forthe Polyad Concentrator System and the Potyad Recovery System for the Eljer Faciri ......................................................................................... 62
14 . Equipment k t and Dimensions for brge Coqxmnts for Polyad Systems Suitable for Installation at the Eljer F a c ~ l i 63
B.l . Data Quali Indicator Goals for C r i t i i Measurements Estimated in QAPP ................................ 82 8-2 . Data Quali Indicator Values for NIOSH Method 1501 Measurements Made at
8.3 . Data Quali Indicator Values for NIOSH Method 1501 . Charcoal Sample Tubes
.. .....................................................................................................
Eljer Plumbingware ..................................................................................................................... 83
Spiked with Known Concentrations of Styrene ............................................................................ 84 8-4 . Data Qual i ty Indicator Values for THC Analyzer Measurements Made at Eljer Plumbi ngware ...... 85 C.l . THC Analyzer Results from November 3. 1992. First Period of Spraying ................................... A 9
C-3 THC Analyzer Results from November 3. 1992 . Third Period of Spraying .................................... 91
C-6 . THC Analyzer Results from November 4. 1992 . Third Period of Spraying .................................... 94 C.7 . THC Analyzer Results from November 5. 1992. First Period of Spraying ..................................... 95 C.8 . THC Analyzer Results from November 5. 1992 . Second Period of Spraying ................................ 97
C.2 . THC Analyzer Results from November 3. 199 2, Second Period of Spraying ................................ 90
C-4 THC Analyzer Results from November 4. 1992, First Period of Spraying ..................................... 92 C-5 THC Analyzer Results from November 4. 1992. Second Period of Spraying ................................ 93
C.9 . THC Analyzer Results from November 5. 1992. Third Period of Spraying .................................... 98
vi

ACKNOWLEDGMENTS
The authors would like to thank J. N. Eason, Plant Manager at fljer Plumbingware in Wilson,
NC, for providing a site to cany out this evaluation and Rollie Nagel, Manager of Safety and
Environmental Health at Eljer, for his support and help during the test. The authors would also like to
thank Lennart Odbratt and Magnus Danielsson of Weathedy, Inc. for making available the PolyacP FB
unit for this test and for their help and assistance before, during, and after the test. Finally, the authors
would like to thank EPA Task Officer Bobby Daniel of the EPA Air and Energy Engineering Research
Laboratory for his help, support. and coordination throughout this work
vii

PREFACE
The Control Technology Center (CTC) was established by EPA's office of Research and
Development (ORD) and Offiie of Air Quality Planning and standards (OAQPS) to provide technical
assistance to state and local air pollution control agencies. Three levels of assistance can be accessed
through the CTC. First, a CTC HOTLINE has been established to provide telephone assistance on
matters relating to air pollution control technology. Second, more in-depth engineering assistance can
be provided when appropriate. Third, the CTC can provide technical guidance through publication of
technical guidance documents, development of personal computer software, and presentation of
work+ops on control technology matters.
The engineering assistance projects. such as this one. focus on topics of national or regional
interest that are identified through contact with state or local agencies.
viii

~~
Metric Multiplier Yields Nonmetric
kPa 1450.38
kPa 4.01 45 in. H20
Pig
'C 1.8T + 32 'F
m 3.2808 ft
m3 35.3134 fP
mmHg 0.03937 in. Hg
kg 2.2026 Ib
lo00 kg 0.90802 ton
dimin 35.3134 ft3imin


SECTION 1
INTRODUCTION
The c o n t r o l of styrene is a major concern for many areas of the country. Up to the time of this
evaluation, The Control Technology Center (CTC) had received over 30 calls on the topic. One area of
styrene emissions is in the manufacture of shower s t a l l s and bathtubs. There are approximately 200 of
these plants operating in the U.S. emitting uncontrolled styrene to the atmosphere. Until recently, no
known technology had been demonstrated to control the emissiin of styrene.
The CTC was contacted by the firm of Weathem, I n c . . of Atlanta, GA, with regard to the
possibility of evaluating a system (The Polyada FB Process) that had been developed in E u W and is
presently being used there to control styrene emisshs. This process uses a fluidized bed adsorption
system with proprietary macro porous polymer p a r t i c l e s as the adsorbent. In the Polyad FB process the
adsobent continuously migrates from an adsorption section to a desorption section where the polymer
particles are regenerated and the solvent is condensed and recovered back to the adsorption section.
After being contacted by Weathetly. Inc., the CTC attempted to find other vendors of c o n t r o l
technology for styrene removal. One other vendor was found and the CTC contacted this vendor,
QUAD Environmental Technologies Corporation, of Northbrook, IL. to propose the evaluation of their
chemical scrubber process (QUAD Chemtactm System) along with the Polyad FB process on a source
of styrene emissions. The QUAD Chemtact process removes styrene by spraying fine droplets (a mist)
of a diluted chemical solution into a contaminated air stream as it is injected tangentially into the top of a
hollow cylindrical reaction chamber. Styrene is apparently oxidized and adsorbed into the mist of
scrubber liquor which is continuously collected and exhausted through the chamber drain. The treated
air is then exhausted tangentially through the bottom of the reaction chamber.
1

The CTC initiated a proposed project to evaluate the Polyad and Chemtact processes for
controlling styrene emissions at a representative fiberglass shower stall and bath tub manufacturing
plant. Eljer Incorporated of Wilson, North Carolina was selected as a possible site and was visited by
representatives of €PA in August of 1992 and later, in October, by representatives of €PA, SRI,
Weatherly, and QUAD. This facility was selected because at this site Eljer manufactures both fiberglass
shower stalls and bathtubs by spraying styrenebased resins onto various mold shapes in individual
spray booths that are vented to the atmosphere. During the August visit, a tentative agreement was
reached to test both the Polyad FB and Chemtact processes on a representative source of styrene
emissions from the shower stalVbathtub construction process. Subsequently, during testing of the
P o w FB unit, it was found that QUAD Environmental could not'supply the unit for testing within the
time frame allotted for this work
Vent air from the spraybooths used for moldcoating that is exhausted to the atmosphere is the
major point source of emissions from the manufacture of fiberglass shower stalls and bathtubs. Thus,
the number of manufacturing steps that involve the spraying of styreneaased resins and the number of
individual spray booths in operation at a particular facility determine the level of styrene emitted to the
atmosphere.
Any fiirghss produd that during its manufacture requires the spraying of styrene is a source of
organic vapors that could affect human health both directly and indirectly. The results of this evaluation
will provide information to state and local agencies for use in responding to public concerns.
2

SECTION 2
PROJECT DESCRIPTION
2.1 EXPERIMENTAL APPROACH I
I
I Styrene is an integral part of the industrial process that produces fiberglass bath tubs and
1 shower stalls. In the first step of this manufacturing process, styrene is mixed with polyester resin and a I
pigment to create a 'gel coat' that is sprayed onto a previously prepared mold. Molds are typically
reusable and before each use the mold is waxed and coated with a mold-release agent that also helps
to provide a high gloss to the finished product. In subsequent manufacturing steps, styrene and
polyesty resin are mixed with inert fillers and sprayed onto the prevkusly coated mold aiong with
chopped fiberglass. Between each application the coated mold is set aside while the resin is allowed to
cure. Because curing is an exothermic process, the next manufacturing step is usualty not camed out
I until the coated mold has coded. Fiberglass provides structural support for the finished article, styrene
1 and polyester resin act as a glue to hold the matrix together, and the inert fillers provide additional
I structural support and can ais0 be used as a fire retardan!. The final step of manufacture is to separate
the finished fiberglass product from the mold. I , The purpose of this project was to evaluate the wormance of two pilot-scale devices designed 1
to control styrene emissions. During this evaluation, each pilot-scale control device was to be
, , configured to treat a portion of the air exhaust from a gelcoat booth at a fiberglass shower stall and bath
tub manufacturing plant operated by Eljer Plumbingware kxated in Wilson, North Carolina. As indicated
above, of the two devices selected for evaluation, only the Polyad FB device could be tested within the
time allotted for this work
To measure the styrene removal effiiiency of the pilot-scale Polyad FB device, total
hydrocarbon (THC) analyzers equipped with flame ionization detectors (FID) were used to determine
total hydrocarbon levels at the inlet and outlet of the device on a continuous basiis while c h a r c o a l - f i l l e d I
sampling tubes were used to collect samples of volatile organic compounds (VOC's) at the inlet and
outlet of the device over time periods ranging from one to two hours. Styrene' levels in the inlet and
3
outlet gas streams were quantified by subsequent chromatographic analysis (with FID detection) of the
VOC's retained in the charcoal-filled sampling tubes.
2.2 EWER PLUMBINOWARE FAClLlN
The Ever Plumbingware facility, diigrammat'kally shown in Figure 1, is located in Wilson, North
Carolina. In this figure the location of the pilot-scale Polyad FB unit is shown along with the location of
the van used for sampling and the generator used to provide power for the Polyad device.
Each stage of manufacture except for mold separation or 'pulling' is camed out in a spray
booth. At the Eljer facility the spray booths were not constructed in place but are prefabricated units
manufactured by Binks. I n c . Each spray booth is approximately 3.05 m (10 ft) high, 4.1 1 m (13.5) ft
wide,-and approximately 3.66 m (12 ft) deep. The booths are actklly several feet deeper but 3.66 m
back trOm the mouth of the booth an expanded metal grate is mounted across the width and height of
the booth on which a large sheet of air conditioning-type filter material is mounted. The filter material is
usually changed evefy other day. Each spray booth is continuously vented with air from the interior of
the plant that is pulled into the booth entrance, through the air conditioning filter mat, to a large fan unit
mounted outside of the building. Air pulled into the fan exits through ductwork that reenters the side of
the building and exhausts vertically through a 0.91 m (3 ft) diameter stack mounted on the roof of the
f a c i i i i . Each exhaust fan has a nominal rated flow of 411 d/mm (14,500 acfm).
There are three distinct manufacturing steps that are required to produce a fberglass shower
s t a l l or bath tub at the Eljer fac i l i i . First, a prepared mold is mounted on a cart and wheeled into one of
the three gekoat spray booths located in the mold repair shop. In the spray booth, the mold and cart
are designed to slide onto the arm of a permanently mounted pedestal assembly that can be elevated
above the floor of the spray booth. The mold and cart are also designed to rotate on the arm of the
pedestal so that a l l parts of the mold are accessible for spraying. Thii mounting system is duplicated in
every spray booth at the Eljer facility.
Geicoat is a nominal mixture of 1/3 styrene monomer, 1/3 polyester resin, and 1/3 pigment. At
the time of this test two colors of pigment were used: white and pink About three minutes are required
to coat a bath tub mold with gelcoat and fwe minutes are required to coat a shower s t a l l mold with
4

I 1 9 0 k k - r
ACCESS AREAWAY FIBERGLASS FOR flLTER SERVICE ROVING CHOPPER
MOLD REPAIR SHOP
. Figure 1. Layout of the u i j Plumbigware Faciiii
5

gelcoat. When spraying is complete, the mold is oriented upright and the pedestal is lowered until the
wheeled cart mounted to the mold contacts the floor. The mold and its attached cart is then wheeled out
of the booth to await the next stage of manufacture. Between each stage of manufacture the coated
mold is set aside to cure and harden for about an hour. Curing generates heat so there is a time interval
between sprayings to allow the coated mold to cool.
The second stage of manufacture is called the Yrst lay-up' or 'initiil laminating' step. In this
stage, the mold is conveyed to one of the first lay-up booths and, as with the first step of manufacture,
mounted on a pedestal and prepared for spraying. In this step, calcium carbonate (CaC03) powder is
added to a mixture of 50% styrene monomer and 50% polyester resin to form a slurry that contains
apprgximately 50% solids. Thii slurry is sprayed onto the moM and during the spraying operation,
chopped fiberglass roving is also blown at about a 30' angle into the stream of spray as it exits the spray
nozzle. The spray mixes withthe strands of chopped fiberglass and forms a entangled mat of resin
impregnated fiberghss on the surface of the mold. The CaCO3 powder and the chopped fiberglass help
provide structural support to the finished product. As with the frst stage of manufacture, this step is
brief and requires only three to fwe minutes to complete. When this step is completed the coated mold
is once again set aside to cure.
The third, and final, spraying step is called the 'second lay-up' or backup' step and takes place
in one of the two second lay-up booths shown in the upper left comer of Figure 1 (Booth #7 or Bwth
#e). In this step, a 609&40% blend of powdered CaCO3 and hydrated alumina is added to a mixture of
50% styrene monomer and 50% polyester resin to form a slurry that is contains approximately 50%
solids. Hydrated alumina is added as a fire retardant. This mixture is also sprayed with chopped
fiberglass fibers and forms the final layer on the mold. As with the first stage of manufacture, this step is
brief and requires only three to fnre minutes to complete. When this step is completed the coated mold
is set aside to cure for the final time.
The final stage of manufacture is 'pulling' or separation of the mold from the completed shower
stall or bath tub. After the finished fiberglass piece is trimmed and inspected it is prepared for shipment
to its final destination.
6

2.3 THE POLYAD@ FB PROCESS
The Polyad FB process was developed and is marketed internationally by Nobel Chematur (now
Chematur Engineering AB) of Karlskoga, Sweden. Weatherly, Inc., located in Atlanta, Georgia, is a
wholly-owned subsidiiry of Chematur International A B , and has the responsibility for domestic marketing
and sales of the Polyad FB process. The pibt-scale PoJyad FB device that was evaluated at the Eijer
Plumbingware facility was provided and operated by Weatherly, Inc. who also supplied the information
from which the following description of the Polyad FE process was taken.
Polyad is a collective name for adsorption processes developed by Chematur AB for the
removal of organic substances from process exhaust air and water. These purification processes are all
based onadsorption onto macro-porous polymer particles instead of activated carbon, which previously
was the adsorption agent of choice for most solvent removal precesses. Chematur indicates that
Polymer adsorbents are superior to activated carbon because polymer formulations can be optimized for
the adsorption of a specific solvent.
For air purifiition applications Chematur. markets their proprietary macro-porous polymer under
the trade name of Bonopore?. It is supplii in the form of off white to pale tan particles with an average
size of 0.5 mm, bulk density of 0.3 g c d , and specific surface area of approximately 800 m2/g. The
high surface area is due to the macro-porous nature of the material. The Material Safety Data Sheet for
Bonopore indicates that it has a molecular weight > 1 ,OOO,OOO and l i is its components as
dvinlybenzene, ethyhrinlybenzene, toluene, and water. Chematur indicates that the adsorption
properties of Bonopore are unaffected by high humidi and that the polymer has IK) catalytic effect on
solvents such as styrene. It also resists abmsion which is important as the Bonopore particles are
generally used to constitute a bed that is fluidized with solvent-laden air. The amount of Bonopore
required for a given appliition is governed by total air flow through the bed, the amount of solvent
present in the air stream, the adsorption rate of the solvent onto the Bonopore polymer, and the desired
solvent removal efficiency.
The Polyaci FB (fluidized bed) air pufllcation and solvent recovery process utilizes a
continuously fluidized bed for air purifiition and the recovery of solvents from air. Chematur claims that
7

this process is especially well suited for recovery of solvents from air streams when the solvents have
relatiuely high boiling points. Typical solvents that are suitable for removal with the Polyad FB process
include aromatic and aiihatic hydrocarbons, chlorinated hydrocabns, certain freons, alcohols,
aldehydes, ketones. and esters. Organic sdvents with low boiling points and very polar solvents. such
as methanol or methylene chloride, are not suitable candidates for removal with the Polyad process.
At this time, two Polyad FB processes are marketed. The first of these processes is the one
that was tested at Eljer Plumbingware where solvent is recovered for reuse or disposal. In this process
(Figure 2) solvent-laden air is purified as it passes through a fluidized bed of Bonopore adsorbent. The
saturated Bonopore adsorbent is then pneumatically conveyed to a desorption unit where it is
regenerated.
The adsorption section consists of two, or more, beds of Bompore. The number of beds
depends on the type and c o n c ~ r a t i i of the solvent and on the degree of solvent removal required,
Solvent is adsorbed by the polymer p a r t i l e s as air passes through and fluidiies each bed. Bonopore
continuously flows from one bed to the next. In the last bed the adsorbent, now saturated with solvent,
is removed from the bottom of the bed and pneumatically conveyed to the desorption section at the
same rate as regenerated Bonopore is fed into the first bed.
Bonopore from the adsorption section is pneumatically conveyed to the top of a vertical moving
bed desorber or 'stripper' for regeneration. The desorption section consists of a container mounted
above the stripper unit comprising a specially designed heat exchanger with gas collector. As particles
of Bonopore descend through the desorber they are heated in a heat exchanger to a temperature at
which the solvent evolves. The heating medm is steam but, by using a heat exchanger, steam and
water do not come in contact with the recovered sotbent or the Bonopore polymer. The vacuum created
in the container at the to9 of the desorption section by the pneumatic transport fan causes air to be
drawn in through an air intake at the bottom of the stripper. It is then drawn upward through the
descending adsorbent. This air, together with the released solvent, is collected and directed into a
condenser. Condensed solvent is captured in a tank Air containing any uncondensed solvent is fed
back into the top of the stripper and allowed to ascend again through the heated desorption zone.
8

CLEAN AIR
Figure 2. Diagrammatic representation of the Polyad FB Air PuriFiition and Solvent Recovery Process.
9

Once past the heated section of the stripper, adsorbent is cooled by a water cooled heat
exchanger situated at the bottom of the stripper. Ordinary tap water is usually sufficient to provide for
satisfactory condensation of the recovered solvent. Regenerated adsorbent is pneumatically conveyed
from the bottom of the desorber to the top of the adsobr into the first fluidized bed, to complete the
cycle.
In a properly designed unit, essentially all of the solvent entering the unit will be adsorbed onto
the Bonopore polymer before the process air stream canying the solvent exits the Polyad FB unit.
Therefore, outlet emissins are primarily due to sorbent 'bleeding' from Bonopore polymer as it reenters
the adsorber after being discharged from the desorber. Thii is because desorbed Bonopore is
intM.uced back into the adsorption section at the hst fluidized bed before the system outlet. Weathen'y
engineers emphasize that such outlet emissions can be minimiied by proper design and are acceptable
in l i iM of the gain in design simplicity and re l i i i l i i afforded by the use of gravity to aid in the feeding of
Bonopore polymer from one fluidized bed to the next.
The second type of Potyad FB process is used in cases where solvent recovery is not required.
In this case, the Polyad F B . p r o c e s s is used as a preconcentrator to increase solvent concentration in
the exhaust stream so that it can be easily incinerated. The net effect of such preconcentration is to
reduce the total volume of air in the exit stream while increasing the concentration of solvent. For this
application, the fluidized bed adsorber is unchanged but instead of a moving bed desorber a fluidized
bed desorber is d. In the fluidied bed desorber the Bonopore is regenerated by blowing hot air
through the adsorbent (in a fluidized bed) which causes the solvent to evolve. As with the first process,
regenerated adsorbent is pneumatically conveyed back to the first adsorber. The hot solvenUair mixture
leaving the desorber is passed to an incinerator where it is burned. To reduce energy consumption, a
heat exchanger can be installed to recover waste heat at the incinerator outlet.
Among the Polyad FB units that have been installed, two were installed specifiilly to remove
and recover styrene. One of these units was installed at the IF6-Sanitar AB plant in Brom6lla, Sweden
in 1989. Thii unit treats 21,200 m%r of air and can recover up to 8 k@hr of styrene with a 90% overall
10

efficiency. This unit requires 52 kW of electric power, 0.5m3/h of cooling water and 150 kg of Bonopore
catalyst per year. Another styrene removaUrecovery unit was recently ordered (in Germany).
2.3.1 pilot-Scale Polvad FB Device
The Polyad mobile unit used at the Eljer Plumbingware facility was designed to accommodate
an air flow of up to 500 d/h (294 acfm). With this unit configured as it was for this evaluation, a
maximum steady state concentration of 1 OOO ppm of styrene could be accomodated before the level of
outlet emissions would be affected. Shortduration peak concentrations of up to 3000 ppm of styrene
could also be experienced before outlet emissions would be expected to increase. Solvent removal
efficiency was expected to be greater than 90%. A schematic diagram of the pilot unit is shown in
Figure 3 snd a component arrangement drawing of the pilot unit is s&wn in Figure 4.
This portable unit consists of three separate modules designed to be assembled on site after
being shipped there by truck The total weight of the a s s e m b l e d package is 2000 kg and once set up it
occupies a space 3.8 m long by 2.0 m wide by 5.0 m high. During operation the pilot-scale Polyad FB
unit requires 45 kW of 480 VAC of electrical service, primarily for steam generation, fan power, and
cooling water refrigeration. A separate generator is usually used to provide this service. The design
cooling water pressure is 5 bar with a design volume flow of 200 Vh.
The pilot-scale unit uses four fluidized beds (two sections of two fluidized beds). Air that enters
the unit passes first through a filter to remove foreign objects and then into the first fluidized bed. The
filter housing also holds a heat exchanger to cool water used to condense recovered solvent. As shown
in Figure 3, flow is upward. Clean air is passes out of the top of the adsober unit through a cyclone to
the atmosphere. The cyclone catches any Bonopore adsorbent that escapes and feeds it back to the
third fluidized bed.
Bonopore that has passed through the four fluidized beds is pneumatically conveyed to the top
of the moving bed desorber unit. Excess air from the conveying process is routed back to the first
fluidized bed at the inlet of the adsorber unit along with fluidizing air that is injected at the bottom of the
desorber . The desorber incorporates two heat exchangers that are designed so that evolved solvents
and the Bonopore adsorbent do not come into contact with the source of heating or cooling. The first
11

1
1
1 I I
S I
12

Figure 4. Component layout of the pilot-scale POryad FB unit tested at Eljer Plumbingware
13

a
(three-section) heat exchanger uses 135'C steam to evolve adsorbed solvent from the Bonopore
polymer. The second (single-section) heat exchanger uses tap water to cool the Bonopore adsorbent
back to room temperature (nominally 20 - 2SC) before it passes to the bottom of the desobr and is
pneumatically conveyed back to the last section of the fluidized bed adsorber. The average time
required for the Bonopore adsorbent to make one complete circuit of the system is one hour.
In the desorber, air and solvent evolved from the heated bonopore polymer is drawn from
between the second and third section of the first heat exchanger and is sent to a separate watercooled
solvent condensing unit. Air that has passed through the condensing unit is returned to the inlet of the
desorber to mix with incoming Bonopore adsotbent. Although tap water was used for this test, if it is
required, an on-board refrigeration unit can supply chilled water &t l0.C) to the heat exchanger in the
solvent condensing unit.
2.3.2 Specific Test conditions
For this test the inlet air flow rate varied from 4.5 to 6.1 d/min (159 to 215 acfm) at a pressure
drop of from -2 to -2.5 kPa (-8 to -10 in. H#). The flow rate of Bonopore through the fluidized beds was
kept at 10 kg/h (5.6 I/m, the lowest flow rate that can be.maintained through the unit), except for one
day (November 4) when the flow was set at 17 kq/h (9.4 l/m). The temperature of the desorber was set
at 1 S C (275'F), which is near, but below, the boiling pomt for styrene monomer (1WC). The tap
water used for cooling the Bonopore adsorber and the heat exchanger in the solvent condensing unit
averaged 20'C throughout the test. Table 1 summarkes the test conditions for each day of testing.
During analysis of VOC samples collected at the inlet and outlet of the pilot unit it was
determined that while only styrene was present at the inlet of the Polyad FB device, substantial amounts
of compounds other than styrene (mainly napthalene and napthalene derivatives) were present at the
outlet. Through conversations with Weatherly, Inc. it was learned that this pilot unit had recently been
tested at a naptha manufacturing plant and that the &nopore adsorbent used for that test was also
used at Eljer. At the end of that test no special attempt was made to clean the unit or to desorb naptha
from the Bonopore adsorbent. At the beginning of this test VOC emissions at the outlet of the Polyad
F6 device were approximately 22% styrene. By the end of the test VOC emissions at the outlet of the
14

Table 1. Daily Test Conditions'
Date Desorber Temp. Bonopore Flow Inlet Air Flow Rel. Humidii Inlet Air Temp. (- C) .(- C) (kg/h) (mVmin) (%)
3 November
5.63 WA 20-25 5 November 4.81 62-66 20-25 4 November 4.47 N/A 20-25 10
17 10
135 135 135
System pressure drop of from -2 to -2.5 kPa (-8 to -10 in. b o )
15

Polyad FB device were approximately 85% styrene. A sample of recovered solvent obtained from the
solvent condensing unit at the end of the test was approximately 26% styrene.
2.4 EXPERIMENTAL APPARATUS
2.4.1
As is shown in Figure 1, the pilot-scale Polyad FB unit was installed on the outside of the plant
as near as possible to the exhaust from gelcoat booth #2. Also shown in this drawing are the relative
locations of a generator used to provide electrical power for the pilot unit and a small van used to house
the sampling equipment used for ths test. Figure 5 shows the overall arrangement for sampling.
Approximately 19.5 m ( 6 4 ft) of flexble 15.24 cm (6 in.) diameter aluminum ducting was used to connect
the Polyad FB unit on the ground to the exhaust of gelcoat booth #2 on the roof of the plant
(approximately 4.6 m above the ground). Because outside temperatures were moderate (20 - 2SC) the
ducting was not heated or insulated. A 0.9 m (3 ft) section of the same flexible aluminum ducting was
attached to the outlet of the Poiyad FB unit. All connections for the sampling equipment were made at
the actual inlet and outlet of the pilot unit through rigid duct adapters and bulkhead f~ings acquired for
this test.
At the pilot unit inlet and outlet single 9.53mm (0.375 in.) diameter TeflorP sample lines were
used to cany gas samples to the sample van for analysis. Both were about 2.13 m (7 ft) long. It
was determined that Method 18 sample lines did not
need to be maintained near the boiling point of styrene but did need to be held at l e a s t 20'F above the
local ambient temperature. Thus. the sample lines were maintained at a temperature of 4 9 ' ~ (120' F).
2.42 amDlina V a
Figures 6 and 7 show how the gas sampling equipment was connected within the van used to
house the sampling equipment. Separate equivalent systems were constructed so that concurrent
samples could be obtained at the inlet and the outlet of the Polyad FB device. Thus, ihe description that
follows applies to either system.
Shortly after each 9.53mm diameter sample line entered the sampling van it was divided into
two short 6.35 mm (0.25 in.) diameter sample lines l e s s than 1 m in length. The smaller sampling lines
16

Figure 5. Overall arrangement for sampling at the flier Plumbingware Facility
17

INLET OR ounm HEATED SAMPLING LINE
TO EPA MEMOD 18 (NIOSH METHOD 1501) - SAMPLING APPARATUS
OUTPUT TO DAS AND CHART RECORDER
-i I J.U.M. VE-7 THC Analyzer
I; TO OTHER THC ANALYZER SPAN AND ZERO GAS INPUTS
TO OTHER THC STYRENE CALIBRATION GAS
ANALYZER
Figure 6. Equipment arrangement used for sampling with THC analyzers
18
INLET OR OUTLET HEATED SAMPLING LINE
TO THC ANALYZER
EXAUST
SAMPLING
MANIFOLD
BYPASS PUMP
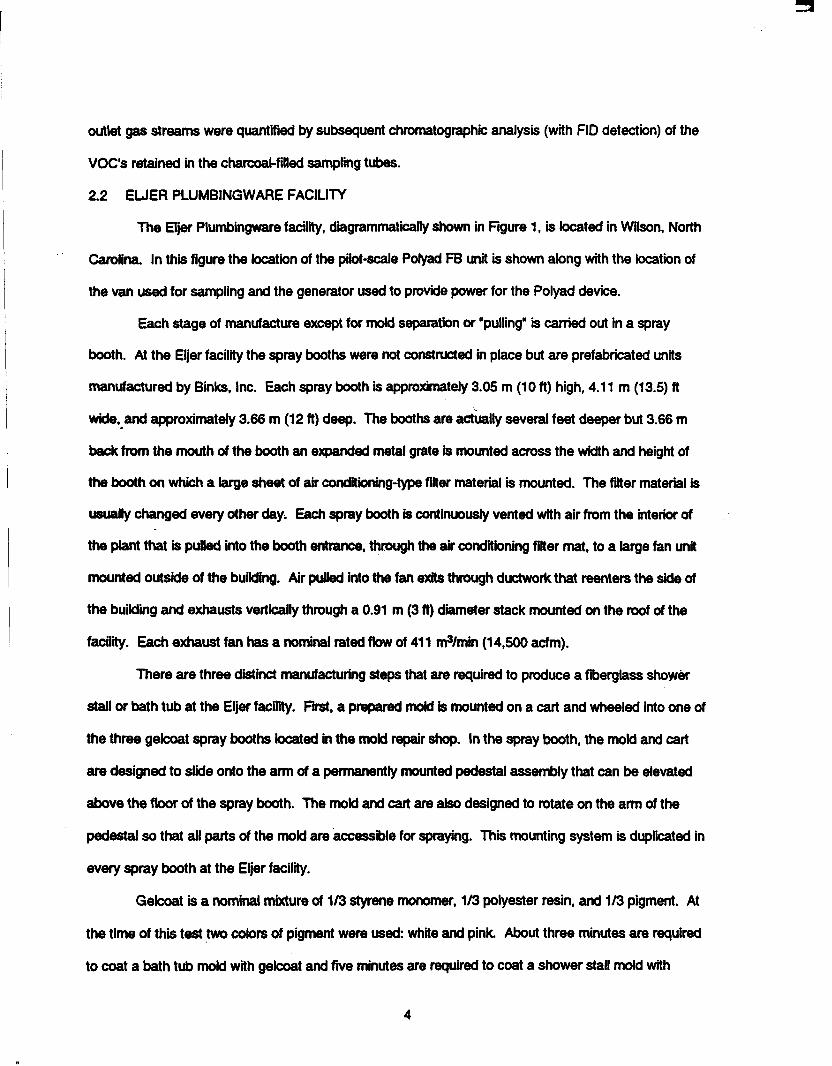
Figure 7. Equipment arrangement used for EPA Method 18 NIOSH Method 1501 sampling
19

were not heat traced. One line was connected to a J.U.M. Instruments VE-7 THC analyzer and the
other line was connected to three SwagelockTM 'Tee' connectors in series from which samples of gas
could be withdrawn into charcoal-filled adsorption tubes (EPA Method 18, Section 7.4 or NIOSH Method
1501). After the last Tee connector this sample line was connected to a small 28.3 I/m (1 cfm) capacity
sampling pump that was operated at approximately one-third of its rated flow. This pump served two
purposes. The first purpose was to assure that more sample was withdrawn from the flexible aluminum
duct than was required by the THC analyzer and the adsorption tube sample pump. The second
purpose was to minimize the time required to cbnvey a gas sample to the sampling equipment. The
exhaust from this pump was diverted to the outside of the sample van.
. Figure 6 shows the calibration gas system used for the THC analyzers. Three mixtures of
styrene in nitrogen were used for calibration (1 71 ppm, 49 ppm, and 25 ppm), in addaion to zero air.
The b o t t l e s of calibration gas .were interconnected with positive shut-off valves to a common manifold
that was itself connected to the span gas port on both THC analyzers. This system allowed both THC
analyzers to be calibrated from the same calibration gases.
The 0 - 10 V output signal from each THC analyzer was fed to one channel of a twochannel
chart recorder. The output signal from each THC analyzer was also recorded on 720 kb floppy disks
with a dedicated PC-based datalogger. Output from each THC analyzer was logged once every second.
The software used to log the data (Labtech Notebook) was configured to display the last 50 minutes of
data (last 3000 data values) from both channels on the PC monitor. Output from the inlet THC analyzer
was displayed from 0 to 1000 ppm full scale and output from the outlet THC analyzer was displayed on
a 0 to 100 ppm scale.
Preliminary measurements with charcoal-filled adsorption tubes (using NIOSH Method 1501.
equivalent to the Adsorption Tube Procedure in Section 7.4 of EPA Method 18) made on a pretest
survey trip to Eljer Plumbingware revealed that virtually all (99%) of the organic material exhausted from
the gelcoat spray booths was styrene monomer. During this test similar measurements were also made
at the inlet and outlet of the Polyad FB device to quantrfy what organic compounds were present at the
inlet and exhaust of this device. The primary intent of these measurements was to establish time-
20

averaged levels of styrene at the inlet and outlet of the Polyad FB device to determine the styrene
remirval efficiency of the Polyad FB device. As with the pre-test visit, NlOSH Method 1501 was followed
in obtaining these samples (see Appendix A).
Figure 7 shows the equipment arrangement used for the NIOSH Method 1501 sampling. The
same arrangement was used to obtain inlet and outlet samples. Provision was made to obtain three
replicate samples at one.time by taking a sample at each tee in the sample line that led to the bypass
pump. The three samples were obtained with a single sampling pump connected to a manifold that, in
turn, was connected to each tee through a standard small charcoal-filled tube. Flow through each leg of
the manifold was set before each measurement to approximately 0.2 I/m.
2.5 IZXPERIMENTAL METHODS AND PROCEDURES
2.5.1 Total Hvdrocarbon Analvzers
J.U.M. Instruments Model VE-7 total hydrocarbon (THC) analyzers equipped with flame
ionization detectors (FID) were used to obtain a continuous measurement of the total hydrocarbon
content in air that entered the Polyad FB device (air exhaust from gelcoat booth #2) and exited the
Polyad FB device. This analyzer extracts approximately 3 I/m of sample with an internal sample pump
and sends from 17 to 20 cmWm of that sample to an onboard FID. The FID's in these instruments were
set up to use hydrogen as a fuel. Two of these THC analyzers were rented from Clean Air Engineering
of Palatine, IL for the duration of testing. These instruments were inspected and calibrated with propane
span gases before shipment.
Five decade output ranges can be selected from 0-10 ppm to 0-100,000 ppm. A 0-1 OV signal is
output at the rear of the instrument that corresponds to the decade range selected. The instrument
used to sample air from the inlet of the Polyad FB device was set to measure in the 0-1000 ppm range
and the instrument used to monitor air exhausted from the Polyad FB device was set to measure in the
0-1 00 ppm range. As indicated above, the output from each of these instruments was recorded on a
two-channel chart recorder and also logged on a dedicated PC-based data acquisition system.
These instruments are normally calibrated with propane. However, for this test they were
calibrated with three mixtures of styrene in nitrogen (171 ppm, 49 ppm, and 25 ppm. certified by
21

Matheson" Gas Products, l n c ) in addition to zero air ( l e s s than 0.1 ppm hydrocarbons). When the
instruments were zeroed on zero air, Instrument response was linear with the three calibration gases.
The instruments were calibrated and operated according to the manufacturer's instruction
manual. Calibration and zero gas connections were made at the back panel of the instrument and
calibration and zero gas pressures were maintained at 1 bar (15 psig). Fuel gas (hydrogen) pressure
was maintained at 1.5 bar (21 psig). Sample presswe was maintained at 200 mbar (3 psig). Full
calibrations (all span gases, zero gas) were performed on both THC analyzers at the beginning and
middle of each day and instrument calibration was checked at the end of each day of testing.
2.5.2 Collection of Volatile Or- Comwund .
The Adsorption Tube Procedure defined in Section 7.4 of EPA Method 18 (equivalent to NIOSH
Method 1501) was followed to obtain samples of vdatile organic cOmpOunds (VOCs) from air that
entered the Polyad FB device (air exhaust from gelcoat booth #2) and exited the Polyad FB device.
NIOSH Method 1501 was followed for the analysis of the samples. A copy of the NIOSH procedure is .
included in Appendix A.
As shown in Figure 7, the heated inlet and outlet samplins lines were divided after reaching the
van housing the sampling equipment. One side was directed to a THC analyzer and the other side to a
bypass pump through three tee fittings where VOC samples were taken. Flow through the bypass pump
was set (by restricting an internal bypass kop between the inlet and outlet of the pump) at a level only
high enough to provide a small excess flow when the THC analyzer and adsorptii tube s a m p l e s were
taken. Typically, the THC analyzer required 3 Ilm and the three adsorption tube samples required a
total of 0.6 I/m.
Three samples were taken at a time (to provide replicate samples, one sample from each tee)
and concurrent m'easurements were made at the inlet and outlet of the Polyad FB device. The three
s a m p l e s were obtained with a single sample pump connected to a fbw-reguhting manifold. This
manifold is designed so that up to three samples can be obtained with a single sample pump (SKC
Model 224-2643 adjustable low flow controller). Provision is made for internal regulation of each
sample flow. At each tee. a standard small chatcoal tube (SKC Model 226-01 charcoal-filled tube,
22

NlOSH approved, Lot 120) was connected to one side of the tee with the other side connected to the
flow'regulating manifold.
Before sampling commenced flow through each leg of the manifold was set to approximately 0.2
I/m. This was done by inserting a 'dummy' small charcoal tube into the flow path after a bubble flow
meter (Giliin Instruments Primary Flow Calibrator, 20 c d m i n to 6 Um). A dummy tube could be used
because the flow resistance properties of the NIOSH-approved charcoal-filled sample tubes are
designed to be uniform from tube to tube. After calibration was completed, the dummy tubes were
replaced with previously numbered charcoal-filled tubes. To prevent contamination, these sample tubes
are designed so that a small glass seal on either end Os the tube must be broken off before a gas
sample can be pulled through the tube. Samples were taken over time periods ranging from one to one
and one-half hours. When sampling ended each tube was sealed with a plastii cap provided by the
manufacturer. Previous experience at SRI has shown that when styrene is sampled, these tubes do not
require refrigeration to preserve the sample prior to analysis. Thus, they were kept at mom temperature
until their contents were extracted for analysis.
The charcoal-filled sample tubes from this evaluation were returned to SRl's laboratories in
Birmingham, Ahbama for analysis. Analysis consisted of desorption of VOC's adsorbed on the charcoal
with carbon disulfide (according to NlOSH Method 1501, reproduced in Appendii A) followed by injection
into a gas chromatograph (GC) coupled to an FID. In addiiion, several styrene standards were used to
spike randomly selected charcoal-filled tubes and these samples were analyzed according to the NIOSH
method to determine a desorption efficiency specific to this lot of charcoal-filled tubes (91.23%). From
this analysis, styrene present in the samples was quantified. Knowledge of the amount of styrene
present, the sample time, and the sample gas flow rate allowed the determination of a time averaged
value for the styrene present at the inlet and outlet of the control device.
2.5.3 Collection of Recovered Solvent Sam&
A sample of liquid desorbed from the Bonopore adsorbent (2.6 liters) was collected at the end of
the test from the reservoir in the Polyad FB device. The liquid had the approximate color of new motor
23

o i l but a viscosity more like that of ligM cooking oil. The liquid had a pronounced unpleasant odor, not
necessarily that of styrene monomer.
The liquid was brought back to SRl's Binningham, Alabama laboratories for analysis. A sample
of the liquid was diluted with mbon disulfide and subjjed to GC-AD analysis to determine styrene
content. A second sample of the l i i i d was subjected to GC analysis with mass spectrographic
detection to determine what other compounds were present.
2.5.4 Total Flow Rate m e m e w
During each day of testing, the total flow rate into the Polyad FB unit was measured with a
thermal anemometer that had been calibrated in a wind tunnei at SRl's laboratories in Birmingham,
Alabama before being taken into the field. These measuments'were made at the inlet of the Polyad
FB device at the end of a bng secth of stmight ducting (2.5 t@ 3 m in length). The inside diameter of
the flexible aluminum ducting was measured and found to be 14.6 cm (5.75 in.) which corresponds to an
area of 167.5 d (0.180 ttz). To measure fkw, air vebcRy measurements were made at five evenly
spaced points across the s m a l l d u d , the measurements were repeated (except on the first day of
testing), and the readings were averaged. The averaged dr velocity measurement was then converted
to volumetric flow. The daily average results of these measwements are shown in Table 1. More
information on these measurements is presented in Section 3.4 of this report.
24

SECTION 3
DATA, RESULTS, AND DISCUSSION
3.1 TOTAL HYDROCARBON ANALYZER DATA
The THC's were operated continuously through the three days of testing. On the last day of
testing a 15 minute power failure at 1:18 pm resulted in the loss of all data to the datalogger for the
balance of the day. Data were reconstructed from the chart recorder record (which itself was lost while
the power was off) by scanning the inlet and outlet record into computer files that were analyzed by
specialized software to determine the numerical value of the data recorded during that time. The
recovered data were then imported into the software package used to generate the experimental record
presented in this report.
Some operational problems were encountered with the THC monitors. On the moming of the first
day of sampling, November 3,1992. the THC used to monitor hydrocarbon emissions at the inlet of the
Polyad FB device experienced an abrupt shift in output (by a factor of 1.75). The exact reason for this
behavior was not known but from an examination of the chart recorder record it was clear that the shift
occurred shortly after the first calibration of the moming. It was detected (and corrected) at the
lunchtime calibration. A correction factor was determined and the morning's data were corrected during
analysis of the data. The THC at the outlet of the Polyad FB unit did not exhibit this behavior. The fact
that both of these analyzers were calibrated at the same time with the same calibration gas allowed the
problem to be quickly isolated and corrected. The same behavior (in the inlet THC analyzer) was
observed one other time. during the calibration check at the end of the day on November 3. The
problem did not appear again and in this instance did not affect any results. Afterwards, the behavior of
this monitor was croSely monitored.
The THC analyzer used to monitor hydocarbon emissions at the outlet of the Polyad FB device
experienced problems with FID fbme-outs. The problem worsened until on November 5, technicians at
Clean Air Engineering, Inc. provided guidance on how to correct the problem and the problem was fixed.
25

Because these periods were short and because the instruments were monitored closely no significant
data were lost.
3.1.1 Met l7- VOC emissions from the spraying process can be characterized as being quite variable. At the
inlet of the Polyad FB device instantaneous hydrocarbon emissions (essentially 100% styrene) ranged
from as low as 90 ppm to as high as 400 ppm during spraying in the gelcoat booth. While molds were
being removed from the spray booth or installed in the spray booth hydrocarbon emission levels ranged
from 18 ppm to 45 ppm. During midday lunch breaks in the production process, hydrocarbon levels
I decreased to approximately 9 ppm.
. Figures 8 through 10 show output from the inlet THC analyzer that was recorded on the
datalogger for the three days of testing, November 3 through 5, 1992. For clarity, THC data taken
during periods of calibration are not shown.
These figures show that there are three distinct 'periods' of spraying per day. The first period
lasts from the start of spraying in the morning (starting at about 0845) and ends when the plant
employees have a 15 minute break at approximately 1000 hours. The second period starts at
approximately 101 5 and lasts untilthe lunch break at 1145. The final period starts around 1230 and
lasts until 1415.
In order to show the variability and the periodic nature of the emissions from this process, inlet
THC data from two 40 minute periods before the lunch break on November 5 are presented in Figures
11 and 12. Because these data have a one-second resolution in time, emissions from the spraying
process can be resolved in some detail. With the exception of the second period of spraying shown in
Figure 11, the operator spent from four to five minutes spraying gel coat on the mold. In the case of the
second spraying period in Figure 11 and the periods of spraying shown in Figure 12 the operator spent
from five to six minutes spraying gel coat on the mold and the pattern of emissions appears distinctly
different between the two types of spraying. Whether these differences are due to differences in the
type of mold (bath tub versus shower stall) or to the approach used by the operator cannot be
determined because no attempt was made to track what type of mold was being sprayed.
26

+ ."...""..i .... " ...""..- ;* ............ ..." I
t ".""i ."."
" """..... +" ...""" +" . "- I l l , I l l , , I , , I I I I I I I I
I 1 I I 0
v) 0
0 0 w 0
0
m 0 (u 0
0 0 F
0
27

0
cu c! r
0 c!
d
0 0 *
0 cu c9
0
3 W
0 aD 0
28

""""3 ...-............ I... ....................... - "t ........ I .... "" -.-. "" L.. "_.". 2 "".
: .
0 9 d .r
0 0 ..
0 2- F? - 0
.c
7
i!! F
0 0 0 7
0 0 Q, ..
ro-
29

In 0 0 0 0
0 v) 0
0 0
v) 0 0 0 0 cu cu F 7 v) 0
30
0
Q) -v,
In
Q) - 2
0
Q) -p:
v)
Q) - 9
0
Q) - 9
v)
Q) - 9
.cu 0 Q) ..
v)
Q)
. v ..
0
Q,
. F ..

"
I d
:-
0 0
0 ln
0 0
0 ln
0 0 d 0 c3 cu cu 0 . o - 7 - * O 0 o
31

3.1.2 Outlet Data
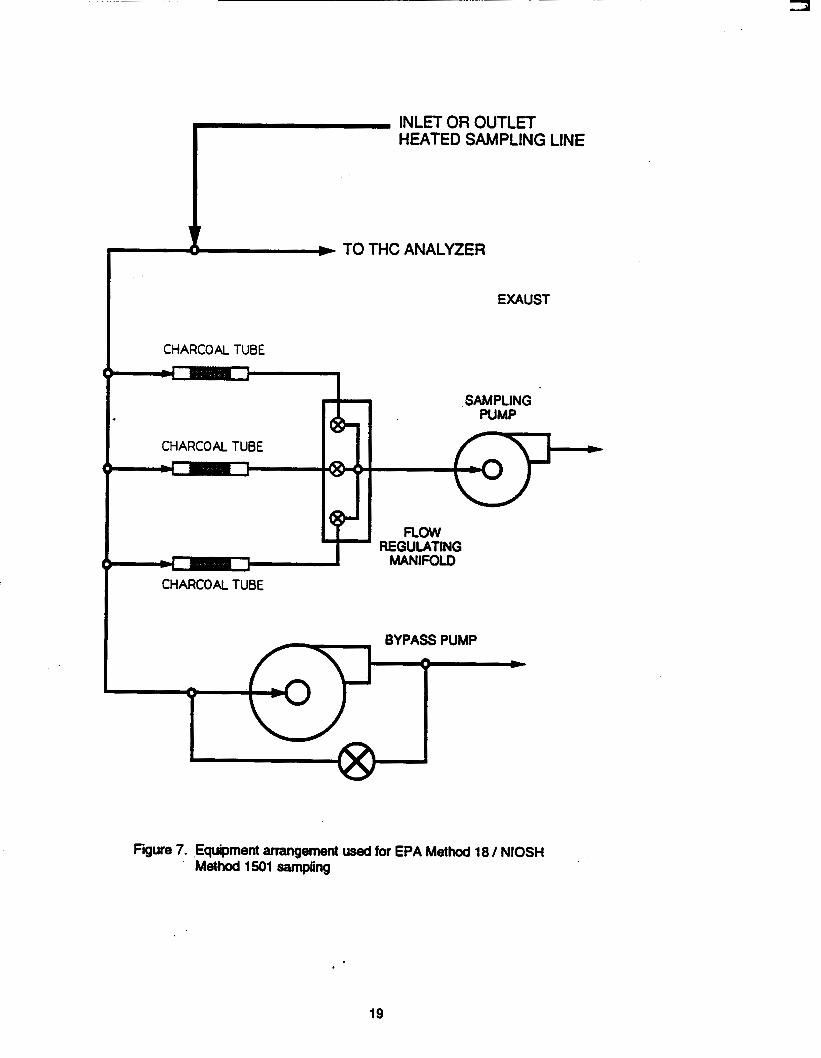
Figures 13 through 15 show output from the outlet THC analyzer that was recorded on the
datalogger for the three days of testing, November 3 through 5, 1992. As with THC data from the inlet,
periods of calibration are not shown. Also not shown are data from periods when the FID in the outlet
THC experienced a flame-out.
These data show that outlet emissions from the Polyad device are essentialy uncoupled from inlet
emissions. This behavior should be expected because the pilot-scale Polyad FB unit was designed to
remove up to 1000 ppm of styrene before outlet emissions would be expected to increase. Thus, outlet
emissions observed during this test were mainly due to the 'bleeding' of solvent from Bonopore polymer
that was not completely evolved in the desorption section.
Outlet emissions tended to decrease throughout the day. At the start of the test, 9 am on
November 3, outlet emissions were near 22 ppm. Outlet emissions dropped to near 4.5 ppm after
several hours and remained at that level for the balance of the day. On November 4, at the start of
testing outlet emissions averaged nearly 15 ppm. .During the day the emissions level dropped to about 6
ppm and thereafter increased slowly reaching approximately 8 ppm by the end of the day. Thin rise may
have been due to the higher flow rate of Bonopore adsorbent used during that day (17 kgh as opposed
to 10 kq/h on other days). On November 5. the emissions level started out at approximately 7.5 ppm.
However, at approximately 0925 outlet emissions were observed to rise quickly to about 11 ppm.before
they dropped back to about 5.5 ppm by 1030. The reason for this 'spike' is not known because at that
time the inlet emissions showed no such increase, as is shown in Figure 12. By the end of testing outlet
emissions were in the range of 3 to 4 ppm.
The results shown in these figures are for total hydrocarbon emissions. Previous measurements
(and other measlrrements to be reviewed here) have shown that virtually all of the VOC emissions from
the Eljer facility occur as styrene. As indicated in Section 2.3.2, other VOC's were present in air at the
outlet of the Polyad FB device because the device was contaminated with VOC residue from a previous
test. However, because these contaminants did not contain styrene, it was possible to determine the
portion of the outlet emissions that were due to styrene from analysis of the charcoal tube samples.
32
9 0 cu
9 In w
33
8 0
0
cu 0 F
I-
0 0
' a , 9 0

9 In 7
9 0 7
9 In 0
9
I-
d
34
35
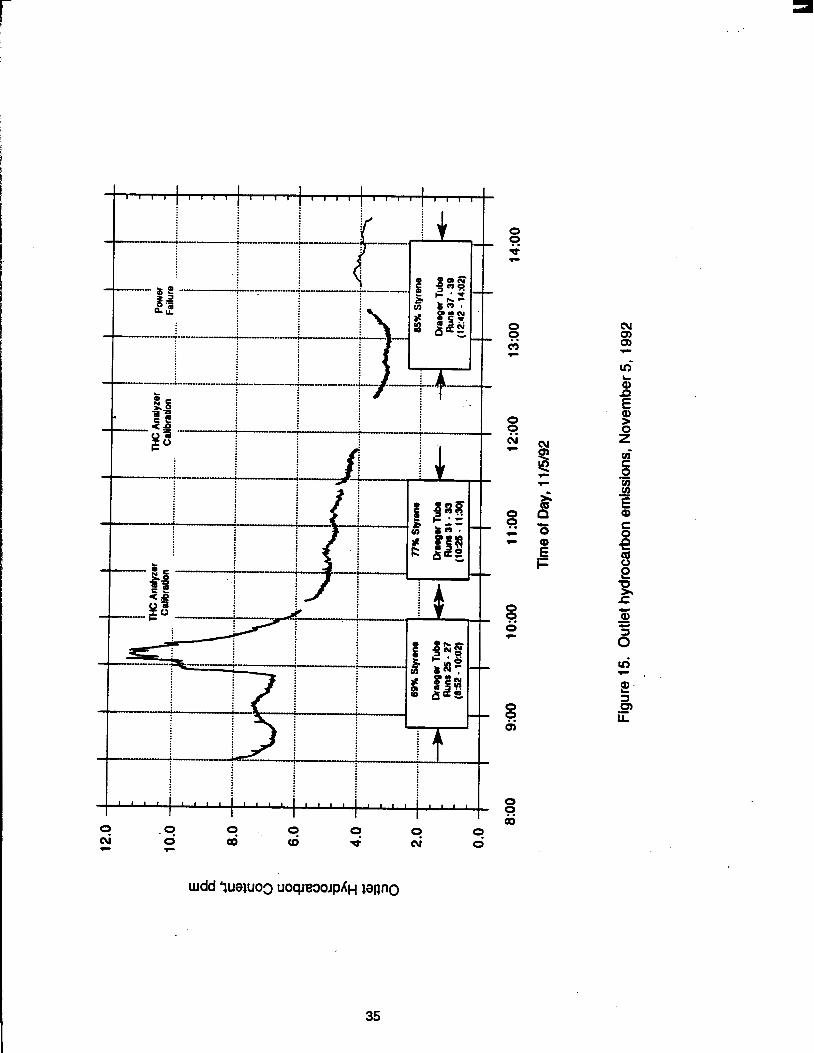
i 0
d 0 F
0
m 0 F
..- 0
I-

Thus, in figures 13 through 15, periods are shown during which charcoal tube (Draeger tube) samples
were taken at the outlet of the Polyad device and the percentage of styrene measured in those samples
is indicated on these figures. Taking into account the actual amount of styrene that was present at the
outlet of the Polyad FB device, styrene emissions at the outlet of the Polyad FB device were never
greater than 8 ppm. By the end of testing emissions of styrene had fallen to less than 4 ppm.
3.1.3 Etficiencv Dm
Figures 16 through 18 show calculated hydrocarbon penetration through the Polyad FB device
and removal efficiency across the Polyad FB device for the three days of testing, November 3 through 5,
1992. Because of the cyclic nature of the inlet emissions the calculated penetration-efficiency curves
shown in these figures exhibit the same cyclic nature. To provide the reader with visual information on
average levels of penetration and efficiencyover time so that trends can be seen, average penetration-
efficiency values during each period of spraying are also shown in these figures along with curve fits
through the peak average values during each period of spraying. As indicated above, outlet emissions
appear to be essentially uncoupled from inlet emissions. Thus, the highest penetrations (lowest
efficiencies) were observed during periods between sprayings and the lowest penetrations (highest
efficiencies) were observed during periods of spraying. In terms of penetration-efficiency values
measured during periods of spraying, efficiencies never fell below 91% and on the last day of testing an
efficiency of over 99% was measured during one period of spraying at around 1300. Clearly, from the
data collected during this period, the Polyad FB process was very efficient in collecting the styrene
emissions.
Because of the rapid variability in process inlet emissions and the level of inlet emissions it was
not possible to confirm the assertion made by Weatherly, Inc. that any stepwise increase in inlet
emissions below 1000 ppm would not affect the immediate outlet emissions level for the Polyad FB pilot
unit. However, the inlet and outlet emissions data presented above do suggest that within the levels of
instantaneous emissions monitored at the inlet to the Polyad FB device (up to 400 ppm of styrene) outlet
emissions are governed by 'bleeding' of solvent from Bonopore polymer as it is reintroduced into the
adsorber from the desorption section.
36

. . . . . .. . . ... . . 3 . .
Hydrocarbon Removal Efficiency, %
0 F
0
0, ai
0
Q, 0 0
0
0 0 ..
0 0 (3 ..
0 0 ..
0 0 F
a
0 ' 6
37

0
Q) ai
Hydrocarbon Removal Efficiency, %
0 0
Q, 0
0,
0 0 v
0 rn 0 .. v
F
0 9 F F
v
- 0
.- .. . .: ..a

0
Q) d
Hydrocarbon Removal Efficiency, % 0
Q, 0 0
0
F
. . . . . . . . . . . . . . . . . . . . . . . , . . . . . . . . . * . . . . i :-: 0 I I I I I I l l , 0 I
I I I I I # , I I I I l l I I I I I I l l ..
0 F
0
0
' a 0
0
39

Because outlet emissions were effectively not coupled to inlet emissions during this test it would
be deceptive to concentrate on the relatively low penetration-eff iciency values determined during periods
between sprayings. Likewise, it may also be deceptive to concentrate on high penetration-efficiency
values determined only during periods of spraying. Thus, in order to obtain a conservative estimate of
the efficiency of the Polyad FB device the following approach was adopted: Inlet and outlet emissions
were averaged during periods of spraying and during periods between sprayings. Penetrations and
efficiencies were then calculated based on these averages. Overall averages were calculated for each
of the three periods of active spraying for each day of testing and from these averages daily averages
and a grand average of all the data were determined.
. An inspection of the inlet emissions record suggested that an inlet hydrocarbon emissions level of
63 pprn was a resonable cutoff point to determine if a mold was being sprayed. Thus, inlet emissions
greater than 63 ppm were found to be typical for periods of spraying and inlet emissions of less than 63
ppm were found to be typical for periods between sprayings. THC data during each period of active
spraying were averaged according to this criteria. Also, a record of the length of time of each spray/non-
spray period was maintained as part of the averaging process. After averaging, the data were sorted by
ascending emissions. Overall averages (weighted by the time span of each emission) were determined
for periods when emissions were greater than 63 ppm and for periods when emissions were l e s s than
63 ppm. Finally, the percentage of time that molds were sprayed was determined for each period of
active spraying.
Table 2 shows the overall result of these calculations and includes the daily and grand test
averages referred to above. Table 3 includes the averages for each of the three test daily periods of
active spraying over the three days of testing. In these two tables no attempt was made to correct the
level of outlet emissions for actual styrene content. Table 4 provides this correction for the times that
the amount of styrene at the outlet was determined. In these tables averagehlet and outlet emissions
and efficiency and penetration are presented for periods when molds were sprayed (emissions > 63
pprn), between sprayings (emissions c 63 ppm) and, for the entire period. Figures 19 and 20 present
graphically the entire period averages shown in Tables 3 and 4 for each period of spraying. Tables
40

1992 Date
3 Nov
4 Nov
5 Nov
3-5Nov
Table 2. Daily Averages and Grand Average of THC Analyzer Data, November 3 through 5,1992
Inlet Emissions
Level
> 63 PPm c 63 PPm
ALL
> 63ppm. < 63 ppm
ALL
> 63 PPm < 63 PPm
ALL
>63ppm c 63 PPm
ALL
Percent of lime
at that Level
63.7 36.3
100.0
67.1 32.9
100.0
65.0 35.0
100.0
65.4 34.6
100.0
Average Inlet THC ppm
187.5 39.2
133.7
177.4 41.7
132.7
160.0 40.4
1 18.2
174.4 40.5
127.9
Average Outlet THC
ppm
10.28 9.1 0 9.85
7.47 7.31 .
7.42
5.53 5.21 5.42
7.62 7.1 3 '1.45
Average Efficiency
%
94.51 76.79 92.63
95.79 82.47 94.41
96.55 87.1 0 95.42
95.63 82.37 94.18
Average Penetration
%
5.49 23.21 7.37
4.21 17.53 5.59
3.45 12.90 4.58
4.37 17.63 5.82
41
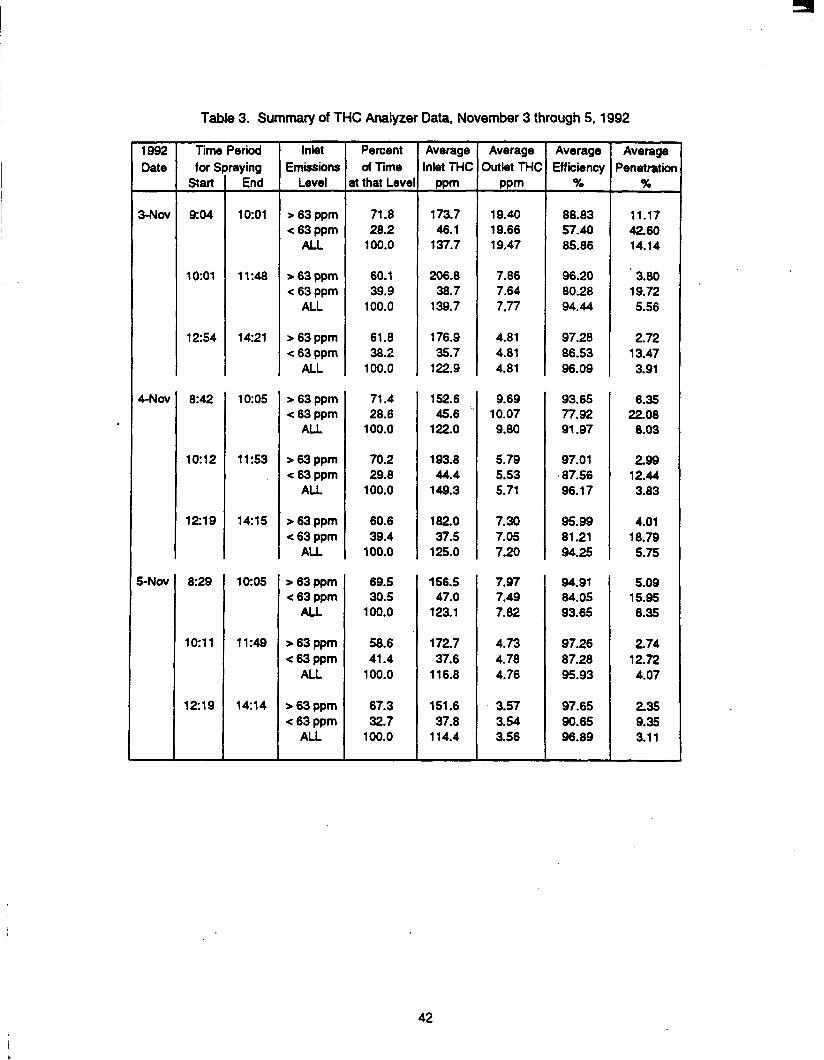
Table 3. Summary of THC Analyzer Data, November 3 through 5,1992
1992
End Start for Spraying Date Time Period-
3-Nav 9:04 1001
1O:Ol 11:48
1254 14:21
8:42 10:05
10:12 1153
12:19 14:15
8:29
1O:ll
12:19
-
10:05
1 1 :49
14:14
Inlet
at that Level Level of Time Emissions Percent
> 63 pprn
100.0 ALL 28.2 63 ppm 71.8
> 63 ppm 60.1 63 ppm 39.9 ALL 100.0
> 63 ppm 61.8 < 63 ppm 38.2
ALL 100.0
> 63 ppm 71.4 e 63 ppm 28.6
ALL 100.0
> 63 ppm 70.2 e 63 ppm 29.8
A U 100.0
> 63 ppm 60.6 <63 ppm 39.4
ALL 100.0
> 63 ppm e 63 ppm ALL
> 63 ppm e 63 ppm
ALL
> 63 ppm e 63 ppm
ALL
69.5 30.5
100.0
58.6 41.4
100.0
67.3 32.7
100.0 !
- Average lnbt M(
PPm
173.7 46.1
137.7
206.8 38.7
139.7
176.9 35.7
122.9
152.6 45.6
122.0
193.8 44.4
149.3
182.0 37.5
125.0
156.5 47.0
123.1
172.7 37.6
116.8
151.6 37.8
1 14.4
Average outlet THC
PPrn
19.40 19.66 19.47
7.86 7.64 7.77
4.81 4.81 4.81
9.69 10.07 9.80
5.79 5.53 5.71
7.30 7.05 7.20
7.97 7.49 7.82
4.73 4.78 4.76
3.57 3.54 3.56
Average Efficiency
%
88.83 57.40 85.86
96.20 80.28 94.44
97.28 86.53 96.09
93.65 77.92 91.97
97.0 1
96.17
95.99 8 1.21 94.25
94.91 84.05 93.65
97.26 87.28 95.93
97.65 90.65 96.89
' 87.56
Average Penetratior
%
11.17 42.60 14.14
3.80 19.72 5.56
2.72 13.47 3.91
6.35 22.08
8.03
299 12.44 3.83
4.01 18.79 5.75
5.09 15.95 6.35
274 12.72 4.07
235 9.35 3.1 1
42

Table 4. Styrene Removal from THC Data, November 3 through 5, 1992
Time Period T for S Starl
12:s
-
8:42
12:lE
8:29
1O:ll
12:19
-
raying End
14:21
-
1 0:05
14:15
10:05
11:49
14:14
Inlet Emissiont
Level
> 63 ppm c 63 ppm ALL
> 63 ppm c 63 ppm
ALL
> 63 ppm c 63 ppm
ALL
> 63 ppm c 63 pprn ALL
* 63 pprn
ALL
63 ppm c 63 pprn
ALL
c 63 PPm
Percent ai Time
at that Leve
61.8 38.2
100.0
71.4 28.6
100.0
60.6 39.4
100.0
69.5 30.5
100.0
58.6 41.4
100.0
67.3 32.7
100.0
Average ,nbt THC ppm 176.9 35.7
122.9
152.6 45.6
122.0
182.0 , 37.5 125.0
156.5 47.0
123.1
1727 37.6
116.8
151.6 37.8
114.4 -
Average 3utlet THC
4.81 4.81 4.81
9.69 10.07 9.80
7.30 7.05 7.20
7.97 7.49 7.82
4.73 4.70 4.76
3.57 3.54 3.56
Styrene in Outlet Air % -
21 .a 21.8 21.8
26.2 26.2 26.2
61.5 61 .5 61.5
6Q. 3 69.3 69.3
77.2 77.2 77.2
84.8 84.8 84.8 -
PPm
1 .os 1 .os 1.05
2.54 2.64 2.57
4.48 4.33 4.42
5.53 5.19 5.43
3.66 3.69 3.67
3.03 3.00 3.02
-
-
T Styrene Effiiienq
%
99.41 97.07 99.1 5
98.34 94.22 97.90
97.54 88.45 96.46
96.47 88.95 95.60
97.89 90.17 96.86
98.00 92.07 97.36
styrene Penetration
%
0.59 293 0.85
1.66 5.78 2.1 0
246 11.55 3.54
3.53 11 -05 4.40
2.1 1 9.83 3.14
2.00 7.93 264
43

175 I I I I I I I I 35
Spray Period 1 2 3 1 2 3 1 2 3 Day November 3 November 4 November 5
Figure 19. Average inlet and outlet hydrocarbon and styrene emissions for each period of spraying
44

. .
I % i
I I I I I I I ::I 86 4 Styrene
I I I I I I I I
I I I 1 I I 1 I I Spray Period 1 2 3 1 2 3 1 2 3
Day November 3 November 4 November 5
Figure 20. Average hydrocarbon and styrene removal efficiency for each period of spraying
45

detailing averages within each period of active spraying (sorted by time) along with population standard
deviations and 95% confidence intervals are presented in Appendix C.
Tables 2 and 3 show that, on the average, 65% of each period of active spraying activity is
occupied by spraying. During these periods the average level of styrene emissions at the inlet ranged
from 152 to 207 ppm while the average level of hydrocarbon emissions at the outlet ranged.from 3.6 to
9.8 ppm (excluding the first period of active spraying on November 3). If the first period of active
spraying on November 3 is excluded the average efficiency during periods of spraying ranged from 93 to
nearly 98%, and the average efficiency during periods between sprayings ranged from 78 to almost
91%. Overall, an average efficiency of just slightly greater than 94% was measured for the test.
. Table 4 and Figure 19 show that styrene at the outlet increased before it started to decrease.
These data also show that outlet emissions dropped by a factor of over four from the beginning to the
end of the test. This is probably because during most of the first two days of testing outlet emissins
were dominated by the evolution of napthalene-related contaminants from the Bonopore polymer.
If data from the last period of the last day of testing can be viewed as representative of the Polyad
FB process (in the absence of contamination) then, as Table 4 and Figure 20 show, overall efficiencies
of at least 97% can be achieved.
3.1.4 Fstimated Stvrene Fmissions from Gel Coat Rooth #7
It is possible to estimate styrene emissions to the atmosphere from the shower stall and bath tub
gel coating process from THC data taken at the inlet of the Polyad FB device. THC data from each day
of testing were inspected to determine times during which bath tubs or shower stall m o l d s were sprayed.
VOC emissions (assumed to be 100% styrene) were averaged over the time required to spray each bath
tub or shower stall mold and multiplied by the time required to spray the mold to determine the
emissions rate in mg of styrene per m3/s of air flow. This value was multiplied by the nominal flow rate
of the vent exhaust fan (6.84 m3/s or 14,500 cfm) to obtain a mass emissions rate of styrene to the
atmosphere for each bath tub or shower stall.
Table 5 shows the results of these calculations with population standard deviations and 95%
confidence intervals. Over the three days of testing sufficient data were acquired to estimate styrene
46

- Date - 3-Nw
4-Nov
S-NW
3-5 Nov -
Table 5. Summary of Estimated Styrene Emissions from Gel Coat Booth #2, THC Data
904
1407 1259 11:42 10:18 1001
Daily Summary
8:48
1408 12:32 I 1 :so 10:20 957
Daily Summary
8:29
14:07 1233 11:G 10:16 9:49
Daily Summary
I lest Summary
I
- Units
3prayec
8 9 9
26
9 12 12
33
9 8 8
25
84 -
304.5 58.9 356.6 93.8 297.6 81.1
320.1 84.2
322 99.1 328.7 99.2 290.8 81.5
313.1 94.7
373.7 68.8 410.1 108.7 340.9 146.7
374.8 114.6
333.6 101.8
40.8 61.3 53.0
32.4
64.7 56.1 46.1
32.3
44.9 75.3
101.6
44.9
21 .8
T- Styref Average 0
1.551 2.1 37 1 . s a
1.744
1.470 1.842 1.541
1.631
1.761 1.990 1.61 9
1.789
1.713
le Emissions Pop. Std Dev. (ko)
0.296 0.530 0.31 8
0.492
0.353 0.448 0.31 5
0.41 1
0.274 0.460 0.547
0.462
0.458
Br unit^- 95% C.I. 0
0.205 0.346 0.208
0.1 89
0.231 0.254 0.178
0.140
0.1 79 0.31 9 0.379
0.1 81
0.097
47

mass emissions for a total of 91 separate mold sprayings. On the average, 5.6 f 1.7 minutes were
required to spray a mold and during that time appmximately 1.9 f 0.5 kg of styrene was vented to the
atmosphere, assuming that the exhaust fan in gel coat booth #2 was operated at its nominal flow rate.
The fairly high population standard deviations fo r these numbers are most likely due to the fact that two
different types molds were sprayed and that bath tub enclosures require a longer time to spray (with
higher emissions) than smaller shower stalls. 3.2 VOLATILE ORGANIC COMPOUND DATA
NIOSH Method 1501 (equivalent to EPA Method 18, Adsorption Tube Procedure) was followed
to obtain charcoal tube samples at selected booth exhausts and at the inlet and outlet of the Polyad FB
device situated at gel coat booth #2. Due to the nature of the adsorption tube sampling procedure and
the desire to sample process emissions over an extended period, sample times of from one to one and
owhalf hours were typical. :
During a pretest vi& on October 13,1992 chancoal tube samples were obtained at the roof
exhaust stack of gel coat boot #2. Later, on November 6,1992, charcoal trrbe samples were obtained at
the roof exhaust stack of first lay-up booth 15 and second lay-up booth t 7. As described above, during
each day of sampling from November 3 -5,1992 charcoal tube samples were obtained from air
exhausted from gel coat booth #2 (the inlet of the Polyad FB device) and air exhausted from the Polyad
FB device.
Only one operational problem was encountered during this testing. Thii was when a 15 minute
power failure occurred on the last day of sampling. Even though the battery-powered pumps that were
used to acquire these samples continued to function during the interval while power was lost. the sample
bypass pumps did not operate during that time (19% of the 80 minute sample period). Thus, those
particular s a m p l e s may not be completely representative of the process.
Equipment problems dd s ign i f i t l y affect sampling. After testing was completed it was
discovered that both sample pumps dd not maintain proper sample flow under negative inlet pressures
typical of those found during this test (approximately 1 W a above that required to sample through the
sample manifold with three charcoal tubes attached). These pumps are designed to maintain flow at

negative inlet pressures of up to 10 kPa (40 in Hg). This problem was exacerbated by a crack in the
tube'of the Giliin Instruments flow calibrator that prevented it from being operated at a negative
pressure of more than 0.25 kPa (1 in. H20). Thus, although the sample pumps were calibrated before
each use, they could not be calibrated with the flow calibrator inserted into the sample line before each
charcoal tube. The net effect of this was to render the charcoal tube data taken from November 3 - 5,
1992 unusable except for information as to styrene content. Fortunately, charcoal tube samples taken
at roof exhaust vents during the pretest visit on October 12 and after testing was completed on
November 6 were usable because for these measurements the sample pumps were calibrated for flow
under the actual conditions of use.
3.2.1 b u r e m e n t s at S D ~ V Rooth F x m t Stacb
Charcoal tube samples were obtained at the exhaust stack of gel coat booth #2 during the
pretest visii on October 13,1992. Samples were also taken at the exhaust stack of first lay-up booth #5
and second lay-up booth # 7 on November 6, 1992. While samples taken at the outlet of other types of
spray booths were not required to determine the appliiilii of the Polyad FB device to controlling
styrene emissions from a ge la t ing booth, these measurements were necessary to determine if
styrene emissions from the gel-coating operation were characteristic of other parts of the bath tub and
shower stall manufacturing process. Also, if higher levels of styrene emissions were t y p i c a l of other
parts of the manufacturing process, costs to install and maintain a Polyad FB - type of control device
would be affected. Tables 6 and 7 summarize the results of these measurements.
Table 6 presents the sample parameters, spraying times, and number of units sprayed during
each set of runs and Table 7 presents averages with population standard deviations, emissions levels of
styrene in ppm, and emission rate in kg of styrene per hour and kg of styrene per unit sprayed.
Because the number of molds sprayed were recorded during each period of sampling, it was possible to
determine an emission rate in terms of the amount of styrene emitted to the atmosphere per mold
sprayed. Compared to styrene emissions rates reported in Table 5 for gel coat booth #2 on November 3
- 5, the level of styrene emissions measured on October 13 with charcoal sample tubes are lower.
However, on October 13. at gel coat booth #2 only 44% of the time was spent in spraying (each period
49

Table 6. Sampling Cc ~nditions fa lr M easurements rn iade at the Outlet of Gel Coat Booth # 2 * FW Lay-Up Booth # 5, and Second . Lay-Up Booth #7* October - November, 1992. EPA Method 18MIOSH Method 1501 Sampling.
Date Numben Sompb Location
10/13 1 - 6 Gel Coat Booth #2
1116 40 - 42 First Lay-Up Booth #5
Second Lay-Up Booth #7 43 - 45 I i T i Spent
Spraying Average lime Number
to Spray a Mold of Units min SSC Sprayed %
28.17
21.08
211.9f36.7 8 44.0
63.0 f 20.1 27 47.2 28.33
84.3 f 26.9 15 35.1

Table 7. Styrene Concentrations Measured at the Outlet of Gel Coat Booth #2, Fbst Lay-Up Booth # 5, and Second Lay-Up Booth #7, October - November, 1992. €PA Method 1 WNIOSH Method 1501 sampling.
f Date Location
1U13 ’ G C H
Average”
1116 FLU 4K
Average
SLU #7
Average
Uumber
1’ 2 3 4 5 6
40 41 42
43 44 45
- iampb /dum liters
16.09 13.68 16.69 13.41 14.13 13.97
-
16.08 15.52 15.94
1.08 6.64 7.00
Styreno Ueasured w
141.4 61 54.3 6702.7 6071.6 6102.1 5965.5
5664.6 5853.9 5544.7
361 1.5 31 38.5 4359.2
-ne COtWOntration
ppm
2.1 105.7 94.3
106.3 101.4 100.3
101.6 f4.3
84.3 90.2 03.2
85.9 f 3.1
122.3 11 3.4 149.1
128.3 f 15.2
l-
i
Equivalent Styrene
Not representative, leak aroLlllcf tube .. Sample %1 not in averages or popuiation standard deviations
Em kslh
0.22 11 .os 9.89
11.15 10.64 10.52
10.66 f 0.45
0.68 929 8.57
8.85 f 0.32
12.57 11.65 15.34
13.18 f 1.57
51
r i o n r kgRJnit
0.029 1.478 1.31 9 1.487 1.419 1.403
1.421 f 0.061
0.579 0.61 9 0.571
0.590 f 0.021
0.465 0.431 0.568
0.448 f 0.01 7
Styrene Measured
K
>99 >99
>99 >99 >99 w99 NIA
99.76 99.69 99.65
9B.70 f 0.05
99.66 99.77 99.82
99.72 f 0.05

. .
of spraying averaged 212 seconds). As Tables 2 and 5 show, during November, molds were usually
sprayed for 65% of any period of spraying activity and the average period of spraying was approximately
334 seconds long. Thus, styrene emissions measured for October 13 may be less than those measured
during November because of a lower production rate.
For styrene emissions measured at first lay-up booth #5 and second lay-up booth #7 exhaust
vents on November 6, product,ion rates were higher and styrene emission rates per unit were lower than
that observed for the gel coating operation at any time. In first lay-up booth #5, 15 units were sprayed
over an hour of sampling (84 seconds of spraying per unit) with an average emission rate of 0.59 kglunit
sprayed. At second lay-up booth #7,27 units were sprayed over an hour of sampling (63 seconds of
spming per unit) with an average emission rate of 0.45 kghnit sprayed. Evidently the second and third
stages of manufacture require shorter times to complete than does the initial stage of spraying with gel
coat. Also, as Table 6 shows, the population standard deviation for average time to spray a unit can be
large compared to the average. These large standard deviations are almost certainly due to the mix of
units sprayed (bath tubs and shower stalls with different surface areas).
On a per unit basis, styrene emissions are lower for the last two stages of manufacture which
might be expected because the mix sprayed in these last two processes contains less styrene monomer
than the mix sprayed in the gel coating process. However, on an hourly basis, at second lay up booth
#7, styrene emissions were greater than measured at gel coat booth #2 (13.2 kglh versus 10.7 for gel
coat booth #2 and 8.9 kglh for first lay-up booth #5).
Compared with the results from THC measurements reported in Table 2, mass emissions
measured for first lay-up booth #5 (86 ppm) and gel coat booth #2 (1 02 ppm) appear very low compared
to the average for all spraying at gel coat booth #2 (128 ppm, Table 2) while mass emissions measured
for second lay-up booth #7 (128 ppm) agree better. In terms of emissions of styrene per unit sprayed,
the results from gel coat booth #2 from October 13, (1.42 kg/unit) agree better with the result shown in
Table 5 (1.71 kglunit), especially when the time of spraying is taken into account (6.7 g/sec on October
13 versus 5.1 glsec for November 3-5).
52

With respect to the amount of styrene present in the s a m p l e s , while it was only verified for the
samples taken in October that styrene was the only significant VOC present in emissions from gel coat
booth #2, quantitative determination of styrene was performed for the samples taken in November. As
Table 6 shows, styrene is essentially the only VOC present in the booth exhaust air at the Eljer facility.
3.2.2 Measurements at the Inlet and 0- the Po@d FR nevicg
Table 8 summarizes the results of measurements made at the inlet of the Polyad FB device and
Table 9 summarizes the results of measurements made at the outlet of the Polyad FB device during
testing on November 3-5.1992. Because of the sampling problems discussed above, Tables 8 and 9
show the percentage of styrene and amount of styrene collected rather than concentration of styrene
measured. Tables 8 and 9 also include averages and population standard deviations for each triplicate
Set Of NUIIS.
Table 8 shows the amount of styrene at the inlet of the Polyad FB device from November 3 to
November 5. Thii table also shows the percentage of styrene measured at the inlet as compared to the
total amount of material detected. While these numbers do not indicate as high a percentage of styrene
in the exhaust of gel coat booth #2 as was reported in Table 7, an inspection of the gas chromatograms
for each sample shown in Table 8 suggests that the s a m p l e s were not contaminated by any particular
compound. These results also show the effects of the malfunctioning of the sample pump. The third
sample in each set usually has much l e s s styrene present than is present in the first two samples.
Table 9 presents the amount of styrene at the outlet of the Polyad FB device from November 3
to November 5 and clearly shows that the amount of styrene in the gas exiting the Polyad FB device
increased throughout the test. This was probably due to the desorption of naphthalene-related
contaminates from previous testing with the Polyad FB pilot unit (seeSection 2.3.2). These samples
also show the effects of a malfunctioning sample pump. The effect was probably more drastic at the
outlet, compared to the inlet, because a higher sample flow rate was used. Flow through the third tube
in each manifold was very low and so little styrene was detected that it cannot be assumed that the
amount of styrene present was reliably measured. Therefore, these samples were excluded from
condition averages and population standard deviations.
53

Table 8. Results of EPA Method 18MIOSH Method 1501 S a m p l e s Taken at the Inlet of the Polyad FB Device , November 3 to November 5,1992
- Date - 11B
1113
1114
1114
1115
11/5
1115
-
Run Number
1 2 3 4 5 6
10 11 12 16 17 18 22 23 24 28 .
29 30 34 35 36
- Start Time
1026
-
1300
9:05
12:40
8:52
1025
12:42
- End
Time
1 1 :26
-
14:02
1005
1410
1002
1130
1402
Styrene %
96.47 96.91 97.30 97.96 97.46 96.76 97.32 96.91 98.19 97.34 96.96 93.81 97.39 96.91 98.75 97.26 97.04 97.14 97.26 96.71 94.24
Styrene
1563.1 4123.8 6072.0 4909.2 1899.4 120.4
5043.3 1149.6
33.0 761 4.2 401e.4
80.4 5979.9 1863.7
50.7 4332.2 191 7.4
38.5 6988.4 2708.9
105.1
~ ~~ ~~
Average Styrene, Ye*
96.89 f 0.34
97.39 f 0.49
97.47 f 0.53
96.04 f 1.58
97.68 f 0.78
97.14 f 0.09
96.07 f 1.31
f one population standard deviation
54
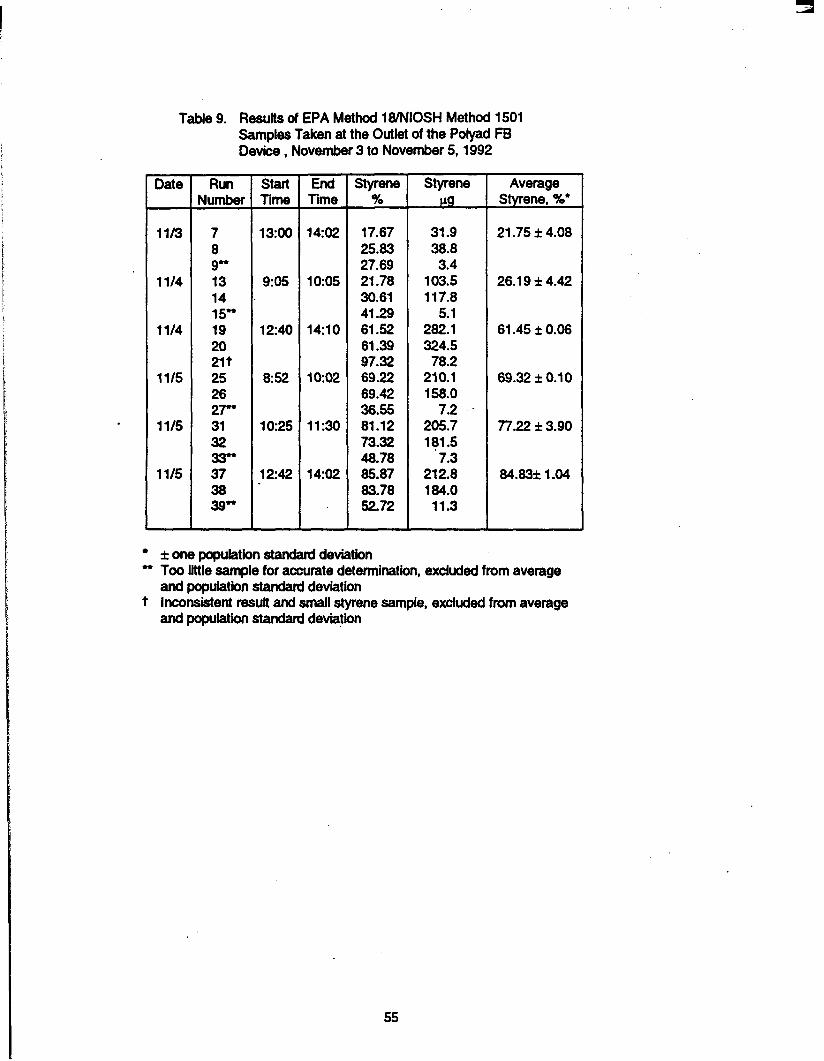
Table 9. Results of EPA Method 18/NIOSH Method 1501 Samples Taken at the Outlet of the Polyad FB Device , November 3 to November 5,1992 -
Date - 11/3
1114
1114
1115
1115
1115
Run Number
7 8 9" 13 14 1 5" 19 20 21 t 25 26 27" 31 32 33" 37 38 39"
- start lime
13:OO
-
9:05
12:a
a:=
10:25
12:42
-
- End
lime
1402
-
10:05
1410
1002
11:30
1402
-
Styrene %
17.67 25.83 27.69 21.78 30.61 41.29 61 -52 61.39 97.32 69.22 69.42 36.55 81.12 73.32 48.78 85.87 83.78 52.72
Styrene A
31.9 38.8 3.4
103.5 117.8
5.1 282.1 324.5 78.2
21 0.1 158.0
205.7 181.5
7.3 2128 184.0 11.3
7.2 ~
Average Styrene, %'
21.75 f 4.08
26.1 9 f 4.42
61.45 f 0.06
69.32 f 0.1 0
77.22 f 3.90
84.83* 1.04
f one population standard deviation .. Too l i le sample for accurate determination, excluded from average and population standard deviation
t Inconsistent mutt and small styrene sample, excluded from average and population standard deviarin
55
3.3 -IS of Recovered Solvent SamDIe
After testing had ended on November 5. the solvent recovery unit in the Polyad FB device was
drained and 2600 ml of liquid was recovered. This liquid had a strong odor. different from that of
styrene. Approximately 100 ml of this liquid was preserved in a glass container with a Tefbn sealed cap
and transported to Birmingham for analysis.
A sample of the liquid was diluted with carbon disulfide (1 :loo) and subjected to GC-FID
analysis to determine styrene content. It was determined that styrene was present in the sample and
was the largest constituent, but only at a concentration of 28.7 %. Many other hydrocarbons were
present. A second sample of the liquid was subjected to GC analysis with mass spectrographic
detedion to identify what compounds were present. An NBScerhed softwarn liry was used for
compound identifiition. Table 10 presents the results of this analysis.
As Table 10 shows, only two compounds could not be identified. The compounds other than
styrene appear to be contamination from the Polyad FB unit. As noted above, before being evaluated at
flier Plumbingware, the Polyad FB unit had been tested at a chemical plant that produced naphthalene.
The sample recovery reservoir in the Polyad FB unit was not drained at the end of that test. When the
Polyad FB unit was prepared for this test, the reservoir was not drained nor was the Bonopore
adsorbent changed. Thus, naphthalene and naphthalene-dated VOC's were present in the POryad FB
unit at the start of the test and throughout the test they continued to be desohed from the Bonopore
adsobnt . 3.4 Total Flow Rate Dab
Following the methodology described in Section 2.5.4, air flow into the Polyad FB device was
measured during each day of testing. Table 11 presents the results of these measurements. The flow
measurements made on November 3 (at 1445) and November (at 08:- 5 were the actual flows used
for testing. On November 4, flow rate measurements were made at the end of the day (14:45). The
flow rate indicated as 'Flow for Testing' in Table 11 was the flow rate used during that day. Flow rates
were measured at two other fan settings to help determine the fan setting to be used for the final day of
testing.
56

Table 10. Compounds Identified in Liquid Sample Recovered from the Polyad FB Device
Compound Identifid'
Unknown - 1 Styrene Unknown - 2 Diethyl Benzene 1.2 - Diethyl Benzene 1,3 - Diethyl Benzene 2 - Methyl - 2 - Propenyl Benzene Naphthalene Bis (2 - Ethylhexyl) Phthalate
Total of Compounds Present
Percent Present
1.439 25.737 4.578
17.028 16.052 5.071 5.809
17.342 6.944
1 oo.oO0
Amount (ml)
37.4 669.2 119.0 442.7 41 7.4 131.9 151 .O 450.9 180.5
2600.0
57

Table 11. Flow Rate Measurements at the Inlet of the Polyad FB Device
Date and Tim
11- 1445
Average
11 /w , 1445 (Flow for testing)
Average
(Trial flow nrl)
Average
(Trial flow nz)
Average
11/5m2,08:55
Average
The duct
c
"
* diameter was 14.61 cm
Distance from Far Wall d Duct'
cm
1.3 3.8 6.4 8.9 11.4
1.3 3.8 6.4 8.9 11.4
1.3 3.8 6.4 8.9 11.4
1.3 3.8 6.4 8.9 11.4
1.3 3.8 6.4 8.9 11.4
Fvst Traverse ' mlmin
259.1 289.6 266.7 228.6 289.6
266.7 304.8 274.3 259.1 292.6
350.5 373.4 342.9 304.8 358.1
388.6 396.2 359.7 335.3 381 .o
365.8 335.3 31 2.4 304.8 358.1
Second
mlmin
NIA NIA NIA NIA WA
rraveme
281.9 320.0 289.6 274.3 304.8
335.3 373.4 335.3 3124 365.8
381 .o 373.4 335.3 329.2 373.4
350.5 365.8 31 2.4 304.8 350.5
.R The flow rate used for testing appears in bold face type.
Average Velocity
mlmin
259.1 289.6 266.7 228.6 289.6
266.7 f 22.6
274.3 312.4 281.9 266.7 298.7
286.8 f 16.6
342.9 373.4 339.1 308.6 362.0
345.2 i222
384.8 384.8 347.5 3322 3??2
365.3 f 21 -5
358.1 350.5 31 24 304.8 354.3
336.0 f 22.7
Average flow Rate"
m3/min
4.4'7 f 038
4.81 f 0.28
5.78 f 0.37
6.12 i 0.36
5.63 f 0.38
58

3.5 Sfvrene Caotured bv the Polvad FB Device
Using the flow measured during each day of testing and the total time of spraying, it is possible
to estimate the minimum amount of air that passed through the Polyad FB device while styrene was
present. Also, if it is assumed that 95% of the styrene that entered the Polyad FB unit was captured and
completely recovered from the Bonopore adsorbent and that the average level of styrene present in the
exhaust air from gel coat booth #2 during periods of spraying was 128 ppm (from Table 2), then it is
possible to estimate the maximum amount of styrene that should have been recovered by the Polyad FB
device. Table 12 shows that amount to be 1.9 kg or 2.1 liters of liquid styrene.
Unfortunately, it is not possible to reconcile the amount of styrene that should have been
recovered with the amount of styrene that was recovered. This is because after testing had been
completed on November 4 (from 1500 until 18:30 when the unit was powered down), and before testing
was started on November 5 (from 07:OO when the unit was powered up until 08:50), the return air line
from the desorber was vented to the atmosphere (as recorded in the Weatherly, Inc. Polyad Mobile Unit
Log Book for the test at the Eljer Facility). The reason given in the Log Book for this modification to the
device was: 'To remove residual sorbent from previous testing." Thus, an unknown amount of styrene
that would have been otherwise recovered was lost.
However, if even half of the styrene that could have been collected through the whole test was
lost, approximately 500 ml of styrene liquid would remain unaccounted for. Two explanations are
possible. First, some styrene did remain on the Bonopore adsorbent at the end of the test. A sample of
the Bonopore adsorbent sent to SRI after the test retained a strong, styrene-like odor. Second, because
the recovered solvent container in the Polyad FB device is not designed to be completely emptied, some
condensed liquid may not have been recovered.
59

Table 12. Estimated Styrene Capture in the Polyad FB Device
Date
1113
11/4
11/5
Total
0994 - 1001 1O:Ol - 11:48 12154 - 14:21
08:42 - 1005 10:12 - 11:s 12:19 - 1415
08129 - 10105 1O:ll - 11:49 12119 - 14114
Polyad FB operation
hours
0.95 1.49 1.21
1.25 1.54 1.72
1.42 1.48 1.43
12.49
P O W FB Flow Rate
d/min
4.47
4.81
5.63
c
"
1
Volume of Air sampled
&
978.9
1301.6
1462.7
~ 3743.2
Estimate of Styrene Recovered'
Liters
0.58
0.76
0.76
2.1 0
Assuming daily average styrene concentrations from Table 2 and a liquid styrene density of 0.9074 4/ml
60
SECTION 4
COSTS ASSOCIATED WITH APPLYING M E POLYAD FB SYSTEM
TO STYRENE REMOVAL
In t e r n of styrene removal, the mobile Polyad FB pilot unit exhibiied excellent performance.
Based on the results of this evaluation, this technology can be expected to easily meet or exceed a 95%
average removal efficiency for styrene entrained in air. While such performance is excellent, this
technology is only suitable if it can compete with' other styrene removal technologies on a cost basii.
Thus. Weatherly, I n c . was asked to provide a price quote for aPolyad FB system suitable for the Eljer
facility..
Price quotes were obtained for two Polyad systems. The first system corresponds to the
configuration tested at Eljer Plumbingware: an adsorber/desorber system with solvent recovev (the
Polyad Recovery System). The second system incorporates a concentrator rather than a desorber and
relies on incineration with catalytic oxidation to dispose of styrene captured in the adsorber (the Polyad
Concentrator System). Both systems were described in Section 2.3 of this report. Weatherly Inc.
certifies that either system will meet a guarantee of 95% styrene removal and a maximum outlet styrene
concentration of 5 ppm. At the Eljer facility, installation of either Polyad system would require the
addi in of ducting to the present roof-vent system so that spray booth emissions would be directed to
the Polyad system. However, these price quotes did not include stacks, manifolding, foundations,
buildings, or weather protection.
Both systems were quoted on the same design basis with a nine-year depreciation period.
Table 13 lists the design assumptions and price quote for each system and Table 14 provides an
equipment list for each system. The air capacity of 200,000 sdm was based on the necessity of
accommodating the output from a l l of the 14 available spray booths operating near their rated capacity
of 14.500 acfm. An average inlet emissions level of 110 ppm of styrene was assumed and the
temperature of the air entering the Polyad unit was assumed to be 30'C (86' F).
61
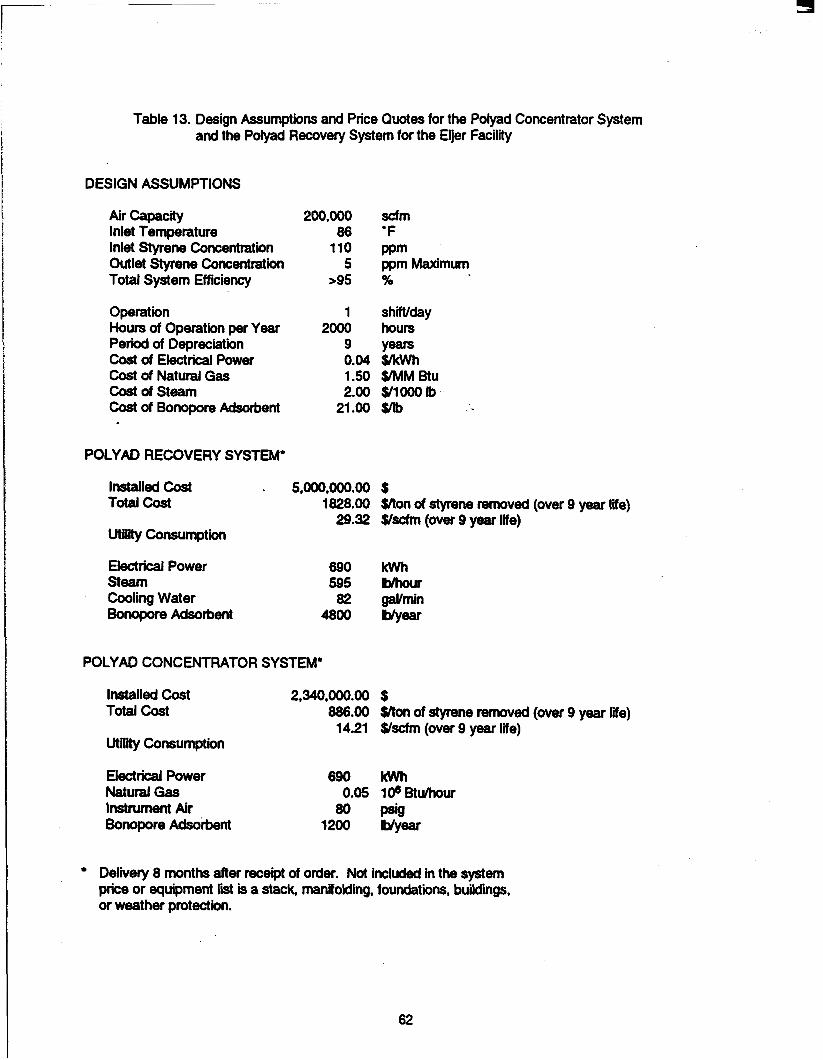
Table 13. Design Assumptions and Price Quotes for the Polyad Concentrator System and the Polyad Recovery System for the Eljer Facility
DESIGN ASSUMPTIONS
Air Capacity 200,000 Inlet Temperature 86 Inlet Styrene Concentration 110 Outlet Styrene Concentration 5 Total System Efficiency >95
Operation 1 Hours of Operation per Year 2000 Period of Depreciation 9 Cost of Electrical Power 0.04 Cost of Natural Gas 1 S O Cost of steam 2.00 Cost of Bonopore Adsobent 21 .oo
POLYAD RECOVERY SYSTEM*
Installed cost - 5,000,000.00 Total cost 1828.00
29.32 utility consumption
Electrical Power 690 steam 595 Cooling Water a2 BonoporeAdsorbent 4800
POLYAD CONCENTRATOR SYSTEM*
Installed cost 2,340,000.00 Total cost 886.00
14.21 utilii Consumption
Electrical Power 690 Natural Gas 0.05 lnstment Air 80 Bonopore Adsorbent 1200
scfm ‘F PPm ppm Maximum %
shift/day hours Years YkWh SI” Btu Y1000 Ib -
rn
$ yton of styrene removed (over 9 year life) Yscfm (over 9 year life)
$ $/ton of styrene removed (over 9 year Me) Yscfm (over 9 year life)
Delivery 8 months after receipt of order. Not included in the system price or equipment list is a stack, manifolding, foundations, buildings, or weather protection.
62

Table 14. Equipment List and Dimensions for Large Components for Polyad Systems Suitable for installation at the Eljer Facility
.YAD RECOVERY SYSTEM' POL
2 Fitter Unit 2 Fluid Bed Adsorber Unit 2 Cyclone 2 Main Fan 2 Moving Bed Desorber Unit 2 Transport Fan 2 Condenser Unit Fan 2 Styrene Condenser Unit 1 Styrene Recovery Tank 2 Water Chiller 2 Static Separator
Necessary pipes and valves e n units Electrical and I n s t r u m e n t a l Equipment Bonopore for Initial Fnhg
POLYAD CONCENTRATOR SYSTEM'
2 fitter Unit 2 Fluid Bed Adsober Unit 2 Cyclone 2 Main Fan 2 Fluid Bed Desorber Unit 2 Desorber Unit 2 C a t a l y t i c Oxidizer Unit
Necessary pipes and valves between units Electrical and Instrumental Equipment Bonopore for Initial Filling
hmitlt
16ftx40ft
14ftx14ft
16ftx40ft
8 ft x 8.3 ft 25ftx14fl
Not included in the system price or equipment list is a stack, manifolding, foundations, buildings, or weather protection
63

estimate how cost savings f m solvent reuse affect overall system cost because it may not be possible
to use the recovered styrene monomer without distillation. In their quote for the PRS, Weatherty, Inc.
noted that styrene has a tendency to discolor during recovery and in most cases requires distillation
before it can be reused. This system was priced at SS,OOO,O00.00 (installed). Depreciated over a nine
year lifetime, total cost (installation plus operation) is $29.321scfm or $1 828hon of styrene removed.
* It is possible to estimate the magnitude of savings that would be realized from the recovery of
styrene over a nine-year lifetime for the Poiyad Recovery System. In April of 1993, Mr. Rollie Nagel at
Eljer Plumbingware reported tMt Eljets current cost for styrene was $0.68/lb, not including shipping or
handling costs. At an average inlet concentration of 11 0 ppm, system flow rate of 200,000 scfm, and
2000 hour work year, in a period of 9 years, approximately 3048 tons of styrene would be recovered,
assuming 95% recovery. Presuming that 75% of this styrene could be reused, without escalating the
cost of styrene, a savings of approximately $3,109.O00 would be realized. If the cost of styrene
escalated at 2.5% per year, the savings would be approximately $3,437,000 over nine years. It should
be noted that this estimate of savings does not include capital or operating costs of redistilling styrene (it
needed), costs associated with disposing of spoiled or unusable recovered styrene, or manhow savings
realized from the handling and storage of l e s s fresh styrene monomer. What this simple analysis does
indicate, however, is that solvent recovery may be cost effective.
The Polyad Concentrator system uses the same type of fluidized bed adsober as was tested in
the Polyad FB pilot unit. However, rather than cooling hot air from the desorber to condense styrene as
was done in the pilot unit, hot styrene-laden air from the desorber (where styrene emissions are
concentrated by a factor of 1 1.8) is sent to a catalytic oxidizer to be burned. Flow to the catalytic
oxidizer is 17,000 acfm and because the styrene has been concentrated, combustion is setf supporting
within the oxidizer. Natural gas is required to start ignition and maintain a pilot light. This system was
64
The Polyad Recovery System is identical in function to the Polyad mobile unit tested at Eljer
P l u m b i r e . In order to recover styrene monomer, hot styrene-laden air from the moving bed
desorber is passed through a solvent recovery unit where styrene is condensed and directed to a
Went recovery tank Recovered solvent can be disposed of or reused. No attempt was made to

priced at $2,340,000.00 (installed). Depreciated over a nine year lifetime, total cost (installation plus
opeiation) is $1 4.21/sdm or $88Wton of styrene removed.
Weatherty, Inc. also provided additional cost information for both types of Polyad systems. This
cost information is shown in Figures 21 and 22. Fgure 21 shows total cost (for a nine year operating
life) in @ton of styrene removed as a function of styrene concentration at the inlet for two inlet. flow rates:
20,000 and 6 0 , O O O sdm. Figure 22 also shows total system cost (for a nine year operating life) but in
terms of @ d m as a function of the same inlet styrene concentrations for the same two inlet flow rates.
On both figures total cost information for the proposed 200,000 sdm Eljer Polyad system is shown at an
inlet styrene concentration of 1 10 ppm.
65

. . 1 . . . .
. .
95% Styrene Removal
1 o2
. . . . * .
. . . . . . . . . .
. . . . . . . . . . . . . . . . . . . . . . . . . . . . . . . . . . . . . . . . . . . .
1 o1 102
Inlet Styrene Concentration, ppm
Figure 21. Total system cost as $/ton of styrene removed for a nine year lifetime for various inlet concentrations of styrene. Data for 20,000 and 60.000 scfm inlet flow rates are shown along with values for the 200,OOO scfm system proposed for Eljer Plumbingware
66

95% Styrene Removal 70 - I I
I I I I I I I
I I 1 I I I l l I I I I I I I I 1 I I I I I I I . . . . . . . . . . . . . . . . . . . . . . . . . . . . . . . . . . . . . . . . . . . . . . . . . . . . . . . . . .
. . : : : : : . : 1 . . . . . . . . . . . . . . . . . . . . . . . . . . . . . . . . . . . . . . . . . . . : . . . . . . . . . . . . . . . . . . . . . . . . . . . . . . . . . . . . . . . . . . . . . . . . . I ri ""0"- 20,000 scfm Inlet flow Rate - 60,000 scfm Inlet flow Rate
60 I 200,000 scfm, Eljer Facility . -
E O 4 0 .c
s c 50 t-"" -
o." - "
Q " - "
10
0
1 o1 1 o2
Polyad Concentrator System I .T . . . . . . . . . . . . . . . . . . . . .
: . . . . . . 8 : . . . . . . . . . . . . . : i : : . . . . . . . . . . . . . . . . . . . . . . . . . . . . . . . . . . . . . . . . . . . . . . . . . . . . . : : : : : * . : : i i ; ;
Inlet Styrene Concentration, ppm 1 o3
Figure 22. Total system cost as $/dm of inlet flow rate for a nine year lifetime for various inlet concentrations of styrene. Data for 20.000 and 60,000 scfm inlet flow rates are shown along with values for the
' ' 200,000 scfm system proposed for Eljer Plumbingware
67

SECTION 5
SUMMARY AND CONCLUSIONS
The purpose of this study was to evaluate the Polyad and Chemtact processes for controlling
styrene emissins at a representative fiberglass shower stall and bath tub manufacturing plant.
Because the Chemtact unit could not be made available within the time frame allotted for this work, only
the Polyad process was evaluated. The Polyad process was evaluated with the aid of a small,
transportable Polyad FB (fluidized bed) unit supplied by Weatherly, Inc., who is responsible for domestic
marketing and s a l e s of the Potyad process. The evaluation carried out from November 3 - 5,1992
at the Eljer Plumbingware faciGly located in Wilson. NC.
The Polyad process uses successive beds of a proprietary regenerable adsorbent (Bonopore@)
that are fluidized by incoming dent-laden air. Clean air . i s exhausted to the atmosphere from the last
bed through a cyclone (to recover bed material). Adsorbent is continually removed from the fluidized
beds, heated to evolve adsorbed solvent, and returned to the fluidized beds. W e n t is evolved from the
bed material in a vertical moving bed desorber and recovered in a separate watercooled condenser..
Testing of the Polyad FB pilot unit was complicated by the fact that just before this evaluation the
Polyad FB unit was operated at a chemical plant to remove napMhaiene from a contaminated air
stream. Unfortunately, at the conclusion of that test, the unit was not cleaned and residual naphthalene
and naphthalenerelated compounds were not desorbed from the Bonopore adsorbent in the unit.
Nevertheless, the Polyad FB device demonstrated that the Polyad process could achieve
styrene removal efficiencies of 99%. After the first day of testing, when molds were being sprayed the
unit operated at a styrene removal efficiency of 94% or greater. During the last day of testing. when
most of the naphthalene from the last series of tests had been evolved, the Polyad FB unit achieved an
average styrene removal efficiency of 95.4% (96.6% while molds were being sprayed).
The possibility exists that greater styrene removal effiiiencies could have been reached. An
engineer at Weatherly, I n c . indi ted that the lowest available Bonopore mass flow rate for the Polyad
68

styrene monomer has a relatively high boiling point (146'C) and a longer residence time in the
adsorption unit and the desorption unit (lower flow rate) would have resulted in greater solvent recovery
and higher overall efficiency.
In addition to the evaluation of the Polyad process. it was possible to quantify styrene emissions
in the spray booth exhaust to which the Polyad FB device was connected and from the exhausts of two
other spray booths at the Eljer Facility. These measurements showed that styrene was the only volatile
organic compound present in the spray booth exhausts at this fac i l i and that time averaged
concentrations of styrene ranged from 85 to 150 ppm.
69

APPENDIX A
NlOSH METHOD 1501
70

H.U.: fable 1
HYDROCAR80NS, AROMATIC
Elm: I s 0 1 ISSUED: 2/15/84
BUNKS: 2 to 10 f ie ld blanks per set
ButK ME: desirable, 1 to 10 a; ship in - separate c o n t a i n e r s frun s a p l e s
U 15/84 1501-1
71
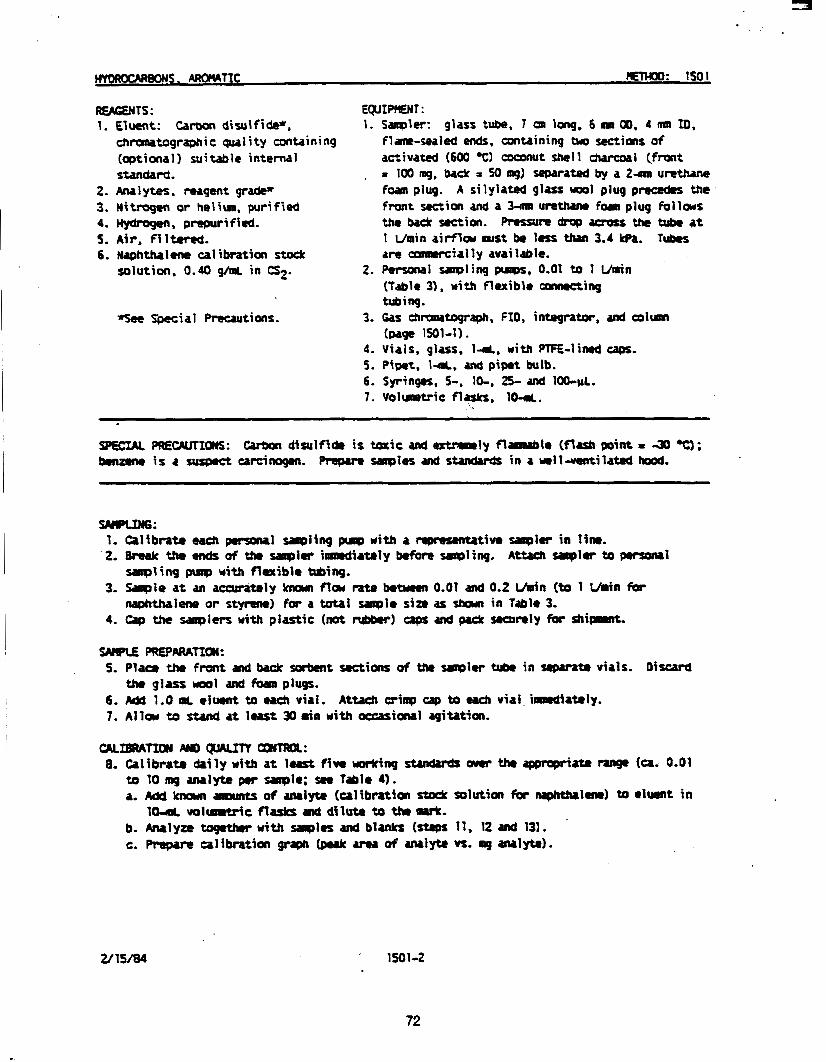
HywK)cARBoNs. AROrUTTC IEtwoo: 1501
REnG€NlS : 1. Eluent: Carbon disulfide*.
chrarratographic quality containing (optional) suitable internal Standard.
2. A M I y t e s . m g m t grade* 3. Nitrogen or heliun, purified 4. Hydmgen, prepurified. f. A i r . filtered. 6. Naphthalene calibration stock
solution, 0.40 g/ml in CS2.
*fee Sphcial Prccwtions.
EgUIPnENT : 1. Swpler: glass tube, 7 an long, 6 00, 4 mn ID,
flam-sealed ends. containing tu0 sections o f activated (600 -1 coconut shell c h a r c o a l (front
, = 1 0 0 mg, back = SO mg) separated by a 2- urethane foam plug. A silylated glass vool plug preceths the front r o c t i a n and a 3 4 urethuw fora plug follows the back s a c t i o n . -re drop across ttw tuk at 1 U n i n aimow mrst be l e s s thn 3.4 kPa. luks are cammciolly avai lable.
2. “ M i s a p l i n g pimps, 0.01 to 1 Vmin (Table 31, with flexible amacting tubing.
(page 1501-1). 3. GU chmnatograph, FID, i m t a r , and a r l u m
4. vials, glass, 1 4 , with P T F E - l i d caps. 5. Pipet, 1 4 . and pipet bulb. 6. Syringes, 5-, 1&, 25- md 1001rL. 7. volumtric flasks, 1 W .
SAWLIm: 1. Calibrate each personal s l r p l i n g pap with a mpmsmtative -la in lin. 2. Break the ends of th. saglw imadiately before -l ing. A t w h u l p 1 . r to personal
3. *le at an accurately lman f law rate 0.01 and 0.2 Llbin (to I Uain fer
4. Cap the s a a p l e r s with plastic (not -1 aps and pack securely for shiplmt,
-ling p\mo w i t h flexible tubing.
naphthalene or styrene) f a a total saple size as shown in Table 3.
URlE PREPARAfIm: 5. P l w the front md back m t seetiam of the sapla tuk in saparate vials. O i s m = d
6, Md 1 .O ml eluent to vial. At- trim ~ 1 0 to each vial, ianrdiately. 7. Allor to Mnd at least 30 .in with o c u t i a u l agitatian.
the glass # o l and foaa plugs.
2/15/84 . 1501-2
72

9. Oetemine desorption efficiency (El at least once for ea& batch of c h a r c o a l used For -ling i n the calibration range (step 8). Prepare three tubes at each o f five levels plus t h r e e media blanks. a. R w v e and discard badc sorbent roction of a lnsdia b!ank sapler. b. Inject a k w n amrmnt of a n d l y t e (calibration s t o c k solution for naphthalene) directly
c. Cap the tube. ~ I l o r to stand overnight. d. Desarb (steps 5 through 1) and andlyze toqathcr with working standards (steps 11, 12
e. -re a graph of OE vs. n q a n a l y t e mowrcd.
calibration graph and OE graph are in c o n t r o l .
onto front sorbent section uith a microliter syringe.
and 13).
10. Analyze three quality CDntml blind spikes and thm analyst spikes to insure that the
nEASUREnMT : 11. at gas chmrratograph according to mamrfacturer’r racomandatims and Cmditions given
on page 1501-1. Select appropriate c o l u m tmperature:
2.5 4.3 1.0 1.0 1.2 8.3 10 16
1.1 1.4 1.4 1.5 1.6 1.9 2.6 3.2 3.8 2s
2. f 4.2 5.2 5.5 5.6 6.0 6.5 1.6
1 .o 8. I 1.2 8. S 6.3 12
NQTt: Alternatively, aplm and hnpcrature amy be taken frca Tale 4.
It, Inject -le aliquot umnually using s o l v e n t flush technique or uith a u ~ l e r . ISOTE: If peak area i s above the linear range of the vorking m. dilute with eluent,
reanalyze and apply the appropriate dilution factor in calculations. 13. !basurn peak area,
2/ 15/84 1501-3
73

_ . a
IS. Calculate concentration, C, of a n a l y t e in the air v o l l m g rarrpled. Y (L):
EVALWTLON OF HETwIO: Precisions and biases listed in Table 3 wn determined by MlyZing generated atmosph.rer oolrtlininq “half, one, and tu0 tims the OSWA standard. Generatad aDncenttationS ucrc i-bntly verified. 8reakthmuqh capacities uer, determined in dy air. Storage stability wlz not assessed. narJurcmPnt precisions given in Table 4 were determined by spiking -ling mdia with amunts comzpondinq to “half. one, and fuo ti- th. OSHA standard for mninal air v o l w r . Desorption efficiencies for s o i k d swplerr containing only one corparnd exceeded Kt. Reference (121 provides more specific information.
STHW REVISED BY: R. Alan Lunsford, Ph.O., and Julie A. Olnnfust; basad an r e s u l t s of NXOSH Contract Q l c - 9 9 - 7 4 4 .
U l W 15014
74

bnrao: EO1 l m R a x m N S . "nc
Table 1. Synonyms. fomla, molecular weight, properties [SI.
tirpirical Nam/Svnonwns Structure Fornula
"
ethylbenzene CAS #loo-u1-4
1 styrene CAS m 4 3 - 9
vinylbenzene
wro
ROiaC- uldr
uaiat
78.11
148.25
120.20
106.17
118.18
la. 18
104.1s
92.14
118.18
B o i 1 ing Paint
0 80.1
192.8
152.4
136.2
165.4
e0.r
14.2
110.6
167.7 171.6 1R.8 169.8
144.4 139.1 138.4
95-2
0.7
4.7
9.6
2.5
0.2
6.1
28.4
1.6 1.9 1.8 1.8
6.7 0.4 0.8
12.7
0.09
0.62
1 - 2 8
0.33
0.03
0.81
3.79
0 . Z 0.26 0.24 0.24
0.B 1.12 1.18
h i t y ea- Is/-
0.879
0.861
0.862
0.067
0.911
1.025
0.306
0.17
0.- 0.911 0.911 0 . m
0.880 0.864 0 . m
U1W 1501-5
75
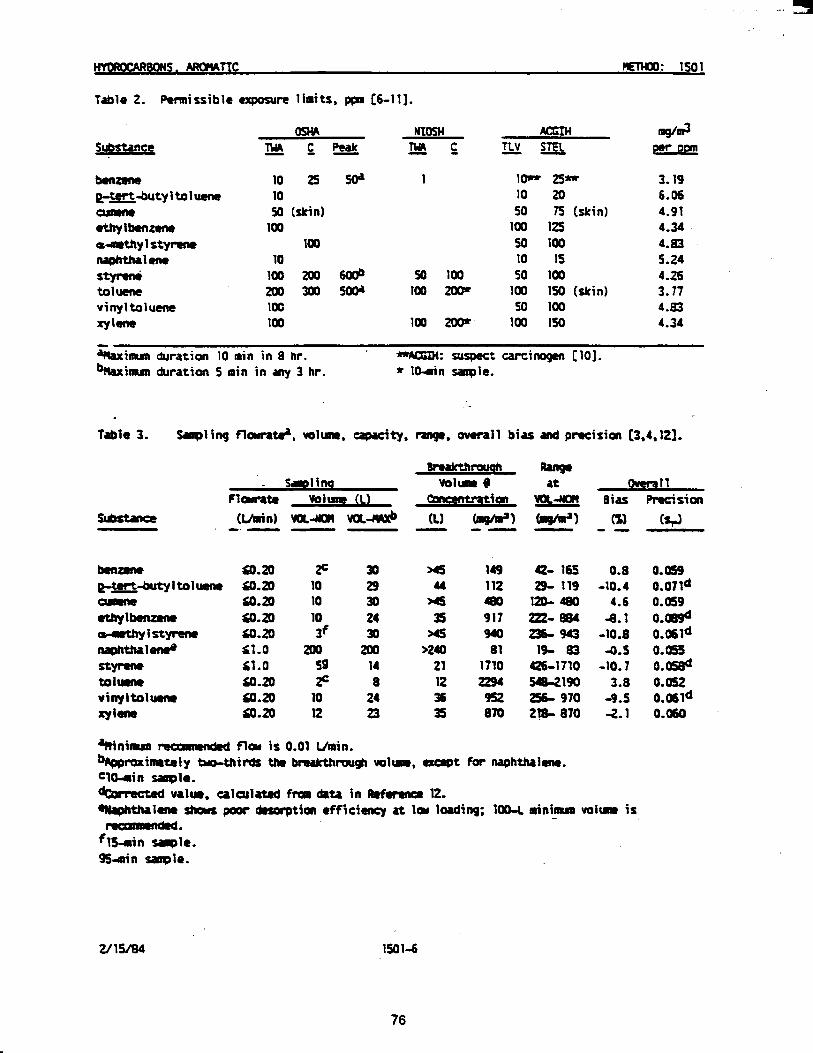
Table 2. Permissible exposure limits, ppn C6-111.
10 10
5 0 ( 100
10 100 200 1OC 100
25
:skin)
100
50' 1 10- 2s- 10 to 50 7S (skin)
100 125 M 100 10 IS
50 100 50 100 100 toot 100 150 (skin)
so 100 100 200* 1 0 0 150
3.19 6.06 4.91 4-34 4.83 5.24 4.26 3.17 4.83 4.34
h i - dration IO min in 8 hr. ' m: suspect c a r c i n o g e n [lo]. blbxiaun duration 5 min i n any 3 hr. * l O 4 n -le.
Table 3. Sapl ing flourat&, volrma. capacity. mqe. overall bias and precision [3,4,121.
s0.a a.20 a.20 a.20 a.20 s1.0 Ll.0 a.20 sO.a Lo.20
F 30 10 a 10 30 10 24 3f 30
2w 200 so 14 zc 8
10 24 12 23
149 112 a0 917 940 81
1710 2294 #z 870
Q- 165 29- 119
1 s 480 z- 8B4 -343
13- 83 426-1710 -190 256- 970 218- 870
0.8 -10.4
4.6 1 . 1
-10.8 0 . 5
-10. I 3.8
-9.5 4.1
0. ass 0.071d 0.059 0 . d 0.061d 0.m 0 . d 0.05t O.Obld 0.060
2/ 15/84 1501-6
76

. . .. z!
150 1 -. m n c
ncaurmnmt range, precision and eonditiarz' [3,4,12l.
1.0 0.5 0.5 0.5 0.5 1.0 0.5 1 .o 0.5 1.0
0.09- 0.35 0.27- 1-09 0.86- 3.46 2.17- 8.67 0.69- 3.57 4.96-19.7 2.17- 8.49 1.13- 4.51 2.41- 9.64 2.60-10.4
0.036
0.010 0.010 0.011 0.019 0.013d 0.011 0.008 0.010
0 . d 50 M so 50 50 30 50 50 M 50
115 0.9 115 3.0 99 3.0 85 3.0
115 3.0 1 2 5 3.0 1 0 9 3.0 I55 0.9 1 2 0 3.0 1 8 0 0.9
1501-7
77
A 8 8 B 8 C 8 0 B 0

APPENDIX B
QUALITY CONTROL EVALUATION REPORT
. .
7a

SUMMARY
. A Quality Assurance Project Plan (QAPP) was written and approved for this project before
testing began. No field audiis were planned or performed. However, as stated in the QAPP, certified
calibration gases (28,55, and 192 ppm of styrene in nitrogen and zero air with less than 0.1 ppm THC
content) served as field performance audii samples for NIOSH Method 1501 and THC sampling. Also,
EPA personnel were on sie to oversee diagnostic measurements. In the field, QC was addressed by
strict adherence to standard sampling protocols either as specified for NIOSH Method 1501 or by
following a standard operating procedure (modified as needed for this particular sampling task) with the
THC analyzers as specified in the THC instruction manual.
In SRl's A n a l y t i c a l Chemistry facilities, QC is addressed by strict adherence to standard
operating procedures (SOP) previously defined and implemented. Pertinent SOP'S for the analyses
required on this project were included in the QAPP. While random audits can occur while the field
samples from any project are being analyzed, and audits are regularly performed by the QA officer at
this facili, no audit was planned or performed as part of this project.
Overall, data quality indicator (OQI) goals were achieved. However, some data were lost due to
an equipment malfunction and because of that malfunction much l e s s data were obtained from the
NIOSH Method 1501 samples than was planned. Since these measurements were duplicated by the
THC analyzer measurements, overall objectives of the project were not compromised.
SlGNlFlCANT QNQC PROBLEMS
One signifcant QNQC problem was encountered. Styrene concentrations determined from
charcoal tube samples taken at the inlet and outlet of the Polyad FB mobile pilot unit were not reliable
because the sample pumps used to draw air samples through the charcoal tubes were unable to
maintain correct flow at inlet pressures negative with respect to ambient. This problem was not
discovered until after all field sampling was completed primarily because the bubble flow meter used to
calibrate the sample pumps could not be operated at inlet pressures negative with respect to ambient.
After this problem was discovered, numerous attempts were made to simulate the sampling condiiions
79

under which the samples were taken so that sample flow rates could be corrected. However, these
attempts were not sucessful. No other corrective actions were required or taken during the collection of
samples and data or during subsequent analysis of samples collected during testing.
DATA QUALITY
The following procedures were used to determine how well data qualii indicator (DQI) goals
were met:
0 erecision is expressed as percent coefficient of variation:
% cv = 100 x (Sfivg)
where SX is the standard deviation of x number of data values from the data set and
&vg is the mean or average of the x number of data values from the data set.
0 is expresses as a difference or percent difference between measured and known
values:
where T is the tnre value (reference standard) and X is the mean sample -
concentration. %RPD is the relative percent difference.
0 -leten- is expressed as a percent between successful analyses and total
attempts:.
80

Completeness = 100 x S A
where S is the number of successful analyses and A is the total number of attempts.
Comparabilii is expressed as a percent difference (%Dm between the results for two
methods:
%Diff = 100 X (Rl-RM(R1 +RH21
where R1 is the result for one method and R2 is the resuR for the second method.
Table B-1 shows the DO1 goals that were estimated for critical measurements in the QAPP.
Tables B-2 and 8-3 show DQI values for measurements. canied out with charcoal tubes (NIOSH Method
1501). Table B 4 shows DQI values for THC analyzer measurements. Below, the precision, accuracy,
and completeness of the data that were obtained in this project are reviewed.
etecisioo Triplicate charcoal tube samples taken on October 13,1992 and on November 6,1992 provided
a total of 12 samples from whch precision for this method could be estimated. Details and results of
these measurements are shown in Tables 6 and 7 of this report. Three series of runs were made. Six
separate runs were made at the same time at gel coat booth #2 on October 13,1992 and two sets of
triplicate runs were made on November 6,1992 after sampling was completed at gel coat booth #2 (one
set at first lay-up booth #5 and one set at second lay-up booth #7). An outlier was identified in the first
set of 6 NIB made on October 13,1992 and was not included in results reported in Table B-2.
Precision for the three distinct sets of ~ n s averaged 6.6%. greater than the 5.8% expected for NIOSH
Method 1501. However, if the third sample taken at second lay-up booth #7 on November 6,1992 is
excluded, the average precision drops to approximately 4%.
-
81

..
I . .
. .
Table 6-1. Data O u a l i Indicator Goals for Critical Measurements Estimated in QAPP
Total Hydrocarbon Analyzer with FID.2
Measurement Parameter
Styrene Content
Hydrocarbon compounds in air.
Experimental Condition
1 .Inlet and Outlet of controi device,
samples. 2. Calibration gas
1. Inlet and Outlet of control device,
samples. 2. Calibration gas
Precision (Rei. Std. Dev., %)
5.81
f 105
EW-d Accuracy (% Bias)
-10.71
1 Precisii and bias for sampling with charcoal-filled tube. 2 J.U.M. Model VE-7 THC Analyzer. 3 Estimated values. Precision and bias will be determined for each instrument
Completeness
(%)
85
85
82

Method and Reference
NIOSH 1501 '
Table 8-2. Data Qualii Indicator Values for NIOSH Method 1501 Measurements Made at EIjer Plumbingware
Measurement
2.First Lay-Up Booth
Exhaust, 1 a1392 Content 1 Gel Coat Booth #2 Styrene
Condition Parameter Experimental
#5 Exhaust, 11/6/92
3. second Lay-up Booth #7 Exhaust, 11/6/92
Precision JRel. Std. Dew, %)'
4.3
3.6
11.9
Accuracy (% Bias)
N/A
N/A
N/A
Completeness (%)
83.3
100
100
' Precision for sampling with charcoal - f i l l ed tube. Average of three conditions = 6.6%
83
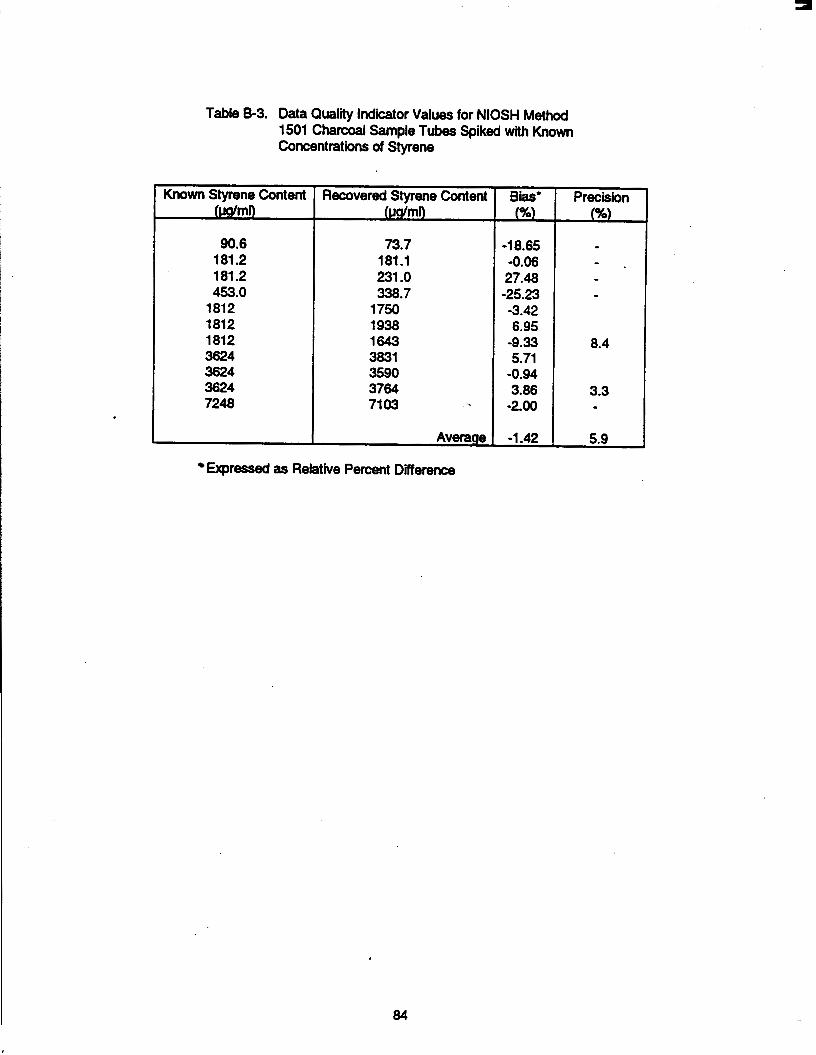
Table 8-3. Data Quali Indicator Values for NIOSH Method 1501 Charcoal Sample Tubes Spiked with Known Concentrations of Styrene
Known Styrene Content (pdml)
90.6 181.2 181.2 453.0
1812 1812 1812 3624 3624 3624 7248
Recovered Styrene Content (pdml)
73.7 181.1 231 .O 338.7
1750 1938 1643 3831 3590 3764 71 03
Average
Expressed as Relative Percent Difference
- Bias' 0 -1 8.65 -0.06 27.48 -25.23 -3.42 6.95
-9.33 5.71
-0.94 3.86 -200
-1.42 -
Precision (%)
- - - -
8.4
3.3 - 5.9
84

Table 6-4. Data Quality Indicator Values for THC Analyzer Measurements Made at Eljer Plumbingware
INLET THC ANALYZER
Span Gas#" Bias 25 ppm Span Gas (Measured Value)
25.0 27.0 25.0 . 27.6 27.8 24.1
6.0
L
OUTLET THC ANALYZER
Span G-0 Bias 25 ppm Span Gas (Measured Value)
Precision (% Cv) Average % Bias
L
25.0 26.0 25.0 24.3 26.0 26.2
3.0
L
0.0 8.0 0.0
10.4 11.2 -3.6
4.3
Bias (Measured Value) % 49 ppm Span Gas
53.1 51.1 50.8
2.4
0.0 4.0 0.0
-2.8 4.0 4.8
1.7
I
Bias (Measured Value) % 49 ppm Span Gas
L
53.1 48.1 51.1
5.0
L
i
8.0 4.0 3.4
5.1
8.0 -2.2 4.0
3.3 -
1725 171.7 164.8 170.0
L
Bias (Measured Value) YO 171 ppm Span Gas
L
0.5 0.0
4.0 -1.0
168.2 175.1 159.7 169.1 171 -7
3.8
- Bias 90
-2.0 2 0
-7.0 -1.5 0.0
-
-1.7 -
85

Table 8-3 shows the results of measurements made with charcoal tubes spiked with a known
amourit of styrene monomer. These data were fit with a linear regression (R2 = 0.9969) to quantify the
results of GC-FID measuremants made on styrene desorbed from the charcoal tube samples taken
during testing. Two concentrations were spiked in triplicate (1812 and 3624 pgrml). The precision
measured for these two sets averaged 5.9%.
For THC analyter'measurements, precision was determined from repeated measurements of
the three span gases. Averaged precision values for the inlet and outlet THC analyzers reported in
Table 8-3 (3.5% for the inlet THC and 3.9% for the outlet THC) are approximately one-third of that
originialty estimated in Table 6-1.
m a Bias could not be determined from charcoal tube samples obtained during testing at Eljer
Plumbingware because of the problems in sampling reported above. However charcoal tubes spiked
with known concentrations of styrene were prepared and analyzed at SRI. The results of this analysis
are reported in Table B-3. For some of the lower concentrations listed, several bas values (as relative
percent difference) in this table are rather high. However, on the average, bas was low (-1.4%).
For THC analyzer measurements, bias was determined for each measurement made of the
three span gases and are reported in Table 8-3. Average bias values for the inlet THC ran from -1.1 %
(1 92 pprn styrene) to 5.1% (55 ppm styrene). Average bas values for the outlet THC ran from -1 .no (192 ppm styrene) to 3.3% (55 ppm styrene). Overall, bas values were within the t5% estimated in
Table 8-1.
For the NIOSH Method 1501 samples taken at the inlet and outlet of the Pdyad FB device,
completeness was Wo because styrene concentration could not be determined from any of the
samples. From the NIOSH Method 1501 samples taken before and after testing the Polyad FB device
completeness was 91 .X.
For THC analyzer measurements, completeness was much higher. Some data was lost during
FID flameouts and other data was lost during a power failure on the hst day of testing. Out of
86

approximately 12.3 hours of data (at one data point per second) less than 5 minutes worth of data were
lost due to FID flame-outs (completeness of 99.3%). Including in a power failure of 15 minutes when no
data were obtained, completeness was 97.3%.
resentattvenes
The design of the portable Polyad FB device dictated much of the sampling strategy and
sampling methodology practiced during this evaluation to obtain representative samples. The use of a
large, flexible aluminum sampling line avoided contamination from plasticizers in a flexible plastic line.
Location of the sampling line inlet (within the vent exhaust duct) and the high flow velocrty into the
Polyad FB unit (4-6 mlsec) assured that the sample extracted from the gel coat booth #2 exhaust was
representative. Following the sample methodology recommended in NIOSH Method 1501 and EPA
Method 18 (Section 7.4) also assured that representative samples were obtained.
ComDarability
The sampling plan for this project made provision for simultaneous sampling using the two
measurement methods of this study which would allow comparison of the results when suitably
averaged over the same sampling period. However, because the NIOSH 1501 samples taken
coincident with the THC sampling periods were unusable, no such comparison can be made.
Nonetheless, since measured precision and accuracy of the THC data were both well within our DQI
objectives, we feel confident that the overall objectives of the project were not compromised.
a7

APPENDIX C
TOTAL HYDROCARBON ANALYZER DAILY RESULTS
aa

I ame GI. I nr; Analyzer HBSUNS rrom Novemmr 3.1992. ~ r s t penod of spraying
November 3,1992 Start Time
9:04 908 909 909 9:09 9:09 .9: 12 9:16 916 9:22 9:25 930 932 9:33 9% 9:39 9:40 9:41 9:47 9:48 954 9:s 9:55 9:55 955 9:s 9:57
- End Time
908 908 909 909 909 912 916 916 922 9% 930 9:32 933 9:33 9:39 940 941 947 948 954 9 s 955 955 955 955 957 1001
T uapsed T" 0 262 8 10 6 3
21 8 217 23 306 182 304 145 31 30 359 42
l o o 302 64 409 9 6 3 6 3
1 3 4 246
2460 988 3428
- -I Average - 165.7 61.1 60.5 63.7 63.3 41 .O 176.9 55.9 195.7 45.8 171.9 45.5 99.9 53.4 202.3 54.2 49.1 180.4 525 131 .O 64.9 59.1 63.6 59.6 64.5 41.6 163.3
173.7 46.1 137.7 -
std. DW.
81.8 0.8 1.2 0.6 0.5 5.7 58.1 3.7 59.4 5.6
55.0 5.4 223 4.0 80.1 4.8 4.3 87.6 5.2 68.3 1.3 1.7 0.2 1.4 1.2 9.1 59.7
1) - 6% c o n f Interval
9.9 0.5 0.7 0.4 0.6 0.8 7.7 1.5 6.6 0.8 6.2 0.9 7.9 1.4 8.3 1.4 0.8 9.8 1.3 6.6 0.9 1.3 0.2 1.2 1.3 1.5 7.4
- l- - - 0
Average - 21.52 21.37 21.31 21.24 21 24 21.09 20.64 20.50 20.39 20.20 19.87 19.61 19.56 19.59 19.53 19.38 19.21 18.94 18.51 18.14 17.68 17.67 17.65 17.65 17.71 17.46 16.71
19.40 19.66 19.47 -
'LETTHC p- ski Dev.
0.14 0.04 0.06 0.01 0.04 0.13 0.1 1 0.04 0.08 0.10 0.14 0.05 0.05 0.05 0.08 0.06 0.05 0.17 0.05 0.23 0.03 0.03 0.02 0.04 0.00 0.15 0.23
89
m) - 95% conf.
lntsvpl
0.02 0.04 0.04 0.01 0.04 0.02 0.02 0.02 0.01 0.02 0.02 0.01 0.02 0.02 0.01 0.02 0.01 0.02 0.02 0.03 0.02 0.02 0.02 0.03 0.01 0.03 0.03
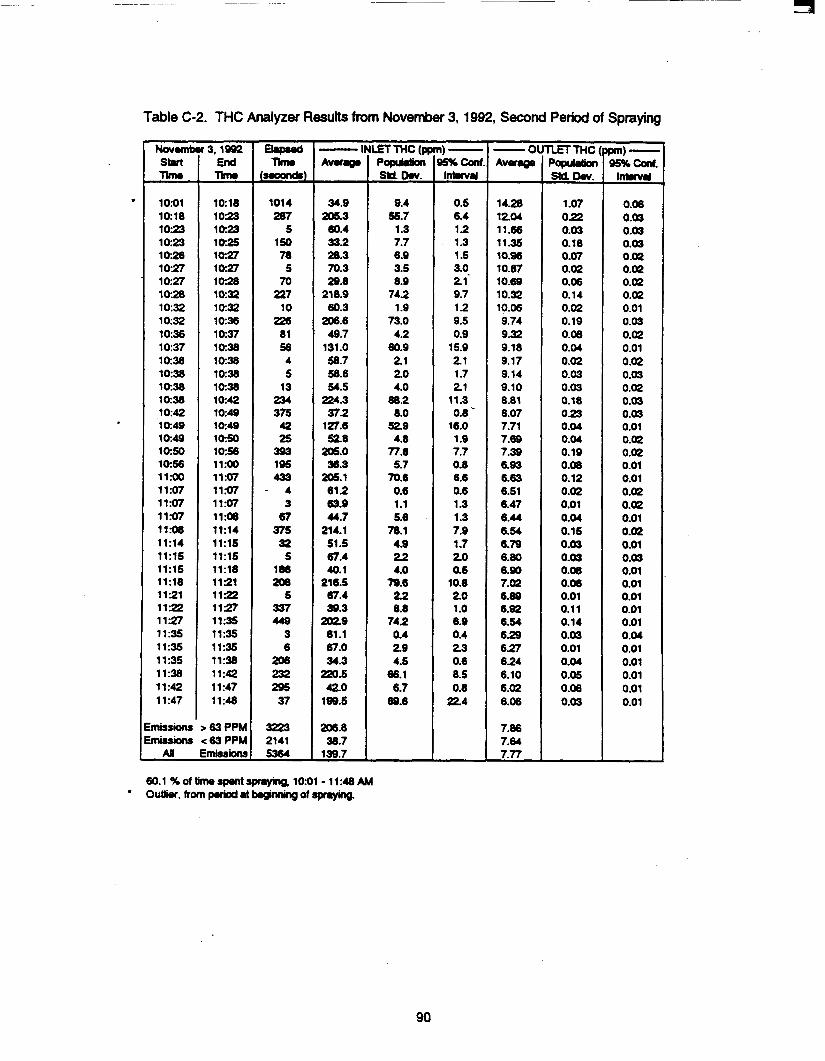
Tabie C-2. THC Analyzer Results from November 3,1992, Second Period of Spraying
I Navember3.1992 SWt Time
1001 1O:lS 1023 1023 1026 1027 1 027 1028 1032 10:s 1036 1037 1038 1038 1038 1038 1042 1049 1 0:49 lo:!% 1056 11- 11:07 11:07 11:07 11- 11:14 11:15 11:15 11:18 112 1 11= 11:n 1 1 s 1 1 s 1 1 s 11:38 11:42 11:47
- End llm.
10:18 1023 lo:= 10% 1027 1o:n 1028 1032 10:32 1036 10:37 1038 1038 10:38 1038 1042 10:49 1049 1050 1056 11:oo 1197 11:07 11.91 11- 11:14 11:15 11:15 11:18 1121 11s 1127 1 1 s 11% 1 1 s 11:s 11:42 11:47 11:a
-
> 63 PPM
EL.prod n l m 0 1014 287 5
150 78 5 70
227 10
z?6 81 56 4 5 13 234 375 42 2s 393 195 433
- 4 3 67 37s 32 5
11)8 208 5
337 449 3 6
206 232 295 37
3a3 2141 5364
- -I A w r r g . - 34.9 205.3 60.4 33.2 211.3 70.3 29.8 218.9 60.3 206.6 49.7 131.0 58.7 58.6 54.5 224.3 37.2 127.6 52.8
205.0 36.3 205.1 61 2 63.9 44.7 214.1 51.5 67.4 40.1 216.5 67.4 39.3 #129 61.1 67.0 34.3
220.5 42.0 199.5
206.8 38.7 139.7 -
LET Tl+c (A POpJllkn sld 0.v.
9.4 55.7 1.3 7.7 6.9 3.5 8.9 74.2 1.9
73.0 4.2 60.9 21 20 4.0
882 8.0 !529 4.8 77.8 5.7 70.6 0.6 1.1 5.6 78.1 4.9 22 4.0 19.6 22 8.8 742 0.4 29 4.5
66.1 6.7 69.6
1) - mcmt lntorvrl - 0.5 6.4 12 1.3 1 .S 3.0- 21 9.7 1.2 9.5 0.9 15.9 21 1.7 21 11.3. 0.8 16.0 1.9 7.7 0.8 6.6 0.6 1.3 1.3 7.9 1.7 20 0.5 10.8 20 1 .o 6.9 0.4 23 0.6 8.5 0.8 a 4
- - 0 Average - 14.20 1204 11.66 11.35 lo.% 10.87 10.69 10.32
9.74 9.32 9.18 9.17 9.14 9.10 8.81 8.07 7.71 7.69 7.39 6.93 6.63 6.51 6.47 6.44 6.54 6.79 6.80 6.90 7.02 6.69 6.92 6.54 629 6.27 624 6.10 6.02 6.06
7.86 7.64 7.77
10.06
-
- TLETTHC populdkr sa Dev.
1.07 0.22 0.03 0.16 0.07 0.02 0.06 0.14 0.02 0.19 0.08 0.04 0.02 0.03 0.03 0.18 0.23 0.04 0.04 0.19 0.08 0.12 0.02 0.01 0.04 0.15 0.a 0.03 0.08 0.06 0.01 0.11 0.14 0.03 0.01 0.04 0.05 0.06 0.03
r n ) - 9596 Carl.
lntnnl
0.06 0.03 0.03 0.03 0.02 0.02 0.02 0.02 0.01 0.03 0.02 0.01 0.02 0.03 0.02 0.03 0.03 0.01 0.02 0.02 0.01 0.01 0.02 0.02 0.01 0.02 0.01 0.03 0.01 0.01 0.01 0.01 0.01 0.04 0.01 0.01 0.01 0.01 0.01
60.1 %oftimesp.ntspraying. 1001 - 11:aAM * 0utlier,frmperiodatbegpwmg0fsprying.
90

"
Table C-3. THC Anaiyzer Results from November 3,1992, Third Period of Spraying
November 3.1992 Start End Time Time
1 2 5 1 1255 1255 1259 1259 1304 1304 13:W 1304 1305 1305 1308 1308 1309 13:09 1310 13:lO 13:16 13:16 1319 1319 1323 1323 1326 1326 1329 13:29 1333 1 3 3 1337 1357 13:37 1337 13:40 1340 13:44 1344 1348 13:48 13:s 1353 1355 1355 1401 1401 1402 1402 1407 14~07 14~21
m i s s i i >63PPM M i <63PPM
All Emiss ionc
- uspsed
n l m k!?sB
28 263 273
3 45
231 54 . 9
41 1 151 262 192 1 74 220 21 8
3 184 265 207 336 126 342 78 206 729
2892 1667 4359 -
- - Average - 281.2 28.5
1 W.6 61.9 75.2 28.1
121.8 57.3
leo.1 28.3
177.5 31 .O
192.3 39.4
181.0 01 .O 48.4
190.5 42.4
179.0 38.5
164.6 41.5
195.7 27.4
176.9 35.7
l P 9 -
p- ski. Dm!.
11.0 2 6
88.2 0.6 5.5 6.8
41.2 5.5
80.3 7.0
55.4 6.2
65.6 6.5
67.9 1.2 4.9
80.0 5.5
n.1 4.6
78.4 8.0
68.4 10.4
1) - 6% c o n 1 intsrvd
4.2 0.4
10.5 0.7 1.6 0.9
11.0 3.6 7.8 1.1 6.7 0.9 9.7 0.9 9.0 1.3 0.7 9.7 0.7 8.2 0.8 8.3 1.8 8.0 0.7
- - -0 Av- -
4.92 4.82 4.89 4.70 4.67 4.63
,4.79 4 . n 4.73 4.67 4.67 4.69 4.71 4.75 4 . n 4.91 4.83 4.95 5.09 5.06 5.05 4.52 5.16
4.81 4.81 4.81 -
SM. Dev.
0.04 0.05 0.02 0.03 0.04 0.04
0.04 0.03 0.04 0.03 0.04 0.04 0.04 0.03 0.06 0.04 0.04 0.04 0.03 0.04 0.04 1 .w 0.04
- m - 9596 conf
lntsrvd - 0.01 0.01 0.03 0.01 0.00 0.01
0.00 0.01 0.01 0.00 0.01 0.00 0.00 0.03 0.01 0.00 0.01 0.01 0.01 0.00 0.01 0.20 0.00
91

Nwemt Sbrt Tim.
a42 a45 a48 a53 a54
. a54 a54 a54 a55 8:s a55 a55 8:55 a55 a55 a56 856 a56 a58 8:59 658 9:- 9- 413 415 921 924 g.28 929 929 430 932 9:35 936 936 936 9% 937 937 937 9:43 9:46 9:50 9:50 951 9:-
- 4. 1992 End Tim0
a45 a48 a53 a54 a54 a54 8:54 . a55 a55 E55 a55 E55 a55 a55 a55 a56 a56 8 : s a59 8 : s 9aE 909 413 415 921 924 926 929 929 4s 932 43s 9:s 936 936 9:s 937 9:37 937 943 946 950 450 951 957 la05
- T - Tinw &!s!!a
169 200 317 3 5 P 6
28 3 5 6 4 3
17 15 49 7
120 46 7
502 54
108 33s 21 7 245 33 27 6
155 1% 28 18 4 9 9
15 15 355 174 240
5 75
512 4m
3pe 1291 4520
283
- - - 164.8 41.3
138.4 61.6 65.9 69.6 61.1 65.8 62.1 64.9 81.5 64.7 632 60.0 n.8 58.3 88.3 36.7
1122 58.1
139.3 14.8
167.6 46.7
166.8 39.9
176.0 58.1 68.6 642 55.6
57.8 60.3 61 2 65.0 60.6 66.6 58.5
161.9 42.9
155.3 652 45.0
134.7 37.5
152.6 45.6
lZz0
1m.o
-
PopJlrrOn sa ow.
60.1 6.4
63.3 0.8 2 5 3.6 0.8 21 0.4 0.8 0.8 1 2 0.6 1.3 6.8 22 3.9 6.8
39.4 21
64.7 7.1
672 5.7
99.9 5.3
54.1 2 0 1.7 0.8 3.6
57.1 2 7 26 0.6 1.5 1 .o 25 2 8
68.6 7.4
67.7 1.4 4.3
68.0 4.0
1) - S%canl
1 n b S n r . l
9.0 0.9 7.0 0-9 2 1 1.5 0.7 0.8 0.4 0.7 0.6 1 2 0.7 0.6 3.4 0.6 3.0 * 12
11.4 1 .6 5.6 1.9 7.9 1.1 6.4 0.7 6.8 0.7 0.6 0.6 0.5 8.0 1 .o 1 2 0.6 1 .o 0.6 1.3 1 A 7 2 1.1 8.6 1.3 1 .o 6.9 0.4
- - - 0' A- -
14.68 14.18 13.50 13.02 1299 1298 1293 1288 1287 1285 1284 1283 1283 1286 1280 1275 1270 1248 1227 1221 11.52 10.77 10.39 10.00 9.68 9.38 9.01 8.74
6.61 8.46 8.09 7.66 7.53 7.45 7 .u 7.40 7.36 7.34 7.14 6.88 6.61 6.41 6.39 6.a 5.90
9.69 10.07 9.80
ass
L€rTHC '
poplwkn m. D.V.
0.17 0.12 0.26 0.04 0.02 0.03 0.02 0.03 0.00 0.02 0.01 0.00 0.02 0.03 0.04 0.04 0.02 0.1 1 0.04 0.02 0.36 0.04 021 0.06 0.1 1 0.09 0.13 0.04 0.03 0.02 0.10 0.19 0.05 0.04 0.02 0.03 0.03 0.02 0.02 0.12 0.06 0.13 0.04 0.03 0.09 0.1 1
- m) - 35% conf. lnlmrl
0.03 0.02 0.03 0.04 0.02 0.01 0.02 0.01
0.02 0.01 0.00 0.02 0.01 0.02 0.01 0.02 0.m 0.01 0.01 0.01 0.01 0.03 0.01 0.01 0.01 0.02 0.01 0.01 0.01 0.02 0.03 0.02 0.02 0.02 0.02 0.02 0.01 0.01 0.01 0.01 0.02 0.03 0.01 0.01 0.01
-
71.4 % of Z m spent spraying, a42 - 1 0 s AM - outlier. rrom penod at end of spraying.
92

Table C-5. THC Analyzer Results from November 4,1992, Second Period of Spraying
November 4.1992 Stsrt
Time Time End
' 1012 1020 1020 1024 1024 1024 1024 1028
1028
11:Ol 11:oo 11:oo 1l:oo 11:oo 11:oo 1l:oo 11:oo 10:59 1059 1059 1059 1059 1059 1059 1052 1052 1052 1052 10:51 1051 1038 10:s 1033 1033
* 11:Ol 11:Ol 11:Ol 1l:Ol 1l:Ol 1197 11:07 11:09 1199 11:14 11:14 11:14 11:14 11:14 11:14 11:14 11:14 11:18 11:18 11:18 11:18 11:18 11:18 11:18 11:18 11:18 11:18 11:18 11:18 11:18 11:18 11:18 ll:18 11:18 11:18 ll:19 11:19 11:19 11:19
11:27 11:19 11:19
11:s 11:s 11:38 11:38 11:s 11:s 11:s 11:36 1 1 3 11:31 11:31 11:31 11:31 11:n 11:27 11:n
ll:50 11:50 11:50 11:s
Emissions > 63 PPM Emissions c 63 PPM
Emissions
- Elapssd Time
Lseconds)
501 221 26
259 285 300 752
56 34
393 4 6
38 50 4 5 4 3
31 335 111 322
- 3 5
14 208
4 6 6 3 7 4 6 6 39 13 5
437 16
252 3
308 8
68 7 4
392 18 74 235
13 162
3905 1858 5563
- - Avuage -
19.0 218.1 54.4
217.6 40.4
lS2.0 37.8
138.7 54.9
187.9 60.8 68.6 49.2
124.5 59.7 65.5 62.1 64.2 54.0
177.6 49.7
2128 61.9 63.8 s . 4
186.6 60.8 64.5 61.2 64.4 61 .5 65.6 59.8 64.7 58.3 726 57.6
186.8 50.9
206.6 60.5
235.5 61 .2
107.1 64.1 60.5
203.2 60.2 55.5
194.0 64.6 54.2
193.8 44.4
149.3 -
-ET (R p- std. Dev.
2 8 73.6 5.7
69.4 5.9
62.4 4.8
58.9 3.8
69.3 1.4 3.4 4.8
43.8 1.3 0.7 0.4 1 .o 3.0
725 4.9
81.5 0.4 0.4 21
88.1 1.3 0.4 0.9 1 .o 0.9 1.9 1.8 1.1 1 .5 6.5 29
726 1.4
728 0.5
69.0 0.6
47.9 0.6 1.4
78.6 0.7 21
85.7 1 .o 3.1
- 1) - 6% c o n 1 lntonral
0.3 9.7 22 8.4 0.7 7.1 0.4
15.5 1.3 6.9 1.4 27 1.5
122 1.3 026 0.4 1.2 1.1 7.8 0.9 8.9 0.4 0.4 1.1 9.5 1.3 0.4 0.7 1.1 0.6 1.9 1.4 0.9 0.4 3.6 25 6.8 0.7 9.0 0.6 7.7 0.4
11.4 0.4 1.3 7.8 0.4 0.4
10.9 0.5 0.4
- - "-0 Averalp -
5.36 5.28 5.33 5.31 5.33 5.36 5.30 5.41 5.41 5.41 5.43 5.40 5.40 5.37 5.34 5.36 5.33 5.35 5.36 5.41 5.48 5.67 5.80 5.78 581 5.83 5.86 5.87 5.89 5.83 5.92 5.89 5.88 5.88 5.92 5.95 5.94 6.03 6.06 6-09 6.09 6.17 6.25 6.29 6.35 6.31 6.47 6.46 6.42 6.35 6.34 6.31
5.79 5.53 5.71 -
W T H C populalkn Std Dev.
0.10 0.03 0.03 0.04 0.04 0.04 0.06 0.04 0.03 0.04 0.02 0.02 0.03 0.03 0.03 0.02 0.01 0.01 0.04 0.04 0.05 0.06 0.04 0.01 0.04 0.04 0.01 0.04 0.04 0.01 0.03 0.01 0.02 0.02 0.04 0.04 0.03 0.08 0.03 0.04 0.05 0.06 0.02 0.05 0.01 0.02 0.08 0.03 0.04 0.04 0.02 0.07
m) - 95% conf.
lntsrvel
0.01 0.00 0.01 0.00 0.00 0.00 0.00 0.01 0.01 0.00 0.02 0.02 0.01 0.01 0.03 0.02 0.01 0.01 0.01 0.00 0.01 0.01 0.05 0.01 0.02 0.01 0.01 0.03 0.03 0.01 0.03 0.01 0.01 0.02 0.01 0.02 0.02 0.01 0.01 0.00 0.06 0.01 0.01 0.01 0.01 0.02 0.01 0.01 0.01 0.01 0.01 0.01
70.2 % of time spent spraying, 10:12 - 11:s AM * Outlier. from period at begnning of spraying.
93

I
Table C-6. THC Analyzer Results from November 4,1992. Third Period of Spraying
Nweml SWt Time
1219 1232 1234 1234 1234 1239 1239 1239 1247 1248 1248 1248 1254 1256 1305 1310 1312 1315 1316 1319 13m 1 3 s 1325 1 3 a 13:30 1334 13:s 1334 1338 13:42 1346 1352 1354 1 4 0 0 1 4 0 0 1 4 0 4 1408
- 4.1992
"
W i >63PPM
End Time
1232 1234 1234 1234 1239 1239 1239 1247 1248 1248 12:48 1254 1256 13:05 13:lO 1312 1315 1316 1319 1320 1 325 1325 1 329 1330 1334 1334 1334 1338 1342 1346 ,
1352 1354 1400 1 4 a 1 4 0 4 14- 1415
- Ebpsed
e Z ! a T i
739 123 10 6
285 28 4
476 33 3 4
347 152 518 312 105 177 69
201 38 263 27
218 45 264
6 7
21 1 273 237 347 1 0 3 370
11 254 206 416
3487 2266 5753
- - A w n g r -
11.5 173.3 69.6 54.6
158.9 73.8 60.9 27.1
136.0 64.1 58.3
176.8 37.2 327
204.0 43.3
165.6 472
108.0 55.4
46.6 200.9 m.2
210.2 61.5 64.4 44.3
P l . 3 46.5
1552 462
144.8 528 35.9
218.3 40.0
1820 37.5
125.0
1m.3
-
po(rulrbkn sld Dev.
5.8 57.0 3.1 3.7
66.8 7.8 1 . 2 5.7
42.9 1 .o 2 4
68.1 6.3 3.8
73.9 4.6
60.3 4.3
68.6 2 4
58.9 4.5
69.3 4 2
Is.0 0.7 0.9 5.9
832 7.0 662 6.9
64.6 5.5 3.3
76.7 8.0
1- 696Cont lntwel
0.4 10.1 2 0 3.0 7.8 29 1 . 2 0.5
14.7 1 . 2 23 7 2 1 .o 0.4 8.2 0.9
1 .o 9.5 0.8 7.0 1.7 9 2 1.3 9.0 0.5 0.6 0.8 9.6 0.9 7.0 1.3 6.6 3 2 0.4
10.5 0.8
-
8.9 -
6.10 5.92 5.90 5.87 5.87 5-84 5.87 5.87 5.93 5.91 5.92 6.01 6.13 6.41 6.83 6.97 7.05 7.16 7.24 7.30 7.30 7.35 7.46 7.58 7.72 7.93 7.95 8.07 8.18 827 8.26 828 8.28 8.30 8.39 8.37 8.44
7.30 7.05 7.20 -
W T H C Popurrtion su o w .
0.17 0.04 0.05 0.02 0.04 0.04 0.03 0.04 0.04 0.01 0.04 0.07 0.04 0.14 0.10 0.04 0.04 0.04 0.08 0.04 0.05 0.04 0.07 0.04 0.12 0.02 0.03 0.10 0.06 0.04 0.04 0.04 0.04 0.04 0.08 0.04 0.09
~
m) - 95% conl. lnowvrl
0.01 0.01 0.04 0.01 0.01 0.02 0.03 0.00 0.01 0.01 0.04 0.01 0.01 0.01 0.01 0.01 0.01 0.01 0.01 0.01 0.01 0.01 0.01 0.01 0.02 0.01 0.02 0.01 0.01 0.01 0.00 0.01 0.00 0.02 0.01 0.01 0.01
94

I ame L-/. I HL Analyzer H~SUIIS rrom Novemr 3, IYYZ, w s r r e m or spraymg - NW-I Start Time
a29 a37 a37 a37 a38 a38 a38 8:46 a49 a55 8:55 a55 a56 856 a56 8:58 903 903 903 910 914 914 9:14
-
915 917 923 927 932 9:32 933 9:33 9:33 933 935 942 942 943 943 949 949 950 950 950 950 950 950 950 950 951 951 951 951 951 951 951 951 -
5. 1992 End Time
a37 a37 837 a38 a38 a38 8:46 a49 a55 855 a55 8% a56 8 : s 8:s 903 903 903 910 914 914 914 9:15 917 923 927 932 932 933 933 933 933 935 942 942 943 943 949 9:49 950 950 950 950 950 950 950 950 951 951 951 951 951 951 951 951 952
-
7
Elapsed
k!se?l Tim
467 3 5
26 11 41 440 165 386
5 6
41 3
10 113 309
5 12 398 241 10 7
14 134 391 2n 318
3 28 7 4 9
83 438
6 41 16 373
4 18 13 4 5 4 3 4 3
24 3 5 6 3 3 4 4 20
- -I Aver- - 148.0 61 2 a2 55.7 65.0 51.2
163.8 46.3
154.6 58.7 65.2 52.9 64.0 60.2 48.3
180.1 61.9 652 39.8
58.6 64.8 57.8 432
lU4.6 46.1
163.4 60.9 59.3 64.4 61 2 65.7 45.8
147.7 61 2 72.5 54.7
140.6 60.1 67.9 68.7 61.3 59.8 64.6 58.4 67.1 61.2 67.8 64.3 67.9 59.7 61.5 64.5 60.4 60.7 58.3
1m.1
-
populatkn Std. Dw.
66.1 0.7 0.5 3.6 2 1 6.9
64.6 5.1
77.1 1.5 25 3.7 0.7 1.3 4.4
69.7 0.3 1.4 7.2
76.7 2 1 1.6 3.1 8.6 58.8 5.5
76.1 0.6 2 6 1.3 0.8 2 1 4.6
62.0 1.1 6.3 4.7 72.2 0.5 4.5 2 5 28 1.9 0.5 1.3 0.9 1 2 2 2 1.4 3.0 1.4 0.8 1 .o 1.1 1.4 2.1
35% c o n f Interval -
6.0 0.8 0.4 1.3 1.3 2 1 6.b 0.8 7.7 1.3 2 0 1.1 0.8 0.9 0.8 7.8 0.3 0.8 0.7 9.7 1.3 1 2 1.6 1.4 5.8 0.7 8.4 0.7 1 .o 1 .o 0.8 1.4 1 .o 5.8 0.8 1.9 2 3 7.3 0.5 2 1 1.3 2.7 1.6 0.5 1.4 0.9 1.3 0.9 1.6 2 7 1.2 0.9 1 2 1.1 1.3 1 .o -
- -0 Averaee - 7.41 6.99 6.97 6.98 6.95 6.90 6.73 6.66 6.83 7.03 7.04 7.06 7.12 7.09 7.14 7.24 7.27 7.28 7.25 6.97 6.80 6.87 6.88 6.88 6.75 7.69 9.74 9.75
10.17 10.72 10.94 11.11 10.97 10.89 9.92 9.89
10.09 8.77 7.85 7.81 7.77 7.71 7.67 7.70 7.68 7.64 7.64 7.60 7.59 7.56 7.53 7.50 7.49 7.48 7.47 7.42
U T T H C popllelion S M Dw.
0.30 0.04 0.01 0.02 0.03 0.03 0.08 0.03 0.15 0.02 0.02 0.03 0.02 0.03 0.04 0.05 0.02 0.02 0.07 0.09 0.02 0.02 0.03 0.05 0.04 0.80 0.1 1 0.03 0.24 0.09 0.09 0.11 0.31 0.37 0.02 0.04 0.04 0.69 0.03 0.03 0.04 0.01 0.03 0.01 0.04 0.01 0.01 0.03 0.03 0.04 0.01 0.04 0.03 0.02 0.02 0.04 (Conl
m - 95% conf.
l n t s r v s l
0.03 0.04 0.01 0.01 0.02 0.01 0.01 0.01 0.02 0.02 0.02 0.01 0.02 0.02 0.01 0.01 0.02 0.01 0.01 0.01 0.01 0.02 0.01 0.01 0.01 0.1 1 0.01 0.04 0.09 0-08 0.09 0.07 0.06 0.01 0.02 0.02 0.03 0.07 0.03 0.01 0.03 0.01 0.03 0.01 0.04 0.01 0.01 0.01 0.03 0.03 0.01 0.04 0.03 0.02 0.02 0.02
-
ued)
95

I November5.1902
1 A# Emission
E m i a s i >63PPI Emissions 63 PPI
4 131 23 42
589
3565 1561 5126
- I
58.4 53.6 67.8 58.9 32.8
156.5 47.0
123.1 -
R T H C (Pm POpWOi sa 0.v.
2 1 3.8 3.5 3.0 7.4
1) - ",
l W d
2 1 0.6 1.4 0.9 0.6
- - OlJTuTTHC(Ppm)- A~~ 9 5 9 c c o n f . Pqnuion
SU0.v. Inbnd
7.38
0.03 0.33 6.34 0.02 0.01 7.02 0.01 0.03 7.13 0.01 0.04 7.30 0.03 0.03
7.97 7.49 7.82
69.5 96 of time spent spraying. 829 - la05 AM - outlier. from pwod at end of spraying.
96

Table C-8. THC Analyzer Results from November 5,1992, second Period of Spraying
Nweml Stert rime
1011 1016 10:20 1020 10:20 1020 1023 10:24 1024 1025 10:28 10:s 10:28 10:29 1029 10:s 1035 10:s 10:s 10:s 1042 1048 1052 1052 1052 1054 11:02 1192 11:03 1 1 a 11:13 11:14 11:14 11:14 11:15 ll:15 11:15 11:21 11:21 11:21 1124 11-25 1126 11:33 1 1 :37 11:37 1 1 :37 11:s 11:45 11:45
5, 1992 End Time
1416 1020 1 0:20 1020 10:20 1023 1024 1024 10:25 1028 1028 1028 1029 1029 10:34 10:35 1035 1035 1035 1042 1048 1052 1052 1052 1054 1192 11:02 11:03 11:04 11:13 ,
11:14 11:14 11:14 11:15 11:15 11:15 11:21 11:21 1 1 :21 11:24 11:25 1126 1133 11:37 11:37 11:37 11:s 11:45 11:45 11:49
-
missions <63 PPN All Emissionr
- uapsod
o The
281 258 13 5 5
162 50 5
28 228
4 6
18 4
282 a7 3 3 3
418 326 253
3 8
112 484
5 83 13
570 36 23 18 4 3 25 343
8 3
200 45 42 440 21 1 24 14 82 362
8 251
3123 2207 5330 -
- -I Average -
15.6 1628 69.0 59.7 68.7 325
136.8 60.9 53.8
191.1 61 .l 66.6 55.5 63.7 36.7
1192 59.9 66.2 59.4
1724 38.6
180.9 61.9 68.8 u.3
165.9 59.8 41.2 65.8 32.8
142.6 53.6 93.0 612 '
61 -5 48.2
1923 56.1 64.0 37.6
120.9 51 .8
156.9 322
123.5 97.7 45.4
214.5 71.4 37.5
1727 37.6
116.8
IET THC (p popuwkn .su Dsv.
2.2 67.9 2.2 1.1 3.6 9.7
46.3 0.9 52
58.9 0.4 1.9 4.6 0.7 6.9
53.4 0.3 1.7 1.5
85.9 6.7
'15.1 0.6 20 4.7 72.2 1 2 6.3 2.2 5.9
54.5 4.6
26.0 0.7 0.4 4.6
762 3.0 6.9 5.7 38.8 5.1
79.6 6.3
47.8 24.0 7 2
65.0 6.3 5.8
- 1) - t5%conl Intend
0.3 8.3 1.3 1 .o 3.1 1.5
129 0.8 2 0 7.7 0.4 1.5 2 1 0.7 0.8
11.2 0.3 2 0 1 .7 I2 0.7 9.3 0.7 1.3 0.9 6.4 1 .o 1.3 1.3 0.4
17.8 1.9
11.5 0.6 0.5 1.8 8.0 21 1 .o 0.8
11.4 1 .5 7.4 0.9
19.1 125 1.5 6.7 4.4 0.7
- - - 01 A V W -
5.42 5.20 5.13 5.13 5.11 5.09 5.02 4.98 5.00 4.96 4.93 4.97 4.96 4.94 4.94 4.90 - 4.94 4.94 4.93 4.96 5.02 4.86 " "
4.n 4.75 4 m 4.84 4.m 4.79
4.71 4.69 4.69 4.67 4-67 4.62 4.52 4.52 4.57
4.70
" "
4.43 4.31 4.31 4.31 4.30 4.27 42s 4.18
4.73 4.78 4.76 -
N T T H C popuhbkn ad. Dev.
0.13 0.04 0.02 0.03 0.02 0.04 0.03 0.01 0.04 0.03 0.01 0.04 0.04 0.02 0.05 0.03 0.02 0.03 0.02 0.08 0.04 0.05 .= 0.04 0.04 0.01 0.03 0.04 0.05 0.02 0.03 0.03 0.03 0.02 0.02 0.05 0.02 0.01 0.04 " ..
0.1 1 0.04 0.03 0.04 0.03 0.04 0.02 0.08
- 95% C o n f .
Intenref
0.02 0.01 0.01 0.03 0.02 0.01 0.01 0.01 0.01 0.00 0.01 0.03 0.02 0.02 0.01 0.01 0.03 0.03 0.02 0.01 0.01 0.01
-
" "
0.01 0.00 0.01 0.01 0.02 0.00 0.01 0.01 0.01 0.03 0.02 0.01 0.01 0.02 0.01 0.01 t.
R
0.01 0.01 0.01 0.02 0.01 0.01 0.02 0.01
58.6 Yo of the spent spraying, 1O:ll - 11~49 AM outlier. from period at begnning OI end of spraying.
** Data lost due to flame out of FID in outkt THC analyzer.
97

Table c-9. THC Analyzer HBSU~S from November 5,1992, ThirCl period of spraying
CI
N W d Sta Time
1219 1233 1233 1234 12% 1242 1248 1248 1248 1248 1248 12:a 1248 1253 1253 1254 1255 1255 12s 1255 1256 1257 1257 13a 1306 1311 1312 1313 1317 1333 1334 13:s 1350 1354 1359 1403 1407
-
. . .
m 5.1992 End mme 1233 1233 1234 1238 1242 12:47 1248 12:48 1248 1248 1248 12:48 1253 12s 1254 1254 1255 12:s 1255 1256 1257 1257 13:00 13- 13:ll 13:12 1333 1317 1338 1334 1338 1350 1354 1359 1403 1407 1414
63 PPM
- T ~secondr, 763 6.6 26 135.5 11 53.2 245 188.1 245 25.7 344 1429 4 67.4 9 65.4 5 60.4 4 64.8 4 60.4 9 58.4
307 84.9 8 65.4 60 68.1 4 60.5 4 60.4 6 61.5 10 65.7 68 48.8 38 1412 3 60.1
217 2042 365 40.9 2 7 1 1942 90 48.0 50 1164 247 188.7 58 48.8 114 116.1 225 34.9 723 144.8 252 38.9 292 163.8 m 35.9 262 164.5 370 27.7
3229 151.6 1570 37.8 4799 114.4
!ad. DeV.
3.4 43.5 5.3 71.6 7.4
68.8 3.0 21 1 .I 0.4 0.9 2.2 8.6 24 27 0.8 0.9 0.7 1 .7 4-7
53.6 20
70.7 4.6 629 6 1 43.6 58.4 4.8
56.6 5.5
73.0 15.7 58.6 10.7 55.7 72
’
lntorvsl
0.3 3.34 16.7 3.18 3.1 3.17 0.9 3.13 0.9 3.10 7.2 3.16 3.0 3.16 1.3 3.14 1.3 ,314 0.4 3.16 0.9 3.16 1.4 3.1 5 1 .o 3.1 5 1.7 3.09 0.7 3.08 0.8 ~ 3.06 0.9 3.04 0.5 3.07 1.1 3.07 1.2 3.08 17.5 3.08 21 3.15 9.4 3.06 0.4 3.09 7.5 325 1.1 3.40
121 3-44 72 3.61 1.3 3.72 102 3.98 0.7 4.05 5.4 4.13 20 3.m 6.8 3.88 1,4 3.w 6.7 3.% 0.7 3.89
3.51 3.54 3.56
m Popul.bion sa DW.
0.10 0.04 0.02 0.04 0.03 0.04 0.03 0.02 0.02 0.02 0.04 0.03 0.04 0.02 0.03 0.02 0.02 0.03 0.03 0.03 0.04 0.03 0.03 0.04 0.m 0.04 0.03 0.09 0.03 0.01 0.04 0.07 0.06 0.02 0.01 0.02 0.02
m - @5% conf. lnwvd
0.01 0.01 0.01 0.01 0.00 a00 0.03 0.01 0.02 0.02 0.04 0.02 0.00 0.02 0.01 0.02 0.02 0.02 0.02 0.01 0.01 0.03 0.00 0.00 0.01 0.01 0.01 0.01 0.01 0.00 0.01 0.01 0.01 0.00 0.00 0.00 0.00
98

TECHNICAL REPORT DATA (Pleose reod Insmetions on the reverse before completing)
1. REPORT NO.
EPA-600/R-93-212
Evaluation of the Polyad" FB A i r Purification and November 1993
2. 3. RECIPIENT'S ACCESSIONNO.
4. TITLE AND SUBTITLE 5. REPORT DATE
Solvent Recovery Process for Styrene Removal 6. PERFORMING ORGANIZATION CODE
7. AUTHOR(S) 8. PERFORMING ORGANIZATION REPORT N C
Larry Felix, Randy Merritt, and Ashley Williamson
9. PERFORMING OROANlfATlON NAME AND ADDRESS 10. PROGRAM ELEMENT NO.
Southern Research Institute P.O. Box 55305
68-D2-0062, Task 2 Birmingham, Alabama 35255- 5305 11. CONTRACT/GRANT NO.
12. SPONSORING AGENCY NAME AND ADDRESS 13. TYPE OF REPORT AND PERIOD COVERED
EPA, Office of Research and Development
E PA/600/13 Research Triangle Park, r$ C 27711 ",
A i r and Energy Engineerin Resear& Laboratory Task Final; 4-7 /93
W08.
14. SPONSORING AGENCY CODE
'?e. SUWLEMENTARY NOTES AEERL project officer is Bobby E$ Daniel, Mail Drop 61, 919 1541- . VB'AasTnAcr The report gives results of a study evaluating the Polyad fluidized-bed (FB) process for controlling .styrene emissions at a representative fiberglass shower stall and bath tub manufacturing plant. The process was evaluated using a transport- able unit supplied by Weatherly, Inc. , of Atlanta, GAD responsible for domestic marketing and sale of the process. The evaluation was carried out November 3-5, 1992, at the Eljer Plumbingware facility in Wilson, NC. The Polyad FB process uses beds of macroporous polymer particles .as a regenerable adsorbent to capture styrene emissions. The source tested was a gel coat spray booth exhaust. A side stream from the source was routed to the pilot unit, and inlet and outlet styreme concentrations were measured using Total Hydrocarbon Analyzers (THCs) and carbo adscoption tubes (EPA Method 18). The process demonstrated the capabilities of removing from 94 to 99% of the styrene emissions.
17. KEY WORDS AND DOCUMENT ANALYSIS
a. DESCRIPTORS c. COSATI Field/Croup b.IDENTlFIERS/OPEN ENOED TERMS
Pollution 13 B Pollution Control Styrene Styrene Resins Solvents Hydrocarbons Fluidized Bed Processors
, Stationary Sources Polyad FB Process
0 7 c UI, llJ 1lK
131,07A 18. DISTRIBUTION STATEMENT . 21. NO. OF PAGES 19. SECURITY CLASS (ThisReportj
Unclassified
Unclassified 22. PRICE 20. SECURITY CLASS (Thbpage) Release to Public
10 8
EPA Form 2220-1 (9-73) 99
__

C
" .. ,
L. \


![14a0054gitecai 14a0054gitecai - FB 002 - FB 002 - Bianca - F.to … · 2014. 3. 10. · 14a0054gitecai-14a0054gitecai-3 - FB 002 - $[LayerName] 14a0054gitecai-14a0054gitecai-4 - FB](https://img.pdfslide.net/doc/110x75/6107fd15e3c88255cd2ce596/14a0054gitecai-14a0054gitecai-fb-002-fb-002-bianca-fto-2014-3-10-14a0054gitecai-14a0054gitecai-3.jpg)