Embed Size (px)
Citation preview
Research report
Evaluation of the Six Month Offer: A report on quantitative research findings by Lorna Adams, Katie Oldfield, Laura Godwin and Charlie Taylor
Evaluation of the Six Month O
ffer: A report on quantitative research findingsDW
P Research report no. 699
Published by the Department for Work and PensionsOctober 2010www.dwp.gov.ukResearch report no. 699 ISBN 978-1-84712-854-6
This research explored the implementation and delivery of the four strands of the Six Month Offer (6M0). A survey was undertaken across Great Britain, in March/April 2010, nearly a year after implementation in April 2009, to help understand the impact of these measures on Jobcentre Plus customers. Further information was added from Jobcentre Plus customers who were surveyed about 6MO as part of a Jobseekers Regime Flexible New Deal (JRFND) survey in late 2009.
This is the second in a series of Support for Newly Unemployed (SNU) and 6MO research reports aiming to establish the extent to which SNU and 6MO lead to additional customer employment outcomes.
If you would like to know more about DWP research, please contact: Paul Noakes, Commercial Support and Knowledge Management Team,Work and Welfare Central Analysis Division, 3rd Floor, Caxton House, Tothill Street, London SW1H 9NA.http://research.dwp.gov.uk/asd/asd5/rrs-index.asp
503990_DWP report 699.indd 1 08/10/2010 14:18:51

Department for Work and Pensions
Research Report No 699
Evaluation of the Six Month Offer: A report on quantitative research findingsLorna Adams, Katie Oldfield, Laura Godwin and Charlie Taylor
A report of research carried out by IFF Research Ltd on behalf of the Department for Work and Pensions

© Crown copyright 2010.
You may re-use this information (not including logos) free of charge in any format or medium, under the terms of the Open Government Licence. To view this licence, visit http://www.nationalarchives.gov.uk/doc/open-government-licence/ or write to the Information Policy Team, The National Archives, Kew, London TW9 4DU, or e-mail: [email protected].
This document/publication is also available on our website at: http://research.dwp.gov.uk/asd/asd5/rrs-index.asp
Any enquiries regarding this document/publication should be sent to us at: Department for Work and Pensions, Commercial Support and Knowledge Management Team, Work and Welfare Central Analysis Division, 3rd Floor, Caxton House, Tothill Street, London SW1H 9NA
First Published 2010.
ISBN 978 1 84712 854 6
Views expressed in this report are not necessarily those of the Department for Work and Pensions or any other Government Department.

iii
ContentsAcknowledgements .................................................................................................................................. xi
The Authors ............................................................................................................................................... xii
Abbreviations ........................................................................................................................................... xiii
Summary .....................................................................................................................................................1
1 Introduction .........................................................................................................................................5
1.1 Delivery of the Six Month Offer .............................................................................................5
1.1.1 Extraadviceandguidance......................................................................................5
1.1.2 Volunteering...............................................................................................................6
1.1.3 Workfocusedtraining..............................................................................................6
1.1.4 RecruitmentSubsidy.................................................................................................6
1.1.6 Self-employment.......................................................................................................6
1.2 The evaluation design ............................................................................................................6
1.2.1 Reportscope..............................................................................................................7
1.3 Methodology .............................................................................................................................7
1.3.1 SixMonthOfferStrandSurveyMethodology.......................................................7
1.3.2 JRFNDStage3SurveyMethodology......................................................................8
1.3.3 Conductoffieldwork.................................................................................................9
1.4 Statistical significance and confidence intervals ..............................................................9
1.5 Reporting conventions ...........................................................................................................9
1.6 Report structure .................................................................................................................... 10
2 Awareness and take-up of the Six Month Offer strands .......................................................... 11
2.1 Awareness and take-up of strands .................................................................................. 11
2.2 Reasons for not taking up each strand ........................................................................... 14
2.2.1 Volunteering............................................................................................................ 14
2.2.2 Training..................................................................................................................... 15
2.2.3 Self-marketingvoucher......................................................................................... 17
2.2.4 Self-EmploymentSupport.................................................................................... 18
Contents

iv
2.3 Level of interest in strands not offered ............................................................................ 19
2.4 Summary ................................................................................................................................ 22
3 Volunteering Strand ......................................................................................................................... 23
3.1 Profile of those taking up volunteering ............................................................................ 23
3.2 Nature of volunteering undertaken .................................................................................. 26
3.3 Process of taking up Volunteering Strand ....................................................................... 31
3.4 Whether or not completed volunteering placement ................................................... 37
3.5 Soft outcomes ....................................................................................................................... 39
3.6 Claim status and hard outcomes ...................................................................................... 44
3.6.1 Natureofemploymententered.......................................................................... 46
3.7 Summary ................................................................................................................................ 47
4 Work-focused Training Strand ....................................................................................................... 49
4.1 Profile of those taking up training ..................................................................................... 49
4.1.1 Coursecompletionstatus..................................................................................... 52
4.2 Nature of training undertaken ........................................................................................... 53
4.3 Process of taking up training .............................................................................................. 57
4.4 Soft outcomes ....................................................................................................................... 61
4.5 Claim status and hard outcomes ...................................................................................... 67
4.5.1 Natureofemploymententered.......................................................................... 69
4.6 Summary ................................................................................................................................ 70
5 Recruitment Subsidy Strand ........................................................................................................... 73
5.1 Profile of Recruitment Subsidy customers ...................................................................... 73
5.2 The process of receiving and using the self-marketing voucher................................ 76
5.3 Perceived role of Recruitment Subsidy in securing employment ............................... 80
5.4 Nature of Recruitment Subsidy jobs ................................................................................ 81
5.4.1 Contracttypeandhoursworked......................................................................... 82
5.4.2 Sectortype............................................................................................................... 83
5.4.3 Occupationandjobrole........................................................................................ 85
5.4.4 Salaries..................................................................................................................... 86
Contents

v
5.5 Views of suitability of employment .................................................................................. 87
5.6 Opportunities for progression ............................................................................................ 89
5.7 Claim status and hard outcomes ...................................................................................... 89
5.7.1 Reasonsforleavingemployment....................................................................... 92
5.8 Summary ................................................................................................................................ 93
6 Self-Employment Support Strand ................................................................................................. 95
6.1 Profile of those taking up Self-Employment Support ................................................... 95
6.2 Prior experience of self-employment ............................................................................... 97
6.3 Finding out about Self-Employment Support ...............................................................100
6.4 Nature of support received: external support ..............................................................102
6.4.1 Introductoryself-employmentguides............................................................103
6.4.2 OtherexternalsupportfromBusinessLink.....................................................103
6.4.3 Helpline...................................................................................................................104
6.4.4 Workshops.............................................................................................................105
6.4.5 Enterprisecoaching.............................................................................................106
6.4.6 ExternalsupportinScotland..............................................................................106
6.4.7 Variationinsupportreceivedbyself-employmentexperienceand‘readiness’......................................................................................................107
6.4.8 Usefulnessofexternalsupport..........................................................................108
6.5 Nature of support received: Jobcentre Plus support ...................................................109
6.6 Usefulness of financial support received from Jobcentre Plus .................................111
6.7 Soft outcomes .....................................................................................................................111
6.8 Claim status and hard outcomes ....................................................................................113
6.9 Nature of self-employment .............................................................................................116
6.10 Summary .............................................................................................................................118
7 Outcomes of strand participants ................................................................................................119
8 Conclusions and recommendations ...........................................................................................121
8.1 Promotion/communication of Six Month Offer options .............................................121
8.2 Volunteering Strand ...........................................................................................................122
8.3 Training Strand ....................................................................................................................123
Contents
vi
8.4 Recruitment Subsidy Strand .............................................................................................123
8.5 Self-Employment Strand ...................................................................................................124
Appendix A Six Month Offer Strand survey ...................................................................................125
Appendix B Jobseekers Regime and Flexible New Deal Stage 3 Survey .................................129
List of tables
Table 1.1 Stage 3 – Achieved interviews by phase and age at start of claim according to DWP records ................................................................................................8
Table 3.1 Demographic profile of Volunteering Strand customers ........................................ 24
Table 3.2 Hours worked per week by placement type ............................................................ 29
Table 4.1 Demographic profile of training customers .............................................................. 49
Table 4.2 Length of course, by broad course content ............................................................. 56
Table 5.1 Demographic profile of Recruitment Subsidy customers ..................................... 73
Table 5.2 Sector entered using the Recruitment Subsidy ........................................................ 84
Table 5.3 Sector entered after using Recruitment Subsidy/undertaking JRFND Stage 3 .............................................................................................................................. 84
Table 6.1 Demographic profile of Self-Employment Support customers ............................. 95
Table 6.2 Take-up of external support by self-employment experience ............................107
Table 6.3 Take up of external support by ‘readiness’ for self-employment.......................108
Table 6.4 Usage of funds received from ADF ............................................................................110
Table 6.5 Increase in knowledge of how to become self-employed ..................................113
Table 6.6 Status at time of interview by nature of strand activity ......................................115
Table 6.7 Status at time of interview .........................................................................................115
Table 6.8 Reasons for deciding against self-employment ....................................................116
Table A.1 Response rate by strand ..............................................................................................126
Table A.2 Fieldwork outcomes .....................................................................................................126
Table A.3 Confidence intervals .....................................................................................................127
Table A.4 Evaluation event timetable ........................................................................................128
Table B.1 Stage 3 fieldwork outcomes.......................................................................................129
Table B.2 Achieved interviews by phase and age at start of claim according to DWP records ...................................................................................................................130
Table B.3 Stage 3 weighted customer profile within phase ..................................................131
Contents

vii
List of figures
Figure 2.1 Proportions of customers who were offered and participated in voluntary strands ............................................................................................................ 12
Figure 2.2 Reasons for not taking up volunteering placement ................................................ 15
Figure 2.3 Reasons for not starting training course ................................................................... 16
Figure 2.4 Reasons for not using self-marketing voucher ........................................................ 17
Figure 2.5 Reasons for not taking up Self-Employment Support ............................................ 19
Figure 2.6 Level of interest in strands not offered ...................................................................... 20
Figure 3.1 Intended duration of volunteering placement ........................................................ 27
Figure 3.2 Classification of placement type by sector of placement organisation and whether or not fixed end ...................................................................................... 28
Figure 3.3 Business activity of placement provider .................................................................... 30
Figure 3.4 How customer first heard about volunteering option ............................................ 32
Figure 3.5 Initial feelings about volunteering option ................................................................. 33
Figure 3.6 Reasons for taking up volunteering option ............................................................... 34
Figure 3.7 Views on range and suitability of placements offered by broker ......................... 35
Figure 3.8 Length of time elapsed between being referred to strand and starting placement ........................................................................................................................ 37
Figure 3.9 Whether completed volunteering placement .......................................................... 38
Figure 3.10 Reasons for finishing volunteering option early ....................................................... 39
Figure 3.11 Soft outcomes from volunteering placement .......................................................... 40
Figure 3.12 Impact of volunteering placement on employability ............................................. 41
Figure 3.13 How volunteering option helped to gain employment .......................................... 42
Figure 3.14 Skills increased as a result of volunteering placement .......................................... 43
Figure 3.15 Claim status and hard outcomes ................................................................................ 44
Figure 3.16 Type of work entered for Volunteering Strand customers ..................................... 46
Figure 4.1 Whether customers completed training course ...................................................... 52
Figure 4.2 Nature of the training course undertaken ................................................................ 54
Figure 4.3 Intended length of course ............................................................................................ 55
Figure 4.4 Content of course ........................................................................................................... 57
Figure 4.5 Process of accessing training as part of the 6MO .................................................... 58
Figure 4.6 Initial feelings about training option .......................................................................... 59
Figure 4.7 Reasons for taking up the training option ................................................................. 60
Figure 4.8 Length of time it took to start course and views on this ....................................... 61
Contents
viii
Figure 4.9 How customers have benefited from training ......................................................... 62
Figure 4.10 How Training Strand has helped or may help to find employment ..................... 63
Figure 4.11 Customer views of training course ............................................................................. 64
Figure 4.12 Skills gained as a result of participation in Training Strand ................................... 66
Figure 4.13 Summary of claim status and hard outcomes ........................................................ 67
Figure 4.14 Type of work entered ..................................................................................................... 69
Figure 5.1 Customers’ initial feelings about using the self-marketing voucher and clarity about use of voucher ................................................................................ 76
Figure 5.2 Use of the Recruitment Subsidy .................................................................................. 77
Figure 5.3 Reasons for not mentioning the self-marketing voucher on all CVs/ applications/during all interviews ............................................................................... 78
Figure 5.4 Perceived impact of self-marketing voucher on customers’ approach to applying for jobs ......................................................................................................... 79
Figure 5.5 Perceived role of Recruitment Subsidy in securing employment ......................... 81
Figure 5.6 Contract type employed on after using Recruitment Subsidy .............................. 82
Figure 5.7 Hours worked ................................................................................................................... 83
Figure 5.8 Occupation entered after using the Recruitment Subsidy .................................... 85
Figure 5.9 Annual salaries of those who entered work with an employer after using the Recruitment Subsidy .................................................................................... 86
Figure 5.10 Extent to which customers agree work entered was a good match .................. 87
Figure 5.11 Reasons for taking up unsuitable work ...................................................................... 88
Figure 5.12 Current status and work outcomes ............................................................................ 90
Figure 5.13 Current status and work outcomes of those whose employers received their subsidy at least six months prior to interview ................................ 92
Figure 5.14 Reasons for leaving Subsidy role ................................................................................. 93
Figure 6.1 Self-employment status and previous experience of self-employment ............ 98
Figure 6.2 Initial self-employment plans and level of support needed ................................. 99
Figure 6.3 Initial feelings about Self-Employment Credit and Support ...............................100
Figure 6.4 Reasons for taking up Self-Employment Credit and Support ..............................101
Figure 6.5 Take-up of external support elements .....................................................................103
Figure 6.6 Additional contact with Business Link or equivalent and who initiated contact ............................................................................................................................104
Figure 6.7 Views of helpline ...........................................................................................................105
Figure 6.8 Usefulness of external support in setting up self-employment .........................108
Figure 6.9 Financial support offered and received....................................................................110
Figure 6.10 Usefulness of financial support given in setting up self-employment .............111
Contents

ix
Figure 6.11 Impact of Self-Employment Strand on knowledge, motivation and confidence ......................................................................................................................112
Figure 6.12 Outcomes of Self-Employment Strand ....................................................................114
Figure 6.13 Industry classification of self-employment ............................................................117
Figure 6.14 Annual salary of self-employed ...............................................................................118
Figure 7.1 Employment and other outcomes of participation, by strand ...........................119
Contents
xiAcknowledgements
AcknowledgementsThis research was commissioned by the Department for Work and Pensions (DWP).
The authors would like to thank all customers who participated in the research. Liz Cole, Matt Garlick, Richard Zaluski-Zaluczkowski and Philippa Knott are the member of the DWP project management teams for the evaluations and have been integral to the research design and conduct and we thank them for their guidance. We would also like to thank also Sirinnuj Redden from the DWP for her help in deriving sample datasets.
At Policy Studies Institute (PSI), we would like to thank Genevieve Knight for her guidance on the structure and content of the report.

xii The Authors
The AuthorsLorna Adams, Board Director, leads IFF’s Employment and Benefits sector team. She was the project director responsible for all elements of the study. She specialises in public policy research and has managed a number of evaluations and research projects relating to labour market issues and welfare to work policy. She joined IFF eleven years ago and in that time has worked extensively for a wide range of public sector organisations and Government departments, in particular DWP, GEO, EHRC/EOC, HMRC, HM Treasury, OFT, FSA and the LSC (as was).
Katie Oldfield, Director, co-directed this study and was involved in all aspects of its delivery. She primarily works on large-scale quantitative and qualitative studies on issues around employment, skills and welfare. She also has an interest in researching the impact of employment and skills initiatives and programmes on disadvantaged groups as well as employment practices in relation to equality and diversity issues. She has been at IFF over six years after joining from TNS Social in 2004.
Laura Godwin became Senior Project Manager in 2010 and took over responsibility for the day to day management of the study, and was subsequently involved with the analysis of the survey data and authoring this report. Laura came into the team having had lead roles at IFF in several evaluations of policy designed to remove barriers for low-skilled adults through learning and training. Laura has worked at IFF for five years.
Charlie Taylor was the Research Executive on this study. Charlie joined IFF’s graduate training programme in 2008 and has since then developed an interest in welfare research. Charlie has been involved with a number of quantitative and qualitative studies exploring the experiences and outcomes of benefit claimants.

xiii
AbbreviationsADF Adviser Discretion Fund
AF Adviser Flexibilities
CPCS Construction Plant Competence Scheme
CSCS Construction Skills Certification Scheme
DWP Department for Work and Pensions
ECDL European Computer Driving License
GNVQ General National Vocational Qualification
JRFND Jobseekers Regime and Flexible New Deal
JSA Jobseeker’s Allowance
LSC Learning and Skills Council
ND New Deal
NDLP New Deal for Lone Parents
NDYP New Deal for Young People
NEET Not in Employment Education or Training
PSA Public Service Agreement
PSI Policy Studies Institute
6MO Six Month Offer
SEC Self-Employment Credit
SFA Skills Funding Agency
SIA Security Industry Authority
SNU Support for Newly Unemployed
Abbreviations

1
SummaryThis report presents findings from one part of the evaluation of the Six Month Offer (6MO). As part of their offer everyone reaching six months’ unemployment received extra advisory help from Jobcentre Plus advisers. In addition, customers were given the opportunity to participate in four voluntary strands of activity:
1 volunteering opportunities to improve employability;
2 access to work focused training;
3 a Recruitment Subsidy for employers; and
4 help to become self-employed.
Profile of strand customersTo understand the types of customers participating in each strand of activity, the profile of customers can be compared to the profile of all customers reaching their sixth consecutive month of claiming. This analysis shows the following variations in the demographic profile of customers. For this analysis participation in the Recruitment Subsidy Strand is defined as entering work providing employers with a Recruitment Subsidy.
• Gender: Self-Employment Strand customers were more likely to be male while Volunteering Strand customers were more likely to be female than those in other strands.
• Age: Probably as a result of those in Jobseekers Regime and Flexible New Deal (JRFND) Phase 2 areas entering New Deal for Young People (NDYP) options at the point of six months’ unemployment, those aged 18-24 were under-represented among customers in all strands. This was particularly noticeable for the Self-Employment Strand and Training Strand (6 per cent and 15 per cent are aged 18-24 respectively, compared to 39 per cent of the comparison group at the six-month point of claim). Young customers were more likely to be routed through the Volunteering Strand; one-quarter of those taking up volunteering as part of the 6MO were aged 18-24 (24 per cent). Although under-represented among Recruitment Subsidy beneficiaries as a whole, young customers were more likely to be employed through the Recruitment Subsidy bulk billing route, making up two-fifths of the cases where individuals were placed in this way (40 per cent).
• Ethnicity: Ethnic minority customers were most likely to take up the Volunteering Strand (they comprised 19 per cent of customers, higher than their representation in the six-month customer comparison group – 16 per cent). Lower proportions of ethnic minority customers were accessing the Recruitment Subsidy Strand (making up only 9 per cent of this strand), the Training Strand (14 per cent) and the Self-Employment Strand (14 per cent).
Across all four strands, around three-fifths of customers had claimed Jobseeker’s Allowance (JSA) on at least one occasion prior to the claim they were making when they reached the six-month claim point. Those taking up the Training and Volunteering Strands were most likely to have claimed before (64 per cent and 62 per cent respectively).
The Volunteering Strand customers were most likely to have been claiming continuously for 18 months or more at the time when they took up the strand offer, indicating that this was the option that those further from the job market were most likely to be directed toward.
Summary
2
A higher proportion of Volunteering and Training Strand customers lacked qualifications at Level 2 or above (46 per cent and 53 per cent respectively), compared to the higher skill levels of those taking up the Self-Employment Strand (only around one-third of whom lacked Level 2 qualifications – 35 per cent).
VolunteeringOn average, volunteering placements lasted just over three months, took up 12 hours a week and were provided by either a charity or Government-funded organisation. There was a wide range of placement types: short, full-time placements with private companies at one end of the spectrum and placements requiring just a few hours a week and with no fixed end date at the other.
Customers tended to be satisfied with the process of arranging a placement, with a majority reporting that they had input into the type of placement undertaken, that the placement was suitable and that they found the length of time it took to arrange the placement appropriate.
For many, the volunteering placement was reported to have resulted in increases in skills related to a particular role as well as generic, transferable skills (the latter particularly in the case of younger customers).
TrainingAs part of the Training Strand, customers undertook a variety of courses, ranging from short courses leading towards a certificate or licence necessary to enter an industry e.g. a construction Construction Skills Certification Scheme (CSCS) card or Security Industry Authority (SIA) security licence, to longer courses leading to a recognised qualification. On average courses lasted eight weeks, although for around a quarter the course was completed in under a week.
On the whole customers felt the course they undertook was suited to their needs. However, for some the range of courses on offer was limited and more could have been done to ensure that available courses related to the types of local jobs.
Around half recalled the course involving an element of employment support and/or direct links with employers. This indicated that the emphasis placed on equipping individuals with skills needed by local employers was not always as strong as the policy intention.
Participation in the Training Strand appeared to have positive effects with at least three in five customers reporting increases in confidence, motivation to find work and enthusiasm to undertake further learning in future. Similar proportions reported an increase in skills related to a particular type of job.
Recruitment SubsidyFour -ifths of those who entered work using the Recruitment Subsidy were those using the self-marketing voucher, with those entering work via the bulk billing route accounting for a fifth of Strand customers1.
1 The vast majority of those entering work using the self-marketing voucher in the sampling period would have done so using the older version of the voucher, before a clearer, redesigned version was rolled out in December 2009.
Summary
3
Subsidy recipients stated they were clear about how to use the voucher. Those who were younger or from an ethnic minority were less likely to state this was the case (and they are under-represented among Recruitment Subsidy beneficiaries as a whole).
Most subsidy recipients stated they were more likely to mention the self-marketing voucher at interviews rather than earlier in the process (e.g. on CVs/application forms). In some cases they relied on Jobcentre Plus advisers mentioning the subsidy to potential employers.
Jobs were secured across the economy and the occupational hierarchy, although elementary or operative roles accounted for a third of destinations. Roles entered via the bulk billing route were particularly likely to be at this end of the occupational spectrum.
Voucher recipients were more likely to have secured work on a permanent or open-ended contract. Conversely, bulk subsidy recipients were more likely to have been employed on a temporary or casual basis.
Self-employmentThe Self-Employment Strand attracted individuals with a wide range of starting points; those with no experience to those who had formerly been and were currently self-employed. Just under a third of customers had previous experience of self-employment. A quarter stated that at the point of entry to the strand, they did not have a firm idea of the type of self-employment they would pursue – they simply had a desire to work for themselves.
Beyond the introductory self-employment guides, only small minorities received each of the types of externally-delivered support available. Only 13 per cent attended workshops on specific elements of self-employment and only 7 per cent received one-to-one coaching. These support elements received very positive feedback for their usefulness from users. Overall, one-third received some form of externally delivered support (although in some cases this was simply a helpline).
Customers that received some support from Business Link or the equivalent organisations in Scotland/Wales were asked how well they felt that Jobcentre Plus worked with this organisation to support their self-employment plans. Views were mixed on this issue. Half (49 per cent) of claimants who had contact with Business Link or the national equivalent felt that Jobcentre Plus staff worked well or very well with them to support their needs. However, just over two in five (42 per cent) disagreed and felt they did not work well or at all well together.
Seven in ten (71 per cent) Self-Employment Strand participants had received Self-Employment Credit (SEC) and a fifth had received one-off payments from the Adviser Discretion Fund (ADF). Payments from the ADF appeared to have been used appropriately to fund materials or services to support self-employment.
Outcomes of strand customersThis research reports on the outcomes of customers who started on the four strands of the 6MO between April to December 2009. However, it does not report on the employment additionality of the 6MO. Planned further 6MO research, i.e. impact analysis, may be able to deliver information on employment additionality of the four 6MO strands.
At the time of research fieldwork in March 2010, three-quarters (75 per cent) of Recruitment Subsidy customers were in either full- or part-time employment or self-employed. There was an indication that jobs secured using the Recruitment Subsidy self-marketing voucher had been sustainable, with two-thirds (66 per cent) still working for the same employer at the time of interview (four to
Summary

4
ten months since participating in the offer) and only one-fifth of customers in this strand having returned to claiming JSA.
For the Self-Employment Strand, three-fifths (57 per cent) of customers were in paid work at the time of interview. Most of these (50 per cent of Self-Employment Strand customers overall) reported being self-employed at the time the research was conducted (somewhere between three months and a year after being referred to the strand), rather than working for an employer. This does indicate that the Self-Employment Support (financial and advisory) available through the 6MO is effective in moving individuals into self-employment.
Across the Training and Volunteering Strands, around two-thirds had been claiming JSA continuously up to the point of interview (between three and 12 months after being referred to strand activity). Some of these were still undertaking their training course (9 per cent of Training Strand customers overall) or volunteering placement (30 per cent of Volunteering Strand customers) at the time of interview, and had claimed continuously.
One in 12 customers in each of the Training and Volunteering Strands (8 per cent) had a break from JSA but then returned to claiming. Just under a fifth of customers were in paid work at the time of interview – 19 per cent of Training Strand customers and 16 per cent of Volunteering Strand customers.
Summary
5
1 IntroductionThe Department for Work and Pensions (DWP) commissioned a research consortium, led by the Policy Studies Institute (PSI), to conduct a comprehensive evaluation of the Six Month Offer (6MO)2. This report presents descriptive survey evidence from customers on their experiences of the 4 voluntary strands of activity. It also covers some information taken from a customer survey that forms part of a separate evaluation of the Jobseekers Review and Flexible New Deal (JRFND). This survey involved interviewing customers who had reached six months of continuous claiming and hence, were eligible for the 6MO. A small number of questions were included into this survey relating to awareness and take-up of the 6MO strands.
The 6MO was rolled out nationally in April 2009 in response to the recession.
In order to support delivery of the 6MO everyone reaching six months’ unemployment received extra advisory help from Jobcentre Plus advisers to provide support, encouragement and advice until they got a job or reached 12 months’ unemployment. This extra advisory support (in the form of a one-to-one advisory interview) was mandatory for all customers reaching the six-month point of their claim. Services under the 6MO were voluntary and were available to customers at the adviser’s discretion. These elements consisted of four strands of support:
1 a Recruitment Subsidy for employers;
2 help to become self-employed;
3 access to work-focused training; and
4 volunteering opportunities to improve employability.
Claimants accessed these services via referral from a Jobcentre Plus adviser and the majority of services were delivered by external providers.
The 6MO was developed to last until March 2010, with the original expectation that 500,000 customers would access this support. In December 2009, this was revised to 230,000 customers.
In this chapter we set out the policies underpinning the reforms, provide an overview of the various initiatives and outline the research methods used.
1.1 Delivery of the Six Month Offer
1.1.1 Extra advice and guidanceExtra advisory support from a Jobcentre Plus personal adviser was made available to customers on reaching the 26 week point in their claim. This extra advisory support was mandatory for all customers reaching their six month point of claim. This extra advisory support acted as a gateway to the 6MO3 voluntary strands.
2 The evaluation consortium consists of PSI, IFF Research, PriceWaterhouseCoopers Social, MDRC New York, Professor David Greenberg of UMBC and Professor Jeff Smith of Michigan.
3 In JRFND, extra adviser support is a design feature of the Stage 3 supported job search element, which was rolled out in Phase 1 areas in April 2009. As JRFND did not roll out in Phase 2 areas until April 2010, interim arrangements were in place to deliver similar advisory support (New Deal for Young People (NDYP) still provided some support). These largely mirrored the supported job search requirement of JRFND, with the exception that customers had to undertake mandatory work-related activity and complete an action plan.
Introduction
6
1.1.2 VolunteeringCustomers with an interest in volunteering to develop their work skills were directed to a third sector broker who would find them a suitable volunteering placement, matched to the individual’s job-related interests and skills.
1.1.3 Work focused trainingThe Work-focused Training Strand offered training to JSA customers who would benefit from significant up skilling or reskilling in order to re-enter the local job market. The training was short-term, full- or part-time, and was focused on meeting the individual’s work aspirations and employer demand. The Learning and skills Council (LSC) (as was4) contracted delivery of the Strand to training providers and the Department for Business, Innovation and Skills (BIS) commissioned the LSC to do so (or equivalently the Scottish Government and the Welsh Assembly Government). There were some differences in the support offered in England, Scotland and Wales.
1.1.4 Recruitment SubsidyThe Recruitment Subsidy was a payment to employers for recruiting customers who have been claiming (JSA) for at least six months.5 The subsidy was delivered in two ways:
• via self–marketing: a ‘voucher’ (revised to a ‘claim form’ in December 2009) given to individual customers when they reached six months of unemployment to present to employers at interviews. If the recruitment takes place, the employer submitted the voucher/claim form to Jobcentre Plus and received a £500 payment. If the customer did not return to claim benefit within 26 weeks, the employer received a further £500 payment;
• via bulk billing: the voucher/claim form was given to customers as above, but employers who are account managed nationally or who expected to recruit 12 or more people over a 12-month period received a £1,000 subsidy for every eligible customer they recruit.
1.1.6 Self-employmentCustomers who were interested in self-employment could receive information, advice and practical support on becoming self-employed from specialist providers. These comprised Business Link (in England), Business Gateway/Training for Work (in Scotland) and Flexible Support for Business (in Wales). Customers moving into self-employment could also receive a Self-Employment Credit (SEC) worth £50 per week for the first 16 weeks of trading.
1.2 The evaluation designThe overall aim of this evaluation is to test the extent to which the Six Month Offer voluntary strands lead to additional employment outcomes for individuals and the cost effectiveness with which this is done.
4 The LSC was succeeded by the Young People’s Learning Agency and the Skills Funding Agency in April 2010.
5 The job must be for at least 16 hours per week and be expected to last at least 26 weeks.
Introduction

7
The evaluation programme consists of:
1 A process study, which combines qualitative and quantitative evidence on 6MO to inform the impact analyses. There are:
a early Implementation Site visits;
b depth customer studies;
c a provider study with operational research with specialist providers delivering 6MO; and
d customer surveys: gathering quantitative process study data alongside impact data on outcomes.
2 Quantitative impact analyses.
The evaluation research for the 6MO is being delivered by a consortium of research organisations led by PSI, with PSI conducting the majority of the qualitative work6, and impacts analyses, with IFF Research conducting customer survey research, and PriceWaterhouseCoopers Social conducting provider qualitative fieldwork.
The evaluation research will be reporting with publications until 2012.
1.2.1 Report scope This report focuses on the findings from element d) – the customer surveys which both form part of the process study and provide quantitative data for the impact analyses. This is a survey of 6MO customers in each of the four voluntary strands.
In addition, Chapter 3 of this report includes information from a customer survey conducted as part of a separate evaluation of the JRFND. This particular survey focused on the experiences of jobseekers at a point between 26 and 52 weeks into their claim (and some fast-trackers7), i.e. at a point when they could have chosen to participate in the 6MO strands. Because this survey covered a broad range of customers reaching six months unemployed it was used to collect some information about awareness and take-up of the 6MO strands to complement the core customer survey.
1.3 Methodology
1.3.1 Six Month Offer Strand Survey MethodologyCustomers eligible for the 6MO customer survey started strand activities between April and December 2009. The 6MO strand survey took place between 17 March and 2 April.
For both the Recruitment Subsidy and the Self-Employment Strands, a sample of known starts was sourced from DWP records. For the Volunteering Strand, a sample of those referred to a volunteering broker was sourced from DWP records and customers were screened to check that they had actually taken up a volunteering placement. For the Work-focused Training Strand, a sample of those starting
6 The findings from the qualitative work are published in a separate report: Vegeris, S. etal. (2010). SupportforNewlyUnemployedandSixMonthOfferevaluations:Areportonqualitativeresearchfindings. DWP Research Report No. 691
7 Who had their 26-week restart interview/initial Stage 3 interview before reaching the point of six months of continuous claiming.
Introduction

8
courses funded through the 6MO was sourced from the LSC’s8 Individualised Learner Record (ILR) for England and Wales with a supplementary sample obtained for Scotland from DWP records.
For some sample sources it was necessary to draw all available records for the survey. In the remaining cases, a random sample was drawn.
A total of 1,000 interviews were conducted for each strand (4,000 interviews in total). The only other quota that was set was a quota on interviews by country for the Work-focused Training Strand to ensure that the final sample included a proportionate number of interviews in Scotland given that these were sourced slightly differently to the rest of the sample. Within each strand (or country in the case of the Work-focused Training Strand) a random sample of customers was taken.
The overall response rate for the survey was 83 per cent; this is calculated as a ratio of completed interviews as a percentage of eligible respondents successfully contacted (completes as a per cent of completed interview cases plus instances of refusals). Ninety-six per cent of all customers interviewed agreed to be re-contacted in a year’s time for the longitudinal study.
The data from this survey is presented unweighted9. Customers were sampled randomly from the starting databases, and given equal opportunities to participate, lending validity to the unweighted data. The response rate amongst eligible customers was also high.
1.3.2 JRFND Stage 3 Survey MethodologyJRFND Stage 3 relates to the stage of claiming that typically occurs between six and 12 months of claiming (although under JRFND some customers could be fast-tracked to this stage). Customers eligible for the JRFND Stage 3 customer survey (from which the data in Chapter 3 is taken) were those who had entered Stage 3 of JRFND (or the equivalent point of their claim in areas where JRFND had not been rolled out) in August-September 2009. The Stage 3 JRFND survey took place between 1 and 21 February.
The survey sample was drawn from the population of all eligible customers using a stratified sampling approach (stratified by JRFND phase and age), with customers randomly selected within each stratum. An opt-out exercise was undertaken prior to the survey fieldwork commencing.
A total of 6,006 interviews were achieved (3,003 with JRFND Phase 1 customers and 3,003 with Phase 2 customers) as detailed in Table 1.1. The overall response rate was 80 per cent. Details of fieldwork outcomes can be found in Appendix A.
Table 1.1 Stage 3 – Achieved interviews by phase and age at start of claim according to DWP records
Stage 3 Phase 1 Phase 2 AllUnder 25 1,000 1,002 2,00225–49 1,001 1,000 2,00150 or over 1,002 1,001 2,003All 3,003 3,003 6,006
8 Supplied by the LSC (as was). The LSC was succeeded by the Young People’s Learning Agency and the Skills Funding Agency in April 2010.
9 Population statistics of customers across all strands were not available, meaning it was not possible to construct response weights for the survey.
Introduction

9
Quotas on JRFND phase and age were set to ensure robust findings at the sub-group level (required for the overall JRFND evaluation).
For this survey, data have been weighted to correct for this design bias and to ensure findings are representative of the population of customers in each phase.
1.3.3 Conduct of fieldworkFor both the surveys, a small number of pilot interviews were conducted before the main survey fieldwork to test the questionnaire structure and to ensure that respondents fully understood the nature of the questions being asked.
Telephone interviews were conducted from the IFF on-site computer-assisted telephone interviewing (CATI) centre in central London.
Customers were eligible for interview irrespective of whether they were still claiming JSA at the time of the interview or had ended their claim. Interviews were conducted in the evening and weekend, as well as during normal working hours, to ensure those who had entered work were able to participate.
1.4 Statistical significance and confidence intervalsUnless explicitly stated otherwise, all differences reported are statistically significant at the 95 per cent confidence level. That is to say, there is a 95 per cent probability that the difference reported is real and not the result of sampling error. The confidence intervals for a range of findings are shown in Table A.3.
1.5 Reporting conventions The following conventions are observed throughout this report:
• All references to ‘strand customers’ refer specifically to those starting strand activity between April and December 2009.
• All demographic characteristics are based on information provided by customers during the survey interview and not on information supplied by the DWP.
• ‘PSA 16’ refers to the Public Service Agreement which forms part of the set of 198 national indicators for English local authorities. The agreement, which was implemented in April 2008, focuses on people falling into any of the following four groups and are subsequently at risk of social exclusion:
– care leavers at age 19;
– offenders under probation supervision (recently left prison, on probation or on a community sentence);
– adults receiving secondary mental health services;
– adults with learning disabilities known to councils.
• References to the ‘level’ of training/qualifications refer to levels on the Qualifications and Credit Framework (QCF). ‘Level 2’ refers to credit learning at Level 2 on the QCF.
• Occupational categories used in the report are based on the Standard Occupational Classification (SOC 2000) system. We have used the broadest level, one digit classifications, giving nine categories (1 – managers and senior officials, to 9 – elementary occupations).
Introduction

10
Throughout the report comparisons are made with the cohort of customers interviewed for the JRFND Stage 3 survey10, particularly when looking at employment outcomes. This cohort of customers forms a useful comparison group as they became eligible for 6MO provision around the middle of the sampling period using for the 6MO survey (specifically they are customers who entered Stage 3 of JRFND from Phase 1 areas (or the equivalent period of their claim in Phase 2 areas) between 24 August 2009 and 28 September 2009. However, this cohort only includes flow customers whereas stock customers were included within the sampling frame for the 6MO survey. While this is an imperfect comparison group it is useful to provide an indication of the employment outcomes of a random sample of customers who entered six month’s consecutive claiming (or were fast-tracked to this point of their claim) at a similar time as those who were interviewed for the 6MO survey were offered access to a 6MO option.
All references to ‘Stage 3 customers’ in this report, therefore, refer to customers who entered Stage 3 of JRFND from Phase 1 areas (or the equivalent period of their claim in Phase 2 areas) between 24 August 2009 and 28 September 2009.
1.6 Report structureFollowing this chpater, Chapter 2 reports the levels of awareness and take-up of 6MO options among all customers reaching the six month point of their claim (using data taken from the JRFND evaluation Stage 3 survey).
Chapters 3 to 6 detail customer experiences of each of the four strands. Chapter 3 looks at experiences of the Volunteering Strand, Chapter 4 looks at experiences of the Training Strand, Chapter 5 explores experiences of those entering a job using the Recruitment Subsidy and Chapter 6 covers the Self-Employment Strand. Chapter 7 then goes on to compare the employment and claim status of participants in each the four Strands.
The conclusions and recommendations chapter (Chapter 8) reviews key findings from each chapter and presents recommendations for each Strand.
Appendices A and B detail the sampling and fieldwork outcomes for each of the two studies. Appendices C and D include questionnaires.
10 This is one survey in a series of customer surveys conducted as part of the Evaluation of the JRFND.
Introduction
11
2 Awareness and take-up of the Six Month Offer strandsThis first chapter of findings examines the proportion of customers reaching their sixth month of unemployment who recalled being offered the opportunity to participate in the Six Month Offer (6MO) as well as the proportion who took up that opportunity. The chapter looks at the reasons for deciding against participation among those who declined the opportunity to do so and levels of interest in the four strands among those who were not offered the opportunity to participate.
The data for this chapter is taken from a survey of customers conducted as part of the evaluation of the Jobseekers Regime and Flexible New Deal (JRFND). Those eligible for the survey had claimed for a continuous period of the last six months (with the exception of a small proportion of fast-trackers11). They were interviewed in February 2010 at a point around 12 months after their claim start date about their experiences over the previous six months. These customers reached the six-month point of their claim in August-September 2009, some time after the initial launch of the offer in April 2009. As such, these customers can be considered a representative cohort of flow customers eligible for the 6MO. However, it is worth noting that the JRFND survey did not cover stock customers with longer claims who may also have been offered participation in the 6MO strands.
2.1 Awareness and take-up of strandsJust over three-quarters of customers with a continuous claim of at least six months (78 per cent) recalled being offered at least one of the six month offer strands. This is quite a large proportion and indicates that efforts were made to communicate the offer widely.
The proportion who recalled being offered any of the strands was slightly higher in JRFND Phase 1 areas (83 per cent) than in Phase 2 areas (74 per cent) that were still operating the former Jobseeker’s Allowance (JSA) regime at the time of interview12. This difference could reflect the fact that the 6MO was rolled out alongside JRFND in Phase 1 areas and hence, could be incorporated into the programme of change management that had already been established. In turn this may have made it easier to inform advisers about the content of the 6MO more quickly than in Phase 2 areas (in turn enabling them to begin to communicate the offer to customers earlier). However, there is no direct evidence that we can draw from this research to support this hypothesis.
The proportion of customers (across Phase 1 and 2 areas) who recalled being offered at least one strand was slightly lower among lone parents (70 per cent) and ex-offenders13 (70 per cent). Other than this, all sub-groups of customers were equally as likely to recall being introduced to at least one of the voluntary strands.
11 The survey included a small number of fast-trackers who had their 26-week restart interview/initial Stage 3 interview before reaching the point of six months of continuous claiming.
12 Unless explicitly stated otherwise, all differences reported in this chapter are statistically significant at the 95 per cent confidence level. Please see Section 1.4 for more details.
13 Defined as those who had recently left prison, were on probation or were on a community sentence.
Awareness and take-up of the Six Month Offer strands
12
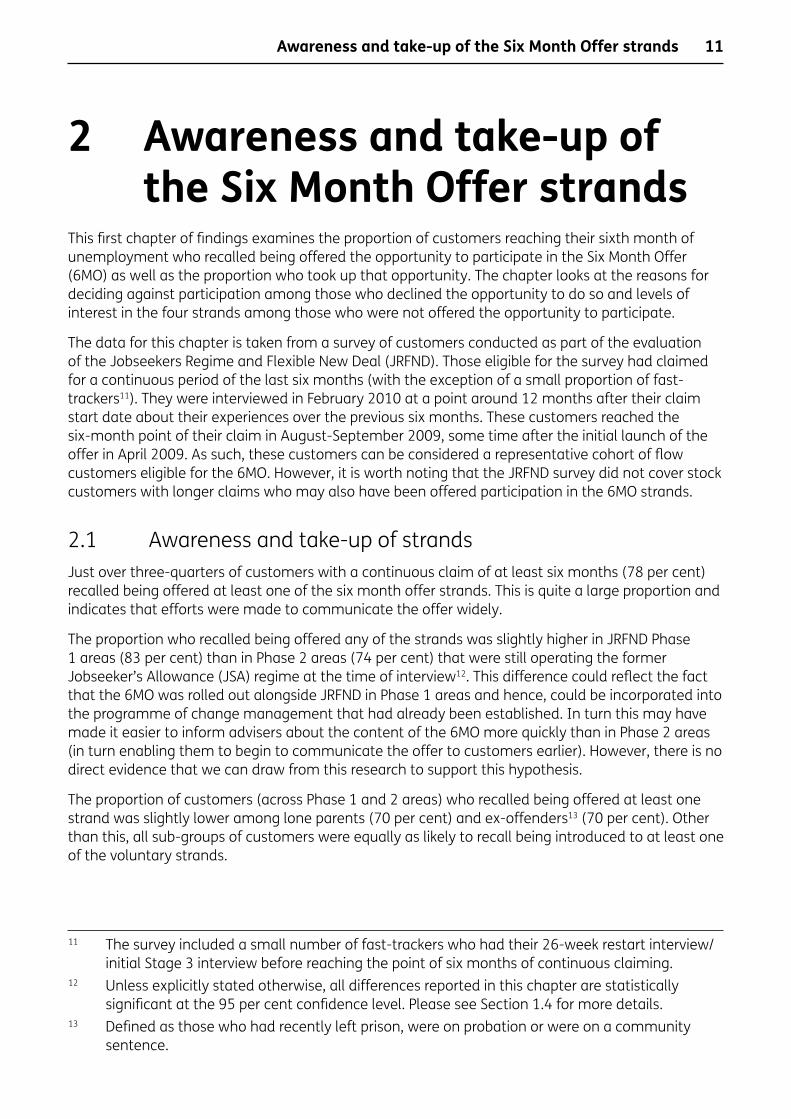
Figure 2.1 shows the proportion of customers who participated in each strand as well as the proportion who were offered it and did not participate. The boxes at the top of each column show the total proportion of customers offered each strand. Note that participation in the Recruitment Subsidy bulk billing route was not assessed in the JRFND Stage 3 survey.
Figure 2.1 Proportions of customers who were offered and participated in voluntary strands
The overall proportion of customers offered the self-marketing voucher was considerably higher than the proportions offered any of the other strands. This indicates that advisers were taking a blanket approach with this particular strand (the correct procedure) while offers of the other three strands were more targeted.
Those offered the self-marketing voucher were slightly more likely to be:
• men (65 per cent compared to 58 per cent of women);
• aged over 25 (68 per cent compared with 55 per cent), perhaps reflecting the fact that in Phase 2 areas 18-24 year olds were not eligible for the Recruitment Subsidy (as the New Deal for Young People (NDYP) subsidy was still operating in those areas);
• from a white British background (65 per cent compared with 54 per cent of those with other ethnic backgrounds).
Awareness and take-up of the Six Month Offer strands
Base: All respondents to JRFND Stage 3 Survey.
Source: H5, H6, H15 and H16.
UnweightedWeighted
* For support type 6MO – Self-marketing voucher, ‘Taken up’ indicates that customers have shown the voucher to potential employers or have used it in job applications.** For support type 6MO – Training course, ‘Taken up’ indicates that customers had actually started a training course.
6MO – Self- marketing voucher*
6,0066,006
Total offered 63 30 30 17
29
34 1925
1211 5 5
6MO – Training course**
6MO – Volunteering placement
6MO – Adviceor support on
setting up own business
Was offered and did not take up Taken up
Perc
enta
ges
13
Overall, a third of customers had made use of the self-marketing voucher (i.e. they told potential employers about the voucher or mentioned it in job applications). This represents just over half (54 per cent) of those who recalled receiving the voucher.
The proportions offered each of the other three strands were lower than for the self-marketing voucher, indicating that advisers were using their judgement to determine who these strands might be appropriate for rather than offering them across the board.
The proportions offered each of the Training and Volunteering Strands were similar (at just under a third of customers) but the proportion taking up a training course was almost twice the proportion embarking on a volunteering placement (36 per cent of all those offered training compared with 17 per cent of those offered volunteering). Additionally, there may have been some people who had accepted the training offer, but were still waiting to start their course at the time of interview.
Customers offered the option of participating in the Training Strand were more likely to be younger (32 per cent of those aged 18-24 compared with 29 per cent of those aged 25-49 and 25 per cent of those aged 50+). Those with no or low qualifications were slightly more likely to be offered training (32 per cent of those without a Level 2 qualification compared with 29 per cent of the summary group with a Level 2 or 3 qualification and 22 per cent of those with Level 4 qualification or above).
There was not a great deal of variation in likelihood to have been offered the Volunteering Strand by customer characteristics, with the exception that those in contact with secondary mental health services were particularly likely to have been offered this strand (41 per cent). Those with lower qualifications were slightly more likely to have been offered volunteering as well (33 per cent of those without a Level 2 qualification compared to 28 per cent qualified above this level). Both are groups that are more likely to contain ‘harder to help’ customers indicating that the Volunteering Strand may be judged as being more appropriate for those further from the labour market.
A relatively small proportion of customers were offered the Self-Employment Strand (17 per cent) and only 5 per cent participated.
Customers particularly likely to have been offered the Self-Employment Strand were:
• men (19 per cent compared with 11 per cent of women);
• aged 25-49 (20 per cent compared with 12 per cent of those aged 18-24 and 18 per cent of those aged 50+);
• highly qualified (22 per cent of those with a Level 4 or 5 qualification, that is, qualified to degree level or above).
Overall just under half of customers (45 per cent) experienced at least one strand of the 6MO (with ‘experience’ of the self-marketing voucher defined as presenting the voucher to potential employers or mentioning it in job applications), a third were offered a strand but did not participate (33 per cent) and 22 per cent were not offered any of the strands.
Not all of those who had made use of the voucher had been successful in securing employment. A total of 6 per cent of customers had made use of the voucher and found paid employment by the time of interview (equivalent to 17 per cent of all those who had used the voucher in job applications). Only a small proportion of these customers stated that gaining work was a result of the self-marketing voucher (1 per cent of all customers). If only those who used the self-marketing voucher and managed to secure paid work are considered as having ‘participated’ in this strand, then the overall proportion of customers participating in any of the 6MO strands falls from 45 per cent to 24 per cent.
Awareness and take-up of the Six Month Offer strands

14
Participation by customers in multiple strands (defining participating in the Recruitment Subsidy Strand as entering work attracting the subsidy) was very low (at 3 per cent). The most common combination of strands experienced was the Volunteering and Training Strands.
The remainder of this chapter focuses on the views of customers who did not take up any of the 6MO strands. More specifically, it considers:
• the reasons for not taking up a particular strand of activity where it was offered; and
• whether customers who were not offered participation in a strand believed they would have been interested in taking up this provision.
2.2 Reasons for not taking up each strand Customers who were told about a 6MO strand but who did not take it up were asked the reasons for this. The reasons for not participating in each of the four voluntary 6MO strands are considered below in turn.
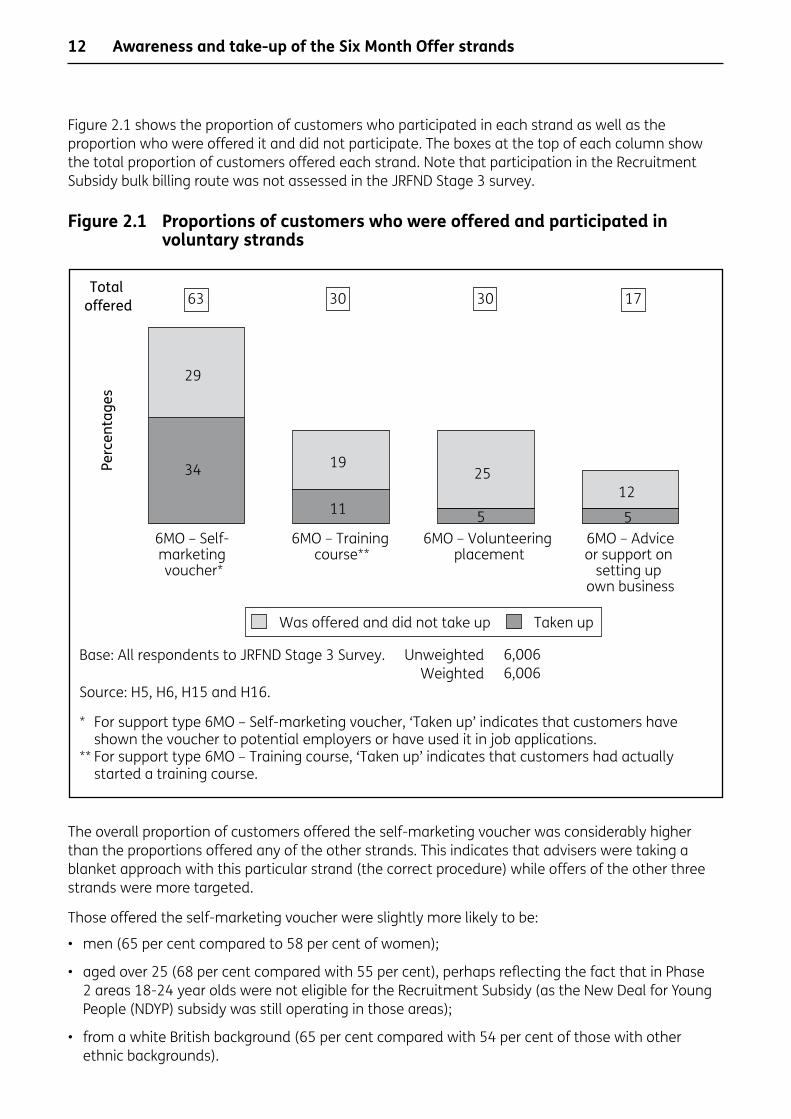
2.2.1 VolunteeringFigure 2.2 illustrates the reasons given by customers for not starting a volunteering role after this opportunity had been mentioned by a Jobcentre Plus adviser. Just over one in ten (11 per cent) of customers were waiting for a particular placement to be set up at the time of the research and 4 per cent were waiting for a placement to be offered to them.
Where customers had decided against taking up this opportunity, it was most commonly because a volunteering placement was simply not of interest or because they were of the opinion that the general offer of voluntary work was not suited to their needs (18 per cent). Customers also reported that a voluntary placement would get in the way of looking for paid work (12 per cent) or that they only wanted work that was paid at this stage (7 per cent). Almost one in ten (9 per cent) had actually found paid work and one in 20 (5 per cent) had started on a training course instead.
There was a suggestion that for a small proportion of customers, the option of a volunteering placement was of interest but there were problems or barriers in pursuing it. A small proportion of customers (6 per cent) reported being unclear on what to do next or how to sort out a placement, and even smaller proportions noted that the broker never got back to them (3 per cent), they had applied for a placement but had not been successful (3 per cent) or had been given no further information after it had been initially mentioned by the Jobcentre Plus adviser (2 per cent). These may be considered process barriers which might be the responsibility of Jobcentre Plus or the broker (as opposed to internal or personal barriers for the customer such as a lack of confidence, personal circumstances or the placement being inconveniently located).
Awareness and take-up of the Six Month Offer strands
15
Figure 2.2 Reasons for not taking up volunteering placement
2.2.2 TrainingFigure 2.3 presents reasons for customers not starting a training course where this option had been mentioned to them. A proportion of customers were interested in taking up this option and were waiting for a course to start or for more information at the time of the research (11 per cent were already enrolled, 5 per cent were waiting for a suitable course to come up and 4 per cent were waiting to hear back after submitting an application).
Awareness and take-up of the Six Month Offer strands
Base: All customers offered volunteering placement but who did not take it up (1,432).Source: JRFND Stage 3 Customer Survey H7.
9
1
18
3
333
4
5
6
6
7
9
11
Other
Lack of confidence
No further information given after initiallymentioned
Already taking part in other voluntary work
12
2
2
Applied for placement but didn't get it
Personal circumstances
Placements too far away
Broker never got back to me
Haven’t been offered a placement yet
Started on a training course
Did not know how to sort out placement orwhat to do next
Did not feel it would improve chances of finding work
Wanted paid workHad found a paid job
Waiting for placement to be set up
Would get in the way of looking for work
Volunteering placement not of interest/suited to needs
Percentages

16
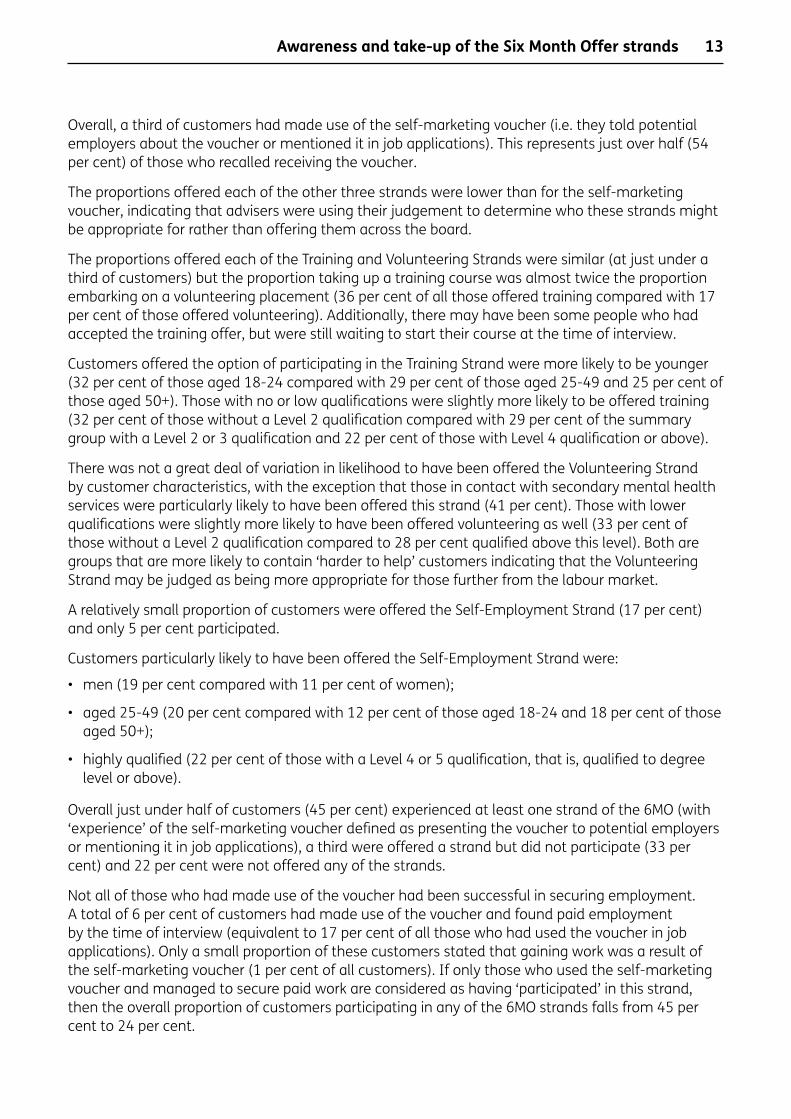
Figure 2.3 Reasons for not starting training course
Just under a fifth (18 per cent) of all customers were not interested in the courses available, with smaller proportions mentioning that they did not feel participating in the course would improve their chances of finding work (8 per cent) or felt that it would get in the way of looking for work (7 per cent). One in ten (10 per cent) had found paid work already.
Relatively small proportions mentioned that the courses available were not suitable in some other way, either because the level was too low (4 per cent), too high (1 per cent) or because funding was not available for the course they were interested in (2 per cent).
Compared with the other strands, smaller proportions of customers reported not being clear on what to do next in order to take up the offer of training (just 2 per cent reported this), suggesting that the referral mechanisms for customers were more straightforward, better understood or better managed for the Training Strand than for the Volunteering or Self-Employment Strand.
Base: All customers offered training course but who did not start a course (1,097).Source: JRFND Stage 3 Customer Survey H11.
Percentages
18
OtherCouldn’t afford the fees
Not possible because of caring responsibilitesHave only just finished a course
Level of courses too highDid not want to go back to college
Colleges too far awayFunding not available for type of course interested in
Did not know how to enrol on course orwhat to do next
Course was full or cancelledFelt too old
Personal circumstancesLevel of courses too low
Had already started another courseStill waiting to hear back about application
Not enrolled but waiting for suitable courseFelt that it would get in the way of looking for work
Did not feel it would improve chances of finding workHad found a paid job
Enrolled and waiting for course to startCourses available not of interest
1110
87
5444
3222222
1111
10
Awareness and take-up of the Six Month Offer strands

17
2.2.3 Self-marketing voucherCustomers who could recall being given a self-marketing voucher but who had not mentioned the Recruitment Subsidy to any employers or on any job applications were asked the reasons for this. Figure 2.4 shows the reasons given in descending order of frequency.
Figure 2.4 Reasons for not using self-marketing voucher
The two most common reasons given were that customers had not yet had a chance to use the voucher (16 per cent) and had not applied for any jobs since receiving it (14 per cent)14. These reasons were particularly likely to be cited by customers aged 50 or over with around a fifth (19 per cent and 21 per cent respectively) mentioning each15.
14 Customers were interviewed six months after they had entered JRFND Stage 3 or had their 26-week restart interview or Initial New Deal Interview. The exact date they were given the voucher is not known.
15 Customers are required to seek work and apply for jobs as a condition of receiving JSA. In this context the proportion of customers stating that they have not applied for any jobs since receiving the voucher could be considered reasonably high.
Base: All customers offered self-marketing voucher but who did not use it on applications or mention it to employers (1,832).Source: JRFND Stage 3 Customer Survey H10.
Percentages
16
Other
Didn’t feel comfortable using it in initial jobapplication phase
No appropriate place to mention it on application form
Employer didn’t ask
Haven’t thought about it
Didn’t get the voucher in time
Wanted to get job on own merits/didn’t want to offer ‘bribe’
Personal circumstances
Not yet received the voucher
Didn’t want potential employers to know unemployedDid not feel comfortable mentioning it to employers
Had already found a job
Wasn’t applicable for type of jobs applied for (e.g. temp)
Forgot about it
Did not know how to sort out placement or whatto do next
Did not feel it would improve chances of finding work
Haven’t applied for any jobs
Haven’t had an interview or chance to use it yet
14
11
9
8
7
6
6
3
2
2
11
1
1
1
1
3
Awareness and take-up of the Six Month Offer strands

18
A number of reasons given related to customers not believing that the voucher would help them secure work; either generally (11 per cent) or due to the specific type of work they were applying for (6 per cent). Types of work that the voucher was not considered applicable for included temporary positions and work gained via an agency.
Almost one in ten (9 per cent) customers did not know how to use the voucher, rising to 13 per cent of all those under 25. This suggests that additional explanation or instruction may have been useful alongside the voucher itself.
Smaller proportions of customers decided not to tell employers about the voucher as they did not feel comfortable doing so (6 per cent) with some saying this was specifically because they did not want employers to know they were unemployed (3 per cent). It would seem that for these customers the perceived stigma of unemployment outweighed any positive role of the voucher in securing them employment. These reasons were more likely to be given by customers educated to degree level or above.
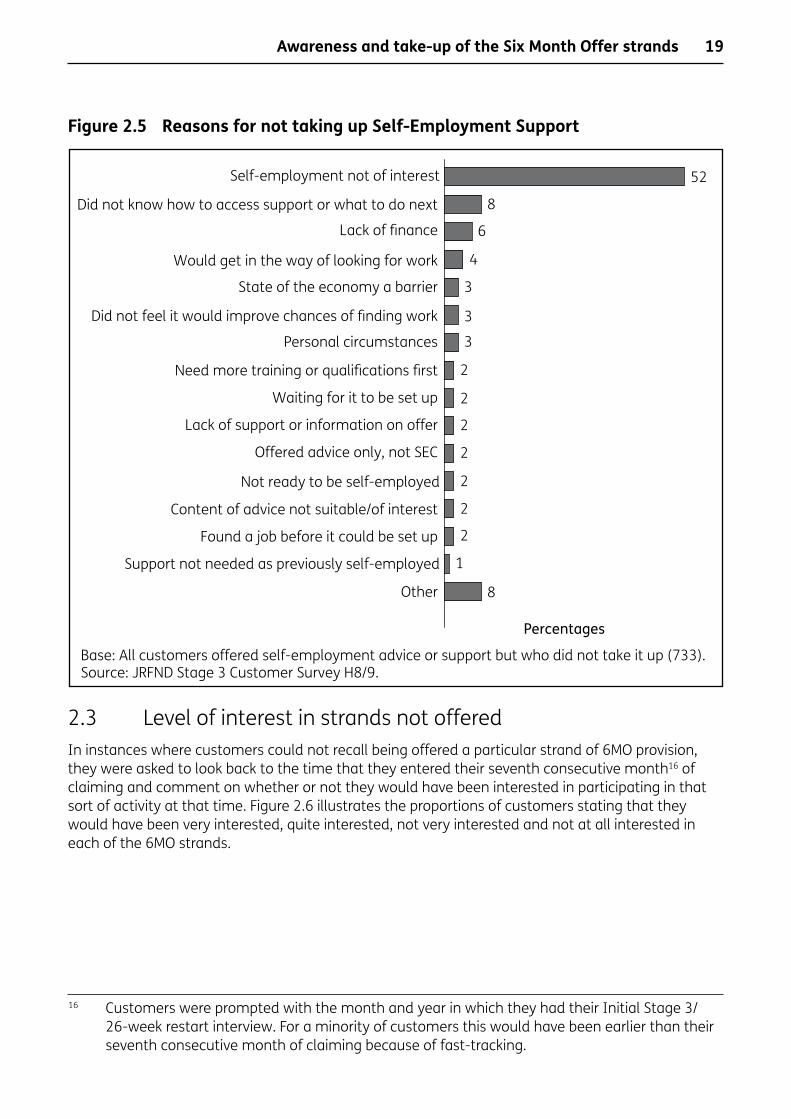
2.2.4 Self-Employment SupportFigure 2.5 shows the reasons given for not participating in the Self-Employment Strand by those customers who recalled being told about the strand (described as ‘adviceorsupportonsettingupyourownbusinessincludingsomefundingforthefirstfewmonths’) but who had not taken up this offer by the time of the research. Over half (52 per cent) of all customers aware of this provision stated that self-employment or setting up their own business was not of interest. Other responses (‘would get in the way of looking for work’ – 4 per cent and ‘would not improve chances of findings work’ – 3 per cent) were closely related to this and indicated that these customers wanted to remain focused on finding work with an employer.
Around one in 12 (8 per cent) customers who had been told about this support said they did not know what to do next or how to access it. This may indicate that in the limited time available to them Jobcentre Plus advisers are only choosing to mention these options very briefly and some customers may benefit from additional detail or support in taking the next step.
Awareness and take-up of the Six Month Offer strands
19
Figure 2.5 Reasons for not taking up Self-Employment Support
2.3 Level of interest in strands not offeredIn instances where customers could not recall being offered a particular strand of 6MO provision, they were asked to look back to the time that they entered their seventh consecutive month16 of claiming and comment on whether or not they would have been interested in participating in that sort of activity at that time. Figure 2.6 illustrates the proportions of customers stating that they would have been very interested, quite interested, not very interested and not at all interested in each of the 6MO strands.
16 Customers were prompted with the month and year in which they had their Initial Stage 3/26-week restart interview. For a minority of customers this would have been earlier than their seventh consecutive month of claiming because of fast-tracking.
Base: All customers offered self-employment advice or support but who did not take it up (733).Source: JRFND Stage 3 Customer Survey H8/9.
Percentages
52
Other
Support not needed as previously self-employed
Found a job before it could be set up
Content of advice not suitable/of interest
Not ready to be self-employed
Offered advice only, not SEC
Lack of support or information on offer
Waiting for it to be set up
Need more training or qualifications first
Personal circumstances
Did not feel it would improve chances of finding work
State of the economy a barrier
Would get in the way of looking for work
Lack of finance
Did not know how to access support or what to do next
Self-employment not of interest
8
6
4
3
3
3
2
2
2
2
2
2
2
1
8
Awareness and take-up of the Six Month Offer strands
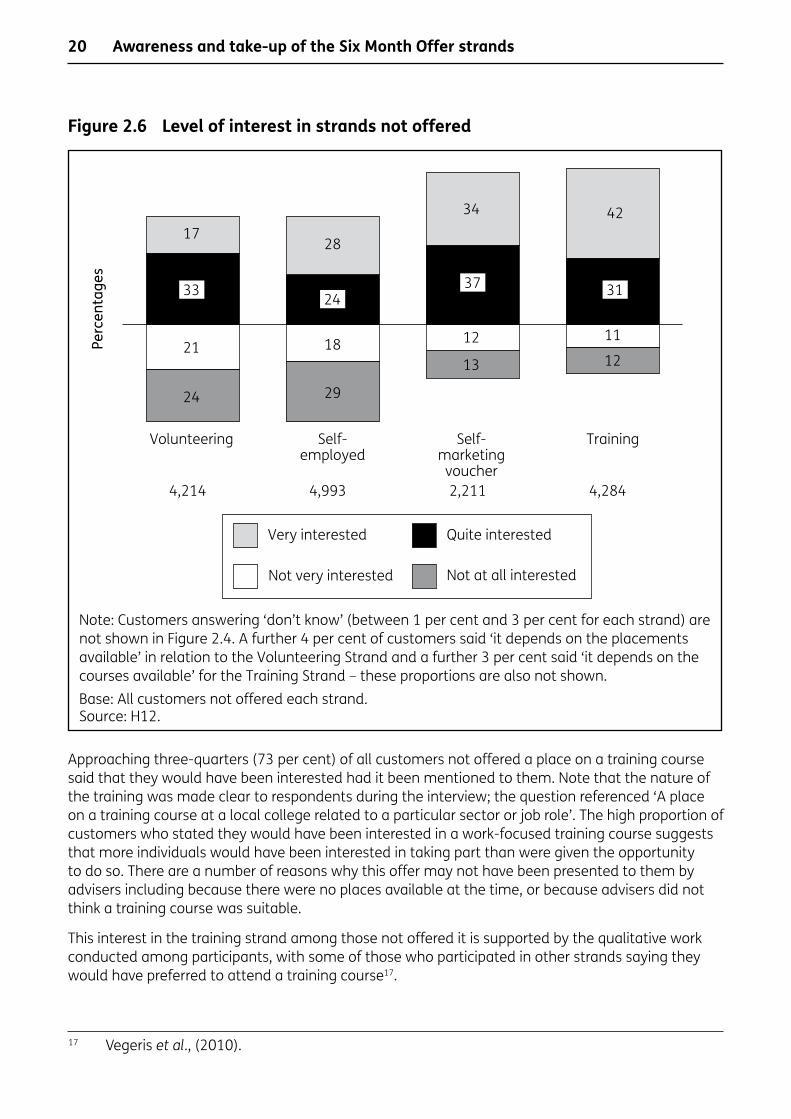
20
Figure 2.6 Level of interest in strands not offered
Approaching three-quarters (73 per cent) of all customers not offered a place on a training course said that they would have been interested had it been mentioned to them. Note that the nature of the training was made clear to respondents during the interview; the question referenced ‘A place on a training course at a local college related to a particular sector or job role’. The high proportion of customers who stated they would have been interested in a work-focused training course suggests that more individuals would have been interested in taking part than were given the opportunity to do so. There are a number of reasons why this offer may not have been presented to them by advisers including because there were no places available at the time, or because advisers did not think a training course was suitable.
This interest in the training strand among those not offered it is supported by the qualitative work conducted among participants, with some of those who participated in other strands saying they would have preferred to attend a training course17.
17 Vegeris etal., (2010).
Base: All customers not offered each strand.Source: H12.
Perc
enta
ges
Volunteering Self-employed
Self-marketingvoucher
Training
4,214 4,993 2,211 4,284
Very interested Quite interested
Not very interested Not at all interested
17
21
24
28
18
29
34
12
13
42
11
12
33 2437 31
Note: Customers answering ‘don’t know’ (between 1 per cent and 3 per cent for each strand) are not shown in Figure 2.4. A further 4 per cent of customers said ‘it depends on the placements available’ in relation to the Volunteering Strand and a further 3 per cent said ‘it depends on the courses available’ for the Training Strand – these proportions are also not shown.
Awareness and take-up of the Six Month Offer strands

21
A similar proportion of those not offered the self-marketing voucher (71 per cent) stated that they would have been interested in receiving it. The offer was put to survey respondents as ‘aself-marketingvouchertoofferemployersoruseonapplicationsthatallowsthemtoclaimaone-offpaymentiftheygiveyouajob’.
Around half of all customers that could not recall being offered advice or support on setting up their own business or the opportunity to take up a volunteering role said they would have been interested in this option (52 per cent and 50 per cent respectively). The self-employed strand offer was described as ‘adviceorsupportonsettingupyourownbusinesspossiblyincludingsomefundingforthefirstfewmonthsifyoumovedoffJSAtobecomeself-employed’and the volunteering offer as ‘theopportunitytotakeavolunteeringrole’.
Customers were polarised in their interest in receiving Self-Employment Support with similar proportions stating that they would have been very interested (28 per cent) and not at all interested (29 per cent).
Almost a fifth (17 per cent) of customers not offered a volunteering placement felt that they would have been very interested in this opportunity had it been mentioned to them. A further third (33 per cent) said they would have been quite interested.
Interest in each of the strands (where they had not been offered previously by a Jobcentre Plus adviser) varied by customer group:
• Customers who would have been ‘very interested’ in taking up the opportunity of a volunteering role had it been offered were more likely to be female (22 per cent of women would have been ‘very interested’, compared with 15 per cent of men), from an ethnic minority (25 per cent ‘very interested’) and lone parents (26 per cent ‘very interested’).
• Customers with no qualifications were less interested in this option, with over a quarter (27 per cent) stating that they were not at all interested. Indeed, customers with degree level or above qualifications were the most likely to express an interest in volunteering. If the Volunteering Strand is designed to provide employment experience for those furthest from the labour market then this finding indicates challenges for Jobcentre Plus advisers in ‘selling’ this option to the customers who are perhaps the intended recipients. While those with higher qualification levels may be easier to place in a volunteering role this may not be the best use of limited placements if these customers already have the necessary skills to find work.
• Male customers (31 per cent), those aged 25-49 (34 per cent), from an ethnic minority (41 per cent), with a child under 16 (38 per cent), customers with a PSA 16 barrier (37 per cent) – particularly those PSA 16 barrier customers who had recently left prison (51 per cent) – and those customers with degree level qualifications (34 per cent) were all more likely than average (28 per cent) to say that they would have been very interested in taking up advice or support in setting up your own business if this had been offered to them at the time of their initial stage 3/26-week restart interview.
• Interest in the self-marketing voucher was slightly higher among customers with a child under 16 (39 per cent very interested compared with average of 34 per cent), customers from an ethnic minority (40 per cent) and customers who had recently left prison (52 per cent). These customers may consider themselves as facing additional barriers to employment and it is possible that they feel the self-marketing voucher would be valuable in helping overcome some of those barriers in a competitive labour market.
Awareness and take-up of the Six Month Offer strands

22
• In line with the patterns described above, over half of all customers from ethnic minorities (55 per cent) and PSA 16 groups (51 per cent) said they would have been very interested in attending a work focused training course if this had been offered to them, indicating an appetite for additional support generally among these customers groups.
• Customers with no qualifications were the least likely to report an interest in the work focused training option (36 per cent very interested). Customers already qualified to Level 2 or 3 were the most likely to show interest in additional learning (46 per cent). This again presents a challenge for advisers in ‘selling’ this strand to those with low skill levels who would be most likely to benefit (although it should be noted that the strand is also intended to offer the opportunity to reskill in a different sector to those with existing qualifications).
2.4 SummaryAmong flow customers eligible for the 6MO (that is those reaching the six-month point of their claim in the period August-September 2009), over three-quarters could recall being offered at least one of the strands of the offer.
Just under half of these customers experienced at least one strand of the offer (where ‘experience’ of the Recruitment Subsidy involved presenting the self-marketing voucher to employers or submitting it with job applications).
Take up of each of the strands varied:
• just over a third of customers had told employers about the Recruitment Subsidy or mentioned it in applications (but just 6 per cent had done this and had found paid work);
• just over one in ten participated in a training course;
• one in 20 took up a volunteering placement;
• one in 20 took up advice or support on becoming self-employed.
A third of customers were offered at least one strand of 6MO activity but did not participate at all. Reasons for declining participation in each strand varied, the most common response was simply that the strand offered was not of interest.
Around three-quarters of customers not offered the self-marketing voucher or the opportunity to take part in a training course said that this option would have been of interest (smaller proportions – around half in both cases – expressed interest in the self-employment and volunteering strands where these had not been offered).
Awareness and take-up of the Six Month Offer strands

23
3 Volunteering StrandThis chapter considers the experiences and outcomes of those customers who participated in the Volunteering Strand. It looks first at the profile of those who participated and compares this with customers generally. It then discusses the nature of the volunteering placement undertaken by customers and describes the process by which customers took up their placement. The chapter concludes by exploring the outcomes of participation on the Volunteering Strand, both in terms of soft outcomes (such as increases in confidence or transferable skills) and hard outcomes such as claim status and employment outcomes.
The data for this chapter (and the remainder of the report) is taken from the Six Moth Offer (6MO) Strand Survey unless otherwise specified.
3.1 Profile of those taking up volunteeringA third (33 per cent) of those who had a broker interview between April and December 2009 had gone on to start a volunteering placement by the time the research fieldwork was conducted in March 201018. Table 3.1 profiles customers in the Volunteering Strand by some key demographics and customer characteristics. This profile is based on the customers that participated in the research and draws on information supplied by customers during the research interview as well as information supplied by the DWP.
18 The sample database supplied by the Department for Work and Pensions (DWP) contained all customers who had spoken to a broker (rather than all those who had started a placement – it was not possible to supply this information). A screening exercise was, therefore, undertaken to identify eligible respondents for the customer survey and for each customer interviewed there were two individuals who confirmed that they had not started a placement. No further data on the reasons for this were collected.
Volunteering Strand
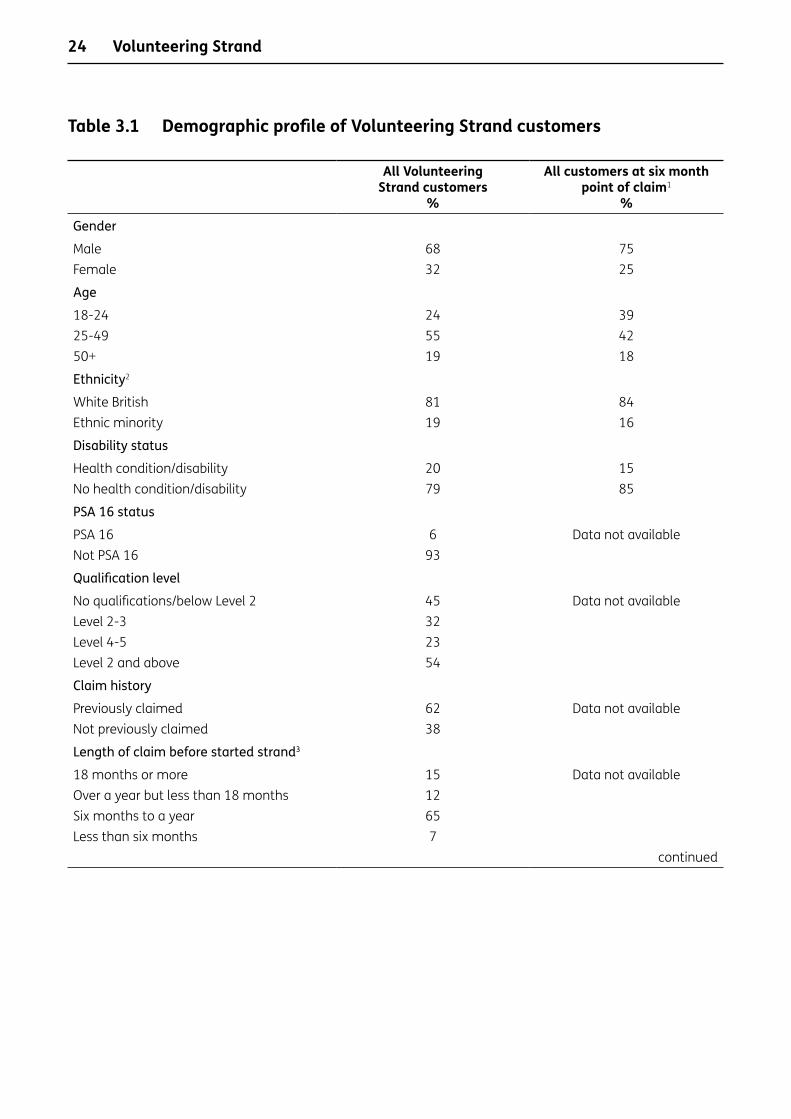
24
Table 3.1 Demographic profile of Volunteering Strand customers
All Volunteering Strand customers
%
All customers at six month point of claim1
%Gender
Male 68 75Female 32 25
Age
18-24 24 3925-49 55 4250+ 19 18
Ethnicity2
White British 81 84Ethnic minority 19 16
Disability status
Health condition/disability 20 15No health condition/disability 79 85
PSA 16 status
PSA 16 6 Data not availableNot PSA 16 93
Qualification level
No qualifications/below Level 2 45 Data not availableLevel 2-3 32Level 4-5 23Level 2 and above 54
Claim history
Previously claimed 62 Data not availableNot previously claimed 38
Length of claim before started strand3
18 months or more 15 Data not availableOver a year but less than 18 months 12Six months to a year 65Less than six months 7
continued
Volunteering Strand

25
Table 3.1 Continued
All Volunteering Strand customers
%
All customers at six month point of claim1
%Month referred to strand
April * Data not availableMay 4June 8July 11August 17September 15October 19November 18December 8
Base 1,001 89,4201 Population figures taken from data supplied by the DWP of all customers having an initial stage 3/26-week
restart/initial New Deal for Young People (NDYP) interview between 24 August 2009 and 28 September 2009.
2 Note that the all ethnicity figures have been re-based to exclude those records where ethnicity is not known (accounting for 1 per cent of the Volunteering strand survey data and 7 per cent of the population data).
3 For Volunteering Strand customers, the date of the broker interview is used as a proxy for the strand start date as it was only possible for the DWP to supply a sample database of those who had attended a broker interview.
In line with the eligible population at this point of claiming, the majority (68 per cent) of Volunteering Strand customers were male. However, women were slightly over-represented in the customer population compared with the entire eligible population (32 per cent compared with 25 per cent).
The age profile of volunteering customers was slightly older19 than customers generally, with just a quarter (24 per cent) under 25 compared with 39 per cent of all customers entering the seventh consecutive month of claiming. This may be in part a result of customers under 25 entering NDYP in many parts of the country at this point of the claim meaning they may have been less likely to be offered a 6MO strand of activity.
A fifth (20 per cent) of Volunteering Strand customers had a health condition or disability compared with just 15 per cent of all customers at a similar stage of claiming. A similar proportion (19 per cent) were customers from an ethnic minority, meaning ethnic minority customers were slightly over-represented on this strand of activity compared with eligible customers generally. In particular, Volunteering Strand participants were more likely to be from black ethnic groups (8 per cent, compared to 5 per cent of all customers at the six month point). This is in line with the finding that customers from ethnic minorities who had not been offered the volunteering option were more likely than average to say that it would have been of interest to them (see Section 3.2).
19 Unless explicitly stated otherwise, all differences reported in this chapter are statistically significant at the 95 per cent confidence level. Please see Section 1.4 in the Introduction for more details.
Volunteering Strand
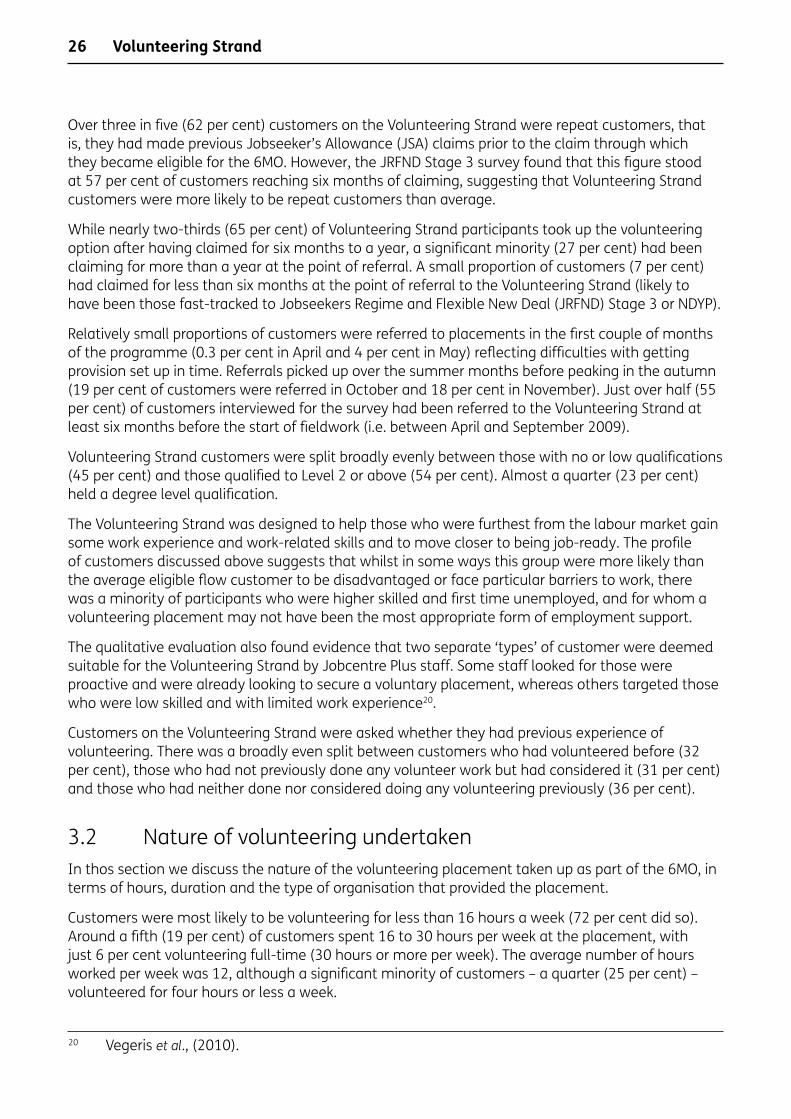
26
Over three in five (62 per cent) customers on the Volunteering Strand were repeat customers, that is, they had made previous Jobseeker’s Allowance (JSA) claims prior to the claim through which they became eligible for the 6MO. However, the JRFND Stage 3 survey found that this figure stood at 57 per cent of customers reaching six months of claiming, suggesting that Volunteering Strand customers were more likely to be repeat customers than average.
While nearly two-thirds (65 per cent) of Volunteering Strand participants took up the volunteering option after having claimed for six months to a year, a significant minority (27 per cent) had been claiming for more than a year at the point of referral. A small proportion of customers (7 per cent) had claimed for less than six months at the point of referral to the Volunteering Strand (likely to have been those fast-tracked to Jobseekers Regime and Flexible New Deal (JRFND) Stage 3 or NDYP).
Relatively small proportions of customers were referred to placements in the first couple of months of the programme (0.3 per cent in April and 4 per cent in May) reflecting difficulties with getting provision set up in time. Referrals picked up over the summer months before peaking in the autumn (19 per cent of customers were referred in October and 18 per cent in November). Just over half (55 per cent) of customers interviewed for the survey had been referred to the Volunteering Strand at least six months before the start of fieldwork (i.e. between April and September 2009).
Volunteering Strand customers were split broadly evenly between those with no or low qualifications (45 per cent) and those qualified to Level 2 or above (54 per cent). Almost a quarter (23 per cent) held a degree level qualification.
The Volunteering Strand was designed to help those who were furthest from the labour market gain some work experience and work-related skills and to move closer to being job-ready. The profile of customers discussed above suggests that whilst in some ways this group were more likely than the average eligible flow customer to be disadvantaged or face particular barriers to work, there was a minority of participants who were higher skilled and first time unemployed, and for whom a volunteering placement may not have been the most appropriate form of employment support.
The qualitative evaluation also found evidence that two separate ‘types’ of customer were deemed suitable for the Volunteering Strand by Jobcentre Plus staff. Some staff looked for those were proactive and were already looking to secure a voluntary placement, whereas others targeted those who were low skilled and with limited work experience20.
Customers on the Volunteering Strand were asked whether they had previous experience of volunteering. There was a broadly even split between customers who had volunteered before (32 per cent), those who had not previously done any volunteer work but had considered it (31 per cent) and those who had neither done nor considered doing any volunteering previously (36 per cent).
3.2 Nature of volunteering undertakenIn thos section we discuss the nature of the volunteering placement taken up as part of the 6MO, in terms of hours, duration and the type of organisation that provided the placement.
Customers were most likely to be volunteering for less than 16 hours a week (72 per cent did so). Around a fifth (19 per cent) of customers spent 16 to 30 hours per week at the placement, with just 6 per cent volunteering full-time (30 hours or more per week). The average number of hours worked per week was 12, although a significant minority of customers – a quarter (25 per cent) – volunteered for four hours or less a week.
20 Vegeris etal., (2010).
Volunteering Strand

27
Customers were asked how long volunteering placements had lasted or were due to last (shown in Figure 3.1). Almost half (47 per cent) of customers took up placements that had no fixed end that they were aware of and were offered on an ongoing basis.
Figure 3.1 Intended duration of volunteering placement
At the other end of the scale a minority of customers undertook very short placements intended to last less than a week (7 per cent), with a similar proportion (6 per cent) on placements that lasted at least a week but less than a month. Where placements did have a fixed end they most commonly were due to last between one and six months; a third (32 per cent) of all customers were on placements with this fixed duration. The mean average number of weeks that a fixed placement lasted for was 14 weeks.
Among those customers who took up a volunteering placement with no fixed end, just over two-thirds (68 per cent) were still attending the placement at the time of the research. Among the third (32 per cent) who had left, attendance had lasted eight weeks on average.
Customers were asked about the type of organisation at which their volunteering placement took place. Three-quarters (75 per cent) of customers were placed with a charity or voluntary organisation. Around one in six (16 per cent) were placed in the private sector, with the remainder (8 per cent) participating in a placement at a government funded organisation. This indicates that there was some engagement with the private sector and that brokers had encountered some success in extending the offer beyond just the charity and public sector to offer some customers a more diverse range of placements.
Those placements offered by private sector companies were more likely to be fixed-term than those offered by Government-funded or third sector organisations. Three-quarters (75 per cent)
Base: All Volunteering Strand participants (1,001).Source: H15 and H16.
Percentages
76
32
4
47
No fixed end
6 months to a year
1-6 months
1-4 weeks
Less than a week
Volunteering Strand

28
of all private sector placements had a fixed end compared with around half of all placements in Government-funded (54 per cent) or third sector organisations (48 per cent). This means that overall one in eight (12 per cent) of all volunteering customers took up a placement in the private sector that was for a fixed duration.
In summary, the nature of the placements undertaken by customers varied greatly in terms of hours worked, intended duration and sector of placement organisation. As well as looking at the overall experiences and outcomes of those on the Volunteering Strand it is also useful to analyse experiences and outcomes by type of placement, to reflect the varied nature of placement types. Figure 3.2 shows a summary of different placement types for the purposes of this analysis.
Figure 3.2 Classification of placement type by sector of placement organisation and whether or not fixed end
Where placements did have a fixed end, there was variation by sector of placement in terms of intended duration:
• Fixed end placements in the public/voluntary sector were more likely to be very short (less than a week) than those in the private sector (15 per cent of all fixed end public or voluntary sector placements were intended to last less than a week compared with 6 per cent in the private sector).
• Correspondingly, private sector fixed end placements were more likely than public or voluntary sector fixed end placements to last one to four weeks (17 per cent compared with 10 per cent).
• However, across both broad sector groupings fixed-term placements typically lasted more than a month but less than six months (61 per cent of fixed-term public/voluntary sector placements and 63 per cent in the private sector).
Volunteering Strand
Base: All Volunteering Strand participants (1,001).Source: H13, H14 and H16.
Percentages
12
40
4
43
Ongoing public or voluntary sector
Ongoing private sector
Fixed end public or voluntary sector
Fixed end private sector
Note: The categories do not sum to 100 per cent as 1 per cent of customers were unable to give an answer for either the type of organisation they did the placement with or the intended length of the placement.

29
There was also some variation in how many hours a week placements lasted (shown in Table 3.2):
• Contrary to all other types of placements, fixed-term private sector placements typically lasted at least 16 hours a week. Over half (55 per cent) were of this length, with one in seven requiring customers to work full-time (30 hours or more). Those working full-time would have limited time each week to seek paid work for the duration of the placement. Given this, these placements would need to be more likely to lead to paid work at the placement organisation (i.e. to be operated like work trials) to ensure that they have an overall beneficial effect on customer’s likelihood to find paid work.
• By contrast, the great majority (86 per cent) of public or voluntary sector placements that were offered on an ongoing basis involved less than 16 hours volunteering per week.
• On balance, fixed-term placements in the public or voluntary sector also most commonly involved less than 16 hours work each week (66 per cent). However, a quarter (25 per cent) were operated on the basis of the customer volunteering for between 16 and 29 hours each week, and a further 7 per cent were full-time (more than 30 hours a week).
Table 3.2 Hours worked per week by placement type
Ongoing public or voluntary sector
placement %
Ongoing private sector placement
%
Fixed end public or voluntary sector
placement %
Fixed end private sector placement
%Less than 16 hours per week 86 73 66 39At least 16 hours but less than 30 hours per week 8 13 25 4030+ hours per week 2 15 7 15Don’t know 4 0 3 6
Base 430 40 400 121
Certain customers groups were more likely to participate in particular types of placement:
• Customers aged 50 or over and those who were educated to degree level or above were more likely than average to participate in ongoing public or voluntary sector placements with over half of all placements among these groups being of this type (53 per cent of all 50+ customers and 51 per cent of all those with a degree level qualification, rising to 54 per cent of all those with a degree and who had never claimed before).
• Likelihood of taking up a fixed end placement in the private sector decreases with age; a fifth (20 per cent) of all younger customers experienced this type of placement compared with one in ten (10 per cent) customers aged 25-49 and just one in 12 (8 per cent) customers aged 50 or over.
• Younger customers were more likely to be offered fixed-term placements, with a greater proportion also taking up a fixed-term placement in the public or voluntary sector than older customers (45 per cent 18-24, 40 per cent 25-49, 34 per cent 50+). There is some suggestion that these fixed-term public or voluntary sector placements were more likely to be targeted at harder to help customers, as those with at least one PSA 16 barrier were more likely than average to take up a placement of this type (53 per cent).
Volunteering Strand
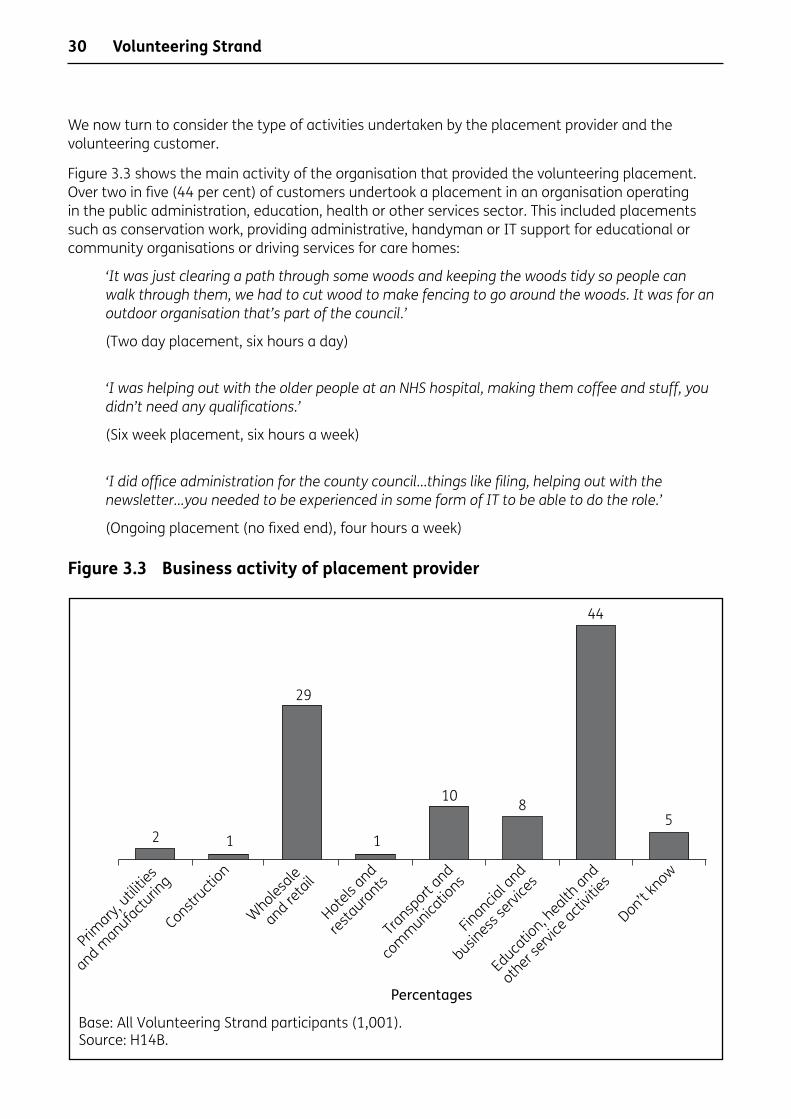
30
We now turn to consider the type of activities undertaken by the placement provider and the volunteering customer.
Figure 3.3 shows the main activity of the organisation that provided the volunteering placement. Over two in five (44 per cent) of customers undertook a placement in an organisation operating in the public administration, education, health or other services sector. This included placements such as conservation work, providing administrative, handyman or IT support for educational or community organisations or driving services for care homes:
‘Itwasjustclearingapaththroughsomewoodsandkeepingthewoodstidysopeoplecanwalkthroughthem,wehadtocutwoodtomakefencingtogoaroundthewoods.Itwasforanoutdoororganisationthat’spartofthecouncil.’
(Two day placement, six hours a day)
‘IwashelpingoutwiththeolderpeopleatanNHShospital,makingthemcoffeeandstuff,youdidn’tneedanyqualifications.’
(Six week placement, six hours a week)
‘Ididofficeadministrationforthecountycouncil…thingslikefiling,helpingoutwiththenewsletter…youneededtobeexperiencedinsomeformofITtobeabletodotherole.’
(Ongoing placement (no fixed end), four hours a week)
Figure 3.3 Business activity of placement provider
Volunteering Strand
Base: All Volunteering Strand participants (1,001).Source: H14B.
Percentages
2 1
29
1
10 8
44
5
Primary,
utilitie
s
and manufactu
ring
Constructi
on
Wholesa
le
and reta
il
Hotels and
restaurants
Transp
ort and
communica
tions
Financia
l and
business
servi
ces
Educatio
n, health
and
other s
ervice
activit
ies
Don’t know

31
Overall, around one in three customers worked in an organisation whose main activity was categorised as wholesale and retail (29 per cent).
A large proportion (78 per cent – representing over a fifth (22 per cent) of all placements) of these were in the charity of voluntary sector (i.e. in almost all cases charity shops), with these placements more likely to be ongoing with no fixed end:
‘ItwasforShelter,workingintheirshop.Iservedcustomers,sortedthroughclothes,washedtheclothesandpricedgoods.’
(Ongoing placement (no fixed end), five hours a week)
Customers who were placed in private companies were most commonly working in the wholesale or retail sector (representing 39 per cent of all private sector placements). These placements typically had a fixed end (79 per cent did compared with an average of 53 per cent) and were presumably operated more like a work trial.
‘Iwasashopassistantfor[private retail store].Iwasrestockingtheshelvesandhelpingcustomersmainly.’
(Two week placement, 30 hours a week)
Much smaller proportions worked for organisations that operated in the transport and communications (10 per cent) and financial/business services sectors (8 per cent). Placements in the manufacturing, construction or hospitality industries were very rare (between 1 per cent and 2 per cent of all placements in each case).
3.3 Process of taking up Volunteering StrandThis section explores experiences of taking up the Volunteering Strand, including how individuals heard about the placement options available to them, their reasons for taking up the offer and their views on the process of arranging and being allocated a placement.
Figure 3.4 shows how customers became aware of the option to undertake a volunteering placement. Around three-quarters (73 per cent) heard about the volunteering option from a Jobcentre Plus adviser. Much smaller proportions heard about the volunteering option from: a charity or voluntary organisation; responding to an advert or proactively enquiring; though a family, friend or other jobseeker; a nextstep or careers adviser; a skills broker or a training; recruitment or work placement company.
Volunteering Strand
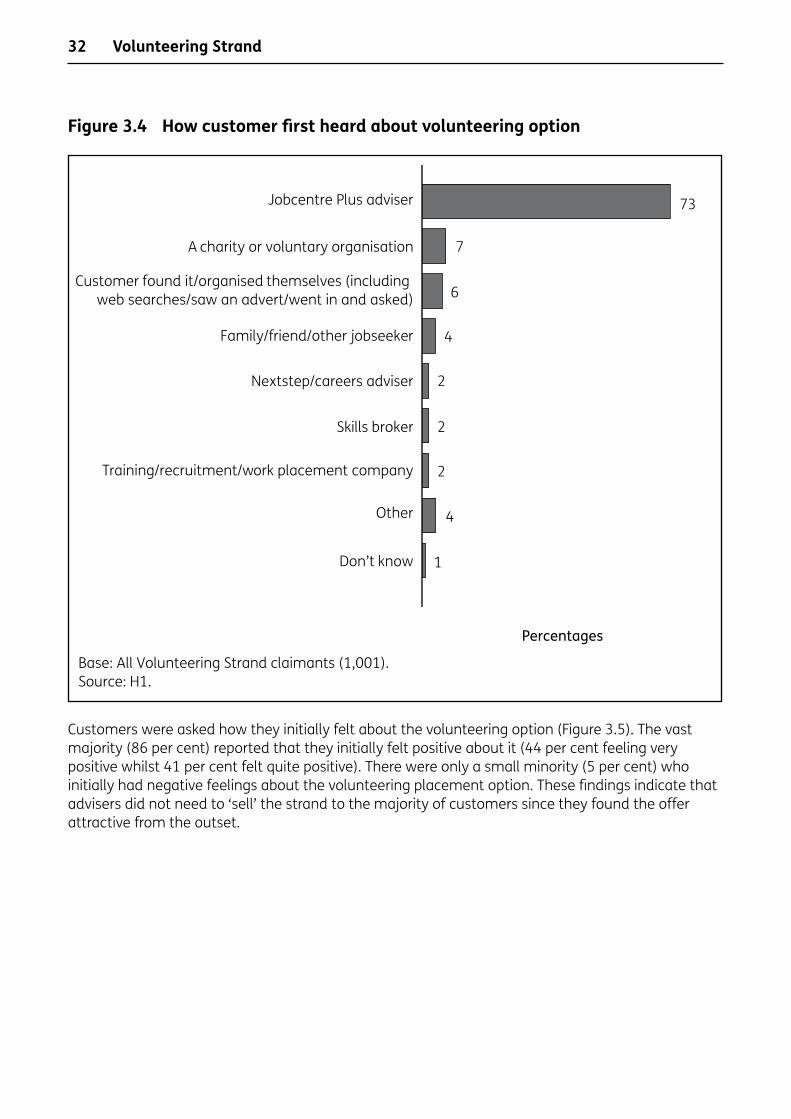
32
Figure 3.4 How customer first heard about volunteering option
Customers were asked how they initially felt about the volunteering option (Figure 3.5). The vast majority (86 per cent) reported that they initially felt positive about it (44 per cent feeling very positive whilst 41 per cent felt quite positive). There were only a small minority (5 per cent) who initially had negative feelings about the volunteering placement option. These findings indicate that advisers did not need to ‘sell’ the strand to the majority of customers since they found the offer attractive from the outset.
Base: All Volunteering Strand claimants (1,001).Source: H1.
73Jobcentre Plus adviser
Percentages
Family/friend/other jobseeker
Customer found it/organised themselves (including web searches/saw an advert/went in and asked)
A charity or voluntary organisation
Other
Skills broker
Training/recruitment/work placement company
Don’t know
Nextstep/careers adviser
7
6
4
2
2
2
4
1
Volunteering Strand

33
Figure 3.5 Initial feelings about volunteering option
Figure 3.6 illustrates the factors that motivated customers to take up the offer of a volunteering placement. Most commonly, they said that they wanted to gain new skills or experience (40 per cent), followed by a third (33 per cent) taking up the volunteering option because they felt it would improve their chances of finding work. It is encouraging that these were the main reasons for participating in the strand given that the primary aim of all strands of the 6MO is to help people to move into employment. These reasons were more likely to given by customers from an ethnic minority (55 per cent and 43 per cent respectively) and, in the case of gaining new skills or experience, female (48 per cent) and younger customers (54 per cent).
Around a quarter (24 per cent) liked the idea of working for a charity or doing something worthwhile. Around one in five (18 per cent) took up the volunteering option in order to keep themselves occupied. One in ten (9 per cent) took up the volunteering option because the Jobcentre Plus adviser said it was a good idea. These motivations were more likely to be expressed by older customers aged 50 or over (30 per cent, 22 per cent and 17 per cent respectively).
Base: All Volunteering Strand participants (1,001).Source: H2.
Percentages 23
41
44
Very positive about it
Quite positive
Quite negative
Very negative about it
Note. ‘Neither positive nor negative’ and ‘don’t know’ responses are not represented on this graph.
Volunteering Strand

34
Figure 3.6 Reasons for taking up volunteering option
It is notable that relatively few customers felt they should take part in the volunteering placement option purely because they could potentially lose their benefits if they did not, with only 7 per cent citing this as their reason for taking up volunteering. It appears that, for the most part, customers were clear that this was a voluntary option.
A variety of other positive reasons were given for taking up the volunteering option, which included customers wanting to improve their CV or get a reference (4 per cent), being interested in what the placement offered (3 per cent), to increase confidence or self-esteem (3 per cent) or to meet people and socialise (3 per cent). The Volunteering Strand seemed to be viewed in a positive way and as a means of gaining new skills and experience, to potentially become more employable and as a way to improve their self-esteem and quality of life.
Once a customer had shown interest in undertaking a volunteering placement, the process required the Jobcentre Plus adviser to arrange for the customer to speak to a broker who discussed the customers’ needs before suggesting and arranging an appropriate placement. Customers provided feedback on this process by agreeing or disagreeing with a range of statements relating to the suitability of the placement (Figure 3.7).
Base: All Volunteering Strand claimants (1,001).Source: H4.
40
Other
Placement was nearby/convenient
Meet people/socialise
Increased my confidence/self-esteem
Enjoyed/interested in what the placement offered
Improve my CV/get a reference
Hoped that it would lead to a paid role atthe same organisation
Jobcentre Plus adviser or broker said it was a good idea
Keep myself occupied
Liked the idea of working for a charity/doingsomething worthwhile
Felt that it would improve changes of finding work
Wanted to gain new skills or experience
Percentages
Thought had to do it or might lose benefit
33
24
18
9
7
5
4
3
3
3
2
5
Volunteering Strand

35
Figure 3.7 Views on range and suitability of placements offered by broker
Feedback in this area was largely positive with at least three-quarters of customers in each case agreeing that:
• the organisation let them have input into the type of placement that they undertook (54 per cent strongly agreed and 24 per cent slightly agreed);
• the location of the placement suited them (67 per cent strongly, 17 per cent slightly);
• the placement suggested by the broker was suitable for both the type of work they were interested in (58 per cent strongly, 21 per cent slightly) and their level of experience and skills (53 per cent strongly, 22 per cent slightly).
It was less common for customers to agree that the broker was able to provide a range of different placement options. However, many did agree, 63 per cent, comprimising 38 per cent strongly and 25 per cent slightly. This suggests that problems with a limited range or unsuitable placements were only experienced by a minority of customers.
Base: All Volunteering Strand participants (1,001).Source: H10.
Let you have input into thetype of placement you want
Percentages
Total percentage agree
54
38
67
58
53
24
25
17
21
22
6
6
78
7
4 4
11 11
4
Had a range of differentplacement options on offer
Suggest a placement witha location that suited you
Suggested a placement thatwas suitable for the typeof work you are interested in
Suggested a placement thatwas suitable for your experience and skill
Strongly disagree Slightly disagree Slightly agree Strongly agree
79
63
84
79
75
Volunteering Strand
36
There was some suggestion that customers with children were less satisfied with the nature of the placement offered. Such customers were more likely than those without children to disagree that: the placement was suited to their skills and interests (23 per cent); was suited to the type of work they were interested in (17 per cent); there was a range of placement options available (28 per cent) and that they were able to input into the type of placement they got (15 per cent). These customers may require additional flexibility in terms of the hours and location of any volunteering placement to allow them to accommodate childcare commitments and it would seem that brokers were not yet fully meeting their needs in terms of the range and quantity of placements available.
However, overall these findings indicate that brokers tended to provide placements flexibly which were local and tailored or suited to an individual’s needs.
Figure 3.8 illustrates the length of time it took for the volunteering placement to start after customers had been referred to the strand. The left hand bar graph on Figure 3.8 shows the time elapsed between the original referral by Jobcentre Plus and when the customer first spoke to the broker to arrange the placement. The right hand bar graph shows the time elapsed between speaking to the broker and the placement actually starting.
Almost six in ten (59 per cent) customers spoke to the broker within a week of the Jobcentre Plus referral, and a further fifth (20 per cent) did so within one to two weeks. After they had spoken to the broker over three-quarters (78 per cent) had started the placement within a month, with the average time to start being 2.6 weeks.
The majority of customers started their voluntary placement within 6sixweeks of signalling interest. Given the need to speak to the broker and for the broker to then source a suitable placement, this seems a reasonable timeframe.
For a minority referral and arrangement of a placement took longer. Around one in seven (14 per cent) reported that it took three weeks or more to speak to a broker after the Jobcentre Plus adviser first mentioned the option of volunteering, and a similar proportion (15 per cent) needed to wait a month or more after speaking to the broker for the placement to start.
Those who had to wait a month or more after speaking to the broker to start the placements were more likely to be from an ethnic minority; almost a quarter (23 per cent) of ethnic minority customers had to wait at least a month for a placement. Ethnic minority customers were also more likely than average (19 per cent compared with 14 per cent) to report having to wait at least three weeks to speak to a broker after being referred by Jobcentre Plus.
For the majority (80 per cent) the length of time between the referral by Jobcentre Plus and actually starting the placement was seen as about right, whilst around one in ten (11 per cent) felt that it was too long. One in 25 (4 per cent) felt it was actually too quick.
Of those who said it took too long to start the placement after the initial referral, the average length of time between the broker interview and the placement starting was 6.3 weeks (compared with an overall average of 2.6 weeks and an average of 2.0 weeks for those who considered the waiting time to be ‘about right’).
Volunteering Strand
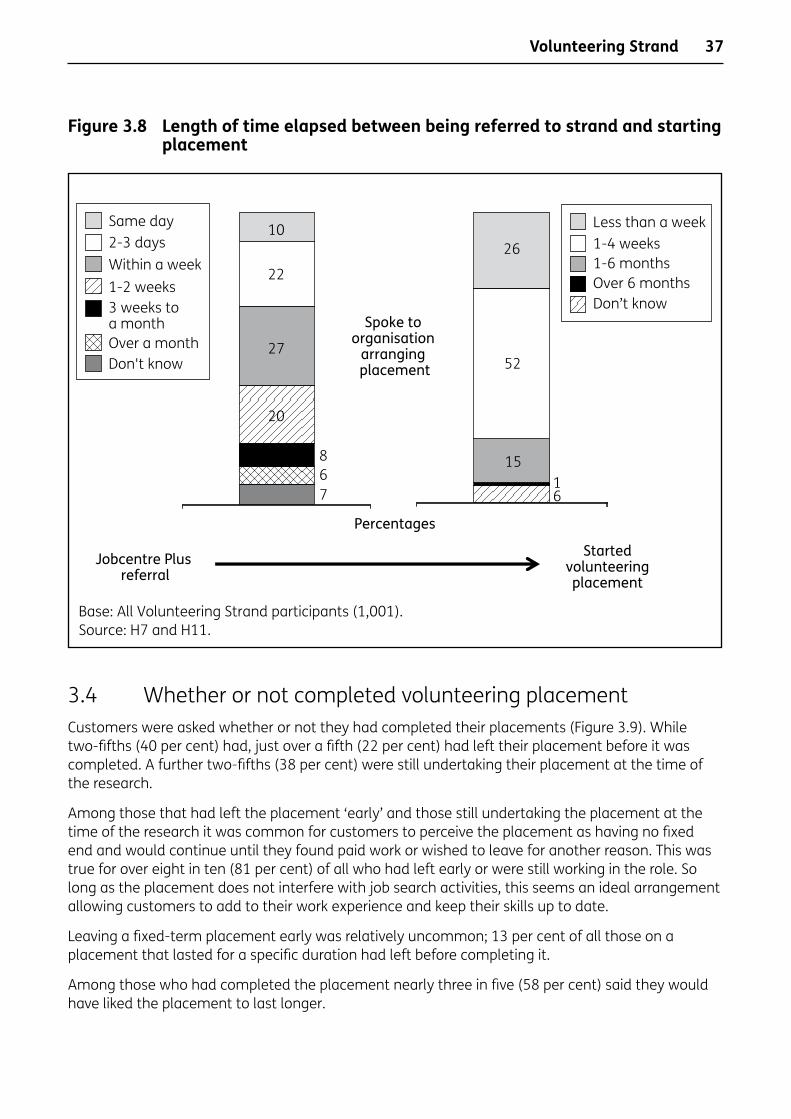
37
Figure 3.8 Length of time elapsed between being referred to strand and starting placement
3.4 Whether or not completed volunteering placementCustomers were asked whether or not they had completed their placements (Figure 3.9). While two-fifths (40 per cent) had, just over a fifth (22 per cent) had left their placement before it was completed. A further two-fifths (38 per cent) were still undertaking their placement at the time of the research.
Among those that had left the placement ‘early’ and those still undertaking the placement at the time of the research it was common for customers to perceive the placement as having no fixed end and would continue until they found paid work or wished to leave for another reason. This was true for over eight in ten (81 per cent) of all who had left early or were still working in the role. So long as the placement does not interfere with job search activities, this seems an ideal arrangement allowing customers to add to their work experience and keep their skills up to date.
Leaving a fixed-term placement early was relatively uncommon; 13 per cent of all those on a placement that lasted for a specific duration had left before completing it.
Among those who had completed the placement nearly three in five (58 per cent) said they would have liked the placement to last longer.
Percentages
Same day2-3 daysWithin a week1-2 weeks3 weeks to a month Over a monthDon't know
Base: All Volunteering Strand participants (1,001).Source: H7 and H11.
Less than a week1-4 weeks1-6 monthsOver 6 monthsDon’t know
Spoke to organisation
arranging placement
Jobcentre Plus referral
Startedvolunteeringplacement
22
27
20
867
26
52
1516
10
Volunteering Strand
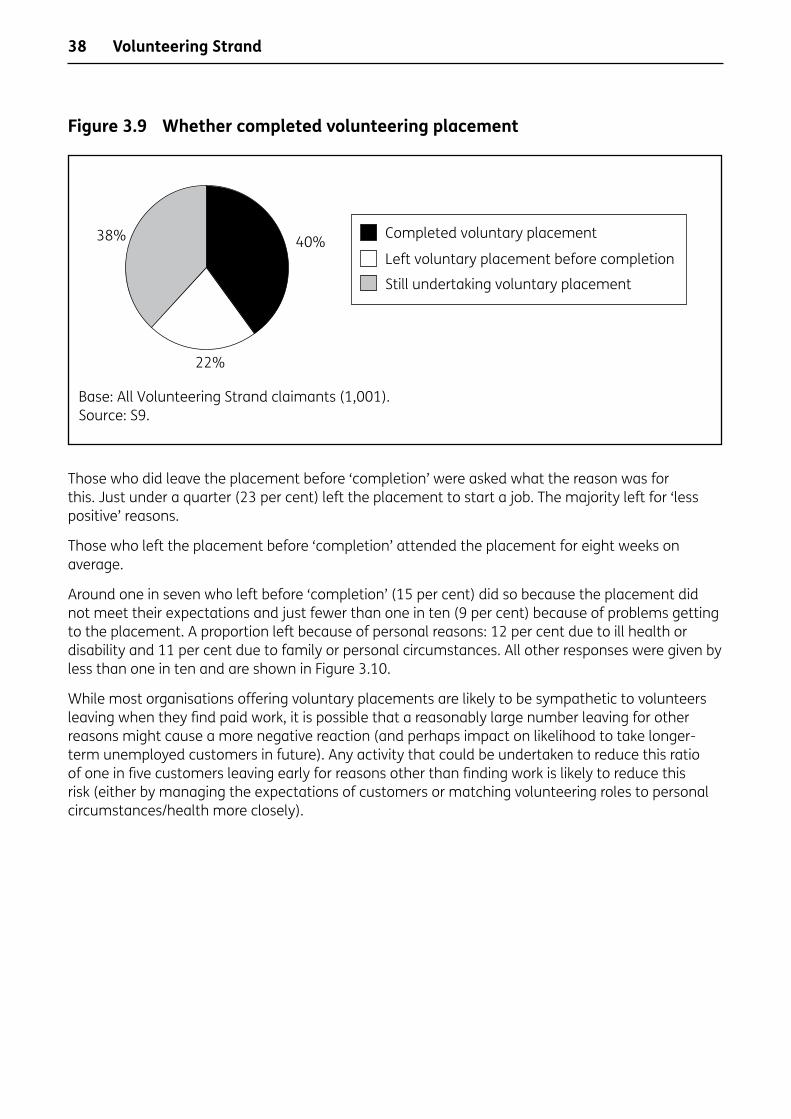
38
Figure 3.9 Whether completed volunteering placement
Those who did leave the placement before ‘completion’ were asked what the reason was for this. Just under a quarter (23 per cent) left the placement to start a job. The majority left for ‘less positive’ reasons.
Those who left the placement before ‘completion’ attended the placement for eight weeks on average.
Around one in seven who left before ‘completion’ (15 per cent) did so because the placement did not meet their expectations and just fewer than one in ten (9 per cent) because of problems getting to the placement. A proportion left because of personal reasons: 12 per cent due to ill health or disability and 11 per cent due to family or personal circumstances. All other responses were given by less than one in ten and are shown in Figure 3.10.
While most organisations offering voluntary placements are likely to be sympathetic to volunteers leaving when they find paid work, it is possible that a reasonably large number leaving for other reasons might cause a more negative reaction (and perhaps impact on likelihood to take longer-term unemployed customers in future). Any activity that could be undertaken to reduce this ratio of one in five customers leaving early for reasons other than finding work is likely to reduce this risk (either by managing the expectations of customers or matching volunteering roles to personal circumstances/health more closely).
Volunteering Strand
Base: All Volunteering Strand claimants (1,001).Source: S9.
40%
22%
38% Completed voluntary placement
Left voluntary placement before completion
Still undertaking voluntary placement
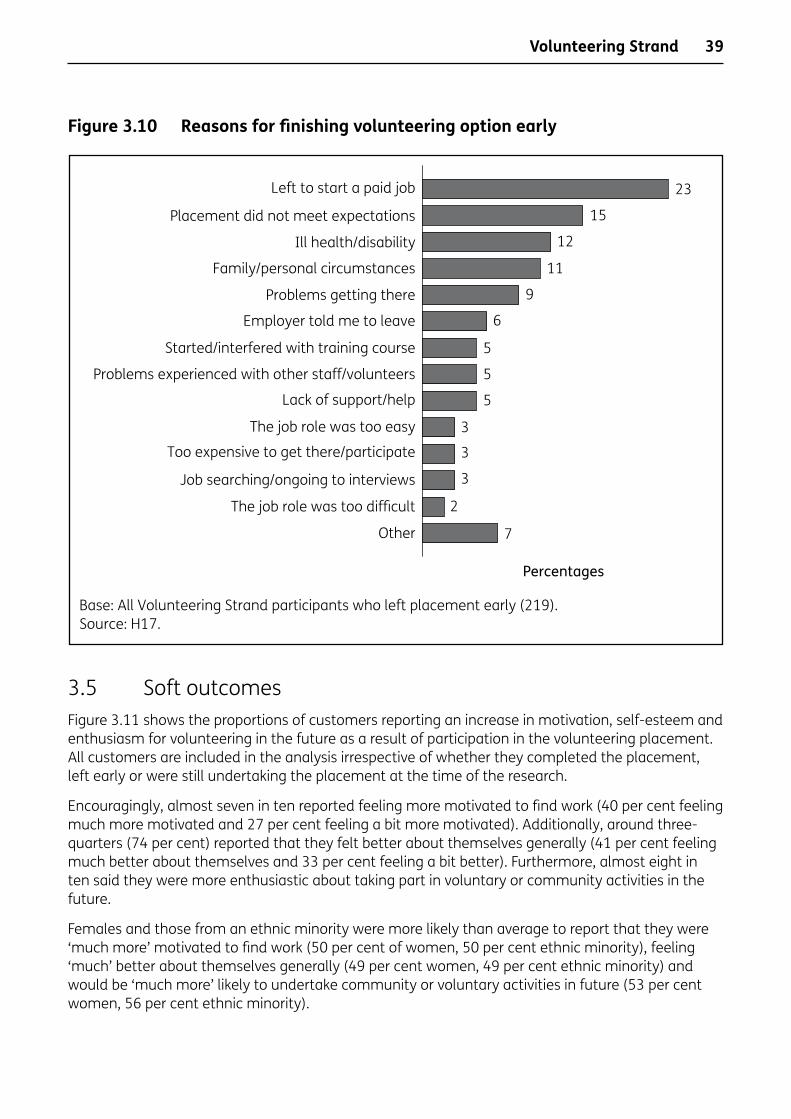
39
Figure 3.10 Reasons for finishing volunteering option early
3.5 Soft outcomesFigure 3.11 shows the proportions of customers reporting an increase in motivation, self-esteem and enthusiasm for volunteering in the future as a result of participation in the volunteering placement. All customers are included in the analysis irrespective of whether they completed the placement, left early or were still undertaking the placement at the time of the research.
Encouragingly, almost seven in ten reported feeling more motivated to find work (40 per cent feeling much more motivated and 27 per cent feeling a bit more motivated). Additionally, around three-quarters (74 per cent) reported that they felt better about themselves generally (41 per cent feeling much better about themselves and 33 per cent feeling a bit better). Furthermore, almost eight in ten said they were more enthusiastic about taking part in voluntary or community activities in the future.
Females and those from an ethnic minority were more likely than average to report that they were ‘much more’ motivated to find work (50 per cent of women, 50 per cent ethnic minority), feeling ‘much’ better about themselves generally (49 per cent women, 49 per cent ethnic minority) and would be ‘much more’ likely to undertake community or voluntary activities in future (53 per cent women, 56 per cent ethnic minority).
Volunteering Strand
Base: All Volunteering Strand participants who left placement early (219).Source: H17.
23
Other
The job role was too difficult
Job searching/ongoing to interviews
Too expensive to get there/participate
The job role was too easy
Lack of support/help
Problems experienced with other staff/volunteers
Started/interfered with training course
Employer told me to leave
Problems getting there
Family/personal circumstances
Ill health/disability
Placement did not meet expectations
Left to start a paid job
Percentages
15
12
11
9
6
5
5
5
3
3
3
2
7
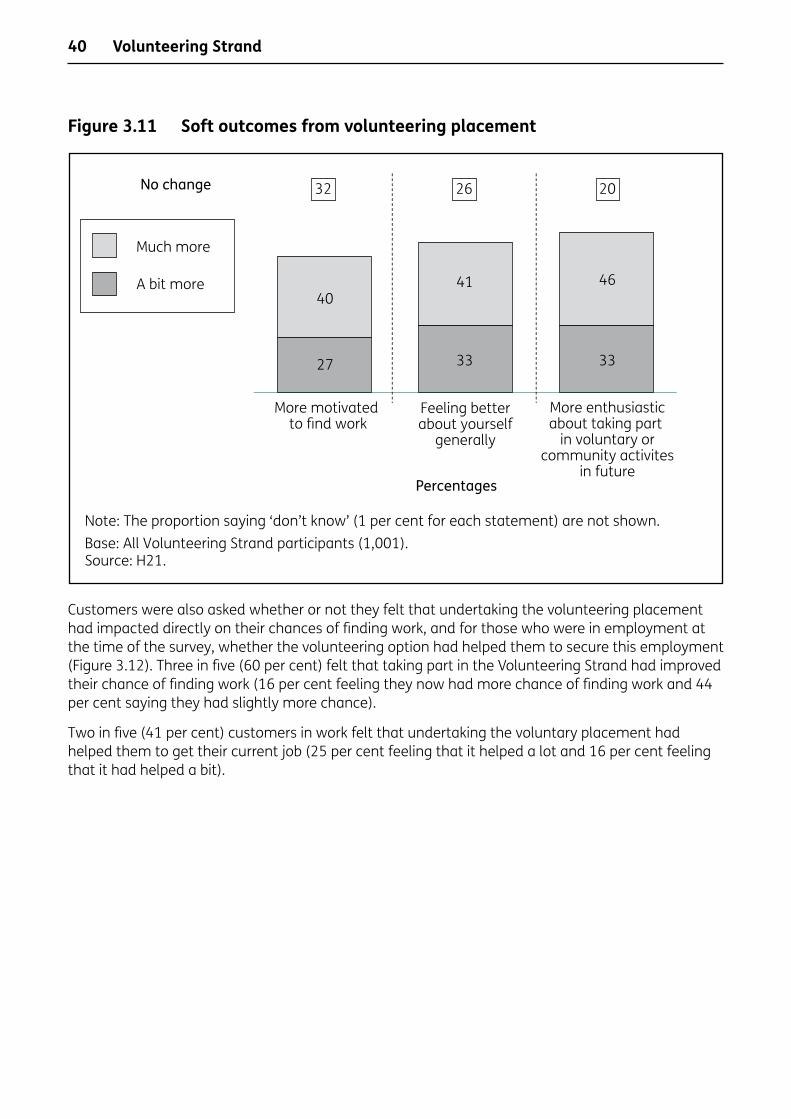
40
Figure 3.11 Soft outcomes from volunteering placement
Customers were also asked whether or not they felt that undertaking the volunteering placement had impacted directly on their chances of finding work, and for those who were in employment at the time of the survey, whether the volunteering option had helped them to secure this employment (Figure 3.12). Three in five (60 per cent) felt that taking part in the Volunteering Strand had improved their chance of finding work (16 per cent feeling they now had more chance of finding work and 44 per cent saying they had slightly more chance).
Two in five (41 per cent) customers in work felt that undertaking the voluntary placement had helped them to get their current job (25 per cent feeling that it helped a lot and 16 per cent feeling that it had helped a bit).
Volunteering Strand
Base: All Volunteering Strand participants (1,001).Source: H21.
Percentages
32
Much more
No change
A bit more
26 20
4041 46
27 33 33
More motivated to find work
Feeling betterabout yourself
generally
More enthusiasticabout taking part
in voluntary orcommunity activites
in future
Note: The proportion saying ‘don’t know’ (1 per cent for each statement) are not shown.
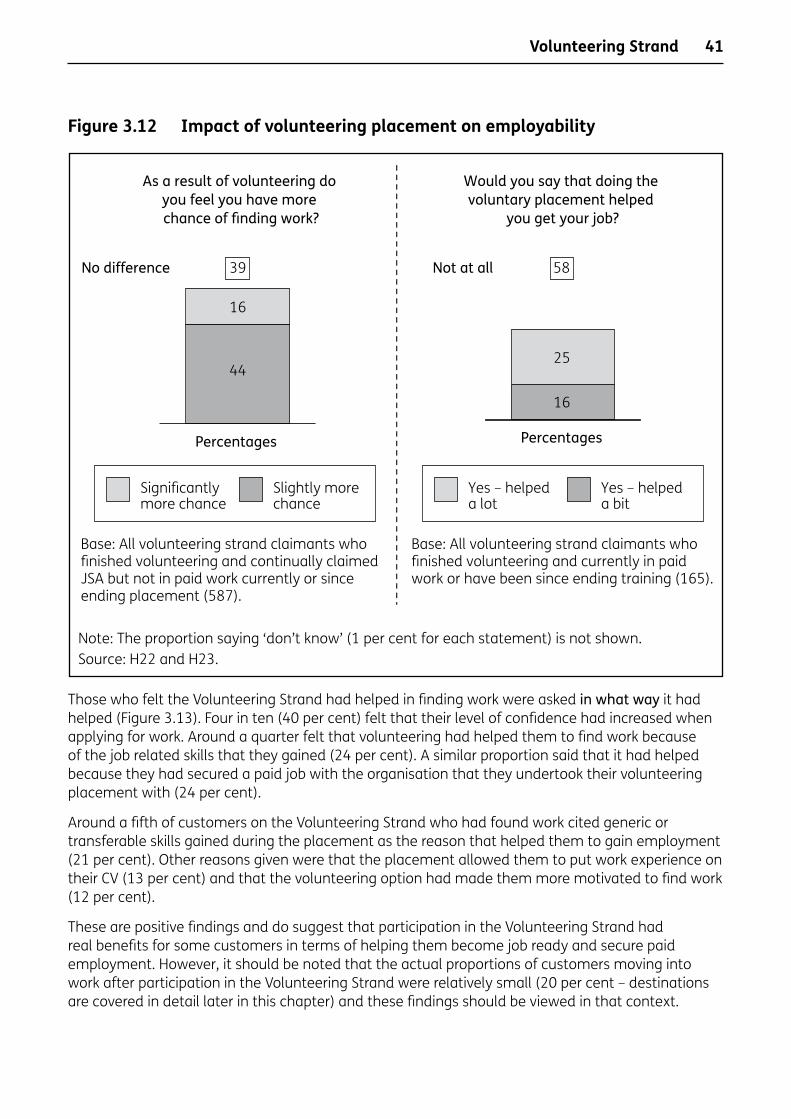
41
Figure 3.12 Impact of volunteering placement on employability
Those who felt the Volunteering Strand had helped in finding work were asked in what way it had helped (Figure 3.13). Four in ten (40 per cent) felt that their level of confidence had increased when applying for work. Around a quarter felt that volunteering had helped them to find work because of the job related skills that they gained (24 per cent). A similar proportion said that it had helped because they had secured a paid job with the organisation that they undertook their volunteering placement with (24 per cent).
Around a fifth of customers on the Volunteering Strand who had found work cited generic or transferable skills gained during the placement as the reason that helped them to gain employment (21 per cent). Other reasons given were that the placement allowed them to put work experience on their CV (13 per cent) and that the volunteering option had made them more motivated to find work (12 per cent).
These are positive findings and do suggest that participation in the Volunteering Strand had real benefits for some customers in terms of helping them become job ready and secure paid employment. However, it should be noted that the actual proportions of customers moving into work after participation in the Volunteering Strand were relatively small (20 per cent – destinations are covered in detail later in this chapter) and these findings should be viewed in that context.
Volunteering Strand
Source: H22 and H23.
As a result of volunteering do you feel you have more chance of finding work?
39
Significantly more chance
No difference
Slightly more chance
Percentages
Base: All volunteering strand claimants who finished volunteering and continually claimed JSA but not in paid work currently or since ending placement (587).
Not at all 58
Would you say that doing the voluntary placement helped
you get your job?
Yes – helped a lot
Yes – helpeda bit
16
4425
16
Percentages
Base: All volunteering strand claimants whofinished volunteering and currently in paidwork or have been since ending training (165).
Note: The proportion saying ‘don’t know’ (1 per cent for each statement) is not shown.
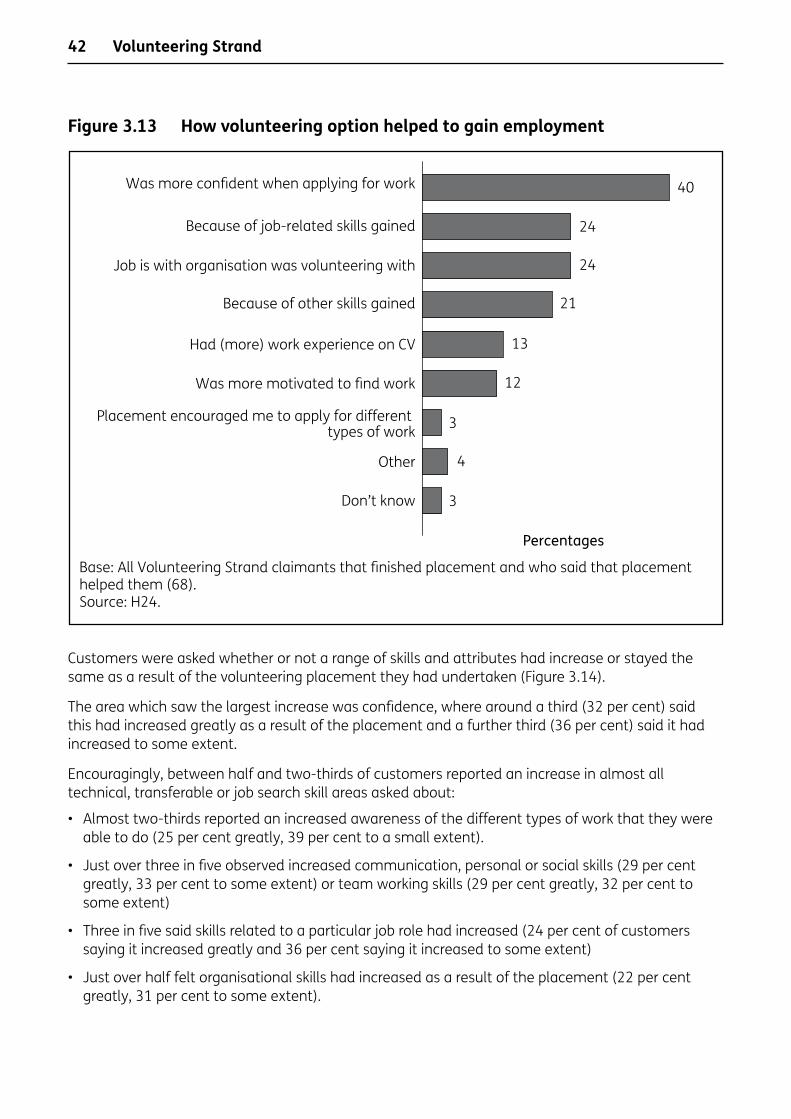
42
Figure 3.13 How volunteering option helped to gain employment
Customers were asked whether or not a range of skills and attributes had increase or stayed the same as a result of the volunteering placement they had undertaken (Figure 3.14).
The area which saw the largest increase was confidence, where around a third (32 per cent) said this had increased greatly as a result of the placement and a further third (36 per cent) said it had increased to some extent.
Encouragingly, between half and two-thirds of customers reported an increase in almost all technical, transferable or job search skill areas asked about:
• Almost two-thirds reported an increased awareness of the different types of work that they were able to do (25 per cent greatly, 39 per cent to a small extent).
• Just over three in five observed increased communication, personal or social skills (29 per cent greatly, 33 per cent to some extent) or team working skills (29 per cent greatly, 32 per cent to some extent)
• Three in five said skills related to a particular job role had increased (24 per cent of customers saying it increased greatly and 36 per cent saying it increased to some extent)
• Just over half felt organisational skills had increased as a result of the placement (22 per cent greatly, 31 per cent to some extent).
Base: All Volunteering Strand claimants that finished placement and who said that placement helped them (68).Source: H24.
40
Don’t know
Other
Placement encouraged me to apply for different types of work
Was more motivated to find work
Had (more) work experience on CV
Because of other skills gained
Job is with organisation was volunteering with
Because of job-related skills gained
Was more confident when applying for work
Percentages
24
24
21
13
12
3
4
3
Volunteering Strand
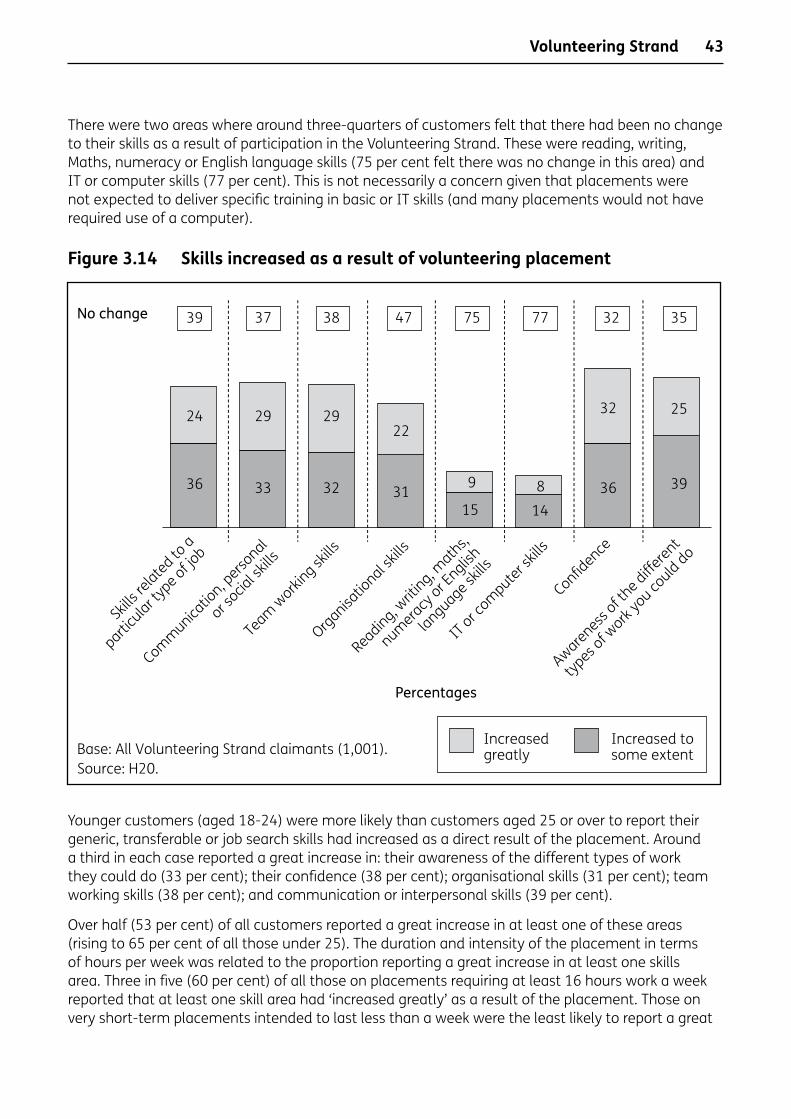
43
There were two areas where around three-quarters of customers felt that there had been no change to their skills as a result of participation in the Volunteering Strand. These were reading, writing, Maths, numeracy or English language skills (75 per cent felt there was no change in this area) and IT or computer skills (77 per cent). This is not necessarily a concern given that placements were not expected to deliver specific training in basic or IT skills (and many placements would not have required use of a computer).
Figure 3.14 Skills increased as a result of volunteering placement
Younger customers (aged 18-24) were more likely than customers aged 25 or over to report their generic, transferable or job search skills had increased as a direct result of the placement. Around a third in each case reported a great increase in: their awareness of the different types of work they could do (33 per cent); their confidence (38 per cent); organisational skills (31 per cent); team working skills (38 per cent); and communication or interpersonal skills (39 per cent).
Over half (53 per cent) of all customers reported a great increase in at least one of these areas (rising to 65 per cent of all those under 25). The duration and intensity of the placement in terms of hours per week was related to the proportion reporting a great increase in at least one skills area. Three in five (60 per cent) of all those on placements requiring at least 16 hours work a week reported that at least one skill area had ‘increased greatly’ as a result of the placement. Those on very short-term placements intended to last less than a week were the least likely to report a great
Source: H20.
Increased greatly
No change
Increased to some extent
Percentages
Base: All Volunteering Strand claimants (1,001).
39 37 38 47 75 77 32 35
24
36
29
33
29
32
22
319
158
14
32
36
25
39
Skills
related to
a
particu
lar typ
e of job
Communicatio
n, perso
nal
or socia
l skil
ls
Team w
orking sk
ills
Organisatio
nal skil
ls
Reading, writ
ing, math
s,
numeracy or E
nglish
language skills
IT or c
omputer skil
ls
Confidence
Awareness of t
he different
types o
f work
you co
uld do
Volunteering Strand

44
increase in any of the prompted skill areas (29 per cent). Whether the placement was on a fixed duration or ongoing, or whether it was in the public, voluntary or private sector did not affect the proportions reporting any soft outcome.
3.6 Claim status and hard outcomesNext we consider the overall destinations of Volunteering Strand customers, and reports on the proportion moving off JSA and entering paid work.
Figure 3.15 illustrates whether customers:
• had entered paid work at any point after starting the volunteering placement;
• had ended their JSA claim but had not entered paid work at any point; or
• were still claiming and had done so continuously since before starting the placement.
It also illustrates the proportion that ended their JSA claim after starting the placement but had returned to claiming by the time of the research fieldwork.
At the time of interview, just over-two thirds of customers (68 per cent) were still claiming JSA and had done so continuously. A fifth (20 per cent) had ended claims and entered paid work at some point; with a further one in eight (12 per cent) ending their claims but entering a destination other than paid work.
By the time of the research, just under a quarter (24 per cent) remained not claiming and 16 per cent were in paid work.
Figure 3.15 Claim status and hard outcomes
Looking just among those surveyed customers who had started their placement at least six months before the time of interview, over a quarter (28 per cent) had ended claims and 19 per cent were in
Volunteering Strand
Base: All Volunteering Strand claimants (1,001).Source: B1, B2, B5 and C1.
PercentagesDid not end original claimEnded original claim butdid not enter paid work
Entered paid work
Returned to JSANot returned to JSA
Returned to JSANot returned to JSA and not in paid workCurrently in paid work
5
7
3
16
112
20
68
45
paid work. Comparing these ‘mid-term’ outcomes21 with those who responded to the JRFND Stage 3/comparison survey indicates that customers on the Volunteering Strand were less likely to end claims and be in paid work than a general sample of customers who had reached a similar stage of their claim (23 per cent). However, this difference should be viewed in the context of volunteering strand participants including a higher number of longer-term unemployed customers and over-representing some of those from other harder to reach groups.
Younger customers were more likely to have entered and remained in paid work than average (21 per cent of those under 25 were still in paid work at the time of the research compared with 16 per cent of all customers).
Those volunteering customers who were qualified to degree level or above were also more likely to have been in paid work at the time of the research (22 per cent).
There was some variation in overall outcomes by the type of placement undertaken. Those on fixed end placements reported more positive paid employment outcomes at the time of the research in March 2010 than those on placements offered on an ongoing basis (18 per cent of those on fixed-term placements were in paid work compared with 14 per cent of those on ongoing placements22). The most positive outcomes were reported by those on fixed-end placements in a Government funded organisation where 28 per cent of those taking up a placement of this type had gone into paid work and overall a third (33 per cent) were no longer claiming at the time of this research23.
Figure 3.16 outlines the type of work (whether full-time with an employer, part-time with an employer or self-employment) entered by those Volunteering Strand customers who had ended their claims and found paid work24. For completeness, Figure 3.16 also shows the proportion who were still claiming and had done so continuously since starting their original claim and those who ended their original JSA claim but who had not entered paid work at any point.
Where they had entered paid work, this was most commonly full-time work with an employer (12 per cent had entered this form of paid employment following participation in a volunteering placement). A smaller proportion had started part time paid work with an employer (8 per cent). A very small minority (2 per cent) were working on a self-employed basis.
21 Longer term outcomes will be explored in the 6MO Longitudinal surveys in spring 2011.22 This difference is only statistically significant at a 90 per cent confidence level23 Small base sizes should be noted here (44 customers had taken up a fixed-term placement at
a Government-funded organisation). However, the proportion of customers on placements of this type currently in paid work is significantly higher than average (16 per cent).
24 If the customer had taken up more than one form of paid work they were asked to identify their ‘main’ (if currently working) or most recent (if returned to claiming JSA or no longer currently working) job to enable later questions about their work to focus on one role.
Volunteering Strand

46
Figure 3.16 Type of work entered for Volunteering Strand customers
3.6.1 Nature of employment enteredOver two-fifths (44 per cent) of customers who had entered paid work with an employer were on a permanent or open ended contract, just under three in ten (29 per cent) were on a temporary or casual basis, and just over one in six (18 per cent) were on a fixed-term contract lasting less than 12 months. One in 20 (5 per cent) were on a fixed-term contract lasting at least 12 months and the remainder (4 per cent) were unable to state what type of contract they were employed on.
The most common industry sector entered by volunteering customers starting paid work was public administration, education, health and other service activities (29 per cent), with around a fifth (18 per cent) entering the financial and business services sector and around one in six starting work in the wholesale and retail industry (16 per cent). Comparing these findings with the profile of occupational sectors entered by those respondents to the JRFND Stage 3/comparison survey who had entered work, gives an indication of how representative the jobs secured by Volunteering Strand customers were of the employment outcomes typically gained by those leaving JSA after at least six months of claiming. Volunteering Strand customers were more likely to have entered paid roles in public administration, education, health or other services (29 per cent compared with 18 per cent of JRFND Stage 3/comparison customers) and were correspondingly less likely to have entered other industry sectors.
Around one in seven (14 per cent) customers who were in work had secured this role with the organisation that had provided the volunteering placement. This equates to 2 per cent of all volunteering customers entering paid work with their placement organisation. All but one of these had participated in fixed-term placements and most were in Government-funded or voluntary organisations. Just a handful of those who had taken up placements in the private sector were employed in a paid role with the same employer at the time of the research. Despite those with PSA
Base: All Volunteering Strand participants (1,001).Source: B1, B2, B5 and C1.
2
Self-employed
Full-time paid role with an employerPart-time paid role wth an employerEnded original JSA claim but did not enter paid workNot ended original JSA claim
12
8
12
68
Percentages
Volunteering Strand

47
16 barriers being more likely to be placed in fixed-term Government or voluntary placements none of these customers had gone on to find paid work with their placement organisation, and indeed only one in 20 (5 per cent) were in paid work elsewhere at the time of interview.
Most commonly participants entered elementary roles (22 per cent), associate professional roles (14 per cent), administrative and secretarial roles (17 per cent), or sales and customer service roles (18 per cent). Compared with JRFND Stage 3/comparison customers, customers on the Volunteering Strand were less likely to enter elementary roles (29 per cent of all customers reaching six months claiming did so compared with 22 per cent of all those on the Volunteering Strand) and were more likely to enter the higher skilled associate professional and administrative roles (14 per cent and 17 per cent respectively compared with 6 per cent and 12 per cent of customers generally).
The mean average annual salary for volunteering customers entering work was £11,55025. This is slightly (but not statistically significantly) lower than the £12,050 secured by those entering work after at least six months of unemployment in the JRFND Stage 3 survey26.
3.7 SummaryVolunteering Strand participants were more likely to be older, female and have a health condition or disability than those reaching their sixth consecutive month of JSA claiming generally. They were also more likely to be repeat customers and over a quarter had claimed continuously for more than a year before being referred to the Volunteering Strand.
Almost a quarter were educated to degree level or above suggesting that not all volunteering participants were those who might be considered furthest from the labour market. Customers with degrees were more likely than average to volunteer in a Government-funded or voluntary sector role (typically involving fewer than 16 hours per week) and more likely than average to have found paid work by the time of the research. For these participants it may be possible that the volunteering placement was appealing in terms of keeping them occupied and maintaining confidence and motivation levels.
On average, placements lasted just over three months, took up 12 hours a week and were provided by either a charity or Government-funded organisation. There was a wide range of placement types either side of these averages however, with short, full-time placements with private companies at one end of the spectrum with placements requiring just a few hours a week and with no fixed end at the other. Those under 25 were more likely to participate in fixed-term placements.
Participants tended to be satisfied with the process of arranging a placement on the whole with majorities reporting: they had input into the type of placement undertaken; the placement was suitable; and they found the length of time it took to arrange the placement appropriate.
For the majority, the volunteering placement was reported to have resulted in increases in skills related to a particular role as well as generic, transferable skills (the latter particularly in the case of younger customers).
By the time of the research, just under a quarter remained not claiming and 16 per cent were in paid work. Looking just among those who had started their placement at least six months ago, over a quarter had ended claims and just under a fifth (19 per cent) were in paid work.
25 Average salaries are rounded to the nearest £50.26 This difference in average salary is not explained by the hours worked which are broadly
comparable for both groups of customers (an average of 29 per week for volunteering strand customers and 30 per week for respondents to the JRFND Stage 3 survey).
Volunteering Strand

48
Participants most commonly (and more commonly than customers as a whole27) entered work in the public administration, education, health and other service activities sector. Around one in seven (14 per cent) of those who had entered paid work secured a paid role with the organisation that had provided the volunteering placement (equating to 2 per cent of all volunteering customers). Those who participated in fixed-term placements in the public sector were the most likely to have gone to paid work. Despite fixed-term placements in the private sector generally being more ‘intensive’ (involving full-time work over a couple of months) relatively few customers on these types of placements reported being in paid work at the time of the research and just a handful were employed by the organisation that had provided the placement.
27 Compared with JRFND Stage 3 customers and those at a comparable stage of their claim in JRFND Phase 2 areas.
Volunteering Strand
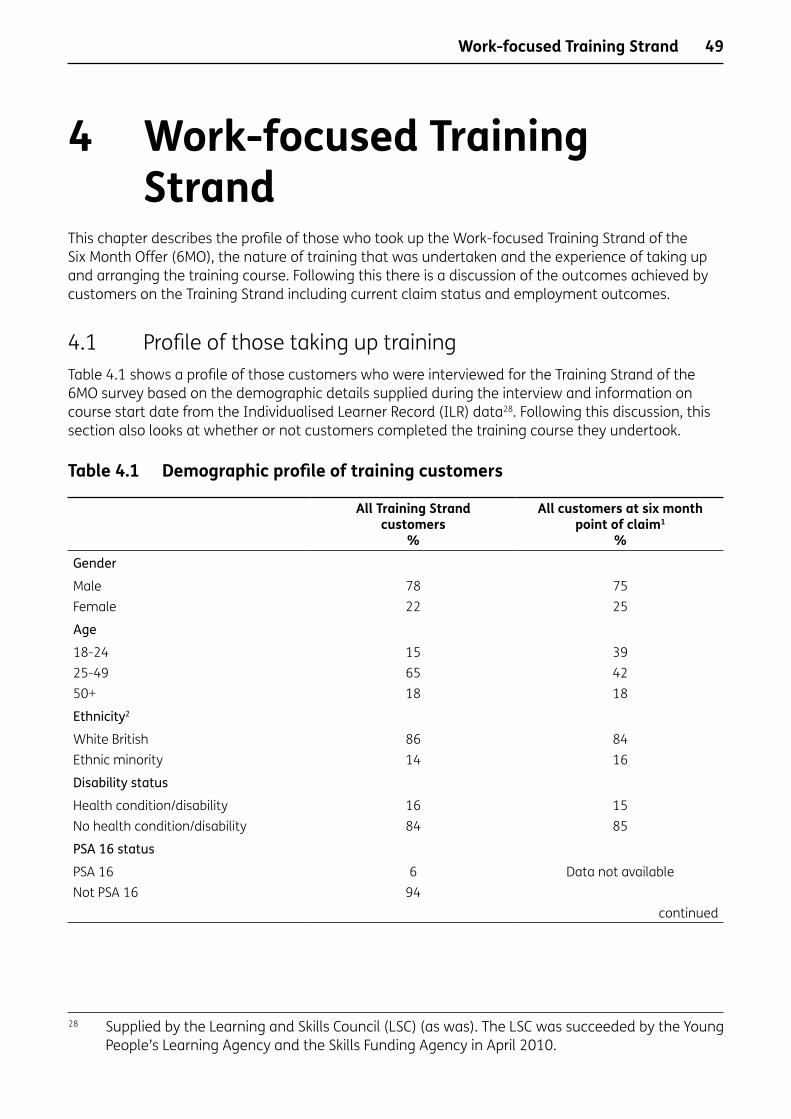
49
4 Work-focused Training StrandThis chapter describes the profile of those who took up the Work-focused Training Strand of the Six Month Offer (6MO), the nature of training that was undertaken and the experience of taking up and arranging the training course. Following this there is a discussion of the outcomes achieved by customers on the Training Strand including current claim status and employment outcomes.
4.1 Profile of those taking up trainingTable 4.1 shows a profile of those customers who were interviewed for the Training Strand of the 6MO survey based on the demographic details supplied during the interview and information on course start date from the Individualised Learner Record (ILR) data28. Following this discussion, this section also looks at whether or not customers completed the training course they undertook.
Table 4.1 Demographic profile of training customers
All Training Strand customers
%
All customers at six month point of claim1
%Gender
Male 78 75Female 22 25
Age
18-24 15 3925-49 65 4250+ 18 18
Ethnicity2
White British 86 84Ethnic minority 14 16
Disability status
Health condition/disability 16 15No health condition/disability 84 85
PSA 16 status
PSA 16 6 Data not availableNot PSA 16 94
continued
28 Supplied by the Learning and Skills Council (LSC) (as was). The LSC was succeeded by the Young People’s Learning Agency and the Skills Funding Agency in April 2010.
Work-focused Training Strand

50
Table 4.1 Continued
All Training Strand customers
%
All customers at six month point of claim1
%Qualification level
No qualifications/below Level 2 51 Data not availableLevel 2-3 36Level 4-5 12Level 2 and above 47
Claim history
Previously claimed 64 Data not availableNot previously claimed 36
Length of claim before started strand
18 months or more 6 Data not availableOver a year but less than 18 months 13Six months to a year 48Less than six months 29Unable to calculate 3
Month started strand
April * Data not availableMay *June 2July 3August 11September 21October 19November 30December 13
Base 1,001 89,4201 Population figures taken from data supplied by the DWP of all customers having an initial stage 3/26-week
restart/initial New Deal for Young People (NDYP) interview between 24 August 2009 and 28 September 2009.
2 Note that the all ethnicity figures have been re-based to exclude those records where ethnicity is not known (accounting for 1% of the Training Strand survey data and 7% of the population data).
* denotes a per centage which is less than 0.5 per cent but greater than 0.
Work-focused Training Strand
51
Compared with the overall population of customers who had been in receipt of Jobseeker’s Allowance (JSA) for at least six months29, Training Strand customers were:
• slightly more likely to be male (78 per cent compared with 75 per cent of the eligible population);
• aged 25 or over (only 15 per cent were aged 18-24 compared with 39 per cent of the eligible population). This may reflect the fact that those aged 18-24 in Jobseekers Regime and Flexible New Deal (JRFND) Phase 2 areas would have been engaged with NDYP at this point in their claim which also involves a training option after completion of the Gateway. As such, young people in these areas would have been less likely to received 6MO funded training.
Approaching two-thirds (64 per cent) of customers on the Training Strand were repeat customers, that is, they had made previous JSA claims prior to the claim through which they became eligible for the 6MO. This is a higher proportion than found at the JRFND stage 3 survey (57 per cent) which is based on all those who have been claiming for six consecutive months as well as those fast-tracked to JRFND Stage 3/NDYP. This indicates that Training Strand participants are more likely to be repeat customers.
Just under half (48 per cent) had been claiming for between six months and a year when they started the training course, so for these strand participation was offered as soon or shortly after they became eligible for the 6MO. However, for around a fifth (19 per cent) the offer came after they had been claiming for at least a year30. Around three in ten (29 per cent) actually started a training course delivered under the 6MO before they had been claiming for a full six months. This is partly explained, by fast-tracking in JRFND Phase 1 areas which means some customers who require more intensive support are fast-tracked to JRFND Stage 3 and are eligible for the support available for those unemployed for six months.
Customers were split broadly evenly between those with no or low qualifications (51 per cent) and those who had a Level 2 or above qualification before starting the course (47 per cent). The majority of work focused training courses delivered under 6MO were intended to lead to a Level 2 qualification so it is perhaps surprising that such a high proportion of customers were already qualified at this level. This may indicate that this strand is offering the opportunity for re-training in a different sector for these individuals. However, the qualitative work conducted as part of the wider evaluation noted that a criticism of the strand was that the course content was too basic for some so it is possible that the training available under the 6MO was not always suitable for higher skilled individuals31.
Reflecting the profile of the customer population, very few Training Strand customers that took part in the research started their course before August 2009. Starts picked up in September with the beginning of the academic term (21 per cent of customers started then) before peaking in November (30 per cent). The skew towards the latter sampling months here should be borne in mind when considering whether or not customers on the Training Strand have secured employment outcomes (i.e. they will have had less time to complete their course and look for work than if they had started earlier in summer 2009)32.
29 Unless explicitly stated otherwise, all differences reported in this chapter are statistically significant at the 95 per cent confidence level. See Section 1.4 for more details.
30 These are likely to be ‘stock’ customers who had reached six months of claiming before the 6MO programme was launched and so were offered it later on in their claims instead.
31 Vegeris etal., (2010).32 Long-term outcomes will be explore through the longitudinal surveys of 6MO strand customers
planned for March 2011.
Work-focused Training Strand

52
4.1.1 Course completion statusAt the time the research was conducted, just over three-quarters (76 per cent) had completed their training course with around one in ten (11 per cent) still on the course. A minority (13 per cent) left their course before completion.
Customers who left their training before completion were asked to give their reasons for this. Not all are negative reasons; one in five had left to start work (19 per cent) which could be considered a positive outcome from a policy perspective with these individuals being moved back into work. However, on the whole those who had dropped out of training to take up work did not consider that the training attended had played an important role in helping them to find work – only three in ten (28 per cent) said that this helped them secure their job.
Furthermore, for just over a quarter of those leaving the course before completion (27 per cent) the reason for leaving early was that the course had not met their expectations, and 12 per cent found the course too difficult. This indicates that for a minority (36 per cent citing one of these factors) the course they were enrolled on may not have been the most appropriate course for them.
Additional reasons included health reasons (12 per cent), family reasons (10 per cent), or travel difficulties (9 per cent).
Figure 4.1 Whether customers completed training course
Base: All those who did not complete their course (129).
27
Source: S9 and G16.
Base: All Training Strand participants (1,001).
Course did not meetexpectations
Course cancellation
Family reasonsHealth reasons
Left to start work
Travel difficultiesLack of support
Did not get on with tutor
Course too easyChildcare reasons
Other
Course too hard
Left to look for work
Completed the training
Left training before completion
Still undertaking training
Reason for not completing course
Percentages
191212
109
44333
112
76%
11%
13%
Work-focused Training Strand
53
4.2 Nature of training undertakenThe following discussion focuses on the nature of the training taken up as part of the 6MO, in terms of whether or not it lead to a qualification as well as the level, subject and duration of the course.
Customers undertook a relatively wide range of courses. Computer courses including the European Computer Driving Licence (ECDL) were relatively common and were undertaken by over a fifth (22 per cent).
A similar proportion33 (21 per cent) trained towards a licence, certificate or card required for entry into a particular sector or role such as the Construction Skills Certification Scheme (CSCS) card in construction, the Security Industry Authority (SIA) licence for the security industry or a forklift driving licence. These licences or cards are not necessarily qualifications but are commonly seen as necessary ‘passports’ into particular industries.
A quarter (25 per cent) reported training in a particular broad sector or towards a particular role, most commonly in retail, care and construction (including plumbing and electrical courses), without this being associated with a particular license or card as mentioned in the previous paragraph.
One in eight (13 per cent) mentioned that the learning involved courses in literacy, numeracy or employability skills and one in ten (10 per cent) mentioned that their learning involved more generic modules on health and safety or first aid (a third – 32 per cent – of all those doing health and safety or first aid also mentioned some type of sector specific learning).
There was some variation in the subject of training undertaken by customer group. Those aged 50 or over were over-represented among those doing an IT course (26 per cent of all those on an IT course were aged 50 or over compared with just 18 per cent of all training customers generally). Those aged under 25 were over-represented among those doing general construction including CSCS cards (24 per cent of all those doing general construction and CSCS card courses were aged under 25 compared to 15 per cent of all training participants). Almost all (98 per cent) of those training towards a CSCS card, SIA or forklift licence were male.
Figure 4.2 outlines whether or not customers considered that the training that was undertaken was designed to lead to a recognised qualification and, if so, what level that qualification was.
33 Note that customers could fall into a number of the categories of training subject listed here.
Work-focused Training Strand

54
Figure 4.2 Nature of the training course undertaken
As shown in Figure 4.2, the split between those who reported undertaking a course designed to lead to a recognised qualification and those who did not was broadly even (48 per cent compared to 46 per cent respectively). A further 6 per cent were unable to answer.
The fact that only half of Training Strand participants had taken a course designed to lead to a qualification is surprising given that the Training Strand of the 6MO was originally envisaged as delivering units or modules of a full Level 2 or 3 qualification. However, the offer was subsequently broadened, and colleges and other providers were able to offer lower level or unit-based training that would allow customers to go on to build a full Level 2 qualification in time. In interpreting these findings, it is also important to note that customers may not always have realised that the course they were on was designed to lead towards a qualification if it represented just a unit, module or part of a qualification.
Where customers were training towards a qualification they were most likely to be undertaking Level 2 courses (which include GNVQ intermediate, BTEC intermediate/Diploma and NVQ level 2) with two in ten (21 per cent) of all those on the Training Strand completing training at this level. This was followed by one in ten (9 per cent) completing courses classified as Level 1 (including GNVQ/GSVQ foundation, BTEC first, and NVQ level 1), 5 per cent being on entry level courses, and 4 per cent being on a course classified as Level 3 (including GNVQ or BTEC National and NVQ level 3; 8 per cent).
Figure 4.3 shows the intended length of the course. Around a quarter (26 per cent) of those on the Training Strand were on courses that lasted for less than a week. Following this the second most common period of time that a course lasted for was five to ten weeks with around a fifth (21 per cent) on courses of this length. Longer courses were less common with just 8 per cent on a course that lasted over 20 weeks. The average number of weeks a course was intended to last was eight.
Base: All Training Strand participants (1,001).Source: G11 and G12.
Percentages
Don’t know
NoYes
Whether training designed to lead to qualification
Level 3Level 2
Level 1
Entry Level
Level ofqualification
6
48
46
4
21
95 Don’t know 9%
Percentages
Work-focused Training Strand
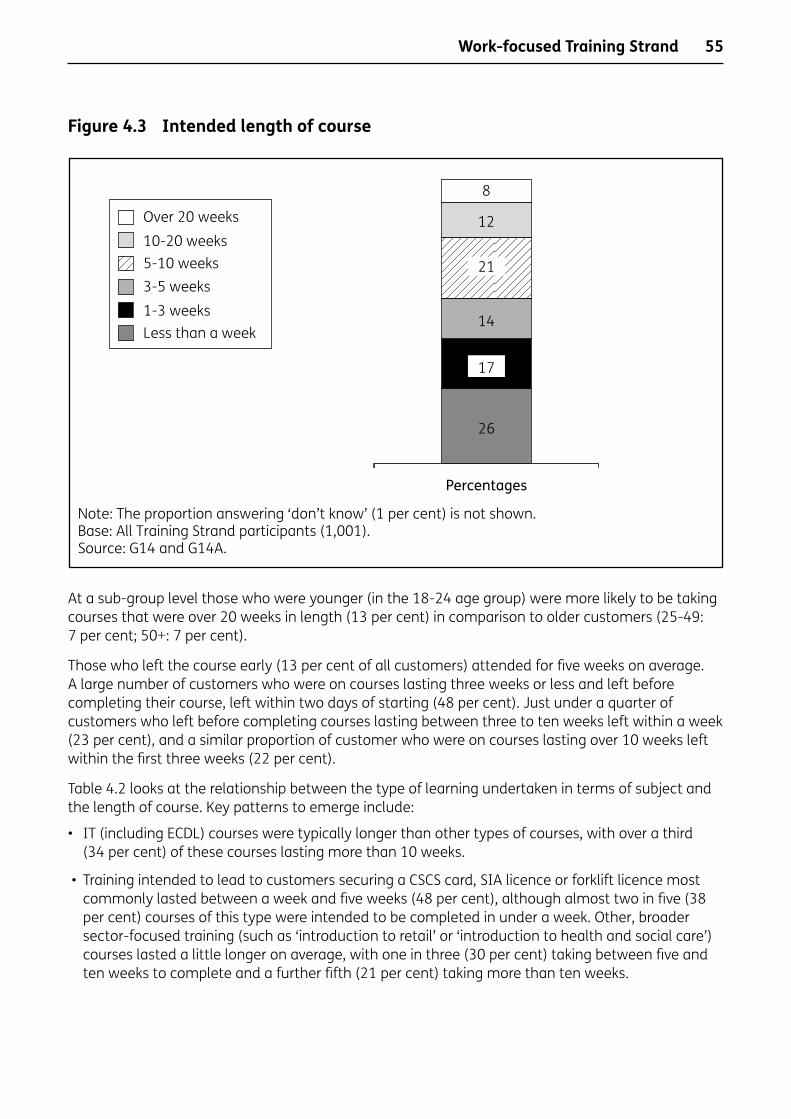
55
Figure 4.3 Intended length of course
At a sub-group level those who were younger (in the 18-24 age group) were more likely to be taking courses that were over 20 weeks in length (13 per cent) in comparison to older customers (25-49: 7 per cent; 50+: 7 per cent).
Those who left the course early (13 per cent of all customers) attended for five weeks on average. A large number of customers who were on courses lasting three weeks or less and left before completing their course, left within two days of starting (48 per cent). Just under a quarter of customers who left before completing courses lasting between three to ten weeks left within a week (23 per cent), and a similar proportion of customer who were on courses lasting over 10 weeks left within the first three weeks (22 per cent).
Table 4.2 looks at the relationship between the type of learning undertaken in terms of subject and the length of course. Key patterns to emerge include:
• IT (including ECDL) courses were typically longer than other types of courses, with over a third (34 per cent) of these courses lasting more than 10 weeks.
• Training intended to lead to customers securing a CSCS card, SIA licence or forklift licence most commonly lasted between a week and five weeks (48 per cent), although almost two in five (38 per cent) courses of this type were intended to be completed in under a week. Other, broader sector-focused training (such as ‘introduction to retail’ or ‘introduction to health and social care’) courses lasted a little longer on average, with one in three (30 per cent) taking between five and ten weeks to complete and a further fifth (21 per cent) taking more than ten weeks.
Note: The proportion answering ‘don’t know’ (1 per cent) is not shown.Base: All Training Strand participants (1,001).Source: G14 and G14A.
Percentages
Over 20 weeks
10-20 weeks5-10 weeks
8
12
21
14
17
26
3-5 weeks
1-3 weeksLess than a week
Work-focused Training Strand

56
• Over two in five customers on health and safety or first aid and numeracy, literacy or employability courses were able to complete their learning in less than a week (45 per cent and 42 per cent respectively). This is likely to be where short interventions on these generic or transferable skills were delivered in isolation. In these instances other funding streams such as Skills for Life or Response to Redundancy provision may have been more appropriate than the 6MO as in these cases.
Table 4.2 Length of course, by broad course content
IT including ECDL
%
CSCS card/SIA/Forklift
licence %
Sector specific training
%
Health and safety/First
Aid %
Numeracy, literacy or
employability skills
%Less than a week 13 38 15 45 421-5 weeks 25 48 33 20 225-10 weeks 26 11 30 18 11More than 10 weeks 34 2 21 15 24Don’t know 3 * 1 1 2
Base 222 217 246 99 130 Notes: course type categories are not mutually exclusive as customers may have undertaken multiple courses within one learning programme.
The policy intention was that training delivered through the Training Strand would have a strong work focus. In order to ascertain the extent to which the training encompassed advice and support aimed at promoting customers’ future employment prospects, Training Strand customers were also asked whether the course content had involved any job search support or links with employers. The content of the training courses is shown in Figure 4.4.
Four in ten (40 per cent) undertook programmes of learning that involved advice on how to look or apply for jobs generally, with just under a quarter (24 per cent) reporting that they were given advice on specific vacancies to apply for. A lower proportion took courses which involved more direct forms of contact with employers such as employers giving talks or holding sessions at the college (14 per cent); undertaking work experience or work placements (8 per cent); or a visit to a local employer (6 per cent).
However, half (50 per cent) said that their course did not contain any of these elements. This proportion seems quite high in the context of colleges being encouraged to provide employment support alongside the work focused training itself34.
34 There is an outcome-based payment available for colleges who successfully move customers into sustainable work (with further training) aimed at encouraging and supporting colleges in delivering employability skills and job search support alongside the core content of the course.
Work-focused Training Strand

57
Figure 4.4 Content of course
Those on IT courses, including the ECDL course, were more likely to report that their course did not contain any of these direct links with employers or employment support (68 per cent). This is perhaps not surprising as IT courses are more generic and link to all types of employment rather than one specific occupation. The proportion saying that their course had involved ‘none of these’ was lowest for those on sector specific courses (39 per cent) and as might be expected those whose training was in literacy, numeracy or employability skills (24 per cent).
4.3 Process of taking up trainingThis section explores the way in which customers heard about the training option, their initial feelings about it, and their reasons for undertaking training.
As shown in Figure 4.5, almost nine in ten (89 per cent) were referred to the Training Strand by Jobcentre Plus (including referrals via nextstep) whilst 11 per cent referred themselves to the Training Strand after speaking directly to someone at a further education college.
Base: All Training Strand participants (1,001).Source: G15.
40Advice on how to look or apply for jobs generally
Percentages
Work experience or work placements
Employers giving talks or holding sessionsat the college
Advice on specific vacancies to apply for
None of these
Visits to local employers
24
14
8
6
50
Work-focused Training Strand

58
Figure 4.5 Process of accessing training as part of the 6MO
Among those 89 per cent referred to the Training Strand by Jobcentre Plus, they most commonly either requested referral to a particular course themselves (41 per cent) or took up the specific course suggested by a Jobcentre Plus adviser (40 per cent). A smaller proportion did not discuss the course they would be taking with the Jobcentre Plus adviser at all but instead were referred to a college for these discussions (13 per cent). Finally, a minority were referred to a specific course by the Jobcentre but decided to take a different course once at the college (4 per cent) or did not know the reason why they had chosen a particular course (3 per cent).
Where they requested a particular course this was most commonly a CSCS card, SIA licence or fork-lift driving licence (37 per cent of those who asked Jobcentre Plus to refer them to a particular type of training requested this type of course). By contrast, where it was the Jobcentre Plus adviser who suggested the course, training towards these cards or licences was less common (18 per cent) and more general courses in a particular industry sector were more typical (33 per cent), along with IT courses (25 per cent).
Source: S8 and G6.
Training – Jobcentre Plus referralTraining – Self-referral
Jobcentre Plus adviser suggested courseAsked Jobcentre Plus adviser for referral to a particular course
11%
Base: All Jobcentre Plus referrals (894).
89%
Jobcentre Plus adviser suggested a course but did a different course once at collegeDid not discuss type of course with Jobcentre Plus adviser – was referred to collegeDon’t know
Initial source of information about course
Nature of Jobcentre Plus referral
40%
41%
4%
13%3%
Base: All Training Strand participants (1,001).
Work-focused Training Strand

59
Customers were also asked how they initially felt about the training option (Figure 4.6) with 87 per cent reporting that they initially felt positive about it (47 per cent feeling very positive whilst 40 per cent felt quite positive). There were only a small minority (4 per cent) who initially had negative feelings about the training option (3 per cent saying they felt quite negative about it whilst 1 per cent felt very negative about it). Hence, as was the case for the Volunteering Strand, it does not appear that advisers needed to ‘persuade’ individuals to participate in the Training Strand.
Figure 4.6 Initial feelings about training option
Figure 4.7 shows the factors that motivated individuals to take up the Training Strand. Unsurprisingly the main motivating factor was to improve chances of gaining employment (56 per cent). Around four in ten (42 per cent) took up the training option in order to gain new skills or to update existing ones, at a sub-group level it was found that more customers in the older age groups (45 per cent of the 25-49 age group and 46 per cent of the 50+ age group) saw this as a motivating factor compared to customers under the age of 25 (32 per cent).
Very few stated that they took part in the Training Strand option because they understood that they would lose benefits if they did not, with only one in 20 (5 per cent) citing this as their reason for taking up training. This indicates that the majority of customers understood that the training offer was voluntary.
Base: All Training Strand participants (1,001).Source: G2.
Very positive about it
Quite positive
Quite negative
Very negative about it
Percentages
47
40
31
Note: The proportion answering ‘neither positive nor negative’ (8 per cent) is not shown.
Work-focused Training Strand
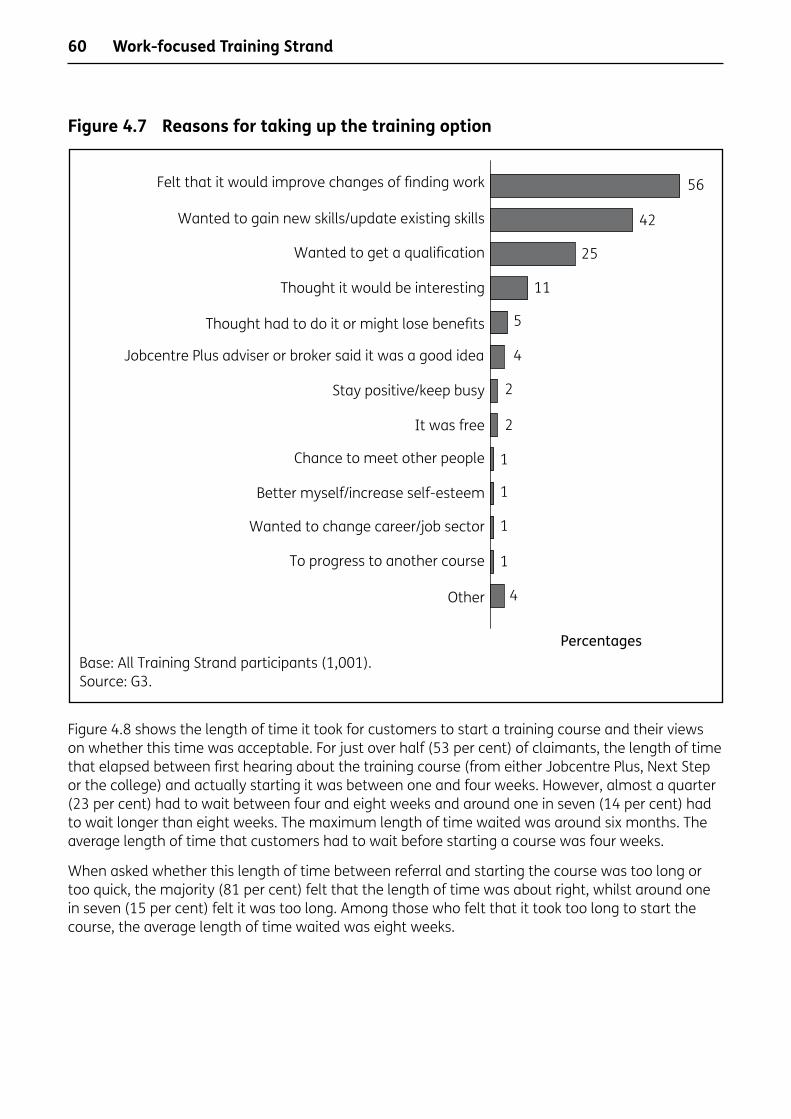
60
Figure 4.7 Reasons for taking up the training option
Figure 4.8 shows the length of time it took for customers to start a training course and their views on whether this time was acceptable. For just over half (53 per cent) of claimants, the length of time that elapsed between first hearing about the training course (from either Jobcentre Plus, Next Step or the college) and actually starting it was between one and four weeks. However, almost a quarter (23 per cent) had to wait between four and eight weeks and around one in seven (14 per cent) had to wait longer than eight weeks. The maximum length of time waited was around six months. The average length of time that customers had to wait before starting a course was four weeks.
When asked whether this length of time between referral and starting the course was too long or too quick, the majority (81 per cent) felt that the length of time was about right, whilst around one in seven (15 per cent) felt it was too long. Among those who felt that it took too long to start the course, the average length of time waited was eight weeks.
Base: All Training Strand participants (1,001).Source: G3.
56
Other
To progress to another course
Wanted to change career/job sector
Better myself/increase self-esteem
Chance to meet other people
It was free
Stay positive/keep busy
Jobcentre Plus adviser or broker said it was a good idea
Thought it would be interesting
Wanted to get a qualification
Felt that it would improve changes of finding work
Wanted to gain new skills/update existing skills
Percentages
Thought had to do it or might lose benefits
42
25
11
5
4
2
2
1
1
1
1
4
Work-focused Training Strand

61
Figure 4.8 Length of time it took to start course and views on this
Those aged 50 or over had to wait longer than average to start a course, almost half (46 per cent) had to wait at least a month compared with just 37 per cent of customers generally (and just 31 per cent of younger customers).
4.4 Soft outcomesFigure 4.9 shows that six in ten customers felt that taking up the Training Strand had made them more motivated to find work (35 per cent saying they were much more motivated to find work and 25 per cent said they were a bit more motivated). Further, three-quarters (75 per cent) were more enthusiastic about undertaking further learning or training in future.
The effect of the course on motivation to find work and to undertake further learning in future increased with the length of course. Over two in five (43 per cent) of those with courses lasting ten weeks or more said they were much more motivated to find work compared with a third (32 per cent) of those whose course lasted less than a week.
Those on courses designed to lead to a CSCS card, SIA licence or forklift driving licence were most likely to report that they were much more motivated to find work (43 per cent). This is higher than those on IT courses including the ECDL course where a quarter (24 per cent) reported that they were much more motivated to find work.
Percentages
More than 8 weeks4-8 weeks1-4 weeksLess than a weekDon’t know
Base: All Training Strand participants (1,001).Source: G8 and G9.
Too quickAbout rightToo long
Whether length of time was too long
or too quick
Don’t know 2%
Length of time it took to start course
14
23
53
74
81
15
Percentages
3
Work-focused Training Strand

62
Figure 4.9 How customers have benefited from training
Soft outcomes were more favourable for customers who completed their course compared to customers who left before completion; those who completed it were more likely to report that they were ‘much more’ motivated to find work compared with customers who left before completion (36 per cent compared with 22 per cent). Customers who completed their course were also more likely to report feeling much more enthusiastic about learning or training in the future compared to customers who left early (49 per cent compared with 37 per cent)
Another test of the usefulness of the Training Strand is whether taking the course helped, or was perceived as being of help, in finding employment (Figure 4.10). Two-thirds (66 per cent) of those who had undertaken training but were not in employment at the time of interview felt that taking part in training had improved their chances of gaining paid employment in the future (with 21 per cent saying they felt it gave them ‘significantly more chance’ and 45 per cent saying they felt it gave them ‘slightly more chance’).
Those on CSCS card, SIA licence of forklift licence courses were the most likely to report that the course had given them ‘significantly more chance’ of finding work (29 per cent). This view was less common among those in IT courses including ECDL (15 per cent).
Among those who had moved into paid employment since taking part in training, a third (33 per cent) stated that the training had played a direct role in securing them work (21 per cent saying that it had helped a lot and 12 per cent saying it had helped a bit). This is perhaps a more concrete measure of the extent to which participation in the Training Strand contributed towards employment outcomes. The fact that around two-thirds of those who had actually found employment (67 per cent) felt that their participation in the training course had no role in securing their current job may indicate that the training delivered could be better tailored to jobs available locally.
Source: G19.
More motivated tofind work
Percentages
Base: All Training Strand participants (1,001).
More enthusiastic about undertaking learning or training in the future
Much more A bit more
35
25
48
27
Percentages
No change 39 24
Note: The proportions answering ‘don’t know’ (one per cent for each statement)are not shown.
Work-focused Training Strand
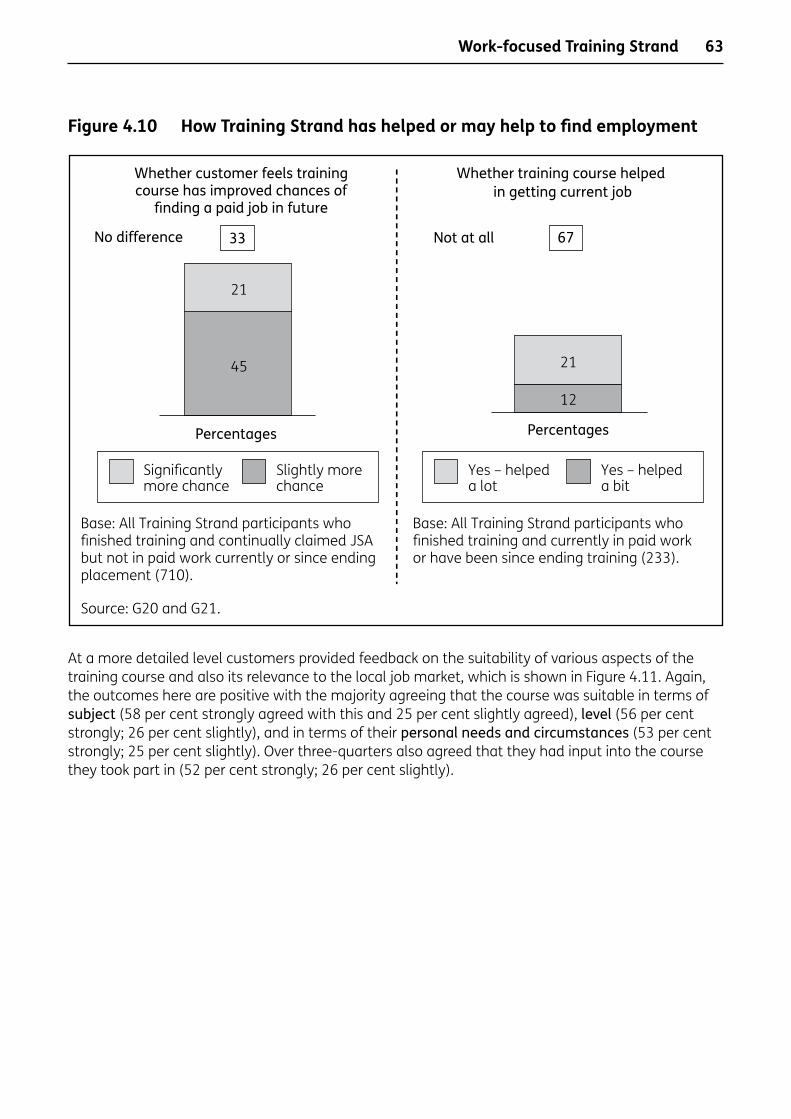
63
Figure 4.10 How Training Strand has helped or may help to find employment
At a more detailed level customers provided feedback on the suitability of various aspects of the training course and also its relevance to the local job market, which is shown in Figure 4.11. Again, the outcomes here are positive with the majority agreeing that the course was suitable in terms of subject (58 per cent strongly agreed with this and 25 per cent slightly agreed), level (56 per cent strongly; 26 per cent slightly), and in terms of their personal needs and circumstances (53 per cent strongly; 25 per cent slightly). Over three-quarters also agreed that they had input into the course they took part in (52 per cent strongly; 26 per cent slightly).
Source: G20 and G21.
Whether customer feels trainingcourse has improved chances of
finding a paid job in future
Percentages
Base: All Training Strand participants whofinished training and continually claimed JSAbut not in paid work currently or since ending placement (710).
Whether training course helped in getting current job
Significantlymore chance
Slightly morechance
Percentages
No difference 33 67Not at all
Yes – helped a lot
Yes – helpeda bit
21
45 21
12
Base: All Training Strand participants who finished training and currently in paid work or have been since ending training (233).
Work-focused Training Strand
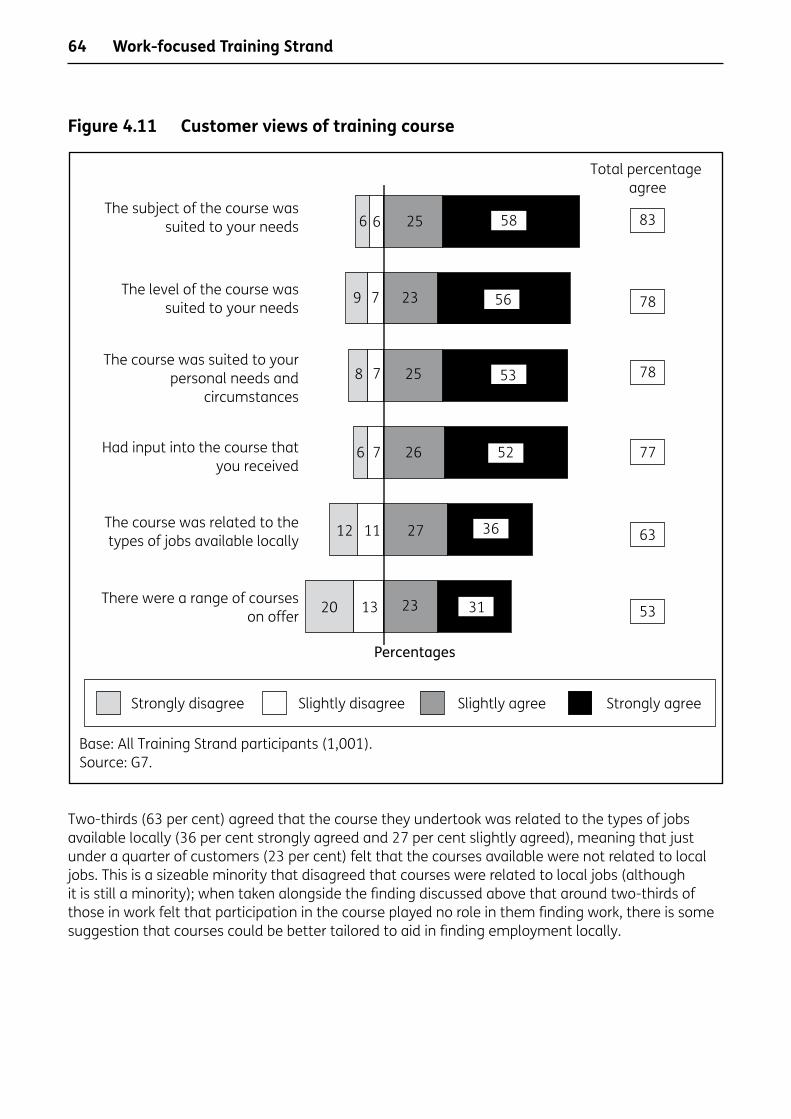
64
Figure 4.11 Customer views of training course
Two-thirds (63 per cent) agreed that the course they undertook was related to the types of jobs available locally (36 per cent strongly agreed and 27 per cent slightly agreed), meaning that just under a quarter of customers (23 per cent) felt that the courses available were not related to local jobs. This is a sizeable minority that disagreed that courses were related to local jobs (although it is still a minority); when taken alongside the finding discussed above that around two-thirds of those in work felt that participation in the course played no role in them finding work, there is some suggestion that courses could be better tailored to aid in finding employment locally.
Base: All Training Strand participants (1,001).Source: G7.
The subject of the course wassuited to your needs
Percentages
Total percentage agree
The level of the course wassuited to your needs
The course was suited to yourpersonal needs and
circumstances
Had input into the course thatyou received
The course was related to thetypes of jobs available locally
Strongly disagree Slightly disagree Slightly agree Strongly agree
83
78
78
77
63
53There were a range of courses
on offer
5825
23 56
25 53
26 52
27 36
23 3120 13
11
7
12
6
78
79
66
Work-focused Training Strand
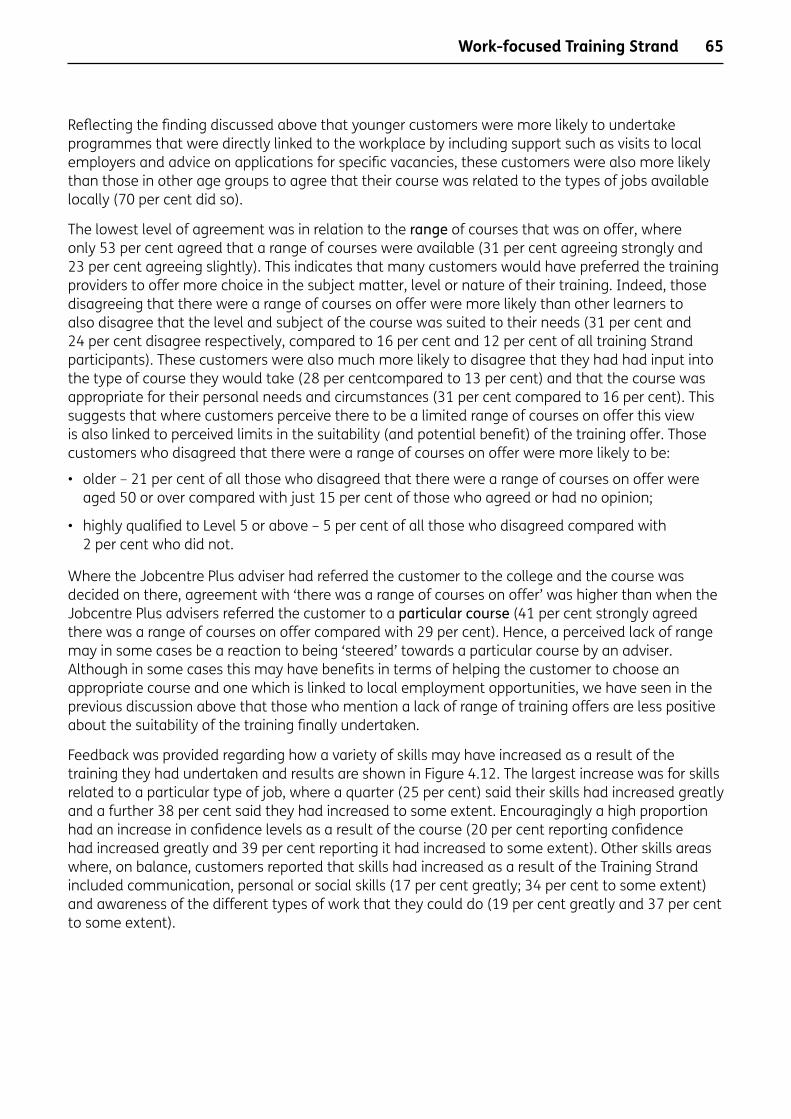
65
Reflecting the finding discussed above that younger customers were more likely to undertake programmes that were directly linked to the workplace by including support such as visits to local employers and advice on applications for specific vacancies, these customers were also more likely than those in other age groups to agree that their course was related to the types of jobs available locally (70 per cent did so).
The lowest level of agreement was in relation to the range of courses that was on offer, where only 53 per cent agreed that a range of courses were available (31 per cent agreeing strongly and 23 per cent agreeing slightly). This indicates that many customers would have preferred the training providers to offer more choice in the subject matter, level or nature of their training. Indeed, those disagreeing that there were a range of courses on offer were more likely than other learners to also disagree that the level and subject of the course was suited to their needs (31 per cent and 24 per cent disagree respectively, compared to 16 per cent and 12 per cent of all training Strand participants). These customers were also much more likely to disagree that they had had input into the type of course they would take (28 per centcompared to 13 per cent) and that the course was appropriate for their personal needs and circumstances (31 per cent compared to 16 per cent). This suggests that where customers perceive there to be a limited range of courses on offer this view is also linked to perceived limits in the suitability (and potential benefit) of the training offer. Those customers who disagreed that there were a range of courses on offer were more likely to be:
• older – 21 per cent of all those who disagreed that there were a range of courses on offer were aged 50 or over compared with just 15 per cent of those who agreed or had no opinion;
• highly qualified to Level 5 or above – 5 per cent of all those who disagreed compared with 2 per cent who did not.
Where the Jobcentre Plus adviser had referred the customer to the college and the course was decided on there, agreement with ‘there was a range of courses on offer’ was higher than when the Jobcentre Plus advisers referred the customer to a particular course (41 per cent strongly agreed there was a range of courses on offer compared with 29 per cent). Hence, a perceived lack of range may in some cases be a reaction to being ‘steered’ towards a particular course by an adviser. Although in some cases this may have benefits in terms of helping the customer to choose an appropriate course and one which is linked to local employment opportunities, we have seen in the previous discussion above that those who mention a lack of range of training offers are less positive about the suitability of the training finally undertaken.
Feedback was provided regarding how a variety of skills may have increased as a result of the training they had undertaken and results are shown in Figure 4.12. The largest increase was for skills related to a particular type of job, where a quarter (25 per cent) said their skills had increased greatly and a further 38 per cent said they had increased to some extent. Encouragingly a high proportion had an increase in confidence levels as a result of the course (20 per cent reporting confidence had increased greatly and 39 per cent reporting it had increased to some extent). Other skills areas where, on balance, customers reported that skills had increased as a result of the Training Strand included communication, personal or social skills (17 per cent greatly; 34 per cent to some extent) and awareness of the different types of work that they could do (19 per cent greatly and 37 per cent to some extent).
Work-focused Training Strand
66
Figure 4.12 Skills gained as a result of participation in Training Strand
There were other areas where at least half felt there had been no change as a result of the training course. These included team working skills (51 per cent felt these did not increase at all), organisational skills (54 per cent), reading, writing, maths, numeracy or English language skills (73 per cent) and IT or computer skills (66 per cent). However, it is encouraging that skills particularly related to finding employment (e.g. skills related to a particular type of job, awareness of the different types of work you could do) increased for a slight majority.
Overall, half (50 per cent) of all customers reported that at least one skill area had increased greatly as a result of the course.
This proportion increased with length of course with two-thirds (66 per cent) of those on courses lasting ten weeks or more reporting a great increase in at least one skill area compared with just over two in five (43 per cent) of those on courses lasting less than a week.
Those on health and safety or first aid courses and those on courses leading to a CSCS card, SIA licence of forklift licence were more likely than the average for all training strand participants to report a great increase in any skill area (59 per cent and 57 per cent respectively).
Source: G18.
Increased greatly
No change
Increased to some extent
Percentages
Base: All Volunteering Strand claimants (1,001).
37 48 51 54 73 66 40 43
Skills
related to
a
particu
lar typ
e of job
Communicatio
n, perso
nal
or socia
l skil
ls
Team w
orking sk
ills
Organisatio
nal skil
ls
Reading, writ
ing, math
s,
numeracy or E
nglish
language skills
IT or c
omputer skil
ls
Confidence
Awareness of t
he different
types o
f work
you co
uld do
25
38
17
34
18
31
15
3118
812
21
20
39
19
37
Work-focused Training Strand

67
4.5 Claim status and hard outcomesFinally in this chapter, we outline the overall claim and employment outcomes of customers on the Training Strand.
Figure 4.13 illustrates whether they:
• had entered paid work at any point after starting the training;
• had ended their JSA claim but had not entered paid work at any point; or
• were still claiming and had done so continuously since before starting the training.
It also illustrates the proportion who ended their claim at some point after starting the training but had returned to claiming by the time of the research fieldwork.
Figure 4.13 Summary of claim status and hard outcomes
As shown in Figure 4.14, just under two-thirds (64 per cent) of Training Strand customers had not ended their original claim by the time of the research, a quarter (24 per cent) had left JSA and entered paid work at some point, and around one in eight (12 per cent) had ended their original claim but had not entered work.
Among the 12 per cent who ended their original claim but did not enter paid work, just under half (representing 5 per cent of all customers) had returned to claiming by the time of the research. Among those who had entered paid work, the majority (81 per cent) were still in paid work by the time of the interview (representing 19 per cent of all training strand participants). A small proportion (4 per cent) had entered paid work after participation in the Training Strand but were claiming JSA again at the time of the research.
Base: All Training Strand claimants (1,001).Source: B1, B2, B5 and C1.
PercentagesDid not end original claimEnded original claim butdid not enter paid work
Entered paid work
Returned to JSANot returned to JSA
Returned to JSANot returned to JSA and not in paid workCurrently in paid work
5
7
4
19
112
24
64
Work-focused Training Strand

68
Nearly three in 10 (28 per cent) Training Strand customers had ended their claim and had not returned to JSA by the time of the research and just under a fifth (19 per cent) were in paid work.
Looking just among those customers who started their course at least six months before the survey fieldwork (i.e. course start dates between April and September 2009), this rises to 36 per cent of customers not claiming at the time of the research and 26 per cent being in paid work. This claim status outcome is comparable to that observed among the JRFND Stage 3 survey cohort (across both phases) where 37 per cent were not claiming when interviewed around six months after entering JRFND Stage 3/NDYP/six months of consecutive claiming. Furthermore, customers on the 6MO Training Strand (April to September starts only) were more likely to be in paid work when interviewed for the 6MO survey in March 2010 than the JRFND Stage 3 survey cohort (26 per cent in paid work compared with 23 per cent).
Where individuals had completed their training course, paid work rates were unsurprisingly higher than where the individuals were still on the course at the time of interview (19 per cent compared to 4 per cent). However, it should be noted that those who had stopped their course before completing had higher rates of paid work at the time of interview (34 per cent). Further impact analysis will be needed to understand the impact of starting compared to completing the training on the ability of individuals to find work, and how time considerations come into play.
Employment outcomes showed little variation by type of training undertaken. Customers on IT courses were, however, more likely to have ended claims and remained not claiming by the time of the research (35 per cent were not claiming compared with 28 per cent of all training customers). These customers were no more likely to have gone into paid work though, suggesting that they were more likely to end claims for other destinations.
Figure 4.14 outlines the type of work entered35, showing the proportions entering a full-time paid role with an employer, a part-time paid role and self-employment. For completeness, Figure 4.14 also shows the proportions who were still claiming and had done so continuously since starting their original claim and those who ended their original JSA claim but who had not entered paid work at any point.
As discussed above, almost two-thirds (64 per cent) had not ended their original JSA claim. Where customers had entered paid work, this was most commonly full-time work with an employer, with 16 per cent having entered full-time paid work, followed by part-time work with an employer (6 per cent). A very small minority (2 per cent) were working on a self-employed basis.
35 If the customer had taken up more than one form of paid work they were asked to identify their ‘main’ (if currently working) or most recent (if returned to claiming JSA or no longer currently working) job to enable later questions about their work to focus on one role.
Work-focused Training Strand
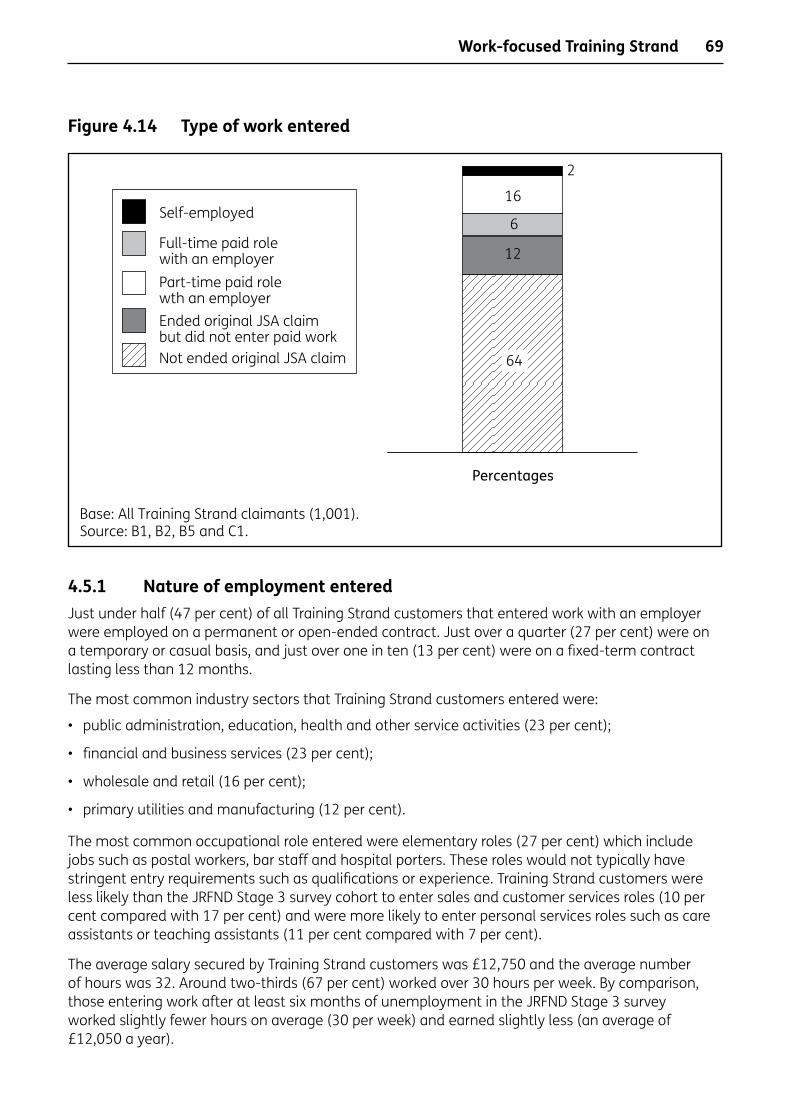
69
Figure 4.14 Type of work entered
4.5.1 Nature of employment enteredJust under half (47 per cent) of all Training Strand customers that entered work with an employer were employed on a permanent or open-ended contract. Just over a quarter (27 per cent) were on a temporary or casual basis, and just over one in ten (13 per cent) were on a fixed-term contract lasting less than 12 months.
The most common industry sectors that Training Strand customers entered were:
• public administration, education, health and other service activities (23 per cent);
• financial and business services (23 per cent);
• wholesale and retail (16 per cent);
• primary utilities and manufacturing (12 per cent).
The most common occupational role entered were elementary roles (27 per cent) which include jobs such as postal workers, bar staff and hospital porters. These roles would not typically have stringent entry requirements such as qualifications or experience. Training Strand customers were less likely than the JRFND Stage 3 survey cohort to enter sales and customer services roles (10 per cent compared with 17 per cent) and were more likely to enter personal services roles such as care assistants or teaching assistants (11 per cent compared with 7 per cent).
The average salary secured by Training Strand customers was £12,750 and the average number of hours was 32. Around two-thirds (67 per cent) worked over 30 hours per week. By comparison, those entering work after at least six months of unemployment in the JRFND Stage 3 survey worked slightly fewer hours on average (30 per week) and earned slightly less (an average of £12,050 a year).
Base: All Training Strand claimants (1,001).Source: B1, B2, B5 and C1.
2
Self-employed
Full-time paid role with an employerPart-time paid role wth an employerEnded original JSA claim but did not enter paid workNot ended original JSA claim
16
6
12
64
Percentages
Work-focused Training Strand

70
The Training Strand of the 6MO was designed to deliver pre-employment work focused training to customers. An important element of the programme design is that on completion of the training, colleges link up with employers to provide post-employment training and development for individuals as part of the Integrated Employment and Skills (IES) agenda. Where possible this post-employment training should draw on Train to Gain and Apprenticeship provision. To explore the extent of post-employment training being offered, those customers who had found paid work were asked whether they had received training in the role.
Around a quarter of those Training Strand customers (24 per cent) who had entered paid work with an employer had done further training in their job role. For just under half (46 per cent) of these customers the post-employment training was designed to lead to either part or all of a recognised qualification. This is equivalent to one in ten (11 per cent) Training Strand customers who entered paid work with an employer. This percentage is in line with the one in ten (10 per cent) customers who had entered work with an employer at the JRFND Stage 3 survey36 who reported that they were training towards a full or part qualification with their employer37.
Among the customers in work who had not undertaken any post-employment training, a third (34 per cent) felt that their employer will offer training towards a qualification in the future, and just over half did not think it would (54 per cent).
4.6 SummaryCompared with the profile of the wider population of customers reaching their sixth consecutive month of JSA claiming, Training Strand customers were more likely to be older, male and from a White British background. They were also more likely to be repeat JSA customers and have no or low qualifications than all customers reaching the six-month point of their claim.
They were undertaking a variety of courses ranging from short courses leading towards a certificate or licence needed to enter an industry such as a construction CSCS card or SIA security licence, to longer courses in IT. On average courses lasted eight weeks, although for around a quarter the course was completed in under a week. Around half of all customers could recall the course involving an element of employment support or direct links with employers.
The great majority had been referred to the Training Strand by Jobcentre Plus or Next Step (rather than hearing about the offer from the college) and the majority had discussed the specific course they would undertake with their adviser. On the whole customers felt the course was well suited to their needs, although for some the range of courses on offer was limited and more could have been done to link the course with the local labour market.
36 Base sizes are low for those entering paid work with an employer after starting a training course, at least six months. Longer-term outcomes will be explored more fully in the 6MO longitudinal surveys in spring 2011.
37 It should be noted that the populations are not directly comparable as Training Strand customers include stock customers who were excluded from the JRFND surveys.
Work-focused Training Strand

71
Participation in the Training Strand appeared to have a positive effect in some areas with at least three in five customers in each case reporting increases in confidence, motivation to find work and enthusiasm to undertake further learning in future. Similar proportions reported an increase in skills related to a particular type of job. These positive outcomes were particularly likely to be reported by those training towards a specific certificate, card or licence that was often a pre-requisite for employment in a particular sector (e.g. the CSCS card) and were less commonly mentioned by those on an IT course, including those on the ECDL course.
In terms of employment and claim status outcomes, approaching three in ten Training Strand customers had ended their claim and had not returned to JSA by the time of the research and just under a fifth were in paid work. Among those who started their course at least six months before the survey fieldwork (course start dates between April and September 2009), this rises to over a third of customers not claiming at the time of the research and over a quarter in paid work. There were some early indications that this work may be slightly higher skilled, more likely to be full-time and more secure than that entered by customers reaching the six-month point of their claim generally.
Work-focused Training Strand

73
5 Recruitment Subsidy StrandThis chapter focuses on customers who entered work that attracted the Six Month Offer (6MO) Recruitment Subsidy. Within this group, we look customers who had been recruited via both the self-marketing and the bulk billing routes. This chapter explores;
• the profile of those entering work as a result of the Recruitment Subsidy between April and December 2009;
• the process of customers receiving and using the self-marketing voucher;
• the nature of the work entered;
• the current status (at the time of interview) of those entering work as a result of the Recruitment Subsidy.
5.1 Profile of Recruitment Subsidy customersTable 5.1 shows the profile of those entering jobs that attracted the Recruitment Subsidy. As in previous chapters, all demographic information is based on the information provided by customers at the time of interview (except for subsidy type – voucher or bulk) which was supplied by the Department for Work and Pensions (DWP). The profile of all customers with claims lasting at least six months is shown for comparison.
Table 5.1 Demographic profile of Recruitment Subsidy customers
Recruitment Subsidy (all)
%
Recruitment Subsidy (self-
marketing route) %
Recruitment Subsidy (bulk billing route)
%
All customers at six month point
of claim1 %
Subsidy type
Self-marketing route 81 100 - -Bulk billing route 19 - 100 -
Gender
Male 75 73* 82 75Female 25 27* 18 25
Age
18-24 22 18 40* 3925-49 57 59* 50 4250+ 18 20* 9 18
Ethnicity2
White British 91 91 89 84Ethnic minority 9 9 11 16
Disability status
Health condition/disability 9 9 11 15No health condition/disability 91 91 89 85
continued
Recruitment Subsidy Strand
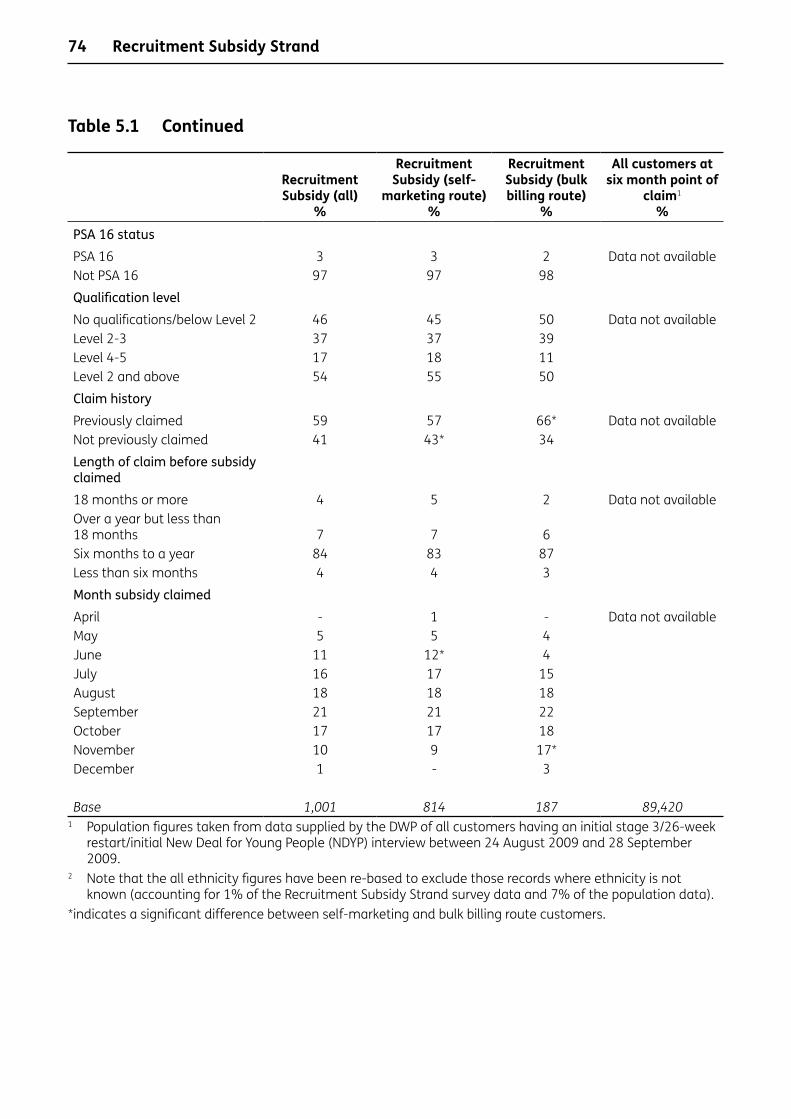
74
Table 5.1 Continued
Recruitment Subsidy (all)
%
Recruitment Subsidy (self-
marketing route) %
Recruitment Subsidy (bulk billing route)
%
All customers at six month point of
claim1 %
PSA 16 statusPSA 16 3 3 2 Data not availableNot PSA 16 97 97 98
Qualification levelNo qualifications/below Level 2 46 45 50 Data not availableLevel 2-3 37 37 39Level 4-5 17 18 11Level 2 and above 54 55 50
Claim historyPreviously claimed 59 57 66* Data not availableNot previously claimed 41 43* 34
Length of claim before subsidy claimed18 months or more 4 5 2 Data not availableOver a year but less than 18 months 7 7 6Six months to a year 84 83 87Less than six months 4 4 3
Month subsidy claimedApril - 1 - Data not availableMay 5 5 4June 11 12* 4July 16 17 15August 18 18 18September 21 21 22October 17 17 18November 10 9 17*December 1 - 3
Base 1,001 814 187 89,4201 Population figures taken from data supplied by the DWP of all customers having an initial stage 3/26-week
restart/initial New Deal for Young People (NDYP) interview between 24 August 2009 and 28 September 2009.
2 Note that the all ethnicity figures have been re-based to exclude those records where ethnicity is not known (accounting for 1% of the Recruitment Subsidy Strand survey data and 7% of the population data).
*indicates a significant difference between self-marketing and bulk billing route customers.
Recruitment Subsidy Strand
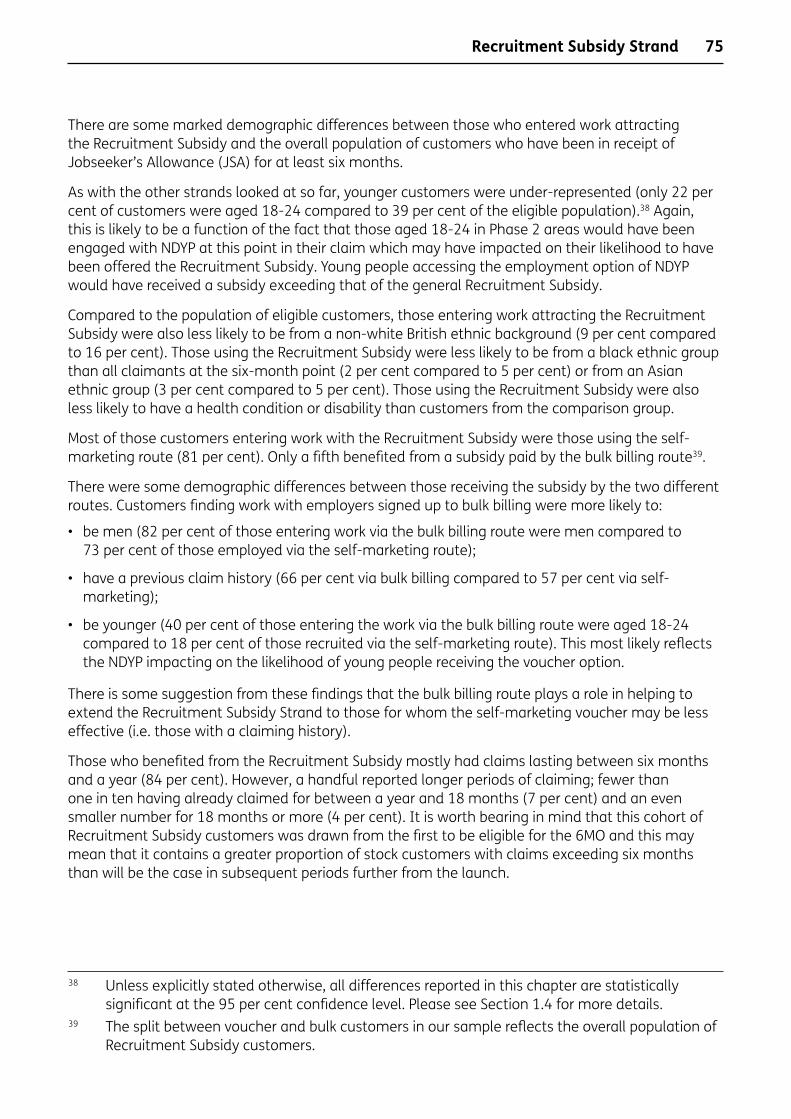
75
There are some marked demographic differences between those who entered work attracting the Recruitment Subsidy and the overall population of customers who have been in receipt of Jobseeker’s Allowance (JSA) for at least six months.
As with the other strands looked at so far, younger customers were under-represented (only 22 per cent of customers were aged 18-24 compared to 39 per cent of the eligible population).38 Again, this is likely to be a function of the fact that those aged 18-24 in Phase 2 areas would have been engaged with NDYP at this point in their claim which may have impacted on their likelihood to have been offered the Recruitment Subsidy. Young people accessing the employment option of NDYP would have received a subsidy exceeding that of the general Recruitment Subsidy.
Compared to the population of eligible customers, those entering work attracting the Recruitment Subsidy were also less likely to be from a non-white British ethnic background (9 per cent compared to 16 per cent). Those using the Recruitment Subsidy were less likely to be from a black ethnic group than all claimants at the six-month point (2 per cent compared to 5 per cent) or from an Asian ethnic group (3 per cent compared to 5 per cent). Those using the Recruitment Subsidy were also less likely to have a health condition or disability than customers from the comparison group.
Most of those customers entering work with the Recruitment Subsidy were those using the self-marketing route (81 per cent). Only a fifth benefited from a subsidy paid by the bulk billing route39.
There were some demographic differences between those receiving the subsidy by the two different routes. Customers finding work with employers signed up to bulk billing were more likely to:
• be men (82 per cent of those entering work via the bulk billing route were men compared to 73 per cent of those employed via the self-marketing route);
• have a previous claim history (66 per cent via bulk billing compared to 57 per cent via self-marketing);
• be younger (40 per cent of those entering the work via the bulk billing route were aged 18-24 compared to 18 per cent of those recruited via the self-marketing route). This most likely reflects the NDYP impacting on the likelihood of young people receiving the voucher option.
There is some suggestion from these findings that the bulk billing route plays a role in helping to extend the Recruitment Subsidy Strand to those for whom the self-marketing voucher may be less effective (i.e. those with a claiming history).
Those who benefited from the Recruitment Subsidy mostly had claims lasting between six months and a year (84 per cent). However, a handful reported longer periods of claiming; fewer than one in ten having already claimed for between a year and 18 months (7 per cent) and an even smaller number for 18 months or more (4 per cent). It is worth bearing in mind that this cohort of Recruitment Subsidy customers was drawn from the first to be eligible for the 6MO and this may mean that it contains a greater proportion of stock customers with claims exceeding six months than will be the case in subsequent periods further from the launch.
38 Unless explicitly stated otherwise, all differences reported in this chapter are statistically significant at the 95 per cent confidence level. Please see Section 1.4 for more details.
39 The split between voucher and bulk customers in our sample reflects the overall population of Recruitment Subsidy customers.
Recruitment Subsidy Strand
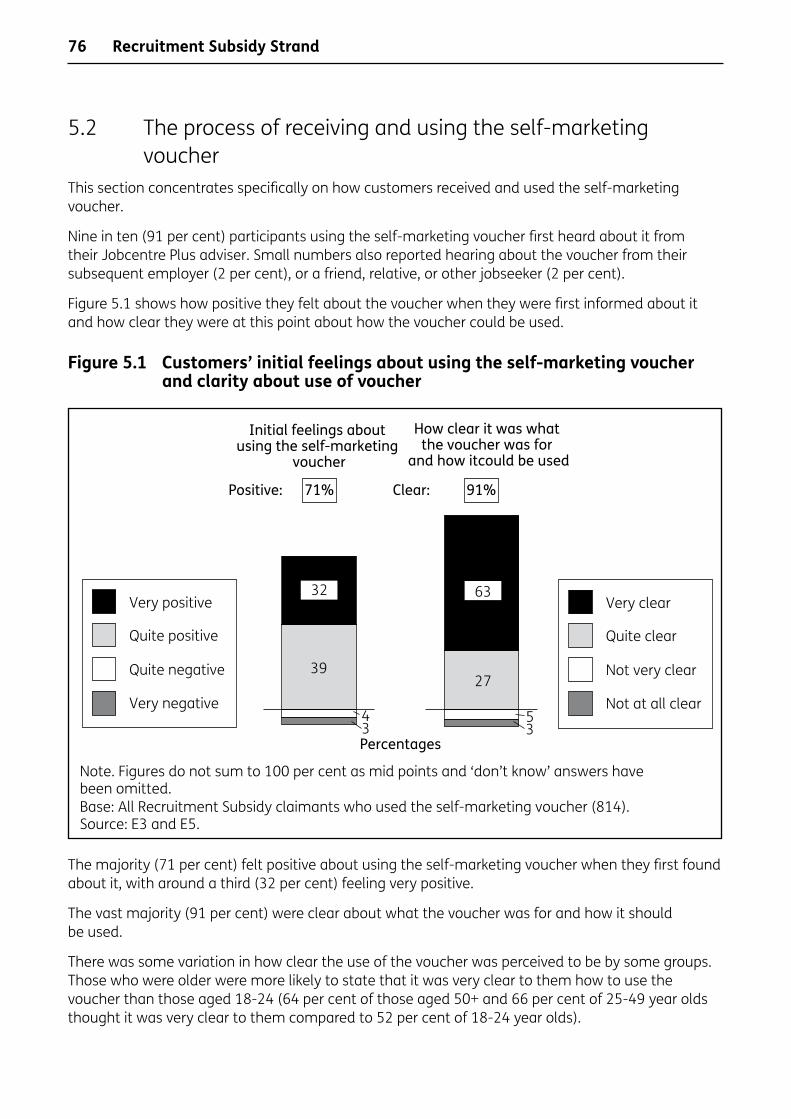
76
5.2 The process of receiving and using the self-marketing voucherThis section concentrates specifically on how customers received and used the self-marketing voucher.
Nine in ten (91 per cent) participants using the self-marketing voucher first heard about it from their Jobcentre Plus adviser. Small numbers also reported hearing about the voucher from their subsequent employer (2 per cent), or a friend, relative, or other jobseeker (2 per cent).
Figure 5.1 shows how positive they felt about the voucher when they were first informed about it and how clear they were at this point about how the voucher could be used.
Figure 5.1 Customers’ initial feelings about using the self-marketing voucher and clarity about use of voucher
The majority (71 per cent) felt positive about using the self-marketing voucher when they first found about it, with around a third (32 per cent) feeling very positive.
The vast majority (91 per cent) were clear about what the voucher was for and how it should be used.
There was some variation in how clear the use of the voucher was perceived to be by some groups. Those who were older were more likely to state that it was very clear to them how to use the voucher than those aged 18-24 (64 per cent of those aged 50+ and 66 per cent of 25-49 year olds thought it was very clear to them compared to 52 per cent of 18-24 year olds).
Base: All Recruitment Subsidy claimants who used the self-marketing voucher (814).Source: E3 and E5.
Percentages
Very positive
Quite positive
Quite negative
Very negative
Note. Figures do not sum to 100 per cent as mid points and ‘don’t know’ answers have been omitted.
How clear it was what the voucher was for
and how itcould be used
Initial feelings about using the self-marketing
voucher
Very clear
Quite clear
Not very clear
Not at all clear
32 63
3927
43
53
Positive: 71% Clear: 91%
Recruitment Subsidy Strand

77
Ethnic minority customers, however, were twice as likely to say that it was not clear to them what the voucher was for and how to use it (16 per cent of ethnic minority customers and 8 per cent of white British customers).
It should be noted that by definition, all of the customers who were asked about the clarity of the voucher went on to secure employment via the Recruitment Subsidy. However, those who stated that they were less clear about how to use the voucher (younger and ethnic minority customers) are among those under-represented among those accessing the Recruitment Subsidy Strand. These findings indicate that a lack of understanding about how to use the voucher may be a reason for lower take-up among these groups. Such issues have been recognised and work has already been undertaken in 2010 to redesign the self-marketing voucher and include clearer explanations for its use.
Nearly all voucher users (95 per cent) had some contact with their Jobcentre Plus adviser about the voucher. They were asked how the adviser suggested using the voucher. In most cases, the adviser suggested mentioning the voucher during interviews (66 per cent), and in around two-fifths of cases (44 per cent) advisers suggested they mention the voucher on their CV or in their application form(s).
In a fifth of cases (19 per cent) it was stated that advisers did not suggest any ways in which the voucher should be used. Those who were older (aged 50+) were particularly likely to state that they did not receive any suggestions from their adviser about how to use the voucher (27 per cent compared to 17 per cent of customers aged 18-49).
Figure 5.2 illustrates where and how frequently the Recruitment Subsidy was mentioned when applying for a role with an employer.
Figure 5.2 Use of the Recruitment Subsidy
Recruitment Subsidy Strand
Percentages
Base: All Recuritment Subsidy claimants who used the self-marketing voucher.Source: E7.
All of the timeSome of the timeNot at all
Not applicable:
On CV/application forms
During interviews
Not applicable:
20
8
42
12
51
29
19% 16%

78
Less than a third mentioned the Recruitment Subsidy on CVs or application forms (28 per cent). Most of those who chose to mention it at this point mentioned it on all CVs and/or application forms that they submitted.
Almost twice as many mentioned Recruitment Subsidy during a job interview than on a CV or application form (54 per cent). Just over two-fifths mentioned it in all interviews, with around one in ten (12 per cent) mentioning it during only some.
A fifth (19 per cent) stated that mentioning the Recruitment Subsidy on an application form was not relevant to them because they did not submit any application forms. A slightly smaller proportion stated that they did not attend any interviews. This indicates a reasonable minority securing employment through less formal recruitment routes.
In addition, one in 20 (5 per cent) only mentioned the Recruitment Subsidy after starting work with their employer. In this small number of cases the Recruitment Subsidy cannot have influenced the employer’s decision to hire.
To try to understand selective reference to the Recruitment Subsidy, those who did not mention the self-marketing voucher in all of their application forms and/or all job interviews were asked why this was. The reasons given are shown in Figure 5.3.
Figure 5.3 Reasons for not mentioning the self-marketing voucher on all CVs/ applications/during all interviews
Recruitment Subsidy Strand
Base: All Recruitment Subsidy claimants who did not mention the voucher on all CVs/applicationforms submitted/during all interviews (525).Source: E8.
Percentages
14
Don’t know
Other
Employer would not be interested in receivinga payment
Embarrassment
Identifies you as being long-term unemployed
Did not understand how the voucher could be used
Forgot about it
Already had the job
Felt it was irrelevant
Wanted to gain job on own merit
Only had a few interviews
Did not have the voucher to hand at the timeof interview
Voucher not appropriate to type of employer
13
10
9
9
9
7
6
5
5
4
8
6
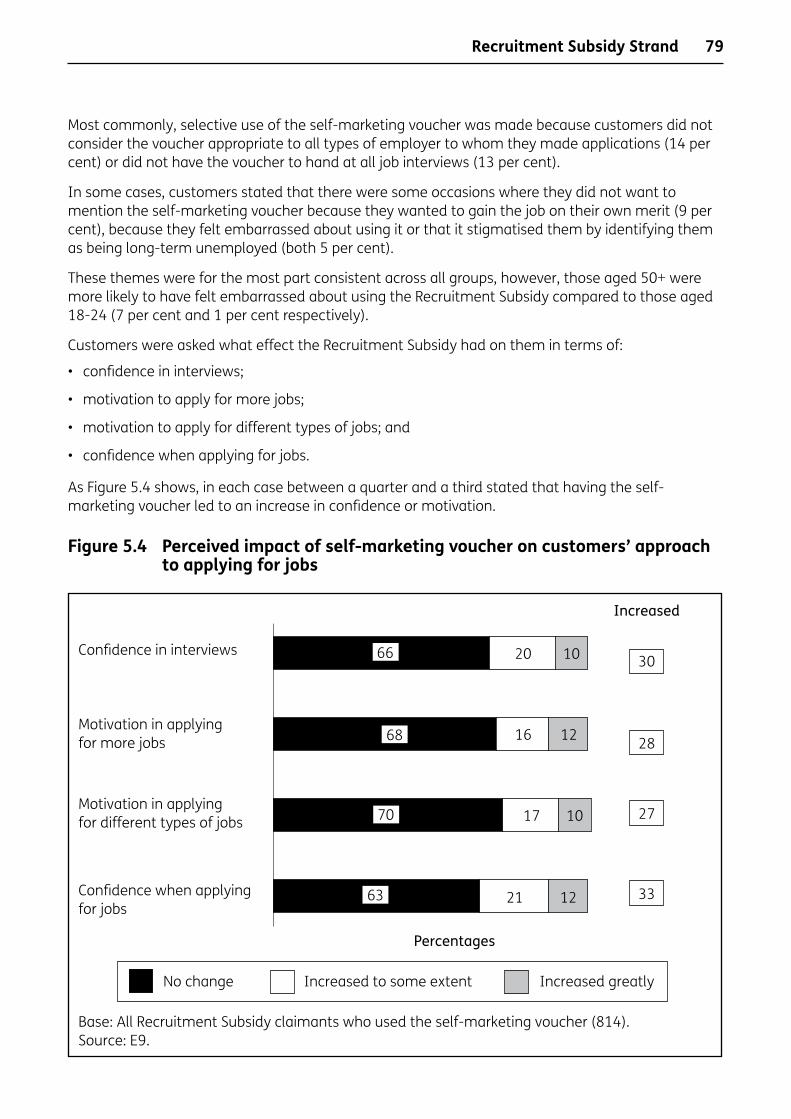
79
Most commonly, selective use of the self-marketing voucher was made because customers did not consider the voucher appropriate to all types of employer to whom they made applications (14 per cent) or did not have the voucher to hand at all job interviews (13 per cent).
In some cases, customers stated that there were some occasions where they did not want to mention the self-marketing voucher because they wanted to gain the job on their own merit (9 per cent), because they felt embarrassed about using it or that it stigmatised them by identifying them as being long-term unemployed (both 5 per cent).
These themes were for the most part consistent across all groups, however, those aged 50+ were more likely to have felt embarrassed about using the Recruitment Subsidy compared to those aged 18-24 (7 per cent and 1 per cent respectively).
Customers were asked what effect the Recruitment Subsidy had on them in terms of:
• confidence in interviews;
• motivation to apply for more jobs;
• motivation to apply for different types of jobs; and
• confidence when applying for jobs.
As Figure 5.4 shows, in each case between a quarter and a third stated that having the self-marketing voucher led to an increase in confidence or motivation.
Figure 5.4 Perceived impact of self-marketing voucher on customers’ approach to applying for jobs
Recruitment Subsidy Strand
Base: All Recruitment Subsidy claimants who used the self-marketing voucher (814).Source: E9.
Confidence in interviews
Percentages
Increased
Motivation in applyingfor more jobs
Motivation in applyingfor different types of jobs
Confidence when applying for jobs
No change Increased to some extent Increased greatly
30
28
27
33
66
68
70
63
20
16
17
21
10
12
10
12

80
They were most likely to report an increase (either to some extent or greatly) in confidence when applying for jobs (33 per cent).
Some groups were more likely to report the Recruitment Subsidy having a positive effect on them; most notably those aged 18-24 and ethnic minority customers.
Indeed, ethnic minority customers were more likely to report a great increase across all measures:
• confidence during job interviews (25 per cent compared to 9 per cent of white British customers);
• motivation to apply for more jobs (30 per cent and 11 per cent);
• motivation to apply for different types of jobs (21 per cent and 9 per cent);
• confidence when applying for jobs (32 per cent and 10 per cent).
Those aged 18-24 were more likely to report an increase in their motivation to apply for:
• more jobs (42 per cent compared to 28 per cent overall);
• different types of job (38 per cent compared to 27 per cent overall).
They were also more likely to report that their confidence when applying for jobs had increased greatly as a result of using the Recruitment Subsidy (19 per cent compared to 12 per cent overall).
These two groups (ethnic minority customers and those aged 18-24) were among the least likely to have used the Recruitment Subsidy voucher (that is they are under-represented among those entering work via the self-marketing voucher route compared to their presence in the population of all those with claims lasting at least six months). Yet those who did make use of the self-marketing voucher are the most likely to report increases in motivation and confidence from receiving it. This indicates either that among these groups advisers were particularly targeting those who they felt would react well to the voucher or that, to a greater extent than for other groups, only those who felt an increase in motivation or confidence from receipt of the self-marketing voucher who went on to use it to secure employment. As the findings in Chapter 3 demonstrate that the self-marketing voucher is widely distributed, the latter is more likely.
5.3 Perceived role of Recruitment Subsidy in securing employmentFigure 5.5 shows the impact that customers felt the Recruitment Subsidy had on securing their job. They were asked to state whether they felt that their employment was a direct result of the Recruitment Subsidy, partly as a result of the Recruitment Subsidy or not related to the Recruitment Subsidy at all. In most cases it will not be possible for customers to know the motivations of the employers definitively but this question gives insight into their perceptions.
Recruitment Subsidy Strand
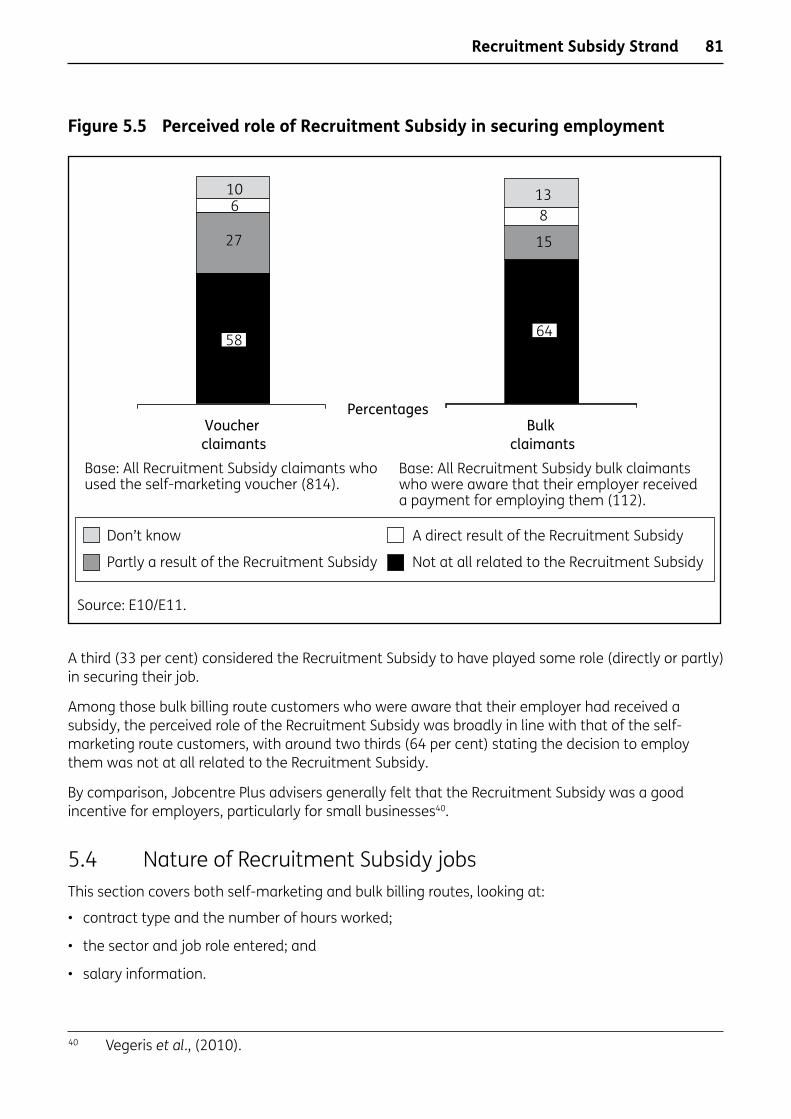
81
Figure 5.5 Perceived role of Recruitment Subsidy in securing employment
A third (33 per cent) considered the Recruitment Subsidy to have played some role (directly or partly) in securing their job.
Among those bulk billing route customers who were aware that their employer had received a subsidy, the perceived role of the Recruitment Subsidy was broadly in line with that of the self-marketing route customers, with around two thirds (64 per cent) stating the decision to employ them was not at all related to the Recruitment Subsidy.
By comparison, Jobcentre Plus advisers generally felt that the Recruitment Subsidy was a good incentive for employers, particularly for small businesses40.
5.4 Nature of Recruitment Subsidy jobs This section covers both self-marketing and bulk billing routes, looking at:
• contract type and the number of hours worked;
• the sector and job role entered; and
• salary information.
40 Vegeris etal., (2010).
Recruitment Subsidy Strand
Percentages
Source: E10/E11.
Don’t know A direct result of the Recruitment Subsidy
Partly a result of the Recruitment Subsidy
Voucher claimants
Bulk claimants
Base: All Recruitment Subsidy claimants whoused the self-marketing voucher (814).
Base: All Recruitment Subsidy bulk claimants who were aware that their employer received a payment for employing them (112).
Not at all related to the Recruitment Subsidy
106
27
138
15
58 64
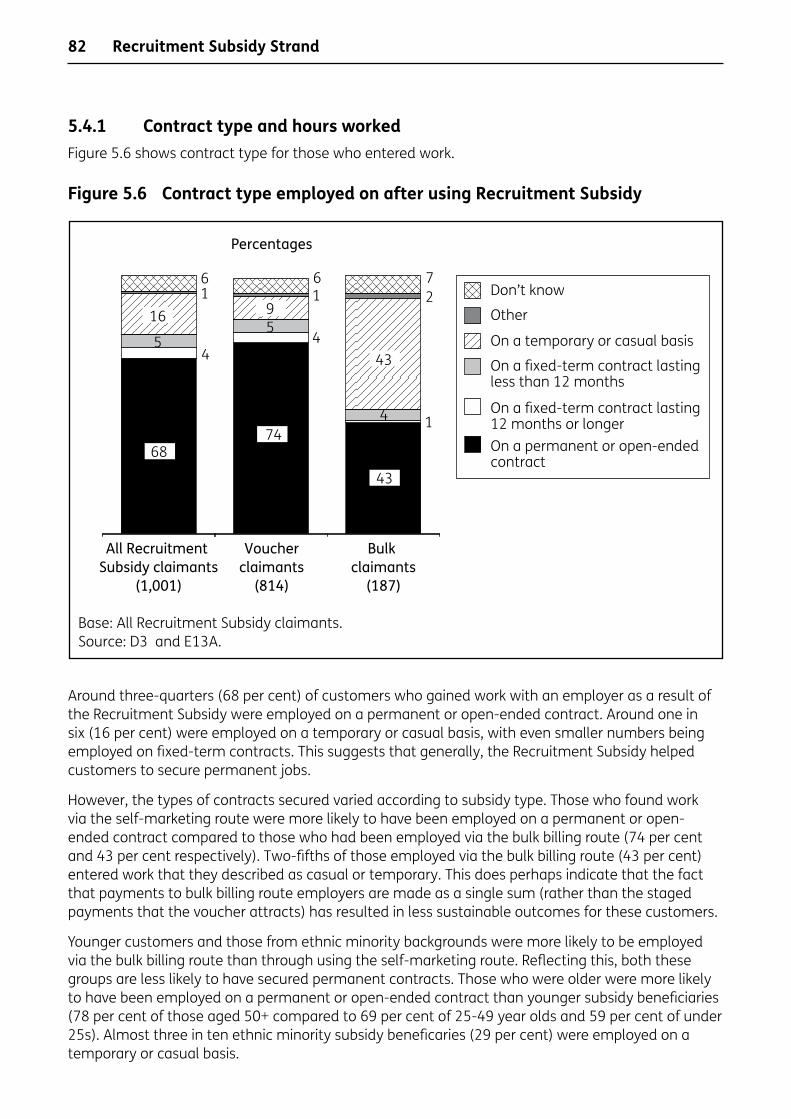
82
5.4.1 Contract type and hours workedFigure 5.6 shows contract type for those who entered work.
Figure 5.6 Contract type employed on after using Recruitment Subsidy
Around three-quarters (68 per cent) of customers who gained work with an employer as a result of the Recruitment Subsidy were employed on a permanent or open-ended contract. Around one in six (16 per cent) were employed on a temporary or casual basis, with even smaller numbers being employed on fixed-term contracts. This suggests that generally, the Recruitment Subsidy helped customers to secure permanent jobs.
However, the types of contracts secured varied according to subsidy type. Those who found work via the self-marketing route were more likely to have been employed on a permanent or open-ended contract compared to those who had been employed via the bulk billing route (74 per cent and 43 per cent respectively). Two-fifths of those employed via the bulk billing route (43 per cent) entered work that they described as casual or temporary. This does perhaps indicate that the fact that payments to bulk billing route employers are made as a single sum (rather than the staged payments that the voucher attracts) has resulted in less sustainable outcomes for these customers.
Younger customers and those from ethnic minority backgrounds were more likely to be employed via the bulk billing route than through using the self-marketing route. Reflecting this, both these groups are less likely to have secured permanent contracts. Those who were older were more likely to have been employed on a permanent or open-ended contract than younger subsidy beneficiaries (78 per cent of those aged 50+ compared to 69 per cent of 25-49 year olds and 59 per cent of under 25s). Almost three in ten ethnic minority subsidy beneficaries (29 per cent) were employed on a temporary or casual basis.
Recruitment Subsidy Strand
Percentages
Base: All Recruitment Subsidy claimants.Source: D3 and E13A.
Don’t know
All Recruitment Subsidy claimants
(1,001)
Voucherclaimants
(814)
Bulk claimants
(187)
Other
On a temporary or casual basis
On a fixed-term contract lastingless than 12 months
On a fixed-term contract lasting 12 months or longerOn a permanent or open-ended contract
6874
43
43
916
4
55
44
1
1 1 26 6 7

83
Nearly three-quarters (73 per cent) of those recruited with a subsidy reported working at least 30 hours per week, with a further quarter (24 per cent) working between 16 and 30 hours per week. Since jobs for fewer than 16 hours were only considered eligible for the Recruitment Subsidy in cases where individuals faced significant barriers to work, it is reassuring that only a very small minority of subsidy beneficiaries reported working for fewer than 16 hours.
Figure 5.7 shows how hours worked vary according to customer type.
Figure 5.7 Hours worked
Those entering work via the bulk billing route were more likely to have worked 30 hours or more per week (78 per cent compared to 69 per cent of customers entering work via the self-marketing route).
5.4.2 Sector typeNine in ten Recruitment Subsidy customers entered the private sector (91 per cent), with one in twenty working for either a Government-funded organisation (5 per cent) or a charity or voluntary organisation (4 per cent).
Table 5.2 summarises the more specific sectors entered.
Recruitment Subsidy Strand
Percentages
Base: All Recuritment Subsidy claimants.Source: E13E and E13F.
30 hours or more per weekAt least 16 hours but fewer than 30Less than 16 hours per week
Mean number of hours
Voucher claimants(814)
Bulk claimants(187)
Mean numberof hours
6978
2514
2 2
34 36

84
Table 5.2 Sector entered using the Recruitment Subsidy
Recruitment Subsidy (All) %
Self-marketing route customers
%
Bulk billing route customers
%SectorPrimary, utilities and manufacturing 17 17 18Construction 9 10 3Wholesale and retail 16 15 21Hotels and restaurants 10 11 5Transport and communications 9 9 12Financial and business services 16 15 22Public administration, education, health and other services 15 16 10Don’t know/refused 8 7 10
Base 1,001 814 187
Employment via the Recruitment Subsidy was undertaken across the full range of sectors indicating that employers across the economy were open to this approach.
To get an indication of how representative the jobs secured through the Recruitment Subsidy were of the destinations typically entered by JSA leavers, the sectors of employment above can be compared to the sectors of work entered by those respondents to the JRFND Stage 3/comparison survey who had entered work. Table 5.3 shows sector type entered by 6MO customers and JRFND Stage 3 Jobseekers Regime and Flexible New Deal (JRFND) customers.
Table 5.3 Sector entered after using Recruitment Subsidy/undertaking JRFND Stage 3
Recruitment Subsidy (All)
%
JRFND Stage 3 customers
%Primary, utilities and manufacturing 17* 10Construction 9 8Wholesale and retail 16* 20Hotels and restaurants 10* 6Transport and communications 9 10Financial and business services 16 19Public administration, education, health and other services 15* 18Don’t know/refused 8 9
Base(unweighted/weighted) 1,001 (1,746/1,775)* = Differences are statistically significant at the 95% confidence level.
As can be seen in Table 5.3, Recruitment Subsidy recipients were less likely to have entered the wholesale and retail and the public sectors compared to those covered by the JFRND Stage 3 survey, but were more likely to have entered the primary, utilities and manufacturing and hospitality industries.
Recruitment Subsidy Strand
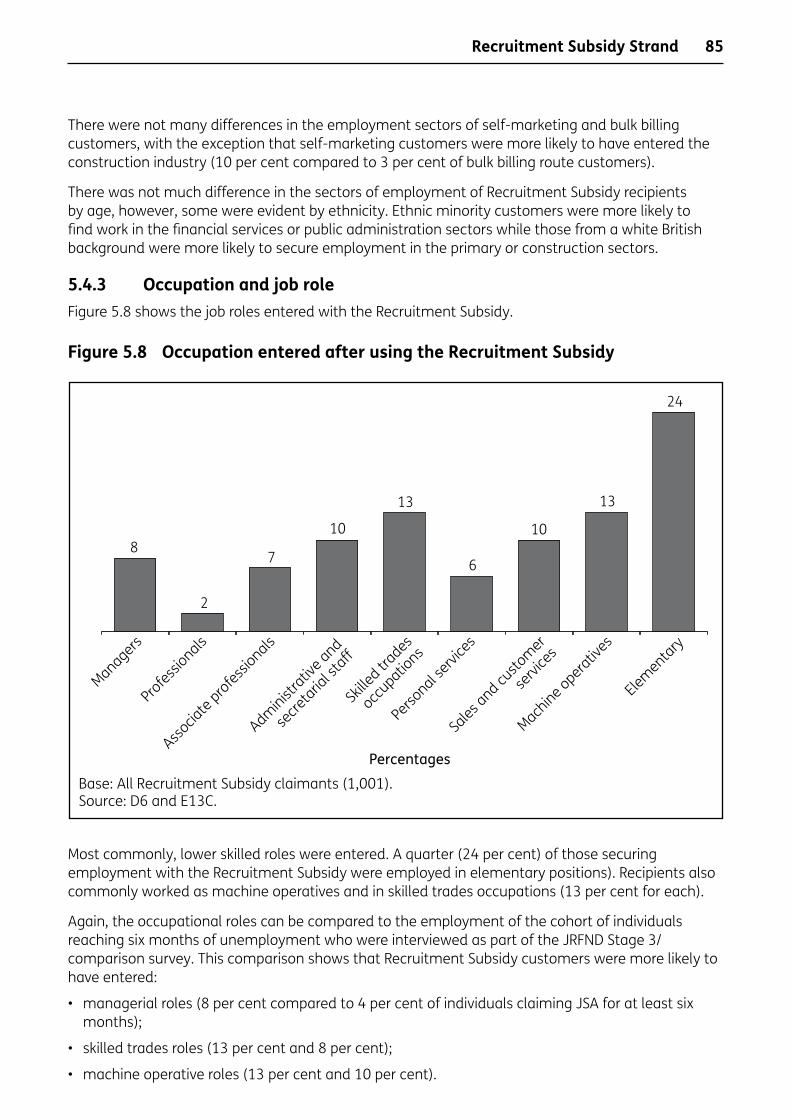
85
There were not many differences in the employment sectors of self-marketing and bulk billing customers, with the exception that self-marketing customers were more likely to have entered the construction industry (10 per cent compared to 3 per cent of bulk billing route customers).
There was not much difference in the sectors of employment of Recruitment Subsidy recipients by age, however, some were evident by ethnicity. Ethnic minority customers were more likely to find work in the financial services or public administration sectors while those from a white British background were more likely to secure employment in the primary or construction sectors.
5.4.3 Occupation and job roleFigure 5.8 shows the job roles entered with the Recruitment Subsidy.
Figure 5.8 Occupation entered after using the Recruitment Subsidy
Most commonly, lower skilled roles were entered. A quarter (24 per cent) of those securing employment with the Recruitment Subsidy were employed in elementary positions). Recipients also commonly worked as machine operatives and in skilled trades occupations (13 per cent for each).
Again, the occupational roles can be compared to the employment of the cohort of individuals reaching six months of unemployment who were interviewed as part of the JRFND Stage 3/comparison survey. This comparison shows that Recruitment Subsidy customers were more likely to have entered:
• managerial roles (8 per cent compared to 4 per cent of individuals claiming JSA for at least six months);
• skilled trades roles (13 per cent and 8 per cent);
• machine operative roles (13 per cent and 10 per cent).
Recruitment Subsidy Strand
Base: All Recruitment Subsidy claimants (1,001).Source: D6 and E13C.
Percentages
24
Managers
Professi
onals
Associa
te professionals
Administrativ
e and
secre
taria
l sta
ff
Skille
d trades
occupatio
ns
Perso
nal servi
ces
Sales a
nd custo
mer
servi
ces
Machine operativ
es
Elementary
13
10
6
13
10
7
2
8

86
They were less likely to have worked in:
• sales and customer services positions (10 per cent and 17 per cent);
• elementary roles (24 per cent and 29 per cent).
Bulk billing route customers (and correspondingly those aged 18-24) were more likely to have entered elementary positions; two-fifths 44 per cent) of those who entered work through the bulk billing route entered elementary positions, compared to 20 per cent of those who entered work through the self-marketing route. One third (33 per cent) of 18-24 year olds who entered work with the Recruitment Subsidy entered elementary positions, compared to one-fifth (22 per cent) of those aged 25 years and over. Conversely, those who were older (and those who were more likely to have entered work via the self-marketing route) were more likely to have entered the highest skilled occupations; 13 per cent of those aged 50+ and 9 per cent of those aged 25-49 entered managerial and senior positions compared to just 1 per cent of 18-24 year olds.
Hence, there is some evidence to suggest that marketing to employers with a requirement for large numbers of recruits results in employment further down the occupational hierarchy (but, as has been shown earlier, it appears to be a more effective route than the self-marketing voucher for some groups – particularly younger customers and those from ethnic minorities).
5.4.4 SalariesSubsidy recipients were asked how much they were paid on an annual, monthly, weekly, daily or hourly basis for the job they gained through the Recruitment Subsidy. Where enough information was provided an estimated annual salary41 was calculated for each individual (Figure 5.9).
Figure 5.9 Annual salaries of those who entered work with an employer after using the Recruitment Subsidy
41 All annual salaries calculated in this section have been rounded to the nearest £50.
Recruitment Subsidy Strand
Note: Annual salary calculated for 89 per cent of subsidy recipients who entered paid work.Base: All Recruitment Subsidy claimants (1,001).Source: D9/14 and E13H/E13M.
Percentages
1
£0-£4,999 £5,000-£9,999
£10,000-£19,999
£20,000-£29,999
£30,000-£40,999
£40,000+
2
8
47
22
8

87
On average Recruitment Subsidy customers reported earning an annual £13,350 salary. Around half of customers (47 per cent) reported earning between £10,000 and £19,999 a year, and a further fifth (22 per cent) between £5,000 and £9,999.
This compares with an average salary of £12,050 secured by those entering work after at least six months of unemployment in the JRFND Stage 3 survey.
Unsurprisingly, older Recruitment Subsidy customers (i.e. those aged 25+ who were more likely to have entered higher skilled occupations) reported earning a higher wage than those aged under 25 years (£14,500 compared to £10,400 respectively).
The following groups also reported earning a higher wage:
• men (£14,450 compared to £10,350 for women);
• white British (£13,600 compared to £10,900 among ethnic minority customers).
Although it was reported earlier that bulk billing route customers were more likely to have entered lower skilled jobs, the difference in average salaries was not that marked. The average salary reported for bulk billing route customers was £12,100 compared with £13,650 for self-marketing route customers.
5.5 Views of suitability of employmentAll customers who had entered work as a result of using the Recruitment Subsidy (both self-marketing and bulk billing customers), were asked how well they felt that this work matched their skills and interests (Figure 5.10)
Figure 5.10 Extent to which customers agree work entered was a good match
Recruitment Subsidy Strand
Base: All Recruitment Subsidy claimants. Source: E17.
All Recruitment Subsidy(1,001)
Percentages
Agree
Voucher claimants(814)
Bulk claimants(187)
Strongly disagree Slightly disagree Slightly agree Strongly agree
69
70
68
43
43
4028
26
27
13
9 8
8 8
7

88
Many customers (69 per cent) considered the employment they secured through the Recruitment Subsidy was a good match for their experience skills and interests, with nearly two in five agreeing strongly with this statement.
Those who were older were more likely to strongly disagree that their work role was well matched (14 per cent of those aged 50+ compared to under 25s and 25-49 year olds (both 8 per cent)). Otherwise, there was not a great deal of variation in attitudes towards the job role secured by customer group.
Customers who disagreed the job they had entered was a good match for their skills were asked why they chose to take on this role (Figure 5.11). In most cases, they took up the employment because they wanted to move into work as soon as possible (88 per cent) or because they needed the money (82 per cent). However, half (49 per cent) agreed that they felt that this role might lead to a job that would suit their abilities better.
Figure 5.11 Reasons for taking up unsuitable work
A quarter (24 per cent) stated feeling under pressure from Jobcentre Plus was a reason for deciding to take up a job that they considered to be a poor match for their abilities. This is a similar proportion to that found among JRFND Stage 3 customers, indicating that those taking up the 6MO Recruitment Subsidy are no more or less likely to feel under pressure from Jobcentre Plus to take up work than customers at this point of their claim more generally.
Recruitment Subsidy Strand
Base: All Recruitment Subsidy claimants disagreed that the work entered was a good match for their skills and interests (173).Source: E18.
88
None of the above
Felt under pressure to take this job
Hope it would lead to a job that better matchesexperience, skills and interests
Few jobs available that matched experience,skills and interests
Needed the money
Wanted to move into work as soon as possible
Percentages
82
68
49
24
3
89
5.6 Opportunities for progressionThose who were still employed in the role that they secured through the Recruitment Subsidy were asked about the potential for development and progression that it offered.
Half (52 per cent) of those who were still in the role they gained as a result of the Recruitment Subsidy believed that the job offered them opportunities for promotion or increased responsibilities. Young customers were more likely to think this (68 per cent), as were bulk billing route customers (61 per cent). Hence, even though these groups were more likely to enter roles which were lower paid and lower down the occupational hierarchy, they were more likely to see opportunities to progress.
Two-fifths of all Recruitment Subsidy recipients (39 per cent) reported receiving some training in the role that they secured through the Recruitment Subsidy. Those who were younger and those who had entered work via the bulk billing route and were more likely to have entered lower paid jobs, were particularly likely to report receipt of training (46 per cent of 18-24 years compared to 28 per cent of 25-49 year olds and 36 per cent of those aged 50+; and 47 per cent of bulk billing route customers compared to 37 per cent of self-marketing route customers).
Of those who had received some training in this role, three-quarters (77 per cent) reported that this training was not designed to lead to a formal qualification, with two-fifths (19 per cent) reporting that it would lead to a full qualification and one in 20 (4 per cent), part of a qualification. Where training leading to a qualification had been received, this was most likely to have been at Level 2 (50 per cent of those receiving qualification-based training received training at this level and a further 14 per cent at Level 3, although in a reasonable proportion of cases respondents were unsure about the level to which they had been trained).
The proportion of customers who were offered training as part of their Recruitment Subsidy role could be considered small in the context of the policy intention being that the Recruitment Subsidy would link up with Train to Gain provision. Employer research conducted as part of the evaluation suggested that awareness of Government-supported training for employees was low42.
Half (52 per cent) of those who were still in the role they gained as a result of the Recruitment Subsidy at the time of interview, believed that their employer would offer them (further) training that would help them secure promotion or increased responsibilities.
Those who were older were more like to believe they would not receive such training (60 per cent of those aged 50+ compared to 45 per cent of 25-49 year olds and 31 per cent of under 25s).
Conversely, bulk billing route customers were more likely to believe they would receive training that would lead to promotion or increased responsibilities (62 per cent of bulk billing route customers against 50 per cent of self-marketing route customers).
5.7 Claim status and hard outcomesHere we outline the outcomes of those participating in the Recruitment Subsidy Strand. By definition, all those ‘participating’ in the Recruitment Subsidy Strand entered work so the analysis concentrates on the sustainability of employment outcomes.
42 Vegeris etal., (2010).
Recruitment Subsidy Strand

90
Figure 5.11 shows whether customers:
• were still working for the same employer who received the Recruitment Subsidy;
• were working for a different employer;
• had returned to JSA;
• were neither working nor claiming.
Figure 5.12 Current status and work outcomes
Two-thirds (66 per cent) were still with the same employer they had gained work with through the Recruitment Subsidy at the time of research. Around one in ten (9 per cent) had changed jobs entirely and moved onto another employer by the time of research, and a small number (3 per cent) were still with the same employer but had changed roles within the same organisation.
Self-marketing route customers were more likely to still be working with the same employer (either in the same role or in a different role) compared to bulk billing route customers (70 per cent compared to 51 per cent respectively). This reflects the fact that bulk billing route customers were more likely to state that the job that they moved into was on a temporary/casual contract.
This cohort of bulk billing route customers were equally as likely to have moved onto another employer as voucher recipients. However, bulk billing route customers were twice as likely to have returned to claiming JSA by the time of interview (34 per cent of bulk billing route customers and 18 per cent of self-marketing route customers).
Recruitment Subsidy Strand
Percentages
Base: All Recruitment Subsidy claimants.Source: B1, B2, B5 and C1.
Neither working nor claiming JSA
All Recruitment Subsidy claimants
(1,001)
Voucherclaimants
(814)
Bulk claimants
(187)
Had returned to JSA
Working for a different employer
Still working for same employer
4 4 5
21 1834
99
10
66 70
51
91
At an overall level, those who had remained with the same employer, but had changed roles within the organisation had been promoted or given more responsibilities (67 per cent). A further two in five had their contract extended, renewed or made permanent (35 per cent). In some cases however, the job title or job description had been changed to a lower grade, with less responsibilities or fewer duties (17 per cent).
Some who were fulfilling a different role with the same employer reported a change in their hours, with two in five (17 per cent) reporting their hours had increased. A further third (33 per cent) reported an increase in pay.
Because the payment of the Recruitment Subsidy to employers receiving a self-marketing voucher is structured in such a way as to try to ensure that employers take customers into sustainable roles (i.e. an initial payment of £500 on recruiting a customer and a second payment of £500 once the individual has been employed for at least six months), it is interesting to look at the length of time that Subsidy recipients remained with their employer. The longitudinal interviews that will be conducted with 6MO customers in a year’s time (April 2011) will provide a more detailed exploration of this issue but the information from this survey can provide some insight.
Of those still in their Subsidy role at the time of interview, two-thirds had been in that role for over six months (65 per cent). A quarter (26 per cent) had been employed in the role for up to six months. (The remainder were unsure about the length of their employment.) By the time of interview customers had been in their Recruitment Subsidy role for an average of 5.4 months.
Looking at this information further, Figure 5.13 shows the outcomes for those who had entered their Recruitment Subsidy job at least six months prior to interview (with the outcomes for all Subsidy recipients shown alongside for comparison purposes). This shows only a very slight decrease in the proportion still working for the same employer.
Overall, this is a positive summary of the work outcomes of those securing employment using the Recruitment Subsidy. Mostly they had remained in the same role, indicating that the placement was well matched, and that where they had changed roles, but remained with the same employer, it tended to be as a result of promotion or an improvement to their existing contract, hours or pay.
Recruitment Subsidy Strand
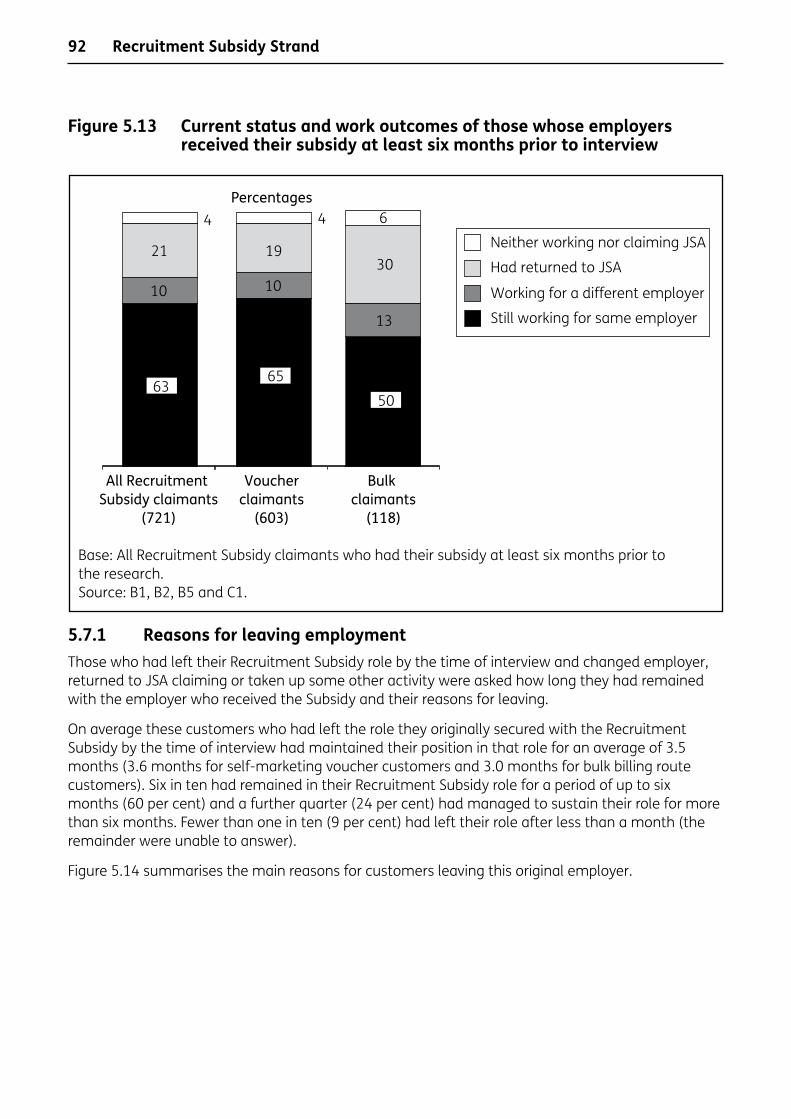
92
Figure 5.13 Current status and work outcomes of those whose employers received their subsidy at least six months prior to interview
5.7.1 Reasons for leaving employmentThose who had left their Recruitment Subsidy role by the time of interview and changed employer, returned to JSA claiming or taken up some other activity were asked how long they had remained with the employer who received the Subsidy and their reasons for leaving.
On average these customers who had left the role they originally secured with the Recruitment Subsidy by the time of interview had maintained their position in that role for an average of 3.5 months (3.6 months for self-marketing voucher customers and 3.0 months for bulk billing route customers). Six in ten had remained in their Recruitment Subsidy role for a period of up to six months (60 per cent) and a further quarter (24 per cent) had managed to sustain their role for more than six months. Fewer than one in ten (9 per cent) had left their role after less than a month (the remainder were unable to answer).
Figure 5.14 summarises the main reasons for customers leaving this original employer.
Recruitment Subsidy Strand
Percentages
Base: All Recruitment Subsidy claimants who had their subsidy at least six months prior to the research.Source: B1, B2, B5 and C1.
Neither working nor claiming JSA
All Recruitment Subsidy claimants
(721)
Voucherclaimants
(603)
Bulk claimants
(118)
Had returned to JSA
Working for a different employer
Still working for same employer
4 4 6
21 1930
13
1010
6365
50

93
Figure 5.14 Reasons for leaving Subsidy role
On the whole, the reasons given for leaving an employer were ‘negative’, with only 8 per cent stating that they left because they had found preferable alternative employment.
Most commonly Recruitment Subsidy customers had left their employer because the company they had been placed with did not have enough money or work to continue employing them (34 per cent). Given the economic climate it was unsurprising that redundancy has affected some. However, a relatively large proportion stated that they employment finished simply because their contract ended (with bulk billing route customers being more likely to say this (31 per cent compared to 15 per cent)).
Around a quarter cited either being made redundant or sacked or dismissed as a reason for leaving this employment (13 per cent and 11 per cent) respectively.
5.8 SummaryMost of those who entered work attracting the Recruitment Subsidy were those using the self-marketing voucher with those entering work via the bulk billing route accounting for a fifth of strand customers.
Compared with the typical population of customers reaching their sixth consecutive month of JSA claiming, those benefiting from the Recruitment Subsidy are more likely to be older and from a white British background. However, bulk billing route customers had an age profile that more closely matches that of the eligible population.
Recruitment Subsidy Strand
Base: All claimants no longer in work/with the same employer they gained employment with as a result the Recruitment Subsidy at the time of interview (247)Source: E15.
Percentages
34
Refused
Other
Went into training/education
Not enough training given
Wasn’t earning enough
The company closed
Did not enjoy working there
Health reasons
Found alternative employment
Sacked/dismissed
Contract ended/temporary work
Company did not have enough money/work to continue employment
19
12
8
7
7
5
4
4
1
8
1
94
On the whole, most self-marketing route customers stated that they were clear about how to use the voucher. Younger and ethnic minority customers were less likely to state this was the case (and they are under-represented among Recruitment Subsidy beneficiaries as a whole).
Self-marketing route customers were much more likely to mention the self-marketing voucher at interviews rather than earlier in the process (say on CVs/application forms). In some cases, they relied on Jobcentre Plus advisers mentioning the subsidy to potential employers.
Jobs were secured via the Recruitment Subsidy across the economy. Compared to work outcomes typically entered by customers with JSA claims of at least six months’ duration, Recruitment Subsidy jobs were slightly more likely to be in the primary/manufacturing and hospitality sectors. Jobs were also spread across the occupational hierarchy although elementary or operative roles accounted for a third of destinations. Roles entered via the bulk billing route were particularly likely to be at this end of the occupational spectrum.
Self-marketing route customers were more likely to have secured work on a permanent or open, ended contract. Conversely, bulk billing route customers were more likely to have been employed on a temporary or casual basis. There is an indication that because bulk billing payments are not staged, the roles secured through this route are less likely to be sustainable.
At the time of interview, almost three-quarters of Recruitment Subsidy beneficiaries were still in employment (and most of these with the employer who received the subsidy). Self-marketing route customers were considerably more likely to be in work than bulk billing route customers (only half of whom were still in employment at the time of interview).
Self-Employment Support
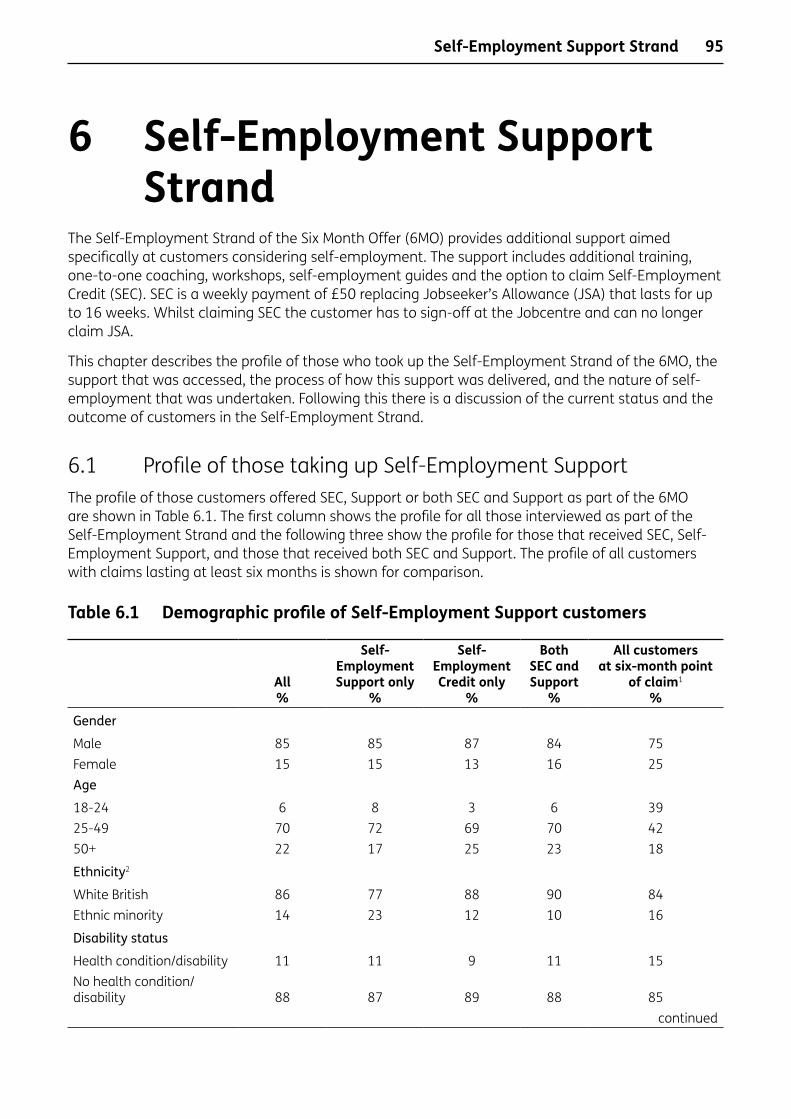
95
6 Self-Employment Support StrandThe Self-Employment Strand of the Six Month Offer (6MO) provides additional support aimed specifically at customers considering self-employment. The support includes additional training, one-to-one coaching, workshops, self-employment guides and the option to claim Self-Employment Credit (SEC). SEC is a weekly payment of £50 replacing Jobseeker’s Allowance (JSA) that lasts for up to 16 weeks. Whilst claiming SEC the customer has to sign-off at the Jobcentre and can no longer claim JSA.
This chapter describes the profile of those who took up the Self-Employment Strand of the 6MO, the support that was accessed, the process of how this support was delivered, and the nature of self-employment that was undertaken. Following this there is a discussion of the current status and the outcome of customers in the Self-Employment Strand.
6.1 Profile of those taking up Self-Employment SupportThe profile of those customers offered SEC, Support or both SEC and Support as part of the 6MO are shown in Table 6.1. The first column shows the profile for all those interviewed as part of the Self-Employment Strand and the following three show the profile for those that received SEC, Self-Employment Support, and those that received both SEC and Support. The profile of all customers with claims lasting at least six months is shown for comparison.
Table 6.1 Demographic profile of Self-Employment Support customers
All %
Self-Employment Support only
%
Self-Employment Credit only
%
Both SEC and Support
%
All customers at six-month point
of claim1 %
Gender
Male 85 85 87 84 75Female 15 15 13 16 25Age
18-24 6 8 3 6 3925-49 70 72 69 70 4250+ 22 17 25 23 18
Ethnicity2
White British 86 77 88 90 84Ethnic minority 14 23 12 10 16
Disability status
Health condition/disability 11 11 9 11 15No health condition/disability 88 87 89 88 85
continued
Self-Employment Support Strand

96
Table 6.1 Continued
All
%
Self-Employment Support only
%
Self-Employment Credit only
%
Both SEC and Support
%
All customers at six month point
of claim1
%PSA 16 status
PSA 16 4 6 3 4 Data not availableNot PSA 16 95 94 96 95
Qualification level
No qualifications/below Level 2 35 32 32 34 Data not availableLevel 2-3 31 32 31 31Level 4-5 33 33 34 33Level 2 and above 65 65 65 64
Claim history
Previously claimed 58 65 56 55 Data not availableNot previously claimed 42 35 44 45
Length of claim before started strand
18 months or more 4 8 1 4 Data not availableOver a year but less than 18 months
12 13 11 12
Six months to a year 76 73 82 77Less than six months 7 6 7 8
Month started strand
April - - - - Data not availableMay - - - -June 6 11 5 4July 8 15 5 5August 11 8 11 12September 19 17 13 21October 23 15 36 24November 26 23 25 27December 8 11 5 7
Base 1,001 289 150 562 89,4201 Population figures taken from data supplied by the DWP of all customers having an initial stage 3/26-week
restart/initial New Deal for Young People (NDYP) interview between 24 August 2009 and 28 September 2009.
2 Note that the all ethnicity figures have been re-based to exclude those records where ethnicity is not known (accounting for 2% of the Self-Employment Strand survey data and 7% of the population data).
Self-Employment Support Strand

97
Comparing the profile of Self-Employment Strand customers with a general profile of customers reaching the six month point of their claim shows that those taking up the Self-Employment Strand were more likely to be men and older customers.43 Men accounted for 85 per cent of all those taking up the self-employment option (while they typically account for 75 per cent of all customers reaching this point in their claim). Only 6 per cent of customers were aged 18-24 while this group typically account for 39 per cent of the customer base. In part, this may be the effect of NDYP activity discussed in relation to other strands (younger people participating in NDYP have to undertake a mandatory activity which would make them unavailable to received Self-Employment Support) but the level of under-representation of young people is even greater than for other strands.
Only a very small proportion of Self-Employment Strand customers faced PSA 16 barriers (4 per cent).
The profile of customers receiving different types of Self-Employment support (SEC only, Support only or SEC and support) are broadly similar. However, those receiving Support only were more likely to have claimed JSA previously. They were also more likely to be from an ethnic minority background.
6.2 Prior experience of self-employmentAt the time of referral to the Self-Employment Strand, just under a third of customers had experience of self-employment (30 per cent). A further 56 per cent had not actually attempted self-employment but had considered it. One in eight (12 per cent) had not considered self-employment prior to it being mentioned in connection with the 6MO. For the majority of those with experience of self-employment (73 per cent), their last period of self-employment was two or more years ago (Figure 6.1).
43 Unless explicitly stated otherwise, all differences reported in this chapter are statistically significant at the 95 per cent confidence level. Please see Section 1.4 for more details.
Self-Employment Support Strand
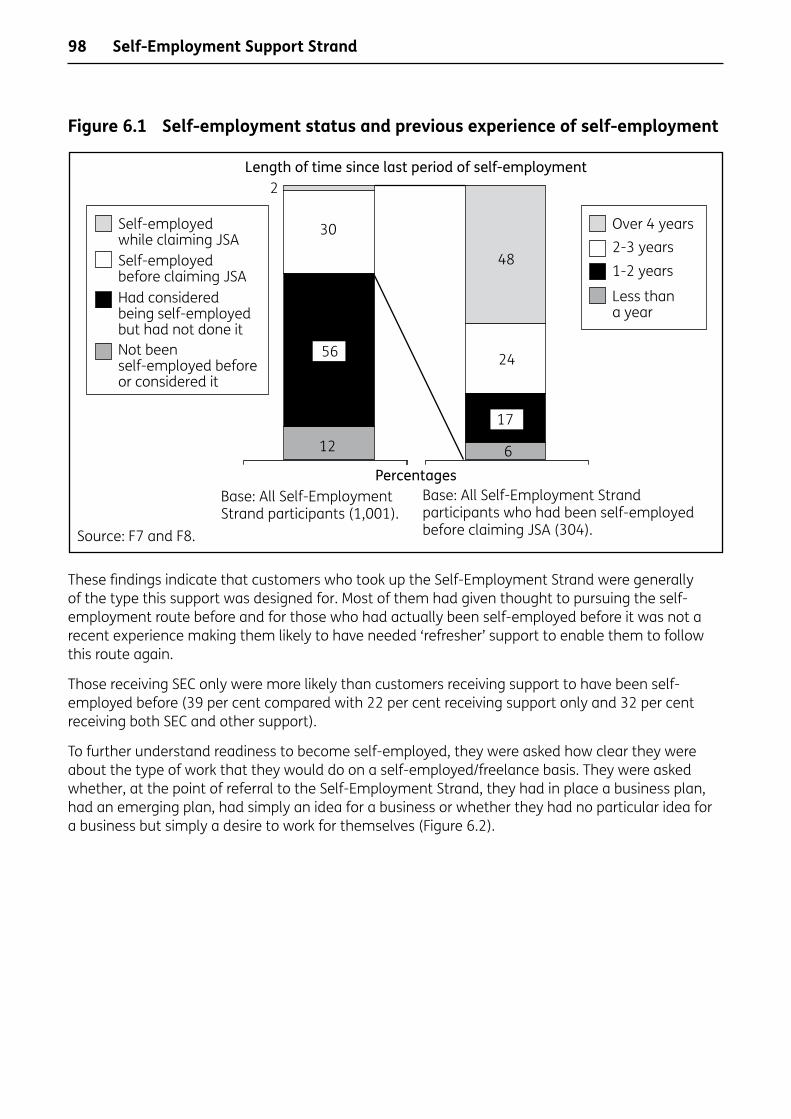
98
Figure 6.1 Self-employment status and previous experience of self-employment
These findings indicate that customers who took up the Self-Employment Strand were generally of the type this support was designed for. Most of them had given thought to pursuing the self-employment route before and for those who had actually been self-employed before it was not a recent experience making them likely to have needed ‘refresher’ support to enable them to follow this route again.
Those receiving SEC only were more likely than customers receiving support to have been self-employed before (39 per cent compared with 22 per cent receiving support only and 32 per cent receiving both SEC and other support).
To further understand readiness to become self-employed, they were asked how clear they were about the type of work that they would do on a self-employed/freelance basis. They were asked whether, at the point of referral to the Self-Employment Strand, they had in place a business plan, had an emerging plan, had simply an idea for a business or whether they had no particular idea for a business but simply a desire to work for themselves (Figure 6.2).
Self-Employment Support Strand
Self-employed while claiming JSASelf-employed before claiming JSAHad considered being self-employed but had not done itNot been self-employed before or considered it
Length of time since last period of self-employment2
Percentages
Source: F7 and F8.
Base: All Self-Employment Strand participants (1,001).
Base: All Self-Employment Strand participants who had been self-employed before claiming JSA (304).
Over 4 years2-3 years1-2 years
Less thana year
30
12
48
24
6
56
17

99
Figure 6.2 Initial self-employment plans and level of support needed
Just under half (46 per cent) of the customers that had received Self-Employment Support as part of the 6MO either had a developed business plan or emerging plan at the time the Support was first offered, and 28 per cent had an emerging idea. Around a quarter (24 per cent) of customers did not have an idea or plan of becoming self-employed but wanted to work for themselves. There is perhaps a question mark over whether these individuals were well suited for this strand of activity. This view would appear to be supported by qualitative work among providers who tended to question to appropriateness of referrals, noting that many did not seem serious about self-employment and that there was not enough time available within the programme to get results from people at such an early stage of the journey to becoming self-employed44.
They were also asked to assess how much advice, guidance and support they felt they required in order to become self-employed or start a business at the time the Support was first mentioned to them. They were asked to rate their support needs on a scale of 1 to 5, where a score of 1 indicated that they did not need any support at all and a score of 5 indicated that they needed a great deal of support (also shown on Figure 6.2). Responses were distributed across this spectrum. Around a third of customers (33 per cent) gave a rating of four or five indicating they felt that they required a large amount of support. In comparison, two-fifths (38 per cent) of customers said that they needed very little or no support and gave a rating of 1 or 2.
Nearly half (48 per cent) who had a business plan when the support was first offered gave a rating of 1 or 2 for the level of support they required to become self-employed, this was higher than the proportion of customers with only an emerging idea that gave a rating of 1 or 2 (26 per cent).
44 Vegerisetal., (2010).
Self-Employment Support Strand
Had a business planHad an emerging planHad an emerging ideaNone of the above but wished to work for myself
Situation at time support was first offered
Percentages
Source: F3 and F4.Base: All Self-Employment Strand participants (1,001).
1 – No support needed at all23
45 – A great deal of support needed
Closest to self-employment
Furthest fromself-employment
26
20
24
18
20
15
2828
17
Level of supportrequired to becomeself-employed when
support wasfirst offered

100
Responses to these two questions indicate that customers entered the Self-Employment Strand with a wide range of ‘starting points’ in terms of thinking about their own businesses and hence, in the level of support provided. While findings indicate that the majority of Self-Employment customers were suitable for referral to the strand from the perspective of being motivated to pursue self-employment, it would appear that they entered the Support with a wide range of ‘starting points’.
6.3 Finding out about Self-Employment SupportThe following discussion looks at how customers first became aware of the Self-Employment Support Strand of the 6MO. It also explores how positive they were about the Support when they first heard about it and their reasons for taking up the SEC and/or Support.
The majority (77 per cent) first became aware of the SEC or Support via their Jobcentre Plus adviser. Small minorities found out through friends and family or other jobseekers (5 per cent). A small number (3 per cent) had found out about the Self-Employment Support themselves after looking for support available to those wishing to start their own business (3 per cent). Others researched the support available online (3 per cent), proactively enquired about options at the jobcentre (3 per cent) or received a leaflet or advert for the Self-Employment Support (2 per cent).
Figure 6.3 shows customers initial feelings about the Self-Employment Strand.
Figure 6.3 Initial feelings about Self-Employment Credit and Support
Self-Employment Support Strand
Source: F2.
Percentages
12Neither positive nor negative 18 12
All
Very positive about it
Quite positive
Quite negative
Very negative about it
9
Self-Employment Strand only
SEC only Both SEC and support
Base: 1,001 289 150 562
43 45 43 41
46412840
23 52
21 13

101
When customers first heard about the Self-Employment Strand, the majority of customers felt positively about it (83 per cent), and only a very small minority were negative (5 per cent). Customers who received SEC only were more likely to be initially positive (85 per cent positive) compared to those that went on to receive Self-Employment Support only (73 per cent positive). Advisers did not need to ‘sell’ activity to customers – all of those who took part were positive about doing so.
A large number of reasons were given for taking up the Self-Employment Strand (Figure 6.4). The most common was that they simply liked the idea of working for themselves (34 per cent) followed by wanting to become self-employed because of a lack of other available jobs (20 per cent). Around one in ten took up SEC or Support for the small one-off payment (11 per cent), the general financial support (11 per cent), because they wanted guidance on developing ideas into a business (10 per cent), or simply because the support was offered (9 per cent). The full list of reasons given is shown in Figure 6.4.
Figure 6.4 Reasons for taking up Self-Employment Credit and Support
Self-Employment Support Strand
Base: All Self-Employment Strand participants (1,001)Source: F5.
Percentages
34
Other
Felt pressured/forced into it
JSA had ended
Thought had to do it or might lose benefit
Did not want to apply for jobs suggested by jobcentre
Best option available
Wanted to gain confidence
Wanted to stop signing on
Wanted advice on how to access long-term financialsupport/capital/funding
Wanted information on specific elements ofself-employment
Because it was offered
Wanted guidance on developing ideas into a business
To help financially
Wanted the small one-off payment
No jobs available
Liked the idea of working for self
20
11
11
10
9
8
5
3
3
2
2
1
1
1
9

102
6.4 Nature of support received: external supportThe Self-Employment Strand is delivered through a combination of Jobcentre Plus services and external support. This section looks at the external support received.
The support available to Self-Employment Strand customers through Business Link (England), Flexible Support for Business (Wales), or Business Gateway (Scotland) support includes:
• introductory self-employment guides;
• helpline;
• website;
• confidence building workshop;
• workshops on specific elements of self-employment;
• one-to-one coaching (followed by four months’ additional support with dedicated Business Link adviser if an English customer).
In addition, some may be put in contact with other organisations for funding, credit or financial support, for example Regional Development Agencies or the Working Neighbourhoods Fund or charities.
Figure 6.5 shows the proportion of Self-Employment Strand customers receiving each of these forms of support (the boxes on the right show the proportion who recalled being offered each type of support regardless of whether they went on to take it up – this information was not collected for the introductory guides or the helpline).
Self-Employment Support Strand

103
Figure 6.5 Take-up of external support elements
6.4.1 Introductory self-employment guidesJust under half (48 per cent) remembered receiving the Business Link guide ‘MakingSelf-EmploymentHappen’ or the equivalent leaflets in Wales (‘Bringusyourdream’), or Scotland. Customers were almost equally likely to receive these leaflets from their Jobcentre Plus adviser (50 per cent) as from Business Link (41 per cent).
Just under three-quarters (74 per cent) who remembered receiving the guide found it useful and only 4 per cent that were given a guide did not read it at all. One in five (20 per cent) who remember receiving the guide read it but did not find it useful, the common reasons being:
• they already knew the information (26 per cent);
• the information was not applicable (20 per cent);
• the information was too basic (12 per cent).
Of the customers who did not find the guide useful, 46 per cent had been self-employed formerly.
6.4.2 Other external support from Business LinkOne-third (35 per cent) had received support other than these leaflets from Business Link or equivalent organisations in Wales and Scotland. Those with previous experience of self-employment were less likely to have had this support (27 per cent compared with 39 per cent). Those who had
Self-Employment Support Strand
*Note that customers where not asked about whether they were ‘offered’ the introductory self-employment guides or the helpline service.Base: All Self-Employment Strand participants (1,001).Source: F11, F19, F21 and F22.
Self-employment introductory guide
Took up (percentages)
Workshops on specific elements ofself-employment
Other self-employment guides
Website
Helpline
One-to-one coaching
17
Confidence building workshop
Contact with other organisations or schemes
Percentage recalled being offered each
type of support
22
12
11
10
48
22
15
13
7
7
5
4
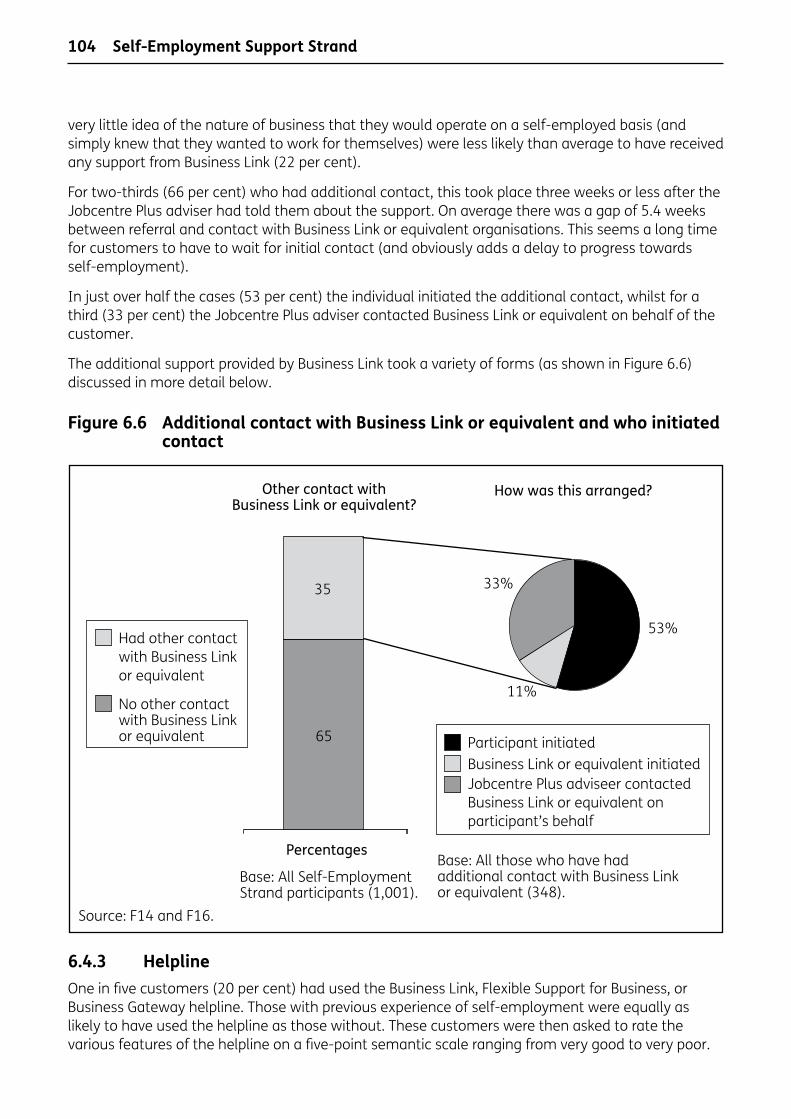
104
very little idea of the nature of business that they would operate on a self-employed basis (and simply knew that they wanted to work for themselves) were less likely than average to have received any support from Business Link (22 per cent).
For two-thirds (66 per cent) who had additional contact, this took place three weeks or less after the Jobcentre Plus adviser had told them about the support. On average there was a gap of 5.4 weeks between referral and contact with Business Link or equivalent organisations. This seems a long time for customers to have to wait for initial contact (and obviously adds a delay to progress towards self-employment).
In just over half the cases (53 per cent) the individual initiated the additional contact, whilst for a third (33 per cent) the Jobcentre Plus adviser contacted Business Link or equivalent on behalf of the customer.
The additional support provided by Business Link took a variety of forms (as shown in Figure 6.6) discussed in more detail below.
Figure 6.6 Additional contact with Business Link or equivalent and who initiated contact
6.4.3 HelplineOne in five customers (20 per cent) had used the Business Link, Flexible Support for Business, or Business Gateway helpline. Those with previous experience of self-employment were equally as likely to have used the helpline as those without. These customers were then asked to rate the various features of the helpline on a five-point semantic scale ranging from very good to very poor.
Self-Employment Support Strand
Percentages
Had other contactwith Business Linkor equivalent
No other contactwith Business Linkor equivalent
Source: F14 and F16.
Participant initiatedBusiness Link or equivalent initiatedJobcentre Plus adviseer contacted Business Link or equivalent on participant’s behalf
How was this arranged?Other contact withBusiness Link or equivalent?
Base: All Self-Employment Strand participants (1,001).
Base: All those who have had additional contact with Business Link or equivalent (348).
35
65
53%
11%
33%

105
Each feature of the helpline received positive reviews, with the length of time advisers spoke to customers, the usefulness of the advice, advisers’ knowledge, and the advisers’ understanding all rated as very good or fairly good by 85 per cent or more (Figure 6.7).
Figure 6.7 Views of helpline
6.4.4 WorkshopsAs shown in Figure 6.5, the proportion of Self-Employment Strand customers who took part in workshops on specific elements of self-employment (such as regulations, business planning, finance, market research, business development, employing people, health and safety or ICT) was quite low at only 13 per cent. However, only a fifth stated that they were offered this option.
Those who had attended Business Link (or equivalent) workshops rated the quality very highly with nine in ten customers rating the following aspects as either good or very good:
• the helpfulness of the teacher – 91 per cent (60 per cent very good, 31 per cent fairly good);
• the teacher’s level of knowledge – 93 per cent (66 per cent very good, 27 per cent fairly good);
• giving clear information and advice – 92 per cent (64 per cent very good, 28 per cent fairly good).
This does perhaps raise a question mark over why workshops were not offered more widely. While not all those offered chose to attend workshops, only around a fifth of customers were given the opportunity to participate. Business Link (and equivalent organisations) have been posited in the role of ‘expert partners’ in directing customers towards appropriate Self-Employment Support. The fact that workshops were not offered widely may reflect Business Link deeming that some of the individuals referred from Jobcentre Plus were not advanced enough in their plans for self-employment to benefit from this level of specific information and support (see point from the qualitative provider research in Section 6.2).
Self-Employment Support Strand
Base: All those who used Business Link or equivalent helpline (69).Source: F20.
Length of time advisers talkedto you
Percentages
Total percentage rate good
The advisers’ level of knowledge
The advisers’ understanding ofyour needs
Very poor Fairly poor Fairly good Very good
93
87
86
3
4
64
6 4
35
33
35
58
54
51

106
Those who had participated in workshops had attended an average of 2.9 workshops by the time of interview. Half of those making use of the workshops did not plan to attend any more (47 per cent) while two in five (41 per cent) planned to attend a few more specific workshops. (The remainder were unsure whether they would participate in further sessions.)
6.4.5 Enterprise coachingEnterprise coaching takes place on a one-to-one basis. Only 7 per cent of strand customers stated that they had received support of this nature (with a further 5 per cent stating that they had been offered this option but chosen not to take it up). Customers who had taken part in Business Link enterprise coaching (or regional equivalent) rated the quality of coaching very highly. Over nine in ten customers rated the following aspects as either very good or fairly good:
• the helpfulness of coaches (93 per cent; 59 per cent very good, 33 per cent fairly good);
• the information was suited to personal needs and circumstances (93 per cent, 55 per cent, very good, 38 per cent fairly good);
• the information or advice from coaches as clear (94 per cent, 67 per cent very good, 29 per cent fairly good).
Again, with such positive reactions to coaching from customers, there is perhaps an argument for offering this more widely (only one in eight self-employment customers were offered coaching of which just over half took it up).
Two-thirds (67 per cent) who had undertaken coaching as part of their Self-Employment Support had completed this by the time of interview, while for the remainder coaching was ongoing. The following reasons were given for ending their coaching:
• they felt they had already received enough support (26 per cent);
• they had reached the end of the four months it was available (17 per cent);
• they were too busy with their business (11 per cent);
• the support was no longer helpful to them (9 per cent).
Over half (55 per cent) who had attended coaching support had received one or two sessions, however, some had attended a large number of sessions, e.g. one in ten (12 per cent) had attended over ten sessions. On average, customers making use of this option had received five one-to-one coaching sessions.
The majority of those receiving coaching support (86 per cent) felt that the amount of contact with the coach was ‘about right’, the rest felt the amount of support was ‘too little’. None of those interviewed felt that the amount of contact they had with the coach was ‘too much’.
6.4.6 External support in ScotlandAdditional support available in Scotland included Training for Work and ‘test trading’. Of the Scottish respondents (base size of 48) around one-fifth participated in Training for Work (19 per cent) or had done ‘test trading’ (17 per cent).
Self-Employment Support Strand

107
6.4.7 Variation in support received by self-employment experience and ‘readiness’The nature of support received varied by whether customers had previous experience of self-employment as well as by the extent of business planning they had conducted by the time they started on the Strand (Table 6.2 and Table 6.3).
Table 6.2 Take-up of external support by self-employment experience
All Had been self-employed
before
Had not been self-employed
beforeSelf-employment introductory guide 48 51 46Website 22 14 25Other self-employment guides 15 11 17
Workshops on specific elements of self-employment 13 7 17One-to-one coaching 7 3 9Helpline 20 5 8Contact with other organisations or schemes 5 4 6Confidence building workshop 4 3 4Any external support other than introductory guides 35 27 39
Base 1,001 322 678
As seems appropriate given their likely greater level of need for guidance, those without prior experience of self-employment were more likely to receive most types of support than those who had been self-employed before. The largest differences are apparent in terms of workshops on specific elements of self-employment, guides other than the introductory guide and use of the Business Link website or equivalent.
Overall, two-fifths of those without prior experience of self-employment received some external support other than the introductory guide.
Exposure to external support also varied by the state of readiness of customers’ plans for self-employment as shown in Table 6.3. Those who entered the strand without a clear idea of the type of self-employment activity that they could pursue were less likely to receive most types of external support indicating that perhaps there was some filtering of access (perhaps by Jobcentre Plus staff or Business Link/equivalent). Only a fifth of this group received any external support other than the introductory self-employment guides.
Self-Employment Support Strand
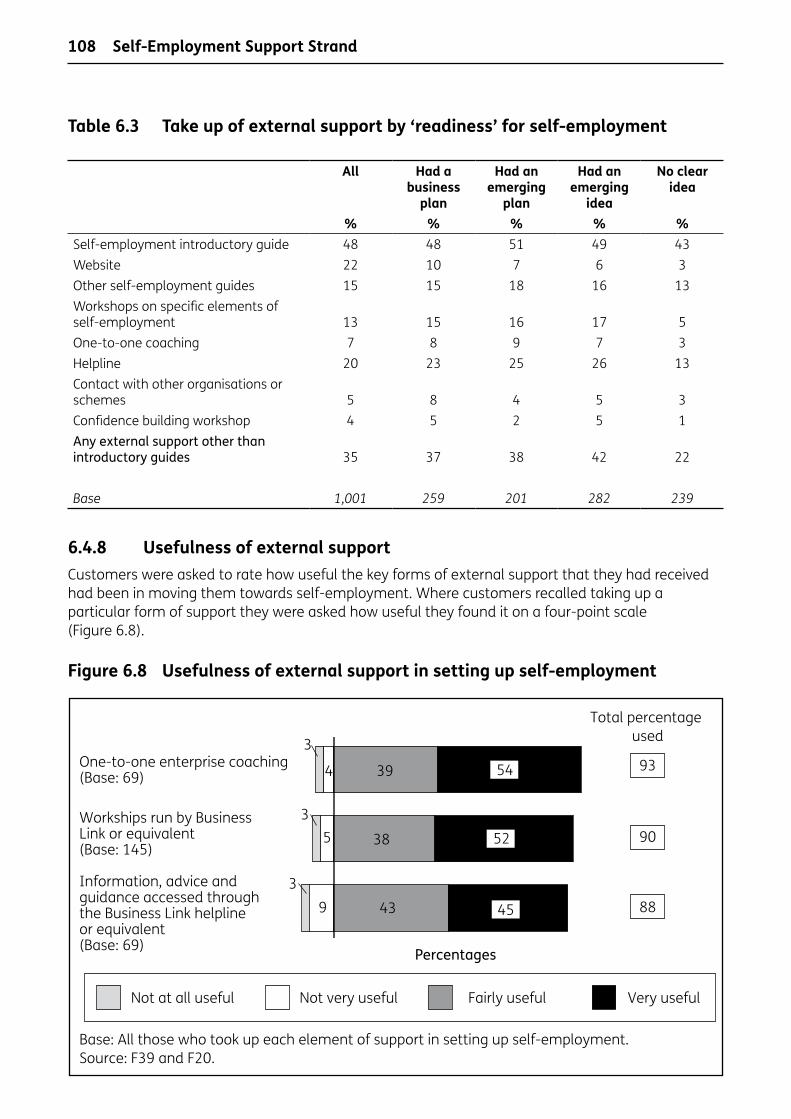
108
Table 6.3 Take up of external support by ‘readiness’ for self-employment
All Had a business
plan
Had an emerging
plan
Had an emerging
idea
No clear idea
% % % % %Self-employment introductory guide 48 48 51 49 43Website 22 10 7 6 3Other self-employment guides 15 15 18 16 13Workshops on specific elements of self-employment 13 15 16 17 5One-to-one coaching 7 8 9 7 3Helpline 20 23 25 26 13Contact with other organisations or schemes 5 8 4 5 3Confidence building workshop 4 5 2 5 1Any external support other than introductory guides 35 37 38 42 22
Base 1,001 259 201 282 239
6.4.8 Usefulness of external supportCustomers were asked to rate how useful the key forms of external support that they had received had been in moving them towards self-employment. Where customers recalled taking up a particular form of support they were asked how useful they found it on a four-point scale (Figure 6.8).
Figure 6.8 Usefulness of external support in setting up self-employment
Self-Employment Support Strand
Base: All those who took up each element of support in setting up self-employment.Source: F39 and F20.
One-to-one enterprise coaching(Base: 69)
Percentages
Total percentage used
Workships run by BusinessLink or equivalent(Base: 145)
Information, advice andguidance accessed throughthe Business Link helplineor equivalent(Base: 69)
Not at all useful Not very useful Fairly useful Very useful
93
90
88
39
38
43
54
52
45
4
5
9
3
3
3

109
One-to-one enterprise coaching received the highest usefulness rating (93 per cent rated useful), followed by workshops run by Business Link or equivalent (90 per cent rated useful). Information, advice and guidance accessed through the Business Link helpline or equivalent was also rated as useful by the large majority (88 per cent), but one in ten (11 per cent) did not find the helpline useful.
6.5 Nature of support received: Jobcentre Plus supportCustomers who received some additional support from Business Link (35 per cent), were asked how well they felt that Jobcentre Plus worked with Business Link or the equivalent organisations in Scotland/Wales to support their self-employment plans. Views were mixed on this issue. Half (49 per cent) of claimants who had contact with Business Link or the national equivalent felt that Jobcentre Plus staff worked well or very well with them to support their needs. However, just over two in five (42 per cent) disagreed and felt they did not work well or at all well together.
Those customers who felt that they needed less support overall in becoming self-employed (giving a rating of 1 or 2 when asked about their support needs where 1 indicated that they needed ‘no support at all’) were more likely to feel that Business Link and Jobcentre Plus did not work well together (51 per cent compared with 37 per cent of those who reported needing more support). In addition, those who made initial contact with Business Link or the equivalent themselves were considerably more likely to feel that the two organisations did not work well together than those whose Jobcentre Plus adviser made initial contact on their behalf.
The split in terms of views about how well the two organisations worked together does not appear to be explained by the length of time between referral and initial contact with Business Link or equivalent (although this appears to have some influence). Of those who waited under two weeks, 37 per cent felt the two organisations did not work well together, compared with 43 per cent of those who waited longer than two weeks.
The base sizes are too small to analyse these findings by the type of Business Link provision attended robustly but the indications are that there is not a great deal of variation in views by whether customers attended workshops/coaching or not.
In addition to referrals to external sources of support, Jobcentre Plus advisers can offer those participating in the Self-Employment Strand access to funds from the Adviser Discretion Fund (ADF) and also SEC. Financial support from the ADF takes the form of a payment45 to cover the start-up costs of setting up in self-employment. SEC is £50 a week and is available to customers for up to 16 weeks to support their transition into self-employment. Figure 6.8 shows the proportion of customers offered each of these types of support as well as the proportions who went on to receive it.
45 ADF can be a one-off payment or a number of payments and there is no upper limit, but for payments over £300 the award must have additional authorisation.
Self-Employment Support Strand
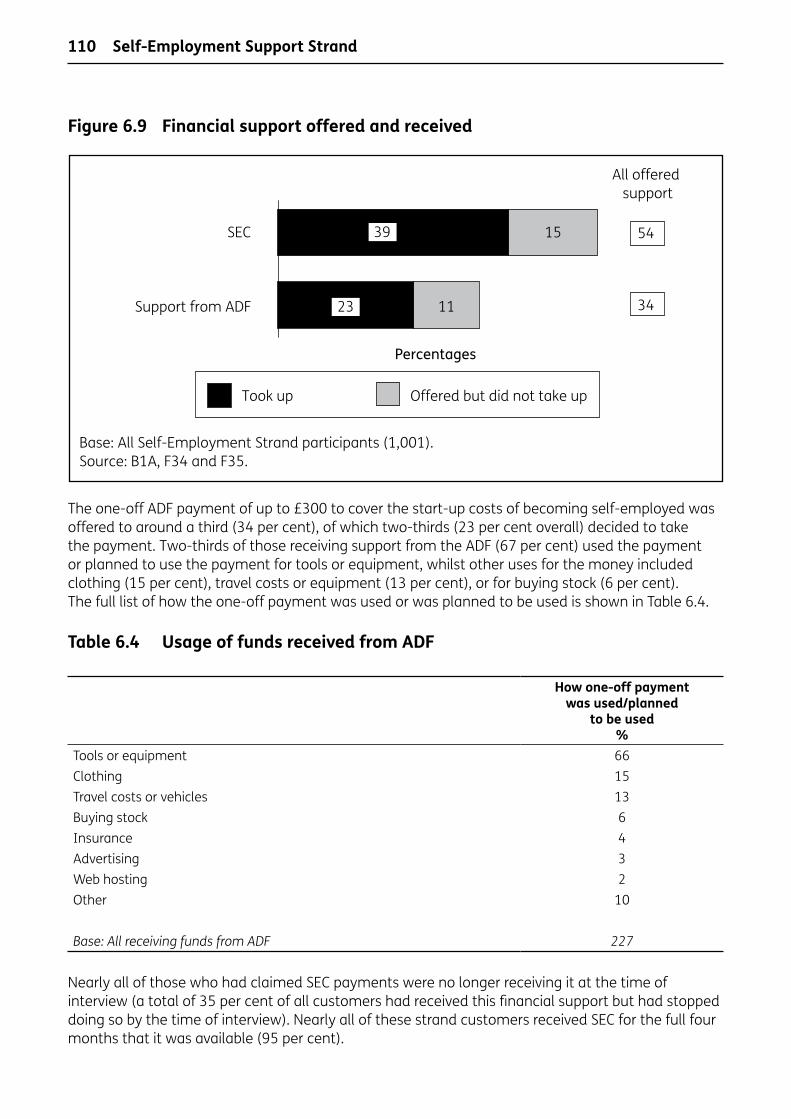
110
Figure 6.9 Financial support offered and received
The one-off ADF payment of up to £300 to cover the start-up costs of becoming self-employed was offered to around a third (34 per cent), of which two-thirds (23 per cent overall) decided to take the payment. Two-thirds of those receiving support from the ADF (67 per cent) used the payment or planned to use the payment for tools or equipment, whilst other uses for the money included clothing (15 per cent), travel costs or equipment (13 per cent), or for buying stock (6 per cent). The full list of how the one-off payment was used or was planned to be used is shown in Table 6.4.
Table 6.4 Usage of funds received from ADF
How one-off payment was used/planned
to be used %
Tools or equipment 66Clothing 15Travel costs or vehicles 13Buying stock 6Insurance 4Advertising 3Web hosting 2Other 10
Base:AllreceivingfundsfromADF 227
Nearly all of those who had claimed SEC payments were no longer receiving it at the time of interview (a total of 35 per cent of all customers had received this financial support but had stopped doing so by the time of interview). Nearly all of these strand customers received SEC for the full four months that it was available (95 per cent).
Self-Employment Support Strand
Base: All Self-Employment Strand participants (1,001).Source: B1A, F34 and F35.
SEC
Percentages
All offered support
Support from ADF
Took up Offered but did not take up
54
34
15
11
39
23

111
6.6 Usefulness of financial support received from Jobcentre PlusThose receiving support from the ADF and the SEC were asked to rate how useful each of these forms of financial support had been in helping them to move towards self-employment (Figure 6.9).
Both types of financial support received very high usefulness ratings. The most useful financial support was seen to be the one-off payment, rated as useful by 95 per cent who had taken up this support, including 78 per cent who rated it as very useful. The SEC was also rated highly useful, with nine in ten rating the support as useful (91 per cent).
Customer views on the usefulness of SEC were echoed by providers and Jobcentre Plus staff. The qualitative element of the evaluation found that SEC was useful in helping people remain in work and off JSA when business was slow46.
Figure 6.10 Usefulness of financial support given in setting up self-employment
6.7 Soft outcomesSelf-Employment Strand customers were asked about the impact that receipt of support had on their confidence and motivation to attempt self-employment (Figure 6.11).
Over half of customers reported an increase in confidence to become self-employed (54 per cent, see Figure 6.11). Similar proportions reported an increase in motivation to become self-employed (52 per cent) and in knowledge of how to run a business (51 per cent). Customers were most likely to report a ‘great increase’ in their confidence.
46 Vegeris etal., 2010.
Self-Employment Support Strand
Base: All those who took up each element of support in setting up self-employment.Source: F39.
One-off payment from Jobcentre Plus(Base: 230)
Percentages
Total percentage used
SEC(Base: 712)
Not at all useful Not very useful Fairly useful Very useful
95
91
1
17
26
78
6544
2

112
Those who had received SEC and other support were most likely to report an increase in confidence, with nearly two-thirds reporting some form of an increase (60 per cent). Motivation to become self-employed was also most likely to have increased among those receiving both SEC and support and more felt their motivation increased greatly compared to those receiving SEC only (26 per cent compared with 16 per cent).
Knowledge of how to become self-employed was most likely to remain the same for those who only received SEC and no support (73 per cent); this figure was lower for those who received support only (37 per cent) or received both SEC and support (43 per cent). This lower increase in knowledge for those only receiving SEC may reflect that typically these customers required very little support in becoming self-employed as they were already reasonably advanced (as reported earlier, those who were receiving SEC only were more likely than those only receiving support to have been self-employed before).
Figure 6.11 Impact of Self-Employment Strand on knowledge, motivation and confidence
Table 6.5 shows the variation in reporting increases in knowledge about how to become self-employed by experience and ‘readiness’ for self-employment. While those without previous experience were more likely to report an increase in their knowledge, the proportions reporting an increase were similar across the full range of ‘starting points’ (so that those who had a business plan before starting strand activity were equally as likely to report an improvement in knowledge as those who only had an ‘emerging idea’).
Those who received some form of Business Link (or equivalent) provision other than the introductory guides were more likely to report an increase in their knowledge than those who did not.
Self-Employment Support Strand
Source: F40.
Increased greatly
No change
Increased to some extent
Percentages
Base: All Self-Employment Strand participants (1,001).
45 46 48
Confidence in becoming self-employed or running
your own business
Motivation to become self-employed or run
your own business
Knowledge of how to become self-employed
or run your own business
35
19
22
30
19
32

113
Table 6.5 Increase in knowledge of how to become self-employed
Base
Increased greatly
%
Increased to some extent
%No change
%All 1,001 19 35 45
Self-employment experience
Had been self-employed before 322 11 28 61Had not been self-employed before 678 23 39 38
‘Readiness’ for self-employment
Had a business plan 259 20 31 49Had an emerging plan 201 19 38 43Had an emerging idea 282 19 43 38No clear idea 239 18 31 51
Nature of support received
Received external support other than introductory guides 348 21 45 34Did not receive external support (other than introductory guides) 653 18 30 52
Note: Row percentages.
6.8 Claim status and hard outcomesThis section outlines the work/claiming status of customers in the Self-Employment Strand at the time of interview.
Figure 6.12 illustrates whether customers:
• were self-employed;
• were in another form of paid work after ending the original claim47;
• had ended the original claim but had not entered paid work at any point; or
• were still claiming and had done so continuously since starting the original claim.
It also illustrates the proportion of customers who ended their original JSA claim but had returned to claiming by the time of the research fieldwork.
47 ‘Original’ JSA claim refers to the claim during which the customer entered Stage 3 between April and December 2009. Customers may have had claims prior to the specific claims being discussed.
Self-Employment Support Strand

114
Figure 6.12 Outcomes of Self-Employment Strand
Around three-quarters (74 per cent) of customers from the Self-Employment Strand entered paid work, of which the majority were still currently in paid work at the time of the interview. Around one in ten customers (9 per cent) had ended their original claim but did not enter paid work, of which the majority had not returned to JSA at the time of the interview.
When customers had entered paid work, most had entered self-employment (65 per cent overall), and 9 per cent had entered paid work for an employer in either a full-time or part-time role.
A small proportion were self-employed and working for an employer (3 per cent) but stated that working for an employer was their main form of paid work. Including these individuals as ‘self-employed’ brings the total of all those who working as self-employed to 68 per cent of all customers.
Table 6.6 shows the status of customers at the time of interview by the nature of support that they received. This shows that those who received SEC either on its own or in combination with other support where vastly more likely to have entered self-employment than those who received support only, the majority of whom were still claiming JSA at the point of interview.
Self-Employment Support Strand
Base: All Self-Employment Strand participants (1,001).Source: B1, B2, B5, C1 and F9.
Percentages
Did not end original claimEnded original claim butdid not enter paid work
Entered paid work (notself-employed)
Returned to JSANot returned to JSA
OtherReturned to JSACurrently in paid work
1Entered self-employment
2
6
7
66
18
99
65
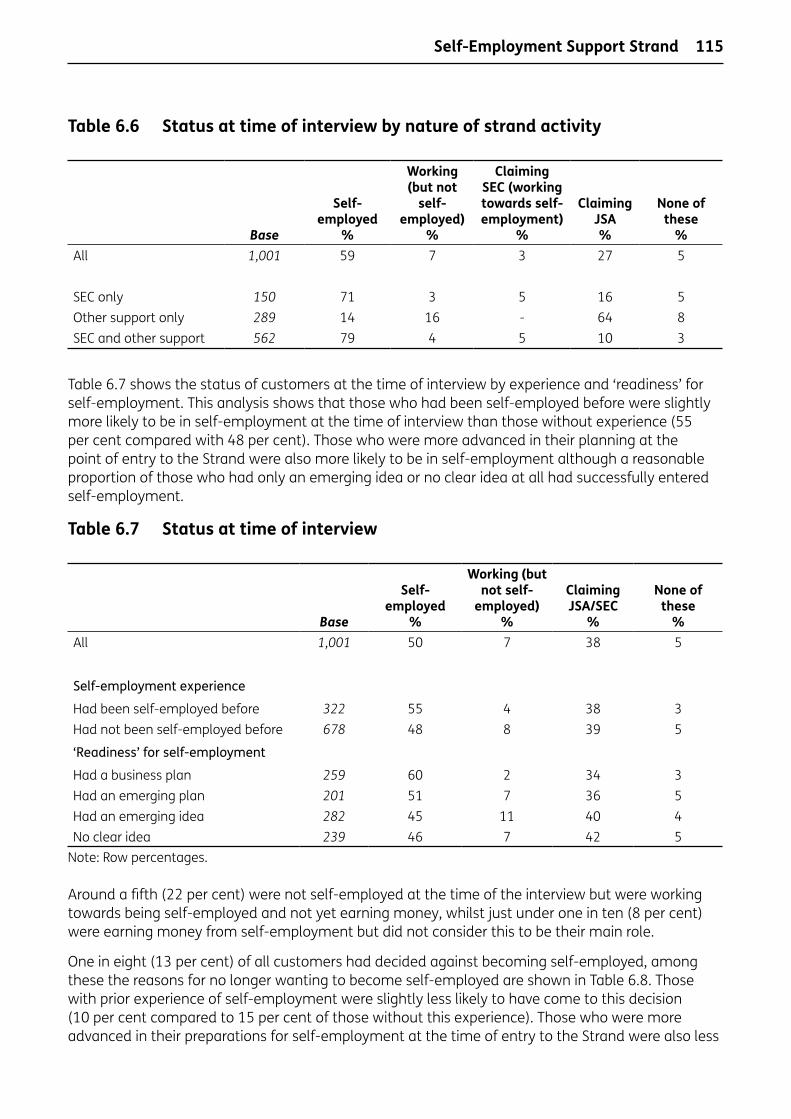
115
Table 6.6 Status at time of interview by nature of strand activity
Base
Self- employed
%
Working (but not
self-employed)
%
Claiming SEC (working towards self-employment)
%
Claiming JSA %
None of these
%All 1,001 59 7 3 27 5
SEC only 150 71 3 5 16 5Other support only 289 14 16 - 64 8SEC and other support 562 79 4 5 10 3
Table 6.7 shows the status of customers at the time of interview by experience and ‘readiness’ for self-employment. This analysis shows that those who had been self-employed before were slightly more likely to be in self-employment at the time of interview than those without experience (55 per cent compared with 48 per cent). Those who were more advanced in their planning at the point of entry to the Strand were also more likely to be in self-employment although a reasonable proportion of those who had only an emerging idea or no clear idea at all had successfully entered self-employment.
Table 6.7 Status at time of interview
Base
Self- employed
%
Working (but not self-
employed) %
Claiming JSA/SEC
%
None of these
%All 1,001 50 7 38 5
Self-employment experience
Had been self-employed before 322 55 4 38 3Had not been self-employed before 678 48 8 39 5
‘Readiness’ for self-employment
Had a business plan 259 60 2 34 3Had an emerging plan 201 51 7 36 5Had an emerging idea 282 45 11 40 4No clear idea 239 46 7 42 5
Note: Row percentages.
Around a fifth (22 per cent) were not self-employed at the time of the interview but were working towards being self-employed and not yet earning money, whilst just under one in ten (8 per cent) were earning money from self-employment but did not consider this to be their main role.
One in eight (13 per cent) of all customers had decided against becoming self-employed, among these the reasons for no longer wanting to become self-employed are shown in Table 6.8. Those with prior experience of self-employment were slightly less likely to have come to this decision (10 per cent compared to 15 per cent of those without this experience). Those who were more advanced in their preparations for self-employment at the time of entry to the Strand were also less
Self-Employment Support Strand
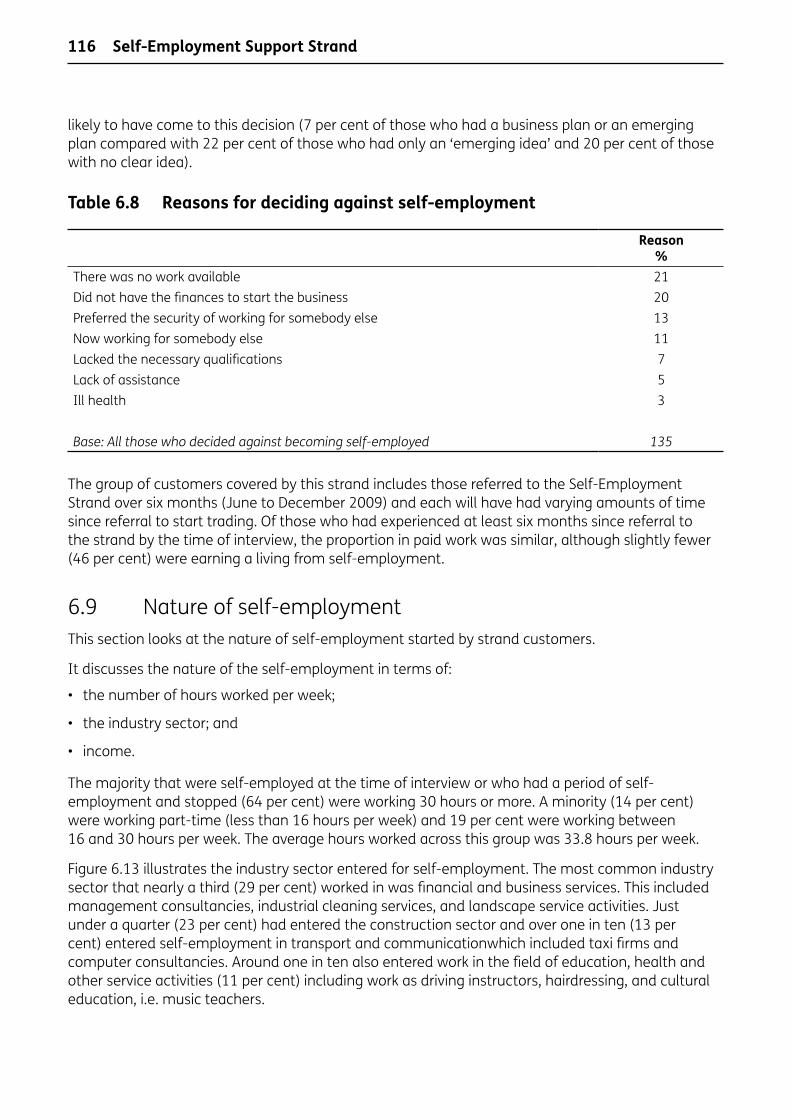
116
likely to have come to this decision (7 per cent of those who had a business plan or an emerging plan compared with 22 per cent of those who had only an ‘emerging idea’ and 20 per cent of those with no clear idea).
Table 6.8 Reasons for deciding against self-employment
Reason %
There was no work available 21Did not have the finances to start the business 20Preferred the security of working for somebody else 13Now working for somebody else 11Lacked the necessary qualifications 7Lack of assistance 5Ill health 3
Base:Allthosewhodecidedagainstbecomingself-employed 135
The group of customers covered by this strand includes those referred to the Self-Employment Strand over six months (June to December 2009) and each will have had varying amounts of time since referral to start trading. Of those who had experienced at least six months since referral to the strand by the time of interview, the proportion in paid work was similar, although slightly fewer (46 per cent) were earning a living from self-employment.
6.9 Nature of self-employment This section looks at the nature of self-employment started by strand customers.
It discusses the nature of the self-employment in terms of:
• the number of hours worked per week;
• the industry sector; and
• income.
The majority that were self-employed at the time of interview or who had a period of self-employment and stopped (64 per cent) were working 30 hours or more. A minority (14 per cent) were working part-time (less than 16 hours per week) and 19 per cent were working between 16 and 30 hours per week. The average hours worked across this group was 33.8 hours per week.
Figure 6.13 illustrates the industry sector entered for self-employment. The most common industry sector that nearly a third (29 per cent) worked in was financial and business services. This included management consultancies, industrial cleaning services, and landscape service activities. Just under a quarter (23 per cent) had entered the construction sector and over one in ten (13 per cent) entered self-employment in transport and communicationwhich included taxi firms and computer consultancies. Around one in ten also entered work in the field of education, health and other service activities (11 per cent) including work as driving instructors, hairdressing, and cultural education, i.e. music teachers.
Self-Employment Support Strand
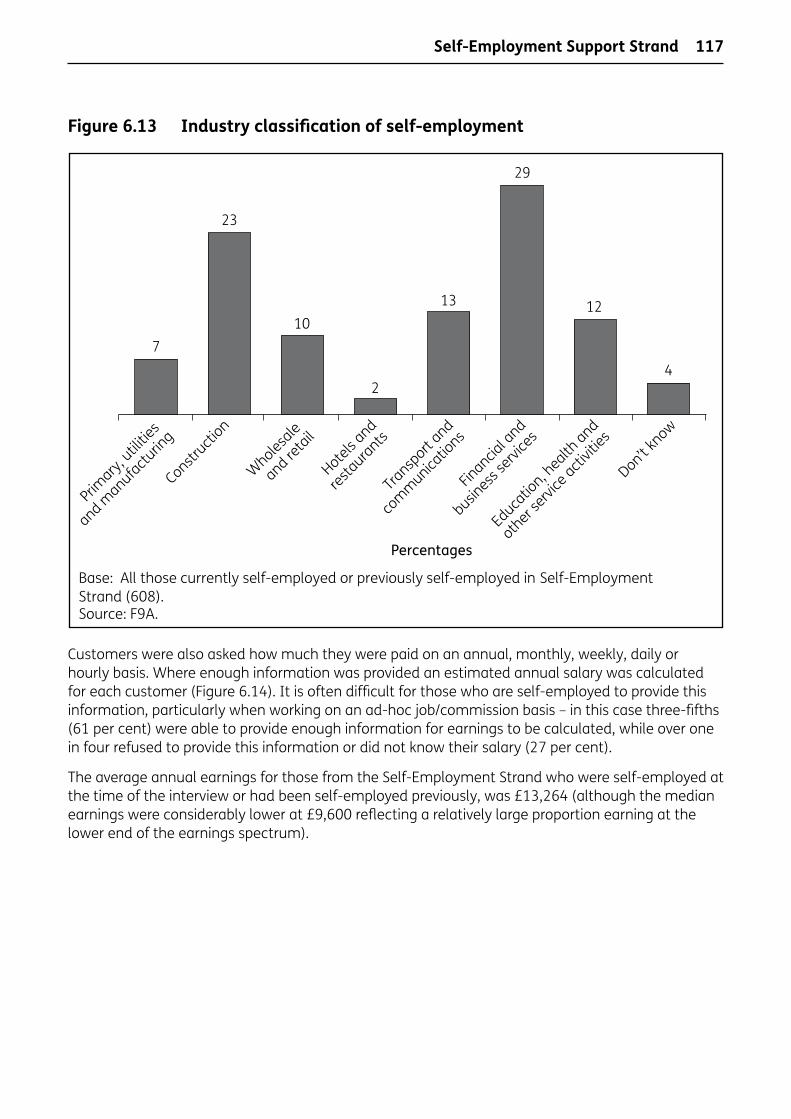
117
Figure 6.13 Industry classification of self-employment
Customers were also asked how much they were paid on an annual, monthly, weekly, daily or hourly basis. Where enough information was provided an estimated annual salary was calculated for each customer (Figure 6.14). It is often difficult for those who are self-employed to provide this information, particularly when working on an ad-hoc job/commission basis – in this case three-fifths (61 per cent) were able to provide enough information for earnings to be calculated, while over one in four refused to provide this information or did not know their salary (27 per cent).
The average annual earnings for those from the Self-Employment Strand who were self-employed at the time of the interview or had been self-employed previously, was £13,264 (although the median earnings were considerably lower at £9,600 reflecting a relatively large proportion earning at the lower end of the earnings spectrum).
Self-Employment Support Strand
Base: All those currently self-employed or previously self-employed in Self-Employment Strand (608).Source: F9A.
Percentages
7
Primary,
utilitie
s
and manufactu
ring
Constructi
on
Wholesa
le
and reta
il
Hotels and
restaurants
Transp
ort and
communica
tions
Financia
l and
business
servi
ces
Educatio
n, health
and
other s
ervice
activit
ies
Don’t know
23
10
2
13
29
12
4

118
Figure 6.14 Annual salary of self-employed
6.10 SummaryComparing the profile of Self-Employment Strand customers with a general profile of customers reaching the six month point of their claim shows that those taking up the Self-Employment Strand were more likely to be men and older customers.
Just under a third of strand customers had previous experience of self-employment. At the other end of the scale, a quarter stated that at the point of entry to the strand, they did not have a firm idea of the type of self-employment they would pursue – they simply had a desire to work for themselves. There is perhaps a question mark over whether the Self-Employment Strand is an appropriate support package for these individuals.
Beyond the introductory self-employment guides, only small minorities of Strand customers received any of the types of externally delivered support available. Only 13 per cent attended workshops on specific elements of self-employment and only 7 per cent received one-to-one coaching. These support elements received very positive ratings from those who attended.
Views were mixed about how well Jobcentre Plus worked with Business Link or equivalent organisations to deliver the Self-Employment Strand. Two-fifths felt that the organisations had not worked well together.
Seven in ten customers (71 per cent) had received SEC and a fifth had received one-off payments from the ADF. Payments from the ADF appeared to have been used appropriately to fund materials or services to support self-employment.
At the time of interview, almost three in five customers were earning an income from self-employment and another one in five stated that they were still working towards self-employment. Customers were working across a wide range of sectors but most commonly in either business services or construction.
Base: All self-employed at some point since ending claim (569).Source: F9D-I.
Percentages
£0-£4,999 £5,000-£9,999
£10,000-£19,999
£20,000-£29,999
£30,000-£40,999
£40,000+
2
14
2
19
16
8
Self-Employment Support Strand

119
7 Outcomes of strand participantsThis chapter compares the outcomes of the various Six Month Offer (6MO) strands, in terms of the employment destinations of customers. It reports on the outcomes of customers who started on the four strands of the 6MO between April to December 2009. However, it does not report on the employment additionality of the 6MO. Planned further 6MO research, i.e. impact analysis, may be able to deliver information on employment additionality of the four 6MO strands.
Figure 7.1 shows the proportion of customers in each strand who were in paid work, claiming JSA or neither at the time of interview in March 2010.
Figure 7.1 Employment and other outcomes of participation, by strand
Outcomes of strand participants
Source: B1, B2, B5 and C1.
RecruitmentSubsidy
Self-employed
Training Volunteering
999 1,001 1,001 1,001
Did not end original claim
Ended original claim butnow returned to JSA
Not in paid work but notreturned to JSA
Currently in paid work
Base: All participants.
Percentages
75 66
19 16
88
8 8
9
7
21
4
18
64 68
120
At the time of research fieldwork in March 2010 three-quarters (75 per cent) of Recruitment Subsidy customers were in either full- or part-time employment or self-employed. By definition all of these will have ended their claim and entered work at some point. However, there is some indication that jobs supported by the Recruitment Subsidy have been sustainable, with two-thirds (66 per cent) with the same employer at the time of interview (four to ten months since participating in the offer) and only one fifth of customers in this strand having returned to claiming JSA. But those who entered work via the bulk billing route were considerably less likely to have been in paid work at the time of interview than those who had entered work through the self-marketing route.48 This might indicate that the staged payments made to employers through the self-marketing route are more effective at securing longer-term employment than the one-off payment made to bulk billing route employers. However, the bulk billing route is more likely to be used in the first instance to secure work on a temporary or casual basis, which may contribute to the lower longer-term employment rates.
For the Self-Employment Strand two-thirds (66 per cent) of customers were in paid work at the time of interview. Most of these (59 per cent of Self-Employment Strand participants overall) had set up on a self-employed basis, rather than working for an employer. This does indicate that the Self-Employment Support (financial and advisory) available through the 6MO is effective in moving individuals into self-employment.
Across the Training and Volunteering Strands, around two-thirds had been claiming JSA continuously up to the point of interview (between three and 12 months after being referred to strand activity). Some of these were still undertaking their training course (9 per cent of Training Strand participants overall) or volunteering placement (30 per cent of Volunteering Strand participants) at the time of interview, and had claimed continuously.
One in 12 customers in each of the Training and Volunteering Strands (8 per cent) had a break from JSA but then returned to claiming. Just under a fifth of customers were in paid work at the time of interview – 19 per cent of Training Strand participants, 16 per cent of Volunteering Strand participants.
48 Unless explicitly stated otherwise, all differences reported in this chapter are statistically significant at the 95 per cent confidence level. Please see Section 1.4 for more details.
Outcomes of strand participants
121
8 Conclusions and recommendations8.1 Promotion/communication of Six Month Offer optionsThe findings from this survey research indicate that the voluntary strands are being widely communicated with most jobseekers reaching the six-month point of their claim aware of at least one of the options available. It appears that the strands are not as yet being communicated universally.
Many customers only remembered being made aware of the Recruitment Subsidy Strand, reflecting the policy of blanket distribution to all eligible customers. Of those who could not recall this strand, most felt they would have been interested. On this basis, assuming that the ratio of voucher distribution to subsidy payment can support this, the current practice of full distribution of the voucher to all reaching six months, unemployment seems appropriate. However, it is clear that some groups felt uncomfortable with using the voucher and others were unsure about how to use it. The latter issue could perhaps be overcome with some advice on how to go about mentioning the subsidy in applications or interviews (particularly for younger and ethnic minority customers). Work has already been done to make the self-marketing voucher easier to use.
Based on the recollections of customers, it appears that advisers were more selective about those to whom they offered the other three strands. There was considerable interest in the Training Strand among those not offered this opportunity. Many said they would be interested in the Volunteering Strand if offered this, particularly from ethnic minorities who were under-represented among participants in the Volunteering Strand.
A quarter of eligible new/repeat Jobseeker’s Allowance (JSA) customers reaching six months claiming participated in one of the 6MO strands (if participation in the Recruitment Subsidy Strand is taken as securing employment against which the subsidy is paid). Hence, experience of these voluntary strands is far from universal.
A small proportion of participants stated that they were under the impression that they would lose benefits if they did not participate in the 6MO strand. Hence incidences of advisers presenting 6MO strands as compulsory appear isolated.
Nearly all customers stated that they were positive about the strand activity from the outset. On one hand this seems appropriate for a voluntary programme. However, it also indicates that there was not a great deal of activity to persuade those who might not initially be keen to participate. There appeared to be some mismatch between policy intention for who should participate in strands and ‘natural’ demand as it was those who were higher qualified who were more likely to state that they were interested in training and volunteering options (while repeat customers and those with no qualifications were under-represented among customers for these strands).
Conclusions and recommendations

122
8.2 Volunteering StrandThe Volunteering Strand appeared to be operating well for participants, with most reporting placements to be well matched to their abilities and resulting in improvements in soft skills and motivation to find work.
The time taken to organise placements was mostly reasonable with the majority of participants having at least initial contact with a broker within two weeks and starting a placement within six weeks. It was also the case that a minority waited considerable periods of time to start a placement which may indicate situations where brokers had a shortage of available placements. It was also the case that only around one in three of those referred to a broker actually end up participating in the strand (and it is only those who participated who were surveyed). While there might be a number of reasons why individuals never progress to starting a placement, this is a relatively high drop-out rate from brokering referrals, and may be due in part to a lack of suitable placements and warrants investigation.
A big role was played by the voluntary sector in terms of providing placements but some engagement of the private sector was also achieved.
Where private sector placements were offered these were most commonly in the wholesale and retail sector, were more likely than average to require a customer to volunteer for at least 16 hours a week and were more likely than average to be fixed-term rather than open-ended.
By comparison, voluntary sector placements typically involved fewer than 16 hours a week and were split fairly evenly between open-ended and fixed-term placements.
Around one in five participants left placements early for reasons other than finding work, e.g. dissatisfaction with the placement or personal circumstances. This is a sizeable minority and there is a danger that an experience of this nature could dissuade employers from participating in the 6MO Volunteering Strand if apparent in the future. It may be worth exploring with brokers and Jobcentre Plus whether more could be done to manage the expectations of participants or conversely, take greater account of personal circumstances to ensure a lower ‘drop out’ rate. It may also be appropriate to reassure employers who do experience an early leaver, that it is the minority of placements that end in this way and would not necessarily be their experience ‘next time round’.
Those taking part in the Volunteering Strand appear to be more likely to be in ‘harder to help’ groups. This is appropriate since other Strands such as the Recruitment Subsidy could be more helpful for those who are job-ready in providing a route to employment. However, a sizeable minority of Volunteering Strand participants were among the better qualified jobseekers currently on their first claim for JSA. It may be the case that direction is needed for advisers as to the outcomes that the Volunteering Strand is intending to achieve if the target for this strand should be those ‘harder to help’. This would tighten referrals more closely.
The proportion of voluntary sector participants who had entered paid work by the time of interview was lower than for other strands and also than the average for six month flow customers at a comparable period (as evident from the Jobseekers Regime and Flexible New Deal (JRFND) Stage 3 survey). This is perhaps unsurprising given that the customer group is mostly skewed towards some harder to help groups. Around two fifths of Volunteering participants (38 per cent) were still engaged with their Volunteering Strand placement at the time of interview, in part explaining the lower employment rates associated with this strand.
More positively, a sizeable minority of participants (5 per cent) were able to secure permanent employment with their placement organisation indicating that in some cases the Volunteering Strand can operate like a work trial.
Conclusions and recommendations
123
8.3 Training StrandQuite a wide range of courses were undertaken as part of the 6MO with course lengths varying considerably.
The policy intention was that courses delivered should lead to a Level 2 or Level 3 qualification, either by delivering part of a qualification or by facilitating entry to Level 2 or Level 3 learning. It appears that a good proportion of learning undertaken was not at this level – half of participants were under the impression that their course did not lead to a formal qualification and some of the courses undertaken clearly do not fit this description (European Computer Driving License (ECDL) courses, Security Industry Authority (SIA) security licenses or Construction Skills Competence Scheme (CSCS) cards). However, it is possible that participants may not have always realised that the course was associated with a qualification if it represented just a unit or module of a full Level 2 or Level 3 qualification.
It was also the intention that the courses demonstrated strong links to local employment and employers. In approximately half of the cases there was no clear link to the local economy that was obvious to participants (although arguably it would be hard to deliver this within a course lasting only a few days).
In some cases, there were quite big gaps between referral to the Training Strand and starting on a training course, which may reflect some difficulties for colleges in delivering ‘roll on roll off’ provision rather than provision structured around the academic year.
The experience of training was generally positive, with the majority of those participating reporting increases in both soft skills (such as team work and communication) and confidence/motivation as a result. Around a third of those who had since found work believed there was a direct link between the training they received and securing employment.
8.4 Recruitment Subsidy StrandDespite large volumes of customers receiving the self-marketing voucher, relatively few had secured employment through this route. This should be viewed in the context of the economic climate at the time of the research with poor employment prospects for jobseekers.
However, the jobs that have been secured using the self-marketing voucher are spread across the economy. For the most part, the early indications show that these jobs are sustainable. Most were taken into permanent positions and customers generally feel that the jobs are well matched to their experience and skills. Around half of those still in employment at the time of interview believed these jobs offer opportunities for development and progression.
It is perhaps a concern that the picture is slightly less positive for customers who secured employment through the bulk billing route. Just under half of this group stated that the job they secured was always intended as casual/temporary and indeed these customers were much less likely to still be in work at the time of interview. It appears that payment of the Recruitment Subsidy in one lump sum (rather than the voucher approach of staged payments) has led to less sustainable job outcomes. However, counterbalancing this, it does appear that the bulk billing route allowed some groups that are under-represented among voucher beneficiaries (those from ethnic minority backgrounds) to benefit from the Recruitment Subsidy. It may be that better direction from advisers on how to use the voucher could improve the means of support from the voucher for these groups.
Conclusions and recommendations
124
Around a third of customers felt that the self-marketing voucher (or bulk billing payment) directly influenced the decision to hire them. In addition, it was also stated that having the voucher gave them greater confidence or motivation to apply for jobs (which in turn is likely to have had a positive impact on the chances of finding employment).
8.5 Self-Employment StrandThe Self-Employment Strand appears to have attracted participants from a wide range of ‘starting points’. Around a third had worked for themselves previously, while at the other end of the spectrum a sizeable proportion entered the Strand without a firm idea of the type of self-employment that they could pursue.
For quite a large proportion of participants, their involvement in the strand was limited to receipt of financial support in the form of a payment from the Adviser Discretion Fund (ADF) or Self-Employment Credit (SEC) and/or written introductory guides. Only a third received some support from Business Link or the equivalent organisations in Wales and Scotland. Those that did receive this additional support from providers (particularly the workshops or coaching) found it very useful hence there would seem to be an argument for providers making these supports more widely available to those receiving some Self-Employment Support, as the full provider service range seems underutilised and rarely offered.
Where participants had received additional provision through Business Link, their views on how well Jobcentre Plus and Business Link worked together were mixed, indicating some difficulties in hand-overs. This is also evident in the fact that the gaps between referral and contact with Business Link were quite long in a number of cases. It is possible that these difficulties may have resulted in fewer individuals accessing Business Link support than may have benefited from it. Improving this aspect will ensure that more targeted support is received as intended.
The outcomes from the Self-Employment Strand appear positive, with over half of participants in self-employment by the time of interview and a reasonable proportion of the remainder still anticipating that they would do so (and a small additional proportion in paid work for an employer). However, a considerable proportion of these were earning at quite low levels so the sustainability of self-employment undertaken remains unclear.
Those who received SEC either on its own or in combination with other support were considerably more likely to have entered self-employment than those who received support only.
Conclusions and recommendations

125
Appendix A Six Month Offer Strand surveySamplingThe Department for Work and Pensions (DWP) drew records for customers starting strand activity between April and December 2009. For the Recruitment Subsidy Strand and Self-Employment Strand a sample of known starts were sourced from DWP records. For the Volunteering Strand records were drawn by the DWP for those referred to a volunteering broker and were screened to check that they had actually taken up a volunteering placement. For the Training Strand, a sample of those starting courses funded through the Six Month Offer (6MO) was sourced from the Learning and Skills Council’s Individualised Learner Record (ILR) for England and Wales with a supplementary sample obtained for Scotland from DWP records.
29,912 records were received from the DWP; 8359 for the Recruitment Subsidy Strand, 12,202 for the Volunteering Strand, 8721 for the Self-Employment Strand, and 630 Scottish records for the Training Strand. 21,354 records were sampled from the ILR for the English and Welsh Training Strand. Records were then excluded from the sampling frame that would not have been possible to contact (no valid postal address or telephone number).
Opt-out and fieldwork outcomesAll customers were given the opportunity to opt out of the study prior to being contacted by telephone. Letters were sent out to all those selected to take part (36,082 in total) which gave a dedicated phone number at IFF that they could call if they did not wish to be contacted further.
The opt-out rate was 2 per cent for the Recruitment Subsidy Strand, Self-Employment Strand, and Training Strand and 3 per cent for the Volunteering Strand. At the overall level, 3 per cent of those drawn across all four strands informed us they did not want to participate following their receipt of the opt-out letter.
Before commencing an interview customers were asked to confirm that they had started a claim for Jobseeker’s Allowance (JSA) or had their New Jobseekers Interview in the month started claim date provided by the DWP. In total only 1 per cent (calculated as a percentage of ‘completes’ plus ‘refused’ plus ‘quit’ plus ‘screen out’) of customers who began an interview screened out at this stage as they disagreed with the details held by the Jobcentre Plus (they either reported never receiving JSA at all, started claiming JSA but not in the specific month, or started a claim for a different benefit, not JSA in the specific month).
The overall response rate for the 6MO Strand survey was 83 per cent (completes as a per cent of completes plus refusals) and 96 per cent of all customers interviewed agreed to be re-contacted in a year’s time for the longitudinal study. This response rate varied for each strand as shown in Table A.1.
Appendices – Six Month Offer Strand Survey

126
Table A.1 Response rate by strand
Recruitment Subsidy Strand
%
Self-Employment Strand
%
Training Strand
%
Volunteering Strand
%Response rate 85 85 88 75Happy to be re-contacted 95 95 97 97
The large majority of customers interviewed (92 per cent) were also happy to have their records linked to administrative records held by the DWP.
Table A.2 shows the final fieldwork outcomes for each strand, showing the breakdown of sample with definite outcomes (excludes those spoken to but required call back, those called but no answer and those not attempted to contact because quotas were filled). The refused category includes those who did not want to participate or quit during the interview. Unreachable sample includes unusable telephone numbers and respondents unreachable because they were unavailable before the end of the fieldwork deadline, had moved abroad, were in prison, or were deceased. The unable to participate category includes customers who were unable to take part in the survey due to health or language reasons.
Table A.2 Fieldwork outcomes
Recruitment Subsidy Strand
%
Self-Employment Strand
%
Training Strand
%
Volunteering Strand
%Completes 54 51 57 23Refused 10 9 8 8Unreachable 28 23 28 21Screened out 8 16 7 47Unable to participate 1 1 * 1 Base: All sample with definite outcome
Statistical significance and confidence intervalsUnless explicitly stated otherwise, all differences that have been reported are statistically significant at the 95 per cent confidence level. That is to say, there is a 95 per cent probability that the difference reported is real and not the result of sampling error. Table A.3 illustrates the confidence intervals for a range of findings (percentages) at overall strand level based on a sample size of 1,000 and 6,000 (as used in Chapter 2). So, if the report states that 30 per cent of customers in a particular strand had entered paid work, there is a 95 per cent probability that the ‘real’ proportion lies between 27.2 per cent and 32.8 per cent.
Appendices – Six Month Offer Strand Survey

127
Table A.3 Confidence intervals
FindingConfidence interval at 95 per
cent level, sample of 1,000Confidence interval at 95 per
cent level, sample of 6,000(%) (+/-)5 1.4 0.6
10 1.9 0.815 2.2 0.920 2.5 1.025 2.7 1.130 2.8 1.235 3.0 1.240 3.0 1.245 3.1 1.350 3.1 1.355 3.1 1.360 3.0 1.265 3.0 1.270 2.8 1.275 2.7 1.180 2.5 1.085 2.2 0.990 1.9 0.895 1.4 0.6
Please note that findings based on customer sub-groups will be based on smaller sample sizes and will, therefore, have larger confidence intervals. Again, only sub-group differences that are statistically significant are presented in this report apart from where explicitly stated otherwise.
Event timetableThe following table shows the timing of sampling, fieldwork and reporting events for the 6MO Evaluation. The sampling period stretched from the time of roll out of the 6MO in April 2009 to December 2009.
Appendices – Six Month Offer Strand Survey

128
Table A.4 Evaluation event timetable
Month EventApril 2009 Roll out of 6MOMay 2009June 2009July 2009August 2009 Sampling period – Started strandSepember 2009October 2009November 2009December 2009January 2010February 2010 Initial fieldworkMarch 2010April 2010May 2010 ReportingJune 2010July 2010August 2010September 2010October 2010November 2010December 2010January 2011February 2011 Longitudinal fieldworkMarch 2011April 2011 Reporting
Appendices – Six Month Offer Strand Survey
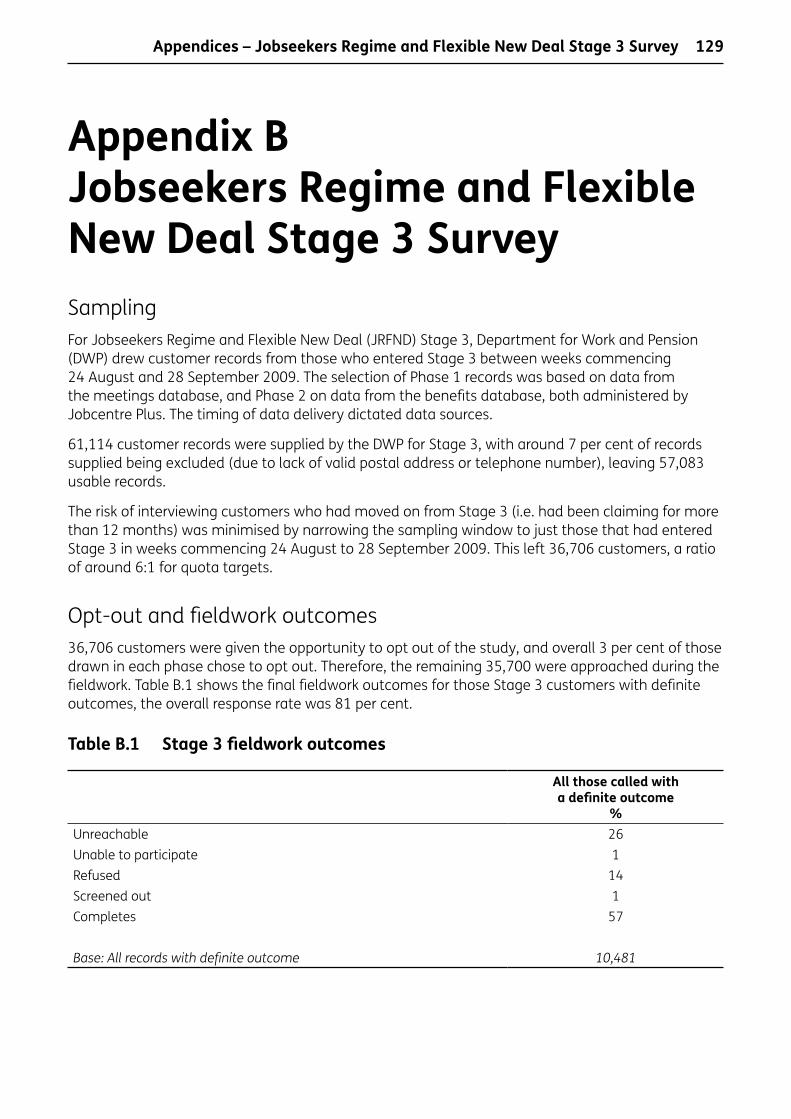
129
Appendix B Jobseekers Regime and Flexible New Deal Stage 3 SurveySamplingFor Jobseekers Regime and Flexible New Deal (JRFND) Stage 3, Department for Work and Pension (DWP) drew customer records from those who entered Stage 3 between weeks commencing 24 August and 28 September 2009. The selection of Phase 1 records was based on data from the meetings database, and Phase 2 on data from the benefits database, both administered by Jobcentre Plus. The timing of data delivery dictated data sources.
61,114 customer records were supplied by the DWP for Stage 3, with around 7 per cent of records supplied being excluded (due to lack of valid postal address or telephone number), leaving 57,083 usable records.
The risk of interviewing customers who had moved on from Stage 3 (i.e. had been claiming for more than 12 months) was minimised by narrowing the sampling window to just those that had entered Stage 3 in weeks commencing 24 August to 28 September 2009. This left 36,706 customers, a ratio of around 6:1 for quota targets.
Opt-out and fieldwork outcomes36,706 customers were given the opportunity to opt out of the study, and overall 3 per cent of those drawn in each phase chose to opt out. Therefore, the remaining 35,700 were approached during the fieldwork. Table B.1 shows the final fieldwork outcomes for those Stage 3 customers with definite outcomes, the overall response rate was 81 per cent.
Table B.1 Stage 3 fieldwork outcomes
All those called with a definite outcome
%Unreachable 26Unable to participate 1Refused 14Screened out 1Completes 57
Base:Allrecordswithdefiniteoutcome 10,481
Appendices – Jobseekers Regime and Flexible New Deal Stage 3 Survey

130
Customers were asked to confirm that they had started a claim for JSA within a specified date range (week commencing 23 February up to week commencing 28 September 2009). For Stage 3 this resulted in 1 per cent of those who began an interview screening out at this stage.
Completed interviews6,006 interviews were conducted, split evenly across each phase/age cell as detailed in Table B.2.
Table B.2 Achieved interviews by phase and age at start of claim according to DWP records
Phase 1 Phase 2 AllUnder 25 1,000 1,002 2,00225 – 49 1,001 1,000 2,00150 or over 1,002 1,001 2,003All 3,003 3,003 6,006
WeightingThere were two stages to the weighting process for the JRFND Stage 3 survey. The 50 plus age group were over-sampled to ensure sufficient sample will be available in each phase for the longitudinal element, so initially a design weight was applied to correct for this and align the age profile with the age profile of the population in each phase.
Secondly, non-response rates for customer types within each phase were analysed resulting in a response weight being applied to correct for response bias by ethnicity. Gender and health/disability status were also checked but no weighting was required as the achieved sample closely matched the population on these variables. The weighted profile of customers in each phase is presented in the following table.
Appendices – Jobseekers Regime and Flexible New Deal Stage 3 Survey

131
Table B.3 Stage 3 weighted customer profile within phase
Phase 1 customers –
reported %
Phase 2 customers –
reported %
All – DWP population
figures %
Age Under 25 37 39 3925-49 36 41 4250+ 17 18 18
EthnicityWhite British 85 78 78White Irish 1 1 *White other 1 2 2Mixed white and black Caribbean 1 1 1Mixed white and black African * * *Mixed white and Asian 1 * *Other mixed background * 1 *Black or black British Caribbean 2 4 2Black or black British African 2 3 2Black or black British other * 1 1Asian or Asian British Indian 2 2 2Asian or Asian British Pakistani 2 3 2Asian or Asian British Bangladeshi 1 1 1Asian or Asian British other 1 1 1Chinese * * *Other ethnic background * 1 1
Appendices – Jobseekers Regime and Flexible New Deal Stage 3 Survey

Research report
Evaluation of the Six Month Offer: A report on quantitative research findings by Lorna Adams, Katie Oldfield, Laura Godwin and Charlie Taylor
Evaluation of the Six Month O
ffer: A report on quantitative research findingsDW
P Research report no. 699
Published by the Department for Work and PensionsOctober 2010www.dwp.gov.ukResearch report no. 699 ISBN 978-1-84712-854-6
This research explored the implementation and delivery of the four strands of the Six Month Offer (6M0). A survey was undertaken across Great Britain, in March/April 2010, nearly a year after implementation in April 2009, to help understand the impact of these measures on Jobcentre Plus customers. Further information was added from Jobcentre Plus customers who were surveyed about 6MO as part of a Jobseekers Regime Flexible New Deal (JRFND) survey in late 2009.
This is the second in a series of Support for Newly Unemployed (SNU) and 6MO research reports aiming to establish the extent to which SNU and 6MO lead to additional customer employment outcomes.
If you would like to know more about DWP research, please contact: Paul Noakes, Commercial Support and Knowledge Management Team,Work and Welfare Central Analysis Division, 3rd Floor, Caxton House, Tothill Street, London SW1H 9NA.http://research.dwp.gov.uk/asd/asd5/rrs-index.asp
503990_DWP report 699.indd 1 08/10/2010 14:18:51


![Quantitative Findings from Cambodia’s Violence Against Children Survey 2013 [Khmer]](https://img.pdfslide.net/doc/110x75/577cc0c81a28aba71191188a/quantitative-findings-from-cambodias-violence-against-children-survey-2013.jpg)


![Quantitative Findings from Cambodia's Violence Against Children Survey 2013 [English]](https://img.pdfslide.net/doc/110x75/577cc0c81a28aba71191188b/quantitative-findings-from-cambodias-violence-against-children-survey.jpg)