Embed Size (px)
Citation preview

Evaluation of Training Programmes Offered
Online in India
Prof(Dr)PK Tulsi, Dean R&D, [email protected](Dr) MP Poonia, Director, [email protected]
National Institute of Technical Teachers Training & ResearchChandigarh (INDIA)
Introduction
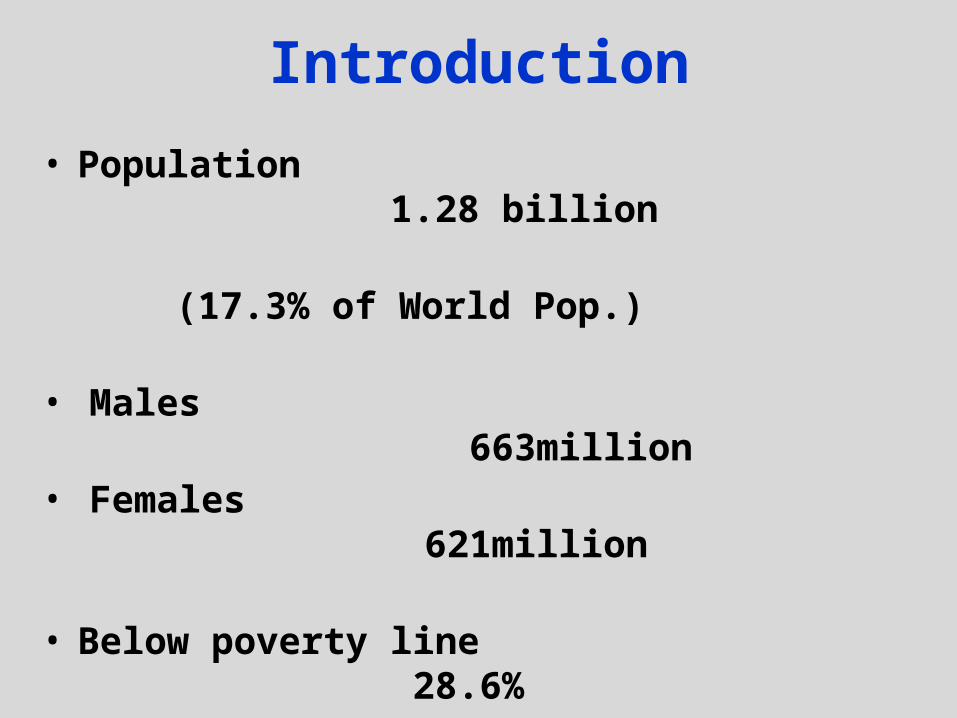
• Population 1.28 billion
(17.3% of World Pop.) • Males 663million
• Females 621million
• Below poverty line 28.6%• Service sector contribution 55.2%
to GDP • Literacy rate 74%• Male literacy rate 82.14%• Female literacy rate 65.46%
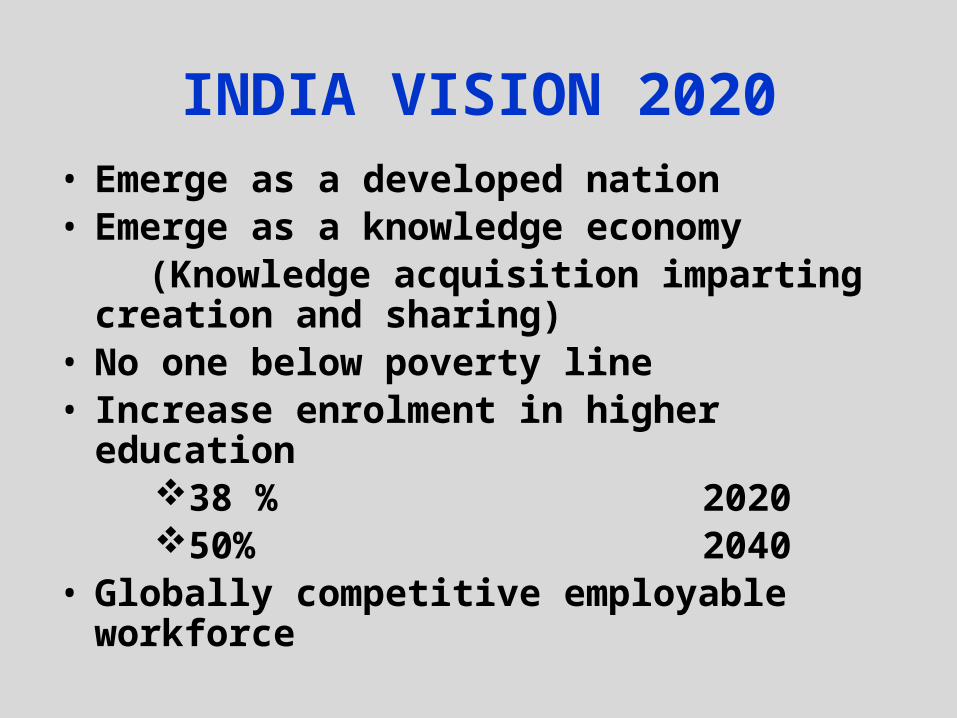
INDIA VISION 2020• Emerge as a developed nation• Emerge as a knowledge economy (Knowledge acquisition imparting creation and
sharing)• No one below poverty line• Increase enrolment in higher education
38 % 202050% 2040
• Globally competitive employable workforce
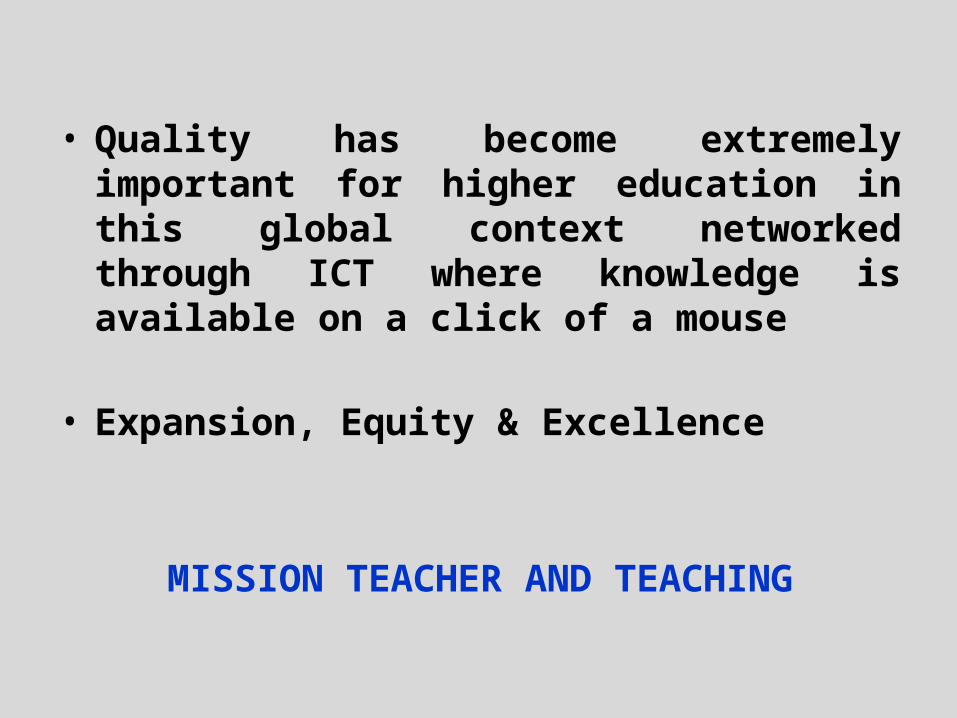
• Quality has become extremely important for higher education in this global context networked through ICT where knowledge is available on a click of a mouse
• Expansion, Equity & Excellence
MISSION TEACHER AND TEACHING
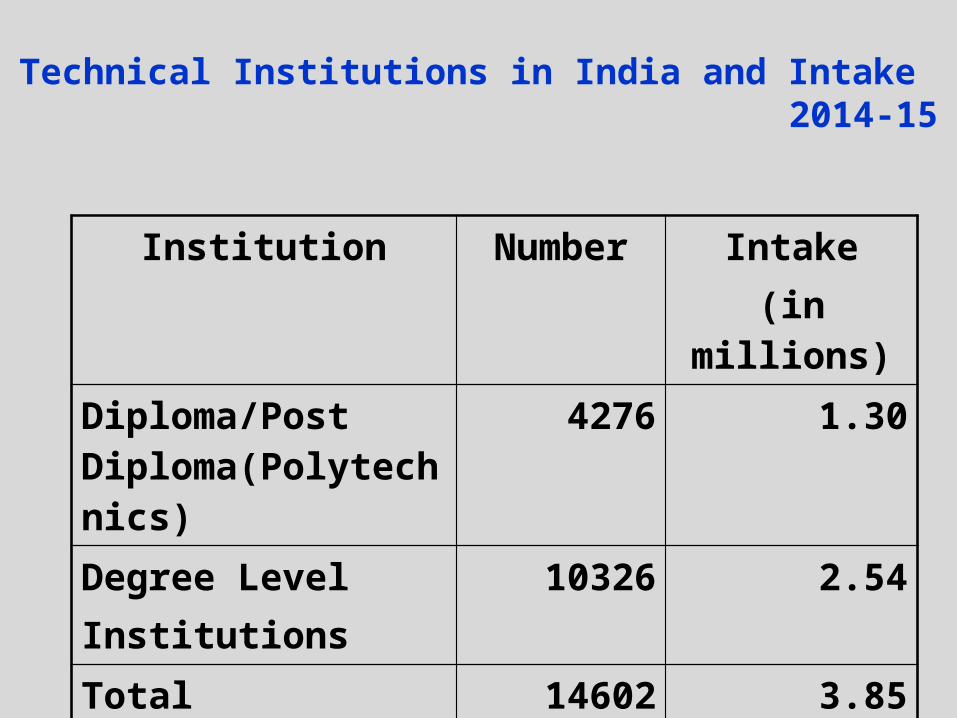
Technical Institutions in India and Intake 2014-15
Institution Number Intake(in millions)
Diploma/Post Diploma(Polytechnics)
4276 1.30
Degree LevelInstitutions
10326 2.54
Total 14602 3.85
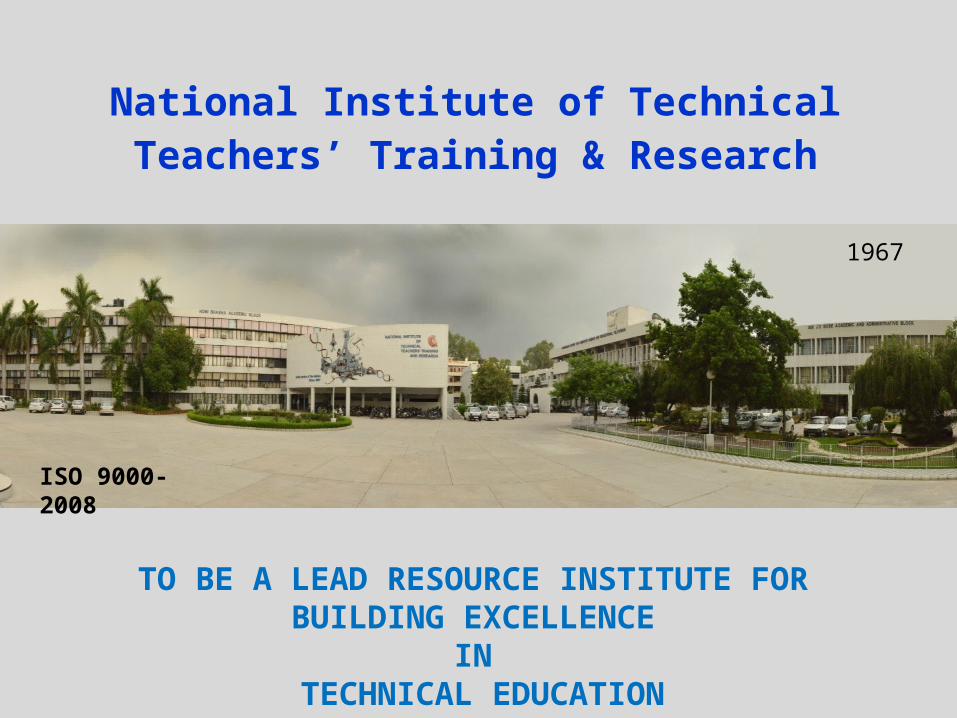
National Institute of Technical Teachers’ Training & Research
1967
ISO 9000-2008
TO BE A LEAD RESOURCE INSTITUTE FOR BUILDING EXCELLENCE
IN TECHNICAL EDUCATION
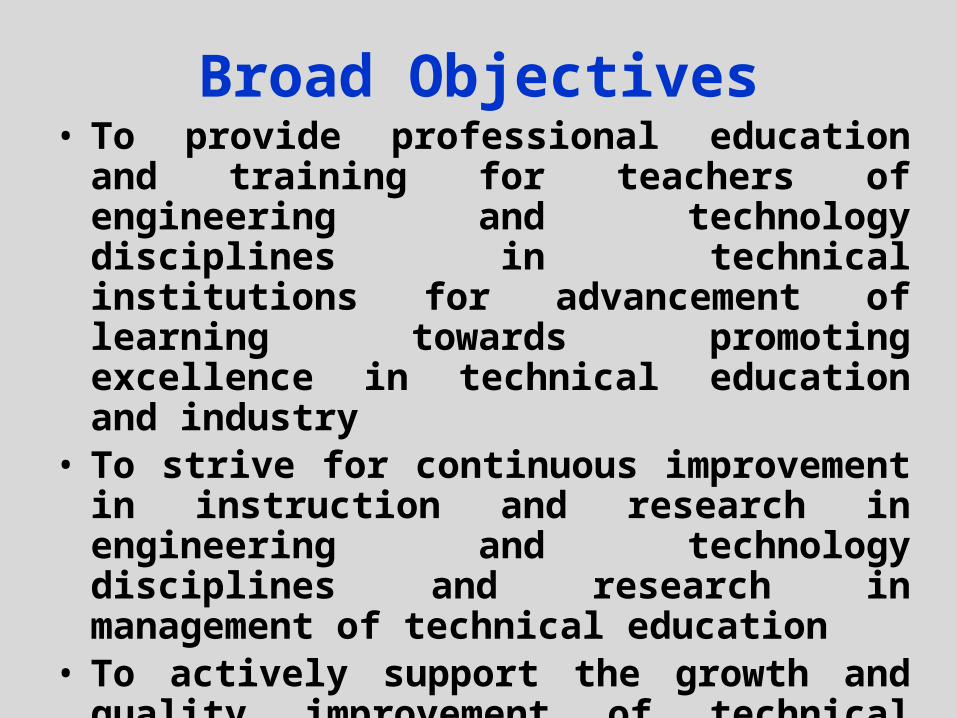
Broad Objectives• To provide professional education and training for
teachers of engineering and technology disciplines in technical institutions for advancement of learning towards promoting excellence in technical education and industry
• To strive for continuous improvement in instruction and research in engineering and technology disciplines and research in management of technical education
• To actively support the growth and quality improvement of technical education in the country through involvement in activities at national and state levels

Education & Training
Curriculum Development
Instructional Material Development
Research and Development
Extension & Consultancy
PROGRAMMES &
ACTIVITIES
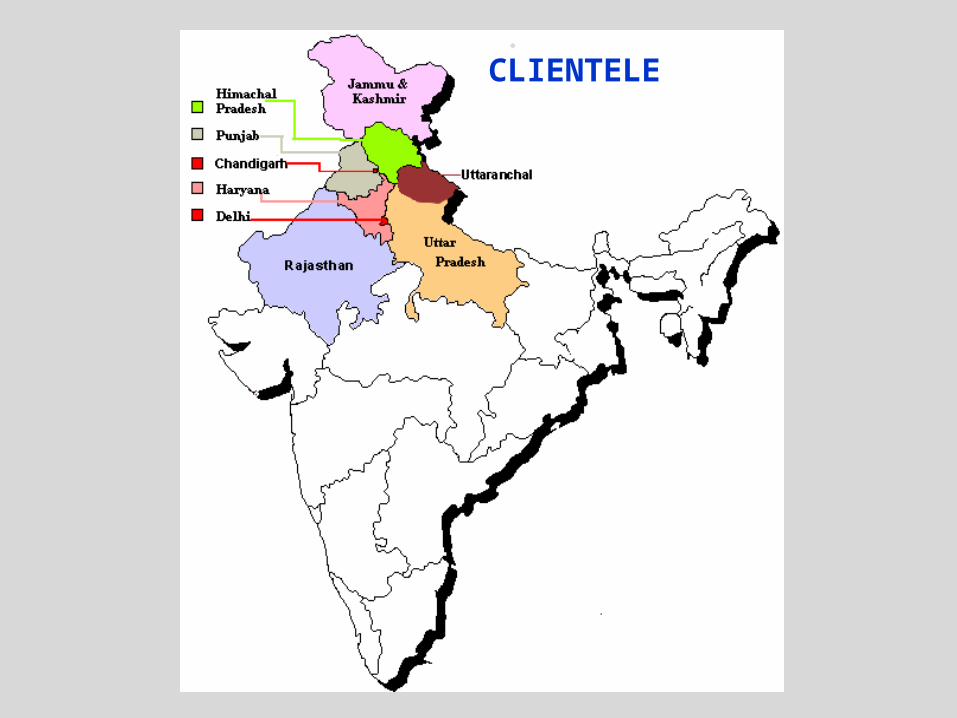
CLIENTELE
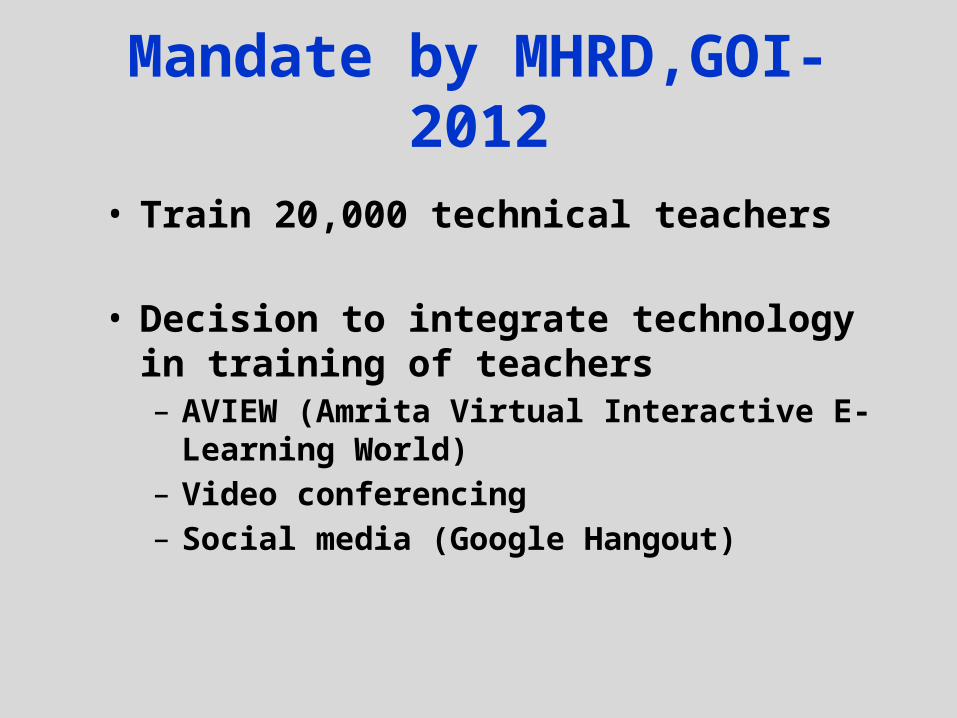
Mandate by MHRD,GOI-2012
• Train 20,000 technical teachers
• Decision to integrate technology in training of teachers – AVIEW (Amrita Virtual Interactive E-Learning World)– Video conferencing– Social media (Google Hangout)

Education Television Studio: NITTTR
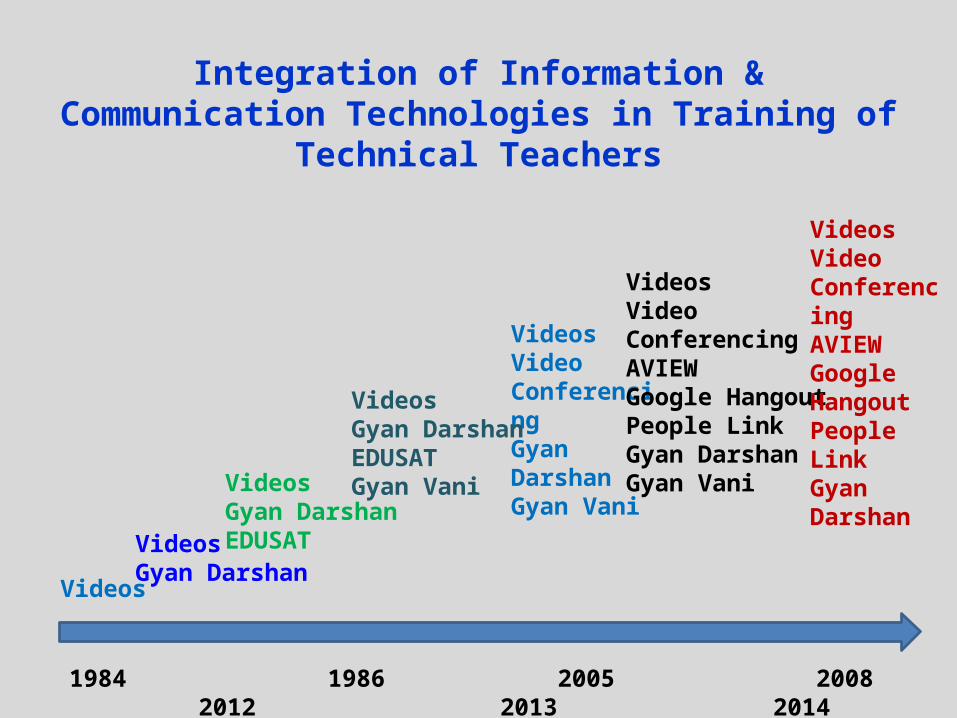
Integration of Information & Communication Technologies in Training of Technical Teachers
1984 1986 2005 2008 2012 2013 2014
Videos
VideosGyan DarshanEDUSATVideos
Gyan Darshan
VideosVideo ConferencingGyan DarshanGyan Vani
VideosVideoConferencingAVIEWGoogle HangoutPeople LinkGyan DarshanGyan Vani
VideosVideoConferencingAVIEWGoogle HangoutPeople LinkGyan Darshan
VideosGyan DarshanEDUSATGyan Vani
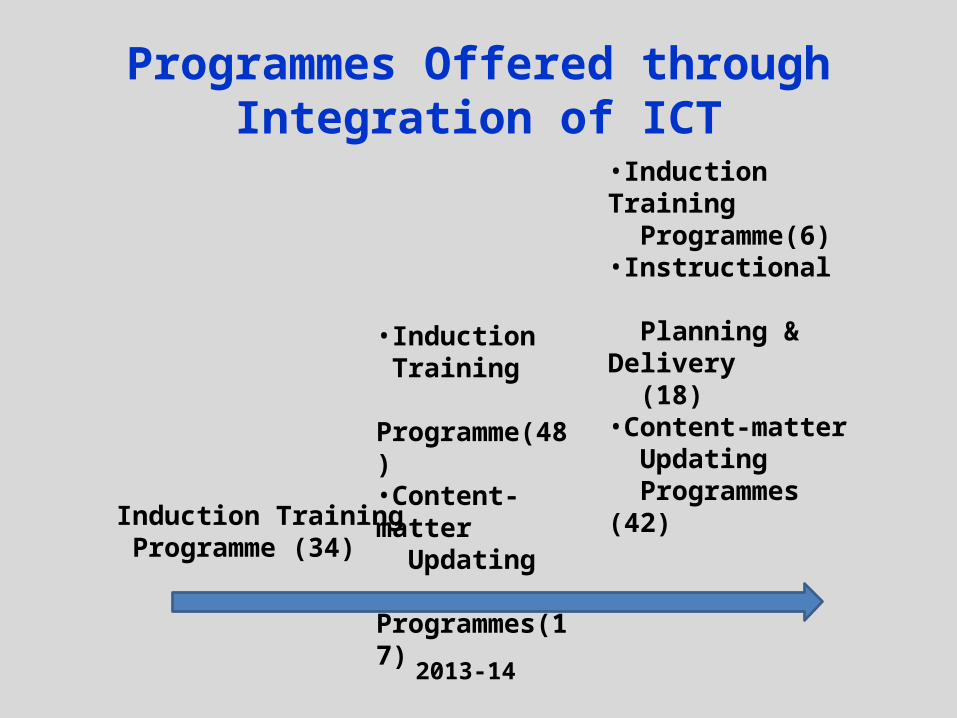
Programmes Offered through Integration of ICT
2012-13 2013-14 2014-15
Induction Training Programme (34)
•Induction Training Programme(48) •Content-matter Updating Programmes(17)
•Induction Training Programme(6)•Instructional Planning & Delivery (18)•Content-matter Updating Programmes (42)

UT/State Polytechnic Engineering College
Chandigarh 45 -
Delhi 83 -
Haryana 447 176
HP 138 155
J&K 195 18
Punjab 534 334
Rajasthan 937 867
UP 279 135
Uttrakhand 317 29
Grand total 2975 1714
Grand Total: 4689
Technical Teachers Trained through ICT Programmes-September 2012-March 2013
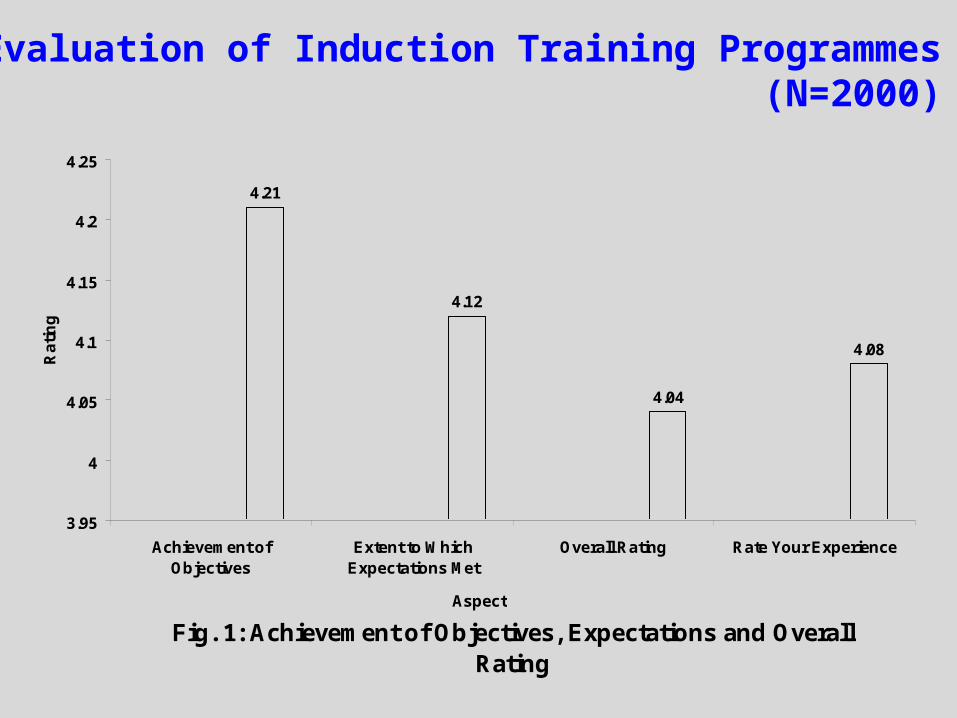
Fig. 1: Achievement of Objectives, Expectations and Overall Rating
4.21
4.12
4.04
4.08
3.95
4
4.05
4.1
4.15
4.2
4.25
Achievement ofObjectives
Extent to WhichExpectations Met
Overall Rating Rate Your Experience
Aspect
Ra
tin
gEvaluation of Induction Training Programmes
(N=2000)
4.24
4.09
3.95
4.114.17
4.31
3.9
4.04
3.92
4.09
3.83
3.69
3.93
4.06
3.3
3.4
3.5
3.6
3.7
3.8
3.9
4
4.1
4.2
4.3
4.4
Ra
tin
g
Aspects
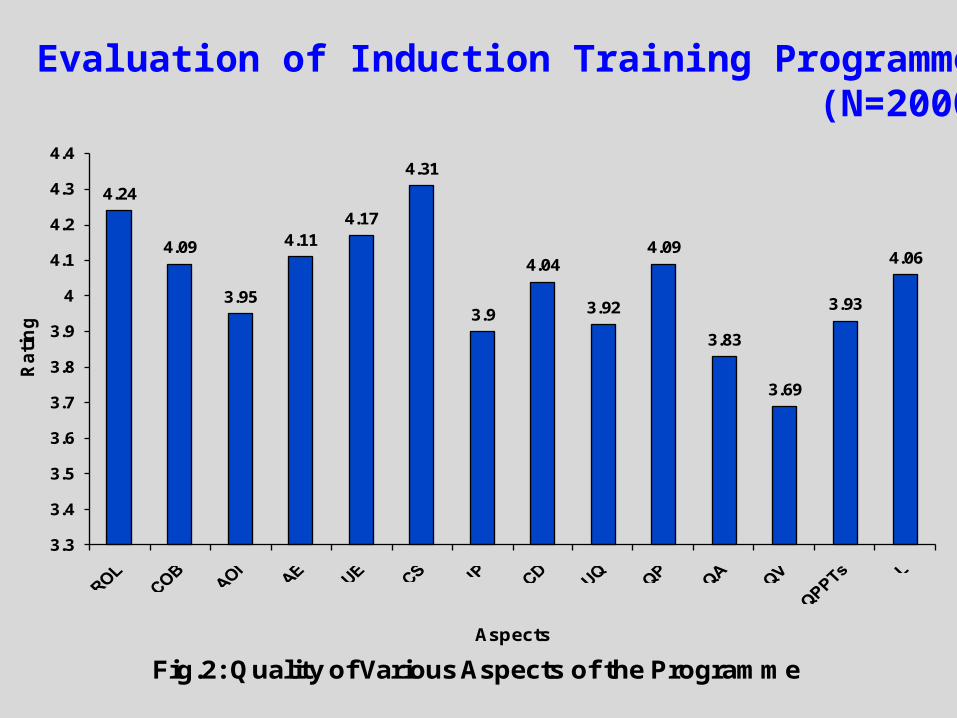
Fig.2: Quality of Various Aspects of the Programme
Evaluation of Induction Training Programmes(N=2000)
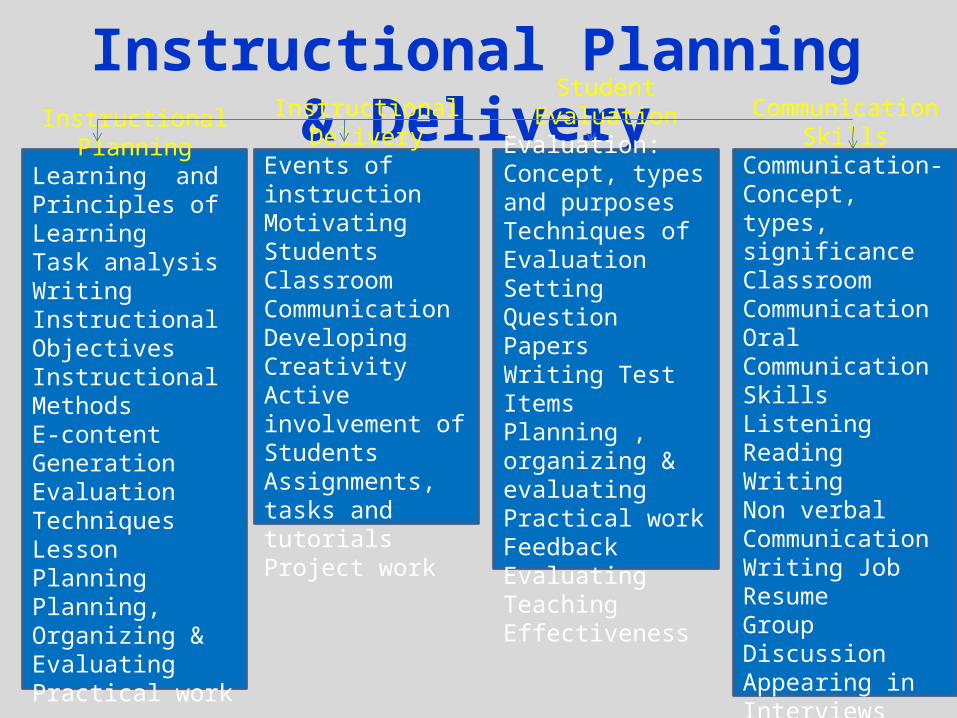
Instructional Planning & DeliveryInstructional
PlanningLearning and Principles of LearningTask analysisWriting Instructional ObjectivesInstructional MethodsE-content GenerationEvaluation TechniquesLesson PlanningPlanning, Organizing & Evaluating Practical work
Instructional Delivery
Events of instructionMotivating StudentsClassroom CommunicationDeveloping CreativityActive involvement of StudentsAssignments, tasks and tutorialsProject work
Student EvaluationEvaluation: Concept, types and purposesTechniques of EvaluationSetting Question PapersWriting Test ItemsPlanning , organizing & evaluating Practical workFeedbackEvaluating Teaching Effectiveness
Communication Skills
Communication-Concept, types, significanceClassroom CommunicationOral Communication SkillsListeningReading Writing Non verbal CommunicationWriting Job ResumeGroup DiscussionAppearing in Interviews

Approach
• Input• Task• Presentations by participants• Feedback
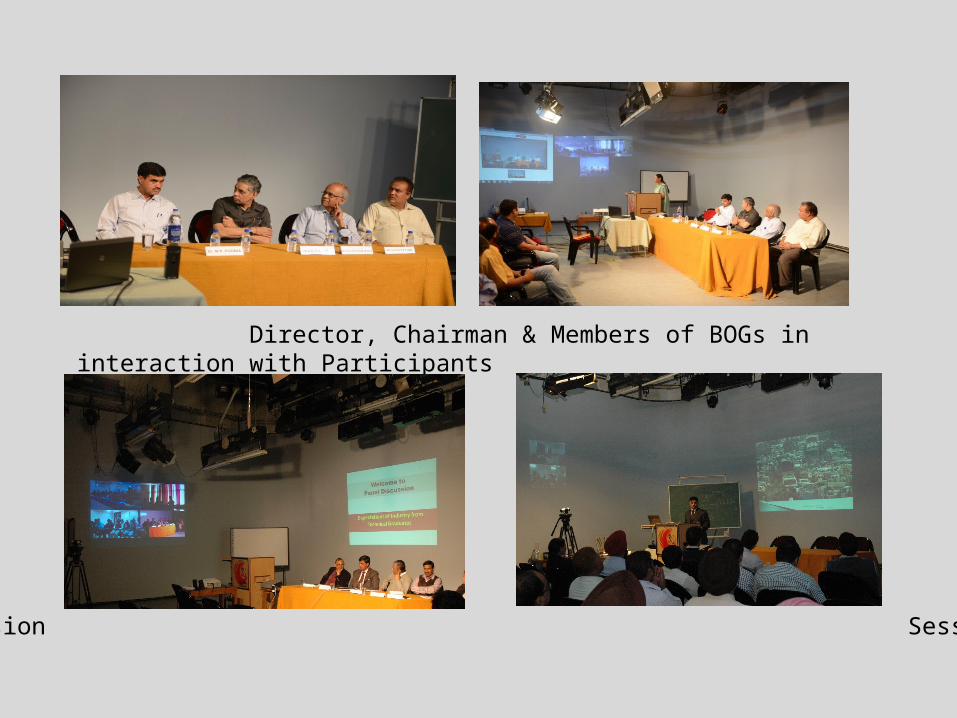
Panel Discussion Session in Progress
Director, Chairman & Members of BOGs in interaction with Participants
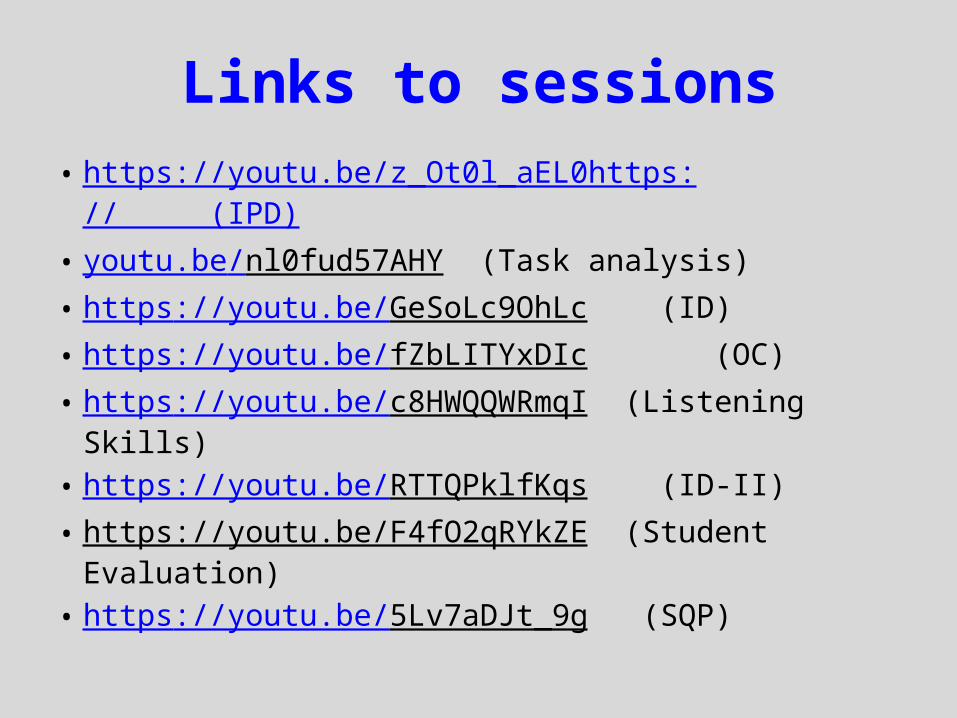
Links to sessions• https://youtu.be/z_Ot0l_aEL0https:// (IPD)• youtu.be/nl0fud57AHY (Task analysis)• https://youtu.be/GeSoLc9OhLc (ID)• https://youtu.be/fZbLITYxDIc (OC)• https://youtu.be/c8HWQQWRmqI (Listening Skills)• https://youtu.be/RTTQPklfKqs (ID-II)• https://youtu.be/F4fO2qRYkZE (Student
Evaluation)• https://youtu.be/5Lv7aDJt_9g (SQP)

Sample for the Evaluation (April to Dec 2014)
Programme/Module Total Trained Sample
Induction Training Programme
1200 685Instructional Planning
Instructional Delivery
Student Evaluation
Communication Skills
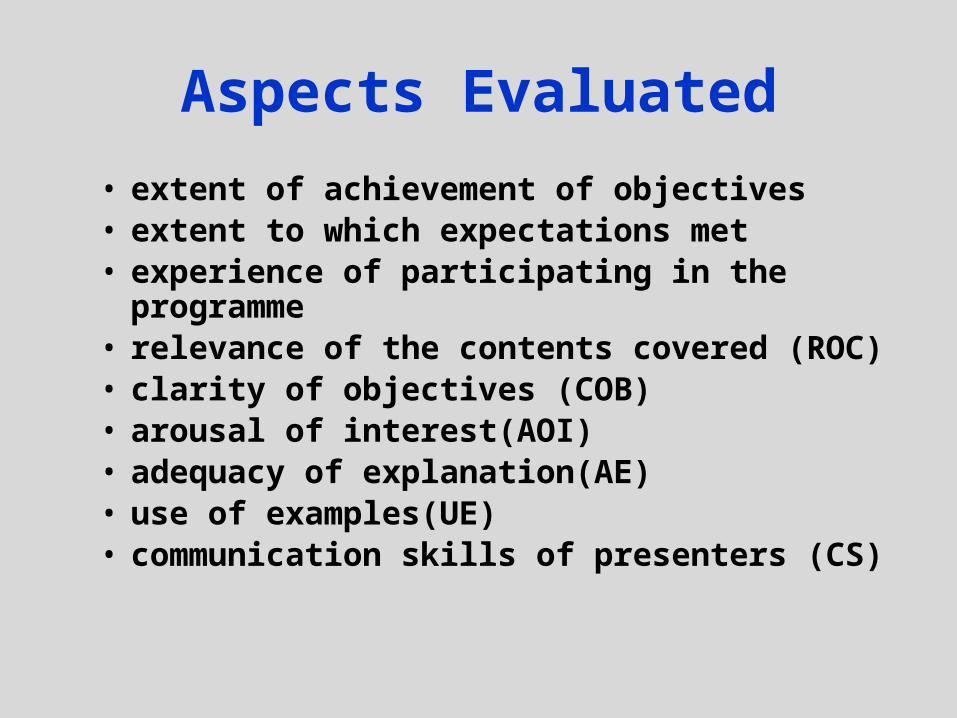
Aspects Evaluated
• extent of achievement of objectives• extent to which expectations met• experience of participating in the programme• relevance of the contents covered (ROC)• clarity of objectives (COB) • arousal of interest(AOI) • adequacy of explanation(AE)• use of examples(UE)• communication skills of presenters (CS)

Contd.
• involvement of participants (IP)• opportunities to clarify doubts (COD)• use of questions(UQ)• quality of presentation (QP)• quality of audio(QA)• quality of video(QV)• quality of power point presentations ( QPPTs)
• learning(L)
0.0
10.0
20.0
30.0
40.0
50.0
60.0
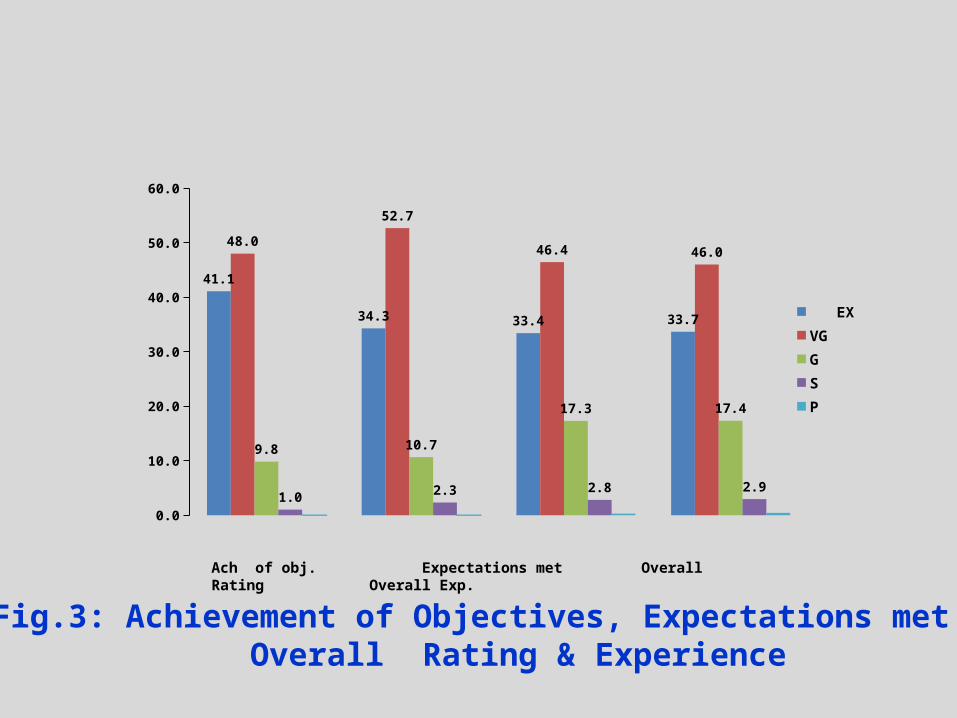
41.1
34.3 33.4 33.7
48.0
52.7
46.4 46.0
9.8 10.7
17.3 17.4
1.0 2.3 2.8 2.9
EXVGGSP
Ach of obj. Expectations met Overall Rating Overall Exp.
Fig.3: Achievement of Objectives, Expectations met and Overall Rating & Experience
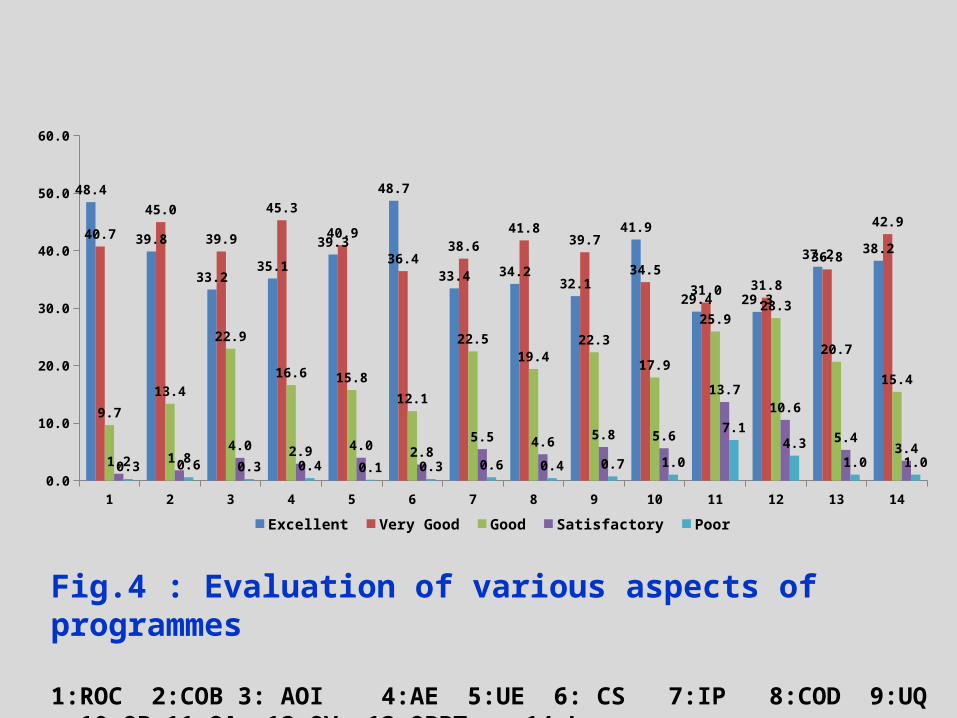
Fig.4 : Evaluation of various aspects of programmes
1:ROC 2:COB 3: AOI 4:AE 5:UE 6: CS 7:IP 8:COD 9:UQ 10:QP 11:QA 12:QV 13:QPPTs 14:L
1 2 3 4 5 6 7 8 9 10 11 12 13 140.0
10.0
20.0
30.0
40.0
50.0
60.0
48.4
39.8
33.235.1
39.3
48.7
33.4 34.232.1
41.9
29.4 29.3
37.2 38.240.7
45.0
39.9
45.3
40.9
36.438.6
41.839.7
34.5
31.0 31.8
36.8
42.9
9.7
13.4
22.9
16.6 15.8
12.1
22.519.4
22.3
17.9
25.928.3
20.7
15.4
1.2 1.84.0 2.9 4.0 2.8
5.5 4.6 5.8 5.6
13.710.6
5.43.4
0.3 0.6 0.3 0.4 0.1 0.3 0.6 0.4 0.7 1.0
7.14.3
1.0 1.0
Excellent Very Good Good Satisfactory Poor
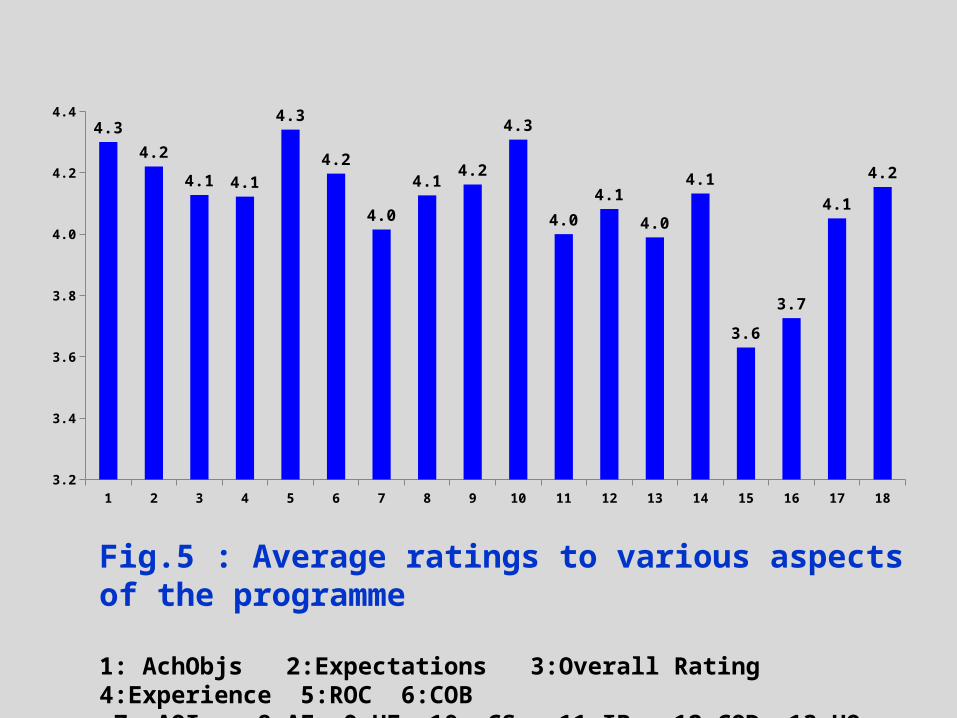
Fig.5 : Average ratings to various aspects of the programme
1: AchObjs 2:Expectations 3:Overall Rating 4:Experience 5:ROC 6:COB 7: AOI 8:AE 9:UE 10: CS 11:IP 12:COD 13:UQ 14:QP15:QA 16:QV 17:QPPTs 18:L
1 2 3 4 5 6 7 8 9 10 11 12 13 14 15 16 17 183.2
3.4
3.6
3.8
4.0
4.2
4.44.3
4.2
4.1 4.1
4.3
4.2
4.0
4.14.2
4.3
4.0
4.1
4.0
4.1
3.6
3.7
4.1
4.2
Comments by Participants• Useful programme• Interactive and useful programme • Learnt how to teach• Provided insight into teaching-learning• I will try to improve quality of my teaching as
experienced in the programme----• I am really inspired by the programme----• I will try to implement what I have learnt in the
programme-------• Great job done by NITTTR• Programme should be compulsary for all teachers-----
Problems Faced
• quality of audio• quality of video• internet connectivity- bandwidth issues• lack of commitment on the part of leader• Lack of seriousness on the part of teachers• Lack of trained technical personnel• Non- availability of high quality infrastructure
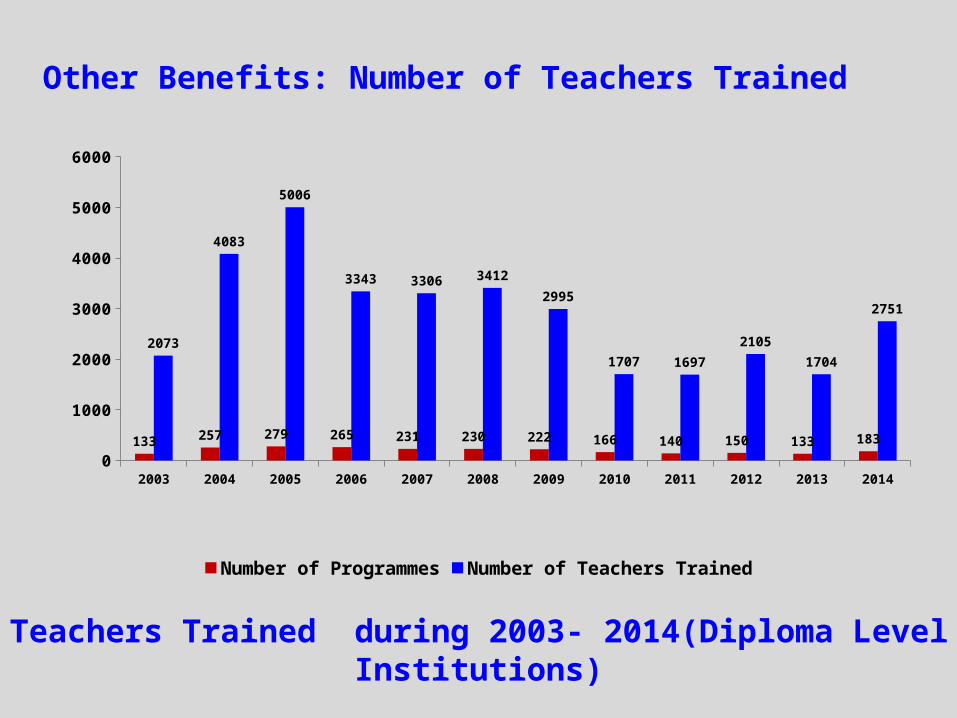
2003 2004 2005 2006 2007 2008 2009 2010 2011 2012 2013 20140
1000
2000
3000
4000
5000
6000
133 257 279 265 231 230 222 166 140 150 133 183
2073
4083
5006
3343 3306 3412
2995
1707 1697
2105
1704
2751
Number of Programmes Number of Teachers Trained
Teachers Trained during 2003- 2014(Diploma Level Institutions)
Other Benefits: Number of Teachers Trained
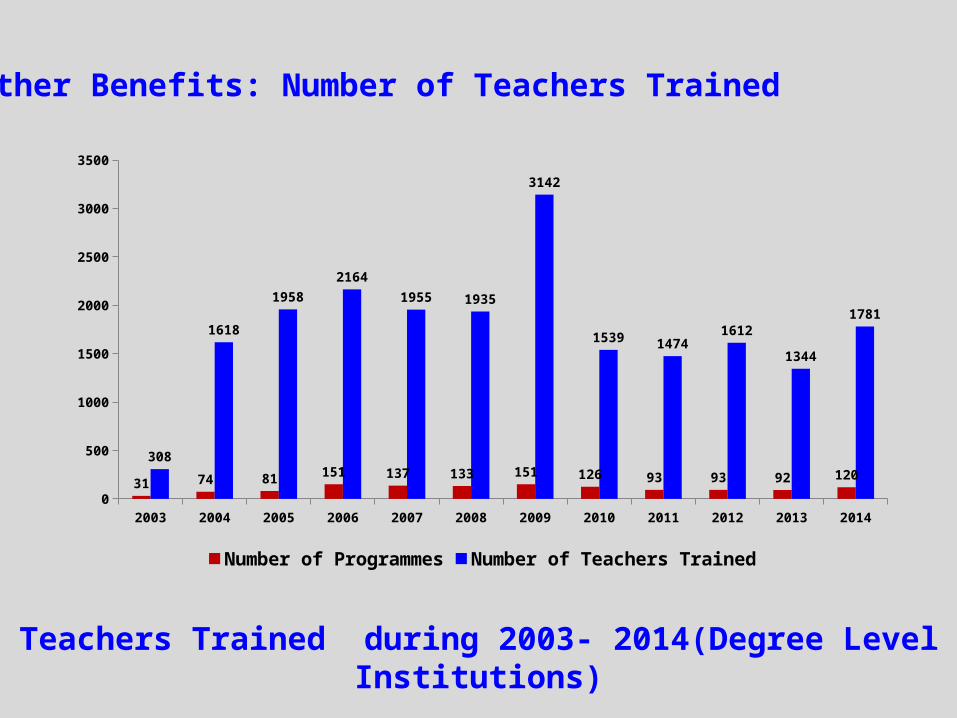
2003 2004 2005 2006 2007 2008 2009 2010 2011 2012 2013 20140
500
1000
1500
2000
2500
3000
3500
31 74 81 151 137 133 151 126 93 93 92 120308
1618
1958
2164
1955 1935
3142
1539 14741612
1344
1781
Number of Programmes Number of Teachers Trained
Teachers Trained during 2003- 2014(Degree Level Institutions)
Other Benefits: Number of Teachers Trained
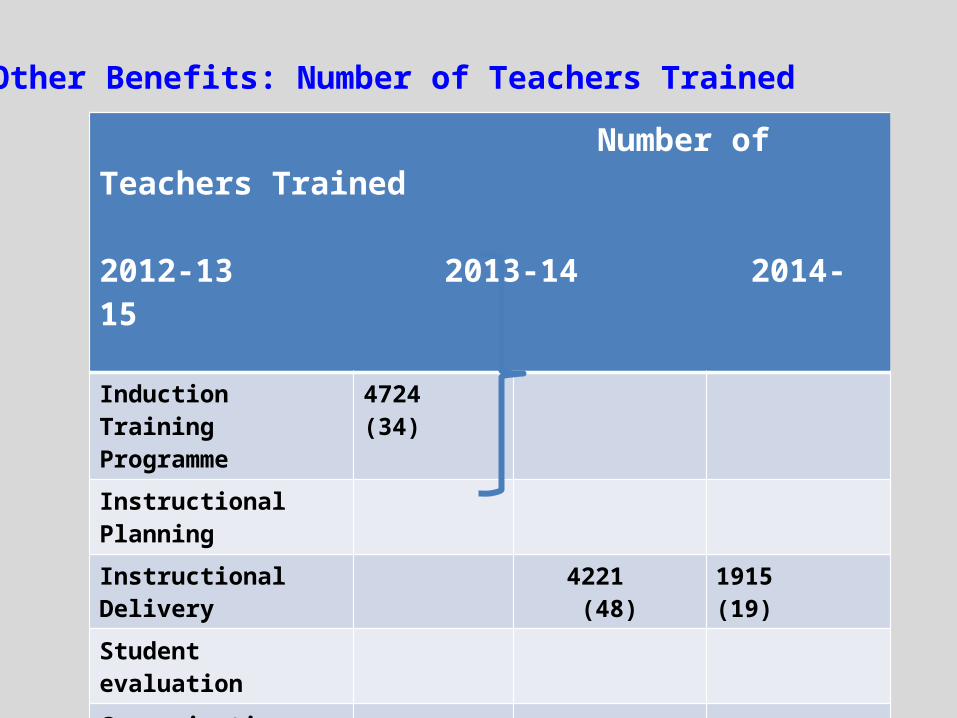
Number of Teachers Trained 2012-13 2013-14 2014-15
Induction Training Programme
4724(34)
Instructional Planning
Instructional Delivery 4221 (48)
1915(19)
Student evaluation
Communication Skills
Content matter updating
5062(17)
5306(36)
Other Benefits: Number of Teachers Trained
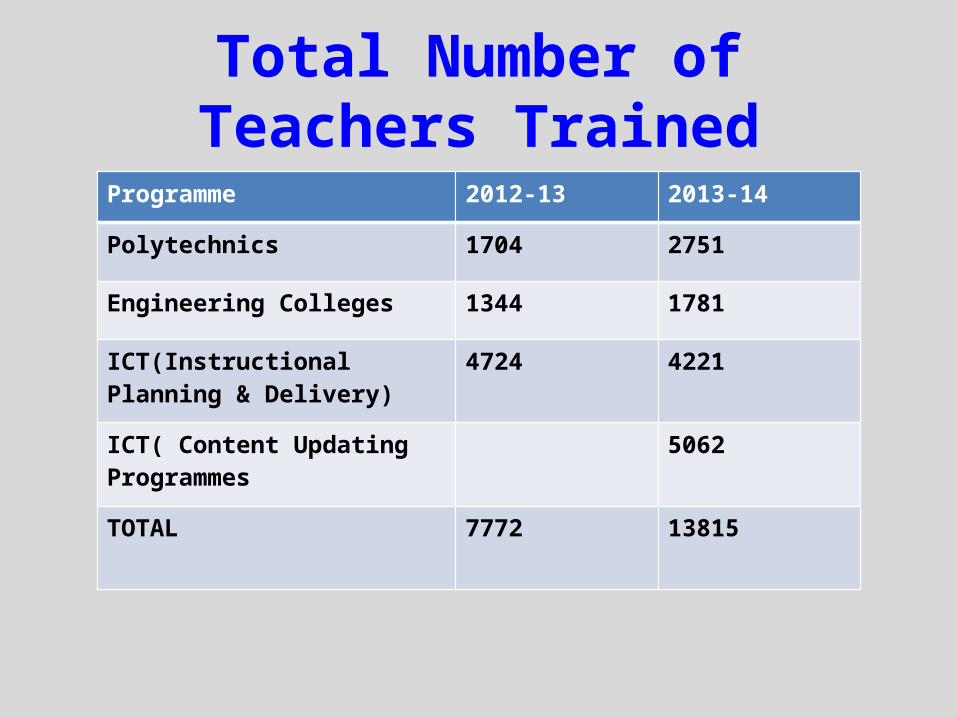
Total Number of Teachers TrainedProgramme 2012-13 2013-14
Polytechnics 1704 2751
Engineering Colleges 1344 1781
ICT(Instructional Planning & Delivery)
4724 4221
ICT( Content Updating Programmes
5062
TOTAL 7772 13815
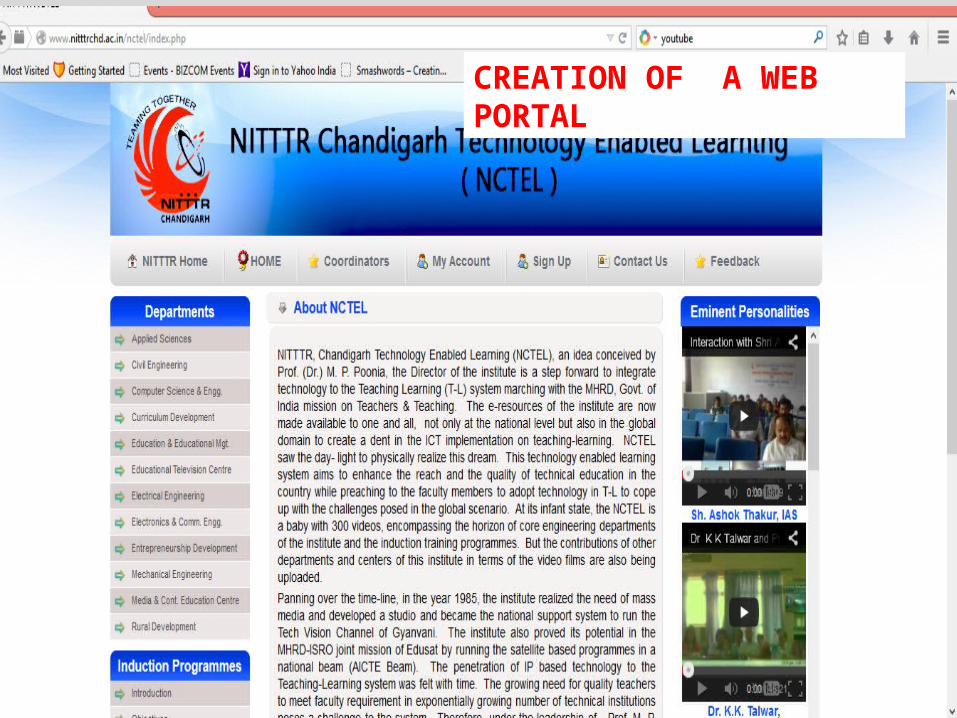
CREATION OF A WEB PORTAL

Conclusions
• Enhancing the reach of the programmes• Increasing the number of teachers trained• Generating interaction among participants at
various centres/colleges• Showcasing the capabilities and application
of ICT to teachers

THANK YOU


![Product authenticity versus globalisation—The Tulsi caseKala Tulsi stands for O. americanum, but in the same source [18] is also used as a synonym for Sri Tulsi, while Ram Tulsi](https://img.pdfslide.net/doc/110x75/60b32a3dc3316d0cc11cb10d/product-authenticity-versus-globalisationathe-tulsi-kala-tulsi-stands-for-o-americanum.jpg)