Embed Size (px)
Citation preview
1
Published in: Transport Policy (2009), doi:10.1016/j.tranpol.2009.10.0003
Evaluation of voluntary travel behaviour change:
Experiences from three continents
Werner Brög, Socialdata GmbH, München, Germany
Erhard Erl, Socialdata GmbH, München, Germany
Ian Ker, CATALYST, Perth, Australia
James Ryle, Sustrans, Bristol, UK
Rob Wall, Sustrans, Bristol, UK
Abstract
The past 20 years has seen a rapid growth across the world in the number,
range and scale of voluntary travel behaviour change (VTBC) initiatives. These so-
called ‘soft’ measures have challenged the assumption that modal shift is only possi-
ble through ‘hard’ system-based measures, or through regulation.
Among the most high-profile VTBC initiatives is a household-based behav-
iour change technique known as Individualised Travel Marketing. This dialogue
marketing approach was developed by Socialdata (under the brand name IndiMark®)
in response to its own research suggesting that a lack of information and motivation,
and incorrect perceptions of the alternatives to the car, were significant barriers to
modal shift.
IndiMark has been applied in more than 100 pilot and nearly 150 large-scale
projects, targeting a total of more than three million people on three continents. A
key factor in this widespread take up has been the consistent use of a detailed evalua-
tion design, employing travel behaviour surveys before and after the IndiMark inter-
vention, using Socialdata’s KONTIV® survey method. This well-established design
uses a self-administered, mail-back questionnaire, coupled with motivation by post
and telephone to encourage high response rates (typically between 60% and 80%)
helping to provide reliable data on mobility behaviour.
This paper reviews the development of the IndiMark technique and the key
features of its evaluation using the KONTIV® survey method. It draws on this ex-
perience to address key challenges in the evaluation of VTBC initiatives, and to iden-
tify the common threads of an integrated approach which might strengthen the case
for all soft measures.
2
1. The growing importance of ‘soft’ policies
1.1 Potential for behavioural change
Levels of car dependency across the developed world have grave and growing
consequences for the environment and health, and for the many local communities
blighted by road traffic. At the same time, delays caused by road congestion are es-
timated to cost business billions of pounds every year (Eddington, 2006). The global
environmental and social costs of greenhouse gas emissions from personal road
transport are also high (e.g. Foley and Fergusson, 2003).
Since the 1970s, Socialdata has conducted in-depth research into the reasons
for an individual’s mode choice for each trip (Brög et al., 1976). The research uses
face-to-face interviews to identify the awareness, perception and choice barriers pre-
venting individuals from using non-car modes for actual trips. These analyses –
echoing findings from many academic studies (e.g. Anable and Gatersleben, 2005;
Steg, 2005; Wall et al., 2008) – have made it possible to differentiate clearly between
people’s subjective and objective situations and, with this information, to determine
the opportunities for travel behaviour change to environmental-friendly modes.
This research (VDV and Socialdata, 1993) showed that in German cities in
1990, 81% of all trips were made by modes other than public transport (PT), and
19% by PT modes. Nearly a quarter of all trips (24%) used another mode because
there were constraints to using PT. As these constraints could be because the car is
used for business reasons, or to carry a heavy load, these trips are likely to have lim-
ited potential for change. A further 32% of trips would have required system im-
provements, such as the provision of an adequate bus connection or improved service
frequencies, before a switch could be made.
However, for the remaining 25% of trips there were only subjective reasons
preventing PT use. For these trips, a voluntary behaviour change approach (using so-
called ‘soft’ measures) appeared to be a solution to achieve modal shift without the
need for ‘hard’ measures such as system improvements, pricing, or changes in land
use policy.
This research showed for the first time that soft measures could activate large
potentials for travel behaviour change, often on the same scale as system measures.
1.2 A personal approach to voluntary travel behaviour change
The findings of this research provided an important underpinning for the
growth, across Europe and elsewhere, in policies and measures focusing on voluntary
travel behaviour change (VTBC). The late 1980s onwards saw the development of a
wide range of interventions aiming to influence the travel mode choices of individu-
als and organisations through awareness-raising, marketing and education.
3
Based on its own research, Socialdata pioneered Individualised Travel Mar-
keting (ITM) – under the brand name IndiMark® – as a technique for changing per-
sonal travel behaviour. The IndiMark process uses direct contact with households to
identify and meet their individual needs for support, and to motivate people to think
about their day-to-day travel choices. This conscious consideration is an important
precursor to change in a type of behaviour that is notoriously habitual (e.g. Matthies
et al., 2002).
The IndiMark process begins with personal contact, either by telephone or on
the doorstep, with households in the target area. This initial contact enables the tar-
get population to be segmented into three main groups: existing regular users of sus-
tainable travel modes; non-regular users who are interested in receiving information
on alternatives to the car; and those who are not interested in taking part.
Most of the ITM campaign focuses on households in the ‘interested’ group.
They receive a TravelSmart® (the brand name for the IndiMark travel behaviour pro-
gramme, delivered in the UK by Sustrans in partnership with Socialdata) order form
enabling them to choose from a range of local travel information materials and other
services, provided by the local authority, public transport operators and other part-
ners. The requested items are assembled into personalised packs and hand-delivered
to households who requested them.
Households that are not regular users of sustainable travel modes are also of-
fered a range of further services to enable them to try these out. These services in-
clude home visits, conducted by a local bus driver or other local travel expert, and
the offer of small incentives such as a test ticket for local bus services, a cycle trip
computer or a pedometer. Regular users are offered a reward to reinforce their travel
behaviour together with a personalised information pack if required (similar to the
interested group).
It is this highly customised, dialogue-based approach, together with the focus
on households rather than major destinations such as workplaces, that sets IndiMark
apart from other VTBC measures. The success of IndiMark schemes in Europe,
Australia and North America has spawned a range of similar VTBC techniques also
focusing on households, known alternatively as personal travel planning (PTP).
This paper describes the development of the IndiMark technique on three
continents (Section 2) and reviews experiences in the evaluation of its effectiveness
in changing travel behaviour (Section 3). Drawing on this, Section 4 explores the
evaluation challenges faced across the range of VTBC schemes and addresses some
common concerns in the debate around their effectiveness. Section 5 makes the case
for a more integrated approach to the evaluation of VTBC schemes, using behav-
ioural surveys alongside traffic counts and other output-based, marketing indicators.
4
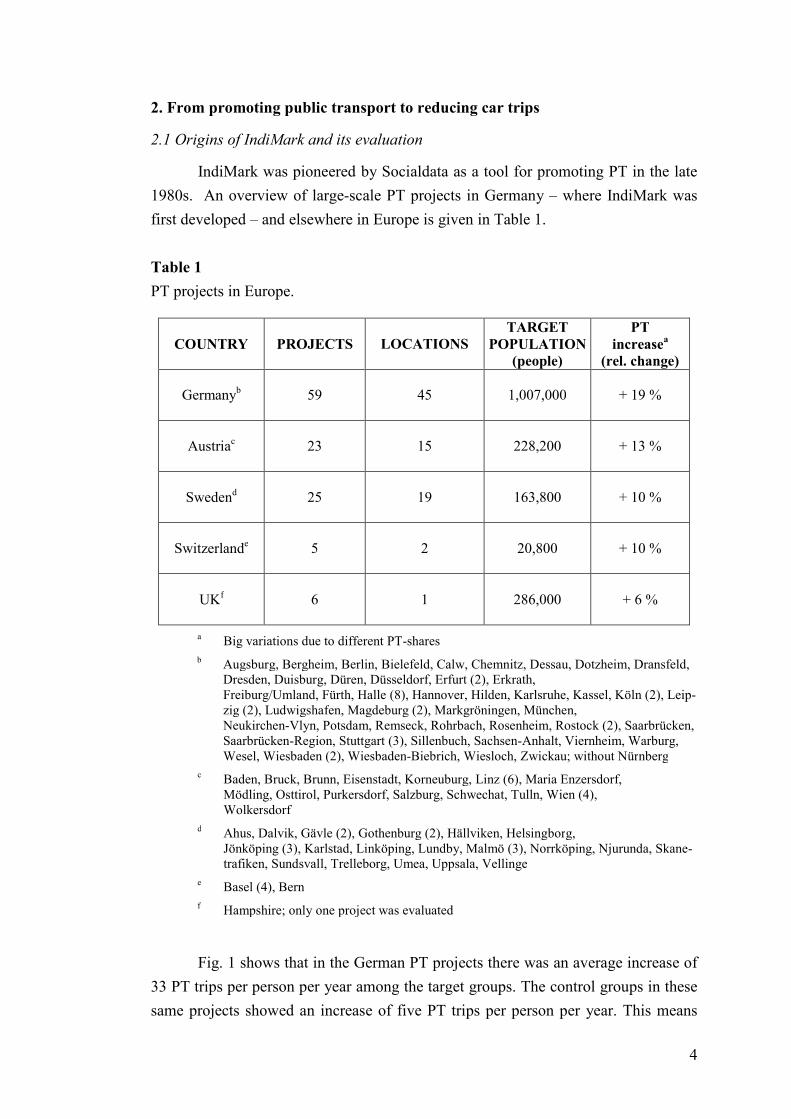
2. From promoting public transport to reducing car trips
2.1 Origins of IndiMark and its evaluation
IndiMark was pioneered by Socialdata as a tool for promoting PT in the late
1980s. An overview of large-scale PT projects in Germany – where IndiMark was
first developed – and elsewhere in Europe is given in Table 1.
Table 1
PT projects in Europe.
COUNTRY PROJECTS LOCATIONSTARGET
POPULATION(people)
PTincreasea
(rel. change)
Germanyb 59 45 1,007,000 + 19 %
Austriac 23 15 228,200 + 13 %
Swedend 25 19 163,800 + 10 %
Switzerlande 5 2 20,800 + 10 %
UKf 6 1 286,000 + 6 %
a Big variations due to different PT-shares
b Augsburg, Bergheim, Berlin, Bielefeld, Calw, Chemnitz, Dessau, Dotzheim, Dransfeld,Dresden, Duisburg, Düren, Düsseldorf, Erfurt (2), Erkrath,Freiburg/Umland, Fürth, Halle (8), Hannover, Hilden, Karlsruhe, Kassel, Köln (2), Leip-zig (2), Ludwigshafen, Magdeburg (2), Markgröningen, München,Neukirchen-Vlyn, Potsdam, Remseck, Rohrbach, Rosenheim, Rostock (2), Saarbrücken,Saarbrücken-Region, Stuttgart (3), Sillenbuch, Sachsen-Anhalt, Viernheim, Warburg,Wesel, Wiesbaden (2), Wiesbaden-Biebrich, Wiesloch, Zwickau; without Nürnberg
c Baden, Bruck, Brunn, Eisenstadt, Korneuburg, Linz (6), Maria Enzersdorf,Mödling, Osttirol, Purkersdorf, Salzburg, Schwechat, Tulln, Wien (4),Wolkersdorf
d Ahus, Dalvik, Gävle (2), Gothenburg (2), Hällviken, Helsingborg,Jönköping (3), Karlstad, Linköping, Lundby, Malmö (3), Norrköping, Njurunda, Skane-trafiken, Sundsvall, Trelleborg, Umea, Uppsala, Vellinge
e Basel (4), Bern
f Hampshire; only one project was evaluated
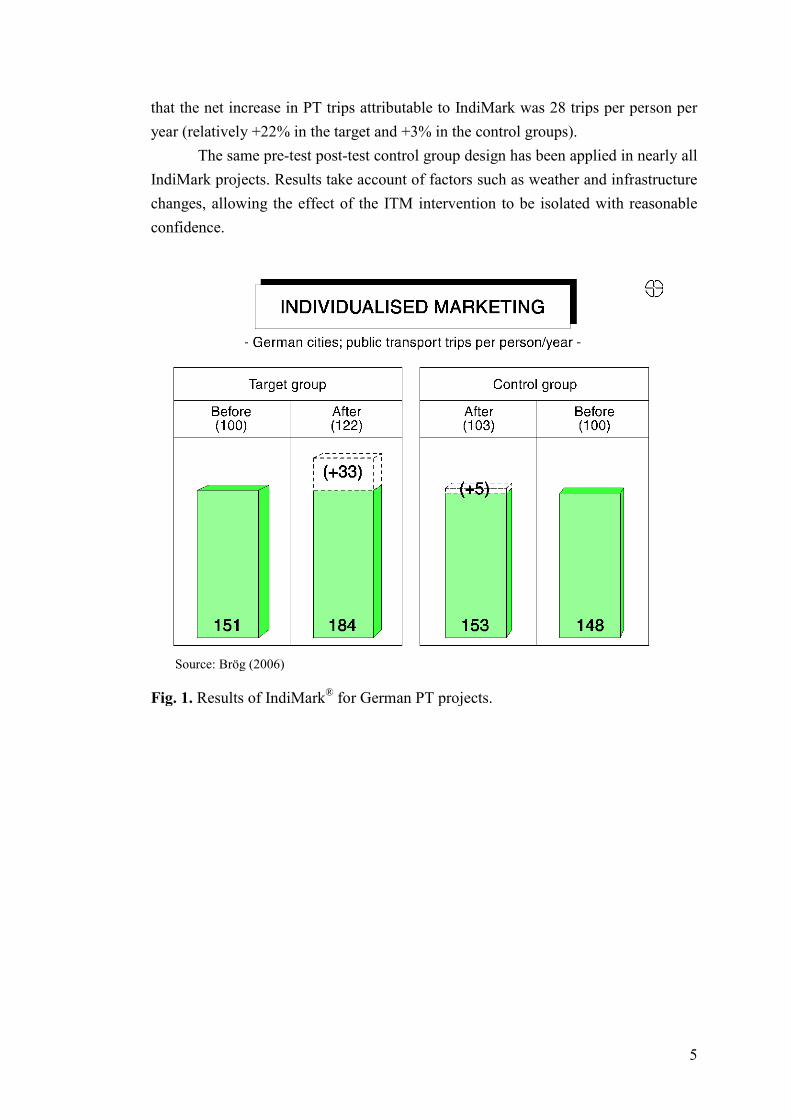
Fig. 1 shows that in the German PT projects there was an average increase of
33 PT trips per person per year among the target groups. The control groups in these
same projects showed an increase of five PT trips per person per year. This means
5
that the net increase in PT trips attributable to IndiMark was 28 trips per person per
year (relatively +22% in the target and +3% in the control groups).
The same pre-test post-test control group design has been applied in nearly all
IndiMark projects. Results take account of factors such as weather and infrastructure
changes, allowing the effect of the ITM intervention to be isolated with reasonable
confidence.
Source: Brög (2006)
Fig. 1. Results of IndiMark® for German PT projects.
6
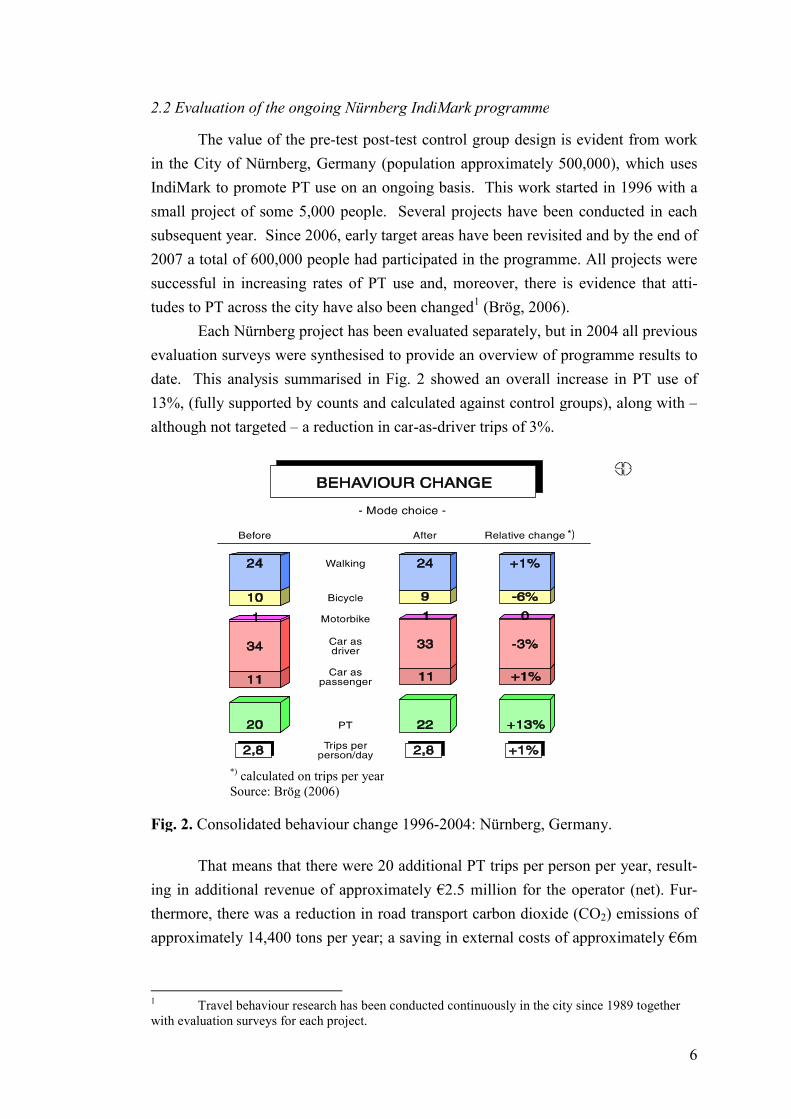
2.2 Evaluation of the ongoing Nürnberg IndiMark programme
The value of the pre-test post-test control group design is evident from work
in the City of Nürnberg, Germany (population approximately 500,000), which uses
IndiMark to promote PT use on an ongoing basis. This work started in 1996 with a
small project of some 5,000 people. Several projects have been conducted in each
subsequent year. Since 2006, early target areas have been revisited and by the end of
2007 a total of 600,000 people had participated in the programme. All projects were
successful in increasing rates of PT use and, moreover, there is evidence that atti-
tudes to PT across the city have also been changed1 (Brög, 2006).
Each Nürnberg project has been evaluated separately, but in 2004 all previous
evaluation surveys were synthesised to provide an overview of programme results to
date. This analysis summarised in Fig. 2 showed an overall increase in PT use of
13%, (fully supported by counts and calculated against control groups), along with –
although not targeted – a reduction in car-as-driver trips of 3%.
*) calculated on trips per yearSource: Brög (2006)
Fig. 2. Consolidated behaviour change 1996-2004: Nürnberg, Germany.
That means that there were 20 additional PT trips per person per year, result-
ing in additional revenue of approximately €2.5 million for the operator (net). Fur-
thermore, there was a reduction in road transport carbon dioxide (CO2) emissions of
approximately 14,400 tons per year; a saving in external costs of approximately €6m
1 Travel behaviour research has been conducted continuously in the city since 1989 togetherwith evaluation surveys for each project.
7
per year; and positive effects on life expectancy in Nürnberg due to increased walk-
ing to and from stations (Brög, 2006).
2.3 Sustainability of behaviour change
There is increasing evidence that behaviour changes generated by
IndiMark are sustained over time. This may be explained by its focus on enabling
voluntary change which helps to make people’s lives easier, rather than denying
them choice. In addition, the dialogue into which households enter is likely to pro-
mote central processing of messages, as opposed to peripheral processing (Petty and
Cacioppo, 1986), leading to longer-lasting behaviour change.
Repeat travel surveys conducted up to four years after the large-scale
TravelSmart programme in South Perth have shown that the behaviour change
achieved by the original VTBC interventions – a 14 % reduction in car-use – has
been ‘locked in’ with a 13% reduction in car-use measured three and four years after
the intervention (James and Brög, 2002).
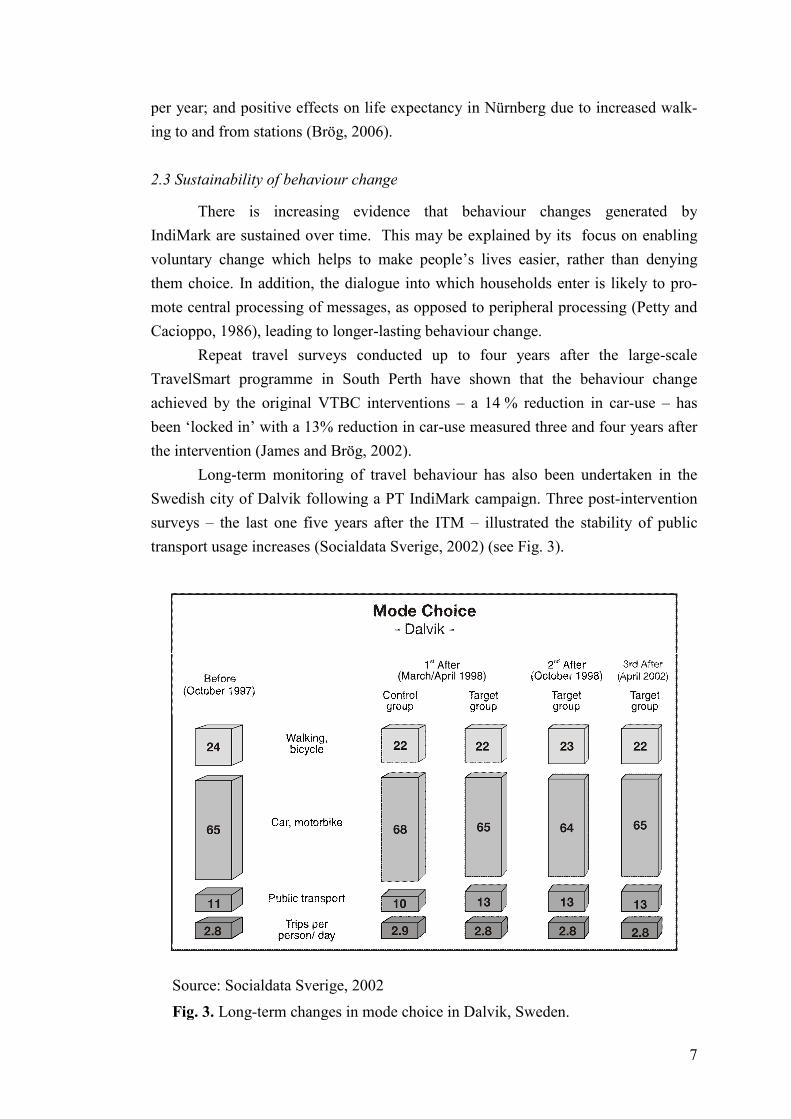
Long-term monitoring of travel behaviour has also been undertaken in the
Swedish city of Dalvik following a PT IndiMark campaign. Three post-intervention
surveys – the last one five years after the ITM – illustrated the stability of public
transport usage increases (Socialdata Sverige, 2002) (see Fig. 3).
Source: Socialdata Sverige, 2002
Fig. 3. Long-term changes in mode choice in Dalvik, Sweden.
8
2.4 IndiMark with system improvements
While effective in its own right, the case for IndiMark is even stronger when
it is combined with transport system improvements (‘hard’ measures). Eight projects
have been carried out in recent years where system improvements and ITM have
been combined. Improvements to the system – as illustrated by control group data –
lead to an average increase of 23 additional PT trips per person per year. However,
when ITM was delivered alongside system improvements, the average increase in PT
trips per person per year was more than doubled (see Table 2).
Table 2
IndiMark® with (rail) system improvements.
INCREASE OF PT TRIPSper person per year
PROJECTS LOCATIONSaTARGET
POPULATION(people)
Only systemSystem andIndiMark®
11 9 156,600 + 23 + 48
a Baunatal, Karlsruhe, Köln, München (2), Nürnberg (2), Remseck, Saarbrücken, Stuttgart,Portland
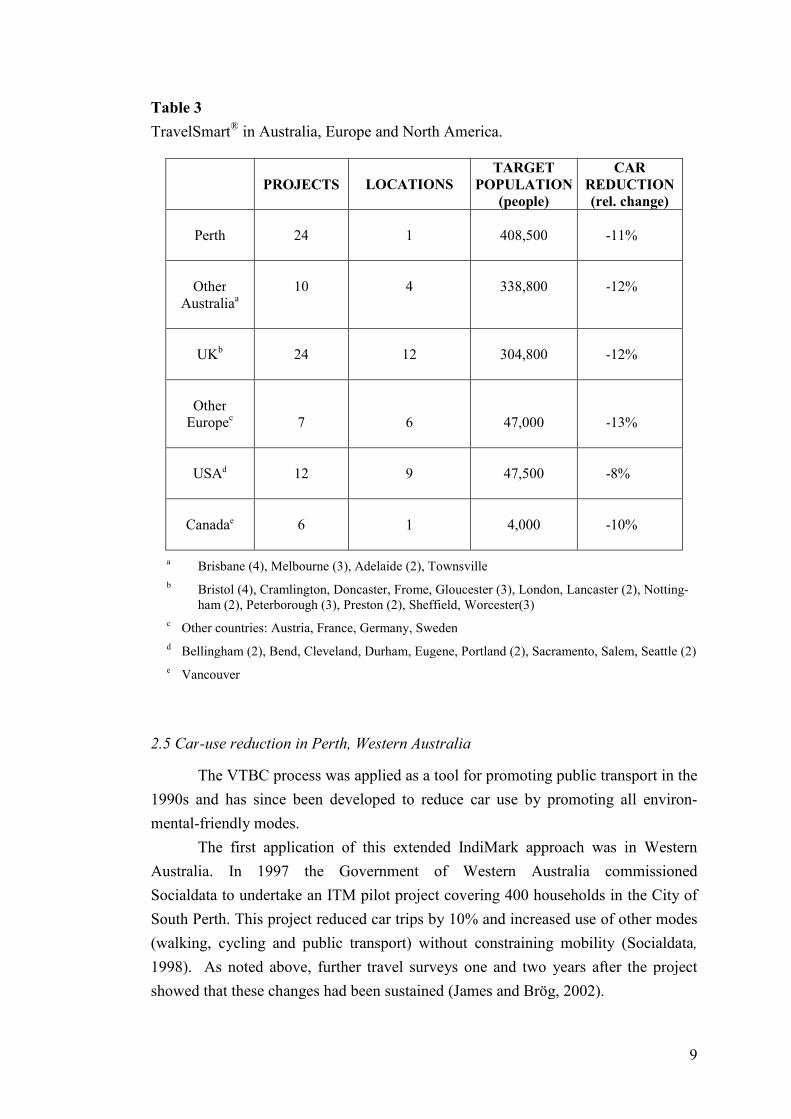
Applications of TravelSmart in Australia, Europe and North America are summa-
rised in Table 3 and discussed in Sections 2.5 – 2.8 below.
9
Table 3
TravelSmart® in Australia, Europe and North America.
PROJECTS LOCATIONSTARGET
POPULATION(people)
CARREDUCTION(rel. change)
Perth 24 1 408,500 -11%
OtherAustraliaa
10 4 338,800 -12%
UKb 24 12 304,800 -12%
OtherEuropec 7 6 47,000 -13%
USAd 12 9 47,500 -8%
Canadae 6 1 4,000 -10%
a Brisbane (4), Melbourne (3), Adelaide (2), Townsville
b Bristol (4), Cramlington, Doncaster, Frome, Gloucester (3), London, Lancaster (2), Notting-ham (2), Peterborough (3), Preston (2), Sheffield, Worcester(3)
c Other countries: Austria, France, Germany, Sweden
d Bellingham (2), Bend, Cleveland, Durham, Eugene, Portland (2), Sacramento, Salem, Seattle (2)
e Vancouver
2.5 Car-use reduction in Perth, Western Australia
The VTBC process was applied as a tool for promoting public transport in the
1990s and has since been developed to reduce car use by promoting all environ-
mental-friendly modes.
The first application of this extended IndiMark approach was in Western
Australia. In 1997 the Government of Western Australia commissioned
Socialdata to undertake an ITM pilot project covering 400 households in the City of
South Perth. This project reduced car trips by 10% and increased use of other modes
(walking, cycling and public transport) without constraining mobility (Socialdata,
1998). As noted above, further travel surveys one and two years after the project
showed that these changes had been sustained (James and Brög, 2002).
10
2.6 Further development of TravelSmart in Australia
The success of the small-scale project in South Perth – and the evidence from
a detailed cost-benefit study (Ker and James, 1999) – laid the foundations for a large-
scale project in South Perth in 2000. This extended IndiMark to a population of
35,000 people. Of 17,500 households in South Perth, 15,300 were identified with a
contact name, address and telephone number. Direct contact was made with 94% of
these and 55% (of the 15,300) chose to participate in the IndiMark programme. The
TravelSmart approach has since been delivered to a total of over 400,000 people in
the Perth area, achieving a reduction of car trips of 11% in total, varying between 4%
and 14% across individual projects2.
Following the pioneering work in Perth, Socialdata has implemented projects
in other Australian cities including the biggest single project ever realised in Bris-
bane with 180,000 people (Ker, 2008).
2.7 TravelSmart in Europe
In the UK, the IndiMark concept has been applied in partnership with Sus-
trans under the TravelSmart programme. A total of more than 600,000 people have
been targeted in 24 pilot and large-scale projects since 2001. The average car-use
reduction (measured in car trips per person per year) achieved is 12%, but for single
projects the range varies between 6% and 13% (ITP, 2007). The largest UK project
targeted a population of 120,000 people in Preston and Lancaster. This project was
in 2006 winner of the CIVITAS demonstration city award3.
TravelSmart projects have also been implemented in four other European
countries and have delivered an average car-use reduction of 13% (see Table 3).
2.8 TravelSmart in North America
There have been 18 TravelSmart projects in ten locations in North America.
Even in the car-dominated US, TravelSmart has proven to be a successful approach
to reducing car use. The range of car reduction varies considerably – between 2%
and 11% – with an average reduction of 8% (Socialdata America, 2006).
2 Reports on TravelSmart programmes undertaken in Australia are available as follows: West-ern Australia: www.dpi.wa.gov.au/travelsmart, Queensland:http://www.transport.qld.gov.au/travelsmart, Victoria: http://www.travelsmart.vic.gov.au/
3 CIVITAS stands for CIty-VITAlity-Sustainability. With the CIVITAS Initiative, the EuropeanCommission aims to generate a decisive breakthrough by supporting and evaluating the implementa-tion of ambitious integrated sustainable urban transport strategies. The CIVITAS Awards honour themost ambitious European CIVITAS Member Cities, which have shown their commitment by intro-ducing innovative transport policies or activities aimed to achieve better and cleaner urban transport.
11
3. Evaluation of behaviour-change interventions
3.1 Indicators of behaviour change
Measuring the effects of marketing interventions on behaviour is a consider-
able challenge, not least because of the many uncontrolled factors that may have an
influence on people’s actions (Brög and Ker, 2008). There are several evaluation
methods available and each has advantages and disadvantages. As such, when
measuring the success of a travel behaviour-change project, it is preferable to use a
variety of evaluation methods. If multiple methods all point in the same direction and
show more-or-less the same magnitude of change, one can be reasonably confident in
the results.4
There are three main measures that should be considered in evaluating a be-
haviour-change intervention.
Marketing indicators. These include the number and type of information re-
quests, and quantitative feedback from residents throughout the project. For exam-
ple, where one of the desired changes is to increase PT use, researchers might con-
sider the number of stop-specific bus timetables requested by participating house-
holds. While it is quite possible that some households may request information that
they do not go on to use, it is unlikely that thousands of households will order spe-
cific, address-based timetables that they are not interested in and which they will
never use . Very often in traditional direct marketing, such indicators are the only
measures of success. A reliance on information requests alone may be too coura-
geous, but they are nonetheless reliable, precise and easy to measure indicators
which should not be ignored.
In addition, it should be borne in mind that enduring behaviour change is
likely to be based to at least some extent on attitude change (e.g. Petty and Cacioppo,
1986). TravelSmart evaluations have provided thousands of comments from partici-
pants which suggest that attitude change does indeed occur as a result of the inter-
vention. These qualitative data, whilst not constituting “proof”, are arguably as im-
portant as changes measured in counts or surveys.
External Indicators. These include measured public transport patronage. In
the TravelSmart programme in Western Australia, for example, bus boarding data are
collected and the ability to gather and use such data will be enhanced by the recent
successful introduction of a comprehensive Smart Card ticketing system
(SmartRider). Parker et al. (2007, p. 127) supports the value of this type of “robust
corroborative data”. This form of monitoring, however, is not without its challenges,
most notably isolating the effects of the VTBC initiative from those of other influ-
ences.
4 One cannot rule out the possibility that all evaluation methods are biased in the same direction, butthe likelihood of this decreases as the number of evaluation methods increases.
12
Behavioural Indicators. The effectiveness of travel behaviour change pro-
jects can also be evaluated by measuring changes in the mobility patterns of residents
by conducting extensive pre- and post-intervention travel surveys. Data from these
surveys for TravelSmart projects describe mode share, activities and travel time, and
analysis of these data shows the mode shift from car-as-driver trips to environmental-
friendly modes. As with external indicators, it is important to measure changes in
behavioural indicators against a control group to account for background (uncon-
trolled) factors (Parker et al., 2007). This issue is discussed further in Section 3.3.
In recent years, most emphasis in the evaluation of VTBC has been on behav-
ioural indicators, often to the exclusion of marketing and external indicators. What-
ever methods are used, acceptance of the results will be highly dependent upon com-
prehensive and consistent documentation of processes and outcomes.
3.2 KONTIV® Design
An international demonstration project initiated by the UITP (International
Association of Public Transport) with scientific leadership from Socialdata (UITP,
1998) showed that a detailed and robust evaluation of the effects of dialogue market-
ing on travel behaviour is of critical importance. This means that:
(a) A design has to be used which is fully developed and has already proven its
capability to provide reliable and valid results.
(b) Data on individuals’ mobility behaviour should be collected; traffic counts,
patronage data and so on will not be enough.
(c) Information about mobility from all household members should be collected
because, for example, one household member might be motivated to change from car
to another mode and another household member might then decide to use the avail-
able car (instead of another mode).
(d) Data on all trips should be collected; not only trips within the target area.
Socialdata has developed, applied and continuously improved a research de-
sign based on the above criteria and which seeks to ensure data quality and high re-
sponse rates. This is known as the KONTIV® Design: a mail-back technique using a
one-day diary for all household members (Brög, 2000). The survey instrument col-
lects information on individual activities performed at all out-of-home destinations
on a nominated travel day and this provides an account of how, where and why re-
spondents travelled (or did not travel). It has been applied in more than 15 countries
with consistently high response rates and reliable and valid results.
13
3.3 Behaviour change in context
Behaviour change initiatives do not happen in isolation. Almost by defini-
tion, such schemes are funded because there is a sympathetic policy environment.
There is also evidence that increased fuel costs have had a systematic impact on
travel behaviour (e.g. Warren, 2008). This requires that, wherever possible, we also
measure the travel behaviour of people or households similar to those subject to the
intervention so that the impact of factors external to the intervention can be identified
and appropriate adjustments made to the measured outcomes in the intervention
group. This poses a problem for interventions that do not attempt to measure change
over the whole target population, as there is a potentially high degree of self-
selection in the intervention group that makes them different from any potential con-
trol group.
The only group that, in principle, meets all of these criteria (subject to sam-
pling variability) would be a random sample from the population of the intervention
area itself. This is particularly so with a very large-scale application that covers a
large and demographically diverse area. In practice, however, even those who are
not part of the target population are highly likely to be influenced by the intervention
itself. As a result, it is often most appropriate to draw the control group from a geo-
graphically close but distinct residential area that is likely to be subject to similar
background influences to the target area.
4. Challenges in the evaluation of VTBC
4.1 Background
Getting people to change their (often habitual) travel behaviour on a large
scale and at a reasonable cost is undoubtedly a challenge. However, in the context of
global climate change, rising fuel costs, and obesity and other health problems asso-
ciated with sedentary lifestyles, the rewards from achieving real and sustained behav-
iour change are potentially very great (AGO, 2006).
It has to be expected that the VTBC programmes reporting the most positive
outcomes should also be subject to the highest levels of external scrutiny. However
many practitioners in the field have been taken aback by the degree of criticism lev-
elled at specific evaluation methods (Stopher, 2003), and by the apparent paucity of
robust alternatives (see, for example, Roth et al., 2003).
A welcome contribution to this debate has been provided by a recent, com-
prehensive study of ‘personal travel planning’ in the UK and elsewhere (Parker et al.,
2007). This report highlights many of the evaluation challenges facing VTBC practi-
tioners. The next section explores these issues in more detail and attempts to make a
14
contribution to some of the most common arguments in the debate around the effec-
tiveness of VTBC.
4.2 Significance of results
Most of the debate on sample size has concerned sampling error estimation
(Richardson et al., 2003). In practice, the error due to systematic factors (e.g. re-
sponse rate) can be many times larger than sampling error. This is a serious problem,
because there are always two types of errors to be considered in empirical studies:
random errors (sampling-related); and systematic errors (design related).
Since there are always systematic errors, the calculated random errors are al-
ways based on an incorrect assumption (that there are no systematic errors). But the
real problem of these two types of errors is that random errors can be calculated ex-
actly, but not corrected, whereas systematic errors can be corrected through survey
design changes but cannot be precisely calculated.
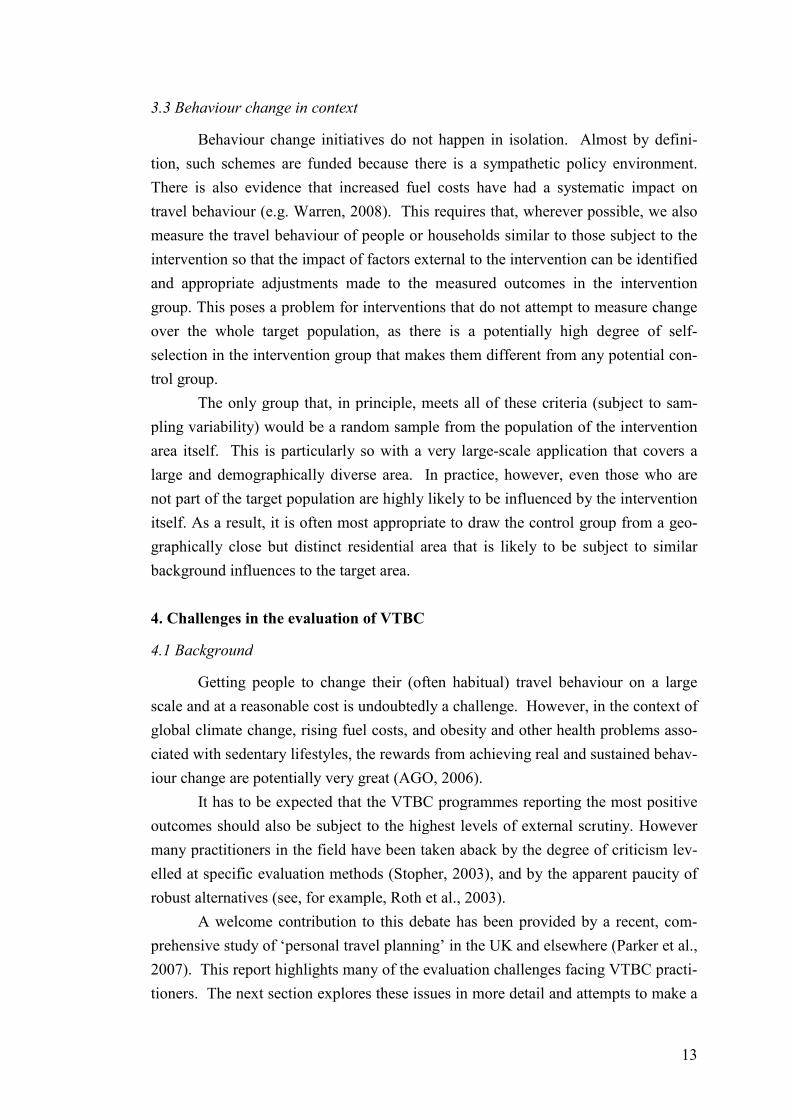
A master calculation undertaken for the Dutch National Travel Survey
(MON) can illustrate this (see Table 4). The MON 2005 achieved a net sample of
66,500 respondents at a response rate of 72% and with a gross sample of 92,350 peo-
ple (using KONTIV® Design). The trip rate per person and day (calculated after a
detailed analysis of non-response and non-reported trips) was 3.1. With a response
rate of only 40%, a gross sample of 166,250 would have been needed to get 66,500
respondents. Using the speed of response technique (described below), the trip rate
for the first 40% can be calculated as 3.4 trips per person and day. The random error
of this survey would be ±0.02 trips. The systematic error (of only one factor: non
response) is fifteen times higher (see Table 4).
Table 4
Random and systematic errors (MON).
Net responses 66,500 respondents (net)
Response rate 40% 72%
Gross sample required 166,250 92,350
Trips per person per day 3.4 3.1
Random statistical error ±0.02 trips per person per day
Systematic (response rate) error +0.30 trips per person per day
Source: Own calculations.
15
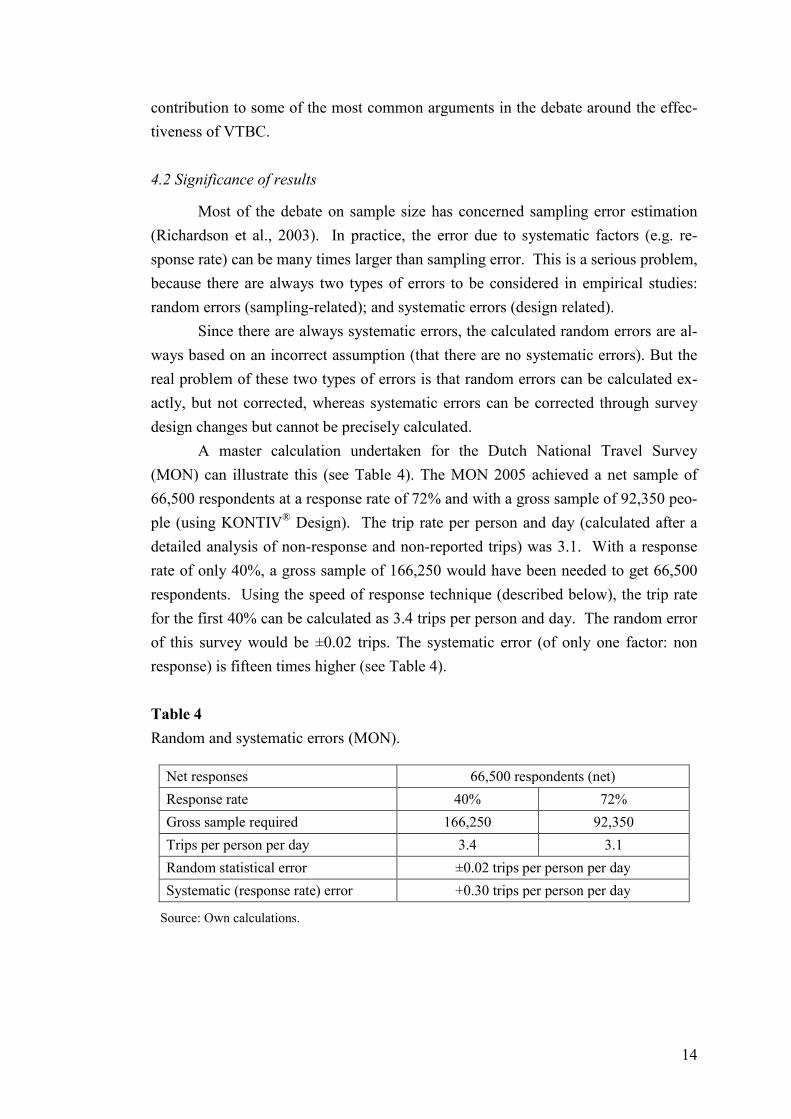
4.3 Non-response and non-reported trips
One technique of understanding, calculating and correcting systematic errors
is through the speed of response technique. In a mail-back survey, the number of
trips per person per day can be analysed according to the response rate reached in the
different phases of a survey (speed of response). This allows different response rates
to be simulated and the result for the variable of interest to be estimated for a full
response (Brög and Meyburg, 1981). This approach has been used to analyse the
likely shortcomings of a survey that achieved only a 25% response rate (Brög and
Erl, 1999). Fig. 4 shows trip rate index on the y-axis (where 100 corresponds to the
expected value for the total sample and is the lower bound of the y-axis) and the re-
sponse rate on the x-axis. This survey showed an over-estimation of trips per person
per day (index=121) with a 25% response rate compared to the expected trip rate for
the total sample of 2.9 trips per person per day (index=100).
Source: Brög and Erl (1999)
Fig. 4. Trip rate by response rate: Vienna 1993 (response rate 85%).
The speed of response technique has been applied in analysis of the Nether-
lands National Travel Survey: the only long-running continuous travel survey in the
world (Ministerie van Verkeer en Waterstaat, 2007). As a consequence, a specific
self-validating design has been developed. This design can correct for non-reported
items, non-reported trips and non-response and is not dependent on external data.
Fig. 5 shows the effect of response rate on the trips per person taking into account
survey non-response and non-reported trips. If we look at the upper response curve
we see a curve following in principle the one presented in Fig. 4, just flatter: The
non-response effects have been reduced. This is a result of systematic analysis of
these non-response effects and continuous improvements of techniques to reduce
them.
16
The lower response curve is another valuable addition. It shows the percent-
age of non-reported trips by response rate. This is important because it is often ar-
gued that later respondents do not have lower mobility but do not report all their trips
correctly. The curve shows that this effect exists, but only to a very small degree. In
principle, non-reported trips have a similar proportion, irrespectively of the response
rate.
Source: Ministrie von Verkeer an Waterstaat (2007)
Fig. 5. Trip rate and non-reported trips by response rate: Netherlands(MON - Mobiliteitsonderzoek Nederland).
4.4 Panel surveys
Many travel behaviour-change interventions have adopted a cross-sectional
survey approach to estimating ‘before’ and ‘after’ travel behaviour. With small sam-
ples, this can cause problems with statistical reliability when examining differences
between the two surveys, but these problems are less severe for larger samples.
It has often been suggested that a panel survey approach, using the same peo-
ple for both surveys, would be more suitable (Stopher et al., 2009)5. However, panel
surveys have their own problems that are more systematic and less amenable to
treatment by statistical analysis (e.g. aging, attrition, survey fatigue).
While it has been argued that panel surveys require lower samples sizes
(Richardson et al., 2003), some of the parameters enabling smaller sample sizes also
give rise to survey designs which are more difficult to undertake. For example, panel
5 On request of the editors we have put in cross-references to other papers in this issue that there is ameans for readers to be aware of related papers in the special issue.
17
survey data is more difficult to obtain (with full control of other biases) than repeated
cross-sectional data (Richardson, 2002). Acquiring repeated data from the same re-
spondents is challenging and a reduced response rate in the post-intervention survey
can lead to sampling bias (Parker et al., 2007).
One example of a panel survey in Melbourne (2004/05) used to estimate the
effect of a VTBC initiative had a low initial response rate (49%: 1,346 out of a sam-
ple of 2,772 households) for the pre-intervention survey and substantial further loss
by the time of the post-intervention survey. Furthermore, in the post-intervention
survey only 682 of the 881 households that responded to the pre-intervention survey
had the same composition as in the earlier data collection exercise (Richardson,
2005). At the individual level, people may exhibit substantially different travel be-
haviours at different times for reasons that are purely idiosyncratic and not related to
the intervention being investigated.
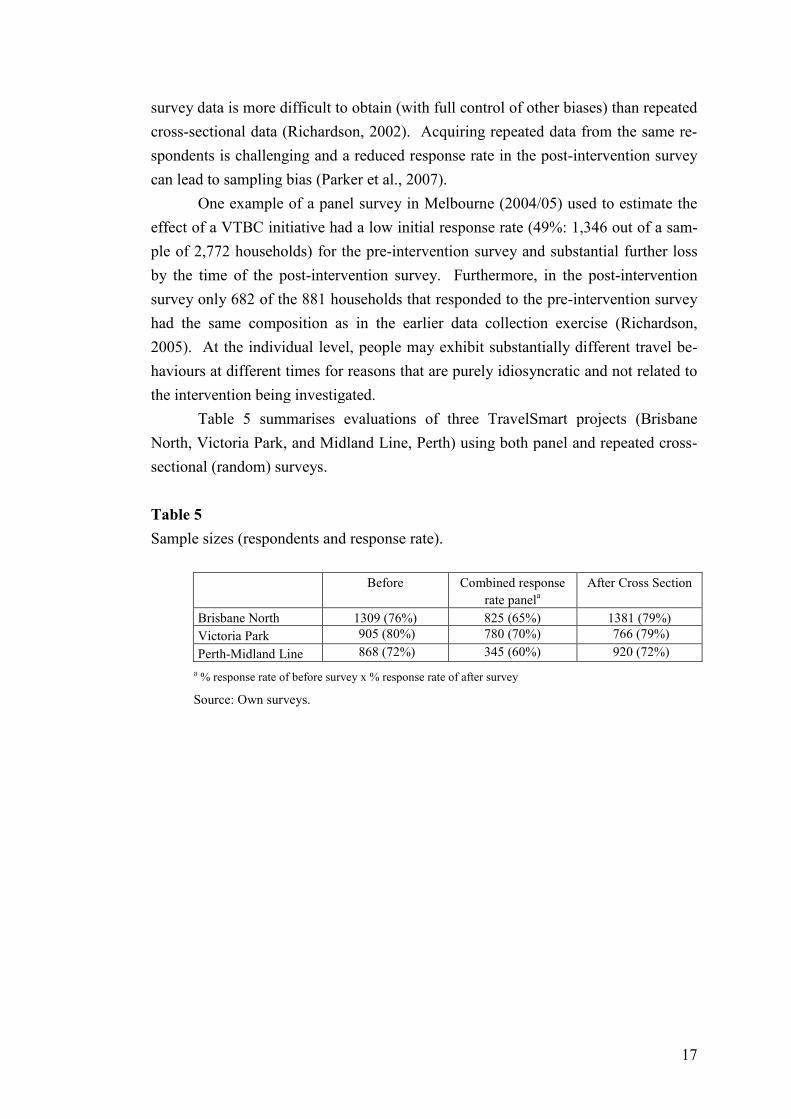
Table 5 summarises evaluations of three TravelSmart projects (Brisbane
North, Victoria Park, and Midland Line, Perth) using both panel and repeated cross-
sectional (random) surveys.
Table 5
Sample sizes (respondents and response rate).
Before Combined response
rate panela
After Cross Section
Brisbane North 1309 (76%) 825 (65%) 1381 (79%)
Victoria Park 905 (80%) 780 (70%) 766 (79%)
Perth-Midland Line 868 (72%) 345 (60%) 920 (72%)
a % response rate of before survey x % response rate of after survey
Source: Own surveys.
18
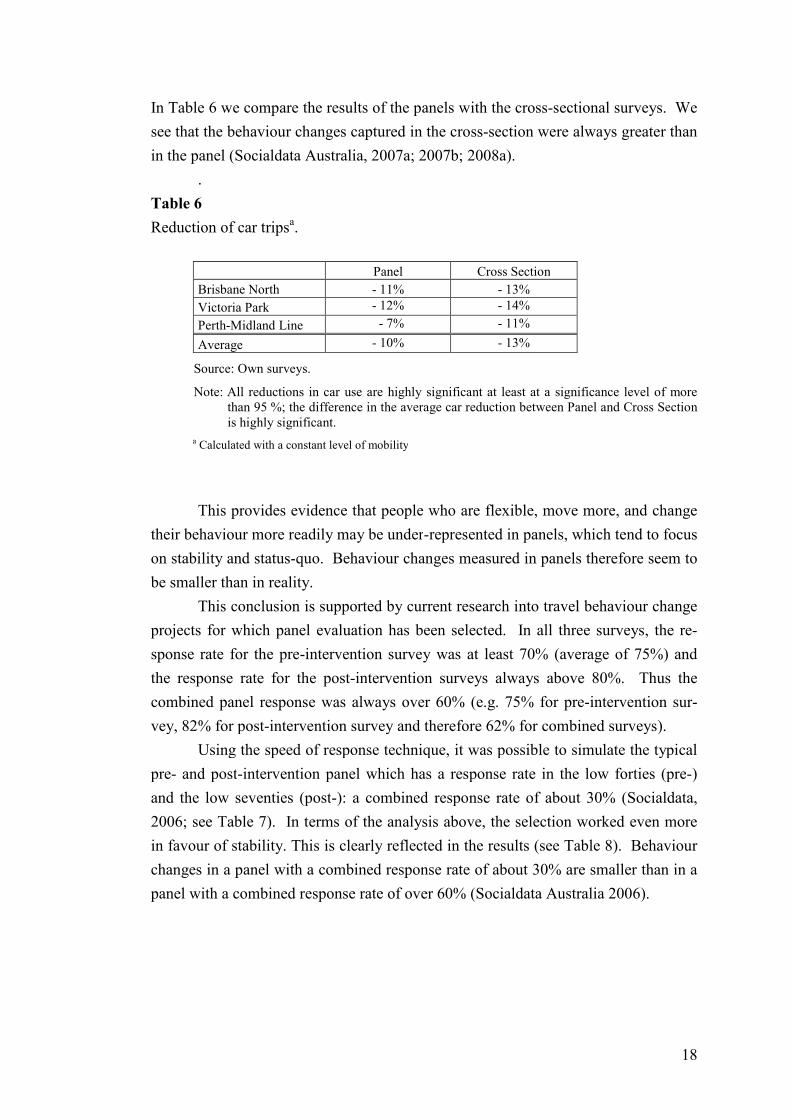
In Table 6 we compare the results of the panels with the cross-sectional surveys. We
see that the behaviour changes captured in the cross-section were always greater than
in the panel (Socialdata Australia, 2007a; 2007b; 2008a).
.
Table 6
Reduction of car tripsa.
Panel Cross Section
Brisbane North - 11% - 13%
Victoria Park - 12% - 14%
Perth-Midland Line - 7% - 11%
Average - 10% - 13%
Source: Own surveys.
Note: All reductions in car use are highly significant at least at a significance level of morethan 95 %; the difference in the average car reduction between Panel and Cross Sectionis highly significant.
a Calculated with a constant level of mobility
This provides evidence that people who are flexible, move more, and change
their behaviour more readily may be under-represented in panels, which tend to focus
on stability and status-quo. Behaviour changes measured in panels therefore seem to
be smaller than in reality.
This conclusion is supported by current research into travel behaviour change
projects for which panel evaluation has been selected. In all three surveys, the re-
sponse rate for the pre-intervention survey was at least 70% (average of 75%) and
the response rate for the post-intervention surveys always above 80%. Thus the
combined panel response was always over 60% (e.g. 75% for pre-intervention sur-
vey, 82% for post-intervention survey and therefore 62% for combined surveys).
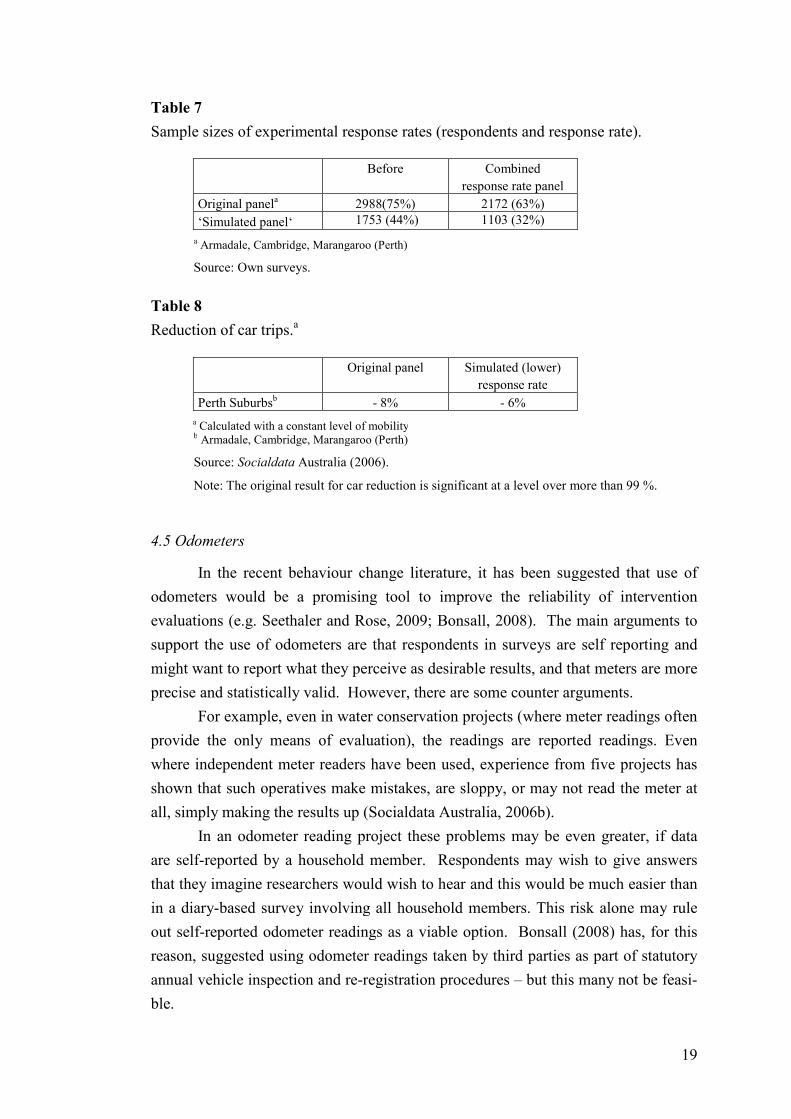
Using the speed of response technique, it was possible to simulate the typical
pre- and post-intervention panel which has a response rate in the low forties (pre-)
and the low seventies (post-): a combined response rate of about 30% (Socialdata,
2006; see Table 7). In terms of the analysis above, the selection worked even more
in favour of stability. This is clearly reflected in the results (see Table 8). Behaviour
changes in a panel with a combined response rate of about 30% are smaller than in a
panel with a combined response rate of over 60% (Socialdata Australia 2006).
19
Table 7
Sample sizes of experimental response rates (respondents and response rate).
Before Combined
response rate panel
Original panela 2988(75%) 2172 (63%)
‘Simulated panel‘ 1753 (44%) 1103 (32%)
a Armadale, Cambridge, Marangaroo (Perth)
Source: Own surveys.
Table 8
Reduction of car trips.a
Original panel Simulated (lower)
response rate
Perth Suburbsb - 8% - 6%
a Calculated with a constant level of mobilityb Armadale, Cambridge, Marangaroo (Perth)
Source: Socialdata Australia (2006).
Note: The original result for car reduction is significant at a level over more than 99 %.
4.5 Odometers
In the recent behaviour change literature, it has been suggested that use of
odometers would be a promising tool to improve the reliability of intervention
evaluations (e.g. Seethaler and Rose, 2009; Bonsall, 2008). The main arguments to
support the use of odometers are that respondents in surveys are self reporting and
might want to report what they perceive as desirable results, and that meters are more
precise and statistically valid. However, there are some counter arguments.
For example, even in water conservation projects (where meter readings often
provide the only means of evaluation), the readings are reported readings. Even
where independent meter readers have been used, experience from five projects has
shown that such operatives make mistakes, are sloppy, or may not read the meter at
all, simply making the results up (Socialdata Australia, 2006b).
In an odometer reading project these problems may be even greater, if data
are self-reported by a household member. Respondents may wish to give answers
that they imagine researchers would wish to hear and this would be much easier than
in a diary-based survey involving all household members. This risk alone may rule
out self-reported odometer readings as a viable option. Bonsall (2008) has, for this
reason, suggested using odometer readings taken by third parties as part of statutory
annual vehicle inspection and re-registration procedures – but this many not be feasi-
ble.
20
In addition, the odometer-reading projects tend to achieve very low participat-
ing rates (e.g. Stopher et al., 2007a) and need a strict regime to be kept by the house-
holds. Adding to the problems of low participation, in any given wave, about 25% of
households will fail to provide odometer readings (Stopher et al., 2007a). At best
this increases the required sample size, but in conjunction with low recruitment rates
it may cause systematic bias that cannot be addressed by larger samples. In a recent
validation survey on odometer readings conducted by Socialdata Australia (2008b)
(recruitment rate 80%), about 60% of the readings reported were in doubt (collected
at the wrong time; wrong day; wrong car; reading invented; later readings lower than
earlier ones; or distances travelled of several thousand kilometres a day).
Finally, even if the odometer reading is correct, it tells us nothing about the
type of travel, its frequency, or the trip purpose.
4.6 Projects using GPS
It has been suggested that geographical positioning systems (GPS) can pro-
vide a means of directly measuring travel and, by inferential means, mode use (Sto-
phe et al., 2007b, and Stopher et al., 2009). However, this is as yet unproven in at
least four key areas:
The robustness of the algorithms for inferring mode use;
The potential for the measurement actually to influence travel behaviour – for
example, a person ‘equipped’ with a GPS device might be more aware of
their travel behaviour (as distinct from it being habitual) and use transport
more efficiently while carrying the device;
The participants are well aware that every movement is registered and will
find ways to omit trips which they want to keep confidential. Moreover, if
such concerns become widespread fewer people may be willing to participate
in such exercises;
Even now the willingness to participate in such an exercise is low, the pro-
jects are expensive, and yet do not achieve representative samples. This is
even more critical because the sample sizes of such projects are traditionally
very small (Stopher et al., 2007a).
A recent experiment following the Brisbane TravelSmart projects (Socialdata
Australia, 2006a; 2007a) attempted to test the willingness of target persons to par-
ticipate in a GPS survey.
On offer were two alternatives for a GPS survey: carrying the GPS tool for
one week; or repeating this exercise three times at two year intervals. Target persons
were survey respondents from the TravelSmart pre- and post-intervention surveys
(KONTIV® Design). In order to control for the tendency of survey respondents to
21
participate again, the Brisbane experiment is contrasted with an experiment in
Karlsruhe, where survey respondents were asked to participate in the same survey
again for one week and repeat surveys in two-year intervals. All results are calcu-
lated for people aged between 14 and 75 years. They show that the well known ef-
fects of repeated surveys are evident in the GPS experiment: not everyone who says
‘yes’ will actually participate, but we can be sure that everyone who says ‘no’ will
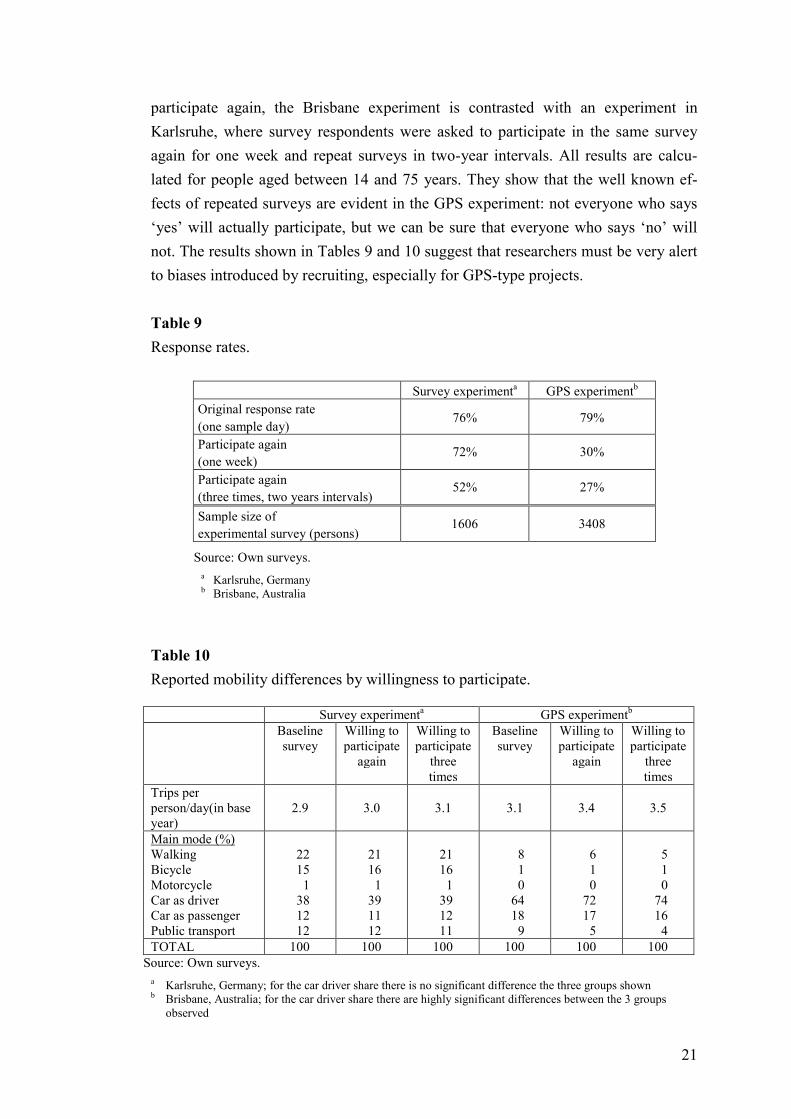
not. The results shown in Tables 9 and 10 suggest that researchers must be very alert
to biases introduced by recruiting, especially for GPS-type projects.
Table 9
Response rates.
Survey experimenta GPS experimentb
Original response rate
(one sample day)76% 79%
Participate again
(one week)72% 30%
Participate again
(three times, two years intervals)52% 27%
Sample size of
experimental survey (persons)1606 3408
Source: Own surveys.
a Karlsruhe, Germanyb Brisbane, Australia
Table 10
Reported mobility differences by willingness to participate.
Survey experimenta GPS experimentb
Baselinesurvey
Willing toparticipate
again
Willing toparticipate
threetimes
Baselinesurvey
Willing toparticipate
again
Willing toparticipate
threetimes
Trips perperson/day(in baseyear)
2.9 3.0 3.1 3.1 3.4 3.5
Main mode (%)WalkingBicycleMotorcycleCar as driverCar as passengerPublic transport
2215
1381212
2116
1391112
2116
1391211
810
6418
9
610
7217
5
510
7416
4TOTAL 100 100 100 100 100 100
Source: Own surveys.
a Karlsruhe, Germany; for the car driver share there is no significant difference the three groups shownb Brisbane, Australia; for the car driver share there are highly significant differences between the 3 groups
observed
22
4.7 Use of control groups
Discussions around the use of control groups often follow an established pat-
tern. There is agreement that a control group should be used; there is agreement that
it is often very difficult to identify an (ideal) control group; and then lamentation
when the (unavoidably) non-ideal control group is not ideal. Many papers could be
written on the subject of control groups alone, but a few practical observations based
on more than 300 evaluation surveys (large scale and pilots, which included in most
of the cases a control group) illustrate the key issues.
The most important factors to be controlled in travel surveys are: season (in-
cluding holidays), weather, special events, infrastructure changes, and prices. It is
generally possible to find a reasonable control group for each of these factors.
But the most problematic single factor is diffusion. Effective behaviour-
change projects can generate enormous momentum and it is often difficult (some-
times impossible) to avoid control group results being contaminated to a degree
(which always makes the changes look smaller than they really are).
Control group evaluation adds substantially to the cost of a travel behaviour
change project. In practice, the change in the control group has consistently been
small, largely because the time between ‘before’ and ‘after’ measurement is short
(one year) and designed to remove the strongest seasonality impacts. Whilst this may
change with rapid change in fuel prices and volatile economic conditions, other more
general indicators of car use (e. g. road traffic volumes and public transport patron-
age) may be able to provide the necessary baseline information.
5. Integrated evaluation
The focus on evaluation through measurement of travel behaviour instead of
concept and tools means that large proportions of the project money are spent on
research instead of on behaviour change (in projects using the IndiMark approach,
the evaluation consumes between 25 and 75% of the total budget).
As experience in the field develops, an increasing number of VTBC pro-
grammes are seeking to broaden the mix of tools used for monitoring and evaluation.
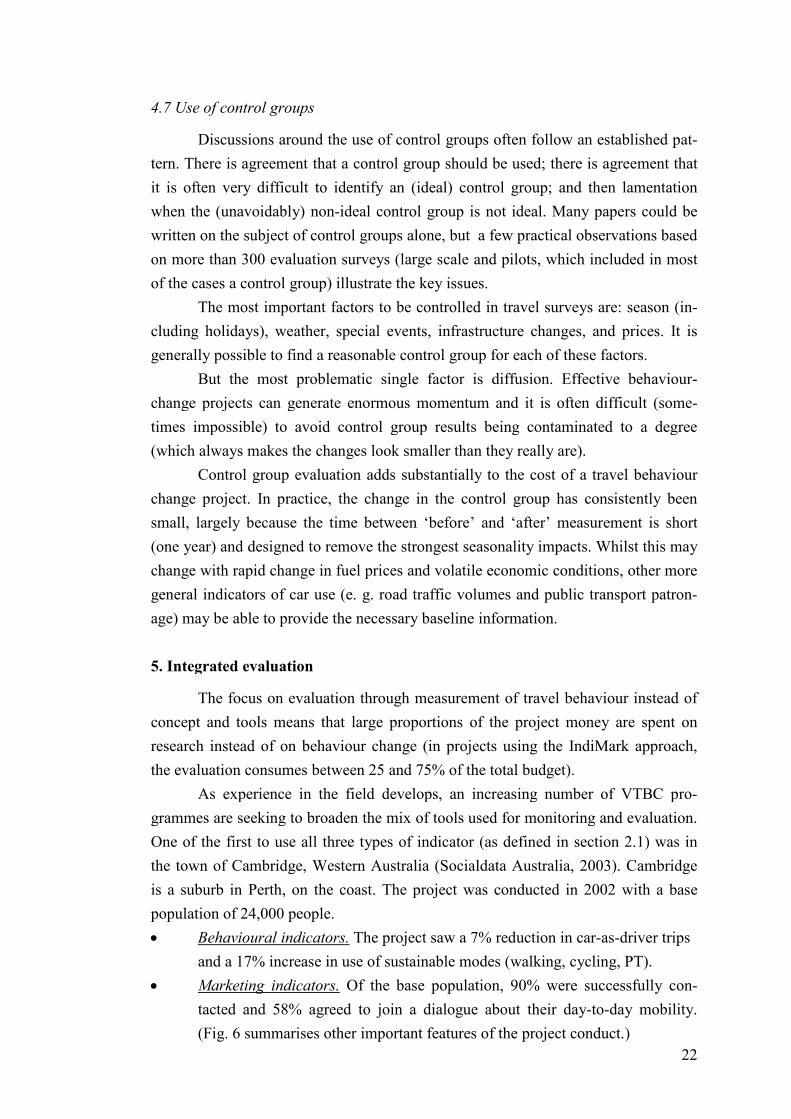
One of the first to use all three types of indicator (as defined in section 2.1) was in
the town of Cambridge, Western Australia (Socialdata Australia, 2003). Cambridge
is a suburb in Perth, on the coast. The project was conducted in 2002 with a base
population of 24,000 people.
Behavioural indicators. The project saw a 7% reduction in car-as-driver trips
and a 17% increase in use of sustainable modes (walking, cycling, PT).
Marketing indicators. Of the base population, 90% were successfully con-
tacted and 58% agreed to join a dialogue about their day-to-day mobility.
(Fig. 6 summarises other important features of the project conduct.)
23
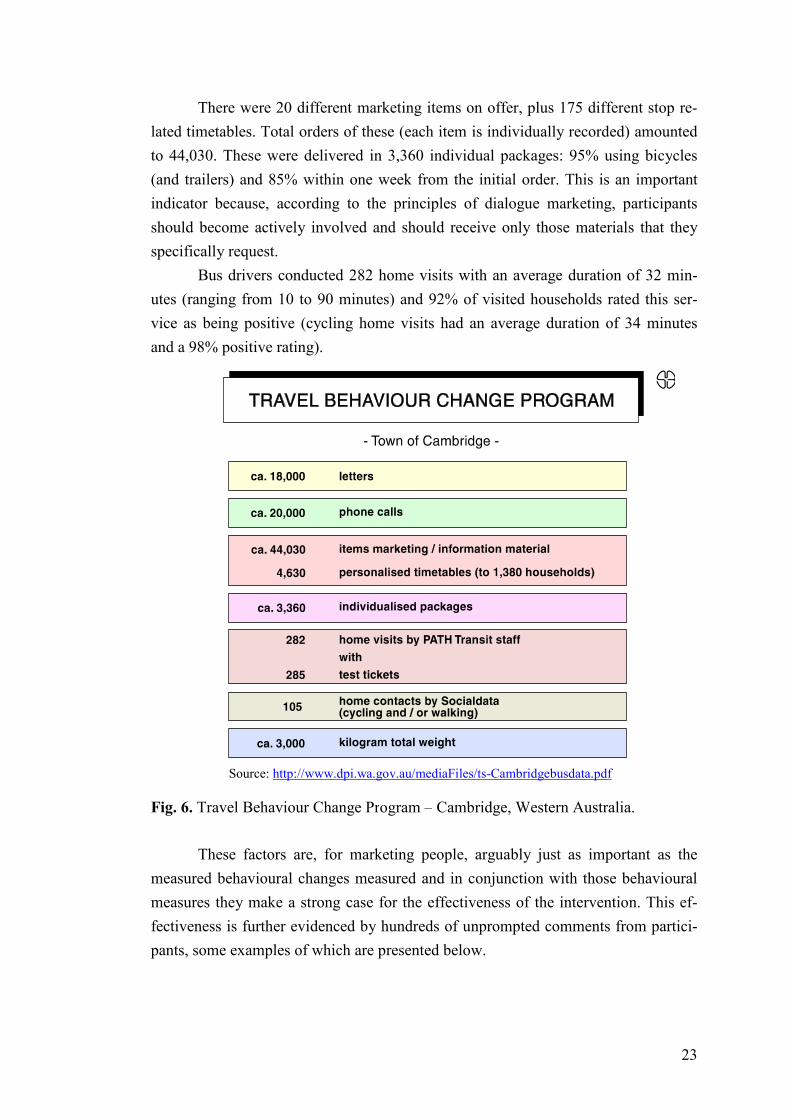
There were 20 different marketing items on offer, plus 175 different stop re-
lated timetables. Total orders of these (each item is individually recorded) amounted
to 44,030. These were delivered in 3,360 individual packages: 95% using bicycles
(and trailers) and 85% within one week from the initial order. This is an important
indicator because, according to the principles of dialogue marketing, participants
should become actively involved and should receive only those materials that they
specifically request.
Bus drivers conducted 282 home visits with an average duration of 32 min-
utes (ranging from 10 to 90 minutes) and 92% of visited households rated this ser-
vice as being positive (cycling home visits had an average duration of 34 minutes
and a 98% positive rating).
Source: http://www.dpi.wa.gov.au/mediaFiles/ts-Cambridgebusdata.pdf
Fig. 6. Travel Behaviour Change Program – Cambridge, Western Australia.
These factors are, for marketing people, arguably just as important as the
measured behavioural changes measured and in conjunction with those behavioural
measures they make a strong case for the effectiveness of the intervention. This ef-
fectiveness is further evidenced by hundreds of unprompted comments from partici-
pants, some examples of which are presented below.
24
General: ‘Every little helps, especially as I get older I need the en-couragement.’
‘The phone discussion and personal visit helped me toovercome some of my unconscious misconceptions aboutpublic transport and clarify my resistance i. e. didn’tknow about tickets, how to validate and purchase, wherebus routes went and about safety on trains and walkinghome after dark. It was useful to talk about these things.’
Publictransport:
‘It gave me the confidence to use a bus that goes near myhome. In 8 years it was the first time.’
‘It’s good to get people used to public transport as thereare various advantages like meeting people and doingsome walking to get to the transport.’
Homevisits:
‘Our bus driver made us feel that the transport systembelongs to everyone; that there is a strong desire to makeit work for everyone; that we are more connected in CityBeach than we generally feel.’
‘An efficient and knowledge based visit. My bus driverwas an expert and really inspired me to make an effort toget our and enjoy the travel available.’
Walking: ‘I will use my car less and walk more.’
‘I think in general the initiative has made me walk moree.g. instead of driving to school I walk.’
Bicycle: ‘Just bought it back into awareness, and made me get mybike out.’
‘A good idea; for me the local visit to my house and theincentive on discount for bike service actually got meonto the road.’
External indicators. The above findings are supported by long-term inde-
pendent monitoring of bus ticketing data, showing a sustained 23% increase
in patronage four years after the TravelSmart programme (Fig. 7).
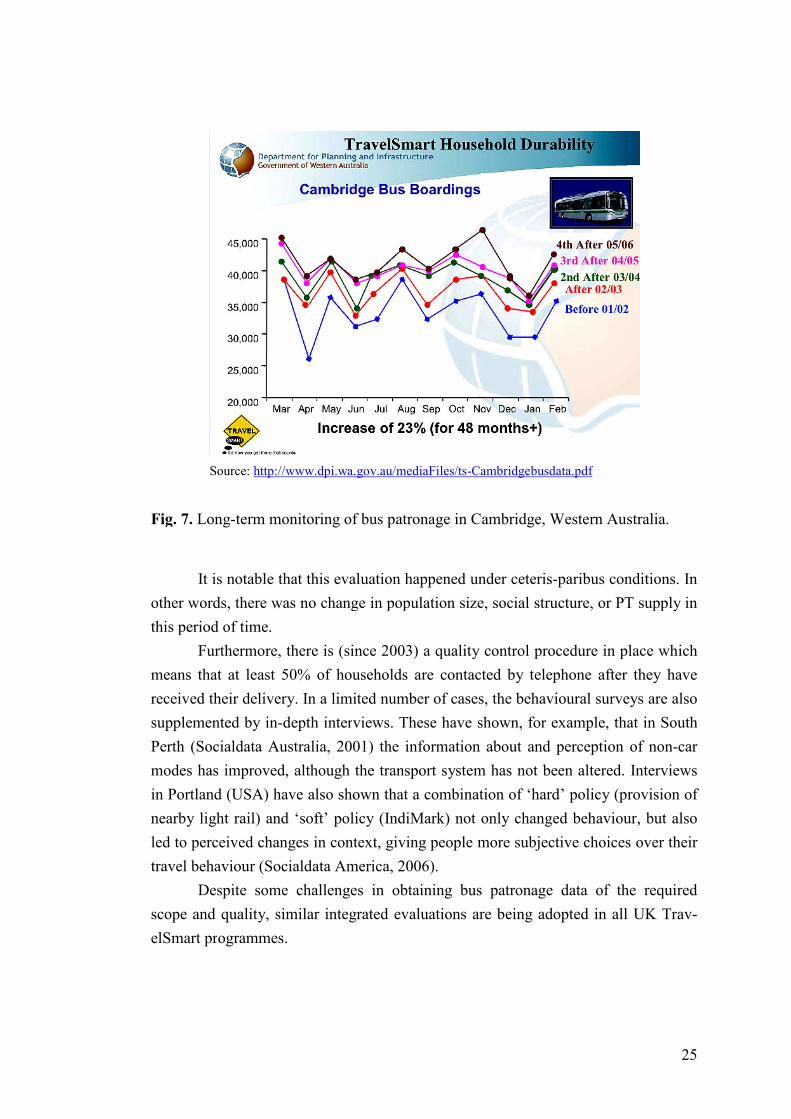
25
Source: http://www.dpi.wa.gov.au/mediaFiles/ts-Cambridgebusdata.pdf
Fig. 7. Long-term monitoring of bus patronage in Cambridge, Western Australia.
It is notable that this evaluation happened under ceteris-paribus conditions. In
other words, there was no change in population size, social structure, or PT supply in
this period of time.
Furthermore, there is (since 2003) a quality control procedure in place which
means that at least 50% of households are contacted by telephone after they have
received their delivery. In a limited number of cases, the behavioural surveys are also
supplemented by in-depth interviews. These have shown, for example, that in South
Perth (Socialdata Australia, 2001) the information about and perception of non-car
modes has improved, although the transport system has not been altered. Interviews
in Portland (USA) have also shown that a combination of ‘hard’ policy (provision of
nearby light rail) and ‘soft’ policy (IndiMark) not only changed behaviour, but also
led to perceived changes in context, giving people more subjective choices over their
travel behaviour (Socialdata America, 2006).
Despite some challenges in obtaining bus patronage data of the required
scope and quality, similar integrated evaluations are being adopted in all UK Trav-
elSmart programmes.
26
6. Conclusions
Voluntary travel behaviour change (VTBC) programmes aim to reduce car-
as-driver trips without investment in physical infrastructure or transport services, or
regulation of transport activity (including pricing). The principal techniques used in
VTBC programmes with households differ in a number of ways: whether they at-
tempt to engage the whole population of the target area: the means of identifying
those who participate actively: the methods of participation; and the methods used to
assess the extent of behaviour change.
VTBC is almost unique among transport initiatives in that it has been devel-
oped from a strong theoretical and observational basis, through a series of interven-
tions using experimental design (generally a pre-test post-test control group design),
and has been subject to comprehensive monitoring and evaluation of outcomes,
widely documented in the public domain.
Reported estimates of travel-behaviour change achieved by IndiMark have
consistently been in the range of a 5% to 15% reduction in car-as-driver trips. This
consistency, repetition of results from successive applications, and the cumulative
sample size now achieved can be seen to have successfully countered any doubts
about effectiveness based on the method of evaluation. Confidence in these esti-
mates is further enhanced by consistently high survey response rates, which mini-
mise the effect of non-response bias.
Further development is required to realise the potential for direct or indirect
measurement of car-as-driver trips as an alternative to surveys, to provide robust es-
timates of the primary travel behaviour outcome. This might be achieved through
measurement related to household vehicles rather than to individual members of
households. However, such approaches do not automatically overcome issues re-
lated to sampling and non-sampling errors associated with surveys.
References
AGO, 2006. Evaluation of Australian TravelSmart®, Projects in the ACT, South
Australia, Queensland, Victoria and Western Australia 2001-2005. Austra-
lian Greenhouse Office, Department of Environment and Heritage: Canberra,
ACT. http://www.travelsmart.gov.au/publications/pubs/evaluation-2005.pdf
Anable, J. and Gatersleben, B., 2005. All work and no play? The positive utility of
travel for work compared to leisure journeys. Transportation Research (Part
A), 39, 163-181.
Bonsall, P., 2008. What is so special about Surveys Designed to Investigate the Sus-
tainability of Travel Behaviour? Resource Paper for 8th Int. Conference on
Survey Methods in Transport, Annecy, France.
27
Brög, W., Heuwinkel, D., Neumann, K.-H., 1976. Psychological determinants of user
behaviour. Report of the 34th Round Table on Transport Economics. Euro-
pean Conference of Ministers of Transport, Paris.
Brög, W. and Meyburg, A. H., 1981. Consideration of non-response effects in large-
scale mobility surveys, Paper presented to the 60th Annual Meeting of the
Transportation Research Board (TRB), Transportation Research Record No.
807, Washington, D.C.
Brög, W. and Erl, E., 1999. Systematic Errors in Mobility Surveys, In: Proceedings
of the 23rd Australasian Transport Research Forum: Perth, Western Australia.
http://www.patrec.org/atrf/index.php?forum=12&showResults=Search&hdnS
howResults=Yes&session=0&surname=brog&title=Systematic
Brög, W., 2000. The New KONTIV®-Design: A Total Design for Surveys on Mobil-
ity Behaviour. International Conference on Establishment Surveys – II, Buf-
falo, New York
Brög, W., 2006. Die Bedeutung eines funktionierenden ÖPNV für eine funktionie-
rende Kommune im internationalen Vergleich, Nürnberg und seine VAG:
Nürnberg 26.10.2006
Brög, W. and Ker, I., 2008. Myths, (Mis) Perceptions and Reality in Measuring Vol-
untary Behaviour Change. Resource Paper for the 8th Int. Conference on Sur-
vey Methods in Transport, Annecy, France.
Eddington, R., 2006. The Eddington Transport Study – Main Report: Transport’s
role in sustaining the UK’s productivity and competitiveness. Department for
Transport: London. Accessed December 2, 2008 at
http://www.dft.gov.uk/about/strategy/transportstrategy/eddingtonstudy
Foley, J. and Fergusson, M., 2003. Putting the brakes on climate change: A policy
report on road transport and climate change. Institute for Public Policy Re-
search: London. Accessed December 2, 2008.
http://www.ippr.org.uk/publicationsandreports/publication.asp?id=206
ITP (2007) ‘Making Personal Travel Planning Work’ Integrated Transport Planning
Ltd FOR Department for Transport: London, England.
James, B. and Brög, W., 2002. TravelSmart® - Large-Scale Cost Effective Mobility
Management – Experiences from Perth, Western Australia. Symposium
‘Networks for Mobility’: Stuttgart, Germany, September 2002.
Ker, I. R. and James, B., 1999. Evaluating Behavioural Change in Transport. De-
partment of Transport, Western Australia.
Ker, I. R., 2008. North Brisbane Household TravelSmart®: Peer Review and Evalua-
tion – Appraisal of Outcomes. CATALYST FOR Brisbane City Council,
Queensland Transport and Australian Greenhouse Office: Brisbane, Queen-
sland.
28
Matthies, E., Kuhn, S., Klockner, C., 2002. Travel Mode Choice of Women: The
Result of Limitation, Ecological Norm, or Weak Habit?. Environment and
Behavior. 34(2), 163-177.
Ministerie van Verkeer en Waterstaat, 2007. Mobiliteitsonderzoek Nederland 2004 –
2007, Ministerie van Verkeer en Waterstaat Rijkswaterstaat Adviesdienst
Verkeer en Vervoer: Rotterdam, Netherlands
Parker, J, Harris, L., Chatterjee, K., Armitage, R., Cleary, J. and Goodwin, P., 2007.
Making personal travel planning work: Research Report. Integrated Transport
Planning Ltd. Report to Department for Transport. Accessed December 2,
2008 at http://www.dft.gov.uk/pgr/sustainable/travelplans/ptp/.
Petty, R. and Cacioppo, T., 1986. Communication and Persuasion; Central and Pe-
ripheral Routes to Attitude Change. Springer: New York.
Richardson, A. J., 2002. Panel Survey Issues in the Evaluation of the TravelSMART
program. TUTI Report 11-2002, The Urban Transport Institute, Taggerty,
Australia.
Richardson, A. J., 2005. TravelSmart Communities Project 2004 – Evaluation Re-
port. The Urban Transport Institute FOR Department of Infrastructure: Mel-
bourne, Australia.
Richardson, A. J., Seethaler, R. K., Harbutt, P. L., 2003. Design Issues for Before
and After Surveys of Travel Behaviour Change. Proc 26th Australasian
Transport Research Forum, Wellington, New Zealand.
Roth, M., Ker, I. R., James, B., Brög, W., Ashton-Graham, C. ,Ryle, J., Goulias, K.
and Richardson, E., 2003. A Dialogue on Individualised Marketing: Address-
ing Misperceptions. Proc. 26th Australasian Transport Research Forum, Wel-
lington, New Zealand.
Seethaler, R., Rose, G., 2009. Using odometer readings to assess VKT changes asso-
ciated with a voluntary travel behaviour change program. Transport Policy
(2009).
Socialdata America, 2006. Portland Interstate Large-Scale Individualised Marketing
TravelSmart® Project, FOR City of Portland, USA.
Socialdata Australia, 1998. Community Survey and Marketing Campaign for the
South Perth TravelSmart® Project: Final Report for Department for Planning
and Infrastructure: Perth, Western Australia.
Socialdata Australia, 2003. TravelSmart® Town of Cambridge, FOR Department for
Planning and Infrastructure, Western Australia.
Socialdata Australia, 2006a. TravelSmart® Household Programm Perth. Integrated
data evaluation, FOR Department for Planning and Infrastructure Perth,
Western Australia.
29
Socialdata Australia, 2006b. TravelSmart® Indooroopilly, FOR Queensland Trans-
port: Brisbane, Queensland.
Socialdata Australia (2006c) ‘Fitzroy North WaterSaver’ Water Use Behavioural
Change Project – Final Report, FOR City West Water.
Socialdata Australia, 2007a. Brisbane North TravelSmart® Communities Project –
Final Report, FOR Queensland Transport: Brisbane, Queensland.
Socialdata Australia, 2007b. TravelSmart® Victoria Park, FOR Department for Plan-
ning and Infrastructure Perth, Western Australia.
Socialdata Australia, 2008a. TravelSmart® Perth-Midland Line, FOR Department for
Planning and Infrastructure Perth, Western Australia.
Socialdata Australia, 2008b. TravelSmart® Joondalup – Odometer readings, FOR
Department for Planning and Infrastructure Perth, Western Australia.
Socialdata Sverige, 2002. Individualiserad Marknadsföring Dalvik, FOR Jönköpings
Länstrafik AB: Jönköping, Sweden.
Steg, L., 2005. Car use: lust and must. Instrumental, symbolic and affective motives
for car use. Transportation Research (Part A), 39 (2-3), 147-162.
Stopher, P., 2003. Travel behaviour modification: A critical appraisal. Proceedings of
the 26th Australasian Transport Research Forum: Wellington, New Zealand.
See also Roth, et al. (2003) for rebuttal of many of the issues raised by Sto-
pher.
Stopher, P., Swann, N., FitzGerald, C., 2007a. Using an Odometer and a GPS Panel
to Evaluate Travel Behaviour Changes. Paper presented to 12th TRB National
Transportation Planning Applications Conference. Transportation Research
Board. http://www.trb-appcon.org/2007conf/program.html#s4
Stopher, P., FitzGerald, C., Greaves, S. and Khang, J., 2007b. Can GPS measurement
replace travel diaries? Proc. Transport – the next 50 Years Conference.
Stopher, P.R., Cifford, E., Swann, N., Zhang, Y., 2009. Evaluating voluntary travel
behaviour change – suggested guidelines and case studies. Transport Policy
2009.
UITP, 1998. Switching to Public Transport, Socialdata FOR International Associa-
tion of Public Transport: Brussels, Belgium.
VDV and Socialdata, 1993. Chancen für Busse und Bahnen, Socialdata FOR Ver-
band Deutscher Verkehrsunternehmen (VDV): Köln, Germany.
Wall, R., Devine-Wright, P., Mill, G.A., 2008. Interactions between perceived be-
havioral control and personal-normative motives: qualitative and quantitative
evidence from a study of commuting-mode choice. Journal of Mixed Meth-
ods Research, 2, 63-86.
Warren, T., 2008. Fuel Hikes ‘Spark Travel Changes’. BBC News. Accessed De-
cember 2, 2008. http://news.bbc.co.uk/1/hi/england/7451371.stm