Embed Size (px)
Citation preview
ECV2228 December 2017
Evaluation of
West of Shetland Assets
on behalf of
Hurricane Energy plc
December 2017
This report relates specifically and solely to the subject assets and is conditional upon various assumptions that are described herein. This report must, therefore, be read in its entirety.
Our estimates of potential reserves, resources, unrisked and risked values are based on data provided by the Company. We have accepted, without independent verification, the accuracy and completeness of these data.
All interpretations and conclusions presented herein are opinions based on inferences from geological, geophysical, engineering or other data. The report represents RPS Energy Consultants Ltd’s best professional judgement and should not be considered a guarantee of results. Our liability is limited solely to Hurricane Energy plc as covered in the Letter of Engagement between Hurricane Energy plc and RPS Energy Consultants Ltd.
RPS Energy
140 London Wall, London, EC2Y 5DN T +44 (0)20 7280 3300 F +44 (0)20 7283 9248
E [email protected] W www.rpsgroup.com
RPS Energy Hurricane Energy CPR
ECV2228 December 2017
Evaluation of West of Shetland Assets
on behalf of
Hurricane Energy plc
DISCLAIMER
The opinions and interpretations presented in this report represent our best technical interpretation of the data made available to us. However, due to the uncertainty inherent in the estimation of all sub-surface parameters, we cannot and do not guarantee the accuracy or correctness of any interpretation and we shall not, except in the case of gross or wilful negligence on our part, be liable or responsible for any loss, cost damages or expenses incurred or sustained by anyone resulting from any interpretation made by any of our officers, agents or employees.
Except for the provision of professional services on a fee basis, RPS Energy Consultants Ltd does not have a commercial arrangement with any other person or company involved in the interests that are the subject of this report.
COPYRIGHT © RPS Energy Consultants Ltd
The material presented in this report is confidential. This report has been prepared for the exclusive use of Hurricane Energy plc and shall not be distributed or made available to any other company or person without the knowledge and written consent of Hurricane Energy plc or RPS Energy Consultants Ltd.
REPORT NUMBER:
ECV2228 REPORT TITLE:
Evaluation of West of Shetland Assets
DATE 11th December 2017 PROJECT REFERENCE: ECV2228
PREPARED: CHECKED: APPROVED:
NAME JHB, ER, DH, WA, GJB, AP, IL
IL GT
SENT EDITION DESCRIPTION COMMENT
FILE LOCATION: \\lon-abl-02\T:\Valuations\ECV2228 - Hurricane CPR 2
RPS Energy Hurricane Energy CPR
ECV2228 i December 2017
Table of Contents
1. EXECUTIVE SUMMARY ........................................................................................... 1
2. INTRODUCTION ....................................................................................................... 4
2.1 Overview ........................................................................................................................ 4
2.2 An Overview of Hurricane’s Exploration and Development Strategy ............................ 4
3. OVERVIEW ............................................................................................................... 5
3.1 Offshore Licences.......................................................................................................... 5
3.1.1 P.1368 Licence Terms and Commitments ....................................................... 6
3.1.2 P.1368 (Frontier Licence) ................................................................................. 6
4. RESOURCE CLASSIFICATION ................................................................................ 8
4.1 General .......................................................................................................................... 8
4.2 PRMS Reserves and Resources Classification ............................................................ 8
5. DATABASE............................................................................................................. 10
5.1 Seismic Data ............................................................................................................... 10
5.2 Well Data ..................................................................................................................... 10
5.3 Other Data ................................................................................................................... 10
6. TECHNICAL EVALUATION .................................................................................... 12
6.1 Regional Setting .......................................................................................................... 12
6.2 Fractured Basement Analogues .................................................................................. 12
7. ASSET SUMMARIES .............................................................................................. 14
7.1 Lincoln Discovery ........................................................................................................ 14
7.1.1 Data Set .......................................................................................................... 14
7.1.2 Well Data ........................................................................................................ 15
7.1.3 Geophysical Interpretation and Mapping ........................................................ 15
7.1.4 Depth Conversion ........................................................................................... 22
7.1.5 Basement Reservoir – Reservoir Properties .................................................. 22
7.1.6 Basement Reservoir – Contacts ..................................................................... 25
7.1.7 Lincoln Volumetrics ........................................................................................ 26
7.1.8 Reservoir Engineering .................................................................................... 26
7.1.9 Recoverable Volumes .................................................................................... 28
7.1.10 Lincoln Risk Assessment ................................................................................ 28
7.2 Halifax Discovery ......................................................................................................... 29
7.2.1 Data Set .......................................................................................................... 29
7.2.2 Basement Reservoir – Reservoir Properties .................................................. 34
7.2.3 Basement Reservoir – Contacts ..................................................................... 35
7.2.4 Halifax Volumetrics ......................................................................................... 38
7.2.5 Reservoir Engineering .................................................................................... 38
7.2.6 Recoverable Volumes .................................................................................... 42
7.2.7 Halifax Risk Assessment ................................................................................ 42
7.3 Warwick Prospect ........................................................................................................ 44
7.3.1 Geophysical Interpretation and Mapping ........................................................ 44
7.3.2 Geological Model ............................................................................................ 44
7.3.3 Reservoir Engineering .................................................................................... 45
7.3.4 Recoverable Volumes .................................................................................... 45
RPS Energy Hurricane Energy CPR
ECV2228 ii December 2017
7.3.5 Warwick Risk Assessment ............................................................................. 46
7.4 Whirlwind Discovery .................................................................................................... 47
7.4.1 Summary ........................................................................................................ 47
7.4.2 Geophysical Interpretation and Mapping ........................................................ 47
7.4.3 Geological Model ............................................................................................ 49
7.4.4 Reservoir Properties ....................................................................................... 49
7.4.5 Contacts .......................................................................................................... 49
7.4.6 Volumetrics ..................................................................................................... 50
7.4.7 Reservoir Engineering .................................................................................... 52
7.4.8 Recoverable Volumes .................................................................................... 55
7.4.9 Whirlwind Risk Assessment ........................................................................... 57
7.5 Strathmore Discovery .................................................................................................. 59
7.5.1 Summary ........................................................................................................ 59
7.5.2 Geophysical Interpretation and Mapping ........................................................ 59
7.5.3 Geological Model ............................................................................................ 60
7.5.4 Strathmore Volumetrics .................................................................................. 60
7.5.5 Contacts .......................................................................................................... 60
7.5.6 Volumetrics ..................................................................................................... 62
7.5.7 Reservoir Engineering .................................................................................... 62
7.5.8 Recoverable Volumes .................................................................................... 67
APPENDIX A: GLOSSARY OF TERMS AND ABBREVIATIONS ............................ 68
APPENDIX B: SPE/WPC/AAPG/SPEE RESERVE/RESOURCE DEFINITIONS ..... 75
APPENDIX C: FRACTURED RESERVOIRS ........................................................... 81
List of Figures
Figure 3.1: Hurricane’s Offshore Licences ..................................................................................5
Figure 6.1: Geological Setting of Hurricane’s West of Shetland Interests ............................... 12
Figure 7.1: Seismic Line showing Weaker Basement Pick on the Southeast Flank of Lincoln 14
Figure 7.2: Top Basement Amplitude Extraction (showing ‘Brights’ on the Highs and ‘Dims’ on Flanks) .................................................................................................................... 15
Figure 7.3: Hurricane Interpreted Basement Faults in Lincoln ................................................. 16
Figure 7.4: Hurricane Model for Sealing Faults where the Brynhild Fault Zone bounds the 3 Way Dip Closure of the Greater Lincoln Area ................................................................ 17
Figure 7.5: Structural Lineaments in the Faroe-Shetland Basin ............................................... 17
Figure 7.6: Gravity Map showing Regional Fault Trends ......................................................... 18
Figure 7.7: Illumination of Top Basement Lincoln, Warwick and Lancaster showing Major North-South, Northwest-Southeast Faulting (red lines) ................................................... 19
Figure 7.8: Seismic Sections Illustrating Major Faults bounding Lincoln. Arrows on Seismic Section are colour coded to match Mapped Fault Polygons .................................. 20
Figure 7.9: Southwest-Northeast Fault crossing the Basement adjacent to Lincoln shown on Seismic Line and an Illumination of Top Basement ............................................... 21
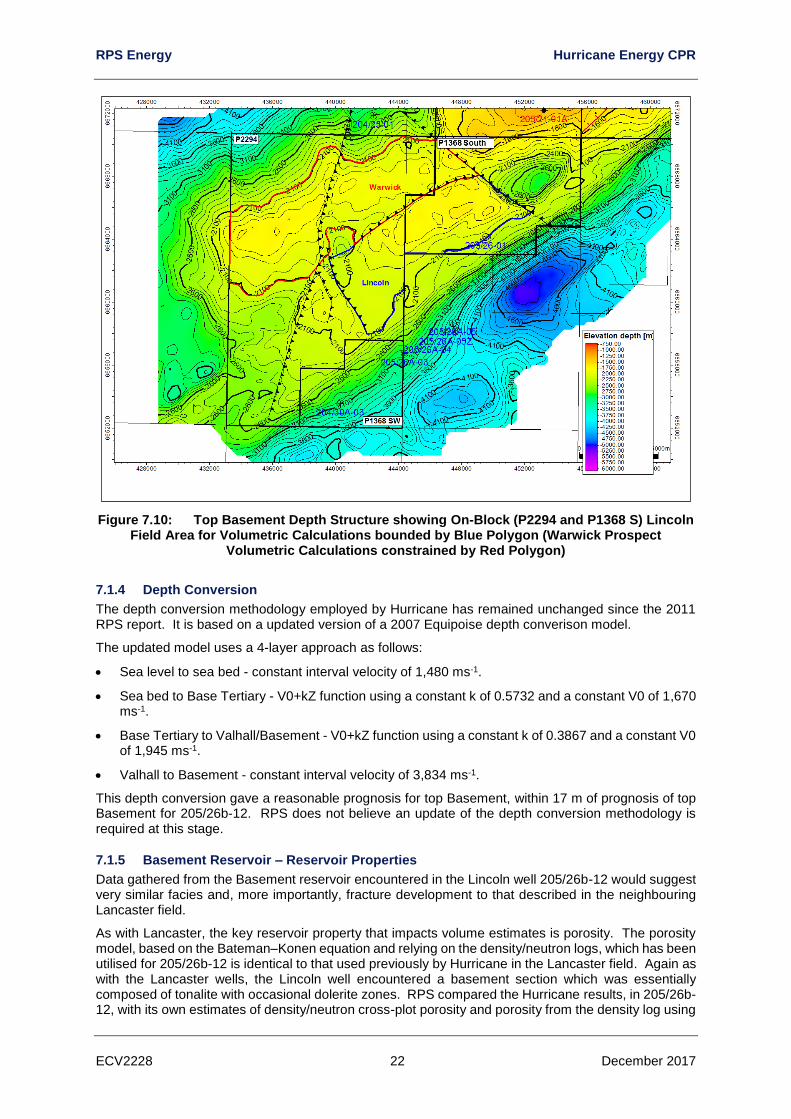
Figure 7.10: Top Basement Depth Structure showing On-Block (P2294 and P1368 S) Lincoln Field Area for Volumetric Calculations bounded by Blue Polygon (Warwick Prospect Volumetric Calculations constrained by Red Polygon) .......................................... 22
Figure 7.11: Conceptual Basement Reservoir Model ................................................................. 23
RPS Energy Hurricane Energy CPR
ECV2228 iii December 2017
Figure 7.12: GCTracer™ Plot showing THC and Wetness Fraction (Note: Depths on Graph axis in MDT whilst ODT’s in TVDSS) ............................................................................. 25
Figure 7.13: Lincoln Field and Warwick Prospect Basement Depth Map with OWC Range ..... 26
Figure 7.14: Lincoln Isotube Data (Bernard Plot) ....................................................................... 27
Figure 7.15: Seismic Time Slice through Rona Ridge from Lancaster to Halifax, illustrating Area of Poor Data Quality and extent of Seismic Coverage ........................................... 29
Figure 7.16: Seismic Lines through Lancaster (Section 1) and Halifax (Sections 2 and 3) ....... 30
Figure 7.17: Seismic Illumination (Upper) and Dip/Azimuth Map (Lower) of Top Basement from Lancaster to Halifax ................................................................................................ 31
Figure 7.18: Seismic Illumination (Upper) and Dip/Azimuth Map (Lower) of Composite Surface: Top Basement and Top Mesozoic, from Lancaster to Halifax ............................... 32
Figure 7.19: 2D Line showing Hurricane’s Interpretation of the Westray Fault Zone ................. 33
Figure 7.20: Halifax Field Top Basement Depth Map (m) .......................................................... 34
Figure 7.21: Plot illustrating Biogenic/Thermogenic Gas Composition ...................................... 36
Figure 7.22: GCTracer™ Plot showing Total Hydrocarbon Gas (THC) ..................................... 37
Figure 7.23: Halifax Basement Depth Map showing OWC Range ............................................. 38
Figure 7.24: Comparison on Halifax and Lancaster Water Geochemistry ................................. 39
Figure 7.25: 205/23-3A MDT Pre-Test @ 2245.1 m MD (1938.4 m TVDSS) ............................ 40
Figure 7.26: 205/23-3A Sidewall Core Barrel covered in ‘Granite Paste’ .................................. 41
Figure 7.27: 205/23-3a VSP Wellbore Transit Time and UBI Fluid Velocity vs Depth ............... 42
Figure 7.28: Top Basement Depth Structure showing On-Block (P2294 and P1368 S) Warwick Prospect Area for Volumetric Calculations bounded by Red Polygon (Lincoln Volumetrics constrained by Blue Polygon) ............................................................. 44
Figure 7.29: Warwick and Lincoln Bulk Rock Volume Distribution (based on ‘shallow’ 2109 m TVDSS Contact Depth) .......................................................................................... 45
Figure 7.30: Structural relationship between Whirlwind and Lancaster (Source: Hurricane) ..... 47
Figure 7.31: Whirlwind Basement Depth Structure Map showing Closure Areas ...................... 48
Figure 7.32: A and B – A: Schematic of the Relationship of the Valhall Formation to Basement; B: Valhall Depth Structure Map with Closure ......................................................... 49
Figure 7.33: Whirlwind 205/21a-5 Well Measured Bottom Hole Pressure History ..................... 54
Figure 7.34: Log-Log Plot of Final Build-Up ............................................................................... 55
Figure 7.35: Seismic Section through the Strathmore Discovery showing the Poor Quality of the Reservoir Reflectors (Yellow ‘OBS’) ....................................................................... 60
Figure 7.36: Strathmore Formation Pressure Plot ...................................................................... 61
Figure 7.37: Top Otterbank Sandstone Depth Map ................................................................... 61
List of Tables
Table 1.1: Summary of Discovered In-Place Volumes and Contingent Resources as of 11th December 2017 .........................................................................................................2
Table 1.2: Summary of Undiscovered STOIIP and Prospective Resources as of 11th December 2017 ...........................................................................................................................3
Table 3.1: Summary of Licence Terms and Commitments ........................................................6
Table 5.1: Summary of Well Data ........................................................................................... 10
Table 7.1: Contact Comparison between Lancaster and Lincoln ............................................ 17
Table 7.2: Lincoln FZ:FB Proportion Range ............................................................................ 24
Table 7.3: Lincoln Porosity Ranges ......................................................................................... 24
Table 7.4: Lincoln Water Saturation Range ............................................................................ 24
RPS Energy Hurricane Energy CPR
ECV2228 iv December 2017
Table 7.5: Lincoln OWC Summary .......................................................................................... 26
Table 7.6: Lincoln STOIIP (100% Basis) ................................................................................. 26
Table 7.7: Lincoln Contingent Resources, Development Unclarified ...................................... 28
Table 7.8: Halifax FZ:FB Proportion Range ............................................................................ 34
Table 7.9: Halifax Porosity Ranges ......................................................................................... 35
Table 7.10: Halifax Water Saturation Range ............................................................................. 35
Table 7.11: Halifax OWC Summary .......................................................................................... 37
Table 7.12: Halifax Basement GIIP and STOIIP (100% Basis) ................................................. 38
Table 7.13: Halifax Contingent Resources, Development Unclarified ...................................... 42
Table 7.14: Warwick STOIIP (100% Basis) ............................................................................... 45
Table 7.15: Warwick Prospective Resources ............................................................................ 46
Table 7.16: Whirlwind Basement Discovered Volumetric Input Parameters ............................. 50
Table 7.17: RPS Estimated Basement Discovered STOIIP in Whirlwind (100% Basis) ........... 50
Table 7.18: RPS Estimated Basement Discovered WGIIP in Whirlwind (100% Basis) ............ 50
Table 7.19: Whirlwind Basement Undiscovered Volumetric Input Parameters ......................... 51
Table 7.20: RPS Estimated Undiscovered Basement STOIIP in Whirlwind (100% Basis) ....... 51
Table 7.21: RPS Estimated Undiscovered Basement WGIIP in Whirlwind (100% Basis) ........ 51
Table 7.22: Whirlwind Limestone Volumetric Input Parameters – RPS Case .......................... 51
Table 7.23: RPS Estimated Discovered Limestone STOIIP in Whirlwind (100% Basis) .......... 51
Table 7.24: RPS Estimated Discovered Limestone WGIIP in Whirlwind (100% Basis) ............ 52
Table 7.25: Whirlwind Limestone Undiscovered Volumetric Input Parameters ........................ 52
Table 7.26: RPS Estimated Undiscovered Limestone STOIIP in Whirlwind (100% Basis) ...... 52
Table 7.27: RPS Estimated Undiscovered Limestone WGIIP in Whirlwind (100% Basis)........ 52
Table 7.28: Whirlwind Oil Contingent Resources (Oil Case) .................................................... 56
Table 7.29 : Whirlwind Associated Gas Contingent Resources (Oil Case) ............................... 56
Table 7.30: Whirlwind Oil Prospective Resources (Oil Case) ................................................... 56
Table 7.31: Whirlwind Associated Gas Prospective Resources (Oil Case) .............................. 56
Table 7.32: Whirlwind Gas Contingent Resources (Gas Condensate Case) ........................... 57
Table 7.33: Whirlwind Condensate Contingent Resources (Gas Condensate Case) ............... 57
Table 7.34: Whirlwind Gas Prospective Resources (Gas Condensate Case) .......................... 57
Table 7.35: Whirlwind Condensate Prospective Resources (Gas Condensate Case) ............. 57
Table 7.36: Strathmore Otterbank Volumetric Input Parameters .............................................. 62
Table 7.37: RPS Estimated Otterbank STOIIP in Strathmore (100% Basis) ............................ 62
Table 7.38: Strathmore PVT Properties .................................................................................... 63
Table 7.39: Strathmore Contingent Resources (Development On Hold) .................................. 67
RPS Energy Hurricane Energy CPR
ECV2228 1 December 2017
1. EXECUTIVE SUMMARY
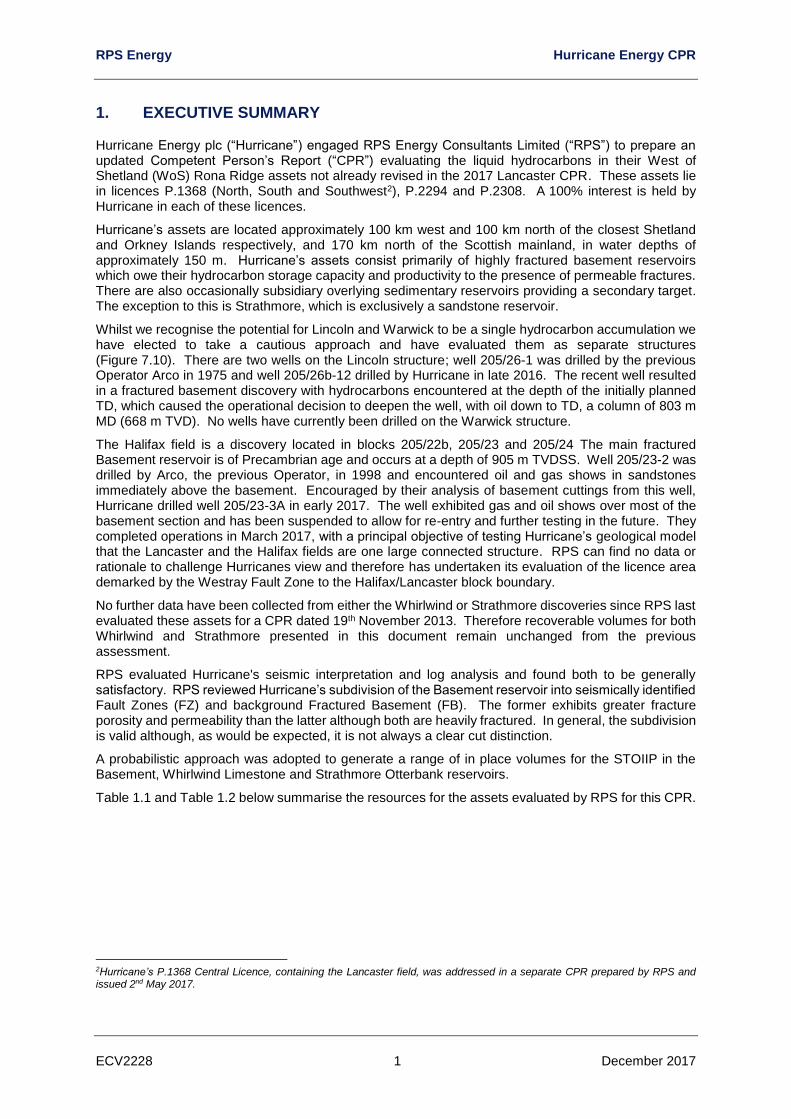
Hurricane Energy plc (“Hurricane”) engaged RPS Energy Consultants Limited (“RPS”) to prepare an updated Competent Person’s Report (“CPR”) evaluating the liquid hydrocarbons in their West of Shetland (WoS) Rona Ridge assets not already revised in the 2017 Lancaster CPR. These assets lie in licences P.1368 (North, South and Southwest2), P.2294 and P.2308. A 100% interest is held by Hurricane in each of these licences.
Hurricane’s assets are located approximately 100 km west and 100 km north of the closest Shetland and Orkney Islands respectively, and 170 km north of the Scottish mainland, in water depths of approximately 150 m. Hurricane’s assets consist primarily of highly fractured basement reservoirs which owe their hydrocarbon storage capacity and productivity to the presence of permeable fractures. There are also occasionally subsidiary overlying sedimentary reservoirs providing a secondary target. The exception to this is Strathmore, which is exclusively a sandstone reservoir.
Whilst we recognise the potential for Lincoln and Warwick to be a single hydrocarbon accumulation we have elected to take a cautious approach and have evaluated them as separate structures (Figure 7.10). There are two wells on the Lincoln structure; well 205/26-1 was drilled by the previous Operator Arco in 1975 and well 205/26b-12 drilled by Hurricane in late 2016. The recent well resulted in a fractured basement discovery with hydrocarbons encountered at the depth of the initially planned TD, which caused the operational decision to deepen the well, with oil down to TD, a column of 803 m MD (668 m TVD). No wells have currently been drilled on the Warwick structure.
The Halifax field is a discovery located in blocks 205/22b, 205/23 and 205/24 The main fractured Basement reservoir is of Precambrian age and occurs at a depth of 905 m TVDSS. Well 205/23-2 was drilled by Arco, the previous Operator, in 1998 and encountered oil and gas shows in sandstones immediately above the basement. Encouraged by their analysis of basement cuttings from this well, Hurricane drilled well 205/23-3A in early 2017. The well exhibited gas and oil shows over most of the basement section and has been suspended to allow for re-entry and further testing in the future. They completed operations in March 2017, with a principal objective of testing Hurricane’s geological model that the Lancaster and the Halifax fields are one large connected structure. RPS can find no data or rationale to challenge Hurricanes view and therefore has undertaken its evaluation of the licence area demarked by the Westray Fault Zone to the Halifax/Lancaster block boundary.
No further data have been collected from either the Whirlwind or Strathmore discoveries since RPS last evaluated these assets for a CPR dated 19th November 2013. Therefore recoverable volumes for both Whirlwind and Strathmore presented in this document remain unchanged from the previous assessment.
RPS evaluated Hurricane's seismic interpretation and log analysis and found both to be generally satisfactory. RPS reviewed Hurricane’s subdivision of the Basement reservoir into seismically identified Fault Zones (FZ) and background Fractured Basement (FB). The former exhibits greater fracture porosity and permeability than the latter although both are heavily fractured. In general, the subdivision is valid although, as would be expected, it is not always a clear cut distinction.
A probabilistic approach was adopted to generate a range of in place volumes for the STOIIP in the Basement, Whirlwind Limestone and Strathmore Otterbank reservoirs.
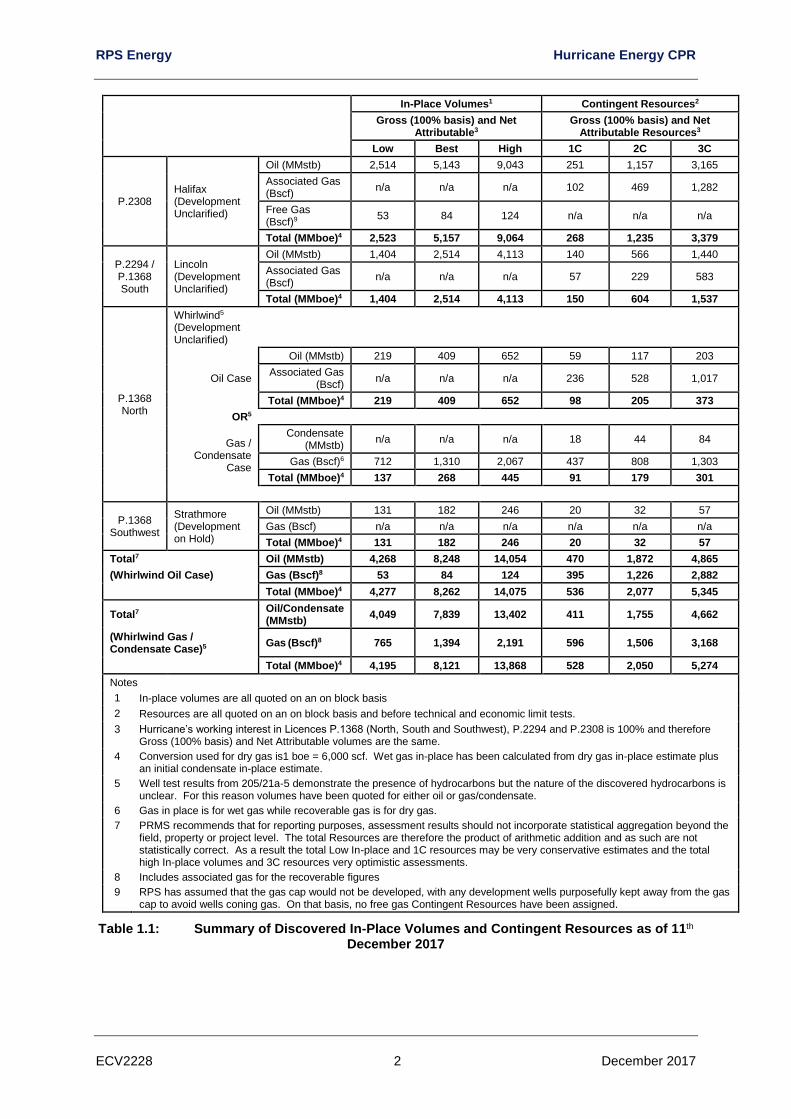
Table 1.1 and Table 1.2 below summarise the resources for the assets evaluated by RPS for this CPR.
2Hurricane’s P.1368 Central Licence, containing the Lancaster field, was addressed in a separate CPR prepared by RPS and issued 2nd May 2017.
RPS Energy Hurricane Energy CPR
ECV2228 2 December 2017
In-Place Volumes1 Contingent Resources2
Gross (100% basis) and Net Attributable3
Gross (100% basis) and Net Attributable Resources3
Low Best High 1C 2C 3C
P.2308 Halifax (Development Unclarified)
Oil (MMstb) 2,514 5,143 9,043 251 1,157 3,165
Associated Gas (Bscf)
n/a n/a n/a 102 469 1,282
Free Gas (Bscf)9
53 84 124 n/a n/a n/a
Total (MMboe)4 2,523 5,157 9,064 268 1,235 3,379
P.2294 / P.1368 South
Lincoln (Development Unclarified)
Oil (MMstb) 1,404 2,514 4,113 140 566 1,440
Associated Gas (Bscf)
n/a n/a n/a 57 229 583
Total (MMboe)4 1,404 2,514 4,113 150 604 1,537
P.1368 North
Whirlwind5 (Development Unclarified)
Oil Case
Oil (MMstb) 219 409 652 59 117 203
Associated Gas (Bscf)
n/a n/a n/a 236 528 1,017
Total (MMboe)4 219 409 652 98 205 373
OR5
Gas / Condensate
Case
Condensate (MMstb)
n/a n/a n/a 18 44 84
Gas (Bscf)6 712 1,310 2,067 437 808 1,303
Total (MMboe)4 137 268 445 91 179 301
P.1368 Southwest
Strathmore (Development on Hold)
Oil (MMstb) 131 182 246 20 32 57
Gas (Bscf) n/a n/a n/a n/a n/a n/a
Total (MMboe)4 131 182 246 20 32 57
Total7 Oil (MMstb) 4,268 8,248 14,054 470 1,872 4,865
(Whirlwind Oil Case) Gas (Bscf)8 53 84 124 395 1,226 2,882
Total (MMboe)4 4,277 8,262 14,075 536 2,077 5,345
Total7 Oil/Condensate (MMstb)
4,049 7,839 13,402 411 1,755 4,662
(Whirlwind Gas / Condensate Case)5
Gas (Bscf)8 765 1,394 2,191 596 1,506 3,168
Total (MMboe)4 4,195 8,121 13,868 528 2,050 5,274
Notes
1 In-place volumes are all quoted on an on block basis
2 Resources are all quoted on an on block basis and before technical and economic limit tests.
3 Hurricane’s working interest in Licences P.1368 (North, South and Southwest), P.2294 and P.2308 is 100% and therefore Gross (100% basis) and Net Attributable volumes are the same.
4 Conversion used for dry gas is1 boe = 6,000 scf. Wet gas in-place has been calculated from dry gas in-place estimate plus an initial condensate in-place estimate.
5 Well test results from 205/21a-5 demonstrate the presence of hydrocarbons but the nature of the discovered hydrocarbons is unclear. For this reason volumes have been quoted for either oil or gas/condensate.
6 Gas in place is for wet gas while recoverable gas is for dry gas.
7 PRMS recommends that for reporting purposes, assessment results should not incorporate statistical aggregation beyond the field, property or project level. The total Resources are therefore the product of arithmetic addition and as such are not statistically correct. As a result the total Low In-place and 1C resources may be very conservative estimates and the total high In-place volumes and 3C resources very optimistic assessments.
8 Includes associated gas for the recoverable figures
9 RPS has assumed that the gas cap would not be developed, with any development wells purposefully kept away from the gas cap to avoid wells coning gas. On that basis, no free gas Contingent Resources have been assigned.
Table 1.1: Summary of Discovered In-Place Volumes and Contingent Resources as of 11th December 2017
RPS Energy Hurricane Energy CPR
ECV2228 3 December 2017
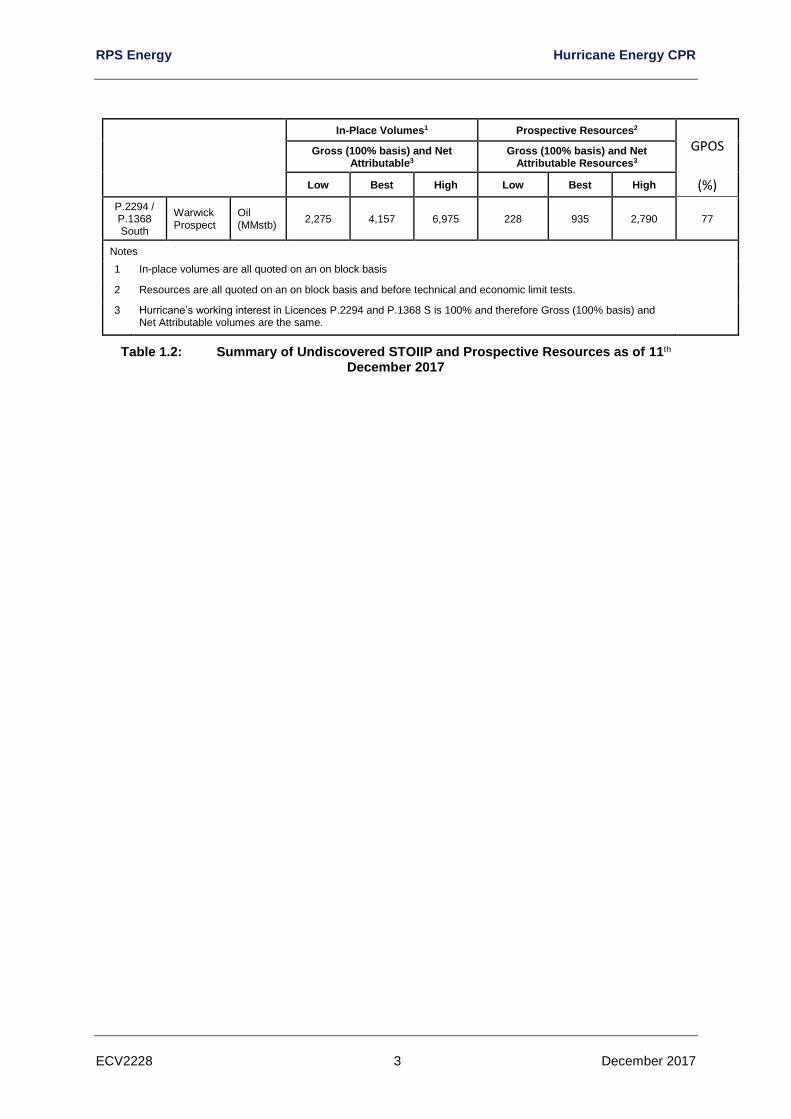
In-Place Volumes1 Prospective Resources2
GPOS Gross (100% basis) and Net Attributable3
Gross (100% basis) and Net Attributable Resources3
Low Best High Low Best High (%)
P.2294 / P.1368 South
Warwick Prospect
Oil (MMstb)
2,275 4,157 6,975 228 935 2,790 77
Notes 1 In-place volumes are all quoted on an on block basis 2 Resources are all quoted on an on block basis and before technical and economic limit tests. 3 Hurricane’s working interest in Licences P.2294 and P.1368 S is 100% and therefore Gross (100% basis) and
Net Attributable volumes are the same.
Table 1.2: Summary of Undiscovered STOIIP and Prospective Resources as of 11th
December 2017
RPS Energy Hurricane Energy CPR
ECV2228 4 December 2017
2. INTRODUCTION
2.1 Overview
RPS has completed an independent evaluation of Contingent and Prospective Resources Hurricane’s assets, located West of Shetland.
A full Glossary of Terms and Abbreviations is given in Appendix A.
2.2 An Overview of Hurricane’s Exploration and Development Strategy
Hurricane believes that the UK continental shelf offers a potential analogue to Vietnam and Yemen as it contains a proven petroleum system which has been associated with serendipitous Basement oil discoveries in the past. Hurricane initiated a work programme to establish the materiality of the UK Basement hydrocarbon resource potential. Hurricane focused on the West of Shetlands where previous drilling provided positive evidence of oil in the Basement below more conventional targets at the time of drilling. An active seismic data acquisition programme has enabled high quality mapping and led to the identification of several relatively low exploration risk Basement prospects which might also have material upside potential outside of conventional closure within what is modelled to be a pervasive fracture network deep into the Basement.
To date, having identified and acquired licences in the 23rd, 24th, 26th and 28th UKCS licensing rounds, Hurricane has now drilled eight Basement wells, each of which have encountered hydrocarbon (to lesser or greater extent) within the Basement. Of the eight wells, five have been drilled into the Lancaster field and one as the discovery well for Whirlwind. The Lancaster drilling results have been covered in our 2013 and 2017 CPRs. The Whirlwind well results were dealt with in the 2013 CPR and no change has been made to Whirlwind resources. The two remaining wells were both drilled on exploration targets, Lincoln, to the south of Lancaster and Halifax to the northeast of Lancaster, Figure 3.1, both wells were targeting the Rona Ridge Basement reservoir.
The Lincoln well, 205/26b-12, penetrated 803 m MD (668 mTVD) of fractured basement. There was strong evidence of hydrocarbons over most of the section with weaker evidence to TD. The well was permanently abandoned.
The Halifax field is a discovery located in blocks 205/22b, 205/23 and 205/24 with its main reservoir being highly fractured Basement rock that owes its hydrocarbon storage capacity and productivity to the presence of permeable fractures. The main fractured Basement reservoir is of Precambrian age and occurs at a depth of 905 m. Well 205/23-2 was drilled by Arco, the previous Operator, in 1998 and encountered oil and gas shows in sandstones immediately above the basement. Encouraged by their analysis of basement cuttings from this well, Hurricane drilled well 205/23-3A in early 2017. They completed operations in March 2017, with a principal objective of testing Hurricane’s geological model that the Lancaster and the Halifax fields are one large connected structure. The well exhibited gas and oil shows over most of the basement section and has been suspended to allow for re-entry and further testing in the future.
RPS Energy Hurricane Energy CPR
ECV2228 5 December 2017
3. OVERVIEW
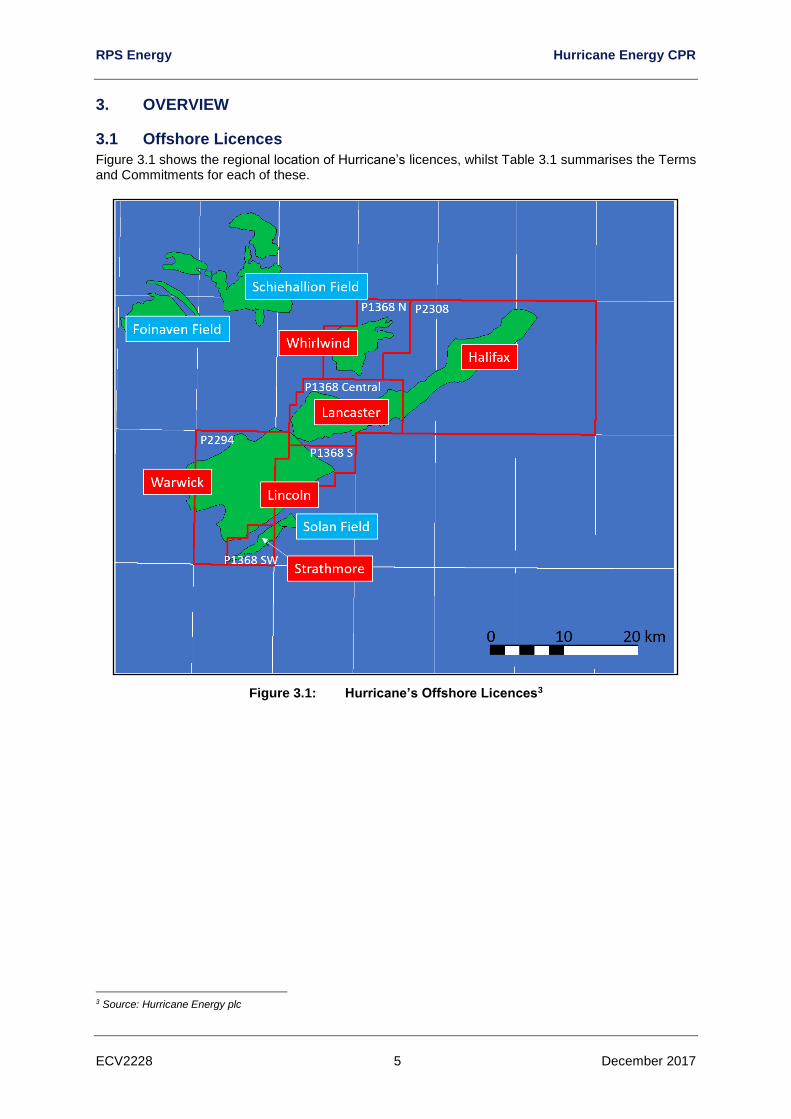
3.1 Offshore Licences
Figure 3.1 shows the regional location of Hurricane’s licences, whilst Table 3.1 summarises the Terms and Commitments for each of these.
Figure 3.1: Hurricane’s Offshore Licences3
3 Source: Hurricane Energy plc
RPS Energy Hurricane Energy CPR
ECV2228 6 December 2017
1 In November 2015 OGA consented to the sub-division of Hurricane’s Frontier Licence P.1368 into four sub-areas, P.1368 North, Central, South and Southwest. Licence P.1368 as a whole contains blocks 205/21a, 205/22a, 205/26b and 204/30a.
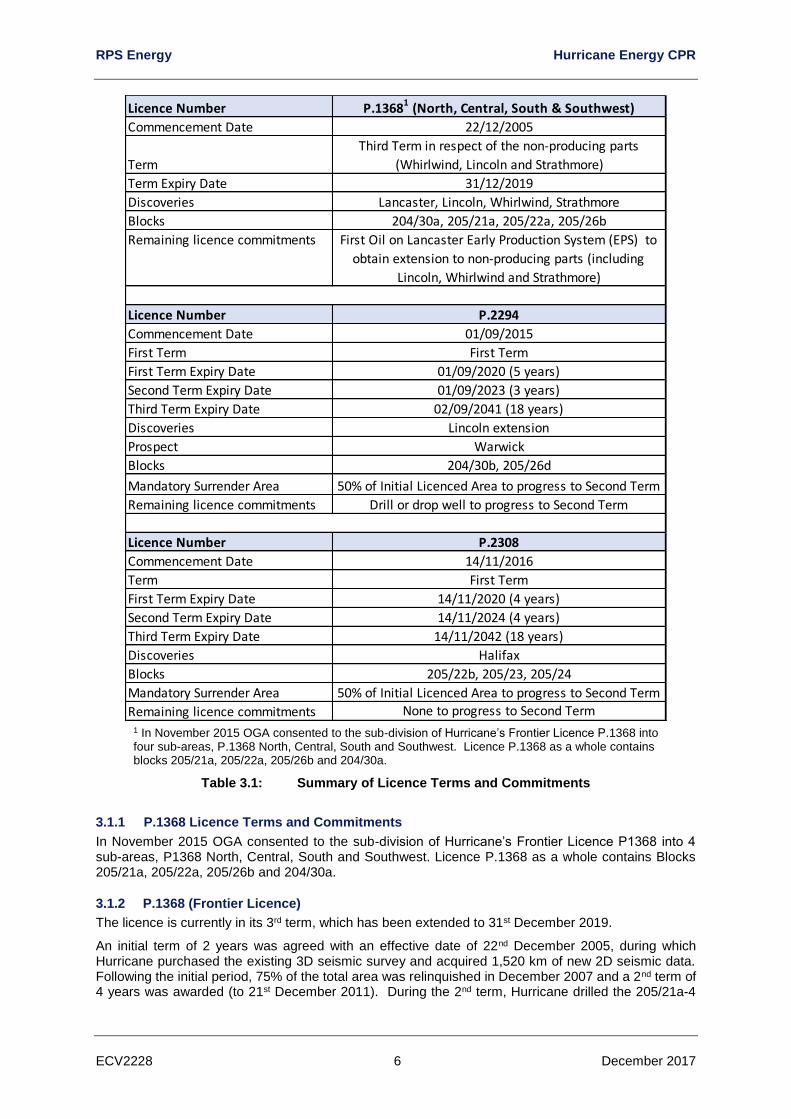
Table 3.1: Summary of Licence Terms and Commitments
3.1.1 P.1368 Licence Terms and Commitments
In November 2015 OGA consented to the sub-division of Hurricane’s Frontier Licence P1368 into 4 sub-areas, P1368 North, Central, South and Southwest. Licence P.1368 as a whole contains Blocks 205/21a, 205/22a, 205/26b and 204/30a.
3.1.2 P.1368 (Frontier Licence)
The licence is currently in its 3rd term, which has been extended to 31st December 2019.
An initial term of 2 years was agreed with an effective date of 22nd December 2005, during which Hurricane purchased the existing 3D seismic survey and acquired 1,520 km of new 2D seismic data. Following the initial period, 75% of the total area was relinquished in December 2007 and a 2nd term of 4 years was awarded (to 21st December 2011). During the 2nd term, Hurricane drilled the 205/21a4
Licence Number P.13681 (North, Central, South & Southwest)
Commencement Date 22/12/2005
Term
Third Term in respect of the non-producing parts
(Whirlwind, Lincoln and Strathmore)
Term Expiry Date 31/12/2019
Discoveries Lancaster, Lincoln, Whirlwind, Strathmore
Blocks 204/30a, 205/21a, 205/22a, 205/26b
Remaining licence commitments First Oil on Lancaster Early Production System (EPS) to
obtain extension to non-producing parts (including
Lincoln, Whirlwind and Strathmore)
Licence Number P.2294
Commencement Date 01/09/2015
First Term First Term
First Term Expiry Date 01/09/2020 (5 years)
Second Term Expiry Date 01/09/2023 (3 years)
Third Term Expiry Date 02/09/2041 (18 years)
Discoveries Lincoln extension
Prospect Warwick
Blocks 204/30b, 205/26d
Mandatory Surrender Area 50% of Initial Licenced Area to progress to Second Term
Remaining licence commitments Drill or drop well to progress to Second Term
Licence Number P.2308
Commencement Date 14/11/2016
Term First Term
First Term Expiry Date 14/11/2020 (4 years)
Second Term Expiry Date 14/11/2024 (4 years)
Third Term Expiry Date 14/11/2042 (18 years)
Discoveries Halifax
Blocks 205/22b, 205/23, 205/24
Mandatory Surrender Area 50% of Initial Licenced Area to progress to Second Term
Remaining licence commitments None to progress to Second Term

RPS Energy Hurricane Energy CPR
ECV2228 7 December 2017
well, fulfilling their commitment to drill one exploration well to a depth of >1,100m or preJurassic. As a result, Hurricane took up the option to enter a 3rd term (6 years) in December 2011.
The 3rd Term4, up to December 2017, required Hurricane to relinquish 50% of the remaining area of P.1368 as at end of 2nd Term, to engage in general appraisal and development preparation activity with a view to declaring a full field development or fully relinquishing the licence by the end of the term.
The 3rd Term was subsequently extended in December 2013 by deed of variation until 31st December 2019 provided that:
• A Lincoln well is drilled by 31st December 2019 as condition to retaining non-producing parts of the licence. Hurricane completed this well on schedule.
• Production commenced from EPS by 31st December 2019 as a condition to retaining nonproducing parts of the licence5.
4 N.B. Within the two licence documents the second 6 year period is actually referred to as the “3rd Term”
5 Assuming Lancaster sub-area is the subject of an approved FDP for the EPS.
RPS Energy Hurricane Energy CPR
ECV2228 8 December 2017
4. RESOURCE CLASSIFICATION
4.1 General
The evaluation presented in this Competent Persons Report has been conducted within our understanding of UK petroleum legislation, taxation and other regulations that currently apply to these interests. RPS is not in a position to attest to the property title, financial interest relationships or encumbrances related to the property. Our estimates of potential resources and risks are based on the limited data set available to, and provided by, Hurricane. We have accepted, without independent verification, the accuracy and completeness of these data.
4.2 PRMS Reserves and Resources Classification
Volumes and risk factors are presented in accordance with the 2007 SPE/WPC/AAPG/SPEE Petroleum Resource Management System. Appendix B discusses in more detail the PRMS classifications appropriate to Hurricane at this time.
Hurricane’s P.1368, P.2294 and P.2308 licences contain discovered hydrocarbons which fall within the PRMS classifications of either Contingent or Prospective Resources.
Both Contingent Resources and Prospective Resources are subject to risk. Prospective Resources are undiscovered and the probability of success is referred to in PRMS as the Chance of Discovery (CoD). Contingent Resources are by definition discovered but are subject to a Chance of Development (also CoD). To avoid confusion with acronyms RPS has used the term Geological Probability of Success (GPoS) in this document synonymously with Chance of Discovery.
CONTINGENT RESOURCES are those quantities of petroleum estimated, as of a given date, to be potentially recoverable from known accumulations, but the applied project(s) are not yet considered mature enough for commercial development due to one or more contingencies. Contingent Resources may include, for example, projects for which there are currently no viable markets, or where commercial recovery is dependent on technology under development, or where evaluation of the accumulation is insufficient to clearly assess commerciality. Contingent Resources are further categorised in accordance with the level of certainty associated with the estimates and may be subclassified based on project maturity and/or characterised by their economic status as follows:
1) Contingent Resources (Development Pending);
2) Contingent Resources (Development Unclarified or on Hold);
3) Contingent Resources (Development not Viable).
Under the above PRMS definitions of Project Maturity Sub-classes the Company’s Contingent Resource volumes are classified as Sub-Commercial. The PRMS defines a project as SubCommercial if the degree of commitment is such that the accumulation is not expected to be developed and placed on production within a reasonable time frame. While 5 years is recommended as a benchmark, a longer time frame could be applied where, for example, development of economic projects are deferred at the option of the producer for, among other things, market-related reasons, or to meet contractual or strategic objectives. Discovered sub-commercial projects are classified as Contingent Resources.
PRMS divides projects currently classified as Contingent Resources into two groups, based on assumptions regarding future conditions and their impact on ultimate economic viability. These two groups are Marginal Contingent Resources and Sub-Marginal Contingent Resources. Marginal Contingent Resources are known (discovered) accumulations for which a development project has been evaluated as economic or reasonably expected to become economic but commitment is withheld because of one or more contingencies. Sub-Marginal Contingent Resources on the other hand, are known (discovered) accumulations for which a development project has been evaluated to not meet economic criteria, even considering reasonably expected improvements in conditions.
Economic evaluation of the Company’s Contingent Resources has not been undertaken as part of the CPR. However, neither this nor the categorisation of such assets as Sub-Commercial under the PRMS definitions should be taken as an indication that such resource categories do not have economic value. Accordingly, the categorisation of such assets as Sub-Commercial is a function of their stage of development, rather than an indication of the commerciality or economic value of the resource volumes identified.
RPS Energy Hurricane Energy CPR
ECV2228 9 December 2017
PROSPECTIVE RESOURCES are those quantities of petroleum estimated, as of a given date, to be potentially recoverable from undiscovered accumulations by application of future development projects. Prospective Resources have both an associated chance of discovery and a chance of development. Prospective Resources are further subdivided in accordance with the level of certainty associated with recoverable estimates assuming their discovery and development and may be sub-classified based on project maturity.
RPS Energy Hurricane Energy CPR
ECV2228 10 December 2017
5. DATABASE
5.1 Seismic Data
A Kingdom™ seismic project was provided to RPS for evaluation in 2013. The project contained the full PGS Megamerge 3D seismic volume plus subsets and derivative volumes.
It is a compilation of several vintages of seismic surveys, and there are some issues of phase variation between surveys within the Megamerge, however, this variation is not a problem for the purpose of quality controlling current interpretations. The polarity and phase of the data is assumed to be zero-phase, with a positive impedance contrast being represented with a positive loop on the seismic data. A full suite of interpreted horizons was included in the Kingdom projects, including the reservoir horizons and the key overburden horizons for depth conversion.
In addition, consultants Equipoise’s depth maps of all the reservoir horizons were provided.
Hurricane provided updated interpretations in 2017 for Base Tertiary, Kyrre Formation, Victory Sandstone, Kimmeridge Clay Formation (KCF), Rona Sandstone, Valhall Formation, Top Triassic and Top Basement. The top Basement horizon pick was largely unchanged from that of 2013. Updated fault interpretations (polygons) were also provided by Hurricane.
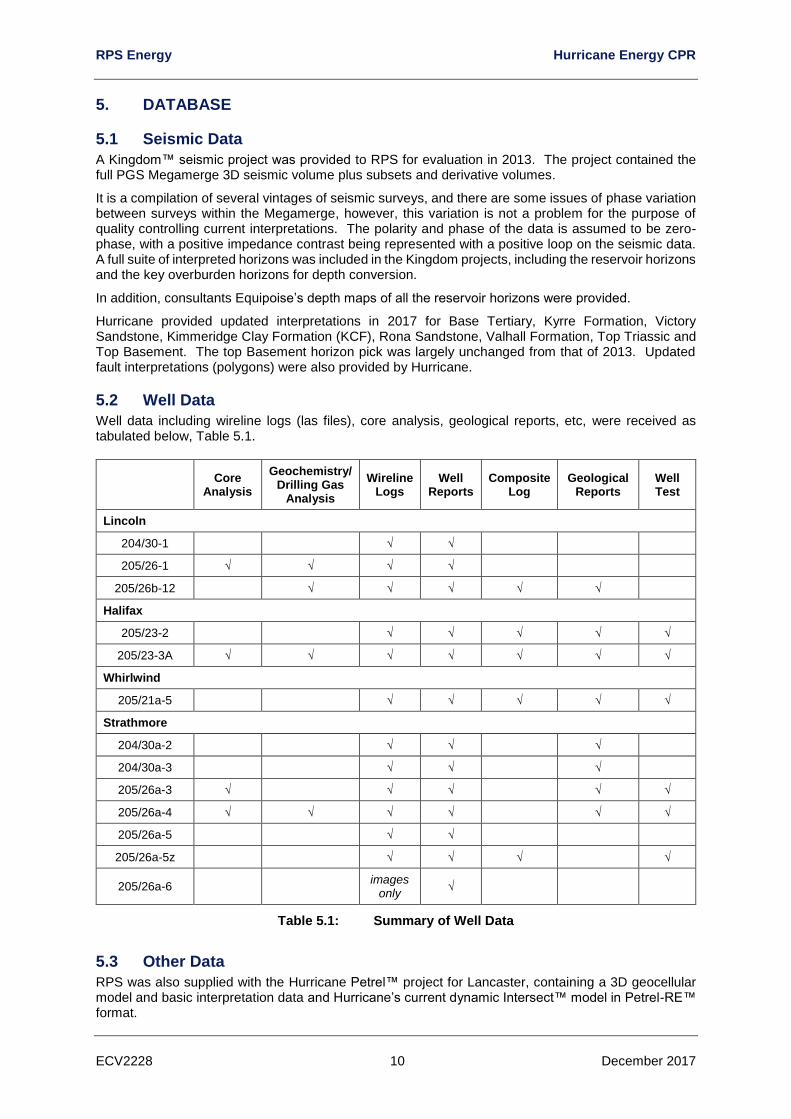
5.2 Well Data
Well data including wireline logs (las files), core analysis, geological reports, etc, were received as tabulated below, Table 5.1.
Core
Analysis
Geochemistry/ Drilling Gas
Analysis
Wireline Logs
Well Reports
Composite Log
Geological Reports
Well Test
Lincoln
204/30-1 √ √
205/26-1 √ √ √ √
205/26b-12 √ √ √ √ √
Halifax
205/23-2 √ √ √ √ √
205/23-3A √ √ √ √ √ √ √
Whirlwind
205/21a-5 √ √ √ √ √
Strathmore
204/30a-2 √ √ √
204/30a-3 √ √ √
205/26a-3 √ √ √ √ √
205/26a-4 √ √ √ √ √ √
205/26a-5 √ √
205/26a-5z √ √ √ √
205/26a-6 images
only √
Table 5.1: Summary of Well Data
5.3 Other Data
RPS was also supplied with the Hurricane Petrel™ project for Lancaster, containing a 3D geocellular model and basic interpretation data and Hurricane’s current dynamic Intersect™ model in Petrel-RE™ format.

RPS Energy Hurricane Energy CPR
ECV2228 11 December 2017
In addition, several reports and PowerPoint™ presentations made by staff and consultants were provided by Hurricane. These included:
• Hurricane – NMR interpretations for 205/26b-12 and 205/23-3A
• Hurricane – Report and PowerPoint presentations on NMR interpretations for 205/26b-12 and 205/23-3A from wireline logs and core based NMR based experiments. The report and presentations documented the comparison and general agreement of NMR porosity with porosity calculated from conventional density-neutron logs and covered fluid typing from NMR logs and Core NMR
A large number of additional reports, including fluid analysis, well test interpretation, VSPs (vertical seismic profiles) and reports were also supplied.
RPS Energy Hurricane Energy CPR
ECV2228 12 December 2017
6. TECHNICAL EVALUATION
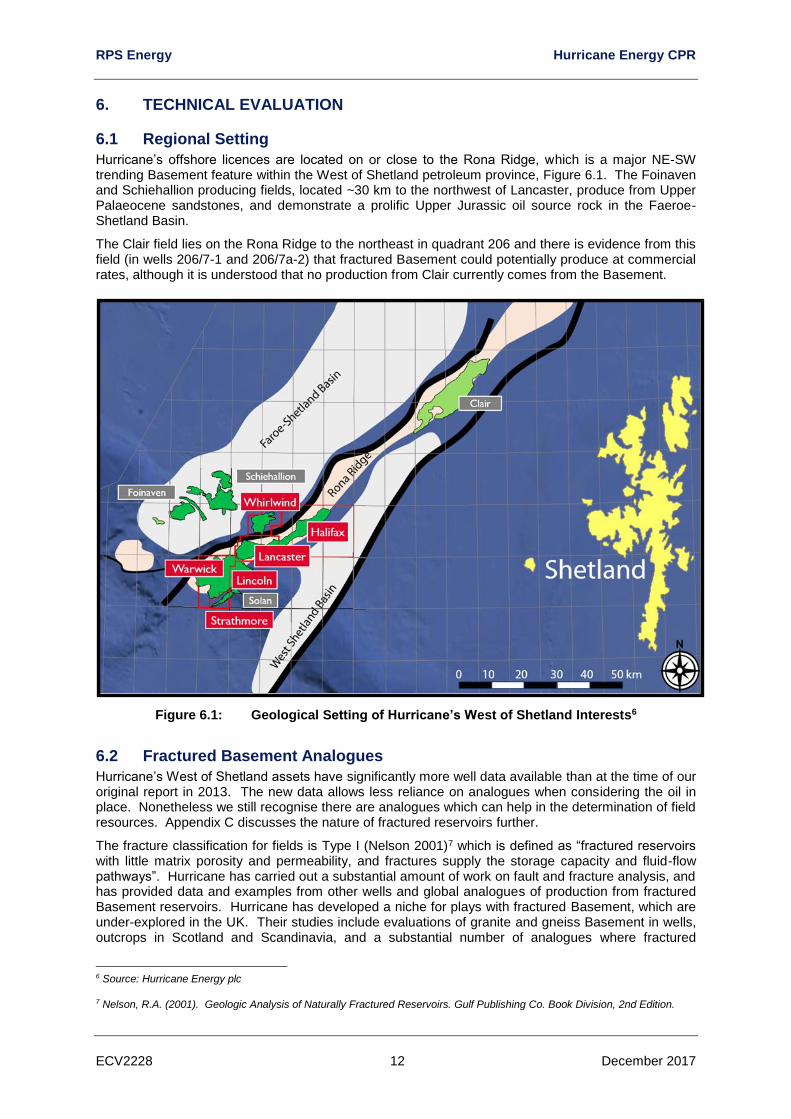
6.1 Regional Setting
Hurricane’s offshore licences are located on or close to the Rona Ridge, which is a major NE-SW trending Basement feature within the West of Shetland petroleum province, Figure 6.1. The Foinaven and Schiehallion producing fields, located ~30 km to the northwest of Lancaster, produce from Upper Palaeocene sandstones, and demonstrate a prolific Upper Jurassic oil source rock in the Faeroe-Shetland Basin.
The Clair field lies on the Rona Ridge to the northeast in quadrant 206 and there is evidence from this field (in wells 206/7-1 and 206/7a-2) that fractured Basement could potentially produce at commercial rates, although it is understood that no production from Clair currently comes from the Basement.
Figure 6.1: Geological Setting of Hurricane’s West of Shetland Interests6
6.2 Fractured Basement Analogues
Hurricane’s West of Shetland assets have significantly more well data available than at the time of our original report in 2013. The new data allows less reliance on analogues when considering the oil in place. Nonetheless we still recognise there are analogues which can help in the determination of field resources. Appendix C discusses the nature of fractured reservoirs further.
The fracture classification for fields is Type I (Nelson 2001)7 which is defined as “fractured reservoirs with little matrix porosity and permeability, and fractures supply the storage capacity and fluid-flow pathways”. Hurricane has carried out a substantial amount of work on fault and fracture analysis, and has provided data and examples from other wells and global analogues of production from fractured Basement reservoirs. Hurricane has developed a niche for plays with fractured Basement, which are under-explored in the UK. Their studies include evaluations of granite and gneiss Basement in wells, outcrops in Scotland and Scandinavia, and a substantial number of analogues where fractured
6 Source: Hurricane Energy plc
7 Nelson, R.A. (2001). Geologic Analysis of Naturally Fractured Reservoirs. Gulf Publishing Co. Book Division, 2nd Edition.

RPS Energy Hurricane Energy CPR
ECV2228 13 December 2017
Basement has proved highly productive. Globally, some of the most significant fractured Basement reservoirs include Aguila Nafoora (Libya), Bach Ho (Vietnam), Ruby (SE Vietnam), Rang Dong (Vietnam), La Paz (South America), Wangzhuang (China), West Puerto Chiquito (USA), and Zeit Bay (Egypt) (also see Appendix C).
In the West of Shetland, there are many drilled Basement sections with oil shows and there are three known examples (one to the southwest of the Foinaven field and two in Clair field) where a significant quantity of hydrocarbons has been produced from fractured Basement. The first is well 204/23-1, located just south west of the Foinaven field, in the Judd Basin. The well tested a 40 m section of fractured basement at a rate of 1.25 mmscfd gas with 117 bopd condensate and no water.
The other two examples are from the Clair field in block 206/7 where vertical well 206/7-1 tested 963 bopd, and said to be entirely from fractures. Well 206/7a-2 had a 530 m horizontal section, much of it through weathered basement. Drill Stem Test (DST) 1B conducted on this well flowed 2,110 bopd after acidisation over a flow period of 80 hours. A PLT log indicates that this production was from five fracture zones.
RPS Energy Hurricane Energy CPR
ECV2228 14 December 2017
7. ASSET SUMMARIES
7.1 Lincoln Discovery
Lincoln is located in Block 205/26b primarily within licence P.1368 South, though it looks to extend into P.2294 and lies on a Basement high in the Outer Rona Terrace, on the Rona Ridge about ~30 km to the southeast of the Schiehallion and Foinaven fields and about 9 km southwest of Lancaster (Figure 6.1). The Lincoln discovery well, 205/26b-12, was spudded on 8th November 2016. The well TD’d about 6 weeks later in the basement formation at 2,547 m MD (2,325 m TVDSS). A basement section of 803 m MD (668 m TVD) was penetrated.
7.1.1 Data Set
A 3D seismic dataset from the PGS Megamerge covers the discovery. The survey is extensive, covering all of Hurricane’s West of Shetland (WoS) assets. It is a compilation of several vintages of seismic surveys, and we have found that there are issues of phase variation between surveys within the Megamerge. However, over Lincoln this variation is not a problem for the purpose of quality controlling interpretations.
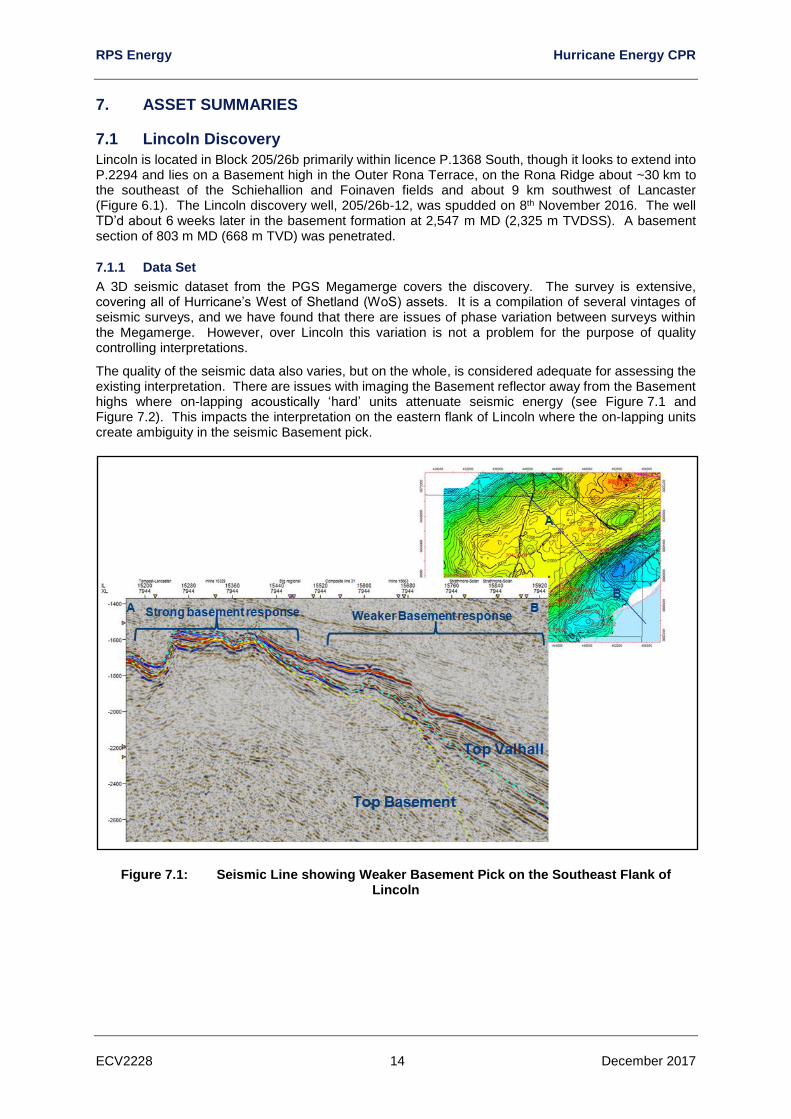
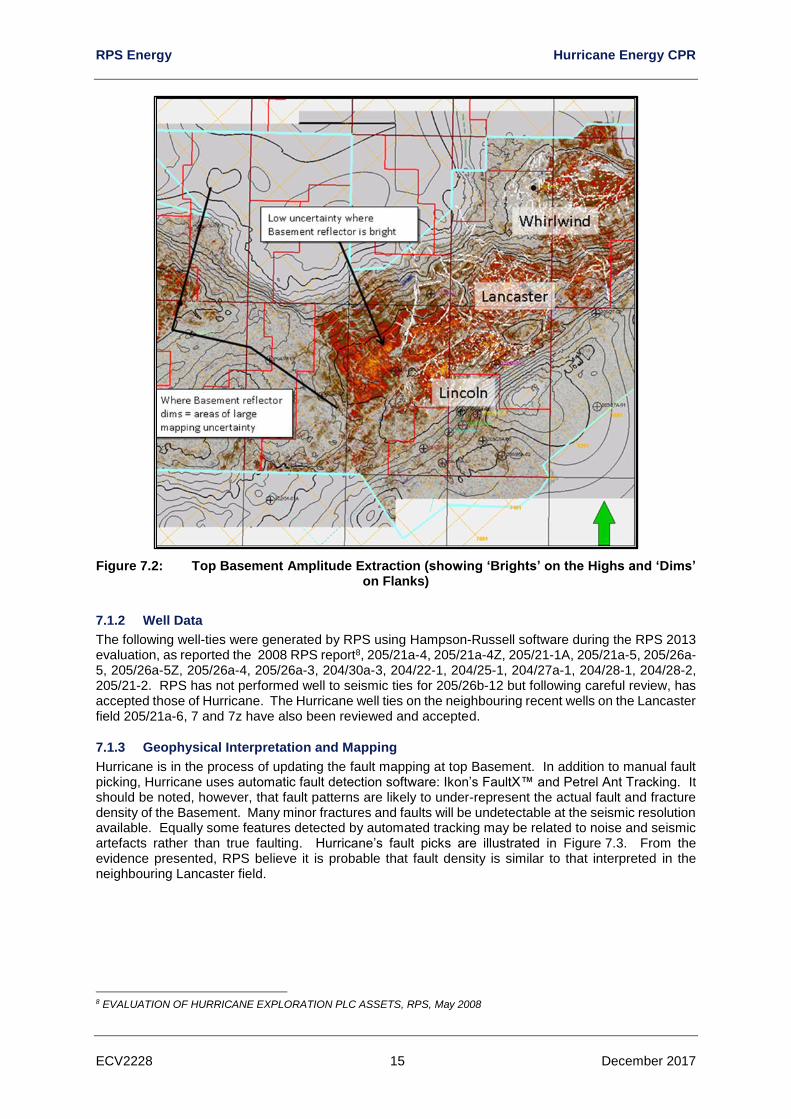
The quality of the seismic data also varies, but on the whole, is considered adequate for assessing the existing interpretation. There are issues with imaging the Basement reflector away from the Basement highs where on-lapping acoustically ‘hard’ units attenuate seismic energy (see Figure 7.1 and Figure 7.2). This impacts the interpretation on the eastern flank of Lincoln where the on-lapping units create ambiguity in the seismic Basement pick.
Figure 7.1: Seismic Line showing Weaker Basement Pick on the Southeast Flank of Lincoln
RPS Energy Hurricane Energy CPR
ECV2228 15 December 2017
Figure 7.2: Top Basement Amplitude Extraction (showing ‘Brights’ on the Highs and ‘Dims’ on Flanks)
7.1.2 Well Data
The following well-ties were generated by RPS using Hampson-Russell software during the RPS 2013 evaluation, as reported the 2008 RPS report8, 205/21a-4, 205/21a-4Z, 205/21-1A, 205/21a-5, 205/26a-5, 205/26a-5Z, 205/26a-4, 205/26a-3, 204/30a-3, 204/22-1, 204/25-1, 204/27a-1, 204/28-1, 204/28-2, 205/21-2. RPS has not performed well to seismic ties for 205/26b-12 but following careful review, has accepted those of Hurricane. The Hurricane well ties on the neighbouring recent wells on the Lancaster field 205/21a-6, 7 and 7z have also been reviewed and accepted.
7.1.3 Geophysical Interpretation and Mapping
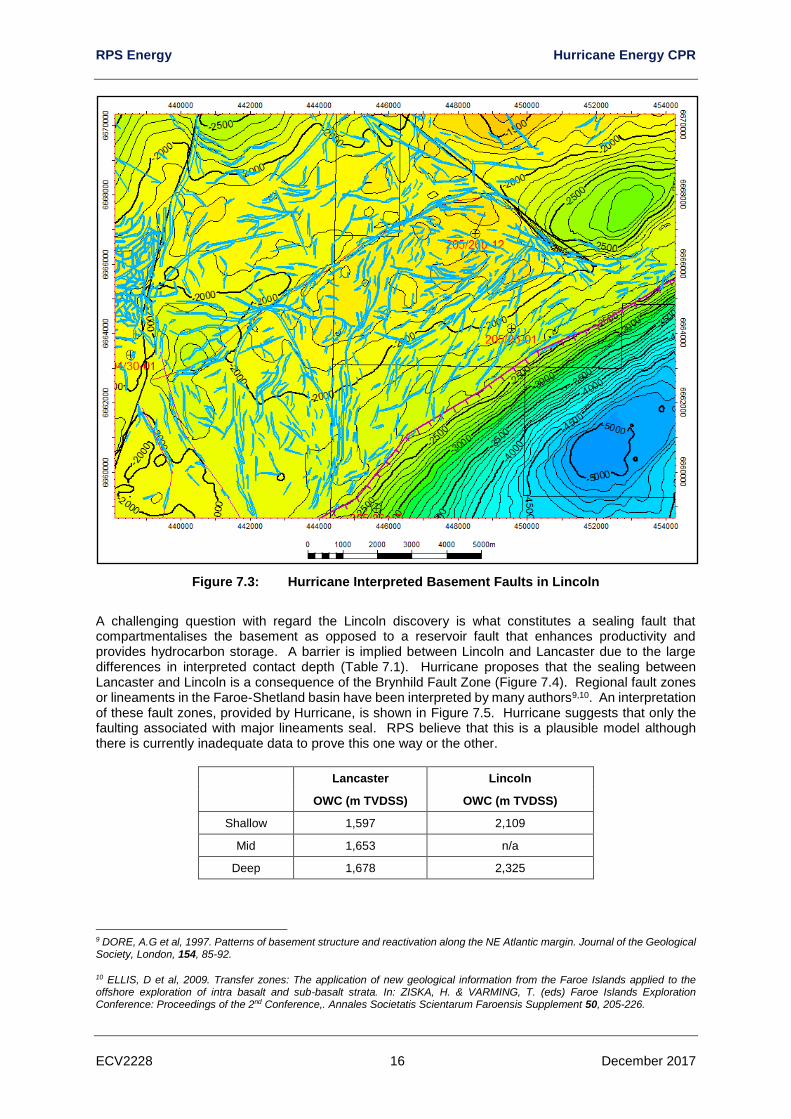
Hurricane is in the process of updating the fault mapping at top Basement. In addition to manual fault picking, Hurricane uses automatic fault detection software: Ikon’s FaultX™ and Petrel Ant Tracking. It should be noted, however, that fault patterns are likely to under-represent the actual fault and fracture density of the Basement. Many minor fractures and faults will be undetectable at the seismic resolution available. Equally some features detected by automated tracking may be related to noise and seismic artefacts rather than true faulting. Hurricane’s fault picks are illustrated in Figure 7.3. From the evidence presented, RPS believe it is probable that fault density is similar to that interpreted in the neighbouring Lancaster field.
8 EVALUATION OF HURRICANE EXPLORATION PLC ASSETS, RPS, May 2008
RPS Energy Hurricane Energy CPR
ECV2228 16 December 2017
Figure 7.3: Hurricane Interpreted Basement Faults in Lincoln
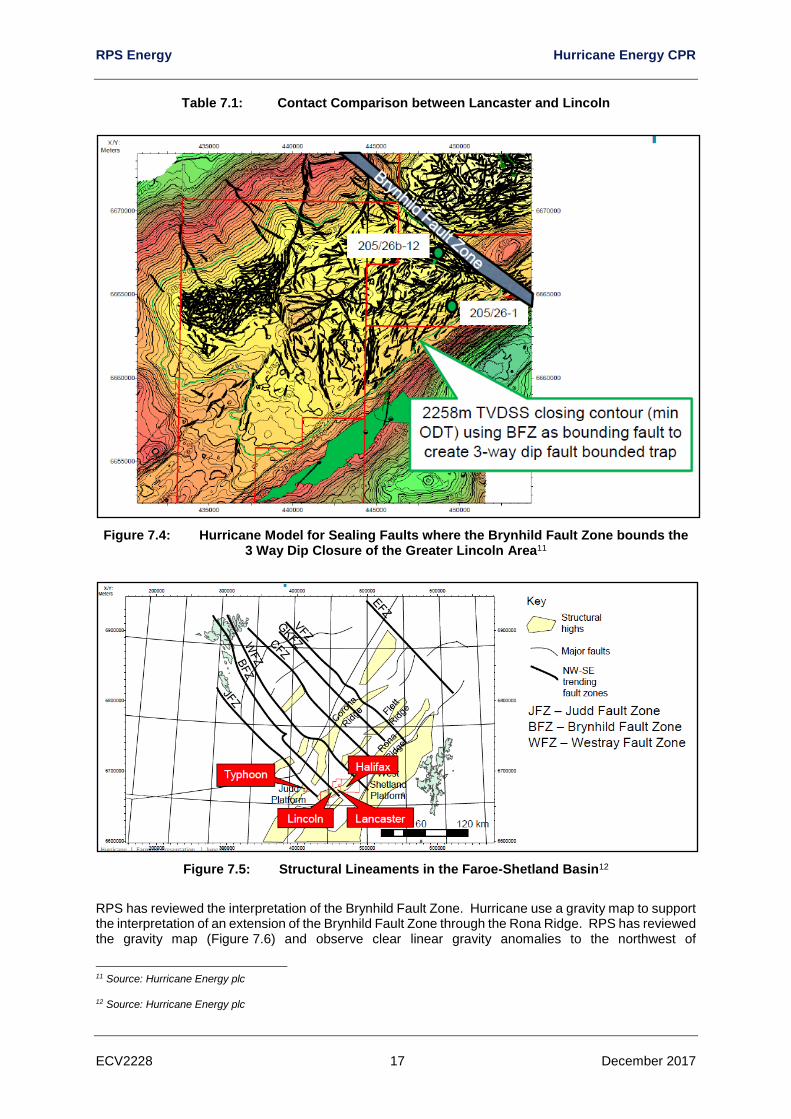
A challenging question with regard the Lincoln discovery is what constitutes a sealing fault that compartmentalises the basement as opposed to a reservoir fault that enhances productivity and provides hydrocarbon storage. A barrier is implied between Lincoln and Lancaster due to the large differences in interpreted contact depth (Table 7.1). Hurricane proposes that the sealing between Lancaster and Lincoln is a consequence of the Brynhild Fault Zone (Figure 7.4). Regional fault zones or lineaments in the Faroe-Shetland basin have been interpreted by many authors9,10. An interpretation of these fault zones, provided by Hurricane, is shown in Figure 7.5. Hurricane suggests that only the faulting associated with major lineaments seal. RPS believe that this is a plausible model although there is currently inadequate data to prove this one way or the other.
Lancaster Lincoln
OWC (m TVDSS) OWC (m TVDSS)
Shallow 1,597 2,109
Mid 1,653 n/a
Deep 1,678 2,325
9 DORE, A.G et al, 1997. Patterns of basement structure and reactivation along the NE Atlantic margin. Journal of the Geological Society, London, 154, 85-92.
10 ELLIS, D et al, 2009. Transfer zones: The application of new geological information from the Faroe Islands applied to the offshore exploration of intra basalt and sub-basalt strata. In: ZISKA, H. & VARMING, T. (eds) Faroe Islands Exploration Conference: Proceedings of the 2nd Conference,. Annales Societatis Scientarum Faroensis Supplement 50, 205-226.
RPS Energy Hurricane Energy CPR
ECV2228 17 December 2017
Table 7.1: Contact Comparison between Lancaster and Lincoln
Figure 7.4: Hurricane Model for Sealing Faults where the Brynhild Fault Zone bounds the 3 Way Dip Closure of the Greater Lincoln Area11
Figure 7.5: Structural Lineaments in the Faroe-Shetland Basin12
RPS has reviewed the interpretation of the Brynhild Fault Zone. Hurricane use a gravity map to support the interpretation of an extension of the Brynhild Fault Zone through the Rona Ridge. RPS has reviewed the gravity map (Figure 7.6) and observe clear linear gravity anomalies to the northwest of
11 Source: Hurricane Energy plc
12 Source: Hurricane Energy plc
RPS Energy Hurricane Energy CPR
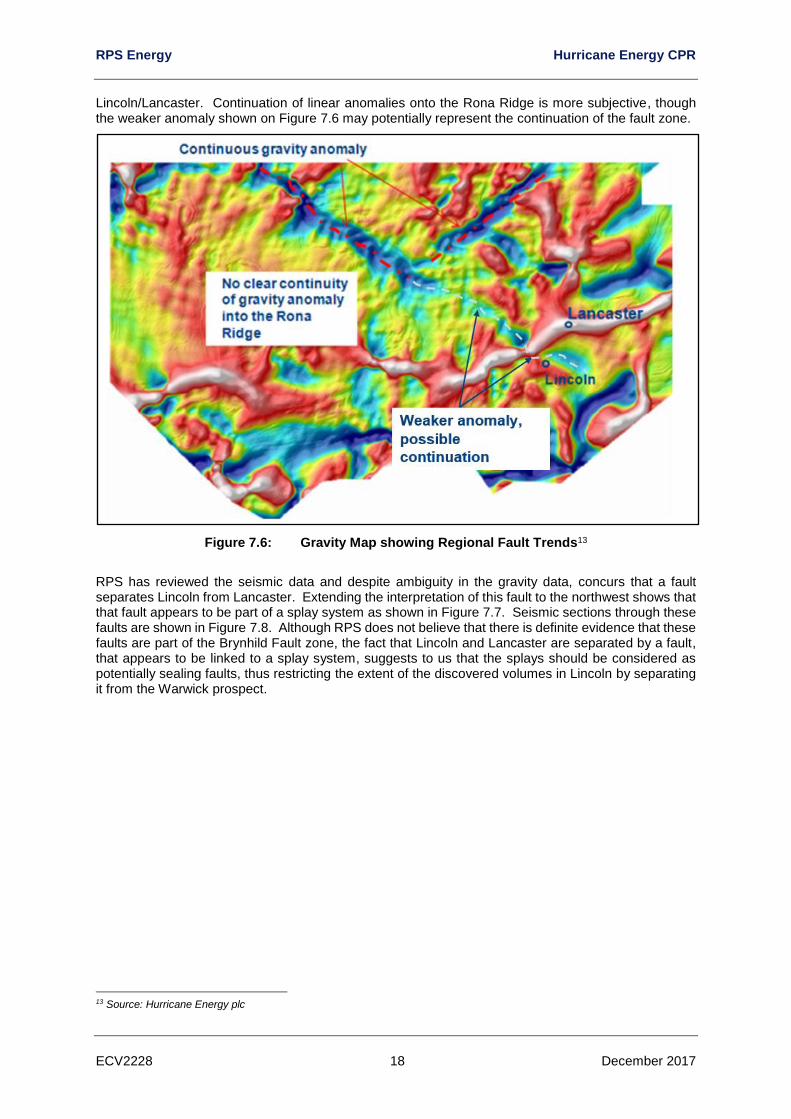
ECV2228 18 December 2017
Lincoln/Lancaster. Continuation of linear anomalies onto the Rona Ridge is more subjective, though the weaker anomaly shown on Figure 7.6 may potentially represent the continuation of the fault zone.
Figure 7.6: Gravity Map showing Regional Fault Trends13
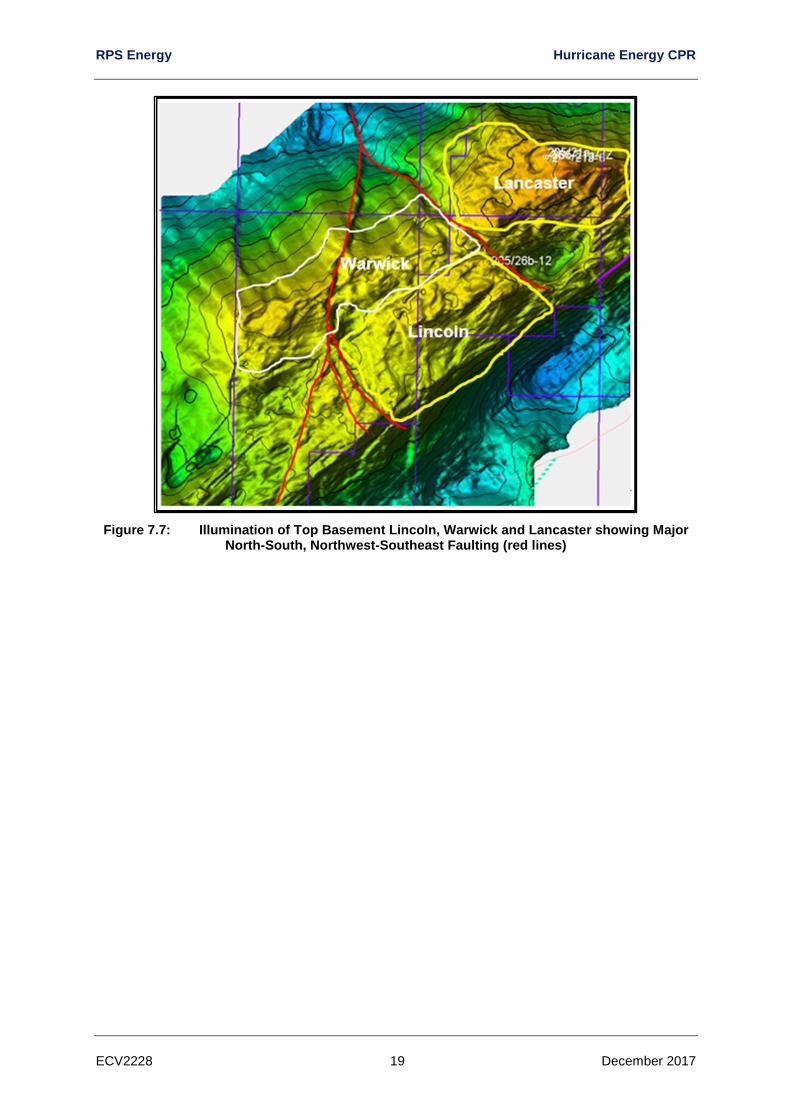
RPS has reviewed the seismic data and despite ambiguity in the gravity data, concurs that a fault separates Lincoln from Lancaster. Extending the interpretation of this fault to the northwest shows that that fault appears to be part of a splay system as shown in Figure 7.7. Seismic sections through these faults are shown in Figure 7.8. Although RPS does not believe that there is definite evidence that these faults are part of the Brynhild Fault zone, the fact that Lincoln and Lancaster are separated by a fault, that appears to be linked to a splay system, suggests to us that the splays should be considered as potentially sealing faults, thus restricting the extent of the discovered volumes in Lincoln by separating it from the Warwick prospect.
13 Source: Hurricane Energy plc
RPS Energy Hurricane Energy CPR
ECV2228 19 December 2017
Figure 7.7: Illumination of Top Basement Lincoln, Warwick and Lancaster showing Major North-South, Northwest-Southeast Faulting (red lines)
RPS Energy Hurricane Energy CPR
ECV2228 20 December 2017
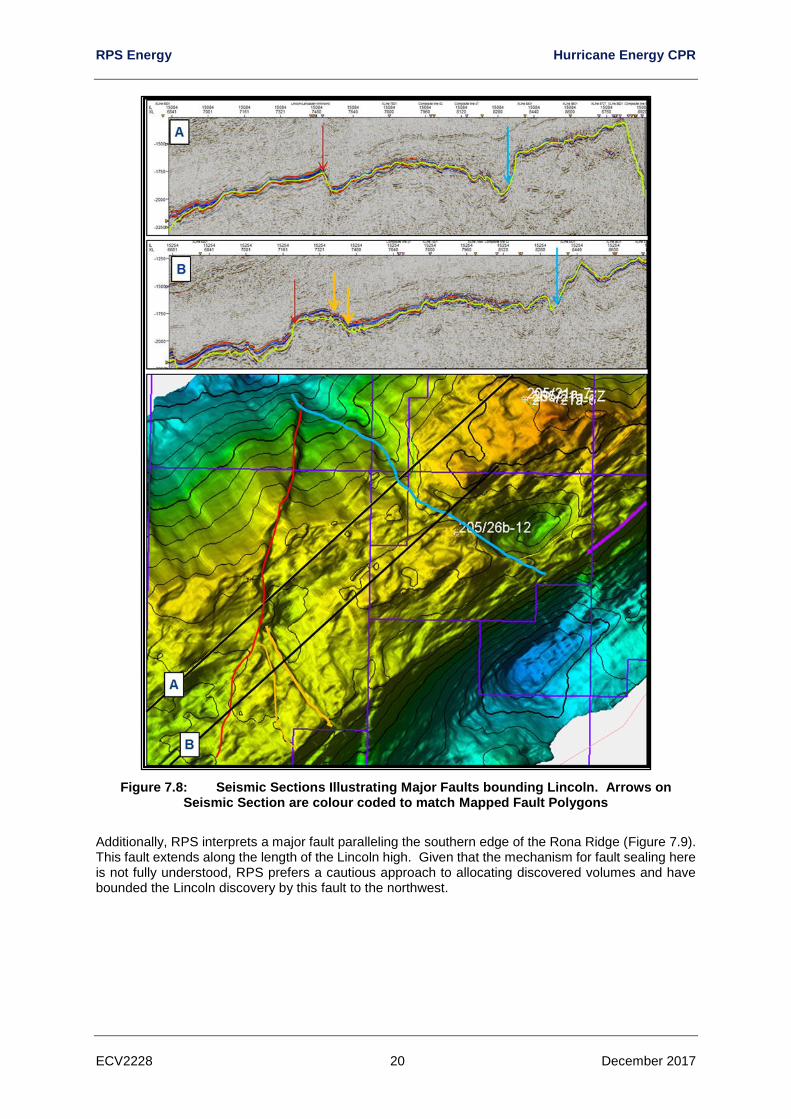
Figure 7.8: Seismic Sections Illustrating Major Faults bounding Lincoln. Arrows on Seismic Section are colour coded to match Mapped Fault Polygons
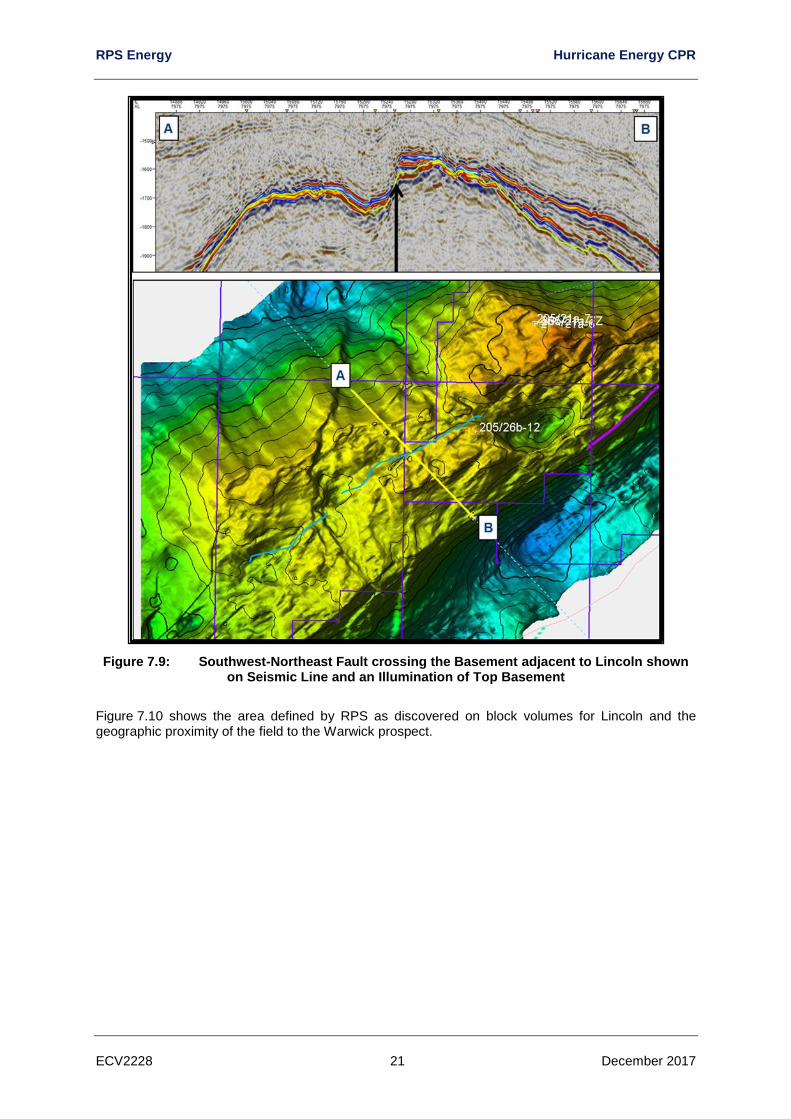
Additionally, RPS interprets a major fault paralleling the southern edge of the Rona Ridge (Figure 7.9). This fault extends along the length of the Lincoln high. Given that the mechanism for fault sealing here is not fully understood, RPS prefers a cautious approach to allocating discovered volumes and have bounded the Lincoln discovery by this fault to the northwest.
RPS Energy Hurricane Energy CPR
ECV2228 21 December 2017
Figure 7.9: Southwest-Northeast Fault crossing the Basement adjacent to Lincoln shown on Seismic Line and an Illumination of Top Basement
Figure 7.10 shows the area defined by RPS as discovered on block volumes for Lincoln and the geographic proximity of the field to the Warwick prospect.
RPS Energy Hurricane Energy CPR
ECV2228 22 December 2017
Figure 7.10: Top Basement Depth Structure showing On-Block (P2294 and P1368 S) Lincoln Field Area for Volumetric Calculations bounded by Blue Polygon (Warwick Prospect
Volumetric Calculations constrained by Red Polygon)
7.1.4 Depth Conversion
The depth conversion methodology employed by Hurricane has remained unchanged since the 2011 RPS report. It is based on a updated version of a 2007 Equipoise depth converison model.
The updated model uses a 4-layer approach as follows:
• Sea level to sea bed - constant interval velocity of 1,480 ms-1.
• Sea bed to Base Tertiary - V0+kZ function using a constant k of 0.5732 and a constant V0 of 1,670 ms-1.
• Base Tertiary to Valhall/Basement - V0+kZ function using a constant k of 0.3867 and a constant V0 of 1,945 ms-1.
• Valhall to Basement - constant interval velocity of 3,834 ms-1.
This depth conversion gave a reasonable prognosis for top Basement, within 17 m of prognosis of top Basement for 205/26b-12. RPS does not believe an update of the depth conversion methodology is required at this stage.
7.1.5 Basement Reservoir – Reservoir Properties
Data gathered from the Basement reservoir encountered in the Lincoln well 205/26b-12 would suggest very similar facies and, more importantly, fracture development to that described in the neighbouring Lancaster field.
As with Lancaster, the key reservoir property that impacts volume estimates is porosity. The porosity model, based on the Bateman–Konen equation and relying on the density/neutron logs, which has been utilised for 205/26b-12 is identical to that used previously by Hurricane in the Lancaster field. Again as with the Lancaster wells, the Lincoln well encountered a basement section which was essentially composed of tonalite with occasional dolerite zones. RPS compared the Hurricane results, in 205/26b-12, with its own estimates of density/neutron crossplot porosity and porosity from the density log using
RPS Energy Hurricane Energy CPR
ECV2228 23 December 2017
a variable matrix density. The variable matrix density was based on the density-neutron separation. Hurricane porosity results were close to the RPS estimates and deemed to be acceptable. Also, the values were very close to the porosity values computed previously in the Lancaster wells. Further corroboration of the porosity values utilised is noted from the provided NMR which demonstrate a good match to BK- derived porosities at both Lancaster and Lincoln.
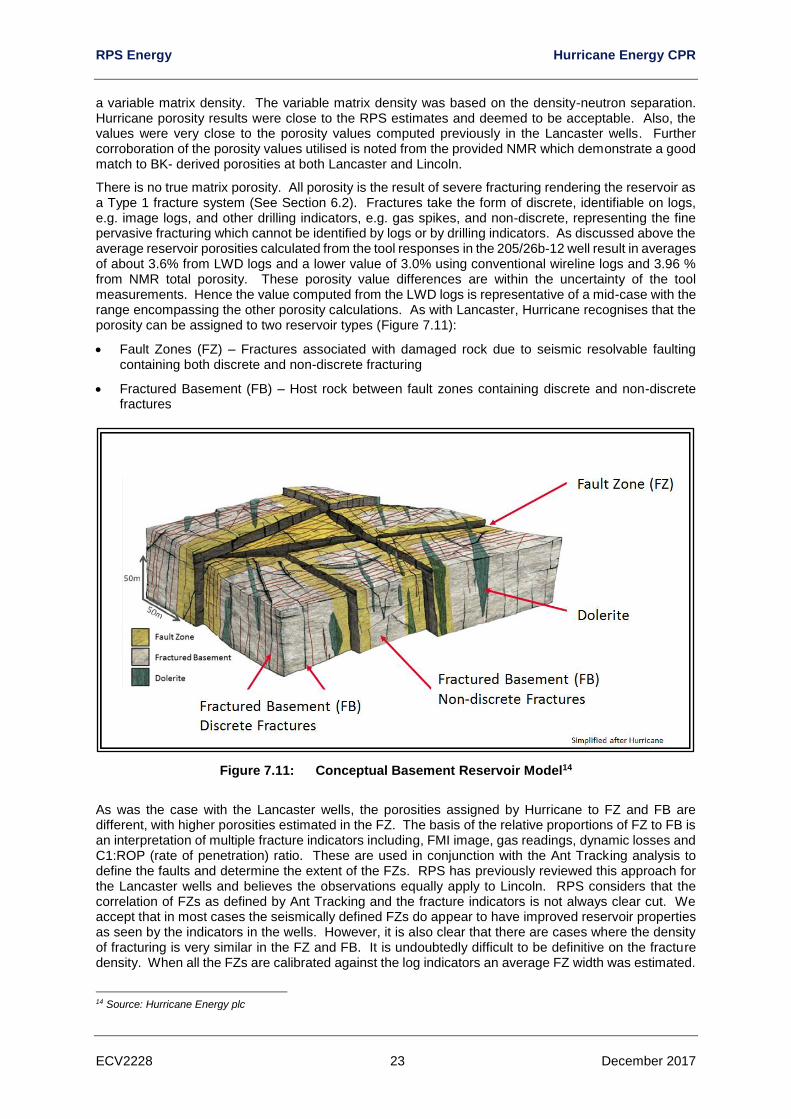
There is no true matrix porosity. All porosity is the result of severe fracturing rendering the reservoir as a Type 1 fracture system (See Section 6.2). Fractures take the form of discrete, identifiable on logs, e.g. image logs, and other drilling indicators, e.g. gas spikes, and non-discrete, representing the fine pervasive fracturing which cannot be identified by logs or by drilling indicators. As discussed above the average reservoir porosities calculated from the tool responses in the 205/26b-12 well result in averages of about 3.6% from LWD logs and a lower value of 3.0% using conventional wireline logs and 3.96 % from NMR total porosity. These porosity value differences are within the uncertainty of the tool measurements. Hence the value computed from the LWD logs is representative of a mid-case with the range encompassing the other porosity calculations. As with Lancaster, Hurricane recognises that the porosity can be assigned to two reservoir types (Figure 7.11):
• Fault Zones (FZ) – Fractures associated with damaged rock due to seismic resolvable faulting containing both discrete and non-discrete fracturing
• Fractured Basement (FB) – Host rock between fault zones containing discrete and non-discrete fractures
Figure 7.11: Conceptual Basement Reservoir Model14
As was the case with the Lancaster wells, the porosities assigned by Hurricane to FZ and FB are different, with higher porosities estimated in the FZ. The basis of the relative proportions of FZ to FB is an interpretation of multiple fracture indicators including, FMI image, gas readings, dynamic losses and C1:ROP (rate of penetration) ratio. These are used in conjunction with the Ant Tracking analysis to define the faults and determine the extent of the FZs. RPS has previously reviewed this approach for the Lancaster wells and believes the observations equally apply to Lincoln. RPS considers that the correlation of FZs as defined by Ant Tracking and the fracture indicators is not always clear cut. We accept that in most cases the seismically defined FZs do appear to have improved reservoir properties as seen by the indicators in the wells. However, it is also clear that there are cases where the density of fracturing is very similar in the FZ and FB. It is undoubtedly difficult to be definitive on the fracture density. When all the FZs are calibrated against the log indicators an average FZ width was estimated.
14 Source: Hurricane Energy plc
RPS Energy Hurricane Energy CPR
ECV2228 24 December 2017
This was then taken into the fault model with average FZ thickness applied to all the seismically defined faults away from well control. Within the model this approach results in a proportion of the model defined as FZ with the remainder defined as FB. RPS accepts that Hurricane’s approach to define fracture distribution represents one reasonable realisation and this will be refined as new data becomes available.
To capture the uncertainty associated with the proportion of FZs to the background FB we used a range of ratios of FZ:FB as detailed in Table 7.2. Clearly when treated probabilistically a strong negative dependency is required i.e. if FZ proportion low FB proportion will be high.
Fault Zone (FZ)
proportion
Fractured Basement (FB)
proportion Rationale
Low (%) 40 60 Hurricane estimate of proportions accepted as the mid case. To capture uncertainty +/- 10% has been adopted as a reasonable variation on the Best case
Best (%) 50 50
High (%) 60 40
Table 7.2: Lincoln FZ:FB Proportion Range
From our review of Hurricane’s log analysis, we have derived a porosity range for both the FZ and FB for Lincoln. Table 7.3 summarises the ranges used with our rationale.
Fault Zone
(FZ) Porosity
Fractured Basement (FB)
Porosity Rationale
Low (%) 2.1 1.3 Adjusted from original image log work conducted by Eriksfiord.15 on the Lancaster wells
Best (%) 4.4 2.9 Based on log analysis both conventional and NMR
High (%) 6.0 5.0 Assumes higher porosity associated with major (sub regional) fault zones
Table 7.3: Lincoln Porosity Ranges
Water saturation, Sw, is particularly difficult to estimate as it cannot be reliably calculated from logs. RPS considers that irreducible water saturation, Swi, in fractures will be very low due to weak capillary forces. This will be particularly true for the FZs where a range of very low average Sw’s has been adopted, as shown in Table 7.4. For the FB a slightly higher rage of Sw’s has be used to reflect the probable higher Swi held in the very fine non-discrete fractures. In both cases it is considered that the transition zone height will be small with little impact on the average Sw.
Fault Zone
(FZ) Water Saturation
Fractured Basement (FB)
Water Saturation Rationale
Low (%) 1 5 Difficult to estimate where Sw cannot be calculated from logs. Adopted a large range of reasonable values to reflect high permeability large fractures to lower permeability small scale fractures
Best (%) 5 10
High (%) 10 15
Table 7.4: Lincoln Water Saturation Range
15 Quality of fractured basement reservoir in Lancaster prospect, May 2011
RPS Energy Hurricane Energy CPR
ECV2228 25 December 2017
7.1.6 Basement Reservoir – Contacts
The definition of the Lincoln field OWC range, Table 7.5 has been assessed by reviewing the data from the 205/26b-12 well. With lack of pressure data reliance was placed on mudlogging and the GC Tracer™ results.
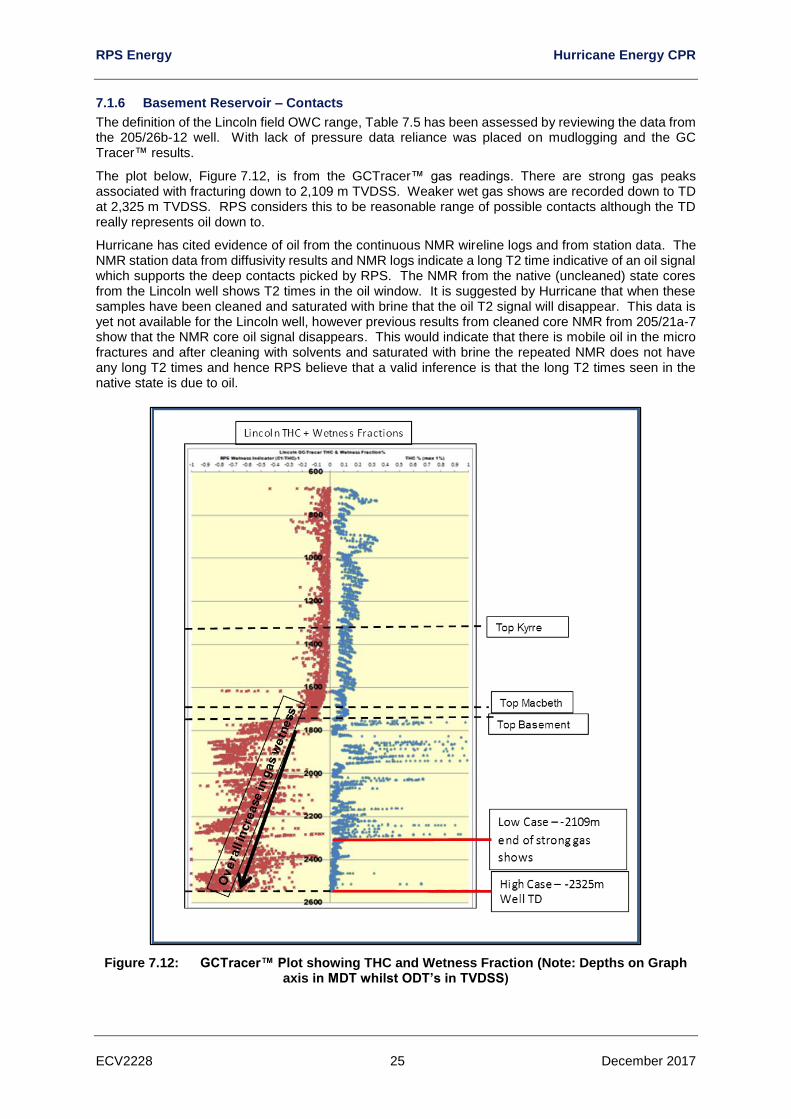
The plot below, Figure 7.12, is from the GCTracer™ gas readings. There are strong gas peaks associated with fracturing down to 2,109 m TVDSS. Weaker wet gas shows are recorded down to TD at 2,325 m TVDSS. RPS considers this to be reasonable range of possible contacts although the TD really represents oil down to.
Hurricane has cited evidence of oil from the continuous NMR wireline logs and from station data. The NMR station data from diffusivity results and NMR logs indicate a long T2 time indicative of an oil signal which supports the deep contacts picked by RPS. The NMR from the native (uncleaned) state cores from the Lincoln well shows T2 times in the oil window. It is suggested by Hurricane that when these samples have been cleaned and saturated with brine that the oil T2 signal will disappear. This data is yet not available for the Lincoln well, however previous results from cleaned core NMR from 205/21a-7 show that the NMR core oil signal disappears. This would indicate that there is mobile oil in the micro fractures and after cleaning with solvents and saturated with brine the repeated NMR does not have any long T2 times and hence RPS believe that a valid inference is that the long T2 times seen in the native state is due to oil.
Figure 7.12: GCTracer™ Plot showing THC and Wetness Fraction (Note: Depths on Graph axis in MDT whilst ODT’s in TVDSS)
RPS Energy Hurricane Energy CPR
ECV2228 26 December 2017
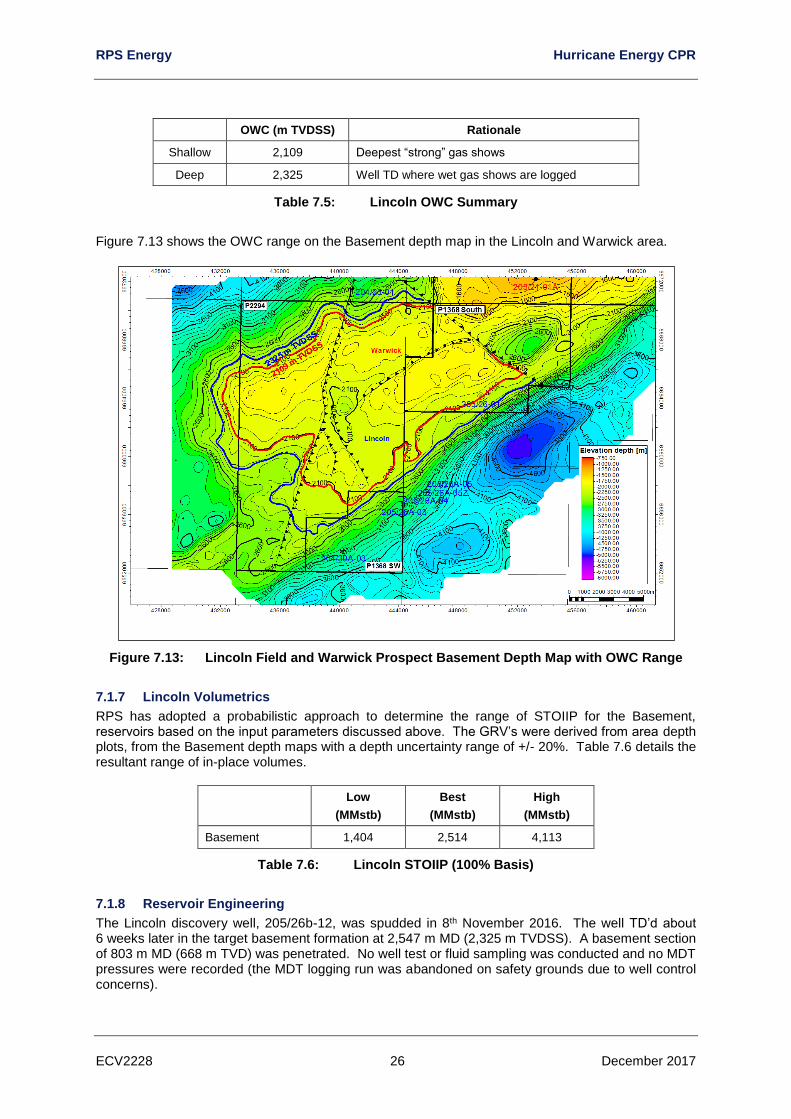
OWC (m TVDSS) Rationale
Shallow 2,109 Deepest “strong” gas shows
Deep 2,325 Well TD where wet gas shows are logged
Table 7.5: Lincoln OWC Summary
Figure 7.13 shows the OWC range on the Basement depth map in the Lincoln and Warwick area.
Figure 7.13: Lincoln Field and Warwick Prospect Basement Depth Map with OWC Range
7.1.7 Lincoln Volumetrics
RPS has adopted a probabilistic approach to determine the range of STOIIP for the Basement, reservoirs based on the input parameters discussed above. The GRV’s were derived from area depth plots, from the Basement depth maps with a depth uncertainty range of +/- 20%. Table 7.6 details the resultant range of in-place volumes.
Low
(MMstb)
Best
(MMstb)
High
(MMstb)
Basement 1,404 2,514 4,113
Table 7.6: Lincoln STOIIP (100% Basis)
7.1.8 Reservoir Engineering
The Lincoln discovery well, 205/26b-12, was spudded in 8th November 2016. The well TD’d about 6 weeks later in the target basement formation at 2,547 m MD (2,325 m TVDSS). A basement section of 803 m MD (668 m TVD) was penetrated. No well test or fluid sampling was conducted and no MDT pressures were recorded (the MDT logging run was abandoned on safety grounds due to well control concerns).
RPS Energy Hurricane Energy CPR
ECV2228 27 December 2017
7.1.8.1 PVT/Fluids Data
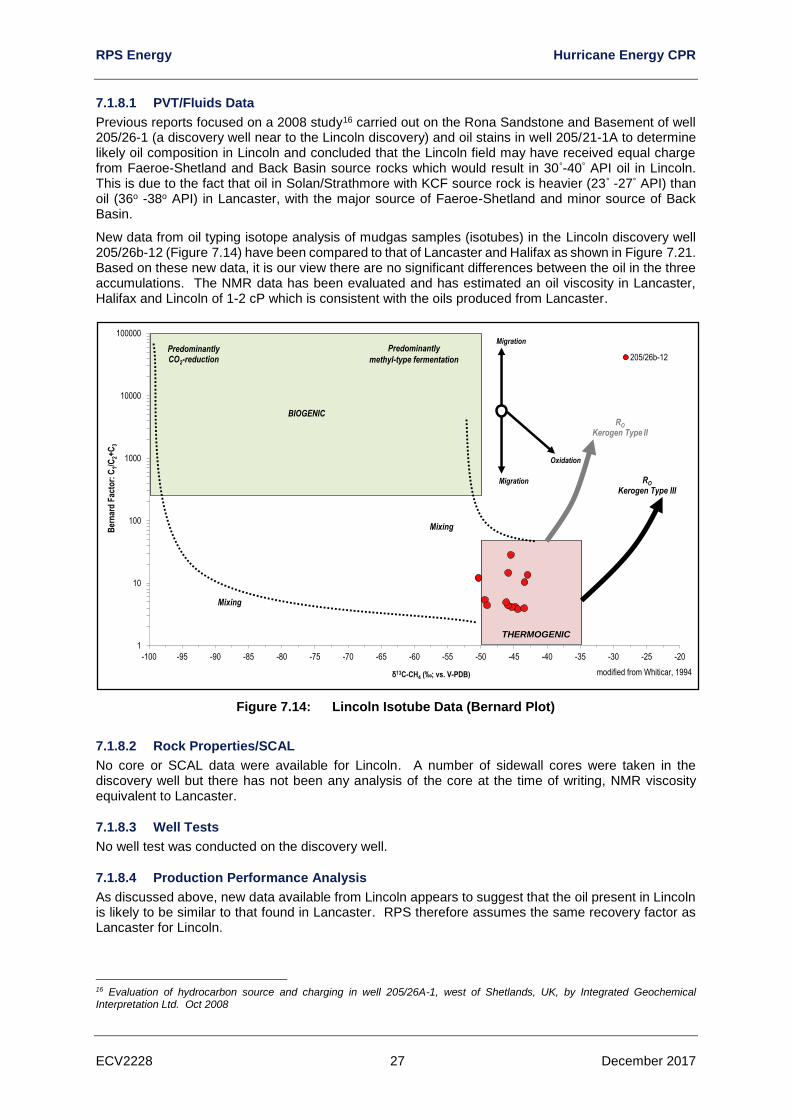
Previous reports focused on a 2008 study16 carried out on the Rona Sandstone and Basement of well 205/26-1 (a discovery well near to the Lincoln discovery) and oil stains in well 205/21-1A to determine likely oil composition in Lincoln and concluded that the Lincoln field may have received equal charge from Faeroe-Shetland and Back Basin source rocks which would result in 30°-40° API oil in Lincoln. This is due to the fact that oil in Solan/Strathmore with KCF source rock is heavier (23° -27° API) than oil (36o -38o API) in Lancaster, with the major source of Faeroe-Shetland and minor source of Back Basin.
New data from oil typing isotope analysis of mudgas samples (isotubes) in the Lincoln discovery well 205/26b-12 (Figure 7.14) have been compared to that of Lancaster and Halifax as shown in Figure 7.21. Based on these new data, it is our view there are no significant differences between the oil in the three accumulations. The NMR data has been evaluated and has estimated an oil viscosity in Lancaster, Halifax and Lincoln of 1-2 cP which is consistent with the oils produced from Lancaster.
Figure 7.14: Lincoln Isotube Data (Bernard Plot)
7.1.8.2 Rock Properties/SCAL
No core or SCAL data were available for Lincoln. A number of sidewall cores were taken in the discovery well but there has not been any analysis of the core at the time of writing, NMR viscosity equivalent to Lancaster.
7.1.8.3 Well Tests
No well test was conducted on the discovery well.
7.1.8.4 Production Performance Analysis
As discussed above, new data available from Lincoln appears to suggest that the oil present in Lincoln is likely to be similar to that found in Lancaster. RPS therefore assumes the same recovery factor as Lancaster for Lincoln.
16 Evaluation of hydrocarbon source and charging in well 205/26A-1, west of Shetlands, UK, by Integrated Geochemical Interpretation Ltd. Oct 2008
1
10
100
1000
10000
100000
-100 -95 -90 -85 -80 -75 -70 -65 -60 -55 -50 -45 -40 -35 -30 -25 -20
Ber
nar
d F
acto
r: C
1/C
2+C
3
δ13C-CH4 (‰; vs. V-PDB)
205/26b-12
modified from Whiticar, 1994
PredominantlyCO2-reduction
Predominantly
methyl-type fermentation
BIOGENIC
THERMOGENIC
Migration
Migration
Oxidation
RO
Kerogen Type II
RO
Kerogen Type III
Mixing
Mixing
RPS Energy Hurricane Energy CPR
ECV2228 28 December 2017
7.1.9 Recoverable Volumes
Hurricane considers that any development of Lincoln would be undertaken in a similar manner to that proposed for Lancaster and produced via subsea tieback to the Lancaster surface facilities. As Lincoln is a discovery, RPS classify the volumes as Contingent Resources, Development Unclarified (see Section 4.2).
The production forecasts for low best and high case Contingent Resources are shown in Table 7.7. The Contingent Resources listed are technically recoverable estimates, not subjected to an economic limit test as no development plan has been presented.
Resource
STOIIP (MMstb)
Recovery Factor (%)
Contingent Resources (MMstb)
P90 P50 P10 P90 P50 P10 1C 2C 3C
Basement 1,404 2,514 4,113 10 22.5 35 140.0 565.7 1,439.6
Table 7.7: Lincoln Contingent Resources, Development Unclarified
7.1.10 Lincoln Risk Assessment
Following the drilling of well 205/26b-12, Lincoln can now be classified as a discovery and, as such, is assigned a significant quantity of Contingent Resources (Development Unclarified). The rationale for assigning discovery status is that a combination of mudlogging, and wireline logging data have satisfactorily demonstrated the presence of both a hydrocarbon column and effective reservoir porosity. The discovered hydrocarbons are potentially movable as evidenced by the probable presence of a pervasive hydrodynamic fracture network and the apparent permeability of the formation as suggested by drilling losses. Further evidence of permeability is noted from wireline resistivity invasion profiles, C1/ROP character, and from NMR station stops. The associated contingent resources are considered to be significant in that they are potentially commercial.
The chance of development of Lincoln is contingent on developing a more thorough understanding of the following uncertainties:
• Fluid properties
• Fracture propensity and distribution
• Interconnectivity of fracture network (pending interference testing)
• OWC depth
• Demonstration of commercial flow rates from a well test
• Water production potential and subsequent water handling requirements
• Full field development plan (number of wells required, drill centre locations)
• The Lancaster development which could potentially be considered to be the host facility for Lincoln hydrocarbons
The Lincoln discovery requires further appraisal to address these uncertainties.
RPS Energy Hurricane Energy CPR
ECV2228 29 December 2017
7.2 Halifax Discovery
The Halifax field is a discovery located in blocks 205/22b, 205/23 and 205/24 within P.2308. Seismic interpretation indicates the presence of a well-defined fault network. Well 205/23-2 was drilled by Arco, the previous Operator, in 1998 and encountered oil and gas shows in sandstones immediately above the basement. Encouraged by their analysis of basement cuttings from this well, Hurricane drilled well 205/23-3A in early 2017, completing operations in March 2017.
7.2.1 Data Set
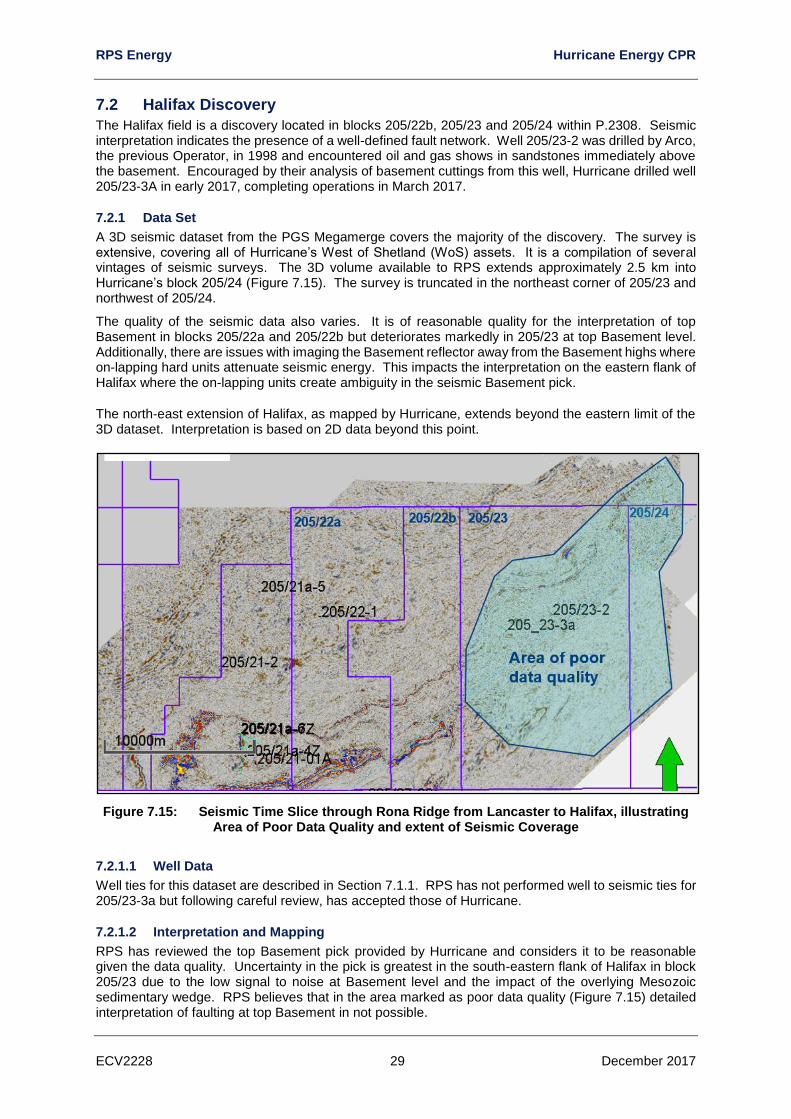
A 3D seismic dataset from the PGS Megamerge covers the majority of the discovery. The survey is extensive, covering all of Hurricane’s West of Shetland (WoS) assets. It is a compilation of several vintages of seismic surveys. The 3D volume available to RPS extends approximately 2.5 km into Hurricane’s block 205/24 (Figure 7.15). The survey is truncated in the northeast corner of 205/23 and northwest of 205/24.
The quality of the seismic data also varies. It is of reasonable quality for the interpretation of top Basement in blocks 205/22a and 205/22b but deteriorates markedly in 205/23 at top Basement level. Additionally, there are issues with imaging the Basement reflector away from the Basement highs where on-lapping hard units attenuate seismic energy. This impacts the interpretation on the eastern flank of Halifax where the on-lapping units create ambiguity in the seismic Basement pick.
The north-east extension of Halifax, as mapped by Hurricane, extends beyond the eastern limit of the 3D dataset. Interpretation is based on 2D data beyond this point.
Figure 7.15: Seismic Time Slice through Rona Ridge from Lancaster to Halifax, illustrating Area of Poor Data Quality and extent of Seismic Coverage
7.2.1.1 Well Data
Well ties for this dataset are described in Section 7.1.1. RPS has not performed well to seismic ties for 205/23-3a but following careful review, has accepted those of Hurricane.
7.2.1.2 Interpretation and Mapping
RPS has reviewed the top Basement pick provided by Hurricane and considers it to be reasonable given the data quality. Uncertainty in the pick is greatest in the south-eastern flank of Halifax in block 205/23 due to the low signal to noise at Basement level and the impact of the overlying Mesozoic sedimentary wedge. RPS believes that in the area marked as poor data quality (Figure 7.15) detailed interpretation of faulting at top Basement in not possible.
RPS Energy Hurricane Energy CPR
ECV2228 30 December 2017
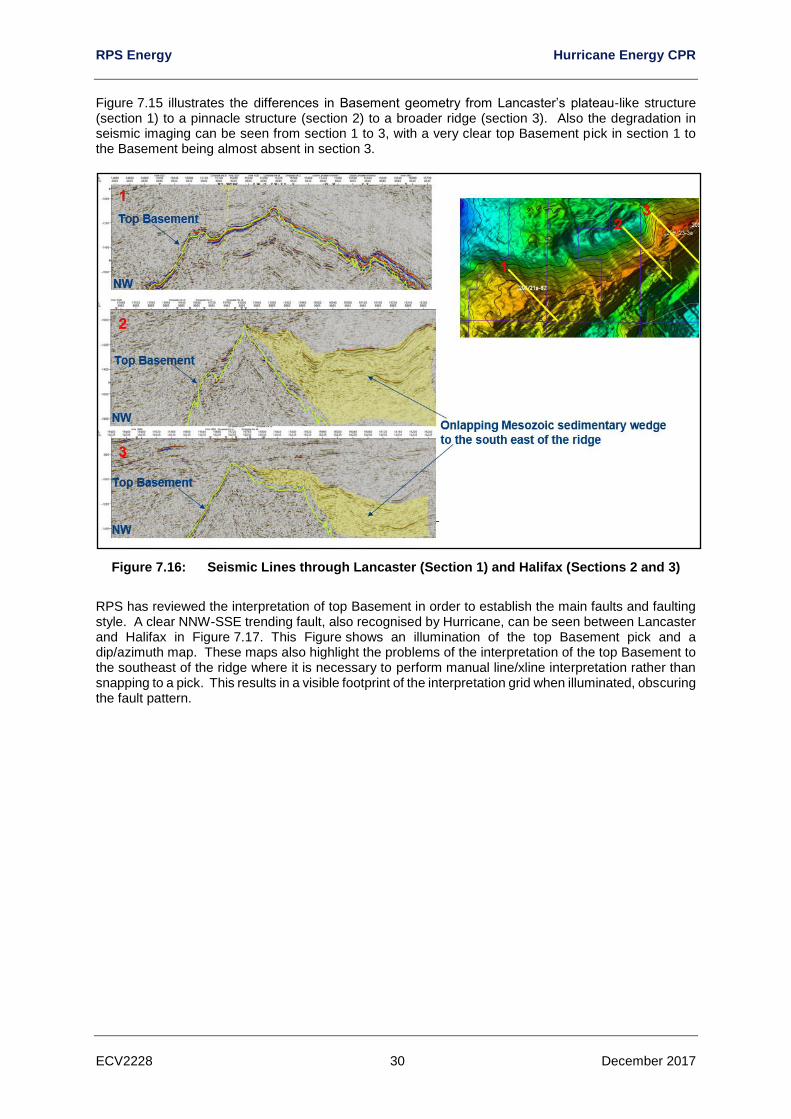
Figure 7.15 illustrates the differences in Basement geometry from Lancaster’s plateau-like structure (section 1) to a pinnacle structure (section 2) to a broader ridge (section 3). Also the degradation in seismic imaging can be seen from section 1 to 3, with a very clear top Basement pick in section 1 to the Basement being almost absent in section 3.
Figure 7.16: Seismic Lines through Lancaster (Section 1) and Halifax (Sections 2 and 3)
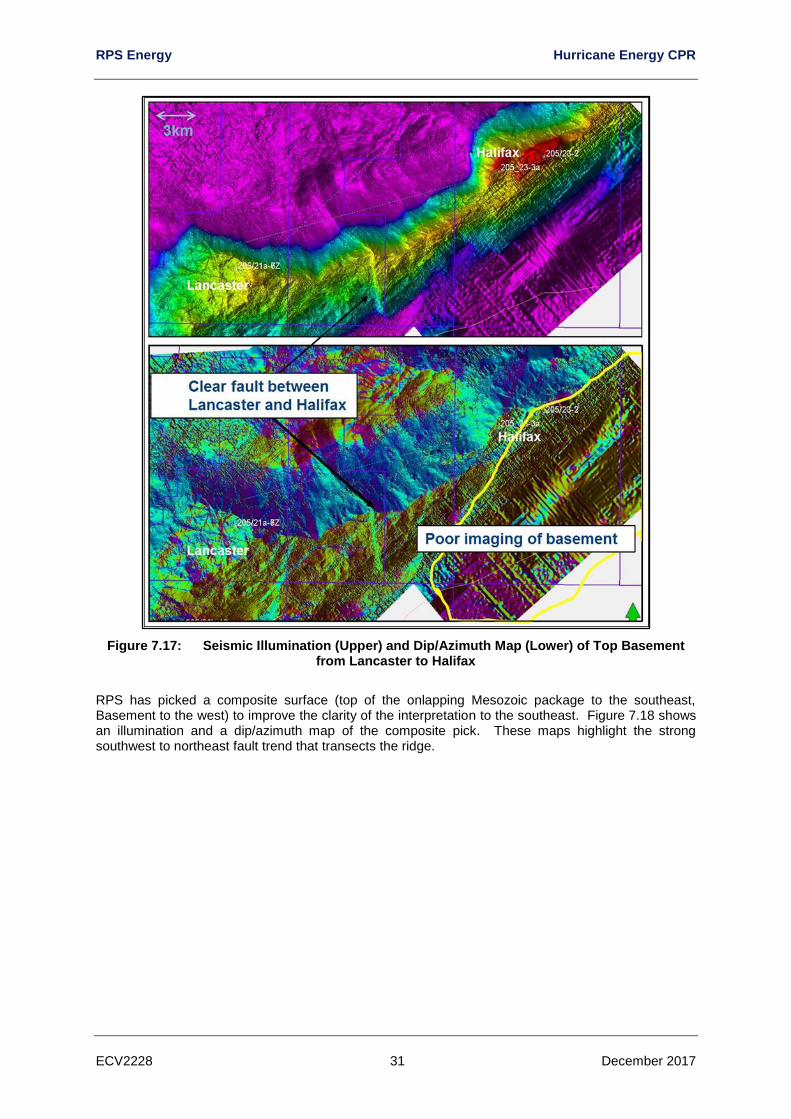
RPS has reviewed the interpretation of top Basement in order to establish the main faults and faulting style. A clear NNW-SSE trending fault, also recognised by Hurricane, can be seen between Lancaster and Halifax in Figure 7.17. This Figure shows an illumination of the top Basement pick and a dip/azimuth map. These maps also highlight the problems of the interpretation of the top Basement to the southeast of the ridge where it is necessary to perform manual line/xline interpretation rather than snapping to a pick. This results in a visible footprint of the interpretation grid when illuminated, obscuring the fault pattern.
RPS Energy Hurricane Energy CPR
ECV2228 31 December 2017
Figure 7.17: Seismic Illumination (Upper) and Dip/Azimuth Map (Lower) of Top Basement from Lancaster to Halifax
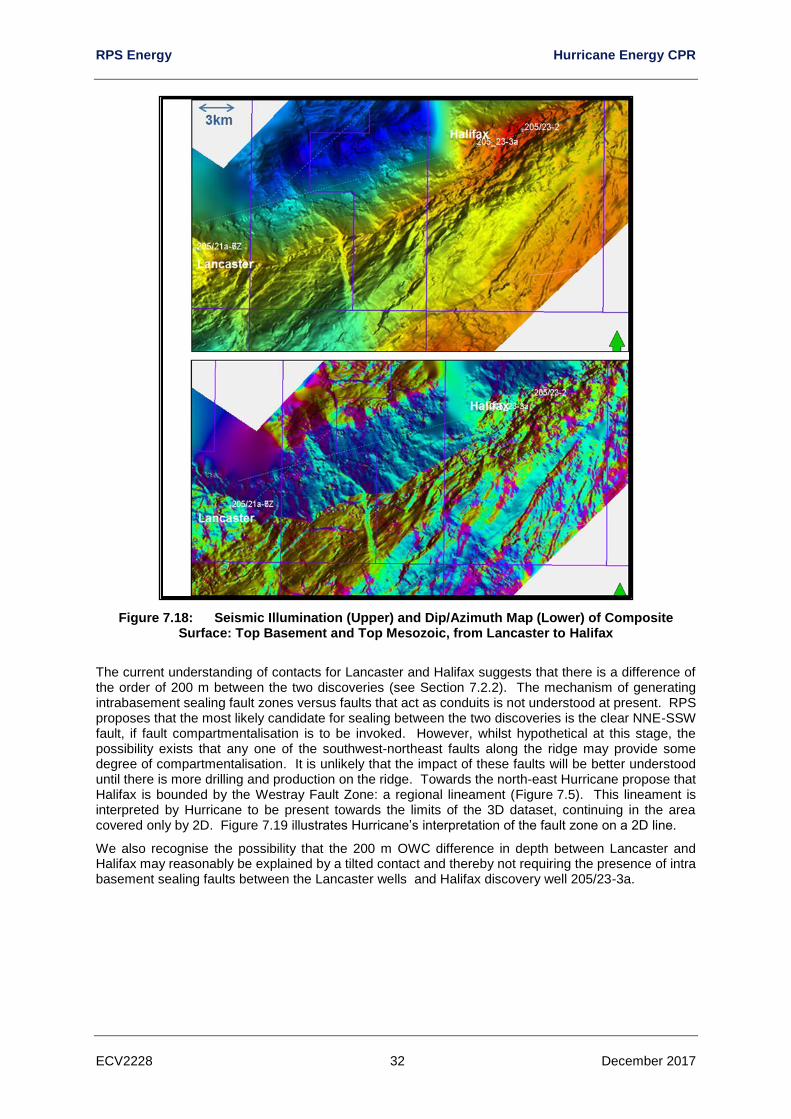
RPS has picked a composite surface (top of the onlapping Mesozoic package to the southeast, Basement to the west) to improve the clarity of the interpretation to the southeast. Figure 7.18 shows an illumination and a dip/azimuth map of the composite pick. These maps highlight the strong southwest to northeast fault trend that transects the ridge.
RPS Energy Hurricane Energy CPR
ECV2228 32 December 2017
Figure 7.18: Seismic Illumination (Upper) and Dip/Azimuth Map (Lower) of Composite Surface: Top Basement and Top Mesozoic, from Lancaster to Halifax
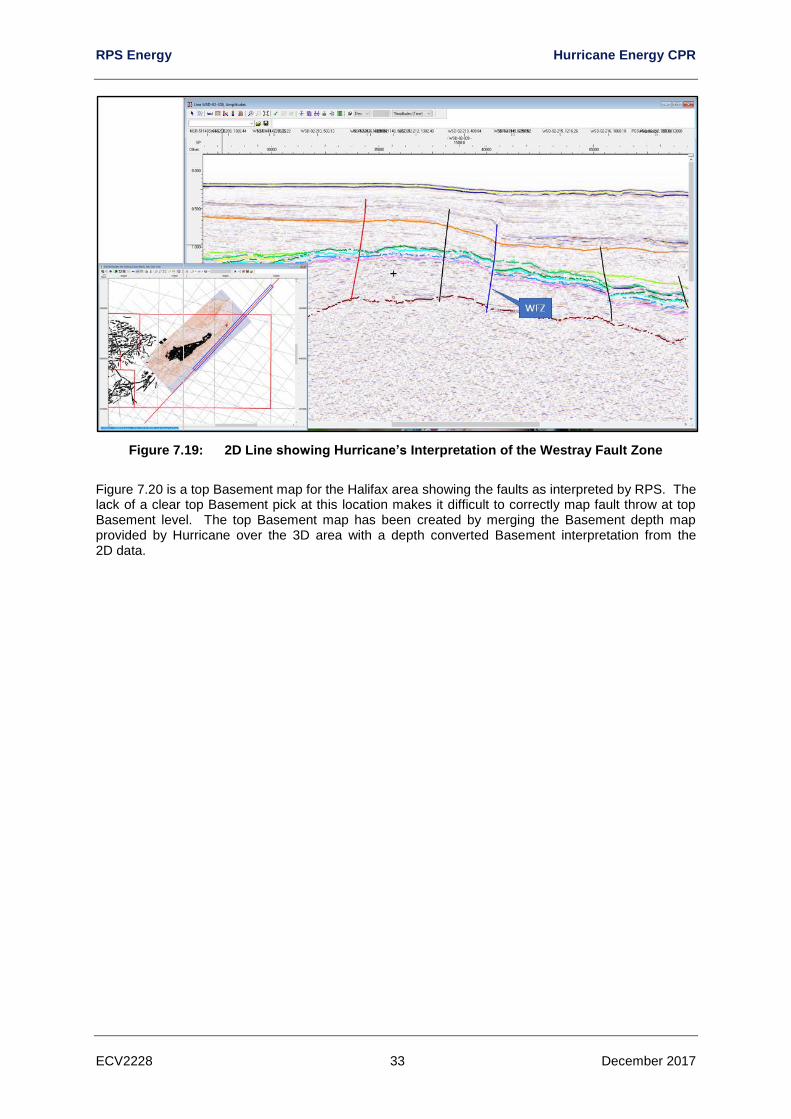
The current understanding of contacts for Lancaster and Halifax suggests that there is a difference of the order of 200 m between the two discoveries (see Section 7.2.2). The mechanism of generating intrabasement sealing fault zones versus faults that act as conduits is not understood at present. RPS proposes that the most likely candidate for sealing between the two discoveries is the clear NNE-SSW fault, if fault compartmentalisation is to be invoked. However, whilst hypothetical at this stage, the possibility exists that any one of the southwest-northeast faults along the ridge may provide some degree of compartmentalisation. It is unlikely that the impact of these faults will be better understood until there is more drilling and production on the ridge. Towards the north-east Hurricane propose that Halifax is bounded by the Westray Fault Zone: a regional lineament (Figure 7.5). This lineament is interpreted by Hurricane to be present towards the limits of the 3D dataset, continuing in the area covered only by 2D. Figure 7.19 illustrates Hurricane’s interpretation of the fault zone on a 2D line.
We also recognise the possibility that the 200 m OWC difference in depth between Lancaster and Halifax may reasonably be explained by a tilted contact and thereby not requiring the presence of intra basement sealing faults between the Lancaster wells and Halifax discovery well 205/23-3a.
RPS Energy Hurricane Energy CPR
ECV2228 33 December 2017
Figure 7.19: 2D Line showing Hurricane’s Interpretation of the Westray Fault Zone
Figure 7.20 is a top Basement map for the Halifax area showing the faults as interpreted by RPS. The lack of a clear top Basement pick at this location makes it difficult to correctly map fault throw at top Basement level. The top Basement map has been created by merging the Basement depth map provided by Hurricane over the 3D area with a depth converted Basement interpretation from the 2D data.
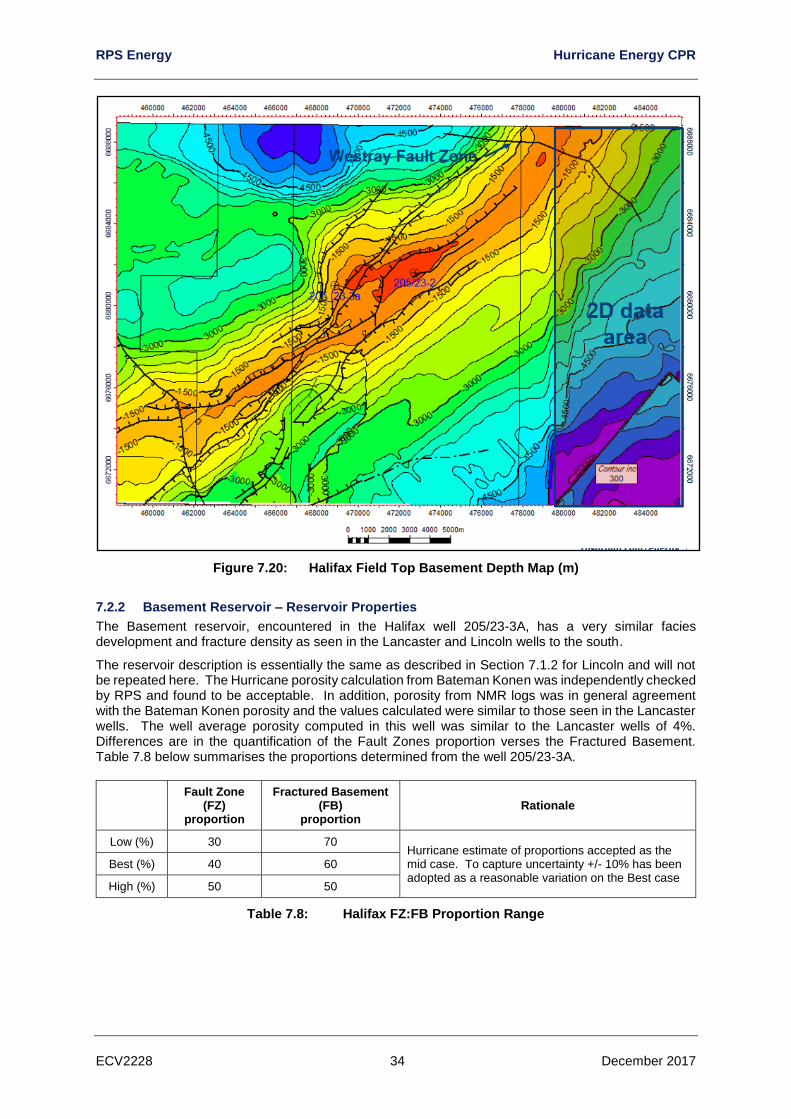
RPS Energy Hurricane Energy CPR
ECV2228 34 December 2017
Figure 7.20: Halifax Field Top Basement Depth Map (m)
7.2.2 Basement Reservoir – Reservoir Properties
The Basement reservoir, encountered in the Halifax well 205/23-3A, has a very similar facies development and fracture density as seen in the Lancaster and Lincoln wells to the south.
The reservoir description is essentially the same as described in Section 7.1.2 for Lincoln and will not be repeated here. The Hurricane porosity calculation from Bateman Konen was independently checked by RPS and found to be acceptable. In addition, porosity from NMR logs was in general agreement with the Bateman Konen porosity and the values calculated were similar to those seen in the Lancaster wells. The well average porosity computed in this well was similar to the Lancaster wells of 4%. Differences are in the quantification of the Fault Zones proportion verses the Fractured Basement. Table 7.8 below summarises the proportions determined from the well 205/233A.
Fault Zone (FZ)
proportion
Fractured Basement (FB)
proportion Rationale
Low (%) 30 70 Hurricane estimate of proportions accepted as the mid case. To capture uncertainty +/- 10% has been adopted as a reasonable variation on the Best case
Best (%) 40 60
High (%) 50 50
Table 7.8: Halifax FZ:FB Proportion Range
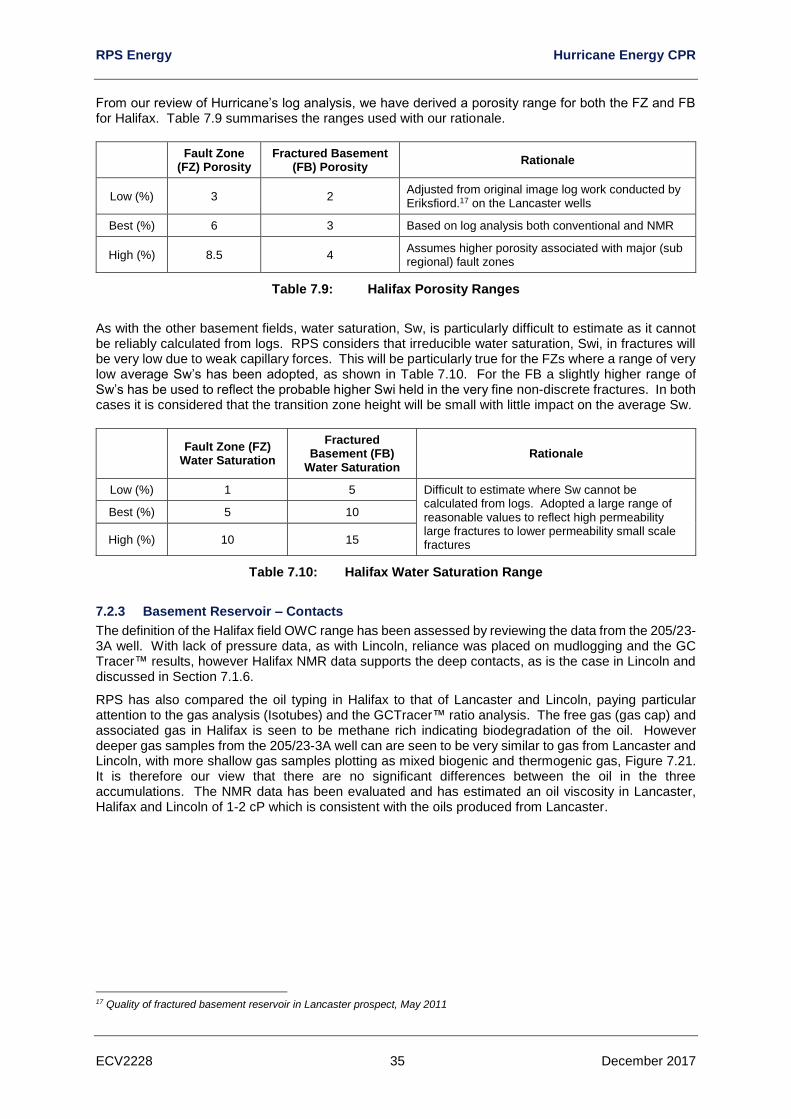
RPS Energy Hurricane Energy CPR
ECV2228 35 December 2017
From our review of Hurricane’s log analysis, we have derived a porosity range for both the FZ and FB for Halifax. Table 7.9 summarises the ranges used with our rationale.
Fault Zone (FZ) Porosity
Fractured Basement (FB) Porosity
Rationale
Low (%) 3 2 Adjusted from original image log work conducted by Eriksfiord.17 on the Lancaster wells
Best (%) 6 3 Based on log analysis both conventional and NMR
High (%) 8.5 4 Assumes higher porosity associated with major (sub regional) fault zones
Table 7.9: Halifax Porosity Ranges
As with the other basement fields, water saturation, Sw, is particularly difficult to estimate as it cannot be reliably calculated from logs. RPS considers that irreducible water saturation, Swi, in fractures will be very low due to weak capillary forces. This will be particularly true for the FZs where a range of very low average Sw’s has been adopted, as shown in Table 7.10. For the FB a slightly higher range of Sw’s has be used to reflect the probable higher Swi held in the very fine non-discrete fractures. In both cases it is considered that the transition zone height will be small with little impact on the average Sw.
Fault Zone (FZ)
Water Saturation
Fractured Basement (FB)
Water Saturation Rationale
Low (%) 1 5 Difficult to estimate where Sw cannot be calculated from logs. Adopted a large range of reasonable values to reflect high permeability large fractures to lower permeability small scale fractures
Best (%) 5 10
High (%) 10 15
Table 7.10: Halifax Water Saturation Range
7.2.3 Basement Reservoir – Contacts
The definition of the Halifax field OWC range has been assessed by reviewing the data from the 205/23-3A well. With lack of pressure data, as with Lincoln, reliance was placed on mudlogging and the GC Tracer™ results, however Halifax NMR data supports the deep contacts, as is the case in Lincoln and discussed in Section 7.1.6.
RPS has also compared the oil typing in Halifax to that of Lancaster and Lincoln, paying particular attention to the gas analysis (Isotubes) and the GCTracer™ ratio analysis. The free gas (gas cap) and associated gas in Halifax is seen to be methane rich indicating biodegradation of the oil. However deeper gas samples from the 205/23-3A well can are seen to be very similar to gas from Lancaster and Lincoln, with more shallow gas samples plotting as mixed biogenic and thermogenic gas, Figure 7.21. It is therefore our view that there are no significant differences between the oil in the three accumulations. The NMR data has been evaluated and has estimated an oil viscosity in Lancaster, Halifax and Lincoln of 1-2 cP which is consistent with the oils produced from Lancaster.
17 Quality of fractured basement reservoir in Lancaster prospect, May 2011
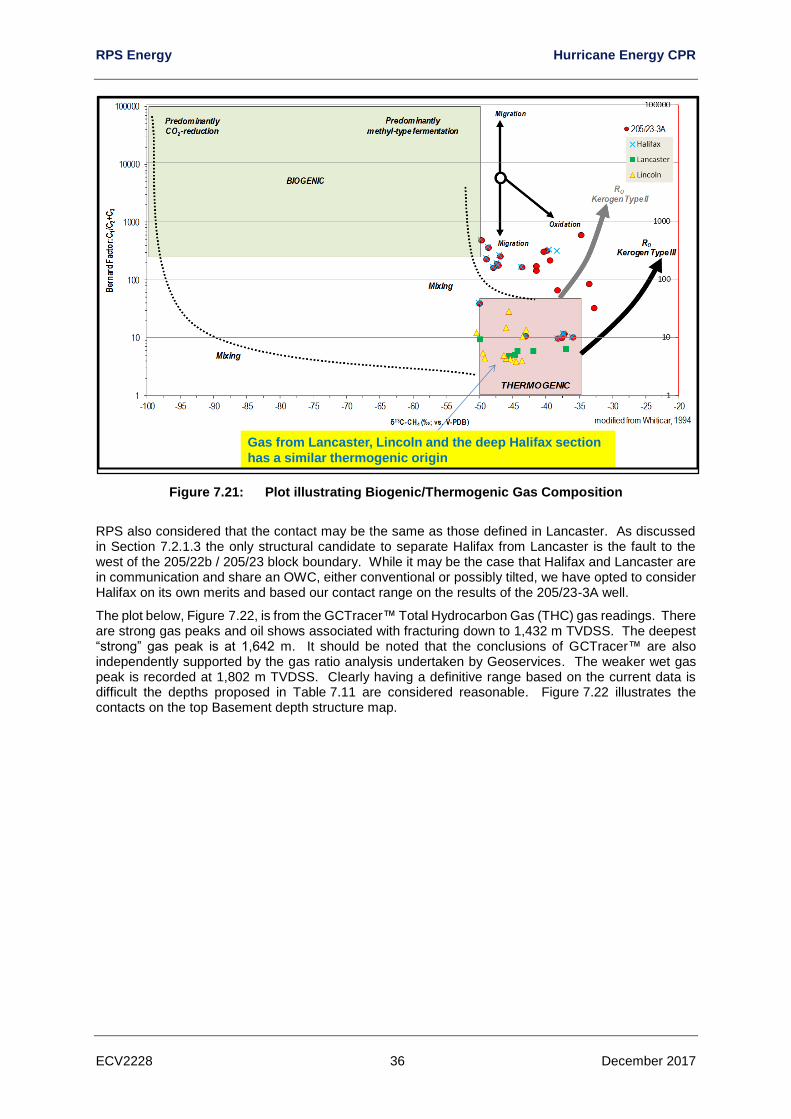
RPS Energy Hurricane Energy CPR
ECV2228 36 December 2017
Figure 7.21: Plot illustrating Biogenic/Thermogenic Gas Composition
RPS also considered that the contact may be the same as those defined in Lancaster. As discussed in Section 7.2.1.3 the only structural candidate to separate Halifax from Lancaster is the fault to the west of the 205/22b / 205/23 block boundary. While it may be the case that Halifax and Lancaster are in communication and share an OWC, either conventional or possibly tilted, we have opted to consider Halifax on its own merits and based our contact range on the results of the 205/23-3A well.
The plot below, Figure 7.22, is from the GCTracer™ Total Hydrocarbon Gas (THC) gas readings. There are strong gas peaks and oil shows associated with fracturing down to 1,432 m TVDSS. The deepest “strong” gas peak is at 1,642 m. It should be noted that the conclusions of GCTracer™ are also independently supported by the gas ratio analysis undertaken by Geoservices. The weaker wet gas peak is recorded at 1,802 m TVDSS. Clearly having a definitive range based on the current data is difficult the depths proposed in Table 7.11 are considered reasonable. Figure 7.22 illustrates the contacts on the top Basement depth structure map.
Gas from Lancaster, Lincoln and the deep Halifax section
has a similar thermogenic origin
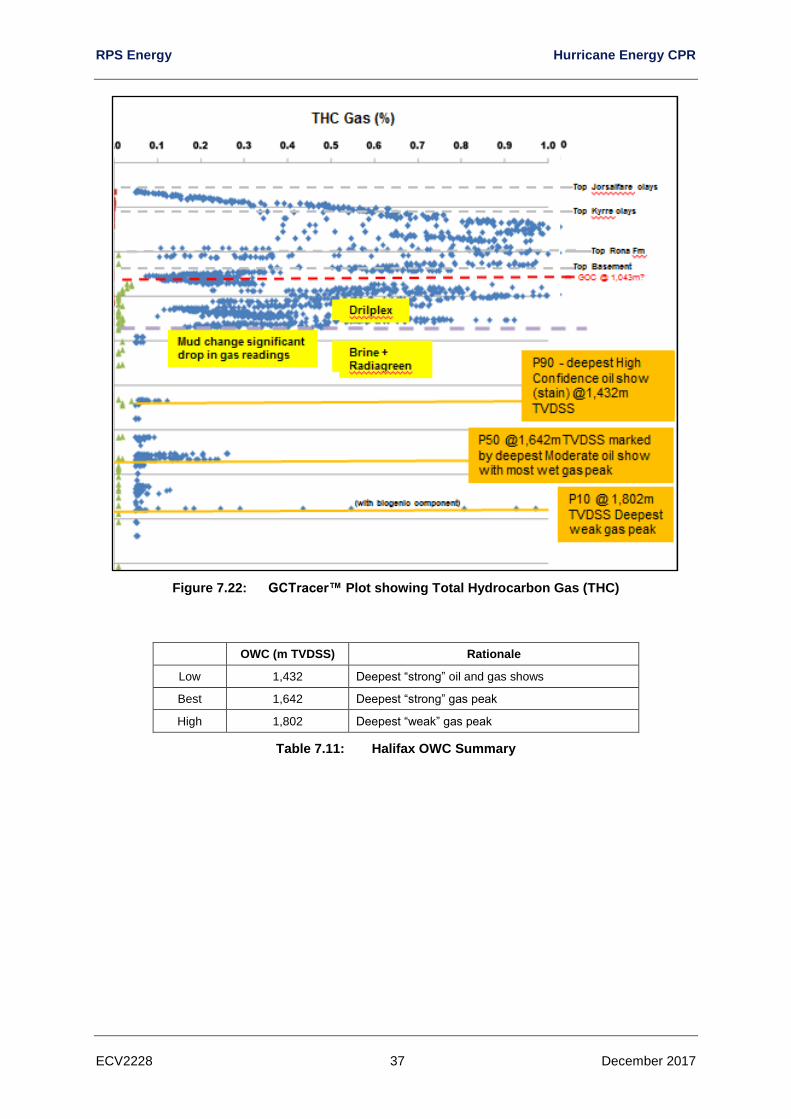
RPS Energy Hurricane Energy CPR
ECV2228 37 December 2017
Figure 7.22: GCTracer™ Plot showing Total Hydrocarbon Gas (THC)
OWC (m TVDSS) Rationale
Low 1,432 Deepest “strong” oil and gas shows
Best 1,642 Deepest “strong” gas peak
High 1,802 Deepest “weak” gas peak
Table 7.11: Halifax OWC Summary
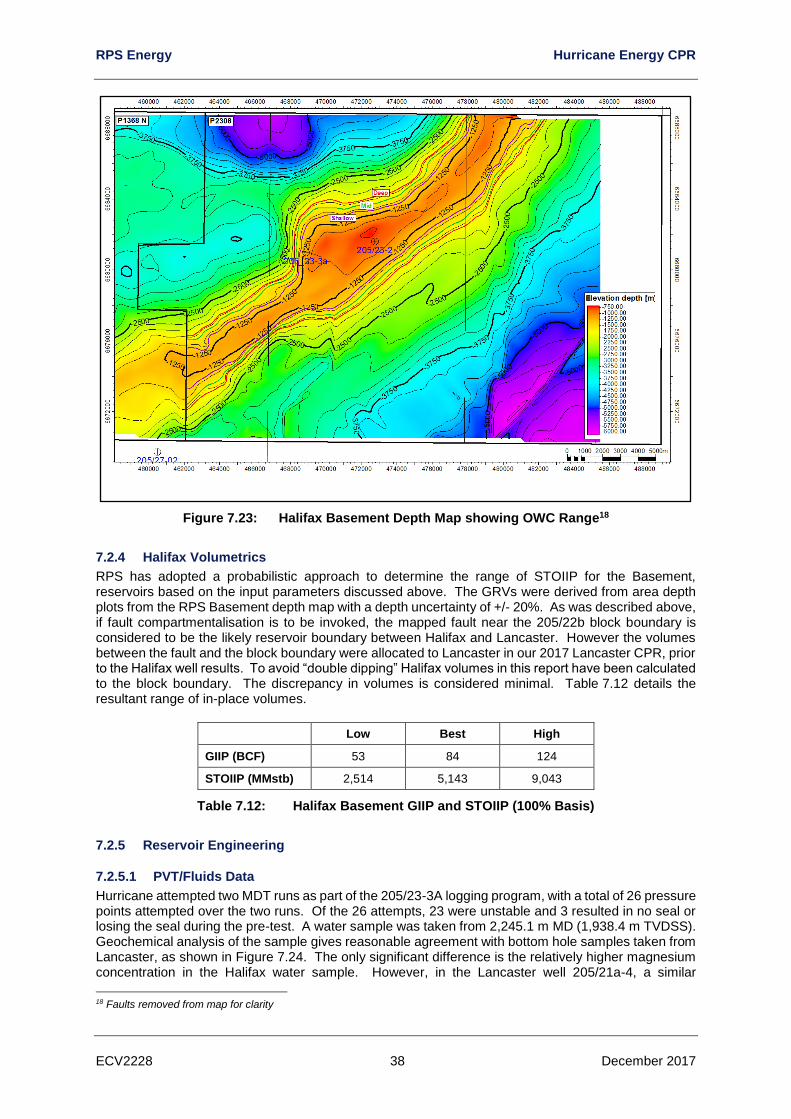
RPS Energy Hurricane Energy CPR
ECV2228 38 December 2017
Figure 7.23: Halifax Basement Depth Map showing OWC Range18
7.2.4 Halifax Volumetrics
RPS has adopted a probabilistic approach to determine the range of STOIIP for the Basement, reservoirs based on the input parameters discussed above. The GRVs were derived from area depth plots from the RPS Basement depth map with a depth uncertainty of +/- 20%. As was described above, if fault compartmentalisation is to be invoked, the mapped fault near the 205/22b block boundary is considered to be the likely reservoir boundary between Halifax and Lancaster. However the volumes between the fault and the block boundary were allocated to Lancaster in our 2017 Lancaster CPR, prior to the Halifax well results. To avoid “double dipping” Halifax volumes in this report have been calculated to the block boundary. The discrepancy in volumes is considered minimal. Table 7.12 details the resultant range of in-place volumes.
Low Best High
GIIP (BCF) 53 84 124
STOIIP (MMstb) 2,514 5,143 9,043
Table 7.12: Halifax Basement GIIP and STOIIP (100% Basis)
7.2.5 Reservoir Engineering
7.2.5.1 PVT/Fluids Data
Hurricane attempted two MDT runs as part of the 205/23-3A logging program, with a total of 26 pressure points attempted over the two runs. Of the 26 attempts, 23 were unstable and 3 resulted in no seal or losing the seal during the pre-test. A water sample was taken from 2,245.1 m MD (1,938.4 m TVDSS). Geochemical analysis of the sample gives reasonable agreement with bottom hole samples taken from Lancaster, as shown in Figure 7.24. The only significant difference is the relatively higher magnesium concentration in the Halifax water sample. However, in the Lancaster well 205/21a-4, a similar
18 Faults removed from map for clarity
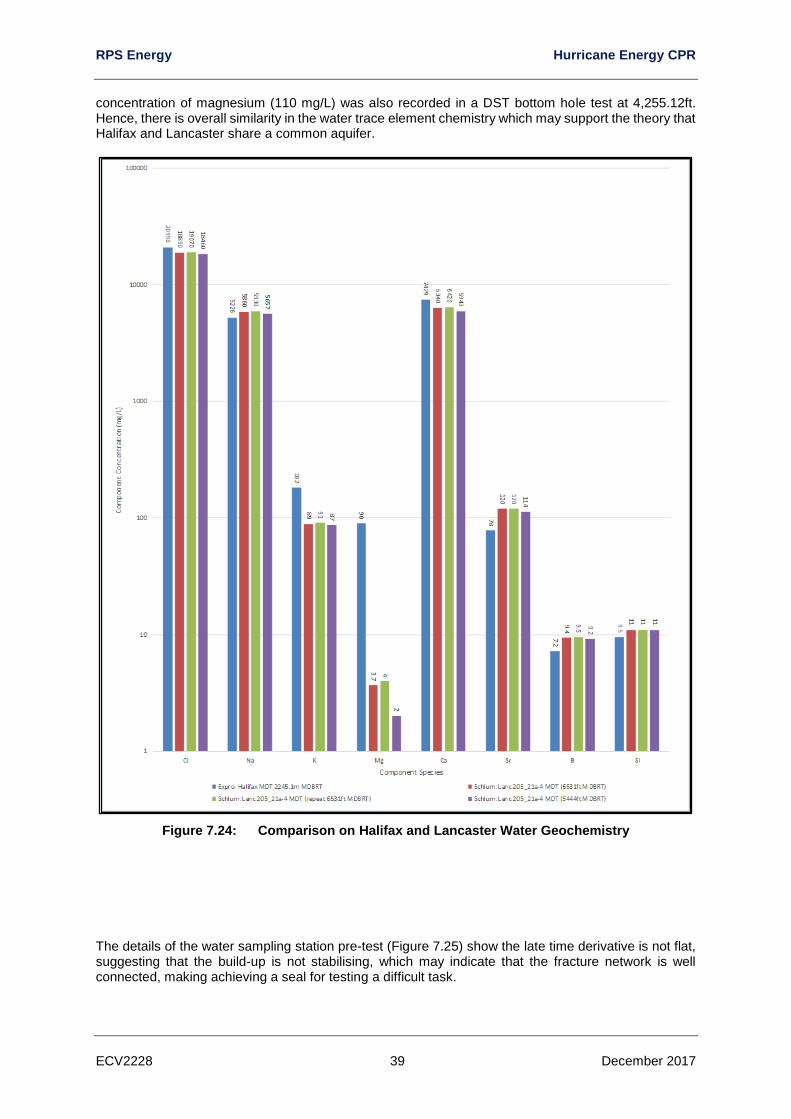
RPS Energy Hurricane Energy CPR
ECV2228 39 December 2017
concentration of magnesium (110 mg/L) was also recorded in a DST bottom hole test at 4,255.12ft. Hence, there is overall similarity in the water trace element chemistry which may support the theory that Halifax and Lancaster share a common aquifer.
Figure 7.24: Comparison on Halifax and Lancaster Water Geochemistry
The details of the water sampling station pre-test (Figure 7.25) show the late time derivative is not flat, suggesting that the build-up is not stabilising, which may indicate that the fracture network is well connected, making achieving a seal for testing a difficult task.
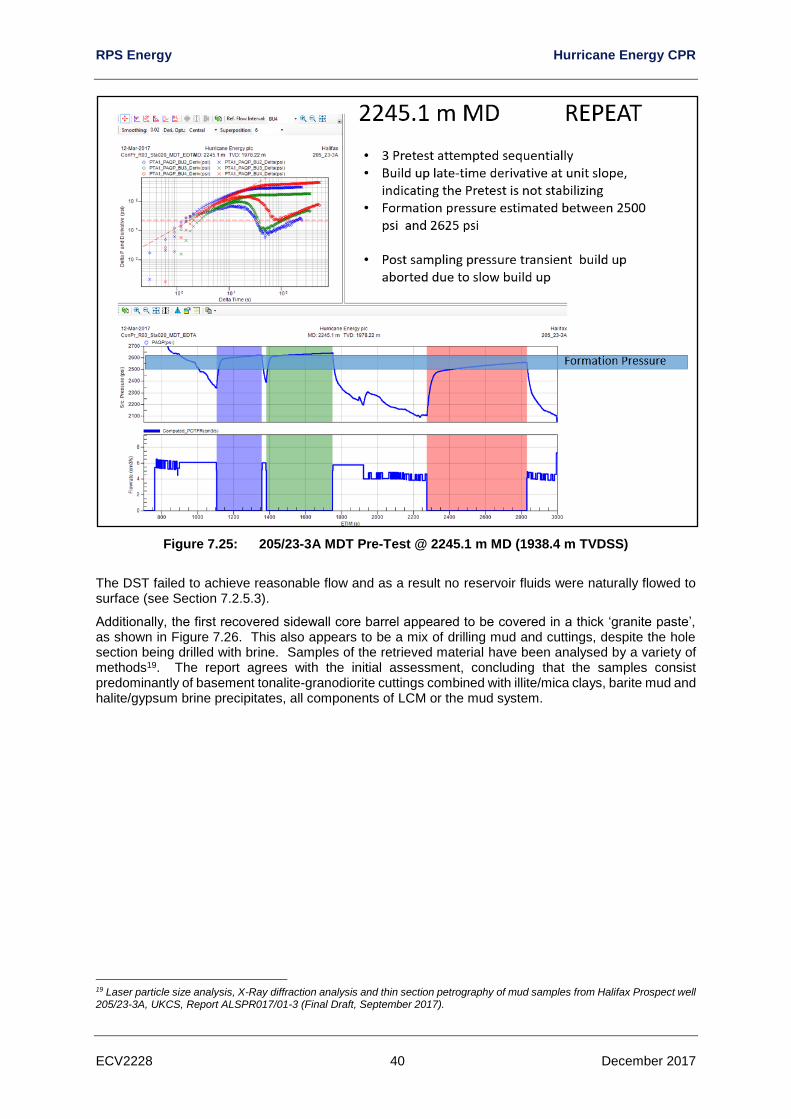
RPS Energy Hurricane Energy CPR
ECV2228 40 December 2017
Figure 7.25: 205/23-3A MDT Pre-Test @ 2245.1 m MD (1938.4 m TVDSS)
The DST failed to achieve reasonable flow and as a result no reservoir fluids were naturally flowed to surface (see Section 7.2.5.3).
Additionally, the first recovered sidewall core barrel appeared to be covered in a thick ‘granite paste’, as shown in Figure 7.26. This also appears to be a mix of drilling mud and cuttings, despite the hole section being drilled with brine. Samples of the retrieved material have been analysed by a variety of methods19. The report agrees with the initial assessment, concluding that the samples consist predominantly of basement tonalite-granodiorite cuttings combined with illite/mica clays, barite mud and halite/gypsum brine precipitates, all components of LCM or the mud system.
19 Laser particle size analysis, X-Ray diffraction analysis and thin section petrography of mud samples from Halifax Prospect well 205/23-3A, UKCS, Report ALSPR017/01-3 (Final Draft, September 2017).
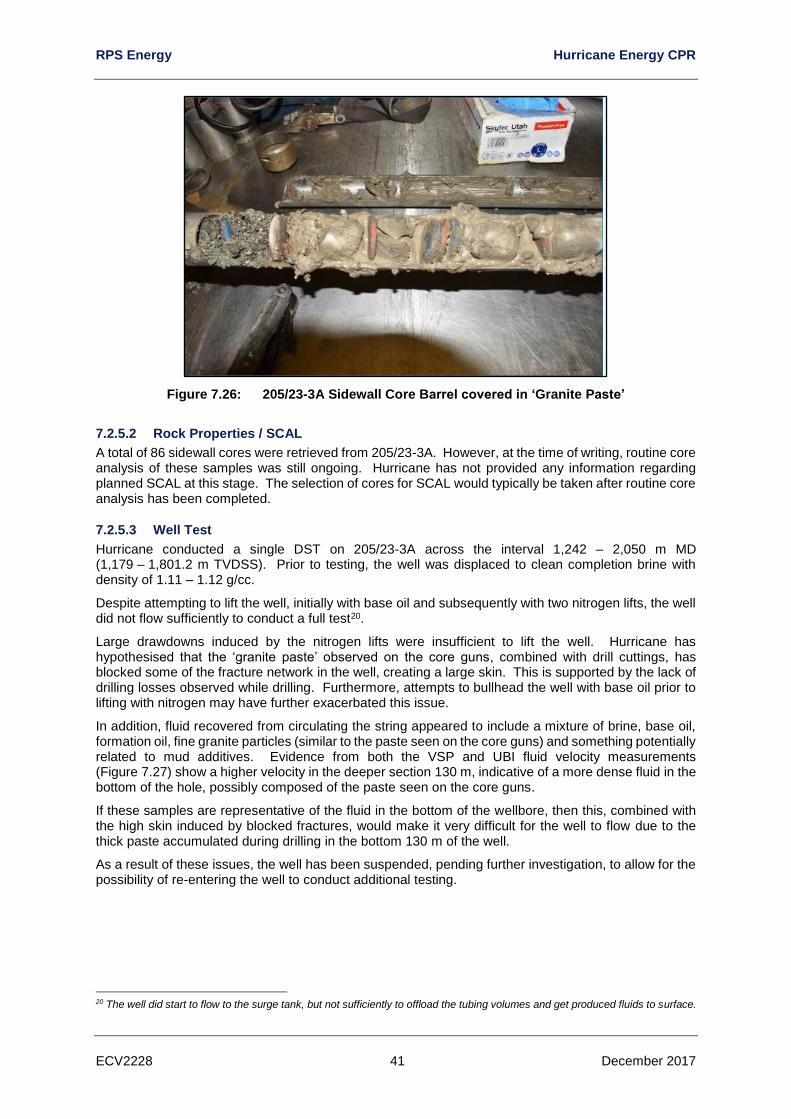
RPS Energy Hurricane Energy CPR
ECV2228 41 December 2017
Figure 7.26: 205/23-3A Sidewall Core Barrel covered in ‘Granite Paste’
7.2.5.2 Rock Properties / SCAL
A total of 86 sidewall cores were retrieved from 205/23-3A. However, at the time of writing, routine core analysis of these samples was still ongoing. Hurricane has not provided any information regarding planned SCAL at this stage. The selection of cores for SCAL would typically be taken after routine core analysis has been completed.
7.2.5.3 Well Test
Hurricane conducted a single DST on 205/23-3A across the interval 1,242 – 2,050 m MD (1,179 – 1,801.2 m TVDSS). Prior to testing, the well was displaced to clean completion brine with density of 1.11 – 1.12 g/cc.
Despite attempting to lift the well, initially with base oil and subsequently with two nitrogen lifts, the well did not flow sufficiently to conduct a full test20.
Large drawdowns induced by the nitrogen lifts were insufficient to lift the well. Hurricane has hypothesised that the ‘granite paste’ observed on the core guns, combined with drill cuttings, has blocked some of the fracture network in the well, creating a large skin. This is supported by the lack of drilling losses observed while drilling. Furthermore, attempts to bullhead the well with base oil prior to lifting with nitrogen may have further exacerbated this issue.
In addition, fluid recovered from circulating the string appeared to include a mixture of brine, base oil, formation oil, fine granite particles (similar to the paste seen on the core guns) and something potentially related to mud additives. Evidence from both the VSP and UBI fluid velocity measurements (Figure 7.27) show a higher velocity in the deeper section 130 m, indicative of a more dense fluid in the bottom of the hole, possibly composed of the paste seen on the core guns.
If these samples are representative of the fluid in the bottom of the wellbore, then this, combined with the high skin induced by blocked fractures, would make it very difficult for the well to flow due to the thick paste accumulated during drilling in the bottom 130 m of the well.
As a result of these issues, the well has been suspended, pending further investigation, to allow for the possibility of re-entering the well to conduct additional testing.
20 The well did start to flow to the surge tank, but not sufficiently to offload the tubing volumes and get produced fluids to surface.
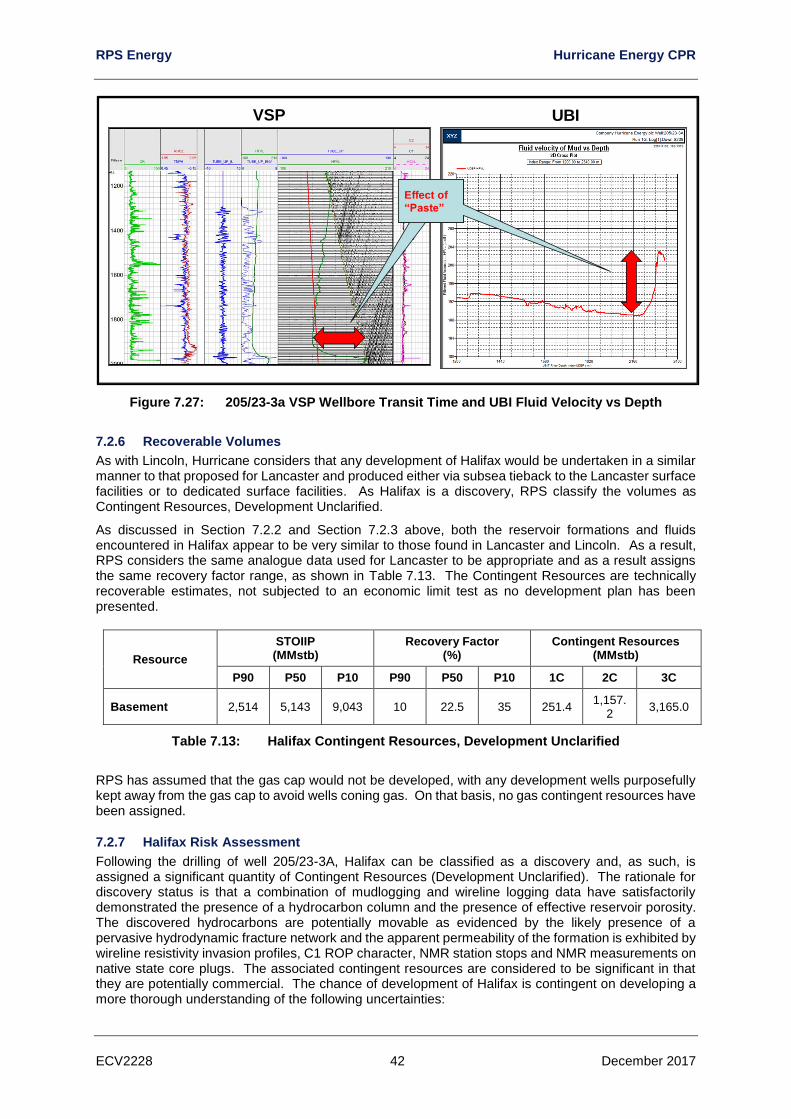
RPS Energy Hurricane Energy CPR
ECV2228 42 December 2017
Figure 7.27: 205/23-3a VSP Wellbore Transit Time and UBI Fluid Velocity vs Depth
7.2.6 Recoverable Volumes
As with Lincoln, Hurricane considers that any development of Halifax would be undertaken in a similar manner to that proposed for Lancaster and produced either via subsea tieback to the Lancaster surface facilities or to dedicated surface facilities. As Halifax is a discovery, RPS classify the volumes as Contingent Resources, Development Unclarified.
As discussed in Section 7.2.2 and Section 7.2.3 above, both the reservoir formations and fluids encountered in Halifax appear to be very similar to those found in Lancaster and Lincoln. As a result, RPS considers the same analogue data used for Lancaster to be appropriate and as a result assigns the same recovery factor range, as shown in Table 7.13. The Contingent Resources are technically recoverable estimates, not subjected to an economic limit test as no development plan has been presented.
Resource
STOIIP (MMstb)
Recovery Factor (%)
Contingent Resources (MMstb)
P90 P50 P10 P90 P50 P10 1C 2C 3C
Basement 2,514 5,143 9,043 10 22.5 35 251.4 1,157.
2 3,165.0
Table 7.13: Halifax Contingent Resources, Development Unclarified
RPS has assumed that the gas cap would not be developed, with any development wells purposefully kept away from the gas cap to avoid wells coning gas. On that basis, no gas contingent resources have been assigned.
7.2.7 Halifax Risk Assessment
Following the drilling of well 205/23-3A, Halifax can be classified as a discovery and, as such, is assigned a significant quantity of Contingent Resources (Development Unclarified). The rationale for discovery status is that a combination of mudlogging and wireline logging data have satisfactorily demonstrated the presence of a hydrocarbon column and the presence of effective reservoir porosity. The discovered hydrocarbons are potentially movable as evidenced by the likely presence of a pervasive hydrodynamic fracture network and the apparent permeability of the formation is exhibited by wireline resistivity invasion profiles, C1 ROP character, NMR station stops and NMR measurements on native state core plugs. The associated contingent resources are considered to be significant in that they are potentially commercial. The chance of development of Halifax is contingent on developing a more thorough understanding of the following uncertainties:
Effect of
Paste
Effect of
“Paste”
VSP UBI
RPS Energy Hurricane Energy CPR
ECV2228 43 December 2017
• Fluid properties
• Fracture propensity and distribution
• Interconnectivity of fracture network (pending interference testing)
• OWC depth
• Demonstration of commercial flow rates from a well test
• Water production potential and subsequent water handling requirements
• Full field development plan (number of wells required, drill centre locations)
The Halifax discovery requires further appraisal to resolve these uncertainties.
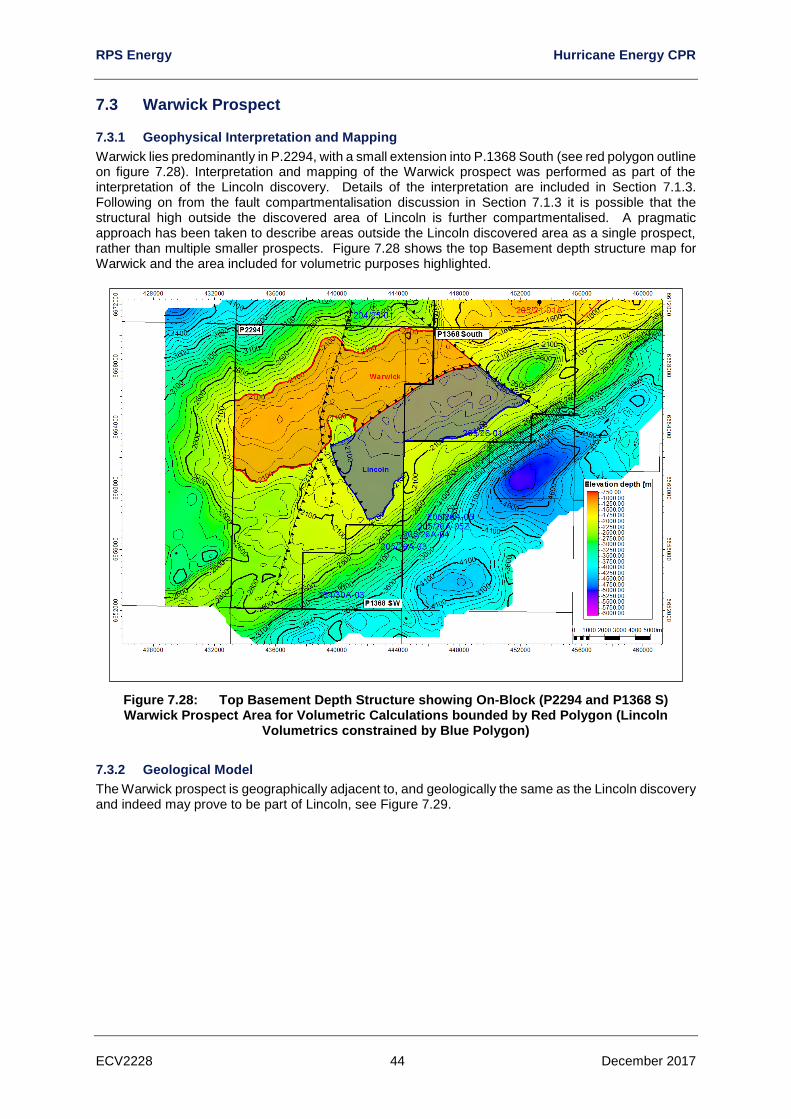
RPS Energy Hurricane Energy CPR
ECV2228 44 December 2017
7.3 Warwick Prospect
7.3.1 Geophysical Interpretation and Mapping
Warwick lies predominantly in P.2294, with a small extension into P.1368 South (see red polygon outline on figure 7.28). Interpretation and mapping of the Warwick prospect was performed as part of the interpretation of the Lincoln discovery. Details of the interpretation are included in Section 7.1.3. Following on from the fault compartmentalisation discussion in Section 7.1.3 it is possible that the structural high outside the discovered area of Lincoln is further compartmentalised. A pragmatic approach has been taken to describe areas outside the Lincoln discovered area as a single prospect, rather than multiple smaller prospects. Figure 7.28 shows the top Basement depth structure map for Warwick and the area included for volumetric purposes highlighted.
Figure 7.28: Top Basement Depth Structure showing On-Block (P2294 and P1368 S) Warwick Prospect Area for Volumetric Calculations bounded by Red Polygon (Lincoln
Volumetrics constrained by Blue Polygon)
7.3.2 Geological Model
The Warwick prospect is geographically adjacent to, and geologically the same as the Lincoln discovery and indeed may prove to be part of Lincoln, see Figure 7.29.
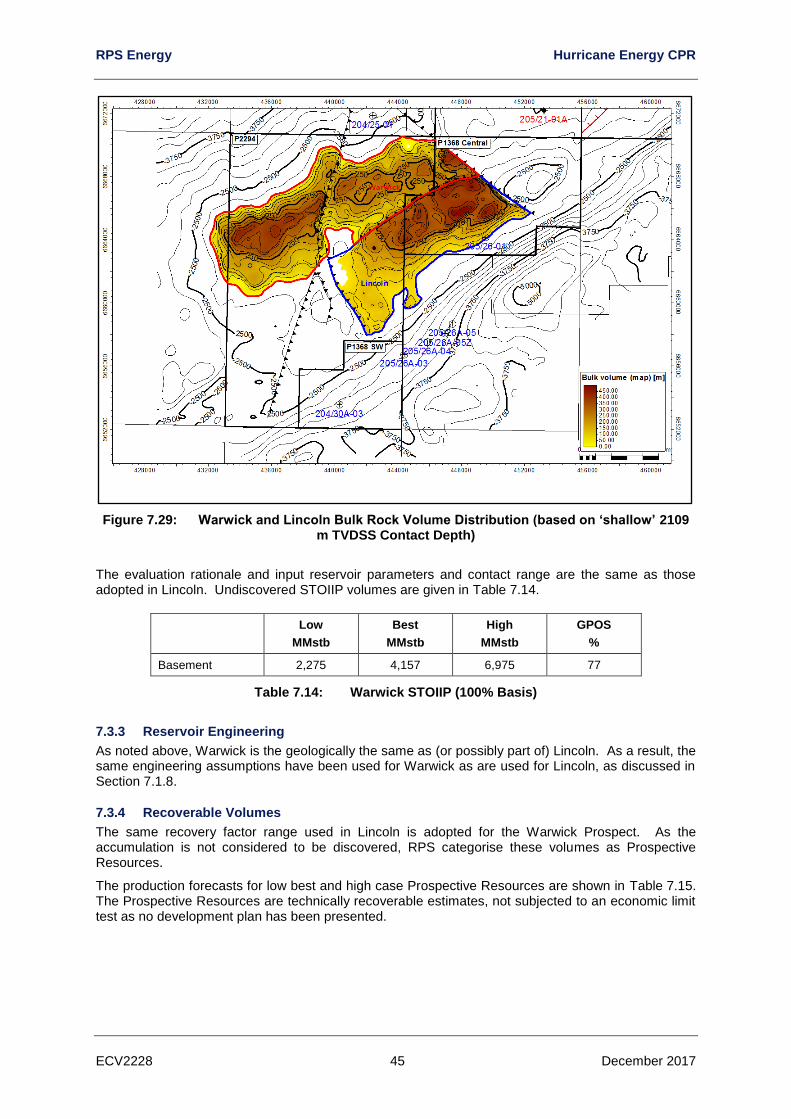
RPS Energy Hurricane Energy CPR
ECV2228 45 December 2017
Figure 7.29: Warwick and Lincoln Bulk Rock Volume Distribution (based on ‘shallow’ 2109 m TVDSS Contact Depth)
The evaluation rationale and input reservoir parameters and contact range are the same as those adopted in Lincoln. Undiscovered STOIIP volumes are given in Table 7.14.
Low
MMstb
Best
MMstb
High
MMstb
GPOS
%
Basement 2,275 4,157 6,975 77
Table 7.14: Warwick STOIIP (100% Basis)
7.3.3 Reservoir Engineering
As noted above, Warwick is the geologically the same as (or possibly part of) Lincoln. As a result, the same engineering assumptions have been used for Warwick as are used for Lincoln, as discussed in Section 7.1.8.
7.3.4 Recoverable Volumes
The same recovery factor range used in Lincoln is adopted for the Warwick Prospect. As the accumulation is not considered to be discovered, RPS categorise these volumes as Prospective Resources.
The production forecasts for low best and high case Prospective Resources are shown in Table 7.15. The Prospective Resources are technically recoverable estimates, not subjected to an economic limit test as no development plan has been presented.
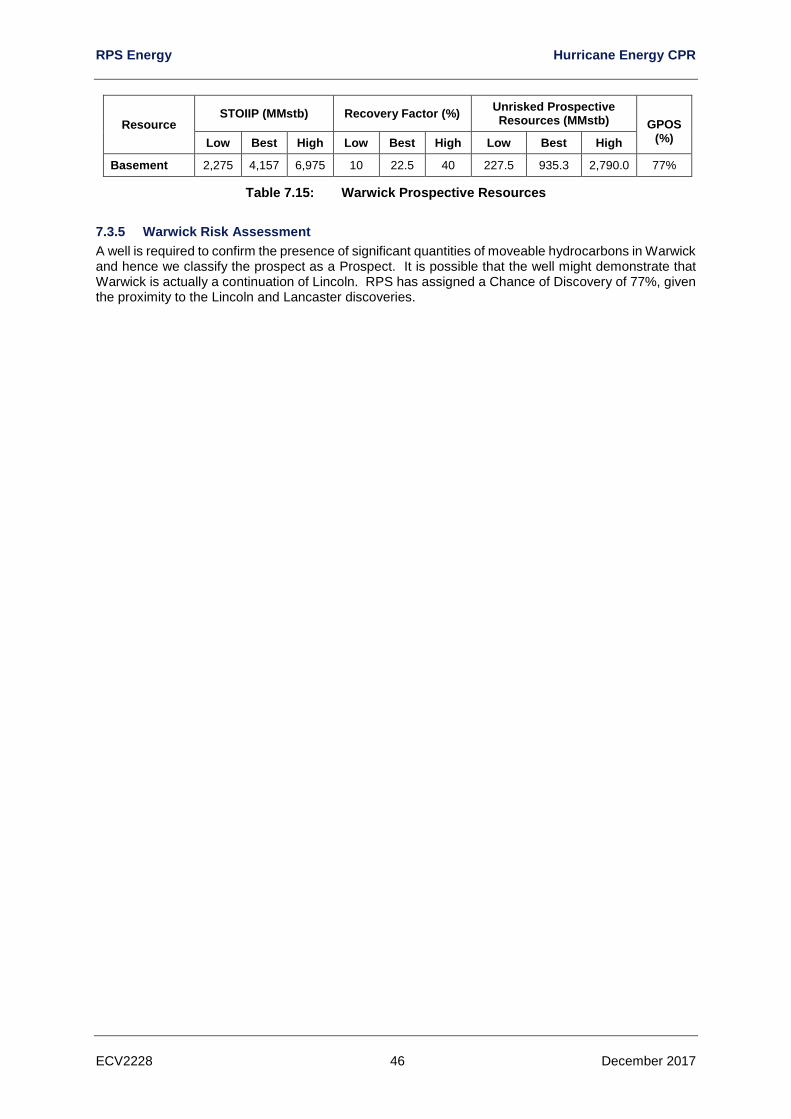
RPS Energy Hurricane Energy CPR
ECV2228 46 December 2017
Resource STOIIP (MMstb) Recovery Factor (%)
Unrisked Prospective Resources (MMstb)
GPOS (%) Low Best High Low Best High Low Best High
Basement 2,275 4,157 6,975 10 22.5 40 227.5 935.3 2,790.0 77%
Table 7.15: Warwick Prospective Resources
7.3.5 Warwick Risk Assessment
A well is required to confirm the presence of significant quantities of moveable hydrocarbons in Warwick and hence we classify the prospect as a Prospect. It is possible that the well might demonstrate that Warwick is actually a continuation of Lincoln. RPS has assigned a Chance of Discovery of 77%, given the proximity to the Lincoln and Lancaster discoveries.
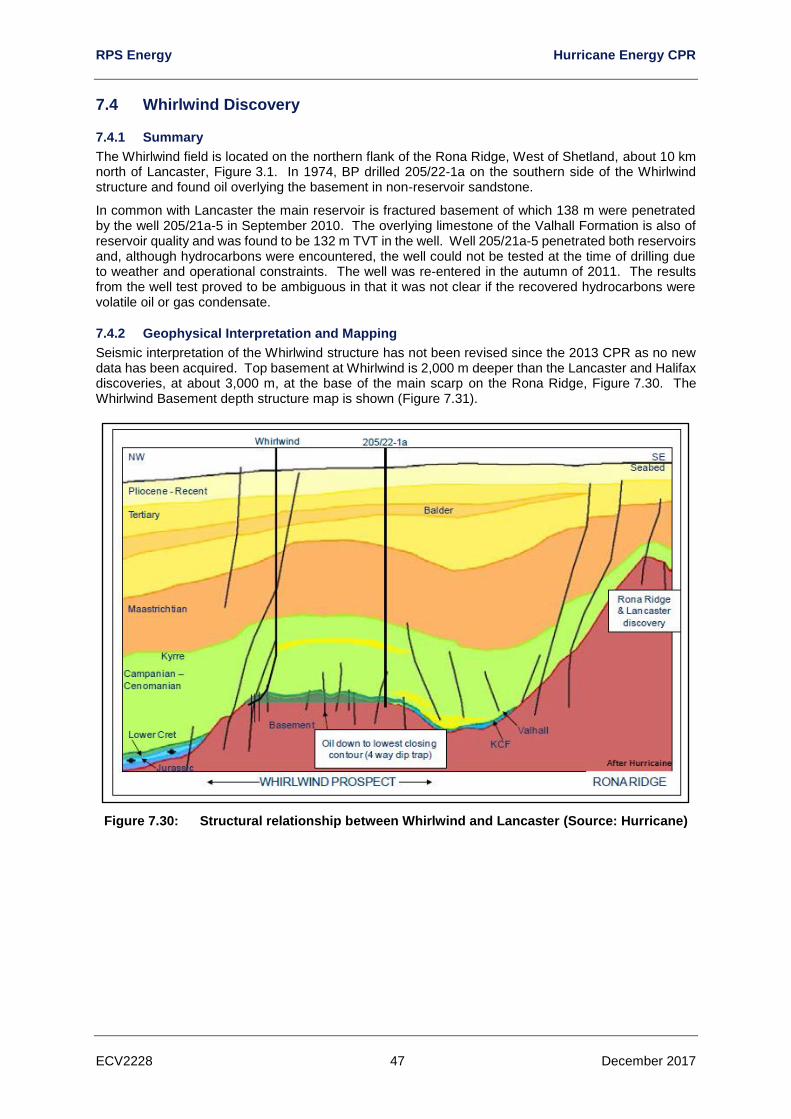
RPS Energy Hurricane Energy CPR
ECV2228 47 December 2017
7.4 Whirlwind Discovery
7.4.1 Summary
The Whirlwind field is located on the northern flank of the Rona Ridge, West of Shetland, about 10 km north of Lancaster, Figure 3.1. In 1974, BP drilled 205/22-1a on the southern side of the Whirlwind structure and found oil overlying the basement in non-reservoir sandstone.
In common with Lancaster the main reservoir is fractured basement of which 138 m were penetrated by the well 205/21a-5 in September 2010. The overlying limestone of the Valhall Formation is also of reservoir quality and was found to be 132 m TVT in the well. Well 205/21a-5 penetrated both reservoirs and, although hydrocarbons were encountered, the well could not be tested at the time of drilling due to weather and operational constraints. The well was reentered in the autumn of 2011. The results from the well test proved to be ambiguous in that it was not clear if the recovered hydrocarbons were volatile oil or gas condensate.
7.4.2 Geophysical Interpretation and Mapping
Seismic interpretation of the Whirlwind structure has not been revised since the 2013 CPR as no new data has been acquired. Top basement at Whirlwind is 2,000 m deeper than the Lancaster and Halifax discoveries, at about 3,000 m, at the base of the main scarp on the Rona Ridge, Figure 7.30. The Whirlwind Basement depth structure map is shown (Figure 7.31).
Figure 7.30: Structural relationship between Whirlwind and Lancaster (Source: Hurricane)
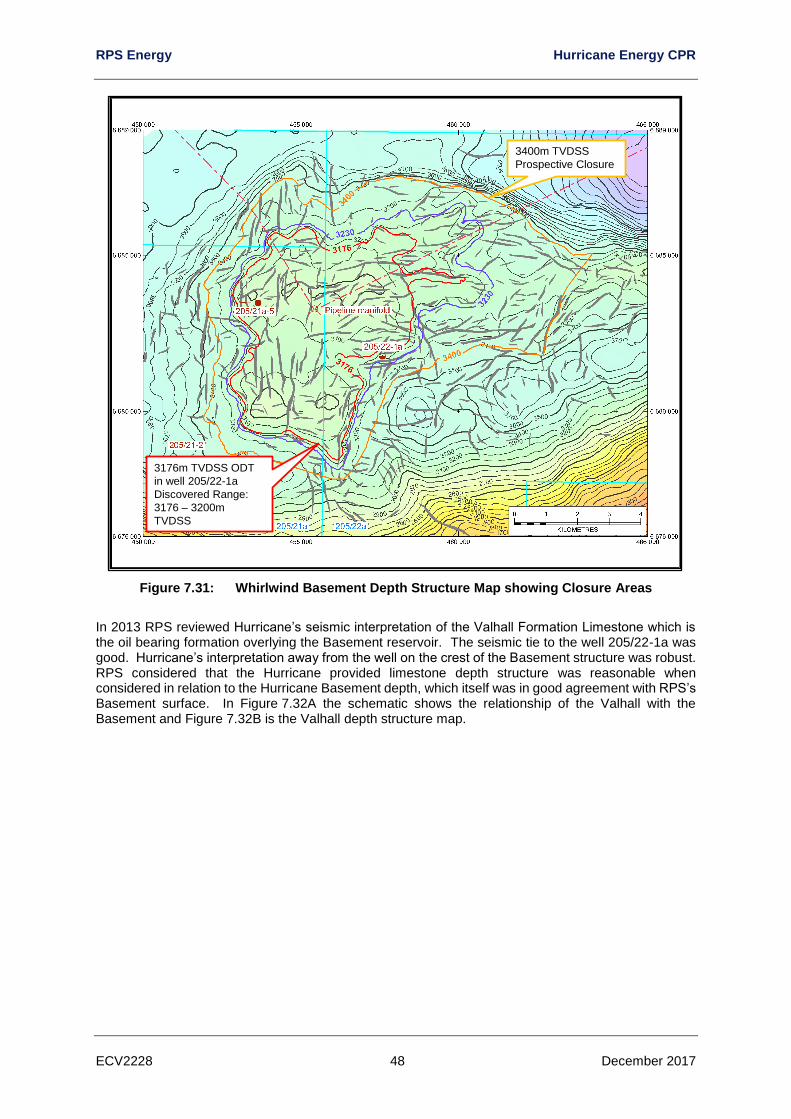
RPS Energy Hurricane Energy CPR
ECV2228 48 December 2017
Figure 7.31: Whirlwind Basement Depth Structure Map showing Closure Areas
In 2013 RPS reviewed Hurricane’s seismic interpretation of the Valhall Formation Limestone which is the oil bearing formation overlying the Basement reservoir. The seismic tie to the well 205/22-1a was good. Hurricane’s interpretation away from the well on the crest of the Basement structure was robust. RPS considered that the Hurricane provided limestone depth structure was reasonable when considered in relation to the Hurricane Basement depth, which itself was in good agreement with RPS’s Basement surface. In Figure 7.32A the schematic shows the relationship of the Valhall with the Basement and Figure 7.32B is the Valhall depth structure map.
3400m TVDSS
Prospective Closure
3176m TVDSS ODT
in well 205/22-1a
Discovered Range:
3176 – 3200m
TVDSS
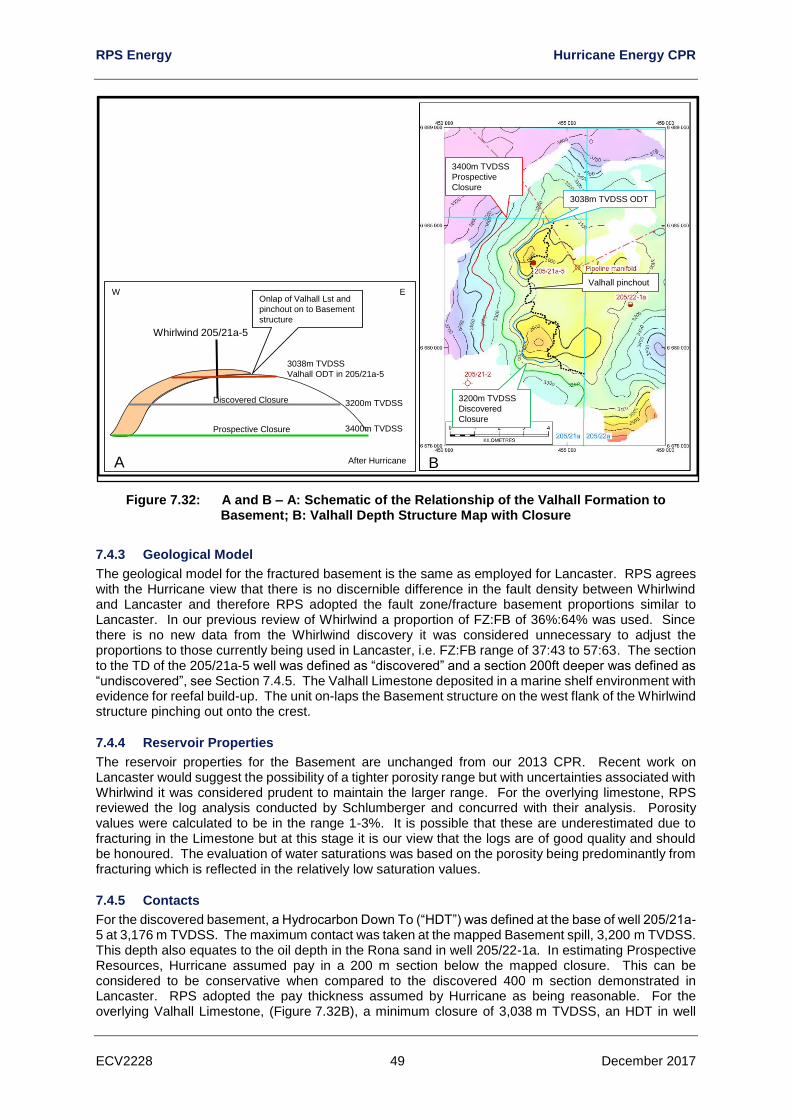
RPS Energy Hurricane Energy CPR
ECV2228 49 December 2017
Figure 7.32: A and B – A: Schematic of the Relationship of the Valhall Formation to Basement; B: Valhall Depth Structure Map with Closure
7.4.3 Geological Model
The geological model for the fractured basement is the same as employed for Lancaster. RPS agrees with the Hurricane view that there is no discernible difference in the fault density between Whirlwind and Lancaster and therefore RPS adopted the fault zone/fracture basement proportions similar to Lancaster. In our previous review of Whirlwind a proportion of FZ:FB of 36%:64% was used. Since there is no new data from the Whirlwind discovery it was considered unnecessary to adjust the proportions to those currently being used in Lancaster, i.e. FZ:FB range of 37:43 to 57:63. The section to the TD of the 205/21a-5 well was defined as “discovered” and a section 200ft deeper was defined as “undiscovered”, see Section 7.4.5. The Valhall Limestone deposited in a marine shelf environment with evidence for reefal build-up. The unit on-laps the Basement structure on the west flank of the Whirlwind structure pinching out onto the crest.
7.4.4 Reservoir Properties
The reservoir properties for the Basement are unchanged from our 2013 CPR. Recent work on Lancaster would suggest the possibility of a tighter porosity range but with uncertainties associated with Whirlwind it was considered prudent to maintain the larger range. For the overlying limestone, RPS reviewed the log analysis conducted by Schlumberger and concurred with their analysis. Porosity values were calculated to be in the range 1-3%. It is possible that these are underestimated due to fracturing in the Limestone but at this stage it is our view that the logs are of good quality and should be honoured. The evaluation of water saturations was based on the porosity being predominantly from fracturing which is reflected in the relatively low saturation values.
7.4.5 Contacts
For the discovered basement, a Hydrocarbon Down To (“HDT”) was defined at the base of well 205/21a-5 at 3,176 m TVDSS. The maximum contact was taken at the mapped Basement spill, 3,200 m TVDSS. This depth also equates to the oil depth in the Rona sand in well 205/22-1a. In estimating Prospective Resources, Hurricane assumed pay in a 200 m section below the mapped closure. This can be considered to be conservative when compared to the discovered 400 m section demonstrated in Lancaster. RPS adopted the pay thickness assumed by Hurricane as being reasonable. For the overlying Valhall Limestone, (Figure 7.32B), a minimum closure of 3,038 m TVDSS, an HDT in well
3400m TVDSS
Prospective
Closure
3200m TVDSS
Discovered
Closure
3038m TVDSS ODT
Valhall pinchout
B
Prospective Closure
Discovered Closure
Whirlwind 205/21a-5
3200m TVDSS
3038m TVDSS
Valhall ODT in 205/21a-5
After Hurricane
Onlap of Valhall Lst and
pinchout on to Basement
structure
3400m TVDSS
A
W E
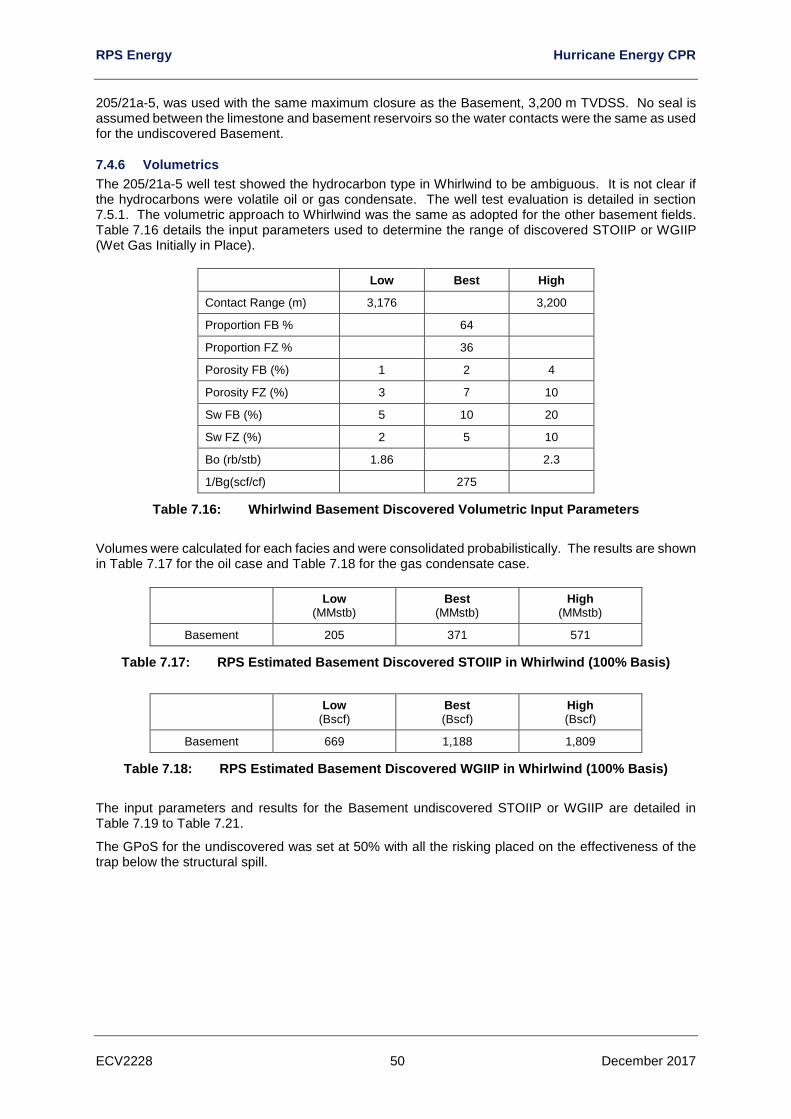
RPS Energy Hurricane Energy CPR
ECV2228 50 December 2017
205/21a-5, was used with the same maximum closure as the Basement, 3,200 m TVDSS. No seal is assumed between the limestone and basement reservoirs so the water contacts were the same as used for the undiscovered Basement.
7.4.6 Volumetrics
The 205/21a-5 well test showed the hydrocarbon type in Whirlwind to be ambiguous. It is not clear if the hydrocarbons were volatile oil or gas condensate. The well test evaluation is detailed in section 7.5.1. The volumetric approach to Whirlwind was the same as adopted for the other basement fields. Table 7.16 details the input parameters used to determine the range of discovered STOIIP or WGIIP (Wet Gas Initially in Place).
Low Best High
Contact Range (m) 3,176 3,200
Proportion FB % 64
Proportion FZ % 36
Porosity FB (%) 1 2 4
Porosity FZ (%) 3 7 10
Sw FB (%) 5 10 20
Sw FZ (%) 2 5 10
Bo (rb/stb) 1.86 2.3
1/Bg(scf/cf) 275
Table 7.16: Whirlwind Basement Discovered Volumetric Input Parameters
Volumes were calculated for each facies and were consolidated probabilistically. The results are shown in Table 7.17 for the oil case and Table 7.18 for the gas condensate case.
Low (MMstb)
Best (MMstb)
High (MMstb)
Basement 205 371 571
Table 7.17: RPS Estimated Basement Discovered STOIIP in Whirlwind (100% Basis)
Low (Bscf)
Best (Bscf)
High (Bscf)
Basement 669 1,188 1,809
Table 7.18: RPS Estimated Basement Discovered WGIIP in Whirlwind (100% Basis)
The input parameters and results for the Basement undiscovered STOIIP or WGIIP are detailed in Table 7.19 to Table 7.21.
The GPoS for the undiscovered was set at 50% with all the risking placed on the effectiveness of the trap below the structural spill.
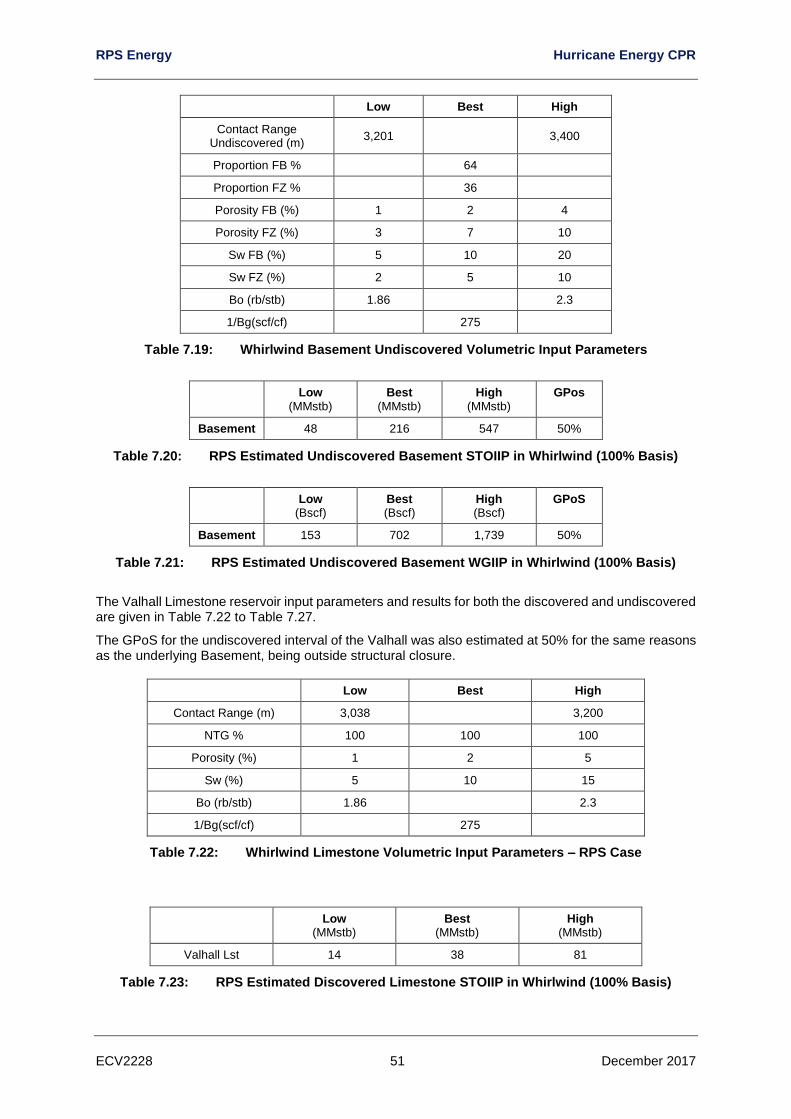
RPS Energy Hurricane Energy CPR
ECV2228 51 December 2017
Low Best High
Contact Range Undiscovered (m)
3,201 3,400
Proportion FB % 64
Proportion FZ % 36
Porosity FB (%) 1 2 4
Porosity FZ (%) 3 7 10
Sw FB (%) 5 10 20
Sw FZ (%) 2 5 10
Bo (rb/stb) 1.86 2.3
1/Bg(scf/cf) 275
Table 7.19: Whirlwind Basement Undiscovered Volumetric Input Parameters
Low (MMstb)
Best (MMstb)
High (MMstb)
GPos
Basement 48 216 547 50%
Table 7.20: RPS Estimated Undiscovered Basement STOIIP in Whirlwind (100% Basis)
Low (Bscf)
Best (Bscf)
High (Bscf)
GPoS
Basement 153 702 1,739 50%
Table 7.21: RPS Estimated Undiscovered Basement WGIIP in Whirlwind (100% Basis)
The Valhall Limestone reservoir input parameters and results for both the discovered and undiscovered are given in Table 7.22 to Table 7.27.
The GPoS for the undiscovered interval of the Valhall was also estimated at 50% for the same reasons as the underlying Basement, being outside structural closure.
Low Best High
Contact Range (m) 3,038 3,200
NTG % 100 100 100
Porosity (%) 1 2 5
Sw (%) 5 10 15
Bo (rb/stb) 1.86 2.3
1/Bg(scf/cf) 275
Table 7.22: Whirlwind Limestone Volumetric Input Parameters – RPS Case
Low (MMstb)
Best (MMstb)
High (MMstb)
Valhall Lst 14 38 81
Table 7.23: RPS Estimated Discovered Limestone STOIIP in Whirlwind (100% Basis)
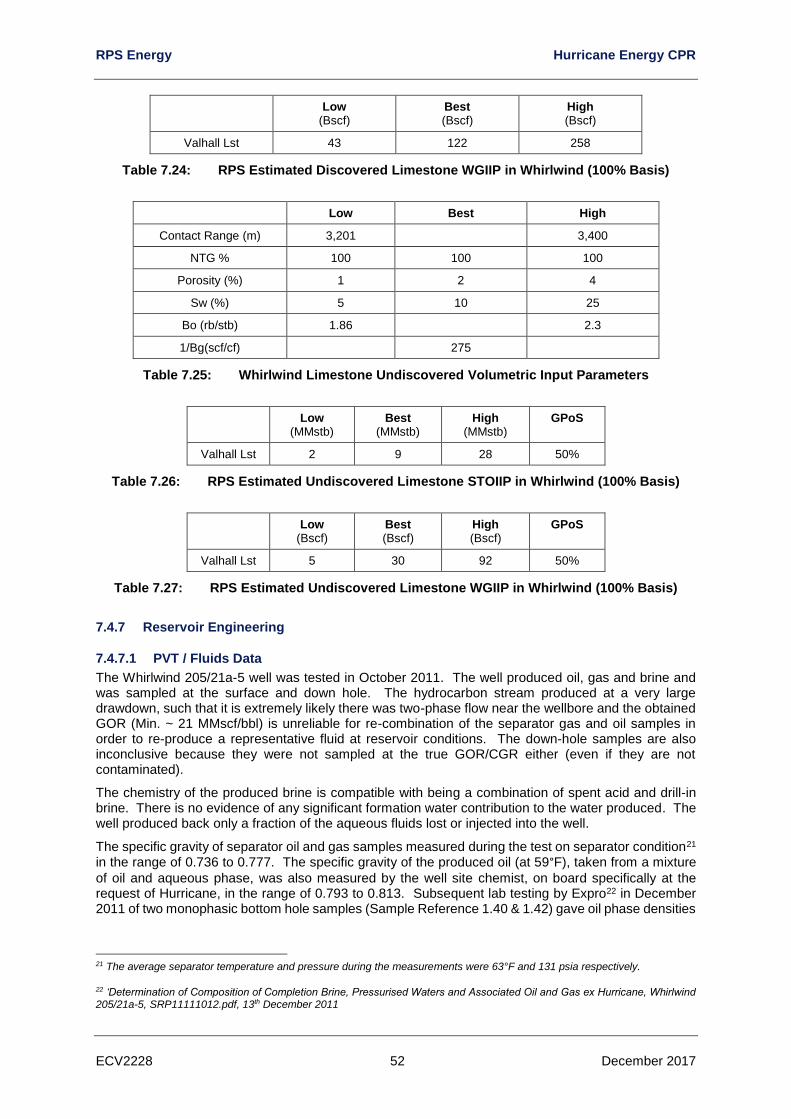
RPS Energy Hurricane Energy CPR
ECV2228 52 December 2017
Low (Bscf)
Best (Bscf)
High (Bscf)
Valhall Lst 43 122 258
Table 7.24: RPS Estimated Discovered Limestone WGIIP in Whirlwind (100% Basis)
Low Best High
Contact Range (m) 3,201 3,400
NTG % 100 100 100
Porosity (%) 1 2 4
Sw (%) 5 10 25
Bo (rb/stb) 1.86 2.3
1/Bg(scf/cf) 275
Table 7.25: Whirlwind Limestone Undiscovered Volumetric Input Parameters
Low (MMstb)
Best (MMstb)
High (MMstb)
GPoS
Valhall Lst 2 9 28 50%
Table 7.26: RPS Estimated Undiscovered Limestone STOIIP in Whirlwind (100% Basis)
Low (Bscf)
Best (Bscf)
High (Bscf)
GPoS
Valhall Lst 5 30 92 50%
Table 7.27: RPS Estimated Undiscovered Limestone WGIIP in Whirlwind (100% Basis)
7.4.7 Reservoir Engineering
7.4.7.1 PVT / Fluids Data
The Whirlwind 205/21a-5 well was tested in October 2011. The well produced oil, gas and brine and was sampled at the surface and down hole. The hydrocarbon stream produced at a very large drawdown, such that it is extremely likely there was two-phase flow near the wellbore and the obtained GOR (Min. ~ 21 MMscf/bbl) is unreliable for re-combination of the separator gas and oil samples in order to re-produce a representative fluid at reservoir conditions. The down-hole samples are also inconclusive because they were not sampled at the true GOR/CGR either (even if they are not contaminated).
The chemistry of the produced brine is compatible with being a combination of spent acid and drill-in brine. There is no evidence of any significant formation water contribution to the water produced. The well produced back only a fraction of the aqueous fluids lost or injected into the well.
The specific gravity of separator oil and gas samples measured during the test on separator condition21
in the range of 0.736 to 0.777. The specific gravity of the produced oil (at 59°F), taken from a mixture
of oil and aqueous phase, was also measured by the well site chemist, on board specifically at the request of Hurricane, in the range of 0.793 to 0.813. Subsequent lab testing by Expro22 in December 2011 of two monophasic bottom hole samples (Sample Reference 1.40 & 1.42) gave oil phase densities
21 The average separator temperature and pressure during the measurements were 63°F and 131 psia respectively.
22 ‘Determination of Composition of Completion Brine, Pressurised Waters and Associated Oil and Gas ex Hurricane, Whirlwind 205/21a-5, SRP11111012.pdf, 13th December 2011
RPS Energy Hurricane Energy CPR
ECV2228 53 December 2017
of 0.7750 and 0.7731 kg/L @ 60°F. The report notes an uncertainty range of +/- 0.0005 kg/L in the density measurements.
As will be explained in Section 7.4.7.3, the well was producing in an un-stabilised condition. At this un-stabilised condition with no availability of PVT data, it is very hard to classify the reservoir fluid type. Gas condensate accumulations may be approximately defined as those which produce light coloured
or colourless stock tank liquids with gravities above 45°API at gas oil ratios in the range of 5,000 to
100,000 scf/bbl23. However, proper classification of accumulations depends on:
• The composition of the hydrocarbon accumulation;
• The temperature and pressure of the accumulation in the reservoir.
While the temperatures and pressures generally increase with depth, a wide variety of pressure/temperature combinations can be found in naturally occurring accumulations. As a result of this, there are no distinct dividing lines between the types into which accumulations may be divided.
Based on the well test data, the hydrocarbon produced at a very high surface GOR, which could be considered either as a gas condensate or as a critical to volatile oil as a result of there being no pressure or fluid stabilisation during the test and also the GOR decreasing with time. However, whether close-to-critical volatile oil or gas condensate, the hydrocarbon fluid is liquid rich.
In conclusion, it is RPS’s view that the data supplied to date are not sufficient to unambiguously define the reservoir fluid and further appraisal is required to resolve the issue. As a result, RPS has calculated Resource estimates for both a volatile oil case and a gas condensate case representing the likely end-members of the possible fluid types that may exist in the reservoir.
For the gas condensate case, the gas condensate formation volume factor (Bg) at initial reservoir
pressure (5,100 psia) and reservoir temperature (106°C) is estimated to be 0.00363 cf/scf24 using a
produced gas gravity (0.69 to 0.71) and standard correlation.
For the volatile oil case, the range of oil formation factor, at the reservoir temperature and pressure, were estimated using Standing correlation25 at different range of oil gravity (0.78 to 0.8)26 and GOR (3,000 to 5,000 scf/stb) as 1.86 to 2.3 rb/stb. The selected range of GOR is the typical range of GOR for close-to critical volatile oil. This range of GOR is selected because the produced GOR is not representative of the actual GOR which can be obtained when there is only one phase near the wellbore.
RPS also recognises that further evidence of the fluid type is available from data other than well-test data. Specifically, it is noted that the geochemical analysis of the side-wall cores suggests light oil. The well 205/22-1a, drilled by BP into the flank of the structure, encountered light oil in the Rona Sand which overlies the Basement reservoir. The offset BP 204/23-1 well, to the west of Whirlwind which tested
gas condensate (48.3° API condensate) had no indication of oil shows in the cored fractured basement
interval tested. Whirlwind, as mentioned above, has oil shows which may add weight to the fluid being light oil.
7.4.7.2 Rock Properties / SCAL Data
No core or SCAL data were available for Whirlwind in either the basement or Valhall limestone sections.
7.4.7.3 Well Test Data
In 1974, BP drilled 205/22-1a on the southern side of the Whirlwind structure and found oil overlying the basement in non-reservoir sandstone. In 2010 Hurricane drilled another well (205/21a-5) and found indications of oil in the thick Valhall limestone and the underlying fractured basement. However, onset of bad weather meant the well had to be suspended before it could be tested.
23 Applied Petroleum Reservoir Engineering, 2nd Edition, Craft, B.C. & Hawkins, M. 1991
24 Applied Petroleum Reservoir Engineering, 2nd Edition, Craft, B.C. & Hawkins, M. 1991
25 Phase Behaviour, Whitson, C.H. & Brule, M.R. SPE Monograph Volume 20, 2000
26 To cover uncertainty in the oil gravity measurements
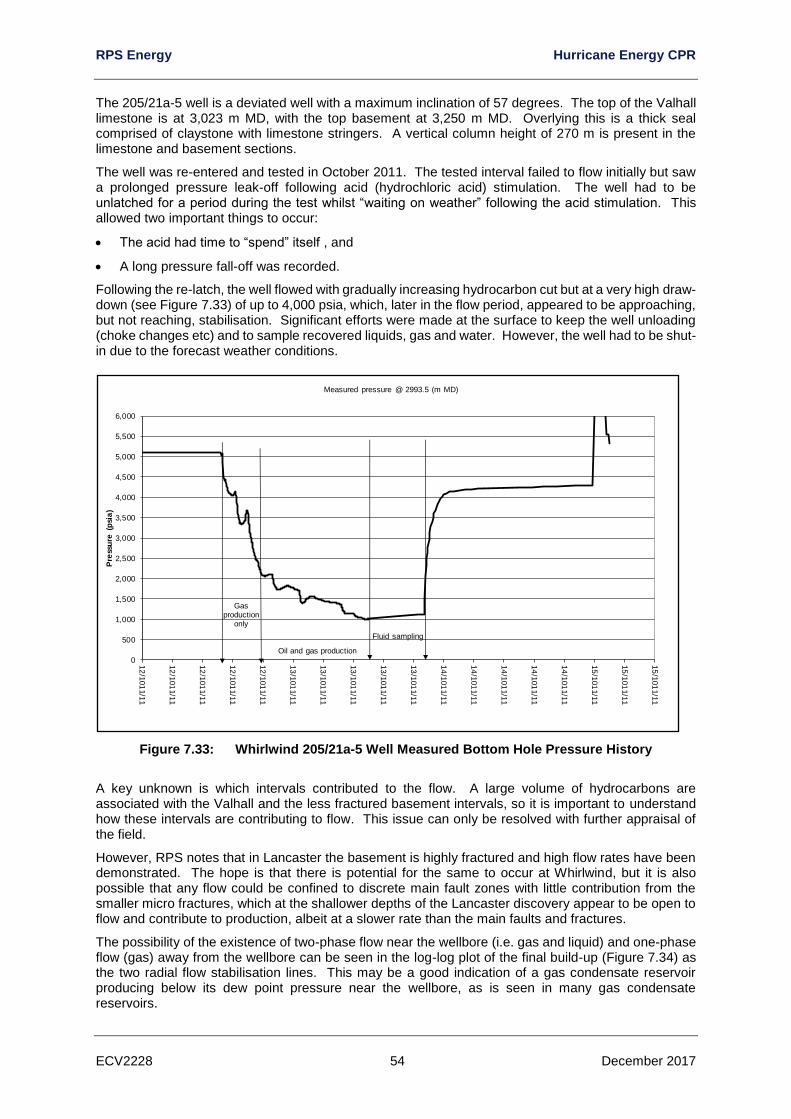
RPS Energy Hurricane Energy CPR
ECV2228 54 December 2017
The 205/21a-5 well is a deviated well with a maximum inclination of 57 degrees. The top of the Valhall limestone is at 3,023 m MD, with the top basement at 3,250 m MD. Overlying this is a thick seal comprised of claystone with limestone stringers. A vertical column height of 270 m is present in the limestone and basement sections.
The well was re-entered and tested in October 2011. The tested interval failed to flow initially but saw a prolonged pressure leak-off following acid (hydrochloric acid) stimulation. The well had to be unlatched for a period during the test whilst “waiting on weather” following the acid stimulation. This allowed two important things to occur:
• The acid had time to “spend” itself , and
• A long pressure fall-off was recorded.
Following the re-latch, the well flowed with gradually increasing hydrocarbon cut but at a very high draw-down (see Figure 7.33) of up to 4,000 psia, which, later in the flow period, appeared to be approaching, but not reaching, stabilisation. Significant efforts were made at the surface to keep the well unloading (choke changes etc) and to sample recovered liquids, gas and water. However, the well had to be shut-in due to the forecast weather conditions.
Figure 7.33: Whirlwind 205/21a-5 Well Measured Bottom Hole Pressure History
A key unknown is which intervals contributed to the flow. A large volume of hydrocarbons are associated with the Valhall and the less fractured basement intervals, so it is important to understand how these intervals are contributing to flow. This issue can only be resolved with further appraisal of the field.
However, RPS notes that in Lancaster the basement is highly fractured and high flow rates have been demonstrated. The hope is that there is potential for the same to occur at Whirlwind, but it is also possible that any flow could be confined to discrete main fault zones with little contribution from the smaller micro fractures, which at the shallower depths of the Lancaster discovery appear to be open to flow and contribute to production, albeit at a slower rate than the main faults and fractures.
The possibility of the existence of two-phase flow near the wellbore (i.e. gas and liquid) and one-phase flow (gas) away from the wellbore can be seen in the log-log plot of the final build-up (Figure 7.34) as the two radial flow stabilisation lines. This may be a good indication of a gas condensate reservoir producing below its dew point pressure near the wellbore, as is seen in many gas condensate reservoirs.
0
500
1,000
1,500
2,000
2,500
3,000
3,500
4,000
4,500
5,000
5,500
6,000
12
/101
1/1
1
12
/101
1/1
1
12
/101
1/1
1
12
/101
1/1
1
12
/101
1/1
1
13
/101
1/1
1
13
/101
1/1
1
13
/101
1/1
1
13
/101
1/1
1
13
/101
1/1
1
14
/101
1/1
1
14
/101
1/1
1
14
/101
1/1
1
14
/101
1/1
1
14
/101
1/1
1
15
/101
1/1
1
15
/101
1/1
1
15
/101
1/1
1
Pre
ssu
re (
psi
a)
Measured pressure @ 2993.5 (m MD)
Gas production
only
Oil and gas production
Fluid sampling
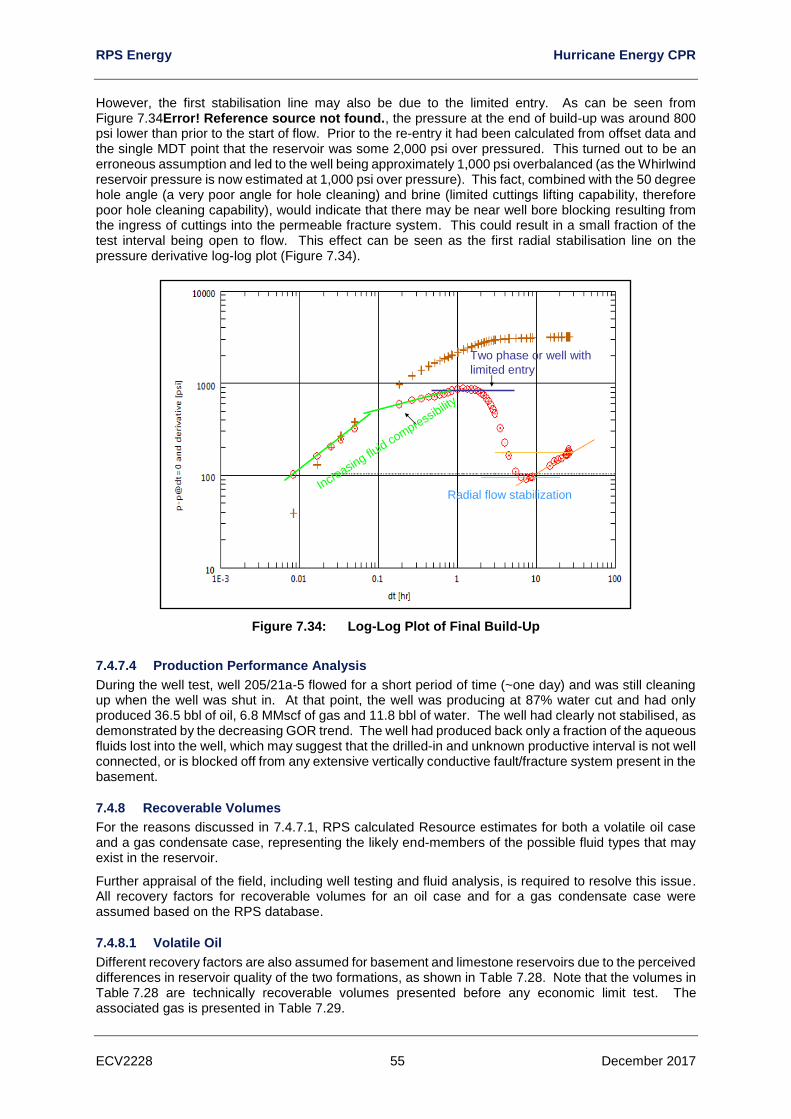
RPS Energy Hurricane Energy CPR
ECV2228 55 December 2017
However, the first stabilisation line may also be due to the limited entry. As can be seen from Figure 7.34Error! Reference source not found., the pressure at the end of build-up was around 800 psi lower than prior to the start of flow. Prior to the re-entry it had been calculated from offset data and the single MDT point that the reservoir was some 2,000 psi over pressured. This turned out to be an erroneous assumption and led to the well being approximately 1,000 psi overbalanced (as the Whirlwind reservoir pressure is now estimated at 1,000 psi over pressure). This fact, combined with the 50 degree hole angle (a very poor angle for hole cleaning) and brine (limited cuttings lifting capability, therefore poor hole cleaning capability), would indicate that there may be near well bore blocking resulting from the ingress of cuttings into the permeable fracture system. This could result in a small fraction of the test interval being open to flow. This effect can be seen as the first radial stabilisation line on the pressure derivative log-log plot (Figure 7.34).
Figure 7.34: Log-Log Plot of Final Build-Up
7.4.7.4 Production Performance Analysis
During the well test, well 205/21a-5 flowed for a short period of time (~one day) and was still cleaning up when the well was shut in. At that point, the well was producing at 87% water cut and had only produced 36.5 bbl of oil, 6.8 MMscf of gas and 11.8 bbl of water. The well had clearly not stabilised, as demonstrated by the decreasing GOR trend. The well had produced back only a fraction of the aqueous fluids lost into the well, which may suggest that the drilled-in and unknown productive interval is not well connected, or is blocked off from any extensive vertically conductive fault/fracture system present in the basement.
7.4.8 Recoverable Volumes
For the reasons discussed in 7.4.7.1, RPS calculated Resource estimates for both a volatile oil case and a gas condensate case, representing the likely end-members of the possible fluid types that may exist in the reservoir.
Further appraisal of the field, including well testing and fluid analysis, is required to resolve this issue. All recovery factors for recoverable volumes for an oil case and for a gas condensate case were assumed based on the RPS database.
7.4.8.1 Volatile Oil
Different recovery factors are also assumed for basement and limestone reservoirs due to the perceived differences in reservoir quality of the two formations, as shown in Table 7.28. Note that the volumes in Table 7.28 are technically recoverable volumes presented before any economic limit test. The associated gas is presented in Table 7.29.
Two phase or well with
limited entry
Increasing flu
id compressibilit
y
Radial flow stabilization
Two phase or well with
limited entry
Increasing flu
id compressibilit
y
Radial flow stabilization
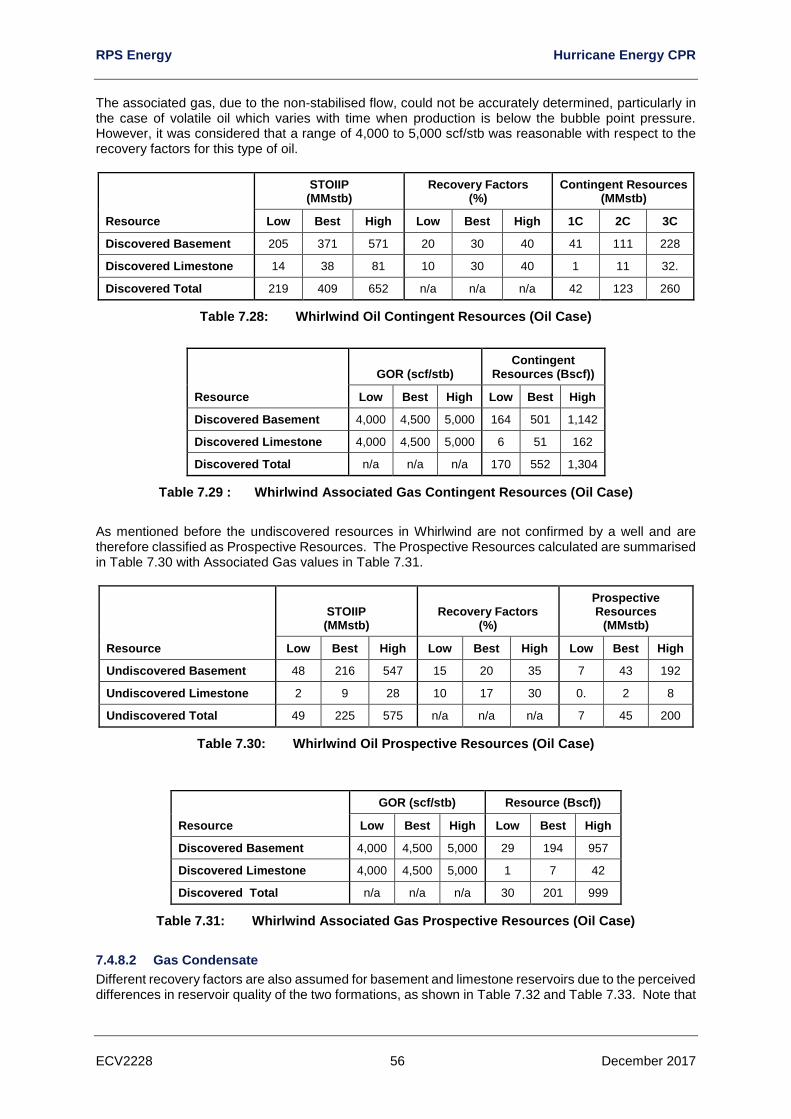
RPS Energy Hurricane Energy CPR
ECV2228 56 December 2017
The associated gas, due to the non-stabilised flow, could not be accurately determined, particularly in the case of volatile oil which varies with time when production is below the bubble point pressure. However, it was considered that a range of 4,000 to 5,000 scf/stb was reasonable with respect to the recovery factors for this type of oil.
Resource
STOIIP (MMstb)
Recovery Factors (%)
Contingent Resources (MMstb)
Low Best High Low Best High 1C 2C 3C
Discovered Basement 205 371 571 20 30 40 41 111 228
Discovered Limestone 14 38 81 10 30 40 1 11 32.
Discovered Total 219 409 652 n/a n/a n/a 42 123 260
Table 7.28: Whirlwind Oil Contingent Resources (Oil Case)
Resource
GOR (scf/stb) Contingent
Resources (Bscf))
Low Best High Low Best High
Discovered Basement 4,000 4,500 5,000 164 501 1,142
Discovered Limestone 4,000 4,500 5,000 6 51 162
Discovered Total n/a n/a n/a 170 552 1,304
Table 7.29 : Whirlwind Associated Gas Contingent Resources (Oil Case)
As mentioned before the undiscovered resources in Whirlwind are not confirmed by a well and are therefore classified as Prospective Resources. The Prospective Resources calculated are summarised in Table 7.30 with Associated Gas values in Table 7.31.
Resource
STOIIP (MMstb)
Recovery Factors (%)
Prospective Resources
(MMstb)
Low Best High Low Best High Low Best High
Undiscovered Basement 48 216 547 15 20 35 7 43 192
Undiscovered Limestone 2 9 28 10 17 30 0. 2 8
Undiscovered Total 49 225 575 n/a n/a n/a 7 45 200
Table 7.30: Whirlwind Oil Prospective Resources (Oil Case)
Resource
GOR (scf/stb) Resource (Bscf))
Low Best High Low Best High
Discovered Basement 4,000 4,500 5,000 29 194 957
Discovered Limestone 4,000 4,500 5,000 1 7 42
Discovered Total n/a n/a n/a 30 201 999
Table 7.31: Whirlwind Associated Gas Prospective Resources (Oil Case)
7.4.8.2 Gas Condensate
Different recovery factors are also assumed for basement and limestone reservoirs due to the perceived differences in reservoir quality of the two formations, as shown in Table 7.32 and Table 7.33. Note that
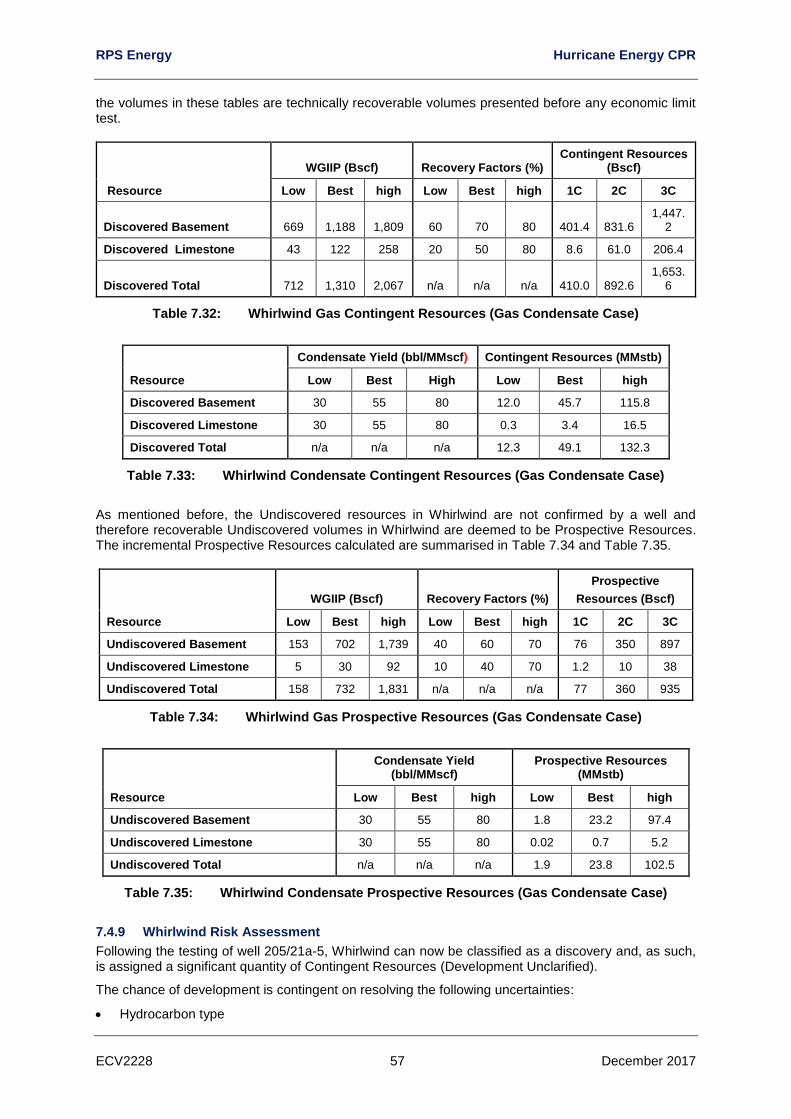
RPS Energy Hurricane Energy CPR
ECV2228 57 December 2017
the volumes in these tables are technically recoverable volumes presented before any economic limit test.
Resource
WGIIP (Bscf) Recovery Factors (%) Contingent Resources
(Bscf)
Low Best high Low Best high 1C 2C 3C
Discovered Basement 669 1,188 1,809 60 70 80 401.4 831.6 1,447.
2
Discovered Limestone 43 122 258 20 50 80 8.6 61.0 206.4
Discovered Total 712 1,310 2,067 n/a n/a n/a 410.0 892.6 1,653.
6
Table 7.32: Whirlwind Gas Contingent Resources (Gas Condensate Case)
Resource
Condensate Yield (bbl/MMscf) Contingent Resources (MMstb)
Low Best High Low Best high
Discovered Basement 30 55 80 12.0 45.7 115.8
Discovered Limestone 30 55 80 0.3 3.4 16.5
Discovered Total n/a n/a n/a 12.3 49.1 132.3
Table 7.33: Whirlwind Condensate Contingent Resources (Gas Condensate Case)
As mentioned before, the Undiscovered resources in Whirlwind are not confirmed by a well and therefore recoverable Undiscovered volumes in Whirlwind are deemed to be Prospective Resources. The incremental Prospective Resources calculated are summarised in Table 7.34 and Table 7.35.
Resource
WGIIP (Bscf) Recovery Factors (%)
Prospective
Resources (Bscf)
Low Best high Low Best high 1C 2C 3C
Undiscovered Basement 153 702 1,739 40 60 70 76 350 897
Undiscovered Limestone 5 30 92 10 40 70 1.2 10 38
Undiscovered Total 158 732 1,831 n/a n/a n/a 77 360 935
Table 7.34: Whirlwind Gas Prospective Resources (Gas Condensate Case)
Resource
Condensate Yield (bbl/MMscf)
Prospective Resources (MMstb)
Low Best high Low Best high
Undiscovered Basement 30 55 80 1.8 23.2 97.4
Undiscovered Limestone 30 55 80 0.02 0.7 5.2
Undiscovered Total n/a n/a n/a 1.9 23.8 102.5
Table 7.35: Whirlwind Condensate Prospective Resources (Gas Condensate Case)
7.4.9 Whirlwind Risk Assessment
Following the testing of well 205/21a-5, Whirlwind can now be classified as a discovery and, as such, is assigned a significant quantity of Contingent Resources (Development Unclarified).
The chance of development is contingent on resolving the following uncertainties:
• Hydrocarbon type
RPS Energy Hurricane Energy CPR
ECV2228 58 December 2017
• Fracture propensity and distribution
• Interconnectivity of fracture network (pending interference testing)
• OWC depth
• Demonstration of commercial flow rates from a well test
• Water production potential and subsequent water handling requirements
• Full field development plan (number of wells required, drill centre locations)
• The Lancaster development, which could be considered to be the host facility for Whirlwind hydrocarbons
The Whirlwind discovery requires further appraisal to resolve the existing uncertainties, particularly the fluid type.
In addition, the nature of the reservoir and trap means that an, as yet, undiscovered volume of potential Resources are prognosed to exist below the current discovered volumes. Therefore, Whirlwind is also assigned a volume of Prospective Resources, which has an associated GPoS (chance of discovery) of 25%.
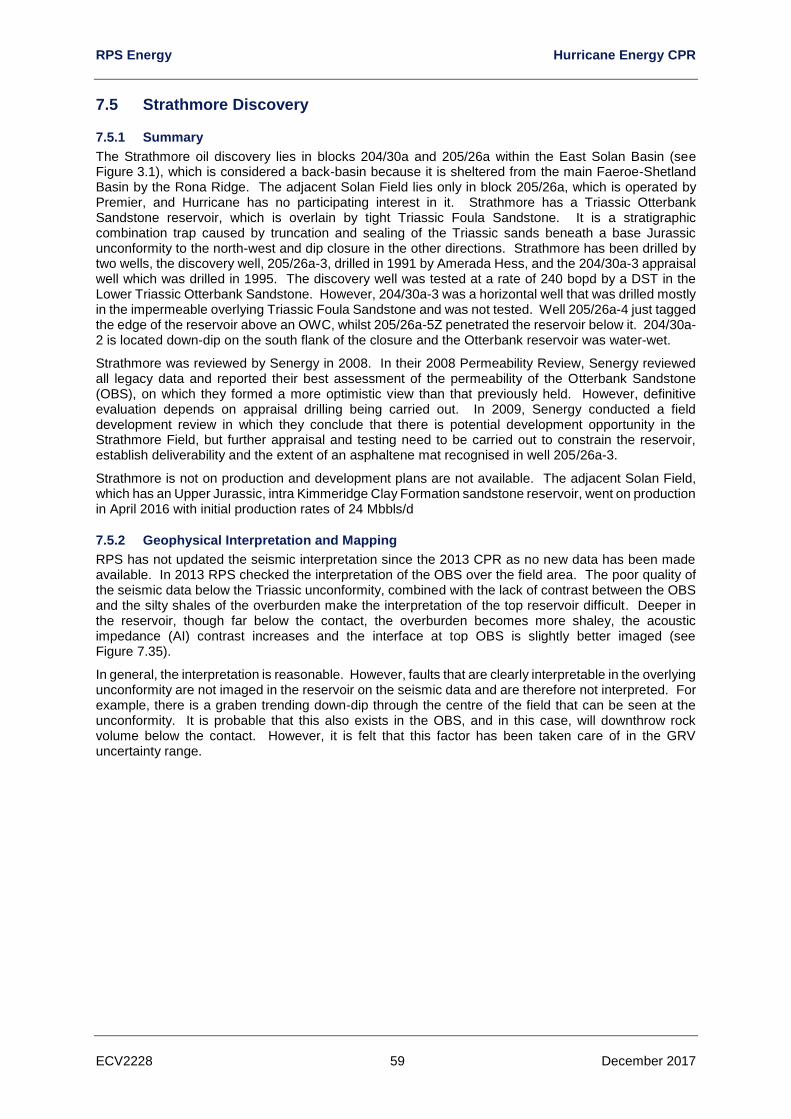
RPS Energy Hurricane Energy CPR
ECV2228 59 December 2017
7.5 Strathmore Discovery
7.5.1 Summary
The Strathmore oil discovery lies in blocks 204/30a and 205/26a within the East Solan Basin (see Figure 3.1), which is considered a back-basin because it is sheltered from the main Faeroe-Shetland Basin by the Rona Ridge. The adjacent Solan Field lies only in block 205/26a, which is operated by Premier, and Hurricane has no participating interest in it. Strathmore has a Triassic Otterbank Sandstone reservoir, which is overlain by tight Triassic Foula Sandstone. It is a stratigraphic combination trap caused by truncation and sealing of the Triassic sands beneath a base Jurassic unconformity to the north-west and dip closure in the other directions. Strathmore has been drilled by two wells, the discovery well, 205/26a-3, drilled in 1991 by Amerada Hess, and the 204/30a-3 appraisal well which was drilled in 1995. The discovery well was tested at a rate of 240 bopd by a DST in the Lower Triassic Otterbank Sandstone. However, 204/30a-3 was a horizontal well that was drilled mostly in the impermeable overlying Triassic Foula Sandstone and was not tested. Well 205/26a-4 just tagged the edge of the reservoir above an OWC, whilst 205/26a-5Z penetrated the reservoir below it. 204/30a-2 is located down-dip on the south flank of the closure and the Otterbank reservoir was water-wet.
Strathmore was reviewed by Senergy in 2008. In their 2008 Permeability Review, Senergy reviewed all legacy data and reported their best assessment of the permeability of the Otterbank Sandstone (OBS), on which they formed a more optimistic view than that previously held. However, definitive evaluation depends on appraisal drilling being carried out. In 2009, Senergy conducted a field development review in which they conclude that there is potential development opportunity in the Strathmore Field, but further appraisal and testing need to be carried out to constrain the reservoir, establish deliverability and the extent of an asphaltene mat recognised in well 205/26a-3.
Strathmore is not on production and development plans are not available. The adjacent Solan Field, which has an Upper Jurassic, intra Kimmeridge Clay Formation sandstone reservoir, went on production in April 2016 with initial production rates of 24 Mbbls/d
7.5.2 Geophysical Interpretation and Mapping
RPS has not updated the seismic interpretation since the 2013 CPR as no new data has been made available. In 2013 RPS checked the interpretation of the OBS over the field area. The poor quality of the seismic data below the Triassic unconformity, combined with the lack of contrast between the OBS and the silty shales of the overburden make the interpretation of the top reservoir difficult. Deeper in the reservoir, though far below the contact, the overburden becomes more shaley, the acoustic impedance (AI) contrast increases and the interface at top OBS is slightly better imaged (see Figure 7.35).
In general, the interpretation is reasonable. However, faults that are clearly interpretable in the overlying unconformity are not imaged in the reservoir on the seismic data and are therefore not interpreted. For example, there is a graben trending down-dip through the centre of the field that can be seen at the unconformity. It is probable that this also exists in the OBS, and in this case, will downthrow rock volume below the contact. However, it is felt that this factor has been taken care of in the GRV uncertainty range.
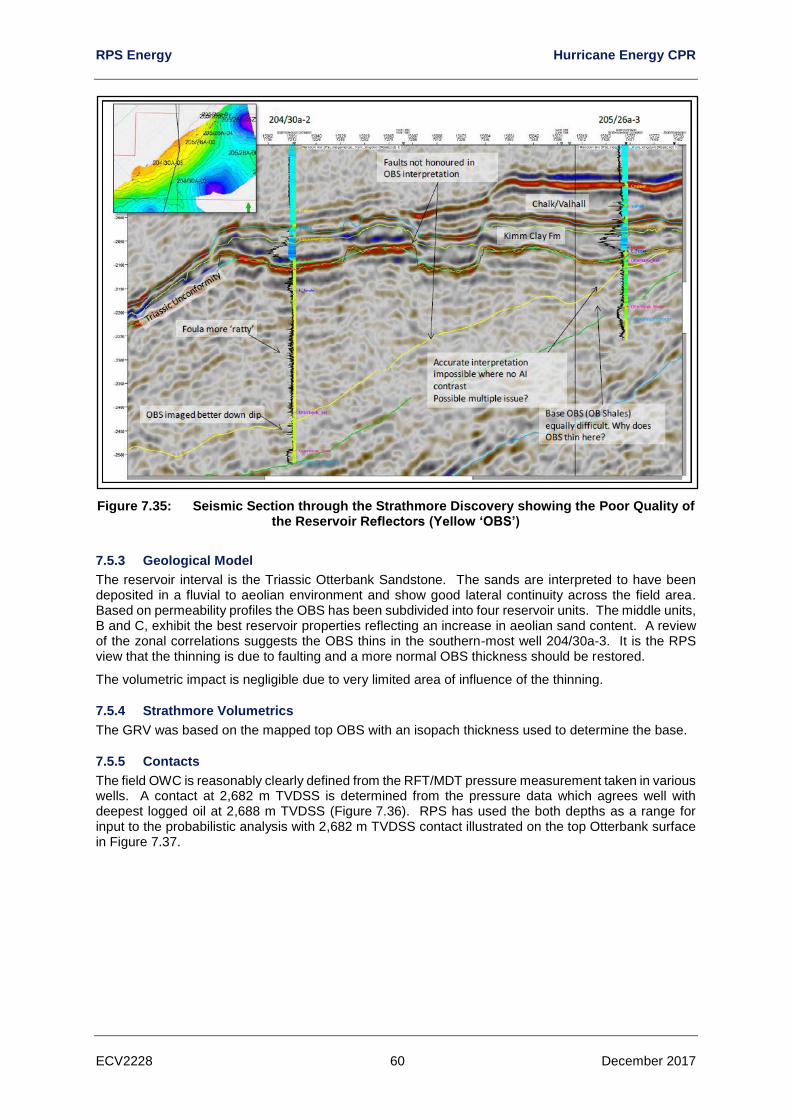
RPS Energy Hurricane Energy CPR
ECV2228 60 December 2017
Figure 7.35: Seismic Section through the Strathmore Discovery showing the Poor Quality of the Reservoir Reflectors (Yellow ‘OBS’)
7.5.3 Geological Model
The reservoir interval is the Triassic Otterbank Sandstone. The sands are interpreted to have been deposited in a fluvial to aeolian environment and show good lateral continuity across the field area. Based on permeability profiles the OBS has been subdivided into four reservoir units. The middle units, B and C, exhibit the best reservoir properties reflecting an increase in aeolian sand content. A review of the zonal correlations suggests the OBS thins in the southern-most well 204/30a-3. It is the RPS view that the thinning is due to faulting and a more normal OBS thickness should be restored.
The volumetric impact is negligible due to very limited area of influence of the thinning.
7.5.4 Strathmore Volumetrics
The GRV was based on the mapped top OBS with an isopach thickness used to determine the base.
7.5.5 Contacts
The field OWC is reasonably clearly defined from the RFT/MDT pressure measurement taken in various wells. A contact at 2,682 m TVDSS is determined from the pressure data which agrees well with deepest logged oil at 2,688 m TVDSS (Figure 7.36). RPS has used the both depths as a range for input to the probabilistic analysis with 2,682 m TVDSS contact illustrated on the top Otterbank surface in Figure 7.37.
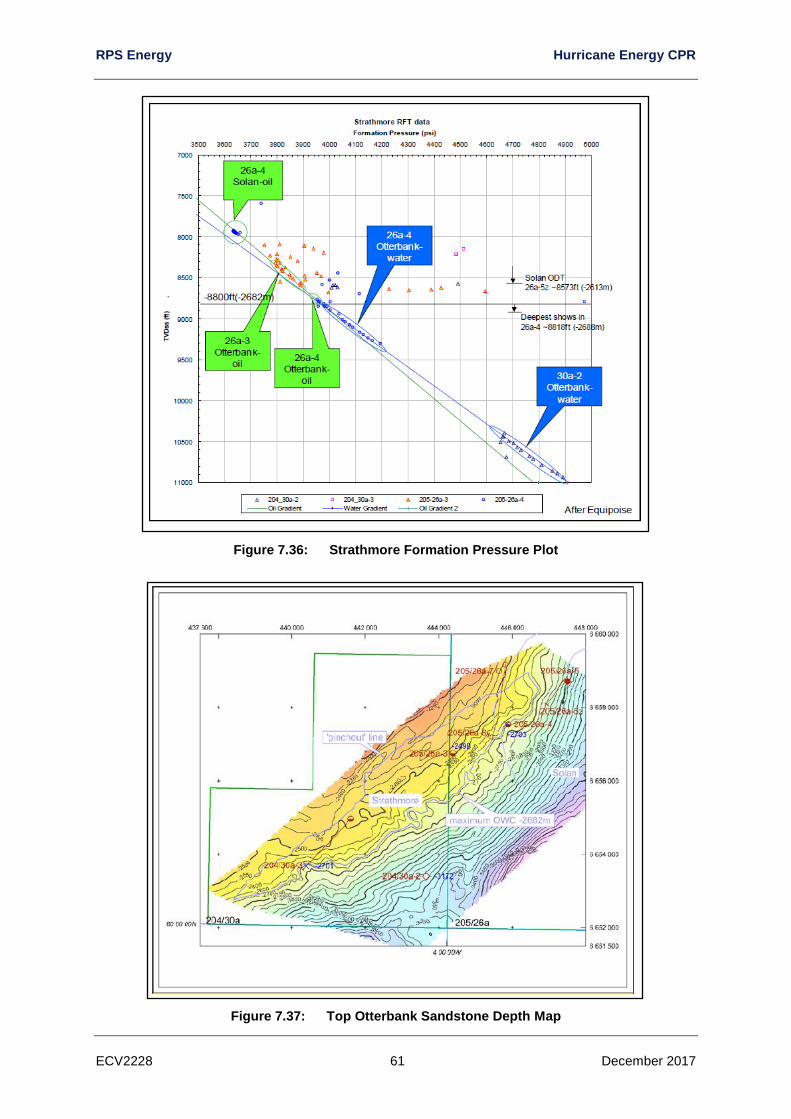
RPS Energy Hurricane Energy CPR
ECV2228 61 December 2017
Figure 7.36: Strathmore Formation Pressure Plot
Figure 7.37: Top Otterbank Sandstone Depth Map
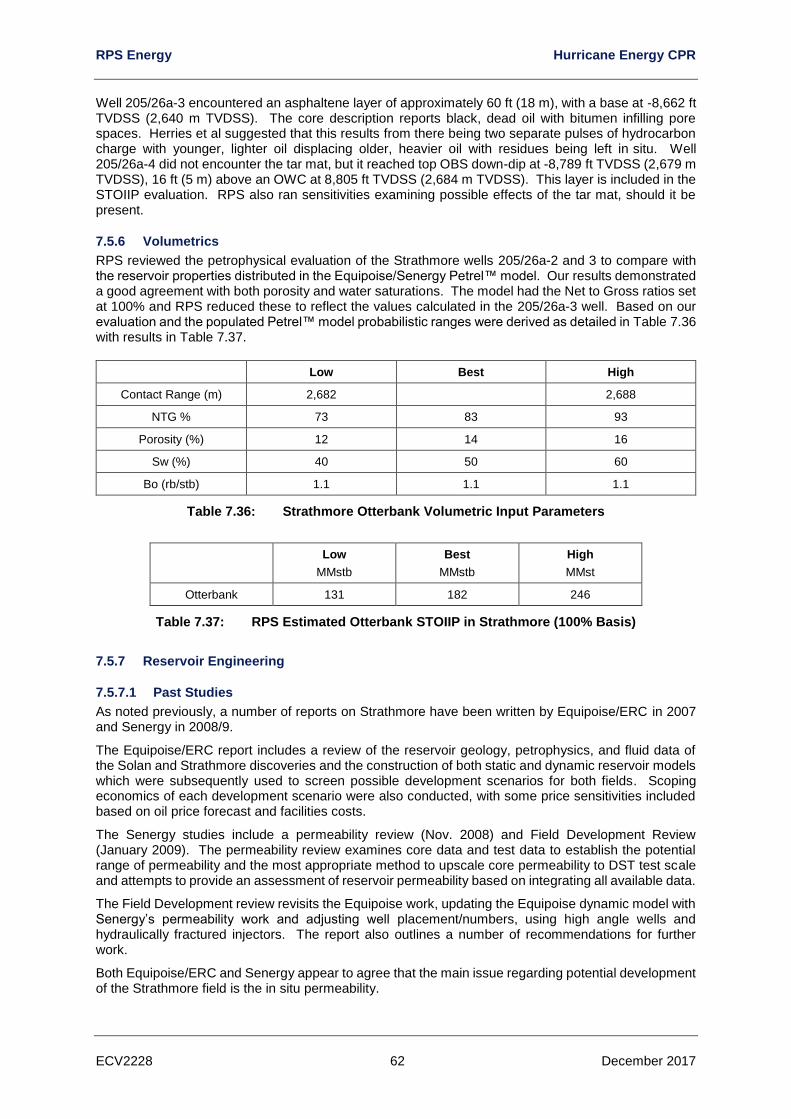
RPS Energy Hurricane Energy CPR
ECV2228 62 December 2017
Well 205/26a-3 encountered an asphaltene layer of approximately 60 ft (18 m), with a base at 8,662 ft TVDSS (2,640 m TVDSS). The core description reports black, dead oil with bitumen infilling pore spaces. Herries et al suggested that this results from there being two separate pulses of hydrocarbon charge with younger, lighter oil displacing older, heavier oil with residues being left in situ. Well 205/26a-4 did not encounter the tar mat, but it reached top OBS down-dip at -8,789 ft TVDSS (2,679 m TVDSS), 16 ft (5 m) above an OWC at 8,805 ft TVDSS (2,684 m TVDSS). This layer is included in the STOIIP evaluation. RPS also ran sensitivities examining possible effects of the tar mat, should it be present.
7.5.6 Volumetrics
RPS reviewed the petrophysical evaluation of the Strathmore wells 205/26a-2 and 3 to compare with the reservoir properties distributed in the Equipoise/Senergy Petrel™ model. Our results demonstrated a good agreement with both porosity and water saturations. The model had the Net to Gross ratios set at 100% and RPS reduced these to reflect the values calculated in the 205/26a-3 well. Based on our evaluation and the populated Petrel™ model probabilistic ranges were derived as detailed in Table 7.36 with results in Table 7.37.
Low Best High
Contact Range (m) 2,682 2,688
NTG % 73 83 93
Porosity (%) 12 14 16
Sw (%) 40 50 60
Bo (rb/stb) 1.1 1.1 1.1
Table 7.36: Strathmore Otterbank Volumetric Input Parameters
Low
MMstb
Best
MMstb
High
MMst
Otterbank 131 182 246
Table 7.37: RPS Estimated Otterbank STOIIP in Strathmore (100% Basis)
7.5.7 Reservoir Engineering
7.5.7.1 Past Studies
As noted previously, a number of reports on Strathmore have been written by Equipoise/ERC in 2007 and Senergy in 2008/9.
The Equipoise/ERC report includes a review of the reservoir geology, petrophysics, and fluid data of the Solan and Strathmore discoveries and the construction of both static and dynamic reservoir models which were subsequently used to screen possible development scenarios for both fields. Scoping economics of each development scenario were also conducted, with some price sensitivities included based on oil price forecast and facilities costs.
The Senergy studies include a permeability review (Nov. 2008) and Field Development Review (January 2009). The permeability review examines core data and test data to establish the potential range of permeability and the most appropriate method to upscale core permeability to DST test scale and attempts to provide an assessment of reservoir permeability based on integrating all available data.
The Field Development review revisits the Equipoise work, updating the Equipoise dynamic model with Senergy’s permeability work and adjusting well placement/numbers, using high angle wells and hydraulically fractured injectors. The report also outlines a number of recommendations for further work.
Both Equipoise/ERC and Senergy appear to agree that the main issue regarding potential development of the Strathmore field is the in situ permeability.
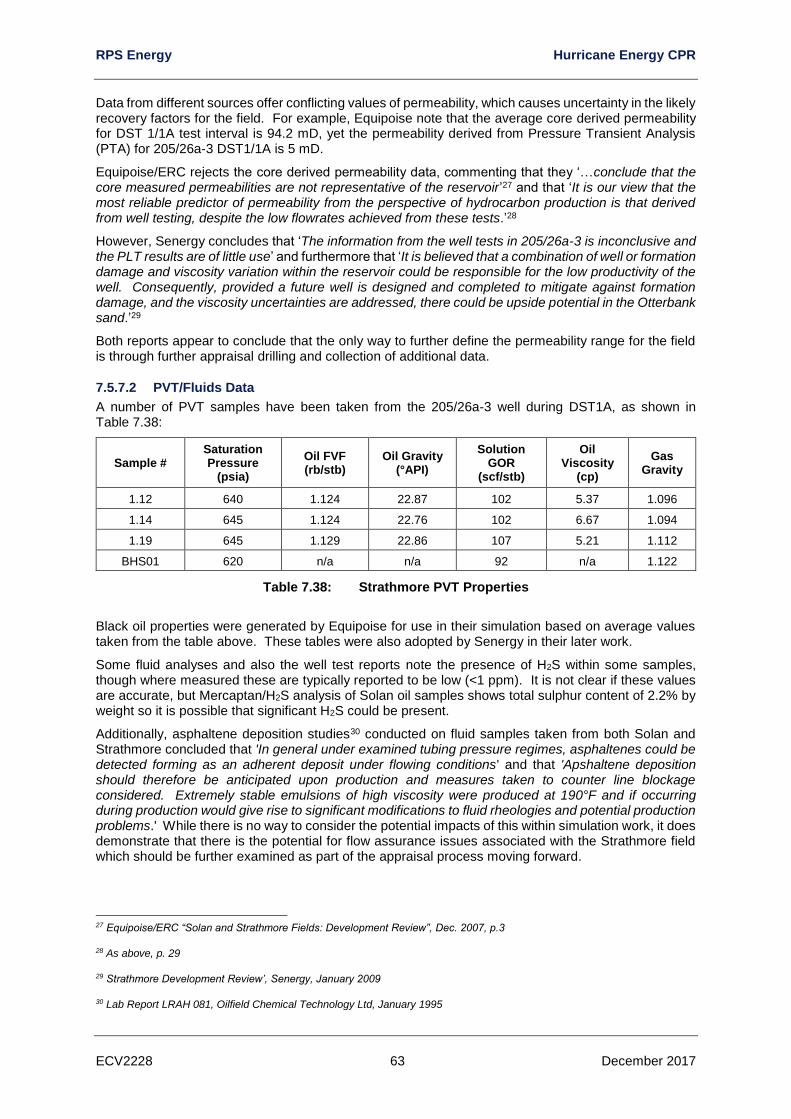
RPS Energy Hurricane Energy CPR
ECV2228 63 December 2017
Data from different sources offer conflicting values of permeability, which causes uncertainty in the likely recovery factors for the field. For example, Equipoise note that the average core derived permeability for DST 1/1A test interval is 94.2 mD, yet the permeability derived from Pressure Transient Analysis (PTA) for 205/26a-3 DST1/1A is 5 mD.
Equipoise/ERC rejects the core derived permeability data, commenting that they ‘…conclude that the core measured permeabilities are not representative of the reservoir’27 and that ‘It is our view that the most reliable predictor of permeability from the perspective of hydrocarbon production is that derived from well testing, despite the low flowrates achieved from these tests.’28
However, Senergy concludes that ‘The information from the well tests in 205/26a-3 is inconclusive and the PLT results are of little use’ and furthermore that ‘It is believed that a combination of well or formation damage and viscosity variation within the reservoir could be responsible for the low productivity of the well. Consequently, provided a future well is designed and completed to mitigate against formation damage, and the viscosity uncertainties are addressed, there could be upside potential in the Otterbank sand.’29
Both reports appear to conclude that the only way to further define the permeability range for the field is through further appraisal drilling and collection of additional data.
7.5.7.2 PVT/Fluids Data
A number of PVT samples have been taken from the 205/26a-3 well during DST1A, as shown in Table 7.38:
Sample # Saturation Pressure
(psia)
Oil FVF (rb/stb)
Oil Gravity (°API)
Solution GOR
(scf/stb)
Oil Viscosity
(cp)
Gas Gravity
1.12 640 1.124 22.87 102 5.37 1.096
1.14 645 1.124 22.76 102 6.67 1.094
1.19 645 1.129 22.86 107 5.21 1.112
BHS01 620 n/a n/a 92 n/a 1.122
Table 7.38: Strathmore PVT Properties
Black oil properties were generated by Equipoise for use in their simulation based on average values taken from the table above. These tables were also adopted by Senergy in their later work.
Some fluid analyses and also the well test reports note the presence of H2S within some samples, though where measured these are typically reported to be low (<1 ppm). It is not clear if these values are accurate, but Mercaptan/H2S analysis of Solan oil samples shows total sulphur content of 2.2% by weight so it is possible that significant H2S could be present.
Additionally, asphaltene deposition studies30 conducted on fluid samples taken from both Solan and Strathmore concluded that 'In general under examined tubing pressure regimes, asphaltenes could be detected forming as an adherent deposit under flowing conditions' and that 'Apshaltene deposition should therefore be anticipated upon production and measures taken to counter line blockage considered. Extremely stable emulsions of high viscosity were produced at 190°F and if occurring during production would give rise to significant modifications to fluid rheologies and potential production problems.' While there is no way to consider the potential impacts of this within simulation work, it does demonstrate that there is the potential for flow assurance issues associated with the Strathmore field which should be further examined as part of the appraisal process moving forward.
27 Equipoise/ERC “Solan and Strathmore Fields: Development Review”, Dec. 2007, p.3
28 As above, p. 29
29 Strathmore Development Review’, Senergy, January 2009
30 Lab Report LRAH 081, Oilfield Chemical Technology Ltd, January 1995
RPS Energy Hurricane Energy CPR
ECV2228 64 December 2017
7.5.7.3 Rock Properties/SCAL
There are no laboratory measurements of relative permeability on core plugs taken from Strathmore.
Equipoise assumed Corey-type relative permeability curves for water/oil flow and “straight line” relative permeability curves for gas/oil flow, using the following relative permeability end points.
Residual oil saturation: 0.20
Critical gas saturation: 0.05
End point oil relative permeability: 0.90
End point water relative permeability: 0.30
End point gas relative permeability: 0.90
Corey exponent (water): 2.50
Corey exponent (oil/water): 3.00
Corey exponent (gas): 1.00
Corey exponent (oil/gas): 1.00
Senergy used the same relative permeability tables in their work, as has RPS.
As discussed in Section 10.5.1, the main issue regarding rock properties in Strathmore relates to the permeability. There is considerable uncertainty about the true permeability of the Otterbank sandstone reservoir.
Four wells drilled and logged in the Otterbank, 204/30a-2 penetrated a full sequence of Otterbank (179m) below the OWC. 204/30a-3 penetrated a partial sequence of Otterbank, also below the OWC. 205/26a-3 (the Strathmore discovery well) encountered a full sequence of Otterbank (187m) above the OWC, while 205/26a-4 encountered a full sequence of Otterbank (178m) but was drilled down dip of the discovery well and penetrated the reservoir just above the OWC.
Three sets of core data exist:
205/26a-3 air permeability data (cleaned and drilled core, 400 psia overburden)
205/26a-4 oil permeability data ('fresh state' core, 3,000 psia overburden)
205/26a-4 helium permeability data (cleaned and drilled core, 400 psia overburden)
The discrepancies between conventional gas permeabilities measured on core from the 205/26a-3 well and the well test derived permeabilities resulted in Hess conducting a series of special core analysis (SCAL). The Hess SCAL report31 comments that 'little sensitivity to the cleaning methods utilised was noted in the air permeability and SEM results, However, SEM did detect some damage to clay structures which had presumably occurred during core recovery. Additionally, overburden analyses showed the core samples displayed extreme overburden pressure sensitivity'
The SCAL report concluded that this overburden sensitivity could be the main reason for the differences between well test and conventional core permeability results.
Equipoise note that 'the 205/26a-3 results were made by Geochem, but were thought to be over-optimistic due to damage to clay minerals (principally kaolinite/chlorite) in core plug preparation or during the analysis itself'32 and that this resulted in the 205/26a-4 core being analysed in a 'fresh state' using oil at the assumed connate water saturation and overburden stress before subsequent cleaning and re-measurement at 400 psia overburden with helium.
This issue has been extensively covered by Hess33 and RPS will not replicate that work here as it is covered in Appendix A of the Equipoise report.
31 Special Core Analysis Study upon Core Samples Recovered from Well 205/26a-3, November 1991
32 Equipoise/ERC “Solan and Strathmore Fields: Development Review”, Dec. 2007, Appendix 1
33 Permeability Study of the Triassic Otterbank Sandstone of the Solan Field, Dean, July 1994
RPS Energy Hurricane Energy CPR
ECV2228 65 December 2017
In short, there are significant questions regarding the results of the core permeability results. Both Equipoise and Senergy have examined all available log and core data and come up with different porosity-permeability transforms which are subsequently used in their static and dynamic modelling work. Both parties' dynamic models also use the well test data to adjust their models, but the resulting recoveries from both models are broadly similar.
7.5.7.4 Well Tests
As discussed above, Equipoise state that the most reliable predictor for permeability is the well test, while Senergy take the opposite view, preferring the core analysis results for permeability estimation.
RPS has reviewed the original paper copies of the testing reports for 205/26a-3 DST1/1A and DST 2.
DST1/1A tested 2 zones utilising the same string. The string was composed of a ‘conventional annular pressure responsive DST string above a selectively fired 4 ½” TCP (Tubing Conveyed Perforating) gun set.’34
The two test zones were to be perforated from 8,758 – 8,700 ft MD (2,669 – 2,652 m MD) (Zone 1) and 8,665 – 8,392 ft MD (2,641 – 2,558 m MD) (Zone 1A).
Testing operations commenced on the 30th August 1990. For the lower test zone, a 500 psia under-balance was achieved by circulating a diesel cushion into the test string. On firing the guns, no immediate indications were detected at surface and on opening the well through a 16/64” choke, for a 15 minute initial flow, the only fluids recovered were from the surface lines draining down, indicating the well was not flowing. After a 2 hour shut-in, the well was again opened on a 16/64” choke for 3 hours, but did not flow at surface.
Nitrogen injection via coiled tubing was subsequently attempted but the well still failed to flow, retrieving only some of the diesel cushion and traces of drilling fluid. Following this, slickline and gradiometers were used to find the fluid level. This found the fluid level at 3,291 ft MD (1,003 m MD) and rising at a rate of 80 ft/hour (24.5 m/hour), equivalent to a flow rate of 27 bfpd (presumably based on drill string volume). On retrieving the gradiometer to surface, the bottom 600 ft (183 m) of cable were covered in thick black crude oil.
Two bottom hole samples runs were then made. The first run recovered a single oil sample from 8,163 ft MD (2,488 m MD). A second run took a further 2 samples, though both were found to contain only drilling mud and traces of oil.
At this point, operations were suspended due to problems on the rig. When operations recommenced, Zone 1A was perforated. Wellhead pressure rose after perforating to 515 psia, with the well shut at surface. After approximately one hour, the well was opened on a 12/64” choke for 15 minutes, retrieving only nitrogen, with the well-head pressure dropping to 190 psia.
At this point, the well was shut-in down-hole for 2 hours. A slickline run to drop off the TCP assembly found the fluid level at 8,854 ft MD (2,699 m MD). No flow was observed for 3 hours after opening the well during the slickline work. Only a few gallons of water were retrieved in the following 4 hours also (for a total of 7 hours open).
At this point, the entire drill string volume was displaced to nitrogen via coiled tubing. The well then flowed for 12 hours unaided, with the latter 6 hours without the coiled tubing in the well. Final flow-rate average for this period was 11 bbl/hour (264 bbl/d). Trace H2S and up to 0.3% CO2 were recorded during this period. Down-hole sampling was subsequently run, recovering 3 oil samplers between 8,246 – 8,397 ft MD (2,513 – 2,559 m MD).
A PLT was then run, with calibration passes made with the well shut-in at surface. During the calibration passes, SIWHP increased, indicating flow into the well during the calibration, with makes the results of the PLT flow rates questionable.
The well was then opened on a 16/64” choke with the PLT string down-hole, and gradually increased to 36/64” choke before allowing the flow to stabilise. Once flow stabilised at a rate of approximately 350 bbl/d, the flowing passes were made. The well was subsequently closed-in at surface and shut-in for 7 hours, before pressure gradient stations were taken at various levels and the PLT string recovered.
34 205/26a-3 Well Test Report DST 1/1A, MacKinley A., Amerada Hess, June 1991
RPS Energy Hurricane Energy CPR
ECV2228 66 December 2017
Stimulation of zone 1A was also attempted, using an acid flush via coiled tubing. Following acid treatment, the well was again opened up and flowed naturally on a 36/64” choke at a rate of 6 bbl/hr (144 bbl/d) prior to being shut in to make a PLT run.
Shut-in calibration passes were made before opening the well again on a 36/64” choke at 10 bbl/hr (240 bbl/d). Once the flowing passes were completed, the well was again shut in at surface with the PLT down-hole to monitor pressure build-up. However, this operation was abandoned less than 2 hours later due to worsening weather and the string was retrieved to surface and operations shut down, closing all down-hole valves and disconnecting the riser from the subsea test tree.
More than 24 hours later, the riser was re-latched and two further sampling runs were made, collecting 6 samples from 6 attempts, before the well was killed with 10.4 ppg KCl/polymer mud.
Based on the description of the operations, both tests were far from ideal. Flow rates for DST1 are almost certainly not correct, based on gradiometer readings of changing fluid levels within the wellbore.
DST1A achieved better results, with flow being achieved to surface (after displacing the entire drill string volume with nitrogen). Results from the PLT run prior to stimulation are questionable due to downhole flow during the calibration passes. It is not clear from reports if downhole flow was detected during calibration of the post stimulation PLT, so these results may be more accurate. However, the post stimulation build-up period was restricted due to weather.
DST2 involved underbalanced perforation of the interval 8,160 – 8,340 ft MD (2,487 – 2,542 m MD) via TCP.
Following the experience of DST1/1A, the entire drill string was displaced to nitrogen prior to perforating. Good indications of firing were observed, but only nitrogen was produced to surface during the initial flow. Following an overnight shut-in, coiled tubing was run in hole to further lift the well, resulting in some mud with oil traces and nitrogen being produced to surface. However, no significant flow to surface was achieved and the wellhead pressure was bled down to zero. A wireline run was subsequently made to identify the fluid level, which was found at 940 ft MD (286.5 m MD). Bottom hole samplers were then run in hole, with 4 samples taken at 5,700 ft MD (1,737 m MD). On retrieving the bottomhole samplers, the fluid level was found at 480 ft MD (146 m MD). Allowing for fluids added to the string due to pressure testing prior to wireline runs, this equates to an influx rate from the reservoir of approximately 17 bfpd.
A further coiled tubing run to lift the well with nitrogen produced approximately 100 bbl of oil to surface with a nitrogen injection rate of 200 scf/min. Following this, a further period of natural flow achieved a flow rate of approximately 20 bfpd based on changes in fluid level. No fluid was flowed to surface under natural flow and the well was subsequently shut in for 24 hours, prior to killing the well, ending the test.
7.5.7.5 Well Test Analysis
Analysis of the DST data by Hess and Equipoise both result in permeabilities around 7.5 mD and negative skin. These results are not consistent with core results. Additionally, the oil viscosity variations and presence of reactive clays (which could cause formation damage inconsistent with negative skin) were also noted by Senergy in the core and fluid data available.
Based on the quality of the testing operations, and given Senergy's observations, the results of the well test analyses conducted by Hess and Equipoise are questionable. Data quality is generally poor and there are a number of inputs, most notably the fluid flow rates, which are inferred from limited data based on changes in fluid level rather than flow rates recorded at surface, particularly for DST1 and DST2. Flow rates for DST1A are recorded, but the short buildup time due to weather forcing a shutdown of test operations makes these test results dubious also.
Given these observations, RPS are inclined to agree with Senergy that the well test results are inconclusive and of little use.
7.5.7.6 Production Performance Analysis
Both Equipoise and Senergy have created simulation models for Strathmore, with Equipoise originally creating an IMEX™ model, which was subsequently converted to ECLIPSE™ by Senergy. RPS has concentrated on the ECLIPSE™ model.
RPS has adjusted the Senergy ECLIPSE™ model to represent both parties’ views on permeability, and examined various production cases for both models.
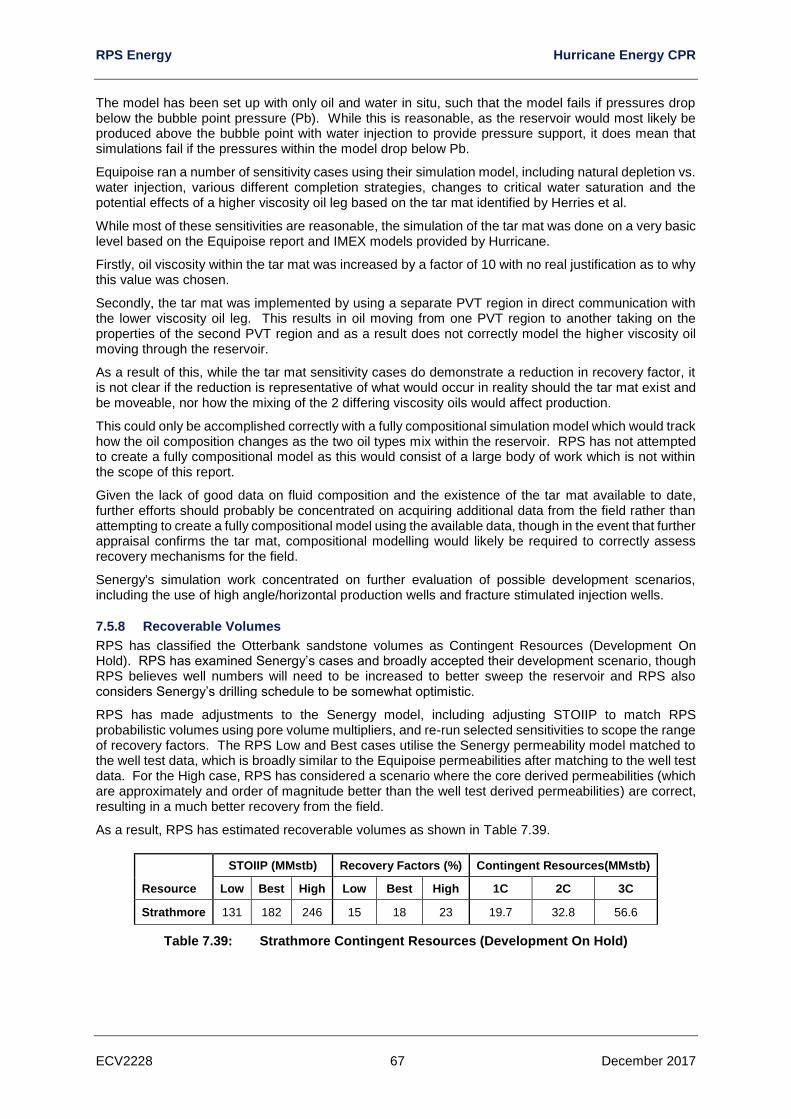
RPS Energy Hurricane Energy CPR
ECV2228 67 December 2017
The model has been set up with only oil and water in situ, such that the model fails if pressures drop below the bubble point pressure (Pb). While this is reasonable, as the reservoir would most likely be produced above the bubble point with water injection to provide pressure support, it does mean that simulations fail if the pressures within the model drop below Pb.
Equipoise ran a number of sensitivity cases using their simulation model, including natural depletion vs. water injection, various different completion strategies, changes to critical water saturation and the potential effects of a higher viscosity oil leg based on the tar mat identified by Herries et al.
While most of these sensitivities are reasonable, the simulation of the tar mat was done on a very basic level based on the Equipoise report and IMEX models provided by Hurricane.
Firstly, oil viscosity within the tar mat was increased by a factor of 10 with no real justification as to why this value was chosen.
Secondly, the tar mat was implemented by using a separate PVT region in direct communication with the lower viscosity oil leg. This results in oil moving from one PVT region to another taking on the properties of the second PVT region and as a result does not correctly model the higher viscosity oil moving through the reservoir.
As a result of this, while the tar mat sensitivity cases do demonstrate a reduction in recovery factor, it is not clear if the reduction is representative of what would occur in reality should the tar mat exist and be moveable, nor how the mixing of the 2 differing viscosity oils would affect production.
This could only be accomplished correctly with a fully compositional simulation model which would track how the oil composition changes as the two oil types mix within the reservoir. RPS has not attempted to create a fully compositional model as this would consist of a large body of work which is not within the scope of this report.
Given the lack of good data on fluid composition and the existence of the tar mat available to date, further efforts should probably be concentrated on acquiring additional data from the field rather than attempting to create a fully compositional model using the available data, though in the event that further appraisal confirms the tar mat, compositional modelling would likely be required to correctly assess recovery mechanisms for the field.
Senergy's simulation work concentrated on further evaluation of possible development scenarios, including the use of high angle/horizontal production wells and fracture stimulated injection wells.
7.5.8 Recoverable Volumes
RPS has classified the Otterbank sandstone volumes as Contingent Resources (Development On Hold). RPS has examined Senergy’s cases and broadly accepted their development scenario, though RPS believes well numbers will need to be increased to better sweep the reservoir and RPS also considers Senergy’s drilling schedule to be somewhat optimistic.
RPS has made adjustments to the Senergy model, including adjusting STOIIP to match RPS probabilistic volumes using pore volume multipliers, and re-run selected sensitivities to scope the range of recovery factors. The RPS Low and Best cases utilise the Senergy permeability model matched to the well test data, which is broadly similar to the Equipoise permeabilities after matching to the well test data. For the High case, RPS has considered a scenario where the core derived permeabilities (which are approximately and order of magnitude better than the well test derived permeabilities) are correct, resulting in a much better recovery from the field.
As a result, RPS has estimated recoverable volumes as shown in Table 7.39.
Resource
STOIIP (MMstb) Recovery Factors (%) Contingent Resources(MMstb)
Low Best High Low Best High 1C 2C 3C
Strathmore 131 182 246 15 18 23 19.7 32.8 56.6
Table 7.39: Strathmore Contingent Resources (Development On Hold)
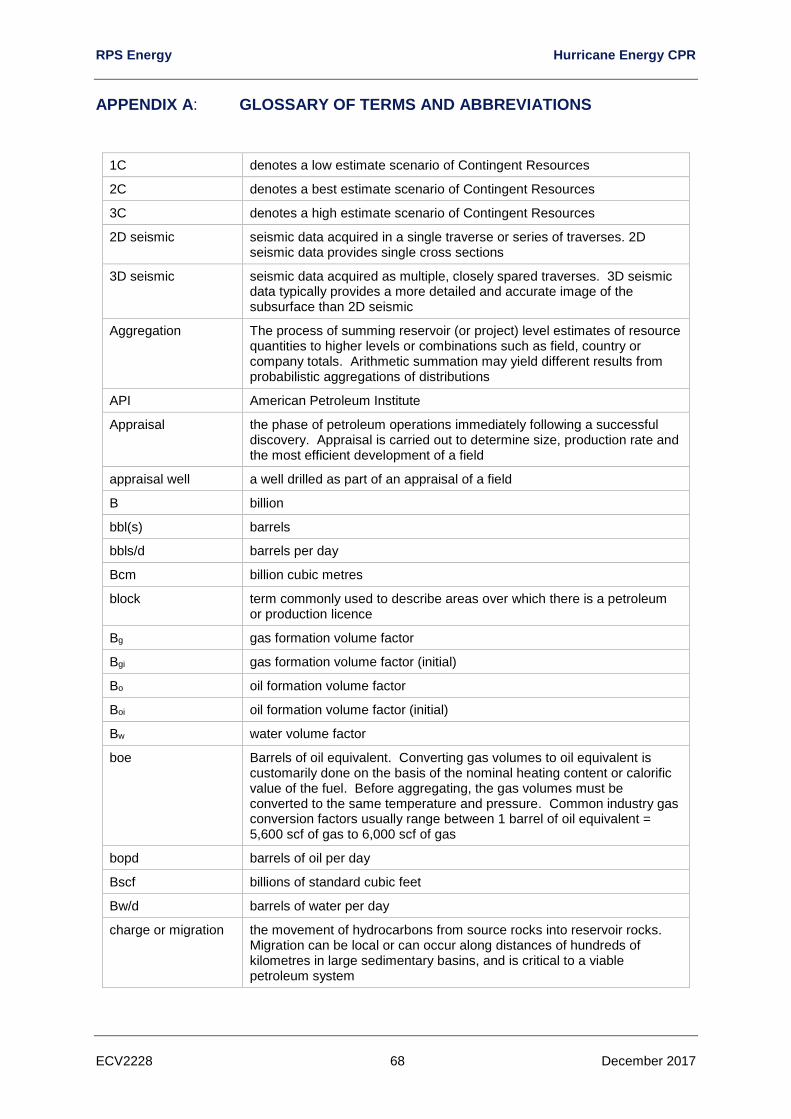
RPS Energy Hurricane Energy CPR
ECV2228 68 December 2017
APPENDIX A: GLOSSARY OF TERMS AND ABBREVIATIONS
1C denotes a low estimate scenario of Contingent Resources
2C denotes a best estimate scenario of Contingent Resources
3C denotes a high estimate scenario of Contingent Resources
2D seismic seismic data acquired in a single traverse or series of traverses. 2D seismic data provides single cross sections
3D seismic seismic data acquired as multiple, closely spared traverses. 3D seismic data typically provides a more detailed and accurate image of the subsurface than 2D seismic
Aggregation The process of summing reservoir (or project) level estimates of resource quantities to higher levels or combinations such as field, country or company totals. Arithmetic summation may yield different results from probabilistic aggregations of distributions
API American Petroleum Institute
Appraisal the phase of petroleum operations immediately following a successful discovery. Appraisal is carried out to determine size, production rate and the most efficient development of a field
appraisal well a well drilled as part of an appraisal of a field
B billion
bbl(s) barrels
bbls/d barrels per day
Bcm billion cubic metres
block term commonly used to describe areas over which there is a petroleum or production licence
Bg gas formation volume factor
Bgi gas formation volume factor (initial)
Bo oil formation volume factor
Boi oil formation volume factor (initial)
Bw water volume factor
boe Barrels of oil equivalent. Converting gas volumes to oil equivalent is customarily done on the basis of the nominal heating content or calorific value of the fuel. Before aggregating, the gas volumes must be converted to the same temperature and pressure. Common industry gas conversion factors usually range between 1 barrel of oil equivalent = 5,600 scf of gas to 6,000 scf of gas
bopd barrels of oil per day
Bscf billions of standard cubic feet
Bw/d barrels of water per day
charge or migration the movement of hydrocarbons from source rocks into reservoir rocks. Migration can be local or can occur along distances of hundreds of kilometres in large sedimentary basins, and is critical to a viable petroleum system
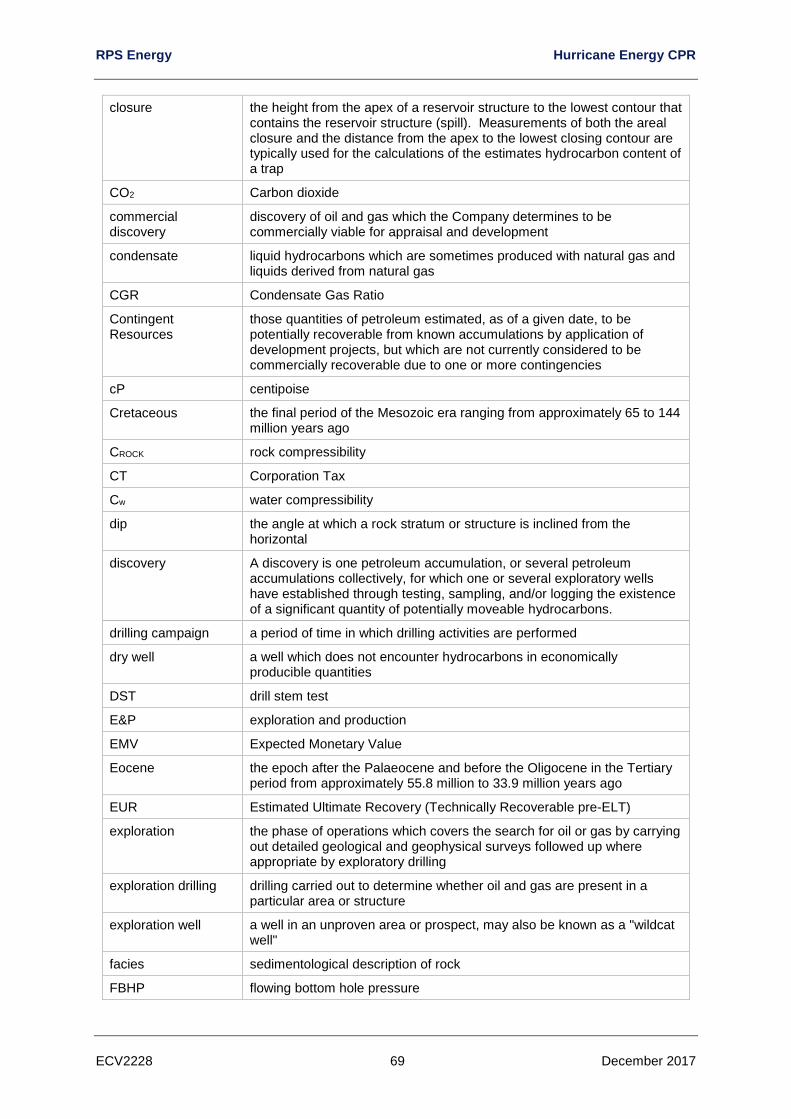
RPS Energy Hurricane Energy CPR
ECV2228 69 December 2017
closure the height from the apex of a reservoir structure to the lowest contour that contains the reservoir structure (spill). Measurements of both the areal closure and the distance from the apex to the lowest closing contour are typically used for the calculations of the estimates hydrocarbon content of a trap
CO2 Carbon dioxide
commercial discovery
discovery of oil and gas which the Company determines to be commercially viable for appraisal and development
condensate liquid hydrocarbons which are sometimes produced with natural gas and liquids derived from natural gas
CGR Condensate Gas Ratio
Contingent Resources
those quantities of petroleum estimated, as of a given date, to be potentially recoverable from known accumulations by application of development projects, but which are not currently considered to be commercially recoverable due to one or more contingencies
cP centipoise
Cretaceous the final period of the Mesozoic era ranging from approximately 65 to 144 million years ago
CROCK rock compressibility
CT Corporation Tax
Cw water compressibility
dip the angle at which a rock stratum or structure is inclined from the horizontal
discovery A discovery is one petroleum accumulation, or several petroleum accumulations collectively, for which one or several exploratory wells have established through testing, sampling, and/or logging the existence of a significant quantity of potentially moveable hydrocarbons.
drilling campaign a period of time in which drilling activities are performed
dry well a well which does not encounter hydrocarbons in economically producible quantities
DST drill stem test
E&P exploration and production
EMV Expected Monetary Value
Eocene the epoch after the Palaeocene and before the Oligocene in the Tertiary period from approximately 55.8 million to 33.9 million years ago
EUR Estimated Ultimate Recovery (Technically Recoverable pre-ELT)
exploration the phase of operations which covers the search for oil or gas by carrying out detailed geological and geophysical surveys followed up where appropriate by exploratory drilling
exploration drilling drilling carried out to determine whether oil and gas are present in a particular area or structure
exploration well a well in an unproven area or prospect, may also be known as a "wildcat well"
facies sedimentological description of rock
FBHP flowing bottom hole pressure
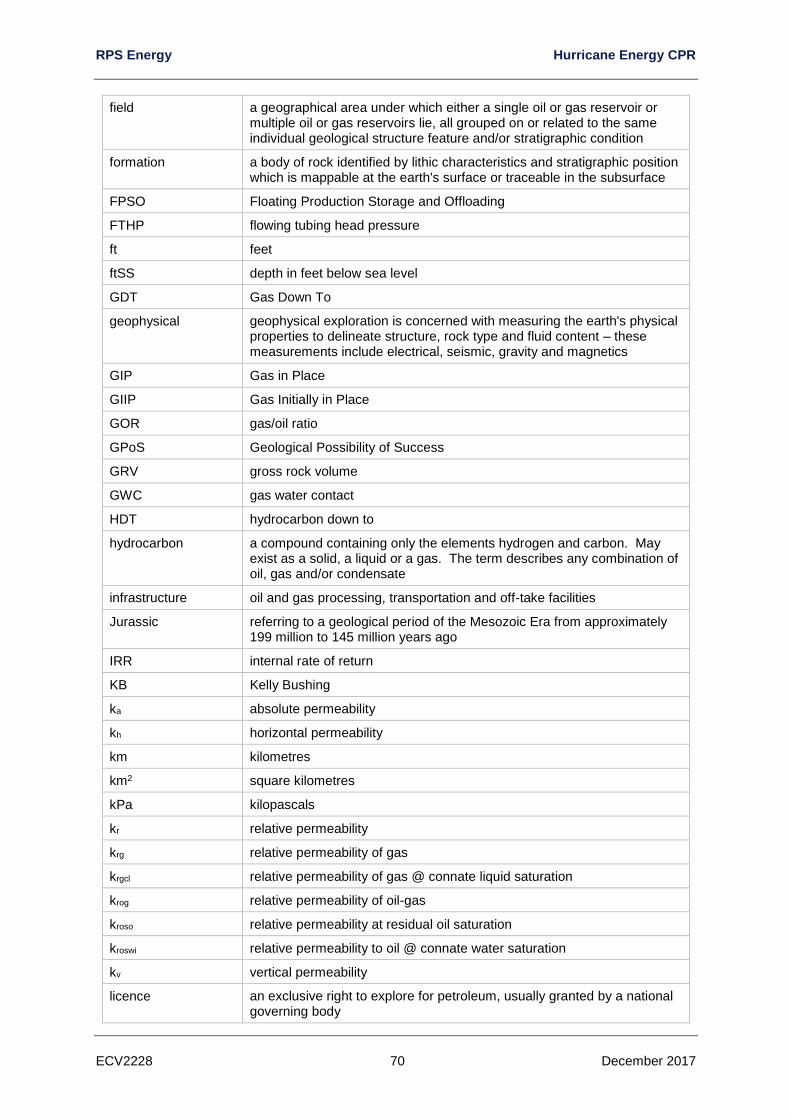
RPS Energy Hurricane Energy CPR
ECV2228 70 December 2017
field a geographical area under which either a single oil or gas reservoir or multiple oil or gas reservoirs lie, all grouped on or related to the same individual geological structure feature and/or stratigraphic condition
formation a body of rock identified by lithic characteristics and stratigraphic position which is mappable at the earth's surface or traceable in the subsurface
FPSO Floating Production Storage and Offloading
FTHP flowing tubing head pressure
ft feet
ftSS depth in feet below sea level
GDT Gas Down To
geophysical geophysical exploration is concerned with measuring the earth's physical properties to delineate structure, rock type and fluid content – these measurements include electrical, seismic, gravity and magnetics
GIP Gas in Place
GIIP Gas Initially in Place
GOR gas/oil ratio
GPoS Geological Possibility of Success
GRV gross rock volume
GWC gas water contact
HDT hydrocarbon down to
hydrocarbon a compound containing only the elements hydrogen and carbon. May exist as a solid, a liquid or a gas. The term describes any combination of oil, gas and/or condensate
infrastructure oil and gas processing, transportation and off-take facilities
Jurassic referring to a geological period of the Mesozoic Era from approximately 199 million to 145 million years ago
IRR internal rate of return
KB Kelly Bushing
ka absolute permeability
kh horizontal permeability
km kilometres
km2 square kilometres
kPa kilopascals
kr relative permeability
krg relative permeability of gas
krgcl relative permeability of gas @ connate liquid saturation
krog relative permeability of oil-gas
kroso relative permeability at residual oil saturation
kroswi relative permeability to oil @ connate water saturation
kv vertical permeability
licence an exclusive right to explore for petroleum, usually granted by a national governing body
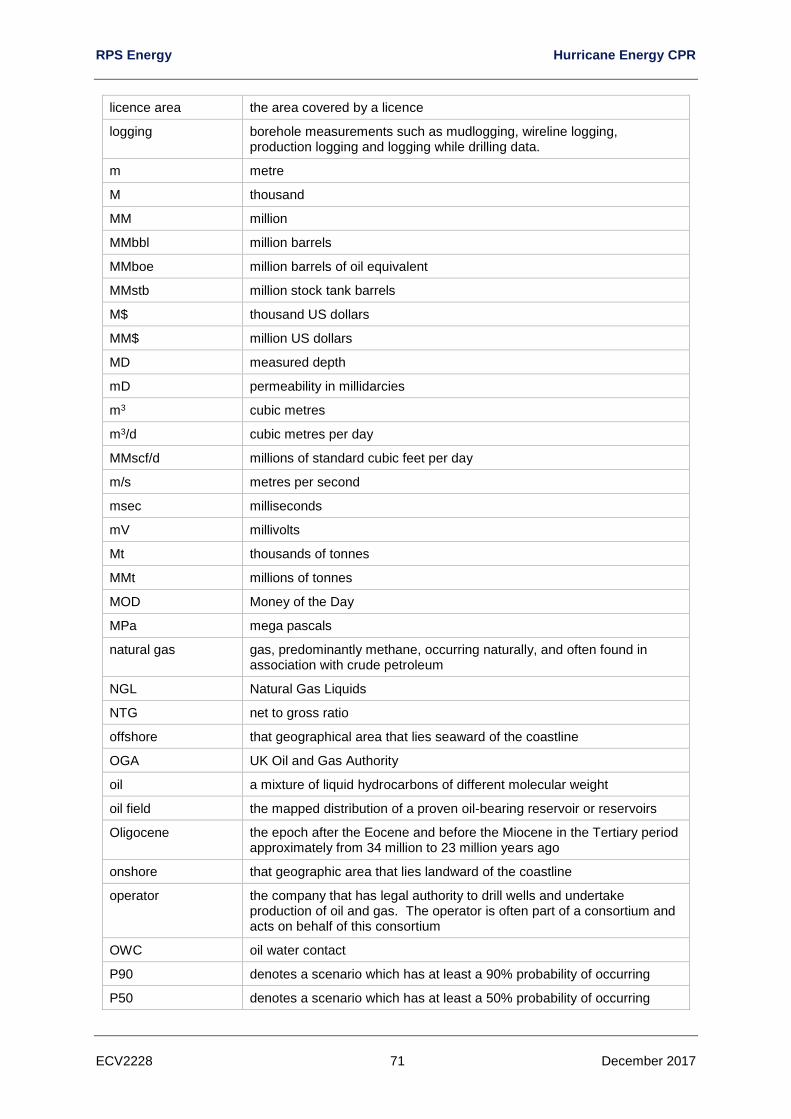
RPS Energy Hurricane Energy CPR
ECV2228 71 December 2017
licence area the area covered by a licence
logging borehole measurements such as mudlogging, wireline logging, production logging and logging while drilling data.
m metre
M thousand
MM million
MMbbl million barrels
MMboe million barrels of oil equivalent
MMstb million stock tank barrels
M$ thousand US dollars
MM$ million US dollars
MD measured depth
mD permeability in millidarcies
m3 cubic metres
m3/d cubic metres per day
MMscf/d millions of standard cubic feet per day
m/s metres per second
msec milliseconds
mV millivolts
Mt thousands of tonnes
MMt millions of tonnes
MOD Money of the Day
MPa mega pascals
natural gas gas, predominantly methane, occurring naturally, and often found in association with crude petroleum
NGL Natural Gas Liquids
NTG net to gross ratio
offshore that geographical area that lies seaward of the coastline
OGA UK Oil and Gas Authority
oil a mixture of liquid hydrocarbons of different molecular weight
oil field the mapped distribution of a proven oil-bearing reservoir or reservoirs
Oligocene the epoch after the Eocene and before the Miocene in the Tertiary period approximately from 34 million to 23 million years ago
onshore that geographic area that lies landward of the coastline
operator the company that has legal authority to drill wells and undertake production of oil and gas. The operator is often part of a consortium and acts on behalf of this consortium
OWC oil water contact
P90 denotes a scenario which has at least a 90% probability of occurring
P50 denotes a scenario which has at least a 50% probability of occurring
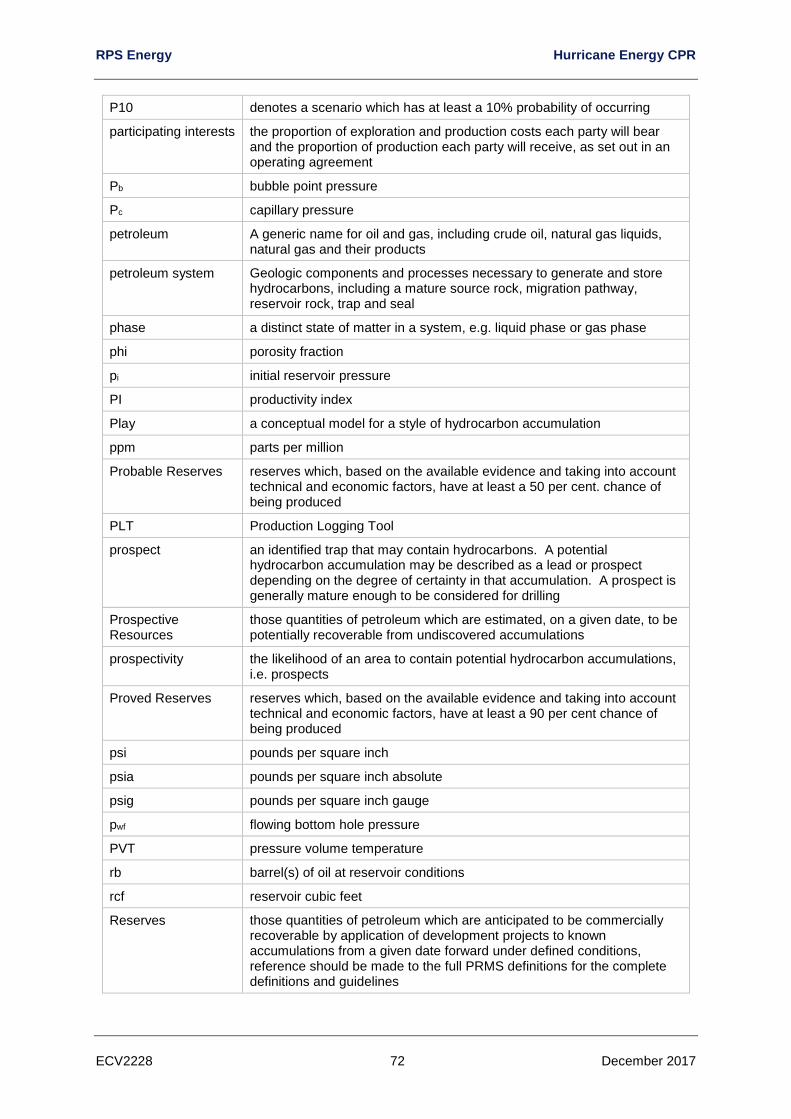
RPS Energy Hurricane Energy CPR
ECV2228 72 December 2017
P10 denotes a scenario which has at least a 10% probability of occurring
participating interests the proportion of exploration and production costs each party will bear and the proportion of production each party will receive, as set out in an operating agreement
Pb bubble point pressure
Pc capillary pressure
petroleum A generic name for oil and gas, including crude oil, natural gas liquids, natural gas and their products
petroleum system Geologic components and processes necessary to generate and store hydrocarbons, including a mature source rock, migration pathway, reservoir rock, trap and seal
phase a distinct state of matter in a system, e.g. liquid phase or gas phase
phi porosity fraction
pi initial reservoir pressure
PI productivity index
Play a conceptual model for a style of hydrocarbon accumulation
ppm parts per million
Probable Reserves reserves which, based on the available evidence and taking into account technical and economic factors, have at least a 50 per cent. chance of being produced
PLT Production Logging Tool
prospect an identified trap that may contain hydrocarbons. A potential hydrocarbon accumulation may be described as a lead or prospect depending on the degree of certainty in that accumulation. A prospect is generally mature enough to be considered for drilling
Prospective Resources
those quantities of petroleum which are estimated, on a given date, to be potentially recoverable from undiscovered accumulations
prospectivity the likelihood of an area to contain potential hydrocarbon accumulations, i.e. prospects
Proved Reserves reserves which, based on the available evidence and taking into account technical and economic factors, have at least a 90 per cent chance of being produced
psi pounds per square inch
psia pounds per square inch absolute
psig pounds per square inch gauge
pwf flowing bottom hole pressure
PVT pressure volume temperature
rb barrel(s) of oil at reservoir conditions
rcf reservoir cubic feet
Reserves those quantities of petroleum which are anticipated to be commercially recoverable by application of development projects to known accumulations from a given date forward under defined conditions, reference should be made to the full PRMS definitions for the complete definitions and guidelines
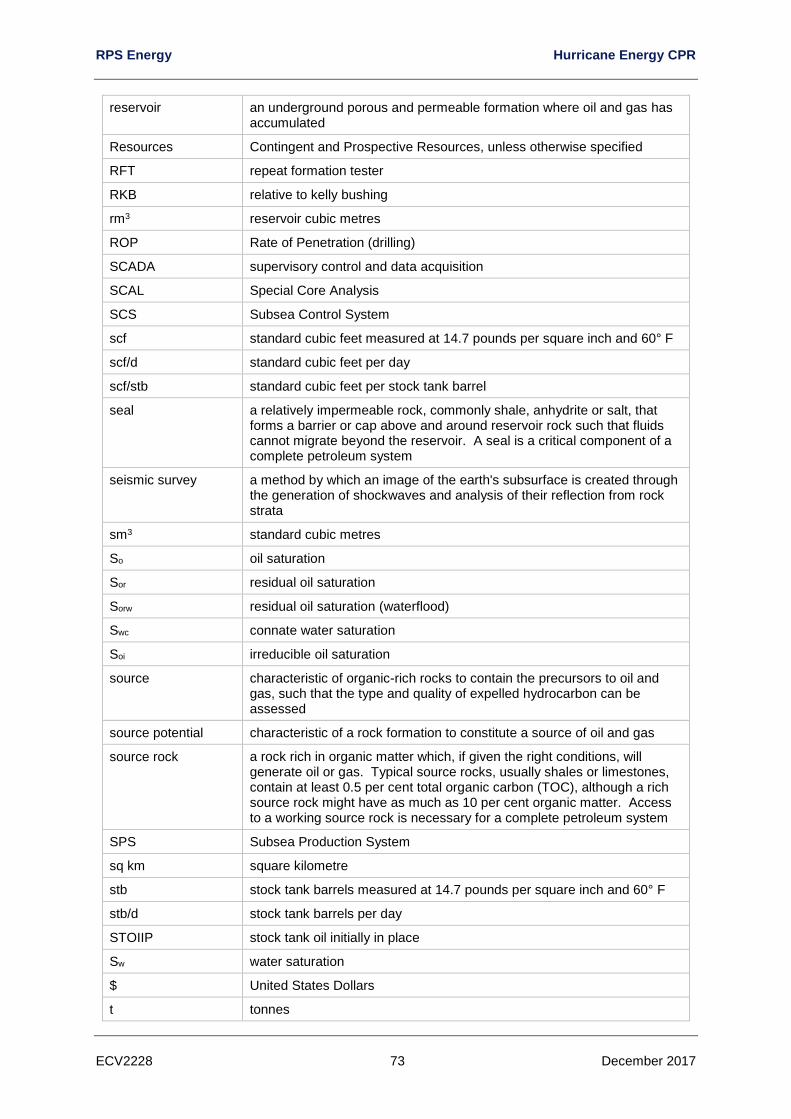
RPS Energy Hurricane Energy CPR
ECV2228 73 December 2017
reservoir an underground porous and permeable formation where oil and gas has accumulated
Resources Contingent and Prospective Resources, unless otherwise specified
RFT repeat formation tester
RKB relative to kelly bushing
rm3 reservoir cubic metres
ROP Rate of Penetration (drilling)
SCADA supervisory control and data acquisition
SCAL Special Core Analysis
SCS Subsea Control System
scf standard cubic feet measured at 14.7 pounds per square inch and 60° F
scf/d standard cubic feet per day
scf/stb standard cubic feet per stock tank barrel
seal a relatively impermeable rock, commonly shale, anhydrite or salt, that forms a barrier or cap above and around reservoir rock such that fluids cannot migrate beyond the reservoir. A seal is a critical component of a complete petroleum system
seismic survey a method by which an image of the earth's subsurface is created through the generation of shockwaves and analysis of their reflection from rock strata
sm3 standard cubic metres
So oil saturation
Sor residual oil saturation
Sorw residual oil saturation (waterflood)
Swc connate water saturation
Soi irreducible oil saturation
source characteristic of organic-rich rocks to contain the precursors to oil and gas, such that the type and quality of expelled hydrocarbon can be assessed
source potential characteristic of a rock formation to constitute a source of oil and gas
source rock a rock rich in organic matter which, if given the right conditions, will generate oil or gas. Typical source rocks, usually shales or limestones, contain at least 0.5 per cent total organic carbon (TOC), although a rich source rock might have as much as 10 per cent organic matter. Access to a working source rock is necessary for a complete petroleum system
SPS Subsea Production System
sq km square kilometre
stb stock tank barrels measured at 14.7 pounds per square inch and 60° F
stb/d stock tank barrels per day
STOIIP stock tank oil initially in place
Sw water saturation
$ United States Dollars
t tonnes
RPS Energy Hurricane Energy CPR
ECV2228 74 December 2017
Tertiary the Tertiary Period is a geological period from approximately 65 million to 2.5 million years ago
THP tubing head pressure
trap A configuration of rocks suitable for containing hydrocarbons and sealed by a relatively impermeable formation through which hydrocarbons will not migrate. Traps are described as structural traps (in deformed strata such as folds and faults) or stratigraphic traps (in areas where rock types change, such as unconformities, pinch outs and reefs). A trap is an essential component of a petroleum system
Tscf trillion standard cubic feet
TVDSS true vertical depth (sub-sea)
TVT true vertical thickness
TWT two-way time
US$ United States Dollar
VSP Vertical Seismic Profile is a technique of seismic measurements used for correlation with surface seismic data.
Vsh shale volume
WC water cut
WGIIP Wet Gas Initially in Place
WOSPS PLEM West of Shetland Pipeline System; Pipeline End Manifold
WUT Water Up To
porosity
viscosity
gb viscosity of gas
ob viscosity of oil
w viscosity of water
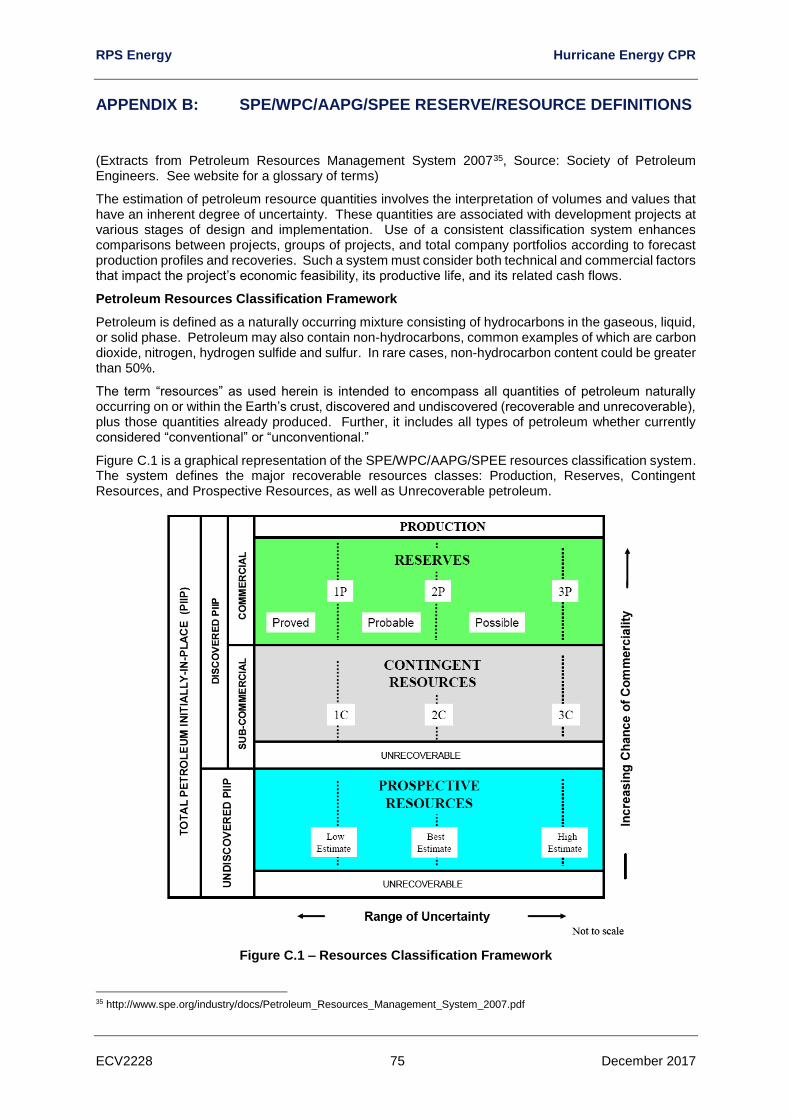
RPS Energy Hurricane Energy CPR
ECV2228 75 December 2017
APPENDIX B: SPE/WPC/AAPG/SPEE RESERVE/RESOURCE DEFINITIONS
(Extracts from Petroleum Resources Management System 200735, Source: Society of Petroleum Engineers. See website for a glossary of terms)
The estimation of petroleum resource quantities involves the interpretation of volumes and values that have an inherent degree of uncertainty. These quantities are associated with development projects at various stages of design and implementation. Use of a consistent classification system enhances comparisons between projects, groups of projects, and total company portfolios according to forecast production profiles and recoveries. Such a system must consider both technical and commercial factors that impact the project’s economic feasibility, its productive life, and its related cash flows.
Petroleum Resources Classification Framework
Petroleum is defined as a naturally occurring mixture consisting of hydrocarbons in the gaseous, liquid, or solid phase. Petroleum may also contain non-hydrocarbons, common examples of which are carbon dioxide, nitrogen, hydrogen sulfide and sulfur. In rare cases, non-hydrocarbon content could be greater than 50%.
The term “resources” as used herein is intended to encompass all quantities of petroleum naturally occurring on or within the Earth’s crust, discovered and undiscovered (recoverable and unrecoverable), plus those quantities already produced. Further, it includes all types of petroleum whether currently considered “conventional” or “unconventional.”
Figure C.1 is a graphical representation of the SPE/WPC/AAPG/SPEE resources classification system. The system defines the major recoverable resources classes: Production, Reserves, Contingent Resources, and Prospective Resources, as well as Unrecoverable petroleum.
Figure C.1 – Resources Classification Framework
35 http://www.spe.org/industry/docs/Petroleum_Resources_Management_System_2007.pdf
RPS Energy Hurricane Energy CPR
ECV2228 76 December 2017
The “Range of Uncertainty” reflects a range of estimated quantities potentially recoverable from an accumulation by a project, while the vertical axis represents the “Chance of Commerciality”, that is, the chance that the project that will be developed and reach commercial producing status. The following definitions apply to the major subdivisions within the resources classification:
TOTAL PETROLEUM INITIALLY-IN-PLACE is that quantity of petroleum that is estimated to exist originally in naturally occurring accumulations. It includes that quantity of petroleum that is estimated, as of a given date, to be contained in known accumulations prior to production plus those estimated quantities in accumulations yet to be discovered (equivalent to “total resources”).
DISCOVERED PETROLEUM INITIALLY-IN-PLACE is that quantity of petroleum that is estimated, as of a given date, to be contained in known accumulations prior to production.
PRODUCTION is the cumulative quantity of petroleum that has been recovered at a given date. While all recoverable resources are estimated and production is measured in terms of the sales product specifications, raw production (sales plus non-sales) quantities are also measured and required to support engineering analyses based on reservoir voidage.
Multiple development projects may be applied to each known accumulation, and each project will recover an estimated portion of the initially-in-place quantities. The projects shall be subdivided into Commercial and Sub-Commercial, with the estimated recoverable quantities being classified as Reserves and Contingent Resources respectively, as defined below.
RESERVES are those quantities of petroleum anticipated to be commercially recoverable by application of development projects to known accumulations from a given date forward under defined conditions. Reserves must further satisfy four criteria: they must be discovered, recoverable, commercial, and remaining (as of the evaluation date) based on the development project(s) applied. Reserves are further categorized in accordance with the level of certainty associated with the estimates and may be sub-classified based on project maturity and/or characterized by development and production status.
CONTINGENT RESOURCES are those quantities of petroleum estimated, as of a given date, to be potentially recoverable from known accumulations, but the applied project(s) are not yet considered mature enough for commercial development due to one or more contingencies. Contingent Resources may include, for example, projects for which there are currently no viable markets, or where commercial recovery is dependent on technology under development, or where evaluation of the accumulation is insufficient to clearly assess commerciality. Contingent Resources are further categorized in accordance with the level of certainty associated with the estimates and may be subclassified based on project maturity and/or characterized by their economic status. See section Project Maturity Sub-classes.
UNDISCOVERED PETROLEUM INITIALLY-IN-PLACE is that quantity of petroleum estimated, as of a given date, to be contained within accumulations yet to be discovered.
PROSPECTIVE RESOURCES are those quantities of petroleum estimated, as of a given date, to be potentially recoverable from undiscovered accumulations by application of future development projects. Prospective Resources have both an associated chance of discovery and a chance of development. Prospective Resources are further subdivided in accordance with the level of certainty associated with recoverable estimates assuming their discovery and development and may be sub-classified based on project maturity.
UNRECOVERABLE is that portion of Discovered or Undiscovered Petroleum Initially-in-Place quantities which is estimated, as of a given date, not to be recoverable by future development projects. A portion of these quantities may become recoverable in the future as commercial circumstances change or technological developments occur; the remaining portion may never be recovered due to physical/chemical constraints represented by subsurface interaction of fluids and reservoir rocks.
RPS Energy Hurricane Energy CPR
ECV2228 77 December 2017
Estimated Ultimate Recovery (EUR) is not a resources category, but a term that may be applied to any accumulation or group of accumulations (discovered or undiscovered) to define those quantities of petroleum estimated, as of a given date, to be potentially recoverable under defined technical and commercial conditions plus those quantities already produced (total of recoverable resources).
In specialized areas, such as basin potential studies, alternative terminology has been used; the total resources may be referred to as Total Resource Base or Hydrocarbon Endowment. Total recoverable or EUR may be termed Basin Potential. The sum of Reserves, Contingent Resources, and Prospective Resources may be referred to as “remaining recoverable resources.” When such terms are used, it is important that each classification component of the summation also be provided. Moreover, these quantities should not be aggregated without due consideration of the varying degrees of technical and commercial risk involved with their classification.
Range of Uncertainty
The range of uncertainty of the recoverable and/or potentially recoverable volumes may be represented by either deterministic scenarios or by a probability distribution. When the range of uncertainty is represented by a probability distribution, a low, best, and high estimate shall be provided such that:
• There should be at least a 90% probability (P90) that the quantities actually recovered will equal or exceed the low estimate.
• There should be at least a 50% probability (P50) that the quantities actually recovered will equal or exceed the best estimate.
• There should be at least a 10% probability (P10) that the quantities actually recovered will equal or exceed the high estimate.
When using the deterministic scenario method, typically there should also be low, best, and high estimates, where such estimates are based on qualitative assessments of relative uncertainty using consistent interpretation guidelines. Under the deterministic incremental (risk-based) approach, quantities at each level of uncertainty are estimated discretely and separately.
Reserves Categories
The following summarizes the definitions for each Reserves category in terms of both the deterministic incremental approach and scenario approach and also provides the probability criteria if probabilistic methods are applied.
• Proved Reserves are those quantities of petroleum, which, by analysis of geoscience and engineering data, can be estimated with reasonable certainty to be commercially recoverable, from a given date forward, from known reservoirs and under defined economic conditions, operating methods, and government regulations. If deterministic methods are used, the term reasonable certainty is intended to express a high degree of confidence that the quantities will be recovered. If probabilistic methods are used, there should be at least a 90% probability that the quantities actually recovered will equal or exceed the estimate.
• Probable Reserves are those additional Reserves which analysis of geoscience and engineering data indicate are less likely to be recovered than Proved Reserves but more certain to be recovered than Possible Reserves. It is equally likely that actual remaining quantities recovered will be greater than or less than the sum of the estimated Proved plus Probable Reserves (2P). In this context, when probabilistic methods are used, there should be at least a 50% probability that the actual quantities recovered will equal or exceed the 2P estimate.
• Possible Reserves are those additional reserves which analysis of geoscience and engineering data suggest are less likely to be recoverable than Probable Reserves. The total quantities ultimately recovered from the project have a low probability to exceed the sum of Proved plus Probable plus Possible (3P) Reserves, which is equivalent to the high estimate scenario. In this context, when probabilistic methods are used, there should be at least a 10% probability that the actual quantities recovered will equal or exceed the 3P estimate.
Use of consistent terminology (Figure C.1) promotes clarity in communication of evaluation results. For Reserves, the general cumulative terms low/best/high estimates are denoted as 1P/2P/3P, respectively. The associated incremental quantities are termed Proved, Probable and Possible. Reserves are a subset of, and must be viewed within context of, the complete resources classification system. While the categorization criteria are proposed specifically for Reserves, in most cases, they can be equally
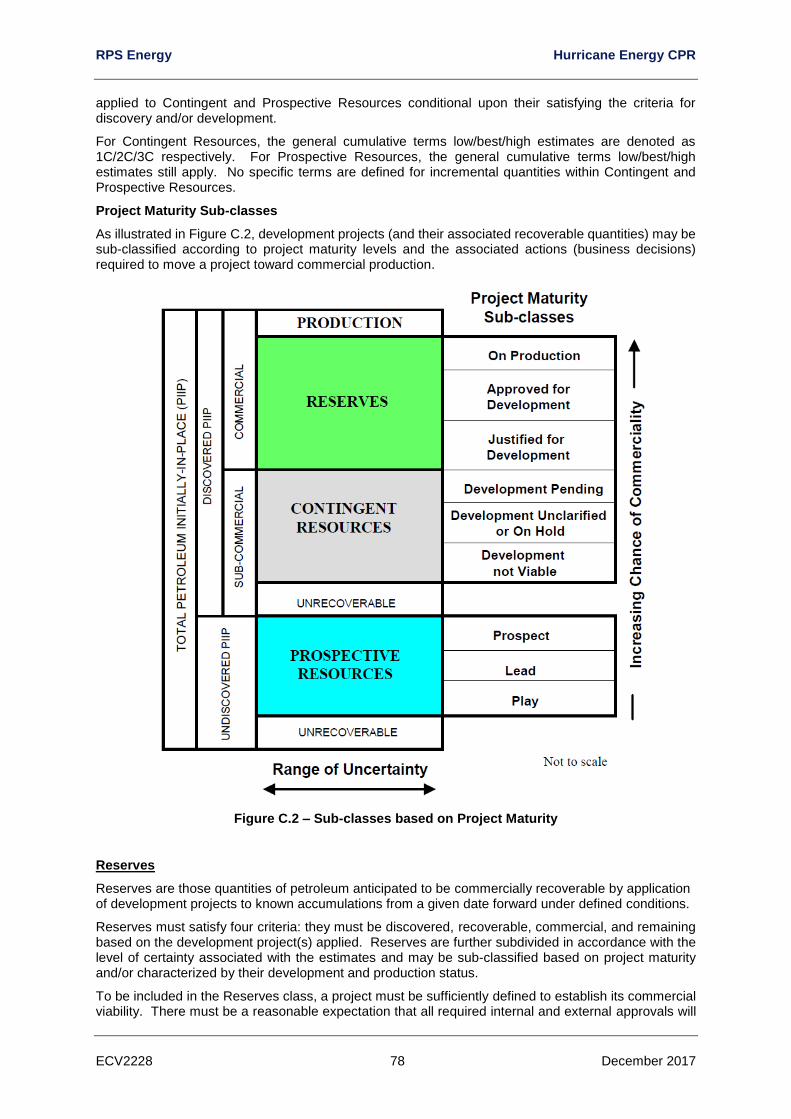
RPS Energy Hurricane Energy CPR
ECV2228 78 December 2017
applied to Contingent and Prospective Resources conditional upon their satisfying the criteria for discovery and/or development.
For Contingent Resources, the general cumulative terms low/best/high estimates are denoted as 1C/2C/3C respectively. For Prospective Resources, the general cumulative terms low/best/high estimates still apply. No specific terms are defined for incremental quantities within Contingent and Prospective Resources.
Project Maturity Sub-classes
As illustrated in Figure C.2, development projects (and their associated recoverable quantities) may be sub-classified according to project maturity levels and the associated actions (business decisions) required to move a project toward commercial production.
Figure C.2 – Sub-classes based on Project Maturity
Reserves
Reserves are those quantities of petroleum anticipated to be commercially recoverable by application of development projects to known accumulations from a given date forward under defined conditions.
Reserves must satisfy four criteria: they must be discovered, recoverable, commercial, and remaining based on the development project(s) applied. Reserves are further subdivided in accordance with the level of certainty associated with the estimates and may be sub-classified based on project maturity and/or characterized by their development and production status.
To be included in the Reserves class, a project must be sufficiently defined to establish its commercial viability. There must be a reasonable expectation that all required internal and external approvals will
RPS Energy Hurricane Energy CPR
ECV2228 79 December 2017
be forthcoming, and there is evidence of firm intention to proceed with development within a reasonable time frame. A reasonable time frame for the initiation of development depends on the specific circumstances and varies according to the scope of the project. While 5 years is recommended as a benchmark, a longer time frame could be applied where, for example, development of economic projects are deferred at the option of the producer for, among other things, market-related reasons, or to meet contractual or strategic objectives. In all cases, the justification for classification as Reserves should be clearly documented.
To be included in the Reserves class, there must be a high confidence in the commercial producibility of the reservoir as supported by actual production or formation tests. In certain cases, Reserves may be assigned on the basis of well logs and/or core analysis that indicate that the subject reservoir is hydrocarbon bearing and is analogous to reservoirs in the same area that are producing or have demonstrated the ability to produce on formation tests.
Reserves may be further subdivided as follows:
On Production:
The development project is currently producing and selling petroleum to market. The key criterion is that the project is receiving income from sales, rather than the approved development project necessarily being complete.
This is the point at which the project “chance of commerciality” can be said to be 100%.
Approved for Development: All necessary approvals have been obtained, capital funds have been committed, and implementation of the development project is under way. At this point, it must be certain that the development project is going ahead. The project must not be subject to any contingencies such as outstanding regulatory approvals or sales contracts. Forecast capital expenditures should be included in the reporting entity’s current or following year’s approved budget.
The project “decision gate” is the decision to start investing capital in the construction of production facilities and/or drilling development wells.
Justified for Development: Implementation of the development project is justified on the basis of reasonable forecast commercial conditions at the time of reporting, and there are reasonable expectations that all necessary approvals/contracts will be obtained.
In order to move to this level of project maturity, and hence have reserves associated with it, the development project must be commercially viable at the time of reporting, based on the reporting entity’s assumptions of future prices, costs, etc. (“forecast case”) and the specific circumstances of the project. Evidence of a firm intention to proceed with development within a reasonable time frame will be sufficient to demonstrate commerciality. There should be a development plan in sufficient detail to support the assessment of commerciality and a reasonable expectation that any regulatory approvals or sales contracts required prior to project implementation will be forthcoming.
Other than such approvals/contracts, there should be no known contingencies that could preclude the development from proceeding within a reasonable timeframe (see Reserves class).
The project “decision gate” is the decision by the reporting entity and its partners, if any, that the project has reached a level of technical and commercial maturity sufficient to justify proceeding with development at that point in time.
Contingent Resources:
Development Pending: A discovered accumulation where project activities are ongoing to justify commercial development in the foreseeable future.
The project is seen to have reasonable potential for eventual commercial development, to the extent that further data acquisition (eg drilling, seismic data) and/or evaluations are currently ongoing with a view to confirming that the project is commercially viable and providing the basis for selection of an appropriate development plan. The critical contingencies have been identified and are reasonably expected to be resolved within a reasonable time frame. Note that disappointing appraisal/evaluation results could lead to are-classification of the project to “On Hold” or “Nor Viable” status.

RPS Energy Hurricane Energy CPR
ECV2228 80 December 2017
The project “decision gate” is the decision to undertake further data acquisition and/or studies designed to move the project to a level of technical and commercial maturity at which a decision can be made to proceed with development and production.
Development Unclarified or On Hold: A discovered accumulation where project activities are on hold and/or where justification as a commercial development may be subject to significant delay.
The project is seen to have potential for eventual commercial development, but further appraisal/evaluation activities are on hold pending the removal of significant contingencies external to the project, or substantial further appraisal/evaluation activities are required to clarify the potential for eventual commercial development. Development may be subject to a significant time delay. Note that a change in circumstances, such that there is no longer a reasonable expectation that a critical contingency can be removed in the foreseeable future, for example, could lead to a re-classification of the project to “Not Viable” status.
The project “decision gate” is the decision to either proceed with additional evaluation designed to clarify the potential for eventual commercial development or to temporarily suspend or delay further activities pending
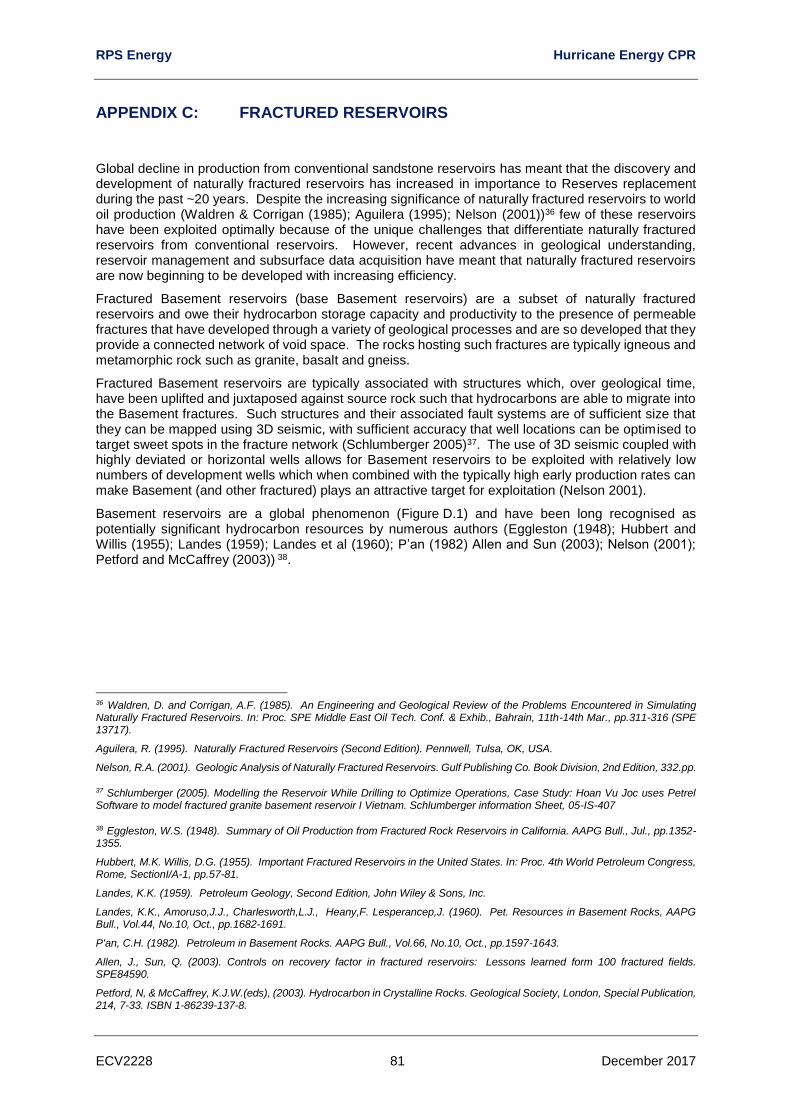
RPS Energy Hurricane Energy CPR
ECV2228 81 December 2017
APPENDIX C: FRACTURED RESERVOIRS
Global decline in production from conventional sandstone reservoirs has meant that the discovery and development of naturally fractured reservoirs has increased in importance to Reserves replacement during the past ~20 years. Despite the increasing significance of naturally fractured reservoirs to world oil production (Waldren & Corrigan (1985); Aguilera (1995); Nelson (2001))36 few of these reservoirs have been exploited optimally because of the unique challenges that differentiate naturally fractured reservoirs from conventional reservoirs. However, recent advances in geological understanding, reservoir management and subsurface data acquisition have meant that naturally fractured reservoirs are now beginning to be developed with increasing efficiency.
Fractured Basement reservoirs (base Basement reservoirs) are a subset of naturally fractured reservoirs and owe their hydrocarbon storage capacity and productivity to the presence of permeable fractures that have developed through a variety of geological processes and are so developed that they provide a connected network of void space. The rocks hosting such fractures are typically igneous and metamorphic rock such as granite, basalt and gneiss.
Fractured Basement reservoirs are typically associated with structures which, over geological time, have been uplifted and juxtaposed against source rock such that hydrocarbons are able to migrate into the Basement fractures. Such structures and their associated fault systems are of sufficient size that they can be mapped using 3D seismic, with sufficient accuracy that well locations can be optimised to target sweet spots in the fracture network (Schlumberger 2005)37. The use of 3D seismic coupled with highly deviated or horizontal wells allows for Basement reservoirs to be exploited with relatively low numbers of development wells which when combined with the typically high early production rates can make Basement (and other fractured) plays an attractive target for exploitation (Nelson 2001).
Basement reservoirs are a global phenomenon (Figure D.1) and have been long recognised as potentially significant hydrocarbon resources by numerous authors (Eggleston (1948); Hubbert and Willis (1955); Landes (1959); Landes et al (1960); P’an (1982) Allen and Sun (2003); Nelson (2001); Petford and McCaffrey (2003)) 38.
36 Waldren, D. and Corrigan, A.F. (1985). An Engineering and Geological Review of the Problems Encountered in Simulating Naturally Fractured Reservoirs. In: Proc. SPE Middle East Oil Tech. Conf. & Exhib., Bahrain, 11th-14th Mar., pp.311-316 (SPE 13717).
Aguilera, R. (1995). Naturally Fractured Reservoirs (Second Edition). Pennwell, Tulsa, OK, USA.
Nelson, R.A. (2001). Geologic Analysis of Naturally Fractured Reservoirs. Gulf Publishing Co. Book Division, 2nd Edition, 332.pp.
37 Schlumberger (2005). Modelling the Reservoir While Drilling to Optimize Operations, Case Study: Hoan Vu Joc uses Petrel Software to model fractured granite basement reservoir I Vietnam. Schlumberger information Sheet, 05-IS-407
38 Eggleston, W.S. (1948). Summary of Oil Production from Fractured Rock Reservoirs in California. AAPG Bull., Jul., pp.1352-1355.
Hubbert, M.K. Willis, D.G. (1955). Important Fractured Reservoirs in the United States. In: Proc. 4th World Petroleum Congress, Rome, SectionI/A-1, pp.57-81.
Landes, K.K. (1959). Petroleum Geology, Second Edition, John Wiley & Sons, Inc.
Landes, K.K., Amoruso,J.J., Charlesworth,L.J., Heany,F. Lesperancep,J. (1960). Pet. Resources in Basement Rocks, AAPG Bull., Vol.44, No.10, Oct., pp.1682-1691.
P'an, C.H. (1982). Petroleum in Basement Rocks. AAPG Bull., Vol.66, No.10, Oct., pp.1597-1643.
Allen, J., Sun, Q. (2003). Controls on recovery factor in fractured reservoirs: Lessons learned form 100 fractured fields. SPE84590.
Petford, N, & McCaffrey, K.J.W.(eds), (2003). Hydrocarbon in Crystalline Rocks. Geological Society, London, Special Publication, 214, 7-33. ISBN 1-86239-137-8.
RPS Energy Hurricane Energy CPR
ECV2228 82 December 2017
Despite the potential for Basement reservoirs, their discovery has historically been more by chance rather than as a result of the product of a Basement-focused exploration programme. However, in recent years drilling programmes targeted at exploiting Basement reservoirs have resulted in major oil discoveries. Such discoveries have made a significant impact on the hydrocarbon reserve of Yemen (Batchelor (2010); Gutmanis (2009))39 and have led to the development of world class oil fields (over a billion barrels recoverable) such as Bach Ho in Vietnam (Tran et al (2006)40; Batchelor (2010); Cuong et al (2011)).
Figure C.1: Basement Reservoirs of The World
39 Batchelor, T., (2010). Hydrocarbon Production from Fractured Basement Formations, Geoscience Limited. http://www.geoscience.co.uk/assets/file/Reservoirs%20in%20Fractured%20Basement%20Ver%209_JCG.pdf.
Gutmanis, J. C., (2009). Basement Reservoirs- A review of their Geological and Production Characteristics.I PTC 13156.
40 Tran, D. L., Tran, H. V., Phung, H. D., & others, (2006). Basement fractured reservoir of Bach Ho oil field - a case study. The basement reservoir. HCM: Science and Technics Publishing House.