Embed Size (px)
Citation preview

1
EEvvaalluuaattiioon Sn Sttuuddyy
oonn
KKhhaaddi i aannd d VVillillaagge e IInndduuststrriiees s PPrrogogrraammmme e
Programme Evaluation Organisation Planning Commission Government of India New Delhi-110001
March 2001

2
CONTENTS
Preface i Executive Summary iii
I. CHAPTER 1. Background - Khadi and Village Industries Programme ………. 1-4
I. Introduction ……………………………………………………. 1 II. Special Employment Programme for 50 Selected Districts through KVI …….. 2 III. Implementation Methodology ……………………………………………….. 2 IV. Need for the Study ……………………………………………………. 3
2. Evaluation Study – Objectives and Methodology ……………..………… 5-9
2.2.1 Objective of the Evaluation Study…………………………………………… 5 2.3 Methodology ………………………………………………………………. 6 2.4.1 Instruments ………………………………………………………………. 6 2.5.1 Selection of Sample …………………………………………………………… 7 2.6.1 Selection of Beneficiaries ………………………………………………… 7 2.7 Selection of Individual Beneficiaries (Employees/Key Persons) …………….. 7 2.8 Coverage ……………………………………………………………… 8 2.9 Reference Period ……………………………………………………… 8 2.10 Orientation of the Field Teams ………………………………………….. 8 Annexure – I …………………………………………………………………………… 9
3. Administration - Planning, Implementation and Monitoring…….. 10-18 3.1 Administrative Structure …………………………………………………… 10 3.2 Directorate of REGP …… …………………………………………………… 10 3.3 KVI Boards …………………………………………………………………. 11 3.4 District Administration ……………………………………………………… 11 3.5 Coordination between KVIC & KVIB ……………………………………. 12 3.6 Planning ……………………………………………………………………. 12
3.7 Implementation ……………………………………………………………… 13 3.8 Certification Committee ……………………………………………………. 14 3.9 Quality Control ……………………………………………………………… 14 3.10 Marketing and Sales ………………………………………………………….. 15 3.11 Monitoring ………………………………………………………………… 16 Fig. -1 Organisational Structure of KVIC ………………………………………….. 18
4. Financing the KVIC Programme - A Performance Analysis………..….. 19-31
4.1 Sources of Funds for KVIC ……………………………………………….. 19 4.2 Eighth Plan Allocation ………………………………………………………… 19 4.3 Plan Proposals and Government Allocation ………………………………… 20 4.4 Allocation between Khadi and Village Industries …………………………... 21 4.5 Interse Allocation of Budgetary Resources ………………………………… 22 4.6 Availability of Finance from other Sources …………………………………. 23 4.7 Utilisation of Grants by KVIC ……………………………………………… 24

3
4.8 Utilisation of Bank Finance ………………………………………………… 25 4.9 State Level Performance …………………………………………………… 26 4.10 State KVIC Units ……………………………………………………… 26 4.11 State KVIB Units ……………………………………………………… 28
5. Physical Performance of Khadi and Village Industr ies ………….. 32-44
5.1 Employment Performance ……………………………………………… 32 5.2 Production Performance …………………………………………….. 37 5.3 Marketing and Sales …………………………………………………. 40 5.4 Training Programme …………………………………………………. 41 5.5 Infrastructure Facilities ……………………………………………….. 43
6. Cost of Employment Generation through KVIC Programme ……… 45-61
6.1 Employment During Eighth Plan ……………………………………. 46 6.2 Expenditure by KVIC – Eighth Plan …………………………………… 46 6.3 Cost of job creation – Analysis of Secondary Data …………………… 48 6.4 Analysis of Survey Data - Employment and Cost of Job Creation &
Maintenance …………………………………………………………. 49 6.5 Sustainability of Employment ……………………………………….. 53
7. Profile of Beneficiaries & Impact of KVIC Programme …………… 62-68
7.1 Profile of Beneficiaries …………………………………………………. 62 7.2 Income of Khadi & Village Industries Workers ………………………… 65 7.3 Household Expenditure Pattern of KVIC Workers …………………… 67 7.4 Earnings of Workers – by Social Groups ……………………………. 67
8. Summary of the Evaluation Report 69-81
8.1 The Programme …………………………………………………………. 69 8.2 The Context ……………………………………………………………. 70 8.3 The Study ………………………………………………………………. 70 8.4 Methodology ……………………………………………………………… 70 8.5 Planning, Implementation & Monitoring ………………………………. 71 8.6 Financial Performance …………………………………………………… 72 8.7 Physical Performance ……………………………………………………… 73 8.8 Cost of Job Creation /Maintenance ………………………………………. 74 8.9 Economics of Khadi Production …………………………………………. 75 8.10 Economics of V.I. Units ………………………………………………….. 76 8.11 Profile of Beneficiaries & Impact………………………………………………. 76 8.12 Suggestions …………………………………………………………………. 77
II. STUDY TEAM 82-83
1. Headquarters Team ………………………………………………………… 82
2. Field Team ………………………………………………..…………. 83

4
PREFACE During the Freedom Struggle, the development of Khadi and Village Industries was an instrument to meet the twin objective of self-reliance through local production and seeking active participation of the poor in the struggle for Independence through removal of hunger and unemployment. Their potential as an instrument of poverty alleviation was also recognised by our early planners. Accordingly, the Khadi and Village Industries Commission (KVIC) was created by an Act of Parliament to plan, promote and organise their systematic development and expansion. While the output and employment of Khadi and Village Industries have grown manifold during the last four and a half decades, their role in the context of the new paradigm of development has been questioned. In particular, the effectiveness of the programme in terms of its employment generation capacity, resource-use efficiency and sustainability has come under attack from various quarters. At the instance of Planning Commission, the Programme Evaluation Organisation (PEO) undertook the evaluation of the performance, adequacy, effectiveness of the implementation mechanism and impact of the KVI programme. To test the relevant hypotheses and examine various issues, PEO relied primarily on the data base generated through a sample survey of 176 KVI units, 730 beneficiary households spread over 32 blocks in 18 states. The data from published sources as well as those from the offices of the implementing agencies were also collected and analysed. The major findings of the study are:
- the planning and implementation mechanisms are weak, as the linkages between production, sales and employment generation are not adequately considered;
- the monitoring is weak and the data base used for planning and
management decision does not represent the grassroots realities;
- in terms of output, sales, job creation and efficiency in use of resources, the performance of the village industry sector is much better than that of the khadi sector;
- the KVI programme, in spite of its poor performance, particularly in the
khadi sector, holds great potential as a poverty alleviation programme; and
- it is possible to run the scheme with reasonable level of fiscal support, if
certain corrective measures, as suggested in the report, are taken.

5
The study received constant support and encouragement from Deputy Chairman, Minister of State for Planning, Statistics and Programme Implementation, Secretary and Chairman (EAC) of Planning Commission. The study was designed and directed by Shri D. Das, Director (PEO) and Dr. S.M. Sirajuddin, Sr. Research Officer (PEO). The analysis of data and report writing were carried out by the officers of PEO under my overall guidance and supervision. The organisation of sample surveys, technical coordination among different offices and activities and computerization of data were carried out under the guidance of Shri V.K. Bhatia, Joint Adviser (PEO). The officers of NIC (YBU), particularly Shri M.K. Nanda extended all assistance for processing of data and statistical analysis.
The help and cooperation extended by the officers of KVIC, KVIB and state
governments are gratefully acknowledged. I also take this opportunity to express my gratitude to Shri B.B.Pandey of Sri Gandhi Ashram who helped us in understanding the functioning of the KVI institutions/units and their linkage with KVIC.
(S.P.Pal) Adviser (Evaluation)
New Delhi Dated: March 2001

6
Evaluation
of
Khadi and Village Industries Programme
Executive Summary
At the instance of KVIC and Planning Commission, the Programme Evaluation Organization (PEO) undertook the evaluation of the performance, suitability and effectiveness of the implementation mechanism and impact of the KVI programme. In addition, the study was designed to examine the adequacy of the planning, execution and monitoring aspects of the programme, and suggest measures to improve its performance. The reference period for the study was the entire period of the Eighth Plan (1992-1997). Main Findings Planning & Resources � �Inadequate linkage between production and sales strategies has resulted in
accumulation of stocks, low return on investment, non-performing asset build-up, low production and shrinking employment opportunities. Co-ordination among implementing agencies at various levels is lacking. The data base available with KVIC on production, employment, sales, earnings, stock and on other relevant parameters is inadequate and inaccurate. No scientific planning and implementation of the programme can be designed with this data-base.
� �The budgetary support constituted more than 80% of resources of KVIC till 1994-
95. It has come down to 35% with the introduction of MMS (Margin Money Scheme). About 67% of budgetary resources of KVIC went to the Khadi sector and one-third to village industries sector during Eighth Plan.
Employment � �As per KVIC’s own statistics, during Eighth plan only 8 lakh jobs were created as
against a target of 20 lakh set by the HPC (for 1994-97). About 95% of the additional employment generated during the Eighth plan was in the village industries sector, while this sector used only about one-third of the budgetary resources.
� �A large proportion of the employment opportunities is part-time employment and
the annual earning per worker in the khadi sector was found to be less than Rs. 50

7
for many workers, the average earning per part-time worker being Rs. 433/annum. As per secondary statistics, the average full-time worker earned about Rs. 4835/annum in the khadi sector and Rs. 4323/annum in the village industries sector during 1996-97.
� �Converting all part time employment into full-time equivalent employment (FTE),
we noted that KVI programme’s current employment level stood at 34.81 lakh in 1996-97, i.e. 59% of what has been reported in secondary statistics.
Cost of Job Creation/Maintenance � �Average investment for job creation in the Khadi sector is Rs. 27, 259/FTE job.
The annual public cost of maintaining a job created is Rs. 4979/FTE job. � �In the Village Industries sector, the investment for job creation is Rs. 43,366/FTE
job. The annual maintenance cost is Rs. 2158. � �The public (delivery) cost works out to 182% of wage payment in the Khadi
sector and 50% of the wage payment in the Village Industries sector.
Economics of Khadi & Village Industries Production
� �On an average, a sample khadi unit was found to have machinery and equipment worth Rs.4,96,305, invested Rs. 61,39,744 in working capital and employed about 246 FTE workers during 1997-98. An average khadi unit generates a surplus of Rs. 5987 per FTE worker under the present pattern of financing. However, this surplus is not translated into profit, as the entire production of the unit is not sold during the year. The average unintended stock build-up is around 35% of the annual production, and for small units, it is as high as 80%. The economics of khadi production will work out very differently if the inventory of finished goods could be reduced to, say, 5% of annual production. In such a scenario, a khadi unit will generate a profit of Rs. 5131/FTE worker or more than Rs. 12.6 lakh as total profit for the unit.
� �Another area of concern is the high raw material to output ratio. For some units,
the ratio is as high as three-fourth. A ratio of more than 25% is neither justified, nor sustainable.
� �The third area of concern brought out by the survey results is the low wage
payment to workers. Not only is this earning much less than what is reported in secondary statistics but, it also forms a relatively small proportion of the value added by an FTE worker. Only 58% of what the government spends on a khadi unit reaches the khadi workers.

8
� �On an average, a village industry unit invested Rs. 6,97,940 and employed 16.2 FTE workers. The village industries units are commercially viable and capable of sustaining themselves without much government subsidy.
Profile of Beneficiaries & Impact
� �The annual per capita income of the beneficiary households (workers) is Rs. 5655 and the earnings from KVIC programme constitute 52.71%. The income of an average village industries worker’s family is 70% more than that of a khadi worker’s family. The khadi workers’ families get 46% of their annual earnings from KVIC programme, while the village industries workers’ families earn about 58%. The relatively low income of khadi workers’ families is because of the dominance of part-time employment in this sector.
� �More than two-thirds of the sample households (workers) originally belonged to
the families below the Poverty Line. Of these poor households, about 71% have actually crossed the poverty line with the help of additional income from the KVIC programme. Here too, the performance of the village industries sector (80.5%) far outweighs that of the khadi sector (62.3%).
� �The key persons (presidents/secretaries) are also direct beneficiaries of the KVIC
programme. Analysis of survey data reveals that more than 50 per cent of the household income of the key persons comes from the KVIC programme.
� �The non-working members of the governing bodies of the units/ institutions also
receive financial benefits from the programme. On an average 15% of their annual household income comes from the KVIC programme.
Suggestions
� �The KVI programme has great potential for generating gainful employment
opportunities. It can be an effective social safety net during economic reforms. However, it has to be made fiscally sustainable.
� �The implementation of the programme for the Khadi Sector & Village Industries
sector runs parallely, and it is appropriate to have two separate implementing agencies- Khadi Commission for the Khadi Sector and the Village Industries Commission for the village industries sector. The former can be placed under the Textile Ministry and the latter may continue under the Ministry of Small Scale Industries and Agro & Rural Industries.

9
Corrective Measures for Khadi Sector The primary concern under the khadi programme should be to ensure that
production of goods actually takes place on a sustainable basis, so that its main objective of generating employment opportunities for the unskilled/ rural poor is met. The quantity and quality of employment are not satisfactory at present, because of low and shrinking production base. Factors, such as unintended stock build-up, constraints to input availability, capital of institutions/units getting locked up for years, non-availability of improved technologies and repair facilities, outmoded product mix etc. have all contributed in different degrees to the present sorry state of affairs.
� �The first and foremost requirement is thorough overhaul of the marketing
strategy for khadi products. Product development and marketing need a professional approach. One way of addressing this issue is to leave the entire marketing and product development to the private sector, while the semi-processed goods be produced by the KVI units/institutions under the guidance and supervision of KVIC as at present.
� �Production and employment bear a direct proportional relationship. The primary
task of the Khadi Commission (KC) under the new regime should be to closely monitor the flows of input and output. This will automatically ensure generation of employment opportunities. The Commission should be made accountable for maintaining the input-output relationship.
� �Rationalize the cost structure of Sliver Mills through better capacity utilisation and
other measures of cost control, including purchase of raw materials at fair prices. If the sliver supply from its own mills is inadequate to meet the demand of the institutions, KC can enter into an agreement with the under-utilized NTC mills to supply adequate quantity of better quality sliver for the institutions.
� �KVIC should not undertake any retail sale of khadi products. Instead, the
entire unprocessed khadi products be sold to the private sector either at cost price or, on auction, keeping cost-price as the floor price. The product development and marketing of khadi products can be left to the private sector.
� �The reorganisation and reorientation of KC should be done keeping in view the
role it has to play in the new scenario. It should concentrate on:
- technological upgradation and diffusion;
- ensuring supply of raw material and other inputs to all units at fixed prices and reasonable terms;

10
- ensuring delivery of output by the units to KC as per cost charts and inputs supplied, by linking release of concessional funds to delivery of output;
- imparting training to artisans and technicians more effectively than
being done at present;
- monitoring of input delivery, output quality, assessment of needs of the units in response to changes in market demand;
- developing an appropriate MIS to get market information feedback from
the private sector on the desired product mix, output quality, demand pattern and respond to the changes by reorienting production pattern of the units; and the like.
� �In the new scenario, no rebate on sale is necessary and the units should be run
purely on the basis of bank finance (CBC). � �It may be necessary to constitute a Committee to examine the feasibility of the
proposed model and to suggest suitable measures for restructuring of KVIC and its various activities, so that the primary objective of the scheme is realised with justifiable level of fiscal support. It is learnt that some specialist organisations (TISS and Arthur Andersen) are already studying various aspects of the scheme. The Committee may look into the findings of these reviews/studies along with those of the PEO’s evaluation study to arrive at a decision on restructuring of the programme and KVIC.
Corrective Measures for the Village Industries Sector:
� �No major changes are suggested for the design and implementation of village
industries programme. Under the existing mode of financing, the units are viable and are contributing to the social cause of generation of gainful employment opportunities with justifiable level of fiscal support. However, since there is scope for improvement in certain areas of operation as also for reducing the public spending on job creation/maintenance, the following measures are suggested.
- The Village Industries Commission should extend the necessary help to
enable the village industries to expand the market at home and abroad. In the domestic market, the village industries products may be standardised and sold through the various marketing co-operatives/federations rather than through KVIC outlets. For the export market, the Commission should organise special trade-fairs for Village Industries products both in India and abroad to enable the units to display their products and innovations.

11
- The Village Industries units encounter difficulties in obtaining the CBC financing facilities, even though their repayment record is good. The new Commission should look into the various aspects and put in place a mechanism that would ensure easy financing facilities for approved schemes.
- The existing monitoring mechanism of KVIC is very weak, as it does not
help generate realistic picture of employment, production, and number of functional units and utilisation of government assistance. The new Commission should strengthen the monitoring system for generation of reliable information with the provision for periodic joint inspection of certain percentage of the village industries units.

12
Chapter 1
Background –Khadi & Village Industries Programme
I. Introduction
Before Independence, the development of Khadi and Village Industries was entirely a non-governmental effort under the guidance of Mahatma Gandhi. After independence, the Government of India took the responsibility of bringing the development of Khadi and Village Industries within the overall framework of the Five Year Plans. Therefore, the Government of India set up Khadi and Village Industries Commission (KVIC), which is a statutory organization by an Act of Parliament. This organisation came up in 1956 and it plays a pivotal role in the strengthening of rural economy by promoting and developing Khadi and Village Industries. The Khadi and Village Industries programme plays a predominant role in providing employment opportunities to rural artisans more specifically the socio-economic weaker strata of the society. Since agriculture sector has been losing its ability to generate additional employment opportunities for the fast increasing workforce in rural areas, the importance of Khadi and Village Industries Commission (KVIC) has increased to find an alternative and appropriate employment for rural people.
The functions of the KVIC are generally to plan, promote, organize and assist in implementation of programmes for the development of khadi and village industries. To achieve this, it undertakes (a) financing of eligible agencies (b) training of persons employed or desirous of seeking employment in Khadi and Village industries, supervisors and other functionaries; (c) building the reserves of the materials; (d) R&D in Khadi and Village Industries sector; (e) promotion of sale and marketing of khadi and village industries products; (f) promotion and encouragement of cooperative efforts among the persons engaged in Khadi and Village Industries, etc. The implementation of Khadi and Village Industries Programme in our country is a joint effort of the Khadi and Village Industries Commission, which is an Apex Organization at the Central level and the State Khadi and the Village Industries Boards, functioning in various States and Union Territories. Though, the primary responsibility of carrying out programme of village industries lies with State Khadi & Village Industries Boards, they require drive and direction from central as well as state governments for the proper development of this sector. That is the reason when the Government of India decided to constitute a National Level Organisation in the name of Khadi and Village Industries Commission (KVIC). It emphasized the need for similar organisations in States also, to work in collaboration with the Central Organisation. Subsequently, the State Khadi and Village Industries Boards were constituted in all States and Union Territories. At present, there are 30 State KVIBs functioning all over India. These Boards are mostly assisting the implementing

13
agencies involved in the village industries programme. As on date, in general, about 77.96% of KVI Programme, in terms of production, is being implemented by State Khadi and Village industries Boards.
Though the basic objective of the KVI programme since very beginning was creation of employment opportunities in rural areas, it was observed during the Eighth Plan that in view of large scale unemployment in the rural areas this aspect would need focussed attention. Therefore, a High Power Committee under the Chairmanship of Honorable Prime Minister examined this aspect in detail in 1993-94 and recommended creation of additional two million jobs in the remaining 3 years of the Eighth Five Year Plan. In view of the above recommendation, KVIC introduced the following major programmes for creation of additional employment.
II Special Employment Programme for 50 Selected Districts Through Khadi and Village Industries.
The main objective of Khadi and Village Industries (KVI) programme during the 8th Plan was to create additional employment opportunities in the non-farm sector and to ensure increased wages/earnings to the rural workers. Therefore, it was proposed to cover 50 backward districts by 1996-97 for generation of employment at the rate of 10,000 per district in Khadi and village industries sector. KVIC formulated the “Special Employment Programme” for implementation in the selected backward districts of the country. The main objectives were: - i. to generate sustainable employment ensuring minimum wages to 10,000
artisans per district directly. (No mention of mandays); ii. to forge linkages with DRDAs, Banks and other agencies to integrate the
scheme into the overall employment generation programme for the districts; iii. to ensure that employment opportunities in adequate number is created for the
weaker sections, particularly SC,ST and women; and iv. to provide marketing support for the products made under the programme in
order to sustain the production activities.
III. Implementation Methodology The scheme is being implemented by KVIC through registered societies directly registered with KVIC and societies registered with KVIBs and non-Governmental Organisations, etc. The beneficiaries are selected from those below the poverty line and for this purpose the system followed by DRDAs for identification and selection of

14
beneficiaries are to be adopted. The beneficiaries and the implementing cooperatives/societies/NGOs are to be identified and selected by a Project Monitoring Committee under the Chairmanship of District Collector and consisting of representative from KVIC, DRDA Banks and other implementing agencies.
In order to achieve the target for employment generation, KVIC identified 21 backward districts in addition to 50 districts identified under Special Employment Programme. Apart from above, KVIC launched 125 Block RPDS Programmes on the occasion of 125th Birth Anniversary of Mahatma Gandhi on 2nd October 1994. Thus the specified area programmes viz. Special Area Programme for 50 related districts and REGP are being implemented by KVIC to cover 71 districts and 125 RPDS blocks with the following objectives:
a) To attempt at generation of additional employment for 7000 to 10,000 persons in an identified district and 1000 persons in a block in non-farming sector in rural areas of the country. The tenure of the programme is 3 years.
b) To help to improve regional imbalance in the industrial growth of the
country. c) To help upliftment of the people living below the poverty line. d) To upgrade the skills of the rural artisans in order to transform them into
an economic asset and thereby ensure better living standards. e) To make coordinated efforts for pooling together the resources of
KVIC, DRDA, financial institutions, public organisations, etc. engaged in rural developments for successful implementation of the programme.
f) To establish backward and forward linkages by making arrangements of
raw material and marketing of products through implementing agencies or NGOs.
IV. Need for the Study
In spite of High Power Committee’s recommendation for creation of additional two million jobs and specific programmes to be implemented by KVIC, it was observed that KVIC was not able to meet the target as is indicated in the Table 1.1.
Table 1.1

15
Production and Employment
Year Production (Rs. In Crores)
Employment (No. In lakh
persons) 1992-93 2876.00 52.50 1993-94 3233.86 53.28 1994-95 3224.06 53.46 1995-96 4026.44 56.72 1996-97 4516.26 58.17
Table 1.1 reveals that total employment generation in the two sectors has risen
from 52.5 lakh in 1992-93 to 58.17 lakh persons in 1996-97. It is noticed that only 4.89 lakh jobs were generated during the remaining 3 years of the 8th Plan against the target of 20 lakhs. As per the secondary data (Annual Reports, KVIC for the years 1992-93 to 1996-97) the value of khadi production was rising while the quantity of production was more or less at the same level during the period. Moreover earning per worker is much less in Khadi sector than in Village Industries sector. At the same time, there is huge amout of ever- rising subsidy and public expenditure for KVI Programme. During the Eighth Plan period Rs. 2722 crore was the total budgetary support to the programme. In view of large shortfall in the target, stagnation in khadi production, huge amount of subsidy and public expenditure during the period, KVIC and Planning Commission requested the Programme Evaluation Organisation to examine various factors responsible for not achieving the targets and also assess the performance of the Khadi and Village Industries Programme as a whole and the adequacies and appropriateness of the various aspects of implementation, so as to provide useful inputs to the policy makers and the implementers for taking corrective measures on existing bottlenecks at various levels for achieving the target.

16
Chapter 2
Evaluation Study- Objectives and Methodology At the instance of the Khadi and Village Industries Commission, the Programme Evaluation Organisation of the Planning Commission has taken up the Evaluation Study of Khadi and Village Industries Programme in general and rural employment in particular. In consultation with the Khadi & Village Industries Commission, it was decided to confine the evaluation study to the following objectives:
2.2.1 Objectives of the Evaluation Study
The specific objectives of the study were: (i) whether the programme has been able to generate additional
employment as envisaged under it; (ii) whether necessary infrastructure has been developed for meeting the
employment objectives;
(iii) to examine the adequacy and effectiveness of the existing administrative structure for planning, implementation and monitoring of the programme;
(iv) to examine the adequacy of funds for implementation of the programme;
(v) to evaluate whether the programme has helped for upliftment of the
poor; and
(vi) to identify problems in implementation of the programme and suggest remedial measures to achieve the targets;
2.2.2 On the basis of the findings of the study, the evaluation study may suggest modifications in design and implementation of the scheme that could contribute to the improvement in performance and hence effective utilization of resources allocated to KVIC. The specific objectives of the study as outlined above are in the nature of general hypotheses. Each of these could be converted into a number of empirically testable specific propositions. The results of such empirical test can help (a) answer if the mandated objectives of the programme being met and (b) in identifying the areas of strength/weakness and (c) in making diagnostic analysis of successes and failures.

17
2.3 Methodology
For testing the hypothesis implicit in the aforesaid objectives, both primary and secondary data were collected through the instruments at various levels. Besides, formal and informal discussions were held by the field teams with the implementing agencies during the course of field investigations to ensure accuracy of the data.
2.4.1 Instruments The following instruments were structured for collection of data:
2.4.2 Headquarters Schedule
This schedule was designed to collect secondary information at all-India level from the Headquarters of the KVIC on aspect like extent of employment generation, marketing facilities, monitoring arrangements, training facilities etc. 2.4.3 State Schedule (KVIC & KVIB Separately)
This schedule was designed for KVIC and KVIB separately to collect information at the state level on employment generation, financial arrangements for implementation of the programme, monitoring facilities, existing monitoring mechanism etc. in the state.
2.4.4 District Schedule
This schedule was prepared to collect information on functioning of district office, employment generated and production level in both khadi and village industries in the district.
2.4.5 Beneficiary Schedule (Unit)
This schedule was designed to collect information on various aspects of the unit relating to employment generation including the cost of production.
2.4.6 Employee Schedule
This schedule was prepared to know the impact of the scheme on the persons working in the beneficiary units. This schedule covered the employees working in the units and non-working members of the units and key-persons of the unit.

18
2.5.1 Selection of Sample
Initially, we intended to select all the States where the scheme is in operation. However, for security reasons in the North Eastern region, only three representative States of Assam, Meghalaya and Tripura were purposely selected. (List of the selected sample is at Annexure-I). 2.5.2 Though 125 blocks were identified for implementation of the Employment Generation Scheme, the scheme was currently operational in 81 blocks only. Out of these, three blocks were in the states of Arunchal Pradesh, Nagaland and Punjab (one each). Since these states are not included in the sample, the study covered only 78 blocks out of 125 identified blocks under the scheme. Given the time, manpower and financial constraints, it was decided to adopt sampling method for generating the needed data base for the study. It was, however, observed that these 78 blocks were scattered unevenly across the 18 selected states. In order to give proportional representation to all the States, PPS sampling methodology was adopted with the restriction that a minimum of one block is selected from each state. List of the selected States, districts and blocks is given in the Annexure-I.
2.6.1 Selection of Beneficiaries
From each selected block, Khadi and Village Industries units were identified with the help of the District Officer. From each of these two categories of units (1. Khadi and 2. Village Industries), the following three types of beneficiary units were selected.
Khadi Sector Unit Village Industries Unit KVIC/KVIB Departmental 1 KVIC/KVIB Departmental 1 Cooperative 1 Cooperative/Institution 1 Institution 1 Individual Unit 1 Total 3 Total 3 Total No. of Beneficiary units: 32 (block) X 6 = 192 2.6.2 Wherever a specific unit was not available in the same block, it was substituted by another unit in other nearby identified block in the same district, or nearby district if not available in the same district.
2.7 Selection of Individual Beneficiaries (Employees/Key Persons)
From each unit the following types of beneficiaries, were selected for
canvassing:

19
1. Chairman/Secretary (Key person In-charge of the Unit) (1 from each unit)
192 X 1 = 192
2. Three Workers (1 from each unit) 192 X 3 = 576 3. One Non-working member from each of the selected
cooperative/ institution (Khadi + Village Industries. 32 + 32=64
Total 832
2.8 Coverage The Study included the following sample:
1. KVIC Headquarters 1 2. States 18 3. Districts 32 4. Blocks 32 5. Beneficiary Units 192 6. Individual beneficiaries 832
2.9 Reference Period The Reference Period for the Study was 1992-93 to 1996-97 (Eighth Plan -five
years ).
2.10 Orientation of the Field Teams The Study design, the instruments were finalised in a meeting of the Heads of
the Regional Evaluation Offices (REOs) of the P.E.O. held on 23-25th September 1998 at the Headquarters. The R.E.Os. in turn held orientation programmes for their respective field staff in the first week of October, 1998 where all the instruments prepared for the study were explained to field teams of the selected States. The study was launched in the field in October 1998.

20
Annexure – I
List of Selected States, Districts and Blocks for the Study of Khadi and Village Industries Programme
Sl. No. State Block District
1. Andhra Pradesh 1. Ibrahim-Patnam 2. Madakasira
1. Ranga Reddy 2. Anantapur
2. Assam 1. Matia 2. Bihpuria
1. Goalpara 2. Lakhimpur
3. Bihar 1. Senha 2. Chanari
1. Lohardaga 2. Rohtas
4. Gujarat 1. Desada 2. Savarkundla 3. Palampur
1. Surendranagar 2. Bhavnagar 3. Banaskantha
5. Haryana 1. Narayangarh 1. Ambala 6. Himachal Pradesh 1. Rampur
2. Chambal 1. Shimla 2. Chamba
7. Jammu & Kashmir 1. Reasi 1. Udhampur 8. Karnataka 1. Kustagi
2. Holalkere 1. Raichur 2. Chitradurga
9. Kerala 1. Pazhayanur 1. Trissur 10. Maharashtra 1. Khej 1. Beed 11. Madhya Pradesh 1. Mainipur
2. Kusmi 3. Shankargarh
1. Raipur 2. Sidhi 3. Sarguja
12. Meghalaya 1. Sel Sella 1. West Garo Hill 13. Orissa 1. Guma
2. Ghatgam 1. Gujapati 2. Keonjhar
14. Rajasthan 1. Kolayat 2. Balothara
1. Bikaner 2. Badmer
15. Tamil Nadu 1. Vilathikulam 1. Chidambarnar 16. Tripura 1. Mohanpur 1. West Tripura 17. Uttar Pradesh 1. Bijua
2. Mauranipur 3. Fatehpur
1. Kheri 2. Jhansi 3. Mau
18. West Bengal 1. Raghunathpur 1. Purulia Total 32 32

21
Chapter 3
Administration – Planning, Implementation and Monitoring KVIC is entrusted with planning, promotion, organisation and implementation of programs for the development of khadi and village industries in the rural areas in coordination with other agencies. Its functions consist of providing financial assistance, building up of resource raw materials and implements for supply to units/entrepreneurs, creation of common service facilities of processing semi-finished goods, marketing of KVI products, organisation of training for artisans/entrepreneurs, promotion of research in the production techniques and equipments and to ensure quality control. This chapter analyses the existing infrastructure facilities of KVIC in terms of administration, its functions of planning, implementation, co-ordination, marketing and quality control to find out the factors contributing to the implementation of KVIC programmes. 3.1 Administrative Structure The implementation of Khadi and Village Industries Programme is a joint effort of the Khadi & Village Industries Commission, which is an apex organisation at the central level and the State Khadi & Village Industries Boards, functioning in various States and Union Territories. The Headquarters of the KVIC is situated at Mumbai, headed by a Chairman and supported by 7 members, a Chief Executive Officer (CEO) and Financial Adviser. CEO is the administrative Head and there are 6 Zonal Offices for six Zones (East, West, North, North-East, Central and South) in the country (Fig.1). At KVIC Head Office, Chief Executive Officer (CEO) is assisted by Joint CEO, Financial Adviser, 4 Dy.CEO’s, Chief Vigilance Officer and about 44 Directorates of different divisions with supporting staff. KVIC has also marketing and training centres looked after by Manager/Director and Principal respectively in most of the States. There are also special officers for special projects like Central Sliver Plant, workshops, Extension centres with supporting staff. The State KVIC offices are situated at 30 State/UT. capitals headed by a Director. Zonal offices are headed by a Dy.CEO and supporting staff. Khadi sector is being looked after by about 16 Directorates and there are about 20 Directorates to implement and monitor the Village Industries Programme. Directorate of Economic Research co-ordinates the activities of other Directorates and conducts periodic surveys and studies. There are multiplicity of directorates and officers are found to hold more than one division under their charge. As on March, 1997, KVIC has reported a total staff strength of 4659 and out of these 291 are officers. It was found that Technical Officers were in position against the sanctioned posts in all the selected States except in Jammu & Kashmir.
3.2 Directorate of Rural Employment Generation Programme (REGP)
In view of the priority being given to creation of employment and to meet the employment target, KVIC merged the Directorate of District’s Special Employment Programme (SEP) and 125 block programmes. These programmes are being
22
implemented by the Directorate of Rural Employment Generation Programme (REGP) since 1.4.1997 at KVIC, Mumbai. The main functions of this Directorate are: i.) Formulation of policy and procedure, ii) Establishment of implementing agencies, iii) Scrutiny and process of the budget proposals, iv) Sanction and release of funds and v) monitoring the programme. 3.3 KVI Boards Khadi and Village Industry Boards are statutory Boards constituted by respective State Governments. KVI boards implement 90% of Village Industries programmes of KVIC, whereas KVIC looks after mainly the khadi implementation programmes and the rest of Village Industries programmes. There are altogether 26 State KVI Boards and 4 U.T. KVI boards in the country. The organisational structure of KVIB is more or less similar to KVIC headquarters in various States. KVIB’s are headed by Chief Executive Officer and supported by Financial Adviser, Executive officers, Registrar, Development Officers, Accounts officers, technical officers and administrative staff. There are variations between the selected States for the number and designation of staff at various levels. In the case of KVI Boards of the selected States, it was found that except in the States of Bihar, Madhya Pradesh, Orissa, Rajasthan, Tamil Nadu and Uttar Pradesh and West Bengal, necessary Technical Officers were in position against the sanctioned posts for the implementation of KVI programme. 3.4 District Administration KVIC programme is implemented at the District level primarily by the District Officer of the KVIB. The District Officer of the KVIB is the member Convenor of the District Level Committee comprising District Collector as Chairman, General Manager of the District Industries Centre, Project Director and DRDA of the district as Members. There are also 4 to 5 Members of Legislative Assembly and one non-official member nominated by the Government. This Committee has to periodically review the implementation of the programme in the district. The main functions of the District Officer are (i) to plan and implement the programme in co-ordination with other agencies engaged in rural development like DRDA, (ii) to advertise the programmes in the local newspapers and invite the applications from the beneficiaries, (iii) to scrutinise the applications received from the beneficiaries, (iv) preparation of budget proposals for the ensuing year; (v) providing them technical assistance through supply of designs, prototypes and information and (vi) to promote sales of KVI products by providing marketing facilities. Though KVIB’s district office is the main agency for implementation of KVI programme many of the district officers of KVIB do not maintain important data relating to units. As some of the khadi and Village Industries institutions run by NGO are doing well, a coordinated effort by KVIC and KVIB is required to promote them for further expansion and by tapping resources from other funding agencies like DRDA, IRDP, etc.

23
3.5 Coordination between KVIC and KVIB Though KVIC is a central organisation and KVIBs are the State level agencies, there is a need for coordination of activities between KVIC and KVIB for successful implementation of the programme. KVIC has to ensure coordination of activities with the Board through discussions of budget proposals by allocating targets for employment and production. KVIC also has to ensure the creation of the Monitoring Committee under the State Industry Secretary for monitoring and coordination of the programme in the State. State-wise targets are fixed by both State KVIC offices and KVI Boards and divided between them for implementation. Though KVIC provides funds with guidelines for implementing its programmes through KVIB, they do not have direct control over them. The major functions of the State KVIC offices are to (i) identify institutions/ entrepreneurs for implementation of the programme, (ii) conduct annual budget discussion to fix the target for employment and production, (iii) supply equipment such as New Model Charkha (NMC) units, twisting units, etc. (iv) provide raw materials such as cotton, sliver, etc., (v) provide marketing support through sales outlets,(vi) conduct economic and sample surveys. Similar functions are performed by KVI Boards in the States for village industries. The Development Officer of the KVIC/KVIB has to scrutinise the proposed units and personally inspect those units before they are sent to Assistant Director/Dy.Director concerned for final scrutiny. The implementation of the programme to a great extent depends on the Development Officer/Assistant Director/Dy.Director. It was found that except in the States of Jammu & Kashmir, Technical officers were in position against the sanctioned posts in all the States. However, our qualitative field data from many States like Himachal Pradesh, J&K and Bihar indicate ineffective administration and lack of coordination between KVIC and KVIB which is hampering the programme, particularly, at implementation and monitoring stages. 3.6 Planning State level planning is initiated by KVI Boards and KVIC State Offices. Representatives from KVIC State Offices as well as State KVIBs participate in the meetings, for finalisation of the proposal at Mumbai. The sector-wise scrutiny is done by the respective Director of the sector at KVIC Headquarters. A summary of scrutiny is placed before the Chairman who takes a final decision in a meeting of senior officers. The meetings are held at the Headquarters State-wise where the proposals are finalised. Then the proposals are placed before the Standing Committee for approval. Our data from the 8 selected States (Assam, Himachal Pradesh, Jammu & Kashmir, Karanataka, Maharashtra, Madhya Pradesh, Meghalaya and Uttar Pradesh) indicate that, 95% proposals were approved in the case of Khadi sector of the 8010 project proposals. In the case of village industries sector, 80% of the proposals were cleared out of the 10,063 projects received in the 11 selected

24
States. Annual action plans prepared by KVIC/KVIB are not based on sound knowledge of ground realities in the field as observed from many States. It has been observed that, District Officers are not involved and infrastructure facilities and viabilities of projects are not evaluated properly. Effective planning and implementation of the programme depends to a great extent upon the adequate staff. It was found that in the selected States, KVIC officers at upper and technical levels were in position against all the sanctioned posts except in the States of Jammu & Kashmir and Meghalaya. In the case of State Khadi & Village Industries Board, except in the States of Bihar, Madhya Pradesh, Orissa, Rajasthan, Uttar Pradesh and West Bengal, officers are in position at the higher level. The post of Director was vacant in Meghalaya State KVIC office. 3.7 Implementation The developmental programmes are executed through 4777 registered institutions, 30,100 cooperative societies and about 7.50 lakh individuals spread over 2.45 lakh villages. Fixation of targets to be achieved by both KVIC and KVIB starts from the initial stage of budget discussion. After the targets are fixed for the State, the targets are bifurcated for KVIC and KVIB keeping in view the budget allocation of the current year, performance of the previous year and scope of expansion of activities in the next year. The responsibility of achieving the targets by the Board totally depends on the District Officer who is entrusted with the job of ensuring adequate number of projects to be operationalised in his district with the help of the funds provided by the KVIB. It was observed that more or less similar type of functions are performed by KVIC and KVIB at the district level for implementation of the programme and the area of the district is distributed between KVIC and KVIB to carry out their respective activities. The important aspect of the KVI programme is to operationalise a unit after its sanction. In the selected states, out of 13,721 approved projects during the 8th plan, only 37% of the projects could be operationalised during the same year and 7% of the projects could never put into operation. The major reasons for the projects not getting operationalised during the same year were: non-availability of adequate funds timely (43%) and procedural delay (26%) (Table 3.1). Main reason reported for the sanctioned projects never taking off was the change in funding pattern from KVIC to Consortium Bank Credit (CBC), as many of the entrepreneurs were not able to furnish security (30%). In some of the selected States (Aandhra Pradesh, Kerala, Tripura and Uttar Pradesh). procedural delay in completing formalities was the reason for the projects not getting operationalised during the same year of its approval. There were also cases of mis-utilisation of funds (24%) by the entrepreneurs in the States of Haryana, Himachal Pradesh and Karnataka (Table 3.1). These reasons for not getting the sanctioned projects operationalised in time should be attended to by the implementing

25
agencies. In some States like Andhra Pradesh, Haryana, Himachal Pradesh, Maharashtra, Meghalaya, Orissa, Tripura and Uttar Pradesh steps are now being taken to provide technical guidance to minimise the delay. 3.8 Certification Committee There are six Zonal Certification Committees, besides the Central Certification Committee at Mumbai. As per the KVIC Act, it is necessary for any khadi institution/individual unit under Village Industries to posess the Certificate from the Certification Committee to get any kind of financial/technical assistance from KVIC. The eligibility criteria for obtaining a certificate from the KVIC are: (i) Registered societies/institutions under Societies Registration Act with the aim to implement KVI Programme in the rural area with no profit no loss motive, (ii) institutions intend to implement KVI programme should be registered as per the model by-laws of KVIC, (iii) the process of manufacture/activities has to be in line with the approved pattern of KVIC. Certified units, avail the facilities provided by the KVIC such as financial assistance, supply of raw materials, rebate on khadi sales, technical guidance, marketing support, etc. 3.9 Quality Control For ensuring quality of KVI projects, KVIC has set up a quality control unit, Directorate of Khadi Processing at Central Office, Mumbai. The samples of khadi cloth are being tested by this quality control unit. It has been reported by the Headquarters of KVIC that in its cost chart, the fabric particulars are mentioned and institutions have to produce items in accordance with the quality mentioned in the cost chart. Similarly, products produced under village industries are directed for testing in the Quality Control Laboratories-cum-Training Centres with the set standard for the product. However, it has been observed that most of the institutions do not follow these procedures and KVIC is not enforcing quality control mechanism effectively. Under Science and Technology sector, the Commission receives one crore rupees (Rs. 30 lakh for khadi and Rs. 70 lakh for Village Industries), each year for Research and Development in production techniques and to draw up standards and specification for different items through testing and quality control methods. KVIC has a separate Science and Technology Directorate and has initiated research and developmental activities at the Central Office to ensure cost effectiveness and competitiveness of the products of the units. So far about 20 BIS have been obtained. It has got two laboratories at Khadi Gramodyog Prayog Samiti, Ahmedabad and Directorate of Khadi Processing, Mumbai. While the former is predominantly equipped to test physical properties and to do research on mechanical processing, the later is equipped to test the fastness properties of processed goods and to conduct research on chemical processing of Khadi textiles. KVIC has developed new Model Woolen Charkha incorporating two arm drafting system to process merino wool. KVIC has also developed charkha having productivity of 900 gms – 1 Kg. Yarn per

26
day. It was found that in almost all the selected States, 8 spindles New Model Charkha (NMC) was introduced to get more production of good quality yarn leading to higher wages to the artisans. The major problems are still with the improvement and innovation of processing techniques and finished products of KVIC. KVIC. Should strengthen the Jamnalal Bajaj Central Research Institute, Wardha on the basis of Tilak Committee’s recommendations and equip it with quality control laboratories and prototype development centre. KVIC should identify existing testing centres run by SIDO and other Central Govt. organisations and a separate quality marketing system could be evolved like BIS or Agmark for different KVI products, keeping in view the export potential of KVI products. KVIC should encourage artisans and entrepreneurs for conducting experiments on new equipments and should arrange for the supply of improved equipment and tools to the beneficiaries. The High Power Committee and Working Group of Ninth Plan have pointed both non-utilisation of S&T resources and non-implementation of new technology and methods by KVIC. Directorate of S&T should organise workshops, demonstration centres and seminars in different parts of the country for ensuring technology transfer from labs to the units. During 1996-97 it has been decided by the KVIC to constitute Consumer Redressal Committees at the State level to ensure quality of products, proper pricing, packing, etc. but these are not effectively working. 3.10 Marketing and Sales KVIC has a Directorate of Marketing at Central Office Mumbai and is running a number of Bhavans. Some of these Bhavans are making profits and the rest are running in loss. The major problem encountered with KVIC products is regarding marketing and sales. Khadi and V.I. products are being sold through the network of 5441 sales outlets of directly aided institutions of KVIC and KVIBs including departmental sales outlets. This is an internal arrangement for KVI products and there is no full assurance of sales for entrepreneurs/units. Many of the KVI units/institutions are having their own arrangement for sales through wholesalers, retailers, etc. and finding it difficult to market their products. Our field data indicates that, 52% of the cases have reported marketing of their products by themselves followed by 27% through exhibitions and weekly markets arranged by KVIC/KVIB, 6% as sales through Government hospitals, hostels and other institutions and only about 15% through Government retail shops. Though HPC has recommended replacement of rebate with Market Development Assistance, the units/entrepreneurs are not enthusiastic about this arrangement and KVIC is not implementing the programme. Our qualitative and quantitative data from the field indicate lack of marketing and sales support and the units have expressed the innumerable difficulties in selling their products. KVIC should make efforts in marketing KVI products in India and abroad. Directorate of Marketing is taking initiative now for export promotion, exhibition, networking with PDS, Governmental institutions and Handloom sector as per the suggestions of the Expert Committee constituted during 1996-97.

27
3.11 Monitoring KVIC programmes are monitored from the KVIC Headquarters through the State Offices and regional offices. The State Offices of KVIC monitor the programmes of the State KVI Boards and the directly financed units of the KVIC in the States. At the Headquarters, individual industry and the Programme Directorate monitor their programmes through State Offices with the help of quarterly and annual reports and also by surprise visits to the units. Data from individual artisans assisted is collected through random sample methods and not from all individuals. Directorate of Economic Research, Mumbai is responsible for collection and analysis of progress of its directly aided institutions. KVIC also undertakes special studies on various problems and conducted so far about 150 studies. The State KVI Boards monitor their programme through the District Village Industries Officers (DVIO). Monitoring in the selected States is routinely carried out on: (i) employment (number of jobs created but not mandays), (ii) production (quality and money value), (iii) sales and (iv) recovery of outstanding loans but not on loss of jobs due to closure of the units and availability of quality raw materials (except in Andhra Pradesh). It was reported that monitoring was done quarterly in all the selected States and in some of the selected States (Andhra Pradesh, Haryana, Himachal Pradesh, Jammu & Kashmir, Kerala and Meghalaya) monitoring was also reported every month in addition to quarterly monitoring by the State KVIC offices. Inspite of these arrangements, there are loose ends in the system of data collection, compilation and dissemination. Data generated through the field returns from the units are not verified by KVIC and therefore, may not represent the grassroots reality. In the employment statistics, we have noted discrepancies between the unit level data generated through the field survey by PEO and those reported in secondary statistics. The data relating to financial flow estimates of production and employment are not presented in an organised manner and one has to scan through various volumes of KVIC publications before drawing any conclusion. As various types of data are required for effective implementation, the High Power Committee and 9th Plan Working Group have also suggested (i) improvement of data collection, (ii) to incorporate the Lead Bank returns for generation of data on financing and (iii) computerisation of data management of KVIC and KVIBs.

28
Table 3.1
Implementation Methods in Selected Districts Procedures/Reasons Frequency % I. Reasons for the projects not getting operationalised
during the same year.
a) Non-fulfilment of Debt Equity Ratio and other legal Formalities,
4 18
b) Non-completion/ availability of infrastructure facilities 1 4 c) Non-availability of timely adequate funds 10 43 d) Procedural delays in completing formalities 6 26 e) Delay in acquiring machinery /equipment 2 9 Total 23 100 II. Reasons for some sanctioned projects never taking off a) Non-furnishing of security by institutions/ individuals. 4 30 b) Administrative reasons 2 15 c) Legal Constraints 2 15 d) Mis- utilisation of funds by the entrepreneur 3 24 e) Non-release of funds by the Central Office/Bank 1 8 f) Non-availability of Raw material 1 8 Total 13 100 III. Efforts to minimise delays in making sanctioned Projects
operationalised
a) To provide technical guidance 8 44 b) Registration within reasonable time 4 22 c) Continuos monitoring 3 17 d) Early/timely release of funds 2 11 e) To co-ordinate with concerned Departments/ Agencies for
speedy action. 1 6
Total 18 100 Source: PEO District Schedule.

29
Figure – 1 Annexure
ORGANISATIONAL STRUCTURE OF KVIC Supporting Staff for every Directorate are: Deputy Director, Assistant Director, Superintendent/Development Officer/Accounts Officer/Supervisors, UDC, LDC.
CHAIRMAN
Member North
Member West
Member Central
Member South
Chief Executive Officer (CEO)
Financial Adviser (FA)
Member East
Member North-East
Member Khadi Expert
Member Village Industries Expert
Financial Adviser Joint Chief Executive Officer
Deputy CEO (Finance, Accounts, Budget, Audit)
Director Finance
Director Accounts
Director Bank Finance
Director Budget
Director Inspection
Dy. C.E. O. ((K&GA)
Dy. C.E.O. (NCE/HRD)
Chief Vigilance Officer
Marketing & Training Centre
Dy. C.E.O. (Eco. Res. Mkt. Publ.)
6 Zonal Centres 6 Dy. CEOs (North, South, central, West, East, North-East)
Director (Vigilance)
Director (Admn.)
Director (Admn.)
Directorates of Khadi (16)
Directors in 30
States/UTs
Directors/ Dy. Director/
Principal
Directorates of Village
Industries (20)
Supporting Staff

30
Chapter 4
Financing the KVIC Programme - A Performance Analysis
The KVIC has been implementing the programme through more than 4700 registered institutions, including NGOs and 30 State (UT) KVI boards. The State KVI boards in turn implement the programme through about 30,100 cooperative societies and 7.5 lakh individual entrepreneurs covering about 2.41 lakh villages in the country. How does the KVIC generate the funds for implementation of the programme? Are the methods employed for formulation of plan proposals realistic and rational? Are the funds generated adequate for the implementation of the programme? How does the KVIC utilise the allocated funds and disburse to its implementing agencies like KVIB/KVIC/institutions/entrepreneurs? A review of the functioning of the State KVIBs, KVIC and the role of Banks with reference to the above issues has been attempted in this Chapter.
4.1 Sources of Funds for KVIC
The budget support being provided by Government of India every year is the main source of finance for KVIC to implement its promotional and developmental programmes. In order to facilitate formulation of the plan every year, KVIC conducts discussions with its implementing agencies to fix the financial and physical targets for each of them, considering various factors like availability of infrastructure, past performance, potentiality of various KVI programmes. As per the KVIC Act, the funds provided by Government of India under its budgetary sources are credited under broad Heads such as (1) Khadi, (2) Village Industries, and (3) General and Miscellaneous. Besides the budgetary support, KVIC also generates resources every year in the form of credit from the Consortium Banks (since 1995-96), refund of non-utilised grants and loans from its subsidiary state units and institutions.
4.2 Eighth Plan Allocation As against the total outlay of Rs. 900 crore, the actual release during the Eighth Plan period was of Rs. 1497.85 crore. The Eighth Plan allocation under KVIC works out to 0.2 per cent of the total public sector outlay in the country. The allocation of KVIC sector was 1.8% of the public sector outlay during Second Plan period and since then it is steadily coming down in subsequent plans. The High Power Committee and the Working Group of the Ninth Plan recommended a step-up in the outlay to 1.8% with1/3 budgetary support and 2/3 institutional finance from Banks.

31
4.3 Plan Proposals and Allocation The Government has allocated about 49% of the KVIC’s proposed budget during
Eighth Plan. A perusal of the Table 4.1 indicates that KVIC has originally proposed an outlay of Rs. 5659.79 crore and revised it subsequently to Rs. 5863.77 crore as its requirement, but the Government has allocated Rs. 2768 crore (i.e. about 47% of the revised outlay proposed by KVIC) as both plan and non-plan budgetary support for the 8th Plan period. It is observed that the major cut is in respect of plan allocation (i.e. only 29% of the proposed outlay allocated), whereas the non-plan proposals and allocation are as per the requirement of KVIC. Though the government has agreed to allocate Rs. 2768.1 crore, it has actually released Rs. 2721.9 crore contributing about 46.4% of the revised budget proposal. There is a major gap between the demand and budgetary allocation and these gaps have widened in the later years of the 8th Plan period i.e. after the introduction of Rural Employment Generation Programme (REGP) in 1993-94, and raise a question about the rationality of the process of preparation of budget proposals of KVIC.
Table 4.1
Budget Proposals, Allocation & Release of Funds – Eighth Plan
(Rs. In Crore)
Budget Proposals Year Original
(Khadi +Village
Industries)
Revised (Khadi +Village
Industries)
Government Allocation (Budget) (K +VI)
Government Release (K +VI)
Plan 494.41 603.36 193 193 Non Plan 254.01 243.94 161 161
1992-93
Total 748.42 847.3 354 354@ Plan 692.23 617.86 208 208 Non Plan 332.34 332.34 325.6 325.6
1993-94
Total 1024.57 950.2 533.6 533.6@ Plan 679.62 830.77 216 216 Non Plan 348.2 349.2 341 341
1994-95
Total 1027.82 1179.97 557 557@ Plan 823.27 1042.78 343 337 Non Plan 323 323 323 323
1995-96
Total 1146.27 1365.78 666 660@ Plan 1377.47 1190.28 343 308.2 Non Plan 335.24 330.24 314.5 309.1
1996-97
Total 1712.71 1520.52 657.5 617.3@ Plan 4067 4285.05 1303 1262.2 Non Plan 1592.79 1578.72 1465.1 1459.7
Total
Total 5659.79 5863.77 2768.1 2721.9 @ : Including Rs. 34.00 crore (23.00 crore for Khadi +11.00 crore for Village Industries) as Subsidy in Lieu of Interest on Govt. Loans under Non-Plan.
Source : Annual Reports, KVIC and Ministry of Small Scale Industry.

32
4.4 Allocation between Khadi & Village Industries A major component of the budgetary resources under plan are allocated
towards Grant and Loan for Khadi and Village Industries, primarily for the khadi sector (Table 4.2 and 4.3). The Khadi industry received the lion’s share of the budgetary allocation of resources. Another interesting point emanating from this table is that resources under plan are given mainly as Khadi grant, and loans under Khadi are only 15 to 21% during the five years. This trend is reverse for the village industries sector and only in the last two years, grants are on a higher scale for Village Industries sector.
Table 4.2
Sectoral Budgetary release During 8th Plan (Rs. In Crore)
Sector Plan Non-Plan Total Khadi 509 120 629 Village Industries 384 - 384
Khadi 92 115 207 Subsidy in lieu of Interest on Government Loans
Village Industries 50 55 105 Khadi 1.5 - 1.5 Science & Technology Village Industries 3.5 - 3.5
REGP/SEP Funds 222.2 - 222.2 Administrative & Miscellaneous - 91.36 91.36 Renewal of past loans - 1078.38 1078.38 Total 1262.21 1459.74 2721.9 Source: Ministry of Small Scale Industry.
Table 4.3
Grant and Loan Component Allocation During 8th Plan*
(Rs. In Crore)
Sector Grant Loan Proportion of Grant Khadi (including Interest Subsidy) 676.5 161 80.7% Village Industries (including Interest Subsidy)
315.5 177 64.1%
* Excluding REGP/SEP Funds. Source : Ministry of Small Scale Industry.
A major part of the Khadi grant is being utilized for payment of Khadi
sales rebate, which is considered a promotional expenditure. In addition, expenditure for training, publicity, marketing activities, etc. under Khadi programme are also incurred from this source. Interest subsidy on bank loans under interest subsidy eligibility scheme is also met from Khadi grant Head. Khadi loan is an expenditure provided in the form of working capital, capital expenditure for various purposes like machinery, implements, worksheds, sales outlets, etc.
Village Industries loans are utilized for providing Working Capital/capital
expenditure loans financed directly by KVIC. After the introduction of line credit of Rs. 1000 crore under Consortium Bank Credit (CBC) in 1995-96, budgetary support for Village Industries loans have declined. Like in Khadi, Village Industries grants

33
are being utilized for sales rebate and promotional ventures like publicity, marketing and also interest subsidy.
Under Science and Technology, a sum of one crore rupees was spent every
year during 8th plan period for research and development. Loans provided by government under khadi is made available (interest free) to the implementing agencies, whereas village industries are liable to pay 4% interest per annum. As banks charge higher rate of interest, subsidy in lieu of interest is provided by Government to bridge the gap in respect of Government loans (payable by KVIC every year under Plan and non-plan which is only a book adjustment). About 7% to16% of plan resources and 11% of non-plan resources are getting allocated for interest subsidy purposes.
Another disturbing feature of the plan allocation/release is with regard to the
khadi (grant) sales rebate as promotional expenditure, which appear under non-plan Head every year. Though the Government is allocating grants for promotion of khadi and village industries under plan since the terminal years of Sixth Five Year Plan, this expenditure has been transferred under Non-Plan Head too. Since then (Seventh Plan period), Government continues to allocate Rs. 24 crore every year under Non-plan Head and efforts may be made to shift this committed expenditure like interest subsidy and sales rebate to Non-plan. The loans being provided by Government every year under Khadi and Village Industries are repayable normally after 5 years or the period indicated in the sanction. However, under Khadi programme, the implementing agencies are permitted to retain this as working capital without refunding. Loans provided to KVIC are renewed every 5 years when it becomes due for repayment but this is just a book adjustment without any cash flow under non-plan Head. As renewal of past loans form about 75 to 77% of the Non-plan budgetary support and as no real resources are being given for its refund a mechanism may be devised to do away with this sectoral allocation.
4.5 Interse Allocation of Budgetary Resources
The Government release of finance against the budgetary allocation under
Khadi and Village Industries sectors is shown in Tale 4.4. About 61 to 64% of the budgetary finances are allocated to Khadi sector. Village Industries sector gets an average of 36 to 37% of the budgetary resources. The interest subsidy component for Khadi sector is almost twice as much as that for Village Industries, but loan component is less indicating a bias favouring the Khadi sector by the Government. Since 1995-96, the Government is releasing a considerable amount under REGP, Consortium Bank Credit (CBC) and for Special Employment Programme (SEP) and these funds can not be sectorally bifurcated. If resource allocation could have been appropriated sectorally, then Khadi sector’s allocation would have shown more inflated figures.

34
Table 4.4
Year-wise Government Release to KVIC for the 8th Plan
(Rs. In Corore)
Year Khadi Village Industries Khadi & Village Industries
Grant Loan Subsidy Interest
Total Grant Loan Subsidy Interest
Total Grant Loan Subsidy Interest
Total
1992-93 83.3 35 37 155.3 16.7 58 21 95.7 100 93 58 251 1993-94 81.3 35 43 159.3 19.7 55 26 100.7 107 * 90 69 266 1994-95 86.3 35 43 164.3 24.7 50 26 100.7 120* 85 69 274 1995-96 84.3 35 42 161.3 74.7 10 16 100.7 292@ 45 58 395 1996-97 134.3 21 42 197.3 74.7 4 16 94.7 283.2@ 25 58 366.2
Total 469.5 161 207 837.5 210.5 177 105 492.5 902.2 338 312 1552.2 @ It includes SEP/ Rural Employment Generation Programme Funds also. * SEP Funds. Excluding renewal of past loans and Administrative Expenditure which is 1169.7 crore.
Source Ministry of Small Scale Industry.
4.6 Availability of Finances from other Sources
In addition to the availability of budgetary support, KVIC has other sources of finance through departmental receipts by way of refund of non-utilised grants and repayment of loans from its assisted agencies. The details during the 8th Plan period are shown in Table 4.5. Budgetary support constitutes the big chunk of the available resources for KVIC (50%). Khadi sector funds are about 23% and V.I. 14% and the rest plan funds are for REGP and other establishment charges. About 50% of its resources are from other sources mainly from banks funds, especially during the last two years of the 8th plan period. Refund of grants and loans constitutes only 4% of the available resources. Only during the last two years, institutional finance is forthcoming after the introduction of REGP.
Table 4.5
Availability of Finance from other sources (apart from plan allocation) – 8th Plan.
(Rs. In crore)
Year Items 1992-93 1993-94 1994-95 1995-96 1996-97 Total
Budgetary Sources (in crore) 226.49 (91.3)
231.01 (80.3)
237.57 (79.9)
372.12 (39.5)
335.77 (32.3)
1402.96 (49.8)
A. Khadi(%) 48 42 44 13 15 23 B. Village Industries (%) 30 26 25 9 8 14 C.Establishment, REGP & others (%) 14 12 11.3 17.8 9.8 13 II. Others (in Crore) 21.47
(8.7) 56.74 (19.7)
59.71 (20.1)
570.36 (60.5)
703.33 (67.7)
1411.61 (50.2)
A. With Banks (%) 2 7 6 31 61 34 B. With State Offices (%) 3 9.7 9.3 26 2 12 C. Refund of grants (%) 0.5 0.3 0.4 0.2 1.2 0.6 D. Repayment of Loans (%) 2.5 3 4 3 3 3.4 Total (in crore) 247.96 287.75 297.28 942.48 1039.1 2814.57
Figures in parenthesis indicate percentages. Source: Annul Reports, KVIC.
35
Repayment of loans is minimal and special efforts are needed to utilize the bank credit, bank loans and KVIC has to broaden the Interest Subsidy Eligibility Certificate (ISEC) scheme to enable the units to avail the bank finances for mobilizing resources.
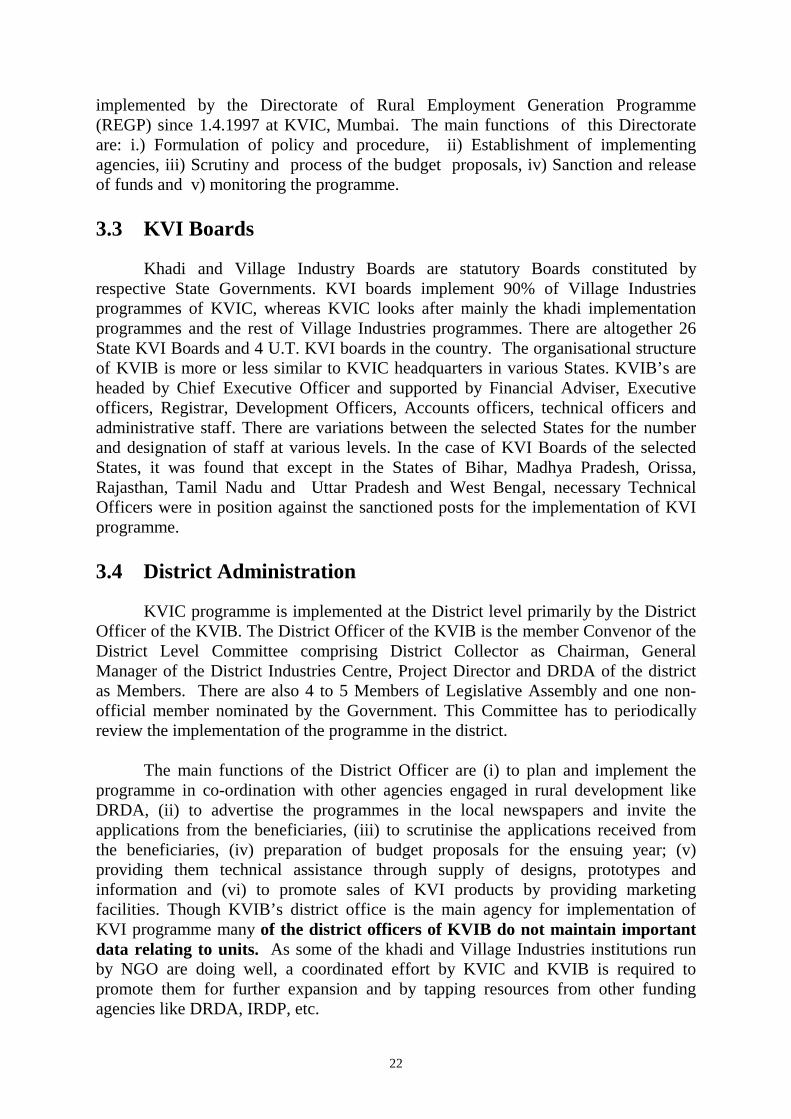
4.7 Utilisation of Grants by KVIC
KVIC plan proposals analysed previously has shown that Government releases
roughly 25% to 35% of its proposed plan budget. It will be interesting to note how the released budgetary resources are utilized. (Tables 4.6 and 4.7).
Table 4.6
Expenditure (Grant+Loan) for all States Year-wise – Eighth Plan (Rs. In Crore)
Year Expenditure Grant + Loan by State
Government Department Others Total
1992-93 178.5 7.3 8.9 194.7 1993-94 150.2 13.3 8.6 172.2 1994-95 192.6 15.5 9.8 217.9 1995-96 174.2 5.6 21.4 201.2 1996-97 243.2 38.5 48.7 330.8
Total 938.7 80.2 97.4 1116.8 Source: KVIC, Mumbai Schedule.
A glance over the tables 4.6/4.7 shows that, there is shortfall of Rs.76 crore in
1992-93, 113 crore in 1993-94, 75 crore in 1994-95 and 213 crore in 1995-96, and 46 crore during 1996-97. KVIC has utilised 7% of its resources for departmental establishment, 8.7% towards miscellaneous items like publicity, training, etc. and utilized the rest of the amount (84.3%) to disburse it to its State units. In sectoral expenditure, as in allocation, khadi sector accounts 50.24% and Village Industries 49.76% of the total plan releases. However, for the first four years of the plan period, khadi sector has always got higher allocation than Village Industries sector. As observed in the allocation and outlay, disbursement by KVIC also shows that loan proportion is only 27% for khadi, whereas it is 57% in the case of Village Industries sector indicating that Village Industries sector has to function utilizing mainly the loan facility either from KVIC or from the Consortium banks.

36
Table 4.7
Year-wise disbursement by KVIC to the Implementing Agencies- Eighth Plan
(Rs. In crore) Khadi Village Industries Year
Grant Loan Total Grant Loan Total 1992-93 76.05 25.25 101.3 21.17 72.23 93.4 1993-94 67.43 19.66 87.09 25.62 59.47 85.09 1994-95 82.98 50.85 133.83 32.23 51.82 84.05
1995-96 105.41 27.77 133.18 (CBC 232.98)
24.82 43.21 68.03 (CBC 62.57)
1996-97 76.63 29.04 105.67 (CBC 31.39)
212.24 12.83 225.07 (CBC 127.01)
Total 408.5 152.57 561.07 (CBC 264.37)
316.08 239.56 555.64 (CBC 189.58)
C.B.C. : Consortium Bank Credit. Source : Statistical Abstract, KVIC Mumbai.
4.8 Utilisation of Bank Finance
KVIC’s financial resources are mainly from the budgetary support, but it also acts as a facilitator for the implementing agencies by issuing them ISEC for drawing bank loans. Since 1995-96,the margin money scheme and CBC facility have also been approved by Government based on the recommendation of High Power Committee and 9th Plan Working Group to reduce the pressure on budgetary support. Table 4.8 shows that there is a steady growth in the utilisation of bank finance during 8th Plan, particularly during the last two years after the introduction of CBC facility. CBC funds for the year 1995-96 and 1996-97 were released by Govt. through banks to the tune of Rs. 244.57 crore (Rs. 167.57 crore for khadi) and Rs. 288.02 crore (Rs. 197.88 crore for khadi) respectively. For providing greater financial flexibility and for accommodating the regional variations, the project approach was being adopted by KVIC in place of earlier pattern of financial assistance as per the recommendations of the High Power Committee (HPC), and this need to be geared up for accountability by the implementing agencies. As on 31st March 1997, the loan balance outstanding against (State/UT) KVIBs and institutions was of the order of Rs. 1219.88 crore out of budgetary sources and Rs. 443.62 crore for CBC funds, adding up to Rs. 1663.5 crore (Annual Report,’96-97, page 30). Loans outstanding against the implementing agencies has increased by 25% from 1995-96 to 1996-97.

37
Table 4.8
Utilization of Bank Finance during – 8th Plan
(Rs. in crore)
Year Khadi Village Industries
Total
1992-93 112.25 51.49 163.74 1993-94 122.16 67.12 189.28 1994-95 118.19 80.60 198.79 1995-96 167.57 77.00 244.57 1996-97 197.88 90.14 288.02
Source : Ninth Plan Working Group Report
4.9 State Level Performance
KVIC implements their programmes through State KVIC units, State KVI
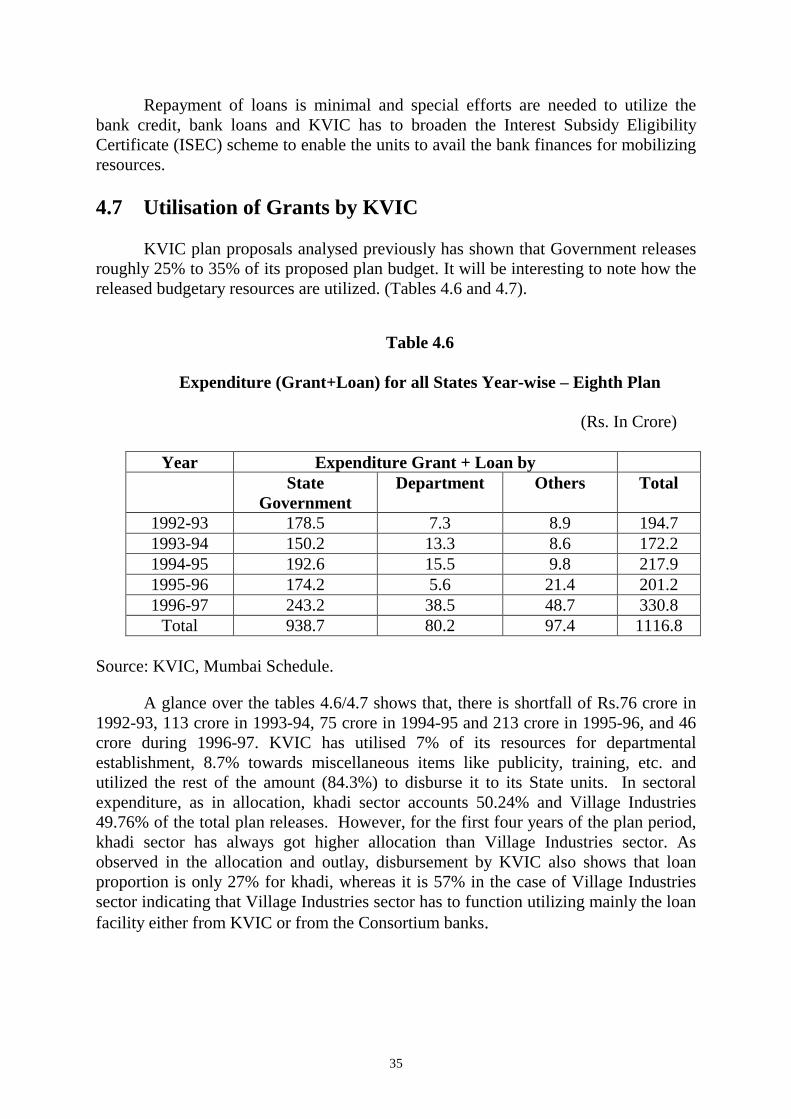
boards, directly aided institutions and entrepreneurs. Financial resources of KVIC State units are the disbursement of funds released by KVIC headquarters, which has been dealt with earlier. KVI boards are the statutory boards under State Government receiving funds both from KVIC and State Governments and the formal transactions are audited every year. About 78% of KVIC programmes are being implemented by KVIBs. In the present evaluation study 18 States were selected, but the data for all the 18 States were not supplied to PEO in the required format for meaningful analysis. The available data were analysed to show the financial performance of outlay, expenditure and generation of resources.
4.10 State KVIC Units Table 4.9 presents the aggregate allocation and expenditure pattern during 8th
Plan for 10 States. Except for Gujarat and Himachal Pradesh, all the other States did not spend the allocated amount for various reasons. All the States show shortfall in spending their allocated resources either in a particular year or for all the years in the case of both khadi and village industries. This was particularly evident for Andhra Pradesh in 1994-95, Assam for 1992-93 (Khadi), 95-96 (Khadi and Village Industries), Karnataka and Tamil Nadu for all years and Maharashtra for 96-97. In some cases, the gap between allocation and expenditure is abnormally large, as in the case of Tamil Nadu and Uttar Pradesh, whereas Gujarat has reported more expenditure than allocation for khadi sector.

38
Table 4.9
KVIC Allocation and Expenditure in selected States
(Rs. In lakhs)
States Sector Allocation Expenditure in % Khadi 290.11 44 Andhra Pradesh Village Industries 79.96 35 Khadi 132.02 69 Assam Village Industries 13.36 59 Khadi 955.57 100 Bihar Village Industries 82.84 100 Khadi 57.84 117 Gujarat Village Industries 29.56 65 Khadi 345.84 100 Himachal Pradesh Village Industries 36.28 78 Khadi 862.99 91 Karnataka Village Industries 652.77 84 Khadi 1467.23 92 Maharashtra Village Industries 1088.66 63 Khadi 8.35 72 Meghalaya Village Industries 2.00 69 Khadi 4660.54 14 Tamil Nadu Village Industries 445.17 49 Khadi 6371.62 19 Uttar Pradesh Village Industries 975.87 52
Source : PEO state level schedule.
Our sample data shows that Maharashtra, Uttar Pradesh, West Bengal and
Bihar are the highest beneficiary States from KVIC (Table 4.10). Employment generated in these States are also higher than other States. Another interesting point to be noted from the data is that assistance is mainly given in the form of loan component (which is always higher with few exceptions) than grant by 2 to 20 times in various States in a given year. This is a very contrasting feature when related to the Central Government release to the KVIC where grant component is always higher than loan during all the five years of 8th Plan as can be seen from Table 4.4.
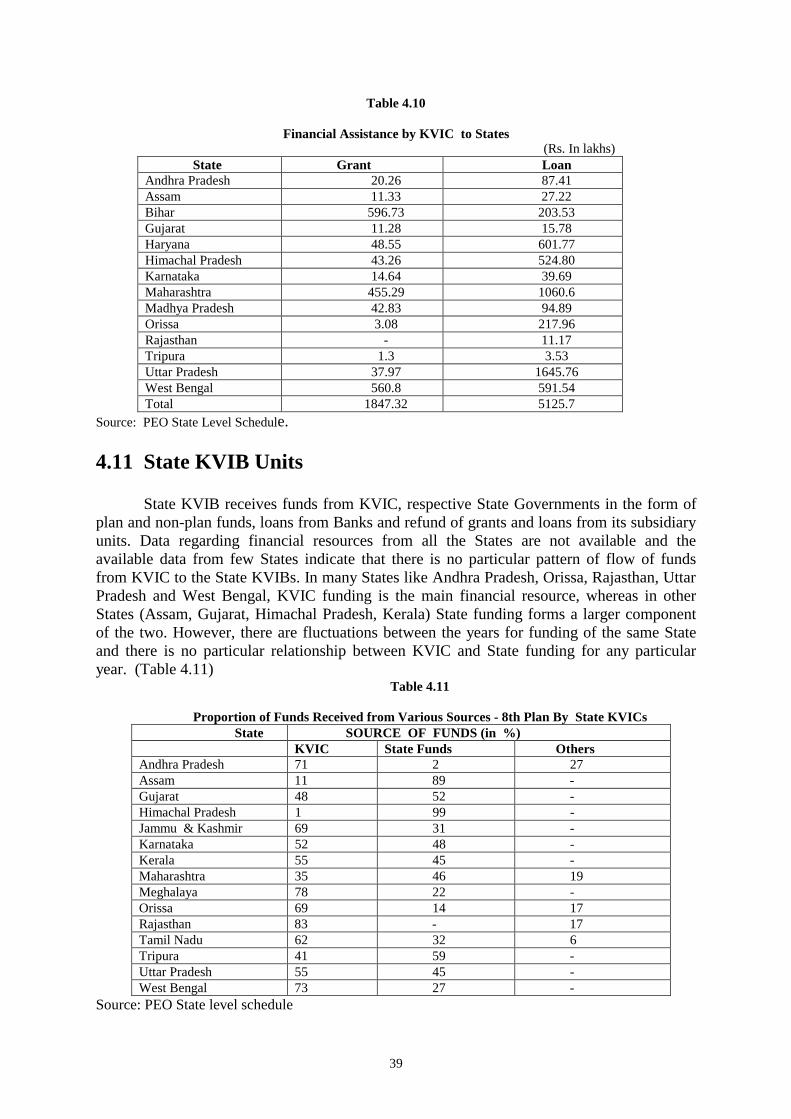
39
Table 4.10
Financial Assistance by KVIC to States (Rs. In lakhs)
State Grant Loan Andhra Pradesh 20.26 87.41 Assam 11.33 27.22 Bihar 596.73 203.53 Gujarat 11.28 15.78 Haryana 48.55 601.77 Himachal Pradesh 43.26 524.80 Karnataka 14.64 39.69 Maharashtra 455.29 1060.6 Madhya Pradesh 42.83 94.89 Orissa 3.08 217.96 Rajasthan - 11.17 Tripura 1.3 3.53 Uttar Pradesh 37.97 1645.76 West Bengal 560.8 591.54 Total 1847.32 5125.7
Source: PEO State Level Schedule.
4.11 State KVIB Units State KVIB receives funds from KVIC, respective State Governments in the form of
plan and non-plan funds, loans from Banks and refund of grants and loans from its subsidiary units. Data regarding financial resources from all the States are not available and the available data from few States indicate that there is no particular pattern of flow of funds from KVIC to the State KVIBs. In many States like Andhra Pradesh, Orissa, Rajasthan, Uttar Pradesh and West Bengal, KVIC funding is the main financial resource, whereas in other States (Assam, Gujarat, Himachal Pradesh, Kerala) State funding forms a larger component of the two. However, there are fluctuations between the years for funding of the same State and there is no particular relationship between KVIC and State funding for any particular year. (Table 4.11)
Table 4.11
Proportion of Funds Received from Various Sources - 8th Plan By State KVICs State SOURCE OF FUNDS (in %) KVIC State Funds Others
Andhra Pradesh 71 2 27 Assam 11 89 - Gujarat 48 52 - Himachal Pradesh 1 99 - Jammu & Kashmir 69 31 - Karnataka 52 48 - Kerala 55 45 - Maharashtra 35 46 19 Meghalaya 78 22 - Orissa 69 14 17 Rajasthan 83 - 17 Tamil Nadu 62 32 6 Tripura 41 59 - Uttar Pradesh 55 45 - West Bengal 73 27 -
Source: PEO State level schedule

40
Utilisation of finance by all the 30 KVIBs from KVIC budgetary sources and KVIC supported bank loans is shown in Table 4.12. Budgetary support is mainly towards the village industries and that too in the form of loan. Except for the year 1993-94 in all the other four years grant proportion is 1/5 th to 1/20th for khadi and 1/3rd to 1/20th for village industries during the 8th Plan. KVIC also supports State KVIBs by issuing ISE Certificates for availing bank loans. Khadi sector was given preference during 1992-93, 93-94, and 96-97 and in the other two years of 8th Plan village industries sector got the benefit. However, actual utilisation of only 35 to 77% of the bank fiancé was availed by KVIB units in the khadi and village industries sectors. Under the Consortium Bank loans for the Special Employment Programme and about 104 crore in 1995-96 and 118 crore in 1996-97 were utilized by the KVIBs under the programme mainly for village industries sector. The aggregate financial assistance by KVIC to State KVIBs during the year 1996-97 reached Rs. 370.03 crore recording a growth of 52% over the previous year. By the end of 8th Plan an amount of Rs. 1001crore was outstanding with State/UT KVIBs consisting of Rs. 221.34 crore for Khadi and Rs. 779.66 crores for Village Industries Sector which constitute about 22.3% of the CBC funds for the two sectors and the rest for budgetary sources. (Annual Report 1996-97, p. 55).
Table 4.12
Utilization of Finance by State KVIBs – 8th Plan
(Rs. In lakhs)
Bank Loans Budgetary Sources ISEC Certifcates
Issued Amount Availed
C.B.C. Loans Year
Khadi Village Industries
Khadi Village Industries
Khadi Village Industries
Khadi Village Industries
1992-93 13.06 (2.56grant)
69.03 (3.42 grant)
199.07 142.23 112.25 51.49 - -
1993-94 87.09 (67.43 grant)
85.08 (25.62 grant)
202.99 140.1 122.16 67.11 - -
1994-95 11.8 (2.17 grant)
40.84 (26.84 grant)
60.27 130.95 22.46 67.66 - -
1995-96 2.07 (0.08 grant)
31.04 (12.56 grant)
59.23 84.81 46.46 59.68 65.49 39.27
1996-97 2.52 (0.15 grant)
121.58 (118.57 grant)
114.18 97.13 51.98 75.3 0.35 118.28
CBC : Consortium Bank Credits. ISEC : Interest Subsidy Eligibility Certificate. Source : Annual Reports, KVIC
Aggregate KVIB outlay and expenditure of Eighth Plan for the seven selected
States (where data are available) are shown in Table 4.13. As in KVIC State units, KVIBs in the selected States have not utilized the allocated finances except in Himachal Pradesh. This is more glaring for khadi secstor in Karnataka (94-95 and 95-96 years), Anadhra Pradesh (93-94 and 94-95 years), Assam (93-94 years), Tamil Nadu (92-93, 94-95 and 95-96 years). Even for Village Industries sector in Uttar

41
Pradesh, Assam and Tamil Nadu States the allocated funds were not fully spent for all the years. State KVIBs have expressed that the allocated funds were not sufficient to implement the programmes/projects but our data shows that even the allocated funds were not utilized fully due to various reasons.
Table 4.13
KVIB Allocation and Expenditure in Selected States – 8th Plan (Rs. Lakhs)
State Sector Average Allocation
Average Expenditure
Khadi 684.55 41.98 Andhra Pradesh Village Industry 0 0 Khadi 110.4 18.06 Assam Village Industry 94.4 39.6 Khadi 0 0 Himachal Pradesh Village Industry 492.41 492.41 Khadi 166.83 152.32 Karnataka Village Industry 0 0 Khadi 0 0 Meghalaya Village Industry 167.32 148.31 Khadi 1459.4 235.89 Tamil Nadu Village Industry 1122.1 552.4 Khadi 742.86 241.79 Uttar Pradesh Village Industry 5916.3 1791.7
Source: PEO State Level Schedule.
Financial assistance by KVIBs in the 16 selected States is shown in Table 4.14. A total of 68353 units of which 4851 are khadi, are being supported in these 16 States and these units, as in KVIC, are being financed mainly through loans rather than grants even in Khadi sector. Funds received by KVIC, Mumbai from Central government is mainly under the “Grant Head” whereas the subsidiary units are being financed mainly through the loan component. Allocation and appropriation of the budget is at variance at the State and unit level when compared to the pattern of allocation of funds received by the Central Government. In relation to budgetary support and bank finance availed, khadi sector shows fluctuations in both allocation of funds and utilization of bank finance at State level.

42
Table 4.14
Financial Assistance by KVIB in Selected States
(Rs. In Lakhs) Average State Sector
Grant Loan Khadi 0 22.61 Andhra Pradesh Village Industries 11.24 690.9 Khadi 8.28 53.9 Assam Village Industries 0 0 Khadi 0 0 Bihar Village Industries 1.9 24 Khadi 0 0 Gujarat Village Industries 1379.2 45.60 Khadi 0 0 Himachal Pradesh Village Industries 13.55 172.8 Khadi - - Jammu & Kashmir Village Industries 11.60 106.17 Khadi - - Karnataka Village Industries 43.62 858.55 Khadi 0.68 143.1 Kerala Village Industries 13.27 288.6 Khadi - - Madhya Pradesh Village Industries 32.35 0 Khadi - - Meghalya Village Industries 12.9 140.4 Khadi 30.51 0 Orissa Village Industries - - Khadi 45.93 493.4 Rajasthan Village Industries 2053 0.00 Khadi 2.66 845.3 Tamil Nadu Village Industries 32.94 462.8 Khadi 10.41 10.41 Tripura Village Industries 4.5 36.87 Khadi 0 120.55 Uttar Pradesh Village Industries 38.07 1269.36 Khadi 16.9 488.4 West Bengal Village Industries - -
Source : PEO State Level Schedule.
From the preceding analysis, it is clear that the pattern of budgetary proposals by KVIC, allocation of funds by the Government is unrealistic and not based on any scientific criteria. The allotted funds were not utilised optimally and the loans outstanding are accumulating over the years. It is also pointed out that there is a positive bias towards khadi for grant purposes at the Centre level. Budgetary support continues to be the main source of funding in spite of HPC Committee’s recommendation in favour of two-third institutional finance.

43
Chapter 5
Physical Performance of Khadi and Village Industries KVIC since 1957 is entrusted with the planning, promotion, organization and
implementation of khadi and village industries programme. This Chapter analyses in details the performance during 8th Plan especially with regard to employment creation, production, earnings, sales, training and other indicators. As District Special Employment Programme, Block Development Programme and other special programmes were introduced during the middle of 8th Plan with REGP funds and institutional finance, the analysis will be focused on pre and post REGP performance. The nature and quality of employment and its relation to quality of production and sales in terms of aggregate and state-wise, coverage of districts and blocks will also be dealt here. An attempt is made to judge the physical performance in terms of suitable indicators that reflect achievement in the areas of employment generation, provision of marketing facilities, sanctioning of loans. Explanations for shortfall in performance have been provided in terms of inadequacies in infrastructure facilities, planning, and implementation.
5.1 Employment Performance
5.1.1 National Level An overview of employment scenario during 8th Plan indicates that (Table 5.1)
8.01 lakhs jobs were created for both khadi and village industries sectors. Out of this, village industries accounts for 7.42 lakhs and khadi 0.59 lakhs and these include both full-time and part-time jobs. Though village industries sector has shown steady increase during all the five years particularly during 1992-93 (2.09 lakhs) and 1995-96 (2.48 lakhs), but, the khadi sector has shown negative growth during 1993-96.
As these employment figures constitute both full-time and part-time employment, they do not reflect the real employment scenario, especially in khadi sector where the employment depends on seasonality, supply of raw material, infrastructure, etc. KVIC and Ministry of Small Scale Industries equate 30% of part-time employment as one full-time employment. However, this does not fully capture the earnings and duration of employment. To address this problem in a proper perspective, we have converted part-time employment to Full-Time Equivalent employment (FTE) based on earnings of part-time and full-time worker per year, using the statistics available in KVIC annual reports (Table 5.1). During the 8th Plan, one full-time worker’s annual earnings was equivalent 11.2 to 12.2 part-time workers for khadi sector and 2.33 to 2.48 part-time workers for Village Industries.

44
Table 5.1
Employment in KVIC- 8 th Plan
(In lakh)
Khadi Village Industries Year Full-time Part-time Total
Full-time Equivalent (FTE)
Full-time Part-time Total Full-time Equivalent (FTE)
Total Employment (K+VI)
1991-92 4.19 10.01 5.09 15.80 20.16 24.02 50.16 (29.11)@
1992-93 4.31 10.14 (0.91)*
5.22 17.22 20.83 (8.50)**
25.72 52.50 (30.94)@
1993-94 4.10 9.77 (0.80)*
4.90 18.76 20.65 (8.86)**
27.62
53.28 (32.52)@
1994-95 4.06 9.13 (0.75)*
4.81 18.80 21.47 (8.76)**
27.56 53.46 (32.37)@
1995-96 4.28 9.69 (0.82)*
5.10 19.46 23.29 (9.39)**
28.85 56.72 (33.95)@
1996-97 4.47 10.32 (0.92)*
5.39 19.73 23.65 (9.69)**
29.42 58.17 (34.81)@
* : Full time equivalent of part-time employment based on earnings per worker in khadi ** Full-time equivalent of part-time employment based on earnings per worker in village industries. @ : Full Time Equivalent (FTE) for both Khadi and V.I. Source: Annual Report, KVIC, Mumbai. Table 5.1 gives the details of part-time, full-time and Full-Time Equivalent employment figures during 8th Plan. Though the statistics reported by KVIC reveals, that 8.01 lakh jobs were added from 1991-92 to 1996-97, in terms of FTE the net addition to employment is 5.7 lakh persons only. During 1993-94 there was a substantial drop in employment in khadi sector and a marginal one in village industries sector during 1994-95. Village industries accounts for more than 80% of the FTE employment generated during 8th plan and khadi sector’s growth is marginal. What are the reasons for the shortfall in Khadi sector? The past performance record indicates that khadi sector historically had modest employment growth, and only during the 6th Plan period, khadi sector could achieve 1.85 lakh net additional employment (both part-time and full-time). Variety-wise, spinners account for 84% and weavers 9.5% in khadi sector. Cotton khadi’s share is more than 75% and woolen sector’s share is about 17%, with Silk and Muslin making up the rest of khadi sector. During the 8th Plan, employment in khadi sector remained stagnant and the 8th Plan Working Group and High Power Committee analysed the problem and felt that, there is scope for employment generation by way of increase in production and financial support. Accordingly, financial support for the programme was raised in the Eighth Plan through special allocation for REGP. But, have employment, production and sales increased in keeping with the rise in financial resources for the programme?

45
Table 5.2
Production, Sales And Expenditure During 8th Plan Year FTE Employment
( in lakhs) Per Employee Exp.
( In Rupees)
Production/FTE (In Rupees)
Sales per unit of FTE (in Rupees)
Khadi Village Industries
Khadi Village Industries
Cloth (Sq. m)
Khadi Village Industries
Khadi Village Industries
1992-93 5.22 25.72 2975 372 202 6772 9811 7416 10926 1993-94 4.90 27.62 3373 365 201 7291 10415 8352 11702 1994-95 4.81 27.56 3602 435 189 8102 11736 10205 12984 1995-96 5.10 28.85 4171 652 206 10240 12146 11125 13386 1996-97 5.39 29.42 3737 355 207 11621 13222 10781 14388 Source : Annual Reports, KVIC.
This aspect has been probed further here to see if there is any relationship
between employment generated, financial resources availed, production and sales. Table 5.2 reveals that per employee expenditure has increased from Rs. 2975 to Rs. 3737 in Khadi, but it remained around Rs. 435 for village industries during 8th Plan. As REGP funds are not allocated sectorally, the funds have been divided 37% between khadi and 63% for village industries for calculating this expenditure based on expenditure incurred in the sample States (Table 5.4). For both Khadi and Village Industries 1995-96 year shows high fluctuations due to quantum release of REGP and institutional funds. Khadi production in terms of cloth per FTE employee remained stagnant, though the value of production shows an increase of 1.7 times and sales per FTE increased to 1.5 times at the end of 1996-97.
Compared to Khadi sector, Village Industries sector had a steady growth in
production and sales per FTE, though the expenditure per employee has remained static and in fact decreased except for the two years 1994-96. This table clearly brings out that there is no significant relationship between resources being spent and the employment generated either in Khadi (r =0.04)�� or in Village Industries (r = 0.29)*. FTE also do not show significant relationship with production and sales for Khadi, though it is high for Village Industries sector. All this points out that resources are not the main binding constraint to employment generation, especially in the Khadi sector.
Table 5.3
Earnings per Worker in Khadi and Village Industries - 8th Plan
Year Khadi (Rs. per annum) Village Industries (Rs. per annum) Part-time Full-time Part-time Full-time 1992-93 287 3223 1340 3289 1993-94 299 3662 1495 3478 1994-95 323 3954 1598 3916 1995-96 380 4468 1588 3935 1996-97 433 4835 1770 4323
Source : Annual Reports, KVIC.
� The Figures in parentheses are ordinary correlation co-efficient between resources and employment.
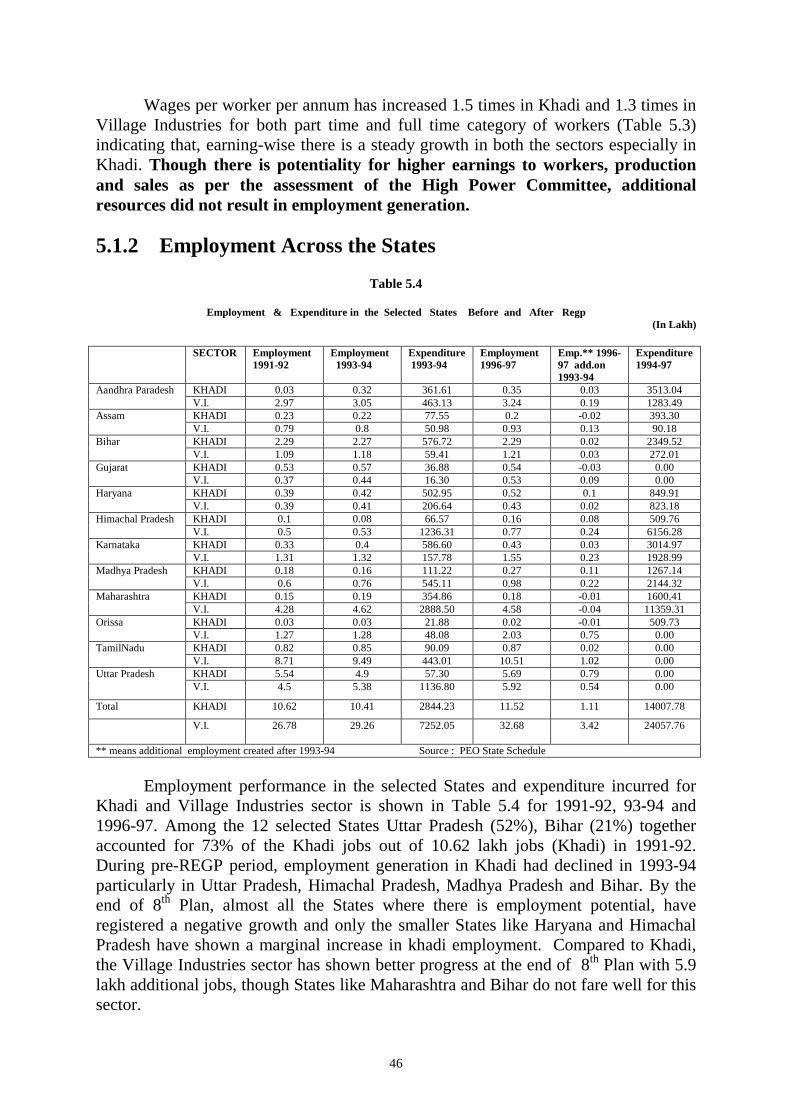
46
Wages per worker per annum has increased 1.5 times in Khadi and 1.3 times in Village Industries for both part time and full time category of workers (Table 5.3) indicating that, earning-wise there is a steady growth in both the sectors especially in Khadi. Though there is potentiality for higher earnings to workers, production and sales as per the assessment of the High Power Committee, additional resources did not result in employment generation.
5.1.2 Employment Across the States
Table 5.4
Employment & Expenditure in the Selected States Before and After Regp (In Lakh)
SECTOR Employment
1991-92 Employment 1993-94
Expenditure 1993-94
Employment 1996-97
Emp.** 1996-97 add.on 1993-94
Expenditure 1994-97
KHADI 0.03 0.32 361.61 0.35 0.03 3513.04 Aandhra Paradesh V.I. 2.97 3.05 463.13 3.24 0.19 1283.49 KHADI 0.23 0.22 77.55 0.2 -0.02 393.30 Assam V.I. 0.79 0.8 50.98 0.93 0.13 90.18 KHADI 2.29 2.27 576.72 2.29 0.02 2349.52 Bihar V.I. 1.09 1.18 59.41 1.21 0.03 272.01 KHADI 0.53 0.57 36.88 0.54 -0.03 0.00 Gujarat V.I. 0.37 0.44 16.30 0.53 0.09 0.00 KHADI 0.39 0.42 502.95 0.52 0.1 849.91 Haryana V.I. 0.39 0.41 206.64 0.43 0.02 823.18 KHADI 0.1 0.08 66.57 0.16 0.08 509.76 Himachal Pradesh V.I. 0.5 0.53 1236.31 0.77 0.24 6156.28 KHADI 0.33 0.4 586.60 0.43 0.03 3014.97 Karnataka V.I. 1.31 1.32 157.78 1.55 0.23 1928.99 KHADI 0.18 0.16 111.22 0.27 0.11 1267.14 Madhya Pradesh V.I. 0.6 0.76 545.11 0.98 0.22 2144.32 KHADI 0.15 0.19 354.86 0.18 -0.01 1600.41 Maharashtra V.I. 4.28 4.62 2888.50 4.58 -0.04 11359.31 KHADI 0.03 0.03 21.88 0.02 -0.01 509.73 Orissa V.I. 1.27 1.28 48.08 2.03 0.75 0.00 KHADI 0.82 0.85 90.09 0.87 0.02 0.00 TamilNadu V.I. 8.71 9.49 443.01 10.51 1.02 0.00 KHADI 5.54 4.9 57.30 5.69 0.79 0.00 Uttar Pradesh V.I. 4.5 5.38 1136.80 5.92 0.54 0.00
Total KHADI 10.62 10.41 2844.23 11.52 1.11 14007.78
V.I. 26.78 29.26 7252.05 32.68
3.42 24057.76
** means additional employment created after 1993-94 Source : PEO State Schedule
Employment performance in the selected States and expenditure incurred for
Khadi and Village Industries sector is shown in Table 5.4 for 1991-92, 93-94 and 1996-97. Among the 12 selected States Uttar Pradesh (52%), Bihar (21%) together accounted for 73% of the Khadi jobs out of 10.62 lakh jobs (Khadi) in 1991-92. During pre-REGP period, employment generation in Khadi had declined in 1993-94 particularly in Uttar Pradesh, Himachal Pradesh, Madhya Pradesh and Bihar. By the end of 8th Plan, almost all the States where there is employment potential, have registered a negative growth and only the smaller States like Haryana and Himachal Pradesh have shown a marginal increase in khadi employment. Compared to Khadi, the Village Industries sector has shown better progress at the end of 8th Plan with 5.9 lakh additional jobs, though States like Maharashtra and Bihar do not fare well for this sector.

47
Is there any linkage between the employment generated and financial resources made available to these States? This aspect has been analysed taking REGP as a cut-off mark during 8th Plan. As more and special funds were made available after the introduction of REGP in 1993-94, it will be interesting to know if availability of more finance had any impact on creation of jobs in the States. A total of 3.42 lakh jobs in Village Industries and 1.11 lakh in khadi sector were created after the introduction of REGP. The expenditure seems to be disproportionate in terms of allocation to Khadi (37%) and Village Industries (63%) if seen in relation to jobs potentiality and actual jobs created in these two sectors. Though this prioritisation seems to have been corrected by the end of 1996-97, the thrust given towards khadi before REGP in terms of funds allocation has not resulted in employment generation.
5.1.3 Achievement of Employment in the Districts
Table 5.5
Achievement of Employment and Expenditure in the Selected Districts State Name of the
District Employment 1993-94 K+VI (A)
Expenditure 1993-94 K + VI (A)
Employment 1994-97 K + VI (A)
Expenditure Total 1994-97
Per Job Expenditure (in thousand)
Andhra Pradesh Anantapur 2532 1051 503 1055 2.1 Rangareddy 1393 1964 1055 21322 20.2 Assam Lakhimpur 48 47 -2 471 -235.5 Haryana Ambala 1743 5353 639 3025 4.7 Himachal Pradesh Chamba 301 1386 34 4049 119.1 Shimla 753 3181 727 4813 6.6 Jammu & Kashmir Udhampur 3290 760 340 3070 9.0 Karantaka Chitradurga 4985 626 1667 11808 7.1 Raichur 1232 598 129 8894 69.0 Maharashtra Beed 480 1016 298 3828 12.8 Meghalaya West Garo Hill 141 452 188 7786 41.4 Orissa Keonjhar 1421 820 930 1186 1.3 Rajasthan Bikaner 17416 4902 2204 461 0.2 Uttar Pradesh Jhansi 171 627 278 14927 53.7 Lakhimpur
Kheri 196 591 166 4686 28.2
Mau 394 430 598 5411 9.0 West Bengal Purulia 459 827 299 1465 4.9 Total 17 36955 24631 10053 98257 9.7 Source : PEO District Schedule.
The survey data from 17 districts of 12 States were analysed for achievement
performance. In the selected districts a total of 36,955 jobs were existing before the introduction of REG Programme (Table 5.5). It was also assumed that atleast 10,000 jobs will be created in each selected district by the end of 8th Plan. However, only 10,053 additional jobs were created which comes to about 5.9% achievement in aggregate. Only three districts viz. Bikaner in Rajasthan (22%), Chitradurga in Karnataka (17%) and Rangareddy district in Andhra Pradesh (10%) could achieve atleast 10 to 22% of the employment target. Lakhimpur district in Assam shows a decline in employment during this period. As targets are for both khadi and village industries sectors, we can not see the trend separately for each sector.

48
The analysis between expenditure and employment generated during 1994-97 indicate that on an average about Rupees 9.7 thousand was spent for creation of one job. However, there is enormous variation between the districts for this. It is as high as Rs. 119 thousand per job in Chamba district of Himachal Pradesh and a low of 0.2 thousand in Bikaner of Rajasthan State. As seen from the Table 5.5, the better performing districts (Chitradurga, Bikaner and Rangareddy) could achieve targets with modest financial resources under REGP indicating that there is no particular relationship between financial resources and employment generation in the districts.
5.2 Production Performance 5.2.1 National Level
Table 5.6
Production Performance in Khadi – 8th Plan
COTTON WOOLEN SILK MUSLIN TOTAL KHADI YEAR Quantity
(lakh Sq.mts)
Actual Value (Rs. Crore)
Quantity (lakh Sq.mts)
Actual Value (Rs. Crore)
Quantity (lakh Sq.mts)
Actual Value (Rs. Crore)
Quantity (lakh Sq.mts)
Actual Value (Rs. Crore)
Quantity (lakh Sq.mts)
Deflated Value* (Rs. Crore)
1992-93 854 204 106 66 54 68 39 15 1053 335 1993-94 808 209 92 66 53 69 30 14 984 290 1994-95 738 227 83 65 58 83 30 15 908 293 1995-96 850 299 96 87 70 116 35 20 1051 424 1996-97 891 348 110 111 79 145 35 22 1115 567 � Values were deflated based on1991-92 Textiles values Source: Statistical Abstracts, KVIC, Mumbai
Production performance is also analysed at national and State level for Khadi and Village Industries sectors. Table 5.6 shows the production performance of Khadi products during 8th Plan period. It is apparent from Table 5.6 that except khadi silk, cotton, woolen and muslin khadi products production (quantity-wise) has declined during 1993 to 1996. It is only during the last year of 1996-97, it started increasing. KVIC has stated that inflation, escalation in raw materials value and shortage of working capital as the reasons for this. However, it was shown earlier that there is no relationship between financial resources and employment or with production. Though in physical quantity, cotton khadi and other products show decrease and shortage of achievement, there is an increase in their values, and about Rs. 626 crore (without deflation) value of production was shown for 1115 lakh square metres of khadi goods by the end of 1996-97.

49
Table 5.7
Production Performance in Village Industries - 8th Plan (at 1991-92 Prices)
(Rs. In Crore)
Sl.No. Village Industries 1992-93 1993-94 1994-95 1995-96 1996-97 1. Mineral based 286 326 352 393 455 2. Forest based 132 173 196 208 258 3. Agro based 895 1000 1106 1211 1345 4. Polymer and Chemical based 445 543 581 638 772 5. ENCE industry 445 539 584 638 742 6. Textile Industry 47 58 69 79 108 7. Service Industry 25 31 39 48 60 TOTAL 2275 2670 2927 3215 3740
* Values were deflated based on 1991-92 manufactured goods prices. Source : Statistical Abstracts, KVIC, Mumbai
The interesting point is that there is a quantum jump of production values of
93% after the introduction of REGP Programme from 1994 to1997. In the case of Village Industries, agro-based (36%), polymer and chemicals (21%), E.N.C.E. industry (20%) and Mineral based industry (12%) together constitute about 90% of production. Service, Textile and Forest based industries accounts for rest of the 10% share. As village industries production figures are available only as value and not in quantity terms, we have deflated these values based on 1991-92 manufactured goods prices for comparison over time. These figures are shown in Table 5.7. The deflated values show steady growth over the years during 8th Plan. Unlike in Khadi, Village Industries industry shows equal growth (28%) during pre and post-REGP programme. Another interesting point that emerges from this Table is that 1996-97 year has a marked growth compared to other years indicating that after the introduction of REGP Programme, it had its effect after two years.
5.2.2 State Level
Production of Khadi has declined during 1993-94 (-11.8%) if the production values are adjusted by deflating with a constant price of 1991-92 (Table 5.8). During the end of the 8th Plan about 39.3% increase in production was achieved after the introduction of REGP programme. Compared to khadi sector, the village industries sector recorded 6.8% increase in growth rate during 1993-94 and 1996-97. Deflated values show that except Maharashtra, J&K, Assam and Orissa, all the other States had lower production during 1993-94 for khadi, but by the end of 1996-97, 9 States (Bihar, Haryana, Karnataka, Maharashtra, Madhya Pradesh, Orissa, Tamil Nadu, Uttar Pradesh and West Bengal) have achieved higher production after the itnroduction of REGP.

50
Table 5.8
Value of Production in the Selected States
(Rs. In Lakh) STATE SECTOR 1991-92
1993-94*
def (khadi) 1993-94* def ( V.I.)
1996-97* def (khadi)
1996-97* def ( V.I.)
Khadi Village Industries
Andhra Pradesh Khadi 1729.09 1612.51 2026.12 Village Industries 12812.11 11759.07 13588.22 Assam Khadi 197.66 219.57 228.67 Village Industries 1978.74 1801.54 2135.87 Bihar Khadi 2078.63 1345.28 1661.63 Village Industries 10805.41 10196.05 10000.43 Gujarat Khadi 2726.17 2611.96 3612.33 Village Industries 7306.75 7475.03 8707.95 Haryana Khadi 1156.98 1074.23 1684.58 Village Industries 4461.82 5076.52 4833.26 Himachal Khadi 199.81 153.95 220.34 Pradesh Village Industries 3871.03 4053.86 3877.13 Jammu & Kashmir Khadi 389.39 457.06 410.93 Village Industries 5285.75 4787.41 4352.43 Karnataka Khadi 1401.28 1393.82 2131.00 Village Industries 12198.2 11994.14 13567.08 Kerala Khadi 922.45 600.32 557.04 Village Industries 8242.58 8635.15 9439.20 Maharashtra Khadi 989.41 1219.55 1457.87 Village Industries 40139.11 43672.82 48940.75 Madhya Khadi 632.47 499.72 1192.94 Pradesh Village Industries 5142.56 6806.75 8277.47 Meghalaya Khadi 0.12 0.14 0.81 Village Industries 636.12 732.89 927.96 Orissa Khadi 116.07 120.68 370.61 Village Industries 2500.65 3410.65 4422.51 Rajasthan Khadi 2993.81 2572.97 2727.82 Village Industries 16530.7 22206.31 22645.78 Tamil Nadu Khadi 5653.28 5516.13 6752.93 Village Industries 32944.1 32337.85 31340.43 Tripura Khadi 18.67 7.48 11.26 Village Industries 1565.89 1723.49 578.57
U.Pradesh Khadi 7413.98 5841.82 9543.08 Village Industries 37392.81 40458.58 43976.10 W.Bengal Khadi 2825.42 2392.27 3832.15 Village Industries 7397 8529.86 9430.64 TOTAL Khadi 31344.69 27639.45 38422.10
Village Industries 211211.33 225657.97 241041.78 *Deflated values with constant price of 1991-92. Source : AnnualReports, KVIC, Mumbai.
In case of Village Industries sector, pre and post REGP period shows similar rates (6.8%) of growth in production values. 5 States (Bihar, J&K, Karnataka, Tamil Nadu and Tripura ) have lower production values in 1993-94. Even after the introduction of REGP Programme, States like Bihar, Haryana, Himachal Pradesh, Jammu & Kashmir , Tamil Nadu and Tripura have shown a decline in production in terms of deflated values. States like Aandhra Pradesh, Gujarat, Karanataka, Maharashtra, Orissa, Uttar Pradesh and West Bengal have achieved higher production values for both khadi and village industries sector after the introduction of REGP Programme indicating equal emphasis being given for both the sectors. Some States like Kerala and Rajasthan have started giving priority to Village industries in place of khadi after the REGP Programme and Bihar shows alarming decrease

51
in production for both Khadi and Village Industries sectors during 8th Plan period. 5.2.3 Performance at the District Level
Table 5.9
Number of Units Started and Proposals Cleared in the Selected Districts
NO. OF UNITS OPENED NUMBER OF PROPOSALS Sector 1993-94 1996-97 Received Approved at Distt.
Level Recommended to
State Office Khadi 178 164 Village Industries 7973 8294 Total 8151 8458 5329 1993
(37.4%) 1029
(19.3%)
Source : PEO District Schedule. It is worth mentioning that, while the number of Khadi units decreased from 178 in 1993-94 to 164 in 1996-97, the number of Village Industries units increased from 7973 to 8294 during the same period in the selected districts. This indirectly explains the employment and production performance of the Khadi and Village Industries sectors in these districts (Table 5.9). It is also observed that in some of the selected districts, the number of units did not show significant increase due to the huge gap between the actual number of proposals received from potential entrepreneurs and the number actually sanctioned (Table 5.9). About 37.4% of the proposals were cleared at the District level, but only 19% were recommended to the State office. We have also noticed that, there is no relationship between additional employment and additional KVIC units or proposals as in some of the selected districts of Andhra Pradesh, Assam, Bihar, Gujarat, Madhya Pradesh, Orissa and Tamil Nadu, additional employment was generated in the existing units only. It was found that in the districts of Rohtas in Bihar only 0.57% of the target was achieved during 1994-97, but no fresh proposals were made to achieve the target. In some districts like Lakhimpur of Assam none of the proposals was approved, though employment was declining in the district. 5.3 Marketing and Sales Table 5.10
Performance of Sales and Earnings - 8th Plan in KVIC
(Rs. crore) YEAR KHADI VILLAGE INDUSTRIES
Production Sales Earnings Production Sales Earnings 1992-93 353 387 168 2523 2810 846 1993-94 357 409 179 2877 3232 961 1994-95 390 491 190 3234 3578 1079 1995-96 522 567 228 3504 3861 1135 1996-97 626 581 261 3890 4232 1271
Source : Annual Reports, KVIC, Mumbai.

52
Besides production shortfalls, the major problem encountered with KVIC products is regarding marketing and sales. The HPC has recommended to replace rebate with Market Development Assistance to streamline marketing. The Commission itself has a Directorate of Marketing and it is running a number of Bhavans and some of these are making profits and others are running in loss. To get an overview of the situation, we have presented the production, sales and earnings figures for the 8th Plan period in Table 5.10. It is apparent from the Table that there is no relationship between production, sales and earnings, as sales of a given year is for the accumulated production stocks over the years. From the Table it is also clear that sales have increased from Rs. 387 to Rs. 581 crore for khadi and from Rs. 2810 to Rs. 4232 crore for Village Industries products. Correspondingly, earnings have also grown by 55% for khadi and 50% for Village Industries Sector during 8th Plan. Khadi and Village Industries products are being sold through the network of 5441 sales outlets of directly aided institutions of KVIC and KVIBs including 27 departmental sales outlets located in different parts of the country. During 8th Plan in many of the States, sales outlets remained static or increased only marginally except in Tamil Nadu and Madhya Pradesh where there is an increase of 12 sales outlets. The above networking is internal for KVIC products and they do not offer 100% sale assurance. KVIC has no direct agreement with other agencies for the sale of Khadi and Village Industries products. Recently, the Directorate of Marketing has taken initiative for inclusion of Khadi and Village Industries products in public Distribution System as suggested by HPC. Some institutions are having their own arrangement and products like papad, masalas are being sold through wholesalers, retailers, etc. Our survey results from the 32 units of 18 sample States shows that in most cases entrepreneurs themselves (52%) market their products. Sales through KVIC/KVIB arranged markets (27%) through government departments (6%), through government retail shops (15%) are only secondary facilities available to them to market their products.
As market facilities for Khadi and Village Industries products in rural areas are
meager, the Expert Committee constituted during 1996-97 suggested net-working with other agencies like Governmental institutions, PDS, Khadi sales Centres, Handloom Sector and export promotion centres. Recently KVIC has set-up a Directorate for export. KVIC should coordinate these activities and identify the products of export potential with quality control for better marketing facilities of KVIC products. A suggestion that has been often -repeated during discussions with the village industries units’ functionaries relates to inadequate opportunities for direct contact between the village industries units and the overseas buyers. The village industries units feel that a large number of goods produced by them have a very high overseas demand and the KVIC should organise special fairs for khadi and village industries goods both in India and abroad to exhibit the wide range of goods being produced by them and attract foreign buyers.
5.4 Training Programme KVIC is vested with the responsibility of planning and organising the training
of working persons, potential entrepreneurs, and for this Directorate of Human Resource Development is functioning in the Central Office of KVIC. At present about 611 departmental and non-departmental training centres are functioning under the Commission. In order to improve the quality of Village Industries programme, the

53
Commission in pursuance of the recommendations of Kapur Committee report has decided to make training a mandatory pre-requisite for entrepreneur/ institution. KVIC organises a four tier training programme covering artisans, unit level workers, supervisory technical staff and managerial staff of KVIC /KVIBs and other implementing agencies.
Table 5.11
Persons trained during 8th Plan
TRAINED IN MAJOR TRAINING
CENTRES Sector Persons Trained
(%)
Employment in Position (in lakh) Selected States Persons
Trained % of persons
trained to employed persons
I. KHADI 23144 37.8 14.79 Assam 527 0.47 II. VILLAGE INDUSTRIES 38055 62.2 43.38 Bihar 523 0.15 1. Mineral based 1044 1.7 6.78 Haryana 166 0.17 2. Forest Based 5575 9.1 2.99 Karnataka 1036 0.66 3. Agro Based 6553 10.7 20.52 Kerala 1953 0.92 4. Polymer & Chemical 2080 3.4 6.8 Maharashtra 5073 1.06 5. E.N.C.E. Industry 14983 24.5 4.9 M.P. 1033 0.83 6. Textile Industry 1707 2.8 0.91 Orissa 461 0.22 7. Other Source 6113 10.0 0.42 Rajasthan 560 0.14 TOTAL KPHADI + V.I. 61199 100.0 58.17 TamilNadu 1567 0.14 Uttar Pradesh 1467 0.13 West Bengal 1196 0.33 Source : PEO State Schedule, and Statistical Abstracts, Mumbai
Table 5.11 shows the number of persons trained in Khadi and different Village Industries during 8th Plan. About 38% of khadi and 62% of village industries workers were trained whereas their respective shares in employment creation were 25.4% and 74.6%. Engineering and Non-Conventional Energy comprising Bio-gas and rural engineering sector account for nearly 25% of the trained persons. We have also presented the employment in the particular industry along with trained persons and it is explicit that persons employed in a particular category do not get proportionately the requisite proportion of trained persons. It is noticed that employment in palm gur industry (8.52 lakh) and cottage industry (5.36 lakh) is higher but only 1037 and 932 persons respectively were trained in these industries. Maximum number of persons (14720) were trained for bio-gas of E.N.C.E. industry which could provide only 0.49 lakh jobs during 8th Plan We have also presented the number of persons trained in major training centres in the selected States. Maximum number of persons (5073) were trained in Maharashtra, followed by Kerala (1953), Tamil Nadu (1567) and Uttar PRadesh (1467). From the data made available by the KVIC, it is observed that more attention has been given to khadi sector though employment generation capacity is less in this sector. It is noticed that, employed persons to the number of persons trained is high in the States of Maharashtra, Madhya Pradesh, Kerala and Karnataka States indicating better training facilities and performance.
54
High Power Committee, and 8th Plan and 9th Plan Working Groups have evaluated the existing infrastructure and facilities in view of the efforts that may be required for additional employment generation in khadi and village industries sectors. These reports suggested the need for setting-up of a National Institute at Nasik with supporting Training Centres at other States in collaboration with NABARD, SIDI, and Ministry of Rural Development and Ministry of Industry. Strengthening of Multi Disciplinary Training Centres, re-organisation of Non-departmental Training Centres with Enterpreneur Development Package, for imparting training at Ahmedabad and New Delhi. High Power Committee has also given detailed suggestions and guidelines for imparting training to artisans, entrepreneurs, workers and staff members of KVIC. The data obtained from KVIC headquarters, Mumbai indicates that many of these are still in the execution stage.
5.5 Infrastructure Facilities
The development of Khadi and Village Industries depends to a great extent on the availability of infrastructure facilities. To analyse this problem, PEO made a sample study from 86 Khadi and 88 Village Industries units in various States regarding the availability of facilities like transport, communication, banks and essential health services. Our data from both the units show that (Table 5.12) more than 80% of the units are served by pucca roads, village telephone, electricity, post office, schools, banks, water supply and dispensary within a reasonable distance. Telephone facility for the units is available only to about 40% of the units. It is also found that, better facilities are available to village industries sector than to khadi.
Facilities for Khadi sector units like pucca roads, electricity and dispensary
facilities are available to 85% of the units, but 12 to 15% of the units still do not have this basic facility. Better performing States like Gujarat, Tamil Nadu, West Bengal and Karnataka have reported 100% of these facilities. Water supply, bank, post office and rail transport is not available to more than 70% of the khadi units. In Orissa, Assam and Bihar States these facilities are very poor and it is reflected in lower production (before REGP) and less expansion of KVI units in these States. Village Industries sector units are comparatively better served and most of them are at the vicinity of the towns. Many of the facilities like pucca roads, dispensaries, post office, bank, school and telephone facilities are available to more than 85% of the Village Industries units. Only rail transport, telephone facility to the units are not fully accessible to them. As most of these units are single owner or small type, they are availing these facilities through other means. Like for khadi units, better performing states like Tamil Nadu, Kerala and Himachal Pradesh have 100% transport and communication facilities available to Village Industries Units. However, facilities like post office, bank and electricity, which are essential to the village Industries units, are not available to 4 to 12% of units in many states like Jammu & Kashmir, Meghalaya and Andhra Pradesh.
We have also obtained the perceptions of the entrepreneurs/units about the
essentiality and usage of these facilities and these are also presented in Table 5.12.

55
Both Khadi and Village Industries units have expressed availability of pucca roads, electricity, water supply and post office (to the tune of 90%) as the most essential facilities required for them. In terms of utilisation also, these facilities are being used by more than 85 to 90% of the units. The felt need for these facilities and actual usage is more for village industries units compared to khadi units. Though other facilities like Telephone in the Village, Bank, School and Dispensary are also the needs but are prioritised to a lesser degree which can be categorised as secondary priorities. About 40 to 45% of the khadi and village industries units are using railways and office telephone facility and feel it as tertiary necessity for them. It is imperative that, provision of primary and secondary infrastructure facilities will boost KVI as is reflected in better performing States like Tamil Nadu, Gujarat and Maharashtra.
Table 5.12
Infrastructure Facilities Available to KVIC Units
(in percentage)
Sector Pucca
Road Tel. Phone in the village
Tele. Phone in the units
Water Supply
Electricity Post Office
Bank Railway Station
School Dispensary
Beneficiaries Reporting Availability Total Units 174
91 84 41 79 93 92 82 37 98 87
Facilities Essential to the Units Khadi 86 Units
94 90 72 86 94 92 85 45 84 85
Village Industries 88
99 82 60 90 96 89 88 39 77 83
Usage of facility Khadi 86 Units
87 77 48 77 86 93 78 40 79 80
Village Industries 88 units
94 75 36 78 85 85 82 26 78 82

56
Chapter 6
Cost of Employment Generation through KVIC Programme The preceding two chapters were concerned with analysing the physical and financial performance of the programmes in the khadi and village industries sectors. While the performance was assessed in terms of a number of relevant indicators, the analysis was based primarily on secondary statistics available with the different offices of KVIC, KVIB and other government agencies. It was noted that the employment figures available in the secondary statistics are maintained in terms of the “number of persons” worked in the Khadi and Village Industries units without adequately reflecting on the type (part-time/full-time) of employment provided under the schemes. It is, however, common knowledge that employment in the khadi units in particular, can not always be full-time employment because of the constraints relating to availability of inputs to artisans/workers, availability of adequate time (of the artisans/workers) for such employment, stoppage of production by the units and seasonality. Of late, the KVIC, too, in their Annual Reports have started reporting part- time and full- time employment generation separately, for both the Khadi and Village Industries sectors. The Annual Reports also give the annual earning figures for both types of employment. A rudimentary analysis of this basic information on employment and earning tends to suggest that in the khadi sector, the annual earning of a full time worker is, on an average, eleven (11) to twelve (12) times that of a part time worker. In the village industries sector, however, the difference in earnings of full time and part time workers is not as high (2 to 2.5 times). The statistics on employment reported by KVIC therefore, need to be interpreted and used, giving due weightage to the nature of part time employment being generated in the Khadi and village industries sectors. This is particularly so, because about 60 per cent of the employment in Khadi and 54 per cent in village industries sector constitute part time employment. An attempt is made in the study to derive Full Time Equivalent (FTE) employment by accounting for the earning differential between the two types of employment. It must be borne in mind that full-time employment as defined here, does not imply that a person gets adequate number of days of employment and wages. Full-Time employment is defined here with reference to an annual earning of Rs. 4835 for Khadi and Rs. 4323 for the village industries sector. These average annual earning figures have been derived from the earnings of the reportedly “fully employed persons” (see Annual Reports, KVIC) for the year 1996-97.

57
6.1 Employment During Eighth Plan Table 6.1 gives the part-time, full-time and FTE annual employment figures for the two sectors for the period 1992-93 to 1996-97.
Table 6.1
Aggregate Employment Generated under KVIC Programme
(Figures in lakh persons)
Year Khadi Sector Village Industries Total FT PT FTE FT PT FTE FTE 1992-93 4.31 10.14 5.22 17.22 20.83 25.72 30.94 1993-94 4.10 9.77 4.90 18.76 20.65 27.62 32.52 1994-95 4.06 9.13 4.81 18.80 21.47 27.56 32.37 1995-96 4.28 9.69 5.10 19.46 23.29 28.85 33.95 1996-97 4.47 10.32 5.39 19.73 23.65 29.42 34.81 Annual Average 5.08 27.83 32.92
FT : Full -Time Employment PT : Part -Time Employment FTE : Full Time Equivalent (FTE) Employment = FT + k. PT where k is a deflation factor derived on the basis of
earning per worker in the two types of employment. The inverse of k varied between 11.2 to 12.2 for Khadi sector and from 2.33 to 2.48 for village industries sector during the VIIIth plan.
Table 6.1 reveals that total employment generation in the two sectors has risen from 52.5 lakh in 1992-93 to 58.17 lakh persons in 1996-97, if no distinction is made between full-time and part-time employment. In terms FTE, employment has risen from 29.11 lakh persons (FTE) in 1991-92 to 34.81 lakh persons (FTE) at the final year of the Eighth Plan. Thus, the net addition to employment under the KVIC programme during the Eighth Plan is 5.7 lakh persons (FTE). It may also be noted that more than 80% of the employment got generated in the village industry sector, and its share has grown from about 82.45 per cent in 1991-92 to about 84.5 per cent in 1996-97.
6.2 Expenditure by KVIC-Eighth Plan Table 6.2 gives the plan and non-plan expenditure of KVIC during the Eighth Plan. The figures for non-plan expenditure exclude “renewal of past loans” which is usually shown as a component of the non-plan expenditure of KVIC. This exclusion is warranted because “renewal of past loan” which will be eventually recovered, can not be treated as an item of expenditure. During the Eighth Plan, a little less than one-fourth of KVIC’s expenditure constituted the non-plan component.
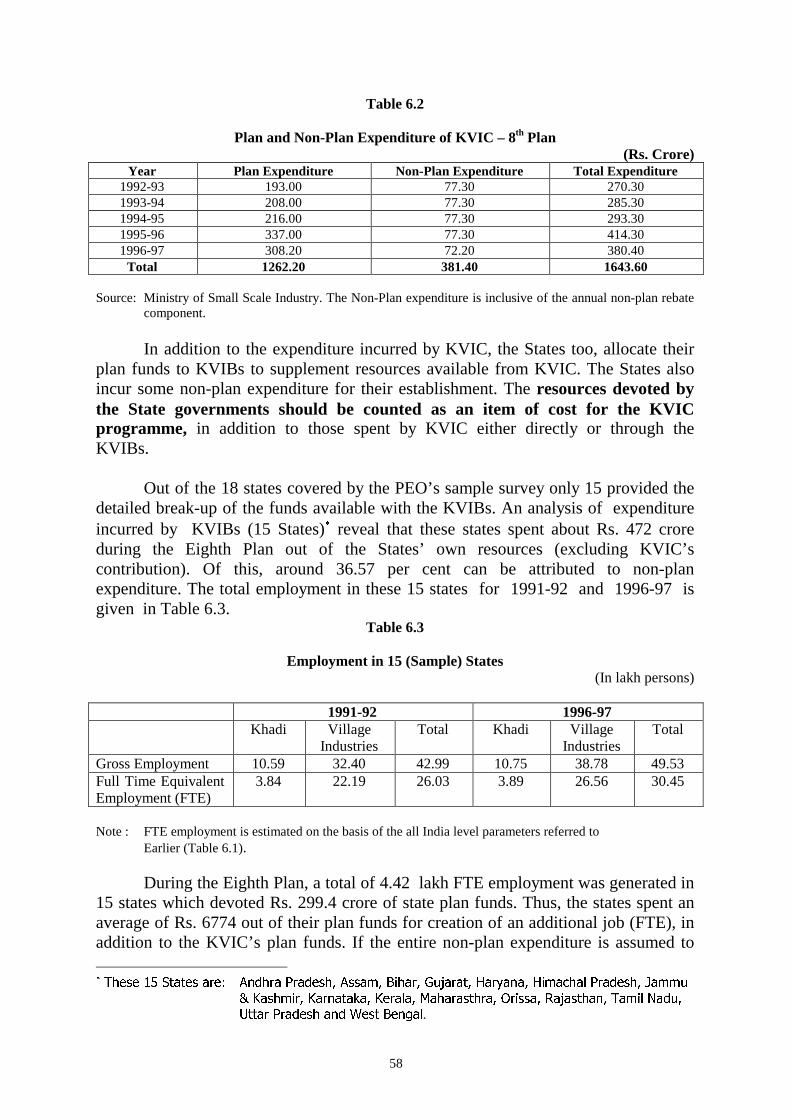
58
Table 6.2
Plan and Non-Plan Expenditure of KVIC – 8th Plan (Rs. Crore)
Year Plan Expenditure Non-Plan Expenditure Total Expenditure 1992-93 193.00 77.30 270.30 1993-94 208.00 77.30 285.30 1994-95 216.00 77.30 293.30 1995-96 337.00 77.30 414.30 1996-97 308.20 72.20 380.40 Total 1262.20 381.40 1643.60
Source: Ministry of Small Scale Industry. The Non-Plan expenditure is inclusive of the annual non-plan rebate
component. In addition to the expenditure incurred by KVIC, the States too, allocate their plan funds to KVIBs to supplement resources available from KVIC. The States also incur some non-plan expenditure for their establishment. The resources devoted by the State governments should be counted as an item of cost for the KVIC programme, in addition to those spent by KVIC either directly or through the KVIBs. Out of the 18 states covered by the PEO’s sample survey only 15 provided the detailed break-up of the funds available with the KVIBs. An analysis of expenditure incurred by KVIBs (15 States)� reveal that these states spent about Rs. 472 crore during the Eighth Plan out of the States’ own resources (excluding KVIC’s contribution). Of this, around 36.57 per cent can be attributed to non-plan expenditure. The total employment in these 15 states for 1991-92 and 1996-97 is given in Table 6.3.
Table 6.3
Employment in 15 (Sample) States (In lakh persons)
1991-92 1996-97 Khadi Village
Industries Total Khadi Village
Industries Total
Gross Employment 10.59 32.40 42.99 10.75 38.78 49.53 Full Time Equivalent Employment (FTE)
3.84 22.19 26.03 3.89 26.56 30.45
Note : FTE employment is estimated on the basis of the all India level parameters referred to
Earlier (Table 6.1). During the Eighth Plan, a total of 4.42 lakh FTE employment was generated in 15 states which devoted Rs. 299.4 crore of state plan funds. Thus, the states spent an average of Rs. 6774 out of their plan funds for creation of an additional job (FTE), in addition to the KVIC’s plan funds. If the entire non-plan expenditure is assumed to � ����� �� ��� ��� ���� ������� ���� ����� ����� ����� ������ ������� ����
� ������� ����� ����� ������ !����� "����� ���� #���
$� ������ �� %�� ���&�.

59
have been spent for maintaining existing jobs, then the states have, on an average, spent Rs. 133 per FTE job/annum. This is over and above the KVIC’s non-plan expenditure of Rs.150/ FTE job/annum. 6.3 : Cost of Job Creation - Analysis of Secondary Data Table 6.4 gives the estimated average expenditure incurred by the KVIC and KVIBs for generating a new employment and for maintaining an existing job during the Eighth Plan. These estimates have been obtained on the basis of some assumptions which have been spelt out at appropriate places in the text.
Table 6.4
Estimated Public Expenditure on Job Creation & Maintenance
(Fig. In Rs./FTE Job/annum) Expenditure on Job Creation (Plan) Other Expenditure (non-plan)
KVIC Component
KVIB Component
Total KVIC Component
KVIB Component
Total
22143 6774 28917 150 133 283 The public spending on creation of a new job has been Rs. 28,917 during the Eighth Plan, while the annual cost of administering the programme comes to around Rs. 283/FTE worker. It is also important to bear in mind that the costs of job creation derived from budget data is only a rough estimate, as several assumptions are implicit in this derivation. For example, the employment figures available in the published sources may or may not reflect the grassroots reality. Secondly, in the plan expenditure, there are loan components which will eventually be recovered and should not be fully counted as a net outgo from the Exchequer. It may be possible that a large part of the “loans” and “grants” given to most of the Khadi and village industries units will have to be considered “sunk costs” but, for analytical purposes, it is not appropriate to count these as net ‘outgo’ from the Exchequer. Instead, the opportunity cost of the loan component of the plan expenditure should be considered a cost to the government. Thirdly, it is not enough to identify the financial flows, but one should also take into account whether such resources are being actually deployed by the units, as intended. There are also reasons to believe that the secondary data on employment and earnings (as reported in the Statistical Abstract and Annual Reports of KVIC) do not adequately reflect the grassroots reality. The observations of the PEO field teams tend to substantiate this belief, as discussions with officials of the implementing agencies at different nodes failed to provide any satisfactory explanation and to generate sufficient confidence in the data set. Moreover, the monitoring and verification mechanisms at different levels were found unsatisfactory. Under these circumstances, it would be worthwhile to examine the data generated by PEO through its sample survey.

60
6.4 Analysis of Survey Data - Employment and Cost of Job Creation & Maintenance
In the Sample Survey of PEO, detailed information on output, employment, wages paid, number of days of employment, composition of labour force, capital employed and other relevant information were collected from 82 (86) Khadi units and 88 Village Industry units spread over 32 districts in the country. These 82 Khadi units employed about 29 thousand workers and 88 village industries units provided employment to 1322 workers during 1997-98. The sample khadi units employed Rs. 407 lakh as fixed capital (only machinery and equipment) and Rs. 5035 lakh as working capital during 1997-98. The corresponding figures for the 88 village industries units are Rs. 114.51 and Rs. 471.76 lakh. At the outset, it may be pointed out that PEO collected the relevant information from the sample units on the basis of the records maintained at these units. The data on wages and number of days of employment were collected from the workers too, but the analysis in this chapter is based primarily on the information collected from the sample units. 6.4.1 Effective Employment in Khadi Units Table 6.5 gives information on the average earnings (wages) by a worker per day, average number of workers/unit and the average (annual) number days of employment /worker. This information is based on compilation of the data received from 82 Khadi units and relate to the year 1997-98.
Table 6.5
Wage rate and Effective Employment in Khadi Sector
State Average daily earnings (Rupees)
Average No. of Workers per unit
Annual Employment per
worker (Mandays)
Effective Employment
(FTE) per unit Andhra Pradesh 7.79 96.67 175.52 27.33 Assam 4.77 95.50 285.00 26.85 Bihar 11.78 536.86 144.74 189.32 Gujarat 32.08 398.45 182.61 482.76 Haryana 49.81 3.00 154.67 4.78 Himachal Pradesh 19.79 15.00 281.51 17.28 Jammu & Kashmir 2.10 8.50 245.42 0.91 Karnataka 18.49 76.71 211.53 62.05 Kerala 21.59 34.00 202.95 30.81 Maharashtra 30.38 6.00 120.67 4.55 Madhya Pradesh 18.92 90.89 76.07 27.05 Orissa 6.53 197.75 137.80 35.68 Rajasthan 2.24 2681.2 130.10 171.26 Tamil Nadu 31.82 30.00 123.58 24.20 Uttar Pradesh 15.64 295.22 223.57 213.50 West Bengal 15.60 147.00 223.97 106.23 Average of 82 units 17.04 385.83 180.83 245.89

61
Though the state-wise picture is presented in Table 6.5 to show variations in daily earnings, days of employment/worker and number of workers per unit across the sample states, the averages at the state level should not be taken as the representative figures for the concerned states. The sample design of the study does not permit derivation of estimates of population parameters at the state level. Therefore, the analysis in this section has been carried out on the basis of pooled data of the 82 Khadi units. Before making any observation on the results of Table 6.5, it is necessary to understand the quality of data maintained by the khadi units. It has been found that many units report that a worker has worked for 365 days in a year, even if the output (or wages) of the worker is equivalent to the output (income) that can be produced (earned) by a fully employed person in a few days. This is evident from the average daily earnings which is much less than the minimum wage rate in almost all the states. The variation in the wage earnings across the sample units as reflected in the average wage earnings in Table 6.5 is very large. The results presented in Table 6.5 show that even though the average number of workers per khadi unit is reported to be 386, in effect, a khadi unit is giving employment to only 246 FTE persons. Thus, the effective employment in terms of FTE is only 64 per cent of the employment figures reported by these units. This “reported” to “effective” employment ratio of 100:64 in the khadi sector has been derived on the basis of statistics supplied to PEO by 86 sample khadi units. However, the average income of a worker from khadi unit during 1997-98 was found to be around Rs. 2598 as per feedback form 1075 khadi workers (spinners and weavers) spread over 16 states. This is about 95% of the estimated income (Rs. 2740) obtained from the information supplied by the units. Thus, the ratio of “reported” to “effective” (FTE) employment works out to 100:61, as against 100:64. This means that the earnings of every 100 workers, reported to have been employed by a Khadi unit should be taken as equivalent to 61 FTE workers. It may be noted that this ratio derived from the unit level data is lower than that observed in Table 6.1 (where it was 100:36). This may be because of the phenomenon of submission of false returns by the sick and non-operational units. 6.4.2: Public Cost of Maintaining Existing Jobs in Khadi Sector An attempt was made in Section 6.3 to derive a rough estimate of the public spending on creating a job under the KVIC programme by making use of the plan and non-plan expenditure of the KVIC and KVIBs. However, because of non-availability of separate information (for khadi and village industries units) on a number of items, the effort in Section 6.3 was confined to deriving an estimate for a job under the KVIC programme, without making a distinction between khadi and village industries. Moreover, a number of assumptions had to be made to arrive at even a rough estimate. The unit level information generated through the PEO sample survey could be used to derive separate estimates of these costs, as also the estimates for the investment requirement for creating a new job.

62
It may be mentioned here that the cost of job creation and maintenance is partly borne by the units themselves, since a large part of the fixed capital requirement of the khadi units is financed by them and they are required to bear a part of the interest cost on working capital. In this study, we have confined to making an assessment of the costs incurred by the public agencies viz; the grants and concessional loans and other indirect expenses on establishment, training, R&D, rebates etc. by the government(s). Table 6.6 gives the public cost of maintaining an existing job in the khadi sector. This cost has two components - the “direct cost” which has been derived on the basis of the concept of opportunity cost and using the unit level fixed and working capital, - and the “indirect cost” derived from the non-plan expenditure of KVIC and KVIBs.
Table 6.6
Annual Public Cost of Job Maintenance- Khadi Sector
(Figures in Rs./annum/FTE Job)
Type of Units Annual
Grant Interest
Cost Indirect Cost Total Cost
Average of all (82) Sample Units 1648 3048 283 4979 Notes : (i) Capital Cost: 15% interest on fixed capital for machinery and equipment and
11% interest on the estimated loans outstanding, both borne by KVIC.
(ii) Indirect Cost: includes all non-plan expenses of KVIC and KVIBs, excluding “renewal of past loans”. Since these figures have been derived from budgets of KVIC & KVIBs, these are assumed to be the same for all types of Khadi units – large or small.
(iii) FTE : Full time equivalent. The number of workers as reported by the units
has been converted into FTE Workers. (iv) Annual Grant: During the 8th plan this grant (rebate)/FTE worker was Rs.
1648 on an average.
The results show that the public spending for maintaining a job in the khadi sector is Rs. 4979/annum, whereas the annual earning of an FTE worker in the khadi sector is only Rs. 2740. This implies that the government not only pays for the entire wage bill of the khadi sector but also gives a subsidy to khadi units to ensure their economic viability. Such a scenario is obviously not fiscally sustainable.
It may be mentioned here that the above estimate of interest cost has been
derived from the unit level data assuming that no part of “loans” to khadi sector is a “sunk” cost. In reality, year after year “renewal of past loan” has constituted a major component of the Non-Plan Budget of KVIC and some khadi units which received grants/loans are not fully functional.

63
6.4.3 Investment Requirement Norm for Job Creation-Khadi Sector
In Section 6.3, the estimated cost of job creation under the KVIC programme
was put at around Rs. 29 thousand. With the help of the micro level data generated by PEO, it is possible to arrive at an alternate estimate of the cost of Job creation under Khadi and village industries separately. Table 6.7 gives such an estimate for the Khadi Sector.
Table 6.7
Investment per FTE Job in Khadi Sector – Unit level data
(Rs./FTE Job)
Direct Capital Cost Indirect Cost Type of Units
M&E WC Sub total
KVIC+KVIB Total
Average of 82 Units 2018 24,958 26,976 283 27,259
Notes: (i) M&E: Capital Cost of machinery and equipment. Land, Building, and other infrastructure cost has not been considered in this section.
W.C.: Working Capital (ii) Indirect Cost is derived from the non-plan expenditure of KVIC & KVIB.
The investment (except land & building and working capital) requirement for creating a new FTE-Job in the khadi sector is thus estimated (1997-98 prices) at Rs. 27,259. Of this amount, the direct requirement of the units works out to Rs. 26,976 and Rs. 283 is the indirect cost for administering the programme, (including subsidies and rebate).
6.4.4 Public Cost of Job Creation & Maintenance –Village Industries
The methodology adopted for derivation of the cost of maintenance of existing jobs and investment requirement norms for the village industries sector is basically the same as adopted for the Khadi sector. The required unit level-data base for this sector was generated through a sample survey of 88 village industry units employing Rs. 115 lakh in fixed capital and Rs. 472 lakh in working capital, and giving employment to 1322 workers. Before deriving the relevant cost estimates from the information generated through the sample survey, it is necessary to mention some of the peculiarities of this sector. First, though the secondary statistics brought out by KVIC refer to “part-time and full-time” employment in the village industries, the field survey revealed that the concept is not of much relevance to this sector. The PEO field teams did not find the “part-time” employment of the type prevalent widely in the khadi sector. Secondly,

64
the feedback from the (sample) workers of this sector revealed that the average income (Rs. 4501) of a village industries worker is higher than the earning of a full-time worker (Rs. 4323) reported in secondary statistics. Having said this, the unit cost of job maintenance and investment requirement per job in the village industries sector is presented in Table 6.8.
Table 6.8
Maintenance Cost & Capital Requirement in Village Industries Sector
(in Rupees- 1997-98 prices/FTE Job)
Item Contribution of
Government
Cost borne by the units
Indirect Cost Total Cost
1. Maintenance cost/ existing Job / annum
1875 Not Relevant 283 2158
2. Investment/ Job (new) 38,775 4308 283 43366 Notes : 1. Maintenance (direct) cost borne by government is taken as interest @ 15% on fixed capital
and interest subsidy on loans outstanding. 2. Investment for a new job includes Rs. 4107 as grant and Rs. 34668 as loan for working
capital.
6.5: Sustainability of Employment In the Khadi sector, the annual public expenditure comes to Rs. 4979 to enable this sector to make a wage payment of Rs. 4835/FTE worker/annum. As we shall see later, the average wage payment of Rs. 4835/FTE worker obtained from secondary statistics is an over estimate. Our survey results show that the average annual earning of an FTE worker is only Rs. 2740 and not Rs. 4835. The annual public spending for maintaining a job (FTE) in the khadi sector is around Rs. 4979/= of which only Rs. 2740 is transferred to the workers and the remaining is the subsidy to khadi sector. Thus, the delivery cost of employment generation in the khadi sector is 182%, which is abnormally high.
In the case of village industries units on the other hand a worker (FTE) earns Rs. 4323, whereas the public cost of maintaining an FTE job is around Rs. 2158/=. Thus, the delivery costs is only about 50% in the case of village industries sector. It may also be noted that the contribution of the khadi sector to employment generation is only 14% to 15% while that of the village industries sector is 85% to 86%.
How do these delivery costs compare with those of other employment
generation scheme? PEO evaluated the Employment Assurance Scheme of Ministry of Rural Areas & Employment in 1999. The delivery cost comes to about 300%. However, the lower delivery cost in KVI programme can not be a justification for

65
continuance of inefficiencies in public spending, as subsidies flowing from the Exchequer are neither justified, nor fiscally sustainable.
Given the above scenario, one could raise a set of pertinent issues, viz;
- can the employment generation programme in the khadi and village industries sectors be sustained, if it depends largely on budgetary support ?
- is the budgetary support necessary at all ? - is the larger part of the subsidy reaching the workers, for whom the
scheme is meant ? - are there alternate cost-effective methods of generating employment ?
In the next few sections, an attempt is being made to address these issues. The
most basic element of the above issues is the economics of production in the khadi and village industries sectors. It is possible that such cost-benefit analyses have been carried out in the past. However, an attempt is made here to work out the profitability of a typical khadi/ village industries unit on the basis of the data generated through the sample survey of PEO.
6.5.1. Economics of Khadi Production
On an average, a sample khadi unit was found to have machinery and equipment worth Rs.4,96,305, invested Rs. 61,39,744 in working capital and employed about 246 FTE workers during 1997-98. For working out the economics of khadi production, the survey information obtained from 86 sample khadi units have been used to generate a set of financial parameters. All the financial flows presented in the Table 6.9 have been expressed in terms of values per unit of labour. Since, in the case of khadi units each worker put in different hours of work and since the range of variation in earnings per worker is wide, it is necessary to adopt a standard definition of “worker” in such an analytical frame. The actual number of the workers in 86 sample khadi units have been converted into FTE workers (see section 5.1) by using the ratio of each worker’s earning to the earning of an FTE worker (i.e. Rs. 4835 per annum). Table 6.9 presents the values of the relevant financial parameters of an average khadi unit. Each financial indicator is expressed in terms of value per FTE worker.

66
Table 6.9
Profitability Analysis of Khadi Unit
Sl. No. Indicator Value/FTE Worker (Rs.)
1. Revenue from Sales 11,131 2. Unsold Stocks 5,993 3. Value of Production (1+2) 17,124 4. Raw Materials used 5891 5. Value Added (3-4) 11,233 6. Wages paid to workers 2740 7. Payments to Managerial and other staff,
including the key person and non-working members
652
8. Salary & Wage Bill (6+7) 3392 9. Interest on Working Capital 998 10. Others costs 856 11. Total Costs (8+9+10) excluding raw
materials 5246
12. Value of Surplus Generated (5-11) 5987 13. (Inflows – Outflows) during 1997-98, i.e. cols.
(1-4-11) -6
An average khadi unit generates a surplus of Rs. 5987 per FTE worker under the present pattern of financing. However, this surplus is not translated into profit, as the entire production of the unit is not sold during the year. The average unintended stock build-up is around 35% of the annual production, and for small units, it is as high as 80%. The economics of khadi production will work out very differently if the inventory of finished goods could be reduced to, say, 5% of annual production. In such a scenario, a khadi unit will generate a profit of Rs. 5131/FTE worker or more than Rs. 12.6 lakh as total profit for the unit.
Another area of concern is the high raw material to output ratio. For some
units, the ratio is as high as three-fourth. A ratio of more than 25% is neither justified, nor sustainable. The PEO study was designed to elicit information on the sources of raw materials and their prices. Nearly all the sample khadi units have expressed difficulty in the procurement of raw materials. The supply from KVIC’s Sliver Units is inadequate, unreliable and sometimes more expensive than other alternatives. While large khadi units have been able to keep their input –output ratio low (less than 20%), most of the medium and small units have shown very high ratio – implying high input prices, or dominance of production of lower count khadi items, or both.
It is felt that there is enough scope to reduce the (value of) raw material to
(value of) output ratio to less than 25%, if steps are taken to supply adequate raw material at reasonable prices and to bring about the necessary technological

67
improvement in yarn production. The following steps may be suggested for this purpose:
- Rationalize the cost structure of the KVIC owned Sliver Units by
introducing a “Cost Chart” specifying the ‘norms’ at different stages of production, beginning with procurement of cotton.
- The capacity utilization of the Sliver units needs to be improved. At
present, their capacity utilization is very low. - Since the supply from Sliver Units would still be inadequate, it may be
explored by KVIC if the idle capacities of the unutilized/underutilised NTC mills be used to produce adequate quantity of sliver for the khadi sector.
- The improved technologies (e.g. Ambar Charkha) are, at present, not
accessible to all units. Their diffusion must be widespread, and facilities for their repair and maintenance must be made available within a reasonable distance to bring about an improvement in the quality of yarn and fabric production. This effort needs to be supplemented with training facilities for the artisans (which should be decentralized) on a regular basis.
These steps would certainly go a long way to bring down the raw-material to output ratio in khadi production. On the assumption that the ratio comes down to 25% from the present average of 34%,the raw material cost of khadi units would reduce by more than 26% (or Rs. 1532/FTE worker). This would enable the khadi units to reduce their sales prices substantially and contribute towards expanding the market for khadi products. The third area of concern brought out by the survey results is the low wage payment to workers, for whose benefit the khadi programme is often justified. How much does a full-time equivalent worker get? As per secondary statistics brought out by KVIC (on the basis of the returns from the units), the average annual earning of a full time worker was Rs. 4835 in 1996-97. However, our analysis shows that an FTE worker got only Rs. 2740 during 1997-98. Not only is this earning much less than what is reported in secondary statistics, but, it also forms a relatively small proportion of the value added by an FTE worker. A payment of 24% of the value added to an FTE worker is very low, in a production process which is labour intensive and the large government subsidy to which is justified on the basis of its employment generation capacity and benefits to the poor. This low share of wages in value added can not be justified on grounds of high cost of capital, as both fixed and working capital are available at negligible cost to the units. If the khadi progarmme is to be justified, the share of wages in value added has to rise substantially (more than 50%).

68
It is also important to note that the opportunity cost (of sustaining khadi production) to the government in the form of grants, concessional loans and rebate works out to Rs. 4979/ annum per FTE worker or, Rs. 12.25 lakh for an average khadi unit. Of this cost, more than 94% is the direct government contribution to the unit (see Table 6.6). This implies that only 58% of what the government spends on a khadi unit reaches the khadi workers. If the large government subsidy to the khadi programme is to be justified primarily on grounds of job opportunities for the poor, it is important to recognize that the delivery cost is abnormally high. In other words, under the present financing pattern, khadi units must make an annual wage payment of at least Rs. 5000/= (at 1997-98 prices) to a full-time khadi worker. As the above analysis shows, it is very much possible.
6.5.2 Restructuring The Khadi Programme Thus, under the present pattern of financing, the khadi production has the potential of not only generating adequate income for the workers, but also adequate return on public investment, if:
- the unintended stock build-up does not take place; - all the units get their raw material requirement timely and at reasonable
prices; and - improved technologies are adopted by all the units to bring about
improvement in product quality, product composition and labour productivity.
The implications of all these measures would be that khadi units would earn a
profit of Rs. 6657/FTE worker or, Rs. 16.38 lakh per annum for an average khadi unit. To put it differently, khadi production has the potential of generating an annual return of more than 16% (on government investment of Rs. 26,976 in fixed and working capital per FTE worker), even after making a wage payment of Rs. 5000/FTE worker. However, this is only the potential of the khadi sector which has to be translated into actual return. However, all these can not happen without any fundamental changes in the existing methods of management of khadi production and sales. Some incremental changes in the areas of concern identified in the above analysis may bring marginal improvement, but are unlikely to make khadi production a sustainable proposition. Keeping in view the employment potential of the khadi sector, it is felt that the necessary changes be brought about to ensure that this sector continues its activity without unjustifiable levels of subsidy from the Exchequer. In the era of liberalization and globalization when the market for eco-friendly products are expanding, khadi should not only expand the domestic market, but also capture the niche
69
international market . However, the key to any such step is the economic viability of khadi production. The government should take a pro-active stance to make this possible, as:
- khadi has potential for employment generation; - the government has larger stake, as the programme runs primarily on
government money; and - it can be an effective social safety net during reforms and structural
adjustment, as it can run without much government subsidy. The primary concern of any alternate strategy for the khadi sector must be to ensure that actual production takes place on a sustainable basis, as it is this that would generate employment. It is necessary to create an enabling environment for this. The following steps are suggested for making the khadi sector economically viable and sustainable. 1. The first and foremost requirement in this regard is thorough overhaul of the
marketing strategy for khadi products. Product development and marketing need a professional approach. The present policy of retail sale of khadi products through KVIC outlets and through the own effort of the khadi units must be done away with, as it has led to unsustainable and unjustifiable public spending. Even the attempts to boost sales using khadi as a brand name is unlikely to succeed unless some fundamental changes are brought about.
One way of addressing the issues relating to marketing and product development is to leave this to the private sector. However, since khadi units operate under a protective environment, the role of private sector has to be carefully designed to ensure that the social objective of employment generation with justifiable level of fiscal support is not diluted because of private sector participation. This warrants close monitoring of the activities of the khadi units. Production and employment are directly related. Thus, it is important to track the flow of input to and output from this sector. To facilitate this process, the delivery of input and receipt of output should be with a single agency which can be held accountable for ensuring that the input-output relationship in the khadi sector is not vitiated. It is, therefore, proposed that the organisational structure of KVIC be reoriented to ensure that: (a) the khadi units’ raw material requirement is met at pre-fixed prices (reasonable prices) (b) the entire production (as per cost charts) is received back by KVIC, (c) the units may be prevented from undertaking processing and any retail sale of khadi products and, (d) upon receipt of output, KVIC must make prompt payment to the khadi units to enable them to plough back the money, so that the process of production and employment generation does not get affected adversely. To make this possible,

70
it is necessary to link availability of concessional funds to units with the delivery of output to KVIC.
2. KVIC should not undertake any retail sale of khadi products. Instead, the entire unprocessed khadi products be sold to the private sector either at cost price or, on auction, keeping cost-price as the floor price. The product development and marketing of khadi products can be left to the private sector. The details of this approach to marketing of khadi products need to be carefully worked out to ensure its viability and sustainability.
3. The reorganisation and reorientation of KVIC should be done keeping in view
the role it has to play in the new scenario. It should concentrate on:
- technological upgradation and diffusion to continually raise labour productivity and improve product composition of units;
- ensuring supply of raw material and other inputs to all units at fixed
(reasonable) terms;
- ensuring delivery of output by the units to KVIC as per cost charts and inputs supplied, by linking release of concessional funds to delivery of output to KVIC;
- imparting training to artisans and technicians more effectively than
being done at present. The entire cost of such training should be borne by the government;
- the monitoring of input delivery, output quality, assessment of needs of
the units in response to changes in market demand;
- developing an appropriate MIS to get market information feedback from the private sector on the desired product composition, output quality, demand pattern and respond to the changes by reorienting production pattern of the units; and the like.
In the new scenario, no rebate on sale is necessary and the units should be
run purely on the basis of bank finance (CBC). The concessional bank finance may be linked to actual production and delivery of output.
6.5.3 Economics of Village Industries Units On an average, a village industries unit invested Rs. 6,97,940 and employed 16.2 FTE workers. Of this investment, 25% is government grant, 65% loan and 10% own contribution. Profitability analysis for the village industries has been carried out at two levels; (i) based on the information obtained from the units on the ownership of

71
fixed and working capital and (ii) on the present MMS financing. The values of the relevant parameters for profitability analysis are:
Table 6.10
Sl. No.
Sources of income and expenditure Analysis based on actual position
Analysis based on MMS financing
1. Value of Sales/FTE 45,556 45,556 2. Raw material cost /FTE 20,063 20,063 3. Value added/FTE 25,493 25,493 4. Costs
- Wage payment 4,323 4,323 - Interest on loan 3,941 1,766(*) - Other costs @ 5% on sales 2,278 2,278
Total Cost 10,542 8,367 5. Profit: Value added – Total Cost 14,951 17,126 6. Stock of finished goods (5% of sales) 2,278 2,278 7. Actual Profit/FTE 12,673 14,848 8. Rate of return on investment/FTE 29.4% 34.5% (*) The interest payment is low because the MMS pattern of financing has been imposed on the
WC. The profitability analysis shows that village industries units are economically viable under the MMS pattern of financing. Since some units have already repaid a part of the loans, the source wise configuration of capital in village industries units has undergone changes with relatively larger proportion of their own capital. In both the cases, the village industries units earn a high rate of return on capital and can sustain themselves with out much direct subsidy from the government. The public expenditure for maintaining a job in the village industries sector is Rs. 2158, of which about Rs. 260/job constitutes the interest subsidy, Rs. 1616/= interest on the grant amount and Rs. 283 the cost of administering the programme. Thus, the government bears a cost of Rs. 2158/= per worker to enable the village industries to make a wage payment of Rs. 4323/FTE worker.
6.5.4 Cost Effectiveness of the KVIC Programme It would be of interest to know how the delivery cost in the KVIC programme compares with that of other employment generation programmes. The Programme Evaluation Organisation (PEO) has recently (April, 2000) completed the evaluation of the Employment Assurance Scheme (EAS) of the Ministry of Rural Areas and Employment. The findings of this study suggest that the government spends about Rs. 3100 per worker, whereas an average EAS beneficiary earns only Rs. 991/ annum. As per guidelines of implementation of EAS, the wage material cost ratio is required to be 60:40 in the total expenditure (Though PEO’s field survey revealed that this ratio was not maintained in the works executed under EAS). However, assuming that the

72
works under EAS were executed as per guidelines, one finds that the material cost per job in EAS works out to Rs. 661. Thus, a total of Rs. 1652/job should have been spent as against Rs. 3100/job actually spent during 1995-97. Thus, the implementing agencies spent Rs. 1448/job to deliver Rs. 991 to a worker. To put it differently, the delivery cost of EAS is 146% of the amount delivered. As already pointed out, the annual public spending for maintaining a job in the khadi sector comes to Rs. 4979/FTE worker (see Table 6.6) while an FTE worker actually gets Rs. 2740. The delivery cost thus works out to 82% of the actual wage payment. In other words, the government bears not only the entire wage bill for the workers, but also pays an extra Rs. 2239/workers as delivery cost. Thus, the government in effect is giving a subsidy to the khadi units, in addition to bearing their entire wage bill. This is neither justified, nor fiscally sustainable. In fact, for sustainability of khadi production, the units should be in a position to contribute a part of the wage bill for workers and not to demand subsidy from the government for ensuring their viability. The analysis of the economics of khadi production tends to suggest that this is indeed possible. The khadi programme, too, should be restructured not only to reduce the delivery cost, but also to enable it to make positive contribution towards the social objective of job creation for the poor.
In the case of village industries units, the public spending for maintaining a job comes to Rs. 2158/annum, whereas an FTE worker earns Rs. 4323/annum. Thus, the village industries units are contributing nearly 50% of the wage payment. In other words, the village industries units are economically viable and make a positive contribution to the realisation of the social objective of creating gainful employment opportunities for the poor. They are thus fiscally sustainable.
Thus, inspite of high delivery costs, the performance of the KVIC programme is better than other employment generation programmes. In fact, it may be useful to explore if the existing anti-poverty and employment generating programmes such as JRY, EAS and IRDP could be restructured along the lines of KVIC programmes to create a wider and more effective social safety net and to ensure that social welfare goals are achieved without unsustainable fiscal support.

73
Chapter 7
Profile of Beneficiaries & Impact of KVIC Programme One major objective of the KVIC programme is to raise the earnings of the poor through creation of part time and full time employment opportunities in the khadi and village industries units. The findings of the previous chapters tend to suggest that while, 33.97 lakh part time and 24.20 lakh full time (as defined by KVIC) employment opportunities are being created each year, the annual earning of a worker from this programme is very low. However, since the scheme was designed primarily to generate supplementary income for the poor households, even this low income could bring about a significant improvement in the well-being of the beneficiaries. But, has this improvement actually taken place?
The objective of this chapter is to analyse the household level information collected from the different categories of beneficiaries of KVIC programme and assess as to what extent their well-being has improved because of the KVIC programme. Though, human well-being is a multi-faceted concept, an attempt is made in this study to measure improvement only in the material wellbeing through changes in income and expenditure. This is done, as the KVIC programme is designed to bring about an improvement in the well being by providing an opportunity to the poor to raise their income levels. In addition, an analysis of the direction of household expenditure is carried out to throw some light on other aspects of well-being. Keeping this analytical frame in view, the household level questionnaire for the beneficiaries in the sample survey (conducted by the field units of PEO) was designed to collect primarily the information relating to income and expenditure of the beneficiary households.
7.1 Profile of Beneficiaries The direct beneficiaries of the KVIC programme can be classified in two broad
groups, viz; those running the khadi and village industry institutions/units and those working in such institutions/units. The former category contains two types of people, viz; (i) those directly responsible for running the institutions/units, such as the Presidents/Secretaries/Owners and (ii) those who are members of the governing bodies, but do not involve themselves in the day-to-day functioning of the institutions/units. The workers of khadi and village industries units can be distinguished in terms of the social groups they belong to. This distinction is important, as the employment generation schemes of KVIC place emphasis on targeting the poor people belonging to the SC/ST categories.
The sampling framework of the study was designed to cover all the four types
of beneficiaries. The sample for the study included 158 key persons, 78 ordinary

74
(non-working) members, 1071 workers from 494 households, of which 666 (62.18%) have worked in the KVIC units. About 74% of the households belonged to the SC/ST/OBC categories. 7.1.1 The Workers
The occupational distribution of the earners of workers’ families working in the selected khadi and village industry units is given in Table 7.1.
Table 7.1
Occupational Distribution of Khadi & Village Industries workers
Primary
Occupation SC/ST/OBC Others All Workers
1. Wage Labour 21.38 21.35 21.37 2. Cultivation 12.53 13.52 12.79 3. Business 3.19 3.92 3.38 4. Artisans 42.63 36.30 41.00 5. Others 20.27 24.91 21.46 Total 100.00 100.00 100.00
The workers of Khadi and village industry units are mostly from low paying occupations. The cultivators are mostly marginal farmers and some workers’ families have petty business. Table 7.2 presents the distribution of workers according to their level of education separately for SC/ST/OBC and other category of workers.
Table 7.2
Distribution of workers by Education Levels Level of Education SC/ST/OBC
Category Other Category All Workers
1. Illiterate 36.63 26.38 33.99 2. Primary 27.72 26.94 27.52 3. Matric 23.50 28.08 24.68 4. Above Xth Class 12.15 18.60 13.81 Total 100.00 100.00 100.00
Thus, more than 60% of the workers working in Khadi and village industries units are either illiterate or have upto primary level of education. The literacy rate as well as educational attainment is more in the ‘others’ category.

75
The Khadi and village industries workers were found mostly to belong to the same districts in which the units were located. It was found that more than 91% of the 494 households (workers) selected for the study belonged to the same districts where they were working in the KVIC units. All this tends to suggest that the workers working in khadi and village industries units are mostly poor, disadvantaged and local people. The REGP, which is designed to attract these target groups, has actually been successful in doing so.
7.1.2 Profile of Other Beneficiaries The key persons (presidents/secretaries) and other non-working members are also
the direct beneficiaries of the KVIC programme. They earn income from the units of khadi and village industries. Table 7.3 gives the average household income of the ordinary members and key persons along with the share of income from the KVIC programme.
Table 7.3
Household Income of Key persons & Members – 1996-97
Sector Total Income (Rs./annum)
Income from KVIC Programme (Rs./annum)
Share of Income from KVIC (%)
Key persons
Other Members
Key persons Other Members
Key persons
Other Members
Khadi 64088 71936 33794 8385 52.73 11.66 Village Industries
84122 66550 44609 14046 53.03 21.11
Average 73598 70072 38928 10345 52.89 14.76 More than 50 percent of the household income of the key persons comes from the KVIC programme. This happens in spite of the fact that, on an average, there are four (4) income earners from each household (both khadi and village industries) and only 1.16 and 1.31 persons from the households of the key persons of khadi and village industries units respectively actually work in these units. In other words, the contribution of other sources of income for these households is relatively low for the households of key persons. It may be mentioned that these estimates of income from the KVIC supported units are only direct income and do not include perks and other benefits in kinds/services from units. In the case of ordinary members of Khadi and Village Industries, 33 family members from 78 selected households were found to be working in these units. In these families, there are 152 earners, of which those working in KVIC units constitute about 19.39% in Khadi units and 25.93% in Village Industries units. The shares of income from the KVIC programme for these families are less than the percentages of

76
earners working in Khadi and Village Industries units. Thus, the ordinary members do derive some benefits from the KVIC programme but this benefit does not constitute a large part of their household income. The above analysis suggests that it is the key persons in KVIC units who derive maximum benefit from the programme, as the involvement of 30% of the earners of such families enable them to earn more than 50% of their household income from the KVIC programme. Though the ordinary members of Khadi and Village Industries institutions do derive some financial benefits, they do not seem to be actively involved in the functioning of these institutions.
7.2 Income of Khadi & Village Industries Workers
Table 7.4 gives the annual per capita household income of khadi and village industries workers.
Table 7.4
Annual per Capita Income of Workers
(In rupees/annum) Sector Per capita Total
Income Per capita income
from KVIC Programme
Percentage of income from KVIC
programme Khadi 4843 2241 46.27 Village Industries 6553 3799 57.98 Pooled Average 5655 2981 52.71
The per capita income of a village industry worker’s family is about 35% more than that of a khadi worker’s family. Without the supplementary income from the khadi and village industries units, however, the per capita income is more or less the same for both types of families. But, the income from the village industries is substantially more (70%) than that from khadi units. This finding is in tune with the macro level statistics on employment and earnings available in secondary statistics. In chapters 5 and 6, it was shown that a large majority of khadi workers get employment for only a few days in a year and that the average income of a part-time khadi worker is as low as Rs. 433 per year (1996-97). In contrast, most of the workers in village industry units get near full employment and their average earning is substantially higher than that of khadi workers. An important issue in the present context is: whether the earnings from the KVIC progarmme have enabled the workers’ families to cross the poverty line. On the basis of the state-wise poverty lines for rural areas for the year 1996-97, an analysis has been done to find out how many workers in the selected khadi and village industries units have been able to cross the poverty line with the help of the supplementary income from these units. Table 7.5 gives the results of this analysis.

77
Table 7.5
Number of Beneficiaries above Poverty Line
Sector Total Number of
Selected Beneficiaries
Below Poverty Line without
KVIC Earnings (Percentage)
Percentage of Poor Workers who crossed
Poverty Line with Supplementary
Income 1. Khadi 256 68.36 62.29 2.Village Industries 238 66.07 80.50 Total 494 67.61 70.96 The results presented in Table 7.5 indicate that more than two-thirds of the workers of khadi and village industries units originally belonged to the families which had incomes below the poverty line. Further, 62.29% of the poor workers of khadi units and 80.50% of the village industries workers have been able to cross the poverty line with the help of supplementary income from the KVIC progarmme. Though, the proportion of khadi workers who were able to cross the poverty line with the help of supplementary income from KVIC programme is lower than that of the village industries workers, the results of Table 7.5 have important implications for planners and policy makers. The performance of the KVIC programme appears much better than that some other employment generation schemes like JRY and EAS. In the recent evaluation study of the Programme Evaluation Organisation on the Employment Assurance Scheme (Planning Commission, April 2000), it was noted that: (a) even with the supplementary income, the majority of the beneficiaries of EAS in the states of Bihar, Madhya Pradesh, Maharashtra, Orissa, Rajasthan and West Bengal did not cross the poverty line and (b) in some other states like Haryana, Himachal Pradesh, Karnataka and Tamil Nadu, the benefits of EAS are leaking to the non-poor. This comparison suggests that KVIC programmes are better targeted and are more effective instruments for poverty alleviation. However, the above results should not be taken to mean that there is no scope for improving the performance of KVIC schemes. As noted in Chapters 4 and 5, the physical and financial performance of KVIC leaves much to be desired. The removal of the weaknesses and inadequacies will certainly bring about improvement in performance and contribute towards meeting the goal of poverty alleviation more effectively.

78
7.3 Household Expenditure Pattern of KVIC Workers Increased income leads to a change in the expenditure pattern of the households in favour of non-material consumption, such as education and health. Table 7.6 presents the annual per capita expenditure on food, clothing, education and health for the families of workers of KVIC programme.
Table 7.6
Annual Per Capita Household Expenditure on Major Items-KVIC Workers
(Rs. At 1996-97 prices) Sector Food Clothing Education Health
Khadi 2964 (71.00)
472 (11.31)
192 (4.60)
256 (6.13)
Village Industries 3352 (68.00)
640 (12.98)
235 (4.77)
342 (6.94)
Average 3193 (70.00)
559 (12.25)
215 (4.71)
301 (6.60)
Figures in parentheses are percentages to total expenditure It is clear from Table 7.6 that the workers of village industries units, who are better off in terms of their annual income compared to their counterparts in the khadi sector, spend more on all the major items of consumption. However, the share of expenditure on food is lower (Engel’s Law) and that on other items, such as clothing, education and health is higher for the village industries workers’ families. These results are in tune with those of Table 7.4 where it is shown that a larger proportion of the village industries workers have incomes above the poverty line, compared to their counterpart in the khadi sector. Though, no attempt is made to compare values of the relevant human development indicators relating to education, health and other areas of concern for the low (khadi workers) and high (village industries workers) earners, it is likely that the level of human development of the families of village industries workers would be more than that of khadi workers. In the field survey of PEO, however, information on the education of 1071 adult members of households of KVIC was collected and it suggests that the literacy rate (68%) of village industries workers is higher than that of the khadi workers (64%).
7.4 Earnings of Workers – by Social Groups
Out of 1071 workers interviewed in the 494 selected households, about 74% belonged to the SC/ST/OBC categories, indicating clearly that the KVIC programme which places emphasis on delivering the benefits to this group, has in fact done so. Here, too, the share (77%) of SC/ST/OBC category of workers in village industries is more than that (71%) of the khadi units.

79
Table 7.7 gives the annual earnings per worker and the share of earnings from KVIC units in total income of the earners.
Table –7.7
Annual Earnings by Social Groups
For SC, ST and OBC For Others Sector Total Income
Per Earner (Rs.) Share of earnings from KVIC (%)
Total Income Per Earner (Rs.)
Share of earnings from KVIC (%)
Khadi 5713 49.82 5568 35.63 Village Industries
7440 60.04 8030 57.54
Average 6588 55.55 6582 46.64 It is noted that the workers belonging to SC/ST/OBC derive a large part of their income from the KVIC programme. In other words, the benefits of the KVIC programme are reaching the target groups, as intended in the REGP.

80
Chapter 8
Summary of the Evaluation Report
8.1 The Programme
During the Freedom Struggle, Mahatma Gandhi, the Father of the Nation, was witness to the grinding poverty of our people, and realised that the poor could not be organised for the struggle, without the problem of hunger, poverty and unemployment being addressed first. He conceived of the development of Khadi and Village Industries (KVI) which involved processing and conversion of agricultural produce into final goods by the villagers/ locals themselves. During the Freedom Movement, the development of KVI was used as an instrument to meet the twin objective of self-reliance through local production and seeking active participation of the poor in the struggle for Independence through removal of hunger and unemployment.
During the initial years of planned development, its potential as an instrument
of poverty alleviation was recognized, and the Government took the responsibility of bringing its development within the framework of Five Year Plans. A Statutory body, called the Khadi and Village Industries Commission (KVIC) was created by an Act of Parliament in 1956. The Commission is required to plan, promote, organize and assist in the implementation of the programme through:
- financing of eligible units; - training of persons for employment; - ensuring supply of raw materials to units/ entrepreneurs; - promotion of sales of khadi and village industries products; and - undertaking research and development activities for the growth and spread
of khadi and village industries.
The KVIC has been implementing the Khadi and Village Industries Programme (the Programme, henceforth) through its regional / State level offices and the Khadi and Village Industries Boards (KVIBs). The state boards (KVIBs) implement about ninety per cent of the village industries programme and receive funds from both KVIC and the state governments. Almost the entire Khadi sector programme and a small part of the village industries programme are being implemented by KVIC directly. Both the KVIC and KVIBs are promotional bodies, which extend a network of institutional, infrastructural and financial support to the Khadi and Village Industries units/ institutions.

81
8.2 The Context
The role of khadi and village industries in the context of the new paradigm of development has been questioned. In particular, the effectiveness of the programme in terms of its employment generation capability, resource use efficiency and sustainability has come under attack from various quarters. The High Power Committee (HPC) under the Chairmanship of the then Prime Minister (Shri P.V. Narasimha Rao) examined the relevant issues and suggested a series of measures in their report (July 1994). Among other things, the HPC recommended for creation of two million additional jobs through additional financial support during 1994-97. To achieve this target, KVIC identified 21 most backward districts in the country with a target of creating 10,000 employment opportunities/district. These districts are in addition to the 50 districts and 125 RPDS blocks selected under the Special Employment Programme (SEP) of KVIC.
8.3 The Study
At the instance of KVIC and Planning Commission, Programme Evaluation Organization (PEO) undertook the evaluation of the performance, adequacy and effectiveness of the implementation mechanism and impact of the KVI programme. The specific objectives of the evaluation study, inter alia, include assessment of:
- performance with respect to production and employment target of two
million jobs during 1994-97;
- performance w.r. to development of infrastructure in the identified areas; - financial performance ; - cost effectiveness of the scheme; and - impact of the KVI programme on the intended beneficiaries.
In addition, the study is required to examine the adequacy of the planning, execution and monitoring aspects of the programme, and suggest measures to improve its performance. The reference period for the study is the entire period of the Eighth Plan (1992-1997).
8.4 Methodology
Construction and testing of the hypotheses relating to the study objectives would require information on the details of scheme parameters, implementing agencies, functioning and operational aspects of the KVIC units/ institutions and socio-economic profile of the beneficiary households. Based on the assessment of available secondary data and discussions with the stakeholders, it was decided to

82
generate the greater part of the data-base through structured questionnaires for the different nodes of the implementing agencies, functionaries of the KVIC units and the beneficiary households. A multi-stage stratified sample design was adopted for the study to select 18 States, 32 blocks in 32 districts, 194 KVIC units/ institutions, and 730 beneficiary households (for details, Chapter-II). The selected sample of KVIC units and beneficiaries included representation from different relevant strata.
8.5 Planning, Implementation and Monitoring Formulation of annual plan involves receipt of proposals from the institutions/ units, their scrutiny at the district and state level, and by banks and KVIC headquarters. Because of the involvement of multiple agencies, inter-agency coordination assumes great importance in planning and implementation of the programme. The guidelines for implementation prepared by KVIC do address these issues by explaining the steps and procedures for project formulation and implementation on the one hand and the role of various agencies on the other. During the Eighth Plan, nearly 95% of the project proposals of the khadi sector and 80% of the village industries sector were accorded approval in the selected states. However, only 37% of the these sanctioned projects could be operationalised during the year of sanction, 5% later during the plan period, and no definite information about the remaining 58% is available with the implementing agencies (see Chapter-3). Why are the sanctioned projects not operationalised? The major constraints as given by the implementing agencies are: non-availability of funds in time (56% of state level agencies), procedural delays (33%), inability of the units to furnish security (22%) and mis-utilization of funds (17%). Does KVIC provide the necessary help to ensure timely implementation of the sanctioned projects? The response received from KVIC (state) offices tends to suggest that while they provide technical guidance to the units, the problems faced by the units are not adequately addressed. This has resulted in closure and inoptimal functioning of the institutions/units, high drop-outs among the new entrants, low employment growth and inefficient use of public resources. Another major weakness in planning is the inadequate linkage between production and marketing. The KVIC seems to believe either in the Law that supply creates its own demand or in a fixed and non-expandable market size for KVI products. It expects that the loyal customers will come to their outlets to pick up the products on display. This passive marketing strategy has resulted in accumulation of stocks, untimely payment to institutions/units whose rebate and investment get locked for years, adversely affecting the economics of production (see chapter-6). The failure in planning and implementation of the programme is also reflected in the inability of KVIC in maintaining an inventory of closed/sick units, ensuring adequate raw material supply, identifying the constraints of the units/institutions and

83
in generating reliable statistics on employment, earnings, production, sales, stocks etc.- all of which provide important management information for planning, implementation and corrective interventions. As will be clear from the analysis of the survey results in the report, the data base with KVIC is not only inadequate, but it also does not reflect the grassroots reality. The system of information generation relies heavily on routine feedback from the units without much verification for accuracy, nor is the available information used for problem solving and appropriate intervention. The entire MIS of KVIC needs overhauling, if planning and implementation are to be oriented towards meeting the primary objectives of the scheme.
8.6 Financial Performance The budgetary support of the Centre constituted more than 80% of the
resources of KVIC till 1994-95, i.e before the implementation of the Margin Money Scheme. During the last two years of the Eighth Plan (i.e. 1995-97), the share of budgetary support came down to around 35%. The other sources of funds for the implementation of KVI programme are the credit form Consortium Banks (since 1995-96) and refunds of unutilized grants and loans. Before 1995-96, more than 50% of the plan expenditure was spent for the khadi sector. Since the introduction of REGP, the khadi sector continued to receive a larger part (32.5%) of the divisible pool of the budgetary support, but a larger chunk (45%) of such resources went to the REGP for which the sectoral break-up between khadi and village industries is not available. Based on the information supplied by the states, the REGP fund was allocated in the ratio of 37:63 between khadi and village industries sector. On a rough estimate, about two-thirds of the budgetary resources during the Eighth Plan went to the khadi sector in the form of ‘grants’, ‘loans’ and ‘interest subsidy’. This bias in allocation in favour of the khadi sector is not commensurate with its performance in terms of employment generation and output (Chapters V and VI).
During the Eighth Plan, allocation to KVI programme was Rs. 1498 crore, as
against the revised budget proposal of KVIC for Rs. 5864 crore. This wide divergence between the “proposals” and “actual allocations” and multiple revisions of proposals point to the weaknesses in the budget formulation processes of KVIC. In Chapters V and VI, an attempt has been made to derive estimates of the relevant (budgetary) parameters that are expected to make the budget making process more realistic and meaningful (Attn. : Planning Commission, KVIC, Ministry).
The financial resources of the Khadi and Village Industries Boards (KVIBs)
which implement about 90% of village industries programme come from KVIC, the state governments (plan and non-plan), banks and refund from its subsidiary units. The shares of alternate sources vary across states (Table 4.11, Chapter IV). In the Eighth Plan, the share of KVIC was more than 50% for Andhra Pradesh, Jammu and Kashmir, Karnataka, Kerala, Meghalaya, Orissa, Rajasthan, Tamil Nadu, Uttar Pradesh and West Bengal, while the share of the state governments was substantial for Assam (89%), Gujarat (52%), Himachal Pradesh (99%) and Tripura (59%). It may however, be mentioned that except in Himachal Pradesh and Karnataka, the actual
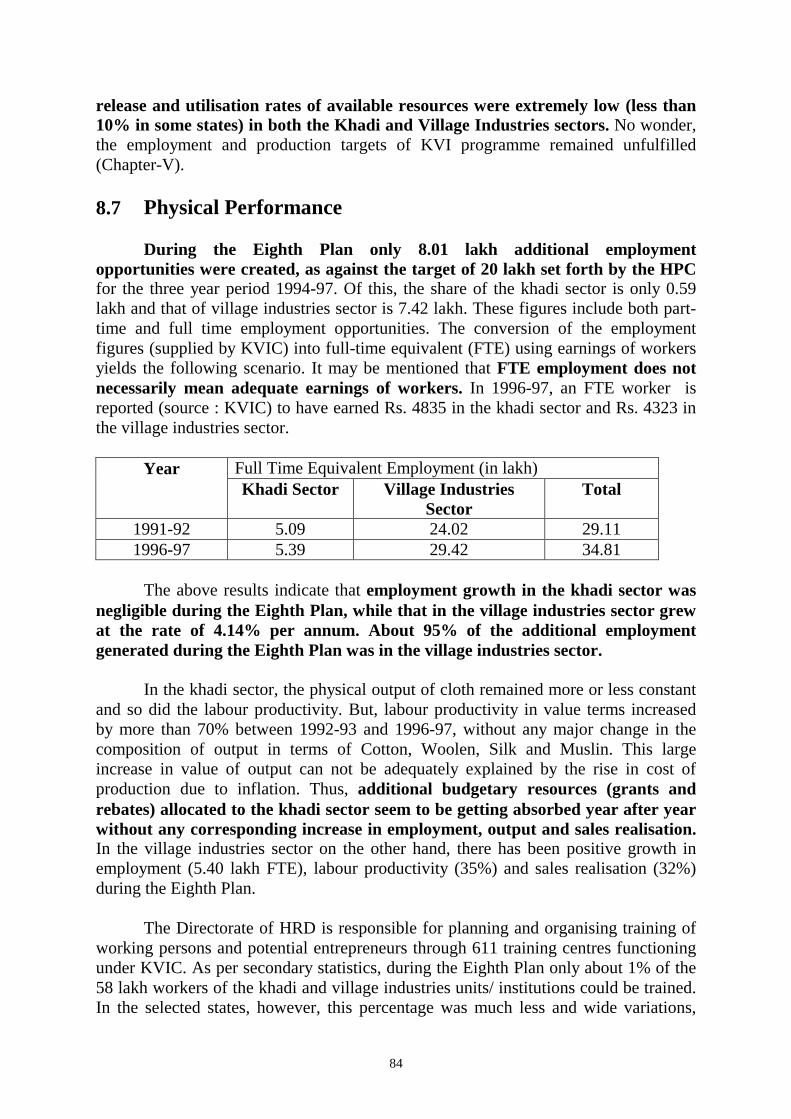
84
release and utilisation rates of available resources were extremely low (less than 10% in some states) in both the Khadi and Village Industries sectors. No wonder, the employment and production targets of KVI programme remained unfulfilled (Chapter-V).
8.7 Physical Performance During the Eighth Plan only 8.01 lakh additional employment opportunities were created, as against the target of 20 lakh set forth by the HPC for the three year period 1994-97. Of this, the share of the khadi sector is only 0.59 lakh and that of village industries sector is 7.42 lakh. These figures include both part- time and full time employment opportunities. The conversion of the employment figures (supplied by KVIC) into full-time equivalent (FTE) using earnings of workers yields the following scenario. It may be mentioned that FTE employment does not necessarily mean adequate earnings of workers. In 1996-97, an FTE worker is reported (source : KVIC) to have earned Rs. 4835 in the khadi sector and Rs. 4323 in the village industries sector.
Full Time Equivalent Employment (in lakh) Year Khadi Sector Village Industries
Sector Total
1991-92 5.09 24.02 29.11 1996-97 5.39 29.42 34.81
The above results indicate that employment growth in the khadi sector was negligible during the Eighth Plan, while that in the village industries sector grew at the rate of 4.14% per annum. About 95% of the additional employment generated during the Eighth Plan was in the village industries sector. In the khadi sector, the physical output of cloth remained more or less constant and so did the labour productivity. But, labour productivity in value terms increased by more than 70% between 1992-93 and 1996-97, without any major change in the composition of output in terms of Cotton, Woolen, Silk and Muslin. This large increase in value of output can not be adequately explained by the rise in cost of production due to inflation. Thus, additional budgetary resources (grants and rebates) allocated to the khadi sector seem to be getting absorbed year after year without any corresponding increase in employment, output and sales realisation. In the village industries sector on the other hand, there has been positive growth in employment (5.40 lakh FTE), labour productivity (35%) and sales realisation (32%) during the Eighth Plan. The Directorate of HRD is responsible for planning and organising training of working persons and potential entrepreneurs through 611 training centres functioning under KVIC. As per secondary statistics, during the Eighth Plan only about 1% of the 58 lakh workers of the khadi and village industries units/ institutions could be trained. In the selected states, however, this percentage was much less and wide variations,

85
from a high of 1% in Maharashtra to a low of 0.01% Uttar Pradesh, were observed (Table 5.11). It was also noted that the training programmes are not designed keeping in view the employment situation/potential of the various sectors. Thus, during the Eighth Plan, 38% of khadi and 62% of village industries workers were trained, whereas their share in employment was 25.4% and 74.6% respectively. Similarly, 24.5% of the trainees were from Engineering and Non-Convention Energy industries which employ only 5% of the workers, whereas the share of agrobased industries which employ more than one-fifth of workers was 10.7% in the total number of workers trained in the Eighth Plan. The khadi and village industries can face competition from organised industries only through continuos upgradation of their products and technological improvements. Regular training by competent staff must be imparted to the artisans through a wide network of training institutions. The present study has not examined the functioning of the training institutions, but has noted that existing training methods and practices are not effective. It is felt that a comprehensive evaluation of KVI training institutions be conducted and the necessary steps be taken to revamp and reorient these so that training helps contribute to labour productivity and development of khadi and village industries.
8.8 Cost of Job Creation/Maintenance Derivation of cost norms for job creation and maintenance is beset with problems, primarily because of various types of part time employment in khadi and village industries units, multiple sources of funds and the practice of accounting followed by KVIC. Several assumptions had to be made and primary data from the units had to be used to standardise the definition of employment and circumvent the problems relating to financial flows for derivation of the cost of job creation from secondary data. On the basis of the analysis of primary data collected from KVI units, it is found that:
- average public cost of job creation in the khadi sector is Rs. 27,259 /FTE (Full Time Equivalent) job;
- average cost of job creation in the village industries sector is Rs.
43,366/FTE, to which the contribution of the government is estimated at Rs. 38,775;
- annual public cost of maintaining a job in the khadi sector is estimated
at Rs. 4979/FTE. Thirty three (33) percent of this amount comes in the form of ‘grant’ from KVIC, 61% as interest subsidy on loans, and the rest is the cost of administering the programme;

86
- annual public cost of maintaining a job (FTE) in the village industries sector is Rs. 2158;
- as per statistics maintained by KVIC, the estimated annual earning per
(FTE) worker in the khadi sector is Rs. 4835 and that in the village industries sector is Rs. 4323 (at 1996-97 prices). However, survey data revealed that an FTE worker in the khadi sector earned Rs. 2740/annum, while no major difference from secondary data was noted in the case of village industries sector. The government pays about 182% of the wage bill to the khadi sector and 50% of the wage bill of the village industries sector. These estimates may be taken as the delivery costs of maintaining jobs created in the KVI programme;and
- in aggregate terms the annual public cost of maintaining 5.084 lakh (FTE)
jobs in the khadi sector comes to around Rs. 253 crore, while it is Rs. 601 crore for maintaining 27.83 lakh (FTE) jobs in the village industries sector.
8.9 Economics of Khadi Production
On an average, a sample khadi unit was found to have machinery and equipment worth Rs.4,96,305, invested Rs. 61,39,744 in working capital and employed about 246 FTE workers during 1997-98. An average khadi unit generates a surplus of Rs. 5987 per FTE worker under the present pattern of financing. However, this surplus is not translated into profit, as the entire production of the unit is not sold during the year. The average unintended stock build-up is around 35% of the annual production, and for small units, it is as high as 80%. The economics of khadi production will work out very differently if the inventory of finished goods could be reduced to, say, 5% of annual production. In such a scenario, a khadi unit will generate a profit of Rs. 5131/FTE worker or more than Rs. 12.6 lakh as total profit for the unit.
Another area of concern is the high raw material to output ratio. For some units, the
ratio is as high as three-fourth. A ratio of more than 25% is neither justified, nor sustainable. While large khadi units have been able to keep their input –output ratio low (less than 20%), most of the medium and small units have shown very high ratio – implying high input prices, or dominance of production of lower count khadi items, or both.
The third area of concern brought out by the survey results is the low wage payment to workers. As per secondary statistics brought out by KVIC (on the basis of the returns from the units), the average annual earning of a full time worker was Rs. 4835 in 1996-97. However, our analysis shows that an FTE worker got only Rs. 2740 during 1997-98. Not only is this earning much less than what is reported in secondary statistics but, it also forms a relatively small proportion of the value added by an FTE worker. It is also important to note that the opportunity cost (of sustaining khadi production) to the government in the form of grants, concessional loans and rebate works out to Rs. 4979/ annum per FTE worker. This implies that only 58% of what the government spends on a khadi unit reaches the khadi workers.

87
8.10 Economics of Village Industries Units
On an average, a village industry unit invested Rs. 6,97,940 and employed 16.2 FTE workers. As per MMS pattern of financing, 25% of this investment is government grant, 65% loan and 10% own contribution. The composition of capital observed among the sample units, however, shows much higher proportion of own capital, because of difficulties in obtaining concessional loan of under CBC. The village industries units are commercially viable and capable of sustaining themselves without much government subsidy. The average wage payment to an FTE worker is almost 58% higher than that in the khadi sector. The government bears only 50% of the wage bill of Village Industries units implying positive contribution by Village industries to the social goal of generating employment opportunities at low public cost. 8.11 Profile of Beneficiaries & Impact
One objective of the study is to examine if the benefits of KVIC programmes
are flowing to the intended beneficiaries and contributing to their well being. For this purpose, 1071 workers from 494 households were approached. The PEO field teams also interviewed 158 key persons (presidents/ secretaries) and 78 ordinary members of institutions/units. The findings are as follows:
- The workers of KVIC units/institutions were found to be mostly poor,
disadvantaged, illiterate and local people. The REGP was designed to attract this group.
- The annual per capita income of the beneficiary households (workers) is Rs.
5655 and the earnings from KVIC programme constitute 52.71%. The income of an average village industries worker’s family is 70% more than that of a khadi workers’ family. The khadi workers’ families get 46% of their annual earnings from KVIC programme, while the village industries workers’ families earn about 58%. The relatively low income of khadi workers’ families is because of the dominance of part-time employment in the khadi sector.
- More than two-thirds of the 494 sample households (workers) originally
belonged to the families below the Poverty Line. Of these poor households, about 71% have actually crossed the poverty line with the help of additional income from the KVIC programme. Here too, the performance of the village industries sector (80.5%) far outweighs that of the khadi sector (62.3%).
- A comparison of the household expenditure patterns of the workers of the
khadi and village industries sector suggests that high earnings from KVIC have enabled the beneficiary households to spend a lower proportion of income on food and a relatively high proportion on education, health and

88
clothing (Table 7.6). Thus, the programme has contributed towards improvement in the wellbeing of beneficiaries.
- The key persons (presidents/secretaries) are also direct beneficiaries of the
KVIC programme. The average annual income of such households is estimated at Rs.73,598 at 1996-97 prices. Analysis of survey data reveals that more than 50 per cent of the household income of the key persons comes from the KVIC programme (See Table 7.3). This happens even though there are 3 to 4 earners in such families. While such a situation can be explained in the case village industries, the share of income from the unit seems very high in the case of the khadi sector.
- The non-working members of the governing bodies of the units/ institutions
also receive financial benefits from the programme. On an average 15% of their annual household income of Rs.70072 comes from the KVIC programme. About one-fifth of the earners of such households in case khadi, and one-fourth in case of village industries units were found to be employed in the units/institutions.
8.12 Suggestions
The khadi and village industries programme holds great potential for
generating gainful employment opportunities for the rural poor, arresting migration of rural unskilled workers to urban areas and for promoting the strategy of sustainable development. It can also be a viable and effective social safety net to enable the poor to ward off the adverse impacts of structural adjustment and economic reforms on their wellbeing. However, this potential can not be realised without addressing some basic weaknesses with regard to the design and implementation of the programme and without making it fiscally sustainable.
The evaluation study has brought out a number of weaknesses of the scheme in
each area of operation of KVIC. In fact, KVIC has spread its net too wide and has got involved in areas of operations where it has very limited expertise and which can be better done by other government agencies and the private sector. Because of this imbroglio and all pervasive weaknesses in its implementation, the programme warrants major changes in policies and implementation methods.
1. The very first aspect of the programme that merits attention at the highest
decision-making level is to examine whether it would not be more appropriate to have two separate implementing agencies for the khadi and village industries. It is proposed that the KVIC may be reorganised into two separate organisations, e.g. the “Khadi Commission” and “Village Industries Commission” with suitable representation from the respective associations of institutions/units. It may be mentioned that about 90% of village industries programme is currently being implemented by the State KVI Boards. Thus, such a division of responsibilities is very much in tune with the present implementation mechanism. The division of

89
responsibilities will help avoid much of the mix-up that has taken place, and fix accountability for the performance of each sector. At the state level, the khadi units/institutions of KVIBs can be brought under the purview of the ‘Khadi Commission’ and the KVIBs may be renamed as “Village Industries Boards.”
2. The Khadi Commission may be brought under the Ministry of Textiles while the
Village Industries Commission may continue to work under the Ministry of Small Scale and Agro and Rural Industries. The advantage of bringing the khadi sector in the Textiles Ministry will be manifold. First, the subsidy on mill-made yarn supplied to the Handloom Sector can be eliminated by meeting the yarn requirement of both Khadi and Handloom sectors from a common source, viz; the khadi sector. The spinning activities in the khadi sector have however, to be reorganised and strengthened for such large scale production of hand-spun yarn. This would involve supply of improved Charkhas to millions of spinners, supply of adequate raw material (sliver or, rovings) at reasonable prices, and a mechanism to ensure steady supply of yarn to the Handloom Sector. Secondly, for supply of adequate quantity of raw material (sliver/rovings) to the spinners, the under-utilized NTC mills can be used, as the supply from KVIC’s Sliver Mills will be inadequate to meet of the requirement. Thirdly, it holds the potential for raising rural employment opportunities manifold. It may, however, be mentioned that the Textile Ministry needs to be sensitized about the potential of the reorganised Khadi and Handloom sectors. The Khadi Commission also needs to be given the autonomy it needs to translate this vision into reality.
Corrective Measures for the Village Industries Sector:
3. No major changes are suggested for the design and implementation of village industries programme. Under the existing mode of financing, the units are viable and are contributing to the social cause of generation of gainful employment opportunities with justifiable level of fiscal support. However, since there is scope for improvement in certain areas of operation as also for reducing the public spending on job creation/maintenance, the following measures are suggested.
- The Village Industries Commission should extend the necessary help to
enable the village industries to expand the market at home and abroad. In the domestic market, the village industries products may be standardised and sold through the various marketing co-operatives/federations rather than through KVIC outlets. For the export market, the Commission should organise special trade-fairs for Village Industries products both in India and abroad to enable the units to display their products and innovations.
- The Village Industries units encounter difficulties in obtaining the CBC
financing facilities, even though their repayment record is good. The new Commission should look into the various aspects and put in place a mechanism that would ensure easy financing facilities for approved schemes.

90
- The existing monitoring mechanism of KVIC is very weak, as it does not
help generate realistic picture of employment, production, number of functional units and utilisation of government assistance. The new Commission should strengthen the monitoring system for generation of reliable information with the provision for periodic joint inspection of certain percentage of the village industries units.
Corrective Measures for Khadi Sector: The primary concern under the khadi programme should be to ensure that
production of goods actually takes place on a sustainable basis, so that its main objective of generating employment opportunities for the unskilled/ rural poor is met. The quantity and quality of employment are not satisfactory at present, because of low and shrinking production base. Factors, such as unintended stock build-up, constraints to input availability, capital of institutions/units getting locked up for years, non-availability of improved technologies and repair facilities, outmoded product mix etc. have all contributed in different degrees to the present sorry state of affairs.
4. The first and foremost requirement is thorough overhaul of the marketing
strategy for khadi products. Product development and marketing need a professional approach. The present policy of retail sale of khadi products through KVIC outlets and through the own effort of the units must be done away with, as it has led to unintended inventory build-up, malpractices and unsustainable and unjustifiable public spending (rebate, grants). Even the attempts to boost sales using khadi as a brand name is unlikely to succeed unless some fundamental changes are brought about.
One way of addressing this issue is to leave the entire marketing and product
development to the private sector, while the semi-processed goods be produced by the KVI units/institutions under the guidance and supervision of KVIC as at present. However, the existing method of supervision and intervention followed by KVIC must be changed, as it is ineffective and does not contribute to the primary objective of the scheme.
Production and employment bear a direct functional relationship. The primary task
of the Khadi Commission (KC) under the new regime should be to closely monitor the flows of input and output. This will automatically ensure generation of employment opportunities. The Commission should be made accountable for maintaining the input-output relationship. It should suitably reorient itself to undertake this task.
5. It is, therefore, proposed that the organisational structure of the proposed khadi
commission be reoriented to ensure that: (a) the khadi units’ raw material requirement is met at pre-fixed prices (reasonable prices) (b) the entire production (as per new cost charts) is received back as per certain quality standards. (c) the units may be prevented from undertaking processing and any retail sale of khadi products and, (d) upon receipt of

91
output, The Commission must make prompt payment to the khadi units to enable them to plough back the money, so that the process of production and employment generation does not get affected adversely. To make this possible, it is necessary to link availability of concessional funds to units with the delivery of output.
6. Rationalize the cost structure of Sliver Mills through better capacity utilisation and other measures of cost control, including purchase of raw materials at fair prices. If the sliver supply from its own mills is inadequate to meet the demand of the institutions, KC can enter into an agreement with the under-utilized NTC mills to supply adequate quantity of better quality sliver for the institutions. The KVIC must ensure that entire raw material requirement of the units/institutions is met at the lowest possible price and that the entire output produced is delivered to it is as per cost-chart.
7. KVIC should not undertake any retail sale of khadi products. Instead, the entire
unprocessed khadi products be sold to the private sector either at cost price or, on auction, keeping cost-price as the floor price. The auction of khadi products should take place in the presence of the representatives of the units/institutions to ensure transparency. This would also give an opportunity to the units/institutions to learn about the market demand for their products. The product development and marketing of khadi products can be left to the private sector. The details of this approach to marketing of khadi products need to be carefully worked out to ensure its viability and sustainability.
8. The reorganisation and reorientation of KC should be done keeping in view the role it has
to play in the new scenario. It should concentrate on:
- technological upgradation and diffusion to continually raise labour productivity and improve product mix of units. The allocation to R&D must be substantially raised and the representatives of the units/institution should be involved in R&D activities for this purpose;
- ensuring supply of raw material and other inputs to all units at fixed
(reasonable) terms;
- ensuring delivery of output by the units to KC as per cost charts and inputs supplied, by linking release of concessional funds to delivery of output;
- imparting training to artisans and technicians more effectively than being done
at present. The entire cost of such training should be borne by the Commission. KC should also provide the necessary financial help to the units /institutions to bring about an improvement in the hygienic conditions of the work places (such as providing pollution mask for khadi workers);
- the monitoring of input delivery, output quality, assessment of needs of the units
in response to changes in market demand;and
92
- developing an appropriate MIS to get market information feedback from the private sector on the desired product mix, output quality, demand pattern and respond to the changes by reorienting production pattern of the units; and the like.
In the new scenario, no rebate on sale is necessary and the units should be run purely on the basis of bank finance (CBC). The concessional bank finance may be linked to actual production and delivery of output.
9. It may be necessary to constitute a Committee to examine the feasibility of the proposed model and to suggest suitable measures for restructuring of KVIC and its various activities, so that the primary objective of the scheme is realised with justifiable level of fiscal support. It is learnt that some specialist organisations (TISS and Arthur Andersen) are already studying various aspects of the scheme. The Committee may look into the findings of these reviews/studies along with those of the PEO’s evaluation study to arrive at a decision on restructuring of the programme and KVIC.

93
Study Team
Project Directors Shri D. Das Director Dr. S. M. Sirajuddin Senior Research Officer HEADQUARTERS Technical Team
1. Shri Balwinder Pal EI.Gr.I 2. Shri Pyare Lal EI. Gr.I 3. Shri V.K.Sharma EI. Gr.I. 4. Shri B.L.Rangroo EI. Gr.I 5. Smt. Prem Lata EI. Gr.II 6. Shri Dharmender Singh Sajwan Tabulation Clerk 7. Smt. Nalini Borkar Tabulation Clerk 8. Shri K.P.Kalshyan Tabulation Clerk
Stenographic and Computer Assistance 1. Shri Ramesh Datta PA 2. Smt. Neera Kapoor PA
Coordination Assistance 1. Shri Ram Singh Senior Research Officer (TC) 2. Shri K.L.Kathuria SRA (TC) 3. Shri H.S.Bunker S.L. & I.A. (PEO Lib.) 4. Shri Bhoop Singh Supervisor (Photostat Unit) 5. Shri Chander Datt Photostat Equipment Operator

94
Field Team - PEO Field Units
Regional Evaluation Offices/Project Evaluation Offices
Officer Incharge Field Staff Sl. No.
Regional Evaluation Office/Project Evaluation Office
Name Designation Name Designation
1 2 3 4 5 6 Sh.B.B.Das Dy.Adviser EI Gr.I REO,Calcutta,
West Bengal Sh. S. Ganguli Sh. H.K.Naskar
S.R.O. R.O.
Sh.D.Barla Mrs. C.Bose EI Gr. I
EI Gr.I PEO, Bhubaneshwar, Orissa.
Sh.R.C.Dey P.E.O. Sh.N.C.Samal Sh.S.Routray EI Gr.I
1.
PEO, Guwahati, Assam. Sh.D. Khound Sh.H.K.Hajong
S.R.O. R.O.
Sh.A.K.Thakur Sh. L.N. Kachari Sh. P.K. Dutta
EI Gr.I EI Gr. II EI. Gr. I
Dy.Adviser EI Gr.I REO, Chandigarh.
Shri Yash Pal
Sh. C.S.Verma Shri Om Prakash EI Gr. II
EI Gr.I
2.
PEO, Shimla, Himachal Pradesh.
Shri Rajesh Thakur
P.E.O. Sh.R.P.Singh Sh.Chander Bhan EI Gr.II
EI Gr.I Mrs. Sarayu Aiyengar
Director EI Gr. I
3. REO, Chennai, Tamil Nadu, PEO, Tiruvananthapuram, Kerala.
Smt.R.Verghese Smt.A.Sreeja
S.R.O. R.O.
Shri G.Subramany Sh. P.S.Raghavan Sh. P.J.Radhakrishnan EI Gr.I
EI Gr.II
EI Gr.II EI Gr.II
REO, Hyderabad, Andhra Pradesh
Shri M. Mathisekaran Shri B.C. Narasimhulu
Director R.O.
Sh.C.G.Deshmukh Sh.M.Kanthaiah Sh.G.Kullayappa Sh.C.Venkaiah EI Gr.II
EI Gr.I EI Gr.I
4.
PEO, Bangalore, Karnataka.
Shri Shivanand S. Ajur
P.E.O. Sh.Rajkumar Sh.K.V.Suresh Sh.Chandersha EI Gr.II
EI Gr.I REO, Jaipur, Rajasthan EI Gr.II
EI Gr.I EI Gr.I EI Gr.II
5.
PEO, Bhopal, Madhya Pradesh.
Shri Om Prakash Dy.Adviser Smt.S.K.Choudhary Sh.P.C.Yadav Sh.Virendra Singh Sh.S.K.Sutradhar Sh.Amar Chand Sh.A.C.Sheikh EI Gr.II
EI Gr.I Ms. Sangeeta Verma
Dy. Adviser REO, Lucknow, Uttar Pradesh
Sh.G.R.Khanna R. O.
Sh.R.S.Rawat Sh. A. Bhatnagar EI Gr.I
6.
PEO, Patna Shri Kamala Pandey
P.E.O. Sh. A K. Singh L.D.C.
EI Gr.I EI Gr.I EI Gr.I
REO, Mumbai, Maharashtra
EI Gr.II EI Gr.I EI Gr.II
7.
PEO, Ahmedabad, Gujarat.
Smt. Nutan Raj Dy.Adviser Sh. B.R.Gawali Ms.D.N.Mothaghare Sh.P.G.Kulkarni Sh.D.K.Bangar Sh.D.J.Kushwah Sh.K.P.Bhatt Sh.A.R.Dodiya EI Gr.II