Embed Size (px)
Citation preview

Evaluation Study on ‘To Review the Unreasonable Increasing Trend of
Power Subsidies being provided to Agriculture Sector’
A
Report
Submitted to
Department of Economic and Statistical Analysis (Government of Haryana)
By
Dr. Kulwant Nehra
Assistant Professor, RBI Chair
Centre for Research in Rural and Industrial Development (CRRID) Plot 2A, Sector 19‐A, Madhya Marg, Chandigarh‐160019
2014

ACKNOWLEDGEMENT
We are grateful to the Government of Haryana for providing endowment fund under the
scheme ‘Institute for Research & Development’ to conduct research studies on various issues
related to Haryana. The present study entitled ‘To Review the Unreasonable Increasing Trend
of Agriculture Power Subsidies being provided to Agriculture Sector’ has been sponsored by
the Department of Planning, Government of Haryana.
I am grateful to Dr. Rashpal Malhotra, Executive Vice-Chairman, CRRID, for his consistent
encouragement and inspiration. I am very thankful to Professor Sucha Singh Gill, Former
Director General, CRRID for encouragement, stimulating deliberations & constructive
comments on various drafts of the study.
I am obliged to Dr. Satish Verma, RBI Chair Professor, CRRID for his consistent support and
co-operation in the conduct of this study.
My sincere thanks are due to Dr. R.S. Ghuman, Professor, Nehru SAIL Chair and Dr. S.S.
Sangwan, Professor, SBI Chair, CRRID for their valuable comments and suggestions, which
really enriched the study. My special thanks are due to Dr. Krishan Chand, Associate
Professor, CRRID, for his consistent guidance, support and critical views on various crucial
issues relevant to the study.
My special thanks are due to Professor Surinder Kumar, Director, Giri Institute of
Development Studies (GIDS), Lucknow (Uttar Pradesh) for his consistent encouragement,
guidance and critical comments at various stages of the study. My thanks are due to my
friend Dr. Rajesh Kumar, Assistant Professor, Maharshi Dayanand University, Rohtak
(Haryana) for his valuable comments and suggestions on the study.
I am grateful to Mr. Yashpal Bhagat, Former Special Secretary Finance, Government of
Haryana for his valuable inputs on various issues related to the study. I am thankful to Mr.
R.K.Bishnoi, Director, Department of Economic & Statistical Analysis (DESA), Government
of Haryana, Yojana Bhawan, Panchkula for his consistent support & encouragement. I am
also put on record my appreciation to Mr. Anand Prakash, Deputy Director, for giving useful
inputs for the study.
My thanks are due to the Additional Deputy Commissioners (ADCs) of the districts
Bhiwani, Jind and Karnal as well as the village functionaries for extending co-operation to
the field investigators in collection of data. I also put on record my appreciation for the co-
operation of the respondents who provided requisite information to our field investigators.

I am also thankful to Superintending Engineers (SEs) and supporting staff (Circle Head
Draftman) of operating circles of Bhiwani, Jind and Karnal for providing the relevant
information. My special thanks are due to Dr. A.S. Dhindwal, Sr. Agronomist & Head,
Department of Agronomy, CCS Haryana Agriculture University, Hisar for providing very
useful data/ information for the study. I am also thankful to comrade Surender Malik for
exploring contacts of relevant persons in different districts for the study.
My thanks are due to Mr. Sunil Kumar (Research Assistant) and Mr. Vijay Kumar, Mr.
Sandeep Hooda and Mr. Rupesh Kumar all field investigators, for their help in data
compilation and tabulations for the study.
I am thankful to the entire staff of Administration, Library and Account Section, CRRID for
their co-operation and sincere help during the study. My thanks are due to Mr. Gurjot Singh,
Office Assistant, RBI Chair, CRRID for his support at various stages of the study.
Needless to say, any error or emissions that remain are my sole responsibility.
Dr. Kulwant Nehra Assistant Professor RBI Chair, CRRID,
Chandigarh.

Contents
Sr. No. Particulars Page No.
Evaluation Study on Unreasonable Increasing Trends in Power Subsidies being provided to Agriculture Sector
1-59
Acknowledgement
Contents i
List of Tables ii-iii
List of Graphs iii
Chapter I Introduction 1-6
1.1 Background 1-4
1.2 Objectives of the Study 4
1.3 Research Methodology and Data Base 4-6
Chapter II Technical Performance of Haryana Power System 7-18
2.1 Milestones of Power Sector Reforms in Haryana 7-8
2.2 Technical Performance of the Power System in Haryana 9-14
2.3 Electricity Consumption Pattern in Haryana 14-15
2.4 Transmission and Distribution Losses in Haryana 15-17
2.5 Fatal & Non Fatal Accidents in Haryana 18
2. 6 Conclusion 18
Chapter III Pricing Policy and Financial Performance of Haryana
Power System
19-23
3.1: Pricing Policy and Financial Performance 19-21
3.2 Implications of Agriculture Power Subsidy to State Finances
22-23
3.3 Conclusion 23
Chapter IV Perception of Agricultural Households regarding Agriculture Power Subsidy
24-43
4.1 Classification of Sampled Households and their Cropping Pattern
24-29
4.2 Estimation of Wasteful Consumption of Resources 29-30
4.3 Impact of Electric Tube well Utilisation on Production and Productivity of the Crops
30-32
4.4 Environmental Impacts of Electric Tube well Utilisations 32-35
4.4 Impact of Electric Tube well Utilisation on Cost of Production
35-36
4.5 Awareness, Preferences, Problems and Suggestions in relation to Electric Tube well Utilisations
37-42
4. 6 Conclusion 42-43
Chapter V Summary, Conclusions and Policy Recommendations 44-57
References and Bibliography 58-59
List of Tables
Sr. No. Particulars Page No.
Table 1 Major Milestones of Power Sector Reforms in Haryana 7-8
Table 2.1 Haryana Plan Expenditure on Energy Sector 9
Table 2.2 Generation Installed Capacity (MW) of Power in Haryana 10
Table 2.3 Demand and Supply of Power in Haryana 11
Table 2.4 Performance of HPGCL 12
Table 2.5 Station-wise Operational Performance 12
Table 2.6 Station-wise Auxiliary Consumption 13
Table 2.7 Station-wise Oil Consumption 13
Table 2.8 Station-wise Heat Rate 14
Table 2.9 Electricity Consumption Pattern in Haryana 15
Table 2.10 Utility-wise Distribution Losses 16
Table 2.11 Fatal and Non Fatal Accidents in Haryana 18
Table 3.1 Average Cost of Supply and Average Revenue Realised in Haryana
21
Table 3.2 Total Agriculture Power Subsidy Paid and as a share of TRR, OTR and GSDP in Haryana
22
Table 3.3 Share of Expenditure on Power Subsidy and Social Sectors in GSDP
23
Table 4.1 Classification of the Households on the basis of Operational Land Holdings
24
Table 4.1a Category-wise Percentage Distribution of Land Holdings at All India and Haryana
24
Table 4.2 Cropping Pattern for the Sampled Households 25
Table 4.3 District-wise category wise Cropping Pattern for the Sampled Households during Kharif Season
26
Table 4.4 District-wise category wise Cropping Pattern for the Sampled Households during Rabi Season
26-27
Table 4.5 Category-wise Cropping Pattern for the Sampled Households in Kharif Season
27
Table 4.6 Category-wise Cropping Pattern for the Sampled Households in Rabi Season
28
Table 4.7 Crop-wise details of Number of times of Irrigation Required and Number of times of Actual Irrigation with tube-well per acre in Kharif Season
29
Table 4.8 Crop-wise details of Number of times of Irrigation Required and Number of times of Actual Irrigation with tube-well per acre in Rabi Season
30
Table 4.9 Impact of Tube-well Utilisation on Production and Productivity of Major Crops for the Sampled Households in Kharif Season
31

Table 4.10 Impact of Tube-well Utilisation on Production and Productivity of Major Crops for the Sampled Households in Rabi Season
31
Table 4.11 Major Factors Responsible for Increase in Productivity of Crops per acre as given by the Sampled Households (multiple response)
32
Table 4.12 Category-wise Purpose-wise Tube-well Utilisation by the Sampled Households (multiple response)
33
Table 4.13 Environmental Impacts of Tube-well Utilisation as given by the Sampled Households (multiple response)
33
Table 4.14 Reasons for Water Table Depletion as given by the Sampled Households (multiple response)
34
Table 4.15 Reasons for Soil Degradation as given by the Sampled Households ( multiple response)
35
Table 4.16 Impact of Tube-well Utilisation on Total Cost per acre and Average Cost of Production of Major Crops for the Sampled Households in Kharif Season
36
Table 4.17 Impact of Tube-well Utilisation on Total Cost per acre and Average Cost of Production of Major Crops for the Sampled Households in Rabi Season
36
Table 4.18 Motor Capacity-wise Average Expenses of Electric Tube-well Connection for the Sampled Households
37
Table 4.19 Major Issues in Relation to Electric Tube-well as given by the Sampled Households (multiple response)
38
Table 4.20 Category-wise Awareness regarding Technological Innovation for Electricity Saving and Water Harvesting among the Sampled Households
39
Table 4.21 Category-wise Preferences for Mode of Agriculture Power Subsidy Payment as given by the Sampled Households (multiple response)
39
Table 4.22 Category-wise Preferences for Electricity Bill Payment System as given by the Sampled Households
40
Table 4.23 Category-wise Awareness/ Preferences as given by the Sampled Households about Solar Irrigation System
41
Table 4.24 Category-wise Major Suggestions as given by the Sampled Households (multiple response)
41
List of Graphs
Sr. No. Particulars Page No.
Graph 2.1
Percentage Share of Various Sources in Total Installed Capacity
10

1
Chapter I Introduction
1.1: Background
The Indian energy sector is today at a crucial juncture of development. With growing
economy, the aspiration of people for improved energy services in terms of availability,
accessibility, quality and affordable power have been raised in a big way.
Under various Five Year Plans, power sector was provided the highest priority
amongst all the sectors of the economy in relation to the resource allocation. The share of
energy sector in total plan allocation was about thirty percent and its more than two-third was
allocated to the power sector.
It is well accepted proposition that adequate supply of energy is a pre-requisite for
successful implementation of any economic development strategy and electricity is the most
versatile form of energy. India’s electric power sector is in a serious financial crisis. Despite
impressive achievements in terms of physical expansion and its contribution in making
energy available for various economic activities, it could not generate adequate financial
resources to meet even a part of its investment requirements. Presently, the Central and State
governments are also expressing helplessness to spare financial resources for investment in
the power sector.
Electricity as infrastructure is of key importance to accelerate the process of economic
development, it was realised that power should be made available at a reasonable price. It has
to be noted that the power sector exerts a critical influence on the performance of the
agricultural sector in India as it influences farmers’ access to and use of electricity for a
variety of agricultural operations, particularly for pumping groundwater. The price of
electricity supplied to agriculture sector in most of the states is heavily subsidized. These
subsidies have contributed to the financial crisis in the state utility, reducing its ability to
undertake required investments to respond to rising local demand and to maintain a smooth
and reliable service. For the agricultural sector, the supply of electricity has been
characterized by rationing, frequent power interruptions, and voltage fluctuations that raise
the real cost of electricity to farmers and affect their production activities in several ways.
As a result of overall shortages, power supply to agriculture is heavily rationed in
Haryana particularly. The three-phase power supply required to operate electric pumps is

2
typically ostered amongst the various electricity feeders for a specified number of hours
during the day and night. Given this situation, the following two aspects of power supply are
likely to be important from the farmers’ perspective. First, the total number of hours of actual
availability of power (both during scheduled and unscheduled period), on an average at the
farm level, every day during each season. This aspect will be referred to as the “availability”
of power supply. The second aspect relates to the “unreliability” of actual supply and will be
defined as the total duration of power cuts during the scheduled hours of power supply. An
important reason for power cuts during scheduled periods of power supply is frequent
transformer burnouts. Poor quality increases farmers’ costs for three reasons. First, low
voltage implies that water delivered by the pump per unit of time is reduced, other things
remaining the same. Second, poor quality also leads to motor burnouts. Apart from the costs
of getting the motor rewound, production activities need to be readjusted and there is
potential loss of output in the time period it takes to get the motor reinstalled. Poor quality of
supply may also cause the electricity transformer to fail, further interrupting the supply of
power until the time it takes to repair it. Third there is also some evidence to suggest that
given the poor quality of supply, farmers tend to select robust motors that have thicker
armature.
Agrarian transformation in Punjab & Haryana under the Green Revolution strategy
generated tremendous demand for power in agriculture sector. Despite that Haryana being
close to Delhi, the national capital, industrialisation and urbanisation spread in areas located
in the national capital region at relatively faster pace. Punjab & Haryana is based on peasant
proprietorship and therefore, increase in production and productivity in agriculture has
enhanced the purchasing power of almost all the sections of the society which gave a boost to
the commercial activities in the States. The accelerated growth in the wide range of economic
activities was made possible by a very high growth in energy consumption by various
categories of consumers.
Overtime, with society acquiring higher levels of Industrial development, now the
major share of electricity consumption in the society is in industry and agriculture where it is
used as energy input. Use of energy as a factor of production is a commercial proposition.
Obviously, this use should be governed by the sound economic principles as its supply
involve resource use, which cost money for which someone has to pay. Who pays and who
should pay must be made transparent.

3
Since early seventies, the state governments adopted certain policies like highly
subsidised supply of electricity to the farmers for irrigation in the agricultural sector at a flat
rate. The electricity was usually not metered. These two policies, the subsidised supply at a
flat rate and unmetered supply played havoc with financial management and administration
of the power sector. The political leadership indulged in competitive populism and
announced and provided highly subsidized or free supply of electricity to the farmers. The
major share of benefits has been cornered by the big landlords and the kulaks who were
highly influential and controlled the rural vote banks.
Due to unmetered supply to agriculture, energy accounting system became ineffective
and in fact collapsed. In such a state of affairs when more than half of the electricity supply
was not metered, it was impossible to estimate the actual technical T&D losses and the
pilferage of power. Obviously, the beneficiaries of the unmetered supply had developed a
vested interest in the system to remain unaccountable. A major part of pilferage and theft of
electricity was shown as consumption in the agricultural sector. The Planning Commission
insisted in 1980s that the SEBs must cut their transmission and distribution losses by say one
per cent each year to be entitled to certain incentive schemes and grants, it was conveniently
done on paper by manipulating the data. When in early 1990s wind of change in policy
regime was under consideration, the same government departments/agencies and officers
from the next year started showing T&D losses as much as 30 per cent to 50 per cent in
comparison to 18 to 20 per cent in the previous years (Planning Commission, 2002). It was
conveniently done to provide justification for privatisation as state government in its
management of the SEBs was inefficient. No questions were asked, no accountability was
fixed! The ‘fresh’ wind of change wrapped everything under the carpet.
It needs to be noted that one of the major reasons for undertaking power sector
reforms in Haryana was the very poor technical and financial performance of the distribution
system. As a large number of stake holders are involved in the process, analysis requires a
careful consideration. Distribution of electricity now is being managed in Haryana by the
state through two wholly government owned corporations Uttar Haryana Bijli Vitran Nigam
Limited (UHBVNL) and Dakshin Haryana Bijli Vitran Nigam Limited (DHBVNL). They are
supposed to be managed like independent companies under the company law.
Under reformed regime, it is not expected that the state government will interfere in
day to day functioning of the power system, but there is close nexus among power utility/ies,

4
state government and Regulatory Commission in the state, which has serious implications for
the financial health of power utilities as well as the state government. The power utilities in
Haryana are providing electricity at highly subsidized rates particularly to agricultural
consumers on the directions of the state government and consequently the financial burden of
agriculture power subsidies on public exchequer of the state government has aggravated over
the period, which hampered the growth of various social and economic sectors.
1.2: Objectives of the Study
The proposed evaluation study on unreasonable increasing trends of power subsidies
being provided to agriculture sector tended to highlight the implications of the subsidized
power supply to agriculture sector in the state. The study will focus broadly on three major
aspects, technical efficiency, pricing policy and perception of households regarding
agriculture power subsidies which are very crucial to analyse the issue of increasing trends in
agriculture power subsidies. The major objectives of the study are as follow:
To examine whether the power subsidy to agriculture sector leads to wasteful
consumption of power.
To study the environmental impact of power subsidy to agriculture sector.
To work out the Economic and Social Cost-Benefits analysis of power subsidy.
To find out whether the burden of power subsidy to agriculture sector can be
minimised without curtailing the benefits to the farmers.
To find out suitable alternatives to power subsidy to agriculture sector.
1.3: Research Methodology and Data Base
The study is based on primary as well as secondary data. For primary data collection,
we have adopted multi-stage random sampling technique for selection of agriculture
households. Initially, we collected data on operational circle wise number of agriculture
connections with connected load (BHP) from both the power utilities Uttar Haryana Bijli
Viteran Nigam Limited (UHBVNL) and Dakshin Haryana Bijli Viteran Nigam Limited
(DHBVNL). Then on the basis of agriculture pump-set connections per thousand hectare net
sown area, we selected three operational circles one (Karnal) from Uttar Haryana Bijli
Viteran Nigam Limited (UHBVNL) and Two (Jind and Bhiwani) from Dakshin Haryana Bijli
Viteran Nigam Limited comprising one circle each from the category of the highest, average

5
and the lowest agriculture connections per thousand hectare net sown area. Thereafter, we
have collected information from each selected operational circles regarding sub-division wise
and feeder wise number of agriculture connections with connected load. After selection of
sub-division and AP feeders, we have collected information from selected AP feeders
regarding village wise number of agriculture connections with connected load. Finally we
have made selection of three villages, having the highest number of agriculture connections
from each selected AP feeders from each selected sub- division and operational circle for
survey. A sample size of 540 households was drawn selecting 180 households from each
operational circle. The ultimate agricultural households were selected at random. Care was
taken to include farmers from different categories of land holding so as to nullify the
discrimination effect. The selected households have been classified into five categories on the
basis of land holdings i.e. Marginal farmer (upto 2.5 acres), Small farmers (2.51 to 5.0 acres);
Semi-medium farmers (5.1 to 10 acres), Medium farmer (10.1 to 25.0 acres) and Large
farmers (more than 25 acres). The sample size consisted 28 (5.19 %) Marginal farmers, 131
(24.26 %) Small farmers, 166 (30.74 %) Semi-medium farmers, 159 (29.44 %) Medium
farmers and 56 (10.37 %) large farmers. The data from households was collected with the
help of well designed questionnaire.
Secondary data was collected from various publications of Government of Haryana,
Haryana Electricity Regulatory Commission (HERC), Haryana Power Utilities, Central
Electricity Authority (CEA), Planning Commission and Power Finance Corporation,
Government of India.
To estimate wasteful consumption, we looked into crop wise water requirement in
terms of number of times a crop is to be irrigated and number of times it is irrigated
by the farmer.
To study environmental impact, broadly, we have examined the changes in water
table and soil degradation during a specific period of time.
To conduct cost benefit analysis of power subsidy, we compared average cost of
supply with average revenue realised. We further estimated total amount of subsidy
and its impact on the financial position of the state government.
To find out alternative to reduce the impact of agriculture power subsidy without
curtailing benefits to farmers, we studied the existing pattern of subsidy and thereby
examined the justification for subsidisation to big farmers.

6
The study has been organised into five chapters. The Chapter one deals with
introduction including objectives and research methodology of the study. In Chapter two, we
have discussed the technical performance of Haryana power utility on the basis of certain
technical parameters. The Chapter three analyses the financial performance of the Haryana
power utility with respect to pricing policy. The Chapter four focussed on perception of
households regarding agricultural power subsidies. The Chapter five highlights the major
findings, conclusion and policy recommendations.

7
Chapter II
Technical Performance of Haryana Power System
Haryana State came into existence with the reorganisation of the State of Punjab as on
November 1, 1966. Haryana State Electricity Board (HSEB) was created in May 1967 by
bifurcating the Punjab State Electricity Board (PSEB). HSEB was incorporated as an
integrated utility to discharge the generation, transmission and distribution functions in the
State. Haryana was the second state in India after Odisha to adopt and implement power
sector reforms under the Haryana Electricity Reforms Act 1997 (HERA), enacted in 1997 and
which came into force on 14th August, 1998.
2.1: Milestones of Power Sector Reforms in Haryana
Event Date
Haryana Electricity Reform Bill passed by Haryana Assembly 22.07.1997 Reform Bill Received the Assent of the President of India 20.02.1998 Gazette Notification of the Haryana Electricity Reform Act 10.03.1998 Haryana Electricity Reforms Act came into Force Haryana Electricity
Regulatory Commission (HERC) & Two Corporations (HPGC and HVPNL) were created
14.08.1998
HERC issued two licenses to HVPNL to carry out Transmission and Bulk Supply (License 1 of 1999) and Distribution and Retail Supply (License 2 of 1999)
04.02.1999
Second transfer scheme, transmission business and distribution were separated HVPNL was retained as transmission company while two distribution companies were created, namely i) Uttar Haryana Bijli Vitran Nigam Limited (UHBVN) ii) Dakshin Haryana Bijli Vitran Nigam (DHBVN)
01.07.1999
HERC issued two separate licenses to HVPN to carry on distribution business on Behalf of the two distribution companies namely UHBVN & DHBVN
21.04.1999
Both distribution companies applied for grant of independent regular license
20.07.1999.
HERC issued first order on Annual Revenue Requirement for FY 1999-2000 of HVPNL for the Transmission and Distribution Business
26.11.1999
HVPNL was declared State Transmission Utility (STU) and entrusted with operating SLDC
10.12.2003
Granted Licenses to UHBVN and DHBVN to carry out the business independently in Northern and Southern regions of the state respectively
04.11.2004
Terms and Conditions for Open access for Intra-state Transmission and distribution system (2005)
19.05.2005
Transferred the rights relating to procurement and bulk supply of electricity or Trading of electricity from HVPNL to HPGCL
11.04.2008
Haryana Government transferred the rights relating to procurement of 15.04.2008

8
electricity/UI drawls/dispatches or Trading of electricity from HPGCL to UHBVNL and DHBVNL Terms and Conditions for determination of tariff from renewable energy
sources and Renewable purchase obligations 03.02.2011
HERC issued its 15th Tariff order on ARR of UHBVNL & DHBVNL for their D&RS Business for FY 2013-14 and Distribution &Retail Supply Tariffs for FY 2013-14
30.03.2013
HERC issued its 16th Tariff order on ARR of UHBVNL & DHBVNL for their D&RS Business under MYT Framework for the control period FY 2014-15 to 2016-17 and Distribution &Retail Supply Tariffs for FY 2014-15
29.05.2014
The Haryana Electricity Regulatory Commission was established in August 1998 to
regulate power sector in the State. After enforcement of HERA, two statutory Transfer
Schemes were notified by the Government of Haryana for restructuring the HSEB. Through
the First Transfer Scheme Rules, 1998, the Generation business (undertakings, assets,
liabilities, proceeds and personnel) was separated from Transmission and Distribution
businesses and vested in a separate company viz. Haryana Power Generation Corporation
Ltd. (HPGCL). The Transmission and Distribution businesses were transferred to and
vested in Haryana Vidyut Prasaran Nigam Ltd. (HVPNL). Thereafter, through the Second
Transfer Scheme Rules 1999, the Transmission undertaking and business was separated from
the Distribution undertakings and business. The former was retained in HVPNL as the
Transmission Company, while the latter was further segregated into and vested in two
successor Distribution companies i.e. Uttar Haryana Bijli Vitran Nigam Ltd (UHBVNL) and
Dakshin Haryana Bijli Vitran Nigam Ltd (DHBVNL). UHBVNL was vested with the
Distribution business in the North Zone of Haryana comprising Ambala, Yamuna Nagar,
Karnal, Kurukshetra, Jind, Rohtak and Sonepat circles. The DHBVNL was vested with the
Distribution business in the southern zone of Haryana comprising of Bhiwani, Faridabad,
Gurgaon, Hisar, Narnaul and Sirsa circles. However, in July 2013, Jind circle has been
transferred to DHBVNL.
It becomes pertinent to analyse technical performance of power system in Haryana on
the basis of certain technical parameters in post reform period to find out the efficiency
improvement, if any.

9
2.2: Technical Performance of the Power System in Haryana
The time when HSEB came into existence it had a generation capacity of 383 MW.
The Haryana state neither owns any significant share of natural energy resources like coal,
petroleum etc. nor it has any significant hydropower potential, so it has to depend upon the
thermal power plants for meeting its power needs. The coal is being imported from the other
States of the country like Madhya Pradesh, Bihar, Uttar Pradesh etc. Up till now,
development of thermal power plants was the only option to the State for meeting its power
requirements. Now nuclear option is also being explored.
The state government has allocated large share of its annual budget to power sector in
total plan expenditure all these years. It is shown in the Table 2.1.
Table 2.1: Haryana Plan Expenditure on Energy Sector (Rs. in crore) S. No Particular Total Plan
ExpenditureExpenditure on
Energy % share of Energy
1. 4th Five Year Plan (1967-74) 358.26 87.53 24.43
2. 5TH Five Year Plan (1974-79) 677.34 260.01 38.39 3. Annual Plan (1979-80) 202.95 56.40 27.79 4. 6th Five Year Plan (1980-85) 15995.47 491.62 30.81 5. 7th Five Year Plan (1985-90) 2510.64 639.03 25.45 6. Annual Plan (1990-91) 615.02 155.92 25.35 7. Annual Plan (199-92) 699.39 182.97 36.16 8. 8th Five Year Plan (1992-97) 4889.89 1197.68 24.49 9. 9th Five Year Plan (1997-2002) 11600.00 3305.00 28.49 10. 10th Five Year Plan (2002-2007) 12979.64 1988.79 15.32 11. 11th Five Year Plan (2007-2012) 35000.00 4687.00 13.39
Source: (i) Statistical Abstracts of Haryana (various Issues). (ii) Five Year Plan Documents, Government of Haryana (various Issues)
The Table 2.1 brings out that the share of expenditure on energy has been very
significant and above 25% in various plan periods up to 9th Five Year Plan. However, the
outlays of 10th FYP and 11th FYP drastic decrease was reported in the relative share of the
plan outlay for the power sector. This may be due to policy change after the initiation of
reform process. Since after unbundling, all the corporations have been incorporated under the
Indian Company Act 1956. Now these corporations are entitled to raise required finances
from the market directly according to their requirements. Private sector initiatives were also
encouraged. The other reason may be the direct grant provided by Ministry of Power under
the Accelerated Power Development and Reforms Programme (APDRP) and Rajiv Gandhi
Grameen Vidyutikaran Yojana (RGGVY). It may be noted that the most of the expenditure

10
allocated for energy was expended on the development of the power sector. The funds were
invested in installing generation capacity and network expansion for transmission as well as
distribution purposes. Thus, it shows that development of power sector was given a high
priority during the different plans.
Table 2.2: Generation Installed Capacity (MW) of Power in Haryana (as on 31-01-2013)
State/UT (Utilities)
Source Wise Break up Total %age Share Thermal Hydro Nuclear RES
Coal Gas Diesel TotalState Sector
3160 25 4 3189 885 0 70 4144 40.77
Central Sector
1174 535 0 1709 479 109 0 2297 29.73
Private Sector
1620 0 0 1620 0 0 53 1673 29.50
Total 5954 560 4 6518 1363 109 123 8114 100 %age Share
73.38 6.90 0.05 80.33 16.80 1.34 1.53 100
Source: Central Electricity Authority, Monthly Report, January, 2013 Note: MW- Mega Watt
Graph 2.1: Percentage Share of Various Sources
80%
17%
1%2%
Percentage Share
Thermal Hydro Nuclear RES
Table 2.2 and Graph 2.1 present the composition of total generation capacity in
Haryana. The total installed generation capacity was estimated as 8114 MW as on
31.01.2013, out of which 80 per cent and 17 per cent was sourced from Thermal and Hydro

11
power plants respectively. The share of Nuclear was 1 per cent and Renewable Energy
Sources (RES) 2 per cent.
Due to quite an impressive expansion in the electricity supply system, the availability
of electricity has increased significantly over the years though supply did not keep pace with
electricity demand. It has in fact revolutionised economic development and the green
revolution in the state. However, due to relatively poor technical and financial performance, it
had to be restructured. Haryana state’s own generating capacity is 5300.50 MW (as on
31.01.2013), out of which 98.83 percent is coal based thermal and 1.17 percent is hydro.
Besides the own generating capacity, it also has dedicated shares in the power plants
managed and operated by Bhakra Beas Management Board (BBMB) and Central Power
Undertakings (CPUs) such as NTPC, NHPC and NPC.
Table 2.3: Demand and Supply Scenario in Haryana
Particulars Energy Peak Demand Available (MU)
Demand (MU)
Deficit (%)
Available (MW)
Demand (MW)
Deficit (%)
2007-08 25652 29353 12.6 4821 4956 2.7 2008-09 26625 29085 8.5 4791 5511 13.1 2009-10 32028 33441 4.2 5678 6133 7.4 2010-11 32626 34552 5.6 5574 6142 9.2 2011-12 NA NA NA NA NA NA 2012-13 38209 41407 7.7 6725 7432 9.5
Source: Central Electricity Authority- Annual Reports Note: NA- Not Available, MU- million units, MW- Mega Watt
The Table 2.3 clearly shows that demand exceeds availability of power in the state
both in energy as well as peak demand during most of the period.
Indicators used to evaluate the technical performance of HPGCL are: Plant Load
Factor (PLF), Auxiliary Consumption, Oil consumption per unit of electricity, Station heat
rate in relation to the norms of efficiency fixed by the Central Electricity Authority (CEA)
and Haryana Electricity Regulatory Commission (HERC).
Plant Load Factor (PLF) is considered an important indicator for measuring the
operational efficiency of the thermal generating plants. The average PLFs of Panipat thermal
power system and Faridabad thermal power system have been presented in Table 2.4. In a
state like Haryana which is an electricity deficit state, overall PLF should not be less than
80% (norms set by CERC & HERC).

12
Table 2.4: Performance of HPGCL (2007-08 to 2012-13) Particulars 2007-08 2008-09 2009-10 2010-11 2011-12 2012-13 Installed Capacity (MW) 2187.70 2085.50 2085.50 3230.50 3230.50 5300.50PLF (%) 78.94 75.01 82.93 76.28 71.75 65.39 Auxilliary Consumption (%) 9.93 9.66 9.77 10.06 9.06 8.96 Oil Consumption (ml/kWh) 1.66 2.87 1.61 3.08 2.47 1.78
Source: Tariff order HPGCL 2014-15
Table 2.5: Station-wise Operational Performance (Plant Load Factor) Particulars 2007-08 2008-09 2009-10 2010-11 2011-12 2012-13 Panipat Phase I (Units I-IV) 59.41 57.89 68.38 53.37 63.71 50.82 Panipat Phase II (Units V-VIII)
93.60 91.30 93.40 89.10 89.50 86.09
FARIDABAD THERMAL POWER STATION (165 MW)
49.25 42.61 55.7 - - -
DCRTPP, YAMUNANAGAR
- 69.05 81.35 73.85 61.45 18.33
HPGCL Overall 78.94 75.01 82.93 76.28 66.60 53.65 Source: Tariff order HPGCL 2014-15
By this norm, except for the year 2009-10, the performance may be charaterised as
unsatisfactory during the period 2007-08 to 2012-13. Despite huge investment on renovation
and modernization of PTPS, unsatisfactory state of performance is a matter of concern.
Yamuna Nagar plant has not yet achieved desirable level of performance.
Auxiliary Consumption for a generating station depends on quality of coal it receives
at the feeding point, number of frequent start-ups and shut downs it encompasses and the
ageing of equipment.
Average auxiliary consumption during 2007-08 to 2012-13 consistently declined from
9.93 per cent to 8.96 per cent. Except for 2010-11 (10.06 per cent), it remained less that 10%.
Table 2.6 shows that auxiliary consumption at Panipat Station (Units I-IV) was between the
range 11.40 per cent to 12.62 per cent, which is very high by any standards during 2007-08 to
2012-13. Steps need to be taken to reduce auxiliary consumption, below 8 percent for the
new plants and up to 10 percent for old plants.

13
Table 2.6: Station-wise Auxiliary Consumption (Percentage of Gross Generation)
Particulars 2007-08 2008-09 2009-10 2010-11 2011-12 2012-13 Panipat Phase I (Units I-IV) 12.13 11.48 11.40 12.00 12.54 12.62 Panipat Phase II (Units V-VIII)
8.81 8.8 9.13 9.66 9.80 9.80
FARIDABAD THERMAL POWER STATION (165 MW)
14.82 16.32 16.07 - - -
DCRTPP, YAMUNANAGAR
- 9.33 9.29 9.73 9.34 10.46
HPGCL Overall 9.93 9.66 9.77 10.06 9.06 8.96 Source: Tariff order HPGCL 2014-15
It was observed from the Table 2.7 that the Specific Oil Consumption of PTPS Units
1 - 4 has been very high compared to the norms, due to frequent start up and shut down of
plants as there have been multiple cases of breaking down of the plants. The higher specific
oil consumption has been attributed by HPGCL to frequent start/ stop operations due to
increase in number of tripping. Oil support also necessitated due to receipt of wet coal.
Table 2.7: Station-wise Oil Consumption (ml/kWh)
Particulars 2007-08 2008-09 2009-10 2010-11 2011-12 2012-13 Panipat Phase I (Units I-IV) 2.93 3.33 2.44 5.80 5.56 5.81 Panipat Phase II (Units V-VIII)
0.59 0.80 1.05 2.68 1.25 0.84
FARIDABAD THERMAL POWER STATION (165 MW)
- - - - - -
DCRTPP, YAMUNANAGAR
- 6.32 1.70 2.35 2.24 2.71
HPGCL Overall 1.66 2.87 1.61 3.08 2.47 1.78 Source: Tariff order HPGCL 2014-15
Normal oil consumption may be one or two ml per unit of electricity generated. By
this norm, oil consumption of PTPS (Units I to IV) and DCRTPP have been very high.
HERC in its recent Tariff Order dated 29.05.2014 has highlighted that Station Heat
Rate per kWh of electricity generated in Haryana was very high in comparison to the norms.
The usage of poor quality of coal has led to an increase in the station heat rate as can
be seen in the trend of the past years.

14
Table 2.8: Station-wise Station Heat Rate (Kcal/kWh)
Particulars 2007-08 2008-09 2009-10 2010-11 2011-12 2012-13 Panipat Phase I (Units I-IV) 3470 3425 3225 3349 3211 3126 Panipat Phase II (Units V-VIII)
- 2574 2561 2679 2662 2538
FARIDABAD THERMAL POWER STATION (165 MW)
DCRTPP, YAMUNANAGAR
2571 2450 2387 2479 2414 2395
HPGCL Overall 1916 2762 2684 2728 2686 2608 Source: Tariff order HPGCL 2014-15
It is a matter of great concern that technical efficiency of various thermal power
stations in Haryana was below the norms. A close analysis of tariff orders issued by the
Regulatory Commission clearly highlighted that the average cost of supply from own
generating stations in Haryana was much higher than the average cost of power purchase
from the other sources. This shows that restructuring of the power sector has not made any
significant change or improvement in the performance of the generation system in Haryana.
2.3: Electricity Consumption Pattern in Haryana
Haryana being close to Delhi, the national capital, industrialisation and urbanization
has spread at a relatively rapid pace particularly in the areas located in the National Capital
Region (NCR). The accelerated rate of growth in a wide range of economic activities
afforded a relatively high growth in energy consumption by various categories of consumers.
The consumption of electricity in Haryana grew at a quite high rate. The Table 2.9 reveals the
composition of electricity consumption by various categories of consumers in the state during
the period 2007-08 to 2012-13.
It is pertinent to note that total electricity sale in the state has increased over the
period of time. The Table (2.9) shows that total electricity sale (approved) increased from
17992 MU in 2007-08 to 29218 MU in 2012-13. The domestic and agricultural consumers,
which enjoyed subsidised power supply, jointly captured 49.13 per cent of total electricity
sale in 2012-13 as against 53.14 per cent in 2007-08. The relative share of industrial,
commercial and other sectors was 29.92 percent, 12.72 percent and 8.23 percent respectively
during the year 2012-13. It is also clear from the data that there was a significant difference
between the projection made by the utilities and sale approved by the Regulatory
Commission that needs to look into.

15
Table2.9: Electricity Consumption Pattern in Haryana for the year 2013-14 (MU) Particulars Domestic Commercial Industrial Agricultural Others Total
2007-08 Utilities 3575
(19.83) 1065 (5.91)
4689 (26.01)
7214 (40.02)
1483 (8.23)
18026 (100)
HERC 3923 (21.80)
1349 (7.50)
5401 (30.02)
5639 (31.34)
1680 (9.34)
17992 (100)
2008-09 Utilities 3642 (18.71)
1286 (6.61)
5753 (29.56)
6016 (30.91)
2768 (14.22)
19465 (100)
HERC 4765 (22.65)
1679 (7.98)
6544 (31.11)
4789 (22.76)
3261 (15.50)
21038 (100)
2009-10 Utilities 4115 (18.95)
1520 (7.00)
5056 (23.29)
8722 (40.18)
2297 (10.58)
21710 (100)
HERC 4055 (19.88)
1395 (6.84)
5722 (28.06)
7474 (36.65)
1749 (8.58)
20395 (100)
2010-11 Utilities 5649 (19.50)
1948 (6.72)
8485 (29.29)
8624 (29.77)
4262 (14.71)
28968 (100)
HERC 5338 (21.01)
1828 (7.19)
8249 (32.47)
7473 (29.41)
2519 (9.91)
25407 (100)
2011-12 Utilities - - - - - - HERC 5950
(21.15) 2071 (7.36)
10286 (36.56)
6787 (24.12)
3044 (10.82)
28138 (100)
2012-13 Utilities 7438 (22.19)
4316 (12.88)
9524 (28.41)
9769 (29.14)
2472 (7.37)
33519 (100)
HERC 6835 (23.39)
3716 (12.72)
8742 (29.92)
7520 (25.74)
2405 (8.23)
29218 (100)
Growth Rate of sale approved by HERC (2007-08 to 2012-13)
11.74 22.47 10.11 5.93 7.44 10.18
Source: HERC-Tariff Orders of various years. Note: Utilities- Sale projections, HERC- Sale approved. We measure electricity consumption on the basis of sales approved by the Haryana Electricity Regulatory Commission.
It is also observed that the demand of electricity for industrial sector grew at a growth
rate 10.11 per cent which is less than that of domestic (11.74 per cent) and commercial (22.47
per cent) sectors. It happened mainly due to non-availability of quality power at reasonable
prices along with uncertain power cuts. Hence, the industrialists were forced to fall back
more and more upon captive plants to continue production in a smooth manner.
The actual estimation of agriculture sector was not possible due to un-metered supply.
The data regarding agricultural consumption should be used with caution.
2.4: Transmission and Distribution Losses (T&D losses)
Energy losses consist of technical losses and commercial losses. Technical losses
occur due to inherent characteristics of the generation, transmission and distribution system

16
whereas the commercial losses are the result mainly of power theft &pilferage and poor
recovery rates of billed sales revenue from the consumers.
The 2.10 presents total distribution losses as a proportion of energy available for sale
in distribution companies. It is necessary to underline that the figures of Transmission &
Distribution losses were remained on higher side which is a matter of concern.
Table 2.10: Utility-wise Distribution losses in the utilities (%age) Year UHBVNL DHBVNL 2007-08 28.56 27.54 2008-09 27.02 25.19 2009-10 25.92 26.97 2010-11 33.30 22.95 2011-12 31.20 23.71 2012-13 31.26 22.01
Source: HERC -Tariff Order for distribution business for FY 2013-14 Note: UHBVNL- Uttar Haryana Bijli Vitran Nigam Limited, DHBVNL- Dakshin Haryana Bijli Vitran Nigam Limited.
The data highlights that distribution losses were consistently at higher levels. There
was a little progress in case of DHBVNL in reducing the losses. However, it may be noted
that none of the company has completed 100% metering at consumer ends. Unless all the
electricity supply including supply to agricultural sector is fully metered, authentic estimates
of T&D losses are difficult to make.
In the post- reforms period the Commission has put pressure on the power distribution
companies to estimate power consumption in agriculture sector on the basis of realistic
average running hours of irrigation per pump-sets. The Commission has also highlighted that
the power distribution companies neither have data on the actual energy consumption nor the
correct BHP rating of the pumps as no instrument was placed to record the same. Therefore,
it may be pointed out that the figures shown in official records were only an ‘intelligent’
guess and not the accurate data as more than 60 per cent electricity supply to agriculture
sector was un-metered. In the tariff order issued for the year 2010-11, the Commission has
observed that both of the distribution companies have failed in reducing the distribution
losses within acceptable limits.
While supplying electricity to a consumer it is expected that it will be metered and the
consumer will be asked to pay as per the tariff approved by the HERC. There may always be
some unscrupulous elements who may temper with the meters or have direct supply from the

17
lines and indulge in pilferage & theft of power. In mid 1970s, it was decided not to meter
supply to agriculture consumers as installation of meters and recording of consumption was a
problem and there will be no revenue loss if electricity is supplied at a flat rate. But non-
metering of electricity opened a flood gate of corruption and non accountability. Thereafter,
nobody could know how much was the actual consumption and how much was the theft in
the agriculture sector.
Now various stakeholders have developed a vested interest not to let full metering
take place despite HERC repeated directives to do the needful as early as possible. Many a
times, dead lines have been violated. It may be noted that there is no dearth of resources to
accomplish the task. There is an active nexus among the influential farmers who do not want
to install meters to continue being unaccountable, corrupt employees and the political
patronage.
The Commission, in its tariff order for the year 2013-14, clearly mentioned with
serious concern that despite claims of the Distribution Licensees that they were making huge
capital investments to reduce distribution losses, the position has not improved much from
the inception of these companies.
Both the Discoms had segregated their agricultural supply feeders in the year 2009-
10. As such their AP consumption for FY 2011-12 & FY 2012-13, was estimated by the
Commission on the basis of actual consumption recorded on segregated AP feeders during
FY 2010-11 and FY 2011-12, after adjusting a loss factor of 16 per cent. It is felt that the
increase in AP sale should be commensurate with the increase in connected load. The
Commission observesd that this mismatch could be because of the following reasons:-
The claim of the Discoms that 100% feeders have been segregated into AP feeders does
not seem to be true.
The claim of UHBVNL that there is no load other than the AP load on segregated AP
feeders does not appear to be correct. Similarly the quantum of non-AP load connected
on segregated AP feeders, intimated by the DHBVNL also seems to be an under
estimation. It clearly indicates that there are non-AP load on segregated AP feeders
which is increasing at an exorbitant rate every year. This is one of the reasons for very
high growth in AP sales year after year (Tariff order 2013-14).

18
2.5 Fatal & Non Fatal Accidents in Haryana
Fatal and non fatal accidents have also tended to increase cost of supply. In this section
we have tried to examine the status of fatal and non fatal accidents.
Table 2.11: Fatal and Non fatal Accidents in Haryana Sr.No. FY Human Beings Animals Total
Fatal Non-fatal Fatal Non-fatal Fatal Non-fatal 1 2007-08 95 138 142 0 237 138 2 2008-09 133 160 226 2 359 162 3 2009-10 124 146 205 0 329 146 4 2010-11 125 134 174 0 299 134 5 2011-12 138 127 141 0 279 127
Source: Tariff Order 2013-14
The Table 2.11 shows that the number of accidents has been unacceptably high. The
HERC has argued that high incidents of accidents not only results in loss of human and
animal life but also causes financial loss to the utility in the shape of avoidable compensation
payable to victims and legal expenses. It tends to increase in cost of supply and also
adversely affects the moral and confidence of the workmen.
2.6: Conclusion
It may be argued that over the period the state government has devoted a significant
amount of funds for the growth of power sector in the state. Despite the impressive expansion
of the sector, the technical performance was not satisfactory. There is an urgent need to
improve technical efficiency of power utilities through ensuring transparency, accountability
and public participation. The utilities must ensure 100 per cent metering at consumer ends,
particularly agricultural consumers on priority basis so that precise estimation of electricity
consumption and level of transmission & distribution losses may be made. In the absence of
proper metering in agriculture sector, the actual amount of subsidy cannot be precisely
estimated.

19
Chapter III
Pricing Policy and Financial Performance of Haryana Power System
In this Chapter we have examined the exiting pricing policy and financial
performance of the power sector in Haryana.
3.1: Pricing Policy and Financial Performance
As per existing tariff policy in Haryana, various categories of consumers were being
charged tariff at different rates (Tariff Order for the FY 2013-14). Moreover, the tariff
structure was not uniform across the categories of consumers. The tariff structure for
domestic consumers has a slab system on the basis of electricity consumption. There were
three slabs: the first slab covered the electricity consumption upto 40 units per month. The
second slab covered the consumption levels between 40 units to 300 units per month and
third slab was applicable for the consumption above 300 units per month. The industrial
power supply has been classified into two groups, L.T. and H.T. In the case of agricultural
supply, tariff structure has two options, per unit charges for metered supply and flat rate
system as Rs. /BHP/ month for unmetered supply.
It may also be highlighted that some consumer categories (commercial and industrial)
were being charged tariff rates consistently at higher rates than the domestic & agriculture
consumers without any socio-economic rationale. Charging certain consumer categories at a
price which was significantly less than its cost of supply encourages wasteful consumption
and loss of revenue to the power utilities. Due to lower revenue realisation, there were regular
hikes in tariffs of both subsidising and subsidised categories of consumers. With the tariff
hike for the power supplied to subsidising category particularly industrial consumers, they
move towards alternative power supply provisions such as captive power generation or power
purchase using open access mechanism. This implies that tariff rates do not have any
systematic relationship with the cost of supply. Socio- economic and political considerations
appear to have played crucial role in the formation of tariff structure. Obviously, State
Governments compelled the power utilities to follow certain pricing policy but it abdicated
from its responsibility to compensate the utilities keeping them in a perpetual financial crisis
(Surinder Kumar, 1999). This requires a reconsideration of the relationship between
electricity undertakings and the state governments on the one side and the rationale for a
pricing policy and subsidisation of certain consumers on the other. Irrational pricing policy

20
has its serious implications for the utility/ies as well as the state economy. To ensure financial
viability of the system, the tariff rates must reflect cost of supply.
The World Bank (2001)1 found that most poor farmers in Haryana would agree to a
rise in power tariff if accompanied by the improvement in the quality of power supply.
Secondly, it was doubtful whether power subsidies have had a specific effect on poverty
reduction. The study pointed out that providing highly subsidized but poor quality power to
agriculture was an impediment to agricultural and income growth. Due to the erratic electric
power, farmers’ costs – particularly in the purchase of unnecessarily high-powered electric
pumps and back-up or alternate diesel pumps and in the repair of pumps that burn out – were
notably higher than they would be if supply were reliable and voltage steady. Indirect costs
also flow from the time lost in repairing equipment and the timeliness lost in getting water to
crops when it was needed most. Moreover, power subsidy was mis-targetted as it benefitted
much more the large farmers who used groundwater for irrigation as compared to small
farmers. The present pricing regime based on a flat rate structure results in higher electricity
prices for the small farmers compared to large farmers because of their lower level of
consumption. The electricity subsidy exclusively benefits electric pump owning farmers,
especially the semi- medium to large farmers, as they predominantly own the electric pumps
and account for the larger share of electricity consumption.
It has been observed from a close analysis of tariff orders issued by the Haryana
Electricity Regulatory Commission (HERC) that the Commission has failed to work out a
realistic and progressive tariff structure reflecting consumer category wise cost of supply that
may target a reduction of cross-subsidy.
In order to bring out the extent of subsidisation or surplus, we have carried out a
comparative analysis of the average cost of supply and average revenue realised for the
period 2007-08 to 2012-13.
1 World Bank. 2001. India: Power Supply to Agriculture, Washington D.C.: World Bank

21
Table 3.1: Average Cost of Supply and Average Revenue Realised in Haryana Items 2007-
08 2008-
09 2009-
10 2010-
11
2011- 12
2012- 13
Average Cost (Paise/ kWh) 463.03 543.14 578.46 533.64 527.42 533.19Average Revenue Realised (Paise/ kWh) 274.73 323.02 337.90 336.12 398.41 340.13Per Unit gap (Paise/ kWh) 188.3 220.12 240.56 197.52 129.01 193.06Cost Recovery Ratio (%) 59.33 59.47 58.41 62.99 75.54 63.79 Average Revenue realised from Agriculture (Paise/ kWh)
37.72 40.18 35.84 35.03 37.69 31.99
Cost Recovery From Agriculture (%) 8.15 7.40 6.20 6.56 7.15 6.00 Per Unit subsidy for agriculture (Paise/ kWh) 425.31 502.96 542.62 498.61 489.73 501.20Total Agriculture Subsidy paid (Rs. in crore) 2560 2999 2771 2940 3577 3974* Source: HERC- Tariff orders for various years, PFC- Report on the performance of state power utilities for the years 2004-05 to 2006-07 and 2008-09 to 2010-11. Note: *-Based on average cost of supply 562 paise/kWh
The Table 3.1 presents the average cost of supply and average revenue realised in
Haryana. Average cost of supply (combined) increased from 463.03 paise per unit in 2007-08
to 578.46 paise in 2009-10 and it reduced to 533.19 paise per unit in 2012-13. Whereas the
average revenue realized from consumers increased from 274.73 paise per unit to 337.90
paise per unit and further to 340.13 paise per unit during the corresponding period.
Meanwhile, the cost recovery through revenue realisation continued to be low. It was 59.33
percent in 2007-08 that increased to 75.54 percent in 2011-12, but it perceptibly reduced to
63.79 percent in 2012-13. It shows that the revenue realised per unit of electricity did
increase over the time but it was inadequate to meet the cost, whereby the average revenue
realised was consistently lower than the cost of supply. There was not even a single year in
which the average revenue was greater than the average cost of supply.
The Table 3.1 further highlights that average revenue realised from agricultural
consumers was 37.75 paise in 2007-08 which reduced to 31.99 paise in 2012-13. During the
period under consideration average revenue realised from agricultural consumers remained
less than even 41 paise per unit. Consequently, the amount of per unit subsidy to agricultural
consumers has increased from 425.31 paise per unit in 2007-08 to 542.62 paise per unit in
2009-10 and further reduced to 501.20 paise per unit in 2012-13. In fact recovery of user cost
from agricultural sector significantly reduced from 8.15 percent in 2007-08 to 6.00 percent in
2012-13. As a result, the amount of total subsidy for agricultural consumers has significantly
increased from Rs. 2560 crore in 2007-08 to Rs. 3974 crore in 2012-13, which has serious
implications for the state economy.

22
3.2: Implications of Agriculture Power Subsidy to State Finances
The analysis of pricing policy and financial performance of electricity distribution
companies (DISCOMs) in Haryana present a very contrasting picture. There is hardly any
relationship between cost of supply and average revenue realised. It may be pointed out that
the reform process did not lead to improve recovery of cost which was one of the important
objectives of the reforms. Increasing amount of subsidisation on account of almost free
supply of electricity to the agricultural consumers has serious implications for the state
finances.
Table 3.2: Total Agriculture Power Subsidy paid and as a share of TRR, OTR and GSDP in Haryana
Year Total Subsidy Paid(Rs. in crore)
Subsidy as %age of TRR
Subsidy as %age of OTR
Subsidy as %age of GSDP
2007-08 2560 12.96 22.03 1.69 2008-09 2999* 16.25 25.73 1.64 2009-10 2771 13.20 20.96 1.24 2010-11 2940 11.50 17.51 1.12 2011-12 3577 11.71 17.54 1.17 2012-13 3974 (7.60)** 10.51 16.36 1.13
Source: CAG: Annual reports for various years. RBI: State Finances: A study of Budgets for various years. Note: TRR- Total Revenue Receipts, OTR- Own Total Receipts, GSDP- Gross State Domestic Product,*: including the amount of rural electrification, **- annual compound growth rate.
Table 3.2 presents the amount of total power subsidy paid by the state government
and its relation with some crucial financial indicators during the period 2007-08 to 2012-13.
The total amount of power subsidy to agriculture increased from Rs. 2560 crore in 2007-08 to
Rs. 3974 crore in 2012-13 representing a growth rate of 7.60 percent per annum. Subsidy as a
share of Total Revenue Receipts of the state was 12.96 per cent in 2007-08 which increased
significantly to 16.25 per cent in 2008-09 mainly due to increase in the amount of rural
electrification. After the year 2008-09, the share of agricultural subsidy in total revenue
receipts has declined to 10.51 per cent in 2012-13, however in absolute amount it has been
continuously increasing. It may be pointed out that higher amount of subsidy leaves smaller
amount of revenue with the state government for meeting developmental and other socio-
economic responsibilities. The share of total own tax revenue cornered by agriculture power
subsidy was more than 16 per cent during most of the period under consideration. For the
year 2012-13, the share of agriculture subsidy in total own tax revenue was 16.36 per cent.
Similarly, the share of subsidy in Gross State Domestic Product (GSDP) remained in range of
1.13 per cent to 1.69 per cent during the period 2007-08 to 2012-13.

23
Table 3.3: Share of Expenditure on Power Subsidy and Social Sectors in GSDP
(per cent) Year Power Subsidy Medical and Public
Health Welfare Water Supply and Sanitation
2007-08 1.69 0.35 0.30 2008-09 1.64* 0.40 0.36 2009-10 1.24 0.46 0.33 2010-11 1.12 0.41 0.33 2011-12 1.17 0.36 0.44 2012-13 1.13 0.49 0.33
Source: CAG: Annual reports for various years. RBI: State Finances: A study of Budgets for various years. Note: GSDP- Gross State Domestic Product,*: including the amount of rural electrification.
Table 3.3 presents expenditure on power subsidy and social sectors as a proportion of
GSDP during the period 2007-08 to 2012-13. It is very interesting to reveal that the share of
agriculture power subsidy was much higher than that of expenditure on medical services and
the supply of clean water & sanitation. It implies that agricultural power subsidy has been
financed at the cost of crucial social sectors. Failure to target health and sanitation services
was probably the main cause for lower Human Development Indices in Haryana.
3.3: Conclusion
On the basis of above analysis, it may be pointed out that power has been supplied to
agricultural consumers at highly subsidised rates without any socio-economic rationale. Such
an irrational pricing policy has adversely affected the financial position of the utilities/
DISCOMs as well as the state government. In wake of insufficient availability of resources,
power utilities were forced to raise loans from the market at higher interest rates for meeting
its working capital expenditure which in turn enhanced the future liabilities of DISCOMs on
account of interest payment and repayment of loans. This burden has been borne by non-
agriculture consumers in terms of regular tariff hikes. Moreover, the amount of power
subsidy has been increasing continuously which enlarged the bill of committed expenditure at
the cost of social sectors. Higher amount of committed expenditure leaves lesser resources for
making quality expenditure in the hands of the government that reflected in terms of poor
HDI indices on the one hand and rising levels of Revenue Deficit and Fiscal Deficit on the
other.

24
Chapter IV
Perception of Agricultural Households regarding Agricultural Power Subsidy
In this chapter, we have analysed the perceptions of agricultural households regarding
various aspects in relation to agricultural power subsidy.
4.1: Classification of Sampled Households and their Cropping Pattern
Table 4.1: Classification of Households on the basis of Operational Land holdings Particulars No. of Households
Marginal Farmer (upto 2.5 Acres) 28 (5.19) Small Farmer (2.51 to 5.0 Acres) 131 (24.26) Semi- Medium Farmer (5.1 to 10.0 Acres) 166 (30.74) Medium Farmer (10.1 to 25.0 Acres) 159 (29.44) Large Farmer (more than 25 Acres) 56 (10.37) Total 540 (100) Source: Field Survey, 2014 Note: Figures in brackets indicate percentage to total
The Table 4.1 presents the composition of the households on the basis of operational
land holdings. The total sample size of 540 households was selected comprising 28 (5.19 per
cent) marginal, 131 (24.26 per cent) small, 166 (30.74 per cent) semi-medium, 159 (29.44
percent) medium and 56 (10.37 percent) large farmers. The majority of households were in
the categories of semi-medium and medium farmers (5.1 to 25 acres) which presents more
than 60 per cent stake. The share of marginal and small farmers in total sample size was
29.44 per cent whereas that of medium & large farmers was 70.56 per cent.
Table 4.1a: Category-wise Percentage Distribution of Land Holdings All India and Haryana Particulars Marginal
(≤ 2.5) acres Small (2.5 -5.0) acres
Semi- medium (5.0 -10.0 ) acres
Medium (10.0 - 25.0) acres
Large (>25) acres
All India 67.10 17.91 10.04 4.25 0.70 Haryana 48.11 19.47 17.55 12.04 2.83 Beneficiaries of agriculture power subsidy in our sample*
5.19 24.26 30.74 29.44 10.37
Source: Agriculture Census 2010-11 Note: *- The classification of beneficiaries was the composition of our sample size of 540.
The Table 4.1a highlights that the combined share of marginal and small land
holdings was 85.01 per cent for all India and 67.58 per cent for Haryana whereas that of
29.45 per cent in our sample. It has been clearly indicated that main beneficiaries of
25
agriculture power subsidy in Haryana are Medium & Large farmers who occupied 70.55 per
cent share in total sample size (540).
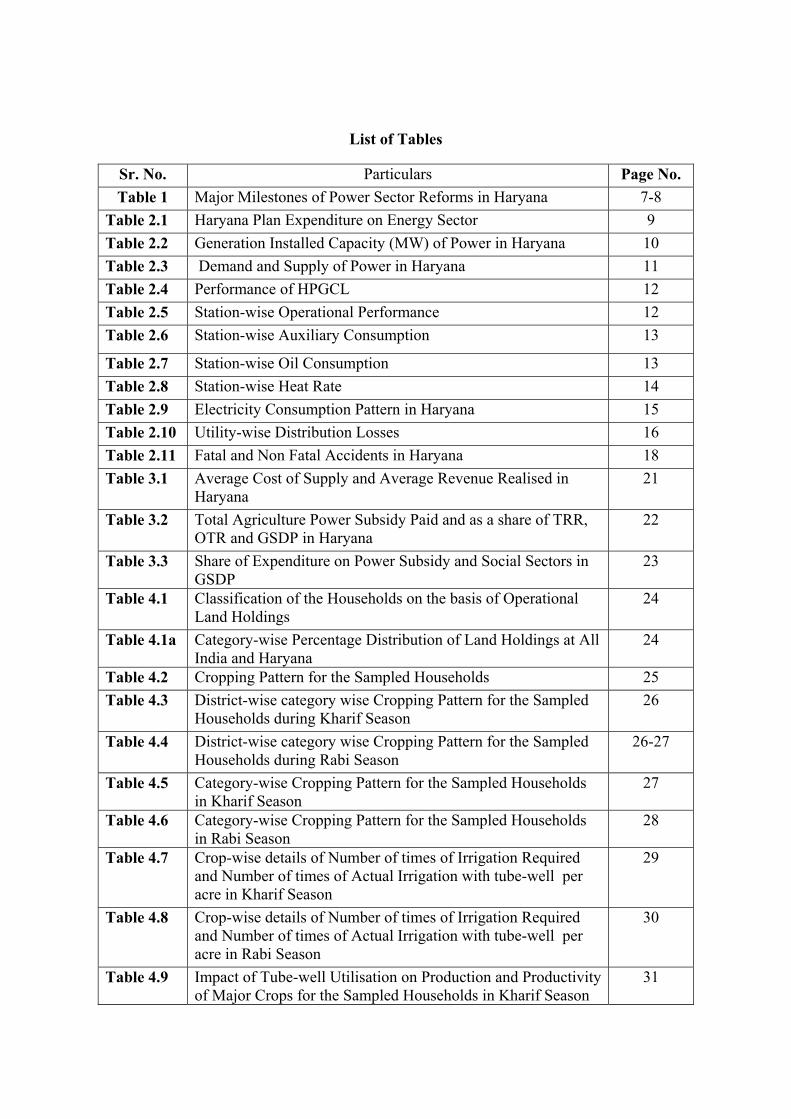
Table 4.2: Cropping Pattern for Sampled Households S.No Pre Tube-well Installation Post Tube-well Installation
Kharif Season Crop Area (acre) Crop Area (acre)
1 Paddy 4183.75 Paddy 4188.25 2 Cotton 646.00 Cotton 766.50 3 Bajra 582.50 Bajra 582.50 4 Fodder 266.25 Fodder 266.25 5 Gwari 478.50 Gwari 478.50 6 Pulses 28.00 Pulses 28.00 7 Maize 2.00 Maize 2.00 8 Total 6187.00 Total 6312.00
Rabi Season 1 Crop Area (acre) Crop Area (acre) 2 Wheat 5038.50 Wheat 5171.00 3 Oilseeds 624.50 Oilseeds 742.50 4 Sugarcane 290.50 Sugarcane 290.50 5 Fodder 235.50 Fodder 235.50 6 Pulses 123.00 Pulses 123.00 7 Barley 5.00 Barley 38.00 8 Vegetable 2.00 Vegetable 2.00 9 Total 6319.00 Total 6602.50 Source: Field survey, 2014
Table 4.2 exhibits the cropping pattern during Kharif and Rabi seasons for the
sampled households. The major crops in Kharif season were paddy, cotton, gawari, bajra and
fodder. Whereas wheat, oilseeds, sugarcane, pulses and fodder were the main crops in Rabi
season. It needs to be noted that wheat paddy rotation is prominently prevailing in Haryana,
except southern districts. The area under cotton cultivation perceptibly increased after
installation of tube-well whereas there was marginal increase in the area under paddy
cultivation.
During Rabi season two crops, wheat and oilseeds, also showed an increase in area
under cultivation after installation of tube-well. It needs to be highlighted that the cropping
pattern during Kharif and Rabi seasons remained more or less the same even after installation
of tube-well in the study area whereas only an increase in area under cultivation of some
specific crops appeared.

26
District-wise category-wise cropping pattern has been presented in Tables 4.3 and 4.4.
Table 4.3: District-wise category-wise Cropping Pattern in Kharif Season Particulars Marginal Farmers
Paddy Cotton Bajra Gawari Fodder Bhiwani √ √ √ Jind √ √ √ Karnal √ √ Small Farmers Bhiwani √ √ √ √ Jind √ √ √ Karnal √ √ Semi- Medium Bhiwani √ √ √ √ Jind √ √ √ Karnal √ √ Medium Bhiwani √ √ √ √ Jind √ √ √ √ Karnal √ √ Large Bhiwani √ √ √ √ Jind √ √ √ √ Karnal √ √
Source: Field Survey, 2014
The Table (4.3) reveals that bajra, cotton, fodder and gawari are the major crops in
district Bhiwani. Paddy and fodder were the main crops in district Karnal whereas in district
Jind paddy, cotton, bajra and fodder remained the major crops during kharif season across the
categories. It is well established proposition in literature that crop diversification took place
with size of land holdings. In district Bhiwani, cotton and gawari cultivation increased with
size of land holdings. In district Jind cotton and bajra cultivation appeared as the size of land
holdings increased. In case of district Karnal the cropping pattern remained the same and
only area under the cultivation increased with the size of land holdings.
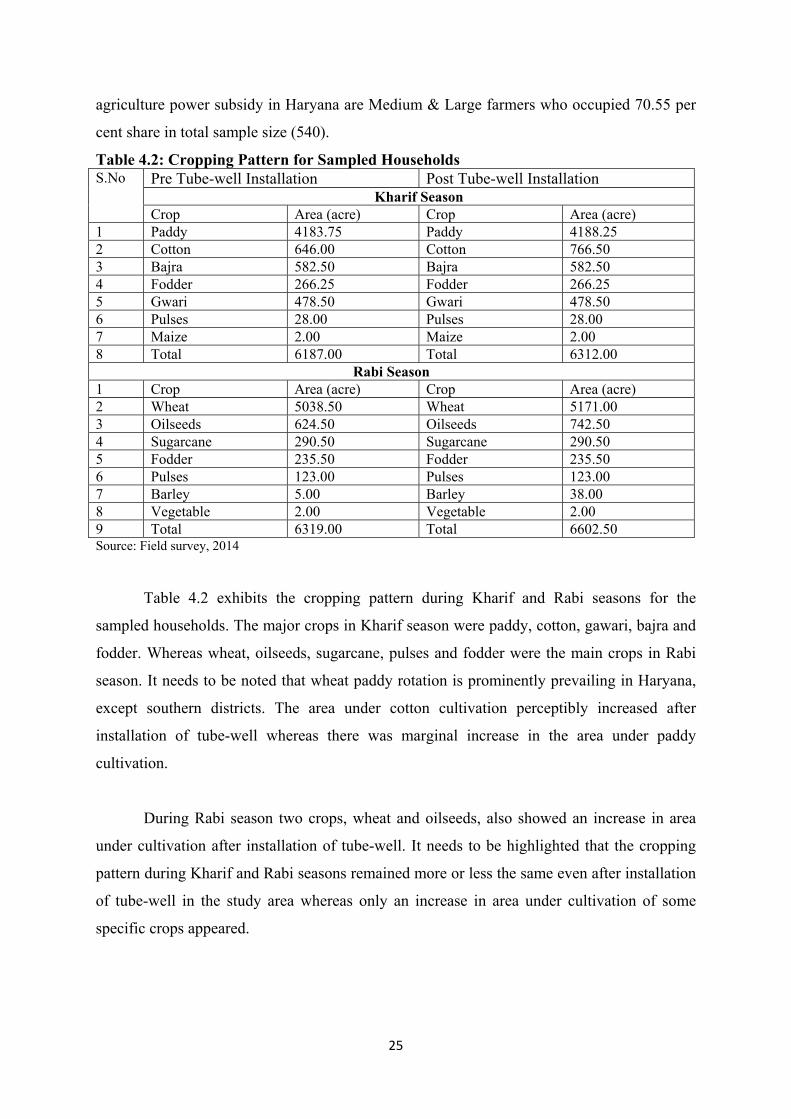
Table 4.4: District-wise category-wise cropping pattern in Rabi Season Particulars Marginal Farmers
Wheat Oilseeds Sugarcane Pulses Fodder Barley Bhiwani √ √ √ Jind √ √ Karnal √ √ Small Farmers Bhiwani √ √ √ √ Jind √ √ Karnal √ √ Semi- Medium Bhiwani √ √ √ √ Jind √ √ Karnal √ √
27
Medium Bhiwani √ √ √ √ √ Jind √ √ √ Karnal √ √ √ Large Bhiwani √ √ √ √ √ Jind √ √ √ Karnal √ √ √ Source: Field Survey, 2014
Table 4.4 clearly exhibits that wheat and fodder were the main crops during Rabi
season across districts and farmer categories. Sugarcane cultivation was adopted by only
medium and large farmers in districts Jind and Karnal. In district Bhiwani, medium and large
farmers adopted oilseeds and pulses cultivation along with wheat and fodder.
Table 4.5: Category-wise Cropping Pattern in Kharif Season (acre) Particulars Pre Tube-well Installation Post Tube-well Installation
Crops Area (acre) Crops Area (acre) Marginal Paddy 25.25 Paddy 25.25
Cotton 17.00 Cotton 17.00 Bajra 5.50 Bajra 5.50 Gawari 4.00 Gawari 4.00 Fodder 3.00 Fodder 3.00
Small Paddy 353.50 Paddy 358.00 Cotton 67.00 Cotton 81.50 Bajra 56.00 Bajra 56.00 Gawari 20.00 Gawari 20.00 Fodder 28.75 Fodder 28.75 Pulses 4.00 Pulses 4.00
Semi Medium Paddy 707.00 Paddy 707.00 Cotton 184.00 Cotton 218.00 Bajra 204.00 Bajra 204.00 Gawari 132.50 Gawari 132.50 Fodder 76.50 Fodder 76.50 Pulses 3.00 Pulses 3.00
Medium Paddy 1567.00 Paddy 1567.00 Cotton 270.00 Cotton 303.00 Bajra 225.00 Bajra 225.00 Gawari 246.00 Gawari 246.00 Fodder 105.50 Fodder 105.50 Pulses 4.00 Pulses 4.00 Maize 2.00 Maize 2.00
Large Paddy 1531.00 Paddy 1531.00 Cotton 108.00 Cotton 147.00 Bajra 92.00 Bajra 92.00 Gawari 76.00 Gawari 76.00 Fodder 52.50 Fodder 52.50 Pulses 17.00 Pulses 17.00
Source: Field survey, 2014

28
The data presented in Table 4.5 clearly indicates that there was no change in cropping
pattern across farmers’ categories during Kharif season. There was nominal increase in area
under cotton cultivation after tube-well installation in most of the farmers’ categories, except
marginal farmers, where it remained intact. Area under paddy cultivation was increased only
by 5 acres in the category of small farmers during post- tube-well installations.
Table 4.6: Farmer Category-wise Cropping Pattern in Rabi Season Particulars Pre Tube-well Installation Post Tube-well Installation
Crops Area (acre) Crops Area (acre) Marginal Wheat 42.25 Wheat 42.25
Oilseeds 11.00 Oilseeds 11.00 Fodder 1.50 Fodder 1.50
Small Wheat 436.25 Wheat 461.25 Oilseeds 49.00 Oilseeds 60.00 Fodder 23.50 Fodder 23.50 Sugarcane 2.00 Sugarcane 2.00 Barley 0.00 Barley 0.50 Pulses 3.00 Pulses 3.0
Semi Medium Wheat 960.50 Wheat 996.50 Oilseeds 216.50 Oilseeds 246.00 Sugarcane 20.00 Sugarcane 20.00 Pulses 23.50 Pulses 23.50 Fodder 68.00 Fodder 68.00 Vegetable 2.00 Vegetable 2.00 Barley 0.00 Barley 5.00
Medium Wheat 1948.00 Wheat 1993.50 Oilseeds 249.00 Oilseeds 291.50 Sugarcane 97.00 Sugarcane 97.00 Pulses 56.50 Pulses 56.50 Fodder 96.50 Fodder 96.50 Barley 5.00 Barley 14.50
Large Wheat 1651.50 Wheat 1677.50 Oilseeds 99.00 Oilseeds 134.00 Sugarcane 171.50 Sugarcane 171.50 Pulses 40.00 Pulses 40.00 Fodder 46.00 Fodder 46.00 Barley 0.00 Barley 18.00
Source: Field survey, 2014
The Table 4.6 presents cropping pattern during pre and post tube-well installation
period in Rabi season. The data shows that there was slight change in the cropping pattern.
After tube-well installation barley cultivation came into scene in the categories of small,
semi-medium and large farmers. Otherwise, there was only increase in area under wheat and
oilseeds cultivation across the categories, except the category of marginal farmers, after tube-

29
well installation. It implies that due to increase in irrigation facilities, after having an electric
tube-well, the farmers started to grow wheat and oilseeds on more acreage.
4.2: Estimation of Wasteful Consumption of Resources
To estimate wasteful consumption of electricity, we have tried to compare the
optimum number of times crop-wise irrigation was required (estimated by agricultural
experts) with actual number of times irrigation took place in the selected districts. It is
pertinent to reveal that depth and number of irrigations depends on many factors such as
weather conditions, especially the intensity and frequency of rainfall during the crop season,
type of soil (sandy, clay, sandy loan etc.), irrigation methods to be adopted (flood, sprinkle
etc.) and other management practices being followed.
Table 4.7: Crop-wise details of Number of times Irrigation Required and Number of times of Actual Irrigation with Electric Tube-well per acre in Kharif Season S. No Crops Area
(acre) No. of times irrigation required *
No. of times of actual irrigation with Electric Tube-well
1 Paddy 4188.25 20-25 41.82 2 Cotton 766.50 3-4 4.60 3 Bajra 582.50 2-3 5.22 4 Fodder (Jawar) 266.25 5-7 7.39 5 Gawari 478.50 2-3 3.83 6 Pulses (Arhar) 28.00 3-4 3.25
Source: 1.Field Survey, 2014 2. Report on Efficient Management of Irrigation Water in Haryana (2009) by A.S. Dhindwal, V.K.
Phogat and M.S. Dahiya, CCS Haryana Agricultural University, Hisar. Note: *: Number of times irrigation required as estimated by the experts are for a normal weather and soil conditions.
The Table 4.7 presents the comparison of crop wise optimum number of times of
irrigation was required and number of times of actual irrigation with tube-well per acre
during Kharif season. The data clearly shows that average number of times of actual
irrigation is significantly higher than optimum number of times of irrigation was required in
most of the Kharif crops, except pulses. In case of paddy, being a highly water intensive crop,
the estimated optimum number of times of irrigation is between 20-25 per acre but actual
average number of times of irrigation was 41.82 which amounts about double against the
optimum number of times of irrigation required. It clearly indicates towards over utilisation
of ground water.
Similar trends have also been observed in most of the Rabi crops, except wheat and
fodder, from the data presented in the Table (4.8). The average number of times of actual
irrigation (5.80) for wheat was in the specified range of optimum number of times of
irrigation. The average actual number of times of irrigation for sugarcane (26.03) and barley

30
(7.20) was perceptibly higher than the respective optimum number of times of irrigation (12-
16 and 2-3).
Table 4.8: Crop-wise details of Number of times Irrigation Required and Number of times of Actual Irrigation with Electric Tube-well per acre in Rabi Season S. No.
Crops Area (acre)
No. of times irrigation required *
No. of times of actual irrigation with Electric Tube-well
1 Wheat 5171.00 5-6 5.80 2 Oilseeds 742.50 2-3 4.97 3 Sugarcane# 290.50 12-16 26.03 4 Fodder (barseem) 235.50 12-15 7.08 5 Pulses (gram) 123.00 1-3 4.00 6 Barley 38.00 2-3 7.20
Source: 1.Field Survey, 2014 2. Report on Efficient Management of Irrigation Water in Haryana (2009) by A.S. Dhindwal, V.K.
Phogat and M.S. Dahiya, CCS Haryana Agricultural University, Hisar. Note: *: No. of irrigations estimated by the experts are for a normal weather and soil conditions. #- Annual crop
There were hardly any efforts from the state government to motivate farmers for
efficient utilisation of electricity and ground water. There is an urgent need to ensure metered
supply at consumer ends, particularly the agriculture connections, on priority basis. It will
promote efficiency and add to viability in the power supply. Unmetered power supply
promotes inefficiency in electricity consumption and utilisation of ground water. The power
utilities claimed 100 % metering at agriculture feeders but it has a significant amount of load
of non-agriculture sector, particularly domestic. In the absence of proper metering at
consumer ends, the precise estimation of actual electricity consumption by agricultural
consumers and level of transmission & distribution losses is not possible.
4.3: Impact of Electric Tube-well Utilisation on Production and Productivity of the
Crops
The Tables 4.9 and 4.10 show the impact of tube-well utilisation on total production
and productivity of major crops for the sampled households during Kharif and Rabi seasons.
The data shows that the area under cultivation of main Kharif crops remained more or less the
same, except cotton during the period of pre and post installation of electric tube-well. But
total production of all the Kharif crops has increased. Consequently, productivity (yield) per
acre of all the corresponding crops also increased. The highest increase in productivity was
observed in paddy during post tube-well installation period (from 17.61 quintals per acre to
22.54 quintals per acre). It may partially be attributed to extension of irrigation facilities from
electric tube-wells. It needs to be noted that use of High Yielding Varieties (HYVs) seeds,
chemical fertilisers and pesticides has gone up with extension of irrigation facilities.

31
Table 4.9: Impact of Tube-well Utilisation on Production and Productivity of Major Crops for the Sampled Households in Kharif Season Particulars Area (acre) Total Production (quintal) Productivity per acre (quintal)
Pre Tube-well Installation
Post Tube-well Installation
Pre Tube-well Installation
Post Tube-well Installation
Pre Tube-well Installation
Post Tube-well Installation
Paddy 4183.75 4188.25 73707.50 94436.50 17.62 22.55 Cotton 646.00 766.50 4195.50 6417.50 6.49 8.37 Bajra 582.50 582.50 2894.50 4008.25 4.97 6.88 Gawari 478.50 478.50 1532.00 2214.00 3.20 4.63 Pulses 28.00 28.00 72.00 100.00 2.57 3.57
Source: Field Survey, 2014
Similar trends have been observed in Rabi crops. The increase in productivity of
sugarcane was the highest from 258.38 quintals per acre in pre tube-well installation to
304.54 quintals per acre in post tube-well installation period. The increase in productivity of
wheat was second highest from 16.07 quintals per acre to 19.69 quintals per acre during the
corresponding period.
Table 4.10: Impact of Tube-well Utilisation on Production and Productivity of Major Crops for the Sampled Households in Rabi Season Particulars Area (acre) Total Production
(quintal) Productivity per acre
(quintal) Pre Tube-well Installation
Post Tube-well Installation
Pre Tube-well Installation
Post Tube-well Installation
Pre Tube-well Installation
Post Tube-well Installation
Wheat 5038.50 5171.00 80966.25 101859.75 16.07 19.70 Oilseeds 624.50 742.50 3464.00 5308.00 5.55 7.15 Sugarcane 290.50 290.50 75060.00 88470.00 258.38 304.54 Pulses 123.00 123.00 566.00 781.50 4.60 6.35 Barley 5.00 38.00 44.00 376.50 8.80 9.12
Source: Field Survey, 2014
The analysis of impact of tube-well utilisation on production and productivity of
major crops for the sampled households during Kharif and Rabi seasons clearly indicates that
the extension of irrigation facility through installation of tube-well has largely promoted the
utilisation of High Yielding Varieties (HYVs) seeds, pesticides and chemical fertilisers which
in turns led to a significant growth in productivity of the crops. The net sown area under
cultivation of paddy and wheat has remained more or less the same. But the total production
of these crops (paddy and wheat) for the sampled households has increased from 73707.50
quintals and 80966.25 quintals during pre tube-well installation to 94436.50 quintals and
101859.75 quintals respectively during post tube-well installation. Correspondingly,

32
productivity has gone up from 17.62 quintals per acre to 22.54 quintals per acre for paddy
and from 16.07 quintals per acre to 19.70 quintals per acre for wheat.
We have also tried to find out major factors responsible for increase in productivity of
major crops. The Table 4.11 presents major factors, as per households’ responses, responsible
for increase in productivity of the crops per acre.
Table 4.11: Major Factors Responsible for Increase in Productivity of the Crops per acre as given by the Households (multiple response)
Particulars Irrigations HYVs Chemical Fertilizers
Pesticides Mechanisation other
Marginal 28 28 (100) 23 (82.14) 26 (92.86) 6 (21.43) 5 (17.86) 0
Small 131 131 (100) 105 (80.15) 102 (77.86) 62 (47.33) 37 (28.24) 0
Semi-medium 166 166 (100) 128 (77.11) 125 (75.30) 57 (34.34) 19 (11.45) 0
Medium 159 159 (100) 126 (79.25) 122 (76.73) 66 (41.51) 21 (13.21) 2 (1.26)
Large 56 56 (100) 45 (80.36) 37 (66.07) 29 (51.79) 10 (17.86) 1 (1.79)
Total 540 540 (100) 427 (79.07) 412 (76.03) 220 (40.79) 92 (17.04) 3 (0.56)
Source: Field Survey, 2014 Note: Figures in brackets indicate percentage to their respective total
The data reveals that extension of irrigation facilities through tube-well installation
was one of the major factors responsible for increase in productivity. With the increase in
irrigation facilities the use of High Yielding Varieties (HYV) seeds, chemical fertilisers and
pesticides have also contributed to increase productivity as 79.07 per cent, 76.03 per cent and
40.79 per cent households respectively pointed out. Besides these factors, mechanisation was
also a factor responsible for an increase in productivity of crops during both the cropping
seasons Kharif and Rabi as 17.04 per cent households revealed.
4.4: Environmental Impacts of Electric Tube-well Utilisations
It clearly indicates that tube-well irrigation has played a significant role in agricultural
growth in terms of increase in total production and productivity. However, over-utilisation of
ground water has caused the problems of decline in water table, degradation of soil fertility
etc. This fact has also been substantiated by Joydeb Sasmal, 2014.
The Table 4.12 presents information on category-wise purpose-wise tube-well
utilisation by the households. The data exhibits that only 13.15 per cent households utilised

33
tube-well for own domestic purposes apart from own irrigations. The utilisation of tube-well
for commercial activities was not found during the field survey.
Table 4.12: Category-wise Purpose-wise Tube-well Utilisation by the Sampled Households (multiple response) Particulars Own Irrigation Own Domestic use Marginal Farmers 28 28 (100) 7 (25.00) Small Farmers 131 131 (100) 11 (8.40) Semi-Medium Farmers 166 166 (100) 26 (15.66) Medium Farmers 159 159 (100) 23 (14.47) Large Farmers 56 56 (100) 4 (7.14) Total 540 540 (100) 71 (13.15) Source: Field Survey, 2014 Note: Figures in brackets indicate percentage to respective total
It may be noted that the households who reported to utilise tube-well for domestic
purposes were in district Bhiwani. The households pointed out that there was no alternate
mean to meet domestic water requirements as most of them live in Dhanis (a small group of
households who built houses in their fields). There was not a single household who was
involved in commercial activities associated with tube-well water including selling water to
other farmers even for irrigation purposes in the study area. However, there were some cases
in district Jind where farmers exchanged tube-well water as and when it was needed to meet
irrigation requirements on mutual basis only.
Haryana and Punjab have successfully implemented the green revolution technology
in 1960s and 1970s, now these states are found to be worst affected by excessive ground
water utilisation/ extraction and intensive farming (Joydeb Sasmal, 2014). The Table 4.13
presents environmental impacts of electric tube-well utilisation as highlighted by the
households.
Table 4.13: Environmental Impacts of Tube-well Utilisation as given by the Sampled Households (multiple response) Particulars Water Table Depletion Soil Degradation Marginal 28 10 (35.71) 26 (92.86) Small 131 52 (39.69) 102 (77.86) Semi Medium 166 68 (40.96) 125 (75.30) Medium 159 63 (39.62) 122 (76.73) Large 56 26 (46.43) 37 (66.07) Total 540 219 (40.56) 412 (76.30)
Source: Field Survey, 2014 Note: Figures in brackets indicate percentage to respective total.
The data reveals that majority of the households irrespective of categories observed
that soil degradation was one of major problems associated with excessive utilisation of tube-
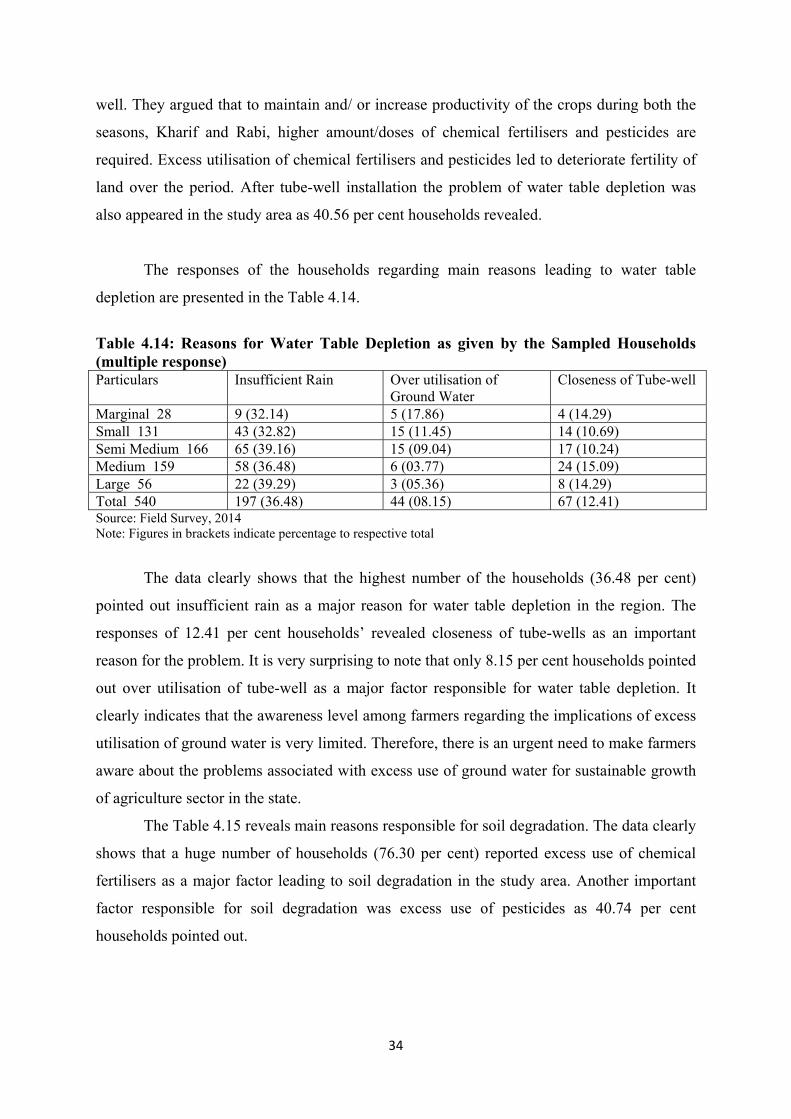
34
well. They argued that to maintain and/ or increase productivity of the crops during both the
seasons, Kharif and Rabi, higher amount/doses of chemical fertilisers and pesticides are
required. Excess utilisation of chemical fertilisers and pesticides led to deteriorate fertility of
land over the period. After tube-well installation the problem of water table depletion was
also appeared in the study area as 40.56 per cent households revealed.
The responses of the households regarding main reasons leading to water table
depletion are presented in the Table 4.14.
Table 4.14: Reasons for Water Table Depletion as given by the Sampled Households (multiple response) Particulars Insufficient Rain Over utilisation of
Ground Water Closeness of Tube-well
Marginal 28 9 (32.14) 5 (17.86) 4 (14.29) Small 131 43 (32.82) 15 (11.45) 14 (10.69) Semi Medium 166 65 (39.16) 15 (09.04) 17 (10.24) Medium 159 58 (36.48) 6 (03.77) 24 (15.09) Large 56 22 (39.29) 3 (05.36) 8 (14.29) Total 540 197 (36.48) 44 (08.15) 67 (12.41) Source: Field Survey, 2014 Note: Figures in brackets indicate percentage to respective total
The data clearly shows that the highest number of the households (36.48 per cent)
pointed out insufficient rain as a major reason for water table depletion in the region. The
responses of 12.41 per cent households’ revealed closeness of tube-wells as an important
reason for the problem. It is very surprising to note that only 8.15 per cent households pointed
out over utilisation of tube-well as a major factor responsible for water table depletion. It
clearly indicates that the awareness level among farmers regarding the implications of excess
utilisation of ground water is very limited. Therefore, there is an urgent need to make farmers
aware about the problems associated with excess use of ground water for sustainable growth
of agriculture sector in the state.
The Table 4.15 reveals main reasons responsible for soil degradation. The data clearly
shows that a huge number of households (76.30 per cent) reported excess use of chemical
fertilisers as a major factor leading to soil degradation in the study area. Another important
factor responsible for soil degradation was excess use of pesticides as 40.74 per cent
households pointed out.

35
Table 4.15: Reasons for Soil Degradation as given by the Sampled Households (multiple response) Particulars Excess use of Pesticides Excess use of Chemical Fertilisers Others Marginal 28 6 (21.43) 26 (92.86) 0 Small 131 62 (47.33) 102 (77.86) 0 Semi Medium 166 57 (34.34) 125 (75.30) 0 Medium 159 66 (41.51) 122 (76.73) 2 (1.26) Large 56 29 (51.79) 37 (66.07) 1 (1.79) Total 540 220 (40.74) 412 (76.30) 3 (0.56) Source: Field Survey, 2014 Note: Figures in brackets indicate percentage to respective total
The available literature also clearly spelt out that over utilisation of ground water has
caused salinity and arsenic problems in water, depletion of water table and degradation of soil
fertility in many parts of the country (Joydeb Sasmal, 2014). Haryana is not except to it.
The state government has adopted hardly any mechanism to regulate use of ground
water, which is a matter of serious concern. The practices of excess extraction of ground
water by farmers have probably happened on account of power supply to the agriculture
sector at flat rate, which is also very nominal in Haryana. Flat rate system has also promoted
the farmers to install in-efficient pump sets that used excessive electricity and led to wastage
of electricity.
4.4: Impact of Electric Tube-well Utilisation on Cost of Production
In this section, we have also tried to examine the impact of electric tube-well
installation on total cost per acre and average cost of production of major Kharif and Rabi
crops for the sampled households.
The Table 4.16 highlights impact of electric tube-well installation on crop wise total
cost per acre and average cost of production of major crops during Kharif season. The data
reveals that total production per acre of major crops in Kharif season has increased from
13.92 quintals in pre tube-well installation to 17.73 quintals in post tube-well installation. The
increase in total production of the major crops for the sampled households has happened on
account of increase in area under cultivation of cotton and paddy on the one hand and
excessive use of HYVs seeds, chemical fertilisers and pesticides with the extension in
irrigation facilities after electric tube-well installation on the other. Consequently, total and
average cost of production for the sampled households has tended to increase. Total cost of
production per acre of major Kharif crops has increased to Rs. 15439.45 in post electric tube-
well installation as against Rs. 10712.52 in pre electric tube-well installation. Overall average
cost of production in Kharif season for the sampled households has gone up from Rs.769.83
per quintal in pre tube-well installation to Rs. 870.64 in post tube -well installation. It reveals
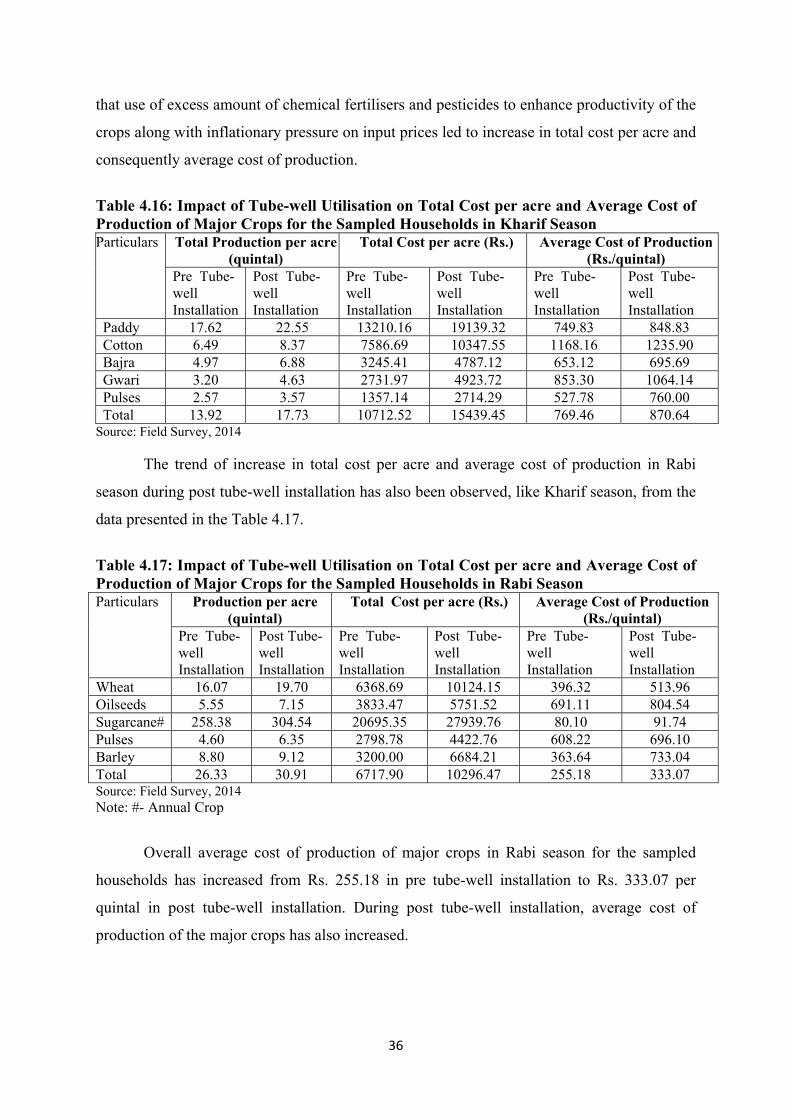
36
that use of excess amount of chemical fertilisers and pesticides to enhance productivity of the
crops along with inflationary pressure on input prices led to increase in total cost per acre and
consequently average cost of production.
Table 4.16: Impact of Tube-well Utilisation on Total Cost per acre and Average Cost of Production of Major Crops for the Sampled Households in Kharif Season Particulars Total Production per acre
(quintal) Total Cost per acre (Rs.) Average Cost of Production
(Rs./quintal) Pre Tube-well Installation
Post Tube-well Installation
Pre Tube-well Installation
Post Tube-well Installation
Pre Tube-well Installation
Post Tube-well Installation
Paddy 17.62 22.55 13210.16 19139.32 749.83 848.83 Cotton 6.49 8.37 7586.69 10347.55 1168.16 1235.90 Bajra 4.97 6.88 3245.41 4787.12 653.12 695.69 Gwari 3.20 4.63 2731.97 4923.72 853.30 1064.14 Pulses 2.57 3.57 1357.14 2714.29 527.78 760.00 Total 13.92 17.73 10712.52 15439.45 769.46 870.64
Source: Field Survey, 2014
The trend of increase in total cost per acre and average cost of production in Rabi
season during post tube-well installation has also been observed, like Kharif season, from the
data presented in the Table 4.17.
Table 4.17: Impact of Tube-well Utilisation on Total Cost per acre and Average Cost of Production of Major Crops for the Sampled Households in Rabi Season Particulars Production per acre
(quintal) Total Cost per acre (Rs.) Average Cost of Production
(Rs./quintal) Pre Tube-well Installation
Post Tube-well Installation
Pre Tube-well Installation
Post Tube-well Installation
Pre Tube- well Installation
Post Tube-well Installation
Wheat 16.07 19.70 6368.69 10124.15 396.32 513.96 Oilseeds 5.55 7.15 3833.47 5751.52 691.11 804.54 Sugarcane# 258.38 304.54 20695.35 27939.76 80.10 91.74 Pulses 4.60 6.35 2798.78 4422.76 608.22 696.10 Barley 8.80 9.12 3200.00 6684.21 363.64 733.04 Total 26.33 30.91 6717.90 10296.47 255.18 333.07 Source: Field Survey, 2014 Note: #- Annual Crop
Overall average cost of production of major crops in Rabi season for the sampled
households has increased from Rs. 255.18 in pre tube-well installation to Rs. 333.07 per
quintal in post tube-well installation. During post tube-well installation, average cost of
production of the major crops has also increased.

37
4.5: Awareness, Preferences, Problems and Suggestions in relation to Electric Tube-well
Utilisations
It has been observed that farmers were using electric motors with difference capacity
in terms of British Horse Power (BHP) in the study area.
Table 4.18: Motor Capacity-wise Average Expenses of Electric Tube-well Connection for the Sampled Households Particulars No. of Connections Average Expenses (Rs.)
Load up to 5 BHP 67 96641.79 Load 5.1 to 10 BHP 137 130190.69 Load 10.1 to 15 BHP 276 176215.83 Load 15.1 to 25 BHP 60 204075.00 Total 540 157761.50
Source: Field Survey, 2014
The Table 4.18 shows capacity wise average expenses of installing electric tube-well
for the sampled households. The average expenses in getting electric connection comprises
security amount, expenses on electric poles, file charges and commission to contractor
(middleman), if any. It needs to be noted that the employees of the power utilities have
developed a mechanism of contractor (middleman) between farmers and the utilities. To
avoid harassment and pendency of electric tube-well connections, farmers generally
approached to contractor for getting tube-well connection at the earliest and contractors do
the needful in collusion with concerned employees. The contractor charges lump-sum amount
from the farmers taking into account total costs involved in releasing electric tube-well
connection at the consumer ends including security amount, expenses on electric poles, file
charges and their own commission. The households were not aware about the amount of
commission charged by the contractor in this process. It was observed that average expenses
for tube-well installation have tended to increase with BHP load. For the capacity of 15-25
BHP, the average expenses were Rs. 2, 04,075 as against Rs. 96,641.79 for capacity up to 5
BHP. Average cost per tube-well for the sampled households was Rs. 1, 57,761.50 which
may not be affordable to marginal and small farmers. There is an urgent need to speed up the
process for earlier release of electric tube-well connections to the farmers so that
contractorship could be eliminated and exploitation of the farmers may be avoided. The
existence of contractorship in the process has burdened the households unnecessarily in terms
of increase in cost of tube-well connection.
The households have also pointed out some major issues in relation to electric tube-
well connections during field survey, which are presented in the Table 4.19.

38
Table 4.19: Major Issues in Relation to Electric Tube-well as given by the Sampled Households (multiple response) Particulars High Cost of Tube- well
Installation Lengthy Process in getting Connection
Inadequate Power Supply
Marginal 28 26 (92.86) 18 (64.29) 24 (85.71) Small 131 126 (96.18) 66 (50.38) 107 (81.68) Semi-Medium 166 158 (95.18) 76 (45.78) 121 (72.89) Medium 159 148 (93.08) 65 (40.88) 116 (72.96) Large 56 52 (92.86) 16 (28.57) 38 (67.86) Total 540 510 (94.44) 241 (44.63) 406 (75.19) Source: Field Survey, 2014 Note: Figures in brackets indicate percentage to respective total.
The data reveals that the major issue has been related with cost of installation of
electric tube-well which was very high. Marginal and small farmers have faced difficulty to
afford the cost of installing electric tube-well in their fields. More than 94 per cent
households highlighted this problem. Second major problem was associated with inadequate
power supply as 75.19 per cent households pointed out. The households argued that the state
government has fixed duration of 8 hours per day for power supply to agriculture sector.
However, the supply remained interrupted and irregular during most of the period. The time
schedule has also been changed frequently and at some occasion the duration of 8 hours was
divided in different quarters. Such type of activities has led to inefficiency and wastage of
ground water as well as electricity. It puts negative impacts on agriculture production &
productivity. There should be regularity in power supply to agriculture sector. Lengthy
process in getting electric tube-well connections was also one of the major problems in the
state as 44.63 per cent households revealed. In a routine process, on an average one
connection takes at least one and a half year to get released. To avoid pendency and
harassment, farmers have approached to contractor to get released an electric tube-well
connection at the earliest date. But it has enhanced average cost of tube-well connection
correspondingly.
As earlier discussion revealed that average cost of electric tube-well installation was
high. Therefore, farmers generally prefer local branded motor as it was relatively cheaper and
extract more ground water. The data presented in the Table 4.20 clearly shows that more than
80 per cent households used local branded motors for their tube-wells. It is pertinent to note
that use of local inefficient motors particularly on account of flat rate system led to over
utilisation of ground water and excess consumption of electricity, which has its implications
for sustainable agricultural growth and financial viability of the power utilities.

39
Table 4.20: Category-wise Awareness regarding Technological Innovation for Electricity Saving and Water Harvesting among the Sampled Households
Particulars Brand of Motor Used Use of Iron Pipes Use of Plastic Pipes Company Local
Marginal 28 4 (14.29) 24 (85.71) 3 (10.71) 25 (89.29) Small 131 35 (26.72) 96 (73.28) 12 (09.16) 119 (90.84) Semi-Medium 166 31 (18.67) 135 (81.33) 25 (15.06) 141 (84.94) Medium 159 27 (16.98) 132 (83.02) 29 (18.24) 130 (81.76) Large 56 8 (14.29) 48 (85.72) 6 (17.71) 50 (82.29) Total 540 105 (19.44) 435 (80.56) 75 (13.89) 465 (86.11) Source: Field Survey, 2014 Note: Figures in brackets indicate percentage to respective total.
The Table (4.20) further shows that more than 86 per cent households were using
plastic pipes instead of iron pipes. The plastic pipes were economical and have least frictions.
The category wise data also reflected the preference of farmers towards use of plastic pipes.
There was hardly any household who used capacitor to boost up voltage to run tube-well
efficiently.
The Table 4.21 clearly highlights that all the households were interested only in
existing pattern of agricultural power subsidy in which they were getting power supply at
highly subsidised rates. They felt that other modes of subsidy payment may force them to
ensure metered supply for tube-well in which they have no interest to avoid accountability.
There is an urgent need to make them aware about the benefits of other alternate modes of
agriculture power subsidy payment and motivate them to install meters at their tube-wells.
Table 4.21: Category-wise Preferences for Mode of Agriculture Power Subsidy as given by the Sampled Households (multiple response) Particulars Existing
Pattern Direct Cash Payment
Payment through Banks
Any other form
Marginal Farmers 28 28 (100) - - - Small Farmers 131 131 (100) - - - Semi-Medium Farmers 166 166 (100) - - - Medium Farmers 159 159 (100) - - - Large Farmers 56 56 (100) - - - Total 540 540 (100) - - - Source: Field Survey, 2014 Note: Figures in brackets indicate percentage to respective total.
The Table 4.22 presents category-wise preferences for electricity bill payment. The
data clearly highlights that more than 53 per cent of total households have their preference in
flat rate billing system. It is very interesting to note that more than 2/3rd marginal and small
farm households were interested in metered supply billing system whereas majority of big
farm households (60 per cent) have their interest in flat rate billing system.

40
Table 4.22: Category-wise Preferences for Electricity Bill Payment System as given by the Sampled Households Particulars Metered Supply Bill Flat Rate Supply Bill Marginal Farmers 28 14 (50.00) 14 (50.00) Small Farmers 131 92 (70.23) 39 (29.77) Semi-Medium Farmers 166 64 (38.55) 102 (61.45) Medium Farmers 159 68 (42.77) 91 (57.23) Large Farmers 56 15 (26.79) 41 (73.21) Total 540 253 (46.85) 287 (53.15) Source: Field Survey, 2014 Note: Figures in brackets indicate percentage to respective total
It was also observed that big farm households extract more ground water with
inefficient electric motors (local branded), which consume relatively more electricity, to meet
their irrigation requirements on large farms size. Therefore, they have developed their vested
interests in flat rate system and avoid installing meters at their tube-wells. It clearly
established that big farm households captured major chunk of benefits of agriculture power
subsidy. A significant proportion of marginal and small farmers are not covered under
agricultural power subsidy net due to non-possession of electric tube-well connections.
It may be argued on the basis of available data/ information that big farm households
were the major beneficiaries of power supply at subsidised rates mainly because of non-
possession of tube-wells by a significant proportion of marginal and small farmers.
Therefore, there is an urgent need to ensure power supply at subsidised rates to the targeted
households. Big farmers, being in a better financial position, may charge full cost of supply
so that the burden of agriculture power subsidy can be reduced on the one hand and the
environmental impacts may be controlled/ reduced on the other. It was also observed that the
farmers were ready to pay higher tariffs provided the regular and sufficient power supply to
their tube-wells. The state government should take initiatives to make the farmers aware
about the benefits of metered power supply and ensure metering at consumer ends
particularly for agricultural consumes on priority basis.
In a power deficit scenario, solar system may be used an alternate source of irrigation.
The Table 4.23 presents category wise awareness/ preferences of the sampled households
regarding solar irrigation system. The data shows that only 34.26 per cent households were
aware about solar system which reflects a poor level of awareness. However, there was no
solar irrigation system in the study area. There is an urgent need to generate awareness
among households regarding alternative sources of energy. The state government should
provide a amount of capital subsidy on solar pump sets at initial stage and later on it may be

41
recovered from the beneficiaries. Moreover, awareness about energy conservation and water
harvesting was also very limited that needs to be enhanced on priority basis.
Table 4.23: Category-wise Awareness / Preferences as given by the Sampled Households about Solar Irrigation System Particulars Awareness/Preferences Marginal Farmers 28 11 (39.29) Small Farmers 131 33 (25.19) Semi-Medium Farmers 166 64 (38.55) Medium Farmers 159 54 (33.96) Large Farmers 56 23 (41.07) Total 540 185 (34.26)
Source: Field Survey, 2014 Note: Figures in brackets indicate percentage to respective total.
It has been observed that irregular & insufficient power supply, lengthy & tiring
process in getting tube-well connections, existence of contractorship between farmers and the
power utilities are the major problems in the study area. To deal with these problems the
sampled households have given some important suggestions.
Table 4.24: Category-wise Major Suggestions as given by the Sampled Households (multiple response) Particulars Regular
Power Supply
Increase in Hours of Power Supply
Specified Time Frame for Getting Agriculture Power Connection
Elimination of Contractor
Repair of Canal System
Adequate MSP of Non-water Intensive Crops
Marginal Farmers 28
24 (85.71)
11 (39.29)
10 (35.71)
18 (64.29)
5 (17.86)
0 (00.00)
Small Farmers 131
107 (81.68)
42 (32.06)
31 (23.66)
66 (50.38)
20 (15.27)
12 (9.16)
Semi-Medium Farmers 166
121 (72.89)
66 (39.76)
50 (30.12)
76 (45.78)
16 (9.64)
19 (11.45)
Medium Farmers 159
116 (72.96)
58 (36.48)
46 (28.93)
65 (40.88)
16 (10.06)
24 (15.09)
Large Farmers 56
38 (67.86)
20 (35.71)
13 (23.21)
16 (28.57)
6 (10.71)
16 (28.57)
Total 540 406 (75.19)
197 (36.48)
150 (27.78)
241 (44.63)
63 (11.67)
71 (13.15)
Source: Field survey, 2014 Note: Figures in brackets indicate percentage to respective total
The major suggestions of the sampled households regarding electric tube-wells are
presented in the Table 4.24. A significant proportion of the sampled households (75.19 per
cent) suggested that the state government should ensure sufficient and regular power supply
42
to meet their irrigation requirements, which is one of the major problems. The power utilities
should also ensure to release electric tube-well connections at the earliest date such that
contractorship could be eliminated and exploitation of the farmers may be avoided. Another
important suggestion was regarding crop diversification. The state government should
increase Minimum Support Price (MSP) of non- water intensive crops such that the farmers
may be motivated to shift their cropping pattern in favour of non-water intensive crops. This
will help to reduce the pressure on natural ground water and electricity consumption. Some
households have also suggested repairing the canals system regularly such that they may use
canal water to meet irrigation requirements to some extent.
4.6: Conclusion
On the basis of analysis above, it may be pointed that with the increase in size of land
holdings, the farmers have changed their cropping behaviour from subsistence to commercial
farming. The wheat-paddy rotation is, predominantly, prevailing in the state except southern
districts. As there has been little change in cropping pattern, it means it has stabilised for
some time now. Over the period, the irrigations facilities have increased on account of
installation of electric tube-wells and consequently the area under cultivation of major crops,
i.e. cotton in kharif season and oilseeds in rabi season, has gone up. Due to excess utilisation
of ground water in some major crops the problems of soil degradation and water table
depletion were appeared in the study area. With the extension of irrigation facilities, the use
of HYVs seeds, chemical fertilisers and pesticides was increased to enhance and /or to
maintain productivity of the crops. It was also observed that after installation of electric tube-
well, average cost of production of all the cultivated crops for the sampled households has
increased which may be attributed to the utilisation of excess chemical fertilisers, pesticides
and HYVs seeds on the one hand and inflationary pressure on input prices on the other. To
extract more ground water, majority of the households are using local branded inefficient
electric motors which consume relatively more electricity. The majority of the households are
using plastic pipes for tube-well irrigations taking into account only financial aspects as these
pipes are relatively cheaper. However, the households have very little awareness about the
water harvesting and energy savings techniques. The households were also unaware about the
implications of excess utilisation of precious ground water for sustainable growth in
agriculture. In case of excessive dependence on ground water irrigation, rain water harvesting
and crop diversification in favour of less water intensive crops have been suggested as
alternative policy options for sustainable growth in agriculture.

43
It may be highlighted that majority of marginal and small farm households were
interested in metered supply billing system whereas more than 60 per cent of big farm
households favoured the flat rate billing system due to vested interests. It is also interesting to
highlight that most of the benefits of subsidised power supply to agriculture sector was
accrued by big farm households only. A majority of marginal and small farmers were getting
a little bite of cake in the state due to non - possession of electric tube-wells. Moreover, most
of the sampled households were interested in existing pattern of power subsidy in which
power is supplied to agricultural consumers at highly subsidised rates. They feared that
alternate mode of power subsidy payment may force them to ensure metered supply for their
tube-wells in which they have no interest to remain unaccountable. There is an urgent need to
make the farmers aware about the benefits of alternate modes of subsidy payments. The
major problem regarding electric tube-wells was irregular and insufficient power supply in
the study area. The lengthy & tiring process in getting electric tube-well connections was also
reported which in turn forced the farmers to approach the contractor for getting electric tube-
well connection at the earliest date. The concerned employees in the utilities have also
developed their vested interests in releasing tube-well connections to the farmers through
contractor. The contractor charged lump-sum amount, without indicating the amount of
commission, from the agricultural households for the job. This practice should be dismantled
by the state government on priority basis. The power utilities should release tube-well
connections at the earliest. The state government should also increase minimum support price
(MSP) of non water intensive crops to motivate farmers to change their cropping pattern from
water intensive crops so that the unnecessary pressure on ground water and electricity
consumption may be reduced. Consequently, the burden of power subsidy on budget
exchequer will also go down. Efforts should also be made to provide regular and sufficient
power supply to agricultural farmers subjected to 100 per cent metering at consumer ends.
The farmers, further, should be motivated to adopt solar irrigation system through providing
capital subsidy at the initial stage of tube-well installation and later the amount of subsidy
may be recovered from the beneficiaries.

44
Chapter V
Summary, Conclusions and Policy Recommendations
The Indian energy sector is today at a crucial juncture of development. With growing
economy, the aspiration of people for improved energy services in terms of availability,
accessibility, quality and affordable power have been raised in a big way.
Electricity as infrastructure is of key importance to accelerate the process of economic
development, it was realised that power should be made available at a reasonable price. It has
to be noted that the power sector exerts a critical influence on the performance of the
agricultural sector in India as it influences farmers’ access to and use of electricity for a
variety of agricultural operations, particularly for pumping groundwater. The price of
electricity supplied to agriculture sector in most of the states is heavily subsidized. These
subsidies have contributed to the financial crisis in the state power utilities, reducing its
ability to undertake required investments to respond to rising local demand and to maintain a
smooth and reliable service. For the agricultural sector, the supply of electricity has been
characterized by rationing, frequent power interruptions, and voltage fluctuations that raise
the real cost of electricity to farmers and affect their production activities in several ways.
Overtime, with society acquiring higher levels of industrial development, now the
major share of electricity consumption in the society is in industry and agriculture where it is
used as energy input. Use of energy as a factor of production is a commercial proposition.
Obviously, this use should be governed by the sound economic principles as its supply
involve resource use, which cost money for which someone has to pay. Who pays and who
should pay must be made transparent.
One of the pertinent problems with power sector rests on highly subsidized and
unmetered power supply to some consumer categories, particularly agriculture on the
discretion of state government without any socio-economic justification.
Due to unmetered supply to agriculture, energy accounting system became ineffective
and in fact collapsed. In such a state of affairs when more than half of the electricity supply
was not metered, it was impossible to estimate the actual technical Transmission &
Distribution losses and the pilferage of power. Obviously, the beneficiaries of the unmetered
supply had developed a vested interest in the system to remain unaccountable. A major part

45
of pilferage and theft of electricity was shown as consumption in the agricultural sector.
When in early 1990s wind of change in policy regime was under consideration, the same
government departments/agencies and officers from the next year started showing T&D
losses as much as 30 per cent to 50 per cent in comparison to 18 to 20 per cent in the previous
years. It was conveniently done to provide justification for privatisation as state government
in its management of the SEBs was inefficient. No questions were asked, no accountability
was fixed! The ‘fresh’ wind of change wrapped everything under the carpet.
The power utilities in Haryana are providing electricity at highly subsidized rates
particularly to agricultural consumers on the directions of the state government and
consequently the financial burden of agriculture power subsidy on public exchequer of the
state government has aggravated over the period.
The evaluation study on unreasonable increasing trends of power subsidies being
provided to agriculture sector have tended to highlight the implications of the subsidized
power supply to agriculture sector in the state.
Objectives of the study
To examine whether the power subsidy to agriculture sector leads to wasteful
consumption of power.
To study the environmental impacts of power subsidies to agriculture sector.
To work out the economic and social Cost-Benefits analysis of power subsidies.
To find out whether the burden of power subsidies to agriculture sector can be
minimised without curtailing the benefits to the farmers.
To find out suitable alternatives to power subsidies to agriculture sector.
Research Methodology and Data Base
The study is based on primary as well as secondary data. For primary data collection,
we have adopted multi-stage random sampling technique for selection of agriculture
households. Initially, we collected data on operational circle wise number of agriculture
connections with connected load (BHP) from both the power utilities Uttar Haryana Bijli
Viteran Nigam Limited (UHBVNL) and Dakshin Haryana Bijli Viteran Nigam Limited
(DHBVNL), then on the basis of agriculture pump-set connections per thousand net sown
area, we selected three operational circles one (Karnal) from Uttar Haryana Bijli Viteran

46
Nigam Limited (UHBVNL) and Two (Jind and Bhiwani) from Dakshin Haryana Bijli Viteran
Nigam Limited comprising one circle each from the category of the highest, average and the
lowest agriculture connections per thousand net sown area. Thereafter, we have collected
information from each selected operational circles regarding sub-division wise and feeder
wise number of agriculture connections with connected load. After selection of sub-division
and AP feeders, we have collected information from selected AP feeders regarding village
wise number of agriculture connections with connected load. Finally we have made selection
of three villages, having the highest agriculture connections from each selected AP feeders
from each selected sub- division and operational circle for survey. A sample size of 540
households was drawn selecting 180 households from each operational circle. The ultimate
agricultural households were selected at random. Care was taken to include farmers from
different categories of land holding so as to nullify the discrimination effect. The selected
households have been classified into five categories on the basis of land holdings i.e.
Marginal farmers (upto 2.5 acres), Small farmers (2.51 to 5.0 acres); Semi-medium farmers
(5.1 to 10 acres), Medium farmer (10.1 to 25.0 acres) and Large farmers (more than 25
acres). The sample size (540) consisted of 28 (5.18 %) Marginal, 131 (24.21 %) Small, 166
(30.87 %) Semi-medium, 159 (29.39 %) Medium and 56 (10.35 %) Large farmers. The data
from households was collected with the help of well designed questionnaire.
The secondary data was collected from various publications of Government of
Haryana, Haryana Electricity Regulatory Commission, Haryana Power Utilities, Central
Electricity Authority, CCS Haryana Agriculture University, Hisar, Planning Commission and
Power Finance Corporation, Government of India.
To estimate wasteful consumption, we looked into crop wise water requirement in
terms of number of times a crop is to be irrigated and number of times it is irrigated
by the farmer.
To study environmental impact, broadly, we have examined the changes in water
table, soil degradation during a specific period of time.
To conduct cost benefit analysis of power subsidies, we compared average cost of
supply with average revenue realised. We further estimated total amount of subsidy
and its impact on the financial position of the state.

47
To find out alternative to reduce the impact of agriculture power subsidies without
curtailing benefits to farmers, we studied the existing pattern of subsidy and thereby
examined the justification for subsidisation to big farmers.
The study has focused on three aspects i.e. technical efficiency of power utilities,
pricing policy and perception of households regarding agriculture power subsidy which are
very much relevant to evaluate increasing trends in agriculture power subsidies and its
implications.
Haryana State came into existence with the reorganisation of the State of Punjab as on
November 1, 1966. Haryana State Electricity Board (HSEB) was created in May 1967 by
bifurcating the Punjab State Electricity Board (PSEB). HSEB was incorporated as an
integrated utility to discharge the generation, transmission and distribution functions in the
State. Haryana was the second state in India after Orissa to adopt and implement power sector
reforms under the Haryana Electricity Reforms Act 1997 (HERA), enacted in 1997 and
which came into force on 14th August, 1998.
The Haryana Electricity Regulatory Commission was established in August 1998 to
regulate power sector in the State. After enforcement of HERA, two statutory Transfer
Schemes were notified by the Government of Haryana for restructuring the HSEB. Through
the First Transfer Scheme Rules, 1998, the Generation business (undertakings, assets,
liabilities, proceeds and personnel) was separated from Transmission and Distribution
businesses and vested in a separate company viz. Haryana Power Generation Corporation
Ltd. (HPGCL). The Transmission and Distribution businesses were transferred to and vested
in Haryana Vidyut Prasaran Nigam Ltd. (HVPNL). Thereafter, through the Second Transfer
Scheme Rules 1999, the Transmission undertaking and business was separated from the
Distribution undertakings and business. The former was retained in HVPNL as the
Transmission Company, while the latter was further segregated into and vested in two
successor Distribution companies i.e. Uttar Haryana Bijli Vitran Nigam Ltd (UHBVNL) and
Dakshin Haryana Bijli Vitran Nigam Ltd (DHBVNL). UHBVNL was vested with the
Distribution business in the North Zone of Haryana comprising Ambala, Yamuna Nagar,
Karnal, Kurukshetra, Jind, Rohtak and Sonepat circles. The DHBVNL was vested with the
Distribution business in the southern zone of Haryana comprising of Bhiwani, Faridabad,
Gurgaon, Hisar, Narnaul and Sirsa circles. However, in July 2013, Jind circle has been
transferred to DHBVNL.
48
The Haryana state neither owns any significant share of natural energy resources like
coal, petroleum etc. nor it has any significant hydropower potential, so it has to depend upon
the thermal power plants for meeting its power needs. The coal is being imported from the
other States of the country like Madhya Pradesh, Bihar, Uttar Pradesh etc. Up till now,
development of thermal power plants was the only option to the State for meeting its power
requirements. Now nuclear option is also being explored. The state government has started to
establish a nuclear power station at Gorkhpur Hisar having a capacity of 2800 MW.
A huge amount of funds was invested in installing generation capacity and network
expansion for transmission as well as distribution purposes. Thus, it shows that development
of power sector was given a high priority during the different five year plans.
The total installed generation capacity was estimated at 8114 MW as on 31.01.2013,
out of which 80 per cent and 17 per cent was sourced from Thermal and Hydro power plants
respectively. The share of Nuclear was 1 per cent and Renewable Energy Sources (RES) 2
per cent.
Haryana state’s own generating capacity is 5300.50 MW (as on 31.01.2013), out of
which 98.83 percent is coal based thermal and 1.17 percent is hydro. Besides the state’s own
generating capacity, it also has dedicated shares in the power plants managed and operated by
Bhakra Beas Management Board (BBMB) and Central Power Undertakings (CPUs) such as
NTPC, NHPC and NPC.
In a state like Haryana which is an electricity deficit state, overall PLF should not be
less than 80%. By this norm, except for the year 2009-10, the performance may be
charaterised as unsatisfactory during the period 2007-08 to 2012-13. Despite huge investment
on renovation and modernization of Panipat Thermal Power Stations (PTPS), unsatisfactory
state of performance is a matter of concern. Yamuna Nagar plant has not yet achieved
desirable level of performance.
It was observed that the specific oil consumption of PTPS Units 1 - 4 has been very
high compared to the norms, due to frequent start up and shut down of plants as there have
been multiple cases of breaking down of the plants. The higher specific oil consumption has
been attributed by HPGCL to frequent start/ stop operations due to increase in number of
tripping. Oil support also necessitated due to receipt of wet coal.

49
It is a matter of great concern that technical efficiency of various thermal power
stations in Haryana was below the norms. A close analysis of tariff orders issued by the
Regulatory Commission clearly highlighted that the average cost of supply from own
generating stations in Haryana was much higher than the average cost of purchase from the
other sources. This shows that restructuring of the power sector has not made any significant
change or improvement in the performance of the generation system in Haryana.
It is clear from the available data that there was a significant difference between the
projections made by the utilities and sales approved by the Regulatory Commission that
needs to look into.
It is also observed that the demand of electricity for industrial sector grew at a growth
rate 10.11 percent which is less than that of domestic (11.74 percent) and commercial (22.47
percent) sectors during the period 2007-08 to 2012-13. It happened mainly due to non-
availability of quality power at reasonable prices along with uncertain power cuts. Hence, the
industrialists were forced to fall back more and more upon captive plants to continue
production in a smooth manner.
The distribution loss level shows the constantly higher trend without any significant
improvement. There is a little progress in case of DHBVNL in reducing the losses. However,
it may be noted that none of the distribution company has completed 100% metering at
consumer ends. So, it is difficult to remark any observation on this trend.
In the post- reforms period the Commission has put pressure on the power distribution
companies to estimate power consumption in agriculture sector on the basis of realistic
average running hours of irrigation per pump-sets. The Commission has acknowledged in
tariff orders that the power distribution companies neither have data on the actual energy
consumption by the agriculture consumers nor the correct BHP rating of the pumps as no
instrument is placed to record the same. Therefore, it may be pointed out that the figures of
agriculture consumption and T&D losses shown in official records were only an ‘intelligent’
guess and not the accurate data as more than 60 per cent electricity supply to agriculture
sector is un-metered. In the tariff order issued for the year 2010-11, the Regulatory
Commission has observed that both of the distribution companies have failed in reducing the
distribution losses.

50
While supplying electricity to a consumer it is expected that it will be metered and the
consumer will be asked to pay as per the tariff approved by the HERC. Unmetered electricity
supply to agriculture has opened a flood gate of corruption and non accountability.
Thereafter, nobody could know how much is the actual consumption and how much is the
theft.
Now various stakeholders have developed political vested interests not to let full
metering to avoid accountability despite HERC repeated directives to do the needful as early
as possible. It may be noted that there is no dearth of resources to accomplish the task. There
is an active nexus among the influential farmers, who do not want to install meters to
continue being unaccountable, corrupt employees and the political patronage.
The analysis of pricing policy and financial performance of electricity distribution
companies (DISCOMs) in Haryana present a very contrasting picture. There is hardly any
relationship between cost of supply and average revenue realised. It may be pointed out that
the reform process did not lead to improve recovery of cost which was one of the important
objectives of the reforms. Increasing amount of power subsidy on account of electricity
supply at highly subsidised rates to the untargeted agricultural consumers has serious
implications for the state finances as well.
Charging certain consumer categories at a price which was significantly less than its
cost of supply encourages wasteful consumption and loss of revenue to the power utilities.
Due to lower revenue realisation, there were regular hikes in tariffs of both subsidising and
subsidised categories of consumers. With the tariff hike for the power supplied to subsidising
category particularly industrial consumers, they move towards alternative power supply
provisions such as captive power generation or power purchase using open access
mechanism. This implies that tariff rates do not have any systematic relationship with the cost
of supply. Socio- economic and political considerations appear to have played a crucial role
in the formation of tariff structure. This requires a reconsideration of the relationship between
power utilities and the state government on the one side and the rationale for a pricing policy
and subsidisation of certain consumers on the other. Irrational pricing policy has its serious
implications for the utility/ies as well as the state economy. To ensure financial viability of
the system, the tariff rates must reflect cost of supply. There is an urgent requirement to work
out a realistic and progressive tariff structure reflecting consumer category wise cost of
supply.

51
Agriculture power subsidy as a share of Total Revenue Receipts of the state was
12.96 per cent in 2007-08 which increased significantly to 16.25 per cent in 2008-09 mainly
due to increase in the amount of expenditure on rural electrification. After the year 2008-09,
the share of agricultural subsidy in total revenue receipts has declined to 10.51 per cent in
2012-13, however in absolute terms it has been continuously increasing. It may be pointed
out that higher amount of subsidy leaves lesser resources with the state government for
meeting developmental and other socio-economic responsibilities. The amount of total own
tax revenues cornered by agriculture power subsidy was more than 16 per cent during most of
the period under consideration. For the year 2012-13, the share of agriculture subsidy in total
own tax revenue was 16.36 percent. Similarly, the share of subsidy in Gross State Domestic
Product (GSDP) remained in range of 1.13 per cent to 1.69 per cent during the period 2007-
08 to 2012-13.
It is very interesting to reveal that the share of power subsidy in state’s GSDP was
much higher than that of expenditure on medical services and the supply of clean water &
sanitation. It implies that agricultural power subsidy has been financed at the cost of crucial
social sectors. Failure to target health and sanitation services was probably the main cause for
lower Human Development Indices in Haryana.
The analysis of perception of households regarding agriculture power subsidy, based
on field survey, presented very interesting results. The major crops in Kharif season were
paddy, cotton, gawari, bajra and fodder. Whereas wheat, oilseeds, sugarcane, pulses and
fodder were the main crops in Rabi season. It needs to be noted that wheat paddy rotation is
prominently prevailing in the state, except southern districts.
It is pertinent to be highlighted that the cropping pattern during Kharif and Rabi
seasons remained more or less the same even after installation of tube-well in the study area
whereas only an increase in area under cultivation of some specific crops like cotton, wheat
and oilseeds was observed. In other words as there has been little change in cropping pattern
it means it has stabilised for some time now. The crop diversification took place with the
increase in the size of land holdings in the study areas.
It is evident from the data that ground water was excessively extracted in the study
area. Average actual number of times of irrigation was significantly higher than optimum
number of times of irrigation required in most of the Kharif and Rabi crops, except a few
crops. In case of paddy, being a highly water intensive crop, the estimated optimum number

52
of times of irrigation required is between 20-25 per acre but actual average number of times
of irrigation with electric tube-well was 41.82 which amounts about double against the
optimum number of times of irrigation.
The analysis of impact of tube-well utilisation on production and productivity of
major crops for the sampled households during Kharif and Rabi seasons clearly indicates that
the extension of irrigation facilities through installation of tube-well has largely promoted the
utilisation of High Yielding Varieties (HYVs) seeds, pesticides and chemical fertilisers,
which resulted in a significant growth in productivity of the crops. The net sown area under
cultivation of paddy and wheat, which are major crops, has remained more or less the same.
But the total production of these crops has increased from 73707.50 quintals and 80966.25
quintals during pre-installation of tube-well to 94436.50 quintals and 101859.75 quintals
respectively during post-tube-well installation. Correspondingly, productivity has gone up
from 17.62 quintals per acre to 22.54 quintals per acre for paddy and from 16.07 quintals per
acre to 19.70 quintals per acre for wheat.
The data has clearly indicated that tube-well irrigation has played a significant role in
agricultural growth in terms of increase in total production and productivity of the crops.
However, over-utilisation of ground water has caused the problems of decline in water table
and degradation of soil fertility in the study area.
The data regarding tube-well utilization for the sampled households has clearly spelt
out that only 13.15 per cent households utilised tube-well for own domestic purposes apart
from own irrigations. It may be noted that the households who reported to utilise tube-well
for domestic purposes were in district Bhiwani. The households pointed out that there was no
alternate mean to meet their domestic water requirements as most of them live in Dhanis (a
small group of households who built houses in their fields). No household was involved in
commercial activities associated with tube-well utilisation including selling water to other
farmers for irrigation purposes in study area. However, there were some cases in district Jind
where farmers exchanged tube-well water as and when it was needed to meet irrigation
requirements on mutual basis only.
The majority of households irrespective of categories highlighted soil degradation as
one of the major problems associated with excessive utilisation of tube-well. Over utilisaiton
of ground water has caused salinity and arsenic problems in water and consequently
degradation of soil fertility. They argued that to maintain and/ or to increase in productivity
of crops during both the seasons Kharif and Rabi, higher amount/doses of chemical fertilisers

53
and pesticides are required. Excess utilisation of chemical fertilisers and pesticides has led to
deteriorate fertility of land over the period. Another major problem associated with excessive
tube-well utilisation was water table depletion in the region as 40.56 per cent households
revealed.
The level of awareness among the sampled households regarding excessive utilisation
of tube-well was very limited. The highest number of households (36.48 per cent) pointed out
insufficient rain as a major reason for water table depletion in the region. The responses of
12.41 per cent households’ revealed closeness of tube-wells as an important reason for the
problem. It is very surprising to note that only 8.15 per cent households revealed over
utilisation of tube-well as a major factor responsible for water table depletion. It clearly
indicates that the awareness level among farmers regarding the implications of over-
utilisation of ground water is very limited. Therefore, there is an urgent need to make farmers
aware about the problems associated with excessive use of ground water for sustainable
growth of agriculture sector in the state.
The state government has hardly adopted any strategy to regulate over extraction of
ground water, which is a matter of serious concern. The practices of excess extraction of
ground water by farmers have probably happened on account of power supply to the
agriculture sector at flat rate, which is also very nominal in Haryana. Flat rate billing system
has also promoted the farmers to install in-efficient pump sets that led to excessive electricity
consumption and overutilization of ground water.
The study further highlighted that cost of production per acre as well as per quintal for
the sampled households has increased during post tube-well installation. It may be attributed
to excessive use of chemical fertilisers and pesticides to maintain and/or to enhance
productivity of the crops along with inflationary pressure on input prices.
The households were using electric motors with different capacity (BHP) in different
regions depending upon the availability of ground water. It is pertinent to reveal that the
employees of utilities have developed a mechanism of contractor between the farmers and
power utilities. To avoid harassment and pendency of electric tube-well connections, farmers
generally have approached to contractor for getting tube-well connection at the earliest date
and contractors do the needful in collusion with concerned employees. The contractor
charges lump-sum amount from the consumers taking into account total costs involved in
releasing electric tube-well connection at the consumer ends including security amount,
expenses on electric poles, file charges and their own commission. The households were not

54
aware about the amount of commission charged by the contractor in this process. It was
observed that average expenses for tube-well installation have tended to increase with BHP
load. For the capacity of 15-25 BHP, the average expenses were Rs. 2, 04,075 as against Rs.
96,641.79 for capacity up to 5 BHP. Average cost per tube-well for the sampled households
was Rs. 1, 57,761.50 which is very high and unaffordable to marginal and small farmers.
There is an urgent need to speed up the process for the earliest release of electric tube-well
connections to the farmers such that contractorship may be eliminated. The existence of
contractorship in the process has burdened the farmers unnecessarily in terms of increase in
the cost of tube-well connection.
High cost of tube-well installation is one of the major issues as more than 94 per cent
households pointed out. Marginal and small farmers have faced difficulty to afford the cost of
installing electric tube-well in their fields. Second major problem was associated with
inadequate power supply as 75.19 per cent households revealed. The households argued that
the state government has fixed duration of 8 hours per day for power supply to agriculture
sector. However, the supply remained interrupted and irregular during most of the period.
The schedule of power supply has also been changed frequently and at some occasions the
duration of 8 hours has been divided into different quarters. Such type of activities may lead
to inefficiency and wastage of ground water as well as electricity that in turn exerts negative
impacts on agriculture production and productivity. There should be regularity in power
supply to agriculture sector. Lengthy process in getting electric tube-well connections was
also one of the major problems in the state as 44.63 per cent households pointed out. In a
routine process, on an average one electric tube-well connection takes at least one and half
year to get released.
Due to high average cost of electric tube-well installation, farmers generally prefer
local branded motor for their tube-wells as it was relatively cheaper and extract more ground
water. It is pertinent to note that use of local branded inefficient motors has led to over
utilisation of ground water and excess electricity consumption, which has its implications for
sustainable agricultural growth and financial viability of the power utilities.
All the sampled households were interested only in existing pattern of agricultural
power subsidy in which they are getting power supply at highly subsidised rates. They felt
that other modes of subsidy payment may force them to ensure metered supply for their tube-
well in which they have no interest to avoid accountability. There is an urgent need to make
them aware about the benefits of other alternate modes of agriculture power subsidy payment
and motivate them to install meters at their tube-wells.

55
The data clearly highlights that more than 53 per cent of total households have their
preference in flat rate billing system. It is very interesting to note that more than 2/3rd
marginal and small farm households were interested in metered supply billing whereas
majority of big farm households (60 per cent) have their vested interest in flat rate billing
system.
The big farm households extract more ground water with inefficient electric motors
(local branded) to meet their irrigation requirements on large farms. Therefore, they have
developed their interests in flat rate system and avoid installing meters at their tube-wells to
remain unaccountable. It clearly established that big farm households captured major chunk
of benefits of agriculture power subsidy mainly because of non-possession of electric tube-
well connections by a significant proportion of marginal and small farmers.
There is an urgent need to ensure targeted power supply at subsidised rates. Big
farmers, being in a better financial position, may charge full cost of supply so that the burden
of agriculture power subsidy can be reduced on the one hand and the environmental impacts
may be controlled/ reduced on the other. It was also observed that the farmers were ready to
pay higher tariffs provided the regular and sufficient power supply to their tube-wells. The
state government should take initiatives to make the farmers aware about the benefits of
metered supply and ensure metering at consumer ends on priority basis.
There is an urgent need to generate awareness among households regarding
alternative sources of energy also. The state government should provide an amount of capital
subsidy on solar pump sets at initial stage and later on it may be recovered from the
beneficiaries. Moreover, awareness about energy conservation and water harvesting among
the farmers is also very limited that needs to be enhanced on priority basis.
In nutshell, it may be argued that over the period the state government has devoted a
significant amount of funds for the growth of power sector in the state. Despite the
impressive expansion of the sector, the technical performance was not satisfactory. There is
an urgent need to improve technical efficiency of power utilities through ensuring
transparency, accountability and public participation. The utilities must ensure 100 per cent
metering at consumer ends, particularly agricultural consumers on priority basis so that
precise estimation of electricity consumption and level of transmission & distribution losses
may be made. In the absence of proper metering in agriculture sector, the actual electricity
consumption and the amount of agriculture power subsidy cannot be precisely estimated.

56
The prevailing tariff structure does not have any systematic relationship with the cost
of supply. Highly subsidised and unmetered power supply to agriculture households have led
to excessive electricity consumption and over utilisation of ground water. Consequently,
serious environmental impacts in terms of soil degradations and water table depletions have
appeared in the study area. Moreover, a major chunk of agriculture power subsidy has been
cornered by the big farmers due to non- possession of tube-well connections by a significant
proportion of marginal and small farmers. All the power supply must be metered and flat rate
system be abolished.
The amount of agriculture power subsidy has been increasing continuously which
enlarged the bill of committed expenditure at the cost of social sectors. Higher amount of
committed expenditure leaves fewer resources for making quality expenditure in the hands of
the government that reflected in terms of poor HDI indices on the one hand and rising levels
of Revenue Deficit and Fiscal Deficit on the other. There is an urgent need to work out a
realistic and progressive tariff structure reflecting consumer category-wise cost of supply.
The state power utilities should ensure to release tube-well connections at the earliest
date such that contractorship could be eliminated and exploitation of the farmers may be
avoided. Efforts should also be made to provide regular and sufficient power supply to
agricultural farmers subjected to 100 per cent metering at consumer ends. Big farmers, being
in a better financial position, may charge full cost of supply so that the burden of agriculture
power subsidy can be reduced on the one hand and the environmental impacts may be
controlled/ reduced on the other. The power supply at subsidized rates should be targeted.
The farmers, further, should be motivated to adopt solar irrigation system through providing
capital subsidy at the initial stage of tube-well installation and later the amount of subsidy
may be recovered from the beneficiaries.
Policy Recommendations:
The technical efficiency of the power system must be improved so that average cost
of supply can be reduced which in turn may reduce the pressure of agriculture power
subsidies on public exchequer.
The state government must ensure 100 per cent metering at consumer ends on priority
basis to estimate precisely actual electricity consumption and amount of subsidy and
to make system transparent and accountable.

57
Serious efforts are required from Regulatory Commission to work out a realistic and
progressive tariff structure reflecting consumer category wise cost of supply.
Subsidised power supply should be targeted to marginal and small farmers. Blind
subsidy is a matter of serious concern. Subsidy to big farmers must be slowly phased
out, at least it should be made transparent to begin with.
Special awareness drives against power theft, energy conservation and energy
efficiency must be launched.
DISCOMs should be managed professionally by the professional managers like
BHEL/NTPC etc.
The state government should devise on priority an effective, accountable and
transparent system to regulate utilisation of ground water. It may also be done through
promoting awareness among the farmers to use optimum number of times of
irrigation.
To regulate excess use of ground water and electricity for paddy crop diversification
may be promoted through increasing minimum support price of non-water intensive
crops.
There is an urgent need to devise a mechanism with transparency and accountability
to release tube-well connections within a specified time period so that contractorship
system may be eliminated to avoid exploitation of the farmers. DISCOMs should
switch over to on line submission of applications and release of electric tube-well
connections in a time bound manner.
The policy of Direct Benefit Transfers (DBT) may be explored in power subsidy
which will require proper metering at consumer ends.
The farmers should be motivated to adopt solar irrigation system through providing
capital subsidy at the initial stage of tube-well installation and later the amount of
subsidy be recovered from the beneficiaries. This will reduce the burden of power
subsidy on public exchequer in long run.
The efforts should be made to generate awareness among farmers regarding rain water
harvesting, watershed development, dry land farming and crop diversification in
favour of protein rich less water intensive crops and energy saving techniques.

58
Selected Bibliography
Ahluwalia S Sanjeev (2000), “Power Tariff Reform in India”, Economic & Political Weekly, Vol. 35, No. 38, pp. 3407.
Bhalla G S (1964), “Economic Theory and Public Enterprise Pricing”, The Indian Economic Journal, Vol. 12, No.2, Oct-Dec, pp. 156-66.
CEA , General Electricity Statistics (various issues), Central Electricity Authority, New Delhi.
CEA (2000), 16th Electric Power Survey of India, Central Electricity Authority, New Delhi CEA (2001), Report of The Inter-Disciplinary Group Appointed By Ministry of Power on
Reduction on the Cost of Power & Transparency in Bidding Process, Central Electricity Authority, New Delhi
Chaudhuri Prabal Ray & Vishvanathan Uma (1994), “Pricing of Electricity: Is Two-part Tariff the Answer”, Indian Economic Review, Vol.29, No.1, pp. 57-69.
Dixit Shantanu, Sant Girish and Wagle Subodh (1998), “Regulation in the WB-Modal: Cure Worse than Disease”, Economic and Political Weekly, Vol. 33 No. 17, pp. 944.
Garg B R & Jain K K (1998), “Impact of Electricity Subsidy for Irrigation in Punjab Agriculture”, Indian Journal of Agriculture Economics, Vol.53, No.3,pp. 309-311.
Ghose Nilabja (1998), “Electricity Use in Indian Agriculture”, Indian Journal of Agriculture Economics, Vol.53, No.3, pp.304-308.
GOH (1998), Haryana Electricity Reform Act 1997, Act no. 10 of 1998, Government of Haryana, Chandigarh. (www.herc.nic.in)
GOH, Statistical Abstract of Haryana (various issue), Planning Department, Govt. of Haryana, Chandigarh.
GOI, Five Year Plan Documents, Planning Commission, Govt. of India, New Delhi. HERC (1998), Issues in the Tariff Philosophy, Haryana Electricity Regulatory Commission, HERC, Tariff Orders on Annual Revenue Requirement (various years), Haryana Electricity
Regulatory Commission, Panchkula. IIPA (2006), Study on Impact of Restructuring of SEBs” Report of Expert Group, Indian
Institute of Public Administration, New Delhi MoP (2006), Performance Report of Power Sector, Ministry of Power, Govt. of India Kannan K P and N Vijayamanmohanan Pillai (2001), Plight of Power Sector in India-II:
Financial performance of SEBs, Economic and Political Weekly, Vol. 36, No. 3, pp. 234-246.
Kumar Surinder (1999), “The State Subsidisation and Pricing Policy in Electricity Supply: A Case Study of Haryana State”, Indian Journal of Power & River Valley Development, Calcutta, March-April,pp.29-39.
Kumar Surinder (2002), Lest the Regulators Be Regulated: Power Sector Reforms in Haryana, Indian Journal of Power and River Valley Development, (May-June), Vol 5&6, Culcutta, pp 87-89.
Kumar Surinder (2004), Electricity Theft: Empowering People and Reforming Power Sector, Manohar Publication, Delhi & Institute for Development and Communication, Chandigarh.
MOP (2001), Memorandum of Understanding (MOU) Between the Ministry of Power, Government of India and Government of Haryana Regarding Power Sector Reforms, Ministry of Power, Government of India, (www.powermin.nic.in).
MOP (2001), Report of the Expert Group on the Settlement of SEBs Dues, Ministry of Power, Government of India, (www.powermin.nic.in)
MOP (2002), Expert Committee Report on Sector Specific Reforms (Power Sector), Ministry of Power, Government of India, (www.powermin.nic.in)

59
Power Finance Corporation: ‘Report on the Performance of Power utilities’ (various issues from 2004-05 to 2009-10)
Rajagopalan Meera & Demaine Harvey (1994), “Issues in Energy Subsidies for Irrigation Pumping”, Energy Policy, Vol.22, No.1, pp.89-95.
Rao S L (2002), “The political Economy of power”, Economic and Political Weekly, Vol. 37, No. 33, pp. 3433-3444
World Bank (2001), India Power Supply to Agriculture, Vol. 1 to 4, Report No 22171-IN, World Bank Document Centre, New Delhi.
Joydeb Sasmal (2014): “Foodgrains Production in India- How Serious is the Shortage of Water Supply for Future Growth”, Indian Journal of Agriculture Economics, Vol.69, No.2, April-June, pp.229-242
O P Singh, Rakesh Singh and Manish Kumar Singh (2014): “Impact of Farm Sector Electricity Subsidy on Water Use Efficiency and Water Productivity in India”, Indian Journal of Agriculture Economics, Vol.69, No.3, July-Sept., pp.404-413.
A.S. Dhindwal, V.K. Phogat and M.S. Dahiya (2009): ‘Report on Efficient Management of Irrigation Water in Haryana’, CCS Haryana Agriculture University, Hisar.