Embed Size (px)
Citation preview
EVALUTATION OF BOND STRENGTH AT ASPHALT INTERFACES
by
MAURICE WHEAT
B.S. CIVIL ENGINEERING, KANSAS STATE UNIVERSITY B.S GEOLOGY, KANSAS STATE UNIVERSITY
A REPORT
submitted in partial fulfillment of the requirements for the degree
MASTER OF SCIENCE
Department of Civil Engineering College of Engineering
KANSAS STATE UNIVERSITY Manhattan, Kansas
2007
Approved by:
Major Professor Dr. Stefan Romanoschi

Copyright
MAURICE WHEAT
2007

Abstract
The primary objective of this research project was to evaluate the shear behavior of three
asphalt-to-asphalt mix interfaces. To accomplish this objective, a special attachment and loading
mechanism was designed and built to facilitate the measurement of the dynamic shear reaction
modulus and shear strength of the asphalt-to-asphalt interfaces when shear and normal forces are
acting simultaneously and they are proportional. Two tests were conducted on 4-inch diameter
cylindrical samples cored from an asphalt concrete pad where three types of asphalt-to- asphalt
interfaces were built. For each interface, four tack-coat quantities were sprayed. On each sample,
the Dynamic Shear Reaction Modulus test was conducted first. Then the Shear Strength test was
conducted until the sample failed in shear at the interface. The experiments suggest that the
shear strength of the interface is affected neither by the interface type nor by the tack-coat
application rate. However, the dynamic shear reaction modulus was affected by both interface
type and by the tack-coat application rate. The lowest moduli were recorded for the interface
between two fine graded asphalt mixes. With very few exceptions, the highest moduli were
obtained for the tack-coat application rate recommended by the construction specification.
iv
Table of Contents
List of Figures ................................................................................................................................. v
List of Tables ................................................................................................................................ vii
Acknowledgements...................................................................................................................... viii
CHAPTER 1 - Introduction ............................................................................................................ 1
Objective..................................................................................................................................... 3
CHAPTER 2 - LITERATURE REVIEW....................................................................................... 5
2.1 Interface Tests....................................................................................................................... 6
2.2 Tack Coat Tests .................................................................................................................. 15
2.3 Summary............................................................................................................................. 18
CHAPTER 3 - METHODOLOGY............................................................................................... 19
3.1. Preparation of Test Specimens ..................................................................................... 19
3.2. Test Configuration Construction ...................................................................................... 25
3.3. Testing .............................................................................................................................. 27
CHAPTER 4 - RESULTS............................................................................................................. 31
4.1- Strength Tests .................................................................................................................... 32
4.2-Dynamic Modulus Tests..................................................................................................... 37
CHAPTER 5 - CONCLUSIONS AND RECOMENDATIONS .................................................. 45
CHAPTER 6 - REFERENCES..................................................................................................... 47
Appendix A - Mix Designs ........................................................................................................... 48

v
List of Figures
Figure 2.1- Slippage Cracking in Hawaii (HAPI, 2007) ................................................................ 6
Figure 2.2- Schematic of Direct Shear Test with Normal Load (Romanoschi, 1999).................... 8
Figure 2.3- Schematic of the Shear Fatigue Test (Romanoschi, 1999) .......................................... 9
Figure 2.4- Schematic of the NCAT Shear Testing Device (West, 2005).................................... 10
Figure 2.5- NCAT Shear Testing Device (West, 2005)................................................................ 10
Figure 2.6- Torque Bond Testing Device and Procedure (Tashman, 2006)................................. 11
Figure 2.7- Superpave Shear Tester (SST) with Test Sample (Tashman, 2006).......................... 13
Figure 2.8- FDOT Shear Tester in use and attachment device (Tashman, 2006)......................... 14
Figure 2.9- Schematic of the Ancona Shear Testing Research and Analysis (Tashman, 2006).. 15
Figure 2.10- DOT UTEP Pull-Off Testing device (Tashman, 2006) ........................................... 16
Figure 2.11- Texas DOT UTEP Pull-Off Testing device in the field (Tashman, 2006)............... 17
Figure 2.12- The ATACKER Device Developed by Instrotek (West, 2005)............................... 17
Figure 3.1- Schematic layout of the asphalt pad constructed by the Shilling Asphalt Company. 20
Figure 3.2- Laid Base Coarse........................................................................................................ 21
Figure 3.3-(Left) Application of the Tack Coat. (Right) The Form Oil Sprayer used to Apply the
Tack....................................................................................................................................... 22
Figure 3.4- (Left) Placing and (Right) Leveling the Asphalt Layer on Top of Coarse Base........ 22
Figure 3.5- Asphalt is almost completely leveled out and ready to be compacted....................... 23
Figure 3.6- Compaction of the second asphalt concrete lift ......................................................... 23
Figure 3.7- Coring Machine used for 4-inch Diameter Core Samples ......................................... 24
Figure 3.8- The Core Samples ...................................................................................................... 24
Figure 3.9- Wet Saw for Sample Cutting...................................................................................... 25
Figure 3.10- The Attachments in the UTM Machine ................................................................... 26
Figure 3.11- The Attachments Placed in the UTM Machine and Ready for Testing ................... 26
Figure 3.12- The LVDT’s and the LVDT Holders ....................................................................... 27
Figure 3.13- A typical Output and Graph of a Dynamic Modulus Test ....................................... 28
Figure 3.14- Typical Output and Graph of a Stress-Strain Test ................................................... 30

vi
Figure 4.1- Interface Shear Strength of Each Sample Tested....................................................... 33
Figure 4.2- Shear Stress-Displacement Curves for the Coarse-Coarse Interface ......................... 34
Figure 4.3- Shear Stress-Displacement Curves for the Coarse-Fine Interface ............................. 34
Figure 4.4- Shear Stress-Displacement Curves for the Fine-Fine Interface ................................. 35
Figure 4.5- Shear Stress-Displacement Curves for Interfaces with No Tack Coat ...................... 35
Figure 4.6- Shear Stress-Displacement Curves for Interfaces with 1/2 Specification Tack Coat 36
Figure 4.7- Shear Stress-Displacement Curves for Interfaces with Specification Tack Coat ...... 36
Figure 4.8- Shear Stress-Displacement Curves for Interfaces with 1.5 Specification Tack Coat 37
Figure 4.9- Dynamic Shear Modulus of Coarse-Coarse Interface at 20-degree Angle ................ 40
Figure 4.10- Dynamic Shear Modulus of Coarse-Fine Interface at 20-degree Angle .................. 41
Figure 4.11- Dynamic Shear Modulus of Fine-Fine Interface at 20-degree Angle ...................... 41
Figure 4.12- Dynamic Shear Modulus of Coarse-Coarse Interface at 30-degree Angle .............. 42
Figure 4.13- Dynamic Shear Modulus of Coarse-Fine Interface at 30-degree Angle .................. 42
Figure 4.14- Dynamic Shear Modulus of Fine-Fine Interface at 30-degree Angle ...................... 43
Figure 4.15- Dynamic Shear Modulus at 10 Hz at Different Angles ........................................... 43
vii
List of Tables
Table 3.1- Definition of Sample Labels........................................................................................ 20
Table 4.1- Shear Strength Test Results at 30-degree Angle ......................................................... 32
Table 4.2- Dynamic Shear Reaction Modulus Test Results ......................................................... 38
Table 4.3- Phase Angle Test Results ............................................................................................ 39
Table 6.1- Single Point gradation of Base Mix # 1....................................................................... 48
Table 6.2-Single Point gradation of Base Mix # 2........................................................................ 48
Table 6.3- Single Point gradation of Fine Mix (SR-12.5A) ......................................................... 48

viii
Acknowledgements
I would like to express my appreciation and thank my advisor, Dr. Stefan Romanoschi,
for providing me the opportunity to do this research. I would also like to thank him for his
guidance and assistance on the project.
Also I am grateful to Dr. Dunja Peric, Dr. Yacoub Najjar, and Dr. Mustaque Hossain for
serving on my committee. I would like to thank them for their help in preparing this report.
This study was supported by the University Transportation Center of Kansas State
University. I am grateful to them for giving me this opportunity.
I would also like to thank Paul Lewis for his help and work on this project with the
construction of the asphalt samples and for his advice, Mbaki Onyango for her guidance and
training with the UTM machine in the KSU Advanced Asphalt Laboratory, and to Dave Suhling
for his help in the KSU Steel Shop with the construction of the UTM machine attachments.

1
CHAPTER 1 - Introduction
In the United States pavements play a major role in the daily lives of the people. The
transportation cost’s in the US contributes 11% of the Nation’s gross domestic product, totaling
around $950 billion. The average total cost of transportation (including the cost of vehicles) for
a household in the US is about 19% of total spending (Transportation, 2007).
There are more than 4.7 trillion passenger miles and more than 3.7 trillion ton miles that
are transported in the US each year on its road networks (Transportation, 2007). Due to this
significant volume, the road networks construction and maintenance costs account for more than
half of the total funds spent on all highway expenditures. Therefore more durable and more
economical ways of designing and constructing pavements is necessary; with the more advances
that are made in pavement design the cheaper and more reliable the pavement infrastructure will
become. Thus, advances in this engineering area have the potential to lead to significant
monetary savings.
A proper pavement design is essential to a successful and long lasting pavement
structure. The design process typically includes the selection and design of materials,
determination of layer thickness depending on traffic volumes and environmental conditions,
pavement configuration, and drainage design. All of these components must be considered for a
long lasting, low maintenance, and well performing pavement structure (Romanoschi, 1999).
Pavement structures are designed using empirical methods or mechanistic-empirical
methods (Romanoschi, 1999). In empirical methods, the relationship between the design inputs
(layer thickness, material properties, traffic and environmental conditions) and pavement
performance are determined through experience or experimentation. There are limitations to
using this approach but as long as they are recognized as reasonable, these methods can be used
with confidence (HAPI, 2007).
The mechanistic-empirical methods are more advanced than the purely empirical method.
The mechanistic part of this approach estimates pavement response (stresses, strains, deflections)
considering the type of vehicle loads and material properties of the pavement structure and
environmental conditions based on the fundamental laws of physics and mechanics of materials
(Romanoschi, 1999). The relationship between loading conditions and pavement response are
2
usually described using mathematical models. The empirical part of the mechanistic-empirical
methods estimates pavement distresses (cracking, rutting, joint faulting, roughness of the
longitudinal profile), and thus pavement performance, from the pavement response (HAPI,
2007).
One assumption in the structural response model for flexible pavements is that the asphalt
layers and completely bonded to each other, when in all reality they may not be. There is no
widely accepted test method for measuring the degree of bonding between pavement layers.
Without proper modeling of the bond between layers, the calculation of pavement response, and
thus the design of the flexible pavement structures, cannot be accurate.
Asphalt pavement layers cannot be constructed in one single lift if the layer thickness is
higher than 2.5 to 3.0 inches because thicker lifts cannot be compacted efficiently with the
nowadays equipment. Therefore, asphalt concrete layers are typically constructed in lifts with a
maximum thickness of 2 to 2.5 inches. Therefore, the construction of interfaces between layers
cannot be avoided.
To achieve a good bond between layers tack coat is usually sprayed in between asphalt
pavement layers. The material can play a large role in the successful bonding of asphalt layers.
The tack material can be asphalt emulsions (slow, medium, and fast setting), cutback asphalts,
high float emulsions, polymer modified asphalt emulsions, and paving grade asphalt cements.
The most commonly used tack material is asphalt emulsion. Another factor to consider when
applying tack coat is the application rate. Too much or to little tack coat can result in a poor
bond. Also, before the tack coat is sprayed, the surface where asphalt is to be placed it must be
clean and debris free. Dirt and fine dust can significantly inhibit bonding of the layers. The
surface is most commonly cleaned with a power broom (West, 2005).
The tack coat is only used if the next of pavement is placed more than two days after the
underlying lift. So if the lifts are placed sooner than two days, no tack coat is typically used
between the layers. The reason for this is that after two days the tack coat is needed to improve
the bond strength between the layers. The bonding between the layers is also improved if the
surface is cleaned before placing the next lift of pavement.
Poor bonding between pavement layers can cause many distresses. One of the most
common distress is slippage failure, which usually occurs where heavy vehicles are often
accelerating, decelerating, or turning. The vehicles load creates dynamic normal and tangential

3
stresses in the pavement interfaces from horizontal and vertical loads. With the vehicles load
being transferred to each underlying layer of asphalt, the interface between the layers is vital to
the pavements integrity. Slippage failure develops when the pavement layers begin to slide on
one another usually with the top layer separating from the lower layer. This is caused by a lack
of bond and a high enough horizontal force to cause the two layers to begin to separate (Hachiya,
1997). Other pavement problems that have been linked to poor bond strength between pavement
layers include premature fatigue, top down cracking, potholes, and surface layer delamination
(NAPA, 2000).
As stated before poor bonding can result in slippage failure, delamination, top down
cracking, potholes, and premature fatigue. With the presence of anyone of these, the pavement
structure’s integrity is compromised and pavements begin to fail quickly. With pavement layer
bonding being so important to the integrity of the structure, improvements to the design process
by incorporating interface models are necessary. This will more than likely lead to lower
maintenance and rehabilitation costs (Romanoschi, 1999).
Objective The objective of this research project is to evaluate the shear behavior of three asphalt-to-asphalt
mix interfaces, with different quantities of tack coat. This will include determining the dynamic
shear reaction modulus and strength of the interfaces.
The first phase of this study is to conduct a literature search. The purpose of this
literature review is to gather information on previous studies on interfaces between materials and
on laboratory tests for the determination of mechanical properties of interfaces.
The next phase of the study is to conduct laboratory tests on layer interfaces constructed
prepared in the field. Four-inch diameter cylindrical specimens will be made in the field and
cored. From there they will be brought into the laboratory for testing. To conduct the laboratory
tests, a special attachment and loading mechanism will be built to fit the IPC loading machine in
the Advanced Asphalt Laboratory of Kansas State University. Three asphalt-to-asphalt mix
interfaces with different quantities of tack coat will be tested under dynamic shear test with
normal load to measure the dynamic shear reaction modulus and strength of the interfaces.
These tests will be performed at several loading magnitudes and frequencies.

4
Graphical plots of the test results will be developed to determine the influence of the
characteristics of the interface material on the mechanical properties of the interface.
A report will be written that will give detailed information on the development of
laboratory tests and the findings of the statistical analysis. Also included in this report will be
recommendations for further research.
5
CHAPTER 2 - LITERATURE REVIEW
When dealing with most flexible pavements, the pavement structure is typically
constructed using more than one lift (depending on thickness). The bonding at the interfaces of
the individual layers is very important to the structures performance. If the pavement layers are
not fully bonded, the magnitude and location of critical strain will be different than when the
layers were completely bonded (Romanoschi, 1999). For this reason it is important to ensure a
proper bond so that pavement performance can be maximized and predicted. Several studies
have been done to study the effects of tack coat and bonding. The studies have included varying
temperatures, tack coat application rate, tack coat material and loading conditions.
A world wide survey done in 1999 by the Bitumen Emulsion Federation was conducted
to determine the most common type of tack material used, the rates at which they were applied,
curing time, test methods, and construction methods. The survey concluded that the most
common type of tack material used was cationic emulsions. The average rate of application was
found to be from 0.026 to 0.088 gal/sq.yd, which was based on residual asphalt (West, 2005).
When a proper bond has not formed, the most common failure of the pavement is
slippage cracking. Slippage cracking occurs where vehicles are usually decelerating,
accelerating, or turning. The top layer will begin to slide and separate from the layer beneath it
and will result in a half moon shaped crack opening away from the direction of movement an
example of this can be seen in Figure 2.1 (Romanoschi, 1999).

6
Figure 2.1- Slippage Cracking in Hawaii (HAPI, 2007)
2.1 Interface Tests Many studies have been done to analyze the behavior interfaces of asphalt pavements.
Of these studies some were inconclusive and some lead to significant findings. One study with
inconclusive findings was conducted by (Korkmaz, 2003). This study was to evaluate a
laboratory testing procedure for analyzing tack materials used at asphalt interfaces. The tack
coat performance was to be evaluated using the Hamburg wheel tracking device and simple shear
tests on laboratory samples. In this particular study the performance of thin asphalt concrete
overlays on concrete pavements was evaluated. Four variables were considered: tack coat type,
mix type, application rate, and trafficking. The shear test applied a shear load at a constant rate
of 50mm/min and was conducted at 20°C. The Hamburg wheel tests were conducted at 50°C. It
was found the trafficking improved the shear strength of the interfaces at 5,000 cycles. For this
reason it was recommended to repeat the experiment at a higher number of cycles at a lower
temperature and up to 20,000 cycles (Korkmaz, 2003).
A specific apparatus was developed for this study to hold the specimens during the
testing. This was developed specifically to induce failure at the asphalt interfaces. The
specimen holders were 150 mm in diameter and 50.8 mm deep. The testing of these samples
used this apparatus and the Superpave Shear Tester (SST). At the end of the study it was
concluded that the addition of a tack material at the interfaces does add shear strength. The tack

7
material that was found to perform the best was CRS 2P with an optimum application rate of
0.02 gal/sq.yd.
A study conducted at Delft University of Technology (Molenaar, 1986) used a simple
shear test to determine the shear resistance at the interface between asphalt layers. The shear
resistance test was done on interfaces with and without a tack coat. This particular device held
the bottom part of the compacted cylinder and a shear load was applied perpendicular to the axis
of the cylinder of the top layer. The load was transferred to the interface of the asphalt layers
and the resistance could then be measured. The device was used in conjunction with a standard
Marshall stability loading press, which applied a load at a rate of 0.85 mm/sec. Their findings
were that at, 15oC, there was no significant difference between the interfaces with and without a
tack coat (West, 2005).
A testing method that is currently being used in the UK involves testing in the field. This
test is simply referred to as an in-situ torque test. A core is drilled in the asphalt and the core left
in place. Then a plate is attached to the top of the core at the surface of the asphalt and a torque
is applied. The torque is applied with a torque wrench so that the force can be recorded. The
torque is applied to the core until it fails and the final torque applied is recorded (West, 2005).
No other detailed information about this test was found.
Romanoschi (1999) conducted direct shear tests at a constant normal load on asphalt-to-
asphalt interfaces to study the mechanical behavior of the interface. It included tests on
interfaces with and without tack coat, three temperature levels (15oC, 25oC, and 35oC), and
different normal stresses at the interface of approximately 138, 276, 414, and 552 kPa. In this
test, the asphalt core sample was fixed in a split steel ring with the interface at the end of the
steel ring. Then the half that is sticking out is fixed in a steel cup that is welded to a vertical
plate. A vertical actuator then pushes on top of the split steel ring, which puts a shearing force at
the interface while a horizontal actuator applies a constant, normal stress at the interface. The
maximum shear stress that could be applied (because of equipment limitations) was 663 kPa
(Romanoschi, 1999).

8
Figure 2.2- Schematic of Direct Shear Test with Normal Load (Romanoschi, 1999)
In the same study, Romanoschi (1999) performed interface fatigue test using a device to
hold cored specimens with the axis at an angle with the direction of load application. The
asphalt specimens were placed in two metal cups spaced at 5 mm. The device was designed such
that adjustments could be made so that the asphalt interface could always be in between the two
cups. The cups holding the specimens were attached to metal angle pieces so that the cups were
at angle of 25.5 degrees with the direction of the applied force. This angle was chosen because
at this angle the shear pressure at the interface is half to the normal pressure. This is important
because this is the average ratio between the vertical and horizontal forces applied at the
interfaces between asphalt layers under the passing of wheel loads. An actuator placed on the top
of the metal angle that was holding the cup applied a vertical force, which was then transferred
by the device holding the specimen to asphalt interface. A schematic of this testing device is
shown in Figure 2.3 (Romanoschi, 1999).

9
Figure 2.3- Schematic of the Shear Fatigue Test (Romanoschi, 1999)
There are several test methods that are in use today to evaluate asphalt interfaces of
different layers of asphalt layers. These tests include: NCAT Shear test, Torque Bond Test,
Superpave Shear Tester (SST), FDOT Shear Tester, and ASTRA from Italy.
The NCAT Shear test is a shear type test. The loading can be applied using a Marshall
press or a universal loading machine. This test has had many improvements over the years. One
of the main improvements that it has under gone over the years was the added ability to apply a
horizontal load. Similar to other methods this is a device that is placed in an MTS machine to
test core samples. It is loaded at a rate of 2 in/min (50.8 mm/min) and is tested at a constant
temperature, which is maintained in the testing chamber. A schematic is given in Figure 2.4
(West, 2005).

10
Figure 2.4- Schematic of the NCAT Shear Testing Device (West, 2005)
Figure 2.5- NCAT Shear Testing Device (West, 2005)

11
The Torque Bond Test was developed in Sweden for in-situ testing asphalt interfaces. In
this relatively simple test, the asphalt concrete is cored to a depth that is deeper than the interface
in question and the core is then left in place. Then a metal plate is glued to the top of the
specimen and from there a torque is applied to the top of the core until failure occurs. The torque
that was required to cause the shear failure will then indicate the tack coat strength. This test is
generally used on interfaces between thin surfacing and its underlying layer. There have also
been laboratory studies with this procedure, which is fundamentally the same procedure except
that the core is removed and placed in a clamping device (Figure 2.6). The clamping device
holds the bottom layer below the interface while the torque is applied to the top of the core. The
major findings of this study were that the interfaces on milled sections of pavement had
significantly higher shear strength when compared to those of non-milled sections. It was also
found that curing time doesn’t influence the strength at the interface, and that for the milled
surfaces tack coat made a significant difference in strength as opposed to using no tack-coat
(Tashman, 2006).
Figure 2.6- Torque Bond Testing Device and Procedure (Tashman, 2006)

12
A study conducted by Mohammad et al. (2002) using the Superpave Shear Tester aimed to
determine the optimum tack coat type and the optimum application rate. The Superpave Shear
Tester (SST) can apply axial loads, shear loads, confinement pressures to asphalt specimens with
controlled temperatures. This machine is a closed-loop feedback, servo-hydraulic system and
has six main components: testing chamber, test control system, environmental system, hydraulic
system, air pressurization system, and measurement transducers. This machine usually tests
specimens that have a height of 50 mm and a diameter of 150 mm although it can accommodate
specimens with heights and diameters up to 200 mm. When determining the shear strength of
the tack coat, the specimen is placed on the shear table inside the testing chamber and the
temperature is then stabilized. The machine will then apply shear and normal forces to the
interface. A picture of the testing chamber with a specimen in it is shown in Figure 2.6. This
machine is preprogrammed to perform several different tests: volumetric uniaxial strain, repeated
shear at constant height, repeated shear at constant stress ratio, simple shear at constant height,
and frequency sweep at constant height.
The objective of the study by Mohammad et al. (2002) was to evaluate the practice of
using tack materials on asphalt interfaces. To accomplish this several tack materials were
considered. The tack materials included two types of asphalt cements, PG 64-22 and PG 76-
22M and four types of emulsions, CRS-2P, SS-1, CSS-1, and SS-1h. Five rates of application
were considered: no tack material, 0.02 gal/sq.yd, 0.05 gal/sq.yd, 0.10 gal/sq.yd, and 0.2
gal/sq.yd. This study was conducted at two temperatures 77oF and 131oF (25°C and 55°C) to
determine the effect of temperature on the tack materials shear strength. The results of this test
showed that the tests at 25oC yielded approximately 5 times the shear strengths at 55oC. Also, it
was found that the tests at 25°C distinguish better the different tack coat application rates (West,
2005).

13
Figure 2.7- Superpave Shear Tester (SST) with Test Sample (Tashman, 2006)
The Florida DOT Shear Tester was developed in 2003 to address the need for a test to
evaluate tack coat strength. This tester makes use of the standard universal testing machine
MTS. This tester is basically an attachment, which fits inside the universal machine. This
device uses 6-inch diameter cores and the interface is placed in between the gap of the two ring
sets. The gap between the two rings should be 3/16 inch. The specimen is brought to a
temperature of 25oC plus or minus 1oC for a minimum of two hours before testing. When the
core is placed in the ring sets it is placed so that the direction of load on the core is parallel the
shear direction. The test is strain controlled and will load at a rate of 2-in/min until failure.
From there the shear strength can be calculated. Also, in this study water was sprayed on two
sections with tack coat on them to simulate rain. Their findings were that water significantly
reduces the bond strength. Also concluded from this study was that all interfaces gained bond
strength with time (West, 2005).

14
Another study conducted by the Washington Center for Asphalt Technology using the
Florida DOT Shear Tester found that milled sections of pavements had a significantly higher
shear strength than the non-milled sections, that the shear strength at the interface was not
affected by the location of the load, and that tack coat did not have an impact of the performance
of the non-milled sections while it greatly affected the milled sections (Tashman, 2006). This
method is now used by the Florida DOT to evaluate the bonding of an interface if there is a
question of bond integrity (West, 2005).
Figure 2.8- FDOT Shear Tester in use and attachment device (Tashman, 2006)

15
In Italy a device called the Ancona Shear Testing Research and Analysis (ASTRA) is
used to determine the bond strength of tack coats. This device had many improvements since it
was first developed more than ten years ago. This device operates by applying a normal load to
the specimen while in shear. The specimen is sheared at a rate of 0.1 in/min (2.5 mm/min). A
schematic of this device can be seen below.
Figure 2.9- Schematic of the Ancona Shear Testing Research and Analysis (Tashman, 2006)
2.2 Tack Coat Tests In addition to the tests developed to evaluate the mechanical properties of interfaces,
several other tests have been developed to evaluate the tack coat by itself. Two of those tests are
the Texas DOT UTEP Pull-Off Test and the ATACKER Device that was developed by Instrotek.
The Texas DOT UTEP Pull-Off Test was developed at the University of Texas at El Paso
(Tashman, 2006). This device measures the bond strength of the tack material. The pivoting
feet shown in Figure 2.10 are used to level the device before the test begins. This device is
placed on the pavement after the tack coat has been placed and then it is leveled. The contact
plate is then lowered until it is contact with the tack coat. A 40 lb load is placed on top and then
the contact plate is allowed to set for 10 minutes to set the contact plate. After 10 minutes, the
load is removed and the torque wrench is rotated counter clockwise until the contact plate has
broken away from the tack coat material. The force that was needed to remove the contact plate
from the tack material is recorded. The reading from the torque wrench is then converted to the

16
strength of the tack material using a calibration factor. The equation used to find the UTEP Pull-
Off Strength is UTEP Pull-Off Strength= overall mean + effect due to Surface Condition + effect
of Residual Rate within the Surface Condition + effect due to testing time + random errors. A
study conducted by the Washington Center for Asphalt Technology involved the UTEP Pull-Off
Strength test at different surface conditions. The study was able to conclude that milled sections
of pavement had a lower tensile strength than the non-milled road surfaces. They speculated this
is due to lesser contact area. Another finding from this study is that the bond strength decreases
with time (Tashman, 2006).
Figure 2.10- DOT UTEP Pull-Off Testing device (Tashman, 2006)

17
Figure 2.11- Texas DOT UTEP Pull-Off Testing device in the field (Tashman, 2006)
The Attacker device is also a machine used to evaluate the bond strength of tack coats. It
was developed by Instrotek, Inc and can be seen in Figure 2.12. The tack coat material can be
applied to a metal plate, a pavement surface, or a hot-mix-asphalt (HMA) sample and then a
metal disc will lower to make contact with whatever surface has the tack coat material applied to
it. This machine can measure the bond strength of the tack material in two ways: tensile or
torsion mode (West, 2005).
Figure 2.12- The ATACKER Device Developed by Instrotek (West, 2005)

18
2.3 Summary
The performance of pavements currently in service today proves that bonding between
pavement layers is critical. The bonding of the layers affects how stresses and strains are
distributed throughout the pavement, which ultimately affects the overall performance of the
pavement structure. There are many different tests that attempt to measure the bonding at the
interface and also the strength of the bonding material. With the rising cost of pavements more
testing is needed to develop more realistic models for pavement structures. These tests should
replicate as close as possible the same conditions that the pavement is subjected in the field.
Thus, a normal load should be applied simultaneously with a shear force.

19
CHAPTER 3 - METHODOLOGY
This chapter discusses the work done to conduct the experimental work. To start, details
on how the specimens were prepared will be discussed from planning to construction. This
chapter will include details of sample identification numbers, how the asphalt pad was
constructed, including the tack coat application process, and the coring process. Once the
samples were brought to the laboratory from the field a wet saw was used to make a smooth flat
surface on the bottom. The testing configuration for the attachment that fits within the UTM
machine will be discussed. Then once the samples are loaded into the apparatus and securely
fastened they are ready to be tested. Two tests will be conducted on each sample once they are
loaded into the apparatus the Dynamic Modulus Test and the Stress-Strain Test (Strength Test).
3.1. Preparation of Test Specimens
To begin this research the Shilling Asphalt Company in Manhattan, Kansas was first
contacted so that a work plan could be discussed. Three asphalt interfaces were built: a coarse-
coarse mix interface, coarse-fine mix interface, and fine-fine mix interface (Figure 3.1). Each of
these asphalt combinations was divided into four equal parts and different amounts of tack
quantities sprayed on each section: no tack coat, 1/2 specification (11 grams per square foot),
specification (21 grams per square foot), and 1.5 specification (approx. 32 grams per square
foot), making a total of 12 different combinations. The layout of the pavement construction is
shown in Figure 3.1. The individual combinations were then labeled as shown in Table 3.1.
Some coordination was necessary because the asphalt plant usually makes one type of
mix at a time. In mid July, Shilling Construction laid an approximately 20-foot section about 4
inches thick of a 12.5A (see appendix A for mix design) mix at the KSU research facility CISL.
In late July, Shilling returned and laid an approximately 15-foot section about four-inches thick
of a BM1 (see appendix A for mix design) mix, BM1 is coarse mix, and 12.5A is fine mix. Now
with the base course laid, the next step was to apply the tack coat.

20
Table 3.1- Definition of Sample Labels
Asphalt Mixture Combinations Tack Quantities Coarse-Coarse Coarse-Fine Fine-Fine No Tack Coat 4 8 12
½ Specification 3 7 11 Specification 2 6 10
1 ½ Specification 1 5 9
Figure 3.1- Schematic layout of the asphalt pad constructed by the Shilling Asphalt Company

21
Figure 3.2- Laid Base Coarse
The tack coat was applied with an industrial form oil sprayer (Chapin - model 1949). To
measure the amount of tack coat being applied several 12 in by 12 in square boards were cut and
tack coat was sprayed on them at the same application rate as on the asphalt pad. The weight of
the boards was then measured before and after the tack coat was applied on them. This way the
rate of tack coat application was measured.
Four quantities of tack coat were sprayed:
• No tack at all,
• Half of the specification rate (approximately 11 grams per square foot),
• Specification rate (approximately 21 grams per square foot),
• 1.5 times the specification rate (approximately 32 grams per square foot).

22
Figure 3.3-(Left) Application of the Tack Coat. (Right) The Form Oil Sprayer used to Apply the Tack
The next lift of asphalt mix was then placed. A coarse-graded mix was laid across
approximately 10 feet of the fine-graded mix and 10 feet of the coarse mix. This resulted in the
coarse-coarse and coarse-fine mix interface. Next a fine-graded mix was laid was laid on the
fine-graded mix base coarse, to obtain the fine-fine mix interface. This process can be seen in
Figure 3.4.
Figure 3.4- (Left) Placing and (Right) Leveling the Asphalt Layer on Top of Coarse Base

23
Figure 3.5- Asphalt is almost completely leveled out and ready to be compacted
Figure 3.6- Compaction of the second asphalt concrete lift
After the second lifts of asphalt concrete had been placed it was allowed to set for a few
days before taking the core samples. A coring machine was used to take four-inch diameter core
samples as shown in Figure 3.7.

24
Figure 3.7- Coring Machine used for 4-inch Diameter Core Samples
Figure 3.8- The Core Samples
When coring the samples with coarse-fine mix interface with no tack coat (specimen # 8),
all samples separated at the interface before they could be removed from the hole. This failure
may be attributed to a weak bond between layers at the interface. Also when coring the samples
for the fine-fine asphalt mix interface with no tack coat, several samples separated before being
removed from the hole so multiple cores had to be cut to obtain enough intact samples. The two
layers of asphalt separated during coring because the layers did not bond well enough to
withstand the shear force exerted at the interface.

25
After coring, the bottom of the samples was cut with a wet saw. This was necessary
because, due to the way the samples were constructed, the bottoms were rough and uneven. This
would cause uneven load distribution when the interfaces are tested in shear with normal load.
Figure 3.9- Wet Saw for Sample Cutting
3.2. Test Configuration Construction After saw cutting the samples they were ready to be tested. Before testing could begin,
two attachments for the Universal Testing Machine (UTM) of the Advanced Asphalt Laboratory
machine had to be built. The steel attachments were fabricated at Express Steel located in
Shawnee, Kansas and then finished in the shop at KSU. Each attachment weighs 56.8 lbs. With
the asphalt cores (4 inches in diameter) supporting the weight of the top attachment, a preloading
stress of 4.52 psi is applied at the interface due to the weight of the steel attachment alone. The
individual attachments can be viewed and the attachments in working setup can be viewed in
Figure 3.11.

26
Figure 3.10- The Attachments in the UTM Machine
Figure 3.11- The Attachments Placed in the UTM Machine and Ready for Testing
Special holders for the LVDT’s were constructed out of plexi-glass. Three LVDT’s were
used to measure displacement: two were set up to measure normal displacement and one LVDT
to measure radial displacement, as shown in Figure 3.12. (the yellow arrows are pointing to the
axial LVDT holders and the red arrow is pointing to the radial LVDT holder).

27
Figure 3.12- The LVDT’s and the LVDT Holders
3.3. Testing At the beginning of the test, the core samples were placed into the lower attachment and
secured tightly. Then the lower attachment was raised up to meet the upper attachment. After the
core was placed into the cup on the upper attachment, the bolts were tightened to securely fasten
the core in the cup of the upper attachment. After the table holding the attachments was raised to
meet the actuator or the actuator was lowered to meet the attachments. The actuator came down
to meet a circular piece of metal with a notch cut in it for the actuator to sit in. This circular
plate then sat on a ball bearing plate to allow the top attachment to move freely in the horizontal
direction without applying any horizontal forces to the actuator. This can be seen in Figure 3.11
with the yellow arrow identifying these pieces.
Now with the core securely fastened and the actuator in place, the Dynamic Shear
Reaction Modulus test was run first. In this test the actuator applies a vertical pulsating force on
the interface at several different frequencies. These frequencies are 25, 10, 5, 1, 0.5, and 0.1 Hz.
The readings during this test were taken from the 3 LVDT’s installed on the attachments. The
two different angles that the specimens were tested at were an angle of 20o and 30o. To begin
this test you must open the program specifically for the Dynamic Modulus test. There is some

28
information that must be input such as core diameter, length, sample identification, and
comments if desired. Once all the information is input and the testing options have been selected
the LVDT’s must be set. A screen will come up with showing the LVDT’s readings, so that the
LVDT’s could be adjusted to have the initial reading at their midpoint range. Once the program
is started, the test commences first with the loading at 25Hz frequency and continues with the
loading at the remaining frequencies, in decreasing order; the last loading frequency is 0.1 Hz.
This test took approximately 5 minutes from start to finish.
Figure 3.13 shows the typical output from the Dynamic Modulus Test. As mentioned
before, the test is run at several frequencies starting with 25 Hz and stopping at 0.1 Hz. The test
records the data in columns for each frequency, which includes dynamic modulus, phase angle,
dynamic stress, recoverable axial micro-strain, permanent axial micro-strain, and the temperature
of the sample at the time it was tested. The data shown in this case is based on the summed
average, which can be changed via options on the left side of the Figure. The graph shown in
Figure 3.13 displays the stress (kPa) vs. time (sec).
Figure 3.13- A typical Output and Graph of a Dynamic Modulus Test

29
A Shear Strength test was run on the sample after the Dynamic Modulus test was
finished. This test was performed to determine the shear strength of the interfaces. The on-
specimen mounted LVDT’s were removed to avoid their deterioration when the interface fails.
So the actuator displacement was used to measure the displacement in this test. A maximum
displacement of 10mm and the displacement rate of 0.05mm/sec of the vertical actuator were
used in the Shear Strength test.
This test was performed for two angles between the normal direction to the interface and
the direction of the applied load: 20o and 30o. This test was conducted immediately after the
Dynamic Shear Reaction Modulus test, because the samples were already fastened and put in
place.
Another program specifically for the Shear Strength tests was used for this test. Once the
program is open, the required information is keyed in: core length, core diameter, core
identification number, the displacement rate, and the maximum displacement of the actuator.
Figure 3.14 shows a typical screen capture during the shear strength test, with the vertical
load vs. shear deformation at the interface during the test. It can be observed that the
deformation increases with the applied load until the maximum load is reached. At that point,
the interface fails and the two layers at the interface continue to move relative to each other, but
under lesser stress. The relative information shown in Figure 3.14 is the compressive stress,
which multiplied by the sine of the angle, at which the sample was being tested to find the shear
stress and the actuator deformation, which was also multiplied, by the sine of the angle at which
the sample was being tested to find the shear displacement.

30
Figure 3.14- Typical Output and Graph of a Stress-Strain Test

31
CHAPTER 4 - RESULTS
In general, all interfaces tested with varying tack coat application rates had roughly the
same shape of strength curves. Also, in general the ultimate strength values were all very close
to each other, only varying 3 to 4 kPa. These findings would suggest that the tack coat
application rate does not have an effect on the ultimate strength of the bonding of the asphalt
layers when they are under a normal load. However, when not subjected to a normal load this
could be different because there were a few problems with cores separating while they were
being cut. All samples with no tack coat with the coarse-fine interface separated during the
coring process and several of the fine-fine interfaces with no tack coat did as well.
The first round of tests was conducted with the apparatus set at an angle of 30 degrees
and at a temperature of 20°C. This seemed to work fine for both the Dynamic Modulus tests and
the Strength tests. The weight of the upper attachment did, however, break some samples before
they could be tested: two of the #12 samples and one of the #10 samples.
After this, it was attempted to test at 45 degrees angle between the actuator and the
interface and at the temperature of 20°C. At this angle, the shear component of the dead weight
of the upper attachment sheared the sample at the interface of all samples before testing could
begin. Thus, the 45-degree angle was found to be too large, so the testing was continued for the
angle between the actuator and the normal to the interface of 20 degrees.
At this new angle, the Dynamic Shear Reaction Modulus Tests were conducted first.
However, when the strength test was performed, it was found that, for this reduced angle, the
normal stress at the interface was too high, and failure of the interface in shear was not induced
anymore; the samples were failing in compression. Therefore, no strength tests were performed
for the 20-degree angle.
32
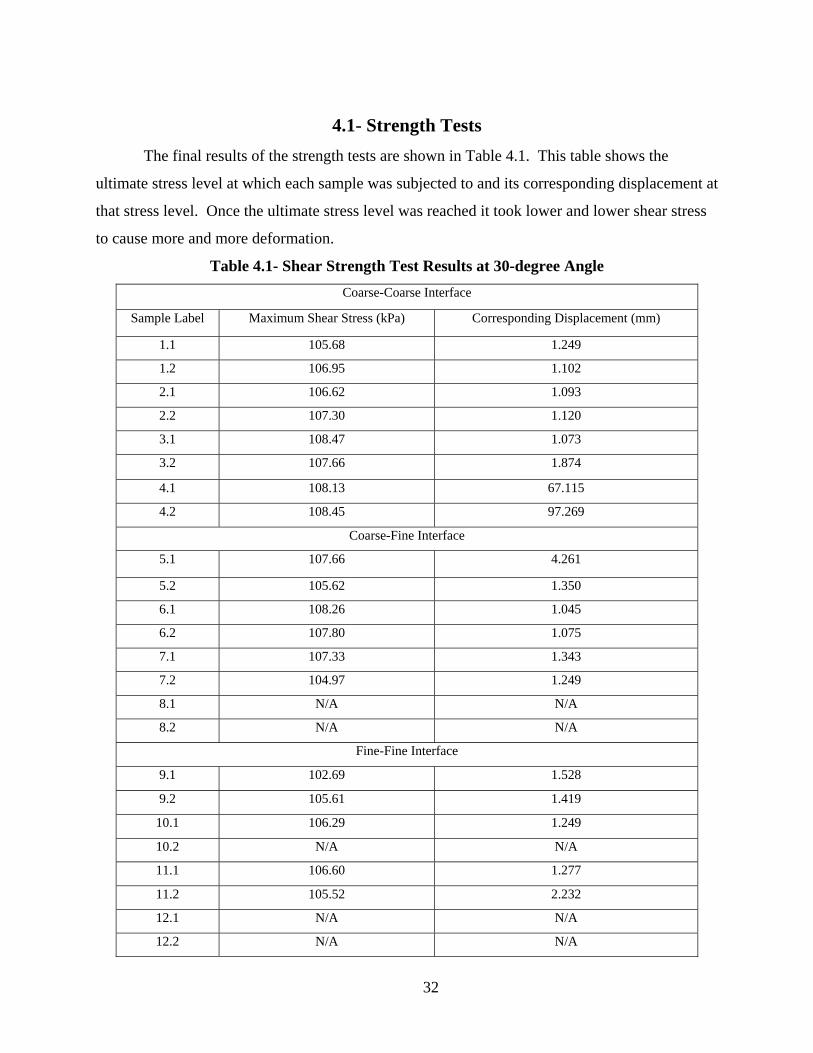
4.1- Strength Tests The final results of the strength tests are shown in Table 4.1. This table shows the
ultimate stress level at which each sample was subjected to and its corresponding displacement at
that stress level. Once the ultimate stress level was reached it took lower and lower shear stress
to cause more and more deformation.
Table 4.1- Shear Strength Test Results at 30-degree Angle Coarse-Coarse Interface
Sample Label Maximum Shear Stress (kPa) Corresponding Displacement (mm)
1.1 105.68 1.249
1.2 106.95 1.102
2.1 106.62 1.093
2.2 107.30 1.120
3.1 108.47 1.073
3.2 107.66 1.874
4.1 108.13 67.115
4.2 108.45 97.269
Coarse-Fine Interface
5.1 107.66 4.261
5.2 105.62 1.350
6.1 108.26 1.045
6.2 107.80 1.075
7.1 107.33 1.343
7.2 104.97 1.249
8.1 N/A N/A
8.2 N/A N/A
Fine-Fine Interface
9.1 102.69 1.528
9.2 105.61 1.419
10.1 106.29 1.249
10.2 N/A N/A
11.1 106.60 1.277
11.2 105.52 2.232
12.1 N/A N/A
12.2 N/A N/A

33
Figure 4.1- Interface Shear Strength of Each Sample Tested
Interface Shear Strength
99
100
101
102
103
104
105
106
107
108
109
1.5 Spec Spec 1/2 Spec No Tack
Tack Coat Quantity
Shea
r Str
engt
h (k
Pa)
Coarse-Coarse
Coarse-Fine
Fine-Fine
Figure 4.1 suggests that the ultimate shear strength of the interface does not depend
significantly on the quantity of tack coat for any of the three interfaces. All samples except one
had an ultimate strength between 105 kPa and 109 kPa. This is not really a significant
difference. For the coarse-coarse mixes interface, the shear strength decreases when the applied
tack coat quantity increases.
The results of the strength tests have been plotted next to each other to aid in comparing
the results. The data has been grouped in two ways. One way the data was grouped to compare
was the effect of the rate of tack-coat application for interface type (Figures 4.2 to 4.4). The
second grouping was done to compare the effect of the three-interface types, for the same tack-
coat application rate.

34
Figure 4.2- Shear Stress-Displacement Curves for the Coarse-Coarse Interface
Coarse-Coarse Interface
0
20
40
60
80
100
120
0 1 2 3 4 5 6
Shear Displacement (mm)
Stre
ss S
tres
s (k
pa)
1.5 Tack-11.5 Tack-2Tack-1Tack-21/2 Tack-11/2 Tack-2no tack-1no tack-2
Figure 4.3- Shear Stress-Displacement Curves for the Coarse-Fine Interface
Coarse-Fine Interface
0
20
40
60
80
100
120
0 1 2 3 4 5 6
Shear Displacement (mm)
Shea
r Str
ess
(kpa
) 1.5 Tack-11.5 Tack-2Tack-1Tack-21/2 Tack-11/2 Tack-2
35
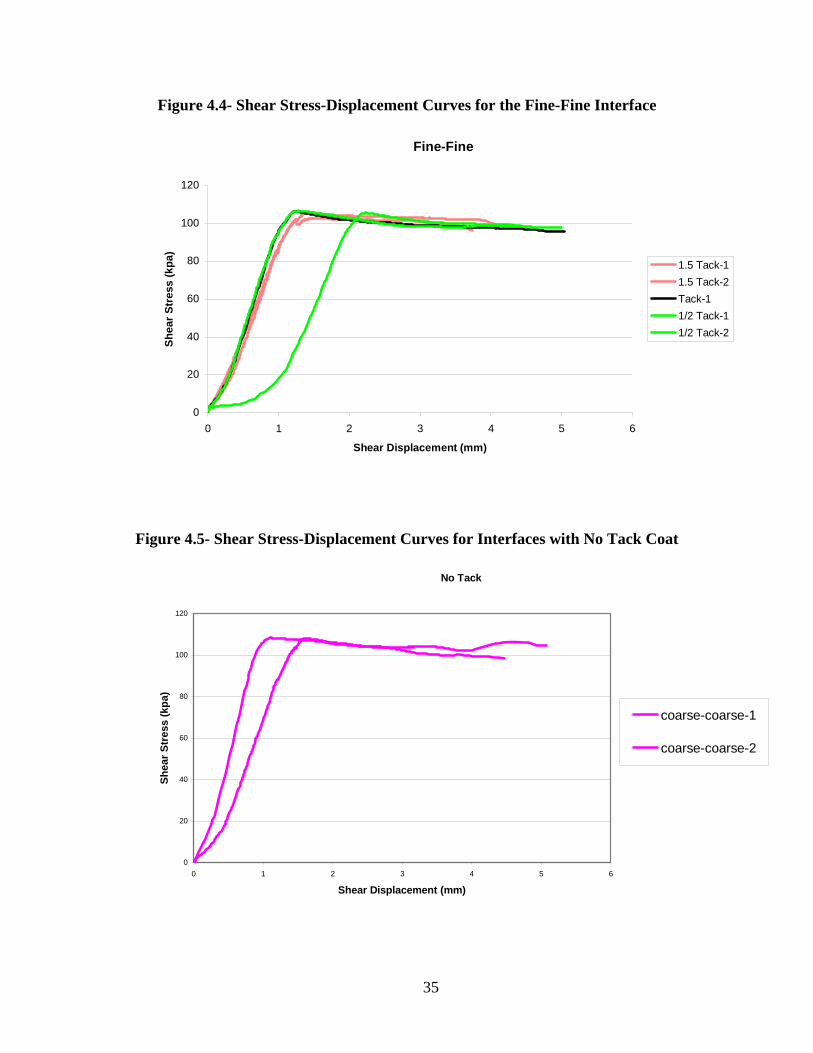
Figure 4.4- Shear Stress-Displacement Curves for the Fine-Fine Interface
Fine-Fine
0
20
40
60
80
100
120
0 1 2 3 4 5 6
Shear Displacement (mm)
Shea
r Str
ess
(kpa
)
1.5 Tack-11.5 Tack-2Tack-11/2 Tack-11/2 Tack-2
Figure 4.5- Shear Stress-Displacement Curves for Interfaces with No Tack Coat
No Tack
0
20
40
60
80
100
120
0 1 2 3 4 5 6
Shear Displacement (mm)
Shea
r Str
ess
(kpa
)
coarse-coarse-1
coarse-coarse-2

36
Figure 4.6- Shear Stress-Displacement Curves for Interfaces with 1/2 Specification Tack Coat
1/2 Tack
0
20
40
60
80
100
120
0 1 2 3 4 5 6
Shear Displacement (mm)
Shea
r Str
ess
(kpa
)
coarse-coarse-1
coarse-coarse-2
coarse-fine-1
coarse-fine-2
fine-fine-1
fine-fine-2
Figure 4.7- Shear Stress-Displacement Curves for Interfaces with Specification Tack Coat
Tack
0
20
40
60
80
100
120
0 1 2 3 4 5 6
Shear Displacement (mm)
Shea
r Str
ess
(kpa
)
coarse-coarse-1
coarse-coarse-2
coarse-fine-1
coarse-fine-2
fine-fine-1

37
Figure 4.8- Shear Stress-Displacement Curves for Interfaces with 1.5 Specification Tack Coat
1.5 Tack
0
20
40
60
80
100
120
0 1 2 3 4 5 6
Shear Displacement (mm)
Shea
r Str
ess
(kpa
) coarse-coarse-1coarse-coarse-2coarse-fine-1coarse-fine-2fine-fine-1fine-fine-2
Figures 4.2 through 4.8 show a definite trend. The maximum shear stress typically
occurred between 1 and 2 mm of deformation. All of the maximum shear stresses were also
between 100 and 120 kPa. There was an increase of the shear stress with the shear displacement
up to a maximum shear stress after which the shear stress stabilized. These graphs would also
suggest that under simultaneous, proportional normal and shear loads; the tack coat application
rate does not significantly affect the shear strength of the interface.
4.2-Dynamic Modulus Tests Table 4.2 shows a summary of the dynamic modulus test results for all interfaces. Data
in Table 4.2 shows that the dynamic modulus tends to be higher for the samples when they are
tested at an angle of 30 degrees. The importance of testing samples at multiple frequencies is
that the different frequencies simulate a vehicle moving over the pavement at different speeds
(i.e. 10 Hz simulates a vehicle moving at approximately 40 mph).

38
Table 4.2- Dynamic Shear Reaction Modulus Test Results
Dynamic Modulus (MPa)Sample ID Angle Interface 25 Hz 10 Hz 5 Hz 1 Hz 0.5 Hz 0.1 Hz
1.1-20d 20 1 69 322 307 277 267 266 1.1-20d 20 1 69 289 266 198 196 222 2.1-20d 20 2 41 355 332 206 200 216 2.2-20d 20 2 73 327 286 240 231 240 3.1-20d 20 3 58 423 399 293 290 304 3.2-20d 20 3 48 223 207 177 175 611 4.1-20d 20 4 43 282 266 233 225 237 4.2-20d 20 4 49 270 258 197 192 208 5.1-20d 20 5 44 267 283 233 214 222 6.1-20d 20 6 54 239 219 190 184 184 6.2-20d 20 6 48 257 229 192 185 179 7.1-20d 20 7 40 269 261 227 219 227 7.2-20d 20 7 45 281 273 234 225 225 9.1-20d 20 9 39 239 257 208 197 190 9.2-20d 20 9 43 280 241 219 213 228 10.1-20d 20 10 94 400 355 265 252 258 10.2-20d 20 10 74 282 319 247 243 252 11.1-20d 20 11 100 321 293 225 213 214 11.2-20d 20 11 67 283 270 204 196 206 12.1-20d 20 12 105 333 306 238 224 230 12.2-20d 20 12 114 361 329 268 257 262 1.1-30d 30 1 186 300 286 232 238 262 1.1-30d 30 1 111 183 192 189 190 187 2.1-30d 30 2 91 658 933 899 668 454 2.2-30d 30 2 104 460 1002 796 643 471 3.1-30d 30 3 110 300 464 576 521 467 3.2-30d 30 3 158 278 318 323 271 224 4.1-30d 30 4 81 919 1086 594 846 374 4.2-30d 30 4 92 527 565 477 470 383 5.1-30d 30 5 83 631 990 789 0 0 5.2-30d 30 5 92 600 927 240 158 131 6.1-30d 30 6 93 527 1012 785 305 245 6.2-30d 30 6 78 1174 1467 591 227 178 7.1-30d 30 7 87 408 572 539 405 302 7.2-30d 30 7 114 301 343 454 316 254 9.1-30d 30 9 117 278 310 341 389 360 9.2-30d 30 9 96 336 363 329 372 350 10.1-30d 30 10 68 476 529 478 484 457 10.2-30d 30 10 95 352 423 462 567 470 11.1-30d 30 11 106 256 302 287 294 297 11.2-30d 30 11 105 308 337 326 358 368 12.1-30d 30 12 n/a n/a n/a n/a n/a n/a 12.2-30d 30 12 n/a n/a n/a n/a n/a n/a

39
Table 4.3- Phase Angle Test Results
Phase Angle (Degrees) Sample ID Angle Interface 25 Hz 10 Hz 5 Hz 1 Hz 0.5 Hz 0.1 Hz
1.1-20d 20 1 104.15 6.76 11.43 10.9 12.46 11.51 1.1-20d 20 1 129.17 7.23 11.55 12.44 13.32 14.66 2.1-20d 20 2 94.75 -1.15 16.03 10.18 12 14.26 2.2-20d 20 2 57.97 2.07 11.38 11.08 12.93 13.63 3.1-20d 20 3 -30.81 -5.17 12.53 13.54 14.32 13.84 3.2-20d 20 3 120.7 9.64 11.76 11.75 12.11 -47.87 4.1-20d 20 4 105.67 3.94 10.03 12.36 13.88 13.77 4.2-20d 20 4 117.84 3.38 10.23 12.21 13.73 14.08 5.1-20d 20 5 125.59 7.52 12.06 10.95 11.54 13.11 6.1-20d 20 6 133.73 5.49 9.51 8 9.36 10.336.2-20d 20 6 109.91 9.8 10.14 8.18 9.76 10.56 7.1-20d 20 7 81.9 5.95 10.99 9.96 11.44 12.01 7.2-20d 20 7 75.35 6.32 13.09 9.65 10.99 11.39 9.1-20d 20 9 91.85 2.7 7.99 9.52 11.61 12.79.2-20d 20 9 105.39 6.44 9.49 9.88 11.24 11.14 10.1-20d 20 10 21.38 1.5 16.98 13.74 13.67 13.74 10.2-20d 20 10 118.96 5.69 10.68 13.08 13.62 13.29 11.1-20d 20 11 30.04 3.14 8.11 9.61 11.47 11.4711.2-20d 20 11 45.41 3.71 7.48 11.17 12.64 13.88 12.1-20d 20 12 29.31 5.88 9.78 13.6 15.26 16.15 12.2-20d 20 12 41.01 4.29 9.65 12.73 13.97 13.93 1.1-30d 30 1 17.58 3.56 1.79 4.8 5.47 1.151.1-30d 30 1 8.2 1.68 1.32 2.18 4.19 6.4 2.1-30d 30 2 -18.81 0.37 -18.87 -42.12 106.88 121.262.2-30d 30 2 -6.47 1.06 -24.41 -32.99 106.96 -4.42 3.1-30d 30 3 -9.27 3.34 -3.24 -29.8 -21.63 -14.37 3.2-30d 30 3 -18.33 8.57 5.4 7.63 9.39 16.31 4.1-30d 30 4 -19.64 33.93 7.07 22.79 3.31 -46.184.2-30d 30 4 -22.11 13.9 14.36 12.96 -155.55 -156.4 5.1-30d 30 5 -5.99 -7.24 -62.57 69.71 0 0 5.2-30d 30 5 -12.94 -0.16 -122.85 24.77 37.7 29.02 6.1-30d 30 6 -8.44 4.89 -18.03 44.14 41.62 44.776.2-30d 30 6 -6.52 -10.82 39.5 21.52 24.93 41 7.1-30d 30 7 -5.99 1.8 -19.56 -42.7 86.95 67.15 7.2-30d 30 7 -13.93 3.39 -2.17 -38.63 68.32 66.4 9.1-30d 30 9 -22.1 3.85 0.68 3.42 4.66 -2.489.2-30d 30 9 155.04 6.97 2.63 4.87 4.42 1.98 10.1-30d 30 10 99.52 7.31 4 2.61 1.18 -2.12 10.2-30d 30 10 -34.91 10.23 1.71 -7.24 157.45 156.39 11.1-30d 30 11 -28.45 8.55 4.26 7.17 9.77 11.4511.2-30d 30 11 -31.39 7.3 5.74 6.92 7.68 7.97 12.1-30d 30 12 n/a n/a n/a n/a n/a n/a 12.2-30d 30 12 n/a n/a n/a n/a n/a n/a

40
Figures 4.9 through 4.15 compares the Dynamic Shear Reaction Modulus of different
interfaces. These figures compare each interface tested at the same angle to the varying tack coat
application rates. Figure 4.15 compares the Dynamic Shear Reaction Modulus of the different
interfaces and varying tack coat application rates at 10 Hz, which is significant because it
simulates traffic on the pavement at approximately 40 mph.
Figure 4.9- Dynamic Shear Modulus of Coarse-Coarse Interface at 20-degree Angle
0
100
200
300
400
500
600
700
1.5 Spec 1.5 Spec Spec Spec 1/2 Spec 1/2Spec No Tack No Tack
Tack-Coat
Mod
ulus
(kPa
)
25 Hz 10 Hz
5 Hz
1 Hz 0.5 Hz
0.1 Hz

41
Figure 4.10- Dynamic Shear Modulus of Coarse-Fine Interface at 20-degree Angle
0
100
200
300
400
500
600
700
1.5 Spec 1.5 Spec Spec Spec 1/2 Spec 1/2Spec No Tack No Tack
Tack-Coat
Modulus (kPa)
25 Hz 10 Hz
5 Hz
1 Hz 0.5 Hz
0.1 Hz
Figure 4.11- Dynamic Shear Modulus of Fine-Fine Interface at 20-degree Angle
0
100
200
300
400
500
600
700
1.5 Spec 1.5 Spec Spec Spec 1/2 Spec 1/2Spec No Tack No Tack
Tack-Coat
Mod
ulus
(kPa
)
25 Hz 10 Hz
5 Hz
1 Hz 0.5 Hz
0.1 Hz

42
Figure 4.12- Dynamic Shear Modulus of Coarse-Coarse Interface at 30-degree Angle
0
300
600
900
1200
1500
1.5 Spec 1.5 Spec Spec Spec 1/2 Spec 1/2Spec No Tack No Tack
Tack-Coat
Mod
ulus
(kPa
)
25 Hz 10 Hz
5 Hz
1 Hz 0.5 Hz
0.1 Hz
Figure 4.13- Dynamic Shear Modulus of Coarse-Fine Interface at 30-degree Angle
Dynamic Shear Modulus - Coarse-Fine Mix Interface 30-degree angle
0
300
600
900
1200
1500
1.5 Spec 1.5 Spec Spec Spec 1/2 Spec 1/2Spec No Tack No Tack
Tack-Coat
Mod
ulus
(kPa
)
25 Hz 10 Hz
5 Hz
1 Hz 0.5 Hz
0.1 Hz
43
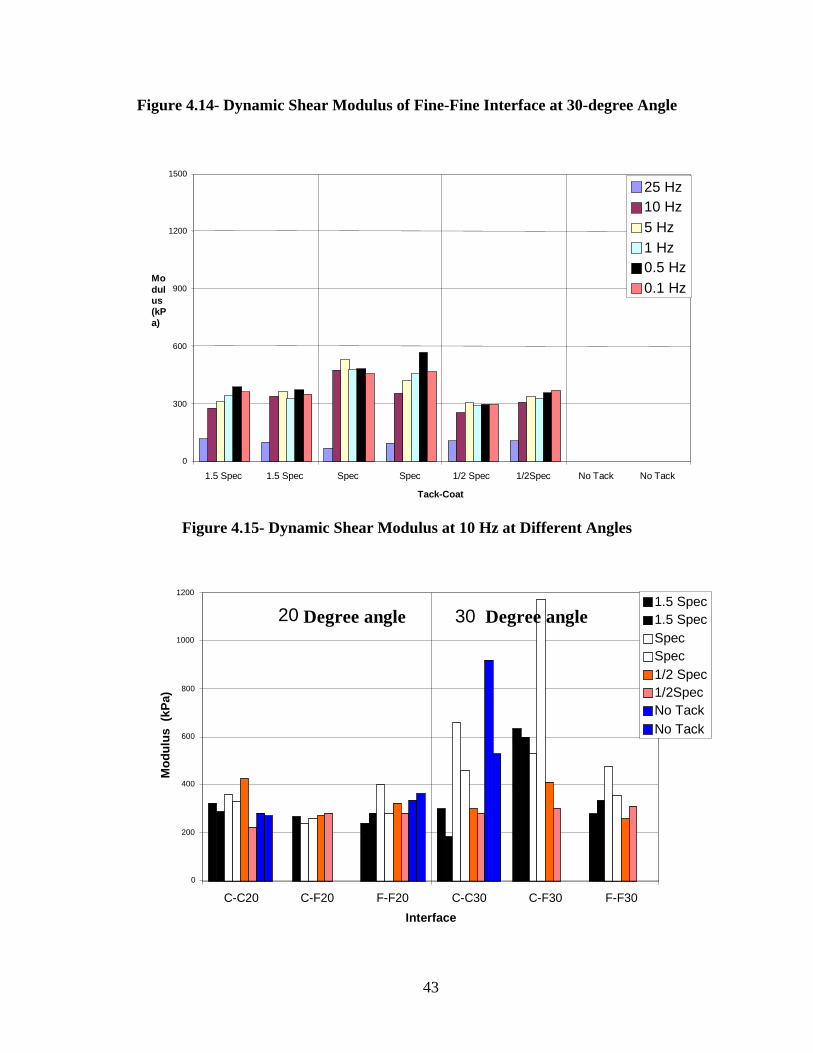
Figure 4.14- Dynamic Shear Modulus of Fine-Fine Interface at 30-degree Angle
0
300
600
900
1200
1500
1.5 Spec 1.5 Spec Spec Spec 1/2 Spec 1/2Spec No Tack No Tack
Tack-Coat
Modulus (kPa)
25 Hz 10 Hz
5 Hz
1 Hz 0.5 Hz
0.1 Hz
Figure 4.15- Dynamic Shear Modulus at 10 Hz at Different Angles
0
200
400
600
800
1000
1200
C-C20 C-F20 F-F20 C-C30 C-F30 F-F30 Interface
Mod
ulus
(kP
a)
1.5 Spec 1.5 Spec Spec Spec 1/2 Spec 1/2Spec No Tack No Tack
20 Degree angle 30 Degree angle

44
For the 20-degree angle, the shear modulus ranged between 200 and 300 kPa. The lowest
variability of the modulus was obtained for the interface with the specification rate application of
tack coat. For the other two interface types, the lower variability of shear modulus was also
obtained for the specification rate of tack-coat application.
For the Coarse-Fine Interface the optimum tack coat application rate was found to be ½
specification rate (11gm/sq.ft) of tack coat application; the shear moduli were the highest
measured and very similar values were obtained for both samples. It is important to note that the
modulus obtained for the specification rate for tack coat was not much lower than that obtained
for the ½ specification rate. For the coarse-coarse and fine-fine mix interfaces the optimum tack
coat application rate was the specification rate.
For the 30-degree loading angle, the highest shear modulus was obtained for the
specification rate of tack-coat application rate for all interfaces. The coarse-coarse interface has
the most repeatable values for the dynamic shear reaction modulus and higher values than any
other interfaces. Even very consistent, the shear modulus was the lowest for the fine-fine mix
interface when compared to the values for the other two interfaces.
The shear modulus results obtained for the loading frequency of 10 Hz are of more
interest, since this frequency simulates the loading under the passing of a vehicle at moderate
speed (40 mph). When comparing the dynamic shear reaction modulus values of all the different
interfaces at this frequency, the highest modulus was obtained for the coarse-fine interface with
the specification tack-coat application rate at the 30-degree angle. However, for the 20-degree
angle, this interface had the lowest modulus; the coarse-coarse mix interface and the fine-fine
mix interface had very similar shear modulus values.
In general, the higher dynamic shear reaction modulus values were obtained for the 30-
degree angle. This contradicts the common assumption that the shear modulus is higher when the
normal stress at the interface is higher. When the samples were tested at an angle of 20-degrees,
the interface type and application rate did not seem to make as big as a difference as it did at 30
degrees.

45
CHAPTER 5 - CONCLUSIONS AND RECOMENDATIONS
The purpose of this research was to evaluate the mechanical properties of asphalt-to-
asphalt interfaces using tests in which the interface is subjected simultaneously to a normal and
shear stresses. This loading was applied to simulate the corresponding stress condition
developed at the interfaces between asphalt layers when a vehicle rolls on a flexible pavement
structure. The core samples were obtained from the pavement layers built at the Civil
Infrastructure Systems Laboratory (CISL) of Kansas State University with conventional
methods. The core samples were tested at the Civil Engineering Advanced Asphalts Laboratory
at Kansas State University. Three different asphalt-to-asphalt interfaces were constructed
(coarse-coarse mixes, coarse-fine mixes and fine-fine mixes), each with four different tack coat
application rates (no tack coat, ½ specification, specification, and 1 ½ specification tack coat).
This resulted in twelve different combinations of asphalt interface types and tack coat application
rates.
The testing attachments were built to allow testing of the specimens at different angles
from 0 to 45 degrees. The experiments were conducted for two angles (20 and 30 degrees)
between the normal direction to the interface and the direction of the applied force.
At the beginning of the laboratory tests, the sample was secured into the top and bottom
attachments and then the actuator was set into place on top of the upper attachment. The
Dynamic Modulus software was then opened and the sample specifications were entered (length,
diameter, volume, sample number). Once the LVDT’s were adjusted and the temperature was
allowed to stabilize the program was started. The Stress-Strain test program was then run to
measure the shear strength of the interfaces. Once it was open the sample specifications were
entered (length, diameter, volume, sample number. The program was run at a rate of deformation
of 0.05mm/sec and continued to run until a total deformation of 10mm was reached. When
testing at the angle of 30 degrees a few of the specimens were sheared apart at the interface
before testing could begin. This was due to the weight of the upper apparatus. Also, when
testing at 20 degrees, the interface did not fail in shear; the samples failed in compression.

46
The results of the laboratory experiments led to the following conclusions:
• The interface shear strength was about the same, between 105 and 109 kPa for all
interface types and tack-coat application rates. Since no effect of tack-coat
application rate or interface type on the shear strength were observed, the strength
tests should not be used to optimize the tack coat application.
• The Dynamic Shear Reaction Modulus of the fine-on-fine interface was lower
than the moduli of the coarse-coarse or coarse-fine interfaces.
• When the specimens were tested at an angle of 20-degrees, the interface type did
not affect the Dynamic Shear Reaction Modulus nearly as much as at 30-degrees.
• When considering the no tack-coat application rate, the interface that seemed to
work best was the coarse-on-coarse interface. It yielded much higher Dynamic
Shear Reaction Moduli than the other two interfaces did when only considering
the no tack application rate.
The following recommendations were drawn from this study:
• When dealing with the coarse-on-coarse interfaces, the best tack coat application
rate is the current specification rate. It produced the highest dynamic modulus
results for that interface.
• The coarse-fine and fine-fine interfaces have the highest Dynamic Shear reaction
Moduli at the specification rate of tack coat application. This suggests that the
current practice is the optimum method for constructing these interfaces.
• The Dynamic Shear Modulus tests should be used to determine the optimum tack-
coat application rate in lieu of the shear strength test. The shear strength tests
cannot distinguish the effect of tack-coat application rate or interface type on the
shear strength.
• For further studies the apparatus should be constructed of lighter material to
reduce the initial stress put on the sample. It should also be taken into account
that this study did not include the stress on the sample before testing began. The
pre-loading stress on the samples was approximately 31 kPa.

47
CHAPTER 6 - REFERENCES
1. Hachiya, Y., and Sato, K., (1997). “Effect of Tack Coat on Bonding Characteristics at
Interface Between Asphalt Concrete Layers,” Eight International Conference on the
Structural Design of Asphalt Pavements. Proceedings. Washington State University,
Seattle, pp. 349-362.
2. (HAPI) www.hawaiiasphalt.com, 2007.
3. Hot Mix Asphalt Construction Reference for Quality HMA Pavements, QIP 112,
National Asphalt Pavement Association, 2000.
4. http://nationalatlas.gov/transportation.html, 2007.
5. Korkmaz, A., Smit, A., and Yildirim, Y. (2003). “Development of a Laboratory Test
Procedure to Evaluate Tack Coat Performance” University of Texas at Austin, 2003, pp.
195-205.
6. Mohammad, L., Huang, B., and Raqib, M., (2002). “Influence of Asphalt Tack Coat
Materials on Interface Shear Strength” Transportation Research Record 1789,
Transportation Research Board, pp. 56-65
7. Molenaar A.A.A., Heerkens, J.C.P., and Veroeven, J.H.M. (1986) “Effects of Stress
Absorbing Membrane Interlayers.” Asphalt Paving Technology, Vol.55, Proceedings of
the Association of Asphalt Paving Technologies.
8. Romanoschi, S. (1999). Characterization of Pavement Layer Interfaces. Ph.D.
Dissertation, Louisiana State University, Baton Rouge.
9. Tashman, L., Nam, K., and Papagiannakis, T. (2006). Evaluation of the Influence of Tack
Coat Construction Factors on the Bond Strength Between Pavement Layers. WCAT
Report 06-002, Washington Center for Asphalt Technology.
10. West, R., Moore, J., and Zhang, J. (2005). Evaluation of Bond Strength Between
Pavement Layers. NCAT Report 05-08, National Center for Asphalt Technology,
Auburn, Alabama.

48
Appendix A - Mix Designs
Table 6.1- Single Point gradation of Base Mix # 1
Base Mix #1 (Top Lift)
Sieve 1 ½ 1 ¾ ½ 3/8 #4 #8 #16 #30 #50 #100 #200
Single Point 0 0 0 0 2 24 41 60 75 86 92 94.5
Binder Grade PG 64-22
Binder Content 5.25%
Table 6.2-Single Point gradation of Base Mix # 2
Base Mix #2 (Base Coarse)
Sieve 1 ½ 1 ¾ ½ 3/8 #4 #8 #16 #30 #50 #100 #200
Single Point 0 0 0 9 17 34 48 60 74 86 93 96
Binder Grade PG 64-22
Binder Content
Table 6.3- Single Point gradation of Fine Mix (SR-12.5A)
Fine Mix (SR-12.5A)
Sieve 1 ½ 1 ¾ ½ 3/8 #4 #8 #16 #30 #50 #100 #200
Single Point 0 0 0 7 13 23 42 64 78 88 94 96.2
Binder Grade PG 64-22
Binder Content 5.40%