Embed Size (px)
Citation preview
EVANGELICAL FREE CHURCH OF AMERICA
Metrics Report EFCA annual survey designed to collect vital statistics and transformational statistics
1 | P a g e

Purpose We desire to measure our faithfulness in alignment with EFCA mission and vision, and to celebrate the fruitfulness that comes from God.
Philosophy The EFCA Annual Church Metrics Survey collects two kinds of information: vital statistics and transformational statistics. Vital statistics are standard, familiar questions that keep the general database information current and give a current snapshot of all EFCA churches and the broader EFCA movement.
Transformational statistics help us measure our faithfulness to act in alignment with our mission/vison (faithfulness metrics) and quantify the fruitfulness that God produces (fruitfulness metrics). Faithfulness metrics do not guarantee an outcome, they simply identify whether we are working toward a desired outcome. For example, “Does your church have an intentional disciplemaking process?” This question measures whether we are intentional about our vision to make disciples. It does not guarantee the making of disciplemakers, but it is a measure of our faithfulness to the mission and vision God has given.
Fruitfulness metrics measure the results of ministry efforts. For example, “What percentage of our congregation is being mentored/discipled while mentoring or discipling another?” If our disciplemaking process is fruitful, we expect a growing percentage of people acknowledging that they are being discipled, and that they are reproducing themselves by discipling others. In short, we are multiplying disciplemakers.
From year to year, we expect that faithfulness metrics will generally result in fruitfulness. Biblically, the book of Proverbs (specifically Proverbs 22:6) serves as an example of faithfulness and fruitfulness metrics. These teachings describe what a wise man does (faithfulness metrics) and the result that occurs (fruitfulness metrics). The result is a principle, not a promise, but still generally predictable.
Beyond the principles, we serve a powerful God who can do more than all we could ask or imagine. Measuring the way EFCA churches impact the kingdom of God and the communities in which EFCA churches exist, signals the power of God at work. Metrics are one way to express thankfulness for what God has done, and an effort to make sure He receives glory for the fruit He produces through our ministries.
Goal Over time, it is our desire that the annual survey will allow individual churches and the broader EFCA movement to pause and humbly consider if we are faithful to the mission and vision we have joined. We pray that the survey would become a rhythm of celebration as we capture and remember the transforming work of God through our faithful service. We desire to see a clear and compelling picture of how God uses the EFCA to multiply transformational churches among all people!
Methodology The 2014 EFCA Annual Church Metrics Survey invitation was sent via email to 1,327 EFCA churches across the United States through the CVENT survey client. Because it is an online survey, the survey went to churches who have provided the EFCA national office with an email address. The survey was conducted from October 16 to November 16, 2014.
2 | P a g e

Three survey reminders were sent in the final three weeks and phone call reminders were made during the final two weeks before the completion deadline. The survey assumed that respondents were either a pastor or administrator at an EFCA church.
Based on the number of responses, considering a typical five percent error rate, we can confidently report the findings of this survey. For an online survey, conventionally, a response rate of 20 percent is considered good, while a 30 percent response rate is considered very good. With 670 complete or partial responses, the metrics survey received a 50.49 percent response rate. Our movement cares about metrics.
Vital Stats
Summary For this first expanded online survey, we received full or partial responses from nearly half of all EFCA churches. This strong rate of participation gives a reasonable expectation that the results reflect the broader EFCA movement. These vital statistics paint a picture of the EFCA that can be described as plateauing. For example, the total number of churches has increased 1.5 percent since 2009, but we saw a .5 percent decrease in the number of churches in the previous year. In addition, attendance has increased by less than one percent since 2013.
670 churches reporting (complete or partial responses).
• 50.5 % of invited EFCA churches participated o 1,327 churches invited to participate o Number of respondents varied by question
• Average Attendance o 265 is the average church attendance in 2014 (as recorded via the general database) o 287 is the average attendance reported by churches responding to the metrics survey o Total attendance in EFCA churches has increased by .7% since 2013 (as recorded via the
general database) • Average Membership
o 602 responses reported 85,249 members in 2014 o Average membership per church = 142 o 19 of the 602 reporting churches indicated a membership of zero
• Church size breakdown (average weekend attendance) – 611 churches reporting o 5 % of churches >1000 (33 churches) o 9 % between 500-999 (54 churches) o 14 % between 250-499 (83 churches) o 33 % between 100-249 (200 churches) o 39% <100 (237)
3 | P a g e

• 42.7% of churches reported they are growing (261 churches) 49.6% of churches reported they are stable (303 churches) 7.7% of churches reported they are declining (47 churches)
• Total number of churches: o 1,313 churches (.5% decrease from 2013) o 168 church plants
• 14 church closures occurred between January 1, 2014 and November 15, 2014
5% 9%
14%
33%
39%
Church Size
>1000
500-999
250-499
100-249
<100
4 | P a g e
Transformational Statistics
All People – Multiethnic
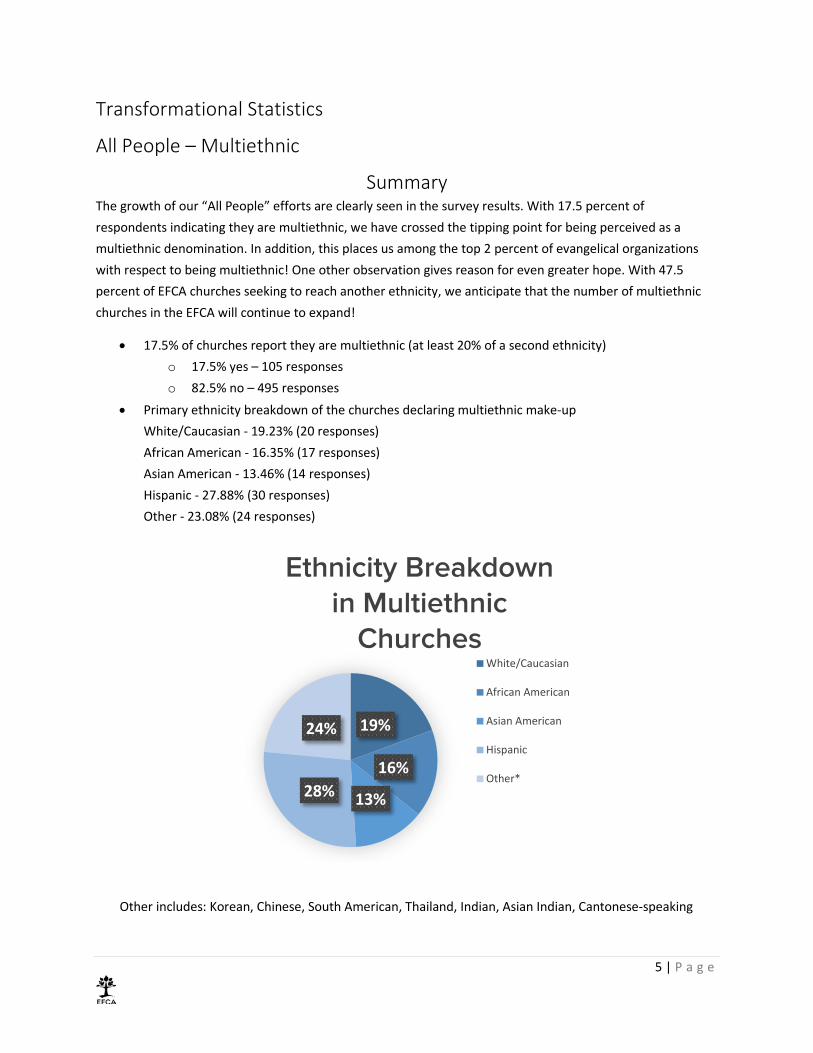
Summary The growth of our “All People” efforts are clearly seen in the survey results. With 17.5 percent of respondents indicating they are multiethnic, we have crossed the tipping point for being perceived as a multiethnic denomination. In addition, this places us among the top 2 percent of evangelical organizations with respect to being multiethnic! One other observation gives reason for even greater hope. With 47.5 percent of EFCA churches seeking to reach another ethnicity, we anticipate that the number of multiethnic churches in the EFCA will continue to expand!
• 17.5% of churches report they are multiethnic (at least 20% of a second ethnicity) o 17.5% yes – 105 responses o 82.5% no – 495 responses
• Primary ethnicity breakdown of the churches declaring multiethnic make-up White/Caucasian - 19.23% (20 responses) African American - 16.35% (17 responses) Asian American - 13.46% (14 responses) Hispanic - 27.88% (30 responses) Other - 23.08% (24 responses)
Other includes: Korean, Chinese, South American, Thailand, Indian, Asian Indian, Cantonese-speaking
19%
16%
13%28%
24%
Ethnicity Breakdown in Multiethnic
ChurchesWhite/Caucasian
African American
Asian American
Hispanic
Other*
5 | P a g e

Chinese, Cuban, Puerto Rican, Nicaraguan, Haitian, Jamaican, those from Trinidad, Filipino, and Native American
• 5.8% of responding churches have second language services o 35 out of 600 responses
• 47.5% of responding churches are seeking to reach another ethnicity o 277 out of 583 responses
Multiplying Churches/Sites
Summary While multiplying transformational churches is central to the mission of the EFCA, we have an opportunity to greatly expand our effectiveness. 65.4 percent of EFCA churches report they are faithfully supporting a church plant in some way, and 33.6 percent are intentionally planning to plant a church in the next two years. Given an annual church planting rate of approximately 3 percent, there is a significant gap between intent and the actual planting of churches. Fully living out the EFCA Mission Statement requires us to help close the gap between intent and practice in the area of church planting.
• # of church plants/starts o 30 launched churches reported via the survey o 22 new church plants with completed paperwork in 2014 (5 adopted)
• 15 churches moved from church plant to full EFC status in 2014 • 13 new sites • Percentage of churches with plans to launch a church
o 3% of churches >1000 o 3% between 500-999 o 6% between 250-499 o 11% between 100-249 o 9% <100
6 | P a g e

• 2.7% of churches have multisite arrangements/presence o 36 out of 1,313 churches; does not include church plants
• 65.4% of churches support a church plant (368 out of 562 responses) • 13% of EFCA churches are church plants (168 plants)
Multiplying Leaders
Summary It is very encouraging to note that nearly 70 percent of respondents indicated they have an intentional leadership development plan. This clearly shows a desire and commitment to faithfully multiply leaders. In general, it appears that the majority of the leadership development plans depend on formal training methods as opposed to apprenticeship approaches.
• 69.5 percent of churches have an intentional leadership development plan (393 out of 565 responses)
• More than 60% of churches claimed that less than 10% of their leaders have apprentices: o More than 50% of leaders have apprentices - 7.64% (43 responses) o 26-50% of leaders have apprentices - 9.27% (51 responses) o 10-25% of leaders have apprentices - 22.55% (124 responses) o Less than 10% of leaders have apprentices - 60.55% (333 responses)
3%
3%
6%
11%
9%
>1000
500-999
250-499
100-249
<100
0% 2% 4% 6% 8% 10% 12%
Churches Planning to Launch Site
>1000
500-999
250-499
100-249
<100
Church size
7 | P a g e
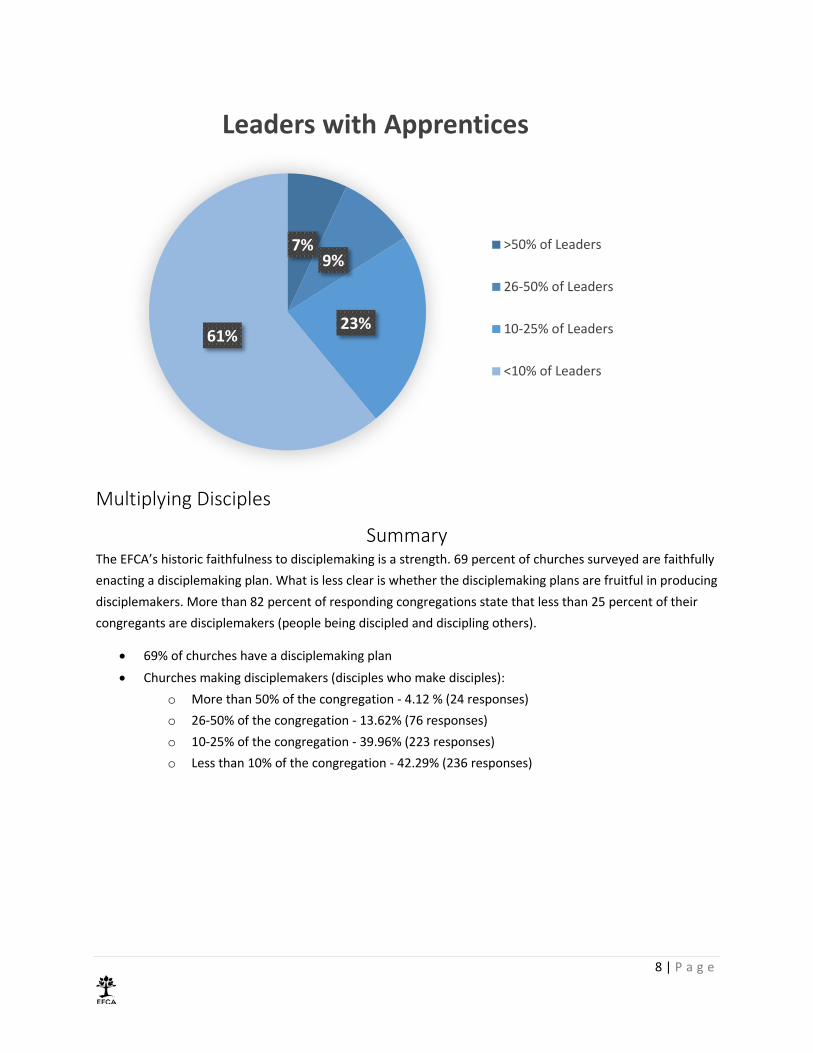
Multiplying Disciples
Summary The EFCA’s historic faithfulness to disciplemaking is a strength. 69 percent of churches surveyed are faithfully enacting a disciplemaking plan. What is less clear is whether the disciplemaking plans are fruitful in producing disciplemakers. More than 82 percent of responding congregations state that less than 25 percent of their congregants are disciplemakers (people being discipled and discipling others).
• 69% of churches have a disciplemaking plan • Churches making disciplemakers (disciples who make disciples):
o More than 50% of the congregation - 4.12 % (24 responses) o 26-50% of the congregation - 13.62% (76 responses) o 10-25% of the congregation - 39.96% (223 responses) o Less than 10% of the congregation - 42.29% (236 responses)
7%9%
23%61%
Leaders with Apprentices
>50% of Leaders
26-50% of Leaders
10-25% of Leaders
<10% of Leaders
8 | P a g e

• Relational groups are an essential part of disciplemaking. Churches reported the following
percentage of their congregation in a relational group: o More than 50% of the congregation - 35.55% (199 responses) o 26-50% of the congregation - 38.60% (215 responses) o 10-25% of the congregation - 20.47% (114 responses) o Less than 10% of the congregation - 5.39% (30 responses)
Gospel Impact
Summary Realizing that thousands of people have come to faith and identified with Christ through baptism is reason for celebration. Of the churches responding to the survey, the average number of baptisms per congregation came to approximately 10, while the number of conversions was nearly 17! The standard benchmark we have pursued in the EFCA is a 10 percent conversion rate or 26.5 conversions per church in an average congregation of 265. Of particular interest is the fact that the number of conversions and baptisms are significantly larger than the total increase in attendance over the previous year.
• 5,559 baptisms reported by 552 churches • 8,012 conversions reported by 460 churches
4%14%
40%
42%
Churches making Disciplemakers
>50% of thecongregation
26-50% of thecongregation
10-25% of thecongregation
<10% of thecongregation
9 | P a g e

City/Region Transformation
Summary Of all the topics covered in the EFCA Church Metrics survey, city/region transformation is the newest and perhaps most difficult to measure. For the 2014 survey, we focused on faithfulness to engagement in transformation beyond church walls. It is exciting to note that nearly 92 percent of respondents are engaged in global missions, and 82 percent are partnering with other groups in their community to create a wider gospel impact. Clearly EFCA churches place value on advancing the gospel and transforming communities, both locally and around the world!
• 91.5 % of churches support global missions o 531 “yes” responses out of 580
• 82% of churches are partnering with other churches/groups/organizations to impact their community
o 480 out of 582 responses • 59% of all EFCA churches (779) support ReachGlobal efforts (projects and missionary support)
o This percentage does not include church plants.
Conclusion
Observations This survey was a significant expansion from previous annual surveys. We asked more and different questions, and it required more time from pastors and leaders to complete the survey. EFCA churches responded in a generally positive way, and we are thankful for the broad participation. It is important to recognize that, in both size and ministry model, there is tremendous variety within EFCA churches. While we have endeavored to make a survey that is applicable in many contexts, we humbly acknowledge that it is not possible to have one survey that works equally well for all contexts. We appreciate the flexibility of the churches as they adapted to a unified, single survey.
The EFCA has a long history and tradition of biblical commitment to disciplemaking. The 2014 survey affirms that the majority of churches remain committed to the command to make disciples. In addition, the vast majority of churches are committed to the process of training new leaders in their congregations. This commitment to multiplying disciplemakers and leaders is a strength on which we can continue to build a fruitful future.
The survey also points out that the EFCA has made significant progress toward being a movement that affirms and welcomes all people. Our multiethnic and immigrant ministries are a place of significant growth and development. We are in process of being recognized as one of the denominational leaders in the area of multiethnic ministry.
It is less clear that we are broadly committed to our mission of multiplying transformational churches. A significant percentage of churches (33.6 percent) are intending to plant, but on average less than 3 percent of
10 | P a g e

churches do so in the course of a given year. This reflects that church planting is currently more aspirational than operational. While we continue to pursue church planting, as our denomination is aging, we see that attrition due to church closures is keeping pace with the planting of new churches. Our total number of churches is barely increasing in the past five years and actually declined in 2014. There is a pressing need and great opportunity to seize our mission of multiplication and make it a practical reality.
From 1980 to 2010, the EFCA enjoyed the designation of being one of the fastest growing evangelical denominations. Current statistics signal that we are, at best, in plateau and possibly in the early stages of decline as a denomination. Our average church attendance has been consistent at 265 for the past three years, but it looks like the number of churches may have crested and we are seeing a movement toward fewer churches. While plateauing is a normal part of the lifecycle of any organization or group, we must seize this moment to faithfully recommit to the EFCA mission and vision, and develop a unified approach to propel us into the next decade with a renewed effort toward kingdom and community impact.
Opportunities/Recommendations Perhaps nothing more clearly shows the power of focused investment and effort than our transformation as a denomination in the area of multiethnic ministry. While it may be true that we are moving into a season of plateau within the EFCA, there are many reasons to be optimistic about the future with intention and focus. The following opportunities stand in front of us:
• We have clear focus in our churches on disciplemaking and leadership development. Without changing the priority on those two areas of multiplication, if we become even more focused on measuring and adapting what we do for effectiveness, we should be able to see even greater fruitfulness.
• Less than 60 percent of churches are engaged in apprenticeship. This gap signals one of the greatest opportunities to enhance existing leadership development plans with the relational/practical benefits of creating an apprenticeship culture.
• The largest group of churches (0-250 in attendance; representing 72 percent of EFCA churches) are also the churches most likely to be interested in planting new churches. We must continue to develop methods, resources and tools to help these churches multiply. Our small-to-medium size churches are the low-hanging fruit.
• It has been said that what you count and celebrate, you do. If the EFCA communicates, celebrates, and platforms leaders/churches that are developing leaders, multiplying disciples, planting churches, and reaching all people, it will change our behavior as a movement. This should become a conscious part of our communications strategy and approach to conferences and events.
• The quality of the survey data is closely connected to the participation of churches in the annual survey. If we continue to stay the course asking these questions and documenting a track record for the movement, we will more accurately discern current realities, future direction and the needs of the EFCA movement.
11 | P a g e

Survey Feedback/Modifications While the first year of this expanded survey was a great success, there are a few changes that will make it even more effective:
• The unified approach between the national office and district leadership was a real and perceived strength that we can build upon. It helped create unity and alignment.
• The majority of EFCA churches collect their metrics on an annual basis following the calendar year. We can make it easier for churches to complete the survey with accurate information if we send it out after January 1.
• A significant percentage of the emailed survey invitations were filtered out by SPAM software used by churches. We will explore ways to make certain the survey invitation and information is actually received by all churches.
• We did limited phone follow-up with churches that had not completed the survey. We discovered that these calls had a high return rate in survey completions. If we start the phone reminders earlier, and with a larger number of callers, we could significantly increase the number of completed surveys.
• Some data collection turned out to be problematic. Most notably, our collection of budget numbers had considerable input errors. The errors were significant enough that we cannot use the data in the final reporting. We must find a way to help validate the data for certain input fields to guarantee accuracy of information for all survey questions.
12 | P a g e

Appendix A
Mission We exist to glorify God by multiplying transformational churches among all people.
Vision We are praying that God will raise up one million disciplemakers impacting millions with the gospel
and transforming entire cities and regions globally.
13 | P a g e

Appendix B
2014 Church Metrics Survey (survey questions with tabulated results): A.
Is your average weekend attendance growing, stable or declining?
Total Respondents: 611
Total Skipped: 0
Choice Response Percent
Response Total
1 Growing 42.72 % 261
2 Stable 49.59 % 303
3 Declining 7.69 % 47
What is the size of your church's community?
Total Respondents: 602
Total Skipped: 0
Choice Response Percent
Response Total
1 Rural community (less than 8,000)
31.56 % 190
2 Small city (8,000-79,999) 34.88 % 210
3 Medium city (80,000-499,000) 20.43 % 123
4 Large metro (500,000 +) 13.12 % 79
14 | P a g e
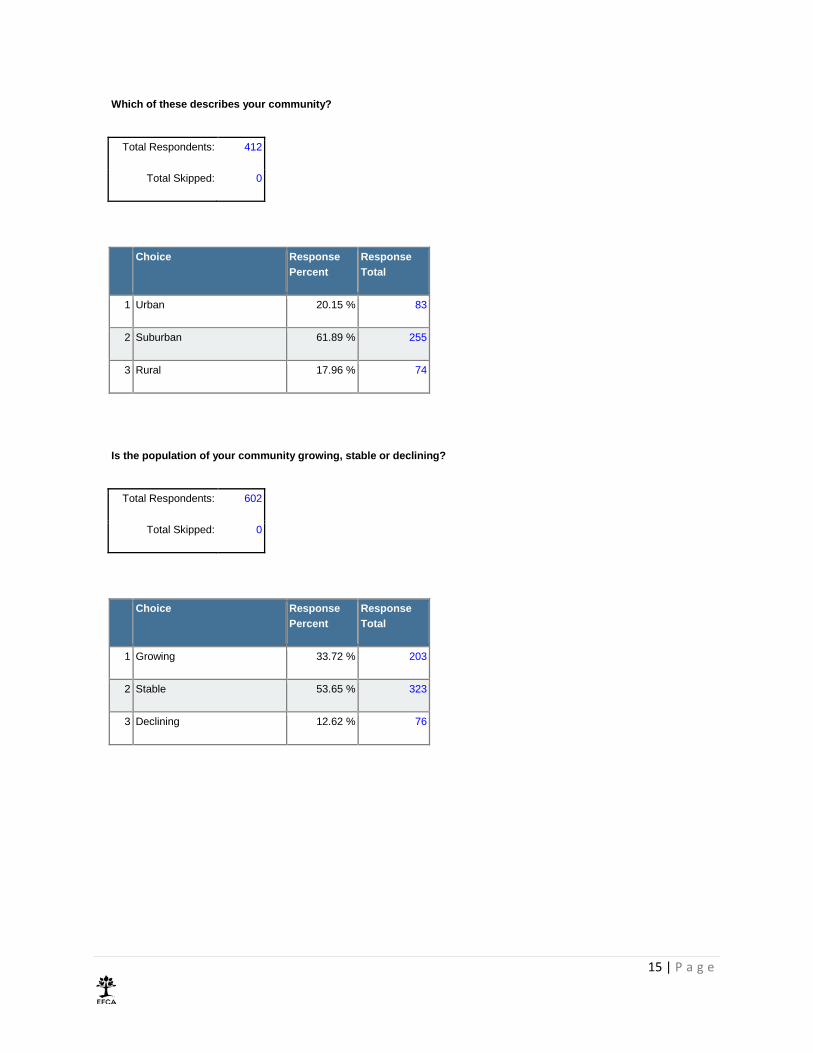
Which of these describes your community?
Total Respondents: 412
Total Skipped: 0
Choice Response Percent
Response Total
1 Urban 20.15 % 83
2 Suburban 61.89 % 255
3 Rural 17.96 % 74
Is the population of your community growing, stable or declining?
Total Respondents: 602
Total Skipped: 0
Choice Response Percent
Response Total
1 Growing 33.72 % 203
2 Stable 53.65 % 323
3 Declining 12.62 % 76
15 | P a g e

What is the primary ethnicity of your church?
Total Respondents: 600
Total Skipped: 0
Choice Response Percent
Response Total
1 White/Caucasian 92.17 % 553
2 African American 2.33 % 14
3 Asian American 0.50 % 3
4 Hispanic 2.83 % 17
5 Other 2.17 % 13
Is your church considered multiethnic? (At least 20% of a second ethnicity.)
Total Respondents: 600
Total Skipped: 0
Choice Response Percent
Response Total
1 Yes 17.50 % 105
2 No 82.50 % 495
16 | P a g e

The second (or other) ethnicity is:
Total Respondents: 105
Total Skipped: 0
Choice Response Percent
Response Total
1 White/Caucasian 19.05 % 20
2 African American 16.19 % 17
3 Asian American 13.33 % 14
4 Hispanic 28.57 % 30
5 Other 22.86 % 24
Does your church have a second language service(s)?
Total Respondents: 600
Total Skipped: 0
Choice Response Percent
Response Total
1 Yes 5.83 % 35
2 No 94.17 % 565
17 | P a g e

Does your church have a second language church within a church?
Total Respondents: 600
Total Skipped: 0
Choice Response Percent
Response Total
1 Yes 9.83 % 59
2 No 90.17 % 541
Does your church have another campus/worship site?
Total Respondents: 600
Total Skipped: 0
Choice Response Percent
Response Total
1 Yes 5.83 % 35
2 No 94.17 % 565
18 | P a g e

Does your church have an intentional disciplemaking plan/process?
Total Respondents: 583
Total Skipped: 7
Choice Response Percent
Response Total
1 Yes 68.78 % 401
2 No 31.22 % 182
Does your ministry result in the multiplication of converts and disciples who make disciples?
Total Respondents: 582
Total Skipped: 5
Choice Response Percent
Response Total
1 Yes 58.08 % 338
2 No 14.26 % 83
3 Not sure 27.66 % 161
19 | P a g e

Does your church actively support a church plant? (Finances, coaching/training/staffing/volunteering/oversight)
Total Respondents: 583
Total Skipped: 7
Choice Response Percent
Response Total
1 Yes 33.79 % 197
2 No 66.21 % 386
In the last 12 months, has your church launched a new (mark all that apply):
Total Respondents: 582
Total Skipped: 8
Choice Response Percent
Response Total
1 Service 12.03 % 70
2 Campus 2.23 % 13
3 Church 5.33 % 31
4 None of the above 83.33 % 485
20 | P a g e

Does your church have a plan to be involved with a church plant within the next two years?
Total Respondents: 586
Total Skipped: 4
Choice Response Percent
Response Total
1 Yes 33.62 % 197
2 No 66.38 % 389
Does your church have an intentional plan to develop leaders?
Total Respondents: 585
Total Skipped: 5
Choice Response Percent
Response Total
1 Yes 70.09 % 410
2 No 29.91 % 175
21 | P a g e

Does your church reflect the demographics of your community/neighborhood?
Total Respondents: 585
Total Skipped: 4
Choice Response Percent
Response Total
1 Yes 88.38 % 517
2 No 11.62 % 68
Is your church actively seeking ways to reach people of different ethnicities than your majority ethnic group?
Total Respondents: 583
Total Skipped: 6
Choice Response Percent
Response Total
1 Yes 47.51 % 277
2 No 52.49 % 306
22 | P a g e
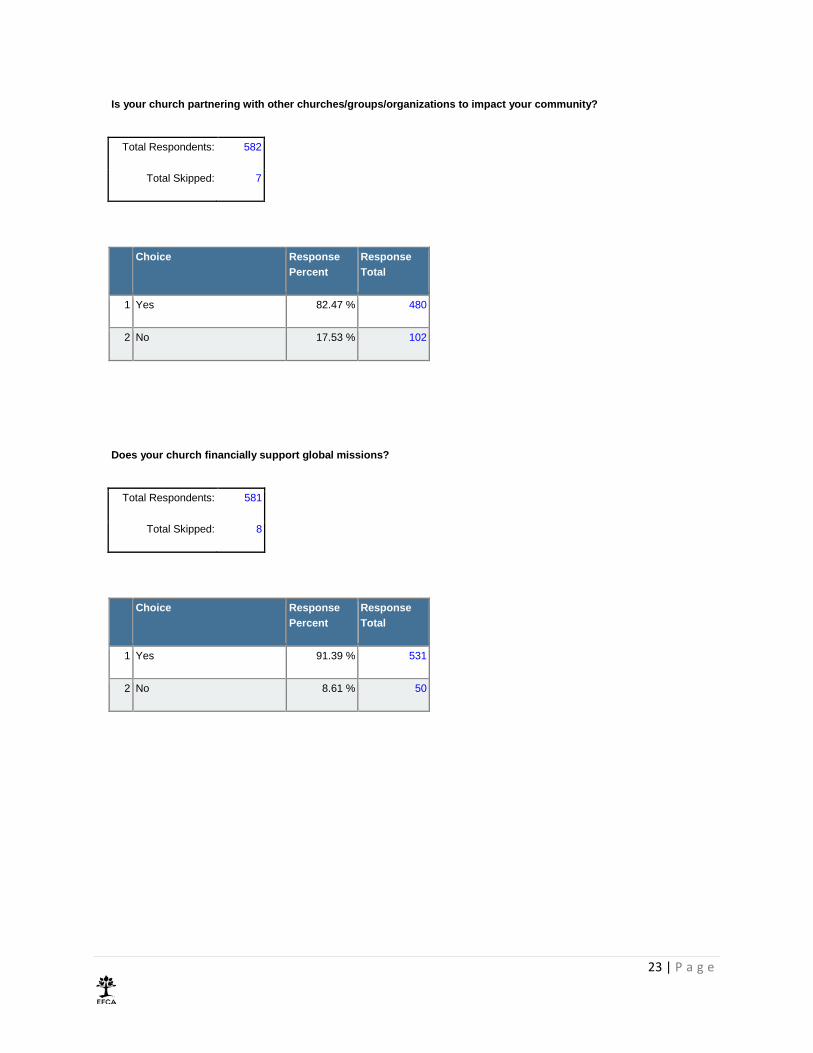
Is your church partnering with other churches/groups/organizations to impact your community?
Total Respondents: 582
Total Skipped: 7
Choice Response Percent
Response Total
1 Yes 82.47 % 480
2 No 17.53 % 102
Does your church financially support global missions?
Total Respondents: 581
Total Skipped: 8
Choice Response Percent
Response Total
1 Yes 91.39 % 531
2 No 8.61 % 50
23 | P a g e

Does your church support missionaries serving with EFCA ReachGlobal?
Total Respondents: 579
Total Skipped: 10
Choice Response Percent
Response Total
1 Yes 62.52 % 362
2 No 37.48 % 217
What percentage of your congregation is in a relational group (small groups/ growth groups/missional communities)?
Total Respondents: 575
Total Skipped: 12
Choice Response Percent
Response Total
1 Less than 10% 5.39 % 31
2 10-25% 20.70 % 119
3 26-50% 38.43 % 221
4 More than 50% 35.48 % 204
24 | P a g e

What percentage of your congregation is being mentored/discipled while mentoring/discipling someone else?
Total Respondents: 576
Total Skipped: 11
Choice Response Percent
Response Total
1 Less than 10% 42.53 % 245
2 10-25% 40.10 % 231
3 26-50% 13.19 % 76
4 More than 50% 4.17 % 24
What percentage of adults serve in your church?
Total Respondents: 577
Total Skipped: 10
Choice Response Percent
Response Total
1 Less than 10% 1.73 % 10
2 10-25% 17.50 % 101
3 26-50% 48.35 % 279
4 More than 50% 32.41 % 187
25 | P a g e

What percentage of students serve in your church?
Total Respondents: 570
Total Skipped: 17
Choice Response Percent
Response Total
1 Less than 10% 22.98 % 131
2 10-25% 34.74 % 198
3 26-50% 24.39 % 139
4 More than 50% 17.89 % 102
What percentage of adults are serving intentionally outside your church?
Total Respondents: 564
Total Skipped: 23
Choice Response Percent
Response Total
1 Less than 10% 23.05 % 130
2 10-25% 49.82 % 281
3 26-50% 20.92 % 118
4 More than 50% 6.21 % 35
26 | P a g e

What percentage of students are serving intentionally outside your church?
Total Respondents: 562
Total Skipped: 25
Choice Response Percent
Response Total
1 Less than 10% 47.33 % 266
2 10-25% 36.30 % 204
3 26-50% 11.74 % 66
4 More than 50% 4.63 % 26
What percentage of your leaders have identified apprentices (are reproducing leaders)?
Total Respondents: 559
Total Skipped: 17
Choice Response Percent
Response Total
1 Less than 10% 60.64 % 339
2 10-25% 22.54 % 126
3 26-50% 9.12 % 51
4 More than 50% 7.69 % 43
27 | P a g e