Embed Size (px)
Citation preview
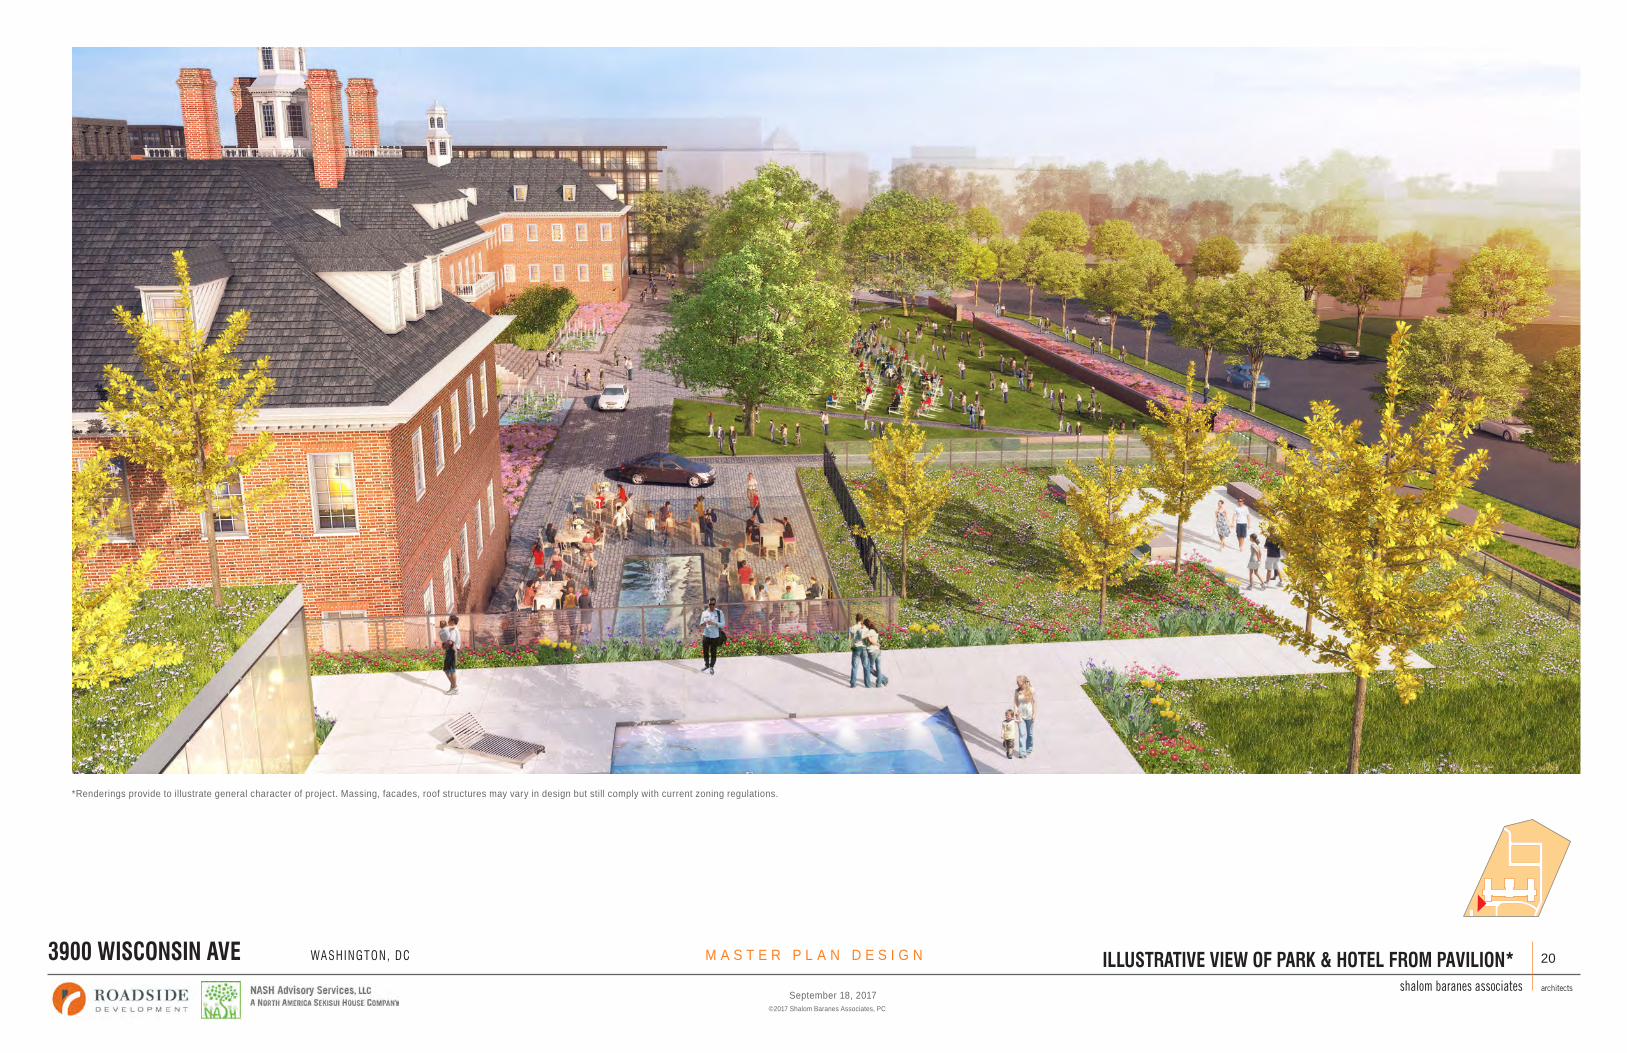
ILLUSTRATIVE VIEW OF PARK & HOTEL FROM PAVILION*shalom baranes associates architects
WASHINGTON, DC3900 WISCONSIN AVE M A S T E R P L A N D E S I G N 20
3900 Wisconsin Avenue | 2
Development Team
Key Partners/Consultants
Retail Anchor Architect Construction Land Use Attorney
September 18, 2017©2017 Shalom Baranes Associates, PC
*Renderings provide to illustrate general character of project. Massing, facades, roof structures may vary in design but still comply with current zoning regulations.
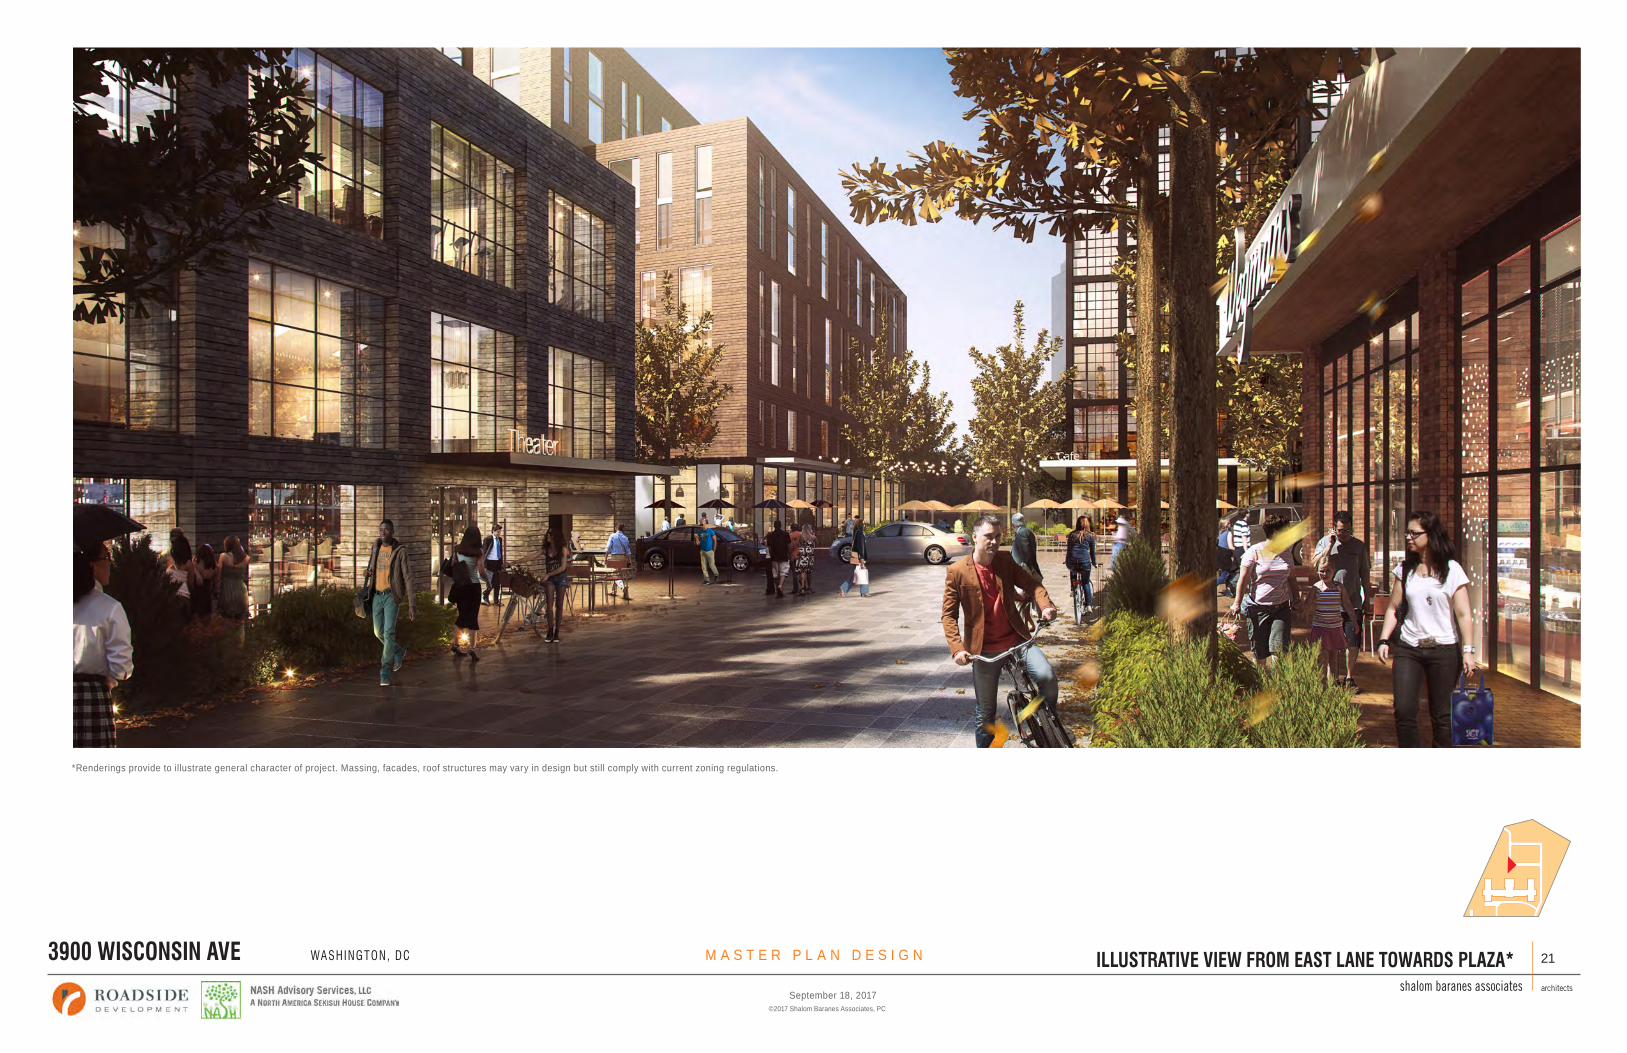
ILLUSTRATIVE VIEW FROM EAST LANE TOWARDS PLAZA*shalom baranes associates architects
WASHINGTON, DC3900 WISCONSIN AVE M A S T E R P L A N D E S I G N 21
3900 Wisconsin Avenue | 2
Development Team
Key Partners/Consultants
Retail Anchor Architect Construction Land Use Attorney
September 18, 2017©2017 Shalom Baranes Associates, PC
*Renderings provide to illustrate general character of project. Massing, facades, roof structures may vary in design but still comply with current zoning regulations.
EN
GIN
EE
RS
PLA
NN
ER
SLA
ND
SC
AP
E A
RC
HIT
EC
TS
SU
RV
EY
OR
SS
US
TA
IN
AB
LE
D
ES
IG
N
EN
GIN
EE
RS
PLA
NN
ER
SLA
ND
SC
AP
E A
RC
HIT
EC
TS
SU
RV
EY
OR
SS
US
TA
IN
AB
LE
D
ES
IG
N
“ ”
“ ”
N
O
R
T
H
C
O
U
R
T
H
Y
A
R
D
W
E
S
T
C
O
U
R
T
Y
A
R
D
370'-
0"
TOW
N SQ
UARE
OUTDOOR
AREA
WES
T LAN
E
EAST
LANE
NORTH LANE
SOUTH LANE C
O
U
R
T
Y
A
R
D
C
O
U
R
T
Y
A
R
D
C
O
U
R
T
Y
A
R
D
3
8
8
'-
0
"
3
9
8
'-
0
"
3
9
8
'-
0
"
3
9
3
'-
9
"
3
9
8
'-
0
"
3
9
8
'-
0
"
3
9
2
'-
0
"
3
9
0
'-
0
"
3
9
2
'-
0
"
A
M
E
N
I
T
Y
T
E
R
R
A
C
E
5.0%
4.0%
3
9
5
'-
6
"
3
9
6
'-
0
"
3
9
0
'-
0
"
MP: +
390'-
8"
3
9
3
'-
9
"
EN
GIN
EE
RS
PLA
NN
ER
SLA
ND
SC
AP
E A
RC
HIT
EC
TS
SU
RV
EY
OR
SS
US
TA
IN
AB
LE
D
ES
IG
N

Exhibit E
September 18, 2017
WASHINGTON, DC
COMPREHENSIVE TRANSPORTATION REVIEW
3900 WISCONSIN AVENUE LARGE TRACT REVIEW
Prepared by:
1140 Connecticut Avenue NW Suite 600
Washington, DC 20036 Tel: 202.296.8625 Fax: 202.785.1276
3914 Centreville Road Suite 330
Chantilly, VA 20151 Tel: 703.787.9595 Fax: 703.787.9905
15125 Washington Street Suite 136
Haymarket, VA 20169 Tel: 703.787.9595 Fax: 703.787.9905
www.goroveslade.com
This document, together with the concepts and designs presented herein, as an instrument of services, is intended for the specific purpose and client for which it was prepared. Reuse of and improper reliance on this document without written authorization by Gorove/Slade Associates, Inc., shall be without liability to Gorove/Slade Associates, Inc.
Contents
Executive Summary ..................................................................................................................................................................................... i
Introduction ............................................................................................................................................................................................... 1
Contents of Study .................................................................................................................................................................................. 1
Study Area Overview ................................................................................................................................................................................. 4
Major Transportation Features .............................................................................................................................................................. 4
Future Regional Projects ........................................................................................................................................................................ 6
Project Design .......................................................................................................................................................................................... 10
Site Access ............................................................................................................................................................................................ 11
Loading ................................................................................................................................................................................................. 12
Parking ................................................................................................................................................................................................. 12
Transportation Demand Management (TDM) ..................................................................................................................................... 13
Trip Generation ........................................................................................................................................................................................ 21
Traffic Operations .................................................................................................................................................................................... 25
Study Area, Scope, & Methodology ..................................................................................................................................................... 25
Vehicular Analysis Results .................................................................................................................................................................... 30
Summary of Traffic Operations ............................................................................................................................................................ 33
Transit ...................................................................................................................................................................................................... 60
Existing Transit Service ........................................................................................................................................................................ 60
Proposed Transit Service ..................................................................................................................................................................... 60
Site-Generated Transit Impacts ........................................................................................................................................................... 62
Pedestrian Facilities ................................................................................................................................................................................. 65
Pedestrian Study Area.......................................................................................................................................................................... 65
Pedestrian Infrastructure ..................................................................................................................................................................... 65
Site Impacts .......................................................................................................................................................................................... 66
Bicycle Facilities ....................................................................................................................................................................................... 69
Existing Bicycle Facilities ...................................................................................................................................................................... 69
Proposed Bicycle Facilities ................................................................................................................................................................... 69
Site Impacts .......................................................................................................................................................................................... 69
Crash Data Analysis .................................................................................................................................................................................. 71
Summary of Available Crash Data ........................................................................................................................................................ 71
Potential Impacts ................................................................................................................................................................................. 71
Summary and Conclusions ....................................................................................................................................................................... 73
Figures
Figure 1: Site Location ................................................................................................................................................................................ 3
Figure 2: Summary of Walkscore and Bikescore ........................................................................................................................................ 5
Figure 3: Major Regional Transportation Facilities .................................................................................................................................... 7
Figure 4: Major Local Transportation Facilities .......................................................................................................................................... 8
Figure 5: Planned Development Map ........................................................................................................................................................ 9
Figure 6: Existing Site Layout ................................................................................................................................................................... 14
Figure 7: Site Plan .................................................................................................................................................................................... 15
Figure 8: Development Program by Parcel .............................................................................................................................................. 16
Figure 9: External Vehicular Access ......................................................................................................................................................... 17
Figure 10: Internal Vehicular Access and Circulation ............................................................................................................................... 18
Figure 11: Pedestrian Facilities and Circulation ....................................................................................................................................... 19
Figure 12: Bicycle Facilities and Circulation ............................................................................................................................................. 20
Figure 13: Study Area Intersections ......................................................................................................................................................... 34
Figure 14: Existing Peak Hour Traffic Volumes ........................................................................................................................................ 35
Figure 15: Inbound Distribution and Routing .......................................................................................................................................... 36
Figure 16: Outbound Distribution and Routing ....................................................................................................................................... 37
Figure 17: Current Lane Configuration and Traffic Control ..................................................................................................................... 38
Figure 18: Planned Lane Configuration and Traffic Control ..................................................................................................................... 39
Figure 19: Background Peak Hour Traffic Volumes .................................................................................................................................. 40
Figure 20: 3900 Wisconsin Avenue Net Site-Generated Peak Hour Traffic Volumes .............................................................................. 41
Figure 21: 4000 Wisconsin Avenue Net Site-Generated Peak Hour Traffic Volumes .............................................................................. 42
Figure 22: Total Fannie Mae Campus Net Site-Generated Peak Hour Traffic Volumes ........................................................................... 43
Figure 23: Future Peak Hour Traffic Volumes .......................................................................................................................................... 44
Figure 24: Summary of Recommended Improvements ........................................................................................................................... 45
Figure 25: Morning Peak Hour Capacity Analysis Results ........................................................................................................................ 53
Figure 26: Afternoon Peak Hour Capacity Analysis Results ..................................................................................................................... 54
Figure 27: Saturday Peak Hour Capacity Analysis Results ....................................................................................................................... 55
Figure 28: Existing Transit Service ............................................................................................................................................................ 63
Figure 29: Bus Headways and Frequency (weekdays) ............................................................................................................................. 64
Figure 30: Pedestrian Pathways ............................................................................................................................................................... 67
Figure 31: Existing Pedestrian Infrastructure ........................................................................................................................................... 68
Figure 32: Existing and Proposed Bicycle Facilities .................................................................................................................................. 70
Tables
Table 1: Carshare Locations within 0.5 miles of the Site ........................................................................................................................... 5
Table 2: Fannie Mae Existing Employee and Parking Breakdown ........................................................................................................... 10
Table 5: Summary of 3900 Wisconsin Avenue Mode Split Assumptions ................................................................................................. 21
Table 6: Summary of 4000 Wisconsin Avenue Mode Split Assumptions ................................................................................................. 21
Table 7: 3900 Wisconsin Avenue Multi-Modal Trip Generation Summary ............................................................................................. 23
Table 8: 4000 Wisconsin Avenue Multi-Modal Trip Generation Summary ............................................................................................. 24
Table 10: Summary of Background Development Trip Generation ......................................................................................................... 27
Table 9: Assumed Applied Annual Growth Rates .................................................................................................................................... 27
Table 11: Existing Fannie Mae Campus Trip Generation ......................................................................................................................... 28
Table 12: 4000 Wisconsin Avenue Site Trip Distributions ....................................................................................................................... 29
Table 13: Fannie Mae Campus Net Trip Generation ................................................................................................................................ 29
Table 14: LOS Results ............................................................................................................................................................................... 46
Table 15: Intersection Summary - Capacity Analysis Results ................................................................................................................... 48
Table 16: Queuing Results ....................................................................................................................................................................... 51
Table 17: Mitigated LOS Results .............................................................................................................................................................. 56
Table 18: Mitigated Queuing Results ....................................................................................................................................................... 58
Table 20: Metrobus Route Information ................................................................................................................................................... 60
Table 21: Transit Stops Requirements ..................................................................................................................................................... 61
Table 22: Sidewalk Requirements ............................................................................................................................................................ 65
Table 22: Intersection Crash Rates (2013-2015) ...................................................................................................................................... 72
Table 23: Crash Type Breakdown ............................................................................................................................................................. 72
i
EXECUTIVE SUMMARY
The following report is a Comprehensive Transportation Review
(CTR) for the 3900 Wisconsin Avenue development. This report
reviews the transportation aspects of the project’s Large Tract
Review (LTR) application.
The purpose of this study is to evaluate whether the project
will generate a detrimental impact to the surrounding
transportation network. This evaluation is based on a technical
comparison of the existing conditions, background conditions,
and total future conditions. This report concludes that the
project will not have a detrimental impact to the surrounding
transportation network assuming that all planned site design
elements and mitigations are implemented.
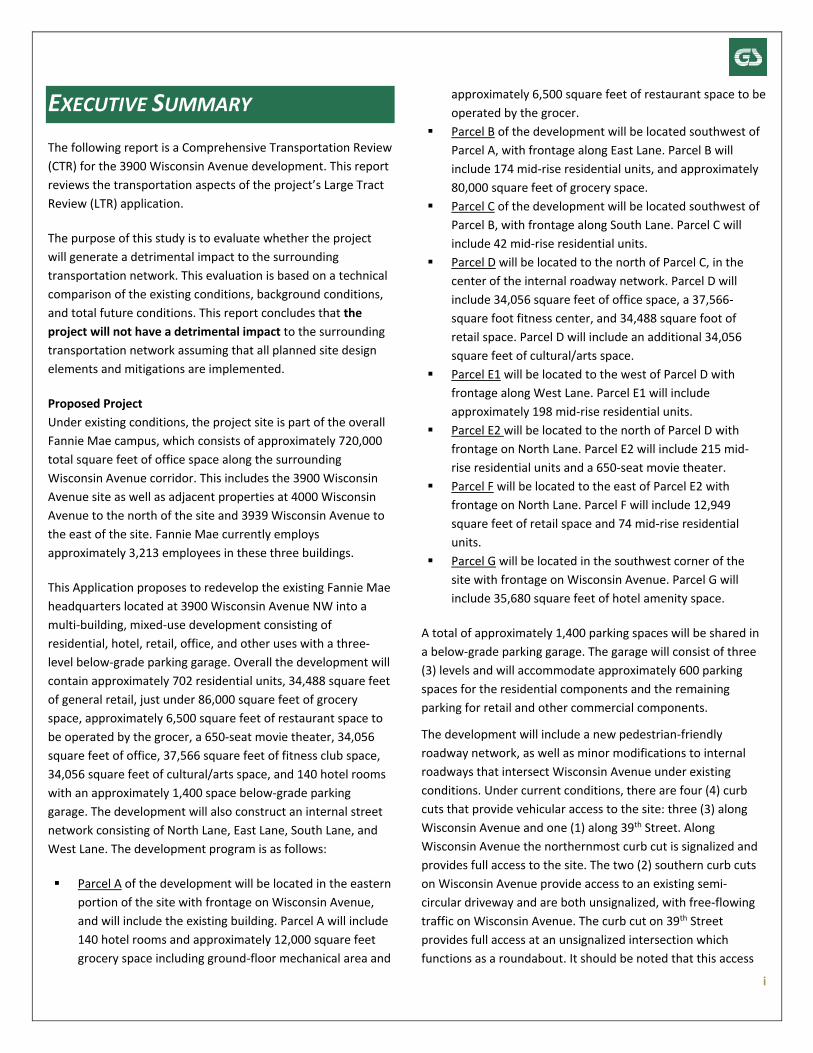
Proposed Project
Under existing conditions, the project site is part of the overall
Fannie Mae campus, which consists of approximately 720,000
total square feet of office space along the surrounding
Wisconsin Avenue corridor. This includes the 3900 Wisconsin
Avenue site as well as adjacent properties at 4000 Wisconsin
Avenue to the north of the site and 3939 Wisconsin Avenue to
the east of the site. Fannie Mae currently employs
approximately 3,213 employees in these three buildings.
This Application proposes to redevelop the existing Fannie Mae
headquarters located at 3900 Wisconsin Avenue NW into a
multi-building, mixed-use development consisting of
residential, hotel, retail, office, and other uses with a three-
level below-grade parking garage. Overall the development will
contain approximately 702 residential units, 34,488 square feet
of general retail, just under 86,000 square feet of grocery
space, approximately 6,500 square feet of restaurant space to
be operated by the grocer, a 650-seat movie theater, 34,056
square feet of office, 37,566 square feet of fitness club space,
34,056 square feet of cultural/arts space, and 140 hotel rooms
with an approximately 1,400 space below-grade parking
garage. The development will also construct an internal street
network consisting of North Lane, East Lane, South Lane, and
West Lane. The development program is as follows:
Parcel A of the development will be located in the eastern
portion of the site with frontage on Wisconsin Avenue,
and will include the existing building. Parcel A will include
140 hotel rooms and approximately 12,000 square feet
grocery space including ground-floor mechanical area and
approximately 6,500 square feet of restaurant space to be
operated by the grocer.
Parcel B of the development will be located southwest of
Parcel A, with frontage along East Lane. Parcel B will
include 174 mid-rise residential units, and approximately
80,000 square feet of grocery space.
Parcel C of the development will be located southwest of
Parcel B, with frontage along South Lane. Parcel C will
include 42 mid-rise residential units.
Parcel D will be located to the north of Parcel C, in the
center of the internal roadway network. Parcel D will
include 34,056 square feet of office space, a 37,566-
square foot fitness center, and 34,488 square foot of
retail space. Parcel D will include an additional 34,056
square feet of cultural/arts space.
Parcel E1 will be located to the west of Parcel D with
frontage along West Lane. Parcel E1 will include
approximately 198 mid-rise residential units.
Parcel E2 will be located to the north of Parcel D with
frontage on North Lane. Parcel E2 will include 215 mid-
rise residential units and a 650-seat movie theater.
Parcel F will be located to the east of Parcel E2 with
frontage on North Lane. Parcel F will include 12,949
square feet of retail space and 74 mid-rise residential
units.
Parcel G will be located in the southwest corner of the
site with frontage on Wisconsin Avenue. Parcel G will
include 35,680 square feet of hotel amenity space.
A total of approximately 1,400 parking spaces will be shared in
a below-grade parking garage. The garage will consist of three
(3) levels and will accommodate approximately 600 parking
spaces for the residential components and the remaining
parking for retail and other commercial components.
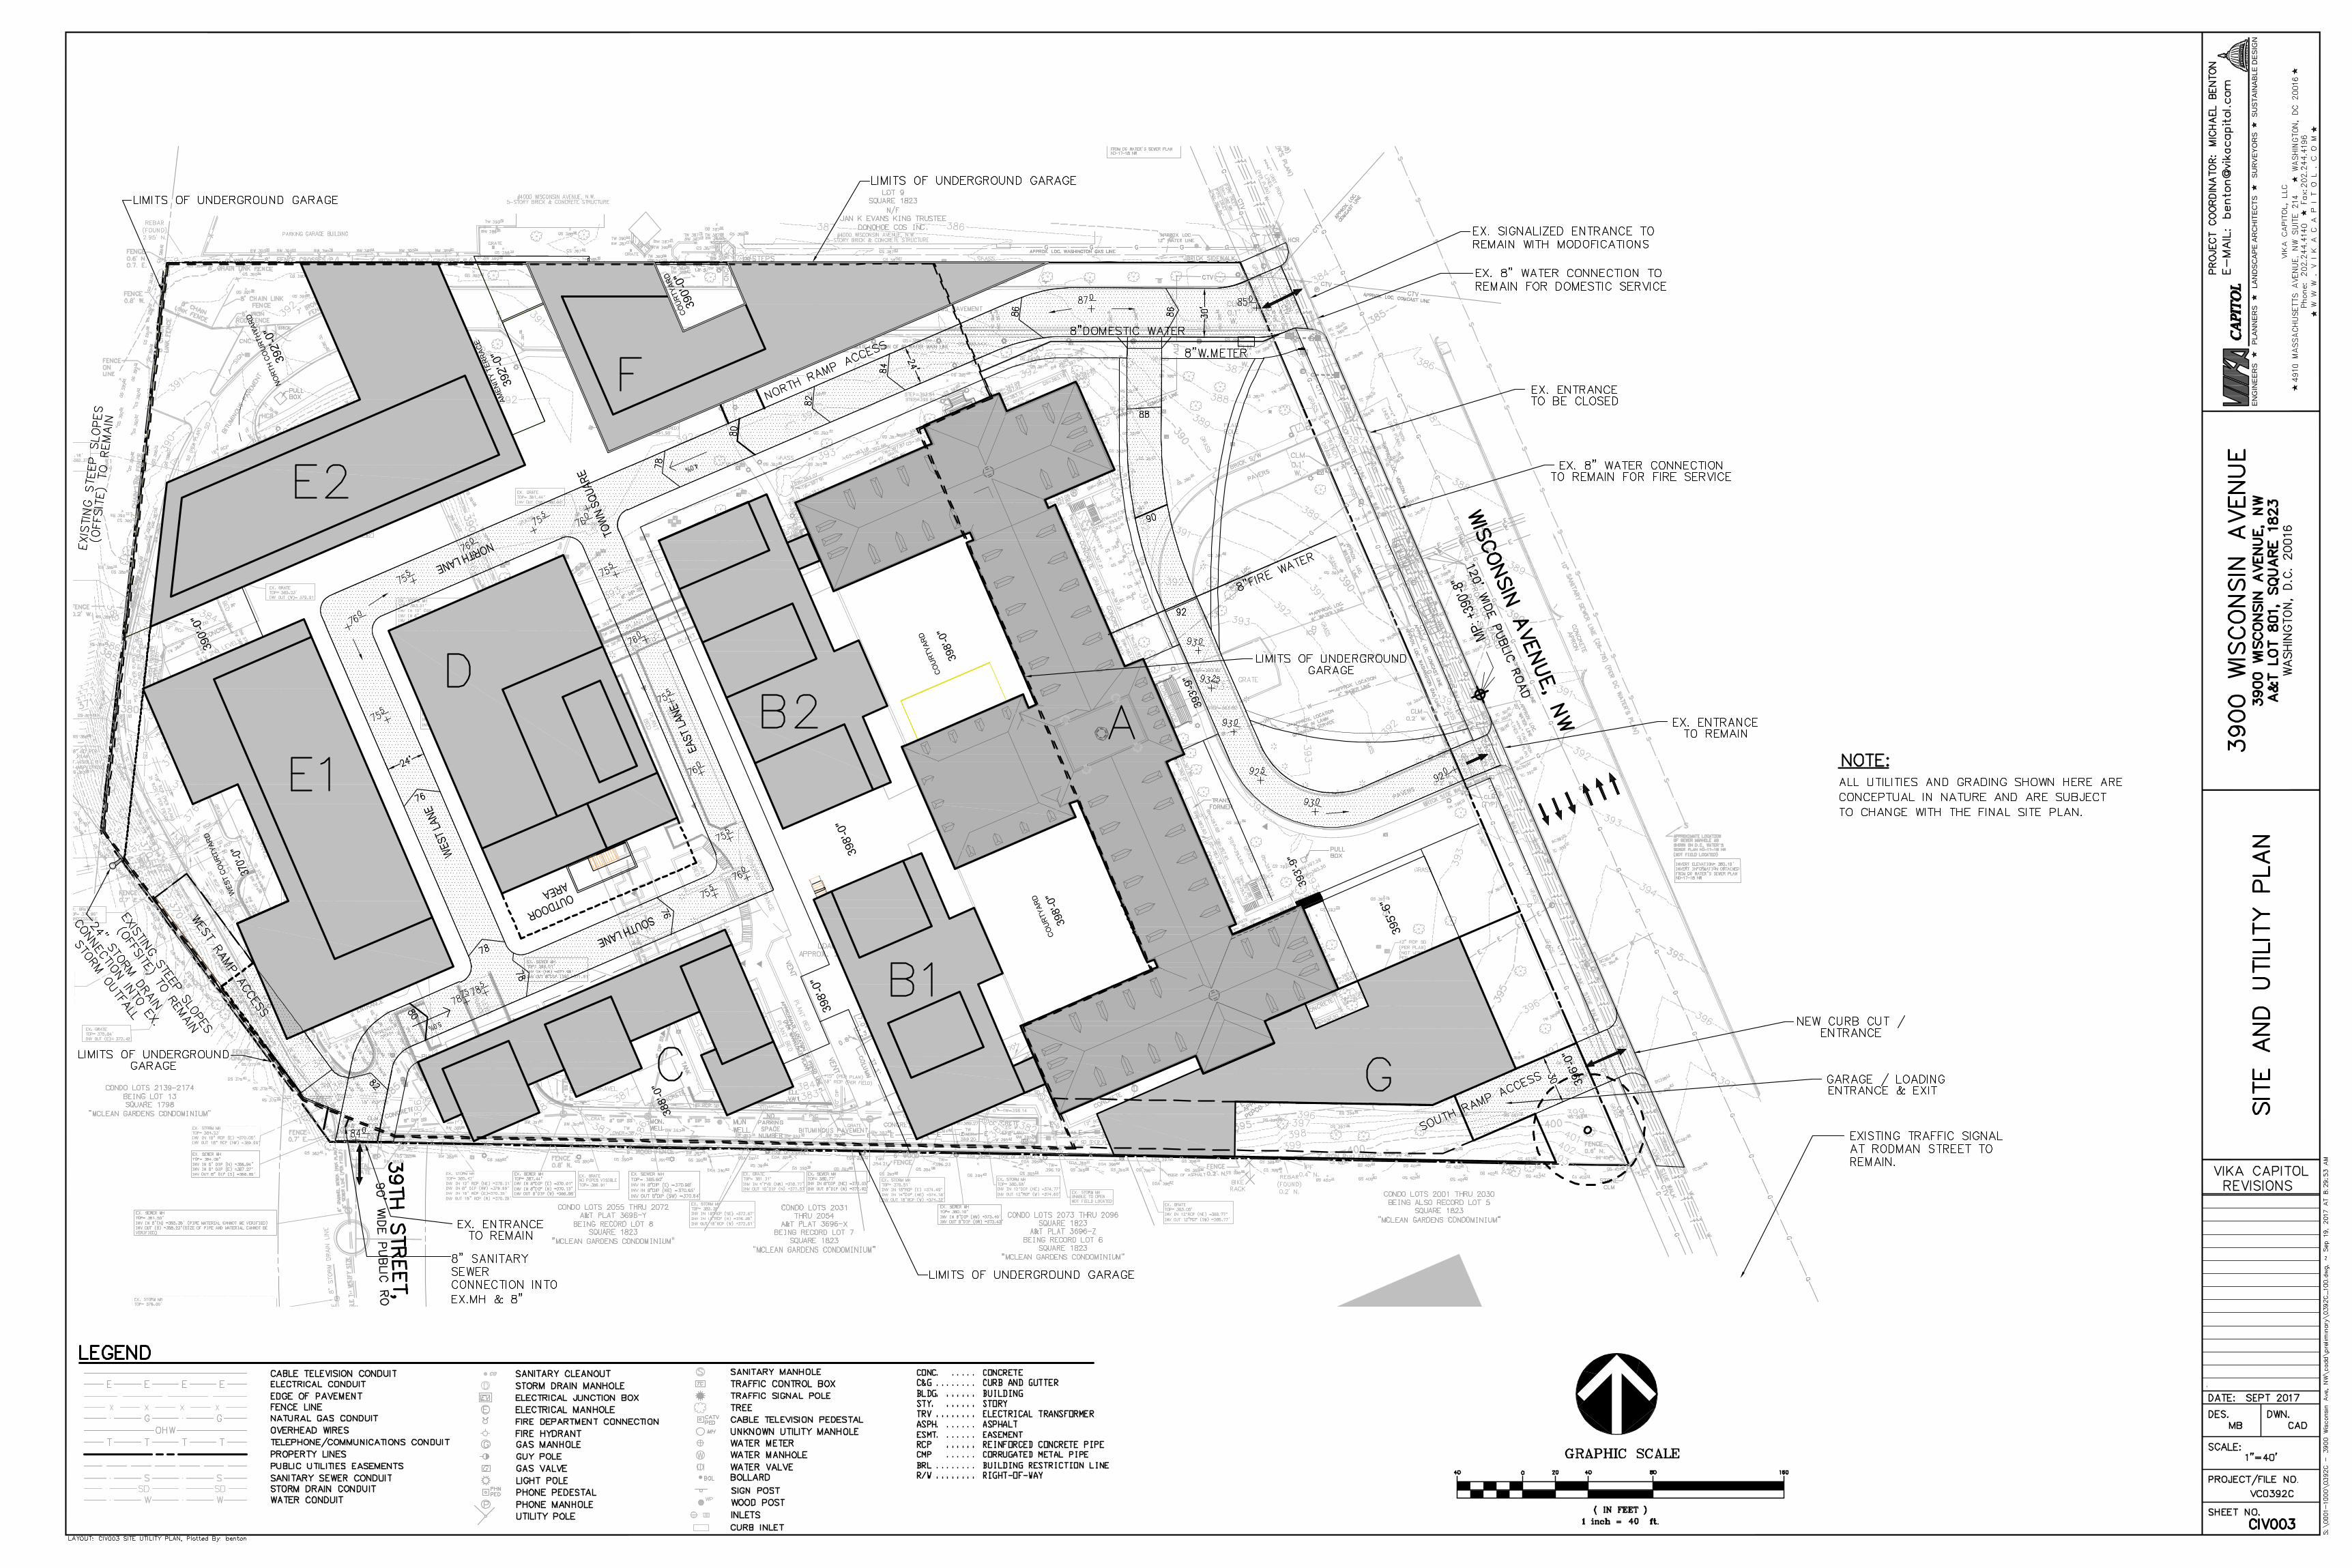
The development will include a new pedestrian-friendly
roadway network, as well as minor modifications to internal
roadways that intersect Wisconsin Avenue under existing
conditions. Under current conditions, there are four (4) curb
cuts that provide vehicular access to the site: three (3) along
Wisconsin Avenue and one (1) along 39th Street. Along
Wisconsin Avenue the northernmost curb cut is signalized and
provides full access to the site. The two (2) southern curb cuts
on Wisconsin Avenue provide access to an existing semi-
circular driveway and are both unsignalized, with free-flowing
traffic on Wisconsin Avenue. The curb cut on 39th Street
provides full access at an unsignalized intersection which
functions as a roundabout. It should be noted that this access
ii
point is only open during the morning and afternoon peak
periods to help process existing peak office traffic, due to
Fannie Mae’s traffic control measures.
Future vehicular access to the site will be primarily via two
existing curb cuts and one new cub cut off of Wisconsin
Avenue, with some residential access via an existing curb cut
off of 39th Street. Along Wisconsin Avenue, two of the curb cuts
are planned to operate as signalized and one is planned to
operate as unsignalized. Under full buildout conditions, the
existing half-circle driveway, which fronts the existing building,
will be converted to one-way traffic such that the southern
curb cut serves outbound traffic only. The northernmost curb
cut along Wisconsin Avenue will be relocated such that it
connects to the new internal roadway network as opposed to
Wisconsin Avenue. The new southern curb cut will connect to a
below-grade parking garage as well as loading facilities for the
site.
A total of 14 loading berths and service/delivery spaces will be
provided on site. Based on an analysis of anticipated loading
activity, the development provides sufficient loading facilities
to accommodate practical loading needs.
Pedestrian access to the development is expected to occur via
Wisconsin Avenue and 39th Street. Additional connections to
the adjacent neighborhoods along the north and south sides of
the site are possible, but must be coordinated with the
neighbors. A connection to the existing trail within Glover
Archbold Park will also be available pending coordination with
National Park Service.
Internal to the site, much of the space is dedicated to
pedestrian circulation and urban plaza area, such that
pedestrians can easily traverse between the buildings and the
adjoining public space. There is also extensive green space that
can be used as pedestrian gathering and recreation areas.
Overall, the pedestrian connectivity and circulation within the
site is expected to deliver an ideal pedestrian environment.
Multi-Modal Impacts and Recommendations
Transit
The site is adequately served by regional and local transit
services such as Metrorail and Metrobus. The site is less than
0.5 miles from the Tenleytown-AU Metrorail station. Nine
Metrobus routes along five different lines service the site, with
42 buses scheduled to arrive during the peak morning
commute time and 56 buses during the peak afternoon
commute time, providing a good connection to Metrorail and
other destinations. Metrobus stops are located within a block
of the site along Wisconsin Avenue.
Although the development will be generating new transit trips
on the network, the existing facilities have enough capacity to
handle the new trips. The Tenleytown-AU Metrorail station
does not have existing capacity concerns and is not expected to
as a result of the planned development.
Pedestrian
The site is surrounded by a pedestrian network with good
connections. Most roadways within a quarter-mile radius
provide sidewalks and acceptable crosswalks and curb ramps,
particularly along primary walking routes. The area in the
vicinity of the site is considered to be above the District
average in terms of quality of pedestrian facilities.
As a result of the development pedestrian facilities along the
perimeter of the site will be improved. The development will
improve sidewalks adjacent to the site such that they meet or
exceed the District Department of Transportation (DDOT)
requirements and provide an improved pedestrian
environment. In addition, the development will include an
internal pedestrian network that will provide quality pedestrian
facilities and a pedestrian plaza and other open spaces that
links the various uses of the site.
Bicycle
The site has adequate access to existing bicycle facilities.
Shared lanes on Van Ness Street offer east-west connectivity,
and on-street signed routes along 36th and 37th Street offer
north-south connectivity. The planned development will meet
zoning requirements for bicycle parking and related support
facilities/amenities.
Vehicular
The site is well-connected to regional roadways such as
Interstate 66 and Interstate 495, primary and minor arterials
such as Wisconsin Avenue, Connecticut Avenue, and
Massachusetts Avenue, as well as an existing network of
collector and local roadways.
In order to determine if the proposed development will have a
negative impact on the transportation network, this report
projects future conditions with and without the overall Fannie
Mae Campus. Following DDOT guidelines there are impacts to