Embed Size (px)
Citation preview

Huaiming SongNov.17th 2010

What is Event Stream Analysis ?yESAS System: DBrokerQ P di ti i ESASQuery Prediction in ESAS

Financial�transaction�data�processingWhich�stocks�are�the�most�active�in�trading�market?Anomaly�detection�in�trading�market…
NetIDSNetIDSWhat�is�the�influence�of�XXX�BotNet over�the�network�?What�kind�of�systems�does�XXX�Trojan�programs�attack?
S i l k i iSocial�network�miningWho�contact�with�A�(maybe�a�criminal,�or�VIP)How�to�discover�a�special�communityp y
People�with�same�characters,�and�the�relation�ship�between�them?How�does�a�community�evolve�over�time?
Telecom�monitoring�systeme eco o to g systeWhat�topics�people�talked�most�over�the�phone?what�is�the�community�of�a�specific�topic?
Sensor network analysis systemSensor�network�analysis�system…

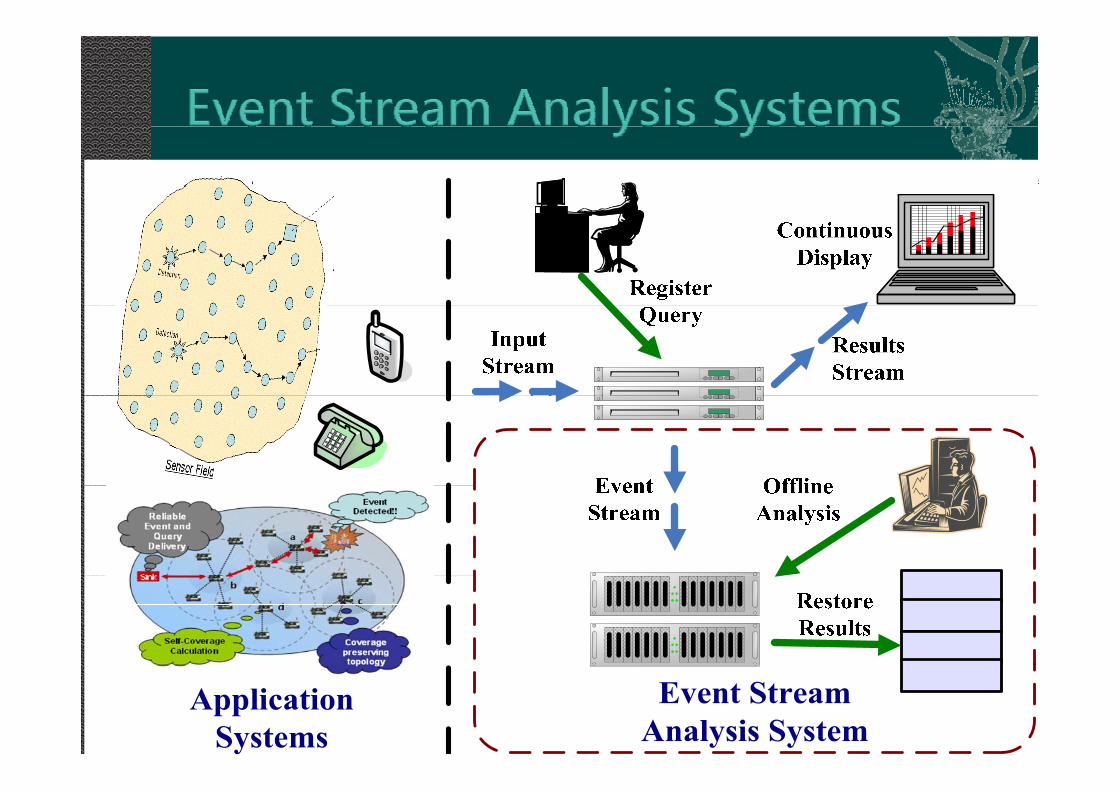
DefinitionEvent: something happen or be in certain status at sometime in the observed world. E=<p, t>
eg1: in Financial transaction system, an event can be represented as {t_id, t_name, stk_no, acc_no, t_prc, t_amt, t_all, serv_id, agent_id, t_time…};
eg2: in a NetIDS system, an event can be represented as {e_name,e_type, dev_id, inout_id,s_ip,s_port, d_ip,d_port,var,e_time…}Event Stream: A stream consists of endless event serialsS ( E E E E E )S=(… Et-2, Et-1, Et, Et+1, Et+2, …)Event Stream Analysis Systems: Systems that make analysis or statistics of event streammake analysis or statistics of event stream.

Offline data storing and queryingS h i i hi h d i iSystem�characteristic:high�speed�arriving,append-only,no�updating,detailed�and�statistics query time condition datastatistics�query,time�condition,data�aging
Two Common query typesTwo Common query typesDetailed query, Q1:Select e id e type e count e time from e baseSelect�e_id,�e_type,�e_count,�e_time from�e_basewhere�e_type =’xxxx’�and�e_time between�(t1,�t2);St ti ti Q2Statistics query, Q2:Select�e_id,�sum(e_count)�from�e_base where�e type =’xxxx’ and e time between (t1 t2)e_type = xxxx �and�e_time between�(t1,�t2)�group�by�e_id;

Data SizeData�SizeContinuous�and�endless�streamInserting at a very high speedInserting�at�a�very�high�speede.g.:�DBroker system�continuous�inserting�speed�>20MB/sIndex�data�size�even�larger
Q P iQuery�ProcessingTime�conditions
select from where e time between (t1 t2) ;select�…from…where�e_time between�(t1,t2)…;Complex�query�not�allowed
No�or�less�join�operation;�no�or�less�embed�queryStatistics�of�stream�is�common
Group-by,�aggregation�(sum,�avg,�min,�max,�count,�distinct…))

Database Data�Stream Event�Stream
SQL
CQL
DML SQL stream SQL/CQLstream
DB
• Data�write�to�disk• Query�from�disk• Data�changes
• Stream process• Pre-defined�query• Continuous�query
• Stream to�disk• Query�from�disks• Pre-defined�&�ad-
h• Ad-hoc�Query • Continuous�result hoc�query• Data�expired
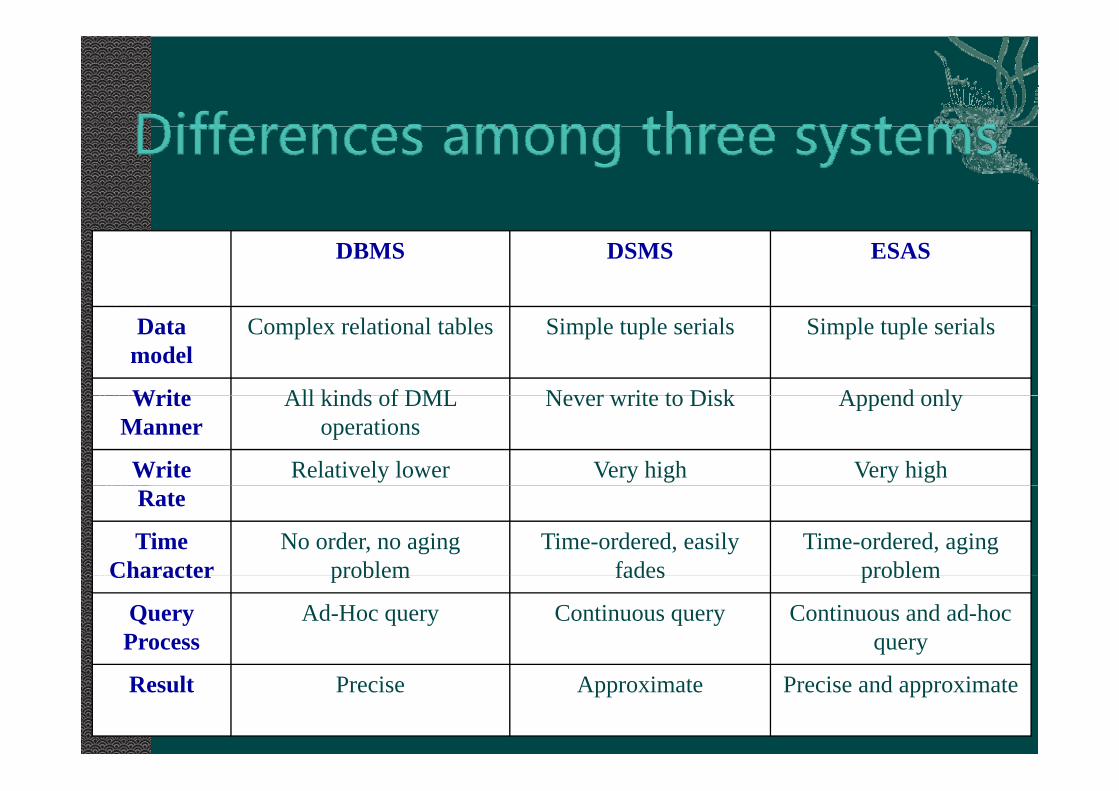
DBMS DSMS ESAS
Data model
Complex relational tables Simple tuple serials Simple tuple serials
Write All kinds of DML Never write to Disk Append onlyWrite Manner
All kinds of DML operations
Never write to Disk Append only
Write Relatively lower Very high Very highRate
Time Character
No order, no aging problem
Time-ordered, easily fades
Time-ordered, aging problemCharacter problem fades problem
Query Process
Ad-Hoc query Continuous query Continuous and ad-hoc query
Result Precise Approximate Precise and approximate
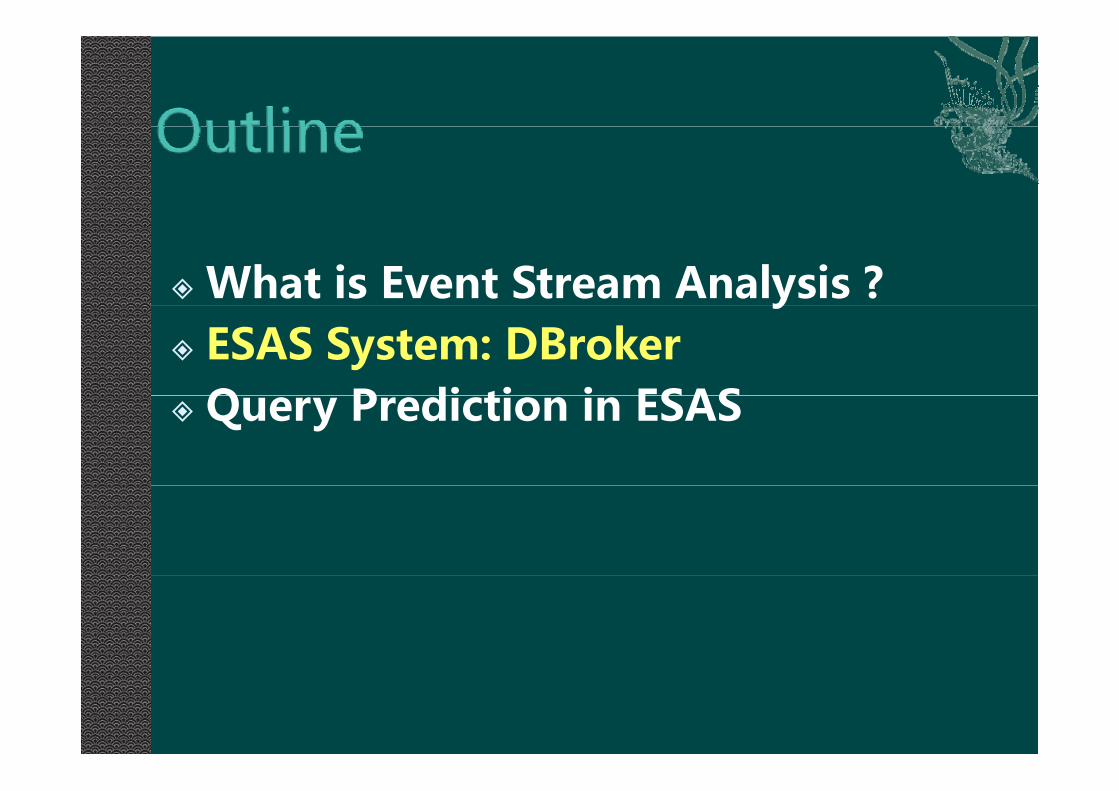
What is Event Stream Analysis ?yESAS System: DBrokerQ P di ti i ESASQuery Prediction in ESAS

Developed by ICT, CASLarge Scale Data Intensive Applications
Shared-nothing Arch.gContinuous Loading Speed > 20MB/s (peak loading several times larger)D t i l (h d d TB PB )Data size very large (hundreds TBs, or PBs)Oracle 10g [RAC] in DB nodes
ESAS li tiESAS applicationsEvent (e_name, e_type, dev_id, in_out_id, s_ip, s port d ip d port msg e time )s_port, d_ip, d_port, msg, e_time….)
Event statistical or detailed query in a time windowwindow


• Functional Techs.DB links management,2-step query process, consistence of configuration data,massage subscription
B l T h• Balance Techs.Data partition, net link partition, query synchronizing, stats data repartitionp
• Performance OptimizingBatch loading, result set pre-fetching, client buffering in transaction, lazy indexing, storage optimizing
• ReliabilityS f i f iSoftware: auto reconnect, auto selection of available server nodes, node fault handle of ServersHardware: redundancy of disks, fiber channel, network, nodes; hot y , , , ;spare techs.
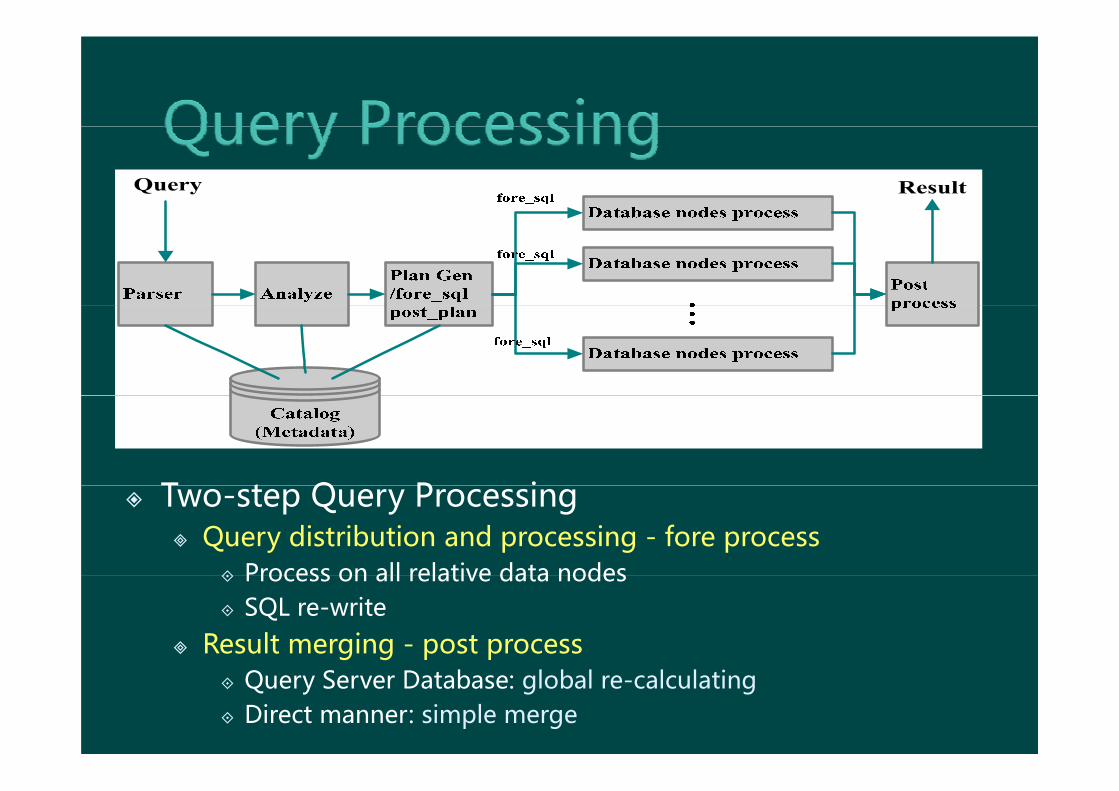
T t Q P iTwo-step�Query�ProcessingQuery�distribution�and�processing�- fore�process
Process on all relative data nodesProcess�on�all�relative�data�nodesSQL�re-write
Result�merging�- post�processQuery�Server�Database:�global�re-calculatingDirect�manner:�simple�merge

DBDB1
Query�Server
App�Client
DB2
DB3
DB4
Detailed query: Simple mergeDetailed�query:�Simple�mergeE.g.:�Select�*�from�e_base where�e.type=xxx;
Statistical query: Result re-calculation aggragate functionsStatistical�query:�Result�re calculation�aggragate functionsE.g.:�Select�sum(e_count),�e_type from�e_base where�…�group�by�e_type;

What is Event Stream Analysis ?yESAS System: DBrokerQ P di ti i ESASQuery Prediction in ESAS
3.1 Data access locality problem in ESAS3.2 Query PredictionQ y3.4 Conclusion
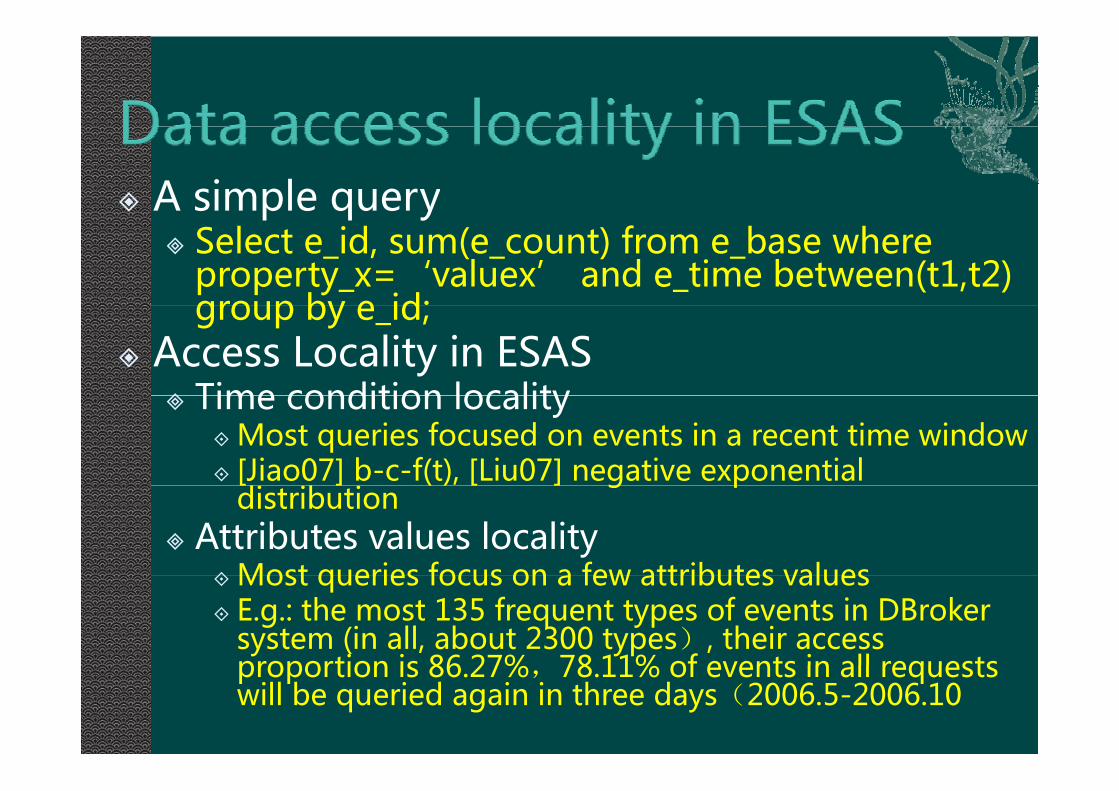
A�simple�queryp q ySelect�e_id,�sum(e_count)�from�e_base where�property_x=‘valuex’�and�e_time between(t1,t2)�group by e id;group�by�e_id;
Access�Locality�in�ESASTime condition localityTime�condition�locality
Most�queries�focused�on�events�in�a�recent�time�window[Jiao07]�b-c-f(t),�[Liu07]�negative�exponential�d b[ ] ( ) [ ] g pdistribution
Attributes�values�localityMost queries focus on a few attributes valuesMost�queries�focus�on�a�few�attributes�valuesE.g.:�the�most�135�frequent�types�of�events�in�DBrokersystem�(in�all,�about�2300�types),�their�access�proportion is 86 27% 78 11% of events in all requestsproportion�is�86.27%,78.11%�of�events�in�all�requests�will�be�queried�again�in�three�days(2006.5-2006.10

We call access locality in ESAS: Recent hotWe�call�access�locality�in�ESAS:�Recent�hot�spot�event�accessD t i blData�aging�problem
Stream�flowing�fast,�results�evolve�fast�gSame�conditions,�different�results
Hot spot draftingHot�spot�draftingConditions�evolve�over�timeNeed�to�predict�the�hot�spot�over�time

DBroker system S111
S116
S121
S126
S131
DBroker system query type statistics
S76
S81
S86
S91
S96
S101
S106
S111
(2006.5~2006.10)
S41
S46
S51
S56
S61
S66
S71
S76
S6
S11
S16
S21
S26
S31
S36
Type 115&116 d f
4-29
5-6
5-13
5-20
5-27
6-3
6-10
6-17
6-24
7-1
7-8
7-15
7-22
7-29
8-5
8-12
8-19
8-26
9-2
9-9
9-16
9-23
9-30
10-7
10-14
10-21
10-28 S1
100
1000
S115
read frequency statistics
1
10
100S116
0.1
14-29
5-9
5-19
5-29
6-8
6-18
6-28
7-8
7-18
7-28
8-7
8-17
8-27
9-6
9-16
9-26
10-6
10-16
10-26

Hot�spot�event�access�provide�a�chance�p pfor�query�predictionCommon Query patterns detectionCommon�Query�patterns�detectionPrediction�query�conditions�in�the�future�q yby�analyzing�the�past�conditions
Time window lengthTime�window�lengthHot�Predicate
i h di dPre-execution�the�predicted�queryTwo�execution�strategies:�global�&�localg gExecution�optimization

Queries Q Srefresh Q Ppre-processQueries
Operation series
QueryAnalyzer
Scoreboard
Query Pre-executor
p p
Opslide window choose
ResultPredictQueryHit?A
ResultEntry
T l l i di t
Predictpool
QueryExecutor
Normal Two-level scoring predictorNormalexecutionif not hit
Reconstruct execution plan if hitB
C
Reconstruct execution plan if hit

Prediction�hitWhen�a�new�query�comes,�it�will�be�divided�into�several�query�
ti If t l t f th ti h b l d iq y q y
operations.�If�at�least�one�of�the�operations�has�been�already�in�‘predict�pool’,�then�it�can�be�called�prediction�hit
Prediction�invalidOne operation in predict pool but not hit by any query in the oneOne�operation�in�predict�pool,�but�not�hit�by�any�query�in�the�one�time�window
Accuracy�rate�(or�hit�rate)The number of hit query / the number of all query in one timeThe�number�of�hit�query�/�the�number�of�all�query�in�one�time�window
Efficiency rateEfficiency�rateThe�number�of�hit�operation�/�the�number�of�all�operation�in�the�predict�pool
Ops set S Predict set POps�set�S��� Predict�set�P
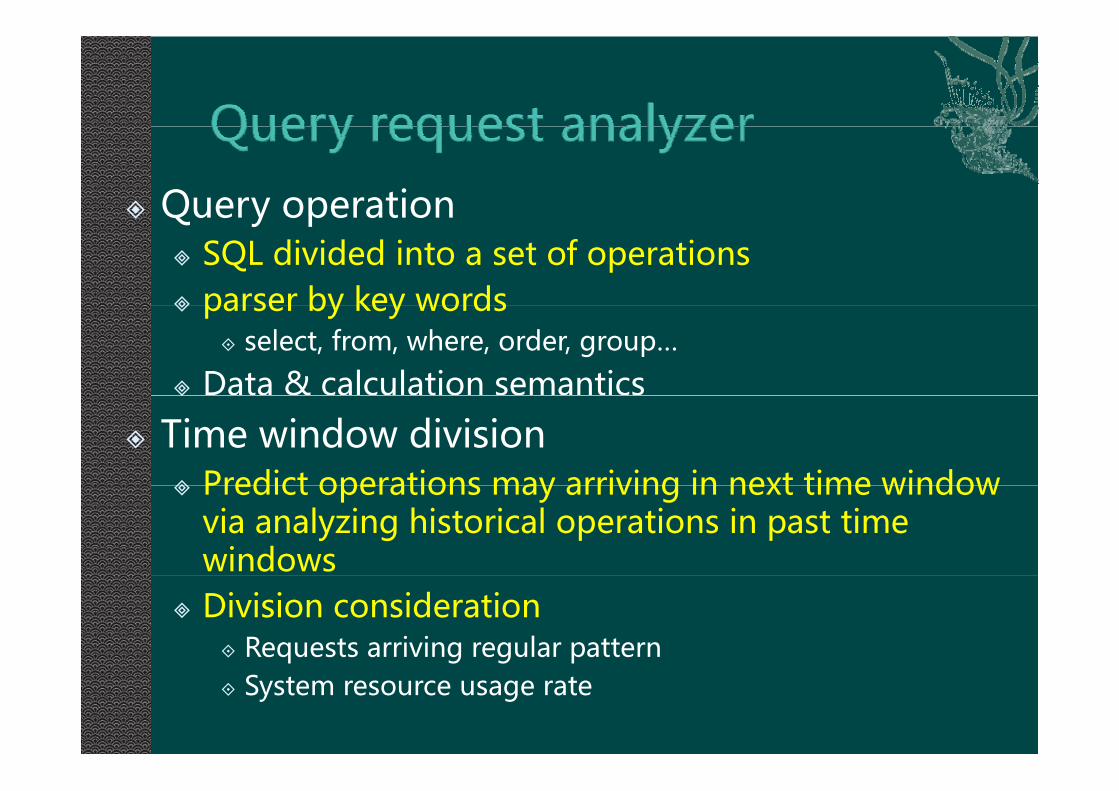
Query operationQuery�operationSQL�divided�into�a�set�of�operationsparser by key wordsparser�by�key�words
select,�from,�where,�order,�group…
Data�&�calculation�semantics
Time�window�divisionPredict operations may arriving in next time windowPredict�operations�may�arriving�in�next�time�window�via�analyzing�historical�operations�in�past�time�windowsDivision�consideration
Requests�arriving�regular�patternSystem�resource�usage�rate
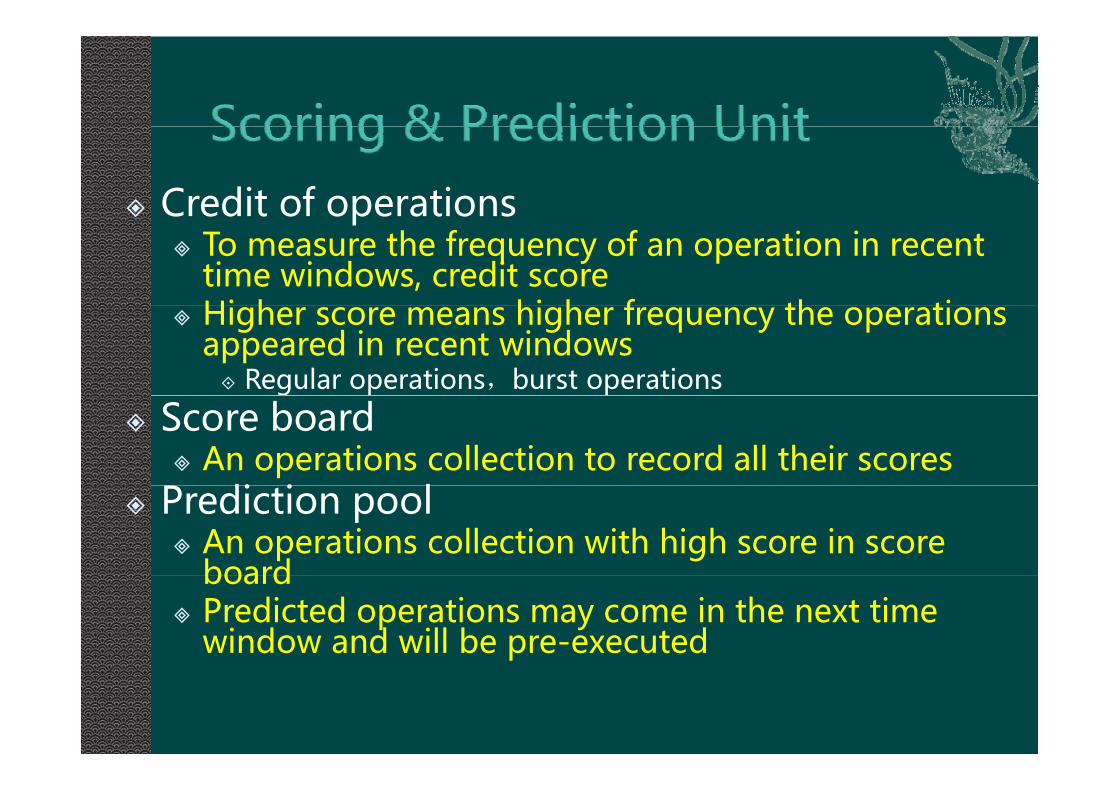
Credit of operationsCredit�of�operationsTo�measure�the�frequency�of�an�operation�in�recent�time�windows,�credit�scoreHi h hi h f th tiHigher�score�means�higher�frequency�the�operations�appeared�in�recent�windows
Regular�operations,burst�operationsScore�board
An�operations�collection�to�record�all�their�scoresdi i lPrediction�pool
An�operations�collection�with�high�score�in�score�boardboardPredicted�operations�may�come�in�the�next�time�window�and�will�be�pre-executed

Tab1 Tab4 Tab6Score_board Predict_pool
operation score operation scoreresultentry
Op2 17
Op1 30
Op4 44
Op1 30 Tab1
Tab4
Op3 28
Op4 44
Op6 36 Tab6
Op5 18
Op6 36
Sketch of score board prediction pool and result entrySketch�of�score�board,�prediction�pool�and�result�entry�

Main idea of TLSMain�idea�of�TLSEvery�moment�a�new�time�window�slides,�modify�operation�credit�in�score_boradp
Hit,score�+hit_bonusInvalid,score�–invalid_penalty
Refresh prediction poolRefresh�prediction�pool
Optimizing with a decay factorOptimizing�with�a�decay�factorEvery�time�a�new�time�window�slides,�all�operation�credit in score board will be multiplied by an decaycredit�in�score_board will�be�multiplied�by�an�decay�factor(<1)
Convergence�of�credit�score�increasingi it b /(1 )init_score < bonus/(1-ε)


(a) prediction accuracy rate (b) prediction efficiency rate
Accuracy & efficiency rate of three algorithms

S t t kl d fSystem extra workload of three algorithms。
Percentage of extra requests number
40
Operations number in SB and PP in TLS algorithm
25
30
35
40
size
sc-sz
pp-sz
In which max prediction pool size is set to 8
5
10
15
20
item s
0
5
1-1
1-3
1-5
1-7
1-9
1-111-
131-
151-
171-
191-
211-
231-
251-
271-
291-
31

Accurate and efficiencyTLS-acc OTLS-acc TLS-eff OTLS-eff Accurate and efficiency rate while introducing decay factor in TLS
60.00%
70.00%
80.00%
90.00%
100.00%
age
TLS acc OTLS acc TLS eff OTLS eff
10.00%
20.00%
30.00%
40.00%
50.00%
perc
enta
0.00%
10.00%
1 2 4 8 16 32 64 128prediction pool size
Extra system workload while introducing decay factor in TLS
Extra System Workload Percentage
3 00%
4.00%
5.00%
6.00%ge
tlsy
-1.00%
0.00%
1.00%
2.00%
3.00%
1 2 4 8 16 32 64 128
perc
enta
g
otls
-3.00%
-2.00%
predict pool size

LocalEach node executes and keeps the result separately
Gl b lGlobalThere’s a result merging step after separately execution keeping the result centralizedexecution, keeping the result centralized.

Query�response�time�in�different�methods
Speculative�execution�can�dramatically�reduce�response�time,�because�of�a�greatly�reduction�of�large�amount�of�I/O�cost.When�speculative�execution�result�size�is�small�(as�in�q1,�q4�and�q7),�the�global�method�is�bbetterWhen�the�speculative�execution�result�size�is�too�large�(as�in�q9),�then�global�method�may�be�even�worse�than�no�prediction�method

Predicates mergeiUsing ‘or’: eg. t1=v1 or t1=v2 or …
Using ‘in’:eg. t1 in (v1,v2,v3…)R f ti ltReuse of pre-execution result
Keeps result in temporary tablesF th d t h dFurther reduce system overhead


No PredictionNo Prediction
PredictionPrediction
System yWorkload
Extra WorkloadSW ith RRSW with RR
EW with RR

PredictionPrediction�Stats�Unit
Acc�rateEff ratePre-exec�timeDS iDS�size
Resource�Monitor UnitMonitor�Unit
CPUMEMDISKNET

Discover attributes value locality of eventDiscover�attributes�value�locality�of�event�stream�dataPrediction model and scoring algorithmPrediction�model�and�scoring�algorithm
TLS�and�OTLSEffects:accuracy�rate�>50%,extra�workload�<5%
Local�&�Global pre-execution�strategiesPre-execution�optimizationEff t l ti (10% 10) f i tEffects:several�times(10%-10)�performance�improvements�while�hitting
The prediction model and techs can be used inThe�prediction�model�and�techs�can�be�used�in�other�systems�with�hot-spot�access�charactersCannot:now�only�support�table-scanning�and�filtering�y pp g goperations�in�the�leaf�nodes�of�the�query�execution�tree

ThanksThanks