Embed Size (px)
Citation preview
UNITED STATESSECURITIES AND EXCHANGE COMMISSION
WASHINGTON, D.C. 20549
FORM 10-Q(Mark One)☒ QUARTERLY REPORT PURSUANT TO SECTION 13 OR 15(d) OF THE SECURITIES EXCHANGE ACT OF 1934
For the quarterly period ended September 30, 2019OR
☐ TRANSITION REPORT PURSUANT TO SECTION 13 OR 15(d) OF THE SECURITIES EXCHANGE ACT OF 1934
For the transition period from to Commission file number: 001-32622
EVERI HOLDINGS INC.(Exact name of registrant as specified in its charter)
Delaware 20-0723270(State or other jurisdiction of incorporation or organization) (I.R.S. Employer Identification No.)
7250 S. TENAYA WAY, SUITE 100 LAS VEGAS
Nevada 89113(Address of principal executive offices) (Zip Code)
(800) 833-7110(Registrant’s telephone number, including area code)
Securities registered pursuant to Section 12(b) of the Act:
Title of each class Trading symbol(s) Name of each exchange on which registeredCommon Stock, $0.001 par value EVRI New York Stock Exchange
Indicate by check mark whether the registrant (1) has filed all reports required to be filed by Section 13 or 15(d) of the Securities Exchange Act of 1934 during thepreceding 12 months (or for such shorter period that the registrant was required to file such reports), and (2) has been subject to such filing requirements for thepast 90 days. Yes x No ¨Indicate by check mark whether the registrant has submitted electronically every Interactive Data File required to be submitted pursuant to Rule 405 of RegulationS-T (§232.405 of this chapter) during the preceding 12 months (or for such shorter period that the registrant was required to submit such files). Yes x No ¨Indicate by check mark whether the registrant is a large accelerated filer, an accelerated filer, a non-accelerated filer, a smaller reporting company, or an emerginggrowth company. See the definitions of “large accelerated filer,” “accelerated filer,” “smaller reporting company,” and “emerging growth company” in Rule 12b-2of the Exchange Act.Large accelerated filer ☒ Accelerated filer ¨
Non-accelerated filer ¨ Smaller reporting company ☐
Emerging growth company ☐
If an emerging growth company, indicate by check mark if the registrant has elected not to use the extended transition period for complying with any new orrevised financial accounting standards provided pursuant to Section 13(a) of the Exchange Act. ¨Indicate by check mark whether the registrant is a shell company (as defined in Rule 12b-2 of the Exchange Act). Yes ☐ No xAs of November 1, 2019, there were 72,297,697 shares of the registrant’s $0.001 par value per share common stock outstanding.
TABLE OF CONTENTS
Page
PART I: FINANCIAL INFORMATION 3
Item 1: Financial Statements 3
Unaudited Condensed Consolidated Statements of Income and Comprehensive Income for the three and nine months endedSeptember 30, 2019 and 2018 3
Unaudited Condensed Consolidated Balance Sheets as of September 30, 2019 and December 31, 2018 5
Unaudited Condensed Consolidated Statements of Cash Flows for the nine months ended September 30, 2019 and 2018 6
Unaudited Condensed Consolidated Statements of Stockholders’ Deficit for the three and nine months ended September 30,2019 and 2018 8
Notes to Unaudited Condensed Consolidated Financial Statements 10
Item 2: Management’s Discussion and Analysis of Financial Condition and Results of Operations 37
Item 3: Quantitative and Qualitative Disclosures About Market Risk 47
Item 4: Controls and Procedures 48
PART II: OTHER INFORMATION 49
Item 1: Legal Proceedings 49
Item 1A: Risk Factors 50
Item 2: Unregistered Sales of Equity Securities and Use of Proceeds 50
Item 3: Defaults Upon Senior Securities 50
Item 4: Mine Safety Disclosures 50
Item 5: Other Information 50
Item 6: Exhibits 51
Signatures 52
PART I: FINANCIAL INFORMATION
Item 1. Financial Statements.
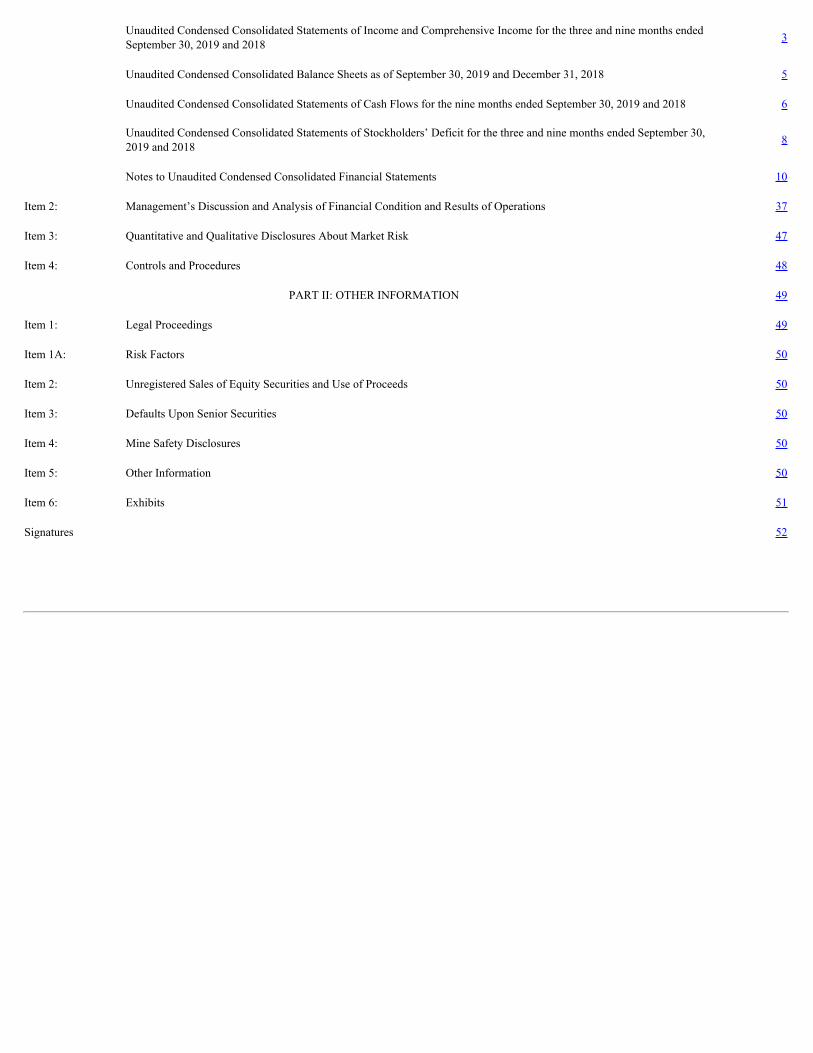
EVERI HOLDINGS INC. AND SUBSIDIARIESUNAUDITED CONDENSED CONSOLIDATED STATEMENTS OF INCOME AND COMPREHENSIVE INCOME
(In thousands, except earnings per share amounts) Three Months Ended September 30, Nine Months Ended September 30,
2019 2018 2019 2018
Revenues Games revenues
Gaming operations $ 48,515 $ 43,540 $ 138,377 $ 126,618 Gaming equipment and systems 19,584 21,068 66,083 63,499 Gaming other 1,174 1,231 1,619 1,887
Games total revenues 69,273 65,839 206,079 192,004 FinTech revenues
Cash access services 43,152 39,406 123,680 117,364 Equipment 10,188 7,155 25,051 16,338 Information services and other 11,956 7,930 33,240 24,307
FinTech total revenues 65,296 54,491 181,971 158,009 Total revenues 134,569 120,330 388,050 350,013
Costs and expenses
Games cost of revenues(1) Gaming operations 4,942 4,607 12,792 13,000 Gaming equipment and systems 11,126 11,907 37,087 34,693 Gaming other 1,117 1,059 1,464 1,618
Games total cost of revenues 17,185 17,573 51,343 49,311
FinTech cost of revenues(1) Cash access services 4,112 2,234 9,777 6,910 Equipment 5,957 3,846 14,884 9,786 Information services and other 1,024 949 2,952 3,146
FinTech total cost of revenues 11,093 7,029 27,613 19,842 Operating expenses 37,631 35,419 111,446 105,176 Research and development 8,196 5,407 22,399 14,313 Depreciation 16,015 17,304 46,062 43,830 Amortization 17,156 16,088 51,143 48,943
Total costs and expenses 107,276 98,820 310,006 281,415 Operating income 27,293 21,510 78,044 68,598
Other expenses Interest expense, net of interest income 19,297 20,160 60,130 62,589 Loss on extinguishment of debt — — — 166
Total other expenses 19,297 20,160 60,130 62,755 Income before income tax 7,996 1,350 17,914 5,843
Income tax benefit (1,319) (719) (2,747) (2,310) Net income 9,315 2,069 20,661 8,153
Foreign currency translation (658) (9) (189) (744) Comprehensive income $ 8,657 $ 2,060 $ 20,472 $ 7,409
(1) Exclusive of depreciation and amortization.
3

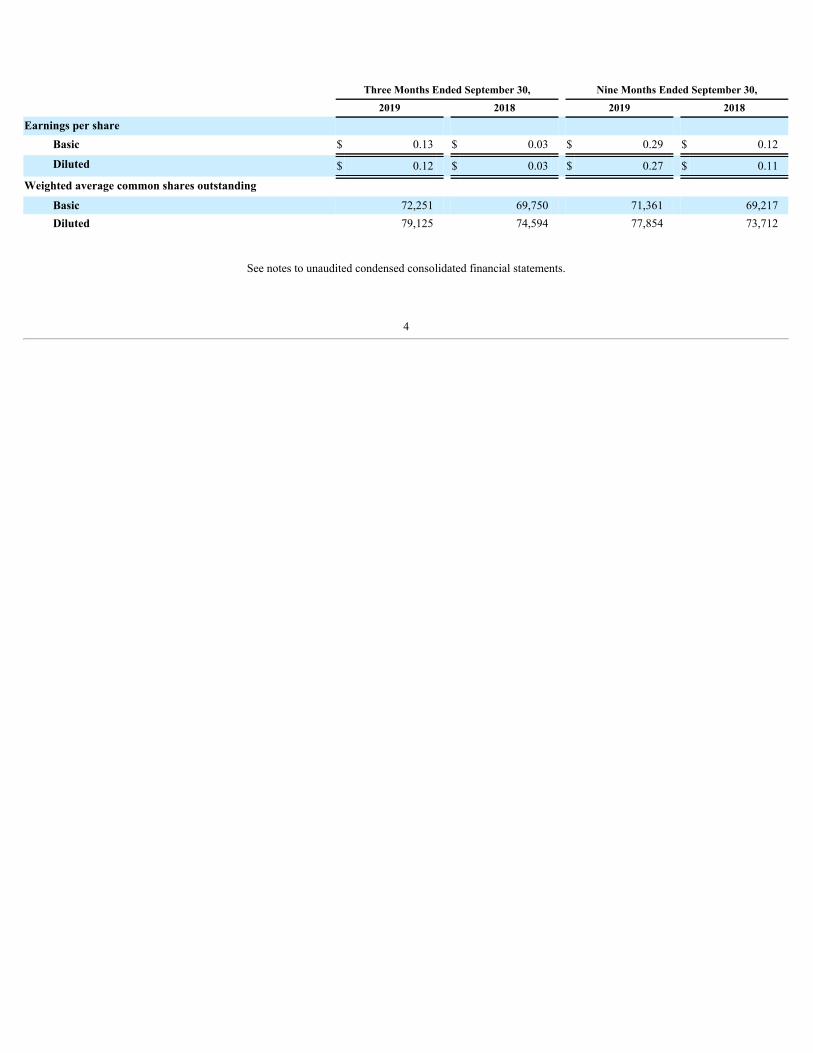
Three Months Ended September 30, Nine Months Ended September 30, 2019 2018 2019 2018
Earnings per share Basic $ 0.13 $ 0.03 $ 0.29 $ 0.12
Diluted $ 0.12 $ 0.03 $ 0.27 $ 0.11
Weighted average common shares outstanding Basic 72,251 69,750 71,361 69,217 Diluted 79,125 74,594 77,854 73,712
See notes to unaudited condensed consolidated financial statements.
4
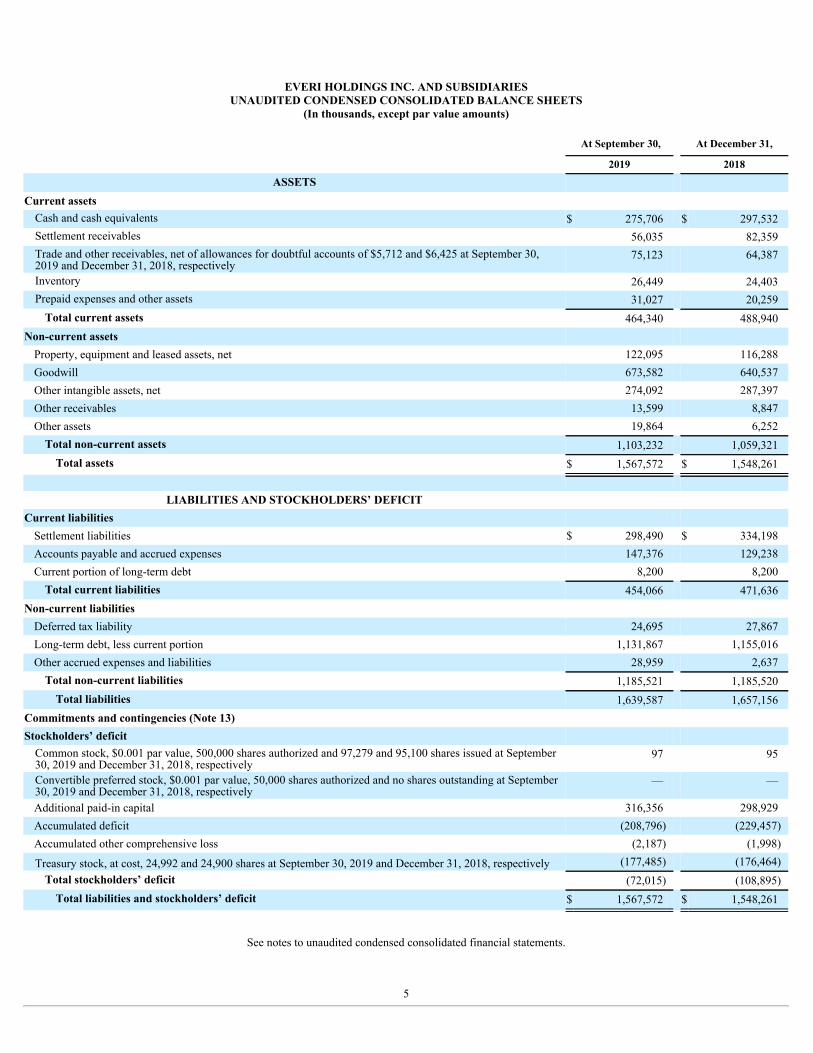
EVERI HOLDINGS INC. AND SUBSIDIARIESUNAUDITED CONDENSED CONSOLIDATED BALANCE SHEETS
(In thousands, except par value amounts) At September 30, At December 31,
2019 2018
ASSETS Current assets Cash and cash equivalents $ 275,706 $ 297,532 Settlement receivables 56,035 82,359 Trade and other receivables, net of allowances for doubtful accounts of $5,712 and $6,425 at September 30,2019 and December 31, 2018, respectively
75,123 64,387
Inventory 26,449 24,403 Prepaid expenses and other assets 31,027 20,259
Total current assets 464,340 488,940 Non-current assetsProperty, equipment and leased assets, net 122,095 116,288 Goodwill 673,582 640,537 Other intangible assets, net 274,092 287,397 Other receivables 13,599 8,847 Other assets 19,864 6,252
Total non-current assets 1,103,232 1,059,321 Total assets $ 1,567,572 $ 1,548,261
LIABILITIES AND STOCKHOLDERS’ DEFICIT Current liabilities Settlement liabilities $ 298,490 $ 334,198 Accounts payable and accrued expenses 147,376 129,238 Current portion of long-term debt 8,200 8,200
Total current liabilities 454,066 471,636 Non-current liabilitiesDeferred tax liability 24,695 27,867 Long-term debt, less current portion 1,131,867 1,155,016 Other accrued expenses and liabilities 28,959 2,637
Total non-current liabilities 1,185,521 1,185,520 Total liabilities 1,639,587 1,657,156
Commitments and contingencies (Note 13)Stockholders’ deficit Common stock, $0.001 par value, 500,000 shares authorized and 97,279 and 95,100 shares issued at September30, 2019 and December 31, 2018, respectively
97 95
Convertible preferred stock, $0.001 par value, 50,000 shares authorized and no shares outstanding at September30, 2019 and December 31, 2018, respectively
— —
Additional paid-in capital 316,356 298,929 Accumulated deficit (208,796) (229,457) Accumulated other comprehensive loss (2,187) (1,998)
Treasury stock, at cost, 24,992 and 24,900 shares at September 30, 2019 and December 31, 2018, respectively (177,485) (176,464) Total stockholders’ deficit (72,015) (108,895)
Total liabilities and stockholders’ deficit $ 1,567,572 $ 1,548,261
See notes to unaudited condensed consolidated financial statements.
5
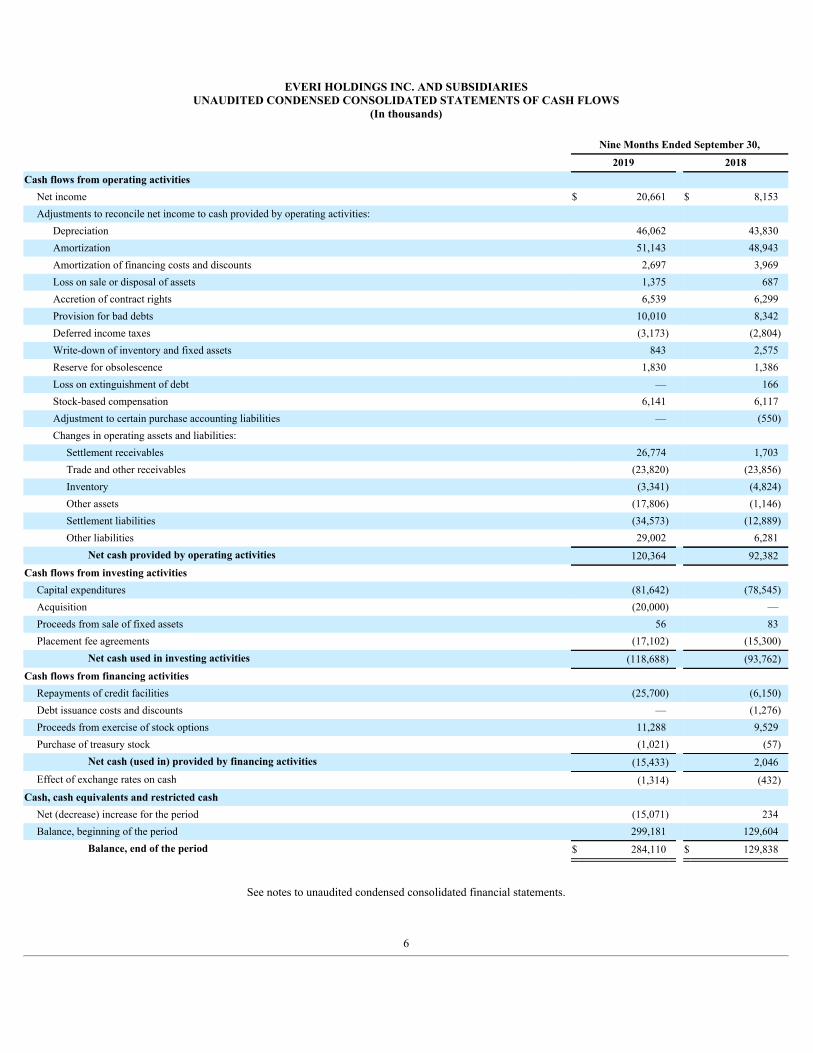
EVERI HOLDINGS INC. AND SUBSIDIARIESUNAUDITED CONDENSED CONSOLIDATED STATEMENTS OF CASH FLOWS
(In thousands)
Nine Months Ended September 30,
2019 2018Cash flows from operating activities
Net income $ 20,661 $ 8,153 Adjustments to reconcile net income to cash provided by operating activities:
Depreciation 46,062 43,830 Amortization 51,143 48,943 Amortization of financing costs and discounts 2,697 3,969 Loss on sale or disposal of assets 1,375 687 Accretion of contract rights 6,539 6,299 Provision for bad debts 10,010 8,342 Deferred income taxes (3,173) (2,804) Write-down of inventory and fixed assets 843 2,575 Reserve for obsolescence 1,830 1,386 Loss on extinguishment of debt — 166 Stock-based compensation 6,141 6,117 Adjustment to certain purchase accounting liabilities — (550) Changes in operating assets and liabilities:
Settlement receivables 26,774 1,703 Trade and other receivables (23,820) (23,856) Inventory (3,341) (4,824) Other assets (17,806) (1,146) Settlement liabilities (34,573) (12,889) Other liabilities 29,002 6,281
Net cash provided by operating activities 120,364 92,382 Cash flows from investing activities
Capital expenditures (81,642) (78,545) Acquisition (20,000) — Proceeds from sale of fixed assets 56 83 Placement fee agreements (17,102) (15,300)
Net cash used in investing activities (118,688) (93,762) Cash flows from financing activities
Repayments of credit facilities (25,700) (6,150) Debt issuance costs and discounts — (1,276) Proceeds from exercise of stock options 11,288 9,529 Purchase of treasury stock (1,021) (57)
Net cash (used in) provided by financing activities (15,433) 2,046 Effect of exchange rates on cash (1,314) (432)
Cash, cash equivalents and restricted cashNet (decrease) increase for the period (15,071) 234 Balance, beginning of the period 299,181 129,604
Balance, end of the period $ 284,110 $ 129,838
See notes to unaudited condensed consolidated financial statements.
6

Nine Months Ended September 30,
2019 2018Supplemental cash disclosures
Cash paid for interest $ 52,077 $ 54,930 Cash paid for income tax 545 350 Cash refunded for income tax 614 4
Supplemental non-cash disclosures Accrued and unpaid capital expenditures $ 3,989 $ 2,591 Accrued and unpaid placement fees added during the year 585 — Transfer of leased gaming equipment to inventory 9,118 7,284 Operating lease right-of-use assets obtained in exchange for lease obligations 14,595 —
Acquisition-related items Fair value of assets acquired 50,240 — Cash paid 20,000 — Accrued and unpaid liability for loyalty acquisition 27,556 — Liabilities assumed 2,684 —
See notes to unaudited condensed consolidated financial statements.
7

EVERI HOLDINGS INC. AND SUBSIDIARIESUNAUDITED CONDENSED CONSOLIDATED STATEMENTS OF STOCKHOLDERS’ DEFICIT
(In thousands)
Common Stock— Series A Additional Retained Earnings
Accumulated Other
Number of Shares Amount
Paid-in Capital
(Accumulated Deficit)
Comprehensive Income (Loss)
Treasury Stock
Total Deficit
Balance, January 1, 2018 93,120 $ 93 $ 282,070 $ (246,202) $ (253) $ (176,341) $ (140,633) Net income — — — 4,609 — — 4,609 Cumulative adjustment related to adoptionof ASC 606
— — — 4,389 — — 4,389
Foreign currency translation — — — — 324 — 324 Stock-based compensation expense — — 2,350 — — — 2,350 Exercise of options 707 1 4,298 — — — 4,299 Restricted share vesting and withholding 5 — — — — (38) (38)
Balance, March 31, 2018 93,832 $ 94 $ 288,718 $ (237,204) $ 71 $ (176,379) $ (124,700) Net income — — — 1,475 — — 1,475 Foreign currency translation — — — — (1,059) — (1,059) Stock-based compensation expense — — 1,955 — — — 1,955 Exercise of options 575 — 2,076 — — — 2,076 Restricted share vesting and withholding 1 — — — — (10) (10)
Balance, June 30, 2018 94,408 $ 94 $ 292,749 $ (235,729) $ (988) $ (176,389) $ (120,263) Net income — — — 2,069 — — 2,069 Foreign currency translation — — — — (9) — (9) Stock-based compensation expense — — 1,812 — — — 1,812 Exercise of options 674 1 3,184 — — — 3,185 Restricted share vesting and withholding 1 — — — — (9) (9)
Balance, September 30, 2018 95,083 $ 95 $ 297,745 $ (233,660) $ (997) $ (176,398) $ (113,215)
8

Common Stock— Series A Additional Retained Earnings
Accumulated Other
Number of Shares Amount
Paid-in Capital
(Accumulated Deficit)
Comprehensive Income (Loss)
Treasury Stock
Total Deficit
Balance, January 1, 2019 95,100 $ 95 $ 298,929 $ (229,457) $ (1,998) $ (176,464) $ (108,895) Net income — — — 5,860 — — 5,860 Foreign currency translation — — — — 504 — 504 Stock-based compensation expense — — 1,773 — — — 1,773 Exercise of options 864 1 4,970 — — — 4,971 Restricted share vesting and withholding 2 — — — — (15) (15)
Balance, March 31, 2019 95,966 $ 96 $ 305,672 $ (223,597) $ (1,494) $ (176,479) $ (95,802) Net income — — — 5,486 — — 5,486 Foreign currency translation — — — — (35) — (35) Stock-based compensation expense — — 2,387 — — — 2,387 Exercise of options 764 1 4,491 — — — 4,492 Restricted share vesting and withholding 275 — — — — (965) (965)
Balance, June 30, 2019 97,005 $ 97 $ 312,550 $ (218,111) $ (1,529) $ (177,444) $ (84,437) Net income — — — 9,315 — — 9,315 Foreign currency translation — — — — (658) — (658) Stock-based compensation expense — — 1,981 — — — 1,981 Exercise of options 263 — 1,825 — — — 1,825 Restricted share vesting and withholding 11 — — — — (41) (41)
Balance, September 30, 2019 97,279 $ 97 $ 316,356 $ (208,796) $ (2,187) $ (177,485) $ (72,015)
See notes to unaudited condensed consolidated financial statements.
9

EVERI HOLDINGS INC. AND SUBSIDIARIESNOTES TO UNAUDITED CONDENSED CONSOLIDATED FINANCIAL STATEMENTS
In this filing, we refer to: (a) our unaudited condensed consolidated financial statements and notes thereto as our “Financial Statements,” (b) our UnauditedCondensed Consolidated Statements of Income and Comprehensive Income as our “Statements of Income,” and (c) our Unaudited Condensed ConsolidatedBalance Sheets as our “Balance Sheets.”
1. BUSINESS
Everi Holdings Inc. (“Everi Holdings,” “Holdings,” or “Everi”) is a holding company, the assets of which are the issued and outstanding shares of capital stock ofeach of Everi Games Holding Inc. (“Everi Games Holding”), which owns all of the issued and outstanding shares of capital stock of Everi Games Inc. (“EveriGames” or “Games”), and Everi Payments Inc. (“Everi Payments,” “Everi FinTech,” or “FinTech”). Unless otherwise indicated, the terms the “Company,” “we,”“us,” and “our” refer to Everi Holdings together with its consolidated subsidiaries.
Everi is a leading supplier of entertainment and technology solutions for the casino, interactive, and gaming industry. With a focus on both customers and players,Everi develops games and gaming machines, gaming systems and services, and is the provider of core financial products and services, player loyalty tools andapplications, and intelligence and regulatory compliance solutions. Everi’s mission is to provide casino operators with games that facilitate memorable playerexperiences, offer secure financial transactions for casinos and their patrons, and deliver software tools and applications to improve casino operations efficienciesand fulfill regulatory compliance requirements.
Everi Holdings reports its results of operations based on two operating segments: Games and FinTech.
Everi Games provides gaming operators products and services, including: (a) gaming machines primarily comprised of Class II and Class III slot machines placedunder participation or fixed fee lease arrangements or sold to casino customers, including TournEvent® terminals that allow operators to switch from in-revenuegaming to out-of-revenue tournaments; (b) system software, licenses, and ancillary equipment; and (c) business-to-consumer (“B2C”) and business-to-business(“B2B”) interactive activities. In addition, Everi Games develops and manages the central determinant system for the video lottery terminals (“VLTs”) installed inthe State of New York, and it also provides similar technology in certain tribal jurisdictions.
Everi FinTech provides gaming operators cash access and related products and services, including: (a) access to cash at gaming facilities via Automated TellerMachine (“ATM”) cash withdrawals, credit card cash access transactions, point of sale (“POS”) debit card cash access transactions, and check verification andwarranty services; (b) equipment that provides cash access and efficiency-related services; (c) self-service enrollment, player loyalty and marketing equipment; (d)products and services that improve credit decision making, automate cashier operations, and enhance patron marketing activities for gaming establishments; (e)compliance, audit, and data solutions; and (f) online payment processing solutions for gaming operators in states that offer intrastate, Internet-based gaming andlottery activities.
2. BASIS OF PRESENTATION AND SUMMARY OF SIGNIFICANT ACCOUNTING POLICIES
Basis of Presentation
Our unaudited condensed consolidated financial statements included herein have been prepared by us pursuant to the rules and regulations of the Securities andExchange Commission (“SEC”). Some of the information and footnote disclosures normally included in financial statements prepared in accordance with generallyaccepted accounting principles in the United States (“GAAP”) have been condensed or omitted pursuant to such rules and regulations, although we believe thedisclosures are adequate to make the information presented not misleading. In the opinion of management, all adjustments (which include normal recurringadjustments) necessary for a fair statement of results for the interim periods have been made. The results for the three and nine months ended September 30, 2019are not necessarily indicative of results to be expected for the full fiscal year. The Financial Statements should be read in conjunction with the consolidatedfinancial statements and notes thereto included in our Annual Report on Form 10-K for the fiscal year ended December 31, 2018.
Other than the adoption of the Financial Accounting Standard Board’s (the “FASB”) Accounting Standards Update (“ASU”) No. 2016-02 (“Leases”) and allsubsequent amendments (collectively, “Accounting Standards Codification 842,” or “ASC 842”), there have been no changes to our basis of presentation andsignificant accounting policies since the most recent filing of our Annual Report on Form 10-K for the fiscal year ended December 31, 2018.
10
We evaluate the composition of our revenues to ensure compliance with SEC Regulation S-X Section 210.5-3, which requires us to separately present certaincategories of revenues that exceed the quantitative threshold on our Statements of Income.
Revenue Recognition
Overview
We evaluate the recognition of revenue based on the criteria set forth in ASC 606 (“Revenue from Contracts with Customers”) and ASC 842, as appropriate. Werecognize revenue upon transferring control of goods or services to our customers in an amount that reflects the consideration we expect to receive in exchange forthose goods or services. We enter into contracts with customers that include various performance obligations consisting of goods, services, or combinations ofgoods and services. Timing of the transfer of control varies based on the nature of the contract. We recognize revenue net of any sales and other taxes collectedfrom customers, which are subsequently remitted to governmental authorities and are not included in revenues or operating expenses. We measure revenue basedon the consideration specified in a contract with a customer and adjusted, as necessary.
Significant Judgments
We apply judgments or estimates to determine the performance obligations and the Stand-Alone Selling Price (“SSP”) of each identified performance obligation.The establishment of SSP requires judgment as to whether there is a sufficient quantity of items sold or renewed on a stand-alone basis and those pricesdemonstrate an appropriate level of concentration to conclude that an SSP exists. The SSP of our goods and services is generally determined based on observableprices, an adjusted market assessment approach, or an expected cost plus margin approach. We utilize a residual approach only when the SSP for performanceobligations with observable prices has been established and the remaining performance obligation in the contract with a customer does not have an observableprice as it is uncertain or highly variable and, therefore, is not discernible.
Collectability
To assess collectability, we determine whether it is probable that we will collect substantially all of the consideration to which we are entitled in exchange for thegoods and services transferred to the customer in accordance with the terms and conditions of the contract. In connection with these procedures, we evaluate thecustomer using internal and external information available, including, but not limited to, research and analysis of our credit history with the customer. Based on thenature of our transactions and historical trends, we determine whether our customers have the ability and intention to pay the amounts of consideration when theybecome due to identify potentially significant credit risk exposure.
Contract Combinations — Multiple Promised Goods and Services
Our contracts may include various performance obligations for promises to transfer multiple goods and services to a customer, especially since our Games andFinTech businesses may enter into multiple agreements with the same customer that meet the criteria to be combined for accounting purposes under ASC 606.When this occurs, an SSP will be determined for each performance obligation in the combined arrangement, and the consideration will be allocated between therespective performance obligations. We use our judgment to analyze the nature of the promises made and determine whether each is distinct or should be combinedwith other promises in the contract based on the level of integration and interdependency between the individual deliverables.
Disaggregation of Revenues
We disaggregate revenues based on the nature and timing of the cash flows generated by such revenues as presented in “Note 18 — Segment Information.”
Outbound Freight Costs, Installation and Training
Upon transferring control of goods to a customer, the shipping and handling costs in connection with sale transactions are generally accounted for as fulfillmentcosts and included in cost of revenues.
Our performance of installation and training services relating to the sales of gaming equipment and systems and FinTech equipment does not modify the softwareor hardware in those equipment and systems. Such installation and training services are generally immaterial in the context of the contract; and therefore, suchitems do not represent a separate performance obligation.
11
Costs to Acquire a Contract with a Customer
We typically incur incremental costs to acquire customer contracts in the form of sales commissions. We evaluate such costs for groups of contracts with similarcharacteristics based on the nature of the transactions. If recognized, the asset related to the incremental costs to acquire customer contracts would be amortizedwithin one year or less and, as a result, we elected to utilize the practical expedient set forth in ASC 340 (“Contract Costs - Incremental Costs of Obtaining aContract”) to expense these amounts as incurred.
Contract Balances
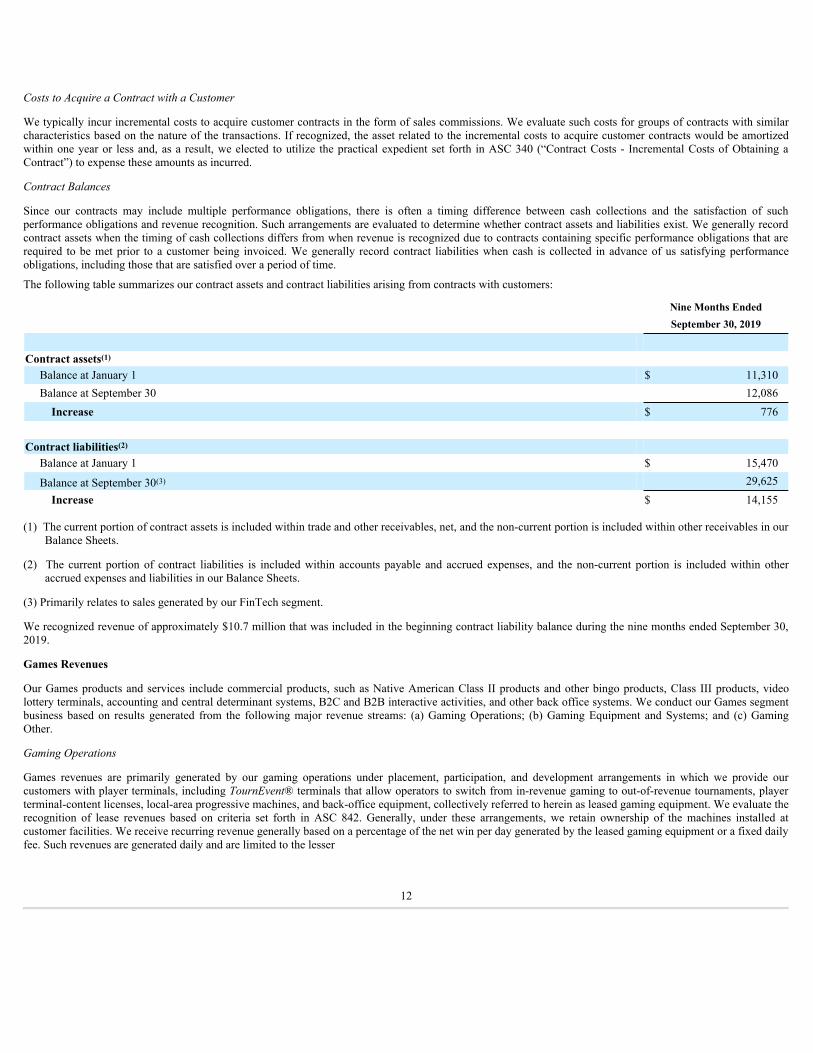
Since our contracts may include multiple performance obligations, there is often a timing difference between cash collections and the satisfaction of suchperformance obligations and revenue recognition. Such arrangements are evaluated to determine whether contract assets and liabilities exist. We generally recordcontract assets when the timing of cash collections differs from when revenue is recognized due to contracts containing specific performance obligations that arerequired to be met prior to a customer being invoiced. We generally record contract liabilities when cash is collected in advance of us satisfying performanceobligations, including those that are satisfied over a period of time.
The following table summarizes our contract assets and contract liabilities arising from contracts with customers:
Nine Months EndedSeptember 30, 2019
Contract assets(1)
Balance at January 1 $ 11,310 Balance at September 30 12,086 Increase $ 776
Contract liabilities(2)
Balance at January 1 $ 15,470
Balance at September 30(3) 29,625 Increase $ 14,155
(1) The current portion of contract assets is included within trade and other receivables, net, and the non-current portion is included within other receivables in ourBalance Sheets.
(2) The current portion of contract liabilities is included within accounts payable and accrued expenses, and the non-current portion is included within otheraccrued expenses and liabilities in our Balance Sheets.
(3) Primarily relates to sales generated by our FinTech segment.
We recognized revenue of approximately $10.7 million that was included in the beginning contract liability balance during the nine months ended September 30,2019.
Games Revenues
Our Games products and services include commercial products, such as Native American Class II products and other bingo products, Class III products, videolottery terminals, accounting and central determinant systems, B2C and B2B interactive activities, and other back office systems. We conduct our Games segmentbusiness based on results generated from the following major revenue streams: (a) Gaming Operations; (b) Gaming Equipment and Systems; and (c) GamingOther.
Gaming Operations
Games revenues are primarily generated by our gaming operations under placement, participation, and development arrangements in which we provide ourcustomers with player terminals, including TournEvent® terminals that allow operators to switch from in-revenue gaming to out-of-revenue tournaments, playerterminal-content licenses, local-area progressive machines, and back-office equipment, collectively referred to herein as leased gaming equipment. We evaluate therecognition of lease revenues based on criteria set forth in ASC 842. Generally, under these arrangements, we retain ownership of the machines installed atcustomer facilities. We receive recurring revenue generally based on a percentage of the net win per day generated by the leased gaming equipment or a fixed dailyfee. Such revenues are generated daily and are limited to the lesser
12

of the net win per day generated by the leased gaming equipment or the fixed daily fee and the lease payments that have been collected from the lessee. Gamingoperations revenues generated by leased gaming equipment deployed at sites under development or placement fee agreements give rise to contract rights, which areamounts recorded to intangible assets for dedicated floor space resulting from such agreements. The gaming operations revenues generated by these arrangementsare reduced by the accretion of contract rights, which represents the related amortization of the contract rights recorded in connection with such agreements.Gaming operations lease revenues accounted for under ASC 842 are generally short-term in nature with payment terms ranging from 30 to 90 days. We recognizedlease revenues of approximately $36.6 million and $104.3 million for the three and nine months ended September 30, 2019, respectively, and approximately $35.2million and $103.9 million for the three and nine months ended September 30, 2018, respectively.
Gaming operations revenues include amounts generated by Wide Area Progressive (“WAP”) systems, which are recognized under ASC 606. WAP consists oflinked slot machines located in multiple casino properties that are connected to a central system. WAP-based gaming machines have a progressive jackpotadministered by us that increases with every wager until a player wins the top award combination. Casino operators pay us a percentage of the coin-in (the totalamount wagered), a percentage of net win, or a combination of both for services related to the design, assembly, installation, operation, maintenance,administration, and marketing of the WAP offering. The gaming operations revenues with respect to WAP machines represent a separate performance obligation.Such revenues are recognized over time as earned and the customer simultaneously receives and consumes the benefits as the performance obligations occur.These arrangements are generally short-term in nature with a majority of invoices payable within 30 to 90 days. Such revenues are presented in the Statements ofIncome, net of the jackpot expense, which are composed of incremental amounts funded by a portion of coin-in from the players. At the time a jackpot is won by aplayer, an additional jackpot expense is recorded in connection with the base seed amount required to fund the minimum level as set forth in the WAParrangements with the casino operators.
Gaming operations revenues include amounts received in connection with our relationship with the New York State Gaming Commission (the “NYSGC”) toprovide an accounting and central determinant system for the VLTs in operation at licensed State of New York gaming facilities. Pursuant to our agreement withthe NYSGC, we receive a portion of the network-wide net win (generally, cash-in less prizes paid) per day in exchange for the provision and maintenance of thecentral determinant system and recognize revenue over time in accordance with ASC 606 as the customer simultaneously receives and consumes the benefits as theperformance obligations occur. We also provide the central determinant system technology to Native American tribes in other licensed jurisdictions, for which wereceive a portion of the revenue generated from the VLTs connected to the system. These arrangements are generally short-term in nature with payments duemonthly.
Gaming operations revenues include amounts generated by our Interactive offering comprised of B2C and B2B activities. Our B2C operations relate to gamesoffered directly to consumers for play with virtual currency, which can be purchased through our web and mobile applications. Control transfers, and we recognizerevenues over time in accordance with ASC 606 from player purchases of virtual currency, as it is consumed for game play, which is based on a historical dataanalysis. Our B2B operations relate to games offered to our business partners, including social and regulated real money casinos that offer the games to consumers.Our B2B arrangements primarily provide access to our game content, and revenue is recognized over time in accordance with ASC 606 as the control transfersupon our business partners’ daily access to such content based on either a flat fee or revenue share arrangements with the social and regulated real money casinos.The customer simultaneously receives and consumes the benefits as the performance obligations occur.
Gaming Equipment and Systems
Gaming equipment and systems revenues are derived from the sale of some combination of: (a) gaming equipment and player terminals, including TournEvent®terminals; (b) game content; (c) license fees; and (d) ancillary equipment. Such arrangements are predominately short-term in nature with payment terms rangingfrom 30 to 180 days, and with certain agreements providing for extended payment terms, ranging from 12 to 24 months. Each contract containing extendedpayment terms over a period of 12 months is evaluated for the presence of a financing component. For those arrangements in which the financing component isdetermined to be significant to the contract, the transaction price is adjusted for the time value of money. Generally, our contracts with customers do not contain afinancing component that has been determined to be significant to the contract. Performance obligations for gaming equipment and systems arrangements includegaming equipment, player terminals, content, system software, license fees, ancillary equipment, or various combinations thereof. Gaming equipment and systemsrevenues are recognized at a point in time when control of the promised goods and services transfers to the customer, which is generally upon shipment or deliverypursuant to the terms of the contract. The performance obligations are generally satisfied at the same time or within a short period of time.
13

Gaming Other
Gaming other revenues consist of amounts generated by our TournEvent of Champions® national tournament that allows winners of local and regionaltournaments throughout the year to participate in a national tournament that results in the determination of a final champion. As the customer simultaneouslyreceives and consumes the benefits of our performance as it occurs, revenues are recognized as earned over a period of time using an output method depicting thetransfer of control to the customer. These arrangements are generally short-term in nature with payment terms ranging from 30 to 90 days.
FinTech Revenues
Cash Access Services
Cash access services revenues are generally comprised of the following distinct performance obligations: cash advance, ATM, and check services. We do notcontrol the cash advance and ATM services provided to a customer and, therefore, we are acting as an agent whose performance obligation is to arrange for theprovision of these services. Our cash access services involve the movement of funds between the various parties associated with cash access transactions and giverise to settlement receivables and settlement liabilities, both of which are settled in days following the transaction.
Cash advance revenues are primarily comprised of transaction fees assessed to gaming patrons in connection with credit card cash access and POS debit card cashaccess transactions. Such fees are primarily based on a combination of a fixed amount plus a percentage of the face amount of the credit card cash access or POSdebit card cash access transaction amount. In connection with these types of transactions, we report certain direct costs incurred as reductions to revenues on a netbasis, which generally include: (a) commission expenses payable to casino operators; (b) interchange fees payable to the network associations; and (c) processingand related costs payable to other third-party partners.
ATM revenues are primarily comprised of transaction fees in the form of cardholder surcharges assessed to gaming patrons in connection with ATM cashwithdrawals at the time the transactions are authorized and reverse interchange fees paid to us by the patrons’ issuing banks. The cardholder surcharges assessed togaming patrons in connection with ATM cash withdrawals are currently a fixed dollar amount and not a percentage of the transaction amount. In connection withthese types of transactions, we report certain direct costs incurred as reductions to revenues on a net basis, which generally include: (a) commission expensespayable to casino operators; (b) interchange fees payable to the network associations; and (c) processing and related costs payable to other third-party partners.
Check services revenues are principally comprised of check warranty revenues and are generally based upon a percentage of the face amount of checks warranted.These fees are paid to us by gaming establishments.
For cash access services arrangements, since the customer simultaneously receives and consumes the benefits as the performance obligations occur, we recognizerevenues as earned over a period of time using an output method depicting the transfer of control to the customer based on variable consideration, such as volumeof transactions processed with variability generally resolved in the reporting period.
Equipment
Equipment revenues are derived from the sale of our cash access kiosks and related equipment and are accounted for under ASC 606, unless such transactions meetdefinition of a sales type or direct financing lease which are accounted for under ASC 842. Revenues are recognized at a point in time when control of thepromised goods and services transfers to the customer generally upon shipment or delivery pursuant to the terms of the contract. The sales contracts are generallyshort-term in nature with payment terms ranging from 30 to 90 days, while certain agreements provide for extended payment terms of up to 60 months. Eachcontract containing extended payment terms over a period of 12 months is evaluated for the presence of a financing component. For those arrangements in whichthe financing component is determined to be significant to the contract, the transaction price is adjusted for the time value of money. Generally, our contracts withcustomers do not contain a financing component that has been determined to be significant to the contract. The cash access kiosk and related equipment salescontracts accounted for under ASC 842 were approximately $0.1 million and $2.7 million in aggregate revenue for the three and nine months ended September 30,2019, respectively. We did not have any cash access kiosk and related equipment sales transactions that qualified for sales type lease accounting treatment in 2018.
In addition, equipment revenues are derived from the sale of our loyalty kiosks and related equipment. Revenues are recognized at a point in time when control ofthe promised goods and services transfers to the customer generally upon installation and customer acceptance based on connectivity to a casino managementsystem pursuant to the terms of the contract. These sales contracts are generally short-term in nature with payment terms ranging from 30 to 90 days.
14
Information Services and Other
Information services and other revenues include amounts derived from our cash access, loyalty kiosk, compliance, and loyalty related revenue streams from thesale of: (a) software licenses, software subscriptions, professional services, and certain other ancillary fees; (b) service-related fees associated with the sale,installation, training, and maintenance of equipment directly to our customers under contracts, which are generally short-term in nature with payment termsranging from 30 to 90 days, secured by the related equipment; (c) credit worthiness-related software subscription services that are based upon either a flat monthlyunlimited usage fee or a variable fee structure driven by the volume of patron credit histories generated; and (d) ancillary marketing, database, and Internet-basedgaming-related activities.
Our software represents a functional right-to-use license, and the revenues are recognized as earned at a point in time. Subscription services are recognized over aperiod of time using an input method based on time elapsed as we transfer the control ratably by providing a stand-ready service. Professional services, training,and other revenues are recognized over a period of time using an input method based on time elapsed as services are provided, thereby reflecting the transfer ofcontrol to the customer.
Restricted Cash
Our restricted cash primarily consists of: (a) funds held in connection with certain customer agreements; (b) deposits held in connection with a sponsorshipagreement; (c) WAP-related restricted funds; and (d) Internet-related cash access activities. The current portion of restricted cash, which is included in prepaidexpenses and other assets, was approximately $8.3 million and $1.5 million as of September 30, 2019 and December 31, 2018, respectively. The non-currentportion of restricted cash, which is included in other assets, was approximately $0.1 million as of September 30, 2019 and December 31, 2018. The current portionof restricted cash was approximately $1.0 million and $0.9 million as of September 30, 2018 and December 31, 2017, respectively, and the non-current portion ofrestricted cash was approximately $0.1 million as of September 30, 2018 and December 31, 2017.
Fair Values of Financial Instruments
The fair value of a financial instrument represents the amount at which the instrument could be exchanged in a current transaction between willing parties, otherthan in a forced or liquidation sale. Fair value estimates are made at a specific point in time, based upon relevant market information about the financialinstrument.
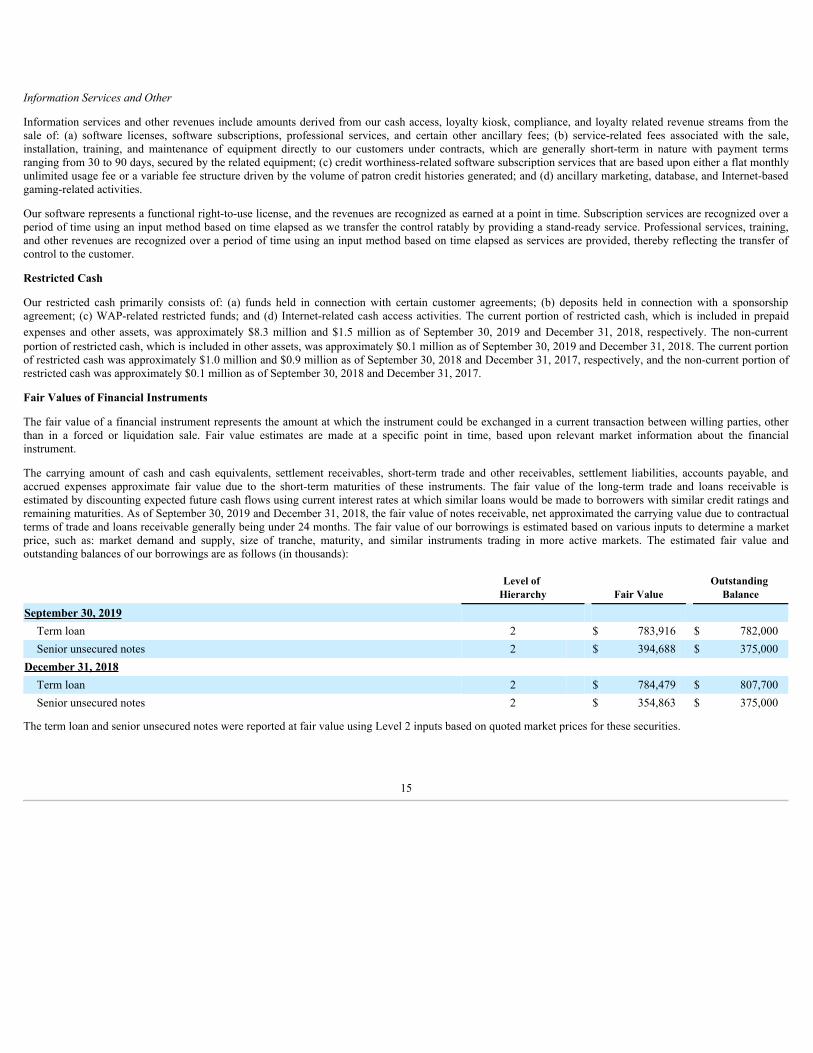
The carrying amount of cash and cash equivalents, settlement receivables, short-term trade and other receivables, settlement liabilities, accounts payable, andaccrued expenses approximate fair value due to the short-term maturities of these instruments. The fair value of the long-term trade and loans receivable isestimated by discounting expected future cash flows using current interest rates at which similar loans would be made to borrowers with similar credit ratings andremaining maturities. As of September 30, 2019 and December 31, 2018, the fair value of notes receivable, net approximated the carrying value due to contractualterms of trade and loans receivable generally being under 24 months. The fair value of our borrowings is estimated based on various inputs to determine a marketprice, such as: market demand and supply, size of tranche, maturity, and similar instruments trading in more active markets. The estimated fair value andoutstanding balances of our borrowings are as follows (in thousands):
Level of
Hierarchy Fair ValueOutstanding
Balance
September 30, 2019 Term loan 2 $ 783,916 $ 782,000 Senior unsecured notes 2 $ 394,688 $ 375,000
December 31, 2018 Term loan 2 $ 784,479 $ 807,700 Senior unsecured notes 2 $ 354,863 $ 375,000
The term loan and senior unsecured notes were reported at fair value using Level 2 inputs based on quoted market prices for these securities.
15
Recent Accounting Guidance
Recently Adopted Accounting Guidance
In June 2018, the FASB issued ASU No. 2018-07, which expands the scope of Topic 718, Compensation — Stock Compensation (which currently only includesshare-based payments to employees) to include share-based payments issued to non-employees for goods or services. Consequently, the accounting for share-basedpayments to non-employees and employees will be substantially aligned. The new standard became effective for fiscal years beginning after December 15, 2018,including interim periods within those fiscal years. We adopted this guidance in the quarter ended March 31, 2019. The adoption of this ASU did not have amaterial impact on our Financial Statements.
In February 2018, the FASB issued ASU No. 2018-02, which provides financial statement preparers with an option to reclassify stranded tax effects withinaccumulated other comprehensive income to retained earnings in each period in which the effect of the change in the U.S. federal corporate income tax rate in theTax Cuts and Jobs Act of 2017 (or portion thereof) is recorded. The new standard became effective for fiscal years beginning after December 15, 2018, includinginterim periods within those fiscal years. We adopted this guidance in the quarter ended March 31, 2019. The adoption of this ASU did not have a material impacton our Financial Statements.
In February 2016, the FASB issued ASU No. 2016-02, to increase transparency and comparability among organizations by recognizing lease assets and leaseliabilities on the balance sheet and disclosing key information about leasing transactions. The guidance establishes a right-of-use (“ROU”) model that requires alessee to record a lease ROU asset and a lease liability on the balance sheet for all leases with terms longer than 12 months. We made an accounting policy electionwhere leases that are 12 months or less and do not include an option to purchase the underlying asset are treated similarly to the operating lease accounting underASC 840 and are not recorded on the balance sheet. For lessees, leases are classified as either financing or operating, with classification affecting the pattern ofexpense recognition in the income statement. For lessors, leases are classified as operating, sales-type, or direct financing with classification affecting the pattern ofrevenue and profit recognition in the income statement. In July 2018, the FASB issued ASU No. 2018-10 — Codification Improvements to Topic 842, Leases andASU No. 2018-11 — Leases (Topic 842): Targeted Improvements. ASU No. 2018-10 affected narrow aspects of the guidance previously issued, and ASU No.2018-11 provided a practical expedient for lessors on separating components of a contract and also included an additional optional transition relief methodology foradopting the new standard. In December 2018, the FASB issued ASU No. 2018-20 — Leases (Topic 842): Narrow-Scope Improvements for Lessors, whichaddressed the following issues facing lessors when applying the standard: sales taxes and other similar taxes collected from lessees, certain lessor costs paiddirectly by lessees, and recognition of variable payments for contracts with lease and non-lease components. The guidance requires an entity to adopt the newstandard, as amended, under a modified retrospective application to each prior reporting period presented in the financial statements with the cumulative effectrecognized at the beginning of the earliest comparative period. With the optional transition relief methodology available, entities had an opportunity to adopt thenew lease standard retrospectively at the beginning of the period of adoption through a cumulative-effect adjustment, with certain practical expedients available.Based on the guidance, we adopted the new standard effective January 1, 2019 and applied certain practical expedients offered in the aforementioned guidance,such as those that stated that the Company need not reassess: (a) whether expired or existing contracts contain leases, (b) the lease classification of expired orexisting leases, or (c) initial direct costs for any existing leases. We have provided additional information with respect to the new guidance in “Note 3 — Leases.”
Recent Accounting Guidance Not Yet Adopted
In August 2018, the FASB issued ASU No. 2018-15, which aligns the requirements for capitalizing implementation costs incurred in a hosting arrangement that isa service contract with the requirements for capitalizing implementation costs incurred to develop or obtain internal-use software (and hosting arrangements thatinclude an internal use software license). The new standard is effective for fiscal years beginning after December 15, 2019, including interim periods within thosefiscal years. Early adoption is permitted, including adoption in any interim period. We are currently evaluating the impact of adopting this guidance on ourFinancial Statements; however, we do not expect the impact to be material.
In June 2016, the FASB issued ASU No. 2016-13, which provides updated guidance on how an entity should measure credit losses on financial instruments.Subsequently, in November 2018 the FASB issued ASU No. 2018-19, which clarified that receivables arising from operating leases are not within the scope ofSubtopic 326-20, but should rather be accounted for in accordance with ASC 842. In May 2019, the FASB issued ASU No. 2019-05 providing targeted transitionrelief to all reporting entities within the scope of Topic 326. The new standard and related amendments are effective for fiscal years beginning after December 15,2019, including interim periods within those fiscal years. This guidance is expected to be applied using a modified retrospective approach for the cumulative-effectadjustment to retained earnings as of the beginning of the first reporting period in which the guidance is effective and using a prospective approach for debtsecurities for which any other-
16
than-temporary impairment had been recognized before the effective date. This guidance replaces the current incurred loss measurement methodology with acurrent expected credit loss (“CECL”) measurement methodology over the lifetime of the receivables. This guidance primarily impacts our trade and otherreceivables, including those related to revenues from contracts with customers that may contain contract assets with respect to performance obligations that aresatisfied for which the customers have not yet been invoiced. From a segment management perspective, our operations are not expected to be significantlyimpacted: (a) Our FinTech business acts as a merchant of record for settlement transactions for our cash access related customers wherein cash is held by theCompany; therefore, we generally have the ability to withhold the necessary funds from customers to satisfy the outstanding receivables associated withequipment, information and other products and services; and (b) Our Games business sells EGMs to gaming establishments on a relatively short-term basis andcollections are reasonably certain based on historical experience. Overall, we are currently continuing to evaluate the impact of adopting this guidance on ourFinancial Statements, including accounting policies and processes, controls and systems; however, we do not expect this guidance to have a material impact on ourresults of operations or financial position.
As of September 30, 2019, other than what has been described above, we do not anticipate recently issued accounting guidance to have a significant impact on ourconsolidated financial statements.
3. LEASES
We determine if a contract is, or contains, a lease at the inception, or modification, of a contract based on whether the contract conveys the right to control the useof an identified asset for a period of time in exchange for consideration. Control over the use of an asset is predicated upon the notion that a lessee has both theright to (a) obtain substantially all of the economic benefit from the use of the asset; and (b) direct the use of the asset.
Operating lease ROU assets and liabilities are recognized based on the present value of minimum lease payments over the expected lease term at commencementdate. Lease expense is recognized on a straight-line basis over the expected lease term. Our lease arrangements have both lease and non-lease components. Forleases in which the Company is the lessee, it accounts for the lease and non-lease elements as a single lease component for the various classes of underlying assets,primarily real estate that consists of buildings for office space and warehouses for manufacturing purposes. For leases in which the Company is the lessor, itaccounts for the lease and non-lease elements as a single lease component, primarily electronic gaming machines (“EGMs”).
Certain of our lease arrangements contain options to renew with terms that generally have the ability to extend the lease term to a range of approximately 1 to 15years. The exercise of lease renewal options is generally at our sole discretion. The expected lease terms include options to extend or terminate the lease when it isreasonably certain that we will exercise such option. The depreciable life of leased assets and leasehold improvements are limited by the expected term of suchassets, unless there is a transfer of title or purchase option reasonably certain to be exercised.
Lessee
We enter into operating lease agreements for real estate purposes that generally consist of buildings for office space and warehouses for manufacturing purposes.Certain of our lease agreements consist of rental payments that are periodically adjusted for inflation. Our lease agreements do not contain material residual valueguarantees or material restrictive covenants. Our lease agreements do not generally provide explicit rates of interest; therefore, we use our incrementalcollateralized borrowing rate based on the information available at the commencement date to determine the present value of lease payments. Leases with anexpected term of 12 months or less are not accounted for on our Balance Sheets.
17
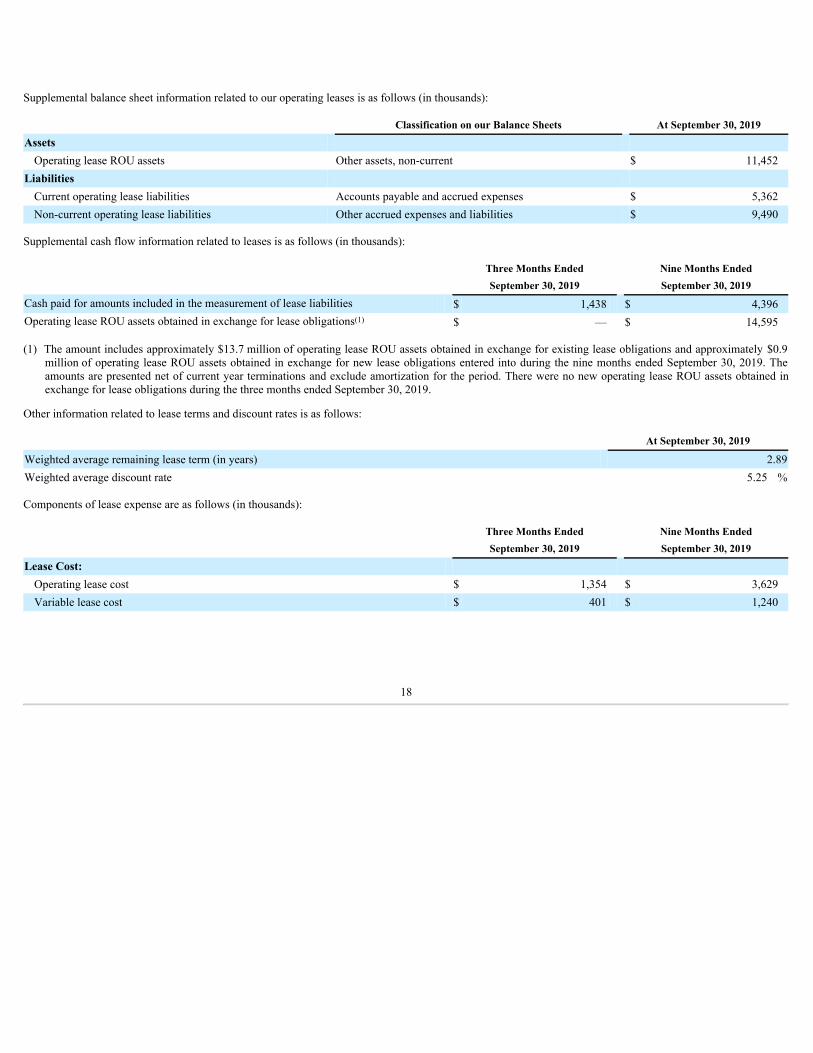
Supplemental balance sheet information related to our operating leases is as follows (in thousands):
Classification on our Balance Sheets At September 30, 2019
AssetsOperating lease ROU assets Other assets, non-current $ 11,452
LiabilitiesCurrent operating lease liabilities Accounts payable and accrued expenses $ 5,362 Non-current operating lease liabilities Other accrued expenses and liabilities $ 9,490
Supplemental cash flow information related to leases is as follows (in thousands):
Three Months Ended Nine Months EndedSeptember 30, 2019 September 30, 2019
Cash paid for amounts included in the measurement of lease liabilities $ 1,438 $ 4,396 Operating lease ROU assets obtained in exchange for lease obligations(1) $ — $ 14,595
(1) The amount includes approximately $13.7 million of operating lease ROU assets obtained in exchange for existing lease obligations and approximately $0.9million of operating lease ROU assets obtained in exchange for new lease obligations entered into during the nine months ended September 30, 2019. Theamounts are presented net of current year terminations and exclude amortization for the period. There were no new operating lease ROU assets obtained inexchange for lease obligations during the three months ended September 30, 2019.
Other information related to lease terms and discount rates is as follows:
At September 30, 2019
Weighted average remaining lease term (in years) 2.89Weighted average discount rate 5.25 %
Components of lease expense are as follows (in thousands):
Three Months Ended Nine Months EndedSeptember 30, 2019 September 30, 2019
Lease Cost:Operating lease cost $ 1,354 $ 3,629 Variable lease cost $ 401 $ 1,240
18
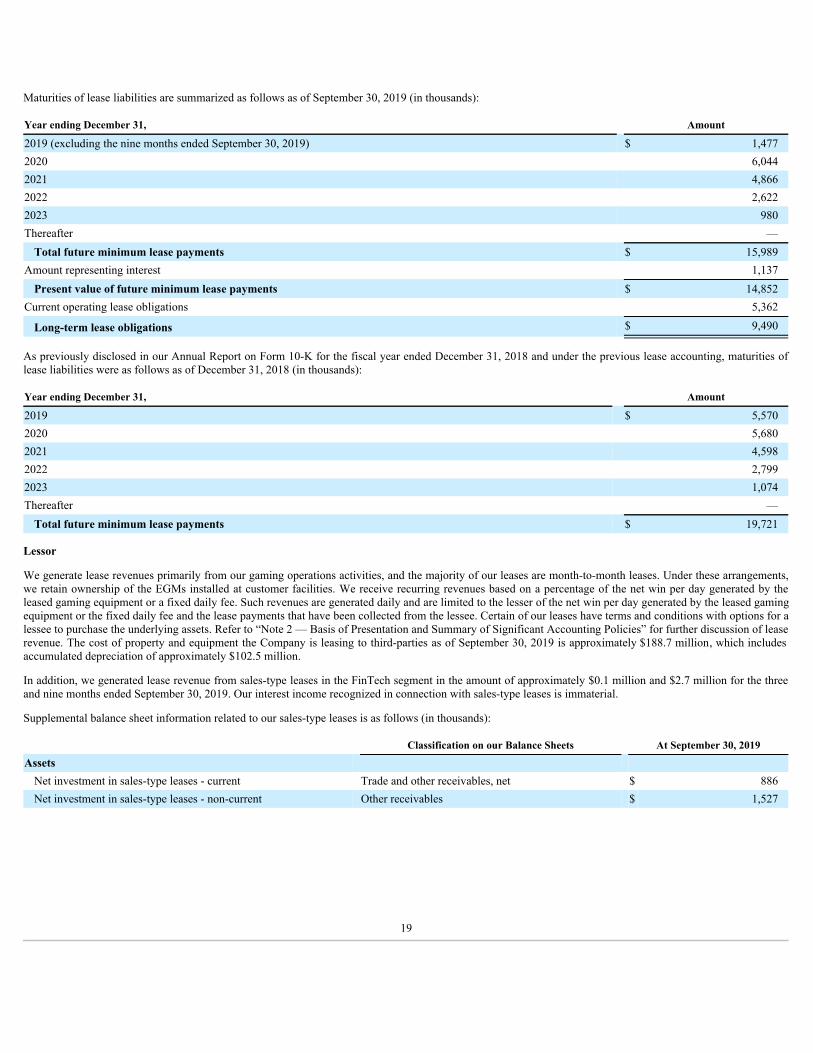
Maturities of lease liabilities are summarized as follows as of September 30, 2019 (in thousands):
Year ending December 31, Amount
2019 (excluding the nine months ended September 30, 2019) $ 1,477 2020 6,044 2021 4,866 2022 2,622 2023 980 Thereafter —
Total future minimum lease payments $ 15,989 Amount representing interest 1,137
Present value of future minimum lease payments $ 14,852 Current operating lease obligations 5,362
Long-term lease obligations $ 9,490
As previously disclosed in our Annual Report on Form 10-K for the fiscal year ended December 31, 2018 and under the previous lease accounting, maturities oflease liabilities were as follows as of December 31, 2018 (in thousands):
Year ending December 31, Amount
2019 $ 5,570 2020 5,680 2021 4,598 2022 2,799 2023 1,074 Thereafter —
Total future minimum lease payments $ 19,721
Lessor
We generate lease revenues primarily from our gaming operations activities, and the majority of our leases are month-to-month leases. Under these arrangements,we retain ownership of the EGMs installed at customer facilities. We receive recurring revenues based on a percentage of the net win per day generated by theleased gaming equipment or a fixed daily fee. Such revenues are generated daily and are limited to the lesser of the net win per day generated by the leased gamingequipment or the fixed daily fee and the lease payments that have been collected from the lessee. Certain of our leases have terms and conditions with options for alessee to purchase the underlying assets. Refer to “Note 2 — Basis of Presentation and Summary of Significant Accounting Policies” for further discussion of leaserevenue. The cost of property and equipment the Company is leasing to third-parties as of September 30, 2019 is approximately $188.7 million, which includesaccumulated depreciation of approximately $102.5 million.
In addition, we generated lease revenue from sales-type leases in the FinTech segment in the amount of approximately $0.1 million and $2.7 million for the threeand nine months ended September 30, 2019. Our interest income recognized in connection with sales-type leases is immaterial.
Supplemental balance sheet information related to our sales-type leases is as follows (in thousands):
Classification on our Balance Sheets At September 30, 2019
AssetsNet investment in sales-type leases - current Trade and other receivables, net $ 886 Net investment in sales-type leases - non-current Other receivables $ 1,527
19
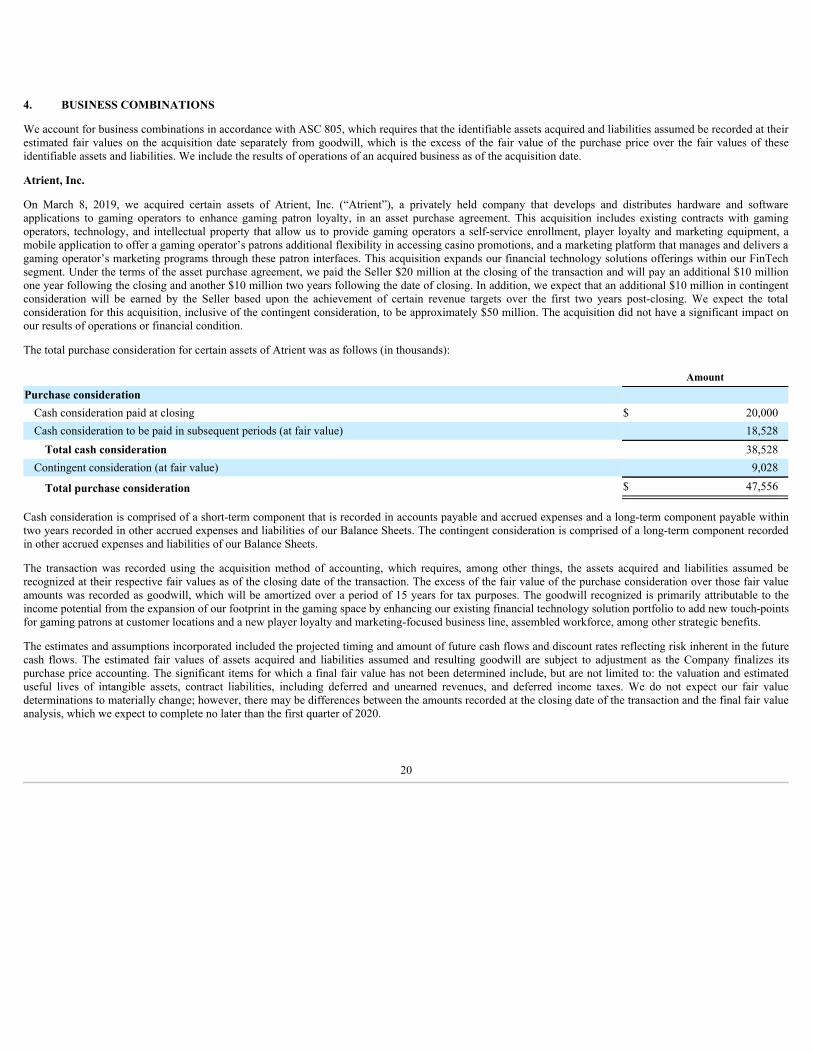
4. BUSINESS COMBINATIONS
We account for business combinations in accordance with ASC 805, which requires that the identifiable assets acquired and liabilities assumed be recorded at theirestimated fair values on the acquisition date separately from goodwill, which is the excess of the fair value of the purchase price over the fair values of theseidentifiable assets and liabilities. We include the results of operations of an acquired business as of the acquisition date.
Atrient, Inc.
On March 8, 2019, we acquired certain assets of Atrient, Inc. (“Atrient”), a privately held company that develops and distributes hardware and softwareapplications to gaming operators to enhance gaming patron loyalty, in an asset purchase agreement. This acquisition includes existing contracts with gamingoperators, technology, and intellectual property that allow us to provide gaming operators a self-service enrollment, player loyalty and marketing equipment, amobile application to offer a gaming operator’s patrons additional flexibility in accessing casino promotions, and a marketing platform that manages and delivers agaming operator’s marketing programs through these patron interfaces. This acquisition expands our financial technology solutions offerings within our FinTechsegment. Under the terms of the asset purchase agreement, we paid the Seller $20 million at the closing of the transaction and will pay an additional $10 millionone year following the closing and another $10 million two years following the date of closing. In addition, we expect that an additional $10 million in contingentconsideration will be earned by the Seller based upon the achievement of certain revenue targets over the first two years post-closing. We expect the totalconsideration for this acquisition, inclusive of the contingent consideration, to be approximately $50 million. The acquisition did not have a significant impact onour results of operations or financial condition.
The total purchase consideration for certain assets of Atrient was as follows (in thousands):
Amount
Purchase considerationCash consideration paid at closing $ 20,000 Cash consideration to be paid in subsequent periods (at fair value) 18,528
Total cash consideration 38,528 Contingent consideration (at fair value) 9,028
Total purchase consideration $ 47,556
Cash consideration is comprised of a short-term component that is recorded in accounts payable and accrued expenses and a long-term component payable withintwo years recorded in other accrued expenses and liabilities of our Balance Sheets. The contingent consideration is comprised of a long-term component recordedin other accrued expenses and liabilities of our Balance Sheets.
The transaction was recorded using the acquisition method of accounting, which requires, among other things, the assets acquired and liabilities assumed berecognized at their respective fair values as of the closing date of the transaction. The excess of the fair value of the purchase consideration over those fair valueamounts was recorded as goodwill, which will be amortized over a period of 15 years for tax purposes. The goodwill recognized is primarily attributable to theincome potential from the expansion of our footprint in the gaming space by enhancing our existing financial technology solution portfolio to add new touch-pointsfor gaming patrons at customer locations and a new player loyalty and marketing-focused business line, assembled workforce, among other strategic benefits.
The estimates and assumptions incorporated included the projected timing and amount of future cash flows and discount rates reflecting risk inherent in the futurecash flows. The estimated fair values of assets acquired and liabilities assumed and resulting goodwill are subject to adjustment as the Company finalizes itspurchase price accounting. The significant items for which a final fair value has not been determined include, but are not limited to: the valuation and estimateduseful lives of intangible assets, contract liabilities, including deferred and unearned revenues, and deferred income taxes. We do not expect our fair valuedeterminations to materially change; however, there may be differences between the amounts recorded at the closing date of the transaction and the final fair valueanalysis, which we expect to complete no later than the first quarter of 2020.
20
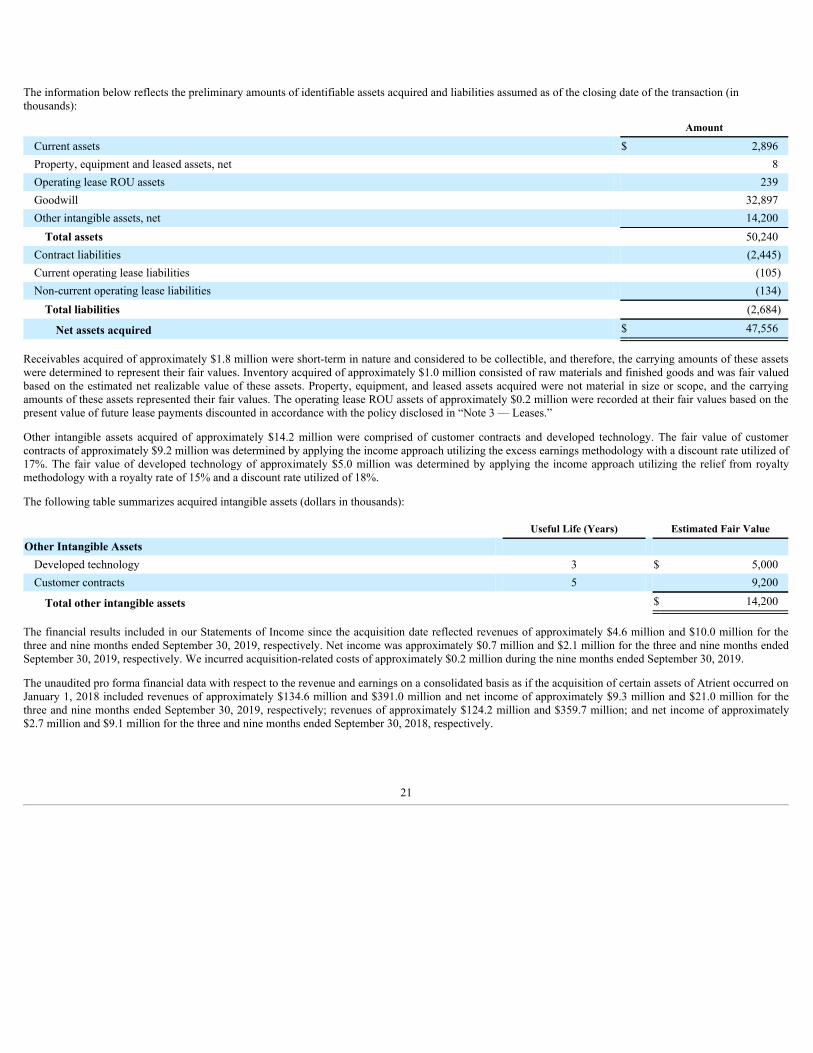
The information below reflects the preliminary amounts of identifiable assets acquired and liabilities assumed as of the closing date of the transaction (inthousands):
Amount
Current assets $ 2,896 Property, equipment and leased assets, net 8 Operating lease ROU assets 239 Goodwill 32,897 Other intangible assets, net 14,200
Total assets 50,240 Contract liabilities (2,445) Current operating lease liabilities (105) Non-current operating lease liabilities (134)
Total liabilities (2,684)
Net assets acquired $ 47,556
Receivables acquired of approximately $1.8 million were short-term in nature and considered to be collectible, and therefore, the carrying amounts of these assetswere determined to represent their fair values. Inventory acquired of approximately $1.0 million consisted of raw materials and finished goods and was fair valuedbased on the estimated net realizable value of these assets. Property, equipment, and leased assets acquired were not material in size or scope, and the carryingamounts of these assets represented their fair values. The operating lease ROU assets of approximately $0.2 million were recorded at their fair values based on thepresent value of future lease payments discounted in accordance with the policy disclosed in “Note 3 — Leases.”
Other intangible assets acquired of approximately $14.2 million were comprised of customer contracts and developed technology. The fair value of customercontracts of approximately $9.2 million was determined by applying the income approach utilizing the excess earnings methodology with a discount rate utilized of17%. The fair value of developed technology of approximately $5.0 million was determined by applying the income approach utilizing the relief from royaltymethodology with a royalty rate of 15% and a discount rate utilized of 18%.
The following table summarizes acquired intangible assets (dollars in thousands):
Useful Life (Years) Estimated Fair Value
Other Intangible AssetsDeveloped technology 3 $ 5,000 Customer contracts 5 9,200
Total other intangible assets $ 14,200
The financial results included in our Statements of Income since the acquisition date reflected revenues of approximately $4.6 million and $10.0 million for thethree and nine months ended September 30, 2019, respectively. Net income was approximately $0.7 million and $2.1 million for the three and nine months endedSeptember 30, 2019, respectively. We incurred acquisition-related costs of approximately $0.2 million during the nine months ended September 30, 2019.
The unaudited pro forma financial data with respect to the revenue and earnings on a consolidated basis as if the acquisition of certain assets of Atrient occurred onJanuary 1, 2018 included revenues of approximately $134.6 million and $391.0 million and net income of approximately $9.3 million and $21.0 million for thethree and nine months ended September 30, 2019, respectively; revenues of approximately $124.2 million and $359.7 million; and net income of approximately$2.7 million and $9.1 million for the three and nine months ended September 30, 2018, respectively.
21
5. FUNDING AGREEMENTS
Commercial Cash Arrangements
We have commercial arrangements with third-party vendors to provide cash for certain of our ATMs. For the use of these funds, we pay a cash usage fee on eitherthe average daily balance of funds utilized multiplied by a contractually defined cash usage rate or the amounts supplied multiplied by a contractually defined cashusage rate. These cash usage fees, reflected as interest expense within the Statements of Income, were approximately $1.8 million and $5.5 million for the threeand nine months ended September 30, 2019, respectively, and approximately $1.6 million and $5.3 million for the three and nine months ended September 30,2018, respectively. We are exposed to interest rate risk to the extent that the applicable rates increase.
Under these agreements, the currency supplied by third-party vendors remains their sole property until the funds are dispensed. As these funds are not our assets,supplied cash is not reflected in our Balance Sheets. The outstanding balances of ATM cash utilized by us from the third-parties were approximately $189.6million and $224.7 million as of September 30, 2019 and December 31, 2018, respectively.
Our primary commercial arrangement, the Contract Cash Solutions Agreement, as amended, is with Wells Fargo, N.A. (“Wells Fargo”). Wells Fargo provides uswith cash in the maximum amount of $300 million with the ability to increase the amount by $75 million over a 5-day period for holidays, such as the periodaround New Year’s Day. The term of the agreement expires on June 30, 2022 and will automatically renew for additional one-year periods unless either partyprovides a 90-day written notice of its intent not to renew.
We are responsible for any losses of cash in the ATMs under this agreement, and we self-insure for this risk. We incurred no material losses related to this self-insurance for the three and nine months ended September 30, 2019 and 2018.
Site-Funded ATMs
We operate ATMs at certain customers’ gaming establishments where the gaming establishment provides the cash required for the ATMs’ operational needs. Weare required to reimburse the customer for the amount of cash dispensed from these site-funded ATMs. The site-funded ATM liability included within settlementliabilities in the accompanying Balance Sheets was approximately $227.7 million and $249.6 million as of September 30, 2019 and December 31, 2018,respectively.
Everi-Funded ATMs
We enter into agreements with international customers for certain of our ATMs whereby we provide the cash required to operate the ATMs. We had suppliedapproximately $3.8 million and $4.8 million of our cash for these ATMs as of September 30, 2019 and December 31, 2018, respectively, which represents anoutstanding balance under such agreements at the end of the period. Such amounts are reported within the settlement receivables line of our Balance Sheets.
Prefunded Cash Access Agreements
Due to regulatory requirements in certain jurisdictions, some international gaming establishments require prefunding of cash to cover the outstanding settlementamounts in order for us to provide cash access services to their properties. We enter into agreements with these gaming operators for which we supply our cashaccess services to their properties. Under these agreements, we maintain sole discretion to either continue or cease operations as well as discretion over theamounts prefunded to the properties and may request amounts to be refunded to us, with appropriate notice to the operator, at any time. The initial prefundedamounts and subsequent amounts from the settlement of transactions are deposited into a bank account that is to be used exclusively for cash access services, andwe maintain the right to monitor the transaction activity in that account. The total amount of prefunded cash outstanding was approximately $5.9 million and $6.1million at September 30, 2019 and December 31, 2018, respectively, and is included in the prepaid expenses and other assets line on our Balance Sheets.
22
6. TRADE AND OTHER RECEIVABLES
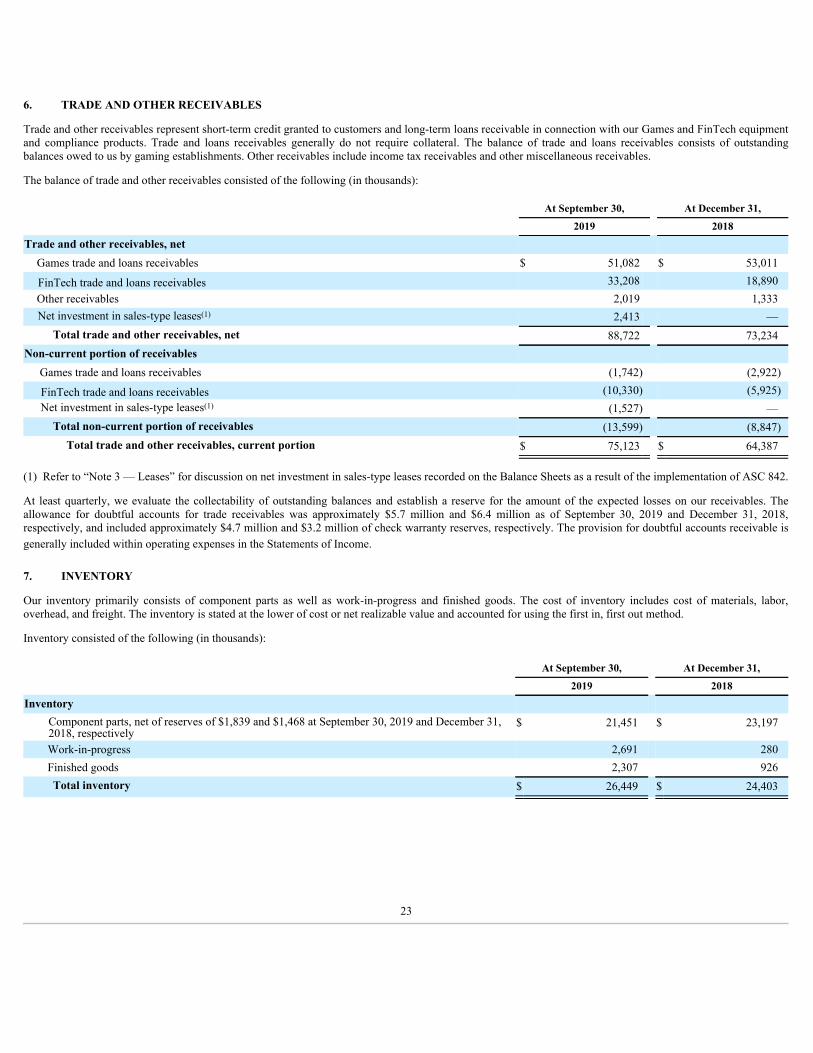
Trade and other receivables represent short-term credit granted to customers and long-term loans receivable in connection with our Games and FinTech equipmentand compliance products. Trade and loans receivables generally do not require collateral. The balance of trade and loans receivables consists of outstandingbalances owed to us by gaming establishments. Other receivables include income tax receivables and other miscellaneous receivables.
The balance of trade and other receivables consisted of the following (in thousands):
At September 30, At December 31,
2019 2018
Trade and other receivables, net Games trade and loans receivables $ 51,082 $ 53,011
FinTech trade and loans receivables 33,208 18,890 Other receivables 2,019 1,333 Net investment in sales-type leases(1) 2,413 —
Total trade and other receivables, net 88,722 73,234 Non-current portion of receivables Games trade and loans receivables (1,742) (2,922)
FinTech trade and loans receivables (10,330) (5,925) Net investment in sales-type leases(1) (1,527) —
Total non-current portion of receivables (13,599) (8,847) Total trade and other receivables, current portion $ 75,123 $ 64,387
(1) Refer to “Note 3 — Leases” for discussion on net investment in sales-type leases recorded on the Balance Sheets as a result of the implementation of ASC 842.
At least quarterly, we evaluate the collectability of outstanding balances and establish a reserve for the amount of the expected losses on our receivables. Theallowance for doubtful accounts for trade receivables was approximately $5.7 million and $6.4 million as of September 30, 2019 and December 31, 2018,respectively, and included approximately $4.7 million and $3.2 million of check warranty reserves, respectively. The provision for doubtful accounts receivable isgenerally included within operating expenses in the Statements of Income.
7. INVENTORY
Our inventory primarily consists of component parts as well as work-in-progress and finished goods. The cost of inventory includes cost of materials, labor,overhead, and freight. The inventory is stated at the lower of cost or net realizable value and accounted for using the first in, first out method.
Inventory consisted of the following (in thousands):
At September 30, At December 31,
2019 2018
Inventory Component parts, net of reserves of $1,839 and $1,468 at September 30, 2019 and December 31,2018, respectively
$ 21,451 $ 23,197
Work-in-progress 2,691 280 Finished goods 2,307 926 Total inventory $ 26,449 $ 24,403
23
8. PREPAID EXPENSES AND OTHER ASSETS
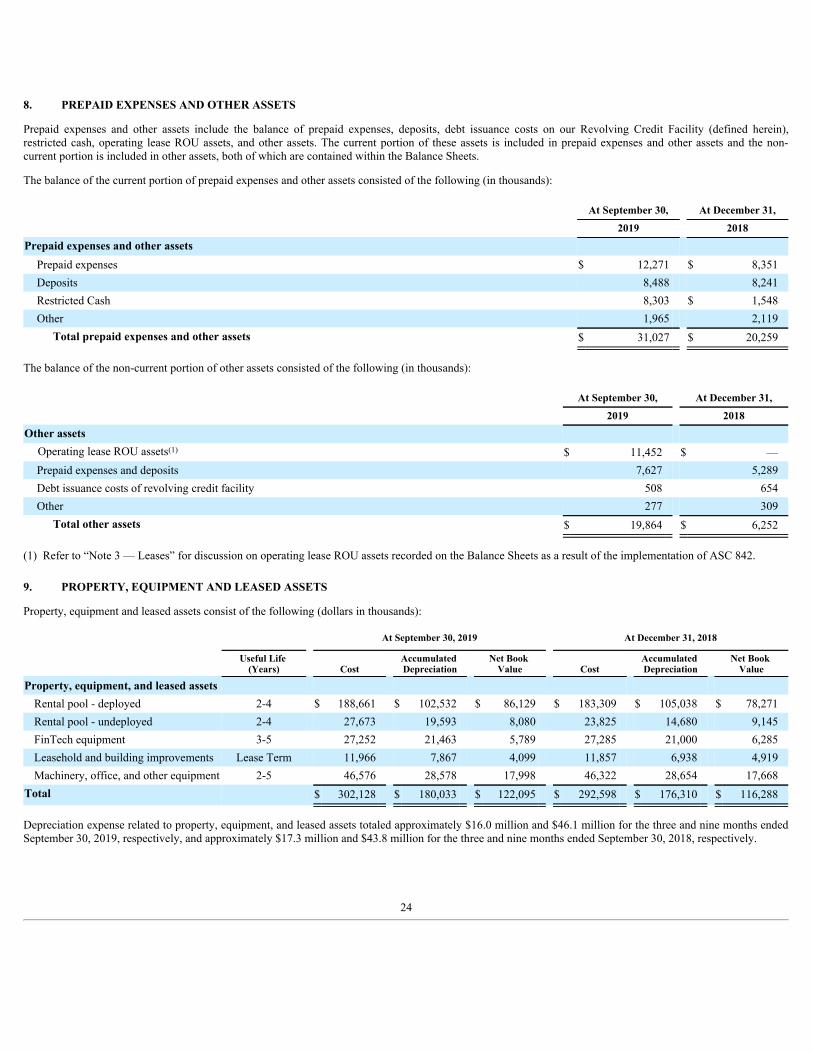
Prepaid expenses and other assets include the balance of prepaid expenses, deposits, debt issuance costs on our Revolving Credit Facility (defined herein),restricted cash, operating lease ROU assets, and other assets. The current portion of these assets is included in prepaid expenses and other assets and the non-current portion is included in other assets, both of which are contained within the Balance Sheets.
The balance of the current portion of prepaid expenses and other assets consisted of the following (in thousands):
At September 30, At December 31,
2019 2018
Prepaid expenses and other assets Prepaid expenses $ 12,271 $ 8,351 Deposits 8,488 8,241 Restricted Cash 8,303 $ 1,548 Other 1,965 2,119
Total prepaid expenses and other assets $ 31,027 $ 20,259
The balance of the non-current portion of other assets consisted of the following (in thousands):
At September 30, At December 31,
2019 2018
Other assets Operating lease ROU assets(1) $ 11,452 $ — Prepaid expenses and deposits 7,627 5,289 Debt issuance costs of revolving credit facility 508 654 Other 277 309
Total other assets $ 19,864 $ 6,252
(1) Refer to “Note 3 — Leases” for discussion on operating lease ROU assets recorded on the Balance Sheets as a result of the implementation of ASC 842.
9. PROPERTY, EQUIPMENT AND LEASED ASSETS
Property, equipment and leased assets consist of the following (dollars in thousands):
At September 30, 2019 At December 31, 2018
Useful Life (Years) Cost
Accumulated Depreciation
Net Book Value Cost
Accumulated Depreciation
Net Book Value
Property, equipment, and leased assets Rental pool - deployed 2-4 $ 188,661 $ 102,532 $ 86,129 $ 183,309 $ 105,038 $ 78,271 Rental pool - undeployed 2-4 27,673 19,593 8,080 23,825 14,680 9,145 FinTech equipment 3-5 27,252 21,463 5,789 27,285 21,000 6,285 Leasehold and building improvements Lease Term 11,966 7,867 4,099 11,857 6,938 4,919 Machinery, office, and other equipment 2-5 46,576 28,578 17,998 46,322 28,654 17,668
Total $ 302,128 $ 180,033 $ 122,095 $ 292,598 $ 176,310 $ 116,288
Depreciation expense related to property, equipment, and leased assets totaled approximately $16.0 million and $46.1 million for the three and nine months endedSeptember 30, 2019, respectively, and approximately $17.3 million and $43.8 million for the three and nine months ended September 30, 2018, respectively.
24
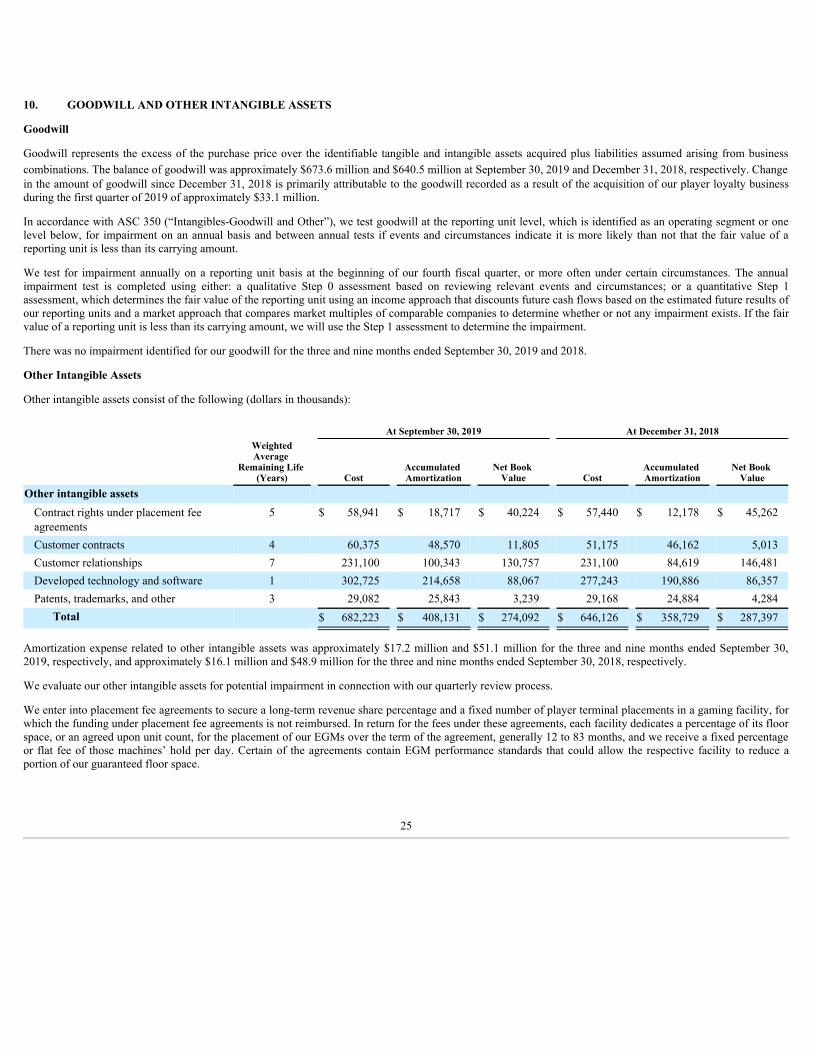
10. GOODWILL AND OTHER INTANGIBLE ASSETS
Goodwill
Goodwill represents the excess of the purchase price over the identifiable tangible and intangible assets acquired plus liabilities assumed arising from businesscombinations. The balance of goodwill was approximately $673.6 million and $640.5 million at September 30, 2019 and December 31, 2018, respectively. Changein the amount of goodwill since December 31, 2018 is primarily attributable to the goodwill recorded as a result of the acquisition of our player loyalty businessduring the first quarter of 2019 of approximately $33.1 million.
In accordance with ASC 350 (“Intangibles-Goodwill and Other”), we test goodwill at the reporting unit level, which is identified as an operating segment or onelevel below, for impairment on an annual basis and between annual tests if events and circumstances indicate it is more likely than not that the fair value of areporting unit is less than its carrying amount.
We test for impairment annually on a reporting unit basis at the beginning of our fourth fiscal quarter, or more often under certain circumstances. The annualimpairment test is completed using either: a qualitative Step 0 assessment based on reviewing relevant events and circumstances; or a quantitative Step 1assessment, which determines the fair value of the reporting unit using an income approach that discounts future cash flows based on the estimated future results ofour reporting units and a market approach that compares market multiples of comparable companies to determine whether or not any impairment exists. If the fairvalue of a reporting unit is less than its carrying amount, we will use the Step 1 assessment to determine the impairment.
There was no impairment identified for our goodwill for the three and nine months ended September 30, 2019 and 2018.
Other Intangible Assets
Other intangible assets consist of the following (dollars in thousands):
At September 30, 2019 At December 31, 2018WeightedAverage
Remaining Life (Years) Cost
Accumulated Amortization
Net Book Value Cost
Accumulated Amortization
Net Book Value
Other intangible assets Contract rights under placement feeagreements
5 $ 58,941 $ 18,717 $ 40,224 $ 57,440 $ 12,178 $ 45,262
Customer contracts 4 60,375 48,570 11,805 51,175 46,162 5,013 Customer relationships 7 231,100 100,343 130,757 231,100 84,619 146,481 Developed technology and software 1 302,725 214,658 88,067 277,243 190,886 86,357 Patents, trademarks, and other 3 29,082 25,843 3,239 29,168 24,884 4,284
Total $ 682,223 $ 408,131 $ 274,092 $ 646,126 $ 358,729 $ 287,397
Amortization expense related to other intangible assets was approximately $17.2 million and $51.1 million for the three and nine months ended September 30,2019, respectively, and approximately $16.1 million and $48.9 million for the three and nine months ended September 30, 2018, respectively.
We evaluate our other intangible assets for potential impairment in connection with our quarterly review process.
We enter into placement fee agreements to secure a long-term revenue share percentage and a fixed number of player terminal placements in a gaming facility, forwhich the funding under placement fee agreements is not reimbursed. In return for the fees under these agreements, each facility dedicates a percentage of its floorspace, or an agreed upon unit count, for the placement of our EGMs over the term of the agreement, generally 12 to 83 months, and we receive a fixed percentageor flat fee of those machines’ hold per day. Certain of the agreements contain EGM performance standards that could allow the respective facility to reduce aportion of our guaranteed floor space.
25

Placement fees and amounts advanced in excess of those to be reimbursed by the customer for real property and land improvements are allocated to intangibleassets and are generally amortized over the term of the contract, which is recorded as a reduction of revenue generated from the facility. In the past we have, and inthe future, we may, by mutual agreement, amend these agreements to reduce our floor space at the facilities. Any proceeds received for the reduction of floor spaceare first applied against the intangible asset for that particular placement fee agreement, if any, and the remaining net book value of the intangible asset isprospectively amortized on a straight-line method over the remaining estimated useful life.
We paid approximately $5.6 million and $17.7 million in placement fees, including $0.1 million and $0.6 million of imputed interest, for the three and nine monthsended September 30, 2019, respectively, and approximately $5.6 million and $17.1 million in placement fees, including $0.4 million and $1.8 million of imputedinterest, for the three and nine months ended September 30, 2018, respectively.
11. ACCOUNTS PAYABLE AND ACCRUED EXPENSES
The following table presents our accounts payable and accrued expenses (in thousands):
At September 30, At December 31,
2019 2018
Accounts payable and accrued expenses Trade accounts payable $ 84,695 $ 70,796 Contract liabilities 28,890 12,887 Payroll and related expenses 9,400 15,055 Accrued interest 8,391 1,374 Cash access processing and related expenses 5,787 4,160 Operating lease liabilities(1) 5,362 — Accrued taxes 2,156 1,917 Other 2,110 6,303 Placement fees 585 16,746
Total accounts payable and accrued expenses $ 147,376 $ 129,238
(1) Refer to “Note 3 — Leases” for discussion on operating lease liabilities recorded on the Balance Sheets as a result of the implementation of ASC 842.
12. LONG-TERM DEBT
The following table summarizes our outstanding indebtedness (in thousands):
At September 30, At December 31,
2019 2018
Long-term debt Senior secured term loan $ 782,000 $ 807,700 Senior unsecured notes 375,000 375,000
Total debt 1,157,000 1,182,700 Debt issuance costs and discount (16,933) (19,484)
Total debt after debt issuance costs and discount 1,140,067 1,163,216 Current portion of long-term debt (8,200) (8,200)
Long-term debt, less current portion $ 1,131,867 $ 1,155,016
26
Refinancing
On May 9, 2017 (the “Closing Date”), Everi Payments, as borrower, and Holdings entered into a credit agreement with the lenders party thereto and JefferiesFinance LLC, as administrative agent, collateral agent, swing line lender, letter of credit issuer, sole lead arranger and sole book manager (amended as describedbelow, the “Credit Agreement”). The Credit Agreement provides for: (a) a $35.0 million, five year senior secured revolving credit facility (the “Revolving CreditFacility”); and (b) an $820.0 million, seven year senior secured term loan facility (the “Term Loan Facility,” and together with the Revolving Credit Facility, the“Credit Facilities”). The fees associated with the Credit Facilities included discounts of approximately $4.1 million and debt issuance costs of approximately $15.5million. All borrowings under the Revolving Credit Facility are subject to the satisfaction of customary conditions, including the absence of defaults and theaccuracy of representations and warranties.
The proceeds from the Term Loan Facility incurred on the Closing Date were used to: (a) refinance: (i) Everi Payments’ existing credit facility with an outstandingbalance of approximately $462.3 million with Bank of America, N.A., as administrative agent, collateral agent, swing line lender and letter of credit issuer,Deutsche Bank Securities Inc., as syndication agent, and Merrill Lynch, Pierce, Fenner & Smith Incorporated and Deutsche Bank Securities Inc., as joint leadarrangers and joint book managers (the “Prior Credit Facility”); and (ii) Everi Payments’ 7.25% Senior Secured Notes due 2021 in the aggregate original principalamount of $335.0 million (the “Refinanced Secured Notes”); and (b) pay related transaction fees and expenses.
In connection with the refinancing, we recorded a non-cash charge of approximately $14.6 million during the second quarter of 2017 related to the unamortizeddeferred financing fees and discounts related to the extinguished term loan under the Prior Credit Facility and the redeemed Refinanced Secured Notes. Noprepayment penalties were incurred.
On November 13, 2017 (the “Repricing Closing Date”), we entered into an amendment to the Credit Agreement (the “First Amendment”) which, among otherthings, reduced the interest rate on the approximately $818.0 million then outstanding balance of the Term Loan Facility, but did not change the maturity dates forthe Term Loan Facility or the Revolving Credit Facility or the financial covenants or other debt repayments terms set forth in the Credit Agreement. We incurredapproximately $3.0 million of debt issuance costs and fees associated with the repricing of the Term Loan Facility.
On May 17, 2018, we entered into a Second Amendment (the “Second Amendment”) to the Credit Agreement, which reduced the interest rate on the $813.9million outstanding balance of the senior secured term loan under the Credit Agreement by 50 basis points to the London Interbank Offered Rate (“LIBOR”) +3.00% from LIBOR + 3.50% with the LIBOR floor unchanged at 1.00%. The maturity date for the Credit Agreement remains May 9, 2024, and no changes weremade to the financial covenants or other debt repayment terms. We incurred approximately $1.3 million of debt issuance costs and fees associated with therepricing of the Term Loan Facility.
Credit Facilities
The Term Loan Facility matures seven years after the Closing Date and the Revolving Credit Facility matures five years after the Closing Date. The RevolvingCredit Facility is available for general corporate purposes, including permitted acquisitions, working capital and the issuance of letters of credit.
The interest rate per annum applicable to loans under the Revolving Credit Facility is, at Everi Payments’ option, the base rate or the Eurodollar Rate (defined to beLIBOR or a comparable or successor rate) (the “Eurodollar Rate”) plus, in each case, an applicable margin. The interest rate per annum applicable to the TermLoan Facility also is, at Everi Payments’ option, the base rate or the Eurodollar Rate plus, in each case, an applicable margin. The Eurodollar Rate is reset at thebeginning of each selected interest period based on the Eurodollar Rate then in effect; provided that, if the Eurodollar Rate is below zero, then such rate will beequal to zero plus the applicable margin. The base rate is a fluctuating interest rate equal to the highest of: (a) the prime lending rate announced by theadministrative agent; (b) the federal funds effective rate from time to time plus 0.50%; and (c) the Eurodollar Rate (after taking account of any applicable floor)applicable for an interest period of one month plus 1.00%. Prior to the effectiveness of the First Amendment on the Repricing Closing Date, the applicable marginsfor both the Revolving Credit Facility and the Term Loan Facility were: (a) 4.50% in respect of Eurodollar Rate loans, and (b) 3.50% in respect of base rate loans.The applicable margins for the Term Loan Facility from and after the effectiveness of the First Amendment on the Repricing Closing Date through theeffectiveness of the Second Amendment were: (a) 3.50% in respect of Eurodollar Rate loans, and (b) 2.50% in respect of base rate loans. The applicable marginsfor the Term Loan Facility from and after the effectiveness of the Second Amendment are: (a) 3.00% in respect of Eurodollar Rate loans, and (b) 2.00% in respectof base rate loans.
27
Voluntary prepayments of the term loan and the revolving loans and voluntary reductions in the unused commitments are permitted in whole or in part, inminimum amounts as set forth in the Credit Agreement governing the Credit Facilities, with prior notice but without premium or penalty.
Subject to certain exceptions, the obligations under the Credit Facilities are secured by substantially all of the present and subsequently acquired assets of each ofEveri Payments, Holdings and the subsidiary guarantors party thereto, including: (a) a perfected first priority pledge of all the capital stock of Everi Payments andeach domestic direct, wholly owned material restricted subsidiary held by Holdings, Everi Payments or any such subsidiary guarantor; and (b) a perfected firstpriority security interest in substantially all other tangible and intangible assets of Holdings, Everi Payments, and such subsidiary guarantors (including, but notlimited to, accounts receivable, inventory, equipment, general intangibles, investment property, real property, intellectual property and the proceeds of theforegoing). Subject to certain exceptions, the Credit Facilities are unconditionally guaranteed by Holdings and such subsidiary guarantors.
The Credit Agreement governing the Credit Facilities contains certain covenants that, among other things, limit Holdings’ ability, and the ability of certain of itssubsidiaries, to incur additional indebtedness, sell assets or consolidate or merge with or into other companies, pay dividends or repurchase or redeem capital stock,make certain investments, issue capital stock of subsidiaries, incur liens, prepay, redeem or repurchase subordinated debt, and enter into certain types oftransactions with its affiliates. The Credit Agreement governing the Credit Facilities also requires Holdings, together with its subsidiaries, to comply with aconsolidated secured leverage ratio. At September 30, 2019, our consolidated secured leverage ratio was 2.97 to 1.00, with a maximum allowable ratio of 4.75 to1.00 (which maximum allowable ratio is reduced to 4.50 to 1.00 as of December 31, 2019, 4.25 to 1.00 as of December 31, 2020, and 4.00 to 1.00 as of December31, 2021 and each December 31 thereafter).
We were in compliance with the covenants and terms of the Credit Facilities as of September 30, 2019.
Events of default under the Credit Agreement governing the Credit Facilities include customary events such as a cross-default provision with respect to othermaterial debt. In addition, an event of default will occur if Holdings undergoes a change of control. This is defined to include the case where Holdings ceases toown 100% of the equity interests of Everi Payments, or where any person or group acquires a percentage of the economic or voting interests of Holdings’ capitalstock of 35% or more (determined on a fully diluted basis).
We are required to repay the Term Loan Facility in an amount equal to 0.25% per quarter of the initial aggregate principal, with the final principal repaymentinstallment on the maturity date. Interest is due in arrears on each interest payment date applicable thereto and at such other times as may be specified in the CreditAgreement. As to any loan other than a base rate loan, the interest payment dates shall be the last day of each interest period applicable to such loan and thematurity date (provided, however, that if any interest period for a Eurodollar Rate loan exceeds three months, the respective dates that fall every three months afterthe beginning of such interest period shall also be interest payment dates). As to any base rate loan, the interest payment dates shall be last business day of eachMarch, June, September and December and the maturity date.
The Term Loan Facility had an applicable weighted average interest rate of 5.25% and 5.41% for the three and nine months ended September 30, 2019,respectively.
At September 30, 2019, we had $782.0 million of borrowings outstanding under the Term Loan Facility and no borrowings outstanding under the Revolving CreditFacility. We had $35.0 million of additional borrowing availability under the Revolving Credit Facility as of September 30, 2019.
Refinanced Senior Secured Notes
In connection with entering into the Credit Agreement, on May 9, 2017, Everi Payments redeemed in full all outstanding Refinanced Secured Notes in theaggregate principal amount of $335.0 million face value (plus accrued interest) of the Refinanced Secured Notes. As a result of the redemption, we recorded non-cash charges in the amount of approximately $1.7 million, which consisted of unamortized deferred financing fees of approximately $0.2 million and discounts ofapproximately $1.5 million. These fees were included in the total $14.6 million non-cash charge referred to above.
Upon the issuance of the Refinanced Secured Notes on April 15, 2015, the Company issued to CPPIB Credit Investments III Inc. (the “Purchaser”) a warrant toacquire 700,000 shares of Holdings’ common stock, with an exercise price equal to $9.88 per share, representing a 30% premium to the volume-weighted averageprice of Holdings’ common stock for the ten trading days prior to the issuance of the warrant. Upon issuance, the warrant was valued at approximately $2.2 millionduring the quarter ended June 30, 2015 using a modified Black-Scholes model and was accounted for as a debt discount, of which the unamortized portion wassubsequently written off upon redemption of the Refinanced Secured Notes. The warrant was not impacted by the May 9, 2017 redemption of the RefinancedSecured Notes and expires on the sixth anniversary of the date of
28
issuance. The number of shares issuable pursuant to the warrant and the warrant exercise price are subject to adjustment for stock splits, reverse stock splits, stockdividends, mergers and certain other events.
Senior Unsecured Notes
In December 2014, we issued $350.0 million in aggregate principal amount of 10.0% Senior Unsecured Notes due 2022 (the “2014 Unsecured Notes”) under anindenture (as supplemented, the “2014 Notes Indenture”), dated December 19, 2014, between Everi Payments (as successor issuer) and Deutsche Bank TrustCompany Americas, as trustee. The fees associated with the 2014 Unsecured Notes included original issue discounts of approximately $3.8 million and debtissuance costs of approximately $14.0 million. In December 2015, we completed an exchange offer in which all of the unregistered 2014 Unsecured Notes wereexchanged for a like amount of 2014 Unsecured Notes that had been registered under the Securities Act of 1933.
In December 2017, we issued $375.0 million in aggregate principal amount of 7.50% Senior Unsecured Notes due 2025 (the “2017 Unsecured Notes”) under anindenture (the “2017 Notes Indenture”), dated December 5, 2017, among Everi Payments (as issuer), Holdings and certain of its direct and indirect domesticsubsidiaries as guarantors, and Deutsche Bank Trust Company Americas, as trustee. Interest on the 2017 Unsecured Notes accrues at a rate of 7.50% per annumand is payable semi-annually in arrears on each June 15 and December 15, commencing on June 15, 2018. The 2017 Unsecured Notes will mature on December15, 2025. We incurred approximately $6.1 million of debt issuance costs and fees associated with the issuance of the 2017 Unsecured Notes.
On December 5, 2017, together with the issuance of the 2017 Unsecured Notes, Everi Payments satisfied and discharged the 2014 Notes Indenture relating to the2014 Unsecured Notes. To effect the satisfaction and discharge, Everi Payments issued an unconditional notice of redemption to Deutsche Bank Trust CompanyAmericas, as trustee, of the redemption in full on January 15, 2018 (the “Redemption Date”) of all outstanding 2014 Unsecured Notes under the terms of the 2014Notes Indenture. In addition, using the proceeds from the sale of the 2017 Unsecured Notes and cash on hand, Everi Payments irrevocably deposited with thetrustee funds sufficient to pay the redemption price of the 2014 Unsecured Notes of 107.5% of the principal amount thereof, plus accrued and unpaid interest to,but not including, the Redemption Date (the “Redemption Price”), and irrevocably instructed the trustee to apply the deposited money toward payment of theRedemption Price for the 2014 Unsecured Notes on the Redemption Date. Upon the trustee’s receipt of such funds and instructions, along with an officer’scertificate of Everi Payments and an opinion of counsel certifying and opining that all conditions under the 2014 Notes Indenture to the satisfaction and dischargeof the 2014 Notes Indenture had been satisfied, the 2014 Notes Indenture was satisfied and discharged, and all of the obligations of Everi Payments and theguarantors under the 2014 Notes Indenture ceased to be of further effect, as of December 5, 2017 (subject to certain exceptions). The 2014 Unsecured Notes werethereafter redeemed on the Redemption Date.
In connection with the issuance of the 2017 Unsecured Notes and the redemption of the 2014 Unsecured Notes, in December 2017 we incurred a loss onextinguishment of debt of approximately $37.2 million consisting of a make-whole premium related to the satisfaction and redemption of the 2014 UnsecuredNotes of approximately $26.3 million and approximately $10.9 million for the write-off of related unamortized debt issuance costs and fees.
We were in compliance with the terms of the 2017 Unsecured Notes as of September 30, 2019.
13. COMMITMENTS AND CONTINGENCIES
There were no material changes in our commitments under contractual obligations as compared to those disclosed in our Annual Report on Form 10-K for thefiscal year ended December 31, 2018, aside from the cash consideration and contingent consideration payable for acquisition of certain assets of Atrient asdiscussed in “Note 4 — Business Combinations.”
We are involved in various legal proceedings in the ordinary course of our business. While we believe resolution of the claims brought against us, both individuallyand in aggregate, will not have a material adverse impact on our financial condition or results of operations, litigation of this nature is inherently unpredictable. Ourviews on these legal proceedings, including those described below, may change in the future. We intend to vigorously defend against these actions, and ultimatelybelieve we should prevail.
29
We evaluate matters and record an accrual for legal contingencies when it is both probable that a liability has been incurred and the amount or range of the loss canbe reasonably estimated in accordance with ASC 450. We evaluate legal contingencies at least quarterly and, as appropriate, establish new accruals or adjustexisting accruals to reflect: (1) the facts and circumstances known to us at the time, including information regarding negotiations, settlements, rulings, and otherrelevant events and developments; (2) the advice and analyses of counsel; and (3) the assumptions and judgment of management. Legal costs associated with ourlegal proceedings are expensed as incurred. We currently have no accrued liabilities for outstanding legal matters.
Given there are procedural, factual, and legal issues to be resolved that could significantly affect our assessment as to the probability of liability, we are not able toreasonably estimate the size or range of the possible loss, if any, with respect to these legal proceedings.
FACTA-related matters:
Oneeb Rehman, et. al. v. Everi Payments Inc. and Everi Holdings Inc., is a putative class action matter pending in the U.S. District Court for the Southern Districtof Florida, Ft. Lauderdale Division filed on October 16, 2018. The original defendant was dismissed and the Company was substituted as defendant on April 22,2019. Plaintiff, on behalf of himself and others similarly situated, alleges that Everi Payments Inc. (“Everi Payments”) and the Company have violated certainprovisions of the Fair and Accurate Credit Transactions Act (FACTA). Plaintiff seeks an award of statutory damages, attorney’s fees, and costs.
Mat Jessop, et. al. v. Penn National Gaming, Inc., is a putative class action matter filed on October 15, 2018, pending in the U.S. District Court for the MiddleDistrict of Florida, Orlando Division. Everi Payments was added as a defendant on December 21, 2018. Penn National Gaming, Inc. (“Penn National”) wasdismissed by the Court with prejudice on October 28, 2019, leaving only claims against Everi Payments. Plaintiff, on behalf of himself and others similarlysituated, alleges that Everi Payments has been unjustly enriched through the charging of service fees for transactions conducted at Penn National facilities. Plaintiffseeks injunctive relief against both parties, and an award of statutory damages, attorney’s fees, and costs.Geraldine Donahue, et. al. v. Everi Payments Inc., et. al., is a putative class action matter filed on December 12, 2018, in Cook County, Illinois. The originaldefendant was dismissed and the Company was substituted as defendant on April 22, 2019. Plaintiff, on behalf of himself and others similarly situated, alleges thatEveri Payments and the Company have violated certain provisions of FACTA. Plaintiff seeks an award of statutory damages, attorney’s fees, and costs.
NRT matter:
NRT Technology Corp., et. al. v. Everi Holdings Inc., et. al., is a civil action filed on April 30, 2019 against the Company and Everi Payments in the United StatesDistrict Court for the District of Delaware alleging monopolization of the market for unmanned, integrated kiosks in violation of federal antitrust laws, fraudulentprocurement of patents on functionality related to such unmanned, integrated kiosks and sham litigation related to prior litigation brought by Everi Payments(operating as Global Cash Access Inc.) against the plaintiffs. Plaintiffs seek compensatory damages, trebled damages and injunctive and declaratory relief.
14. STOCKHOLDERS’ EQUITY
Preferred Stock. Our amended and restated certificate of incorporation, allows our Board of Directors, without further action by stockholders, to issue up to50,000,000 shares of preferred stock in one or more series and to fix the designations, powers, preferences, privileges and relative participating, optional, or specialrights as well as the qualifications, limitations or restrictions of the preferred stock, including dividend rights, conversion rights, voting rights, terms of redemptionand liquidation preferences. As of September 30, 2019 and December 31, 2018, we had no shares of preferred stock outstanding.
Common Stock. Subject to the preferences that may apply to shares of preferred stock that may be outstanding at the time, the holders of outstanding shares ofcommon stock are entitled to receive dividends out of assets legally available at the time and in the amounts as our Board of Directors may from time to timedetermine. All dividends are non-cumulative. In the event of the liquidation, dissolution, or winding up of Everi, the holders of common stock are entitled to shareratably in all assets remaining after the payment of liabilities, subject to the prior distribution rights of preferred stock, if any, then outstanding. Each stockholder isentitled to one vote for each share of common stock held on all matters submitted to a vote of stockholders. Cumulative voting for the election of directors is notprovided for. The common stock is not entitled to preemptive rights and is not subject to conversion or redemption. There are no sinking fund provisions applicableto the common stock. Each outstanding share of common stock is fully paid and non-assessable. As of September 30, 2019 and December 31, 2018, we had97,278,570 and 95,099,532 shares of common stock issued, respectively.
30

Treasury Stock. Employees may direct us to withhold vested shares of restricted stock to satisfy the minimum statutory withholding requirements applicable totheir restricted stock vesting. We repurchased or withheld from restricted stock awards 3,698 and 92,065 shares of common stock for the three and nine monthsended September 30, 2019, respectively, at an aggregate purchase price of $41,433 and $1,021,082, respectively, and 1,215 and 7,431 shares of common stock forthe three and nine months ended September 30, 2018, respectively, at an aggregate purchase price of $9,424 and $56,702, respectively, to satisfy the minimumapplicable tax withholding obligations related to the vesting of such restricted stock awards.
15. WEIGHTED AVERAGE COMMON SHARES
The weighted average number of shares of common stock outstanding used in the computation of basic and diluted earnings per share is as follows (in thousands):
Three Months Ended September 30, Nine Months Ended September 30,
2019 2018 2019 2018
Weighted average shares Weighted average number of common shares outstanding -basic
72,251 69,750 71,361 69,217
Potential dilution from equity awards(1) 6,874 4,844 6,493 4,495 Weighted average number of common shares outstanding -diluted(1)
79,125 74,594 77,854 73,712
(1) The potential dilution excludes the weighted average effect of equity awards to purchase approximately 0.2 million and 1.7 million shares of common stock forthe three and nine months ended September 30, 2019, respectively, and approximately 3.7 million and 7.4 million shares of common stock for the three andnine months ended September 30, 2018, respectively, as the application of the treasury stock method, as required, makes them anti-dilutive.
16. SHARE-BASED COMPENSATION
Equity Incentive Awards
Our 2014 Equity Incentive Plan (as amended and restated effective May 22, 2018, the “Amended and Restated 2014 Plan”) and our 2012 Equity Incentive Plan (asamended, the “2012 Plan”) are used to attract and retain the best available personnel, to provide additional incentives to employees, directors, and consultants, andto promote the success of our business. Our equity incentive plans are administered by the Compensation Committee of our Board of Directors, which has theauthority to select individuals who are to receive equity incentive awards and to specify the terms and conditions of grants of such awards, including, but notlimited to the vesting provisions and exercise prices.
Generally, we grant the following types of awards: (a) time-based options; (b) market-based options; (c) time-based restricted stock; and (d) restricted stock units(“RSUs”) with either time- or performance-based criteria. We estimate forfeiture amounts based on historical patterns.
A summary of award activity is as follows (in thousands):
Stock Options Restricted Stock Awards
Restricted Stock Units
Outstanding, December 31, 2018 15,674 8 1,797 Granted — — 1,976 Exercised options or vested shares (1,891) (8) (288) Canceled or forfeited (1,101) — (79)
Outstanding, September 30, 2019 12,682 — 3,406
There are approximately 2.8 million awards of our common stock available for future equity grants under our existing equity incentive plans.
Stock Options
Our time-based stock options granted under our equity plans generally vest at a rate of 25% per year on each of the first four anniversaries of the option grant dates,and the options expire after a ten year period.
31

Our market-based options granted in 2017 and 2016 under our 2014 Plan and 2012 Plan vest at a rate of 25% per year on each of the first four anniversaries of thegrant date, provided that as of the vesting date for each vesting tranche, the closing price of our shares on the New York Stock Exchange is at least a specified pricehurdle, defined as a 25% and 50% premium for 2017 and 2016, respectively, to the closing stock price on the grant date. If the price hurdle is not met as of thevesting date for a vesting tranche, then the vested tranche shall vest and become vested shares on the last day of a period of 30 consecutive trading days duringwhich the closing price is at least the price hurdle. These options expire after a ten year period.
The following table presents the options activity for the nine months ended September 30, 2019:
Number of Options
(in thousands)
Weighted Average Exercise Price
(per Share)
Weighted Average Life Remaining
(Years)
Aggregate Intrinsic Value (in thousands)
Outstanding, December 31, 2018 15,674 $ 5.39 6.0 $ 17,733 Granted — Exercised (1,891) $ 5.82 Canceled or forfeited (1,101) $ 7.43
Outstanding, September 30, 2019 12,682 $ 5.15 5.6 $ 42,917 Vested and expected to vest, September 30, 2019 12,434 $ 5.19 5.6 $ 41,587 Exercisable, September 30, 2019 9,995 $ 5.70 5.2 $ 28,494
There were no time-based or market-based option awards granted during the three and nine months ended September 30, 2019 and 20,000 time-based optionawards granted during the three and nine months ended September 30, 2018. The total intrinsic value of options exercised was approximately $1.3 million and $8.8million for the three and nine months ended September 30, 2019, respectively, and approximately $2.7 million and $6.5 million for the three and nine monthsended September 30, 2018, respectively.
There was approximately $1.8 million in unrecognized compensation expense related to options expected to vest as of September 30, 2019. This cost is expected tobe recognized on a straight-line basis over a weighted average period of 1.3 years. We recorded approximately $2.1 million in non-cash compensation expenserelated to options granted that were expected to vest as of September 30, 2019. We received approximately $1.8 million and $11.3 million in cash from theexercise of options for the three and nine months ended September 30, 2019, respectively.
There was approximately $4.3 million in unrecognized compensation expense related to options expected to vest as of September 30, 2018. This cost was expectedto be recognized on a straight-line basis over a weighted average period of 3.0 years. We recorded approximately $4.7 million in non-cash compensation expenserelated to options granted that were expected to vest as of September 30, 2018. We received approximately $3.2 million and $9.5 million in cash from the exerciseof options for the three and nine months ended September 30, 2018, respectively.
Restricted Stock Awards
The following table presents our time-based restricted stock activity for the nine months ended September 30, 2019:
Shares Outstanding (in thousands)
Weighted Average Grant Date Fair Value
(per share)Outstanding, December 31, 2018 8 $ 6.66 Granted — $ — Vested (8) $ 6.66 Forfeited — $ —
Outstanding, September 30, 2019 — $ —
There were no shares of restricted stock granted for the three and nine months ended September 30, 2019 and 2018. The total fair value of restricted stock vestedwas $55,478 for the nine months ended September 30, 2019 and $33,307 and $185,359 for the three and nine months ended September 30, 2018, respectively.
There was no remaining unrecognized compensation expense related to shares of restricted stock expected to vest as of September 30, 2019. During the ninemonths ended September 30, 2019, there were 8,330 shares of restricted stock that vested, and we recorded $48,203 in non-cash compensation expense related torestricted stock expected to vest.
32

There was approximately $0.1 million in unrecognized compensation expense related to shares of restricted stock expected to vest as of September 30, 2018. Thiscost was expected to be recognized on a straight-line basis over a weighted average period of 0.3 years. During the nine months ended September 30, 2018, therewere 27,003 shares of restricted stock that vested, and we recorded $0.4 million in non-cash compensation expense related to the restricted stock expected to vest.
Restricted Stock Units
The fair value of each RSU grant is based on the market value of our common stock at the time of grant.
The time-based RSUs vest at a rate of 25% per year on each of the first four anniversaries of the grant dates.
The performance-based RSUs granted during the nine months ended September 30, 2019 will be evaluated by the Compensation Committee of our Board ofDirectors after a performance period, beginning on the date of grant through December 31, 2021, based on certain revenue and free cash flow growth rate metrics,with achievement of each measure to be determined independently of one another. If the performance criteria of the metrics are approved, the eligible awards willbecome vested on the third anniversary of the grant dates.
The time-based RSUs granted during the nine months ended September 30, 2019 to independent members of our Board of Directors vest in equal installments oneach of the first three anniversary dates of the grant date and settle on the earliest of the following events: (a) May 1, 2029; (b) death; (c) the occurrence of aChange in Control (as defined in the Amended and Restated 2014 Plan), subject to qualifying conditions; or (d) the date that is six months following the separationfrom service, subject to qualifying conditions.
The performance-based RSUs granted during the nine months ended September 30, 2018 will be evaluated by the Compensation Committee of our Board ofDirectors after a performance period, beginning on the date of grant through December 31, 2020, based on certain revenue and Adjusted EBITDA growth ratemetrics, with achievement of each measure to be determined independently of one another. If the performance criteria of the metrics are approved, the eligibleawards will become vested on the third anniversary of the grant dates.
The time-based RSUs granted during the nine months ended September 30, 2018 to independent members of our Board of Directors vest in equal installments oneach of the first three anniversary dates of the grant date and settle on the earliest of the following events: (a) March 7, 2028; (b) death; (c) the occurrence of aChange in Control (as defined in the Amended and Restated 2014 Plan), subject to qualifying conditions; or (d) the date that is six months following the separationfrom service, subject to qualifying conditions.
The following table presents our RSU awards activity for the nine months ended September 30, 2019:
Shares Outstanding
(in thousands)
Weighted Average Grant Date Fair Value
(per share)
Weighted Average Life Remaining
(years)
Aggregate Intrinsic Value (in thousands)
Outstanding, December 31, 2018 1,797 $ 7.49 2.0 $ 9,254 Granted 1,976 $ 10.17 Vested (288) $ 7.44 Forfeited (79) $ 8.54
Outstanding, September 30, 2019 3,406 $ 9.02 1.9 $ 28,812 Vested and expected to vest, September 30, 2019 2,334 $ 8.97 1.8 $ 19,743
There were approximately 2.0 million and 1.9 million shares of the RSU awards granted for the nine months ended September 30, 2019 and 2018, respectively.There were approximately 0.3 million RSU awards that vested during the nine months ended September 30, 2019 and no shares that vested during the nine monthsended September 30, 2018.
There was approximately $15.3 million and $7.3 million in unrecognized compensation expense related to RSU awards expected to vest as of September 30, 2019and 2018, respectively. This cost is expected to be recognized on a straight-line basis over a weighted average period of 2.7 years and 3.2 years as of September 30,2019 and 2018, respectively. We recorded approximately $4.0 million and $1.0 million in non-cash compensation expense related to the RSU awards during thenine months ended September 30, 2019 and 2018, respectively.
33

17. INCOME TAXES
The income tax benefit reflected an effective income tax rate of negative 16.5% and negative 15.3% for the three and nine months ended September 30, 2019,respectively, which was less than the statutory federal rate of 21.0%, primarily due to a decrease in our valuation allowance for deferred tax assets and the benefitfrom a research credit. The decrease in our valuation allowance is primarily due to the book income during the year and certain indefinite lived deferred tax assetswhich can be offset against our indefinite lived deferred tax liabilities. The income tax benefit reflected an effective income tax rate of negative 53.3% andnegative 39.5% for the three and nine months ended September 30, 2018, respectively, which was less than the statutory federal rate of 21.0%, primarily due to adecrease in our valuation allowance for deferred tax assets, and the benefit from a research credit.
We have analyzed filing positions in all of the federal, state and foreign jurisdictions where we are required to file income tax returns, as well as all open tax yearsin these jurisdictions. As of September 30, 2019, we recorded approximately $1.1 million of unrecognized tax benefits, all of which would impact our effective taxrate, if recognized. We do not anticipate that our unrecognized tax benefits will materially change within the next 12 months. We have not accrued any penaltiesand interest for our unrecognized tax benefits. Other than the unrecognized tax benefit recorded, we believe that our income tax filing positions and deductions willbe sustained upon audit, and we do not anticipate any other adjustments that will result in a material change to our financial position. We may, from time to time,be assessed interest or penalties by tax jurisdictions, although any such assessments historically have been minimal and immaterial to our financial results. Ourpolicy for recording interest and penalties associated with audits and unrecognized tax benefits is to record such items as a component of income tax in ourStatements of Income.
18. SEGMENT INFORMATION
Operating segments are components of an enterprise about which separate financial information is available that is evaluated regularly by the chief operatingdecision-making group (the “CODM”). Our CODM consists of the Chief Executive Officer and the Chief Financial Officer. Our CODM allocates resources andmeasures profitability based on our operating segments, which are managed and reviewed separately, as each represents products and services that can be soldseparately to our customers. Our segments are monitored by management for performance against our internal forecasts.
We have reported our financial performance based on our segments in both the current and prior periods. Our CODM determined that our operating segments forconducting business are: (a) Games, and (b) FinTech:
• The Games segment provides solutions directly to gaming establishments to offer their patrons gaming entertainment- related experiences including:leased gaming equipment; sales of gaming equipment; gaming systems; interactive solutions; and ancillary products and services.
• The FinTech segment provides solutions directly to gaming establishments to offer their patrons cash access-related services and products, including:access to cash at gaming facilities via ATM cash withdrawals; credit card cash access transactions and POS debit card cash access transactions; check-related services; kiosks for cash access and other services; self-service enrollment, player loyalty and marketing equipment; maintenance services;compliance, audit, and data software; casino credit data and reporting services, and other ancillary offerings.
Corporate overhead expenses have been allocated to the segments either through specific identification or based on a reasonable methodology. In addition, werecord depreciation and amortization expenses to the business segments.
Our business is predominantly domestic with no specific regional concentrations and no significant assets in foreign locations.
34
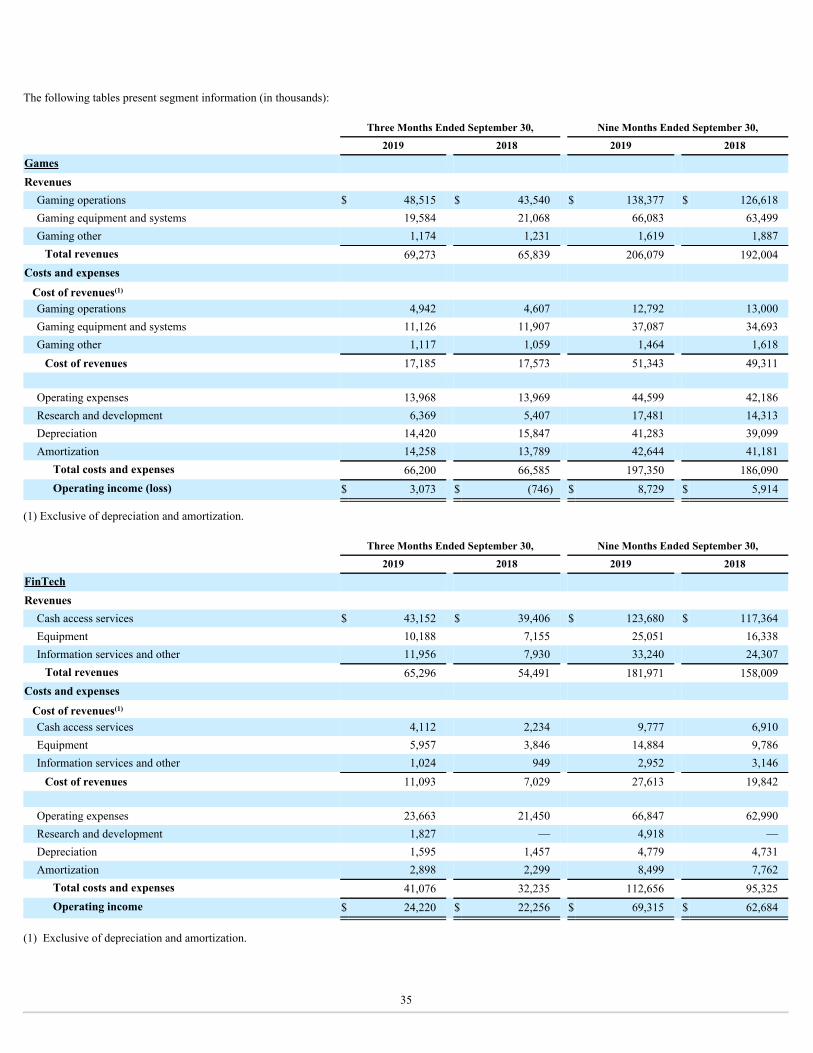
The following tables present segment information (in thousands):
Three Months Ended September 30, Nine Months Ended September 30,
2019 2018 2019 2018
Games Revenues Gaming operations $ 48,515 $ 43,540 $ 138,377 $ 126,618 Gaming equipment and systems 19,584 21,068 66,083 63,499 Gaming other 1,174 1,231 1,619 1,887
Total revenues 69,273 65,839 206,079 192,004 Costs and expenses
Cost of revenues(1) Gaming operations 4,942 4,607 12,792 13,000 Gaming equipment and systems 11,126 11,907 37,087 34,693 Gaming other 1,117 1,059 1,464 1,618
Cost of revenues 17,185 17,573 51,343 49,311
Operating expenses 13,968 13,969 44,599 42,186 Research and development 6,369 5,407 17,481 14,313 Depreciation 14,420 15,847 41,283 39,099 Amortization 14,258 13,789 42,644 41,181
Total costs and expenses 66,200 66,585 197,350 186,090 Operating income (loss) $ 3,073 $ (746) $ 8,729 $ 5,914
(1) Exclusive of depreciation and amortization.
Three Months Ended September 30, Nine Months Ended September 30,
2019 2018 2019 2018
FinTech Revenues Cash access services $ 43,152 $ 39,406 $ 123,680 $ 117,364 Equipment 10,188 7,155 25,051 16,338 Information services and other 11,956 7,930 33,240 24,307
Total revenues 65,296 54,491 181,971 158,009 Costs and expenses
Cost of revenues(1) Cash access services 4,112 2,234 9,777 6,910 Equipment 5,957 3,846 14,884 9,786 Information services and other 1,024 949 2,952 3,146
Cost of revenues 11,093 7,029 27,613 19,842
Operating expenses 23,663 21,450 66,847 62,990 Research and development 1,827 — 4,918 — Depreciation 1,595 1,457 4,779 4,731 Amortization 2,898 2,299 8,499 7,762
Total costs and expenses 41,076 32,235 112,656 95,325 Operating income $ 24,220 $ 22,256 $ 69,315 $ 62,684
(1) Exclusive of depreciation and amortization.
35
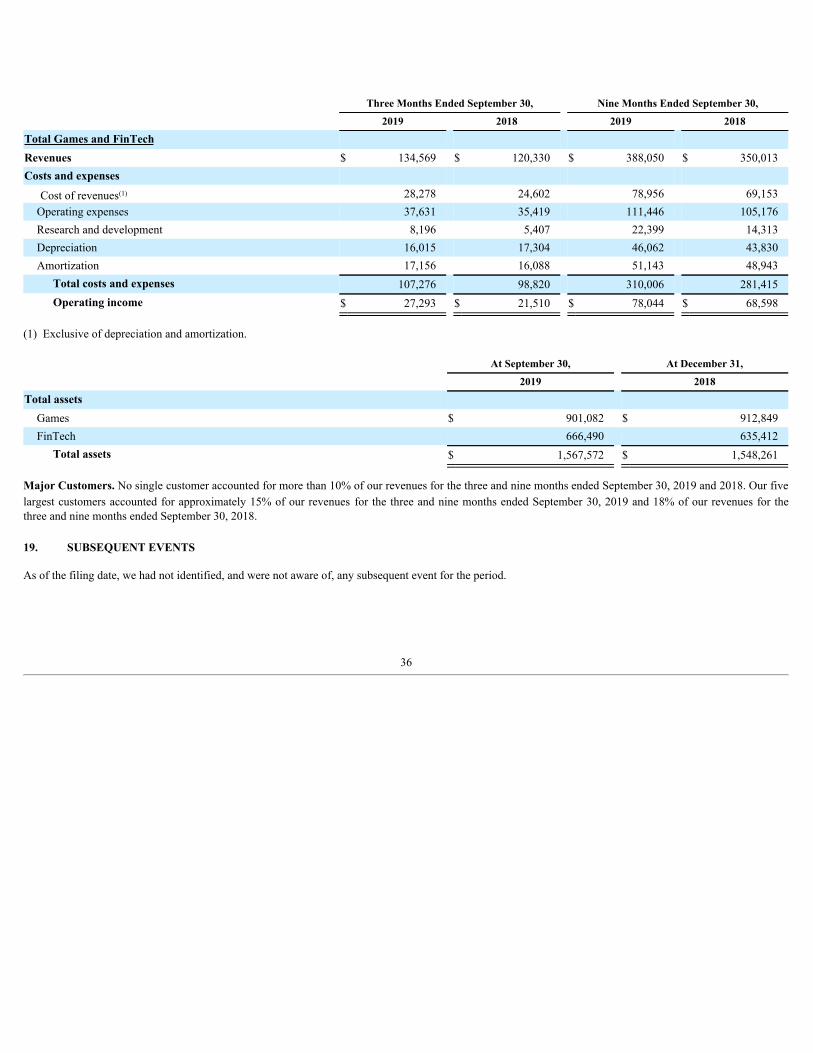
Three Months Ended September 30, Nine Months Ended September 30,
2019 2018 2019 2018
Total Games and FinTech Revenues $ 134,569 $ 120,330 $ 388,050 $ 350,013 Costs and expenses
Cost of revenues(1) 28,278 24,602 78,956 69,153 Operating expenses 37,631 35,419 111,446 105,176 Research and development 8,196 5,407 22,399 14,313 Depreciation 16,015 17,304 46,062 43,830 Amortization 17,156 16,088 51,143 48,943
Total costs and expenses 107,276 98,820 310,006 281,415 Operating income $ 27,293 $ 21,510 $ 78,044 $ 68,598
(1) Exclusive of depreciation and amortization.
At September 30, At December 31,
2019 2018
Total assets Games $ 901,082 $ 912,849 FinTech 666,490 635,412
Total assets $ 1,567,572 $ 1,548,261
Major Customers. No single customer accounted for more than 10% of our revenues for the three and nine months ended September 30, 2019 and 2018. Our fivelargest customers accounted for approximately 15% of our revenues for the three and nine months ended September 30, 2019 and 18% of our revenues for thethree and nine months ended September 30, 2018.
19. SUBSEQUENT EVENTS
As of the filing date, we had not identified, and were not aware of, any subsequent event for the period.
36
Item 2. Management’s Discussion and Analysis of Financial Condition and Results of Operations.
In this filing, we refer to: (a) our unaudited condensed consolidated financial statements and notes thereto as our “Financial Statements,” (b) our UnauditedCondensed Consolidated Statements of Income and Comprehensive Income as our “Statements of Income,” (c) our Unaudited Condensed Consolidated BalanceSheets as our “Balance Sheets,” and (d) our Management’s Discussion and Analysis of Financial Condition and Results of Operations as our “Results ofOperations.” Unless otherwise indicated, the terms the “Company,” “we,” “us” and “our” refer to Everi Holdings Inc. (“Everi Holdings,” “Holdings,” or“Everi”) together with its consolidated subsidiaries, including Everi Games Holding Inc. (“Everi Games Holding”), Everi Games Inc. (“Everi Games” or“Games”) and Everi Payments Inc. (“Everi FinTech” or “FinTech”).
Cautionary Information Regarding Forward-Looking Statements
The following Management’s Discussion and Analysis of Financial Condition and Results of Operations contains “forward-looking statements” as defined in theU.S. Private Securities Litigation Reform Act of 1995. In this context, forward-looking statements often address our expected future business and financialperformance, and often contain words such as “goal,” “target,” “future,” “estimate,” “expect,” “anticipate,” “intend,” “plan,” “believe,” “seek,” “project,” “may,”“should,” or “will” and similar expressions to identify forward-looking statements. These forward-looking statements are subject to additional risks anduncertainties, including those set forth under the heading “Risk Factors” and “Management’s Discussion and Analysis of Financial Condition and Results ofOperations” in our periodic reports filed with the Securities and Exchange Commission (the “SEC”), including, without limitation, our Annual Report on Form 10-K for the year ended December 31, 2018, and are based on information available to us on the date hereof. Such risks and uncertainties could cause actual results todiffer materially from those projected or assumed, including, but not limited to, the following: our ability to generate profits in the future and to create incrementalvalue for shareholders; our ability to execute on mergers, acquisitions and/or strategic alliances, including our ability to integrate and operate such acquisitionsconsistent with our forecasts in order to achieve future growth; our ability to execute on key initiatives and deliver ongoing improvements; expectations regardingdriving growth for the Company’s installed base and daily win per unit; expectations regarding placement fee arrangements; inaccuracies in underlying operatingassumptions; expectations regarding customers’ preferences and demands for future product and service offerings; the overall growth of the gaming industry, ifany; our ability to replace revenue associated with terminated contracts; margin degradation from contract renewals; our ability to comply with the Europay,MasterCard, and Visa global standard for cards equipped with security chip technology; our ability to successfully introduce new products and services, includingthird-party licensed content; gaming establishment and patron preferences; failure to control product development costs and create successful new products;anticipated sales performance; our ability to prevent, mitigate, or timely recover from cybersecurity breaches, attacks, and compromises; national and internationaleconomic and industry conditions; changes in gaming regulatory, card association, and statutory requirements; regulatory and licensing difficulties; competitivepressures and changes in the competitive environment; operational limitations; gaming market contraction; changes to tax laws; uncertainty of litigation outcomes;interest rate fluctuations; business prospects; unanticipated expenses or capital needs; technological obsolescence and our ability to adapt to evolving technologies;our ability to comply with our debt covenants and service outstanding debt; employee turnover, and other statements that are not historical facts. If any of theseassumptions prove to be incorrect, the results contemplated by the forward-looking statements regarding our future results of operations are unlikely to be realized.
These cautionary statements qualify our forward-looking statements, and you are cautioned not to place undue reliance on these forward-looking statements. Anyforward-looking statement contained herein speaks only as of the date on which it is made, and we do not intend, and assume no obligation, to update or revise anyforward-looking statements, whether as a result of new information, future events, or otherwise.
This Quarterly Report on Form 10-Q should be read in conjunction with our Annual Report on Form 10-K for the fiscal year ended December 31, 2018 and theinformation included in our other press releases, reports, and other filings with the SEC. Understanding the information contained in these filings is important inorder to fully understand our reported financial results and our business outlook for future periods.
Overview
Everi is a leading supplier of entertainment and technology solutions for the casino, interactive, and gaming industry. With a focus on both customers and players,Everi develops games and gaming machines, gaming systems and services, and is the provider of core financial products and services, player loyalty tools andapplications, and intelligence and regulatory compliance solutions. Everi’s mission is to provide casino operators with games that facilitate memorable playerexperiences, offer secure financial transactions for casinos and their patrons, and deliver software tools and applications to improve casino operations efficienciesand fulfill regulatory compliance requirements.
37

Everi Holdings reports its results of operations based on two operating segments: Games and FinTech.
Everi Games provides gaming operators products and services, including: (a) gaming machines primarily comprised of Class II and Class III slot machines placedunder participation or fixed fee lease arrangements or sold to casino customers, including TournEvent® terminals that allow operators to switch from in-revenuegaming to out-of-revenue tournaments; (b) system software, licenses, and ancillary equipment; and (c) business-to-consumer and business-to-business interactiveactivities. In addition, Everi Games develops and manages the central determinant system for the video lottery terminals (“VLTs”) installed in the State of NewYork, and it also provides similar technology in certain tribal jurisdictions.
Everi FinTech provides gaming operators cash access and related products and services, including: (a) access to cash at gaming facilities via Automated TellerMachine (“ATM”) cash withdrawals, credit card cash access transactions, point of sale (“POS”) debit card cash access transactions, and check verification andwarranty services; (b) equipment that provides cash access and efficiency-related services; (c) self-service enrollment, player loyalty and marketing equipment; (d)products and services that improve credit decision making, automate cashier operations, and enhance patron marketing activities for gaming establishments; (e)compliance, audit, and data solutions; and (f) online payment processing solutions for gaming operators in states that offer intrastate, Internet-based gaming andlottery activities.
Trends and Developments Impacting our Business
The key trends, developments, and challenges facing us were disclosed in our Annual Report on Form 10-K for the fiscal year ended December 31, 2018. Exceptas discussed herein, during the three and nine months ended September 30, 2019, there have been no significant changes in these trends, other than the acquisitionof certain assets of Atrient as described in “Note 4 — Business Combinations” in Part I, Item 1: Financial Statements. For further information, refer to Item 7,“Management’s Discussion and Analysis of Financial Condition and Results of Operations — Trends and Developments Impacting our Business” in our AnnualReport on Form 10-K for our fiscal year ended December 31, 2018, which is incorporated herein by reference.
Impact of ASC Topic 842 on the Comparability of Our Results of Operations
For a detailed discussion of the impact of adopting Accounting Standards Codification Topic 842 Leases (“ASC 842”), refer to “Note 2 — Basis of Presentationand Summary of Significant Accounting Policies” and “Note 3 — Leases” in Part I, Item 1: Financial Statements, which assesses the impact on our FinancialStatements of ASC 842, which applies to us as of January 1, 2019. We determined that the adoption of ASC 842 had a material impact on our Balance Sheets withthe recognition of right-of-use (“ROU”) assets and lease liabilities of operating leases; however, the standard did not have a material impact on our Statements ofIncome.
Operating Segments
We report our financial performance based on two operating segments: (a) Games; and (b) FinTech. For additional information on our segments, see “Note 2 —Basis of Presentation and Summary of Significant Accounting Policies” and “Note 18 — Segment Information” included in Part I, Item 1: Financial Statements ofthis Quarterly Report on Form 10-Q.
38

Results of Operations
Three months ended September 30, 2019 compared to three months ended September 30, 2018
The following table presents our Results of Operations as reported for the three months ended September 30, 2019 compared to the three months endedSeptember 30, 2018 (amounts in thousands)*:
Three Months Ended
September 30, 2019 September 30, 2018 2019 vs 2018 $ % $ % $ %
Revenues Games revenues Gaming operations $ 48,515 36 % $ 43,540 36 % $ 4,975 11 %Gaming equipment and systems 19,584 14 % 21,068 18 % (1,484) (7)%Gaming other 1,174 1 % 1,231 1 % (57) (5)%
Games total revenues 69,273 51 % 65,839 55 % 3,434 5 %FinTech revenues Cash access services 43,152 32 % 39,406 32 % 3,746 10 %Equipment 10,188 8 % 7,155 6 % 3,033 42 %Information services and other 11,956 9 % 7,930 7 % 4,026 51 %
FinTech total revenues 65,296 49 % 54,491 45 % 10,805 20 %Total revenues 134,569 100 % 120,330 100 % 14,239 12 %Costs and expenses
Games cost of revenues(1) Gaming operations 4,942 4 % 4,607 4 % 335 7 %Gaming equipment and systems 11,126 8 % 11,907 10 % (781) (7)%Gaming other 1,117 1 % 1,059 1 % 58 5 %
Games total cost of revenues 17,185 13 % 17,573 15 % (388) (2)%FinTech cost of revenues(1) Cash access services 4,112 3 % 2,234 2 % 1,878 84 %Equipment 5,957 4 % 3,846 3 % 2,111 55 %Information services and other 1,024 1 % 949 1 % 75 8 %
FinTech total cost of revenues 11,093 8 % 7,029 6 % 4,064 58 %Operating expenses 37,631 28 % 35,419 29 % 2,212 6 %Research and development 8,196 6 % 5,407 4 % 2,789 52 %Depreciation 16,015 12 % 17,304 14 % (1,289) (7)%Amortization 17,156 13 % 16,088 14 % 1,068 7 %
Total costs and expenses 107,276 80 % 98,820 82 % 8,456 9 %Operating income 27,293 20 % 21,510 18 % 5,783 27 %Other expenses Interest expense, net of interest income 19,297 14 % 20,160 17 % (863) (4)%
Total other expenses 19,297 14 % 20,160 17 % (863) (4)%Income before income tax 7,996 6 % 1,350 1 % 6,646 492 %
(1) Exclusive of depreciation and amortization.
* Rounding may cause variances.
39

Three Months Ended
September 30, 2019 September 30, 2018 2019 vs 2018
$ % $ % $ %
Income tax benefit (1,319) (1)% (719) (1)% (600) 83 %Net income $ 9,315 7 % $ 2,069 2 % $ 7,246 350 %
* Rounding may cause variances.
Revenues
Total revenues increased by approximately $14.2 million, or 12%, to approximately $134.6 million for the three months ended September 30, 2019, as compared tothe same period in the prior year. This was primarily due to the higher Games and FinTech revenues described below.
Games revenues increased by approximately $3.4 million, or 5%, to approximately $69.3 million for the three months ended September 30, 2019, as compared tothe same period in the prior year. This was primarily due to an increase in the average daily win per unit on the installed base of leased gaming machines and anincrease in our interactive revenues, partially offset by a decline in revenue from the sale of gaming machines.
FinTech revenues increased by approximately $10.8 million, or 20%, to approximately $65.3 million for the three months ended September 30, 2019, as comparedto the same period in the prior year. This was primarily due to increased equipment revenues and information services and other revenues, which included revenuesfrom our player loyalty operations of approximately $4.6 million, which were acquired in March of this year, as well as higher dollar and transaction volumes fromcash access services.
Costs and Expenses
Total costs and expenses increased by approximately $8.5 million, or 9%, to approximately $107.3 million for the three months ended September 30, 2019, ascompared to the same period in the prior year. This was primarily due to the changes in Games and FinTech costs and expenses described below.
Games cost of revenues decreased by approximately $0.4 million, or 2%, to approximately $17.2 million for the three months ended September 30, 2019, ascompared to the same period in the prior year. This was primarily due to the lower sales of gaming equipment during the period, partially offset by variable costincreases related to the higher gaming operations revenue.
FinTech cost of revenues increased by approximately $4.1 million, or 58%, to approximately $11.1 million for the three months ended September 30, 2019, ascompared to the same period in the prior year. This was primarily due to the costs associated with the increase in equipment sales and an increase in checkwarranty expense related to check warranty cash access services.
Operating expenses increased by approximately $2.2 million, or 6%, to approximately $37.6 million for the three months ended September 30, 2019, as comparedto the same period in the prior year. This was primarily driven by the operating expenses associated with the player loyalty operations and a reduction to the priorperiod’s operating expenses due to the Resort Advantage acquisition earn out liability adjustment related to our FinTech segment.
Research and development costs increased by approximately $2.8 million, or 52%, to approximately $8.2 million for the three months ended September 30, 2019,as compared to the same period in the prior year. This was primarily due to research and development costs incurred by our FinTech segment and a reduction incapitalized research and development costs within our Games segment.
Depreciation decreased by approximately $1.3 million, or 7%, to approximately $16.0 million for the three months ended September 30, 2019, as compared to thesame period in the prior year. This was primarily associated with certain of the fixed assets related to our Games segment becoming fully depreciated.
Amortization increased by approximately $1.1 million, or 7%, to approximately $17.2 million for the three months ended September 30, 2019, as compared to thesame period in the prior year. The increase was primarily due to the amortization of the intangible assets in connection with the player loyalty business for ourFinTech segment and release of new game themes for our Games segment.
Primarily as a result of the factors described above, operating income increased by approximately $5.8 million, or 27%, to approximately $27.3 million for thethree months ended September 30, 2019, as compared to the same period in the prior year.
40

The operating margin was 20% for the three months ended September 30, 2019 compared to 18% for the same period in the prior year.
Interest expense, net of interest income, decreased by approximately $0.9 million, or 4%, to approximately $19.3 million for the three months ended September 30,2019, as compared to the same period in the prior year. This was primarily due to higher interest income during the period, partially offset by an increase in ourcash usage fees in connection with our commercial cash arrangements.
Income tax benefit increased by approximately $0.6 million, or 83%, to approximately $1.3 million for the three months ended September 30, 2019, as comparedto the same period in the prior year. The income tax benefit reflected an effective income tax rate of negative 16.5% for the three months ended September 30,2019, which was less than the statutory federal rate of 21.0%, primarily due to a decrease in our valuation allowance for deferred tax assets and the benefit from aresearch credit. The decrease in our valuation allowance is primarily due to the current quarter book income and certain indefinite lived deferred tax assets, whichcan be offset against our indefinite lived deferred tax liabilities. The income tax benefit reflected an effective income tax rate of negative 53.3% for the sameperiod in the prior year, which was less than the statutory federal rate of 21.0%, primarily due to a decrease in our valuation allowance for deferred tax assets andthe benefit from a research credit.
Primarily as a result of the foregoing, net income increased by approximately $7.2 million, or 350%, to approximately $9.3 million and diluted earnings per share(“EPS”) increased by $0.09, or 300%, to $0.12 for the three months ended September 30, 2019, as compared to the same period in the prior year.
41
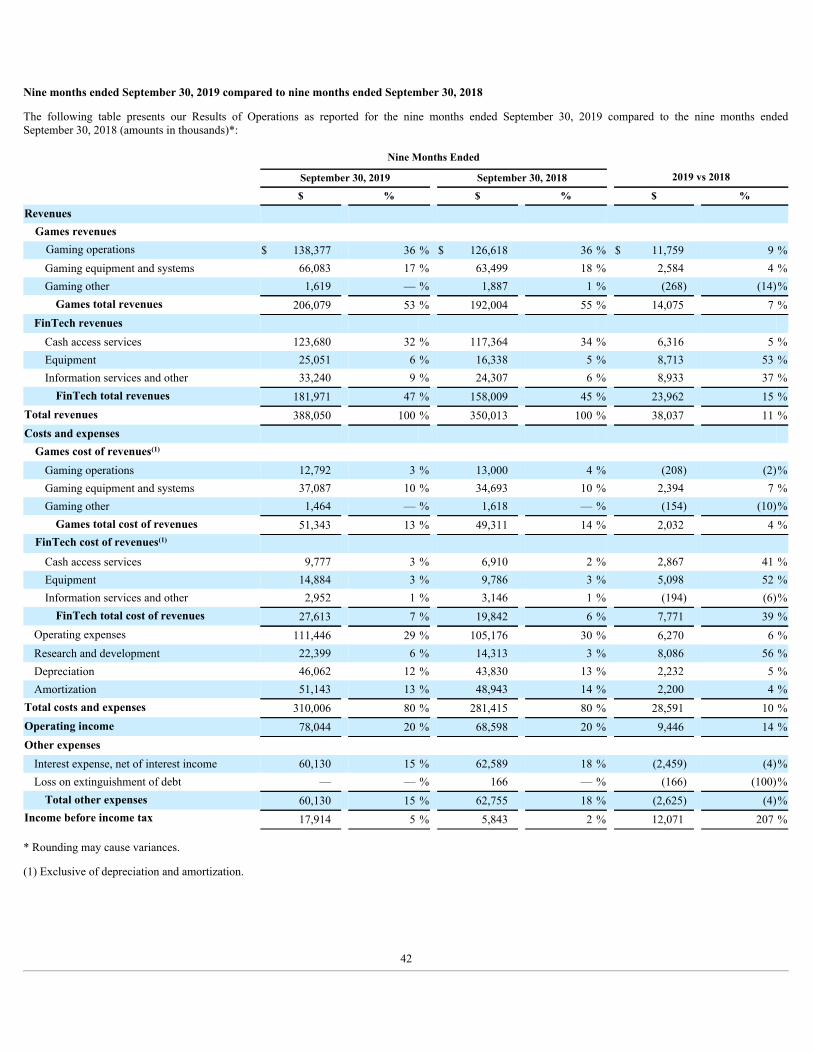
Nine months ended September 30, 2019 compared to nine months ended September 30, 2018
The following table presents our Results of Operations as reported for the nine months ended September 30, 2019 compared to the nine months endedSeptember 30, 2018 (amounts in thousands)*:
Nine Months Ended
September 30, 2019 September 30, 2018 2019 vs 2018 $ % $ % $ %
Revenues Games revenues Gaming operations $ 138,377 36 % $ 126,618 36 % $ 11,759 9 %Gaming equipment and systems 66,083 17 % 63,499 18 % 2,584 4 %Gaming other 1,619 — % 1,887 1 % (268) (14)%
Games total revenues 206,079 53 % 192,004 55 % 14,075 7 %FinTech revenues Cash access services 123,680 32 % 117,364 34 % 6,316 5 %Equipment 25,051 6 % 16,338 5 % 8,713 53 %Information services and other 33,240 9 % 24,307 6 % 8,933 37 %
FinTech total revenues 181,971 47 % 158,009 45 % 23,962 15 %Total revenues 388,050 100 % 350,013 100 % 38,037 11 %Costs and expenses
Games cost of revenues(1) Gaming operations 12,792 3 % 13,000 4 % (208) (2)%Gaming equipment and systems 37,087 10 % 34,693 10 % 2,394 7 %Gaming other 1,464 — % 1,618 — % (154) (10)%
Games total cost of revenues 51,343 13 % 49,311 14 % 2,032 4 %FinTech cost of revenues(1) Cash access services 9,777 3 % 6,910 2 % 2,867 41 %Equipment 14,884 3 % 9,786 3 % 5,098 52 %Information services and other 2,952 1 % 3,146 1 % (194) (6)%
FinTech total cost of revenues 27,613 7 % 19,842 6 % 7,771 39 %Operating expenses 111,446 29 % 105,176 30 % 6,270 6 %Research and development 22,399 6 % 14,313 3 % 8,086 56 %Depreciation 46,062 12 % 43,830 13 % 2,232 5 %Amortization 51,143 13 % 48,943 14 % 2,200 4 %
Total costs and expenses 310,006 80 % 281,415 80 % 28,591 10 %Operating income 78,044 20 % 68,598 20 % 9,446 14 %Other expenses Interest expense, net of interest income 60,130 15 % 62,589 18 % (2,459) (4)%Loss on extinguishment of debt — — % 166 — % (166) (100)%
Total other expenses 60,130 15 % 62,755 18 % (2,625) (4)%Income before income tax 17,914 5 % 5,843 2 % 12,071 207 %
* Rounding may cause variances.
(1) Exclusive of depreciation and amortization.
42
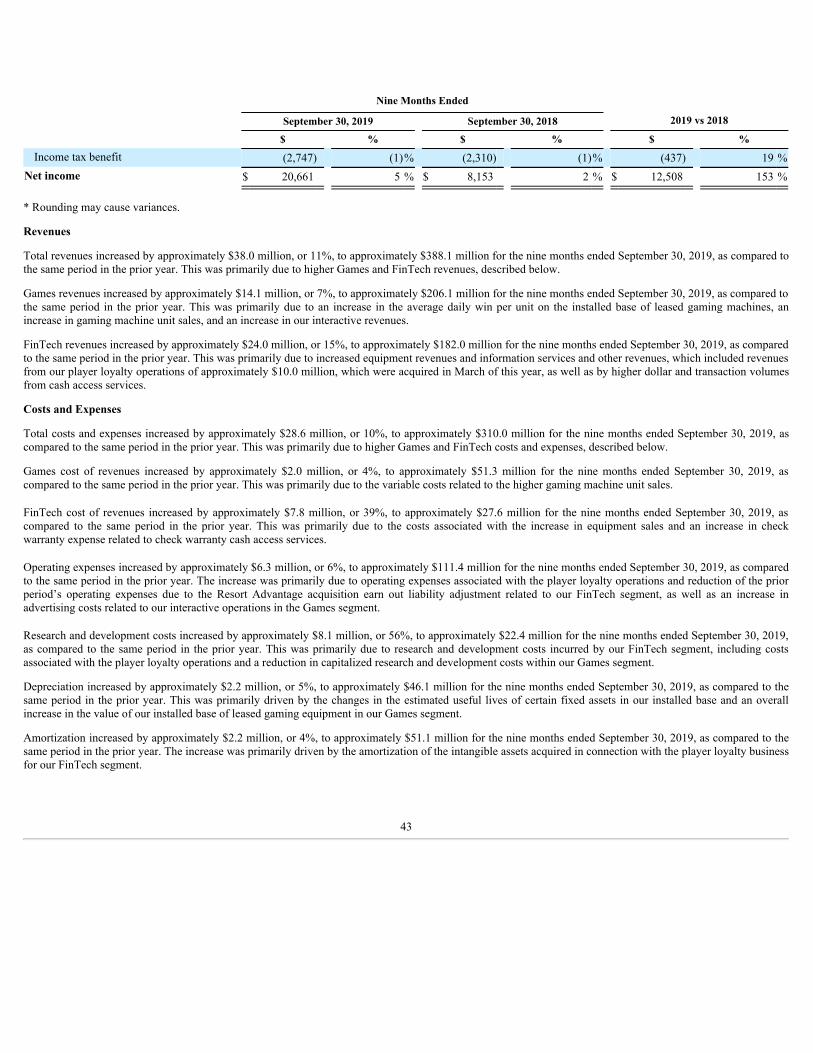
Nine Months Ended
September 30, 2019 September 30, 2018 2019 vs 2018 $ % $ % $ %
Income tax benefit (2,747) (1)% (2,310) (1)% (437) 19 %Net income $ 20,661 5 % $ 8,153 2 % $ 12,508 153 %
* Rounding may cause variances.
Revenues
Total revenues increased by approximately $38.0 million, or 11%, to approximately $388.1 million for the nine months ended September 30, 2019, as compared tothe same period in the prior year. This was primarily due to higher Games and FinTech revenues, described below.
Games revenues increased by approximately $14.1 million, or 7%, to approximately $206.1 million for the nine months ended September 30, 2019, as compared tothe same period in the prior year. This was primarily due to an increase in the average daily win per unit on the installed base of leased gaming machines, anincrease in gaming machine unit sales, and an increase in our interactive revenues.
FinTech revenues increased by approximately $24.0 million, or 15%, to approximately $182.0 million for the nine months ended September 30, 2019, as comparedto the same period in the prior year. This was primarily due to increased equipment revenues and information services and other revenues, which included revenuesfrom our player loyalty operations of approximately $10.0 million, which were acquired in March of this year, as well as by higher dollar and transaction volumesfrom cash access services.
Costs and Expenses
Total costs and expenses increased by approximately $28.6 million, or 10%, to approximately $310.0 million for the nine months ended September 30, 2019, ascompared to the same period in the prior year. This was primarily due to higher Games and FinTech costs and expenses, described below.
Games cost of revenues increased by approximately $2.0 million, or 4%, to approximately $51.3 million for the nine months ended September 30, 2019, ascompared to the same period in the prior year. This was primarily due to the variable costs related to the higher gaming machine unit sales.
FinTech cost of revenues increased by approximately $7.8 million, or 39%, to approximately $27.6 million for the nine months ended September 30, 2019, ascompared to the same period in the prior year. This was primarily due to the costs associated with the increase in equipment sales and an increase in checkwarranty expense related to check warranty cash access services.
Operating expenses increased by approximately $6.3 million, or 6%, to approximately $111.4 million for the nine months ended September 30, 2019, as comparedto the same period in the prior year. The increase was primarily due to operating expenses associated with the player loyalty operations and reduction of the priorperiod’s operating expenses due to the Resort Advantage acquisition earn out liability adjustment related to our FinTech segment, as well as an increase inadvertising costs related to our interactive operations in the Games segment.
Research and development costs increased by approximately $8.1 million, or 56%, to approximately $22.4 million for the nine months ended September 30, 2019,as compared to the same period in the prior year. This was primarily due to research and development costs incurred by our FinTech segment, including costsassociated with the player loyalty operations and a reduction in capitalized research and development costs within our Games segment.
Depreciation increased by approximately $2.2 million, or 5%, to approximately $46.1 million for the nine months ended September 30, 2019, as compared to thesame period in the prior year. This was primarily driven by the changes in the estimated useful lives of certain fixed assets in our installed base and an overallincrease in the value of our installed base of leased gaming equipment in our Games segment.
Amortization increased by approximately $2.2 million, or 4%, to approximately $51.1 million for the nine months ended September 30, 2019, as compared to thesame period in the prior year. The increase was primarily driven by the amortization of the intangible assets acquired in connection with the player loyalty businessfor our FinTech segment.
43

Primarily as a result of the factors described above, operating income increased by approximately $9.4 million, or 14%, to approximately $78.0 million for the ninemonths ended September 30, 2019, as compared to the same period in the prior year. Operating margin for the nine months ended September 30, 2019 remainedconsistent with the same period in the prior year at 20%.
Interest expense, net of interest income, decreased by approximately $2.5 million, or 4%, to approximately $60.1 million for the nine months ended September 30,2019, as compared to the same period in the prior year. This was primarily due to debt issuance costs of approximately $1.3 million paid in the prior year period inconnection with the debt repricing of our Term Loan Facility in 2018 and higher interest income earned during the period.
Income tax benefit increased by approximately $0.4 million, or 19%, to approximately $2.7 million for the nine months ended September 30, 2019, as compared tothe same period in the prior year. The income tax benefit reflected an effective income tax rate of negative 15.3% for the nine months ended September 30, 2019,which was less than the statutory federal rate of 21.0%, primarily due to a decrease in our valuation allowance for deferred tax assets and the benefit from aresearch credit. The decrease in our valuation allowance is primarily due to the current quarter book income and certain indefinite lived deferred tax assets, whichcan be offset against our indefinite lived deferred tax liabilities. The income tax benefit reflected an effective income tax rate of negative 39.5% for the sameperiod in the prior year, which was less than the statutory federal rate of 21.0%, primarily due to a decrease in our valuation allowance for deferred tax assets andthe benefit from a research credit.
Primarily as a result of the foregoing, net income increased by approximately $12.5 million, or 153%, to approximately $20.7 million and diluted EPS increased by$0.16, or 145%, to $0.27 for the nine months ended September 30, 2019, as compared to the same period in the prior year.
Critical Accounting Policies
The preparation of our financial statements in conformity with U.S. generally accepted accounting principles (“GAAP”) requires us to make estimates andassumptions that affect our reported amounts of assets and liabilities, revenues and expenses, and related disclosures of contingent assets and liabilities in ourFinancial Statements. The SEC has defined critical accounting policies as the ones that are most important to the portrayal of the financial condition and results ofoperations, and which require management to make its most difficult and subjective judgments, often as a result of the need to make estimates about matters thatare inherently uncertain.
For the three and nine months ended September 30, 2019, there were no significant changes to the critical accounting policies and estimates discussed in ouraudited Financial Statements included in our Annual Report on Form 10-K for the fiscal year ended December 31, 2018. Refer to Item 7, “Management’sDiscussion and Analysis of Financial Condition and Results of Operations - Critical Accounting Policies” in our Annual Report on Form 10-K for our fiscal yearended December 31, 2018, which is incorporated herein by reference.
Recent Accounting Guidance
For a description of our recently adopted accounting guidance and recent accounting guidance not yet adopted, see “Note 2 — Basis of Presentation and Summaryof Significant Accounting Policies — Recent Accounting Guidance” included in Part I, Item 1: Financial Statements of this Quarterly Report on Form 10-Q.
44
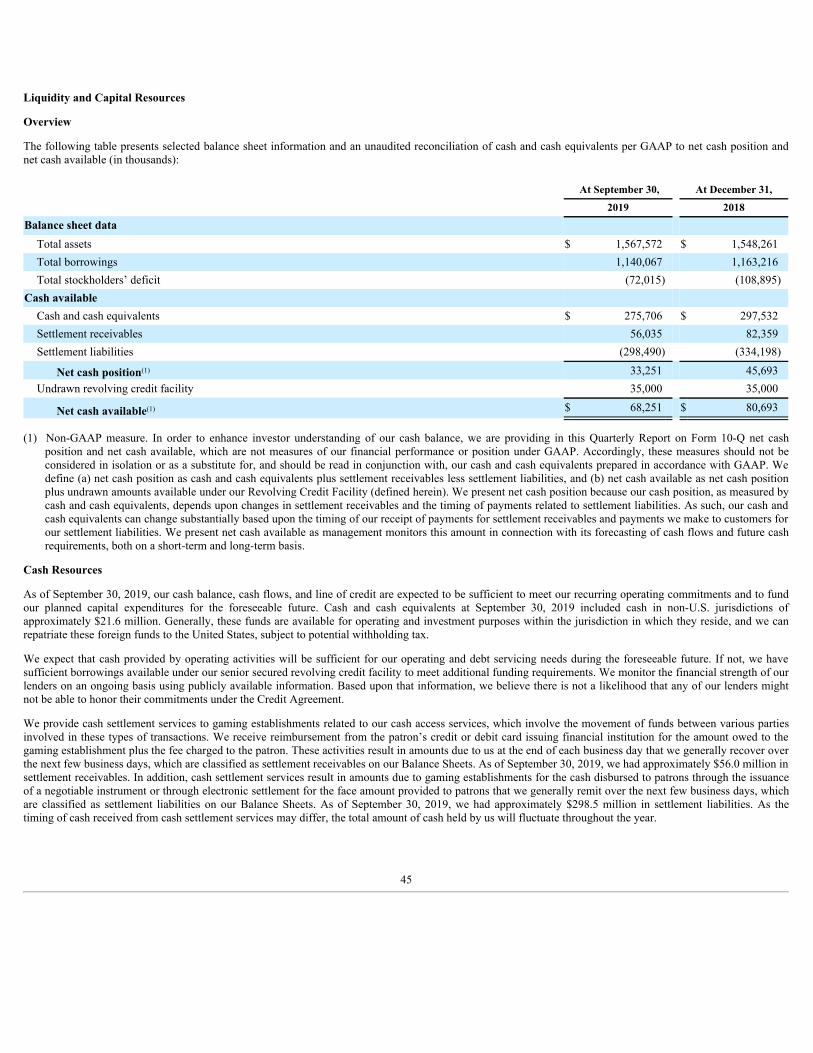
Liquidity and Capital Resources
Overview
The following table presents selected balance sheet information and an unaudited reconciliation of cash and cash equivalents per GAAP to net cash position andnet cash available (in thousands):
At September 30, At December 31,
2019 2018
Balance sheet data Total assets $ 1,567,572 $ 1,548,261 Total borrowings 1,140,067 1,163,216 Total stockholders’ deficit (72,015) (108,895)
Cash available Cash and cash equivalents $ 275,706 $ 297,532 Settlement receivables 56,035 82,359 Settlement liabilities (298,490) (334,198)
Net cash position(1) 33,251 45,693 Undrawn revolving credit facility 35,000 35,000
Net cash available(1) $ 68,251 $ 80,693
(1) Non-GAAP measure. In order to enhance investor understanding of our cash balance, we are providing in this Quarterly Report on Form 10-Q net cashposition and net cash available, which are not measures of our financial performance or position under GAAP. Accordingly, these measures should not beconsidered in isolation or as a substitute for, and should be read in conjunction with, our cash and cash equivalents prepared in accordance with GAAP. Wedefine (a) net cash position as cash and cash equivalents plus settlement receivables less settlement liabilities, and (b) net cash available as net cash positionplus undrawn amounts available under our Revolving Credit Facility (defined herein). We present net cash position because our cash position, as measured bycash and cash equivalents, depends upon changes in settlement receivables and the timing of payments related to settlement liabilities. As such, our cash andcash equivalents can change substantially based upon the timing of our receipt of payments for settlement receivables and payments we make to customers forour settlement liabilities. We present net cash available as management monitors this amount in connection with its forecasting of cash flows and future cashrequirements, both on a short-term and long-term basis.
Cash Resources
As of September 30, 2019, our cash balance, cash flows, and line of credit are expected to be sufficient to meet our recurring operating commitments and to fundour planned capital expenditures for the foreseeable future. Cash and cash equivalents at September 30, 2019 included cash in non-U.S. jurisdictions ofapproximately $21.6 million. Generally, these funds are available for operating and investment purposes within the jurisdiction in which they reside, and we canrepatriate these foreign funds to the United States, subject to potential withholding tax.
We expect that cash provided by operating activities will be sufficient for our operating and debt servicing needs during the foreseeable future. If not, we havesufficient borrowings available under our senior secured revolving credit facility to meet additional funding requirements. We monitor the financial strength of ourlenders on an ongoing basis using publicly available information. Based upon that information, we believe there is not a likelihood that any of our lenders mightnot be able to honor their commitments under the Credit Agreement.
We provide cash settlement services to gaming establishments related to our cash access services, which involve the movement of funds between various partiesinvolved in these types of transactions. We receive reimbursement from the patron’s credit or debit card issuing financial institution for the amount owed to thegaming establishment plus the fee charged to the patron. These activities result in amounts due to us at the end of each business day that we generally recover overthe next few business days, which are classified as settlement receivables on our Balance Sheets. As of September 30, 2019, we had approximately $56.0 million insettlement receivables. In addition, cash settlement services result in amounts due to gaming establishments for the cash disbursed to patrons through the issuanceof a negotiable instrument or through electronic settlement for the face amount provided to patrons that we generally remit over the next few business days, whichare classified as settlement liabilities on our Balance Sheets. As of September 30, 2019, we had approximately $298.5 million in settlement liabilities. As thetiming of cash received from cash settlement services may differ, the total amount of cash held by us will fluctuate throughout the year.
45
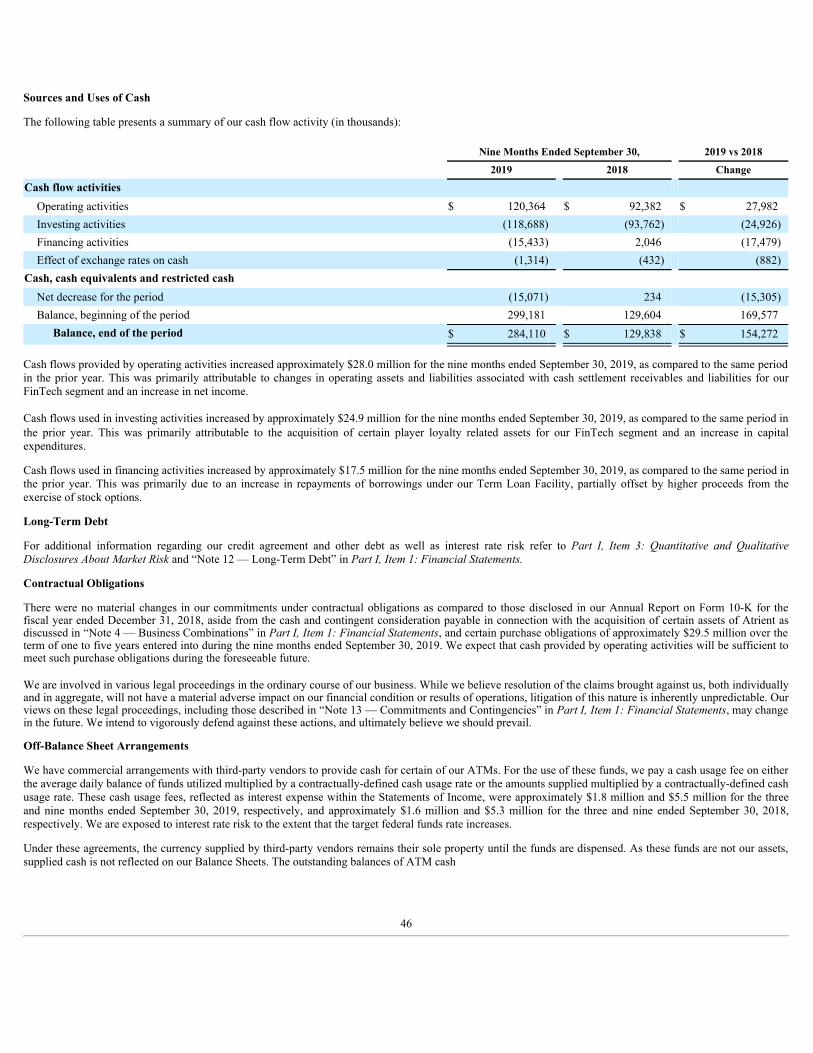
Sources and Uses of Cash
The following table presents a summary of our cash flow activity (in thousands):
Nine Months Ended September 30, 2019 vs 2018
2019 2018 Change
Cash flow activities Operating activities $ 120,364 $ 92,382 $ 27,982 Investing activities (118,688) (93,762) (24,926) Financing activities (15,433) 2,046 (17,479) Effect of exchange rates on cash (1,314) (432) (882)
Cash, cash equivalents and restricted cash Net decrease for the period (15,071) 234 (15,305) Balance, beginning of the period 299,181 129,604 169,577
Balance, end of the period $ 284,110 $ 129,838 $ 154,272
Cash flows provided by operating activities increased approximately $28.0 million for the nine months ended September 30, 2019, as compared to the same periodin the prior year. This was primarily attributable to changes in operating assets and liabilities associated with cash settlement receivables and liabilities for ourFinTech segment and an increase in net income.
Cash flows used in investing activities increased by approximately $24.9 million for the nine months ended September 30, 2019, as compared to the same period inthe prior year. This was primarily attributable to the acquisition of certain player loyalty related assets for our FinTech segment and an increase in capitalexpenditures.
Cash flows used in financing activities increased by approximately $17.5 million for the nine months ended September 30, 2019, as compared to the same period inthe prior year. This was primarily due to an increase in repayments of borrowings under our Term Loan Facility, partially offset by higher proceeds from theexercise of stock options.
Long-Term Debt
For additional information regarding our credit agreement and other debt as well as interest rate risk refer to Part I, Item 3: Quantitative and QualitativeDisclosures About Market Risk and “Note 12 — Long-Term Debt” in Part I, Item 1: Financial Statements.
Contractual Obligations
There were no material changes in our commitments under contractual obligations as compared to those disclosed in our Annual Report on Form 10-K for thefiscal year ended December 31, 2018, aside from the cash and contingent consideration payable in connection with the acquisition of certain assets of Atrient asdiscussed in “Note 4 — Business Combinations” in Part I, Item 1: Financial Statements, and certain purchase obligations of approximately $29.5 million over theterm of one to five years entered into during the nine months ended September 30, 2019. We expect that cash provided by operating activities will be sufficient tomeet such purchase obligations during the foreseeable future.
We are involved in various legal proceedings in the ordinary course of our business. While we believe resolution of the claims brought against us, both individuallyand in aggregate, will not have a material adverse impact on our financial condition or results of operations, litigation of this nature is inherently unpredictable. Ourviews on these legal proceedings, including those described in “Note 13 — Commitments and Contingencies” in Part I, Item 1: Financial Statements, may changein the future. We intend to vigorously defend against these actions, and ultimately believe we should prevail.
Off-Balance Sheet Arrangements
We have commercial arrangements with third-party vendors to provide cash for certain of our ATMs. For the use of these funds, we pay a cash usage fee on eitherthe average daily balance of funds utilized multiplied by a contractually-defined cash usage rate or the amounts supplied multiplied by a contractually-defined cashusage rate. These cash usage fees, reflected as interest expense within the Statements of Income, were approximately $1.8 million and $5.5 million for the threeand nine months ended September 30, 2019, respectively, and approximately $1.6 million and $5.3 million for the three and nine ended September 30, 2018,respectively. We are exposed to interest rate risk to the extent that the target federal funds rate increases.
Under these agreements, the currency supplied by third-party vendors remains their sole property until the funds are dispensed. As these funds are not our assets,supplied cash is not reflected on our Balance Sheets. The outstanding balances of ATM cash
46

utilized by us from the third-party vendors were approximately $189.6 million and $224.7 million as of September 30, 2019 and December 31, 2018, respectively.
Our primary commercial arrangement, the Contract Cash Solutions Agreement, as amended, with Wells Fargo Bank, N.A. provides us with cash in the maximumamount of $300 million with the ability to increase the amount by $75 million over a 5-day period for special occasions, such as the period around New Year’sDay. The agreement currently expires on June 30, 2022 and will automatically renew for additional one-year periods unless either party provides a 90-day writtennotice of its intent not to renew.
We are responsible for any losses of cash in the ATMs under this agreement, and we self-insure for this risk. We incurred no material losses related to this self-insurance for the three and nine months ended September 30, 2019 and 2018.
Effects of Inflation
Our monetary assets that primarily consist of cash, receivables, inventory, as well as our non-monetary assets that are mostly comprised of goodwill and otherintangible assets, are not significantly affected by inflation. We believe that replacement costs of equipment, furniture, and leasehold improvements will notmaterially affect our operations. However, the rate of inflation affects our operating expenses, such as those for salaries and benefits, armored carrier expenses,telecommunications expenses, and equipment repair and maintenance services, which may not be readily recoverable in the financial terms under which weprovide our Games and FinTech products and services to gaming establishments.
Item 3. Quantitative and Qualitative Disclosures About Market Risk.
In the normal course of business, we are exposed to foreign currency exchange risk. We operate and conduct business in foreign countries and, as a result, areexposed to movements in foreign currency exchange rates. Our exposure to foreign currency exchange risk related to our foreign operations is not material to ourresults of operations, cash flows, or financial condition. At present, we do not hedge this risk; however, we continue to evaluate such foreign currency translationexposure.
In the normal course of business, we have commercial arrangements with third-party vendors to provide cash for certain of our ATMs. Under the terms of theseagreements, we pay a monthly cash usage fee based upon the target federal funds rate. We are, therefore, exposed to interest rate risk to the extent that the targetfederal funds rate increases. The outstanding balance of ATM cash utilized by us from third-party vendors was approximately $189.6 million as of September 30,2019; therefore, each 100 basis points increase in the target federal funds rate would have approximately a $1.9 million impact on income before tax over a 12-month period.
The Credit Facilities bear interest at rates that can vary over time. We have the option of having interest on the outstanding amounts under the Credit Facilities paidusing a base rate or LIBOR. We have historically elected to pay interest based on LIBOR, and we expect to continue to do so for various maturities. The weightedaverage interest rate on the Credit Facilities was 5.25% and 5.41% for the three and nine months ended September 30, 2019, respectively. Based upon theoutstanding balance on the Credit Facilities of $782.0 million as of September 30, 2019, each 100 basis points increase in the applicable LIBOR would have an$7.8 million impact on interest expense over a 12-month period. The interest rate for the 7.50% Senior Unsecured Notes due 2025 is fixed; therefore, an increase inthe LIBOR rate does not impact the related interest expense. At present, we do not hedge the risk related to the changes in the interest rate; however, we continueto evaluate such interest rate exposure.
We continue to evaluate the potential impact of the eventual replacement of the LIBOR benchmark interest rate, which is set to phase out by the end of 2021.Although we are not able to predict what will become a widely accepted benchmark in place of LIBOR, or what the exact impact of such a possible transition tosuch benchmark may be on our business, financial condition, and results of operations, our current expectation is this transition will not have a material impact onour business or results of operations.
47

Item 4. Controls and Procedures.
Evaluation of Disclosure Controls and Procedures
Our management, including its Chief Executive Officer and Chief Financial Officer, has evaluated the effectiveness of our disclosure controls and procedures (assuch term is defined in Rules 13a-15(e) and 15d-15(e) under the Securities Exchange Act of 1934, as amended (the “Exchange Act”)) as of the end of the periodcovered by this report. Based on such evaluation, the Chief Executive Officer and Chief Financial Officer have concluded that our disclosure controls andprocedures are effective such that material information required to be disclosed by us in the reports that we file or submit under the Exchange Act is (a) recorded,processed, summarized and reported within the time periods specified by the SEC’s rules and forms, and (b) accumulated and communicated to management,including our principal executive officer and principal financial officer, as appropriate to allow timely decisions regarding required disclosure.
Changes in Internal Control over Financial Reporting during the Quarter Ended September 30, 2019
In connection with the adoption of ASC 842, we assessed the impact and applied changes to our internal control over financial reporting to update additionalcontrol procedures with respect to the preparation of our financial information.
Except as noted above, there were no changes in our internal control over financial reporting (as defined in Rules 13a-15(f) and 15d-15(f) under the Exchange Act)that occurred during the period covered by this report that have materially affected, or are reasonably likely to materially affect, our internal control over financialreporting.
48
PART II. OTHER INFORMATION
Item 1. Legal Proceedings.
We are involved in various legal proceedings in the ordinary course of our business. While we believe resolution of the claims brought against us, both individuallyand in aggregate, will not have a material adverse impact on our financial condition or results of operations, litigation of this nature is inherently unpredictable. Ourviews on these legal proceedings, including those described below, may change in the future. We intend to vigorously defend against these actions, and ultimatelybelieve we should prevail.
We evaluate matters and record an accrual for legal contingencies when it is both probable that a liability has been incurred and the amount or range of the loss canbe reasonably estimated in accordance with ASC 450. We evaluate legal contingencies at least quarterly and, as appropriate, establish new accruals or adjustexisting accruals to reflect: (1) the facts and circumstances known to us at the time, including information regarding negotiations, settlements, rulings, and otherrelevant events and developments; (2) the advice and analyses of counsel; and (3) the assumptions and judgment of management. Legal costs associated with ourlegal proceedings are expensed as incurred. We currently have no accrued liabilities for outstanding legal matters.
Given there are procedural, factual, and legal issues to be resolved that could significantly affect our assessment as to the probability of liability, we are not able toreasonably estimate the size or range of the possible loss, if any, with respect to these legal proceedings.
FACTA-related matters:
Oneeb Rehman, et. al. v. Everi Payments Inc. and Everi Holdings Inc., is a putative class action matter pending in the U.S. District Court for the Southern Districtof Florida, Ft. Lauderdale Division filed on October 16, 2018. The original defendant was dismissed and the Company was substituted as defendant on April 22,2019. Plaintiff, on behalf of himself and others similarly situated, alleges that Everi Payments Inc. (“Everi Payments”) and the Company have violated certainprovisions of the Fair and Accurate Credit Transactions Act (FACTA). Plaintiff seeks an award of statutory damages, attorney’s fees, and costs.Mat Jessop, et. al. v. Penn National Gaming, Inc., is a putative class action matter filed on October 15, 2018, pending in the U.S. District Court for the MiddleDistrict of Florida, Orlando Division. Everi Payments was added as a defendant on December 21, 2018. Penn National Gaming, Inc. (“Penn National”) wasdismissed by the Court with prejudice on October 28, 2019, leaving only claims against Everi Payments. Plaintiff, on behalf of himself and others similarlysituated, alleges that Everi Payments has been unjustly enriched through the charging of service fees for transactions conducted at Penn National facilities. Plaintiffseeks injunctive relief against both parties, and an award of statutory damages, attorney’s fees, and costs.Geraldine Donahue, et. al. v. Everi Payments Inc., et. al., is a putative class action matter filed on December 12, 2018, in Cook County, Illinois. The originaldefendant was dismissed and the Company was substituted as defendant on April 22, 2019. Plaintiff, on behalf of himself and others similarly situated, alleges thatEveri Payments and the Company have violated certain provisions of FACTA. Plaintiff seeks an award of statutory damages, attorney’s fees, and costs.
NRT matter:
NRT Technology Corp., et. al. v. Everi Holdings Inc., et. al., is a civil action filed on April 30, 2019 against the Company and Everi Payments in the United StatesDistrict Court for the District of Delaware alleging monopolization of the market for unmanned, integrated kiosks in violation of federal antitrust laws, fraudulentprocurement of patents on functionality related to such unmanned, integrated kiosks and sham litigation related to prior litigation brought by Everi Payments(operating as Global Cash Access Inc.) against the plaintiffs. Plaintiffs seek compensatory damages, trebled damages and injunctive and declaratory relief.
49
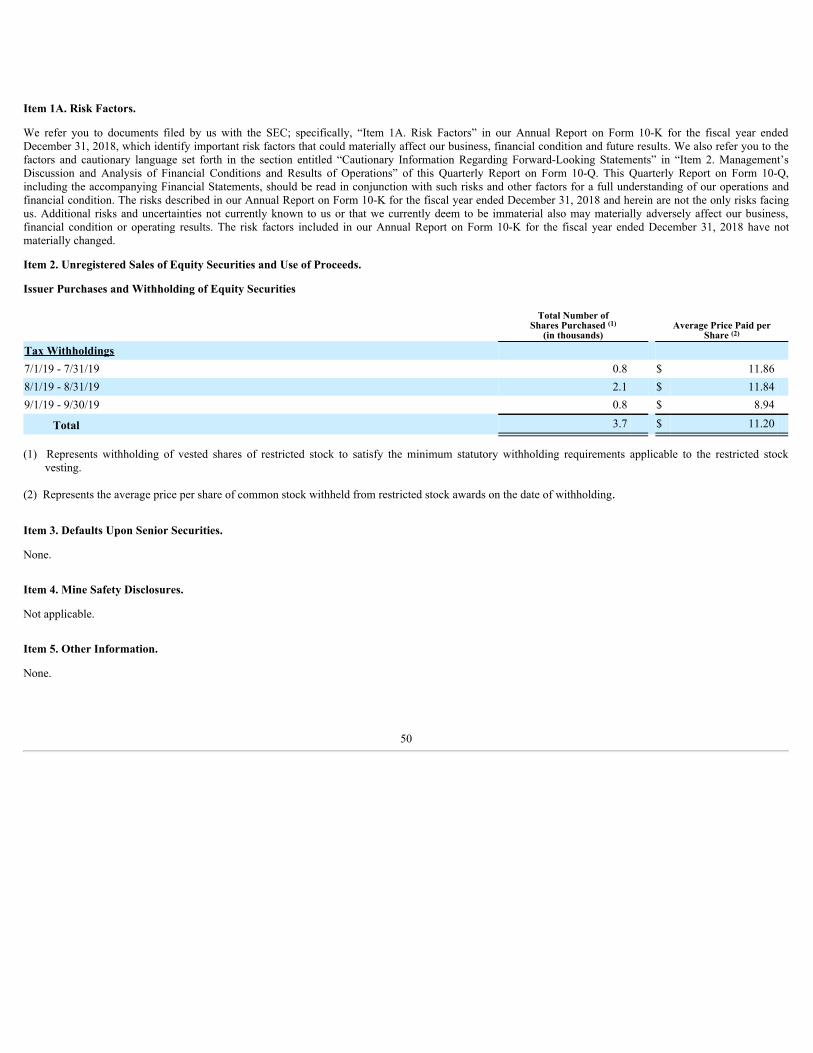
Item 1A. Risk Factors.
We refer you to documents filed by us with the SEC; specifically, “Item 1A. Risk Factors” in our Annual Report on Form 10-K for the fiscal year endedDecember 31, 2018, which identify important risk factors that could materially affect our business, financial condition and future results. We also refer you to thefactors and cautionary language set forth in the section entitled “Cautionary Information Regarding Forward-Looking Statements” in “Item 2. Management’sDiscussion and Analysis of Financial Conditions and Results of Operations” of this Quarterly Report on Form 10-Q. This Quarterly Report on Form 10-Q,including the accompanying Financial Statements, should be read in conjunction with such risks and other factors for a full understanding of our operations andfinancial condition. The risks described in our Annual Report on Form 10-K for the fiscal year ended December 31, 2018 and herein are not the only risks facingus. Additional risks and uncertainties not currently known to us or that we currently deem to be immaterial also may materially adversely affect our business,financial condition or operating results. The risk factors included in our Annual Report on Form 10-K for the fiscal year ended December 31, 2018 have notmaterially changed.
Item 2. Unregistered Sales of Equity Securities and Use of Proceeds.
Issuer Purchases and Withholding of Equity Securities
Total Number ofShares Purchased (1)
(in thousands)Average Price Paid per
Share (2)
Tax Withholdings 7/1/19 - 7/31/19 0.8 $ 11.86 8/1/19 - 8/31/19 2.1 $ 11.84 9/1/19 - 9/30/19 0.8 $ 8.94
Total 3.7 $ 11.20
(1) Represents withholding of vested shares of restricted stock to satisfy the minimum statutory withholding requirements applicable to the restricted stockvesting.
(2) Represents the average price per share of common stock withheld from restricted stock awards on the date of withholding.
Item 3. Defaults Upon Senior Securities.
None.
Item 4. Mine Safety Disclosures.
Not applicable.
Item 5. Other Information.
None.
50

Item 6. Exhibits Exhibit Number
Description
*31.1 Certification of Michael D. Rumbolz, President and Chief Executive Officer of Holdings in accordance with Rules 13a-14(a) and 15d-14(a) of the Securities Exchange Act, as amended, as adopted pursuant to Section 302 of the Sarbanes-Oxley Act of 2002.
*31.2 Certification of Randy L. Taylor, Chief Financial Officer of Holdings in accordance with Rules 13a-14(a) and 15d-14(a) of theSecurities Exchange Act, as amended, as adopted pursuant to Section 302 of the Sarbanes-Oxley Act of 2002.
**32.1 Certification of the Chief Executive Officer and Chief Financial Officer of Holdings in accordance with 18 U.S.C. §1350, as adoptedpursuant to Section 906 of the Sarbanes-Oxley Act of 202.
*101.INS XBRL Instance Document.
*101.SCH XBRL Taxonomy Extension Schema Document.
*101.CAL XBRL Taxonomy Extension Calculation Linkbase Document.
*101.DEF XBRL Taxonomy Extension Definition Linkbase Document.
*101.LAB XBRL Taxonomy Extension Label Linkbase Document.
*101.PRE XBRL Taxonomy Extension Presentation Linkbase Document.
* Filed herewith.** Furnished herewith.† Management contracts or compensatory plans or arrangements.
51

SIGNATURES
Pursuant to the requirements of the Securities Exchange Act of 1934, the registrant has duly caused this report to be signed on its behalf by the undersignedthereunto duly authorized.
November 5, 2019 EVERI HOLDINGS INC.(Date) (Registrant)
By: /s/ Todd A. Valli Todd A. Valli Senior Vice President, Corporate Finance and Chief Accounting Officer (For the Registrant and as Principal Accounting Officer)
52

Exhibit 31.1Certification of Principal Executive Officer
Pursuant to Exchange Act Rules 13a-14(a) and 15d-14(a)as Adopted Pursuant to Section 302 of the Sarbanes-Oxley Act of 2002
I, Michael D. Rumbolz, certify that:1. I have reviewed this Quarterly Report on Form 10-Q of Everi Holdings Inc.;
2. Based on my knowledge, this report does not contain any untrue statement of a material fact or omit to state a material fact necessary to make the statements made,in light of the circumstances under which such statements were made, not misleading with respect to the period covered by this report;
3. Based on my knowledge, the financial statements, and other financial information included in this report, fairly present in all material respects the financialcondition, results of operations and cash flows of the registrant as of, and for, the periods presented in this report;
4. The registrant’s other certifying officer(s) and I are responsible for establishing and maintaining disclosure controls and procedures (as defined in Exchange ActRules 13a-15(e) and 15d-15(e)) and internal control over financial reporting (as defined in Exchange Act Rules 13a-15(f) and 15d-15(f)) for the registrant and have:
a) Designed such disclosure controls and procedures, or caused such disclosure controls and procedures to be designed under our supervision, to ensure thatmaterial information relating to the registrant, including its consolidated subsidiaries, is made known to us by others within those entities, particularlyduring the period in which this report is being prepared;
b) Designed such internal control over financial reporting, or caused such internal control over financial reporting to be designed under our supervision, toprovide reasonable assurance regarding the reliability of financial reporting and the preparation of financial statements for external purposes inaccordance with generally accepted accounting principles;
c) Evaluated the effectiveness of the registrant’s disclosure controls and procedures and presented in this report our conclusions about the effectiveness ofthe disclosure controls and procedures, as of the end of the period covered by this report based on such evaluation; and
d) Disclosed in this report any change in the registrant’s internal control over financial reporting that occurred during the registrant’s most recent fiscalquarter (the registrant’s fourth fiscal quarter in the case of an Annual Report) that has materially affected, or is reasonably likely to materially affect, theregistrant’s internal control over financial reporting; and
5. The registrant’s other certifying officer(s) and I have disclosed, based on our most recent evaluation of internal control over financial reporting, to the registrant’sauditors and the audit committee of the registrant’s board of directors (or persons performing the equivalent functions):
a) all significant deficiencies and material weaknesses in the design or operation of internal control over financial reporting which are reasonably likely toadversely affect the registrant’s ability to record, process, summarize and report financial information; and
b) any fraud, whether or not material, that involves management or other employees who have a significant role in the registrant’s internal control overfinancial reporting.
Dated: November 5, 2019 By: /s/ Michael D. Rumbolz
Michael D. Rumbolz President and Chief Executive Officer

Exhibit 31.2Certification of Principal Financial Officer
Pursuant to Exchange Act Rules 13a-14(a) and 15d-14(a)as Adopted Pursuant to Section 302 of the Sarbanes-Oxley Act of 2002
I, Randy L. Taylor, certify that:1. I have reviewed this Quarterly Report on Form 10-Q of Everi Holdings Inc.;
2. Based on my knowledge, this report does not contain any untrue statement of a material fact or omit to state a material fact necessary to make the statements made,in light of the circumstances under which such statements were made, not misleading with respect to the period covered by this report;
3. Based on my knowledge, the financial statements, and other financial information included in this report, fairly present in all material respects the financialcondition, results of operations and cash flows of the registrant as of, and for, the periods presented in this report;
4. The registrant’s other certifying officer(s) and I are responsible for establishing and maintaining disclosure controls and procedures (as defined in Exchange ActRules 13a-15(e) and 15d-15(e)) and internal control over financial reporting (as defined in Exchange Act Rules 13a-15(f) and 15d-15(f)) for the registrant and have:
a) Designed such disclosure controls and procedures, or caused such disclosure controls and procedures to be designed under our supervision, to ensure thatmaterial information relating to the registrant, including its consolidated subsidiaries, is made known to us by others within those entities, particularlyduring the period in which this report is being prepared;
b) Designed such internal control over financial reporting, or caused such internal control over financial reporting to be designed under our supervision, toprovide reasonable assurance regarding the reliability of financial reporting and the preparation of financial statements for external purposes inaccordance with generally accepted accounting principles;
c) Evaluated the effectiveness of the registrant’s disclosure controls and procedures and presented in this report our conclusions about the effectiveness ofthe disclosure controls and procedures, as of the end of the period covered by this report based on such evaluation; and
d) Disclosed in this report any change in the registrant’s internal control over financial reporting that occurred during the registrant’s most recent fiscalquarter (the registrant’s fourth fiscal quarter in the case of an Annual Report) that has materially affected, or is reasonably likely to materially affect, theregistrant’s internal control over financial reporting; and
5. The registrant’s other certifying officer(s) and I have disclosed, based on our most recent evaluation of internal control over financial reporting, to the registrant’sauditors and the audit committee of the registrant’s board of directors (or persons performing the equivalent functions):
a) all significant deficiencies and material weaknesses in the design or operation of internal control over financial reporting which are reasonably likely toadversely affect the registrant’s ability to record, process, summarize and report financial information; and
b) any fraud, whether or not material, that involves management or other employees who have a significant role in the registrant’s internal control overfinancial reporting.
Dated: November 5, 2019 By: /s/ Randy L. Taylor Randy L. Taylor Chief Financial Officer

EXHIBIT 32.1
EVERI HOLDINGS INC.CERTIFICATION OF PRINCIPAL EXECUTIVE OFFICER AND PRINCIPAL FINANCIAL OFFICER PURSUANT TO 18 U.S.C. SECTION 1350
AS ADOPTED PURSUANT TO SECTION 906 OF THE SARBANES-OXLEY ACT OF 2002 In connection with the Quarterly Report of Everi Holdings Inc. (the “Company”) on Form 10-Q for the period ended September 30, 2019 filed with the Securitiesand Exchange Commission (the “Report”), Michael D. Rumbolz, President and Chief Executive Officer of the Company, and Randy L. Taylor, Chief FinancialOfficer of the Company, each hereby certifies as of the date hereof, solely for the purposes of Title 18, Chapter 63, Section 1350 of the United States Code, that tothe best of his knowledge:
(1) the Report fully complies with the requirements of Section 13(a) or 15(d), as applicable, of the Securities Exchange Act of 1934; and(2) the information contained in the Report fairly presents, in all material respects, the financial condition and results of operations of the Company at the
dates and for the periods indicated. This Certification has not been, and shall not be deemed, “filed” with the Securities and Exchange Commission. Dated: November 5, 2019 By: /s/ Michael D. Rumbolz Michael D. Rumbolz President and Chief Executive Officer
Dated: November 5, 2019 By: /s/ Randy L. TaylorRandy L. TaylorChief Financial Officer