Embed Size (px)
Citation preview
Everyman’s Science Vol. XLVIII No. 1, April ’13 — May ’13
1
EVERYMAN’SSCIENCE
Vol. XLVIII No. 1 (April ’13 – May ’13)
EDITORIAL ADVISORY BOARD
Prof. Swapan Kumar Datta (New Delhi)
Prof. Premendu Prakash Mathur
(Bhubaneswar)
Dr. R. L. Bharadwaj (Agra)
Prof. Rajneesh Dutt Kaushik
(Haridwar)
Prof. Amarendra Kumar Sinha (Jaipur)
Dr. Mohan Khedkar (Amravati)
Dr. Pitamber Prasad Dhyani (Almora)
Dr. Subhash Chandra Yadav (Varanasi)
Prof. Lalit Mohan Manocha
(Vallabh Vidyanagar)
Prof. D. S. Hooda (Guna)
Dr. Surya Kant Tripathi (Lucknow)
Prof. Parimal C. Sen (Kolkata)
Dr. Sanjeev Ramachandra Inamdar
(Dharwad)
Prof. Surinder Pal Khullar (Chandigarh)
COVER PHOTOGRAPHS
Past General Presidents of ISCA
1. Prof. A. K. Saha (1980)
2. Prof. A. K. Sharma (1981)
3. Prof. M. G. K. Menon (1982)
4. Prof. B. Ramachandra Rao (1983)
5. Prof. R. P. Bambah (1984)
6. Prof. A. S. Paintal (1985)
For permission to reprint or
reproduce any portion of the
journal, please write to the
Editor-in-Chief.
EDITORIAL BOARD
Editor-in-Chief
Dr. Ashok Kumar Saxena
Area Editors
Dr. (Mrs.) Vijay Laxmi Saxena
(Biological Sciences)
Dr. Pramod Kumar Verma
(Earth Sciences, Engineering & Material Sciences)
Dr. Manoj Kumar Chakrabarti
(Medical Sciences including Physiology)
Dr. Arvind Kumar Saxena
(Physical Sciences)
Dr. (Mrs.) Vipin Sobti
(Social Sciences)
General Secretary (Membership Affairs)
Er. Nilangshu Bhushan Basu
General Secretary (Scientific Activities)
Prof. Arun Kumar
Editorial Secretary
Dr. Amit Krishna De
Printed and published by Dr. Ashok Kumar Saxena
on behalf of Indian Science Congress Association
and printed at Seva Mudran, 43, Kailash Bose
Street, Kolkata-700 006 and published at Indian
Science Congress Association, 14, Dr. Biresh Guha
Street, Kolkata-700 017, with Dr. Ashok Kumar
Saxena as Editor.
Annual Subscription : (6 issues)
Institutional 200/- ; Individual 50/-
Price : 10/- per issue

Everyman’s Science Vol. XLVIII No. 1, April ’13 — May ’13
2
EDITORIAL :
Recent Trends in Biological Sciences
Dr. (Mrs.) Vijay Laxmi Saxena 3
ARTICLES :
Presidential Address : Energy Strategies for India
Ajit Kumar Saha 5
Climate Change and Coral Vulnerability
Sharmila Chandra 69
Virus as a Biosensor
Rajib Deb, Satish Gaikwad, Sanjeev K. Shukla,
C. Madhan Mohan and Sohini Dey 74
KNOW THY INSTITUTIONS 80
CONFERENCES / MEETINGS / SYMPOSIA / SEMINARS 83
S & T ACROSS THE WORLD 84
CONTENTS

Everyman’s Science Vol. XLVIII No. 1, April ’13 — May ’13
3
EDITORIAL
Imagine a world where there is abundant and
healthy food for everyone, where the environment
is resilient and flourishing, where there is
sustainable, clean energy, where good health is the
norm. All these daunting challenges are
interdependent – growing of more food without
harming natural environments, exploring new energy
sources without global warming or have adverse
health effects. Fortunately, advances in the life
sciences have the potential to contribute innovative
and mutually reinforcing solutions to reach all of
these goals. Some plausible contributions of the
life sciences to meet these challenges are :
(i) a wide variety of plants with faster maturation,
drought tolerance, and disease resistance
could contribute to a sustainable increase in
local food production.
(ii) Food crops could be engineered for higher
nutritional value, including higher
concentrations of vitamins and healthier oils.
(iii) Critical habitats could be monitored by arrays
of remote sensors.
Note that in the 19th century, persons
investigating the living world used to be termed as
“naturalists” with interdisciplinary research
activities, combining biology, geology, and physics.
Now, after decades of high productive specialization,
the study of life is again becoming more
interdisciplinary, by necessity combining previously
disparate fields to create a new horizon of Biology.”
The essence of this new horizon is the re-integration
of sub-disciplines of biology, along with greater
influence from the physical and computational
sciences, mathematics, and engineering. This has
RECENT TRENDS IN BIOLOGICAL SCIENCES
the potential to devise new approaches that address
traditional and systems level questions in new,
interdisciplinary, and especially, quantitative ways.
Modern researches in Biology rely on integrating
knowledge from many disciplines to derive deeper
understanding of biological systems. That deeper
understanding both allows the development of
biology-based solutions for society’s problems and
also feeds back to enrich the individual scientific
disciplines that contributed to these new insights. It
is critically important to recognize that in near
future, Biology will not replace the ongoing
research; that research is the foundation on which
the future Biology rests and on which it will
continue to rely. If we compare our understanding
of the living world to the assembly of a massive
jigsaw puzzle, each of the sub-disciplines of biology
has been assembling sections of the puzzle. The
individual sections are far from complete and
continued work to fill those gaps is critical. Indeed,
biological systems are so complex that it is likely
that major new discoveries are still to be expected,
and new discoveries very frequently come from
individual scientists who make the intellectual leap
from the particular system they study to an insight
that illuminates many biological processes.
Now it is time to invest in the development of
the new aspects of biology because the life sciences
are in the midst of a historical period analogous to
the early 20th century in the physical sciences. The
discovery of the electron in 1897 marked the
beginning of a major turning point in the history of
science. Over the next few decades, physics,
chemistry, and astronomy were all transformed.
Physicists uncovered the fundamental constituents

Everyman’s Science Vol. XLVIII No. 1, April ’13 — May ’13
4
Science is a way of thinking much more than it is a body of
knowledge.
—Carl Sagan
of matter and energy and discovered that these
constituents interact in unanticipated ways. Chemists
related the structure and properties of substances to
the interactions of electrons surrounding atomic
nuclei. Astronomers related the light received from
stars and the sun to the chemical properties of the
atoms generating that light. In this way, new
connections within the physical sciences became
apparent and drove further advances. These
theoretical advances also led to practical applications
that transformed society. Having a “parts list” of
the physical world enabled scientists and engineers
to develop technologies that would not have been
possible without this understanding. These
technologies led in turn to the electronic industry,
the computer industry, and the information
technology industry, which together have created a
world that could scarcely have been imagined a
century ago. Before the transition associated with
the discovery of the electron, scientists gathered
increasing amounts of data, but those data could
not be put to full use because of the lack of a
conceptual framework. After that discovery,
previously gathered data took on new usefulness,
entirely new areas of inquiry emerged, and discovery
and application accelerated rapidly. Such discoveries
are critical junctures that send science and society
in new directions.
Responses to great challenges often must be
enunciated, formulated, and launched before the
capabilities to meet those challenges are in place.
In this way, the response often motivates the creation
of the necessary capabilities. The decisions to send
humans to the moon and to sequence the human
genome were both made when the relevant
technologies were far from being up to the job. In
each case, establishing a bold and specific target
created unforeseen routes to solutions. Recent
technological and scientific advances have brought
the life sciences to a point where rapid progress
toward understanding complex biological systems
is possible. Many of the essential ingredients are
already in place. Biotechnology is already emerging
as an interdisciplinary, system-level, computationally
intensive subject. A piecemeal strategy, with many
different agencies, interdisciplinary projects and
investing in various technologies would continue to
advance the efforts of some pioneer researchers
whose work has enormous promise. But the cross-
cutting technologies and tools that would genuinely
empower the Biotechnology will definitely require
significant investment and advance planning. We
all expect that such sustained development in
biological sciences will result the eventual
realization of our imagination mentioned in the
beginning of this editorial.
Dr. (Mrs.) Vijay Laxmi Saxena
Department of Zoology
D.G.(P.G.) College, Kanpur

Everyman’s Science Vol. XLVIII No. 1, April ’13 — May ’13
5
W hen I express my gratitude to members
of India Science Congress for having
chosen me for the highest office. I do not use
words of mere conventional courtesy. I deeply
appreciate this honour, thought I may right away
say that I not admire your choice.
In keeping up with recent tradition, I was
required to lay down a focal theme for this Session
and I chose one which has become a matter of
global concern. In our younger days, energy was
taken for granted. Very seldom we were concerned
with the finiteness of its availability. The thinking
of our scientist pioneers had mainly to do with how
to develop the energy potentialities, and get on
with the business of generating the industrial and
agricultural growths necessary to improve the quality
of lives of our people. The General President of the
21st Session of the Science Congress said in 19381.
“If we desire to fight successfully the scourge of
poverty and want from which 90% of our
countrymen and suffering, if we wish to remodel
our society and renew the springs of our civilization
and culture, and lay the foundations of a strong and
progressive national life, we must make the fullest
use of the power which a knowledge of Nature has
given us. We must rebuild our economic system by
utilizing the resources of our land, harvesting the
energy of our rivers, prospecting for the riches
PRESIDENTIAL ADDRESS
ENERGY STRATEGIES FOR INDIA
Prof. Ajit Kumar Saha, D.Sc., F.N.A
hidden under the bowels of the earth, reclaiming
deserts and swamps, conquering the barriers of
distance”
In choosing my theme I pay my respects to him,
for I am beholden to him in more ways then one.
Today this easy optimism has to a large measure
disappeared. We know now that much of the energy
pools from which we have been drawing our
sustenance are of finite dimensions and would
vanish very soon. No doubt there are other energy
pools which are replenishable or inexhaustible for
all practical purposes; but the technologies to use
them have yet to be developed. Our populations are
exploding and a tremendous pressure is building up
in the form of demands for improvement of the
quality of lives of our people. The problem of
energy now dominates all our thoughts and actions.
I propose to discuss some aspects of the energy
problem of India and present most humbly some
possible strategies. I realise of course that the
problem is of unsurpassing complexity and it would
be presumptuous for any person to say that this or
that is the solution. What I would hope is that my
address would generate discussions among the
community of scientists and technologists, for any
solution must necessarily depend heavily upon them.
I must emphasise from the beginning that I am no
expert in this field, I only know some parts of it as
a physicist. The problem needs multidisciplinary
treatment. I started collecting data and informations
and what I intially prepared was of a size quite
unsuitable for this occasion and must await the
* General President, 67th Indian Science Congress held during
January, 1980 at Jadavpur.
1. Meghnad Saha (1983) : The problems of Indian rivers.
Presidential address to National Institute of Science of
India.

Everyman’s Science Vol. XLVIII No. 1, April ’13 — May ’13
6
pleasure of the DST to see the light of the day. In
this address I have summarised what I had written.
HISTORIC PERSPECTIVE OF ENERGY USE2
It is fascinating to study the evolution of
technology from paleolithic times to the modern
age and see the many ways energy has been
harnessed by man. Fire, wind, flowing water and
oil from vegetable and animal origins were the
main energy sources right upto the medieval times.
Animal and man power dominated the economy
and much of the wars of the ancient world was as
much for the replenishment of slaves and animal
stocks as for land and precious materials like gold.
The great forests provided the wood necessary for
fuel till the beginning of the Industrial Age. This
induced forest clearings on a very massive scale;
the forests in China were virtually destroyed by
1000 B. C. Oil, asphalt, naphtha, natural gas and
coal were known in the ancient world. In China
natural gas was transported through bamboo pipes
in 1000 B. C. There was a resistance against the
use of coal because of the smoke. Edward I of
England legislated capital punishment for burning
of coal. With the coming of the Industrial
Revolution, machines came to their own and
abundant sources of energy and technologies of
energy conversions for running the machines became
imparative. Whatever remained of the forests would
have vanished because of this strident demand for
energy, were it not for the fact that the demands of
the steel industry for a cheap reducing agent brought
coal into extensive use in the economy, leading to
its use as a source of heat also.
THE CONCEPT OF ENERGY3
Before I survey the technologies for conversion
of energy, I should like to draw your attention to
the evolution of the concept of energy.
Understanding of the concept did not come easily.
In the ancient world, the mechanical advantages of
the inclined plane and the five fundamental machines
— the wheel and axel, the levers, the pulleys, the
wedge and the endless screw were well known and
their disadvantages in terms of speeds were realised.
But there was no clear concept of energy; indeed
same words were used to represent energy, force
and momentum. However one could see two distinct
lines of evolution of the concept: one was a search
for something which was conserved, and the other
a search for a perfect machine (perpetuum mobile)
of the first kind which was to run without any
input. Leonardo da Vincl was one of the first to
realise the impossibility of such a machine.
Lagrange, who laid the analytic foundations of
Dynamics, wrote down the energy equation as an
equation of conservation. But neither he nor others,
who preceeded him like the great Newton, used the
word energy. The word existed however, being
probably coined by Aristotle. We own to J.
Bernoulli, Young and Corriolls the meanings of the
words energy and work, as used in modern science.
It was very soon realised that mechanical energy
in its two forms: kinetic and potential, were not the
only forms in which energy could exist. There are
many other forms in which energy may be found.
The classical work of Mayer and Joule led to the
understanding of the real natural of heat. We now
realise that if a suitable physical process can be
found, then energy can be transformed from one to
another — a concept on which our technological
civilisation stands. The concept led to the
magnificient branch of physics known as
Thermodynamics which was the result of the great
works of Carnot, Clausius and Lord Kelvin. This
discipline embraces all our energy conversion
technology that exists now or that may come. At
the begining of this century another conceptual
step was taken by the Einstein, relating mass to
energy, the consequences of which were far
reaching. This work is one of the greatest intellectual
achievements of this century. The utilisation of
2. E. Ayres & C. A. Scarlott: Energy sources-The wealth ofthe world, McGraw Hill (1952). E. Cook: Man, Energy,Society, Freeman, 1976; C. A. Berg: Process innovationand changes in industrial energy use, Science, 199, p 608,1978
3. Energy-historical development and concepts Vol.1.Benchmark series, Papers on Energy edited by R. B.Lindsay and M. E. Hawley. Academic Press.

Everyman’s Science Vol. XLVIII No. 1, April ’13 — May ’13
7
energy of nuclear fission or fusion are based on
Einstein’s celebrated equation E = mc2.
THERMODYNAMICS OF ENERGY
CONVERSION TECHNOLOGY4
The foundation of Thermodynamics were laid
in 1824 by Camot in his classical paper: “Reflections
on the motive power of fire and the machines fitted
to develop that power”. He wrote
“If the honour of discovery belongs to a nation
in which it (steam engine) has acquired its growth
and all its development, this honour cannot be
refused to England. Savery, Newcomen, Smeaton
and the famous Watt, Woolf, Trevithick, and some
other English engineers, are the veritable creators
of the steam engine. ... Notwithstanding the
satisfactory condition to which they have been
brought to day, their theory is very little understood,
and the attempts to improve them are still directed
almost by chance.
This paper sparked of a flood of research leading
to the understanding of engines, i.e. of all
mechanisms converting energy of any form into
work. The understanding is embodied in the
statements of the second law of thermodynamics of
which various forms exist. Lord Kelvin’s statement
is : Processes which convert work into heat without
any other change is irreversible; it is impossible to
convert completely heat extracted from a body at
uniform temperature into work without causing any
other changes. Other changes stand for the changes
that are left with, after the completion of the
process. There are other alternative statements of
the law, of which the most famous is that of
Clausius. All the statements are of course equivalent
i.e. derivable from each other. Rankine introduced
the concept of effciency of conversion, defined by
η = W/Q2,
where W = Q2 – Q1 is the work delivered by the
engine and Q2 is the heat taken from a source at
temperature T2 and Q1 is the heat transferred to a
sink at lower temperature T1. Engines were made
to work in cycles so that the working fluid returned
periodically to its initial state. In the calculations,
the sequence of thermodynamic processes through
which the working fluid was made to go, were all
assumed to be reversible. This means that if the
thermodynamic processes, envisaged, take the fluid
from state 1 to state 2 through a sequence of nearly
equilibrium states, then a little coaxing would take
the system in the reverse direction from state 2 to
state 1. In practise this is not possinle, and the main
reason for irreversibility is the existence of friction
which converts a part of the work into heat. For
reversibility all of this frictional heat should be
reconvertible into work without other changes of
the environment. The second law prohibits this,
because according to it only a part of the frictional
heat can be converted to work, the balance being
delivered to a sink at lower temperature, It was
realised early that all reversible engines have same
efficiencies. The engine contemplated by Carnot
was also a reversible engine and had efficiency
η = 1 – T1/T2,
where T2 and T1 are the temperatures of the heat
source and sink respectively. Efficiencies of
irreversible engines are lower than those of reversible
engines. If an engine, working in a particular sense
of the cycle, takes heat from a source, converts a
part of it into work and delivers the balance to a
sink at lower temperature, then when worked in the
reverse cycle, the engine will act a heat pump or a
refrigerator i.e. it will take heat from a body at
lower temperature, combine this heat with the work
that is done on it by an outside agency and deliver
the sum total to a body at higher temperature than
the sink. It is a heat pump because it pumps heat
from a body at lower temperature to one at higher;
it is also a refrigerator because it takes heat from
the body at lower temperature.
4. Applications of energy 19th century. Vol. 2, Second law ofThermodynamics vol. 5, Benchmark Series-Papers onEnergy edited by R. B. Lindsay and M. E. Hawley.Academic Press; M. N. Saha & B. N. Srivastava : Atreatise on heat, Ind. Press; G. F. C. Rogers and Y. R.Mayhew : Engineering Thermodynamics, Longmans Green.& Co. Ltd., 1967.

Everyman’s Science Vol. XLVIII No. 1, April ’13 — May ’13
8
The science of thermodynamics developed very
rapidly leading to deeper understanding of engines
and other energy converters. For thermal engines
Rankine introduced the practice of indicating the
processes on pressure-volume diagrams or entropy-
temperature diagrams. The various thermodynamic
potentials were defined in course of time and
extensively used. Clausius himself introduced the
concept of Entropy-a concept of fundamental
importance in theoretical physics as shown by the
work of Boltzmann. For engines with flowing fluids
like turbines, the thermodynamic potential enthalpy
introduced by Kammerling Onnes proved very
useful. For combustion of fuels and analysis of
chemical reactions Gibb’s potential became very
important. The potentials are defined by
Enthapy : H = U + pV,
Gibb’s potential : G = H – TS,
where U = internal energy, S = entropy, p =
pressure, V = Volume, T = temperature. Gibb’s
potential is connected to reaction rate K of a
chemical reaction by the equation
K = exp.[ – ∆/RT ] ;
K is also connected with the partial pressure and
the mole numbers of the molecules participating in
the reaction.
Quality of Energy : While energy can be
converted from one form to another, some forms of
energy are better than others because they convert
with smaller loss during conversion. The second
law says that only a part of heat can be converted
into work, the rest being lost to the sink. Thus heat
is energy of low quality. On the other hand there is
very small loss when electric energy is converted to
work, and we can say that electric energy is of high
quality. Sunlight has energy of low quality. Energy
can be transformed from a form of low quality to
a form of high quality only at the expense of a
large part of it. However, once it is so converted
there will be very small loss in its further utilisation.
Efficiency vs. Power Output of Engines :
Though energy conversion efficiency of an engine
is an important parameter for an engine, the
efficiency will reach the ideal calculated for the
engine only if the fundamental thermodynamic
processes of the conversion cycle are reversible.
This necessity makes the operation of the engine
very slow, because slowness allows reversibility.
Thus the power output for a high efficiency engine
necessarily becomes small. A fast engine gives
large output of power but has low efficiency because
of the irreversibilities induced in the thermo-dynamic
processes. However, at low and moderate speeds
the power output may be proportional to effciency.
What we have stated about efficiency falling with
increasing power output will be noticeable at high
speeds as irreversibility and friction losslow-ering
the efficiency dominate in the region whereas power
output increases linearly with speed till the slipoff
point is reached.
ENERGY CONVERSION OF YESTERDAY
AND TODAY
I do not propose to go into any detail about the
present day energy conversion machines. Broadly
speaking the thermal engines work on one or the
other of the following cycles :
1. Joule-Brayton cycle, : The gas turbines, jet
Atkinson cycle aircraft engine etc.
usually utilise this cycle.
Power 3-50 MW
2. Otto, Diesel and : Internal combustion
dual cycles engines automobiles,
aircraft piston engines,
Diesel electricity
generators etc. utilise
these cycles. Power ~
1500 – 2000 kW.
3. Rankine cycle : Steam and vapour
turbines are based on
this cycle. Power ~ 1 –
500 MW
4. Constraint free jet : Jet and rocket engines.
flow
Though in principle there are all reversible engines,
the efficiencies are different from that of the Carnot,

Everyman’s Science Vol. XLVIII No. 1, April ’13 — May ’13
9
because heat is not drawn from a definite
temperature and delivered to another definite
temperature. Cycles which have the Carnot
efficiency are the Stirling and the Ericsson cycles.
Heat engines are classified by the way they use
their fuels :
1. internal combusion engines in which the heat
is added inside the engine, e.g. automobiles,
aircraft engines, gas turbines, jet engines and
rockets.
2. external combustion engines in which the
working substance is heated outside the
engine, e.g. steam engines, steam turbines
and Stirling engines.
Heat engines have another kind of description :
1. reciprocating engines, e.g. automobiles,
Stirling engines, aircraft piston engine,
2. rotary engines-turbines, Wankel or Scissor
engines and
3. linear jet engines and rockets.
Heat engines are characterised by :
1. maximum temperature and pressure,
2. specific fuel consumption,
3. power to volume, and power to weight ratios
for airborne engines,
4. cost to power ratio for electricity generators
and
5. maximum thrust available for jets and rockets.
With the end use in view, the following thumb rule
may be kept in mind for selection of the type of
engine which is most suitable for the purpose :
1. multistage steam turbines in tandem with
fission reactors in the region 200-500 MW,
2. solid fossil fueled steam turbines for electric
generators in the region 50-300 MW,
3. gas turbines for electric generators and aircraft
populsion in the region 0.5-50 MW,
4. oil fired steam turbines for marine propulsion,
5. Diesel/Otto engines for land locomation,
small boats agriculture pumps and motive
power for industrial machines,
6. Stirling engines using inferior quality fuels
for machines and pumps in the agriculture
sector,
7. low power, low efficiency solar engines using
nontoxic organic liquids for rurilf areas
Commercially available heat engines have
achieved efficiencies 0.08 (solid fuel rockets) to
0.58 (multistage steam turbines in tandem with
fission reactors) and power levels achieved range
from 103 MW to few kW. It must be remembered
that heat engines are a nuisance in the sense they
are sources of thermal polution, as about half of the
heat is thrown to the environment without doing
anything useful.
The other types of engines: dynamo (electrical
energy) ↔ motor (work) are well known.
Pachionotti demonstrated the relation between the
two. These engines are a very important component
in energy economy-generation of electricity being
heavily dependent on work electricity converters.
The efficiencies and power outputs arc of high
orders.
Water turbines are the most essential component
in hydroelectricity generation, These are very ancient
devices. In modern forms they can be classed like
other turbines in two classes-impulse turbine e.g.
Pelton water wheel and reaction turbines like Francis
or Kaplan turbines.
MAGNETOHYDRODYNAMIC GENERATION
OF ELECTRICITY
Another important technology engaging attention
of scientists and technologists all over the world is
the possibility of direct conversion of the energy of
a flowing plasma to electricity. Magnetohydro-
dynamics describes the interaction of an electrically
charged fluid flowing through a magnetic field.
The principle of energy conversion is given below5.
A Charged particle moving through a magnetic
field B, experiences a force E = ev × B, where v is
the velocity of the particle. An electric field is also
generated, E = F/e = — ∆ϕ, where ϕ = electric
potential due to the field E. If v, B are perpendicular
to each other and the charge moves a length l along5. Analysis by Dr. B. K. Banerjea
F–2

Everyman’s Science Vol. XLVIII No. 1, April ’13 — May ’13
10
E, whose direction is perpendicular to both v and
B, the induced electromotive potential across l is
Bvl. The charge is in a plasma, which has an
internal resistivity 1/σ, where σ is the coductivity
of the plasma medium, a is given by σ = ne2 τ/m
where τ = effective electron collision time, m =
mass of electrons and n = electron density. Thus
there will be a voltage drop across the plasma. Let
VT be the terminal voltage available for the outside
load, i.e. V – VT is the voltage drop across the
plasma conductor. If α = cross section of the
plasma and l = its length, then plasma volume = Ω= αl, and its conductance is l/ασ. The current i
through the plasma is
( ) ( )
ασ ασ= − = −
where k = VT/V = electric load factor. The power
avilable is
P = iVT = Ωk (l – k) σB2V2,
i. e. Power density = Pd = k (1 – k) σB2V2.
Typical values of the above parameters for actual
MHD generators are
k = 0.7 – 0.8 σ = 10 – 20 mhs/in, B ~ 5 – 6
Tesla
v = 600 – 1000 m/s reaching sonic velocity at
the throat of the nozzle for a given temperature
there.
The power density outputs are of the order
Pd = 25 – 150 MW/m3,
It will be noticed that a MHD generator combines
the flowing medium principle of a conventional
turbine with that of the usual electric dynamo. The
MHD generator is much simpler, atleast in principle.
There are no heated moving parts subject to
mechanical stresses, and external cooling if required,
is more easily achieved. Vapour/gas heated to very
high temperatures should be usable. The basic
MHD process being a volume process the power
generation should increase with rise of generator
size. The ratio of surface losses to net power output
is, in principle, very favourable compared to
conventional thermal turbines. MHD should be
ideal for large scale power generation.
The most important part of a MHD plant
resembles a rocket engine ventauri through which
the hot vapour/gas expands. This expander is
surrounded by strong magnetic field produced by
standard methods; in some MHD plants very high
magnetic fields have been produced by
superconductor devices. Temperatures from 1500°K
to 2500°K have been used. Seed materials like
potassium or caesium carbonates are evaporateded
and injecting into the vapour/gas stream flowing
through the ventauri to improve the conductivity of
the plasma. The electron temperature is much higher
than the vapour/gas temperature. The hot outgoing
vapour/gas of the MHD generator can be used to
heat a stream of vapour/gas, which can be fed into
a second conventional vapour/gas turbine. The MHD
generator vapour/gas turbine combination should
have efficiency higher than 50%, because much
higher temperatures can, in principle, be used. In
liquid metal MHD generators, electric conductivity
is obtained by injecting a liquid metal into a vapour
or liquid to obtain a continuous liquid phase. These
are not yet promising.
Starting with the idea that India must find
alternative efficient use of coal for energy generation
purpose, an Indian MHD6 facility is being set up at
Tiruchirapally through colaborative efforts of BARC
and BHEL and funding by DST. The plan is to
have a coal based MHD generator with 5-15 MW
thermal input. Technical consultation has been
established for this project with Institute of High
Temperature at Moscow.
On the global scene, the Soviet U-25 MHD
pilot plant directed by Prof. A. E. Sheindlin, operated
continuously in 1977 for 250 hrs at a power output
of upto 12 MW into a Moscow grid. USA has
completed a 5 Tesla superconducting magnet for
MHD application at the Argonne National
6. I am indebted to Shri C. Ambasankaran of BARC forinformation on the Indian MHD programme. Furtherinformations to be found in Progress Report No. 3-MHDgeneration project, BARC, 1978.

Everyman’s Science Vol. XLVIII No. 1, April ’13 — May ’13
11
Laboratory. USSR has operated a high power MHD
generator, upto 30 MW, in a pulse mode for
geophysical application. There are many other MHD
projects in various countries in different stages of
completion. Mention may be made of Mark VI
project in USA.
SOLAR ENERGY
The sun pours in energy all round us, and nature
has evolved methods of converting the
electromagnetic energy of its radiation to a form,
which we can use as food and fuel. We shall later
review briefly this wonderful technology which
nature has evoloved. We are just beginning to
understand this technology, but we are nowhere
near imitating it. There is an intense effort going on
all over the world to convert solar energy, for this
source of energy can be taken to be eternal. I shall
review here some of these efforts and the results
achieved.
In the latitude range where India is situated, the
average integrated solar radiative energy on a
horizontal surface at a place like Hyderabad should
be 4.9 kWh/m2 and this may rise on sunny days to
7 kWh/m2. The total energy received by our land
mass annually is about 60 × 1016 kwh which is a
very large amount. But the radiation spatial density
is very low and conversion factor is very small, and
special measures are necessary to improve the
conversion factor
1. optical concentration,
2. reduction of emissivity by special coatings
and
3. reduction of convective and conductive losses.
In any book on utilisation of solar energy house
plans are shown which are nearly autonomous in
their power requirement for space heating and
cooling. In other words these power requirements
are, for most of the time, met by the conversion of
solar energy and the dependence on other sources
of energy are reduced. Indeed except for the expense,
this seems to be an well established technology.
There are many laboratories in India-NPL is one
important centre-where R&D work is going on for
the utilisation of solar energy for space cooling/
heating. There are intense global R&D efforts for
improving the solar absorption coatings. According
to an analysis7 the efficiency of the solar absorption
coatings is given by
η = energy extracted/incident energy
( )
= α − ∈σ − + + where α = absorptance of solar energy, x = optical
gain, F = insolation or solar power recived,
P = fraction of energy extracted for external work,
Ts = surface temperature, and T0 = environment
temperature, E0, Ed are respectively conductive and
convective losses, both being proportional to
Ts – T0. To maximise this expression a/∈ must be
maximised, which makes selective coatings
necessary capable of absorbing as much solar flux
in the wavelength region 0.35 – 1.5 µm and radiate
in the infrared region 1.5 – 30 µm. For most metals
a/∈ ~ 50. Semiconductor layers are transparent in
the infrared region and provide good selective
absorbers. Various multilayered absorbers for in
infrared have been successfully tried. Waveguide
principle for selective absorption appear promising.
The other part of the technology is concerned turn
carries it to the working fluid. The main difficulty
here is the loss of efficiency of heat transfer,
because of the drop of temperature of the primary
fluid in the heat exchanger for heat transfer to the
working fluid tube between entry and exit points.
There are encouraging results obtained by using a
heat exchange system using wicks. Many fluids —
water, Dowtherm A, mercury, potassium etc. have
been tried as the primary heat transfer fluid. Each
has its special merits and faults. If all these
developments can lead to low cost systems, then
these coupled to a low power engine like the
Stirling engine can provide a reliable energy device
for the rural sector, in particular for the agriculture
sector for the pumping irrigation water.
I should say something of optical gain i.e.
concentration of solar energy by mirrors. The great7. Analysis by Dr. B. K. Banerjea

Everyman’s Science Vol. XLVIII No. 1, April ’13 — May ’13
12
mathematician of the ancient world, Archemedes of
Syracuse, considered by Whitehead to be the
founder of mathematical physics, is often credited
with constructing a burning mirror which set the
besieging Roman ships on fire. However, I have not
found any reference to this incident in Plutarch’s
life of Marcellus. Today this principle has been
very successfully tried in many countries. In one
system 1000 mirrors each 10′ × 10′ spread over an
area of 1 mile2 follow the sun, and reflect its
radiation on to a boiler on the top of a 1500′ tower,
where a temperature of about 1000°C is obtained.
A 50kW plant has been built in Italy and a megawatt
solar furnace has been built in France for material
research. In similar systems constructed in the
other countries temperatures upto 3500°C have
been obtained.
But the breakthrough in solar conversion
technology has not yet happened. The world is
waiting for a cheap photovoltaic conversion system.
Intense R&D efforts on a global scale are going on
to develop such a system. According to an estimate
of possible theoretical efficiencies of photovoltaic
conversion8
ηm = efficiency under proper matched condition
= ( )
where Vm = junction potential for which power
output is a maximum, Vg = the band gap Vc = kTc/
e, Tc = temperature of the cell, ts = probability that
photon of energy > hvg will produce an electron-
hole pair, xg = Eg/kTs, Eg = evg, Ts = black body
temperature of solar radiation and u(xg) = ultimate
efficiency( )
( )
∞
∞
−∫ = −∫
where Qs = number of photons per unit are of
frequency ≥ vg = Eg / h, P = total radiation incident
per unit area. The best experimental value for Si
obtained by Prince9 and Loferski10 is about 14%.
On the basis of above estimates the efficiency can
be improved upto 26%. However for the same
power range Si cells are about 1000-2000 times
costlier than solar heat engines with high optical
concentration. Power obtained from Si cells can be
increased by a factor 100-200 using high optical
gain system. For Si, the short circuit current is 28
ma/cm2 and open circuit voltage rises from low
values to 0.6 volts at insolation 1 kW/cm2, the
maximum power output being 11 mW/cm2 at output
voltage of 0.45 V. Si leads the field from art overall
point of view; indeed the solar cells used in space
satellites are almost exclusively made of Si. For
effective photovoltaic action the crystal should be
defect free and of high purity (99.999999%) to
avoid recombination of electron-hole pairs and
loss of charge carriers. The other possible
semiconductors for photovoltaic conversion are InP,
GaAs and CdTe. The following methods are usually
used to produce the crystal materials,
1. Czochralski method for ingots of 3 cm
diameter,
2. float zone technique,
3. ribbon or sheet growing by rolling,
4. dentritic web techniques,
5. edge defined film growth techniques,
6. epitaxial thin film growth techniques, and
7. evaporated thin film growth techniques.
The limits of photovoltaic cell performance
reached today are shown below :
Physical area : ≤ 35 cm2/cell
dimension shape : 2 × 2, 2 × 4, 2 × 8, 3 ×
3, 4 × 8 cm × cm
thickness : 2 – 20 mils
mass/area : upto 0.0117gm/cm2
Electrical power/area : up to 19mW/cm2
output conversion :
efficiency : 13.5 –14%
area/Watt : down to 52 cm2/ Watt
price/Watt : 25/wall (1973)
8. Analysis by Dr. B. K. Banerjea9. M. B. Prince : Silicon solar energy converter, Jour App.
Phys. 26, p. 534 (1955).10. J. Loferski : Theoretical considerations governing the choice
of the optimum semiconductor for photovoltaic solar energy
conversion. Jour. App. Phys. 27, p. 777 (1956).

Everyman’s Science Vol. XLVIII No. 1, April ’13 — May ’13
13
Environmental temperature : 190°C – 900°C
limits insolation : 5 mW/cm2 – 3 mW/cm2
moisture : upto 95% at 85°C
The incorporation of an electric field in the bulk
silicon resulting from an impurity gradient, increases
the radiation resistance. Retarding drift fields near
the back surface gives increased cell voltage.
Enhanced bulk response cells have high minority
carrier diffusion lengths and higher short circuit
currents and open circuit voltage. With present day
technology about 7500 kWh of electricity is required
for producing solar cells to cover 1 m2 of a solar
panel. With working efficiency of 10% and average
isolation of 0.5 kW/m2 this panel will produce
7500 kWh in less than 42 sunlit hours (6-8 days).
This promises a bright future for breeding of solar
panels.
I wish to close this survey with an idea — the
Powersat concept — that is recently being talked
about, which would look perfectly alright in science
fiction but may never be realised in practice. This
idea conceives of relay to earth of solar energy
collected by a large collection panel of solar cells
fixed on a stationary geosatellite. Because of absence
of atmosphere and the sunlight being available for
almost 22 hrs, the insolation should be about ten
times larger. The solar energy collected is to be
converted to microwave power and directed to
earth by a microwave transmitter of high directivity,
which is to be locked to a ground based microwave
rectenna, to receive the microwave energy and
convert it to an electricity. Microwave is being
thought of, because of its relative low loss while
travelling through the atmosphere. The arguments
against the idea are :
1. life of the solar panel may be shortened
because of bombardment by cosmic rays,
2. microwave may heat up the ozone layers
with disastrous consequences,
3. the degree of locking of the transmitter to
rectenna, that is required, may be very
difficult to achieve, whereas a failure in this
respect will be catastropic for the inhabitants
area round the ground station, and
4. the experience of Skylab has shown that
satellite life times are unpredictable.
ENERGY FROM NUCLEAR FISSION11
Nuclear fission was discovered by Hahn and
Strassmann12 in 1939, and the phenomenon analysed
by Meitner and Frisch13 in 1939. There is a famous
paper by Bohr and Wheeler14, in which the
phenomenon was analysed from the point of view
of vibrations of a charged liquid drop. I mention
this because Bohr’s first paper was also on charged
liquid drop.
The controlled release of nuclear energy in a
chain reaction was announced by Fermi in 1942 in
a telegram “The Italian navigator has just landed in
the new world”. Thus Fermi informed the world
that his experimental pile has reached criticality.
This was followed in 1945 by the explosion of the
bomb on the deserts of New Mexico at Almogordo,
which made Openheimer quote from the Bhagbad
Gita15
“DIBI BHABED
!"#
YADI $ " "
$ ''< ”
Translation
If 1000 suns rise at once one time in the sky
Only that will resemble the brilliance of the
Great Soul
At 8.15 AM on Aug 6, 1945 a U bomb fell on
Hiroshima; three days later on Aug 9, 1945 a Pu
11. I acknowledge the help given to me in preparing this
section by my colleague Prof. S.K. Mukherjee.12. Von O. Hahn and F. Strassmann: Uber die Nachweis und
des Verhalten der bei der Bestrahlung des Urans mittels
Neutronen entehenden Erdalkalimetalle, Naturwis
27,11(1939).13. L. Meitner and O.R. Frisch: Disintegration of U by neutrons,
a new type of nuclear reaction, Nature 143, p. 239(1939).14. N. Bohr and J. Wheeler: The mechanism of nuclear fission,
Phys. Rev. 56, p. 426 (1939). N. Bohr: Determination of
the surface tension of water by the method of jet vibration,
Phil Trans Roy Soc A 209, p. 281, (1909).15. Bhagbad Gita : 12th Sloka, llth adhaya,
Biswarupadarshanayoga.

Everyman’s Science Vol. XLVIII No. 1, April ’13 — May ’13
14
bomb fell on Nagasaki. With such awe inspiring
fanfare the nuclear age was ushered in for mankind.
Scientists and technologists all over the world
saw in the brilliant experiment of Fermi, a prototype
of a technology which could perhaps solve the
global energy problem for all times to come.
Meghnad Saha16 was one of the pioneers of India,
who by his writings and speeches, endeavoured to
inform the public of the nuclear possibilities. Dr.
H.J. Bhabha laid the foundation, in 1948, of a
nuclear policy for India, and the country was
launched on the path to nuclear developments.
Unfortunately, after thirty years, doubts about our
nuclear capabilities are being cast, which cannot be
lightly brushed away, as our dependence on
imported technology, plants, and materials, is being
more and more revealed. Moreover, there are fierce
debates, raging all over the world, whether
exploitation of nuclear energy is really desirable,
and whether man can live with nuclear energy.
I should like to describe the fission process very
briefly. Certain very heavy nuclei like certain
isotopes of uranium (U) and thorium (Th) are
unstable against fission into two or more fragments,
when irradiated with neutrons. The energy release
can be very large ( ~ 200 Mev/ reaction) compared
to normal energy releases in chemical reactions,
which take place in the combustion of chemical
fuels. More than one neutron is emitted in the
fission reactions which make chain reactions and
breeding of nuclear fuels possible. Nuclear species,
which are important for fission, are groupted under
?@?X ? ?
Z\^ Z^
_ ` | X
− −β β α+ −×
? ? ? @? ?
?
Z\^ Z^
_ < @ X
X
− −β β α+ −×
α +
? X
_
Z\^
X
+ −
α ×
X
_
Z^
?
+ −
α
two heads : (1) fissile isotopes, which suffer fission
after absorbing neutrons e.g. 233, 235U, 239, 241Pu.
Some examples of conversion of fertile isotopes are
given below. The isotope 233U does not occur in
nature and the abundance of the other isotopes of
U are 238U 99.28%, 235U 0.72% and 234U 0.0058%.
Pu isotopes are entirely man made.
The average numbers of neutrons emitted per
neutron absorbed in a fissionable material is
represented by η. It has to be > 1 for sustenance of
chain resction in a reactor. This parameter depends
on the neutron energy and the fuel material.
Generally η varies from 1 to 3 and has intermediate
values for thermal neutrons, low values for neutrons
of intermediate energies, and high value for fast
neutrons. However it rises dramatically with even
slight enrichment of 235U in the U-fuel. This is the
philosophy behind enrichment of U. η is high for239, 241Pu or 233U, which is why in breeder reactors,
these second generation fuels are produced from
the neutron irradiation of the fertile isotopes 238U
or 232Th contained in blankets in the reactors. The
advantage of breeding is brought out neatly in the
statement. “Johnny had 3 truck loads of Pu. He
used 3 of them to light New York for 1 year. How
much Pu did Johnny have left? Answer 4 truck
loads”17. Approximate values of η for various
materials and neutron energies are given in the
following table
Approximate Table of ηηηηηMaterial When thermal neutron When fast neutron
is absorbed is absorbed
U232 2.3 2.45
U225 2.1 2.3
Pu239 2.12 2.7
Pu241 2.1 2.7
Thus for 232, 235U, the energy of the neutron
makes little difference, whereas the Pu isotopes are
best used as fuel for fast reactors, i.e. those which
16. For a list of the writtings and speeches of Meghnad Sahaon nuclear energy see Appendix.
17. Breeder Reactors — by W. Mitchell III and G.E. Turner,U.S. Atomic Energy Commission Office of InformationServices 1972 (Revised).

Everyman’s Science Vol. XLVIII No. 1, April ’13 — May ’13
15
employ fast neutrons. Breeding of fissile material
from fertile material is not possible with η ~ 2.
Thus breeder reactors with U isotopes are unlikely
unless one uses 233U. Breeders with 239Pu isotopes
would be very efficient with fast neutrons.
The other important thing in a reactor is the
moderator whose purpose is to slow down the
fission produced neutrons without absorbing them.
The performance of a moderator is measured by a
figure of merit called moderating ratio. Some typical
values are well known moderators are given in the
following table18.
Moderating Factor
Moderator Moderating factor
Zr-hydride 49
Organic luquids 60-90
Light water 72
Be 159
Graphite 160
BeO 190
D2OPure 1.2 × 10⁴
D2O 99.8 atom 2.3 × 10²
In reactor systems moderators are used to
thermalise the neutrons. Often in addition to this
function, liquid moderators are also used as coolants.
Control rods are made of materials like B or Cd
with large cross sections for capture of neutrons,
and are used to control the reactor activity or to
shut it down.
Before we look at the reactor types now in use,
brief review must be given of enrichment
technology18 for U. U enrichment is increasing the
amount of fissile isotopes 233, 235U in particular of235U, from the natural abundance to the % desired
in a particular reactor configuration of a nuclear
weapon. The historic metheds are :
1. the electromagnetic separation method —
Calutron,
2. the gas diffusion method and
3. gas centrifuge method.
The methods (2) and (3) are in wide use. U is
transformed to UF6, which is a gas. Gas diffusion
method depends on the fact that the lighter isotopes
of U have a highter average velocity, and so when
the gas is passed through a specially prepared Ni
barrier, the emerging gas is very slightly enriched
in U235. Many thousand stages are required for
useful enrichment. There are many technical
difficulties that have to be faced. Theoretically the
centrifuge method should be the cheapest method.
However, the success achieved is not remarkable. It
employs the principle of centrifuge separation.
Among the modern methods we must mention the
Becker nozzle process, in which UF6 is forced at
high velocity through the space between a pair of
blades and a circular groove. Centrifugal and
pressure effects concentrate the heavier isotopes at
the wall of the groove behind the second blade.
Another method is the Fenn Shock which is based
on aerodynamics, and does not depend on too
sophisticated a technology. A high powered blower
and nozzle drives a supersonic stream of UF6
against hollow metal shaped tubes. The heavier
isotope collects behind the shock wave formed.
The latest separation concept utilises laser
technology, in which laser irradiation raises specific
U isotopes to excited levels, creating appreciable
differences of energy between the various isotope
species. The Tarapur reactor in India depends on
enriched U fuel. Unfortunately India’s U enrichment
programme leaves much to be desired.
The reactor types may now be classified. There
are many ways of doing this :
1. by purpose,
2. by fuel,
3. by the state of layout of the fuel in the
reactor,
4. by the type of moderator,
5. by the type of coolant which takes away the
heat and transfers it to the media for the
electricity generator turbine,
6. by the neutron energy, and
7. by the electricity output and
8. by the temperature.18. J. J. Glacken-The dangerous drift in U enrichment. Bulletin
American Scientists Vol. 32, p. 22, 1976.

Everyman’s Science Vol. XLVIII No. 1, April ’13 — May ’13
16
Often the name indicates the type of the reactor
and some important technical detail regarding it.
Thus when a fast reactor is mentioned, we
immediately understand that the neutrons employed
have high velocity and the fuelis most likely to be235U or 239Pu. A breeder reactor will most certainly
have these fuel and very little moderator control,
permitting fast neutrons, and there must be a blanket
of fertile material from which the fissile materials
have to be bred. LWR is a light water reactor in
which moderator and coolant is light water, and the
neutron moderation is by light water only, which is
not very effective, so that the fuel has to be enriched
U. The Tarapur reactor is of this type. CANDU
stands for Canadian deuterium reactor in which the
moderator is D2O which is a very high quality
moderator i.e. a moderator which does not capture
neutron. Hence 235U in its natural abundance can
be used. The three other Indian nuclear power
stations are equipped with reactors of this type.
Unfortunately, after the Pokhran explosion, the
colaboration whih Canada on these projects has
ceased. Other moderators, which have been used,
are graphite and Be. Other coolants used are CO2,
He, organic liquids and liquid metals like Na.
LMFBR stands for liquid metal fast breeding reactor.
One also gets an idea of the temperature and
pressure conditions within the reactor from its
name. BWR stands for boiling water reactor, where
the coolant light water is allowed to transform into
steam and drive a turbine. PSR stands for pressurised
warer reactor where the coolant water is kept at a
high pressure of-2200 psi and a temperature of~600F
and made to deliver the heat to another water
circuit through a heat exchanger. HTGR is a high
temperature gas cooled reactor. A heterogeneus
reactor is the usual type in which the fuel rods are
separate from each other and mounted in a geometry
dictated by the neutron economy desired. A
homogeneous reactor is one in which the fuel is
mixed with a suitable moderator. MSBR is a reactor
of this type, the letters standing for molten salt
breeder reactor. The state of the art in reactor
technology can be seen in Table 1.
Table 1. Power Reactors : Types and characteristics
Reactor type fuel form Enrichment Neutron Energy Moderator Coolant Control Cladding
LWR/PWR UC Enriched U (3.2% U-235) Thermal Water Water B4C. Zircaloy
(Converter) & possibly recycled Pu Ag-In-Cd Rods
LWR/BWR ,, Enriched U (2.8% U-235) ,, ,, ,, B4C ,,
(Converter)
HWR (CANDU) ,, Natural (.7% U-235) ,, Heavy Heavy Moderator ,,
(Converter) water water level
SGHWR UO2
Enriched U (3% U-235) ,, Heavy Water B4C
(Converter) water
HTGR UC2, ThC
2Enriched (93% U-235) ,, Graphite Helium ,,
(Converter) recycled U-233, Th-232 gas
LWFBR PUO2 UO
2Recycled Pu and U-238 Fast None Liquid B
4C Stainless
(Breeder) sodium steel
LWBR Recycled U-233 and Thermal Water Water
(Breeder) Th-232
GCFBR Recycled Pu & U-238 Fast None Helium B4C Graphite
(Breeder) gas
MSBR U fluorides Molten fluorides of Thermal Graphite Molten
(Breeder) U-233 and Th-232 salt
LWR - Light water reactor CANDU - Canadian deuterium uranium LWGR - Light water breeder reactor
PWR - Pressurized water reactor SGHWR - Steam generating heavy water reactor GCFBR - Gas cooled fast breeder reactor
BWR - Boiling water reactor HTGR - High temperature gas cooled reactor MSBR - Molten Salt breeder reactor
HWR - Heavy water reactor LMFBR - Liquid metal fast breeder reactor

Everyman’s Science Vol. XLVIII No. 1, April ’13 — May ’13
17
Rationale of nuclear energy production : I
summarise below various aspects of nuclear energy
production, about which such fierce debate is raging
all over the world. What emerges clearly is that
every country has seriously to consider the various
points of the arguments and decide for itself, whether
it is prepared to go through the great hazards for
the sake of energy that it could get. For India, if we
must have nuclear energy, then the whole unclear
energy programme of the country has to be
reoriented. For this country, unclear energy can be
possible only along the path of breeder technology.
The lead time for this technology is so large that it
is doubtful that nuclear energy could ever contribute
in any effective measure to our energy economy or
serve even as a stop gap system to fill up the time
till a more dependable and safer alternative energy
systems emerge.
The various arguments for and against nuclear
energy are summarised below.
ASPECTS OF NUCLEAR ENERGY
PRODUCTION
1. Positive aspects
A. National/Social benefits
Electricity for the economy.
Weapon grade Pu bred in FBR’s to increase
defence capability and as nuclear deterrent.
B. Other considerations
Energy density very large resulting in small
fuel weights.
Global nuclear resources possibly large.
With FBR, the nuclear resources can be
made to last over longer span of time,
Nuclear energy exploitation may be
unavoidable and imperative when other
alternative energy resources are scarce.
C. Indian scenario
Indian U reserves are small but Th reserves
in monazite sand are very large so that
breeder technology is needed.
2. Uncertain aspects
The cost of nuclear electricity is quite
uncertain, and when compared with hydel
or thermal electricity it may be quite high of
one considers the high cost of plant
maintenance and final plant shut down, fuel
processing and recycling and security
measures.
3. Negative aspects
A. Cost
Installation
Long lead time for installation.
Fuel enrichment technology very expensive.
Reactor boiler and heat exchanger technology
are not of conventional thermal plant types,
because of radioactivity and radiation damage
and fatigue of the materials involved.
Commercial thermal electricity generation
plant has in any case to be dovetailed at the
tail end of a nuclear plant.
General high level of investment necessary
for a nuclear plant.
Additional high investment necessary for
reactor safety.
Maintenance and operation of plant
Very high level of technical expertise and
skill necessary to operate and maintain a
nuclear power plant.
Fuel processing and recycling process cost
very high.
In FBR’s the generation of high weapon
grade Pu Present grest security problem.
There is great risks of hijacking of Pu and
proliferation of nuclear weapons.
High cost of replacement of reactor parts,
damaged and fatigued by the intense
radiation in the reactor.
Useful life of a reactor may compare
unfavourably with those conventional hydel
or thermel plants.
High cost of radioactive waste disposal.
F–3

Everyman’s Science Vol. XLVIII No. 1, April ’13 — May ’13
18
Final close down of plant
High cost of protection measures for reactor
parts after final shut down of plant, which
measures may have to be extended for
centuries.
B. National/Social hazards
Health hazards
Hazards of mining nuclear fuel.
Hazards of fuel processing and recycling of
nuclear fuels.
Hazards to personnel operating the reactor.
Environmental hazards
Atmospheric polution caused by leakage of
radioactive gases from reactors. Thermal
polution due to large output of heat to the
atmosphere in the cooling towers and to the
cooling water.
Environmental polution due to dispersal of
radioactive waste caused by geological
processes.
Disaster aspects
There is no fail safe system against nuclear
plant disaster
Typical nuclear power plant disaster is not
an explosion but is a core melt down, which
has actually happened.
C. Indian capability
Enrichment plant for U to be used in LWR
has yet to be established.
Heavy water production for use in existing
CANDU reactors has to be improved.
Very large dependence on foreign technology
and vital materials and components necessary
to install and operate a nuclear power plant.
Import of this technology and materials must
have political conditions attached, which is
a fact of life.
Indian U reserves are not sufficient, but Th
reserves are very large, which points to the
dangerous road of FBR technology.
The long lead time necessary to install
nuclear power plants makes it very unlikely
that nuclear energy can help in the deepening
energy shortage by the turn of the century.
Effective measures (legislative and executive)
probably have yet to be evolved for
mitigating the hazards of health, polution,
waste disposal; codes for nuclear security or
disaster have yet to be worked out.
I shall briefly comment on some of these aspects,
which have been listed above.
Radioactive hazards and waste disposal : A
3000 MWe nuclear plant generates, allowing for
monoperating periods, about 1200 kg of fission
products annually, occupying a volume of 4 ft3,
which present serious health and pollution hazards.
Some of the radioactive products, that are generated,
are
Ver long life : 129I(1.6 × 10⁷y), 99Tc(2 × 10⁶y),239Pu(2.4 × 10⁴y), 243Am(7.3 ×
103y), 240Pu(6.5 × 10³y),241Am(440y).
Long life (1y–100y) : 238PU(85y), 137Cs(30y),90Sr(28y), 244Cm(17y),3T(11.8y), 85Kr(10.6y),147Pm(2.52y), 155Eu(1.7y),106Ru(1y).
Short life (~ days) : 144Ce(290d), 95Zr(63.3d),91Y(52d), 89Sr(50.4d),131I(8.05d), 99Mo(67 hr),90Y(64.2 hr), 140(La(40.2 hr),127Te(9.35 hr), 129Te(74 min),144Pr(17.5 m), 106Rh(30 sec).
All these fission products reside in the fuel
except the gaseous products, which may leak out of
the fuel cladding materials through microcraks or
fissures caused by radiation damage and heat. So
great care has to be taken of
1. fuel transfer,
2. fuel storage for decay,
3. fuel transportation and
4. reprocessing of fuel in fuel cycling processes,
by which the fissile materials are extracted
for future use.

Everyman’s Science Vol. XLVIII No. 1, April ’13 — May ’13
19
To check for leak of gaseous fission products
constant monitoring must be imposed. Gaseous
radioactive products halogen and noble gas isotopes
are constantly removed from primary coolants and
kept in storage tanks for the radioactives to die out
before release to the atmosphere. The liquid wastes
are stored in storage tanks, continuously sampled
and monitored and released to rivers or seas, when
the safety limits of activities are reached. Thus
gaseous and liquid radioactive waste are ultimately
disposed off into the earth’s biosphere, which is
very undesirable. The disposal of soild radioactive
waste presents much more difficult problem. We
shall consider this a little later.
Fuel cycling : The spent fuel rods in a reactor
have to be processed so that U and Pu portions are
extracted. This makes a large amount of Pu available,
which by various clandestine methods - thefts,
hijacking, smuggling etc. - may contribute to nuclear
proliferation, resulting in many countries feeling
very pleased with themselves with a bomb or two
in their possession. It is very doubtful that hijacking
can be prevented against a determined bid by
kamakaze type of terrorists, to whom life is of no
consequence. Making of a bomb, once the weapon
grade Pu is obtained, is a much simpler problem. It
is not necessary to have a delivery system for the
bomb. Its parts can be smuggled into the enemy
territory system for the bomb. Its parts can be
smuggled into the enemy territory, assembled and
detonated by remote control. Apart from this hazard,
Pu239 has a half life of 24100y and is perhaps one
of the deadliest toxic substances made by man. If
it leaks to the environment it would create a
dangerous environmental situation. Fortunately Pu
does not move easily from place to place or from
one biosystem to another like 90Sr. some solutions
have been proposed for security of weapon grade
Pu :
1. One method is to have Pu always unseparated
from the fission products; infact a fuel fissium
(containing all the fission products) was
considered for the LMFBRs-this would make
extraction of Pu very expensive.
2. The second method considers a throw away
fuel cycle, i.e. Pu would never be allowed to
be recovered from the spent fuels — this
defeats the whole purpose of the FBR
systems.
3. The third method envisages generation of
nuclear energy in heavily guarded nuclear
parks where all the operations from mining,
enrichment, energy production, fuel cycling
and disposal are to be collectively done.
Solid radioactive waste disposal : Solid waste
are usually calcinated as phosphate glass or
solidified under spray solidification techniques. The
method of disposal are usually.
1. Retrievable surface storage system-the solid
wastes are stored in sealed canisters, about
1'-diameter and 10'-long, designed to stand
up to tornadoes, earthquakes, floods and
aircraft disasters. The storage is either above
ground allowing normal air cooling or in
water pool; such storage requires heavy
security arrangements;
2. Storage in geological formations, such as
salt mines, in canisters sealed off from the
biosphere; this would not need heavy security
arrangements, the only human surveillance
that is needed is that no drill holes are made
in the vicinity. Other geological formations
which may be suitable are basaltic formations
or ice structures.
3. The third method of disposal considers
shooting the radioactive wastes stored in
space vehicles to the sun; this is prohivitively
expensive.
4. The fourth method is to subject the wastes to
nuclear reactions to convert them to short
lived products; this will be also very
expensive and energy intensive.
Reactor accident : The hazards to populations
depend on the type and severity of the accident, the
degree to which the safety containment of the
reactor system performs successfully, the population
distribution in the vicinity and the meteorological
conditions. It must be noted that reactors can not

Everyman’s Science Vol. XLVIII No. 1, April ’13 — May ’13
20
explode like a bomb. What may occur, and what
nearly occured at the Three Miles Island, is a core
melt down. If the cooling system of a reactor fails,
or if there is a power transient, then the core melts
down and makes its way through the concrete floor
of the containment vessel to the ground below. It is
only that a then large release of radioactive fission
products to the environment is made possible. A
1000 MW LWR contains about 12 G curie
radioactivity in the form of fission products after
sustained operation. Of this the greatest hazards are
presented by 90Sr and 131I. If l/4th of the 131I comes
to the atmosphere, then the permissible
concentration over all America will be exceeded by
a factor of 2 upto a height of 10,000m. Half of the90Sr may contaminate the annual fresh water of all
America to six times the permissible limits. The
Rasmussen19 report examined the possibility of
reactor accident and concluded that the probability
of 100 or more fatalities from 100 reactors was 1
in 104 years, the same as being hit by a meteorite,
and the probability of 1000 or more fatalities from
100 reactors was 1 in 106 years, whereas the same
for meteorite was 1 in 105 years. But recent
experience and other analyses by various bodies of
scientists do not agree with these conclusions.
However the fact remains that because of the
extreme care taken for reactor safety, the overall
safety records of nuclear plants have been
outstanding.
ENERGY CONVERSION TECHNOLOGY OF
THE 21ST CENTURY20
Fusion Technology-Thermounclear
Reactions20 : Eddington21 posed the question in
his book: What is the mechanism that supplies
energy to the stars ? This question was solved by
Bethe22, Who proposed the famous C cycle as the
reaction system which release the energy necessary
to support the stellar structure. Man is now
attempting so simulate the stellar conditions in the
laboratory, and thereby evolve a technology for
energy condition, which if successful, may solve
our energy problem for all times to come.
Unfortunately, as in nuclear fission the bomb came
first. On November 1, 1952 a small coral island
Elugelab in the Eniwetok atou, 13 mile2 in area,
disappeared from the face of the earth, and the
world come to know of the hydrogen bomb “Super”,
Dr. H. J. Bhabha in his presidential address at the
first Geneva Conference (1955) on peaceful uses of
atomic energy predicted that fusion energy will be
in production for our use within two decades from
1955.
The principle involved in this technology is the
release of energy when very light nuclei come
together and fuse. The particle accelerators can be
used to accelerate the nuclei to the energy necessary
for fusion. However this method would be terribly
expensive and energy intensive. The other method
is to use very high temperatures, so that a large
fraction of the nuclei would have sufficient velocities
to overcome the Coulomb repulsion and fuse. The
temperatures at which fusion reactions take place
are of the order of M° K. Matter at such
temperatures is completely ionised and the name
plasma is given to this state. The power released as
a result of thermonuclear reactions is given by
Pf =
n1n2 < σ V> Q ergs/cm3 sec,
where Pf = power released by the fusion reactions,
n1, n2 are the densities of the colliding nuclear
species, Q = energy released by the reaction, < σ V >
is the value of the product of the cross section of
the reaction with the velocity averaged over the
maxwelliam velocity distribution in the plasma i.e.
< σ V > = )
X
' '
∞ σ − π ∫where M = mass of the target particle, m = mass of
bombarding particle and T = temperature in
kiloelectron volts. Thus for the DT reaction
19. Reactor safety study (WASH - 1400), National ResearchCouncil (usually referred to as the Rasmussen Report)1975.
20. I am indebted to Prof.S.K. Mukherjee for preparing thissection.
21. A.S. Eddington: Internal constitution of the star, CambridgeUniv. Press, 1926,
22. H. Bethe : Energy production in stars, Phys. Rev. 55, p.434 (1939).

Everyman’s Science Vol. XLVIII No. 1, April ’13 — May ’13
21
PDT = nDnT < σ V > Q × 10–7 Watt/cm3, Q = 5.6
× 10–6 ergs.
so that
PDT (T = 10 keV) = 6.2 × 10⁻²⁹ nDnT Watt/cm3,
PDT (T = 100 keV) = 4.5 × 10⁻²⁸ nDnT Watt/cm3,
Here temperature is measured in kiloelectron volts :
1 eV = 1.60 × 10⁻¹² erg.
We have also to consider a process which tends to
cool the plasma. This is the process of bremstrahlung
radiation by the electrons colliding with the ions of
the plasma. The rate of cooling by production of
bremstrahlung is give by
( ) ( )
$
_ _
ππ= ∑= 5.35 × 10⁻³¹ne ( )
_ ∑ Watts/cm3.
where ne and ni are the dentisties of electron and
ions in the plasma and Te is the electron temperature.
This rises as
whereas Pf rises much faster. At
a particular temperature the curves cut; above this
temperature the fusion release from the plasma
becomes selfustaining. This temperature is called
the ignition temperature Tig.
Some fusion reactions : The reactions which
are important from the point of view of astrophysics
are
1. C cycle :
12C + p(H1) → 13N + γ (γ ray),
13N → 13C + β+ (γ position) + v (neutrino),
13C + p → 14N + γ,
14N + p → 15O + γ,
15O → 15N + β+ + γ.
15N + p → 12C + α (He4),
4p → + 3γ + 2β+ + 2v + 26.6 Mev,
So effectively, four hydrogen nuclei are consumed
to form a nucleus of helium with liberation of
energy. This is the process that sustains the sun.
2. Proton-proton cycle :
[p + p → H2 + β+ + v + 4.2 Mev] × 2
[p + H2 → He3 + γ + 5.5 Mev] × 2
He3 + H3 → He4 + 2p + 12.8 Mev,
4p → He4 + 2β+ + 2v + 2γ + 24.4 Mev.
This reaction system sustained the sun at early
stages of its evolution.
It would be useless to try to simulate the above
reactions on earth to generate energy, because even
at the temperatures prevailing inside the sun, their
rates of reaction will be too slow under earth
condition. Only the huge mass of the steller body
keeps them going. Hence almost all the attempts to
simulate fusion reaction on earth are based on the
element deuteron, which (D ≡ H2) is relatively
abundant on our planet. It is estimated that the
amount of deuterium heavy water present in our
oceans is about 5 × 10¹⁹ gms. The different fusion
reactrions involving D are given below. In what
follows, σ denotes the cross scetion of the reaction
and Tig the ignition temperature.
1. 2D + 3T → n + α + 17.6 Mev,
αmax = 5 barn at 100 kev, Tig = 47 M°K. Note
that a carries away 20% of the energy.
2. D + D → n + 3He + 3.27 Mev,
αmax = 0.1 barn at 600°K, Tig = 400 M°K
D + D → p + T + 4.03 Mev,
3. Catalysed D reaction : It is basically the
above D-D reaction in which the reaction products
are also burned at the same rate at which they are
produced.
D + D → n + 3He + 2.27 Mev,
D + D → p + T + 4.03 Mev,
D + 3He → α + p + 1.83 Mev,
αmax = 0.7 barn at 600 Kev, Tig = 320 M°K
D + T → n + α + 17.6 Mev,
αmax = 5 barn at 100 kev, Tig = 47 million ºK
6D → 2α + 2p + 2n + 21.6 Mev,
Tig = 290 million °K. Note that α and p carry away
more than 60% of the energy.
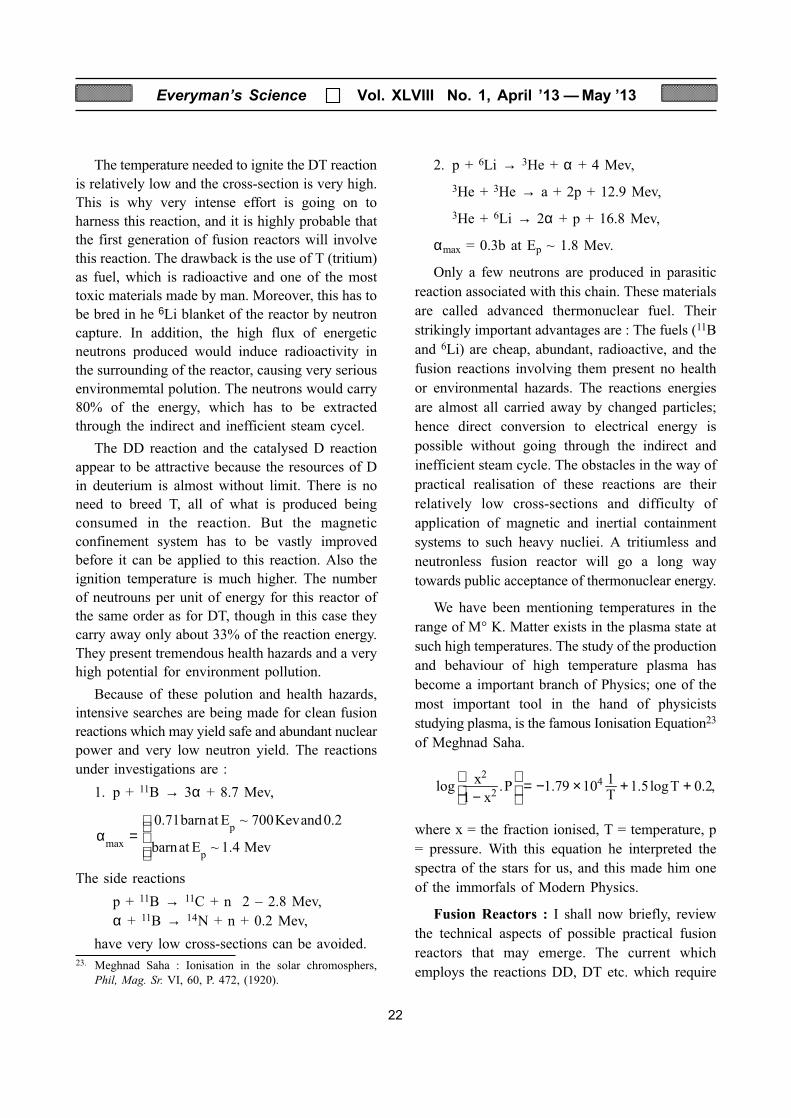
Everyman’s Science Vol. XLVIII No. 1, April ’13 — May ’13
22
The temperature needed to ignite the DT reaction
is relatively low and the cross-section is very high.
This is why very intense effort is going on to
harness this reaction, and it is highly probable that
the first generation of fusion reactors will involve
this reaction. The drawback is the use of T (tritium)
as fuel, which is radioactive and one of the most
toxic materials made by man. Moreover, this has to
be bred in he 6Li blanket of the reactor by neutron
capture. In addition, the high flux of energetic
neutrons produced would induce radioactivity in
the surrounding of the reactor, causing very serious
environmemtal polution. The neutrons would carry
80% of the energy, which has to be extracted
through the indirect and inefficient steam cycel.
The DD reaction and the catalysed D reaction
appear to be attractive because the resources of D
in deuterium is almost without limit. There is no
need to breed T, all of what is produced being
consumed in the reaction. But the magnetic
confinement system has to be vastly improved
before it can be applied to this reaction. Also the
ignition temperature is much higher. The number
of neutrouns per unit of energy for this reactor of
the same order as for DT, though in this case they
carry away only about 33% of the reaction energy.
They present tremendous health hazards and a very
high potential for environment pollution.
Because of these polution and health hazards,
intensive searches are being made for clean fusion
reactions which may yield safe and abundant nuclear
power and very low neutron yield. The reactions
under investigations are :
1. p + 11B → 3α + 8.7 Mev,
`
X|`\_` |XX`_X
`\_` '
α =
The side reactions
p + 11B → 11C + n 2 – 2.8 Mev,
α + 11B → 14N + n + 0.2 Mev,
have very low cross-sections can be avoided.
2. p + 6Li → 3He + α + 4 Mev,
3He + 3He → a + 2p + 12.9 Mev,
3He + 6Li → 2α + p + 16.8 Mev,
αmax = 0.3b at Ep ~ 1.8 Mev.
Only a few neutrons are produced in parasitic
reaction associated with this chain. These materials
are called advanced thermonuclear fuel. Their
strikingly important advantages are : The fuels (11B
and 6Li) are cheap, abundant, radioactive, and the
fusion reactions involving them present no health
or environmental hazards. The reactions energies
are almost all carried away by changed particles;
hence direct conversion to electrical energy is
possible without going through the indirect and
inefficient steam cycle. The obstacles in the way of
practical realisation of these reactions are their
relatively low cross-sections and difficulty of
application of magnetic and inertial containment
systems to such heavy nucliei. A tritiumless and
neutronless fusion reactor will go a long way
towards public acceptance of thermonuclear energy.
We have been mentioning temperatures in the
range of M° K. Matter exists in the plasma state at
such high temperatures. The study of the production
and behaviour of high temperature plasma has
become a important branch of Physics; one of the
most important tool in the hand of physicists
studying plasma, is the famous Ionisation Equation23
of Meghnad Saha.
^ |? X @^ X
= − × + + −
where x = the fraction ionised, T = temperature, p
= pressure. With this equation he interpreted the
spectra of the stars for us, and this made him one
of the immorfals of Modern Physics.
Fusion Reactors : I shall now briefly, review
the technical aspects of possible practical fusion
reactors that may emerge. The current which
employs the reactions DD, DT etc. which require23. Meghnad Saha : Ionisation in the solar chromosphers,
Phil, Mag. Sr. VI, 60, P. 472, (1920).

Everyman’s Science Vol. XLVIII No. 1, April ’13 — May ’13
23
temperatures in the range 107 to 109 °K. Such a hot
plasma would naturally tend to expand and cool.
Thus the important technical problem is how to
confine the plasma for the time necessary.
Confinements by various methods, which we shall
briefly mention later, have been employed to prevent
the hot plasma from coming into contact with the
walls of the containing vessel and thereby losing
energy. Confinement by a magnetic field has become
very important today. Such a problem is not faced
by the stars, for gravitation does the confinement
for them. There are problems of plasma instabilties
in a magnetically confined high temperature plasma.
We have mentioned that a hot plasma may lose
energy and cool by the bremstrahlung process. The
other sources of energy loss of plasma is by the
electron drag mechanism, by which the ion
temperature falls because of the cool electrons of
the plasma. Because of these loss mechanisms,
effort is made to confine the plasma for a short
time only, which is sufficient however for the
thermonuclear reactions to be effective. Thus the
fusion reactors working in the pulsed mode would
produce short busts of power. Lawson24 investigated
this problem and found that the condition of fusion
is given by a parameter N which is the product of
the ion density and confinement time of the plasma.
< _
= τ = < σ >
where n = number of ion/cm3, g = energy gain,
s = reaction cross section, v = ion velocity, T =
temperature, Q = the energy liberated in a single
reaction and k is the Boltzmann constant. For DT
reaction, kT = 10 keV and Q = 17.6 MeV, so that
the Lawson number N = 7 × 10¹³ sec/cm3 for the
break-evenpoint. For energy generation g 10,
then N = nτ = 7 × 10¹⁴ 1015 sec/cm3.
Confinement Techniques : The usual methods
employed to confine plasma are :
1. by magnetic field as mentioned above and
2. by inertial means where a fuel pellet is heated
more quickly thant the time taken for the
pellet to disintegrate.
Typical values of nt for magnetic confinement
range from 1014 to 1015 sec/cm3 for plasma densities
n 1014 to 1015 cm3 and τ 1 sec. For inertial
confinement τ 10–9 sec so that n 1025 to 1026/
cm3, which is the concentration for solids.
Magnetic Confinement : There are two principal
ways of confining a plasma by magnetic fields. In
open ended systems, magnetic mirrors are used in
which an injected plasma moves between the mirror
throats and is heated by magnetic compression
methods. Among the closed systems, the best known
are the toroidal pinch systems in which the magnetic
field is bent into a toroidal shape. The plasma
moves along the field lines in the torus and are
pinched to high compression by passing a large
electric current along the axis of the torus. This
current generates poloidal magnetic field which
confines the plasma and heats it. But this brings
along many types of instabilities in the plasma that
work against in their effective confinement. Many
modifications of the torodial and poloidal magnetic
fields have been adopted to control the current flow
in the plasma and contain the instabilities. One that
shows the best promise and is now the most widely
investigated, is called the Tokamak (toroidal
magnetic chamber), a machine pioneered in the
USSR during the sixties.
In a Tokamak, the poloidal magnetic field
produced by the current flowing through the
plasmas, is very weak compared to the toroidal
field. The plasma current is induced by an external
magnetic field by transformer action and produces
ohmic heating of the plasma. Though this ohmic
heating is the largest single factor for heating of the
plasma, supplementary means to heat further the
plasma upto the fusion temperatures are almost
always adopted. These are required because there is
a limit to the use of very high current densities no
account of the loweing of resistivity of plasma with24. J. D. Lawson : Proc. Phys. Soc. B70, 6, (1957).

Everyman’s Science Vol. XLVIII No. 1, April ’13 — May ’13
24
temperature anc the onset of instabilities with very
high currents. There types of supplementary heating
has been tested no Tokamaks :
1. heating by neutral beam injection.
2. heating by adiabatic magnetic compression
of the plasma, and
3. radiofrequency heating at ion-cyclotron
frequencies, at lower hybrid frequencies or
at the electron-cyclotran frequencies. Of these,
the neutral beam injection method has proved
by far the most successful one.
The early success of the Tokamak system led to
its widespread investigation, so much that in 1968
there were nine Tokamaks (all in USSR) and there
are now more than 100 operational Tokamaks in
USSR, USA, Europe, Japan and other countries,
and their performance parameters are being
constantly improved and are fast approaching the
values required the fusion reactors (N 1014 sec/
cm3 and Tion 108 °K). Some notable achievements
are : Alcator Tokamak at MIT achieved N = 3 ×
1013 sec/cm3. Princeton large Tokamak (PLT)
achieved energy confinement time τ = 100 ms and
Tion = 7 × 10⁷ °K. PLT also demonstrated the
success of the nuetral beam heating method. The
general experience is that the energy confinement
time increases with the dimension of the minor
radius of the torus. Hence there is an all out effort
to construct larger Tokamaks. Examples are—the
JET of the European community, the TFTR of
USA, JT-60 of Japan & T-10M of USSR; all are in
construction or design stages and are expected to
be operational by 1982-83. The key issues at present
are :
1. the impurity control in the plasma.
2. plasma fueling,
3. control of the instabilities,
4. the developments of high voltage beams,
5. the development of superconducting coils,
and
6. thermal burning of the fuel and its control. It
is to be understood that the development is
still very much in research stages and a
commercial fusion reactor of the magnetically
confineded plasma type is not expected to
come before the next twenty five years.
The other magnetic confinement systems (non-
Tokamaks) being tried as
1. mirror machines—the tandem mirror systems
and long linear systems with various end
plugging schemes,
2. mirror-torus hybrid systems : the Elmp
Bumpy Torus (EBT) and the Tormac,
3. reversed field systems : the field-reversed
mirror, the reversed-field Z-pinch, and the
Spheromak.
The state of art in the Tokamak give below in
table 2.
Table 2. Magnetic Confinement : Tokamarks
a = minor radius, discharge tube, (cm); R =
major radius (cm);
a* = minor radius, limiter, (cm); B = on-axis
torodial magnetic field (max), (kG)
COUNTRY
Laboratory Experiment a R B Comments
AUSTRALIA
Canberra LT-3 10 40 14 Low-q studies
BELGIUM
Lab.Plasma Erasmus 50×50 50 8.7 Low aspect
Brussels squeare ratio. R.F
heating
CANADA
Saskatchewan Stor 4 22 20 Turbulent
heating device
FRANCE Petula 15* 72 16-25 RF heating
studies
Grenoble Wega 16* – 15-25 heating
methods
GERMANY Asdex 40 164 30 Axially
symmetric
Fed. Rep. Divertor
Garching experiment
ITALY FT 21 83 100 High current
Frascati Dnsity,
High B

Everyman’s Science Vol. XLVIII No. 1, April ’13 — May ’13
25
COUNTRY
Laboratory Experiment a R B Comments
JAPAN JFT-2 25* 90 18 Small aspect
ratio.
Jaeri Iron core
JT-60 100 300 50 Large Tokamak
device–extends
tokamak para-
meters closer
to reactor para-
meters.
Tohoku Asperator <24 25 5 Small aspect
T-3 ratio, magnetic
plasma limiter.
The NETHER- Torture 9 45 20 Turbulent
LANDS heating
FOM–Jutphaas
UK
UKAEA— Dite 27* 117 27 Divertor and
Culham injection
USA MIT Alcator 9.5 54 100 High current
and particle
densities
ORNL Ormak 23 80 <30 Low aspect
ratio, with
neutral beam
heating
Princeton ATC 18 90 – Ohmic heating
Plasma Physics –11 –38 followed by
Laboratory adiabatic
compression
PLT 45 132 50 Large toroidal
apparatus of
Tokamak type
USSR
Kurchatov T-12 8×16 36 8 Cross-section
elongated along
main axis of
symmetry with
two poloidal
divertors
TM-3 8* 40 35 Studies of
thermal
insulation and
HF heating
Inertial confinement methods : The ideas,
here, is to heat the fuel pellets of fusion ignition
temperature by bringing into play on them a high
power beam, the energy of which is absorbed in the
outer less dense region of the fuel pellet, and then
transported to the highly compressed pellet core.
The pellets should be capable of achieving high
density to conform to the necessary confinement
times. The typical problems associated with this
method are :
1. development of the driver technology, and
2. planning an effective implosion sequence
and target design.
The driver requirements for a break-even case
for DT reaction are estimated to require energy-100
kJ and a power of 100 TW. To construct a large-
scale commercial reactor of 10 GW operating at 10
pps., a driver of a few MJ yield would be needed.
The different drivers at present under consideration
are :
1. high power laser beam,
2. relativistic electron beams (REB),
3. light-ion beams (LIB), and
4. heavy-Ion beam (HIB),
Laser driven fusion is one of the most difficult
but promising fusion schemes under development.
Laser produces very high instantaneous power
density over a very small area an thus can drive a
fuel pellet to ignition temperature and density. To
acheive success, the laser beam has to deliver most
of its energy to the fuel mass to compress the fuel
by implosion before heating it and before the shock
wave can disperse the fuel mass.
The state of the art is given in table 3.
Table 3. Interial Confinement
Place Name of Type & Laser Power Pulse energy Compression Neutron
Machine status TW kT gm/cm3 yield
1. Lawrence Argus Nd-glass, 4.5 2.2 Jh 0.5 2×10⁹
Livermore operating
Laboratory
(LLL)
Shiva –do– 26 10 100 1011
Nova Nd-glass, 300 500 300 1418
in construction
F–4

Everyman’s Science Vol. XLVIII No. 1, April ’13 — May ’13
26
Migma or Fusion with colliding Beams : The
concept of the Migma scheme is completely
different from the thermonuclear schemes. While
in the schemes described above, the idea is to heat
the plasma to produce thermonuclear reaction, the
Migma scheme is an attempt to achieve fusion
reaction by the collision of beam in intersecting
orbits. Based on the concept of intersecting storage
rings (ISR), developed in accelerator technology, in
“Migma” (a greek word for mixture) one single
accelerated beam is made to collide with itself. In
the Migma chamber placed in a magnetic field an
ion beam from a 3 Mev accelerator is injected. If
the strength of the magnetic field decreases
outwards, the ion orbit would exhibit precession in
addition to revolutions. If after one half precession
period, another beam is injected, the orbits will
continue processing in the head-on collision
configuratrion at the centre, with multiple traversal
factor of about 108/sec. In a preliminary design
called Migma III at the Migma Institute of USA, a
magnetic field of 60 kG and an acceleration power
of 60 kW are being planned. A prototype
demonstration plant generating continuous power
of 1 kW is expected to be in operation soon. The
greatest advantage of the Migma concept is that
advanced fuel can be used with the consequent
elimination of almost all radioactivities.
At the moment, the objective of simulating the
stellar conditions in terrestrial conditions seems
very remote. But if it is ever achieved and if it does
not give rise to environmental and ecological hazards
of such magnetudes that they cannot be controlled,
then we should have solved the problem of energy
for all times to come. Who would have thought that
there was so much in a glass of water. But like
nuclear fission, nuclear fusion may give rise to
unexpected surprises and problems, and it would
not be wise to be too optimistic. In any case the
perfection of this technology will not take place
before the 21st Century is well under way. Fusion
energy may not contribute to mitigate our immediate
energy crisis.
BIOCONVERSION OF ENERGY25
We have discussed the evolution of engines in
the hands of man. We should also consider the far
more wonderful energy converters that appear in
Place Name of Type & Laser Power Pulse energy Compression Neutron
Machine status TW kT gm/cm3 yield
2. Los Alamos TBS CO2, 0.8 0.8 0.04 105
Scientific in operation
Laboratory
Helios CO2, in 21 10.7 – –
operation
Since 1978
Antares in construction 200 100 100 1017
3. Limeil Coquelicot Nd-glass, 0.25 0.02 105
in operation
Camelia Nd-glass 1 – – 107
in operation
4. Osakha Gekko II Nd-glass 0.6 0.2 0.2 105
in operation
Gekko IV –do– 4 2 – 107
Gekko XII Nd-glass, 20 20 10-100 1014
in construction
Lekko I CO2, 2 0.2 – –
in operation
Lekko II –do– 1 1 – –
Lekko X CO2, 10 10 10-100 1014
in construction
25. This section has been prepared in consultation with my
colleagues Prof. N. N. Saha and Dr. S. K. Ghosh.

Everyman’s Science Vol. XLVIII No. 1, April ’13 — May ’13
27
the biologial world, which includes us. The
bioenergy converters are truly awe inspiring-self-
reproducing, self-regulatory and of very high
efficiencies. I shall only briefly describe two
systems :
1. the photosynthetic conversion system for solar
energy used by the plant kingdom, which
comes under the class autotrophs on which
we feed, and
2. the energy conversion system within us and
other members of the heterotroph class, which
convert the food to energy necessary for the
work that we have to do.
In living systems whether the energy is derived
from the sun or from the metabolism of organic
compounds, most of it is stored in adenosine
triphosphate (ATP) and used when needed. ATP is
transformed into adenosine disphosphate (ADP) in
a reaction, which is exergonic, liberating about 9
kcal/mole. By donation of the terminal phosphate
group to other molecules, ATP creates
phosphorylated speecies of high free energy, which
can participate in cellular reactions, that otherwise
could not take place. The transformation
ADP → ATP takes place at special sites in the
mitochondrial, the chloroplast and the bacterial cell
membranes. The specific mechanism of ADP
→ ATP is just beginning to be understood. It is
known that large proton concentration and
electropotential differentials are built up on two
sides of the membrane, and the energy released in
the various metabolic degradation is stored in these
gradients. In the chemiosmotic theory the debris of
metabolic degradations, mostly H+ and CO2, are
removed by specific transport mechanisms, which
are also responsible for the establishment of the
gradients. The protons accumulated outside the
membrane move in, and the ADP molecules are
phosphorylated, and the resulting ATP molecules
are transported out by the gradient. This is what
happens in the mitochondrial and bacterial cell
membranes. The process is reversed in the
membranes of chloroplast where ADP → ATP
transformations takes place outside the cell.
Every year the plants of the earth trap solar
energy by photosynthesis and combine about 150
GT of carbon with 25 GT of hydrogen liberating
about 400 GT of oxygen. Only 10% of the total
photosynthesis is carried on by the green plants,
the rest being done by algae, diatoms and
dinoflagellates in marine environments. Broadly
speaking what happens in photosynthesis in that
atomospheric CO2 is reduced recording to the
equation
6CO2 + 6H2O + hv (sum) → C6H12O6 + 6O2,
which is balanced by the reverse respiratory process.
C6H12O6 + 6O2 → 6CO2 + 6H2O + energy,
There are two major phases of photosynthesis.
In the first phase called the light reaction phase,
light is captured by the pigments i.e. chlorophyll
(chla), in the chlorosplast by a complicated
photoinduced electron transport mechanism working
through the cooperative interaction of two distinct
photochemically active systems. In the second phase,
the catalyser chla of the light reaction phase is
restored and the ADP molecule is transformed to
ATP. The carbon assimilation process in plants,
using the ATP so produced, goes through by way
of th Calvin cycle, which is broadly as follows :
2H+ + CO2 + 2NADPH + 3ATP + 3H2O →
Hexose + 2 NADP+ + 3Pi + 3ADP,
In green plants and algae, chlorophyll a and b
are mainly used with the maximum of absorption
of solar energy at 6500 Å and 6750 Å. Green
photosynthetic bacteria use chlorobium-chlorophyll
with absorption maxium at 7200 Å and 7470 Å.
Other types of bacteria use other types of
cholorophylls. The important difference in bacterial
photosynthesis is that no oxygen is produced and
the reactions take place only in the presence of
suitable oxidisable matter.

Everyman’s Science Vol. XLVIII No. 1, April ’13 — May ’13
28
For heterotophs, like members of the animal
kingdom, carbohydrate is the metabolite, and the
energy conversion takes place in two steps. The
first part of the carbohydrate metabolism is an
anaerobic process, called glycolysis, which is a
process left over from the early deveopments of
Evolution. The process in animal muscles starts
from starch or starch like polysaccharides which
produce glucose, and through a sequence of complex
reactions the glucose is converted to lactic acid.
Two molecules of ATP are needed to drive the
glycolytic sequence or reactions and four molecules
of ATP are finally produced i.e. Q ≈ 2 × 9 = 18
kcals/mole of energy is available to the cell. The
effective reaction is :
Glucose + 2ATP → 2 Lactic acid + 4 ATP,
∆G = – 54 kcal, Q = 18 kcal,
so that the efficiency of glycolysis is ;
η ≈
XX @
× =
In presence of oxygen the final product of
glycolysis is not lactic acid but two molecules of
pyruvic acid and ten molecules of ATP :
Glucose + 2ATP → 2 Pyruvic Acid + 10ATP +
2H2O,
∆G = – 140 kcal, Q = 8 × 9 = 72 kcal
In other organisms, the process of glycolysis is
slighly altered. In yest, for example, two molecules
of ethanol are formed instead of lactic acid.
In course of evolution the mitochondrion
appeared after about 23 G years, and the stage was
set of find metabolic pathways to use oxygen from
the environment. The second part of the
carbohydrate metabolism is the final development,
and is indeed an aerobic mechanism, enabling the
cell to call upon larger amounts of energies stored
in the organic molecules. What happens is that
pyruvic acid, which is now the final product of
glycolysis, is taken to further stages of degradation
through a cycle, variously called the Kreb cycle,
the TCA cycle or the citric acid cycle, to finally
produce carbon dioxide and water. The net effect
is :
Glucose + 2ATP → 2 Pyruvic Acid + 10ATP +
2H2O,
2 Pyruvic Acid + 6O2 → 6H2O + 6CO2 +
30ATP
Total number of ATP molecules produced in the
carbohydrate metabolism = 8 + 30 = 38, i.e. Q =
9 × 93 = 342 kcal. Also ∆G = – 688 kcal. Thus the
efficiency of the reaction is :
η = XX
@X× ≈
Had we constructed a heat engine working
between the normal body temperature 37°C and a
condenser temperature 20°C, we would have an
efficiency of only 5.5% which would mean only
about 38 kcal of the total of 688 kcal would be
usefully available. This demostrates our high
efficiency as bioengines.
I regret that I have no time to describe the other
wonderful aspect of the bioengines evolved by
nature, viz, their sensing and monitering systems
for rapidly changing external and internal
environments, together with the extremely efficient
autocontrol and regulatory mechanisms, which
evolution has incorporated within the system.
The complex sequence of equations described
above should not divert our attention from the basic
fact that, what is being achieved through all these
complexities is a very simple chemical reaction, viz
the combustion of hydrogen by combination with
oxygen, forming water. The carbon skeletons of the
metabolite molecules only provide a suitable
reservoir to store the energy of this combustion to
make it available when needed.
ENERGY POOLS OF EARTH
The principal energy pools of the earth from
which we draw energy, originate from the sun and
the earth acting separately and in conjunction. The

Everyman’s Science Vol. XLVIII No. 1, April ’13 — May ’13
29
nuclear fuels-uranium and thorium are found in
earth’s crust. In some regions of the earth there are
other sources of energy which are classed as
geothermal energy (volcanoes, hot rocks and hot
springs). The earth, in conjunction with the moon,
produces tides and tidal currents. The atmosphere
of the earth heated by solar radiation generates
winds, which also have served the energy needs of
man. In the materials drap within the earth, man
has loked for fuels. We are searching for a
technology to liberate energy out of earth’s water
by the fusion process and also for a technology for
cheap production of hydrogen the emerging fuel.
But in the immediate past, for more important were
the pools created by the sun. We have seen how
nature has worked out wonderful conversion
mechanisms to store energy in the living bodies.
The living bodies, after death and passage of
millions of years, are converted under suitable
conditions into the fossil fuels, which have been
our main energy source so far. We are considering
also how we can ourselves transform solar energy
to a form directly and immediately useful to us.
Some of the pools-the pools of fossil fuels and the
nuclear fuels, are of limited dimension and therefore
of limited duration. The biological pools like those
derived form the forests and the vegetables and the
animal wastes are replenishable. Other pools, which
depend on earth’s internal heat and sun’s radiated
energy, are eternal for all practical purpose.
GROWTH RATES AND MODELS FOR
WITHDRAWAL FROM LIMITED STOCK
Before we consider the next part of the theme,
a word about growth rates is necessary. There are
many ways of estimating growth rates. One methods
is by the index number Kn
Kn = 100 Pn/Po, (1)
where Po is the value of what is to be estimated at
some selected fiduciary year and Pn is the value
after n years. If the growth is according to an
annual compound rate x% (x = APGR = annual
percentage growth rate) then the growth is
exponential
)__
_
XXλ+= =
where λ = 1n (1 + x/100) year–1
The APGR x is given by
x/100 = anti log [(log Pn – log Po)/n] – 1 (2)
The doubling time is given by
τ = log2/log (1 + x/100) year.
The cumulative sum Sn is given by
)_ _
_
XX
XX
+ = = + − ∑ (3)
If we have a reserve R of some commodity and the
production at t = 0 is Po and the APGR is x%, then
the time when the reserve is exhausted is N years
where
)
< ^ ^
XX XX
+ = + + (4)
This equation will be used in this study for
making estimates of the life time of the reserves.
For source limited growth the production curves is
not exponential but has the shape of a bell i.e. the
production rises, reaches a maximum and then
declines. A model of this type has been given by
Elliot and Turner26. According to this model if S is
the cumulative production, then the annual
production P = dS/dt is given by
)
λ = − (5)
where R = the lutimate resource produced and λ =
a constant. The first factor on the right takes care
of the demand, and the second factor depends on
the remaining supply. This equation integrates to
α−λ=+ (6)
where α is the constant of integrations. The
maximum production occurs at t = tm when dP/dt
= 0 i.e. S(tm) = R/2. This gives26. M.A. Elliot and N. C. Turner : American Chemical Society
meeting, Boston, Massachusetts April (1972).

Everyman’s Science Vol. XLVIII No. 1, April ’13 — May ’13
30
α = ltm/R (7)
i.e.
−λ −=+ (8)
The annual production is given by
P =
−λ −−λ −
α+
= Poeλt/R as t → 0, λ/4 as t → tm, 0 as t → ± ∞,
where Po = P (t = 0) = ( )
λ
λλ+
The curve
S(t) rises with t, passes through the value R/2 at tmand reaches a saturation value R as t → ∞. The
curve P(t) first grows with t, reaches a maximum at
tm and then decays to zero as t → ∞. The estimate
of the time of exhaustion of a fuel supply depends
on the time when P effectively vanishes. The
parameter λ may change with time with
development of technology of fuel recovery and
production. The parameter R depends on total
resource available with a given recovery technology.
There are other similar models (Hubert27). I shall
not however use these models, for in the first place
the parameters for mining of various fuels in India
are yet to be estimated, Moreover, what predictions
I have to make do not need such a refined time
analysis; infact the production of various fuels in
India seem to follow, at least for the present, the
exponential growth. It will, therefore be sufficient
to adopt a simple exponential growth for which
equation (4) will do.
FUELS
The nonrenewable fuels that are most widely
known are : fossil fuels — coal, oil, natural gas, oil
from shales and tar sands and the nuclear fuels —
uranium and thorium. These fuels are handled by
normal market procedures and are therefore known
as commercial fuels as distinguished form
noncommercial fuels-firewood, animal dung and
vegetable waste, which are seldon bought or sold
and are gathered by consumers. In estimating the
fuel resources certain distinctions are made. When
assessing the total fuel recoverable from the deposit,
there are many economic and technological
considerations whether the mine can be worked.
Even if the mine is worked, it can be worked only
for some limited time after which the existing
recovery technology becomes too expensive. The
resources which can be immediately recovered by
normal techniques are the reserves. The parts which
can be recovered at some future date, when it is
economic to use more expensive technology, which
may exist or may have to be developed, are called
the submarginals or the indicated resources. Thus
when we say that a particular resource is exhausted,
the statement is to be understood against the
economics of available recovery technology. There
may be quite an amount of resources still left in the
deposits, but it may be too expensive to recover it
for consumption. In addition there may be other
deposits not yet discovered, but for which sufficient
geological evidence exist. These are called inferred
resources.
I shall now speak about each individual fuels,
and describe the global and Indian reserves,
submarginals and inferred resources and the various
processings to which they are required to be
submitted.
FOSSIL FUELS
Coal : Coal is a type of rock consisting of plant
organic material, occuring as individual beds with
sandstones, shales and clays in a sedimentary
sequence. In different geological ages, mainly in
the Carboiniferous period, plant materials were
deposited in inland bogs, coastal swamps and the
river deltas. In course of millions of years, through
burial and consequent rise of temperature and
pressure, the organic matter was compacted, and in
presences of moisture and absence of air, underwent
fermentation processes, and passed through various
stages of codification. The various stages are, on
water and air free basis
27. M. K. Hubert : Energy resources for power production in
environment aspects of nuclear power stations, Vienna
International Atomic Energy Agency p 13-43, (1971).

Everyman’s Science Vol. XLVIII No. 1, April ’13 — May ’13
31
1. Wood :C~51%, H~6%,O~43%,
2. Peat : C~60%, H~6%, O~34%,
3. Lignites : C~66%, H~6%, O~28%,
4. Subbituminous coals : C~75%, H~5%,
O~20%,
5. Bituminous coals : C~91%, H~4%, O~5%, .
6. Anthracite : C~96%, H~3%, O~l%,
The calorific values change as follows
1. Wood : 7747 Btu/lb,
2. Peat : 7030 Btu/lb,
3. Lignite : 7000 Btu/lb,
4. Subbituminous coal : 9500 Btu/lb,
5. Bituminous : low volatile 14000 Btu/lb, high
volatile 13500 Btu/lb,
6. Anthracite : 12700 Btu/lb.
Coking coals are used for metallurgical purposes,
and is produced by dry distillation and incomplete
combustion of coal to boil off the volatile matter
with enrichment of the carbon component. Not all
coals can be cokified. Charcoal was earlier used in
metallurgy and was produced by charring wood. In
India coal occurs in two stratigraphic horizons28 :
1. the lower Gondwanas of the permian age,
and
2. the coal and lignites of the Tertiary age.
The Gondwana coals are set in the basin like
depressions of older formations and are aligned
along four main river valleys :
1. Damodar-koel,
2. Sone-Mahanadi,
3. Pranhita-Godavari and
4. Satpura basin. Outside these river basins are
the coal fields of Rajmahal Hills and the
Deoghar group.
All these are found in the golden triangle defined
by the 24° N latitude line, 78° E longitude line to
16° N latitude and then to 88° E. The tertiary coals
are best developed in the north eastern region. The
lignites are found in Kashmir, Rajasthan, Gujrat
and Tamilnadu. Unfortunately, no new coal fields
have been found recently.
Coal exploration techniques are the normal
geological prospecting techniques. Recently
geologging techniques, measuring resistivity, density
and γ-radioactivity, are also being employed. Coal
mining methods depend largely on the orientation
of the coal seams with respect to the surface. The
usual methods for underground mining are :
1. room and pillar method,
2. long wall technique, and
3. short wall technique.
The tecniques of surface mining are :
1. cover area stripping,
2. contour stripping and
3. Auger mining.
A concept tried experimentally in USSR and
USA viz. underground gasification of coal, is worthy
of consideration because :
1. the products are cheaper on account of low
investments,
2. environmental perturbations are smaller,
3. mining hazards are avoided and
4. a possibility opens of going to very great
depths.
In India 25-27% of the coal comes from surface
mining. The low scale of wages, the necessity of
generating employment, and the scarcity of capital
and various technical reasons, have dictated the
very primitive methods followed. The stripping of
open cast mining is only 3 : 1, and the average
output is 0.3-2.5 MT per annum from a mine.
Underground mining employs bord and pillar
method, though recently the long wall technique
has been tried. The mining equipments are also
very primitive. By 1973 all Indian mines, excepting
a few captive mines, have been nationalised. It is a
matter of great regret that nationalisation has not
effectively improved mining of coal in India or its
distribution and avilability.28. T. N. Basu and T. P. Basu : Coal resources and extraction
technology in india.

Everyman’s Science Vol. XLVIII No. 1, April ’13 — May ’13
32
Coal is classified in a variety of ways :
1. by type depending upon the plant type which
generated it and the geological modification
that followed.
2. by rank to indicate the degree of
metamorphism and finally
3. grade to describe the composition of
impurities in it.
Very powerful methods have been developed to
determine the above characterisations of coal29. In
India though all types of coal are available, very
little care is taken to characterise them, which
lessens their utility for a particular end use. There
is a great shortage of coking coal in India, all of
which comes from only one particular mine in
Bihar. Infact we have started importing coking
coal.
GSI estimated in 1976 the coal and lignite
deposits in India for seams 1.2 m and above, and
upto depths of 600 m as given in the following
table.
Indian Coal Resources (in GT)
Proven Submarginals Inferred Total
Reserve
Prme coking 3.25 1.59 0.46 5.30
Medium coking 3.79 4.27 1.31 9.38
Semi to weakly
coking 1.21 2.60 0.91 4.72
Total coking coal 8.25 8.46 2.68 19.40
Noncoking coal 12.49 23.61 28.25 64.35
Total coal 20.74 32.07 30.93 83.74
According to the recovery technology used in
Indian mines, only 55% of the noncoking coal in
extractable, of which 25% has to be rejected because
of high ash content, reducing the usuable percentage
to 0.75 × 0.55/100 i.e. 41% only. For coking coal
this figure is still lower viz. 29%, because of the
loss at washeries. This gives the recoverable coking
coal as 29 × 19,40/100 = 5.62 GT, and the
recoverable noncoking coal as 41 × 64.35/100 =
26.38 GT. Thus the total recoverable coal is only
32 GT.
According to the estimates of the workshop of
alternative energy strategies (WAES)30, the global
coal reserves and resources in 1974 are as follows
Global Coal (in GT)
Proven reserves Total (Reserve + Submarginals
737 + Infrared)
1327
Thus India has only 2.8% of world’s proven
reserves of coal and only 6.3% of world’s total
resources of coal.
Coal conversion technology : Coal is not
convenient for many end energy uses; transport,
domestic and agriculture sectors are examples. It is
some times imperative, particularly in the
background of oil scarcity, to convert the coal into
liquid or the gaseous forms for convenience of
transport and domestic consumption. The basic
reactions of coal gasification are
1. Hydrogasification :
C + 2H2 → CH
4Coal methenation
\`_ Z `\
+ → + + → +
2. Catalytic shift conversion
CO + H2O → CO
2+H
2
3. Catalytic methenation
CO + 3H2 → CH
4 + H
2O
These are the basic processes, and many
production methods are on trial or in course of
development. The idea is to enrich the methane
content of the gas produced, or alternatively to
extract the hydrogen itself as the output fuel. The
main systems are
1. hydrogasifier systems,
2. steam-iron systems and
3. electrothermal systems.
29. B. R. Cooper : Research challenge-clean energy from coal,
Physics Today Aug. 1978.30. Energy : Global prospects 1985-2000. Workship of
alternative energy strategies Me. Graw Hill Book Co.

Everyman’s Science Vol. XLVIII No. 1, April ’13 — May ’13
33
There are three basic ways to liquify coal :
1. addition of hydrogen,
2. depletion of carbon (pyrolysis), and
3. breaking coal down to individual carbon
atoms and resynthesising to desired liquid
fuel.
In this area intense global R & D work is going
on, and in India also we must immediately intensify
the research already started. Sir J. C. Ghosh had
initiated a number of studies on this subject by a
number of committees of the Government. We may
mention some projects which are going on abroad;
coal gasification — Atgas, Bigas, Cogas, Hygas,
hydrane, Synthane; coal liqufaction; COED,
CONSOL, H-coal-process, hydrosulphurisation,
Meyer’s process, solvent refined coal process,
Synthoil.
Oil and Natural Gas : Petroleum is the general
name of the liquid form of fossil fuels. Decay of
plants and animal matter in ancient marine
environments in course of million of years gave
rise to oil and natural gas.
Oil prospecting technology is very sophisticated,
employing seismic and magnetic measurements for
detection of rock structure formations, which are
capable of bearing oil deposits. The technology is
so well developed, that it is possible to prospect
and extract oil from the deposits on the continental
shelves and deep oceans. Recently satellites like
Landsat are being used for oil prospecting by
remote sensing methods.
In India the petroleum geologists have marked
27 basins on land and offshore - a sedimentary area
of about 1.41 M km2 on land, and 0.26 M km2
laying within 100 m isobath of offshore shelf zone.
Most successful has been the exploration and oil
extraction in Assam-Arakan area and the Cambay
basin. In the later basin, the recently discovered oil
deposits in Gujrat and the Bombay high structure
are well known. The rate of discovery of new oil
deposits seems encouraging.
Oil recovery technology is very well developed.
In the primary method, oil is driven out of the well
by the pressure of the deposits inside the well.
Other methods are:
1. stimulation by fluid injection,
2. reduction of viscosity of oil by mixing with
gases and surfactants,
3. thermal stimulation by steam injection,
4. underground ignition and
5. acidisation.
Nuclear stimulation has been tried in USA to
fracture oil bearing rocks, but public opinion, there,
is against this technology.
Products from oil refineries are vital in the
economy: Liquid Petroleum Gas (LPG), gasoline,
kerosene and air turbine fuels, gas oils, High
Speed Diesels (HSD), Light Diesel Oil (LDO),
fuel/furnace oils, lubricating oils and greases, and
petroleum coke are some of the petroleum products.
Because of the convenience of use and easy and
cheap availability prior to the OPEC embargo in
1974, there was a dramatic global switch over from
coal to oil in the sixties, and India also followed
suit. In absence of oil all these products must be
substituted by coal derived products.
According to an estimate by ONGC made in
1978 the total resources of oil and natural gas,
including the reserves, the submarginals and the
inferred resource are shown below
Indian Oil and Natural Gas
Oil (GBbl) Natural gas (Tft, 3)
2.06 GBbl ≡ 282 MT 3.4
WAES31 gives the global reserve of oil as follows
Global Oil and Natural Gas
Oil Natural gas
Proven reserve proven reserve
(GBbl) (Tft)
658 2352
31. Energy : Global prospects 1985-2000. Workship of
alternative energy strategies Me. Graw Hill Book Co.
F–5

Everyman’s Science Vol. XLVIII No. 1, April ’13 — May ’13
34
Thus India has only 0.3% of world’s oil reserve
and 0.15% of world’s natural gas reserves.
HYDROGEN-THE FUEL OF THE
IMMEDIATE FUTURE32
It is clear that prospects for conventional fossil
fuels for this country are not bright, though the oil
gap may be attempted to be met by ethanol from
biowaste, the possibilities of which we shall discuss
while considering the technology of using biomass
for energy. We have therefore to look for some
radically new fuel, and this brings us to hydrogen,
the emerging fuel.
The element hydrogen, which is so abundant in
the universe, is ninth in abundance by weight in the
earth’s crust. It is found in many organic and
inorganic substances on earth, but most of it exists
in the form of water, which is therefore the ultimate
source of this fuel. The calorific value of hydrogen
is 68.32 kcal/mole at 25°C, which compares well
with those for the fossil fuels. It is an ideal fuel in
the sense that it is non-polutant, the production of
combustion being water which is good for the
environment.
The present methods of production of hydrogen
are :
1. coal gasification, which we have mentioined
already and which is Of limited use because
of limited availability of coal, and
2. various water cracking methods :
a. electrolysis,
b. thermal decomposition,
d. hybrid methods, and
e. photolysis.
The most promising of all these methods is the
thermochemical cracking of water. The major
difficulty is the high Gibb’s energy for the reaction.
H2O + H2 +
O2,
Thus to get any appreciable reaction rate from
this reaction very high temperatures would be
needed. The problem has been solved by achieving
the target through a number of intermediate steps
with simaller Gibb’s energies, which permit the
intermediate reactions to run efficiently at lower
temperature. A very encouraging reaction system
examined by Marchetti33 and called by him Mark
I, is
a. Mark I reaction system
CaBr2 + 2H2O → Ca(OH)2 + 2HBr (730°C),
Hg + 2HBr → HgBr2 + H2 (250°C),
HgBr2 + Ca(OH)2 → CaBr2 + H2O + HgO (200°C),
HgO → Hg +
O2 (600°C)
Many other cycles have been proposed :
b. Cl2 + H2O → 2HCl +
O2 (800°C),
2HCl3 + 2VOCl → 2VOCl2 + H2 (170°C),
4VOCl2 → 2VOCl + 2VOCl3 (600°C),
2VOCl2 → 2VOCl + Cl2 (200°C),
c. Cl2 + H2O → 2HCl +
O2 (800°C)
2HCl +
S2 + 2FeCl2 → H2S + 2FeCl3 (100°C),
H2S → H2 +
S2 (800°C),
2FeCl3 → 2FeCl2 + Cl2 (420°C),
d. 2H2O + SO2 + xI2 → H2SO4 + 2HIx (27°C),
2HIx → xI2 + H2 (77°C–177°C)
H2SO4 → H2O + SO2 +
O2 (827°C–927°C)
Ix represents a mixture of several polylodides.
A typical plant employing cycle d) may produce
hydrogen at the rate of 40 g mole/h. The empirical
overall efficiency of hydrogen production is defined
by
` `_ _Z ^Z
`^ ` _ Z\ \_ Z ∈=
32. I have received help in preparing this section from mycolleague Dr. B. G. Ghosh
33. C. Marchetti : Chemical Economy & Engineering Review5, (1973); G. de Beni and C. Marchelti : A chemicalprocess to decompose water using heat, Am, Chem, Soc,Meeting, Boston, 9 April (1972).

Everyman’s Science Vol. XLVIII No. 1, April ’13 — May ’13
35
The efficiency of the various hydrogen
production cycles are still under study. Marchetti
expects efficiencies in the region of 45-50%. So far
cost of production is concerned, it is expected to be
in the region of $ 1.50 per MBtu, which may be an
assessment on the high side. Solar energy can be
utilised in the sulphu-iodine cycle d) to produce
hydrogen.
The classical method of splitting water is of
course electrolysis but this is too heavily electricity
intensive. The main motivation of the RεD in this
area is to reduce the electricity input by considering
the thermodynamic aspects of the reaction. Indeed
it is possible to devise a system working at about
1000 °C, in which 46%, of the energy for the
cracking of water would come from thermal sources.
Improvements for reaction kinetics at the electrodes
are also going on at a quick pace.
In the hybrid cycle some of the reactions in a
cluster of reactions in the thermo-chemical
decomposition of water are not driven thermally,
but are carried on in an electrolytic cell. One
potentially successful hybrid cycle was proposed
by Schultz and Fiebelmann34.
SO2
+ Br2 + H
2O → 2HBr + H
2SO
4,
2HBr → H2
+ Br2,
H2SO
4 → H
2O + SO
2 +
O2
The prospects for hybrid cycle production of
hydrogen seems quite bright.
Photolysis of water by absorption of solar
radiation in region of wavelength 1800-1900 Å
does not seem very promising; however if fusion
reactions develop they may provide a suitable source
of necessary photons for photolysis.
The public mind has not yet accepted hydrogen
as a possible energy fuel because of its possible
hazzards. But careful work has shown that as a fuel
hydrogen can be safer than coal gas provided
ceartain precautions are taken. Hydrogen has already
been adapted in internal combustion engines for
providing motive power for road and air transport.
Its use for rocket propulsion is well known.
Hydrogen can be efficiently stored as hydrides and
in the lattice structures of certain rare earth metals.
The following table gives the ratio of weights/
volume of hydrogen container to gasoline container
for the two fuels of same energy.
Storage type By weight By volume
(inclusive of weight
of container)
Gas at 200 psi 15.0 24.5
Metal hydride 4.6 4.0
(Magnesium hydride
with 40% prosity)
Liquid hydrogen 2.4 3.8
Hydrogen can be also piped to the user in
conventional pipelines as has been demonstrated in
some countries in Europe. A very important
nonenergy use of hydrogen is the possibility of
using it in place of coke for metallurgy as a
reducing agent. The water pool from which
hydrogen can be drawn is of almost limitless
dimension, and is constantly replenished by its
combustion in course of use. Hydrogen can indeed
be called the fuel of the immediate future. We shall
see that unless intense RεD is started on hydrogen
production and utilisation technology immediately,
we shall be in serious trouble after 1990.
FUEL CELLS
Fuel cell is a very old concept given by Grove
in 1839 which received renewed attention because
of its success in space programmes. It is a galvanic
energy conversion device, circumventing the
limitations of the Carnot cycle. The energy is
supplied in the path : Chemical energy—electrical
energy, and an efficiency 100% can be theoretically
expected. The overall chemical reaction is :
34. Schulz, G. and Fiebelmann, P. ‘Electrolysis of hydrobromic
acid, 2nd World Hydrogen Conference, Zurich, August
(1978).

Everyman’s Science Vol. XLVIII No. 1, April ’13 — May ’13
36
fuel + oxidant → reaction product + heat,
Anode : fuel → fuel oxidation product + ne,
Cathode : oxidant + ne → oxidant reduction
product.
Also, ∆G = – nFE = ∆H – T∆S, where F =
Faraday constant, E = electric voltage across the
cell. The change of chemical energy Q = – ∆H.
Thus efficiency of the fuel cell is
_ !
∆ ∆η = = = −
Theoretically the efficiency achieved is much
higher than what is possibe for thermal engines.
Some typical reaction systems used in fuel cells are
given in the following table.
Some reaction systems under tiral for fuel cells
T = 300°K T = 900°K
Basic reaction n E ηηηηη E ηηηηη(volts) (volts)
C + O2 → CO2 4 1.02 1.00 1.02 1.02
2C + O2 → 2CO2 4 0.70 1.25 0.98 1.75
2CO + O2 → 2CO2 4 1.33 0.91 1.06 0.72
CH4 + 2O2 → CO2 + 2H2O 8 1.04 1.00 1.04 1.00
2H2 + O2 → 2H2O4 4 1.18 1.94 1.03 0.80
It is seen from the table that η may be > 1. We
shall illustrate by analysing the reaction representing
the combustion of hydrogen at 150°C. The
thermodynamic potentials in the steam cracking
reaction at 150°C.
H2O (gas) → H2 + O2,
are35 ∆H = 58.14 kcal/mole, ∆G = 52.99 kcal/mole
and ∆S at this temperature is 12 × 10–3 kcal/mole.
Therefore,
∆∆ at 150°C =
X@
−× × = 0.087.
Thus the efficiency of the fuel cell for hydrogen
system at 150°C i.e. 423°K
η = 1 – 0.087 = 0.913 or ~ 91.3%
The thermodynamic efficiency of a fuel cell,
therefore, depends on the magnitude and the sign
of the entropy change during the reaction.
Accordingly, when gaseous substances are
consumed in course of the reaction, entropy of the
system may be expected to decrease, and the
theoretical efficiency would be smaller than unity;
when gaseous substances are formed the opposite
effect is observed. Of course, the practical efficiences
of the existing fuel cells are much lower than
theoretical values, but these values greatly exceed
the efficiencies of heat engines.
Important consideration in determining the
usefulness of fuel cells as an electric power source
are the fuels, their cost, availability, energy density,
toxicity, handling problems like transporation and
storage, It is not possible here to discuss the various
chemical systems and fuel cell designs which are
under trial. some of these are given in tables 4 and
5. The prospects are indeed very bright. The
important features of a fuel cell on its credit side
are :
1. there is no moving part in the cell,
2. It is highly efficient,
3. it is a silent device,
4. it can be made on modular principle, and
5. it can be switched into use or switched off
immediately and need no idling time.
However, the power density output is low,
rarely exceeding 1 kW/kg.
Coal fired fuel cells may be useful for central
electricity production. Though the first entry or
hydrogen in energy economy is expressed to be
through internal conversion engines, the final form
of the transducers fed by hydrogen energy may
well be the fuel cells because of their higher
efficiency. Fuel cells will be used wherever portable
power plants are necessary and in sectors where
silence and avoidance from polution are desired. In
the urban sector fuel cell powered vehicles may
ultimately replace the internal conversion engines
that are in use today and against which there is so
much objection from environment protectionsist.
35. J. O. M. Bockris Energy : The solar hydrogen alternative
p. 159. The Architectural Press, London (1979).

Everyman’s Science Vol. XLVIII No. 1, April ’13 — May ’13
37
I cannot stress too much that intense RεD is
necessary in the area of fuel cells and in the allied
field of electrode developments.
FUEL FROM BIOMASS
Search for alternative sources of energy basin in
recent years focussed attention on the energy
possibilities of biomass derived from both land and
aquatic sources.
Biowaste : An important component of biomass
is biowaste which can be classified in the following
boad groups :
1. agrowaste-sugar cane trash, weed, crop
stubble, straw and spolied fodder,
2. agroindustry waste-oil cakes, baggase, rice
brans, tobacco wastes, fruit wastes and
vegatable processing wastes, tea wastes, jute
wastes, textile industry wastes,
3. forest litters-twigs, branches, barks and leaves,
4. acquatic biowastes-marine algae, sea weeds,
water hyacinths,
5. human waste-facces, urine and other wastes
and
6. animal wastes-cattleshed wastes (durg, urine,
general litter), poultry litter, sheep and goat
droppins, slaughter house wastes (blood and
meat), fish waste, leather and wool waste.
Many of the waste materials have very important
nonenergy use as source of organic manures and in
paper and hard board industry. But in recent years,
because of the possibility of obtaining methane
from these wastes by anaerobic fermentation, these
materials have achieved the status of important
sources of energy.
Table 4. Advanced Fuel Cell Systems
Electrolyte Reactant Electrode Heat & water Cell construction and
catalyst removal observation
Alstholm KOH Hydrazine Ag/Co Circulating Nonporous electrodes density
(France) (N2H4 - H2O2) electrolyte packed, surface coating cat.
Engelhand Mineral Cone Impure Pt Air or circulating Hydrophobic electrode matrix
Chemicals Corp. H2PO4 H2-air Metal coolant type construction bipolar stacking
operates at atm. press.
Siemens Ag. KOH H2 – O2(air) Raney Circulating Cat. layer supported on asbestor
(Germany) Ni/Ag electrolyte sheet, operates at 1 atm. press
Varta KOH H2 – O2 (air) Raney Circulating Electrodes of carbonized Ni
(Germany) Ni/Ag electrolyte substrate with embedded Raney
catalyst, operating 1 atm.
Pratt & Whitney KOH H2 – O2 (air) Pt. metal Evaporative Matrix-type construction
Division, United Ag cooling
Tech. Corpn.
Pratt & Whitney Cone. impure Pt. metal Air or air with Detail not published
Division, United H2PO4 H2 — air circulating cooling
Tech. Corpn
Table 5. Synthetic fuels for fuel cells
Fuel Storage Basic reaction Hazards
Hydrogen 200 Compressed None Hazardous
atms guage gas famable
pressure gas
Reversible Solid Hydrogen release
hydride (Fe, FeTiH0.1+H2 →Ti-hydride ect) FeTiH1.95
Non reversible Solid Reaction with Flamable
solid hydride water CaH2 +2H2O solid
(CaH2) → Ca(OH)2 +2H2O
Methanol Liquid Steam reforming Hazardous
at 200°C CH3OH flamable
+ H2OC2 + 3H2 liquid
Anhydrous Compressed Thermal cracking Hazardous
NH3 liquid at 750°C 2NH2 material
→ N2 + 3H2 poisonous
liquid
Hydrazine Liquid None –
hydrate

Everyman’s Science Vol. XLVIII No. 1, April ’13 — May ’13
38
Anaerobic degradation of plant waste depends
on its cellulose content. The presence of lignin is a
nuisance, for it is nonbiodegradable and protects
the cellulose from bacterial attacks. The
biodegradation takes place in three stages :
1. anaerobic bacteria bearing cellulolytic,
lipolytic and proteolytic potency convert the
cellulose, the lipids and the proteins into
soluble monomers;
2. these then serve as the substrates for the
microorganisms for conversions into soluble
organic acids-mainly acetic acid; and finally
3. these acids are reduced by hydrogen or formic
acid, generated by other bacteria, and
converted to methane. If efficiently run 8–9
ft3 of gas containing 60% of methane per Ib
of biomass can be obtained. The sludge after
biogradation contains noncellulosic materials,
mainly ligin, which can be used as manure.
All over the world the production of methane
from animal waste has aroused considerable interest.
In India by the middle of 1973 about 6250 so
called gobar gas plants have been set up under the
supervision of KVIC in various Indian states. We
give a rationable of a typical plant and analyse the
economic benefits from it. The basic data on drug
outturn of Indian cattle is taken from Meghnad
Saha’s36 very last paper published posthurously.
Gobar gas plant is a multiproduct output unit in
which a fuel of low quality is transformed into a
fuel of high quality together with a sludge which
has merits as a manure, so that here is a case of
having the cake and eating it too. We give an
analysis of the advantages of conversion of dung
into biogas and sludge.
36. Meghand Saha. Fuel in India. Nature p. 923 May 19, 195637. Survey of rural energy consumption in northern India,
National Council of Applied Economic Research.38. C. N. Acharya, Organic manures series No. 2 p. 13,
National Council of Applied Economic Research.39. K. S. Parekh : Energy-Second series. (1976).
BASIC DATA ABOUT DUNG AND ITS
DERIVATIVES :
Dung :
5 kg of green dung = 1 kg of dry dung.
Thermal value of dry dung = 2444 kcal/kg
(SRECNI37).
Cumbustion efficiency of dry dung = 11%
Thus heat available from dry dung = 269 kcal/
kg = 54 kcal/kg of green dung.
Fertiliser value of dung :
1 kg of green dung = 3.5 gm of nitrogen, 1.2
gms of P2O5 and 1.7 gm of K2O (C. N. Acharya38).
Compost from dung (Parekh39) :
1 kg of green dung = 0.1 kg of compost
containing 1.5 gm of nitrogen.
Average outturn of green dung per cattle head =
13.5 kg/day of which only 40% is usually collected
(Meghnad Saha quoted above. See also the
discussion of noncommercial fuel of India in this
address).
Biogas :
Calorific value of methane = 5.93 kcal/L.
% of methane in gobar gas = 60% (Parekh).
Thus calorific value of gobar gas = 3.6 kcal/L.
Gobar gas yield = 36.25 L/kg of green dung
(Parekh). Of this the thermal value is 130.5 kcal.
The yield is dependent on the season, being less in
winter than in summer.
Dry sludge (Parekh) :
1 kg of green dung yields 144 gm of sludge.
1 kg of sludge contain 20 gm of nitrogen.
Dimension of biogas plant :
Digestion time ~ 50 days.
1 kg of green dung mixed with water produce.
357 × 10–3 m3 of slurry. Thus if x kg is the daily
input of green dung, then volume of the digester
should be
V = 17.8 × 10⁻³ × m3.

Everyman’s Science Vol. XLVIII No. 1, April ’13 — May ’13
39
We give the calculation for a plant of digester
volume ~ 1 m3, so that the input of dung is
required to be 56.2 kg of green dung per day. If the
dung collection is at 40% efficiency, then the number
of cattle head necessary to yield this outtum of
green dung is about 10, whereas if the plant has a
dairy attached to it, only 4 cattle heads are necessary.
An input of 56.2 kg/day of green dung ≡ 20.5 T/
year of green dung.
Evidently dung treated through a gobar gas
plant is more useful both as a fuel and as a manure.
But it must be realised that dung is a poor man’s
fuel. Any attempt to commercialise or monopolise
it in the hands of the richer classes of the society,
who are able to affort gobar gas plants, may lead to
the poorer classes being deprived of this fuel,
which would create a social problem. There are
other problems—the spread of sophisticated
technology necessary to build gobar gas plants
among villages in remote parts of the country,
efficient method of collection of dung and night
soil, the mechanism of transporting the gas to rural
consumers, and similar problems, have yet to receive
easy workable solutions.
Table 6 : Benefit analysis of a gobar gas plant
of volume 1m3.
Factors uder Yield Combustion Fertiliser
consideration
1. Green dung 56.2 kg/d ≡ 20.5 T/y
Dry dung 11.2 kg/d ≡ 4.1 T/y
Thermal value 3.03 Mcal
≡ 1.11 Gcal/y
Fertiliser value 196.7 g/d ≡ 71.8 kg/y
of nitrogen,
67.4 g/d ≡ 24.6 kg/y
of P2O5 and
95.6 g/d ≡ 34.9 kg/y
of K2O
2. Gobar gas 2.04 kL/d
≡ 0.744 ML/y
Thermal value 7.34 Mcal/d
≡ 2.68 Gcal/y
Sludge 8 kg/d = 2.95 T/y
Sludge-fertiliser 160 g/d ≡ 58.4 kg/y
value of nitrogen
3. Compost 5.62 kg/d = 2 T/y 84.3 g/d ≡ 30.8 kg/y
Fertiliser value of nitrogen
Biomass : Biomass or biota is a more general
term compared to biowaste and encompasses all
biological materials originating in land and aquatic
environments. There are very strong arguments for
and against large scale conversion of biomass for
energy and other uses. Arguments against are :
1. though biomass is perennial i.e. a
replenishable source of energy, the quantum
of land available to grow it is limited because
of very pressing demands for other uses, and
2. planned production of biomass will need
many basic inputs-water and inorganic
nutrients for replenishment of the soil.
Arguments in favour are :
1. sufficient powerful technologies exist to
convert biomass into fuels like ethanol, and
no lead time is required to use these
technologies in our economy,
2. much of the biomass can be grown on barren
and fallow lands, and valuable agricultural
lands need not be trespassed and on.
3. muhc of the biota can be grown in acquatic
environments.
At present there exist three different pathways
for extracting energy from biomass :
1. direct combustion of biomass,
2. chemical treatment of biomass for production
of,
a. compounds rich in carbon and hydrogen
b. compounds poor in oxygen and nitrogen-
elements which do not add to the energy
content.
c. compounds rich in double bonds, and
d. compounds rich in ring structures, and
3. as feed materials for work animals.
It is will know that the efficiency of conversion
of food energy to work by animals is about 4.5%
only. This is too small, and apart from the fact that
work animals must have food, there is not much
interest in converting biomass into animal food.

Everyman’s Science Vol. XLVIII No. 1, April ’13 — May ’13
40
The pathways to convert biomass into energy
fuels are :
1. thermal
2. purely chemical and
3. biological
The thermal methods embrace patrial oxidation,
hydrogenation, pyrolysis and steam reforming. The
chemical process include hydrolysis-chemical and
enzymatic, and other chemical conversion methods.
The biological processes include anaerobic
fermentation biophotolysis and similar methods.
The conversion efficients can be very high.
A very high interesting aspect of biomass
conversion is that is product can be integrated in an
agriculture farm economy. A scheme is under trial
is USA in which corn stovers can be fermented into
a product called stillage, which is an ideal food for
nonruminants and also simultaneously produce the
valuable fuel ethanol. Bagasse in another valuable
source for ethanol and a new process is under
development in Canada. In Indian alcohol used to
be produced from the molasces, left over as waste
in the sugar industry, which have no further use.
The production of this power alcohol has steadily
declined as shown in the table 7 :
Table 7 : Production of Power Alcohol (in GL)
Year Production Year Production
1951 26.49 1972 0.88
1956 46.69 1973 0.58
1961 53.77 1974 0.65
1966 2.47 1975 1.74
1971 0.68 1976 0.96
Source : Statistical Abstract 1977.
Some basic data for ethanol production are : 1T
of starch can yield 0.568 T of ethanol; 5.6 T of
molasces ( 50% sugar) can yield 1 T of ethanol. It
is clear that very intense R∈ D efforts have to be
made to include conversion of biomass, into energy
fuels in our economy.
Energy plantation40 : A few remarks about
energy plantation is called for — a concept which
is very important in the context of biomasses. For
the production of biomass besides the cash crops
one can resort to intense agri - and silvi - cultures
as well as grow photosynthetic algae and bacteria
One should also examine the plants grown in their
totality. Thus if grapes are grown, one should think
also of the kinds which are rich in fermentable
sugars. Plantations of fast growing trees like
Eucalyptus zincyphus Prosopis etc. can be
established easily in the foot hills and plains. In the
temperature and subtemperature zones trees like
the willow and the poplars can be easily grown.
This man made agroforests would not only provide
the biomass, but would also help to mitigate
industrial polution, and establish a valuable
symbiosis with the environment. Casurina is another
type of tree very successful tried in south India,
which besides providing the biomass, fixes nitrogen
for the soil very efficiently. Another similar plant is
Leucacena, leucocephala which has been very
successfully tried in Philipines. There is an important
experiment in USA to use the latex of certain
plants for producing compounds which may
substitute for petroleum. A species of Enphorbia,
specially E. tirucallis is ideally suited for its fast
growth, wide adaptibility and suitable sap
consistency. Varieties of large and bacteria of high
photosynthetic efficiency may also be artificially
cultivated. A large scale RεD in genetic engineering
is necessary to improve these varieties. DST has
already set up a committee to consider programmes
for handling biomass.
OTHER ENERGY SOURCES IN INDIA
Let us now take a quick look at the prospects of
utilising hydro, wind, tidal and geothermal energies
in India. The information of hydroenergy is drawn
from the report of the Fuel Policy Committee, 1974
(RFPC)41 of the Government of India. The date on
40. Survey of rural energy consumption in northern India,
National Council of Applied Economic Research.41. Report of the Fuel Policy Committee, Government of India
(1974).

Everyman’s Science Vol. XLVIII No. 1, April ’13 — May ’13
41
wind and tidal energy is from the NCST report :
Report of the power and Fuel sector, 197442.
HYDROENERGY
India is paritcularly blessed with hydroenergy
potential. The great pioner engineer Visheshwarya
established the first major hydel station in India
Shivasamudram in Karnataka to provide electricity
to the Kolar gold fields. Meghnad Saha43 was
another pioneer, who wrote extensively on river
controls and hydroelectricity to generate public and
government interest in multipurpose river projects.
The river systems of India can be divided in 6
general groups :
1. north west India-rivers of Indus basin,
2. central India including-both east and west
flowing rivers,
3. the Ganga system with all its tributaries,
4. eastern India-Brahmaputra system and rivers
of the adjacent areas,
5. east flowing rivers of south India, and
6. west flowing rivers of south India.
According to estimates of Central Water and
Power Commission (CWPC)44 made from
investigations in the period 1959-60, the total hydel
potential of India is 41.17 GW, which means that
the total hydel output at 60% load factor could be
216 TWh annually. This has been recently upgraded
in 1971 by the Power Economy Commirtee (PEC)45
to 80-100 GW, which means an annual output at
60% load factor of 420-525 TWh of electricity.
India is divided into five power zones :
1. northern India-Himachalpradesh, Haryana,
Jammu and Kashmir, Panjab, Rajasthan and
Uttarpradesh,
2. western India-Gujrat, Madhyapradesh and
Maharashtra,
3. south India-Andhrapradesh, Karnataka,
Kerala and Tamilnadu,
4. eastern India-Bihar, Orissa and west Bengal
and
5. north eastern India-Assam and adjacent states
and Manipur.
The hydel potential distribution is as follows:
north India-10.73 GW (26.0%), west India 7.17
GW (7.4%), south India 8.10 GW (19.4%), east
India 2.69 GW (6.6%) and north east India 12.46
GW (30.3%), the figures in the brackets indicating
the % shares of the original estimate of CWPC.
Let us now survey how much of this hydel
potential has been actually developed in India.
Upto 1970/1 the installed hydel capacities were as
follows: north India 2.08 GW (19.4%), west India
0.99 GW (13.8%) south India 2.81 GW (34.6%),
east India 0.44 GW (16.5%) northeast India 0.07
GW (0.57%), total = 6.39 GW (15.5%), the figures
in the bracket indicating % share of the estimate of
CWPC for the region. Thus the progress of hydel
development leaves much to be desired. By 1977/
8 the total hydel installed capacity reached the
figure of 9.97 GW i.e. about 24% CWPC’s estimate.
The Assam region, in particular, seems to be very
badly neglected.
Thirring46 proposed in 1956 at the world power
Conference a hydel project on R. Tsangpo, or R.
Bramhaputra, as it is known in India , for which he
estimated a potential of generating annually 147-
333 TWh of electricity. The project is of immense
dimensions and can only be undertaken jointly by
China, Tibet and India.
There are many aspects of hydel projects which
must be taken into consideration, which is very
seldom done. Most major hydel projects are
multipurpose projects : flood controls, agricultural
use of the water are some important aspects besides
generation of electricity. Seismic rationale and water
holding capacity of the site, change of soil
conditions due to concentration of certain metal
42. Report of the Fuel and Power Sector, NCST (1974).43. For a list of articles of Meghnad Saha on river controls see
appendix.44. Survey, made by the Central water and Power commission,
Government of India.45. Progress of Power Economy Committee, Government of
India (1973).46. Calder. R : After the seventh day, p. 319 Mentor Book
(1961).
F–6

Everyman’s Science Vol. XLVIII No. 1, April ’13 — May ’13
42
ions and consequent ecological changes, reduction
of the useful life of dams caused by raising of their
beds by soils washed from the banks resulting from
massive deforestation of the banks, are some of the
many consideration. Codes for mitigation of
disasters from the dam bursts caused by excessive
rainfall have yet to be worked out. I do not think
that the probable courses of water released by dam
bursts have been clearly worked out for any dam,
and the people shifted from these areas, or where
that cannot be done, diversion channels for the
surging water from dam bursts have been
established. Another unfortunate feature of hydel
production is that it is completely dependent on
rainfall and general meteorological conditions. So
the production will drastically fall in the years of
drought, as has happened last year. Hydel stations
and dams are often installed at inaccessible places,
and transmission of hydel power to the consumer
often poses problems. Also dams are likely to
produce profound changes in the environment and
the ecology of the surrounding country.
Wind Energy : A minimum wind speed of 10
km/hr is considered to be useful for working-
windmills for the agricultural sector. For 80% of
the days in Karnataka, Maharashtra and Gujrat
with 10 or more hours, and 40% of the days with
20 or more hours with maximum duration in the
monsoon months, the wind has this minimum speed.
For 20% of the days in Madhyapradesh, 10 hrs of
such wind is available. Along the sea coasts and on
high hilly areas, such wind is available; such areas
are therefore suitable locations for windmills.
Windmills can be used for the following purposes:
1. water pumping, and
2. providing electricity in rural areas.
R&D work on aeolian engines is being carried
out at NAL. Unfortunately, not much progress has
yet been made in perfection of designs suitable for
India, or in the construction and installation of such
devices on any large scale.
Tidal Energy : The water level of the sea rises
and falls periodically because of the joint action of
the moon and the sun. Thus if basins and dams are
created at the mouths of the rivers, the water
flowing in during high tide can be stored and
allowed to flow out during ebb tide, driving turbines
to generate electricity. Suitable sites may be found
in the Gulf of Cambay, Gulf of Kutch and the
Hugly basin. Preliminary assessment based on the
French experience at Le Ranee indicates that the
cost of generation of tidal power will be high. No
progress has been made in this field in India.
Geothermal Energy : There are three types of
geothermal energy fields in India :
1. steam fields with temperature gradient > 50°
C/km depth,
2. hot water fields with gradients 30°- 50°
C/km depth and
3. normal fields with gradient < 30° C/km depth.
Extensive investigations have been made by the
Geological Survey of India of the geothermal regions
of various parts of India. Two possible sites :
1. the Puga valley of Ladakh and
2. the Manikaran kasol area in Himachal pradesh
received recommendations for geothermal
developments.
POPULATION OF INDIA
In any prediction about the energy demand of a
country, its population is an important parameter.
In India it is one of the imponderables, and we can
only make intelligent guesses about it. For our
purpose, it is neccessary also to estimate the rural
and urban populations. According to a world Bank
estimate the population growths in India are as
given in the table 8.
Table 8. Urban and rural populations in India
1965/6 1968/9 1970/1 1973/4
Urban 92(18.9) 101(19.4) 108(19.8) 120(20.5)
Rural 395(81.1) 420(80.6) 438(80.2) 465(79.5)
Total 487(100) 521(100) 546(100) 585(100)
(in M persons). Figures in brackets indicate % shares
Source : India The Energy Sector by P.D. Henderson47
The APGR’s for the period 1970/1 - 1973/4
are :
urban 3.6%, rural 2.0%.
47. P. D. Henderson : India-The Energy sector, World Bank,
Oxf. Univ. Press, 1975.

Everyman’s Science Vol. XLVIII No. 1, April ’13 — May ’13
43
For study on non-commercial fuel in India, we
shall need the rural population in 1976. According
to the APGR for rural population, this figure should
be 484 M.
If the above APGR’s are allowed to remain
unchecked, then the population figures will be as
given in the table 9.
Table 9. Population projections in India on
present trends. Population given in M person
1979/80 1982/3 1983/4 1990/1 1991/2 2000/1 2035/6
Urban 148 165 171 219 227 312 1075
Rural 523 555 567 651 664 794 1587
Total 671 720 738 870 891 1106 2662
With such a population load, the energy problem
for India can never be solved. I hope therefore, that
wisdom will dawn upon us, and the family planning
projects will become effective by 1991/2 and 1%
APGR will be achieved for both rural and urban
populations, in the scenario I shall consider here
after, I shall assume that the APGR’S would remain
constant upto 2000/1 AD after which an APGR of
0.5% would be achieved for both populations. The
population projections on these assumptions are
given in table 10.
Table 10. Population of India and
projections 1960/1 to 2035/6 (in M persons)
assumed in this study
Year Rural Urban Total Year Rural Urban Total
1960/1 356 79 435 1985/6 589 184 773
1965/6 395 92 487 1990/1 651 219 870
1970/1 438 108 546 1991/2 664 227 891
1975/6 484 129 613 1995/6 691 236 927
1979/80 523 148 671 2000/1 726 248 974
1980/1 534 154 688 2035/6 864 295 1159
APGR’s : For period 1960/1 to 1991/2 rural
population 2%, urban population 3.6%,
for period 1991/2 to 2000/1 rural and
urban population both 1% and after 2000/
1 both 0.5%.
PRODUCTION AND CONSUMPTION OF
ENERGY
To understand the production and consumption
of energy in India, we meet with the difficulty that
substantial portion of the energy fuels is not handled
by market processes, i.e., these are not sold and
purchased, but are gathered for use by the
consumers. It is therefore customary to divide the
energy fuels in two classes :
1. commercial fuels which pass through the
market : coal, oil, natural gas, and nuclear
minerals and
2. noncommercial fuels which do not : firewood,
vegetable waste and animal dung.
We shall first consider the commercial energy,
which again can be divided in two classes :
1. primary energy derived from the fossil fuels,
used in the original form without any
transformation and
2. secondary which, like electrical energy, are
transformed forms of energy.
In spite of my best efforts I have not been able
to collect data about the energy productions and
consumptions for recent years. So I have been
forced to make intelligent guesses about them from
the APGR trends. Table 12 contains the data for
energy productions of all types. This would be the
master table upon which all subsequent analysis
would be based. The data collected from published
data are printed in heavy types, and those calculated
from the APGRS or by other means are printed in
light types in this table.
COAL REPLACEMENT VALUES
The energy data in the tables are given in an
uniform unit, which does not represent the thermal
values expressed by coal equivalent (CE) values of
the fuels or various forms of energy. We have
rather, as is the practice, used their coal replacement
(CR) values. The CR values are different from the

Everyman’s Science Vol. XLVIII No. 1, April ’13 — May ’13
44
CE values, because whereas CE only emphasises
the thermal value, CR reflects many other things -
convenience for consumers, technology of use,
managerial skills for production and distribution.
The Energy Survey of India Committee48
recommended in 1965 the CR values of various
fuels and energy forms which are given in table 11.
Table 11. CE and CR values of various
fuels and energies
Original CE CR
units value value
Coal all types 1MT 1MT 1MT
Oil 1MT 2MT 6.5 MT
Natural gas 1m3 1.8MT 3.6 MT
Electricity 1TWh 1MT 1MT
Firewood 1MT 0.95 MT 0.95-0.7 MT
(depending
on chullah)
Veg.waste 1MT — 0.61 MT
Dung 1MT — 0.3-0.4 MT
Source : RFPC49 and SRECNPI50
PRODUCTION OF COMMERCIAL ENERGY
IN INDIA
The production of various commercial fuels and
commercial energies in India from 1960/1 to 1978/
9 are shown in table 12 (fig. 1). The main source
that consulted was the Report of the Fuel Policy
Committee of the Covernment of India. 1974
(RFPC); also some information were given by
individuals51. The % slares of the various forms of
energy in the total is given table 13.
Fig 1. India Energy Production
Certain trends will be evident in this table 12:
(1) Coal : The APGR for coal production for
the period 1971/2 to 1974/5 is 7%. Projecting on
this growth rate, we get a possible figure for coal
production in 1979/80 as 124.0 MT. But I have
very serious doubts if this figure has been actually
achieved. In fact the informations collected later
show a decline of coal production from the figures
given in table 12, the productions being 99.68 MT
in 1975/6, 101.04. MT in 1976/7,101.00 MT is
1977/8 and 101.90 MT in 1978/9. The % share of
coal in the total commercial energy has varied from
47% in 1960/1 to possibly 31% in 1979/80.
(2) Oil : The APGR for oil import for the period
1975/6 to 1977/8 is 6.8%. It is quite clear that the
global crisis of oil has not affected the oil import in
India, which means that the switch over to oil in
the sixties in this country was too drastic to revert
back to coal. Projecting on an APGR of 6.8%, the
oil import in 1979/80 should be 123.6 MTCR. The
APGR for domestic oil production for the period
1973/4 to 1977/8 in 9.3% On this basis, the domestic
oil production in 1979/80 should be 73.9 MTCR.
Thus the total oil available in 1979/80 should be
197.5 MTCR. The % share of oil in the total
commercial energy produced varied from 46% in
48. Energy Survey of India Committee, Government of India,
1965.49. Report of the Fuel Policy Committee, Government of
India, 1974.50. Survey of Rural Energy Consumpution of Northern India,
National Council of Applied Economic Research.51. I am specially indebted to Dr. J. Gururaja of the Department
of Science and Technology and Dr. P. K. Mukhopadhyay
of Oil and National Gas Commission.
Total Commercial Hydel
Total Energy
CoalTotaloil
Total Noncommercial
Fire woodVeg waste
Dung
OilDomestic
OilImported
60/1
64/5
68/9
72/3
76/7
80/1
84/5
88/9
92/3
2000/1
4/5
8/9
12/3
16/7
20/1
24/5
28/9
32/3
36/7
96/7
103
864
2
102
86432
1086432
3
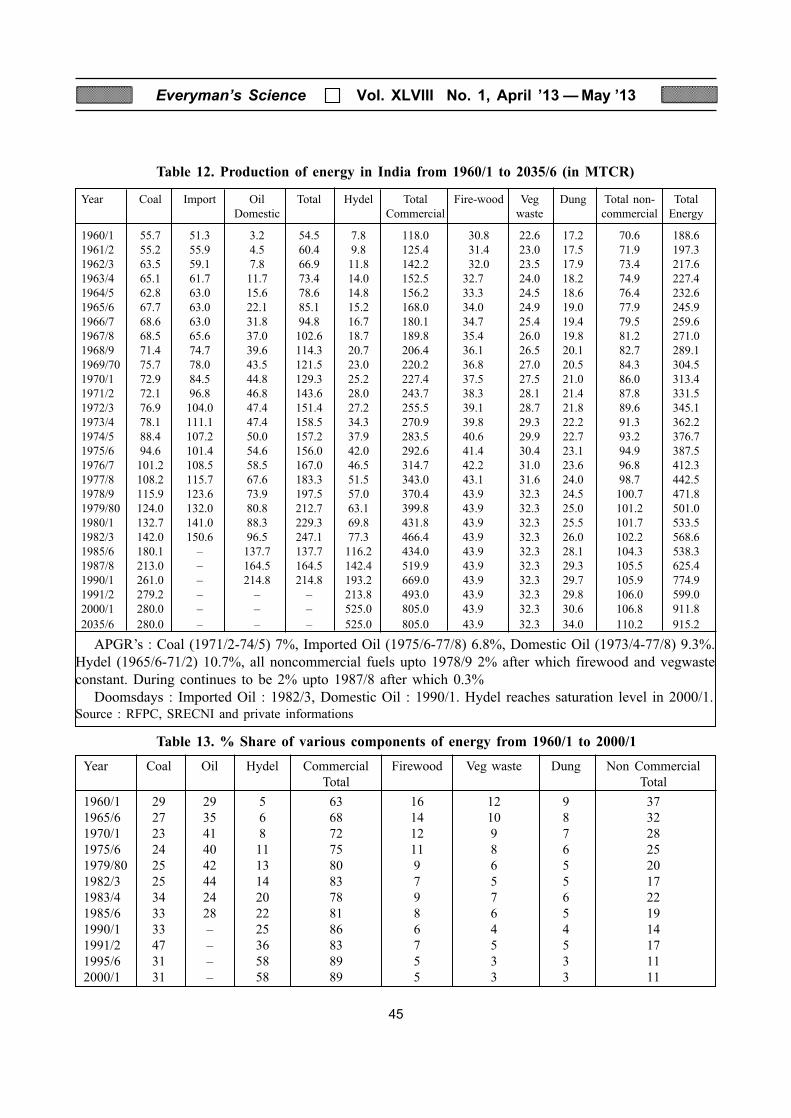
Everyman’s Science Vol. XLVIII No. 1, April ’13 — May ’13
45
Table 12. Production of energy in India from 1960/1 to 2035/6 (in MTCR)
Year Coal Import Oil Total Hydel Total Fire-wood Veg Dung Total non- Total
Domestic Commercial waste commercial Energy
1960/1 55.7 51.3 3.2 54.5 7.8 118.0 30.8 22.6 17.2 70.6 188.6
1961/2 55.2 55.9 4.5 60.4 9.8 125.4 31.4 23.0 17.5 71.9 197.3
1962/3 63.5 59.1 7.8 66.9 11.8 142.2 32.0 23.5 17.9 73.4 217.6
1963/4 65.1 61.7 11.7 73.4 14.0 152.5 32.7 24.0 18.2 74.9 227.4
1964/5 62.8 63.0 15.6 78.6 14.8 156.2 33.3 24.5 18.6 76.4 232.6
1965/6 67.7 63.0 22.1 85.1 15.2 168.0 34.0 24.9 19.0 77.9 245.9
1966/7 68.6 63.0 31.8 94.8 16.7 180.1 34.7 25.4 19.4 79.5 259.6
1967/8 68.5 65.6 37.0 102.6 18.7 189.8 35.4 26.0 19.8 81.2 271.0
1968/9 71.4 74.7 39.6 114.3 20.7 206.4 36.1 26.5 20.1 82.7 289.1
1969/70 75.7 78.0 43.5 121.5 23.0 220.2 36.8 27.0 20.5 84.3 304.5
1970/1 72.9 84.5 44.8 129.3 25.2 227.4 37.5 27.5 21.0 86.0 313.4
1971/2 72.1 96.8 46.8 143.6 28.0 243.7 38.3 28.1 21.4 87.8 331.5
1972/3 76.9 104.0 47.4 151.4 27.2 255.5 39.1 28.7 21.8 89.6 345.1
1973/4 78.1 111.1 47.4 158.5 34.3 270.9 39.8 29.3 22.2 91.3 362.2
1974/5 88.4 107.2 50.0 157.2 37.9 283.5 40.6 29.9 22.7 93.2 376.7
1975/6 94.6 101.4 54.6 156.0 42.0 292.6 41.4 30.4 23.1 94.9 387.5
1976/7 101.2 108.5 58.5 167.0 46.5 314.7 42.2 31.0 23.6 96.8 412.3
1977/8 108.2 115.7 67.6 183.3 51.5 343.0 43.1 31.6 24.0 98.7 442.5
1978/9 115.9 123.6 73.9 197.5 57.0 370.4 43.9 32.3 24.5 100.7 471.8
1979/80 124.0 132.0 80.8 212.7 63.1 399.8 43.9 32.3 25.0 101.2 501.0
1980/1 132.7 141.0 88.3 229.3 69.8 431.8 43.9 32.3 25.5 101.7 533.5
1982/3 142.0 150.6 96.5 247.1 77.3 466.4 43.9 32.3 26.0 102.2 568.6
1985/6 180.1 – 137.7 137.7 116.2 434.0 43.9 32.3 28.1 104.3 538.3
1987/8 213.0 – 164.5 164.5 142.4 519.9 43.9 32.3 29.3 105.5 625.4
1990/1 261.0 – 214.8 214.8 193.2 669.0 43.9 32.3 29.7 105.9 774.9
1991/2 279.2 – – – 213.8 493.0 43.9 32.3 29.8 106.0 599.0
2000/1 280.0 – – – 525.0 805.0 43.9 32.3 30.6 106.8 911.8
2035/6 280.0 – – – 525.0 805.0 43.9 32.3 34.0 110.2 915.2
APGR’s : Coal (1971/2-74/5) 7%, Imported Oil (1975/6-77/8) 6.8%, Domestic Oil (1973/4-77/8) 9.3%.
Hydel (1965/6-71/2) 10.7%, all noncommercial fuels upto 1978/9 2% after which firewood and vegwaste
constant. During continues to be 2% upto 1987/8 after which 0.3%
Doomsdays : Imported Oil : 1982/3, Domestic Oil : 1990/1. Hydel reaches saturation level in 2000/1.Source : RFPC, SRECNI and private informations
Table 13. % Share of various components of energy from 1960/1 to 2000/1
Year Coal Oil Hydel Commercial Firewood Veg waste Dung Non Commercial
Total Total
1960/1 29 29 5 63 16 12 9 37
1965/6 27 35 6 68 14 10 8 32
1970/1 23 41 8 72 12 9 7 28
1975/6 24 40 11 75 11 8 6 25
1979/80 25 42 13 80 9 6 5 20
1982/3 25 44 14 83 7 5 5 17
1983/4 34 24 20 78 9 7 6 22
1985/6 33 28 22 81 8 6 5 19
1990/1 33 – 25 86 6 4 4 14
1991/2 47 – 36 83 7 5 5 17
1995/6 31 – 58 89 5 3 3 11
2000/1 31 – 58 89 5 3 3 11

Everyman’s Science Vol. XLVIII No. 1, April ’13 — May ’13
46
1960/1 to possibly 53% in 1979/80. This shows the
dramatic switch over to oil in the sixties in this
country, which has been in line with what other
countries have done.
(3) Electricity : The APGR for hydel
(hydroelectricity) production for the period 1965/6
to 1971/2 has been 10.7%. On this basis, the hydel
production in 1979/80 should be 63.1 MTCR or
63.1 Twh. The share of hydel in the total commercial
energy varied from 7% in 1960/1 to 16% 1978/9.
The analysis for thermel (thermal electricity)
production will be done little later when we consider
the coal and oil consumptions for power production.
I have not shown in table 13 the % share of total
electricity in the total energy, as thermel part of it
is already accounted for in the coal and oil
production. This is given later in table 19.
(4) Nuclear energy : Nuclear electricity started
coming in from 1969/70. Since then the production
has declined. In 1972/3 nuclear portion was only
1.6% of the total electricity produced. We may
therefore leave out this energy entirely from our
consideratios, as it cannot possibly have any
influence on the energy budget for the next decade.
CONSUMPTION OF COMMERCIAL
ENERGY IN INDIA
Unfortunately, the only reliable data for
commercial energy consumption, that is available,
is for period from 1953/4 to 1970/1, as given by
the REPC. The figures for 1960/1 to 1970/1 are
given in tables 14, 15 and 16. Inspite of my best
efforts I could not get reliable data for the energy
consumption after this period. I have closely studied
the energy consumption pattern from 1960/1 to
1970/1 in the hope that this will give an idea of
which particular economic sector will be hit to
what degree in the event of shortage of some
particular fuel or some particular form of energy.
I shall first define the customary divisions of the
economic sectors, that is made for study of
commerical energy consumption :
1. mining and industry (M&I),
2. transport (T),
3. domestic (D),
4. agriculture (A) and
5. establishment (E) which is associated with
both government and commerce. To these I
have added another sector :
6. power (P), which covers the production of
electricity from coal and oil i.e. thermal
production. I have added another head
7 unaccounted (U), which is the difference
between the energy produced and energy
consumed and covers losses, wastages before
the energy reaches the consumer, nonenergy
uses and similar items. The amount under
U for oil is particularly large.
We shall first look at the amount of energy
consumed in the different sectors fig 2. M&I Sector
takes the dominant role, and its consumption rose
from 39.7 MTCR in 1960/1 to 76.3 MTCR in
100
50
A
0E
P
T
D
M & I
60/1
1/2
2/3
3/4
4/5
5/6
6/7
7/8
69/7
0
70/1
8/9
MT
CR
Fig 2. Energy Consumption in different sectors
1970/1. The next important sector is T which
consumed 34.1 MTCR in 1960/1 and 64.5 MTCR
in 1970/1-a steady linear increase. Next is the D
sector whose consumption varied from 20.8 MTCR
in 1960/1 to 35.5 MTCR in 1970/1. P took 9.1
MTCR in 1960/1 and 28.1 MTCR in 1970/1. The

Everyman’s Science Vol. XLVIII No. 1, April ’13 — May ’13
47
Table 16. Consumption of electricity in India (in TWh & MTCR) from 1960/1 to 1970/1
Year PR M&I T D A E C U
1960/1 16.9 11.6 0.8 1.5 0.8 2.2 16.9 0.0
1961/2 19.8 14.5 0.6 1.7 1.0 1.6 19.4 0.4
1962/3 22.5 16.5 0.9 1.9 1.1 2.1 22.5 0.0
1963/4 26.9 19.1 0.8 2.1 1.1 2.1 25.2 1.7
1964/5 29.6 20.9 1.0 2.2 1.4 2.2 27.7 1.9
1965/6 32.9 22.6 1.2 2.4 1.9 2.5 30.6 2.3
1966/7 36.3 24.4 1.3 2.6 2.1 2.8 33.2 3.1
1967/8 41.3 26.8 1.4 2.9 2.6 3.1 36.8 4.5
1968/9 47.4 29.9 1.3 3.2 3.5 3.6 41.5 5.9
1969/70 50.6 32.3 1.4 3.5 3.8 4.0 45.0 5.6
1970/1 53.3 34.3 1.4 3.8 4.5 4.5 48.5 4.8
PR = Production, M&I = Mining and Industry, T = Transport, D = Domestic, A = Agriculture, E = Establishment, C = Total
consumption (Energy use), U = Unaccounted.
Source : RFPC
Table 15. Consumpton of oil in India (in MTCR) from 1960/1 to 1970/1
Year PR M&I T D A E P C U
1960/1 54.5 7.2 17.3 16.5 2.7 – 2.4 46.1 8.1
196112 60.4 7.7 19.5 18.5 2.9 – 2.7 51.3 9.1
1962/3 66.9 9.4 21.8 20.3 3.2 – 2.5 57.2 9.7
1963/4 73.4 6.6 25.3 20.3 3.6 0.6 3.0 59.2 14.0
1964/5 78.6 7.1 27.5 21.6 3.6 0.1 4.3 64.2 14.4
1965/6 85.1 8.1 31.3 20.0 4.4 0.8 5.3 69.9 15.2
1966/7 94.8 9.0 33.1 20.6 5.1 1.0 6.6 75.4 19.4
1967/8 102.6 9.9 35.3 21.4 5.3 1.6 7.9 81.4 21.2
1968/9 114.3 10.4 39.7 23.8 6.8 1.6 11.3 93.6 20.0
1969/70 121.5 9.4 43.3 25.5 4.5 7.3 10.5 100.5 21.0
1970/1 129.3 10.9 47.2 27.6 4.5 6.9 11.0 108.1 21.2
PR = Production, M&I = Mining and Industry, Transport, D = Domestic, A = Agriculture, P = Power, C = Total
consumption (Energy use), U = Unaccounted.
Source : RFPC
Table 14. Consumption of coal in India (in MTCR) from 1960/1 to 1970/1
Year PR M&I T D E P C U
1960/1 55.7 20.9 16.0 2.8 0.7 6.7 47.1 3.6
1961/2 55.2 24.2 16.7 2.8 0.4 7.2 51.3 3.9
1962/3 63.5 28.0 17.4 3.2 0.5 8.0 57.1 6.4
1963/4 65.1 27.0 17.4 3.5 0.7 9.8 58.4 6.7
1964/5 62.8 27.2 17.4 3.4 0.3 10.5 58.8 4.0
1965/6 67.7 30.1 17.3 4.1 0.3 12.4 64.2 3.5
1966/7 68.6 30.4 16.9 4.5 0.5 13.0 65.3 3.3
1967/8 68.5 33.0 16.7 4.3 0.5 14.7 69.2 –0.7
1968/9 71.4 31.9 16.3 4.3 0.5 15.4 68.4 3.0
1969/70 75.7 35.3 16.1 4.8 0.4 17.1 73.7 2.0
1970/1 72.9 31.1 15.9 4.1 0.3 17.1 68.5 4.4
PR = Production, M&I = Mining and Industry, T = Transport, D = Domestic, E = Establishment, P = Power, C = Total
consumption (Energy use), U = Unaccounted.
Source : RFPC

Everyman’s Science Vol. XLVIII No. 1, April ’13 — May ’13
48
A and E sectors are very small consumers: for A
the rise is from 3.5 MTCR to 9 MTCR and for E
the rise is from 2.9 MTCR to 11.7 MTCR.
Next let us examine the consumtpion pattern
of coal, oil and electricity in terms of % shares
(fig. 3).
Coal : The consumption in the M&I sector
dominates and has been in the neighbourhood 44%
for all the ten years. The next important sector for
coal is T, for which the % share, however, is
decreasing over the years reaching the level of
22% in 1970/1. The consumption of coal in the P
sector increased, reaching 17% in 1970/1.
The other sectors consume coal in insignificant
amounts.
Oil : Here the T sector dominates, being steady
in the range 32-37%. The next big consumer is the
D sector, where the % share has decreased with
time, being about 28% in 1970/1. The U head
holds quite a substancial share, being about 21% in
1970/1 i.e., quite a large amount of oil does not
come for energy use. The consumption in P sector
is not large, being about 9% in 1970/1. The
consumptions in other sectors are small. The E and
A sectors both consumed about 5% of the oil in
1970/1. If this pattern continues, then oil shortage
will spell disaster for the T and D sectors. In these
sectors liquid or gas fuels are preferred. If
replacement has to be derived from coal, then R&D
work for liquifaction or gasification of coal and
installation of the necessary plants must be
expedited. In terms of quantities, T and D sectors
together consumed oil of amount 74.8 MTCR, in
1970/1, which is a very large amount.
Electricity : The sector which dominates in the
use of electricity is the M&T sectors, the level of
consumption in 1970/1 being 65%. All other sectors
are rather insignificant consumers, seldom rising
above 8%. Oil shortage will indirectly hit the M&I
sectors through a shortage of thermel production.
Now let us examine fuel and energy flows in the
different sectors (fig 4) :
M&I Sector : In the early sixties coal and
electricity used to dominate this sector. However,
by 1970/1 electricity has surpassed coal, electricity
being 45% and coal 41%. Oil in 1970/1 contributed
only 14%. Thus oil shortage will ony indirectly
affect this sector through the electricity it produces.
100
Coal ConsumptionCoal Consumption
Oil Consumption
Electricity Consumption
50
0
100
50
0
100
50
0
M & I
T
P
U D
E
M & I
T
D
U
A
P E
M & I
E UEADT
Fig 3. Consumption of energy in different
economic sectors
Shar
e %
Shar
e %
Shar
e %

Everyman’s Science Vol. XLVIII No. 1, April ’13 — May ’13
49
Fig 4. Energy Consumption pattern of coal, oil and electricity in terms of % shares
T Sector : Here oil surpasses coal to a very large
measure in 1970/1. In 1970/1 oil had 79% share
where coal had ony 25%. Electricity had very little
contribution. The T sector will therefore be crushed
by oil shortage, as we have already mentioned.
sector in 1970/1 was only 9 MTCR. Here effective
replacement has to be found in developing Stirling
engines for pumping water for irrigation purposes.
E. Sector : The total consumption of energy in
this sector was very low, being only 11.7 MTCR.
D Sector : The pattern is similar to T Sector.
Oil dominates, reaching the level of 78% in 1970/
1. Coal and electricity mattered very little, both
being in the region of 11% in 1970/1. This sector,
as we have already stated will be very hard hit by
oil shortage.
A Sector : Coal is not seen in this sector at all. Oil
used to dominate in the early sixties. But by 1970/1,
oil and electricity achieved equal shares in this
sector. This sector will also be sensitive to oil
shortage. But the total consumption of energy in this
There was wide fluctuation in the oil and electricity
consumptions. In 1970/1 oil was 59% and electricity
38%. The share of coal declined steadily.
P. Sector : The coal share is total thermel declined
steadily from 74% in 1960/1 to 61% in 1970/1,
whereas the oil share increased from 26% to 39%.
Use of oil products : We should look at the fine
structure of oil product production to understand
the impact of oil shortage more completely. The
production of oil products in 1975 in 1975 is given
in table 17.

Everyman’s Science Vol. XLVIII No. 1, April ’13 — May ’13
50
Fig 5. Electricity Production
Table 17. Production of petroleum products and sectorial consumptions of oil in India for 1970/1
Source : India-The Energy Sector by P. Henderson52.
Production of petroleum products53 Sectorial consumption of oil as % of
total oil consumption
Item MT % Sector MT %
Light distillatesNaptha 0.90 5 M&T 1.68 10Motor spirits 1.44 8 T 7.27 44Others 0.30 3 D 47.24 25
A 0.69 52.64 16 E 1.07 6
Middle distillates P 1.70 10
Kerosene 3.31 18 Total 16.65 100HSDO (High SpeedDiesel Oil) 3.85 21LDO (light Diesel Oil) 1.09 6Aviation, turbine fuel 0.71 4
8.96 49Heavy end distillatesFuel oil and fueloil products 4.78 27Bitumen 0.80 4Others (lubes and greases) 0.80 4
6.38 35Total 17.98 100
52. P. Henderson: India-the energy sector. World Bank, Oxf.Univ. Press.
53. The production figures given in Hendersons book is forcalendar years. We have assumed that production for 1960/1 is 0.75x production in 1970 + 0.25x production in 1971,the production figures being as given by Henderson.
The total production figure of 17.98 MT(≡ 116.9
MTCR) in table 17 in somewhat different from the
figure 16.65 MT (≡ 108.2 MTCR), of which the
CR value was given earlier in table 15. This is
because the sources from which the two figures
were taken are different. The sectorial consumptions
are easy to understand in terms of the oil products.
Kerosene is mainly used in the D-sector. HSD is
used in the road transport 78%, and for diesel
locomotives 12%, and the rest of HSD being
employed for other uses. LDO is used in A-sector
for energising irrigation pump sets 40%, in the
P-sector 7%, in the T sector 5%, and industrial
sector 48%. Fuel oil is used as follows : P sector
26%, industry-textile industry 10%, steel 8%, steam
raising 36%, T-sector : shipping 10%. Motor spirits
are almost wholly used in the T-sector. Naptha is
used in the industry sector and bitumen in the
E-sector. This picture would help to understand
how the economy would be effected by the coming
oil crisis.
Production of thermel and the efficiency of
electricity use : In the game of forecasting, it will
be necessary to examine the production of thermel

Everyman’s Science Vol. XLVIII No. 1, April ’13 — May ’13
51
from coal and oil and not to base the predictions on
APGR of thermel production only, because of the
anticipated oil shortage. The APGR of the thermel
production in the period 1965/6 to 1971/2 was
10.2%. But the thermel production was not explicitly
shown in the energy production for it was already
accounted for under coal and oil productions. Table
18 (fig 5) gives the production data of electricity
production for the period 1960/1 to 1970/1, all the
components, hydel and thermel (produced by the
utilities and nonutil-ities) shown separately and the
% shares are shown in table 19. The % shares of
hydel and thermel production in the total electricity
produced in the period 1960/1 to 1970/1 (fig 6),
fluctuates in the range 47% to 53%. The % share
of power coal in total * electricity produced has
declined from 39.6% in 1960/1 to 32.1% in 1970/
1, and thf % shares of power coal in total coal has
varied from 12% in 1960/1 to 23.5% in 1970/1.
The % share of power oil in total electricity has
changed from 14.2% In 1960/1 to 20.6% in 1970/
1, and the % share of power oil in total oil has
changed from 4.4% in 1960/1 to 8.5% in 1970/1.
We shall use these data when we try to forecast the
scenario at the turn of the century.
Let us see how efficiently is electricity being
used in India. The Indian experience is that there is
heavy loss in transmission and other causes, such
Table 18. Production of thermel in India from 1960/1 to 2000/1 (in TWh s MTCR)
Source : RFPC and projections
Year Thermel Power Power PC PO PC PO
coal oil % in % in % in % in
total Thm total Thm total C total O
1960/1 9.1 6.7 2.4 73.6 26.4 12.0 4.4
1965/6 17.7 12.4 5.3 70.1 29.9 18.3 6.2
1970/1 28.1 17.1 11.0 60.8 39.2 23.5 8.5
1975/6 46.7 28.0 18.7 60.0 40.0 29.6 12.0
1979/80 67.3 39.7 27.6 59.0 41.0 32.0 13.0
1982/3 83.2 48.6 34.6 58.4 41.6 32.0 13.0
1983/4 67.0 52.0 15.0 77.6 22.4 32.0 13.0
1990/1 111.4 83.5 27.9 74.9 25.0 32.0 13.0
1991/2 89.3 89.3 – 100.0 – 32.0 –
1995/6 89.6 89.6 – 100.0 – 32.0 –
2000/1 89.6 89.6 – 100.0 – 32.0 –
Thm = Thermel, PC = power coal, PO = power oil, C = coal, O = oil
Fig 6. The % shares of the thermel production in the
total electricity produced in the period 1960/1 to
1970/1. India electricity Production.
as commercial losses like piracy and misreading of
meters. An estimate of such losses can be derived
from the data for 1970/1: total production electricity
= 61.2 GWh, total amount of electricity consumed

Everyman’s Science Vol. XLVIII No. 1, April ’13 — May ’13
52
54. Survey of rural energy consumption in northern India(SRECNI), National Council of Applied EconomicResearch.
= 48.5 GWh showing a loss of 12.7 GWh which
amounts to 20% of what was produced. Of this the
line loss was 9.3 GWh. Much of this loss could be
reduce if instead of high voltage AC transmission,
high voltage DC transmission was introduced in
India so far. This would mean, however, a total
change of the transmission systems and the
consumer’s utilisation systems. In India not much
progress has been achieved in introducing the DC
transmission technology.
Another aspect of utilisation of electricity is to
see how well the power generated is used in face of
fluctuating demands by adjustment of the proper
mix of electricity from different sources.
Customarily this is measured by the following
parameters
Load factor = _\ `_` ^` |X×
Demand factor = ` `
` ``
Plant factor = Load factor × demand factor.
In India in 1970/1, the values achieved for these
efficiency parameters are :
Load factor: 0.657, demand factor: 0.828, plant
factor: 0.527. The load factor value is disturbing,
because the figure shows that our electricity system
is not able to cope with fluctuating loads. An
electricity price reorganisation on a differential
basis for offpeak load, might smoothen the
fluctuating load. Demand factor is much higher
than the usual safety margin of 25% required, i.e.
the plants are working near the peak capability,
leaving little margin for outrages and maintenance.
The plant factor of 53% is considered satisfactory.
RURAL ENERGY—NONCOMMERCIAL
ENERGY
India’s consumption of non commercial energy
is largely terra incognita. There has been a number
of past studies, which are unacceptable for the
purpose of obtaining the general picture, because
of the limitations of the scope of those studies or of
the basic assumptions. I should like to base my
study on a recent survey made of the rural energy
consumption of northern India (SRECNI)54,
composed of the states Delhi, Haryana,
Himachalpradesh, Punjab and Rajasthan with about
150 M population, made by the National Council
of Applied Economic Research for 1975/6. This
survey, which analyses sectorwise consumptions of
Table 19. Production of electricity in India from 1960/1 to 2000/1 (In TWh)
Source : RFPC and projections
Year Hydel Thermel Total Hyd PC PO Thm El
electricity % in % in % in % in % in
total El total El total El total El total El
1960/1 7.8 9.1 16.9 46.2 39.6 14.2 53.8 9.0
1965/6 15.2 17.7 32.9 46.2 37.7 16.1 53.8 13.4
1970/1 25.2 28.1 53.3 47.3 32.1 20.6 52.7 17.0
1975/6 42.0 46.7 88.7 47.4 31.6 21.0 52.6 22.9
1979/80 63.1 67.3 130.4 48.4 30.4 21.2 51.6 26.0
1982/3 85.7 83.2 168.9 50.7 28.8 20.5 49.3 27.8
1983/4 94.8 67.0 161.8 58.6 32.1 9.3 41.4 34.0
1990/1 193.2 111.4 304.6 63.4 27.4 9.2 36.6 39.3
1991/2 213.8 89.3 303.1 70.5 29.5 – 29.5 50.6
1995/6 321.1 89.6 410.7 78.2 21.8 – 21.8 45.1
2000/1 525.0 89.6 614.6 85.4 14.6 – 14.6 67.2
PC = power coal, PO = power oil, Hyd = hydel, Thm = thermel, El = electricity, E = energy

Everyman’s Science Vol. XLVIII No. 1, April ’13 — May ’13
53
commercial and non commercial energies in this
region of India, seems more trustworthy than the
earlier ones, because of the very detailed nature of
the study. In absence of such data from other rural
regions of India, I have converted the consumption
data of SRECNI for various fuels into per capita
amounts and then made the quite unjustifiable
assumption that this is also the per capita consumtion
for these fuels for the rest of rural India. In this
way I have arrived at a picture of rural consumption
of energy in India, and of the commercial and
noncommercial components in it, which I hope
would be closer to reality than the previous estimates
of the RFPC.J1209
In table 20 is given the per capita rural
consumption of both the commercial fuels and
noncommercial fuels: firewood, vegetable waste,
charcoal and above all dung, all estimated in MTCR
unit using the conversion factors given in table 11.1
also give estimates of kcal of food input for a man
day of labour. 2000 kcal for Construction sector
and 1200 kcal for a man day labour: in other
sectors, and an animal day (8 hr) labour of 18400
kcal. The economic sectors of energy consumption
are the usual ones: Transport, Domestic, Agriculture,
Establishment together with a new one Construction.
I have, however, joined the Establishment and
Construction sectors, as this would be more
Table 20. Per capita energy consumption in rural northern India in 1975/6.
Source : SRECNI55
Commercial T D A E Total
(kgCR/cap)
Coal/Coke 0.827 0.780 – 6.367 7.973
Kerosene – 6.793 – 2.153 8.947
HSD & LDO 10.760 – 43.087 1.987 55.833
Petrol 0.720 – – – 0.720
Fuel Oil – – – 0.033 0.033
Electricity
(Wh/cap ≡ kg CR/cap) 0.033 1.713 10.753 0.980 13.480
12.340 9.286 53.840 11.520 86.986
Noncommercial
(kgCR/cap)
Firewood – 83.720 – 4.060 87.780
Vegwaste – 57.927 – 6.647 64.573
Dung – 47.427 – 1.547 48.973
Charcoal – 1.193 – 3.367 4.560
190.267 15.621 205.887
Animate energy
(M cal/cap)
Man energy 1.07 – 92.47 12.33 105.87
Animal energy 18.47 – 356.67 – 375.14
19.54 449.14 12.33 481.01
Sectors: T = Transport, D = Domestic, A = Agriculture, E = Establishment including Construction.
55. Survey of Rural Energy Consumption in Northern India,
National Council of Applied Economic Research.
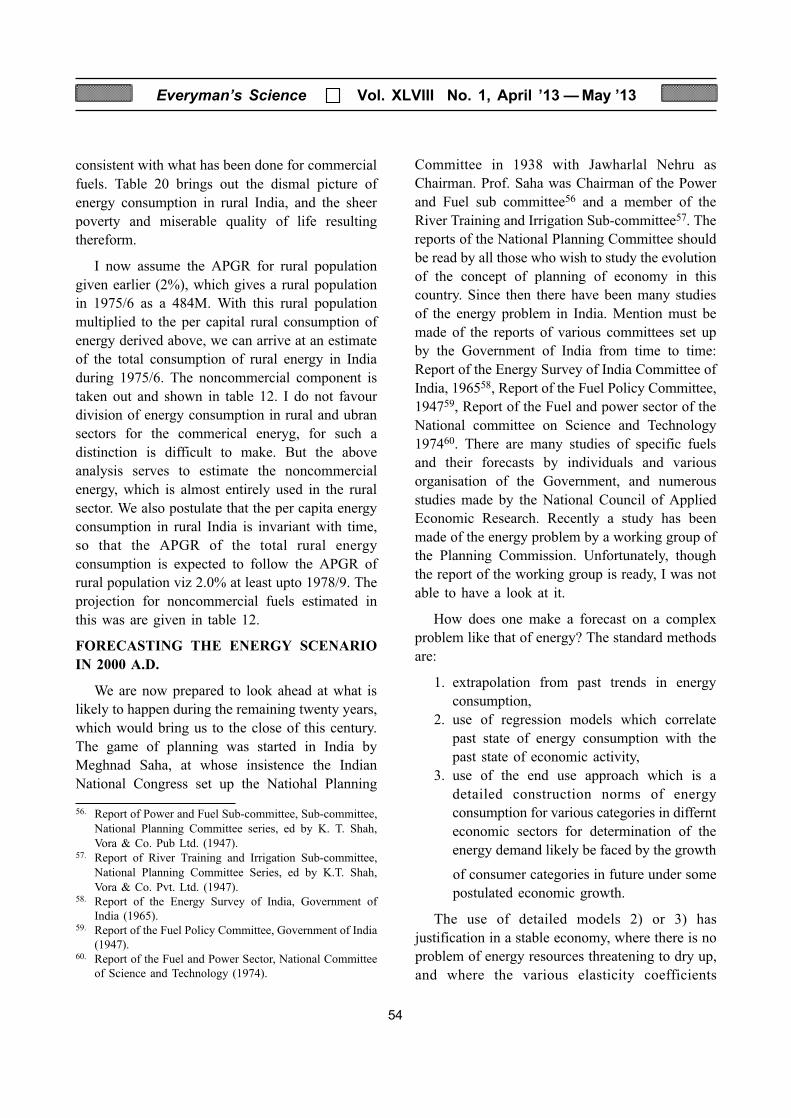
Everyman’s Science Vol. XLVIII No. 1, April ’13 — May ’13
54
of consumer categories in future under some
postulated economic growth.
The use of detailed models 2) or 3) has
justification in a stable economy, where there is no
problem of energy resources threatening to dry up,
and where the various elasticity coefficients
56. Report of Power and Fuel Sub-committee, Sub-committee,
National Planning Committee series, ed by K. T. Shah,
Vora & Co. Pub Ltd. (1947).57. Report of River Training and Irrigation Sub-committee,
National Planning Committee Series, ed by K.T. Shah,
Vora & Co. Pvt. Ltd. (1947).58. Report of the Energy Survey of India, Government of
India (1965).59. Report of the Fuel Policy Committee, Government of India
(1947).60. Report of the Fuel and Power Sector, National Committee
of Science and Technology (1974).
consistent with what has been done for commercial
fuels. Table 20 brings out the dismal picture of
energy consumption in rural India, and the sheer
poverty and miserable quality of life resulting
thereform.
I now assume the APGR for rural population
given earlier (2%), which gives a rural population
in 1975/6 as a 484M. With this rural population
multiplied to the per capital rural consumption of
energy derived above, we can arrive at an estimate
of the total consumption of rural energy in India
during 1975/6. The noncommercial component is
taken out and shown in table 12. I do not favour
division of energy consumption in rural and ubran
sectors for the commerical eneryg, for such a
distinction is difficult to make. But the above
analysis serves to estimate the noncommercial
energy, which is almost entirely used in the rural
sector. We also postulate that the per capita energy
consumption in rural India is invariant with time,
so that the APGR of the total rural energy
consumption is expected to follow the APGR of
rural population viz 2.0% at least upto 1978/9. The
projection for noncommercial fuels estimated in
this was are given in table 12.
FORECASTING THE ENERGY SCENARIO
IN 2000 A.D.
We are now prepared to look ahead at what is
likely to happen during the remaining twenty years,
which would bring us to the close of this century.
The game of planning was started in India by
Meghnad Saha, at whose insistence the Indian
National Congress set up the Natiohal Planning
Committee in 1938 with Jawharlal Nehru as
Chairman. Prof. Saha was Chairman of the Power
and Fuel sub committee56 and a member of the
River Training and Irrigation Sub-committee57. The
reports of the National Planning Committee should
be read by all those who wish to study the evolution
of the concept of planning of economy in this
country. Since then there have been many studies
of the energy problem in India. Mention must be
made of the reports of various committees set up
by the Government of India from time to time:
Report of the Energy Survey of India Committee of
India, 196558, Report of the Fuel Policy Committee,
194759, Report of the Fuel and power sector of the
National committee on Science and Technology
197460. There are many studies of specific fuels
and their forecasts by individuals and various
organisation of the Government, and numerous
studies made by the National Council of Applied
Economic Research. Recently a study has been
made of the energy problem by a working group of
the Planning Commission. Unfortunately, though
the report of the working group is ready, I was not
able to have a look at it.
How does one make a forecast on a complex
problem like that of energy? The standard methods
are:
1. extrapolation from past trends in energy
consumption,
2. use of regression models which correlate
past state of energy consumption with the
past state of economic activity,
3. use of the end use approach which is a
detailed construction norms of energy
consumption for various categories in differnt
economic sectors for determination of the
energy demand likely be faced by the growth

Everyman’s Science Vol. XLVIII No. 1, April ’13 — May ’13
55
measuring the responses to various demands of the
economy are stable and known. These models are
not well adopted to meet the demands of a crisis.
On the other hand, one would think that forecasts
depending on past trends should also not be of may
help for a scenario involving a crisis. It is like
driving a car forward by looking at the rear view
mirror, with a prayer to God that there is no sudden
change of direction of the road ahead. However, in
1980, we have a fair idea of the status of the energy
resources available to us in this country, which I
hope I have been able to bring out clearly to you.
So I was encouraged to go ahead and do some
predictions using the first method for what they are
worth. In any case, this is the best one can do, who
does not have a big secretariate to help him and has
only a pocket calculator and some loyal friends
who are ever ready to come to assistance.
There is very close correlation between certain
economic variables like the Gross National Product
and the energy production, and the correlation is
used often to determine the energy demand for a
particular GNP desired for the economy by the
planners. However, when energy is in short supply,
the approach should be the other way round i.e. the
energy supply should be first estimated and then
GNP worked out and the economy planned in
detail.
I did not consider a scenario in which the
population is allowed to grow unchecked and in
which there is no limit to the capacity to produce
the fuels necessary, if their resources are available.
The scenario which I think is most likely is described
below.
1. Population : The population scenario has
been described already : the APGR would be 2%
for rural and 3.6% for urban population upto 1991/
2, for both populations the APGR’s would be 1%
from 1991/2 to 2000/1 and 0.5% after 2000/1. An
APGR for the population higher than this will spell
disaster for the country.
2. Oil : The APGR for import of oil for the
period 1975/6 to 1977/8 is 6.8%. But the import of
oil cannot be continued much longer after this year,
because of the price escalation. In 1973/4 oil prices
were in the region of $ 3 per Bbl; in 1979/80 no
body is surprised when oil prices are quoted in the
region of $ 25-35 per Bbl. The price trends are
rising more and more steeply. I expect that the oil
suports will cease for all practical purposes by
1982/3, at which time the oil import prediction
from an APGR of 6.8% should be about 160.8
MTCR. The APGR for domestic oil production
was for period 1973/4 to 1977/8 9.3%. The total
reserve of our domestic oil is 2.06 G Bbl ≡ 0.282
GT ≡ 1.833 GTCR and the domestic production of
crude in 1978/9 was 11.4 MT ≡ 73.9 MTCR. Using
equation (4) with the above data we expect the
Doomsday for domestic oil production to be around
1990/1, unless very large new deposits of oil are
discovered. Thus within eleven years from now, all
our oil reserves are expected to dry up, which will
have devastating effect on our economy. We are
perhaps feeling already the approach of this disaster.
In 1990/1, the domestic production of oil is expected
to be 214.8 MTCR.
If in this scenario one looks at the per capita oil
production, then because of high APGR’s assumed
for both imported and domestic oil, the per capita
oil production increases as shown in table 20.
Table 20. Per capita oil production in India
(in 10 × TCR/cap)
1960/1 1.25 1982/3 3.70
1965/6 1.75 1983/4 1.56
1970/1 2.37 1985/6 1.78
1975/6 2.54 1990/1 2.47
1979/80 3.17 1991/2 –
This means that we shall be geting increasingly
more oil per capita except for a drastic fall in
1983/4, after which there is steady rise again till a
total colapse in 1991/2. It will be an important
decision for the Government to determine at what
level the per capita oil production has to be
maintained. Laissez faire exploitation of our oil
resources may not be permitted much longer and to
conserve what we have, oil consumption most

Everyman’s Science Vol. XLVIII No. 1, April ’13 — May ’13
56
certainly will have to be rationed and oil substituted
by other fuels like ethanol or hydrogen. The luxury
of a personal petrol driven car may very soon be a
thing of the past. Even if per capita domestic oil
production is drastically reduced from 1979/80 and
maintained at a constant level of 1.25 x 10⁻¹ TCR/
cap, which is the 1960/1 level, the Doomsday for
oil in India can pushed only to 1996/7 and not
much further, if there is total ban on oil import
after 1978/9.
3. Coal : The APGR for coal production is 7%
in the period 1971/2 to 1974/5. If this growth rate
can be maintained, about which there can be room
for doubt, the output of coal should be 280 MT by
1991/2. I feel that it it beyond our capacity to
produce much more than this. We are already
witnessing a crisis in coal production because of
managerial failures, transportation breakdowns, the
failure of the symbiosis that should exist between
coal and electricity, and the primitive condition of
our mining methods and equipments. There are
reasonable doubts whether 7% APGR can be
maintained upto 1991/2.1 have assumed that this
APGR will be maintained because the Government
is under compulsion to do so, for otherwise the
situation would be too aweful to think about. In the
scenario that I am contemplating, I propose to
maintain the level of coal production at 280 MT
from 1991/2 onwards. If the 7% APGR could be
maintained, then using the coal production figure
for 1975/6, which is 94.6 MT and the coal reserve
of 83.74 GT we get Doomsday for coal in India
around 2035/6 AD. If, as we have seen,
the useful part of the coal is taken to be only 32
GT, the Doomsday comes in on 2021/2 AD. If the
coal production is kept constant at 280 MT, then
the Doomsday for 94.6 MT reserve goes well into
the twenty third century (2260/1 AD). Of course,
the per capita coal production will reduce drastically
from 3.00 × 10⁻¹ MT in 1990/1 to 2.42 × 10⁻¹ MT
in 2035/6. It is quite clear that we can not be
complacent about our known coal reserves, because
India’s mining capacity will have to improve with
time from dire necessity, and coal production may
rise above 280 MT. Thus there is an imperative
need for intense prospecting for coal.
If we consider the per capita coal production,
then becuase of the high APGR of coal production,
it should steadily increase with time. But in practice,
this might not happen. Assuming, however, that
everything goes alright, we get the per capita coal
productions as given in table 21.
Table 21. Per capita coal production in India
(in 10 × TC/cap)2
1960/1 1.28 1985/6 2.33
1965/6 1.39 1990/1 3.00
1970/1 1.33 1995/6 3.02
1975/6 1.54 2000/1 2.87
1979/80 1.85 2035/6 2.42
1980/1 1.93
It appears that there will never be enough coal
available to divert it for liquifaction or gasification
for providing substitution for oil, and alternative
substitutes for oil must be found.
4. Electricity : If the 10.7% APGR for hydel
can be maintained, them ignoring the fact that
dams have finite useful lives, the hydel potential
for this country, as estimated by the Power Economy
Committee viz. 420-525 TWh of annual electricity
production, will be reached by 2000/1. But this
means tremendous civil engineering work and a
very large programme for manufacture of
machineries for electricity generation by the end of
this century. Thus the hydel productions in 1999/
2000 should be 482 TWh and in 2000/1 525 TWh,
which is an increase of 43 /TWh. This means that
hydel installation of 8 GW capacity with the civil
construction work for the necessary dams have to
be completed within that year. It is difficult to
foresee whether a task of such magnitude can be
achieved in this country.
Before we try to estimate the total production
on electricity in the coming years, let us consider
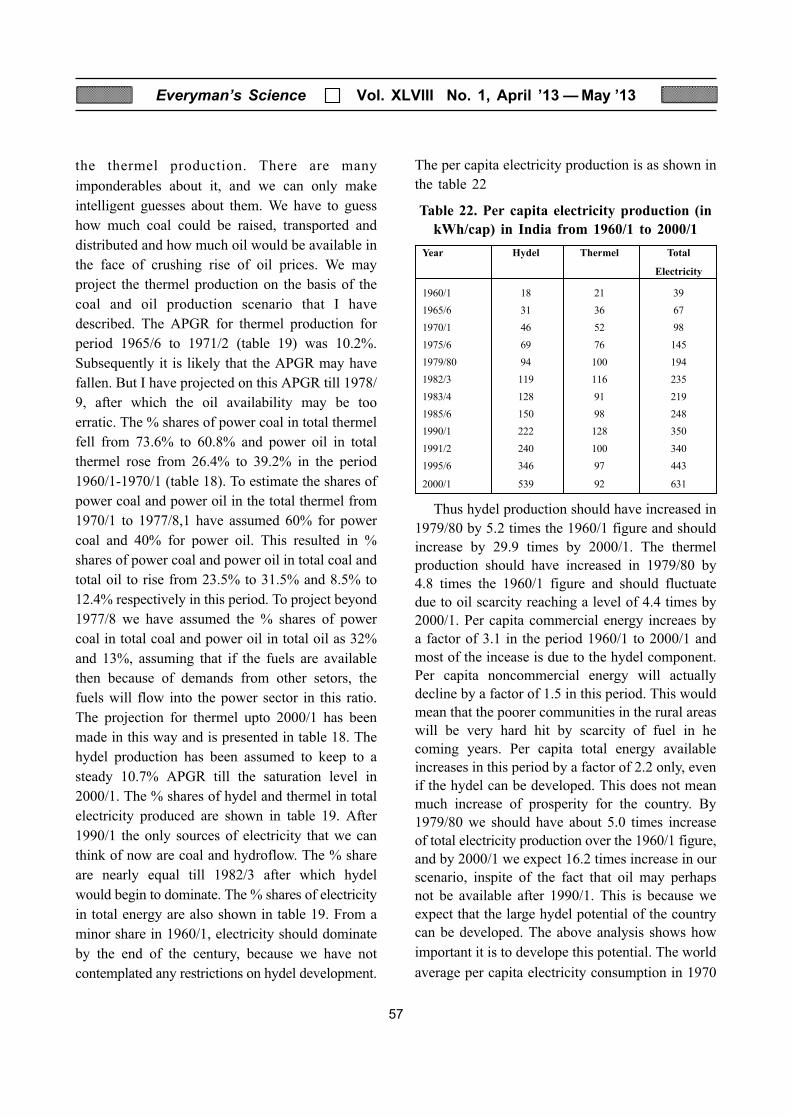
Everyman’s Science Vol. XLVIII No. 1, April ’13 — May ’13
57
the thermel production. There are many
imponderables about it, and we can only make
intelligent guesses about them. We have to guess
how much coal could be raised, transported and
distributed and how much oil would be available in
the face of crushing rise of oil prices. We may
project the thermel production on the basis of the
coal and oil production scenario that I have
described. The APGR for thermel production for
period 1965/6 to 1971/2 (table 19) was 10.2%.
Subsequently it is likely that the APGR may have
fallen. But I have projected on this APGR till 1978/
9, after which the oil availability may be too
erratic. The % shares of power coal in total thermel
fell from 73.6% to 60.8% and power oil in total
thermel rose from 26.4% to 39.2% in the period
1960/1-1970/1 (table 18). To estimate the shares of
power coal and power oil in the total thermel from
1970/1 to 1977/8,1 have assumed 60% for power
coal and 40% for power oil. This resulted in %
shares of power coal and power oil in total coal and
total oil to rise from 23.5% to 31.5% and 8.5% to
12.4% respectively in this period. To project beyond
1977/8 we have assumed the % shares of power
coal in total coal and power oil in total oil as 32%
and 13%, assuming that if the fuels are available
then because of demands from other setors, the
fuels will flow into the power sector in this ratio.
The projection for thermel upto 2000/1 has been
made in this way and is presented in table 18. The
hydel production has been assumed to keep to a
steady 10.7% APGR till the saturation level in
2000/1. The % shares of hydel and thermel in total
electricity produced are shown in table 19. After
1990/1 the only sources of electricity that we can
think of now are coal and hydroflow. The % share
are nearly equal till 1982/3 after which hydel
would begin to dominate. The % shares of electricity
in total energy are also shown in table 19. From a
minor share in 1960/1, electricity should dominate
by the end of the century, because we have not
contemplated any restrictions on hydel development.
The per capita electricity production is as shown in
the table 22
Table 22. Per capita electricity production (in
kWh/cap) in India from 1960/1 to 2000/1
Year Hydel Thermel Total
Electricity
1960/1 18 21 39
1965/6 31 36 67
1970/1 46 52 98
1975/6 69 76 145
1979/80 94 100 194
1982/3 119 116 235
1983/4 128 91 219
1985/6 150 98 248
1990/1 222 128 350
1991/2 240 100 340
1995/6 346 97 443
2000/1 539 92 631
Thus hydel production should have increased in
1979/80 by 5.2 times the 1960/1 figure and should
increase by 29.9 times by 2000/1. The thermel
production should have increased in 1979/80 by
4.8 times the 1960/1 figure and should fluctuate
due to oil scarcity reaching a level of 4.4 times by
2000/1. Per capita commercial energy increaes by
a factor of 3.1 in the period 1960/1 to 2000/1 and
most of the incease is due to the hydel component.
Per capita noncommercial energy will actually
decline by a factor of 1.5 in this period. This would
mean that the poorer communities in the rural areas
will be very hard hit by scarcity of fuel in he
coming years. Per capita total energy available
increases in this period by a factor of 2.2 only, even
if the hydel can be developed. This does not mean
much increase of prosperity for the country. By
1979/80 we should have about 5.0 times increase
of total electricity production over the 1960/1 figure,
and by 2000/1 we expect 16.2 times increase in our
scenario, inspite of the fact that oil may perhaps
not be available after 1990/1. This is because we
expect that the large hydel potential of the country
can be developed. The above analysis shows how
important it is to develope this potential. The world
average per capita electricity consumption in 1970

Everyman’s Science Vol. XLVIII No. 1, April ’13 — May ’13
58
was 1361 kWh/capita; whereas Norway consumed
14635 kWh/capita and USA 8009 kWh/capita in
that year, thus this country has a long way to go
before its electricity production and consumption
can compare with those of other countries.
Another scenario for hydel is more probable
perhaps; this is based on the assumption that the
capital annual hydel production in 1979/80, which
in 94 kWh/capita, cannot be easily exceeded. Then
the hydel production to 2000/1 would be as given
below.
Table 23. Total hydel production (in TWh) in
India if per capita hydel production is
constant and
= 94 kWh/capita year
1979/80 57 91/2 82
82/3 68 95/6 84
83/4 69 2000/1 92
90/1 73
This means it would take very long time to
reach the target assessed by Power and Economy
Committee. The annual increase of hydel production
is about 2 TWh which would mean annual hydel
installation of 380 MW, which is not too much.
5. Noncommercial Fules : I give some reasons
below which leads me to believe that not
much more than 100.7 MTCR amount of
noncommercial fuel will be available
hereafter.
AVAILABILITY OF NONCOMMERCIAL
FUEL
Firewood
Let us first look into the availability of firewoods
which requires an examination of land utilisation in
India. Table 23 gives the relevant data since most
of the firewood
Table 23. Land utilisation in India in 1972/3.
All areas given in 107 hectare
Source : Statistical Abstract 197761. Figures in
brackects indicate % shares of the total land utilised.
Total geographic area = 32.87
Total land utilised = 30.41 (92.5%
of total land)
Forest area = 6.53 (21.5)
Land area under non-
agricultural use = 1.62 (5.3)
Barren and uncultivable
fallow land area = 2.63 (8.6)
Permanent pastures and
other grazing land = 1.28 (4.2)
Land area under miscellaneous
cultivated tree crops and groves
not included in the area shown = 0.46 (1.5)
Cultivable waste land area = 1.58 (5.2)
Balance area under cultivation = 16.15 (53.1)
comes from our forests let us look at our forest
wealth. The data given in table 23 is very disturbing.
Forests cover only 21.5% of the utilised land and
this can only men disaster from ecological and
climatic points of view. It is therefore extremely
urgent for the Government to seriously review its
forest policy before it is too late. Time targeted
R&D work is necessary to established energy
plantations on cultivable waste land which forms
5.2% of the utlilised land. However, there will be
other important claims on this area. According to a
study of National Council of Applied Economic
Research made in 1959, not all firewood is collected
from forests but from other areas. The survey gives
the firewood consumed for this year as 31 MTCR
and charcoal62 1/MTCR i.e. a total of 32 MTCR.
However, the out turn of firewood from forests was
only 375 Mcft. Allowing for an extra third on this
as illegal cutting, we get a total of 500 Mcft of
firewood which is equivalent of 5 MTCR. Deducting
this from the total 31 MTCR, we find that 27
MTCR of firewood was collected from outside the
forest area. This is extremely serious. Our estimate
61. Statistical Abstracts 1977. Central Stasticial Organisation
Government of India.62. Domestic Fuels in India, National council of Applied
Economics Research (1959)

Everyman’s Science Vol. XLVIII No. 1, April ’13 — May ’13
59
from SRECNI survey is that firewood used in
1978/9 is 43.9 MTCR, and I hope that it is realised
from what has been said, that this cannot be
increased much more.
VEGWASTE
This is mostly agrowaste and depends on the
agricultural output, and the rest depends on
droppings from trees and various other plants. It is
very difficult to estimate the proportions of the
various components, and the problem should be
studied in depth. The agricultural output depends
on the cultivated land, which is already about
53.1% of the utilised land, and perhaps cannot be
increased and further. The trees are diminishing in
number, and their droppings must necessarily
decrease henceforth. Moreover, there are other
important demands on vegwastes for nonenergy
industrial use. An important example is the
utilisation of just sticks for production of hard
boards. The figure for vegwaste obtained from the
SRECNI study for 1978/9 is 32.3 MTCR and it is
very likely this figure will remain constant with
time.
DUNG
Meghnad Saha63 in his last paper made a very
interesting study of availability of dung fuel, and
his approach to the problem was accepted as realistic
by NCAER in their report on Domestic Fuel64. He
made an estimate of the dung collected from the
report of marketing of cattle65 in India which stated
that an average adult Indian cow produced 25 1b/
day of green dung, young cow 18 1b/day, an adult
buffalo 60 1b/day and an young buffalo 40
1/b day. Prof. Saha assumed 180 M heads of cattle
with composition 140M heads of cow and 40M
heads of buffaloes. With the age structure for both
groups : 70% adult and 30% young, the dung
outturn should be as given below :
Number Annual
(in M heads) green dung
outturn (MT)
1. Cow population
Adult 98 405
Young 42 125
140 530
2. Buffalo population
Adult 28 278
Young 12 79
40 357
Total : 180 887
Thus, average yield of green dung by a cattle
head per year = 4.93T/year = 13.50 kg/day.
According to the Memorandum on the Development
of Agricultural and Husbandry (1944)66 and 40%
of dung is collected. Thus of 887 MT green dung
only 354 MT green dung or 71 MT dry dung is
available This gives the ratio.
"\ _ Z | XXXX
|!\_ _ \_×× = =
Thus average dry dung collected per cattle head
= 0.39 T/y
Our calculation from the SRECNI study requires
23.1 MTCR of dry dung in 1975/6 which is
equivalent to 76.96 MT of dry dung or 962 MT of
green dung. This would require 195 M heads of
cattle. According to statistical abstract 197767 the
cattle population growths are as given below
1961 1972 APGR
Number of cows 176 178 0.1%
(in M heads)
Number of buffaloes 51 59 1.3%
(in M heads)
Total (in M heads) 227 237 0.3%
63. Meghnad Saha. Fuel in India, Nature, May 19, p. 923,
(1956)64. Domestic Fuels in India, National council of Applied
Economics Research (1959)65. See Meghnad Saha. loc. cit.66. See Meghnad Saha. loc. cit.67. Statistical Abstract 1977, Central Statistical Organisation,
Government of India.

Everyman’s Science Vol. XLVIII No. 1, April ’13 — May ’13
60
With these APGR’s the cow number is 178.5
heads and buffalo number is 61.3 M heads, i.e. a
total of 240 cattle heads in 1975/6 which is sufficient
for the dung required. If the rural population grows
unchecked at APGR of 2%, then the dung demand,
which should also grow at this rate, will very soon
outstrip the supply, which grows at the rate of 0.3%
only. If this happens in x years after 1975/6 then x
is a solutions of
195 × (1.02)x = 240 (1.003)x
which gives x = 12 years, i.e. the year when
dung supply will be inadequate is 1987/8. We have
allowed 2% growth of rural human population upto
1991/2. So the dung supply can be allowed to grow
at 2% APGR upto 1987/8, when it reaches the
fugure 29.3 MTCR (dry dung). After this year the
dung supply may rise very slowly at an APGR of
0.3% the APGR for cattle population of India.
It must be recognised that we have taken a
very low CR value for dung viz. 0.3%. With
improvement of utilisation technology e.g.
conversion into gobar gas, the net energy available
from the dung collected may be much larger than
what is put in table 12.
SUMMARY
We may now summarise the main points of this
study.
Oil gap : The Doomsday for oil import has been
set in 1928/3 and domestic oil in 1990/1. We have
seen that the shortage of oil will profoundly affect two
economic sectors : the Transport and the Domestic.
We have calculated the per capita oil consumptions
for these sectors for 1970/1, which is 0.137 TCR/cap,
and projected with this per capita consumption as
constant with time to find the amount of oil consumed
in these sectors for subsequent years. This assumes no
real growth of consumption of oil in these sectors.
Table 24 shows the state of affairs for these sectors
upto 2000/1.
Table 24. Oil gap (in MTCR)
Oil demand for T&D sectors calculated at the
1970/1 per capita level of 0.137 TCR/cap
Year Oil Oil demand % Gap
available (T&D sectors)
1970/1 129.3 74.8 58
1975/6 156.0 84.0 54
1979/80 212.7 91.9 43
1982/3 247.1 94.6 40
1983/4 137.7 101.1 73
1985/6 115.3 105.9 92
1990/1 214.8 119.2 55
1991/2 – 122.0 – 122.0
1995/6 – 827.0 – 127.0
2000/1 – 133.4 – 133.4
Thus by 1990/1 the oil gap may dominate the
Transport and Domestic sectors. This gap must be
filled up by alternative liquid fuels. The production
of ethanol from bio waste may not be sufficient, for
the amount of biowaste available will have reached
saturation by 1978/9. The only other alternative
seems to be hydrogen, which must enter the
economy by the next ten years.
Coal : The coal production has been assumed to
rise steadily at 7 % rate. But to maintain this steady
APGR tremendous changes are necessary in the
managerial structures and mining methods; the
symbiosis of coal and electricity must be restored.
The assumption made here that coal production
will level off at 280 MT by 1991/2, if such changes
cannot be made, seems to be realistic. The
Doomsday for coal for 280 MT annual production
will be in 2260/1. It is also very clear from the
expected per capital coal production that not much
coal can be spared for liquifaction or gasification
as substitute fuel for the Transport and Domestic
sectors.
Electricity : The optimistic picture that emerges
of electricity production is based on the assumption
that the 10.7% APGR can be maintained for hydel
production. This may be too much to expect. The
question of transmission of hydel from the place of
generation to the consumers will become very
important in future. To solve this problem, hydrogen
may have to be produced at the site of electricity

Everyman’s Science Vol. XLVIII No. 1, April ’13 — May ’13
61
production, which could then be piped to the
consumer. The loss of electric energy in transmission
must be reduced by replacing gradually the high
voltage AC transmission systems by the high voltage
DC transmission ones.
This then the picture of what I feel would be
shape of things to come. It will be clear that I am
putting too much trust in our capacity to develope
hydroenergy. If we fail in doing this, then ofcourse
the country will face a disaster of unprecedented
magnitude. Even if everything goes alright, does
the per capita energy, which becomes available,
mean prosperity for the country.
Tolstoy asked the question : how much land
does a man need. A similar question may be asked
about energy. How much energy do we really
need? An American consumed in 1970/1 about
328.8 M Btu of energy i.e. about 11.7 TCR, which
is very large compared to India per capita energy
0.57 TCR for the same period. Indeed if one
examines the energy comsumption of various global
areas in 1970 given in table 25 one can see that the
developed countries with 26.1% of the world
population consume 77.9% of the energy. Indian
Table 25. Energy consumption of various countries in 1970
Country Energy consumption Population Per capita energy
(in q = 1015 Btu) (in G = 109 a persons) (in M Btu)
Africa 3.64 ( 1.7) 0.35 ( 9.7) 10.40
Asia (communist) 11.34 ( 5.3) 0.79 (21.9) 14.35
Asia
(Non-Communist) 20.76 ( 9.7) 1.23 (34.0) 16.90
Latine America 9.20 ( 4.3) 0.28 ( 7.8) 32.90
North America 74.25 (34.7) 0.23 ( 6.4) 326.80
Oceania 2.35 ( 1.1) 0.02 ( 0.5) 117.50
USSR &
East Europe 44.72 (20.9) 0.35 ( 9.7) 127.80
West Europe 47.72 (22.3) 0.36 (10.0) 132.50
213.98 (100) 3.61 (100) 59.28
Source : J. P. Harnett68. Figures in brackets indicate % shares
per capita energy 0.57 TCR is comparable with the
per capita energy for noncommunist Asia for
1970/1 which is 16.9 M Btu i.e. 0.60 TCR. Meghnad
Saha had all his life struggled to fight this injustice,
and his wish was that this country achieves the
same energy consumption level as the developed
countries. But today in face of energy shortage, the
per capita energy consumption in developed country
seems a preposterous way of spending the limited
resources available.
On the other hand the advance of technology
based on increasing consumption of energy has
certainly improved the quality of life of many
classes of the society. The increasing pace of energy
consumption is very neatly summarised in the
dedication page of the survey “ Energy and man70” :
“For the grandparents .. who found 110 kWh/
capita/day was more than enough, for the parents ..
who thought 150 kWh/capita/day was about right,
for the brothers and sisters .. who have been doing
well on 250 k Wh/capita/day and for the children ..
who will probably feel like they’re having to skimp
at 350 kWh/capita/day” The figures are presumably
for total energy. The Indian figure71 for total energy
68. J. P. Harnett : The case for alternative energy sources,article in Alternative Energy Sources.
70. Energy and Man–Technological and Social Aspect : edMorgan M.G. The Institute of Electrical and ElectronicsEngineers Press.
71. Note : Using calorific value of anthracite-12700 Btu/lb,ITCE = 28 MBtu = 8202kwh.
is 12.8 kWh/capita/day in 1970/1, which may rise
to 21.1 kWh/capita/day in 1970/1, which may rise
to 21.1 kWh/capita/day in 2000/1. Technology has
increased the expectation of people of all walks of
life, and it is unthinkable that its forward march

Everyman’s Science Vol. XLVIII No. 1, April ’13 — May ’13
62
can be halted or reversed. We have a long way to
go to meet the energy demand, which is bound to
rise steeply.
In table 26 we see the per capita production of
various forms of energy. The non-power coal
We cannot attack the energy problem unless our
attitudes change. In the coming years, the energy
question will surpass all other national problems in
importance and urgency. The Government must
realise the key role that energy plays in the economy
production increases by a factor of 1.9 to a
maximum in 1991/2 and then declines. Oil may
vanish by 1990/1, creating an oil gap of 122 MTCR,
i.e., 18.8 MT in the Transport and Domestic sectors,
which has to be met. Per capita electricity increases
by a factor of 16.2 in the period 1960/1 to 2000/1.
But whether this will be possible is doubtful. In
table 22 we have seen that per capita hydel increases
by a factor of 29.9 in this period whereas thermel
increases only by a factor of 4.4. Thus if the APGR
of the hydel is not maintained, then electricity will
be a scarce commodity as it is already threatening
to be.
ENERGY STRATEGIES FOR THE FUTURE
I shall be very happy if my forecasts are proved
to be wrong. But my fear is that what will actually
happen may be far worse than what I have described.
So the country must be put on a state of preparedness
to face the dangerous situations that will come. I do
not know the answers to what must be done -I do
not believe any body does. I shall, however, suggest
a few points, which I think are relevant. In the hope
that specialists would discuss them and indicate the
path, which the country should follow.
Table 26. Per capita energy production (in 10 × TCR/person = 104 kwh/person)
Year Nonpower Nonpower Electricity Total Total Non- Total
Coal Oil Commercial Commercial Energy
1960/1 1.13 1.20 0.39 2.72 1.62 4.34
1965/6 1.13 1.64 0.67 3.45 1.60 5.05
1970/1 1.02 2.17 0.98 4.17 1.57 5.74
1971/2 1.09 2.24 1.45 4.78 1.55 6.33
1977/8 1.26 2.76 1.94 5.96 1.51 7.47
1978/9 1.43 3.22 2.35 7.00 1.43 8.43
1982/3 1.50 1.36 2.19 5.05 1.40 6.45
1983/4 1.58 1.55 2.48 5.61 1.35 6.96
1990/1 2.04 2.15 3.50 7.69 1.22 8.91
1991/2 2.13 – 3.40 5.53 1.19 6.72
1995/6 2.05 – 4.43 6.48 1.15 7.63
2000/1 1.95 – 6.31 8.26 1.10 9.36
and lives of the people, who would put up with
energy shortage only to the point that the Domestic
sector is not touched and the food supply systems,
which is a matter for the Transport sector, does not
collapse. If the energy question is allowed to drift,
then the politicians indulging in the luxury of the
power game, would be swept away as unworthy of
trust of the people. We, scientists value our freedom
to work on problems of our choice : this freedom
will be lost, if we do not participate in energy
reserach. We have a wonderful status in society.
Other people pay and we do what we want. If we
neglect to work on energy, our privileged status
cannot be defended, in a energy less society. Energy
research must, therefore, be undertaken as a matter
of compulsion in all R&D institutes of the country.
The technologists may find very soon that the
society would not have much use for them, if they
do not lavish the care and attention to the design,
manufacture, installation, operation and maintenance
of the energy conversion machines, which is
required. The workers must cooperate to see that
the energy supply to the various economic sectors
are assured, for otherwise they would suffer as
much as others in the disasters that would follow.

Everyman’s Science Vol. XLVIII No. 1, April ’13 — May ’13
63
Energy is a multidisciplined subject and
educationists must carefully arrange that the
Universities and the I.I.T’s have energy as an
important item in their syllabi and also design
practical training courses for those who would take
up energy as a career. The media has a major role
to play in making the awareness of the problem
pervade through all strata of society. All of us must
realise the urgency of the problem and be ever
vigilant that things are properly done. Energy crisis
has to be treated on a war time footing.
To formulate a strategy for energy, reliable data
and informations should be easily available on
various forms of energy, both in regard to quantity
and efficiency of production and distribution, their
consumptions in the various economic sectors with
assessments of various end uses. Unfortunately, in
India, the data that are available, are too old and
incomplete to be useful. Thus it is imperative that
a monitoring agency be set up to undertake this
task.
The country evidently must have an energy
policy. I do not know which organisation should
undertake the formulaition of the policy. I can at
least suggest, for what it is worth, what should be
discussed while formulating the policy statement.
Evidently the policy must contain considerations
the following points :
1. Energy resources and exploitation
Prospecting for new resources, Development
of prospecting methods for remote areas and
under oceano using remote using methods
for prospecting.
Preparation of a master inventory of energy
resources of the country.
Modernisation of mining methods and
equipments: Consideration of secondary and
tertiary recovery methods for oil wells which
are exhausted with respect to primary
methods, deep coal mining.
Assesment of the biomass that can be gathered
without endangering the ecology of the
country.
Establishing energy plantation for biofuels.
A trade policy for regulating export of energy
resources and import of energy fuels.
2. Alternative uses of existing fuels
Intense R&D programme for liquifaction and
gasification of coal within a considered time
frame so that by 1990/1 the plants can be
ready to provide coal based liquid fossil fuel
to domestic and transport sectors.
Intense R&D programme for production of
ethanol from biomass and introduction into
the economy of other bioconversion systems.
Rethinking of the gobar gas programme to
make the gas available to the poorer classes
of society.
3. Hydel & electrification programme
Rethinking of the various aspects of the
existing hydel projects for taking corrective
measures.
Laying down a hydel production programme
for the country, for we may have to depend
on hydel in increasing proportions.
Replacement of A.C. transmision by D.C.
systems.
Rural electrification should be reconsidered
if hydel production cannot be increased.
4. Energy conversion machines
A review of what types of energy machines
and plants should be manufactured in the
country and what should be imported.
5. Energy pricing
A policy for pricing various forms of energy
that is should to the consumers and
recommendations of differential rates,
whenever necessary.
6. Regulatory aspects
To consider the pollution and damage to
environment and ecology from energy
production from fossil or nuclear fuesl, hydel
etc. and what legislations to pass and how to
enforce them.

Everyman’s Science Vol. XLVIII No. 1, April ’13 — May ’13
64
7. New energy sources
Intense R&D programme for hydrogen
production with the target that production
begins by 1990/1.
Intense R&D programme for fuel cell
development.
A solar energy policy for its utilisation with
Stirling engines in the Rural Agriculture for
irrigation pumps and generally for sector for
space heating and cooling, and a R&D work
programme for photovoltaic converters,
should be laid down.
Installation of aeolian engines where strong
winds are available, tidal energy stations at
gulf of Cambay and Kutch and the mouth of
Hugly in West Bengal.
Consideration of prospects of utilisation of
geothermal station.
8. Collaboration with other countries on
energy R&D
To the consider research programmes on
energy, which are too expensive for this
country or lack native expertise, for which
collaborations should be established with
other countries magnetohydrodynamics,
fusion energy programmes, solar energy
programmes, etc.
9. Nuclear fission energy
Rethinking about what to do with this
technology : whether to go on with it, in
which case a reorganisation of the whole
programme will be needed, or whether to
taper it off in view of the known hazards,
which seem almost unsurmountable.
10. Perspective for the future
A plan for fuel replacements when the
shortages really set in – ethanol to take the
place of oil now and hydrogen coming in by
1990/1.
Consideration of per capita producton of
various forms of energy and consumption in
various enconomic sectors upto the end of
this century, for this provide the basis to plan
the other aspects of the economy.
11. Energy Ministry.
Restructuring of the Energy Ministry to
vitalise it for planing for energy and endowing
it with the necessary overall powers for
executive actions.
12. Various Agencies and Research Institutes
Reorienting the charters of various agencies
and R&D organisations and allotment of
tasks to them to meet the energy challange.
13. Education and training.
Introduction of energy prominently in the
sylabi of the Universities, the IITs and the
Technical Colleges, and designing of practical
training courses on various aspects of energy.
There are many aspects that I have not touched
at all in this study.
The historic perspective has been only very
briefly described. This is a fascinating field
for study for scholars, particularly with
respect to what happened in India in the past,
which is not so well known.
I have considered a few likely scenarios.
Many other scenarios are possible which
should be examined in detail to work out the
best strategies to meet the crisis looming
ahead. The strategies should have a flexibility
so that they can be adapted to altered
situations.
The discussion of structures and logistics of
large energy plants and their management
has been completely left out. This is of
immediate importance in view of the present
crisis of management.
I have not considered the rise of cost of
energy and the effect on various sectors of
the economy and on the social ethos.
I have just touched on the effect of energy
scarcity on a few chosen sectors of the
economy arid that also rather casually. I have
not discussed the profound social changes
that are likely to follow as a result of the
scarcity.

Everyman’s Science Vol. XLVIII No. 1, April ’13 — May ’13
65
The conservation aspect has not been touched
at all. This should be an important area in
which study in depth has to be conducted,
for many administrative and legislative
measures are dependent on such studies.
I have not discussed the pollution apects of
energy production and consumption. The
Industrial Revolution had started the release
to the atmosphere of CO2 and many hazardous
gases, aerosols and various particulates. The
release of CO2 is dramatically demonstrated
by the Suess effect. What will be the long
term effect on the global climate is a matter
of intense controversy. Completely opposing
conclusions are put forward, all basing their
speculations on what would happen to the
ozone layer.
The question of acceptance by society of
new modes of energy has not been discussed.
There are many other questions related to
interacton of energy and society which need
detailed analysis.
I have not considered the global scenarios in
any detail and the interactions between other
countries and ours on energy, which must
assume importance in years to come. We can
not live in isolation and energy is an area in
which international discussions,
collaborations and agreements will be very
much needed.
I have also not considered the tremendous
stock of energy resources which are likely to
be found below the oceans and on the
continental shelves and the methods of
prospecting for them, assessing the
dimensions of the deposits and possible
recovery technologies. There are other
important questions regarding such deposits-
who owns them, does the principle of Res
Cummunis apply to the resources in the sea
or do such resources, in practice, belong
only to the technologically advanced nations,
who have the expertise as prospect for and
exploit such wealth?
I have tried to cover many things in course of
this address, from very sublime concepts like Migma
to some rather profane things like dung. I hope that
I have been able to show to you the tip of the
iceberg. This is as much as I could do in the time
available to me. The opinions I have expressed are
my own. There will be other opinions and other
views. I do not wish you to agree with me; rather
if this address gives rise to vigorous discussions
among you, then I shall have achieved my purpose.
The crisis is right on us, and there is so much to be
done. It would be wrong to think that we shall
some how muddle through. A lot of thinking,
preparation and organisation will be needed, if we
have to face the challenge. To be or not to be is
now very much the question.
My appeal to those who ordain our lives is to
spare a thought on the shape of things to come. In
a world, where energy will be scarce, much of the
issues on which we fight so fiercely will lose their
relevance. The arguments we use would be just so
many empty words, devoid of any meaning. In
such a world, it would be sufficient for the day, to
live from one moment to the other, and survive.
The warning bells of Spaceship Earth are ringing.
Do not ask me for whom the bells toll-it tolls for
you, for me, for all the people of earth of today and
tomorrow. Shall we heed the warnings and take up
the challenge?
Finally I turn once more to the 21st President,
who did so much to draw our attention to these
problems, and who thought so much about them.
We have come across his thoughts and studies
althrough this address. With the deepest humility, I
dedicate this work to him. His life and philosophy
stand as a shining beacon in the gloom that is
setting on our world.
Thank you ladies and gentlemen.
ACKNOWLEDGEMENTS
My thanks are due to Dr. J. Gururaja of the
Department of Science and Technology for making
available to me the preliminary report of the Survey
of the Rural Energy consumption of northern India
made by the Natonal Council of Applied Economic

Everyman’s Science Vol. XLVIII No. 1, April ’13 — May ’13
66
Research, and the study on coal by T. N. Basu,
T. P. Basu : “Coal resources and extinction
technology in India”, Central Mine Planning and
Design Institute Ltd., Ranchi. Dr. Gururaja made
available to me the DST library and gave me many
other help. My thanks are due to Shri C.
Ambasankaran of Bhabha Atomic Resarch Centre
for information on Indian MHD programme and
for making available to me the reports of the
second world Hydrogen conference held in 1978 at
Zurich. I have also used the library of the Indian
National Science Academy and through the kind
courtsey of Dr. A. K. Bose, the library of the
Council of Scientific and Industrial Research. I
owe a debt to the American Centre at Culcutta for
the kind courtsey that was extended to me for the
use of their library. My thanks are due to Dr. P. K.
Mukhopadhya of ONGC for many informations
about oil production and consumption in India. The
ungrudging helps given to me by my friend Dr. B.
K. Banerjea and my colleagues of the Saha Institute
of Nuclear Physics, Prof. S. K. Mukherji, Prof. N.
N. Saha, Dr. S. K. Ghosh, Dr. B. G. Ghosh and Dr.
N Chatterji and the valuable discussions I had
continuously with them are gratefully acknowledged.
My thanks are also due to Shri P. K. Mukherji, Shri
B. C. Roy and Shri N. K. Sinha, for prepartion of
the manuscript and to Shri A. Saha for the graphs
appearing in this study.
APPENDIX
Papers and speeches by Meghnad Saha on
Energy
On hydroenergy and rivers
1922 The great flood of northern Bengal, Mod.
Rev., 32, 605.
1932 Catastrophic flood in Bengal and how
they can be combated, Mod. Rev. 51, 163.
1933 Need of a hydraulic research laboratory
in Bengal, Sir P. C. Roy, 70th Birthday
Commemoration Volume p. 237.
1935 The Damodar food of 1935, Mod. Rev.,
58, 527.
1936 Irrigation research in India, Sci. Cult., 2,
281.
1938 The problems of Indian rivers, Presidential
address to National Institute of Sciences
of India, Proc. Nat. Inst. Sci. Ind., 4, 23.
1943 Damodar Bengal’s river of sorrow,
Amritabazar Patrika Aug 15. Flood, Sci.
Cult., 9, 95.
1944 With K. Roy : Training of the Tennesse
river, Sci. Cult., 9, 418.
With K. Roy : Planning for Damodar
river, Sci. Cult, 10, 20.
1946 With K. Roy : The Damodar Valley
reclamation scheme, Sci. Cult, 11, 513.
1947 Multipurpose development of Indian
rivers, Sci. Cult., 13, 3.
On nuclear energy
1935 Ultimate constituents of matter, Sci. Cult.,
1, 12,
1936 With P. L. Kapoor : Conference on
Nuclear Energy, Sci. Cult., 2, 133.
1939 World of Atom and Nuclei. J. C. Bose
Memorial Lect.
1941 Uranium fission, Sci. Cult., 6, 694.
1945 With B. D. Nagchowdhuri : Story of the
atomic bomb, Sci. Cult., 11, 111.
The logic of the atomic bomb, Sci. Cult.,
11, 212.
Britain’s part in the evolution of the atomic
bomb, Sci. Cult., 11, 214.
1946 The atomic bomb, Sci. Cult., 11, 645,
Lecture given at Royal Asiatic Society of
Bengal.
1947 The Industrial utilisation of atomic power
in India, Sci. Cult., 13, 86 and 134.
Release of atomic energy, Sci. Cult., 13,
167.
1953 Speech as Chief Guest printed in Quarterly
Journal of Geological, Mining and
Metallurgical Society.
1954 Suggestions for developments of atomic
energy, Ind. Exp., Nov 18.
1954 Peaceful utilisation of atomic energy on
international level, Sci. Cult., 19, 363.

Everyman’s Science Vol. XLVIII No. 1, April ’13 — May ’13
67
Atomic energy in India and abroad, future
of atomic energy in India, Sci. Cult., 20,
205. Talk given to a group of MPs and
other distinguished persons at a meeting
presided over by Shri Jawharlal Nehru.
1954 Peaceful uses of atomic energy-Loksabha
Debate Vol. 5, 7005.
1955 On the choice and design of reactors,
paper presented at a conference on atomic
energy development at New Delhi held in
1955 and delivered also as a lecture on
the occasion of 70th birthday
commemoration celebration of prof. D.
M. Bose. Trans Bose Inst 20, 102. Atomic
weapons, disarmament and peaceful uses
of atomic energy-address at World
Assembly for Peace held at Helsenki in
1955 published by World Secretariat
Council for Peace p 541-7, Sci. Cult.,
21, 66.
Report of the disarmament and atomic
weapons commission of the World
Assembly for Peace held at Helsinki in
1955, published by World Secretariat
Council for Peace p. 564-5, Sci. Cult., 21,
70.
Russia ready to offer atomic power,
Hindustan Standard July 20. The atomic
energy conference at Moscow, Sci. Cult.,
21, 76.
Russia exceeds US in Nucl Power,
Hindustan standard June 20.
End of an Unscientific era, Sci. Cult., 21,
117.
On non commercial energy
1956 Fuel in India, Nature, May 19, p.923,
1956.
Other articles on energy
1935 Electricity-its use for the public and for
industries, Sci. Cult., 1, 203.
Public supply of electricity in India, Sci.
Cult., 1, 367.
1937 On the national supply of electricity, Sci.
Cult., 3, 65.
1938 With A. N. Tandan : The intelligent men’s
guide to the production and economics of
electrical power, Sci. Cult., 3, 506, 574.
1938 Symposium on power supply : Opening
address, Proc. Nat. Acad. Sci., (Special
number) 1, 1938.
Need for power research and investigation
board, Sci. Cult., 3, 405.
1939 Wanted a national fuel policy, Sci. Cult.,
6, 61.
1942 With S. N. Sen : Oil and invisible
imperialism, Sci. Cult., 8, 150.
1944 India’s need for power development, Sci.
Cult., 10, 61, Lecture at Rotary Club.
UNITS
1. Decimal Scales :
Milli (m) = 10–3,Centi (c) = 10–2,Kilo (k) = 103,Mega (M) = 106,Giga (G) = 109,Tera (T) = 1012,USA n-trillion = 103 (n + 1),European n-trillion = 106n
2. Weights
1b kg1 0.45362.205 11 short ton = 2000 1b,1 long ton = 2240 1b,
1 quintal = 102 kg,
1 tonne (T) = 103 kg
3. Lengths
ft m1 0.30483.281 11 inch = 12–1 ft,1 mile = 5280 ft = 1.609 km1 cm = 10–2m,1 km = 103m = 0.6213 mile
4. Areas
ft2 m2
1 9.2910.76 11 Acre = 43560 ft2,1 mile2 = 640 Acre1 Areas = 102 m2
1 hectare (ha) = 104m2,1 km2 = 106m2 = 100 ha1 mile2 = 2.59 km2,1 km2 = 0.3861 mile2

Everyman’s Science Vol. XLVIII No. 1, April ’13 — May ’13
68
5. Volumes
ft3 litre (L)1 28.31
3.532 × 10⁻² 11 L = 103 cm3,1 m3 = 106 cm3 = 103L1 ft3 = 2.831 × 10⁻³m3,1 m3 = 35.32 ft3
1 Imp gallon = 4.546 L,1 USA fluid gallon = 3.785 L1 Petrol barrel (BBI) = 42 USA fluid gal = 158.9L
6. Energies
Ftlb k joule (kj) Btu
k cal Hph kWh
1 1.356 × 10⁻³ 1.285 × 10⁻³
3.241 × 10⁻⁴ 5.051 × 10⁻⁷ 3.766 × 10⁻⁷
7.377 × 10² 1 9.486 × 10⁻¹
2.390 × 10⁻¹ 3.725 × 10⁻⁴ 2.778 × 10⁻⁴
7.776 × 10² 1.054 1
2.520 × 10⁻¹ 3.927 × 10⁻⁴ 2.929 × 10⁻⁴
3.086 × 10³ 4.184 3.9681 1.559 × 10⁻³ 1.162 × 10⁻³
1.98 × 10⁶ 2.684 × 10³ 2.542 × 10³
6.416 × 10² 1 7.457 × 10⁻¹
2.665 × 10⁶ 3.6 × 10³ 3.414 × 10³
8.601 × 10² 1.340 1
Very large energy units :
1 Therm = 105 Btu,1 Quad (q) = 105 Btu,1 Quint (Q) = 1018 Btu = 292.9 TWh.
Very small energy units :1 eV = 1.6 × 10⁻¹⁹ J,1 Mev = 1.6 × 10⁻¹³J1 erg = 10–7 J
7. Powers
Hp kW(mechanical horsepower)
1 7.457 × 10⁻¹
1.341 1
Watt (W) = Joule/sec
FORM IV
Rule 81. Place of Publication The Indian Science Congress Association
14, Dr. Biresh Guha Street, Kolkata – 700 017
2. Periodicity of Publication Bi-monthly (Published every two months)
3. Printer’s Name Dr. Ashok Kumar Saxena
Nationality Indian
Address The Indian Science Congress Association
14, Dr. Biresh Guha Street, Kolkata – 700 017
4. Publisher’s Name Dr. Ashok Kumar Saxena
Nationality Indian
Address The Indian Science Congress Association
14, Dr. Biresh Guha Street, Kolkata – 700 017
5. Editor-in-Chief’s Name Dr. Ashok Kumar Saxena
Nationality Indian
Address 7/182, Swarup Nagar,
Kanpur–208 002, Uttar Pradesh
6. Name and Address of Individuals The Indian Science Congress Association
who own the newspaper and 14, Dr. Biresh Guha Street,
partners of Shareholders holding Kolkata - 700 017
more than one percent of the total
I, Ashok Kumar Saxena, hereby declare that the particulars given above are true to the best of my knowledge and belief.
Date : 31.05. 2013 Ashok Kumar Saxena
Publisher
Everyman’s Science

Everyman’s Science Vol. XLVIII No. 1, April ’13 — May ’13
69
G lobal warming is today an issue of concern
for every nation. The genesis of global
warming can be related to a combination of factors
including an excessive increase in human population,
a more than optimum consumption of energy and
matter, increasing degradation of the environment,
rapid deforestation leading to loss of valuable
topsoil, indiscriminate use of non-biodegradable
biocides, relentless release of toxic synthetic
chemicals and radioactive waste into the seawater,
profuse oil-spill in the oceans, acidification of oceans
and on top of all, rise in temperature.
Global warming, coupled with ozone-depletion,
is causing thermal expansion of oceans, increased
precipitation, melting of the polar ice-caps and
retreat of mountain glaciers—all of which are
leading to a pronounced rise in sea level.
One of the most significant marine organisms
are coral polyps which secrete lime and in the
process, form coral reefs. Reef-building corals are
called hermatypic. Coral reefs form one of the
most important marine ecosystems of the world.
They occupy less than 1% of the total area of the
oceans, but host at least 25% of all marine life2.
They provide a natural habitat for thousands of
marine organisms including coralline fish, sponges,
CLIMATE CHANGE AND CORAL VULNERABILITY
Sharmila Chandra
mollusks, echinoderms, crustaceans, etc. However,
corals are extremely fragile and vulnerable to
thermal stress and other environmental parameters.
They also have a very low adaptive capacity1.
Coral bleaching may be defined as a process in
which corals expel the algae that exist within them
or their constituent algae die. The relationship
between corals and their constituent algae is very
intricate. Inside the sac of every coral polyp there
exists a single-celled algae called zooxanthellae.
Zooxanthellae provide 30% of the nitrogen and
91% of the carbon needs of a coral host. In the
process of photosynthesis, the algae gives off oxygen
that the coral polyp requires to survive. In return
the polyp gives the algae carbon dioxide and other
substances the algae needs. Thus, there is a
symbiotic relationship between the coral and the
zooxanthellae. When the temperature of seawater
rises, the symbiosis between the coral and the algae
breaks down. It is then that the coral expels the
algae and turns white. Bleaching induces
biochemical changes in the composition of the
coral tissues, including reduction in protein and
amino acids. Also, there occurs a fall in the lipid
content of the coral tissues. Since the coral derives
its energy from this microscopic organism, the
coral is then deprived of its source of energy.
Without symbiotic algae, the coral either dies from
starvation or becomes so weak3, that it succumbs to
This is entirely a review article intended to raise awareness about one of the most dangerous
consequences of global warming. The oceans are repositories of some of the most valuable
resources of the world and human-induced global warming puts them at risk. All scientists
and environmentalists must be conscious of this fact and make efforts to save them from
overexploitation.
* Department of Geography, Visva Bharati University,
Santiniketan-731235, West Bengal
Email : [email protected]

Everyman’s Science Vol. XLVIII No. 1, April ’13 — May ’13
70
harmful bacteria and seaweeds which can poision
and kill coral on contact.
As seawater begins to warm, immediately a
complex cascade of molecular signals are sent out,
which trigger the process of coral bleaching. The
corals suffer from apoptosis, that is, a programmed
and self-inflicted cell death, in which they kill off
some of their cells as they undergo thermal stress.
Apart from bleaching, increased ocean temperatures
also affect coral larvae survival negatively. This
means that as temperatures continue to rise, there
are fewer baby corals replacing the ones that have
already died.
Mass coral bleaching events were rare about 30
years ago, but have increased in frequency in the
past few years. Studies have revealed that this type
of mass coral bleaching, in which entire reefs may
be wiped out, are positively related to the increase
in sea surface temperature in recent times10.
Australia’s Great Barrier Reef, the longest in the
world, has suffered eight bleaching events since
1980, the worst being in 2002 when 55% of the
total reef area was affected. The frequency of these
events appears to be increasing. The Caribbean and
western Pacific were identified by the researchers
as the areas where most corals are threatened. The
Elkhorn Coral, a critical reef-building species was
included in the U.S. Endangered Species List in
2006 due to a rapid decline in its population. The
Staghorn Coral, another Caribbean reef-building
species, is also under threat.
Coral atolls still exist in the Lakshwadeep group
of islands in India, which are made up of 12 atolls
and 3 reefs. Islands such as Kadmat, Minicoy,
Kalpeni, Kilpan and Chetlat are typical atolls.
However, these are also endangered with the
possibility of extinction. Increasing ocean
temperatures related to global warming and climate
change caused a 70% loss in corals of the reef
ecosystems off Lakshwadweep and the Andamans
in 1998. There are reports of 80%-90% loss in
Lakshwadeep corals during 1998 probably due to
the El Nino event of 1997-1998. The type of coral
most affected was Acropora. The Expert Team
constituted by the Planning Commission,
Government of India, to review the status of the
coral reefs in Lakshwadeep reported that in Kavaratti
only 30% of the corals remained live and the rest
were dead corals. Patches of sea grass and seaweeds
were seen by them in some shallow water zones.
The team noted that extensive bleaching had taken
place due to rise of sea surface temperature in the
wake of the El Nino event of 1997-1998, which
had impacted over 40%-90% of live coral cover.
There were no more than 10% live corals in the
Kadmat Island after the bleaching event. In 2000
A.D., WWF identified Lakshwadweep as a global
marine ecoregion. It is part of the marine ecoregion:
Maldives, Chagos, Lakshwadweep Atolls - Chagos
Archipelago (United Kingdom), India, Maldives,
Sri Lanka. In the year 1998, ocean temperatures
increased to an excess of 2°C above the normal
summer maxima that exists in this part of the
Indian Ocean. It has been found that a rise of just
1°C in ocean temperatures lasting as little as two to
three days is sufficient to start bleaching events6.
The year 1998 was the warmest of the century
(NOAA, 1999). In that particular year, coral
bleaching took place in 60 countries and island
nations at sites in the Pacific Ocean, Indian Ocean,
Red Sea, Persian Gulf, Mediterranean Sea and
Caribbean Sea. The corals of the Andaman and
Nicobar Islands as well as the Lakshwadeep Islands
were severely affected, with greater man 70%
mortality reported in the Maldives, Andamans,
Lakshwadweep Islands and 75% in the Seychelles
Marine Park System and the Mafia Marine Plant
off Tanzania. The Global Coral Reef Monitoring
Network recognised four overlapping levels of coral
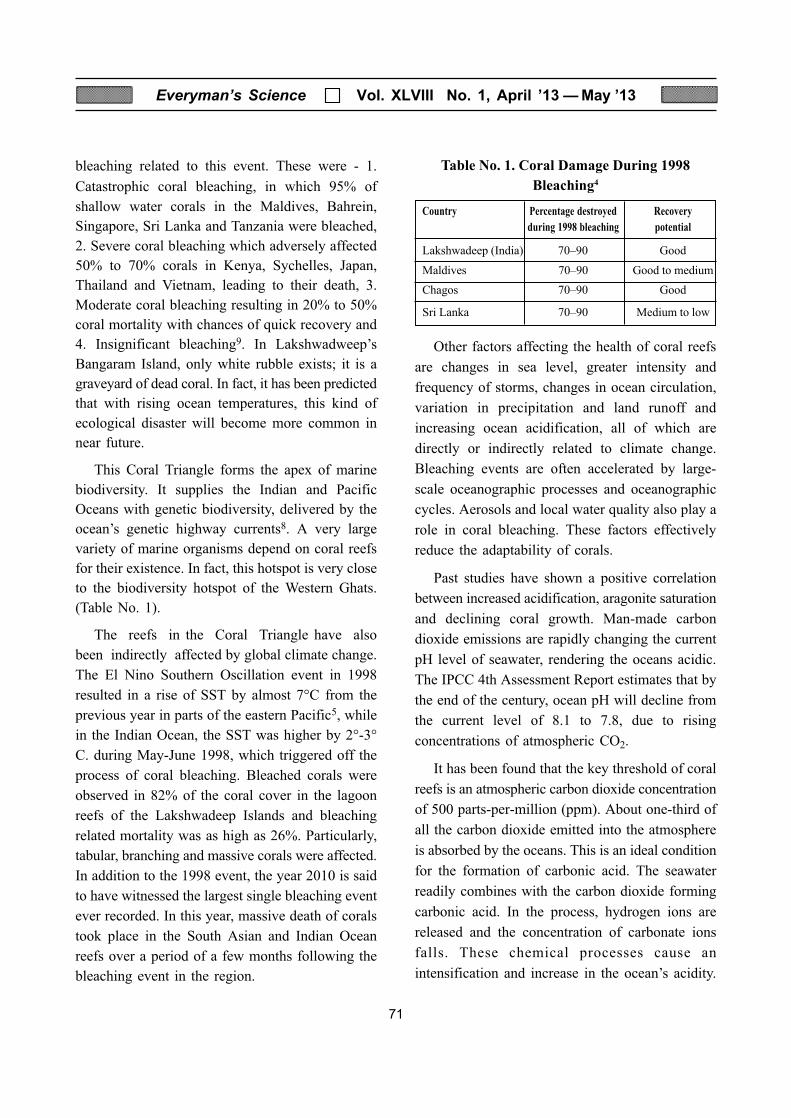
Everyman’s Science Vol. XLVIII No. 1, April ’13 — May ’13
71
bleaching related to this event. These were - 1.
Catastrophic coral bleaching, in which 95% of
shallow water corals in the Maldives, Bahrein,
Singapore, Sri Lanka and Tanzania were bleached,
2. Severe coral bleaching which adversely affected
50% to 70% corals in Kenya, Sychelles, Japan,
Thailand and Vietnam, leading to their death, 3.
Moderate coral bleaching resulting in 20% to 50%
coral mortality with chances of quick recovery and
4. Insignificant bleaching9. In Lakshwadweep’s
Bangaram Island, only white rubble exists; it is a
graveyard of dead coral. In fact, it has been predicted
that with rising ocean temperatures, this kind of
ecological disaster will become more common in
near future.
This Coral Triangle forms the apex of marine
biodiversity. It supplies the Indian and Pacific
Oceans with genetic biodiversity, delivered by the
ocean’s genetic highway currents8. A very large
variety of marine organisms depend on coral reefs
for their existence. In fact, this hotspot is very close
to the biodiversity hotspot of the Western Ghats.
(Table No. 1).
The reefs in the Coral Triangle have also
been indirectly affected by global climate change.
The El Nino Southern Oscillation event in 1998
resulted in a rise of SST by almost 7°C from the
previous year in parts of the eastern Pacific5, while
in the Indian Ocean, the SST was higher by 2°-3°
C. during May-June 1998, which triggered off the
process of coral bleaching. Bleached corals were
observed in 82% of the coral cover in the lagoon
reefs of the Lakshwadeep Islands and bleaching
related mortality was as high as 26%. Particularly,
tabular, branching and massive corals were affected.
In addition to the 1998 event, the year 2010 is said
to have witnessed the largest single bleaching event
ever recorded. In this year, massive death of corals
took place in the South Asian and Indian Ocean
reefs over a period of a few months following the
bleaching event in the region.
Table No. 1. Coral Damage During 1998
Bleaching4
Country Percentage destroyed Recovery
during 1998 bleaching potential
Lakshwadeep (India) 70–90 Good
Maldives 70–90 Good to medium
Chagos 70–90 Good
Sri Lanka 70–90 Medium to low
Other factors affecting the health of coral reefs
are changes in sea level, greater intensity and
frequency of storms, changes in ocean circulation,
variation in precipitation and land runoff and
increasing ocean acidification, all of which are
directly or indirectly related to climate change.
Bleaching events are often accelerated by large-
scale oceanographic processes and oceanographic
cycles. Aerosols and local water quality also play a
role in coral bleaching. These factors effectively
reduce the adaptability of corals.
Past studies have shown a positive correlation
between increased acidification, aragonite saturation
and declining coral growth. Man-made carbon
dioxide emissions are rapidly changing the current
pH level of seawater, rendering the oceans acidic.
The IPCC 4th Assessment Report estimates that by
the end of the century, ocean pH will decline from
the current level of 8.1 to 7.8, due to rising
concentrations of atmospheric CO2.
It has been found that the key threshold of coral
reefs is an atmospheric carbon dioxide concentration
of 500 parts-per-million (ppm). About one-third of
all the carbon dioxide emitted into the atmosphere
is absorbed by the oceans. This is an ideal condition
for the formation of carbonic acid. The seawater
readily combines with the carbon dioxide forming
carbonic acid. In the process, hydrogen ions are
released and the concentration of carbonate ions
falls. These chemical processes cause an
intensification and increase in the ocean’s acidity.

Everyman’s Science Vol. XLVIII No. 1, April ’13 — May ’13
72
Ocean acidification threatens to decimate creatures
that form a calcium carbonate shell, including coral,
shellfish, foraminifera, cocoliths, i.e., carbonate
oozes and phytoplankton, that form the very base
of the marine food chain. This is because the
carbonate ion is critical in formation of carbonate
minerals and these carbonate minerals are used by
marine biota to form shells and skeletons.
The equation may be represented thus-
← Mineral Formation
[CaCO3] ←→ [Ca2+] + [CO32]
Dissolution →
Calcium carbonate exists in two main minerals
–aragonite and calcite. Corals are mostly made
from aragonite. As seawater becomes more acidic,
the solubility of aragonite increases, resulting in
undersaturation.
Corals are extremely vulnerable to changes in
ocean conditions. Rising atmospheric CO2 and its
equilibration with surface ocean water is lowering
both the pH and carbonate saturation state (Ω) of
the oceans. It is a fact that both coral species
richness and coral colony size decline with increasing
proximity to low-saturation, low-pH waters as has
been proved from in-situ chemical and biological
data. Reef-building corals are adversely impacted
by declining aragonite and calcite saturation. Jokiel,
at the Hawai Institute of Marine Technology, in his
“proton flux hypothesis” of 2011, has proved that
calcification of coral skeletons is dependent on the
passage of hydrogen ions between the water column
and the coral tissue. This process ultimately disrupts
the ability of corals to create an aragonite skeleton7.
Lowered calcification rates are problematic for
coral reefs because it creates weakened coral
skeletons leaving them susceptible to breakage and
decreasing protection.
The ultimate result is a reduced rate in the
building of coral reefs, which decreases the
resiliency of the corals from bleaching, disease and
coral death due to high ocean temperatures. Further,
reef building rates could decrease to a point at
which it is insufficient to maintain the reefs
themselves. The IPCC 4th Assessment Report
estimates that by the end of the century, ocean pH
will decline from the current level of 8.1 to 7.8, due
to rising atmospheric CO2 concentrations.
Acidification of sea water has been found to be
very rapid in the areas off the coast of North
America. These waters have become so acidic that
they are actually dissolving the skeletons and even
shells of coral, clams and starfish.
Corals often develop a minimum resistance to
bleaching effects. Large coral colonies such as
Porites are able to withstand extreme temperature
shocks, while fragile branching corals such as table
coral are far more susceptible to heat stress. Corals
consistently exposed to low stress levels often
develop more resistance to bleaching.
Also, there are many factors that determine the
outcome of a bleaching event. These may be listed
as stress-resistance which reduces bleaching,
tolerance to the absence of zooxanthellae and how
quickly new coral grows to replace the dead. Coral
and zooxanthellae health and genetics also influence
bleaching.
Recent studies have revealed that with constantly
rising ocean temperatures and increased ocean
acidification, corals may cease to survive very
soon.
Coral reefs support more species per square
metre than any other marine ecosystem. Because of
this kind of biodiversity, coral reefs have been
called the rainforests of the sea. They provide a
natural habitat for thousands of marine organisms
including coralline fish, sponges, mollusks,
echinoderms, crustaceans and so on. Through the
photosynthesis carried out by their constituent algae,
corals serve as a vital input of food into the tropical
and sub-tropical marine food-chain and assist in
recycling the nutrients too. Marine plankton coexists
with corals and forms a vital constituent of the

Everyman’s Science Vol. XLVIII No. 1, April ’13 — May ’13
73
marine food web. Thus, a coral reef is a nursery for
the juvenile forms of many marine creatures.
Coral reefs act as a bulwark against storm surges,
tsunamis and cyclones. They play a major role in
shoreline protection. For example Moorea in French
Polynesia only experiences a 10 cm tidal range due
to its protective barrier reef. On the other hand,
since coral cover is low in the Lakshwadeep Islands,
the island faces a serious problem of coastal erosion.
With the near extinction of coral reefs, tropical
storms, tidal waves and cyclones have become
more frequent. Hence, reefs are likely to experience
greater coastal erosion, sedimentation and turbidity,
which would add to their demise.
In the light of the above situation, it is
recommended that certain steps be taken
immediately to save coral reefs that are particularly
endangered.
1. Virgin and pristine reefs should be declared
as protected areas.
2. Exploitation of the reefs and coral harvesting
must be stopped.
3. Alternative means of livelihood can be
provided to communities that excessively
depend on coral reefs and fisheries.
4. Creation of marine reserves off limits to
fishing will also help in this respect.
5. Awareness must be created among the public
and the local government agencies regarding
the needs for conservation of coral reefs.
6. Regulation of wastewater discharge from the
land and maintaining high water quality could
also help in the conservation of coral reefs.
7. The ultimate way to save coral reefs is to cut
down carbon emissions. It is said that if
current emission trends continue, then coral
bleaching will become an annual event by
2030-2070. In this way, coral reefs could be
eliminated altogether by 2100A.D. Current
estimates suggest that reefs could take
hundreds of years to recover. It is estimated
that most reefs will disappear in the next 40
years. In fact, reefs around the West Indies in
the Caribbean will cease to exist by 2020
and the Great Barrier Reef will altogether
disappear in just 30 years. Thus, tropical
marine environments are likely to be the first
casualties of climate change.
REFERENCES
1. B. Strychar Kevin and W. Sammarco Paul,
ISEI Journal, December 14, 2011.
2. DNA, Washington, January 9, 2010.
3. Dr. Craig D. Idso, “CO2, Global warming
and Coral reefs: Prospects for the future.”
January 12, 2009.
4. E. V. Muley, Zahir Hussein, et. al., “Status of
coral reefs in South Asia : Bangladesh, India,
Maldives and Sri Lanka.”
5. Gerrit Burgers, et. al., Climate Research and
Seismology, scientific report, 1997-1998.
6. “Global Warming Is Destroying Coral Reefs
: Major Study warns”- Science News.
December 13, 2007.
7. Jokiel, Paul Louis, 2011, Bulletin of Marine
Science, 87, 3, 639-657, 2011.
8. P. R. Shukla, Subodh K. Sharma, Amit Garg,
et. al., “Climate Change and India:
Vulnerability Assessment and Adaptation,”
2003, 274-276, Universities Press (India)
Private Limited, Hyderabad.
9. Savindra Singh - “Physical Geography,” 2000,
400-405, Prayag Pustak Bhawan, Allahabad.
10. Thomas J Goreau, Open Democracy, 2005.

Everyman’s Science Vol. XLVIII No. 1, April ’13 — May ’13
74
VIRUS AS A BIOSENSOR
Rajib Deb, Satish Gaikwad, Sanjeev K. Shukla, C. Madhan Mohan andSohini Dey *
Virus-based sensors (mainly phages) may lead to development of new strategies for the rapid,
specific and sensitive monitoring or detection of chemicals, explosives, proteins, microbes
and toxins for various applications in conjunction with various traditional analytical methods
like Quartz Crystal Microbalance (QCM) and Enzyme-Linked Immuno-Sorbent Assay (ELISA)
as well as various optical and electrochemical devices.
INTRODUCTION
B iosensors are analytical devices that can
provide quantitative or semi-quantitative
information by exploiting a chemical or biological
recognition element which is either integrated within
or is closely associated with a transducer interface
that can convert chemical, physical, or biological
interactions into a measurable output1. There are
many applications of biosensors such as for
detecting different analytes viz. explosives, proteins,
DNA, tumor markers, bacteria, viruses, microbes
and toxins in foods, environmental samples or
clinical materials2. In terms of the transducer
properties, biosensors can be classified as optical,
magnetic thermometric, piezoelectric,
micromechanical, and electrochemical. Since the
transducers normally do not have specificity against
a target analyte, introduction of target-specificity to
the sensors is a difficult task. In addition, the
analysis of samples is always complicated by the
broad range of concentration over which the analytes
might be present, the limited volumes of the
samples, and the heterogeneous nature of the
samples. Hence, there is a pressing need for the
development of target-selective sensors3. Viruses,
though their natural function is to store and transport
genetic material, have recently been demonstrated
to act as templates for the synthesis and assembly
of nano materials, as vehicles for targeted drug and
gene delivery, and as probes for sensing and
imaging. These novel functions of the viruses are
possible due to the reason that they specifically
infect their host and thus can be used as a specific
biosensing agents4, 5.
Figure 1 : General setup of a biosensor
(Analytes are detected by immobilized
recognition elements such as antibodies,
microorganisms, enzymes that are converted to
optical, piezoelectric, calorimetric or electrochemical
signals which can be easily quantified).
TYPES OF VIRUSES USED AS A BIOSENSOR
Three types of viruses may be used for these
applications viz. bacteriophages, plant and animal
* Recombinant DNA Laboratory, Division of Animal
Biotechnology, I.V.R.I., Izatnagar 243122, U.P.
Email : [email protected]

Everyman’s Science Vol. XLVIII No. 1, April ’13 — May ’13
75
viruses. The use of viruses in sensing is being
actively developed, and many opportunities are
available for scientists to explore in this area.
Of the different viruses being studied
bacteriophages (shortened to phages)—viruses that
specifically infect bacteria-have proved to be the
most powerful candidates for the reasons that a
well-established technique, called phage display,
can be used to identify target-recognizing peptides
or proteins from a combinatorial phage-displayed
random peptide or protein library, which in turn
results in the selection of target-specific virus
particles6.
PHAGE DISPLAY : VIRUS BASED
BIOSENSOR
Phages are bacteria-specific viruses. There are
two major types of phage in nature: lytic and
nonlytic. Lytic phages like T4 and MS2 phage
infect bacteria and when the bacterial cells are
destroyed, the new phages will infect new host
cells7. It is the lytic phage that has been proposed
for use as an anti-bacteria treatment strategy (phage
therapy). However, the nonlytic phages such as fd
and M13 phages do not break the host bacterial
cells when they infect their host cells. Instead, the
phages undergo lysogeny i.e., the phage genome is
integrated with the host DNA and replicated. The
host cells thus continue to survive and reproduce,
and the phages are reproduced and amplified.
Therefore, nonlytic phages such as M13 and fd
phages are often used in recombinant DNA
engineering.
The well-established phage display technique is
mainly based on filamentous phages. M13 and fd
phages both have an almost identical structure and
morphology. They have a cylindrical structure
composed of about 3000 highly ordered copies of
the major coat protein (pVIII) which surrounds a
circular single-stranded DNA genome. The single-
stranded DNA encodes pVIII on the major coat and
four other structural proteins at two tips : pIII, pVI,
pVII, and pIX. At one tip of the cylinder there are
five copies each of pIII and pVI, while at the other
tip there are five copies each of pVII and pIX. By
inserting DNA that encodes foreign peptides into
the genes of the coat proteins, the peptides are
themselves displayed on the outer surface of the
phage at the tips (for example, pIII or pIX display)
and/or along the length of the filamentous scaffold
(pVIII display). This leads to the single, double, or
triple display of different peptides or proteins on a
single virus particle.
Figure 2 : Phage Display peptides
PHAGES IN SENSOR DEVELOPMENT
Although phage display has been applied since
the 1980s for the identification of target-specific
peptide or protein probes, the use of phages in the
sensor area is new. Phages have several desirable
chemical and biological properties for the
development of a real-time sensor to rapidly and
selectively detect and monitor antigen molecules.
Firstly, phage display can be applied to select
peptides or proteins that can specifically recognize
a target and display the target-specific peptide or
protein on the surface of the phage, thereby enabling
the phage to become a target-specific probe.
Secondly, nonlytic phages such as M13 and fd can
be cost-efficiently mass-produced by infecting
bacteria. Thirdly, phages are stable in a variety of
harsh conditions, such as under acidic or basic pH
ranges, and in the presence of nucleases or
proteolytic enzymes. Fourthly, phages are also
thermally stable (up to 180°C), and chemically
pVIII
pIII
pVI
pVII
pIX
displayed peptides
Wild-type phage
pVIII
displaypIII
display
pIX
display
pIII+pVIII+pIX
triple display
pIII+pIX
double displaypIII+pVII
double display
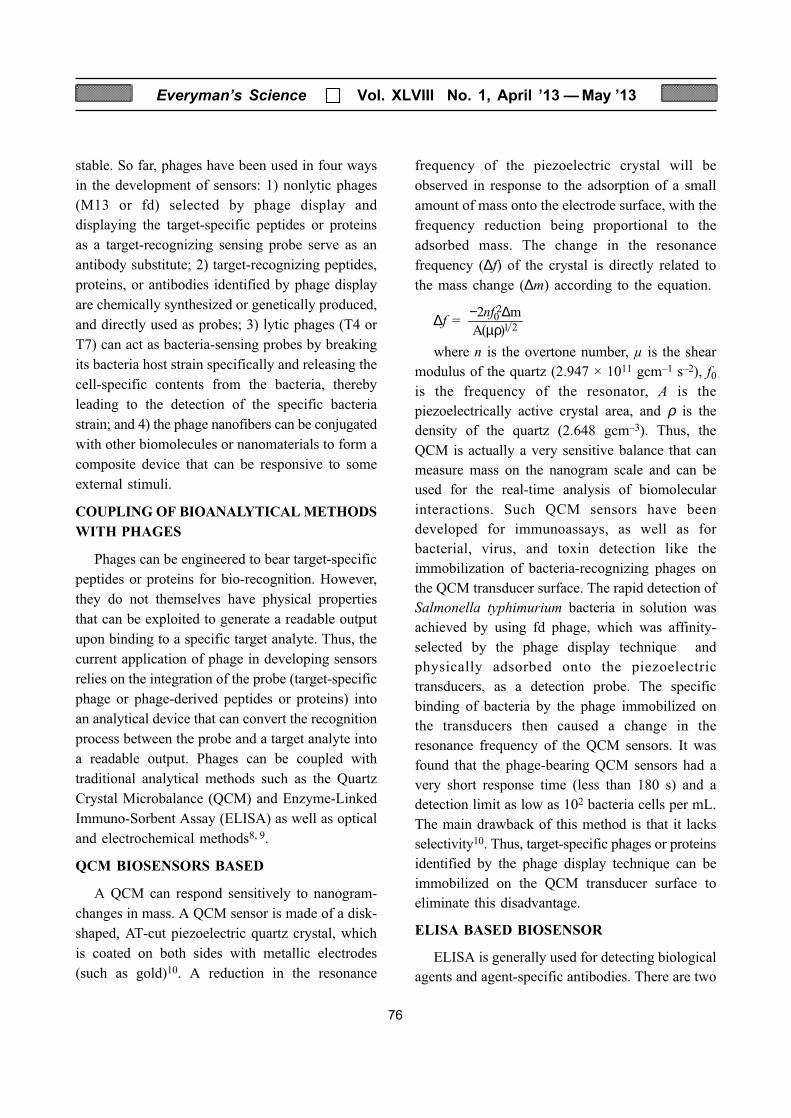
Everyman’s Science Vol. XLVIII No. 1, April ’13 — May ’13
76
stable. So far, phages have been used in four ways
in the development of sensors: 1) nonlytic phages
(M13 or fd) selected by phage display and
displaying the target-specific peptides or proteins
as a target-recognizing sensing probe serve as an
antibody substitute; 2) target-recognizing peptides,
proteins, or antibodies identified by phage display
are chemically synthesized or genetically produced,
and directly used as probes; 3) lytic phages (T4 or
T7) can act as bacteria-sensing probes by breaking
its bacteria host strain specifically and releasing the
cell-specific contents from the bacteria, thereby
leading to the detection of the specific bacteria
strain; and 4) the phage nanofibers can be conjugated
with other biomolecules or nanomaterials to form a
composite device that can be responsive to some
external stimuli.
COUPLING OF BIOANALYTICAL METHODS
WITH PHAGES
Phages can be engineered to bear target-specific
peptides or proteins for bio-recognition. However,
they do not themselves have physical properties
that can be exploited to generate a readable output
upon binding to a specific target analyte. Thus, the
current application of phage in developing sensors
relies on the integration of the probe (target-specific
phage or phage-derived peptides or proteins) into
an analytical device that can convert the recognition
process between the probe and a target analyte into
a readable output. Phages can be coupled with
traditional analytical methods such as the Quartz
Crystal Microbalance (QCM) and Enzyme-Linked
Immuno-Sorbent Assay (ELISA) as well as optical
and electrochemical methods8, 9.
QCM BIOSENSORS BASED
A QCM can respond sensitively to nanogram-
changes in mass. A QCM sensor is made of a disk-
shaped, AT-cut piezoelectric quartz crystal, which
is coated on both sides with metallic electrodes
(such as gold)10. A reduction in the resonance
frequency of the piezoelectric crystal will be
observed in response to the adsorption of a small
amount of mass onto the electrode surface, with the
frequency reduction being proportional to the
adsorbed mass. The change in the resonance
frequency (∆f) of the crystal is directly related to
the mass change (∆m) according to the equation.
∆f =
X
− ∆µρ
where n is the overtone number, µ is the shear
modulus of the quartz (2.947 × 10¹¹ gcm–1 s–2), f0
is the frequency of the resonator, A is the
piezoelectrically active crystal area, and ρ is the
density of the quartz (2.648 gcm–3). Thus, the
QCM is actually a very sensitive balance that can
measure mass on the nanogram scale and can be
used for the real-time analysis of biomolecular
interactions. Such QCM sensors have been
developed for immunoassays, as well as for
bacterial, virus, and toxin detection like the
immobilization of bacteria-recognizing phages on
the QCM transducer surface. The rapid detection of
Salmonella typhimurium bacteria in solution was
achieved by using fd phage, which was affinity-
selected by the phage display technique and
physically adsorbed onto the piezoelectric
transducers, as a detection probe. The specific
binding of bacteria by the phage immobilized on
the transducers then caused a change in the
resonance frequency of the QCM sensors. It was
found that the phage-bearing QCM sensors had a
very short response time (less than 180 s) and a
detection limit as low as 102 bacteria cells per mL.
The main drawback of this method is that it lacks
selectivity10. Thus, target-specific phages or proteins
identified by the phage display technique can be
immobilized on the QCM transducer surface to
eliminate this disadvantage.
ELISA BASED BIOSENSOR
ELISA is generally used for detecting biological
agents and agent-specific antibodies. There are two

Everyman’s Science Vol. XLVIII No. 1, April ’13 — May ’13
77
types of ELISA : Indirect ELISA in which the
target antigen is captured by one antibody and
detected by a second antibody and direct ELISA in
which the antigen in the sample solution will
compete with labeled antigen to bind to the
antibodies. Phage probes can serve as antibody
substitutes in direct ELISA. For example, fd phage
probes that can capture their targets, such as β-gal,
streptavidin, and neutravidin, can be used in direct
ELISA. Consequently, direct ELISA using phage
probes as antibody substitutes can specifically detect
bacteria, spores, and viruses. The most specific
spore-binding phage, which was selected from a
landscape phage library by using the phage display
technique and which displayed a peptide
(EPRLSPHS) on its major coat, showed a binding
affinity to spores of B. anthracis Sterne 3.5 to 70
folds higher than that to spores of other Bacillus
species11.
OPTICAL BIOSENSOR BASED PHAGES
There are two types of optical sensing. In the
first type, sensing is achieved by measuring the
change in intensity at a particular wavelength, and
includes techniques such as UV/Vis spectrometry,
fluorescence/phosphorescence spectrometry, bio/
chemiluminescence, and IR spectrometry. In the
other type, sensing is achieved by detecting the
changes in the chemical properties upon changing
the wavelength, and include techniques such as
Surface Plasmon Resonance (SPR), Fluorescence
Resonance Energy Transfer (FRET), and
colorimetry8.
SURFACE PLASMON RESONANCE (SPR)
SPR results from the light-induced excitation of
surface plasmons and is related to changes in the
refractive index induced by the molecules near the
metallic surface12. SPR has been exploited in the
development of sensors because it enables the
sensitive, rapid, real-time, and label-free detection
of biomolecules in a small sample volume. Phages
can enable the development of SPR sensors for
target-specific detection in two ways : by
immobilizing the target-specific phage on the sensor
chip or a phage displaying a scFv antibody to the
virulence factor actin polymerization by
immobilizing the target-specific protein selected by
phage display on the sensor chip. For example a
study was conducted where in actin polymerisation
protein (ActA) was immobilized on the SPR sensor
chip by physical adsorption. This SPR sensor chip
was then used to specifically detect the common
food-borne bacteria L. monocytogenes.
IMMUNOFLUORESCENCE ASSAYS
The immunofluorescence assay exploits
fluorescence spectrometry and specific
biorecognition to obtain quantitative results. The
lytic phage will destroy bacterial cells and cause
the cell components to be released when it infects
the cells. If the cell-specific components released
from the cells can be detected, the lytic phage can
be used as a probe to detect bacteria. One method
takes advantage of the fluorescence properties of
the released cell components. Blasco et. al., (1998)
developed a sensitive and rapid assay to detect
bacteria by using E. coli and Salmonella newport
as the model bacteria using ATP bioluminescence
probes2.
PHAGES IN ELECTROCHEMICAL
BIOSENSOR
Biosensors based on electrochemical methods
have been widely studied because they are simple,
rapid, highly sensitive, amenable to miniaturization,
and can be operated in turbid media9. Such
electrochemical sensors are proposed for the
detection of microbes and toxins. The surface of
the electrodes in an electrochemical sensor can be
coated with a variety of materials such as polymers,
sol-gel, ionophores, enzymes, antibodies, DNA,
bacteria, viruses, and toxins, which has led to the
development of various electrochemical sensors13.

Everyman’s Science Vol. XLVIII No. 1, April ’13 — May ’13
78
The immobilization of a target-specific phage probe
onto the surface of the working electrodes of
electrochemical sensors can enable the target-
specific detection of target analytes.
OTHER VIRAL AGENTS AS BIOSENSOR
Similar to phages, other viruses, including the
tobacco mosaic virus14, cowpea chlorotic mottle
virus15 etc. have been used for templating the
synthesis of nanomaterials. Inorganic materials can
be formed either outside the coat or inside the core
of rod like viruses such as TMV. For example,
copper nanowires were prepared by electronless
deposition within the central channel of TMV
particles. Nanomaterials can be synthesized either
outside the coat or inside the core of icosohedral
viruses such as CCMV6.
VIRUS LIKE NANO MATERIALS (VLNS) AS
BIOSENSOR
Viruses such as M13 or T7 phage can be viewed
simply as a protein coat assembled around a nucleic
acid (DNA or RNA). There is electrostatic
interaction between the nucleic acid inside the
virus and the protein coat, which is made of many
copies of protein subunits. Thus, the formation of
such a virus particle can be simplified as the
assembly of protein subunits around a nuclei acid
template driven by the electrostatic interaction.
Therefore, if the nucleic acid in the virus is replaced
by an inorganic nanomaterial and the inorganic
nanomaterial surface is functionalized to mimic the
electrostatic behavior of the nucleic acid, a Virus
Like Nanomaterial (VLN) will result from the
electrostatic self-assembly of proteins around the
nanomaterial. Viral protein purified from the virus
particle is needed to form such a VLN. The self-
assembly of viral protein around nanoparticle
templates to form virus like particles (VLPs) has
been successfully demonstrated. For example, the
coat protein from a Brome Mosaic Virus (BMV)
can self-assemble around a functionalized AuNP
core to form a VLP16. The assembly of virus
proteins around nanomaterials will allow the
resultant VLNs to bear target-specific peptides or
proteins on the surface.
CONCLUSION
Virus based sensors have been actively studied
and have become increasingly attractive as an area
of nanotechnology. Phage-based sensors are still
the most popular in this field because selectivity is
a very important property of a chemical and
biological sensor, and phage can be engineered to
bear a target-specific motif by using the well-
established phage-display technique. For the
development of advanced chemical and biological
sensors with improved sensitivity and specificity,
viruses need to be combined with new analytical
methods and the fabrication of micro and nano
functional devices by applying virus-like
nanomaterials and exploiting supramolecular
materials self-assembled from viruses and
nanomaterials.
REFERENCES
1. D. Atias, L. Lobel, M. Virta, R. S. Marks
Phage displayed epitopes as bioreceptors for
biosensors. Chapter 7. pg. 115-131. Marks,
R. S., D. Cullen, C. Lowe, H.H. Weetall and
I. Karube (eds). Handbook of Biosensors and
Biochips. John Wiley & Sons Ltd Publishers.
2007.
2. R. Blasco, M. J. Murphy, M. F. Sanders, D.
J. Squirrell, Journal of Applied Microbiology,
84 (4), 661-6, 1998.
3. A. D. Griffiths, A. R. Duncan, Current
opinion in biotechnology, 9 (1), 102-108,
1998.
4. J. R. Brigati , V. A. Petrenko, Analytical and
Bioanalytical Chemistry, 382 (6), 1346-50,
2005.
5. X. Lu, P. Weiss, T. Block, Journal of
Virological Methods, 119, 51–54, 2004.

Everyman’s Science Vol. XLVIII No. 1, April ’13 — May ’13
79
6. E. Donath, Nature Nanotechnology, 4, 215-
216, 2009.
7. L. Loo, R. H. Guenther, S. A. Lommel, S.
Franzen, Journal of the American Chemical
Society, 129, 11111-11117, 2007.
8. J. R. Sambles, G. W. Bradbery, Y. Fuzi, An
introduction Contemporary Physics, 32 (3),
173-183, 1991.
9. J. Shah, E. Wilkins, Electroanalysis, 15 :
157-167, 2003.
10. T. G. M. Schalkhammer, Biosensors, Chapter
5, In TGM Schalkhammer (Ed.), MTBM
Volume on Analytical Biotechnology, 167-
219. Basel, Switzerland: Birkhäuser Verlag.
2002.
11. J. W. Yu H, Raymonda, T.M. McMahon,
A.A. Campagnari, Biosensors &
Bioelectronics, 14 : 829-840, 2000.
12. A. J. Haes, D.A. Stuart, R. P. Van Duyne,
Nanoscale Optical Sensors based on Surface
Plasmon Resonance (SPR), in
Nanotechnology in Biology and Medicine,
Vo-Dinh, T., Ed. : CRC Press LLC : Boca
Raton, FL, 2007.
13. G. A. Weiss, R. M. Penner, Analytical
Chemistry, 80, 3082, 2008.
14. H. Ben-Yoav, A. D. Brown, E. Pomerantseva,
L. K. Deanna, N C. James, Reza Ghodssi,
Tobacco mosaic virus biotemplated
electrochemical biosensor 06/2012; In
proceeding of: Hilton Head Solid-state
Sensors, Actuators and Microsystems
Workshop, At Hilton Head, South Carolina,
United States. 2012.
15. F. Nicole Steinmetz, J. Evans David, Organic
& Biomolecular Chemistry. 5, 2891–2902
2891. 2007.
16. G. Decher, Science, 277, 1232-1237, 1997.

Everyman’s Science Vol. XLVIII No. 1, April ’13 — May ’13
80
KNOW THY INSTITUTIONS
CSIR-NATIONAL AEROSPACE LABORATORIES, BANGALORE
National Aerospace Laboratories (NAL), a
constituent of the Council of Scientific and Industrial
Research (CSIR), India is the only civilian aerospace
R & D laboratory in the country. Started on June 1,
1959 in Delhi, it moved to Bangalore in 1960 and
later on to its own two campuses (Kodihalli and
Belur) in Bangalore. CSIR-NAL is a high-
technology oriented institution focusing on advanced
disciplines in aerospace and has a mandate to
develop aerospace technologies with strong science
content, design and build small and medium size
civil aircraft and support all national aerospace
programmes. It has many advanced test facilities
recognized as National Facilities. These are not
only best in the country but are also comparable to
other similar facilities in the world. NAL’s
committed efforts over the last five decades have
resulted in achieving expertise and core
competencies in most of the disciplines of
aeronautics. It has always readily accepted
challenges and delivered programme-critical
products and technologies and has become the
preferred destination for almost all the mission-
mode aerospace programmes in the country. It
would not be improper to say that LCA Tejas
development would have been difficult without
NAL’s contributions and that every major aerospace
programmes of DRDO and ISRO has some
significant contributions from CSIR-NAL.
As is in its mandate, in 1983-84, CSIR-NAL
started a project to fabricate an all-composite aircraft
using a kit bought from the Rutan Aircraft Company
in USA. The project led by the indefatigable Prof
R B Damania, gave CSIR-NAL teams very valuable
insights into building-airworthy composite
structures. The aircraft, called the Light Canard

Everyman’s Science Vol. XLVIII No. 1, April ’13 — May ’13
81
Research Aircraft (LCRA), was ready by the end of
1986 made its maiden flight on 26 February 1987.
After the LCRA success, CSIR-NAL seriously
started the preparatory work to design and build
small and medium sized aircraft. Today, NAL’s two
seat aircraft (15 built so far) named ‘HANSA’ a
pioneering ab-initio all composite design, certified
by DGCA in the year 2000 under JAR-VLA
certification is catering to the needs of flying clubs
in the country. SARAS, the 14 seat (7 ton class)
multirole transport aircraft to be certified under
FAR 23 category is being designed and built by
CSIR-NAL had its maiden flight on May 29, 2004.
It has been designed for multiple roles like executive
transport, light package carrier, remote sensing, air
ambulance etc. Indian Air Force is expected to be
the launch customer for SARAS with HAL as the
production partner. The five seat General Civil
Aviation aircraft named CNM-5 has the distinction
of being the country’s first public-private partnership
(PPP) for development of civil transport aircraft. It
is being developed by CSIR-NAL in collaboration
with M/s Mahindra Aerospace Pvt. Ltd. (MAPL),
Bangalore and had its maiden flight on the 1st
September 2011 in Australia. It is proposed to be
certified first under CASA, the Australian
Certification Authority. CNM-5 is an ideal aircraft
for air taxi, air ambulance, training, tourism and
cargo applications.
NAL’s contributions to major national
programmes have carved niche for itself. Key
technology successes of NAL include; carbon fibre
airframe components using innovative and cost-
effective fabrication technologies and Fly-by-wire
Flight Control Laws design for the Tejas programme.
An achievement with far reaching implications is
the development of aerospace grade carbon fibres,
a technology which is high on the list of sanctions.
CSIR-NAL is playing a lead role jointly with many
academic institutions in the National Programme
on Micro Air Vehicles (NP-MICAV) of DRDO/
DST. MAVs of Black Kite, Golden Hawk and
Pushpak with a 300mm span, 300 gms weight and
endurance of 30 minutes have been developed.
These MAVs are currently undergoing user trials.
The other key technology successes are; nano-
coatings, sunshield mirrors for satellites, and design
and development of 55HP Wankel engine with
VRDE for DRDO-ADE’s Nishant UAV. NAL’s
association with India’s space programmes has been
very fruitful. NAL has carried out acoustic tests on
all of ISRO’s launch vehicle stages as well as
satellites. It is very proud to say that every Indian
aerospace vehicle has graduated out of NAL’s 1.2m
Trisonic Wind Tunnel which is performing reliably
for over 50 years.
NAL has made significant contributions in the
area of new technologies and systems. The high
speed combustor design and related test facilities
has been developed for hypersonic vehicles.
Radomes are an area of strength in NAL and its
multi disciplinary team has established a niche
technology covering mechanical, electromagnetic,
aerodynamic and structural design, testing and
certification aspects. Radomes have been developed
for ground based as well as air borne applications,
this include the 12.9 meter dia Doppler Weather
Radar Radome for ISRO, and nose radomes for
Jaguar and Saras aircrafts. The institution
contributed to developing technologies relating to
advanced aircraft structures like co-cured co-bonded
composite parts, variable resin infusion technology,
and indigenous autoclaves for composite airframe
manufacture. Active Noise Control (ANC) system
for fighter aircraft has been developed and as also
a host of surface modification technologies.
Over the years, NAL has successfully addressed
the avionics challenge. DRISHTI, an airport runway
visibility assessor system developed is a fast and
accurate transmissometer. Engine Instruments and
Crew Alert System (EICAS) and a 3-axes digital
autopilot system developed for Saras aircraft is first
of its kind in India and has the potential for use in
other aircraft programmes both in India and Abroad.

Everyman’s Science Vol. XLVIII No. 1, April ’13 — May ’13
82
CSIR-NAL’s Flight Operation Quality Assurance
(FOQA) software has been the key tool for aviation
and is being used by many Indian aircrafts for over
a decade.
CSIR-NAL is known for its expertise and
capabilities in many disciplines of aeronautics. It
has a very strong base in advanced computational
and experimental fluid dynamics which has
substantially contributed to speeding up the design
of complex flight vehicles. Our laboratory is
recognized as India’s premier organization for
carrying out failure analysis and accident
investigations of aircrafts. CSIR-NAL’s structural
technological capabilities cover dynamic analysis
of structures including aeroelastic testing and
analysis. The full-scale fatigue test facility provides
inputs that can lead to a substantial increase in the
operational life of airframes. NAL has achieved
considerable success in using smart materials for
structural health monitoring and also sensors and
actuators. It has a proven ability in the area of
design, testing and analysis of advanced engine
components.
Many technologies have been developed for
societal applications. NAL’s pioneering efforts in
parallel processing hardware and software
development have given the country advanced
metrological computational capabilities. NALSUN
solar selective coating for industrial and domestic
solar water heaters, wind turbines of 300 kW and
500 kW capacity for wind energy harvesting,
coatings for cutting tools to enhance wear resistance
and improved tool life are some of the significant
achievements with societal impact.
CSIR-NAL is continuously striving towards new
strategic initiatives to meet the challenges of future.
To name a few initiatives in this regard are; a major
programme initiative on national civil aircraft
development for regional connectivity, and design
& development of sub 200 mm class Micro Air
Vehicles to meet the needs of strategic and civilian
use. Further, NAL is expected to play a significant
role in the proposed development of Advanced
Medium Combat Aircraft by ADA and the Fifth
Generation Fighter Aircraft and Medium Transport
Aircraft programmes of HAL. In conclusion it
may be well said that CSIR-NAL aims to reach
greater achievements in futuristic aerospace
technologies and participation in national
development efforts.
Contact :
Director,
National Aerospace Laboratories
Post Bag No. 1779
Bangalore-560017, Karnataka
Website : www.nal.res.in

Everyman’s Science Vol. XLVIII No. 1, April ’13 — May ’13
83
Conferences / Meetings / Symposia / Seminars
XXXVI All India Conference of The Indian Botanical Society on Plant Wealth and
Human Welfare, October 18-20, 2013 Gorakhpur, U.P.
Topics : Bioenergy, Plant Biofunction, Nutraceuticals, Herbal medicine, Forestry and Horticulture IPR
issues, Biological Control.
Contact : Prof N. N. Tripathi, Orginizing Secretary, Department of Botany, D.D.U. Gorakhpur University,
Gorakhpur (U.P.), Phone : Cell : +91 9450883779, +91 9415083883, +91 9450129022, 9450885374,
E-mail : [email protected]/[email protected].
National Conference on Emerging Trends in Engineering & Sciences (ETES-2013),
9-10 Nov. 2013, Haridwar, Uttarakhand
Themes :
Electrical Engineering Electronics & Communication Enginneering
Computer Science Engineering Physical Sciences
Chemical Sciences Mathematical Sciences
Pharmaceutical Sciences
Contact : Professor R. D. Kaushik Chairman, ETES-2013, Professor & Head, Department of Chemistry,
Dean Faculty of Engineering & Technology, Dean, Faculty of Science, Gurukul Kangri University,
Haridwar-249404 (Uttarakhand), India. E-mail : [email protected] or [email protected]
website : www.gkv.ac.in
Internatinal Conference on Challenges : Chemistry and Biology of Carbohydrates
(Carbo-XXVIII) January 20-22, 2014 Dehra Dun
Themes :
Fundamental aspects of carbohydrates in chemistry, biology and chemical biology, and technologies/processes
related to chemistry, biotechnology, and industrial applications.
Contact : Dr. Vineet Kumar, Scientist-F, Chemistry Division FRI, Dehra Dun-248006, Uttarakhand, India
Tel : [O] +91-135-2224210, Mobile : +91 9410555335 E-mail : [email protected]/[email protected].
Web : http/www.accti.in

Everyman’s Science Vol. XLVIII No. 1, April ’13 — May ’13
84
S & T ACROSS THE WORLD
POP ! BURSTING THE BUBBLE ON
CARBONATION
The refreshing bite of carbonation is an integralpart of beverages consumed around the globe.
Carbonated beverages are produced when carbondioxide is dissolved in a liquid, typically underhigh pressure. This can happen naturally in certainspring waters or in fermented beverages like beer.Carbon dioxide also can be added to beveragesthrough production processes. In either case, when
pressure is reduced by opening a bottle or can of acarbonated beverage, some of the carbon dioxide isreleased from the solution in the form of bubbles.After a sip, enzymes in the mouth convert theremaining free carbon dioxide into carbonic acid.The acid then activates sensory nerve endings,
which signal the mild irritation that we refer to as‘bite.’
In the study, published in the public accessjournal PLOS ONE, the Monell researchersexamined the role that bubbles play in carbonationbite. In the first experiment, they took advantage ofthe fact that bubbles cannot form when atmosphericpressure is raised above a certain level. Twelve
healthy adults were comfortably seated in ahyperbaric chamber and asked to rate the biteintensity of several concentrations of carbonatedwater. The ratings were collected once while undernormal atmospheric pressure (with bubbles) and asecond time at higher pressure (no bubbles),
equivalent to diving to a depth of 33 feet in seawater.There was no difference in the bite reportedin the two conditions, even though bubbles arephysically unable to form at the higher pressure.
Although bubbles aren’t necessary for bite, theystill could be contributing to the overall sensationof carbonation. Thus, a second experiment wasdesigned to address this possibility In this
experiment, 11 adults rated the intensity of bite ina laboratory setting. The ratings were made forcarbonated water under normal conditions and againwhen additional air bubbles were added to theliquid. The researchers were surprised to find thatair bubbles enhanced the bite of the carbonated
bubbles, presumably by stimulating the sense of
touch. Together, the studies reveal that carbondioxide bubbles are not directly responsible for the
bite of carbonation. However, by stimulating thesense of touch inside the mouth, bubbles do enhancethe bite sensation beyond the chemical irritationcaused by carbonic acid.Future experiments willcontinue to explore the interactions between
chemical and mechanical stimuli.
ELUSIVE Z-DNA FOUND ON NUCLEOSOMES
New research published in BioMed Central’s
open access journal Cell & Bioscience is the first to
show that left-handed Z-DNA, normally only found
at sites where DNA is being copied, can also form
on nucleosomes. The structure of DNA which
provides the blueprint for life has famously been
described as a double helix. To save space inside
the nucleus, DNA is tightly wound around proteins
to form nucleosomes which are then further wound
and compacted into chromatin, which is further
compacted into chromosomes. But this familiar
image of a right handed coil (also called B-DNA)
is not the only form of DNA. At sites where DNA
is being copied into RNA (the messenger which is
used as the instruction to make proteins) the DNA
needs to unwind, and, in a process of negative
supercoiling, can form a left-handed variety of the
DNA double helix (Z-DNA).
It was originally thought that Z-DNA could
only be formed in the presence of active RNA
polymerase (the enzyme which assembles RNA).
However more recently it has been discovered that
SWI/SNF, a protein involved in remodeling
nucleosomes and allowing RNA polymerase access
to DNA, can convert certain sequences of B to Z-
DNA. The team of researches led by Dr Keji Zhao
discovered that they could convert B-DNA to Z-
DNA on nucleosomes by the addition of SWI/SNF
and ATP (the cell’s energy source) and that the Z-
nucleosome formed was a novel structure. Dr Zhao,
from the NIH, explained, “The fact that we have
found Z-DNA on nucleosomes is a new step in
understanding the roles of chromosome remodeling
and Z-DNA in regulating gene expression. While
the Z-nucleosome is likely to be a transient structure
it nevertheless provides a window of opportunity
for the placement of DNA binding proteins which
may recruit, regulate, or block the transcription
machinery and hence protein expression.”


![[Vipin Dubey] - educlashdl.mcaclash.com/OPERATION_RESEARCH.pdf · [Vipin Dubey] FB/IN/Tw: @educlashco. [Vipin Dubey] FB/IN/Tw: @educlashco. [Vipin Dubey] FB/IN/Tw: @educlashco](https://img.pdfslide.net/doc/110x75/5f45fcdc8cc88b4cb0117db7/vipin-dubey-vipin-dubey-fbintw-educlashco-vipin-dubey-fbintw-educlashco.jpg)