Embed Size (px)
Citation preview


PTA
Screen dump
Everything should be made as simple as possible, but not simpler’-Albert Einstein
‘
© KAPPA Engineering – September 2012

Not so many years ago, such dynamic information
was almost exclusively provided by specific field
operations (well tests), that would determine important
reservoir characteristics such as well productivity
and sometimes reservoir boundaries, in an area
around the well that depended on the duration of
such operations.
For KAPPA it was the time of Saphir, our Pressure
Transient Analysis software.
Today, safety and economics combined with
technological developments mean that we need and
are actually able to acquire, analyze, visualize and
model on any scale in terms of time and dimension.
We have to make use of whatever data we can
get to piece together the dynamic model. Couple
this with the fact that reservoirs are of increasing
physical complexity, data-flow can be enormous and
economics or lack of resources can limit the time
spent on processing and analysis and there was a
need to develop an integrated tool suite to visualize,
organize and analyze dynamic data on any scale
or complexity.
For KAPPA it is the time of Ecrin, the integrated
engineering workstation, the surveillance tool KAPPA
Server and the visualization tool KAPPA Viz.
The KAPPA suite offers a workflow from the simplest
near wellbore analytical analysis to the most complex
full-field numerical cases with exotic geometry and
fluids. Adopted by almost all IOCs, NOCs, Service
Companies and Independents the KAPPA suite is
simple to use, robust and subject to an aggressive
technical development program that will see it
continue to develop fit for purpose tools integrated
with third party workflows and massive data that
face the industry.
KAPPA is 25 years old, privately owned, fiercely
independent and totally committed to technical
development.
We need static data (seismic, logs, etc), but until we start to physically
move the fluid in the reservoir and measure the response we cannot get
the dynamic information that will allow us to model and predict the value
of what we have.
DYNAMIC DATA: A DEFINITION
Whenever a fluid is produced or injected into the
reservoir, the diffusion produces changes in pressure
and temperature that may be recorded in various
places. Combine this data with the production
and/or injection rates and we have what we call
Dynamic Data. Analysis and modeling of this data
leads to a better understanding of the reservoir
dynamics and the well performance, which in turn
allows decision making and proper forecasting.
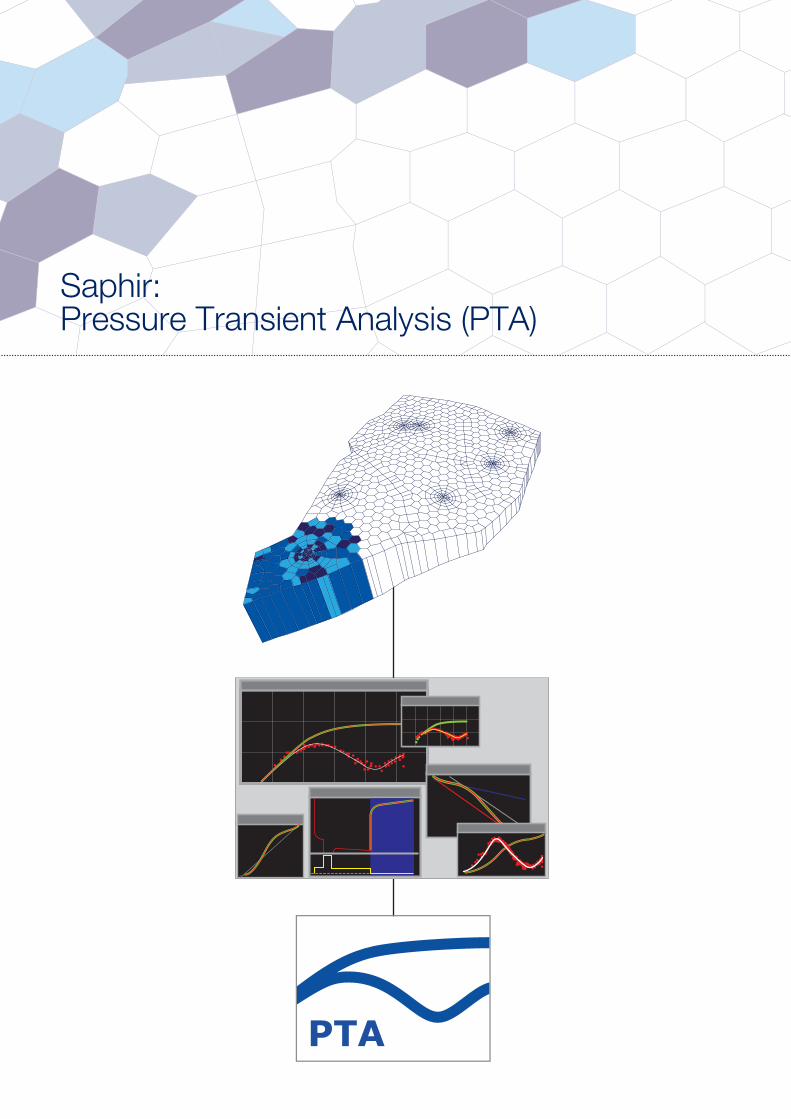
PTA
Saphir:Pressure Transient Analysis (PTA)
ANALYZE
LEARN MORE
FEATURES
analysis modules
Saphir connects seamlessly with the PDG surveillance
tool KAPPA server and other components of Ecrin,
including the Production Analysis (PA) module
Topaze and allowing, through sector extraction, the
Recent developments include advanced work on
minifrac analysis, multiple probe formation tests
and deconvolution. Deconvolution, by linking build-
ups separated in time, allows the user to see much
further into the reservoir than could be achieved by a
single build-up.
‘Generally we re-consider our software choices every
five years. We have now been using Saphir for more than
twenty years and we will certainly not change as long as
you keep your enhancements, your development speed
and your support as they are.’
‘We are glad to see that KAPPA has not changed
its technical focus since Saphir became the industry
standard.’
‘When you released your first numerical model in Saphir
ten years ago I thought it was just a gimmick. Now I cannot
imagine what I would do without it.’
‘Saphir is by far the most popular software among our
reservoir engineers.’
‘Saphir? It just works.’
Saphir, the Pressure Transient (PTA) module of the Ecrin workstation, is the
industry standard with over 3000 active installations. With a methodology
based, since its origin, on the Bourdet derivative, Saphir offers an extensive
and growing analytical model library. The Voronoi numerical model has been
developed to handle the increasing complexity of producing wells, solving
exactly the multi-phase and complex geometry cases for multiple wells
and layers.

PA
Topaze:Production Analysis (PA)
ANALYZE
LEARN MORE
FEATURES
other analysis modules
The abundance of data from permanent gauges
has meant that users are able to obtain answers
that were previously only available from transient
tests. This information has the advantage that it
is available at no extra cost and with no deferred
production. As the long-term production is modeled,
the evolution in time of the well productivity may
also be quantified. Finally, forecasting is based on
a real model as opposed to an empirical function.
the Ecrin PTA module (Saphir) data and models,
an extensive analytical model catalog and a unique
numerical capability that allows reliable history
matching and forecasting, even in the case of shale
wells. Its multiwell capability allows very fast full-field
decline analysis and forecasting. A field production
profile generator is also integrated.
‘With decent rate data, permanent gauge pressure
data and Topaze I can make the data dance.’
‘Other tools process bulk data efficiently, but when I
need to be sure my analysis is not based on any old line
I use Topaze to be really sure of the model.’
‘You may not like what you see, but the data is the
data and it is telling you what is happening. If that is
the model then, like it or not, you have to live with it.
The data never lies.’
‘Why should I be surprised when the rates and the
pressures tell me the same thing? It is the same
reservoir. Just a different scale and way of looking
at things.’
Moving deeper into the reservoir and typically making use of low resolution,
low frequency data Production Analysis (PA) has recently come of age.
Evolving from empirical decline curve methods to modern methodology that
shares much with pressure transient analysis (PTA). With over 1300 commercial
licenses Topaze, the Ecrin PA module, offers single and multi-well analytical
and numerical analysis leading to reserves and production forecasting from the
most simple to most complex multiphase case.
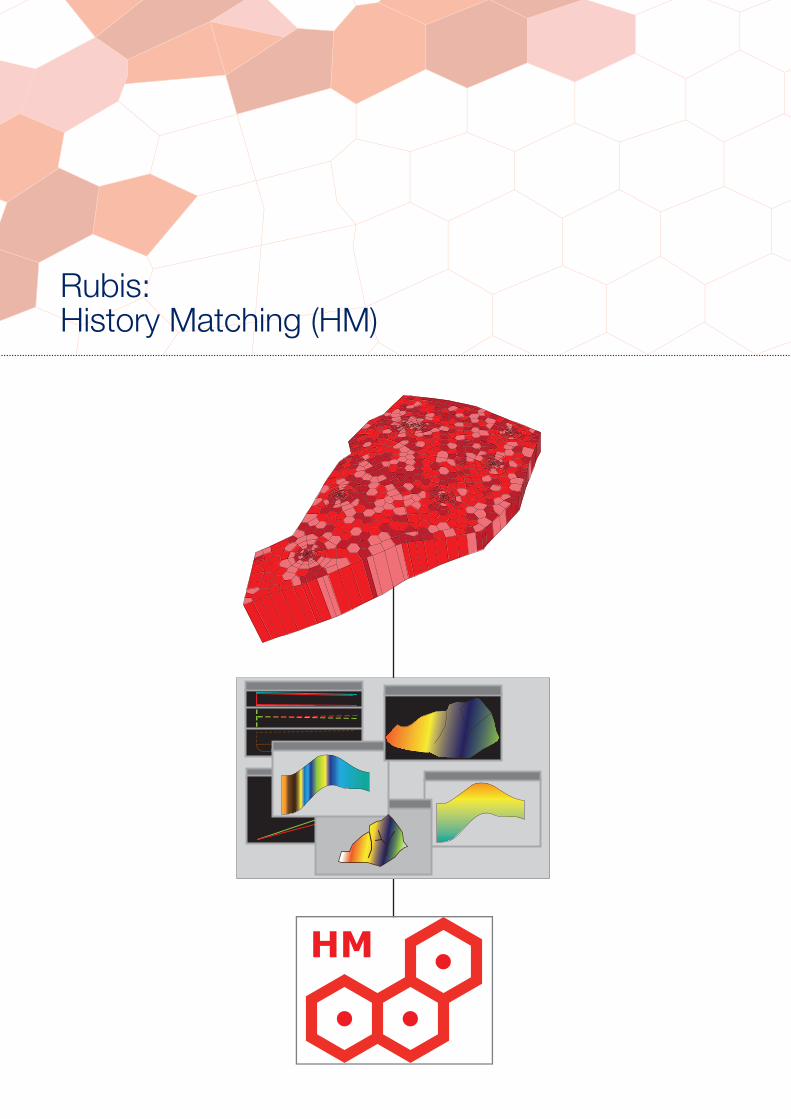
HM
Rubis:History Matching (HM)

ANALYZE
LEARN MORE
FEATURES
Rubis sits between single cell material balance and
massive simulation models. It replaces neither, but
does much of the work of both. It offers full-field,
It was developed after seeing engineers labor with
spreadsheets or conventional simulators to solve day-
to-day problems.
The basic premise is that the grid is a necessary
evil that should not dominate the problem solving
process, so it is built automatically. Of real interest is
the physical problem we want to simulate. We want
this to be complex enough to reproduce the main
drives of the reservoir that will affect production, but
simple enough to be run with a very short time cycle
that is usable; in hours, not days.
Recent developments in Rubis have focused on
unconventional resources with multiple-fracture
horizontal wells and wells with arbitrary trajectories;
the Wriggly wells.
‘Just before lunch the reservoir manager walked in
and asked me to run a few scenarios for the next well
placement. I had the answers on his table by close of
business that day.’
‘I will never use Rubis to replace my current model. It has
taken so long to build it makes little sense to do so. What I
can do though is run my cases in Rubis and it gets me very
close to what I think is happening. This drastically saves
time in advancing the full model.’
‘I should not say this, but working with Rubis is fun.
It is the way it should be.’
Rubis, the full-field numerical module of the Ecrin workstation, offers the
specialist and non-specialist alike, an easily built click-and-draw model in
minutes as opposed to hours or days. Multiple forecasts, reserves and
investigation of possible intervention opportunities can be run and history
matched in a very short time frame.

s
KAPPA Server (Ks):Reservoir surveillance of Dynamic Data

ORGANIZE
LEARN MORE
FEATURES
analysis modules
KAPPA Server addresses the issue of capturing
massive PDG data in a useable, smart-filtered
form for transient/production analysis and history
matching. It automates, alarms and connects
seamlessly with KAPPA workstation and third party
platforms and workflows helping to transform PDG
data into valuable information such as productivity,
wellbore performance, reserves and forecasts in a
seamless environment.
KAPPA server represents the next generation of
massive dynamic data management and replaces
‘Since we installed the system we have not needed to
perform a single planned shut-in’.
‘This has become the eyes of the reservoir’
‘We thought this would all be about build-ups, it is, but
it has also given us an unexpected visualization on the
interconnectivity of wells’
‘The flow of data we get from Diamant Master is of
strategic value to our business’.
Permanent gauges are a wonderful, data-rich witness of reservoir behavior,
but without organization they only add to the end-user feeling of data
overload and at best the ROI will be limited.

WPA
Amethyste:Well Performance Analysis (WPA)

ANALYZE
LEARN MORE
FEATURES
The WPA module corrects for less than optimal
gauge placement, including at surface. It allows
full drag and drop, back-and-forth integration with
it can be run dynamically with complete control and
without blind table interpolation.
data can be added to the model for comparison.
Correlation between resulting rates and the
sensitivity parameters can then be displayed, as can
the evolution of the productivity index as a function
of the time as the reservoir starts to deplete.
Wellbore and flow line can be treated independently
or together. A well sketch is available for graphical
display using a library of pre-defined completion
Eclipse™ format for third party software.
The Well Performance Analysis (WPA) module (Amethyste) is seamlessly
integrated in the workflow to simplify processes involving wellbore modeling
and IPR calculations. Although there are some fine packages on the market
the WPA module was developed to speed up and allow unique workflows
and to ensure a consistency of approach. The WPA module is free of charge,
included with the package

PL
Emeraude:Production Log Interpretation (PL)

ANALYZE
LEARN MORE
FEATURES
and most major OPCOs
and FSI ) capability
Recent years have seen a step change in the
complexity of wells with multiple zones, phases and
deviation ranging from vertical to horizontal. This
has led to the development of esoteric logging tools
with multiple arrays attempting to describe complex
flow regimes by giving a spatial mapping of the flow
straightforward process. It is easy to succumb to the
temptation of a ‘black box’ that will do some clever
statistical stuff to produce a solution that matches
perfectly all data to hand. With the complexity of the
physical problem, and the simplicity of the models,
a perfect match only means that a trick is used
internally by means of additional degrees of freedom,
not necessarily obvious to the user. Production log
interpretation is not rate measurement. The key to
the process is in the name: Interpretation. Engineers
interpret, machines do not. The engineer must control
the software not the other way around.
Emeraude offers the user the choice of both zoned
and continuous processing. Data from the simplest
injector string to the most complex multiprobe tools
workflow with an unparalleled range of tools for
displaying, editing and handling data. There are no
‘black boxes’ no hidden processing. Recent additions
include an ‘energy’ temperature model to simulate
reservoir thermal behavior; this can be applied to
steam injection tests, leak detection design and DTS
data interpretation. Additional options include multi-
multilayer rate export to Saphir.
‘Having the software on my workstation has meant service
companies know I can look very closely at the data. It has
meant a significant increase in log analysis quality. It is now
a common platform of communication between us.’
‘The continuous processing is something some clients
insist upon. I really did not want to purchase and learn
another package. Now I have the choice of processing in
one software.’
With over 1,100 active licenses, KAPPA Emeraude is the industry standard
software platform for production log interpretation, shared between all major
service companies, most operating companies and independent contractors
worldwide. Data from any PL string can be analyzed; from the simplest injector
to the most complex multi-probe strings run in multiphase horizontal wells.

viz
KAPPA Viz (Kv):Visualization and Collaboration

VISUALIZE
LEARN MORE
FEATURES
object from the seismic block through to wells,
simulations and logs.
KAPPA-Viz can handle objects of any size and
format from any source. KAPPA objects, such as
numerical models from Rubis, Topaze and Saphir,
or production logs from Emeraude are imported by
a single drag-drop either locally from Ecrin or from
KAPPA Server. Third party objects, such as seismic
blocks, geomodels, simulations and logs are handled
by a series of plug-ins. The massive processing is
handled on the KAPPA-Viz server, the manipulation
and visualization is handled ‘light and local’.
When a new object is imported, whatever the size,
the hands of the user this allows smooth manipulation
of the actual massive object. It is simplified as much
as possible, but no further. There is just sufficient
many orders of magnitude more data are held in store
that is equally accessible and useable. When the
manipulation ceases the full high resolution image is
populated by the server and immediately presented
to the user.
they can share, overlay, manipulate and animate any
object or objects describing the reservoir in real time
on iPad or PC. When the object is a KAPPA analysis a
handle appears on the relevant well(s) that opens the
corresponding analysis on a click or touch.
KAPPA-Viz is the virtual visual meeting place for any 3D object generated by
KAPPA or any third party application. This Client-Server solution offers virtual
rooms where Giga or Terrabyte objects can be shared between PC and iPad
users over an intranet or very narrow internet bandwidths.

PA
HM
Unconventional resources
ANALYZE
LEARN MORE
FEATURES
KAPPA is the first to admit it does not have all the
answers. Nobody has.
focus for KAPPA. Currently available in the suite are
both analytical and numerical horizontal fractured
well models. The latter includes adaptive superfine
gridding and non-linearity. However, to believe that
what exists now is the model on which to base all
future predictions would be foolish.
Research is underway in partnership with more
than twenty of the major OPCOs and Service
that has brought together the best experience and
practise in the industry to move the development of
tools forward and test them against real data as it
brings a three-year exclusivity on developments.
Unconventional Resources occur in ultra-tight formations in which we need
to create a large interface area by massive fracing. Simultaneously the PVT
behaviour is exotic with extreme pressure gradients and compressibility
changes. ‘All’ the industry needs to do is model these mechanisms to
accurately book reserves and predict production.
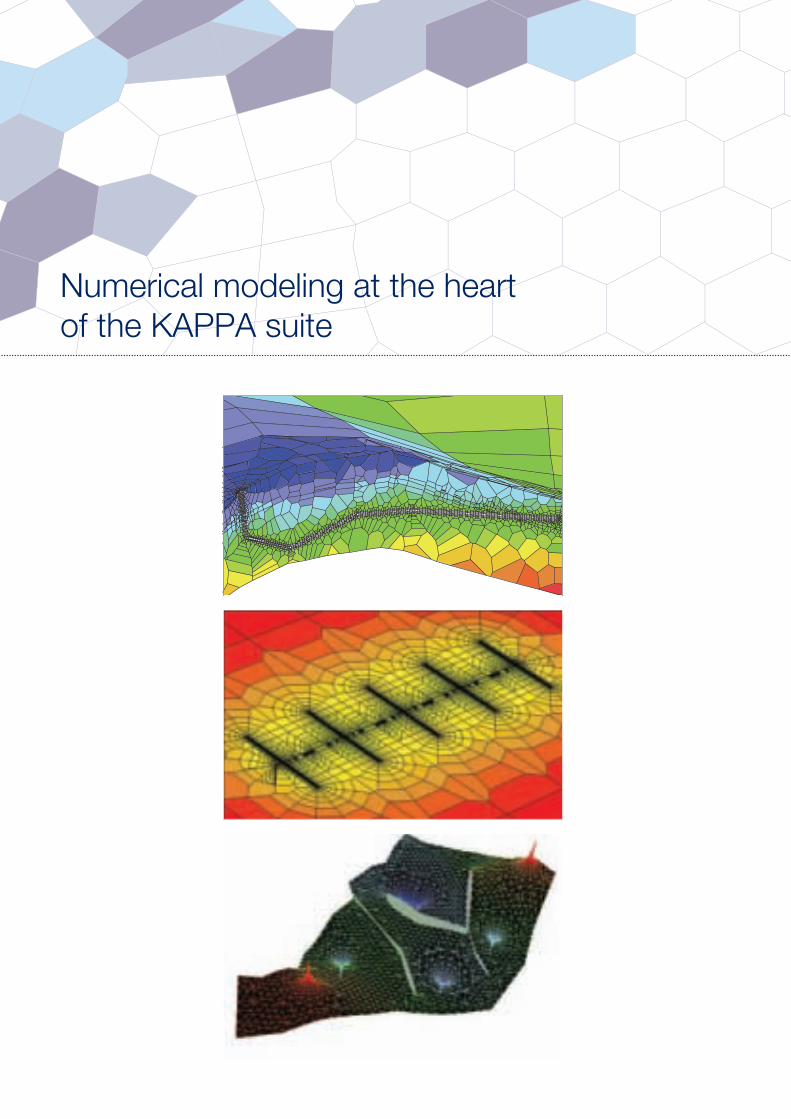
Numerical modeling at the heart
of the KAPPA suite

ANALYZE
FEATURES
(PTA/PA/full field)
By using flexible upscaling the same grid can be
used at the different time scales demanded by
transient, production and full field analysis. This,
for example, allows the user to grab a sector from
the full field model for transient analysis or transfer
the model between various analyses by seamless
drag-drop.
see from extremely close to the wellbore, as in a
formation test or unconventional resource analysis,
progressively deeper into the reservoir to observe
the effect of other wells and the boundaries, all with
perfect coherence.
In the latest development the Voronoi grid has
been adapted to extreme geometries to enable
the analysis of true horizontal wells. The wriggly
well model handles any well trajectory across
any stratigraphy.
A numerical model should be quick and intuitive to build, allowing users to solve
day-to-day problems without deep specialist simulation knowledge. Developed
at the core of the workstation the automatic unstructured Voronoi grid tips
conventional model building on its head. The model is simple to build using
interactive geometry tools or by importing from geomodelers. The grid is then
filled automatically into the created space, freeing the mind to concentrate on
the physical problem with a turn around of minutes rather than hours or days.

vizws s
Training, consulting and support

LEARN
LEARN MORE
COURSES
and Production Analysis
and Production Analysis
SUPPORT
The KAPPA aim is to provide practical training that
offers sufficient theory to understand the subject
and the tools to perform useful work immediately
after the course. KAPPA trainers are all experienced
practitioners in their fields and selected to get the
message across with clarity and, bearing in mind we
are in the commercial world, with a need to produce
a real return on the training dollar.
Clients have access to software support through
extensive contextual help in the application, our
regional offices, web collaboration tools, interactive
videos on the web, free workflow training courses
and forums.
If you do not have time to make the analysis or would
like a second opinion on a case, our consultants
are some of the most experienced in their field in
the industry and are available for short or long term
interventions anywhere in the world, or simply on the
end of the telephone.
For more information on the theory and practice of
Dynamic Data Analysis download the KAPPA DDA
book from www.kappaeng.com
We ask clients to register on our website to keep them
informed. We do not spam and we zealously protect
your identity.
KAPPA trains and consults in Dynamic Data Analysis; namely transient
and production analysis, production log analysis, data management,
modeling and history matching. Public courses are delivered worldwide.
KAPPA also trains hundreds of engineers every year in client specific
in-house courses and workshops.
!"#$%&'(!$)$(*#$+",&,
-./()./01"($#2(31$')&'/(04(51/,,61/(-1$#,&/#)7(
51026')&0#(*#$+",&,7(8/++(5/1401%$#'/(*#$+",&,7(
51026')&0#(90::&#:($#2()./(6,/(04(5/1%$#/#)(
!0;#.0+/(<$6:/(2$)$=
!"#$#%&'()*+,'-'.#/#%&'0#1*&21'-'!"%'34'562%&%
7%1'2"8

www.kappaeng.com
Corporate office
France - Sophia Antipolis
Support and Development
KAPPA Engineering SA
Sales, Training
and Consulting
UK - Reigate
Regional offices
USA & Latin America - Houston
KAPPA North America Inc.
Middle East Asia - Bahrain
Russia - St Petersburg