Embed Size (px)
Citation preview

EVIDENCE AGAINST THE PREMOTOR THEORY OF ATTENTION
by
Stephen Charles Walenchok
Submitted to the Undergraduate Faculty of
the School of Arts and Sciences in partial fulfillment
of the requirements for the degree of
Bachelor of Philosophy
University of Pittsburgh
2010
ii
UNIVERSITY OF PITTSBURGH
SCHOOL OF ARTS AND SCIENCES
This thesis was presented
by
Stephen C. Walenchok
It was defended on
April 14, 2010
and approved by
Mark Wheeler, Ph.D., University of Pittsburgh, Department of Psychology
Tessa Warren, Ph.D., University of Pittsburgh, Department of Psychology
Patryk Laurent, Ph.D., Johns Hopkins University, Department of Psychological and Brain Sciences
Thesis Advisor: Erik Reichle, Ph.D., University of Pittsburgh, Department of Psychology

iii
Copyright © by Stephen C. Walenchok
2010
iv
The premotor theory of attention postulates that attention allocation and saccadic programming
are strictly linked. We conducted an eye-tracking study to test this theory. Participants were
presented with a centrally-located cue arrow and were instructed to make a saccade to the
corresponding peripheral dot while attending to the center, in order to report a briefly-displayed
target letter. Using two separate temporal cutoff criteria from the arrow onset, we found both
significant increases in performance accuracy with practice and decreases in performance
accuracy with longer cue delays, but with accuracies being above chance across conditions.
These results suggest that attention allocation and saccadic programming may be governed by
separate mechanisms.
EVIDENCE AGAINST THE PREMOTOR THEORY OF ATTENTION
Stephen C. Walenchok
University of Pittsburgh, 2010
v
TABLE OF CONTENTS
ACKNOWLEDGEMENTS ....................................................................................................... IX
1.0 INTRODUCTION ........................................................................................................ 1
1.1 SUPPORT FOR THE PREMOTOR THEORY OF ATTENTION ............... 1
1.2 ALTERNATIVE VIEWS .................................................................................... 3
1.2.1 Testing the premotor theory of attention ...................................................... 4
1.3 THE EXPERIMENT ........................................................................................... 5
2.0 METHOD ..................................................................................................................... 8
2.1 PARTICIPANTS ................................................................................................. 8
2.2 APPARATUS AND STIMULI ........................................................................... 8
2.3 DESIGN .............................................................................................................. 11
2.4 PROCEDURE .................................................................................................... 11
2.5 DATA ANALYSIS ............................................................................................. 12
3.0 RESULTS ................................................................................................................... 14
3.1 QUALIFYING TRIALS: 300-MSEC CUTOFF ............................................. 14
3.2 QUALIFYING TRIALS: 250-MSEC CUTOFF ............................................. 15
3.3 ACCURACIES: 300-MSEC CUTOFF ............................................................ 17
3.4 ACCURACIES: 250-MSEC CUTOFF ............................................................ 19
3.5 HYPOTHESES SUPPORTED ......................................................................... 21

vi
4.0 DISCUSSION ............................................................................................................. 23
4.1 EVIDENCE AGAINST A STRICT PREMOTOR THEORY ...................... 24
4.2 FUTURE RESEARCH ...................................................................................... 26
REFERENCES ............................................................................................................................ 27

vii
LIST OF TABLES
Table 1. Proportional means of qualifying to total trials, applying the 300-msec cutoff ............. 15
Table 2. Proportional means of qualifying to total trials, applying the 250-msec cutoff ............. 16
Table 3. Proportional means of correct to qualifying trials, applying the 300-msec cutoff ......... 19
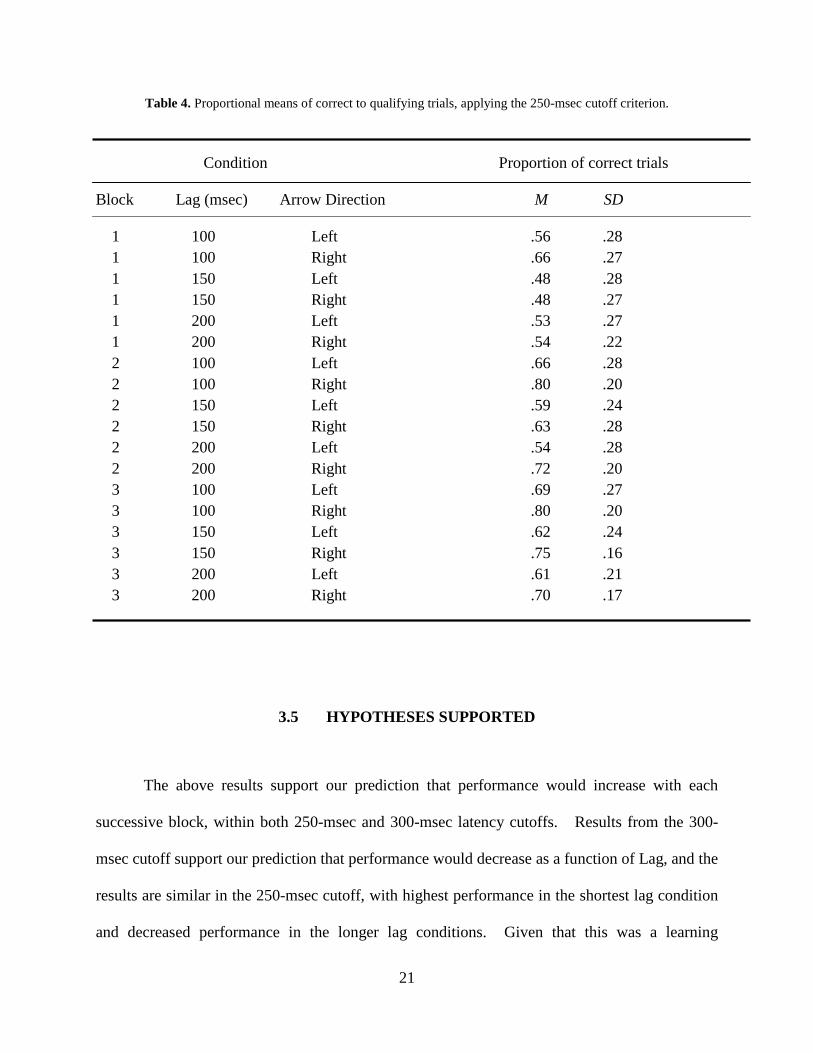
Table 4. Proportional means of correct to qualifying trials, applying the 250-msec cutoff ......... 21

viii
LIST OF FIGURES
Figure 1. Order of stimuli presentation ........................................................................................... 9
Figure 2. “Interest areas,” invisible to the participant .................................................................. 10
Figure 3. Mean accuracy with the 300-msec cutoff applied, as a function of Block and Lag ...... 18
Figure 4. Mean accuracy with the 250-msec cutoff applied, as a function of Block and Lag ...... 20
Figure 5. Diagram of the experiment outlining the 250-msec cutoff ........................................... 24

ix
ACKNOWLEDGEMENTS
This research was funded by National Institutes of Health grant RO1HD053639. I would like to
thank my committee chair and thesis advisor Erik Reichle and committee members Tessa
Warren, Mark Wheeler, and external examiner Patryk Laurent for their invaluable feedback. I
would also like to thank Amanda Virbitsky for her contributions and support and Jiye Shen of
SR Research for his technical assistance.
1
1.0 INTRODUCTION
Humans perform rapid ocular movements called saccades that orient the fovea to areas of
interest within the visual field (Findlay & Walker, 1999). These occur many times per day;
according to Rayner (1998), saccades occur frequently due to visual acuity limitations in the
areas outside the fovea—the parafovea and the periphery. During reading, saccades propel the
fovea through lines of text and are punctuated by fixations, or periods of relative ocular
motionlessness (Rayner, 1998), during which information is acquired (Reichle, Rayner, &
Pollatsek, 2003). During active reading of English text, saccades typically propel the eyes from
left to right, although 10-15% of saccades are regressions that result in refixations of previously
fixated words (Rayner, 1998). In this article, we will consider attention as being allocated in a
“spotlight,” typically to the right of the fixated word during reading of English text (Reichle, et
al., 2003).
1.1 SUPPORT FOR THE PREMOTOR THEORY OF ATTENTION
The question of how attention functions in saccadic eye movements is one of
considerable debate. Rizzolatti, Riggio, Dascola, and Umiltá (1987) postulated the premotor
theory of attention, in which covert attention and ocular motor programs for moving the eyes are
strictly linked (i.e., eye movements to a given location are obligatorily preceded by a shift of
2
attention to that location). They conducted a study in which participants were instructed to
attend to a cued location. The target was presented 70% of the time in the cued location and
30% of the time in a non-cued location. In similar trials, participants were instructed to attend to
all of the potential target locations, each having an equal probability of being stimulus locations.
Participants manually responded to the stimulus as quickly as possible. Results showed that
validly cued trials yielded a temporal performance benefit, and that invalidly cued trials resulted
in temporal cost. They also found that temporal cost increased as a function of distance between
the attended and stimulus locations. Finally, if attended and stimulus locations were on opposite
sides of the horizontal or vertical meridian, additional costs ensued. These additional costs are
(according to the central assumption of the premotor theory of attention) the result of reorienting
the direction of the oculomotor program; in other words, reorienting covert attention.
Hoffman and Subramaniam (1995) support this claim. They conducted two experiments
to determine whether attention is required for a saccade. In the dual-task block of the first
experiment, participants were instructed to make a saccade to one of four specified locations.
Within those four locations (located in the top, bottom, left, and right of the computer display),
one of four different letters was briefly displayed immediately before the saccade was executed.
One of these was the target letter, and participants had to report which letter appeared, after
making the saccade. Although participants were told to make a saccade to a specific location,
they were instructed to attend to all four locations equally. Results showed that detection
accuracy was best when the target letter matched the saccade location. This showed that,
although all stimulus locations were equally probable, participants chose to attend to the intended
saccade location. In the second experiment, participants were instructed to make a saccade to a
fixed location throughout. They were specifically instructed to attend to a specific location,
3
although most of the time the saccade did not coincide with this location. Results showed that
detection accuracy was greatest when the saccade location and the attended location coincided.
Hoffman and Subramaniam thus concluded that participants cannot attend to and move their eyes
to separate locations.
Clark’s (1999) computational model also follows the assumptions of the premotor theory
of attention. In his model, the processes involved in shifting attention continuously define where
the eyes move, thus cutting out the need for a separate saccadic programming mechanism. Clark
specifically cites the premotor theory of attention (Rizzolatti, 1983) and the oculomotor
readiness hypothesis (Klein, Kingstone, & Pontefract, 1992), in which attention and eye
movements directed by exogenous cues are closely associated. As cited by Clark, however,
Klein et al. (1992) did not find this same close association between attention and endogenously-
cued saccades. The reason for this discrepancy remains unclear, but it may indicate that saccadic
programming is not obligatorily coupled with attention shifts—a hypothesis that will be directly
tested in this article.
1.2 ALTERNATIVE VIEWS
Other models of saccade generation do not assume that attention and saccadic
programming are strictly linked. For example, Findlay and Walker (1999) postulate a system of
competitive interaction involving “fixate” and “move” centers that determines when, where, and
whether a saccade should be made. They reject Posner and Peterson’s (1990) theory (described
by Posner & Cohen, 1984, p. 1864) that postulates attention as being disengaged from the current
location, then moved and engaged on a new target. Findlay and Walker argue that, in their
4
model, disengagement and attention allocation involve separate processes, and thus attention is
not singularly moved from one locus to another.
In a similar manner, Reichle, Rayner, and Pollatsek (2003) also propose separate saccadic
programming and attentional processes in their E-Z Reader model. In this processing model, the
lower-level cognitive process of word identification determines both when and where the eyes
move during reading. Higher-level (post-lexical language) processes only directly engage the
attention and oculomotor systems when lower-level processes fail—then, they signal termination
of forward progression and/or the initiation of a regression (Reichle, Warren, & McConnell,
2009). Core assumptions of this model include (1) that attention proceeds serially from one
word to the next in a “spotlight” encompassing one word at a time, and (2) that a sub-stage of
word identification signals a saccade. The first stage of the two-stage word identification system
(i.e., the familiarity check) sends an eye-movement signal to the first stage of the oculomotor
system, which is comprised of a labile stage, where the saccadic program can be cancelled, a
non-labile stage, where the program cannot be cancelled, and a saccade generator. The second
stage of the word identification system (i.e., the completion of lexical access) signals an attention
shift (Reichle, et al., 2003, 2009).
1.2.1 Testing the premotor theory of attention
This assumption of a dissociation between saccadic programming and attention shifting
was explicitly tested by Belopolsky and Theeuwes (2009). In their first experiment, they
presented participants with two figure-eight masks on the left and right sides of the upper
hemifield. A central arrow cued participants to covertly attend to one of the masks. Segments of
the figure-eights were then removed to reveal either the digits one or two, which directed
5
participants to make a saccade toward the upper left or right, respectively. Eighty-percent of the
trials were validly cued, in which the target character was presented at the attended location.
Twenty-percent were invalidly cued, in which the target and attended locations did not match.
Experiment 1 results showed that reaction times were faster on the validly-cued trials; i.e., when
the attended and target locations matched. Performance was also faster on the trials in which the
target and saccade locations matched, indicating that attention reduced saccadic latencies. This
is consistent with the premotor theory of attention (Rizzolatti, et al., 1987) and Hoffman and
Subramaniam’s (1995) results. In the Experiment 2, Belopolsky and Theeuwes added two
additional target locations to the left and right sides of the lower hemifield. This reduced the
probability of saccade and target congruence to 25%. Cues remained valid for 80% of trials.
Performance was faster on validly-cued trials, but for these trials, performance was slower when
the target location matched the saccade location than when these locations were incongruent.
These results suggest that when the probability of making a saccade to an attended location is
low (25%), saccades to that location are suppressed. Taken together, the results from both
experiments are inconclusive because they fail to demonstrate a consistent dissociation of
attention allocation and saccade preparation.
1.3 THE EXPERIMENT
In our study, we aimed to provide more conclusive evidence about the coupling (or lack
thereof) between saccadic programming and the movement of attention. We designed our
experiment to test the premotor theory of attention (Rizzolatti, et al., 1987) and the E-Z Reader
model’s (Reichle et al., 2003, 2009) disparate assumption that attention allocation and saccadic
6
programming diverge within the word identification process. Although in everyday life,
attention and eye movements are undoubtedly closely associated (congruent with the premotor
theory of attention; e.g., Rizzolatti, et al., 1987), we propose that attention shifts and eye
movements may only be linked through association because we make saccades so frequently. In
other words, it may appear as if attention and eye movements are tightly coupled because most
of the time they are. However, although attention shifts often precede eye movements, this does
not necessarily mean that they cannot be “teased apart” as separate processes.
In order to determine if attention and saccadic programming can be separated, we
presented participants with an unusual situation in which they were forced to maintain attention
on a central location while making a cued saccade to a peripheral location. The saccade
direction was cued by an arrow pointing either left or right, that was displayed for 100 msec, 150
msec, or 200 msec. To ensure that participants were attending to the center of the display, they
were required to report the briefly displayed letter. We predicted that, although this task would
be difficult, participants’ performance would be above chance, indicating that they could
simultaneously attend to one location while programming a saccade to another location. We had
two other major hypotheses. First, we predicted that participants’ performance would improve
with each of the three subsequent blocks of trials. This improvement would reflect practice as
participants gained experience dissociating saccadic programming from attention. Second, we
predicted that performance would decrease as a function of arrow lag. The reason for this
prediction is that participants would have to separate saccadic programming from attention
allocation for a longer period of time with each increase in arrow lag duration. This would
increase the necessity of participants to separate the two processes, resulting in a performance

7
decrease in this highly unusual situation. However, as already indicated, we believed that
performance would be above chance in all conditions.
8
2.0 METHOD
2.1 PARTICIPANTS
Twenty-two compensated university students participated in the study. The first four
were considered pilot participants and their data was not used. Two additional participants failed
eye-tracking calibration. We used the data from the remaining sixteen participants, which
included 11 females and five males. All participants received the same stimuli. Participants
signed an informed consent form that was approved by the University of Pittsburgh’s Internal
Review Board prior to beginning the experiment.
2.2 APPARATUS AND STIMULI
We utilized the EyeLink 1000 tower-based eye-tracking system from SR Research, with
dimensions of 400 × 750 × 270 mm, 1000 Hz sampling rate, noise (RMS) < 0.01, and a gaze
position accuracy of 0.15°, using version 4.21 of the host computer software. We designed the
experiment using version 1.6.1 of the SR Research Experiment Builder software. Participants’
right pupils were tracked.
The stimuli consisted of a white background with a central area of interest. Two
equidistant grey circles (dots) were always present on the far left and right, each measuring from
9
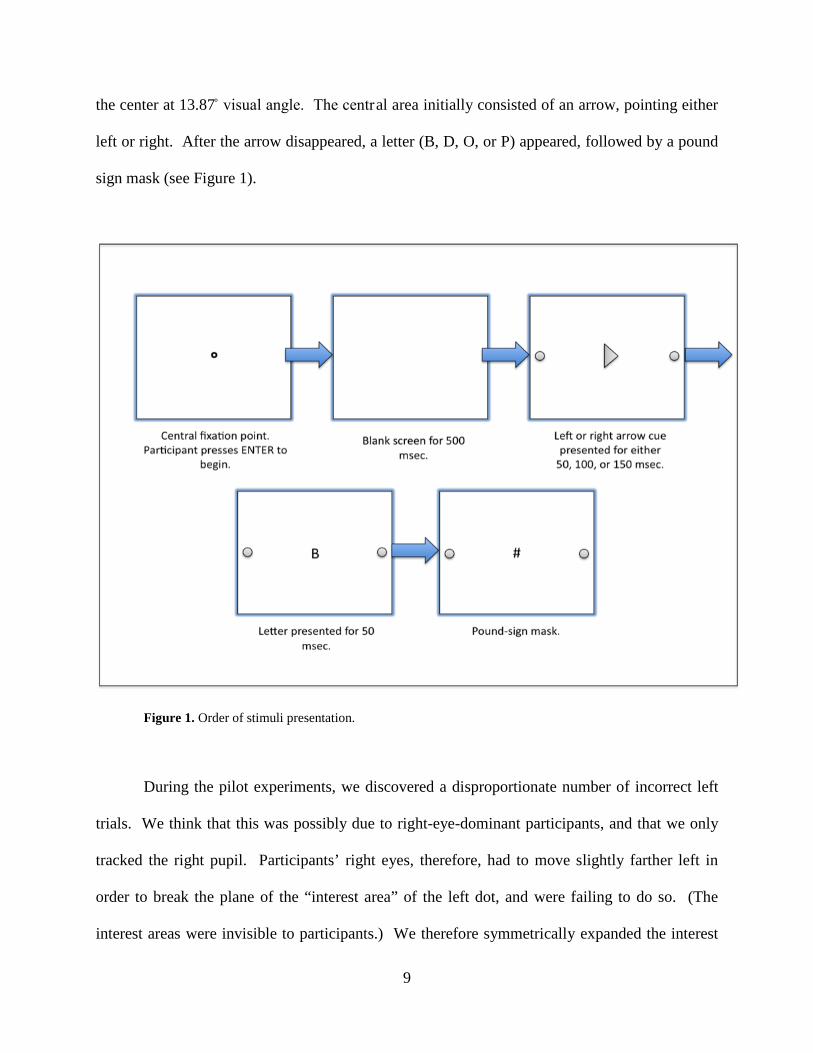
the center at 13.87̊ visual angle. The central area initially consisted of an arrow, pointing either
left or right. After the arrow disappeared, a letter (B, D, O, or P) appeared, followed by a pound
sign mask (see Figure 1).
Figure 1. Order of stimuli presentation.
During the pilot experiments, we discovered a disproportionate number of incorrect left
trials. We think that this was possibly due to right-eye-dominant participants, and that we only
tracked the right pupil. Participants’ right eyes, therefore, had to move slightly farther left in
order to break the plane of the “interest area” of the left dot, and were failing to do so. (The
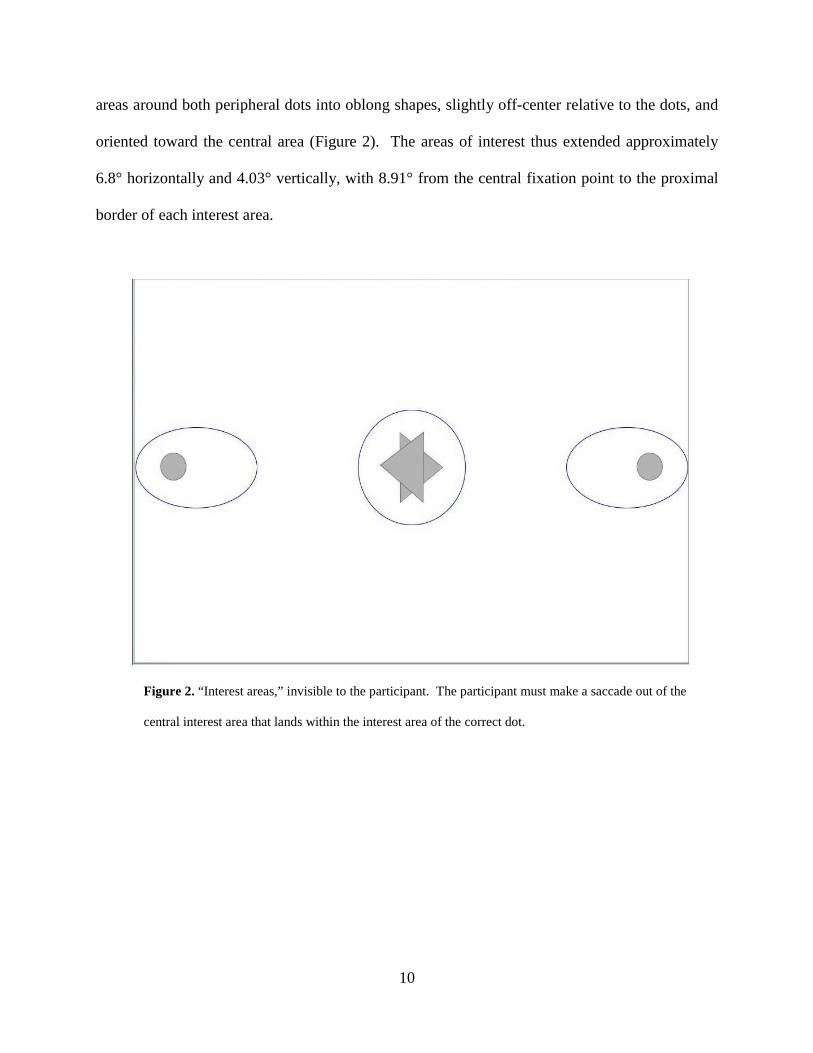
interest areas were invisible to participants.) We therefore symmetrically expanded the interest
10
areas around both peripheral dots into oblong shapes, slightly off-center relative to the dots, and
oriented toward the central area (Figure 2). The areas of interest thus extended approximately
6.8° horizontally and 4.03° vertically, with 8.91° from the central fixation point to the proximal
border of each interest area.
Figure 2. “Interest areas,” invisible to the participant. The participant must make a saccade out of the
central interest area that lands within the interest area of the correct dot.
11
2.3 DESIGN
We conducted a 2 × 3 × 3 mixed factorial experiment. All variables were within-
subjects. There were 20 practice trials and 540 experimental trials, which were divided into
three blocks of 180 trials each. The independent variables of interest were Arrow Direction (left
or right), Lag (100, 150, or 200 msec), and Block (1, 2, or 3). Lag was defined as the duration of
the cue arrow (50, 100, or 150 msec) plus the duration of the target letter, which remained a
constant 50 msec on all trials. Both Arrow Direction and duration, and letter displayed were
randomized through the Experiment Builder run-time randomization feature on each trial.
Correct trials were defined as trials in which participants both made a saccade (within 300 msec
of the arrow onset) from the central interest area to the interest area of the correct dot, and
reported the correct letter. Incorrect trials were defined as trials in which participants broke the
plane of the central interest area with a saccade within 300 msec of the arrow onset, but fixated
on any location other than within the interest area of the correct dot, or reported the incorrect
letter after fixating the correct dot. Trials in which participants dwelled in the central interest
area for longer than 300 msec after the arrow onset were discarded. Participants earned $.05 for
each correct trial as an incentive to put effort into this difficult task. They were not penalized for
incorrect trials.
2.4 PROCEDURE
After the instruction screen, participants were calibrated for accurate tracking and were
given further explanation of the task. They were told that only the first ten trials were practice

12
and the rest were experimental, but we discarded the first 20 trials. At the beginning of each
trial, a central fixation dot appeared. After participants pressed enter to begin the trial, a blank
screen was displayed for 500 msec, followed by an arrow pointing either left or right, which was
displayed for either 50, 100, or 150 msec. (The blank screen before the arrow onset was
displayed for 500-msec on every trial.) Participants were instructed to make a saccade to the
peripheral dot corresponding to the arrow direction as quickly as possible after the arrow onset.
After the arrow offset, a letter immediately appeared in the center for 50 msec, followed by a
mask. During each trial, participants had to make a saccade to the correct dot corresponding to
the arrow direction, while simultaneously maintaining attention on the center, in order to
verbally report the correct letter at the prompt. Participants were only prompted after fixating on
the correct dot. If participants did not make a saccade within 300 msec of the arrow onset in all
conditions, they were warned, “You did not move your eyes quickly enough.” If they did not
fixate within the interest area of the correct dot, they were warned, “You did not look at the
correct dot.” The reason for verbal as opposed to manual entry of each letter was that this was a
difficult task and manual entry would have added unnecessary burden. Consequently,
participants only had to press enter to begin each trial; the experimenter entered the letters.
2.5 DATA ANALYSIS
We analyzed the proportion of trials with qualifying saccadic latencies to the total
number of trials in each condition using two separate temporal cutoff criteria, starting from the
arrow onset. We then analyzed performance accuracy proportional to the number of qualifying

13
trials using each of two temporal cutoff criteria. All analyses were conducted using repeated-
measures ANOVAs, and all results reported in the text reflect estimated marginal means.

14
3.0 RESULTS
First, we analyzed the proportion of trials with qualifying saccadic latencies to total trials
in each condition (n = 30), within two separate temporal cutoff criteria from the arrow onset—
250 msec and 300 msec. For example, when applying the 300-msec cutoff criterion, all trials in
which participants did not make a saccade within 300 msec of the arrow onset were excluded.
3.1 QUALIFYING TRIALS: 300-MSEC CUTOFF
Using the 300-msec cutoff, we found a significant main effect of Block, F(2, 30) = 17.25,
p = .000, and Lag, F(2, 30) = 15.59, p = .000. We found no significant main effect of Arrow
Direction (p > .5) and no interactions (all ps > .3). The proportion of qualifying trials increased
as a function of Block—the lowest proportion of trials came from block 1 (M = .64, SE = .04). A
greater proportion resulted in block 2 (M = .75, SE = .04), and block 3 yielded the highest
proportion of qualifying trials (M = .82, SE = .03). The proportion of qualifying trials decreased
as a function of Lag, with the greatest proportion in the 100-msec condition (M = .82, SE = .04).
The 150-msec condition yielded a lower proportion (M = .71, SE = .04), and the lowest
proportion was in the 200-msec condition (M = .67, SE = .04). (See Table 1 for qualifying
means within the 300-msec cutoff.)

15
Table 1. Proportional means of qualifying to total trials, applying the 300-msec cutoff criterion.
Condition Proportion of qualifying trials
Block Lag (msec) Arrow Direction M SD
1 100 Left .76 .22 1 100 Right .72 .22 1 150 Left .62 .18 1 150 Right .58 .24 1 200 Left .59 .22 1 200 Right .56 .21 2 100 Left .82 .22 2 100 Right .84 .21 2 150 Left .74 .21 2 150 Right .74 .26 2 200 Left .69 .18 2 200 Right .66 .23 3 100 Left .90 .14 3 100 Right .88 .13 3 150 Left .85 .12 3 150 Right .78 .19 3 200 Left .77 .15 3 200 Right .75 .22
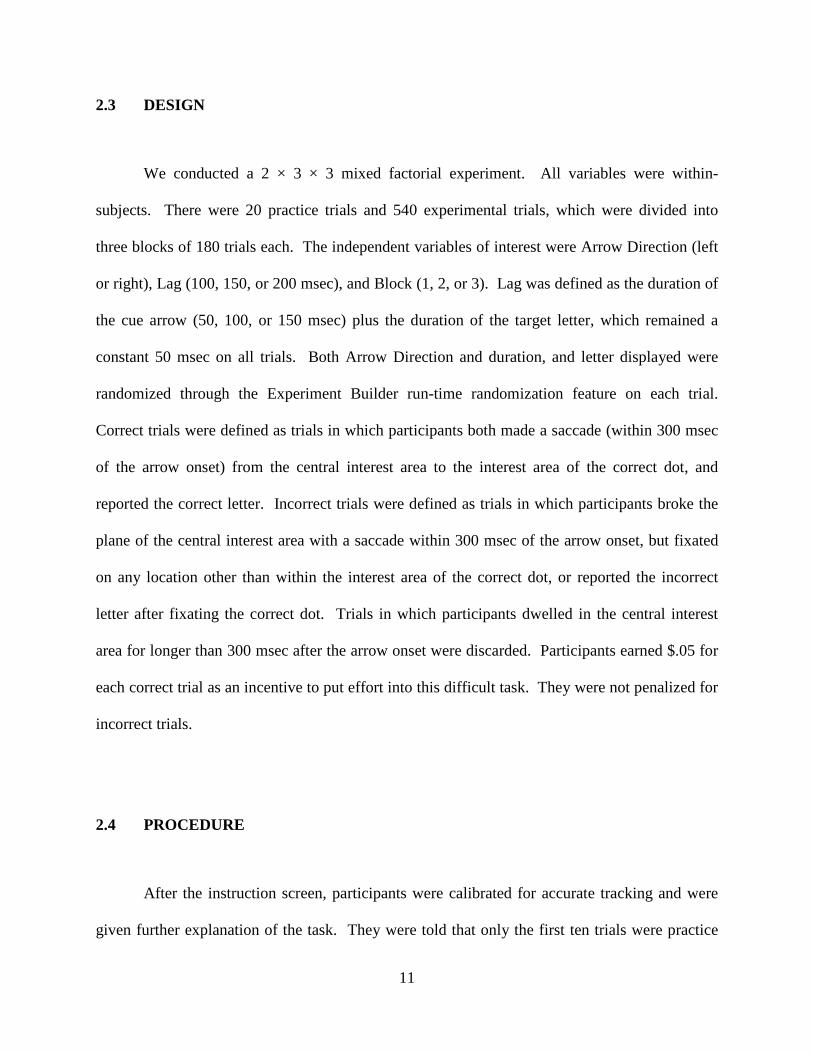
3.2 QUALIFYING TRIALS: 250-MSEC CUTOFF
After applying the more stringent 250-msec cutoff criterion, we again found a significant
main effect of Block, F(2, 30) = 21.29, p = .000, and Lag, F(2, 30) = 12.18, p = .000. We found
no significant main effect of Arrow Direction (p > .9) and no interactions (all ps > .3). Again,
the proportion of qualifying trials increased with each block. Slightly less than half of the trials
in block 1 met the criteria (M = .49, SE = .04). Block 2 yielded a greater proportion (M = .63, SE
= .05), and block 3 yielded the greatest (M = .72, SE = .04). The proportion of qualifying trials
16
decreased as a function of Lag. The 100-msec condition yielded the highest proportion (M = .71,
SE = .05), with the 150-msec condition yielding a smaller proportion (M = .57, SE = .04) and the
200-msec condition yielding the smallest proportion of trials with qualifying latencies (M = .55,
SE = .04). (See Table 2 for qualifying means within the 250-msec cutoff.)
Table 2. Proportional means of qualifying to total trials, applying the 250-msec cutoff criterion.
Condition Proportion of qualifying trials
Block Lag (msec) Arrow Direction M SD
1 100 Left .57 .23 1 100 Right .60 .23 1 150 Left .44 .22 1 150 Right .42 .25 1 200 Left .45 .20 1 200 Right .46 .17 2 100 Left .71 .26 2 100 Right .75 .26 2 150 Left .58 .26 2 150 Right .60 .25 2 200 Left .54 .25 2 200 Right .58 .23 3 100 Left .84 .19 3 100 Right .80 .16 3 150 Left .71 .21 3 150 Right .68 .21 3 200 Left .66 .20 3 200 Right .64 .23
17
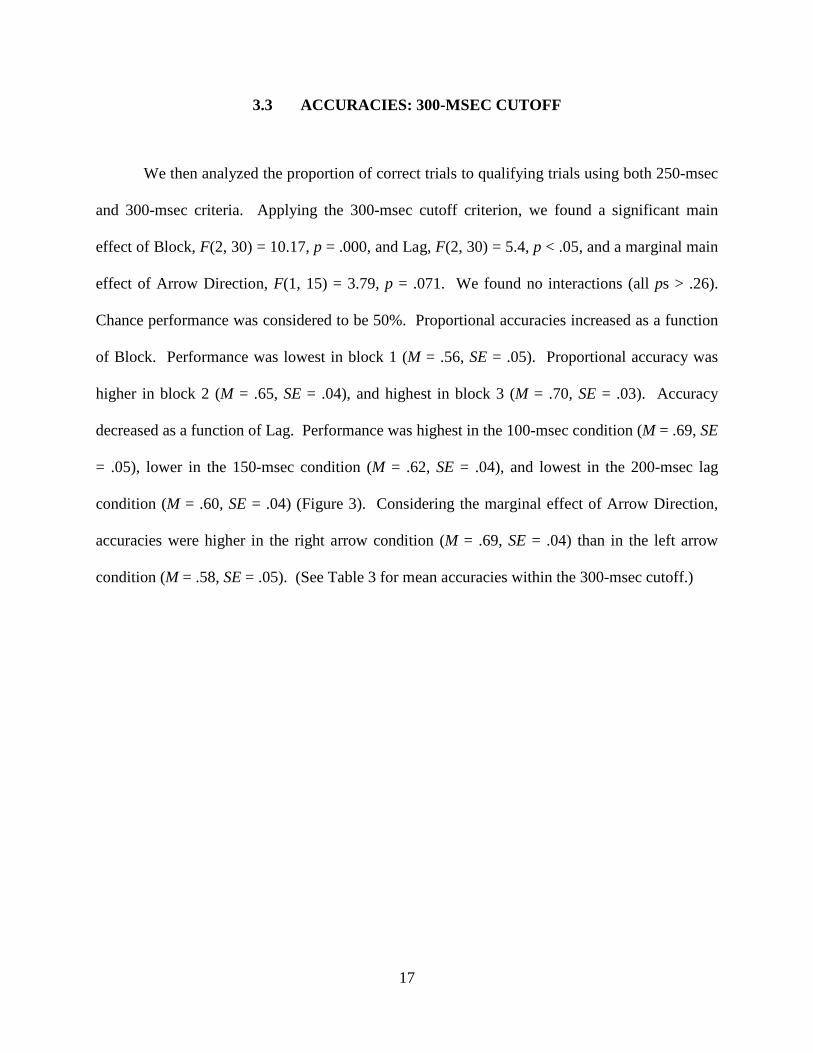
3.3 ACCURACIES: 300-MSEC CUTOFF
We then analyzed the proportion of correct trials to qualifying trials using both 250-msec
and 300-msec criteria. Applying the 300-msec cutoff criterion, we found a significant main
effect of Block, F(2, 30) = 10.17, p = .000, and Lag, F(2, 30) = 5.4, p < .05, and a marginal main
effect of Arrow Direction, F(1, 15) = 3.79, p = .071. We found no interactions (all ps > .26).
Chance performance was considered to be 50%. Proportional accuracies increased as a function
of Block. Performance was lowest in block 1 (M = .56, SE = .05). Proportional accuracy was
higher in block 2 (M = .65, SE = .04), and highest in block 3 (M = .70, SE = .03). Accuracy
decreased as a function of Lag. Performance was highest in the 100-msec condition (M = .69, SE
= .05), lower in the 150-msec condition (M = .62, SE = .04), and lowest in the 200-msec lag
condition (M = .60, SE = .04) (Figure 3). Considering the marginal effect of Arrow Direction,
accuracies were higher in the right arrow condition (M = .69, SE = .04) than in the left arrow
condition (M = .58, SE = .05). (See Table 3 for mean accuracies within the 300-msec cutoff.)
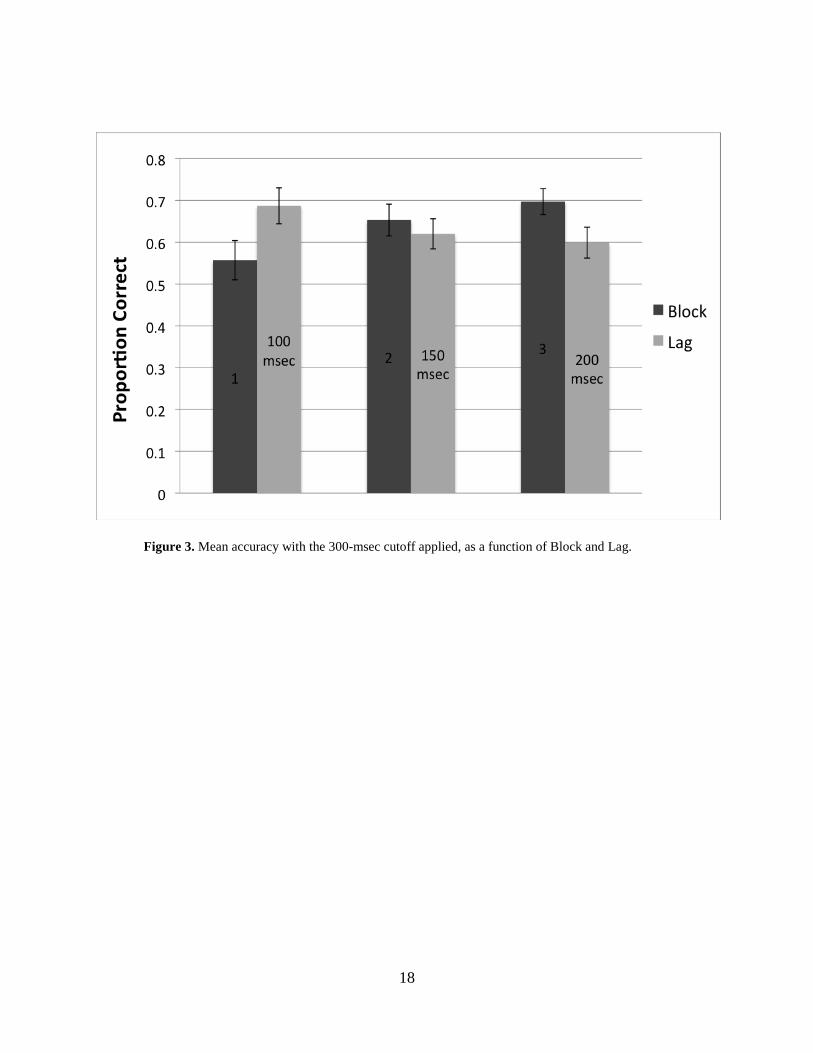
18
Figure 3. Mean accuracy with the 300-msec cutoff applied, as a function of Block and Lag.
19
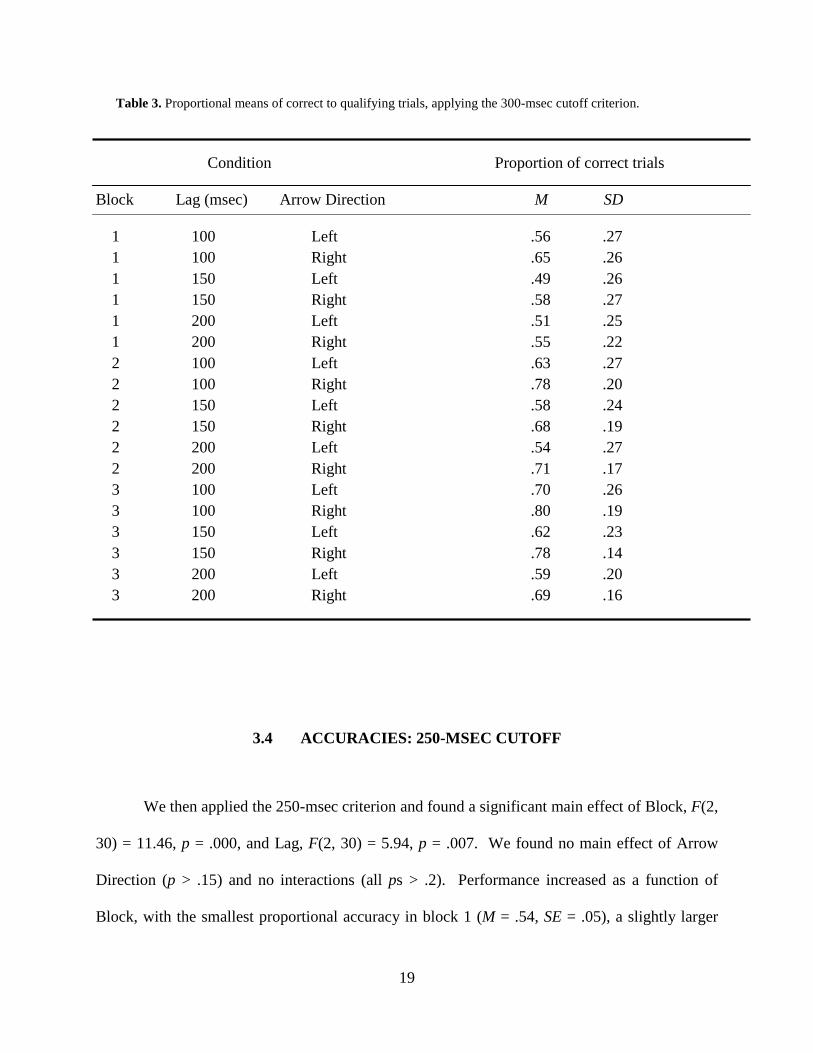
Table 3. Proportional means of correct to qualifying trials, applying the 300-msec cutoff criterion.
Condition Proportion of correct trials
Block Lag (msec) Arrow Direction M SD
1 100 Left .56 .27 1 100 Right .65 .26 1 150 Left .49 .26 1 150 Right .58 .27 1 200 Left .51 .25 1 200 Right .55 .22 2 100 Left .63 .27 2 100 Right .78 .20 2 150 Left .58 .24 2 150 Right .68 .19 2 200 Left .54 .27 2 200 Right .71 .17 3 100 Left .70 .26 3 100 Right .80 .19 3 150 Left .62 .23 3 150 Right .78 .14 3 200 Left .59 .20 3 200 Right .69 .16
3.4 ACCURACIES: 250-MSEC CUTOFF
We then applied the 250-msec criterion and found a significant main effect of Block, F(2,
30) = 11.46, p = .000, and Lag, F(2, 30) = 5.94, p = .007. We found no main effect of Arrow
Direction (p > .15) and no interactions (all ps > .2). Performance increased as a function of
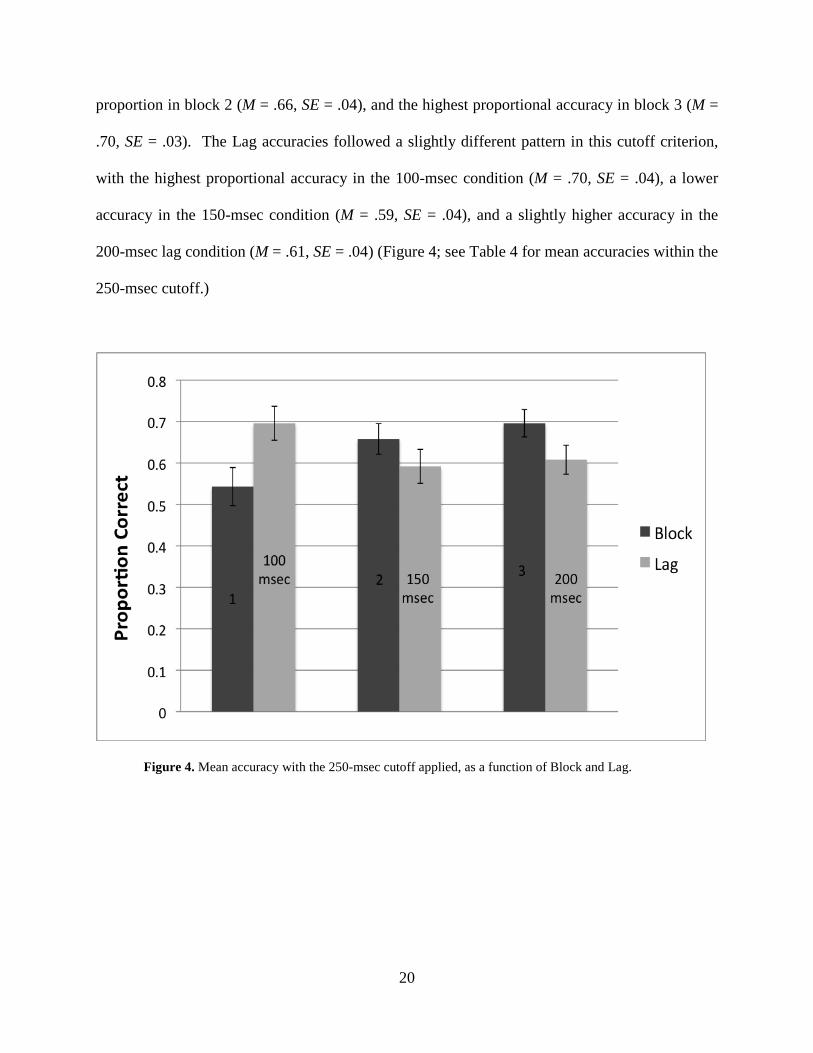
Block, with the smallest proportional accuracy in block 1 (M = .54, SE = .05), a slightly larger
20
proportion in block 2 (M = .66, SE = .04), and the highest proportional accuracy in block 3 (M =
.70, SE = .03). The Lag accuracies followed a slightly different pattern in this cutoff criterion,
with the highest proportional accuracy in the 100-msec condition (M = .70, SE = .04), a lower
accuracy in the 150-msec condition (M = .59, SE = .04), and a slightly higher accuracy in the
200-msec lag condition (M = .61, SE = .04) (Figure 4; see Table 4 for mean accuracies within the
250-msec cutoff.)
Figure 4. Mean accuracy with the 250-msec cutoff applied, as a function of Block and Lag.
21
Table 4. Proportional means of correct to qualifying trials, applying the 250-msec cutoff criterion.
Condition Proportion of correct trials
Block Lag (msec) Arrow Direction M SD
1 100 Left .56 .28 1 100 Right .66 .27 1 150 Left .48 .28 1 150 Right .48 .27 1 200 Left .53 .27 1 200 Right .54 .22 2 100 Left .66 .28 2 100 Right .80 .20 2 150 Left .59 .24 2 150 Right .63 .28 2 200 Left .54 .28 2 200 Right .72 .20 3 100 Left .69 .27 3 100 Right .80 .20 3 150 Left .62 .24 3 150 Right .75 .16 3 200 Left .61 .21 3 200 Right .70 .17
3.5 HYPOTHESES SUPPORTED
The above results support our prediction that performance would increase with each
successive block, within both 250-msec and 300-msec latency cutoffs. Results from the 300-
msec cutoff support our prediction that performance would decrease as a function of Lag, and the
results are similar in the 250-msec cutoff, with highest performance in the shortest lag condition
and decreased performance in the longer lag conditions. Given that this was a learning

22
experiment, our finding that slightly less than half of the trials in block 1 met the latency criteria
for a 250-msec cutoff is not surprising. This was the only condition in which less than half of the
trials qualified. Mean accuracies were above chance within the Block (1, 2, and 3) and Lag (100,
150, and 200 msec) conditions, within both cutoff criteria.
23
4.0 DISCUSSION
The results of this study provide evidence against a strong premotor theory of attention
(Rizzolatti, et al., 1987) and support the E-Z Reader (Reichle, et al., 2003, 2009) assumption of
divergent mechanisms for attention allocation and saccadic programming. We defined the two
cutoff criteria in order to thoroughly examine whether participants were actually dissociating
attention from saccadic programming, or simply fixating on the center well into the letter onset,
overtly detecting the letter, then making a saccade to the peripheral dot; or detecting the arrow,
covertly attending to the corresponding peripheral dot, making a saccade to the dot, then
allocating covert attention back to the center. If these scenarios were the case, the results would
have had a bimodal distribution, with the highest accuracies in the shortest (100 msec) and the
longest (200 msec) lag conditions, and lowest accuracies in the medium lag condition (150
msec). The 300-msec-cutoff results do not show this trend. While accuracies were slightly
higher in the 200-msec lag condition than in the 150-msec lag condition within the 250-msec
cutoff, these results are not strongly bimodal. Also, given the brief duration of stimuli
presentation and the counterbalancing of Arrow Direction and Lag, it is implausible that
participants would be have been able to use these alternative strategies. We defined the arrow
onset as the starting time for participants to begin programming an eye movement in all the
trials. Therefore, the 300-msec cutoff criterion represents a 300-msec maximum saccadic
latency. This is slightly longer than approximate saccadic latencies found in other studies, but
24
the 250-msec cutoff constrains saccadic latencies to a 250-msec maximum, which is within the
180-250-msec range (see Becker & Jürgens, 1979; and Rayner, Slowiaczek, Clifton, & Bertera,
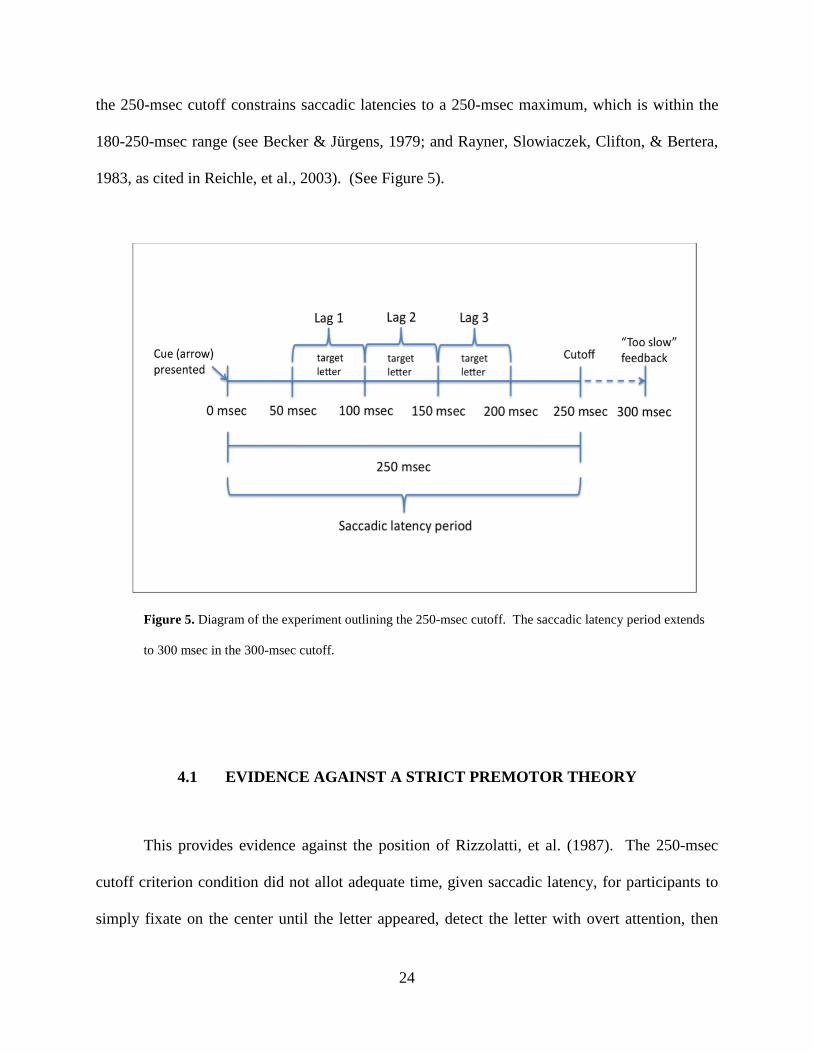
1983, as cited in Reichle, et al., 2003). (See Figure 5).
Figure 5. Diagram of the experiment outlining the 250-msec cutoff. The saccadic latency period extends
to 300 msec in the 300-msec cutoff.
4.1 EVIDENCE AGAINST A STRICT PREMOTOR THEORY
This provides evidence against the position of Rizzolatti, et al. (1987). The 250-msec
cutoff criterion condition did not allot adequate time, given saccadic latency, for participants to
simply fixate on the center until the letter appeared, detect the letter with overt attention, then

25
shift attention to the periphery and make a saccade (if attention and saccadic programming are
strictly linked). Thus, our findings support our claim that the oculomotor system can program a
saccade to the periphery utilizing a process separate from that of attention allocation.
We also found that performance accuracy decreased as a function of Lag, and increased
as function of Block. The Lag results show that with progressively longer time lags between
arrow presentation and letter onset, participants had to increase the time during which attention
and saccadic programming were dissociated. This prolonged separation of the two mechanisms
is an unusual task that people do not commonly perform in everyday life. The Block
performance improvement shows that although this task is unusual, participants could learn to
perform the task and improve with practice. The marginal main effect of Arrow Direction within
the 300-msec cutoff criterion suggests that participants performed slightly better on right-arrow
trials. We postulate that this may have been due to both tracking participants’ right pupils and
possibly right-eye dominance, as previously mentioned. Better performance on right trials also
made sense given that all participants were fluent in English, since the perceptual span extends
asymmetrically from left to right for English readers (Rayner, 1998). Participants were used to
making saccades from left to right, especially in the context of looking at a computer screen,
where text is common. Given that the perceptual span in readers of Hebrew extends to the left of
fixation because they read from left to right (Rayner, 1998), it would be interesting to see the
effect of Arrow Direction on participants whose native language is Hebrew.
26
4.2 FUTURE RESEARCH
Additional future research relevant to our findings would include further investigation of
our learning hypothesis. Accuracy increased with each successive block in our study, and it
would be interesting to see the results of testing fewer participants over a longer period of time.
We believe that performance would greatly improve in participants who did the task several
times over multiple days, since this task situation is highly unusual. This would provide
additional evidence against a strict premotor theory of attention.
Furthermore, our experiment used an endogenous cue (the arrow). Incorporating an
exogenous, attention-capturing cue to this task may provide additional evidence for our findings;
i.e., displaying the target dot after the arrow onset may render detection of the target letter
extremely difficult or impossible. If this turns out to be the case, these results will further
support our finding that participants were attending to the center in order to detect the target
letter, in the original study. This would also lend support to Clark’s (1999) suggestion that
saccades and endogenous attention are not as closely associated as saccades and exogenous
attention.
27
REFERENCES
Becker, W., & Jürgens, R. (1979). An analysis of the saccadic system by means of double step stimuli. Vision Research, 19(9), 1967-1983. Belopolsky, A. V., & Theeuwes, J. (2009). When are attention and saccade preparation dissociated? Psychological Science, 20(11), 1340-1347. Clark, J. J. (1999). Spatial attention and latencies of saccadic eye movements. Vision Research, 39, 585-602. Findlay, J. M., & Walker, R. (1999). A model of saccade generation based on parallel processing and competitive inhibition. Behavioral and Brain Sciences, 22, 661-721. Hoffman, J. E., & Subramaniam, B. (1995). The role of visual attention in saccadic eye movements. Perception & Psychophysics, 57(6), 787-795. Klein, R., Kingstone, A., & Pontefract, A. (1992). Orienting of visual attention. In K. Rayner (Ed.), Eye movements and visual cognition (pp. 46-65), New York: Springer-Verlag. Posner, M. I., & Cohen, Y. (1984). Components of visual orienting. In H. Bouma & D. G. Bowhuis (Eds.), Attention and performance X (pp. 531-556). Hillsdale, NJ: Lawrence Erlbaum Associates. Posner, M. I., & Petersen, S. E. (1990). The attention system of the human brain. Annual Review of Neuroscience, 13, 25-42. Rayner, K. (1998). Eye movements in reading and information processing: 20 years of research. Psychological Bulletin, 124(3), 372-422. Rayner, K., Slowiaczek, M. L., Clifton, C., & Bertera, J. H. (1983). Latency of sequential eye movements: Implications for reading. Journal of Experimental Psychology: Human Perception and Performance, 9, 912-922. Reichle, E. D., Rayner, K., & Pollatsek, A. (2003). The E-Z Reader model of eye-movement control in reading: comparisons to other models. Behavioral and Brain Sciences, 26, 445-526.
28
Reichle, E. D., Warren, T., & McConnell, K. (2009). Using E-Z Reader to model the effects of higher level language processing on eye movements during reading. Psychonomic Bulletin & Review, 16(1), 1-21. Rizzolatti, G. (1983). Mechanisms of selective attention in mammals. In J. P. Ewart, R. R. Capranica, & D. J. Ingle (Eds.), Advances in vertebrate neuroethology (pp. 261-297). New York: Plenum. Rizzolatti, G., Riggio, L., Dascola, I., & Umiltá, C. (1987). Reorienting attention across the horizontal and vertical meridians: evidence in favor of a premotor theory of attention. Neuropsychologia, 25(1A), 31-40.