Embed Size (px)
Citation preview
MTID DISCUSSION PAPER NO. 72
Markets, Trade and Institutions Division
International Food Policy Research Institute 2033 K Street, N.W.
Washington, D.C. 20006 U.S.A. http://www. ifpri.org
July 2004
Copyright © 2004 International Food Policy Research Institute
MTID Discussion Papers contain preliminary material and research results, and are circulated prior to a full peer review in order to stimulate discussion and critical comment. It is expected that most Discussion Papers will eventually be published in some other form, and that their content may also be revised.
EVIDENCE AND IMPLICATIONS OF NON-TRADABILITY OF FOOD STAPLES IN TANZANIA 1983-1998
Christopher Delgado, Nicholas Minot, and Marites Tiongco
MTID DISCUSSION PAPER NO. 72
Markets, Trade and Institutions Division
International Food Policy Research Institute 2033 K Street, N.W.
Washington, D.C. 20006 U.S.A. http://www. ifpri.org
July 2004
Copyright © 2004 International Food Policy Research Institute
MTID Discussion Papers contain preliminary material and research results, and are circulated prior to a full peer review in order to stimulate discussion and critical comment. It is expected that most Discussion Papers will eventually be published in some other form, and that their content may also be revised .
EVIDENCE AND IMPLICATIONS OF NON-TRADABILITY OF FOOD STAPLES IN TANZANIA 1983-1998
Christopher Delgado, Nicholas Minot, and Marites Tiongco

i
ABSTRACT
Economic reform programs assume that major goods are tradable, such that
depreciation of the real exchange rate raises the value of output compared to factor costs
in domestic currency. In Tanzania, major food staples that account for most real income
are non-tradables in at least one-quarter of the country. This is demonstrated and
implications assessed for the constraints imposed on macroeconomic-led adjustment
strategies.
Keywords: tradable goods, non-tradable goods, exchange rate pass-through, Tanzania

ii
TABLE OF CONTENTS I. INTRODUCTION .........................................................................................................1 2. WHY BOTHER?������� .. .......................................................................... 4 3. PRODUCTION AND PRICE TRENDS IN TANZANIA 1985-1998 .........................6 4. DATA �������������� .................................................................12 5. APPROACH ���������� .......................................................................16 6. RESULTS AND DISCUSSION .................................................................................17
Are Some Starchy Staples Non-Tradables? ..........................................................17 Why Does Maize Behave As Non-Tradable? .......................................................21
7. CONCLUSIONS�������.. ...........................................................................25
iii
LIST OF TABLES
Table 1�Market coverage of MDB price survey, main food staples, 1983-98..............14 Table 2�Determinants of staple food prices in Tanzania ..............................................18 Table 3�Tests of whether prices are determined in isolated markets the same way that
they are in well-connected markets.................................................................21 Table 4�Determinants of spreads between Dar-es-Salaam price for food staples and
interior market retail prices 1986-98...............................................................24

1
EVIDENCE AND IMPLICATIONS OF NON-TRADABILITY OF FOOD STAPLES IN TANZANIA 1983-1998
Christopher Delgado1, Nicholas Minot2, and Marites Tiongco3
I. INTRODUCTION
An important component of many economic reform programs in developing
countries is to stimulate the production and reduce consumption of tradable goods by
increasing (depreciating) the real exchange rate (RER), defined as the relative price of
tradables to non-tradables (Edwards, 1989). In particular, it is often assumed that the
agricultural sector will benefit from this policy because agricultural commodities are
thought to be tradable, while most of the costs of agricultural production are non-tradable
factors of production such as land and labor.
Agriculture has typically loomed large in the discussion of structural adjustment
in Sub-Saharan Africa, at least since the time of the famous Berg Report (World Bank,
1981). The key idea was that the set of reforms associated with a depreciating RER
would expand aggregate agricultural output through higher returns to tradables, and also
through lower costs for non-tradables linked to costs of production of tradables. In much
of Africa, export crops and tradable food crops have in fact tended to respond as
predicted to favorable changes in the macro economy and domestic market liberalization
where it has occurred, as Berg predicted (Townsend, 1999). Yet, there is little
1 Director of the Joint ILRI-IFPRI Program for Livestock Market Opportunities. 2 Research Fellow, Markets, Trade and Institutions Division, IFPRI, 2033 K Street NW Washington D.C. 3 Research Analyst, Markets, Trade and Institutions Division, IFPRI, 2033 K Street NW Washington D.C.
2
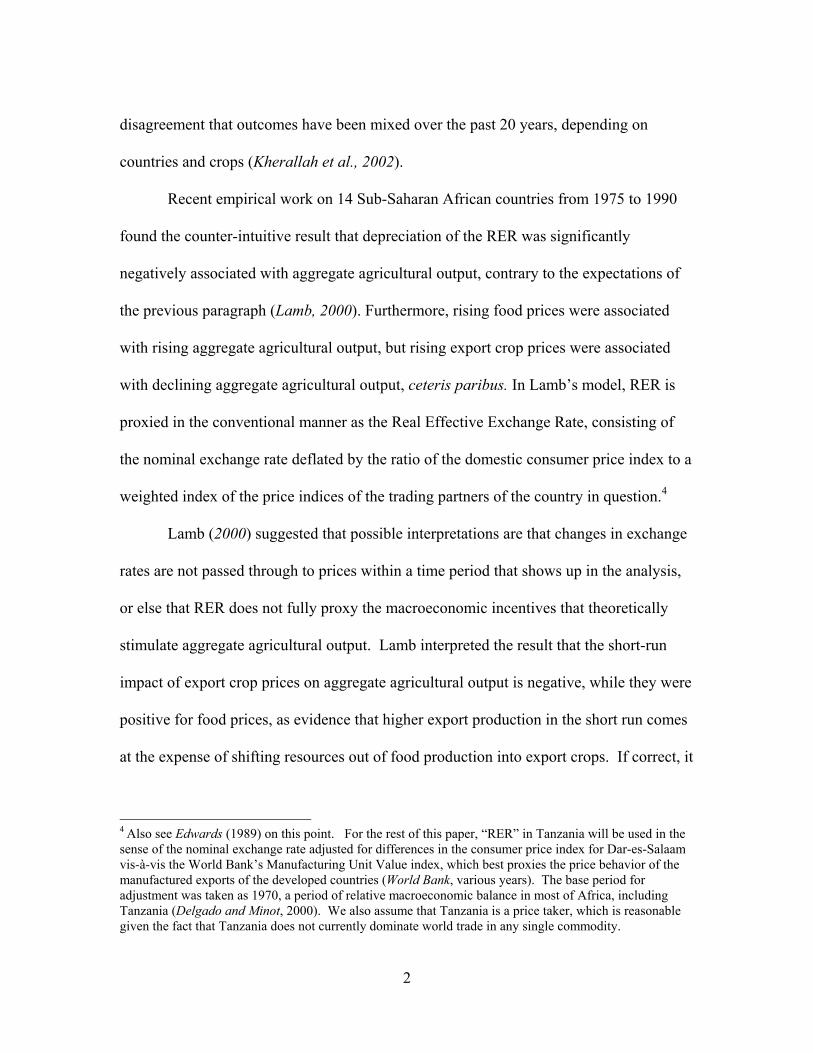
disagreement that outcomes have been mixed over the past 20 years, depending on
countries and crops (Kherallah et al., 2002).
Recent empirical work on 14 Sub-Saharan African countries from 1975 to 1990
found the counter-intuitive result that depreciation of the RER was significantly
negatively associated with aggregate agricultural output, contrary to the expectations of
the previous paragraph (Lamb, 2000). Furthermore, rising food prices were associated
with rising aggregate agricultural output, but rising export crop prices were associated
with declining aggregate agricultural output, ceteris paribus. In Lamb�s model, RER is
proxied in the conventional manner as the Real Effective Exchange Rate, consisting of
the nominal exchange rate deflated by the ratio of the domestic consumer price index to a
weighted index of the price indices of the trading partners of the country in question.4
Lamb (2000) suggested that possible interpretations are that changes in exchange
rates are not passed through to prices within a time period that shows up in the analysis,
or else that RER does not fully proxy the macroeconomic incentives that theoretically
stimulate aggregate agricultural output. Lamb interpreted the result that the short-run
impact of export crop prices on aggregate agricultural output is negative, while they were
positive for food prices, as evidence that higher export production in the short run comes
at the expense of shifting resources out of food production into export crops. If correct, it
4 Also see Edwards (1989) on this point. For the rest of this paper, �RER� in Tanzania will be used in the sense of the nominal exchange rate adjusted for differences in the consumer price index for Dar-es-Salaam vis-à-vis the World Bank�s Manufacturing Unit Value index, which best proxies the price behavior of the manufactured exports of the developed countries (World Bank, various years). The base period for adjustment was taken as 1970, a period of relative macroeconomic balance in most of Africa, including Tanzania (Delgado and Minot, 2000). We also assume that Tanzania is a price taker, which is reasonable given the fact that Tanzania does not currently dominate world trade in any single commodity.
3
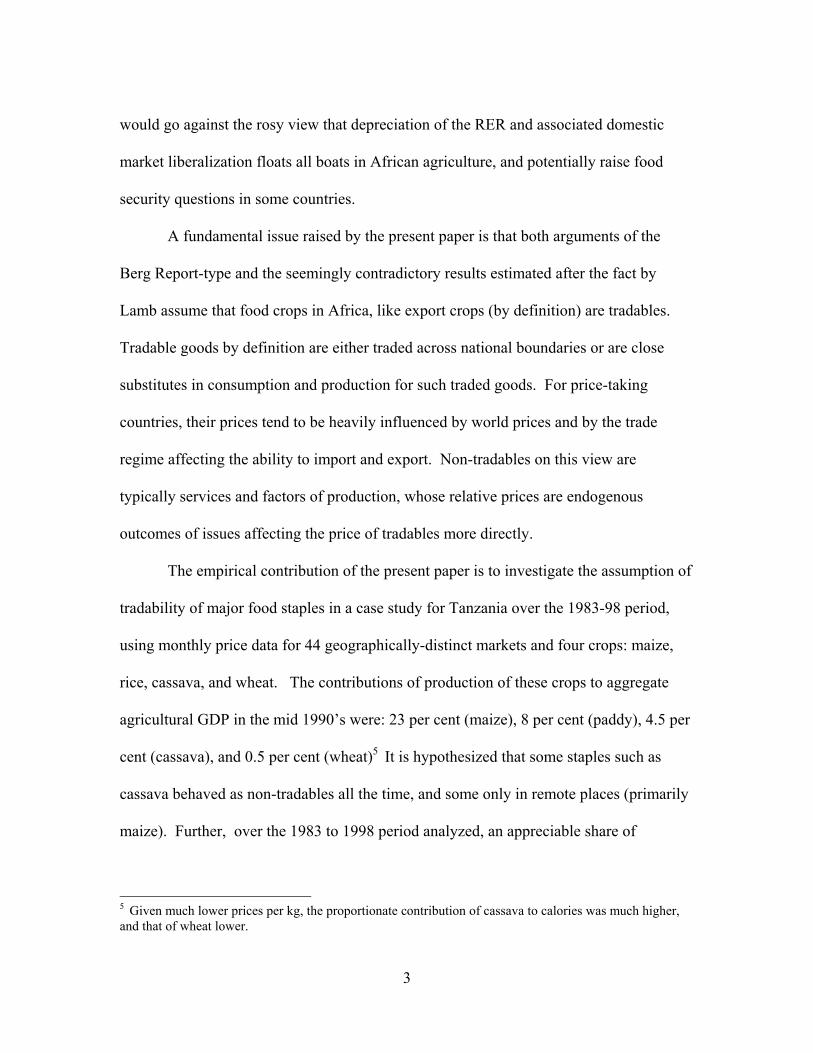
would go against the rosy view that depreciation of the RER and associated domestic
market liberalization floats all boats in African agriculture, and potentially raise food
security questions in some countries.
A fundamental issue raised by the present paper is that both arguments of the
Berg Report-type and the seemingly contradictory results estimated after the fact by
Lamb assume that food crops in Africa, like export crops (by definition) are tradables.
Tradable goods by definition are either traded across national boundaries or are close
substitutes in consumption and production for such traded goods. For price-taking
countries, their prices tend to be heavily influenced by world prices and by the trade
regime affecting the ability to import and export. Non-tradables on this view are
typically services and factors of production, whose relative prices are endogenous
outcomes of issues affecting the price of tradables more directly.
The empirical contribution of the present paper is to investigate the assumption of
tradability of major food staples in a case study for Tanzania over the 1983-98 period,
using monthly price data for 44 geographically-distinct markets and four crops: maize,
rice, cassava, and wheat. The contributions of production of these crops to aggregate
agricultural GDP in the mid 1990�s were: 23 per cent (maize), 8 per cent (paddy), 4.5 per
cent (cassava), and 0.5 per cent (wheat)5 It is hypothesized that some staples such as
cassava behaved as non-tradables all the time, and some only in remote places (primarily
maize). Further, over the 1983 to 1998 period analyzed, an appreciable share of
5 Given much lower prices per kg, the proportionate contribution of cassava to calories was much higher, and that of wheat lower.
4
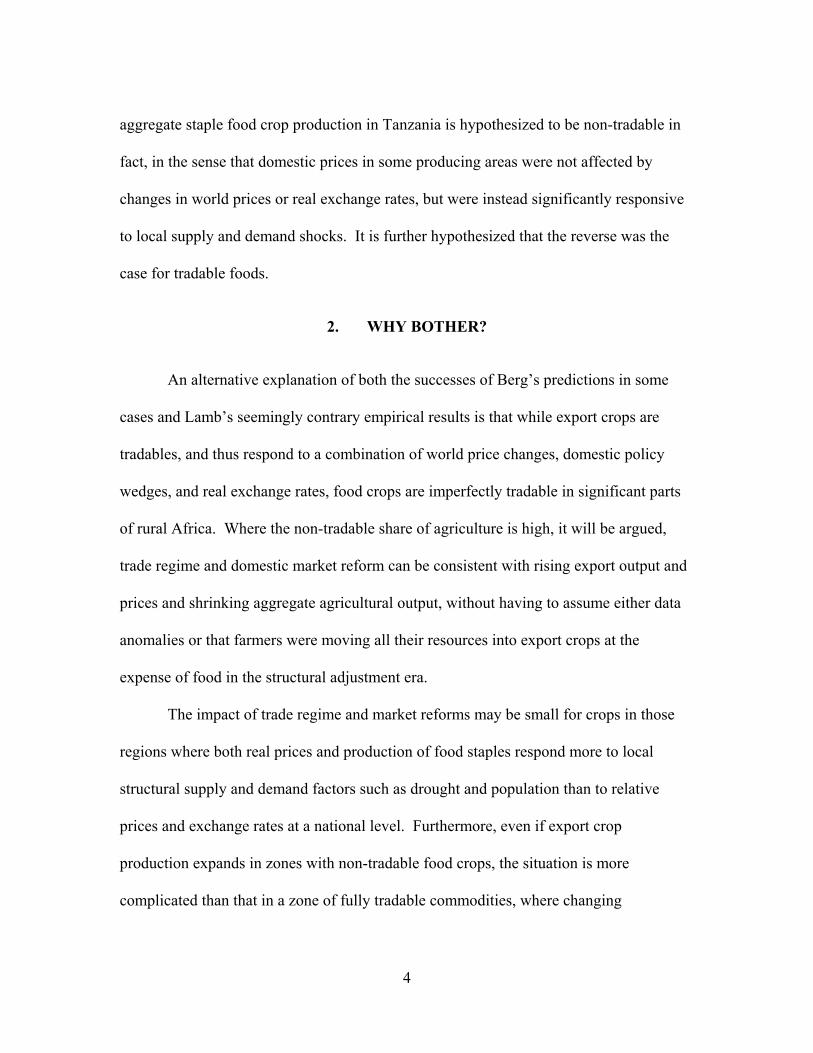
aggregate staple food crop production in Tanzania is hypothesized to be non-tradable in
fact, in the sense that domestic prices in some producing areas were not affected by
changes in world prices or real exchange rates, but were instead significantly responsive
to local supply and demand shocks. It is further hypothesized that the reverse was the
case for tradable foods.
2. WHY BOTHER?
An alternative explanation of both the successes of Berg�s predictions in some
cases and Lamb�s seemingly contrary empirical results is that while export crops are
tradables, and thus respond to a combination of world price changes, domestic policy
wedges, and real exchange rates, food crops are imperfectly tradable in significant parts
of rural Africa. Where the non-tradable share of agriculture is high, it will be argued,
trade regime and domestic market reform can be consistent with rising export output and
prices and shrinking aggregate agricultural output, without having to assume either data
anomalies or that farmers were moving all their resources into export crops at the
expense of food in the structural adjustment era.
The impact of trade regime and market reforms may be small for crops in those
regions where both real prices and production of food staples respond more to local
structural supply and demand factors such as drought and population than to relative
prices and exchange rates at a national level. Furthermore, even if export crop
production expands in zones with non-tradable food crops, the situation is more
complicated than that in a zone of fully tradable commodities, where changing
5
comparative advantage would be accompanied by a shift of resources out of food staples
and into export crops such as coffee and cotton. If the zone with non-tradable food crops
is demand-constrained, as seems likely where the share of non-tradable food is high in
total output, then an export boom will draw unused resources into both export and food
production, until the price of food starts rising relative to export crops as resources
become fully utilized (Delgado, Hopkins and Kelly, 1998). Trade of food into the region
(by definition difficult for a non-tradable commodity) may not occur until price rises for
food relative to other commodities are very significant, undermining the theory that
export crops can continue to grow without losing much of their profitability.
A depreciating real exchange rate where all crops are tradable would be expected
to raise the output of both cash and food crops. In some cases, output of both will
increase, and in some, the higher-value activity will substitute for the lower value one,
but the aggregate value of output will rise. But if food prices are driven by a different and
exogenous set of factors, such as local supply and demand shocks, it is quite possible for
macroeconomic reform embodied in a depreciating RER to stimulate export crop output
on the one hand, and to discourage output of that part of the food sector that is non-
tradable on the other. Furthermore, the food sector in Tanzania accounted for 65 per cent
of agricultural GDP compared to 9 per cent for export crops in the early 1990s (Delgado
and Minot 2000), and this relative proportion is not unusual in Sub-Saharan Africa.
Under these proportions, what happens to the non-tradable food portion of agriculture
will exceed the first-round impact on aggregate output of what happens to export crops if
at least 14 per cent of food production by value is non-tradable (65 X 0.14 > 9).
6
Another reason the non-tradability of food matters to macroeconomic outcomes in
rural Sub-Saharan Africa is that the non-tradability of major food grains, where
established, suggests limited ability for government to control a key strategic variable
that affects both immediate human welfare (through food prices and real incomes of
consumers), and also long-run competitiveness through the rising labor costs of
producers (Delgado, 1992). Finally, a year of good rainfall or successful public
investment in increasing production of food in regions where it is a non-tradable can
quickly lead to precipitous declines in the producer price of food and subsequent
retrenchment of producers from the sector.
It will be argued below that if a significant share of food output behaves as non-
tradables, then the focus of agricultural strategy needs to be nuanced. In addition to the
already difficult task of pursuing rural growth poles wherever they can be found in the
expectation that they will pull the rest of the rural economy along, there remains the need
to worry about balance between tradables and non-tradables, while waiting for success in
promoting better internal economic integration.
3. PRODUCTION AND PRICE TRENDS IN TANZANIA 1985-19986
The relative importance of agriculture in Sub-Saharan has declined a bit since the
1970s of the Berg Report, but still remains high. As recently as 1997, the sector still
accounted for 35 per cent of GDP, 40 per cent of exports, and 70 per cent of employment
6 The general reference for figures and interpretations in this section is Delgado and Minot (2000) unless otherwise indicated.
7
if South Africa is excluded (Townsend, 1999). The proportions for the poorer countries
without oil exports are even higher; for Tanzania, agriculture accounted for over 80 per
cent of employment and over half of net exports and GDP in the late 1990s. Therefore
understanding the links between relative agricultural prices and macroeconomic variables
such as RER is especially relevant in countries such as Tanzania, and by extension to
most of Sub-Saharan Africa, where agriculture continues to dominate the national
economy, at least from the standpoint of employment.
Economic reforms associated with structural adjustment policies in Tanzania were
followed by a sharp and sustained depreciation in the RER (as defined above) after 1986,
following a long period of appreciation from the late 1960's. This trend was sharply
reversed after 1993, with a strong appreciation of RER thereafter to the end of the 1998.
Widespread market liberalization reforms of Tanzanian agriculture began to be phased in
over the same period, beginning with the food crops and ending with the minor cash
crops in the late 1990s.
Data pertaining to output volumes of food and export crops has been controversial
at times in Tanzania in the period in question. A careful sorting out of evidence from
many sources within Tanzania found that between 1985 and 1998, the six main food
crops had an aggregate growth rate of 3.5 per cent by weight, and the major export crops
grew at an aggregate 5.4 per cent per annum by weight.
Maize is the principal staple food crop, and is grown on about 44 per cent of crop
land (depending on the season), by more than four-fifths of all rural households. The
largest surpluses are generated in relatively remote inland areas: Iringa, Mbeya, Ruvuma
8
and Rukwa. National production growth over the 1985-98 period was 2.4 per cent per
annum, 0.3 per cent per annum less than population growth. Growth was slightly higher
in the period after major market liberalization in 1991, and lower before then. Fertilizer
use�adversely affected by withdrawal of subsidies�fell by about one-quarter from the
late 1980s to the mid 1990s. Real maize prices (officially set and enforced until 1991)
declined slightly over the period prior to 1991, tripled thereafter to 1993, and then
declined sharply thereafter, reaching pre-liberalization levels by 1998 (Delgado and
Minot, 2000). Maize has variously been exported in small amounts, imported in large
amounts, or not traded over the period, depending on weather outcomes and
administrative fiat.
Rice production increased fourfold between 1985 and 1998. Production has been
promoted by research and investment policies, and although the main production areas
are far inland, they tend to be near major road and rail infrastructure. The income
elasticity of demand for rice is relatively high (1.25 in rural areas), and rice is imported
even in years of good production. Similarly, wheat is a relatively high value starch that is
imported even in good years and which is growing rapidly in demand. Rice prices tend
to be more correlated with maize than with wheat, but both shot up after liberalization in
1991, although wheat prices declined more slowly than maize after 1993. A priori, both
wheat and rice are thought to be tradable crops influenced by world prices and exchange
rates.
Cassava on the other hand is both an important food source in Tanzania and
typically thought to be non-tradable. It has a very low value-to-bulk ratio versus other
9
food staples, making transport relatively costly. Furthermore, although it stores in the
ground for years unharvested, the fresh root is highly perishable once dug up. Production
trended upwards over the period, but is quite variable and both production and prices
have tended to be counter-cyclical with maize, suggesting a role of unharvested cassava
as a food security crop for bad times, in addition to regular seasonal use. A priori,
cassava is expected to be non-tradable, with its local price influenced mainly by local
demand that rises with poor weather for maize production.
Tanzania has a varied and rich set of agricultural exports, including coffee,
cotton, tobacco, cashew, and tea. On the whole, world real prices for these commodities
fell in the late 1980�s and early 1990s, rose from 1992/93 to around 1997/98, and fell
thereafter. Real domestic producer prices were affected by both the real exchange rate
and domestic institutional reforms associated with liberalization of crop procurement and
processing. Different rates of market liberalization by commodity led to different trends
in crop producer prices from the late 1980s through the 1990s. However as a
generalization, producer prices for export crops were more stable than world prices in
the 1980s (at low mean levels compared to world prices), but tended to head in similar
directions (up and down) to world prices in the 1990s, as would be expected under
increased liberalization.
Interestingly, the relative trends in domestic prices of both major export crops and
the hypothesized major traded food staples in Tanzania over the 1990s were consistent
with the trends in Tanzania�s RER. The real (inflation adjusted) prices of the more
tradable crops (wheat, rice, maize) rose from 1991 to 1993, and then declined to less than
10
50 per cent of their 1991 levels by 1999. The pattern of prices for the generally tradable
food crops was clearly also influenced by the impact of the 1991-92 drought in southern
Africa, and associated Tanzanian maize exports. Yet it is also clear that the appreciating
real exchange rate after 1993 (i.e. moving away from the desired depreciation under
macroeconomic reform after 1986) made imports of wheat and rice less expensive,
driving down real domestic prices for these crops. Real prices of the less tradable crops
(cassava, sorghum/millet, beans) tended to rise for another two years, before falling after
1995. Furthermore, the declines after 1995 were less than those of the tradable crops.
The depreciating RER after 1986 meant, other things equal, that the relative
prices of tradable goods were rising faster than the relative value of labor and land to
produce them; the reverse was the case after 1993. In theory the returns to producers of
traditional exports should have risen from 1986-93. Unfortunately, real world
commodities prices were falling sharply, largely wiping out the gains from the
depreciating RER. Given the extent of the fall in world real prices in the 1990s, the
situation of export crop producers would have been disastrous had the RER not been
depreciating during at least the early part of the decade.
Conversely, the real prices received by producers of non-tradables were declining
during the 1986-93 period. The most obvious manifestation of this is the austerity felt by
employees in the urban non-tradable industries such as government services where wages
did not keep up with the cost of living. Producers of non-tradable agricultural goods
were also adversely affected during this period. After 1993, the price of non-tradables
11
was rising relative to tradables, reducing incentives to producers of export crops, but
raising the returns of producers of non-tradable goods.
In other words, the impact of economic reforms between 1986 and 1993 reduced
the need for import controls and increased the returns to export and import-substitution
activities, and deregulated private trade in food crops (liberalization in input distribution
and export marketing), thus favoring producers of tradables. After 1993, the net impact
of RER changes was to favor the producers of non-tradables, despite the acceleration
thereafter of implementation of agricultural reforms in Tanzania designed to do the
opposite and favorable price trends for Tanzania�s traditional export crops in world
markets between 1993 and 1997.
Thus macroeconomic and trade regime reform in Tanzania between 1986 and
1993, combined with increasing domestic market liberalization after 1991, stimulated
both export and food crop real prices (i.e. relative to non-agriculture) and output. After
1993, RER began to appreciate (making both imports cheaper and exports less valuable),
and by hypothesis decreasing the relative returns to tradables compared to non-tradables.
The negative effect on export crops in Tanzania was not felt until 1998, because world
commodity prices were growing until then at rates high enough to offset the effects of an
appreciating RER. After 1997, the relative incentives to produce export crops in
Tanzania declined in comparison to other goods as a steep fall in world prices reinforced
the unfavorable movements in RER since 1993. Tradable food crops such as rice and
wheat suffered real price declines after 1993, due to the effects of adverse RER
movement and declining world food prices, even as domestic production in Tanzania
12
suffered from drought in 1994 and 1995. The real prices of less tradable foods such as
cassava, beans and millet stayed high through 1995, and declined thereafter more slowly
than the more tradable foods.
4. DATA
Food price behavior and the evidence of tradability and non-tradability of
Tanzania�s main food staples are analyzed based on data from a monthly survey of 44
markets of retail food prices over the period 1983-98 collected by the Market
Development Bureau (MDB) and compiled by the Famine Early Warning System
(FEWS) project office in Dar-es-Salaam in Tanzania (MAC-FEWS, 1999). The food
retail price series were collected using a reasonable protocol and showed seasonal
fluctuations and considerable variation across a large sample of markets, as anticipated.7
The markets surveyed are listed in Table 1, along with their regional location and
approximate distance to Dar-es-Salaam (by far the largest market in Tanzania) by road or
rail. These markets are further sub-divided into 24 well-connected markets and 20
isolated markets. The well-connected markets are located on or near a rail link to Dar-
es-Salaam or Tanga (important coastal ports), or they are on or near a major all-weather
road to Dar-es-Salaam or Tanga. This classification was straightforward for
approximately four-fifths of the 44 markets, using a detailed road map and knowledge of
the country. Classification of the remaining one-fifth of the markets involved making
7 Five or six retail prices were recorded, if possible for each product twice monthly. These are then averaged into a single monthly price. Additional information for gaps or verification come from producer prices. Producer prices recorded prior to 1991 were largely official prices, and not much use here.
13
inquiries of staff of the Ministry of Agriculture and Cooperatives familiar with the
markets in question, and was necessarily more subjective. The classification principle
was reasonable year-round connectivity of the market in question to a major trunk road or
rail connection, without significant extra expense of transport from the market to a point
on the main trunk road or line-of-rail from which further transport could easily be
obtained.
Ex post, virtually all the �well-connected� markets were within 10 km of a year-
round road or rail connection, and virtually all �remote� roads were not. Seventeen of
the twenty regional capitals are classified as well-connected. Isolated markets are all
other markets included in the price data. As can be seen from Table 1, proximity to the
capital and the coast are not good indicators of isolated status, since many well-connected
markets are far from the coast and some �isolated� markets are near the coast but do not
have good transport infrastructure. Other data linked to the markets studied came from
MAC (1998), and world prices and RER components from World Bank (2000 and
preceding years).
14
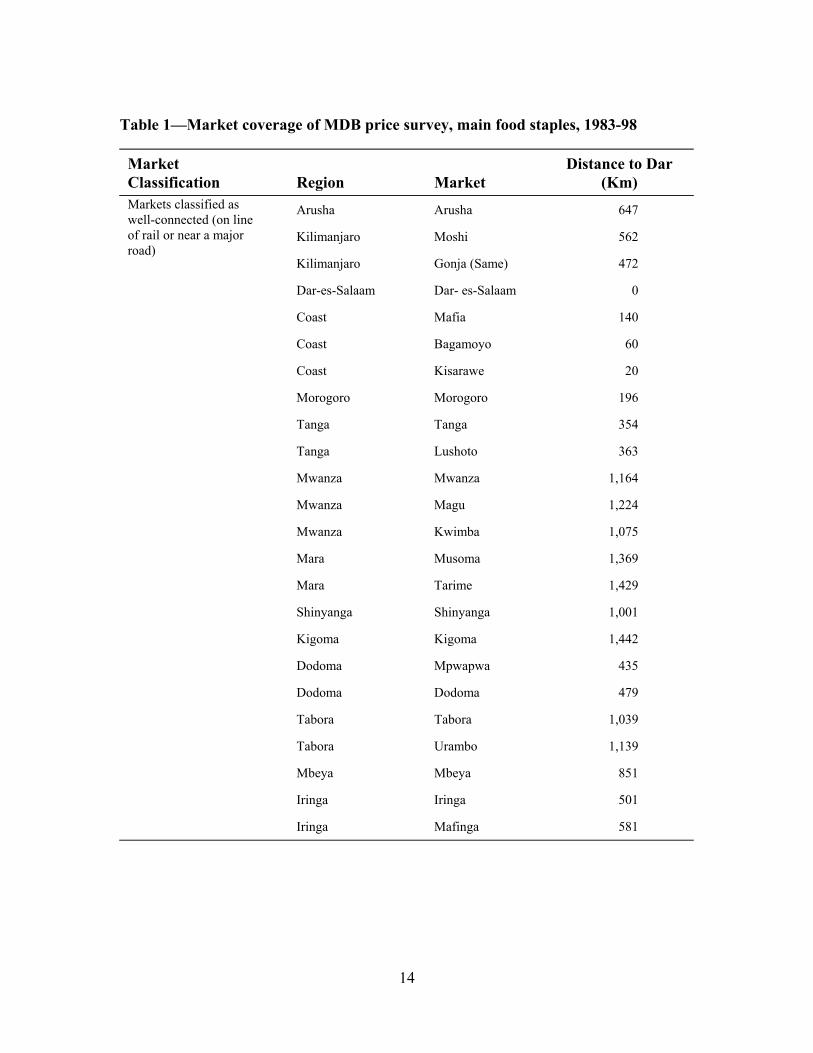
Table 1�Market coverage of MDB price survey, main food staples, 1983-98
Market Classification Region Market
Distance to Dar (Km)
Arusha Arusha 647
Kilimanjaro Moshi 562
Markets classified as well-connected (on line of rail or near a major road)
Kilimanjaro Gonja (Same) 472 Dar-es-Salaam Dar- es-Salaam 0 Coast Mafia 140 Coast Bagamoyo 60 Coast Kisarawe 20 Morogoro Morogoro 196 Tanga Tanga 354 Tanga Lushoto 363 Mwanza Mwanza 1,164 Mwanza Magu 1,224 Mwanza Kwimba 1,075 Mara Musoma 1,369 Mara Tarime 1,429 Shinyanga Shinyanga 1,001 Kigoma Kigoma 1,442 Dodoma Mpwapwa 435 Dodoma Dodoma 479 Tabora Tabora 1,039 Tabora Urambo 1,139 Mbeya Mbeya 851 Iringa Iringa 501 Iringa Mafinga 581
15
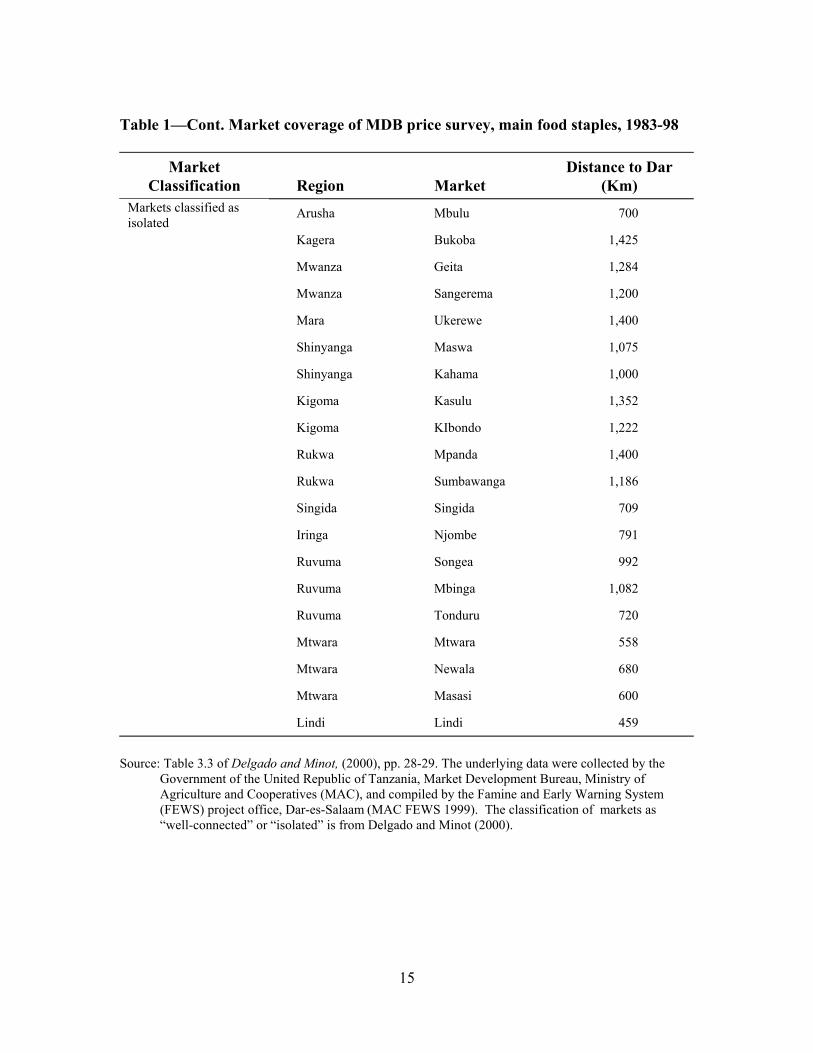
Table 1�Cont. Market coverage of MDB price survey, main food staples, 1983-98
Market Classification Region Market
Distance to Dar (Km)
Arusha Mbulu 700 Markets classified as isolated
Kagera Bukoba 1,425 Mwanza Geita 1,284 Mwanza Sangerema 1,200 Mara Ukerewe 1,400 Shinyanga Maswa 1,075 Shinyanga Kahama 1,000 Kigoma Kasulu 1,352 Kigoma KIbondo 1,222 Rukwa Mpanda 1,400 Rukwa Sumbawanga 1,186 Singida Singida 709 Iringa Njombe 791 Ruvuma Songea 992 Ruvuma Mbinga 1,082 Ruvuma Tonduru 720 Mtwara Mtwara 558 Mtwara Newala 680 Mtwara Masasi 600 Lindi Lindi 459
Source: Table 3.3 of Delgado and Minot, (2000), pp. 28-29. The underlying data were collected by the Government of the United Republic of Tanzania, Market Development Bureau, Ministry of Agriculture and Cooperatives (MAC), and compiled by the Famine and Early Warning System (FEWS) project office, Dar-es-Salaam (MAC FEWS 1999). The classification of markets as �well-connected� or �isolated� is from Delgado and Minot (2000).
16
5. APPROACH
If a staple is tradable and trade policy is not prohibitive, then movements in its
domestic price should be largely determined by movements in world prices for the good
in question and the market exchange rate, through either changes in imports (for
importables) or changes in exports (for exportables). Conversely, if the staple in question
is a non-tradable, and domestic demand is constant, then its price will be determined
primarily by the local and national supply of the good.
These assertions are tested more formally by estimating the parameters of
equation 1 by OLS regression, separately for the eight combinations of four staple crops
(wheat, rice, maize, and cassava) and two market types (well-connected and isolated, as
defined in the previous section).
The dependent variables are the monthly market-level retail prices (Pr) over the
1983 to 1998 period, deflated by monthly National Consumer Price Index for Dar-es-
Salaam (NCPI). Explanatory variables consist of twelve monthly fixed effects (Mt) to
capture seasonal patterns, a monthly time trend (Tt), monthly US export prices lagged
three months (Pxt-3), national production of the good in question from the most recent
harvest (Qnt), regional production of the good from the most recent harvest (Qrt) , and the
real exchange rate (RERt)8. All prices are adjusted to constant 1998 Tanzanian shillings
(Tsh) or US dollars.
8 Lags of 0 and 6 months were also tested. Three months gave the best fit for tradable crops, and none of the lags were statistically significant for any of the non-tradables. Ninety days is a plausible delay between order and international delivery of grain in East Africa. The continuous monthly time trend is designed to control for any secular trends in the data.
17
12
0 13 14 3 15 16 171
Prijt j j jt tj it it jt ijtj
M T Px Qn Qr RER eα α α α α α α−=
= + + + + + + +∑ (1)
where i = wheat, rice, maize, and cassava; j = month (1 to 12), t = year, the α�s are
unknown coefficients to be estimated and eijt is a random error term.
6. RESULTS AND DISCUSSION
ARE SOME STARCHY STAPLES NON-TRADABLES?
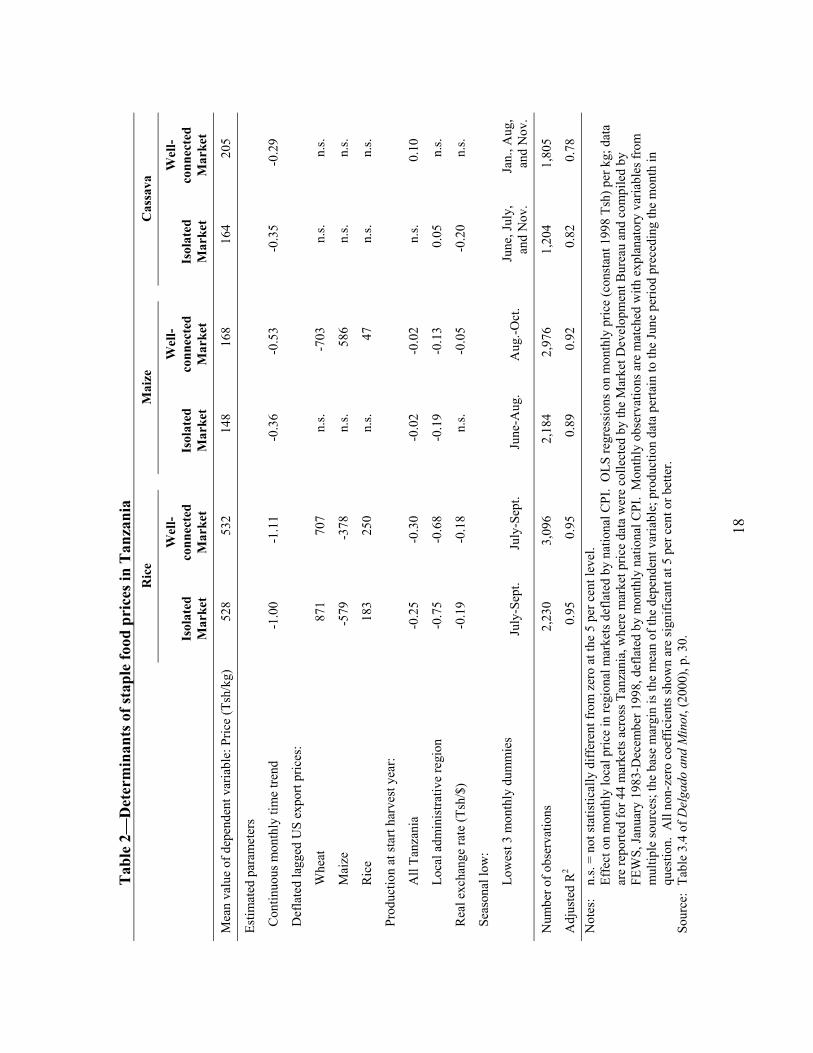
Results of the regressions are shown in Table 2. Results for the goodness-of-fit
(R2) show that this model explains 95 per cent of monthly domestic price variation for
rice over the 1983 to 1998 period in both well-connected and isolated markets. This
alone suggests that rice is largely a tradable in Tanzania, as common sense would also
suggest (Kyle and Swinnen, 1994). World rice prices have a positive influence on
Tanzanian rice prices, as would be expected. Yet local and national rice prices are also
inversely correlated with domestic rice production, as would be expected given the
importance and inland nature of much of Tanzania rice production. The latter gives a
degree of natural protection to rice in inland areas of Tanzania such as the Lake Victoria
region.
The strict interpretation of the world rice price coefficient for domestic rice prices
in isolated markets in the table is that for every US$1.00 per kg increase in world rice
prices, Tanzanian domestic prices in isolated markets will increase by Tsh 183 per kg
three months later, compared to more than Tsh 250 per kg in well-connected markets.
18
Tab
le 2
�D
eter
min
ants
of s
tapl
e fo
od p
rice
s in
Tan
zani
a
Ric
e
Mai
ze
C
assa
va
Is
olat
ed
Mar
ket
Wel
l- co
nnec
ted
Mar
ket
Is
olat
ed
Mar
ket
Wel
l- co
nnec
ted
Mar
ket
Is
olat
ed
Mar
ket
Wel
l- co
nnec
ted
Mar
ket
Mea
n va
lue
of d
epen
dent
var
iabl
e: P
rice
(Tsh
/kg)
52
8 53
2
148
168
16
4 20
5
Estim
ated
par
amet
ers
Con
tinuo
us m
onth
ly ti
me
trend
-1
.00
-1.1
1
-0.3
6 -0
.53
-0
.35
-0.2
9
Def
late
d la
gged
US
expo
rt pr
ices
:
Whe
at
871
707
n.
s. -7
03
n.
s. n.
s.
Mai
ze
-579
-3
78
n.
s. 58
6
n.s.
n.s.
Ric
e 18
3 25
0
n.s.
47
n.
s. n.
s.
Pro
duct
ion
at st
art h
arve
st y
ear:
All
Tanz
ania
-0
.25
-0.3
0
-0.0
2 -0
.02
n.
s. 0.
10
Loca
l adm
inis
trativ
e re
gion
-0
.75
-0.6
8
-0.1
9 -0
.13
0.
05
n.s.
Rea
l exc
hang
e ra
te (T
sh/$
) -0
.19
-0.1
8
n.s.
-0.0
5
-0.2
0 n.
s.
Sea
sona
l low
:
Low
est 3
mon
thly
dum
mie
s Ju
ly-S
ept.
July
-Sep
t.
June
-Aug
. A
ug.-O
ct.
Ju
ne, J
uly,
an
d N
ov.
Jan.
, Aug
, an
d N
ov.
Num
ber o
f obs
erva
tions
2,
230
3,09
6
2,18
4 2,
976
1,
204
1,80
5
Adj
uste
d R
2 0.
95
0.95
0.89
0.
92
0.
82
0.78
N
otes
: n.
s. =
not s
tatis
tical
ly d
iffer
ent f
rom
zer
o at
the
5 pe
r cen
t lev
el.
Effe
ct o
n m
onth
ly lo
cal p
rice
in re
gion
al m
arke
ts d
efla
ted
by n
atio
nal C
PI.
OLS
regr
essi
ons o
n m
onth
ly p
rice
(con
stan
t 199
8 Ts
h) p
er k
g; d
ata
are
repo
rted
for 4
4 m
arke
ts a
cros
s Tan
zani
a, w
here
mar
ket p
rice
data
wer
e co
llect
ed b
y th
e M
arke
t Dev
elop
men
t Bur
eau
and
com
pile
d by
FE
WS,
Janu
ary
1983
-Dec
embe
r 199
8, d
efla
ted
by m
onth
ly n
atio
nal C
PI.
Mon
thly
obs
erva
tions
are
mat
ched
with
exp
lana
tory
var
iabl
es fr
om
mul
tiple
sour
ces;
the
base
mar
gin
is th
e m
ean
of th
e de
pend
ent v
aria
ble;
pro
duct
ion
data
per
tain
to th
e Ju
ne p
erio
d pr
eced
ing
the
mon
th in
qu
estio
n. A
ll no
n-ze
ro c
oeff
icie
nts s
how
n ar
e si
gnifi
cant
at 5
per
cen
t or b
ette
r. So
urce
: Ta
ble
3.4
of D
elga
do a
nd M
inot
, (20
00),
p. 3
0.
19
These are equivalent to a 28 per cent pass-through rate for the world price
increase in isolated markets and a 38 per cent pass-through rate in well-connected
markets.9
World wheat and maize relative prices also have significant impact on Tanzanian
domestic rice prices. The negative coefficient on world maize prices probably stems
from maize and rice being substitutes in consumption in Tanzania, and also from how
import decisions are made. If world maize prices are low, importers and government
authorities import more maize and less rice, putting upwards pressure on domestic rice
prices.
Finally, the real exchange rate has a significant negative effect on Tanzanian rice
prices, as predicted. The higher the exchange rate (expressed as Tsh/US$), the more it
costs to import, and the more valuable import substitutes such as rice become. The
bottom line is that rice prices in Tanzania unequivocally behave as prices of a mostly
tradable good in both isolated and well-connected markets.
Maize, on the other hand, the primary food crop in the country, behaves like a
tradable in well-connected markets and like a non-tradable for isolated markets. In
isolated markets, maize prices are influenced only by regional and national production in
the most recent harvest. World prices have no statistically significant influence on maize
prices in these markets (at any lag), nor does the RER. In well-connected markets,
however, maize behaves like a tradable. A US$1.00 increase in world maize prices
translates three months later into a Tsh. 586 per kg increase in Tanzanian maize prices,
9 The average 1998 free market nominal exchange rate in 1998 was Tsh. 656 per US dollar.
20
implying a pass-through rate of about 90 per cent. Regional maize production decreases
maize prices somewhat, but much less so than in the case of isolated markets. National
maize production has hardly any impact at all in well-connected markets. The bottom
line is that maize behaves like a non-tradable in isolated markets and like a highly
tradable good in well-connected markets. Based on comparison of regional production
data with maps of population and grid infrastructure, it is roughly estimated that at least
one-quarter of all Tanzanian maize production occurs in isolated areas as defined here.10
For comparison purposes, another set of regressions was run to explain fresh
cassava prices in terms of world cereal prices, given that domestic food cassava does not
have a comparable world market counterpart. As can be seen in Table 2, fresh cassava
in both isolated and well-connected markets behaves as a non-tradable. As expected, the
goodness-of- fit of these regressions (R2) indicates that the independent variables
�explain� a smaller percentage of the variation in the dependent variable than was the
case in the regressions for tradable staples.
Although the t-tests on the own-price coefficients in these regressions are probably
sufficient to make the case for non-tradability, we also test to see whether retail food
prices in the isolated markets are driven by the same forces and in the same way as those
for well-connected markets. More specifically, we test whether the hypothesis that the
values of the coefficients in the isolated markets are the same as those in the well-
connected markets. As shown in Table 3, in the case of rice, there is no statistically
10 This is clearly a conservative estimate, since it assumes that any region that is largely served by rail or paved road infrastructure is entirely well-connected, whereas many villages and towns in such regions are not.
21
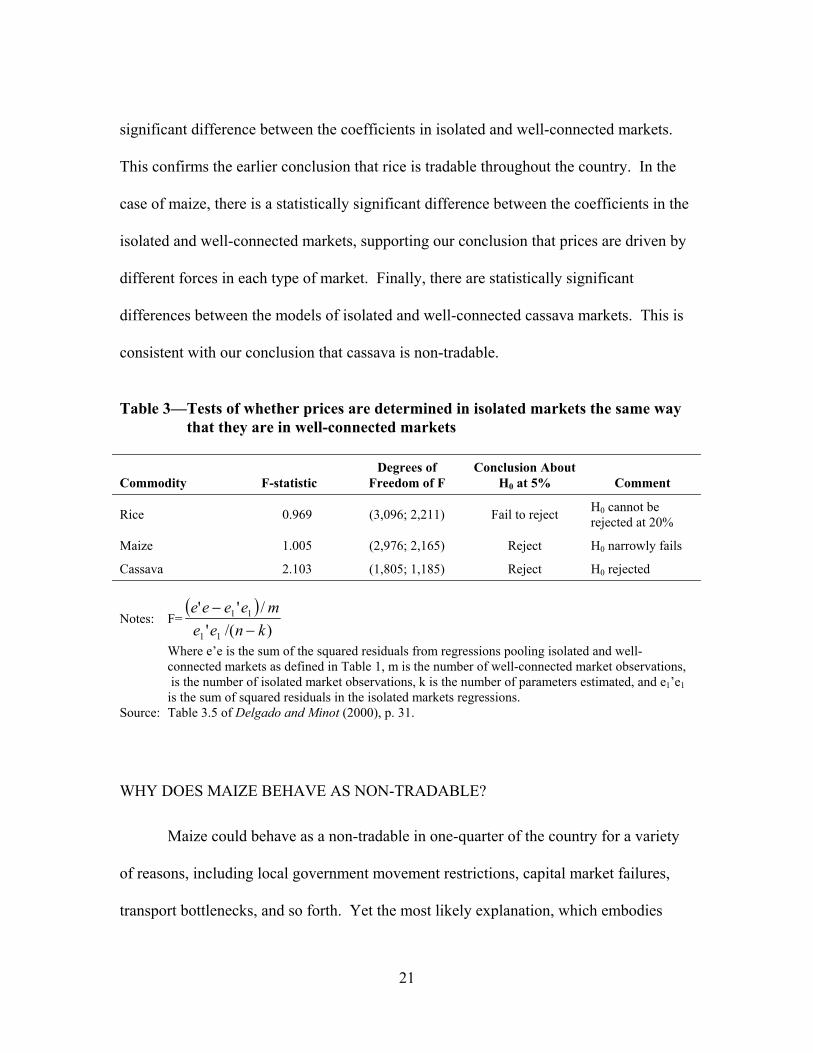
significant difference between the coefficients in isolated and well-connected markets.
This confirms the earlier conclusion that rice is tradable throughout the country. In the
case of maize, there is a statistically significant difference between the coefficients in the
isolated and well-connected markets, supporting our conclusion that prices are driven by
different forces in each type of market. Finally, there are statistically significant
differences between the models of isolated and well-connected cassava markets. This is
consistent with our conclusion that cassava is non-tradable.
Table 3�Tests of whether prices are determined in isolated markets the same way
that they are in well-connected markets
Commodity F-statistic Degrees of
Freedom of F Conclusion About
H0 at 5% Comment
Rice 0.969 (3,096; 2,211) Fail to reject H0 cannot be rejected at 20%
Maize 1.005 (2,976; 2,165) Reject H0 narrowly fails
Cassava 2.103 (1,805; 1,185) Reject H0 rejected
Notes: F=( )
)/('/''
11
11
kneemeeee
−−
Where e�e is the sum of the squared residuals from regressions pooling isolated and well-connected markets as defined in Table 1, m is the number of well-connected market observations, is the number of isolated market observations, k is the number of parameters estimated, and e1�e1 is the sum of squared residuals in the isolated markets regressions.
Source: Table 3.5 of Delgado and Minot (2000), p. 31.
WHY DOES MAIZE BEHAVE AS NON-TRADABLE?
Maize could behave as a non-tradable in one-quarter of the country for a variety
of reasons, including local government movement restrictions, capital market failures,
transport bottlenecks, and so forth. Yet the most likely explanation, which embodies
22
some of the possibilities above, is that it costs too much to move a bulky starch from A to
B, within a wide price band.
To further investigate these issues, we calculate the evolution of spreads between
food prices in different parts of the country and Dar-es-Salaam. Assuming that
wholesale-to-retail markups do not differ greatly in percentage terms across markets, the
difference in retail prices between two locations between which trade is actually
occurring is a good indicator of total marketing costs, including the trader's margin.
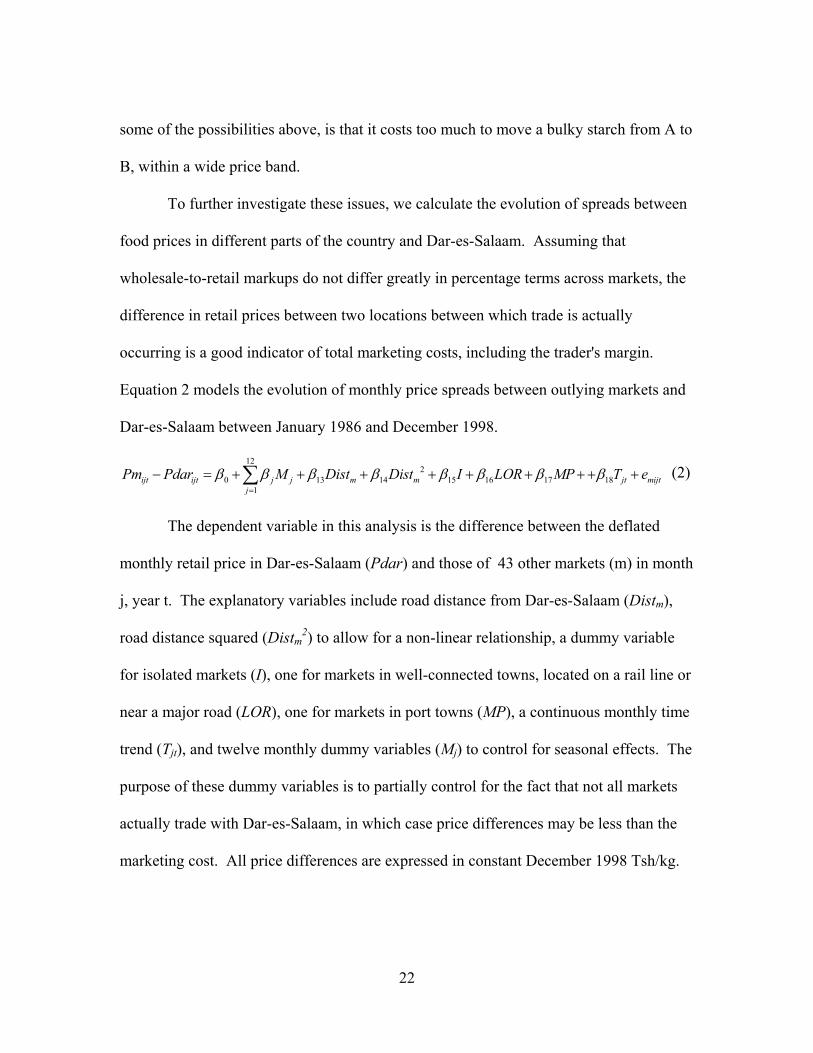
Equation 2 models the evolution of monthly price spreads between outlying markets and
Dar-es-Salaam between January 1986 and December 1998.
122
0 13 14 15 16 17 181
ijt ijt j j m m jt mijtj
Pm Pdar M Dist Dist I LOR MP T eβ β β β β β β β=
− = + + + + + + + + +∑ (2)
The dependent variable in this analysis is the difference between the deflated
monthly retail price in Dar-es-Salaam (Pdar) and those of 43 other markets (m) in month
j, year t. The explanatory variables include road distance from Dar-es-Salaam (Distm),
road distance squared (Distm2) to allow for a non-linear relationship, a dummy variable
for isolated markets (I), one for markets in well-connected towns, located on a rail line or
near a major road (LOR), one for markets in port towns (MP), a continuous monthly time
trend (Tjt), and twelve monthly dummy variables (Mj) to control for seasonal effects. The
purpose of these dummy variables is to partially control for the fact that not all markets
actually trade with Dar-es-Salaam, in which case price differences may be less than the
marketing cost. All price differences are expressed in constant December 1998 Tsh/kg.
23
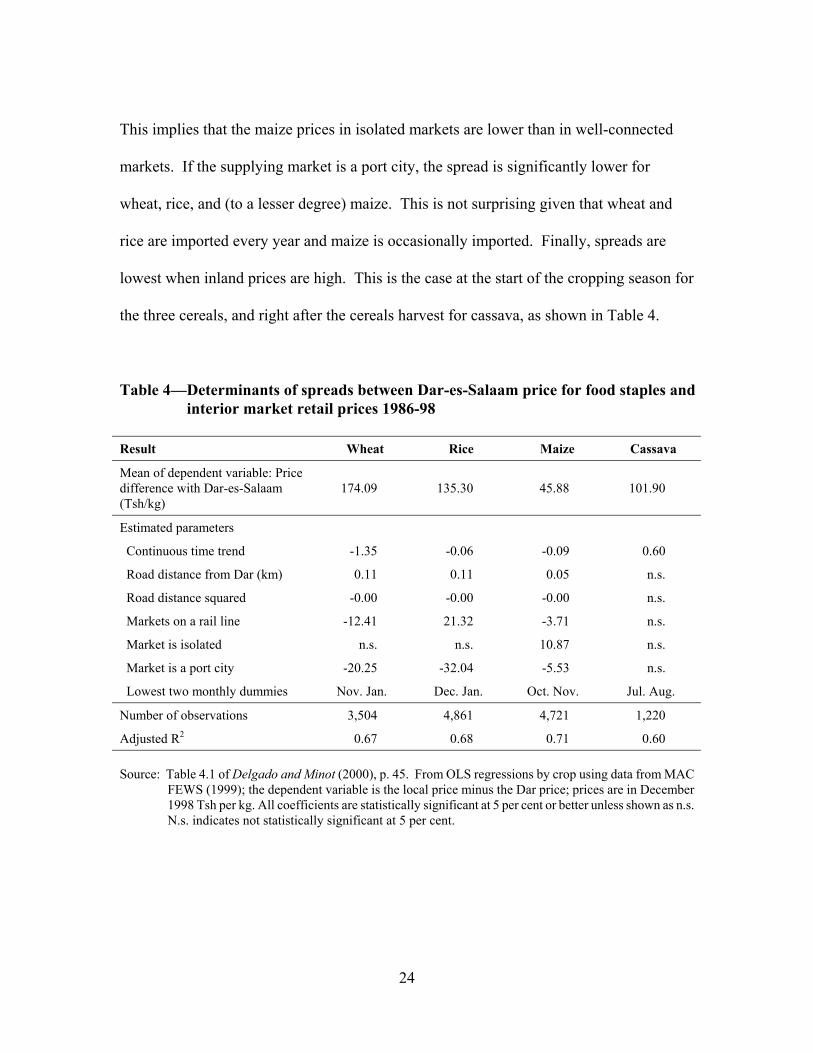
Results for wheat, rice, maize and cassava are shown in Table 4. The first row
shows the mean price spread between all markets and Dar-es-Salaam in all months over
the 1986 to 1998 period. Spreads are highest for wheat (Tsh 174) and rice (Tsh 135) and
lowest for maize (46 Tsh/kg).
The continuous time trend coefficient indicates that wheat spreads have declined
at an average monthly rate of Tsh 1.35 over the period 1986-98, while rice and maize
spreads declined moderately at about Tsh 0.06 to 0.08 per month. Cassava spreads,
which involved a smaller number of markets due to missing observations, increased
significantly over the period (0.6 Tsh/kg per month).
Distance to Dar has a positive effect on spreads for wheat rice and maize, as
expected. For rice, for example, each additional kilometer from Dar-es-Salaam adds 0.11
Tsh/kg to the spread (or US$0.16 per ton/km)11. The presence of statistically significant
but very small negative coefficients for distance squared is interpreted as evidence of
economies of scale in transport as distance increases, as expected.
If a market is on line of rail or on a major road, other things being equal, the
spread for wheat and maize will be reduced by 12 Tsh/kg and 4 Tsh/kg, respectively.
However, well-connected markets have a significantly higher spread for rice. This
implies that they have lower rice prices, perhaps because the main rice producing regions
of the country are all on railroads. If a market is isolated, the spread increases
significantly for maize by 11 Tsh/kg, but is not significant for wheat, rice and cassava.
11 Given adjustment for being on the line of rail, which controls for the fact that Tanzania�s rice producing regions are inland around Lake Victoria, yet well-connected to other points on the line of rail.
24
This implies that the maize prices in isolated markets are lower than in well-connected
markets. If the supplying market is a port city, the spread is significantly lower for
wheat, rice, and (to a lesser degree) maize. This is not surprising given that wheat and
rice are imported every year and maize is occasionally imported. Finally, spreads are
lowest when inland prices are high. This is the case at the start of the cropping season for
the three cereals, and right after the cereals harvest for cassava, as shown in Table 4.
Table 4�Determinants of spreads between Dar-es-Salaam price for food staples and
interior market retail prices 1986-98 Result Wheat Rice Maize Cassava
Mean of dependent variable: Price difference with Dar-es-Salaam (Tsh/kg)
174.09 135.30 45.88 101.90
Estimated parameters
Continuous time trend -1.35 -0.06 -0.09 0.60
Road distance from Dar (km) 0.11 0.11 0.05 n.s.
Road distance squared -0.00 -0.00 -0.00 n.s.
Markets on a rail line -12.41 21.32 -3.71 n.s.
Market is isolated n.s. n.s. 10.87 n.s.
Market is a port city -20.25 -32.04 -5.53 n.s.
Lowest two monthly dummies Nov. Jan. Dec. Jan. Oct. Nov. Jul. Aug.
Number of observations 3,504 4,861 4,721 1,220
Adjusted R2 0.67 0.68 0.71 0.60 Source: Table 4.1 of Delgado and Minot (2000), p. 45. From OLS regressions by crop using data from MAC
FEWS (1999); the dependent variable is the local price minus the Dar price; prices are in December 1998 Tsh per kg. All coefficients are statistically significant at 5 per cent or better unless shown as n.s. N.s. indicates not statistically significant at 5 per cent.
25
7. CONCLUSIONS
There is solid evidence from both point studies and broad-based statistically-
significant trends that absolute spatial marketing margins are still quite high in Tanzania.
This, combined with occasional prohibitions on cross-border trade, is a fundamental
reason why a quarter of the country's maize supply was seen to behave as a non-tradable
crop. Market-mediated structural reforms will continue to be difficult to implement until
spatial marketing margins can be brought down further, through infrastructure
improvements and rural transportation policies that reduce transportation costs.
If at least a quarter of locally produced food staple supplies behave as non-
tradables, certain simplifying assumptions of conventional economic theory for open
economies no longer hold. Instead, parts of Tanzania should be considered what Myint
(1975) called the "semi-open" economy, where competitiveness of exports matters to
overall growth (as in open economies), but where the competitiveness of tradable sectors
generally also depends on what is exogenously occurring in the non-tradable sectors (as
in closed economies) (Myint, 1975; Delgado, 1992; Delgado, Hopkins and Kelly, 1998).
In the purely open economy, producers should follow their comparative advantage in
production and trade for their preferred consumer goods (such as food). Thus, production
and consumption decisions are separate. Resources can appropriately be concentrated in
specialized growth poles (such as cash cropping zones or urban light manufacturing,
depending on comparative advantage) that will pull everyone else along.
26
In the semi-open economy, however, there is a need for balance between the
tradable and non-tradable sectors, as in closed economies. This is fundamentally because
producers consume significant amounts of non-tradable items (such as food staples) with
additional income earned from exports. If the production of these non-tradable consumer
items, sometimes called "wages-goods", is inelastic in the short to medium run, their
prices will be bid up relative to the prices of tradables.12 For example, an export boom
will rapidly increase local demand for food. If food is non-tradable and inelastic in
supply, this will increase the price of food, leading to increased wage demands as
workers try to protect their standard of living. Higher wages will choke off the export
expansion. Under these circumstances, lack of production growth in the non-tradable
staple food sector will choke off export gains made possible by structural adjustment
reforms.
Exogenous shocks such as drought will also lead to price spikes for non-tradable
food staples, a common occurrence in Africa (Delgado, 1992). Even if under-used land
and labor are available, it takes another year at least before local production can recover.
On the other hand, non-tradability suggests that local production is primarily demand-
constrained over the longer-run, consistent with the probability that local resources are
not fully employed where these commodities are important in production. It is also
consistent with a high long-term price elasticity of supply. In Tanzania, maize�s short-
12 So called because they are the physical counterparts to returns to labor in low income societies where most income is spend on staples.
27
run supply elasticity has been estimated at 0.25 and the long-run supply elasticity at 1.96
(Delgado and Minot, 2000).
Finding ways to further stimulate tradables in those regions where much of the
food supply is non-tradable will have multiplier impacts on aggregate agricultural output
provided that: (a) unused productive resources are available to be brought into production
by new opportunities; and (b) the stimulus from the growth in tradables is widely
distributed to people who want to buy the non-tradable goods that the previously
underemployed resources are capable of producing, such as traditional food staples
(Mellor, 1966; Delgado, Hopkins and Kelly, 1998).
In coastal urban areas and those areas where food is fully tradable, commercially
viable imports of cereals can avert harmful price spikes because of economies of
agglomeration and of lower transport costs to the outside world. In cash crop zones
where food is non-tradable, subsidized food aid can temporarily help keep food prices
lower than they would be otherwise. Besides the dominant humanitarian motive, this has
the additional benefit of protecting the livelihoods of numerous small-scale farmers who
depend on slim profit margins in non-food tradable-good activities that in most years are
more remunerative than growing food staples, and rely at least in part on purchased food.
It is also beneficial to larger farms whose primary cost of production is the cost of labor,
highly correlated with the cost of food. However, a viable long-run growth strategy will
require developing the food sector to the point that a growing supply at a relatively stable
price is ensured, whether from technological change in own production or cheaper
commercial imports through improved infrastructure, or a mix of the two.
28
Significant supply shocks for food, as happened in 2000-02 in much of Southern
Africa well after the period of analysis of this paper, can raise the relative price of food
so high that a non-tradable becomes an exportable in areas still capable of producing
food. This appears to have been the case in Rukwa, one of the �isolated� areas of
Tanzania referred to above.13 In such cases, a demand shock outside the immediate area
has been so large as to resolve demand constraints, yet it remains to be seen if this
tradability can be sustained in the long-term. Similarly, investment in infrastructure will
surely turn non-tradables into tradables over time. The question remains as to the
cost/benefit calculation and what to do for zones where food supply is non-tradable in the
meantime. The prescriptions for getting agriculture moving in fully tradable areas still
apply, but there is the added problem of pro-actively promoting outlets for the demand-
constrained non-tradables that local resources are capable of producing in larger amounts.
13 We are indebted to an anonymous reviewer for this point.
29
REFERENCES
Delgado, C. 1992. �Why Domestic Food Prices Matter to Growth Strategy in Semi-open West African Agriculture�, Journal of African Economies 1(November): 446-471.
Delgado, C. and N. Minot. 2000. Agriculture in Tanzania Since 1986: Follower or Leader of Growth? Washington, D.C.: A World Bank Country Study, 167 pp.
Delgado, C., J. Hopkins and V. Kelly. 1998. Agricultural Growth Linkages in Sub-
Saharan Africa, Washington, D.C.: IFPRI Research Report No. 107. 139pp. Kherallah, M., C. Delgado, E. Gabre-Madhin, N. Minot and M. Johnson. 2002.
Reforming Agricultural Markets in Africa, Baltimore, MD and Washington, D.C.: Johns Hopkins University Press for the International Food Policy Research Institute, 201 pp.
Kyle, S. C., and J. Swinnen. 1994. �The Theory of Contested Markets and the Degree of
Tradedness of Agricultural Commodities: An Empirical Test in Zaire�, Journal of African Economies 3(April):93-113.
Lamb, R.L. 2000. �Food Crops, Exports, and the Short-run Policy Response of
Agriculture in Africa.� Agricultural Economics 22(April): 271-298. MAC (Ministry of Agriculture and Cooperatives of the Government of the United
Republic of Tanzania). 1998. Basic Data: Agriculture and Livestock Sector 1991/92-1997/98. Dar-es-Salaam, Tanzania.
MAC FEWS (Ministry of Agriculture and Cooperatives of the Government of the United
Republic of Tanzania and USAID Famine Early Warning System). 1999. Wholesale Price Meta Data, Dar-es-Salaam, Tanzania.
Mellor, J. W. 1966. The Economics of Agricultural Development, Ithaca, N.Y.: Cornell
University Press. Myint, H. 1975. �Agriculture and Economic Development in the Open Economy�, in
L.G. Reynolds, ed. Agriculture in Development Theory, New Haven: Yale University Press.
World Bank. 1981. Accelerated Development in Sub-Saharan Africa: An Agenda for
Action�, Washington, D.C.: World Bank. 198pp. World Bank, various years, World Development Indicators, Washington, D.C.: World
Bank.

30
Townsend, R.F. 1999. Agricultural Incentives in Sub-Saharan Africa, Washington, D.C.: World Bank Technical Paper No. 444. 191pp.
31
MTID DISCUSSION PAPERS 1. Foodgrain Market Integration Under Market Reforms in Egypt, May 1994 by
Francesco Goletti, Ousmane Badiane, and Jayashree Sil.
2. Agricultural Market Reforms in Egypt: Initial Adjustments in Local Output Markets, November 1994 by Ousmane Badiane.
3. Agricultural Market Reforms in Egypt: Initial Adjustments in Local Input
Markets, November 1994 by Francesco Goletti. 4. Agricultural Input Market Reforms: A Review of Selected Literature, June 1995
by Francesco Goletti and Anna Alfano. 5. The Development of Maize Seed Markets in Sub-Saharan Africa, September 1995
by Joseph Rusike. 6. Methods for Agricultural Input Market Reform Research: A Tool Kit of
Techniques, December 1995 by Francesco Goletti and Kumaresan Govindan. 7. Agricultural Transformation: The Key to Broad Based Growth and Poverty
Alleviation in Sub-Saharan Africa, December 1995 by Christopher Delgado. 8. The Impact of the CFA Devaluation on Cereal Markets in Selected CMA/WCA
Member Countries, February 1996 by Ousmane Badiane. 9. Smallholder Dairying Under Transactions Costs in East Africa, December 1996
by Steven Staal, Christopher Delgado, and Charles Nicholson. 10. Reforming and Promoting Local Agricultural Markets: A Research Approach,
February 1997 by Ousmane Badiane and Ernst-August Nuppenau. 11. Market Integration and the Long Run Adjustment of Local Markets to Changes in
Trade and Exchange Rate Regimes: Options For Market Reform and Promotion Policies, February 1997 by Ousmane Badiane.
12. The Response of Local Maize Prices to the 1983 Currency Devaluation in Ghana,
February 1997 by Ousmane Badiane and Gerald E. Shively.
32
MTID DISCUSSION PAPERS
13. The Sequencing of Agricultural Market Reforms in Malawi, February 1997 by Mylène
Kherallah and Kumaresan Govindan. 14. Rice Markets, Agricultural Growth, and Policy Options in Vietnam, April 1997
by Francesco Goletti and Nicholas Minot. 15. Marketing Constraints on Rice Exports from Vietnam, June 1997 by Francesco
Goletti, Nicholas Minot, and Philippe Berry. 16. A Sluggish Demand Could be as Potent as Technological Progress in Creating
Surplus in Staple Production: The Case of Bangladesh, June 1997 by Raisuddin Ahmed.
17. Liberalisation et Competitivite de la Filiere Arachidiere au Senegal, October
1997 by Ousmane Badiane. 18. Changing Fish Trade and Demand Patterns in Developing Countries and Their
Significance for Policy Research, October 1997 by Christopher Delgado and Claude Courbois.
19. The Impact of Livestock and Fisheries on Food Availability and Demand in 2020,
October 1997 by Christopher Delgado, Pierre Crosson, and Claude Courbois. 20. Rural Economy and Farm Income Diversification in Developing Countries,
October 1997 by Christopher Delgado and Ammar Siamwalla. 21. Global Food Demand and the Contribution of Livestock as We Enter the New
Millenium, February 1998 by Christopher L. Delgado, Claude B. Courbois, and Mark W. Rosegrant.
22. Marketing Policy Reform and Competitiveness: Why Integration and Arbitrage
Costs Matter, March 1998 by Ousmane Badiane. 23. Returns to Social Capital among Traders, July 1998 by Marcel Fafchamps and
Bart Minten. 24. Relationships and Traders in Madagascar, July 1998 by M. Fafchamps and B.
Minten.
33
MTID DISCUSSION PAPERS 25. Generating Disaggregated Poverty Maps: An application to Viet Nam, October
1998 by Nicholas Minot. 26. Infrastructure, Market Access, and Agricultural Prices: Evidence from
Madagascar, March 1999 by Bart Minten. 27. Property Rights in a Flea Market Economy, March 1999 by Marcel Fafchamps
and Bart Minten. 28. The Growing Place of Livestock Products in World Food in the Twenty-First
Century, March 1999 by Christopher L. Delgado, Mark W. Rosegrant, Henning Steinfeld, Simeon Ehui, and Claude Courbois.
29. The Impact of Postharvest Research, April 1999 by Francesco Goletti and
Christiane Wolff. 30. Agricultural Diversification and Rural Industrialization as a Strategy for Rural
Income Growth and Poverty Reduction in Indochina and Myanmar, June 1999 by Francesco Goletti.
31. Transaction Costs and Market Institutions: Grain Brokers in Ethiopia, October
1999 by Eleni Z. Gabre-Madhin. 32. Adjustment of Wheat Production to Market reform in Egypt, October 1999 by
Mylene Kherallah, Nicholas Minot and Peter Gruhn. 33. Rural Growth Linkages in the Eastern Cape Province of South Africa, October
1999 by Simphiwe Ngqangweni. 34. Accelerating Africa�s Structural Transformation: Lessons from East Asia,
October 1999, by Eleni Z. Gabre-Madhin and Bruce F. Johnston. 35. Agroindustrialization Through Institutional Innovation: Transactions Costs,
Cooperatives and Milk-Market Development in the Ethiopian Highlands, November 1999 by Garth Holloway, Charles Nicholson, Christopher Delgado, Steven Staal and Simeon Ehui.
36. Effect of Transaction Costs on Supply Response and Marketed Surplus:
Simulations Using Non-Separable Household Models, October 1999 by Nicholas Minot.
34
MTID DISCUSSION PAPERS
37. An Empirical Investigation of Short and Long-run Agricultural Wage Formation
in Ghana, November 1999 by Awudu Abdulai and Christopher Delgado. 38. Economy-Wide Impacts of Technological Change in the Agro-food Production
and Processing Sectors in Sub-Saharan Africa, November 1999 by Simeon Ehui and Christopher Delgado.
39. Of Markets and Middlemen: The Role of Brokers in Ethiopia, November 1999 by
Eleni Z. Gabre-Madhin. 40. Fertilizer Market Reform and the Determinants of Fertilizer Use in Benin and
Malawi, October 2000 by Nicholas Minot, Mylene Kherallah, Philippe Berry. 41. The New Institutional Economics: Applications for Agricultural Policy Research
in Developing Countries, June 2001 by Mylene Kherallah and Johann Kirsten. 42. The Spatial Distribution of Poverty in Vietnam and the Potential for Targeting,
March 2002 by Nicholas Minot and Bob Baulch. 43. Bumper Crops, Producer Incentives and Persistent Poverty: Implications for
Food Aid Programs in Bangladesh, March 2002 by Paul Dorosh, Quazi Shahabuddin, M. Abdul Aziz and Naser Farid.
44. Dynamics of Agricultural Wage and Rice Price in Bangladesh: A Re-
examination, March 2002 by Shahidur Rashid. 45. Micro Lending for Small Farmers in Bangladesh: Does it Affect Farm
Households� Land Allocation Decision?, September 2002 by Shahidur Rashid, Manohar Sharma, and Manfred Zeller.
46. Rice Price Stabilization in Bangladesh: An Analysis of Policy Options, October
2002 by Paul Dorosh and Quazi Shahabuddin 47. Comparative Advantage in Bangladesh Crop Production, October 2002 by Quazi
Shahabuddin and Paul Dorosh. 48. Impact of Global Cotton Markets on Rural Poverty in Benin, November 2002 by
Nicholas Minot and Lisa Daniels.
35
MTID DISCUSSION PAPERS
49. Poverty Mapping with Aggregate Census Data: What is the Loss in Precision?
November 2002 by Nicholas Minot and Bob Baulch.
50. Globalization and the Smallholders: A Review of Issues, Approaches, and Implications, November 2002 by Sudha Narayanan and Ashok Gulati.
51. Rice Trade Liberalization and Poverty, November 2002 by Ashok Gulati and
Sudha Narayanan.
52. Fish as Food: Projections to 2020 Under Different Scenarios, December 2002 by Christopher Delgado, Mark Rosegrant, Nikolas Wada, Siet Meijer, and Mahfuzuddin Ahmed.
53. Successes in African Agriculture: Results of an Expert Survey. January 2003 by
Eleni Z. Gabre-Madhin and Steven Haggblade. 54. Demand Projections for Poultry Products and Poultry Feeds in Bangladesh,
January 2003 by Nabiul Islam. 55. Implications of Quality Deterioration for Public Foodgrain Stock Management
and Consumers in Bangladesh, January 2003 by Paul A. Dorosh and Naser Farid.
56. Transactions Costs and Agricultural Productivity: Implications fo Isolation for Rural Poverty in Madagascar, February 2003 by David Stifel, Bart Minten, and Paul Dorosh.
57. Agriculture Diversification in South Asia: Patterns, Determinants, and Policy
Implications, February 2003 by P.K. Joshi, Ashok Gulati, Pratap S. Birthal, and Laxmi Tewari.
58. Innovations in Irrigation Financing: Tapping Domestic Financial Markets in
India, February 2003 by K.V. Raju, Ashok Gulati and Ruth Meinzen-Dick. 59. Livestock Intensification and Smallholders: A Rapid Reconnaisance of the
Philippines Hog and Poultry Sectors, April 2003 by Agnes Rola, Walfredo Rola, Marites Tiongco, and Christopher Delgado.
60. Increasing Returns and Market Efficiency in Agriculture Trade, April 2003 by
Marcel Fafchamps, Eleni Gabre-Madhin and Bart Minten.
36
MTID DISCUSSION PAPERS
61. Trade Liberalization, Market Reforms and Competitiveness of Indian Dairy
Sector, April 2003 by Vijay Paul Sharma and Ashok Gulati.
62. Technological Change and Price Effects in Agriculture: Conceptual and Comparative Perspective, April 2003 by Eleni Gabre-Madhin, Christopher B. Barrett, and Paul Dorosh.
63. Analyzing Grain Market Efficiency in Developing Countries: Review of Existing Methods and Extensions to the Parity Bounds Model, September 2003 by Asfaw Negassa, Robert Myers and Eleni Gabre-Madhin.
64. Effects of Tariffs and Sanitary Barriers on High- and Low-Value Poultry Trade, February 2004 by Everett B. Peterson and David Orden.
65. Regionalism: Old and New, Theory and Practice, February 2004 by Mary E.
Burfisher, Sherman Robinson, and Karen Thierfelder. 66. Grain Marketing Policy Changes and Spatial Efficiency of Maize and Wheat
Markets in Ethiopia, February 2004 by Asfaw Negaassa, Robert Myers and Eleni Gabre Madhin.
67. Achieving Food Security in a Cost Effective Way: Implications of Domestic
Deregulation and Reform under Liberalized Trade, May 2004 by Shikha Jha and P.V. Srinivasan.
68. Economic Liberalisation, Targeted Programmes and Household Food Security: A
Case Study of India, May 2004 by S. Mahendra Dev, C. Ravi, Brinda Viswanathan, Ashok Gulati, and Sangamitra Ramachander.
69. Managing Price Volatility in an Open Economy Environment: The Case of Edible
Oils and Oilseeds in India, May 2004 by P.V. Srinivasan. 70. Impacts of Trade Liberalization and Market Reforms on the Paddy/rice Sector in
Sri Lanka, May 2004 by Jeevika Weerahewa.
71. Spatial Integration of Maize Markets in Post-Liberalized Uganda, May 2004 by Shahidur Rashid.