Embed Size (px)
Citation preview
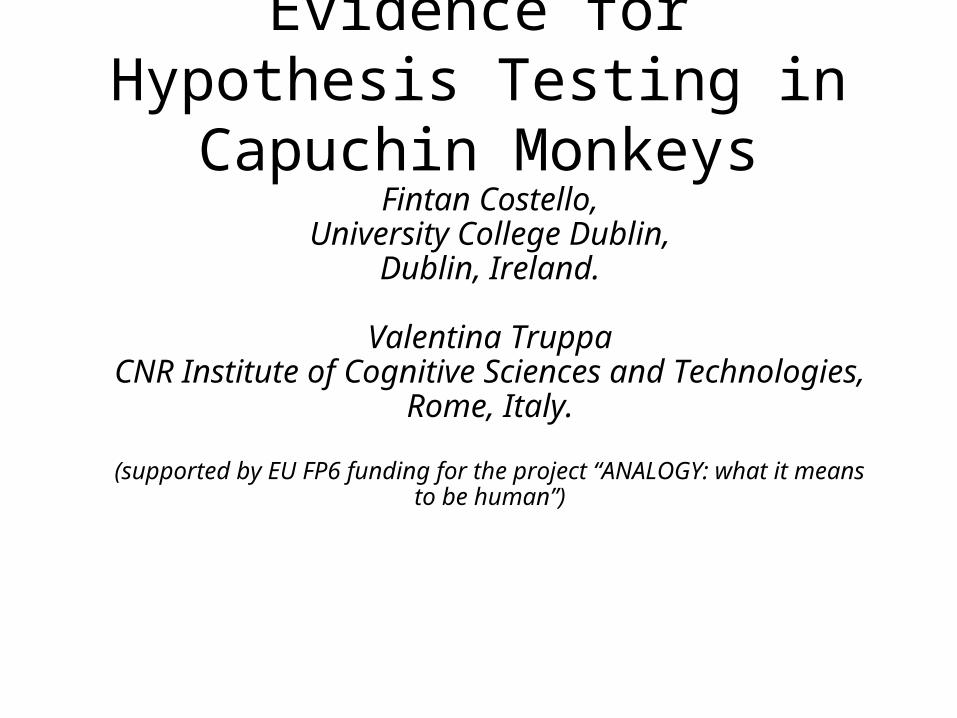
Evidence for Hypothesis Testing in Capuchin Monkeys
Fintan Costello,University College Dublin,
Dublin, Ireland.
Valentina TruppaCNR Institute of Cognitive Sciences and
Technologies,Rome, Italy.
(supported by EU FP6 funding for the project “ANALOGY: what it means to be human”)
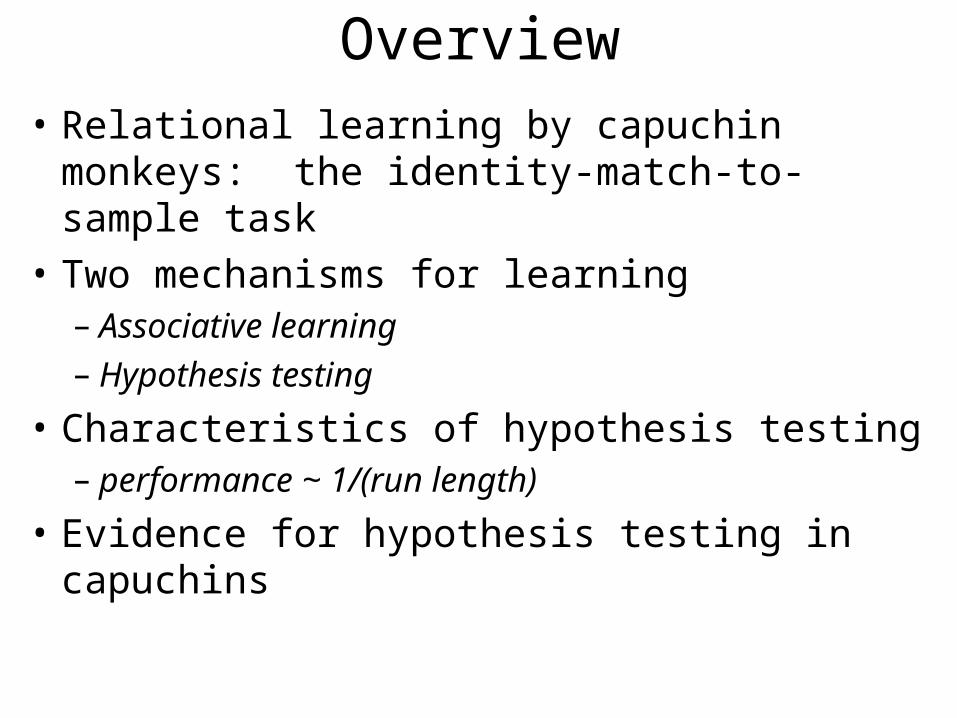
Overview• Relational learning by capuchin monkeys:
the identity-match-to-sample task
• Two mechanisms for learning– Associative learning– Hypothesis testing
• Characteristics of hypothesis testing– performance ~ 1/(run length)
• Evidence for hypothesis testing in capuchins
rewardNo rewardrewardNo reward
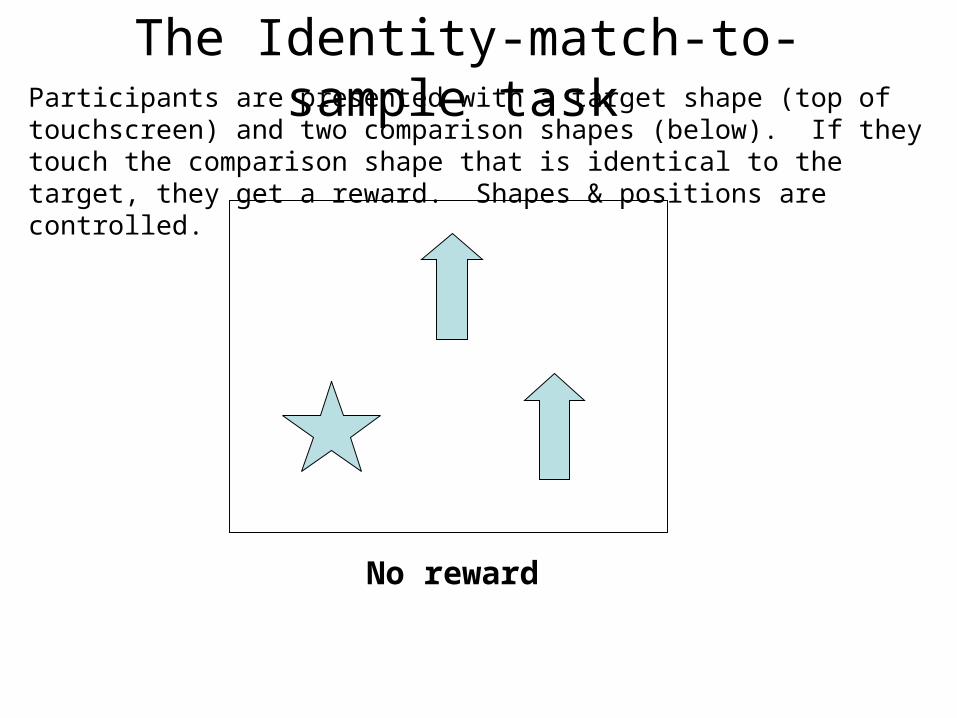
The Identity-match-to-sample task Participants are presented with a target shape (top of touchscreen) and two comparison shapes (below). If they touch the comparison shape that is identical to the target, they get a reward. Shapes & positions are controlled.
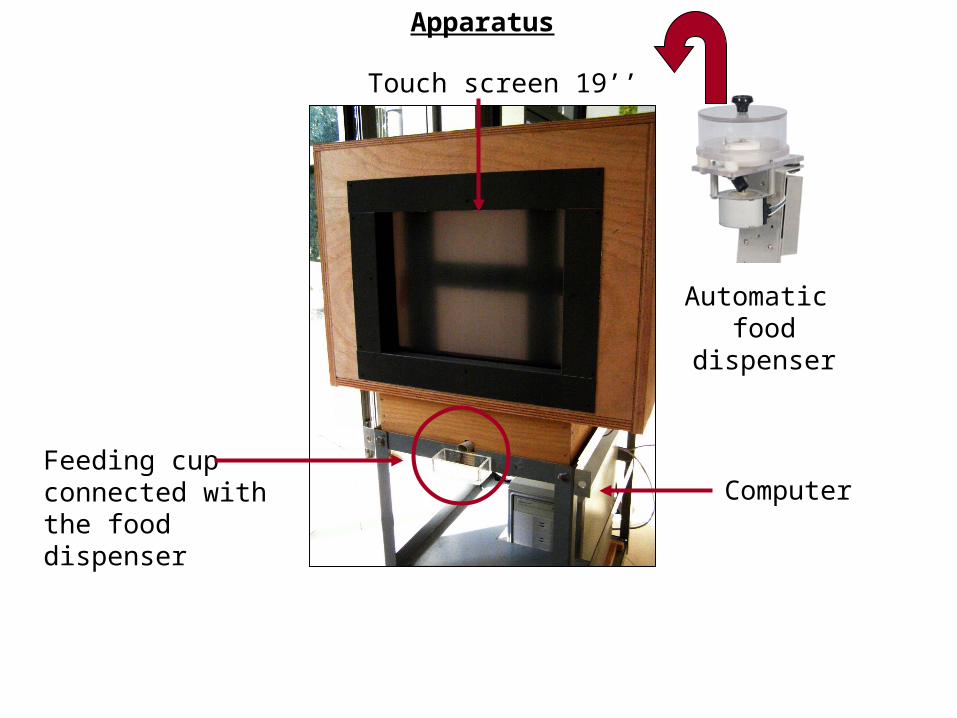
Touch screen 19’’
Feeding cup connected withthe food dispenser
Computer
Automatic food dispenser
Apparatus
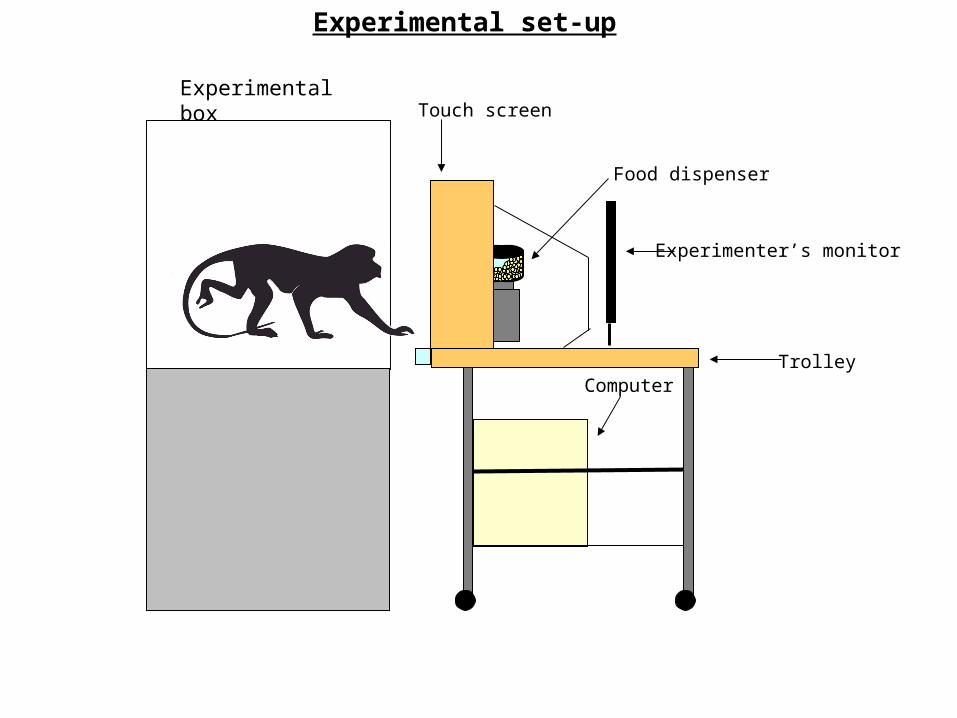
Experimental set-up
Experimental boxTouch screen
Food dispenser
ComputerTrolley
Experimenter’s monitor
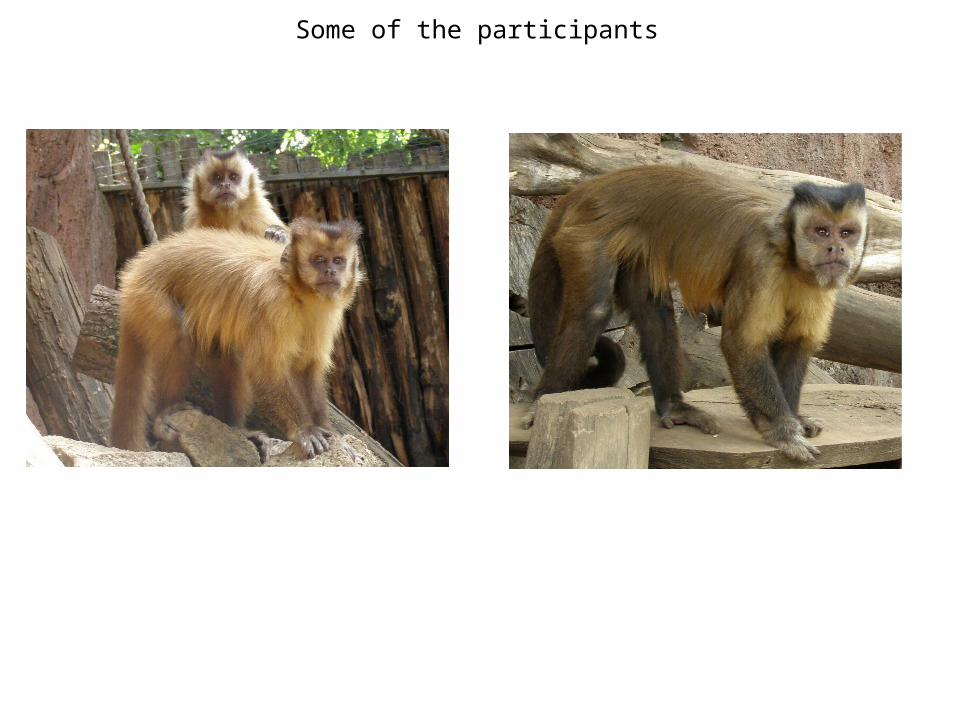
Some of the participants
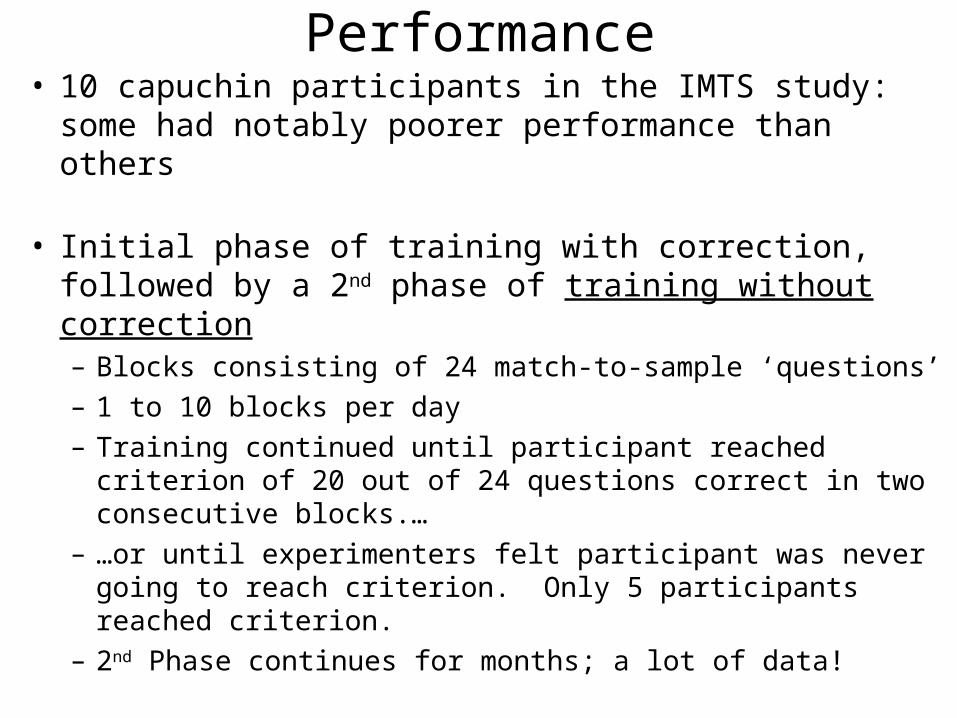
Performance• 10 capuchin participants in the IMTS study: some
had notably poorer performance than others
• Initial phase of training with correction, followed by a 2nd phase of training without correction– Blocks consisting of 24 match-to-sample ‘questions’– 1 to 10 blocks per day– Training continued until participant reached criterion of 20
out of 24 questions correct in two consecutive blocks.…– …or until experimenters felt participant was never going to
reach criterion. Only 5 participants reached criterion.– 2nd Phase continues for months; a lot of data!
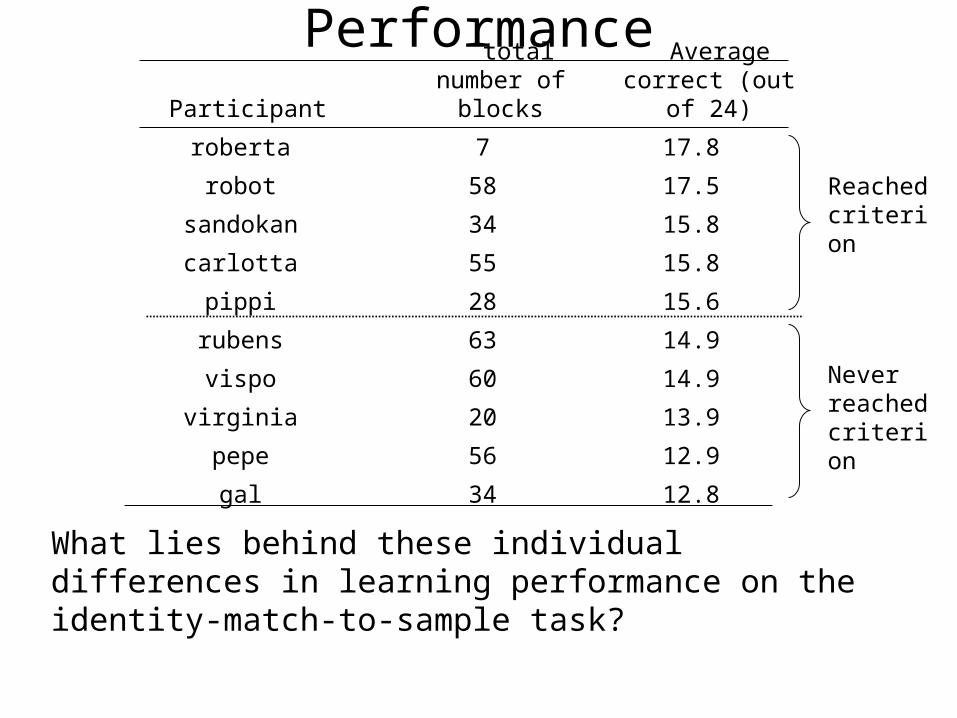
PerformanceParticipant
total number of blocks
Average correct (out of 24)
roberta 7 17.8
robot 58 17.5
sandokan 34 15.8
carlotta 55 15.8
pippi 28 15.6
rubens 63 14.9
vispo 60 14.9
virginia 20 13.9
pepe 56 12.9
gal 34 12.8
Never reached criterion
Reached criterion
What lies behind these individual differences in learning performance on the identity-match-to-sample task?
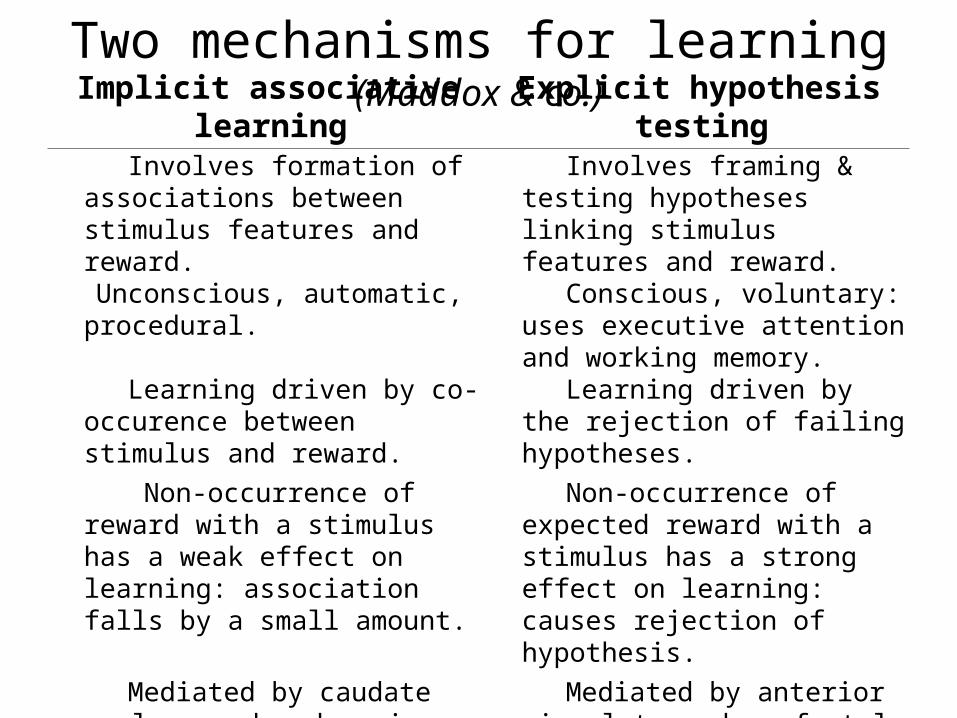
Implicit associative learning Explicit hypothesis testing Involves formation of associations
between stimulus features and reward.
Involves framing & testing hypotheses linking stimulus features and reward.
Unconscious, automatic, procedural. Conscious, voluntary: uses executive attention and working memory.
Learning driven by co-occurence between stimulus and reward.
Learning driven by the rejection of failing hypotheses.
Non-occurrence of reward with a stimulus has a weak effect on learning: association falls by a small amount.
Non-occurrence of expected reward with a stimulus has a strong effect on learning: causes rejection of hypothesis.
Mediated by caudate nucleus and a dopamine-based reward signal.
Mediated by anterior cingulate and prefontal cortex.
General learning mechanism, occurring in all species.
Often seen as specifically human, requiring language to state hypotheses.
Two mechanisms for learning (Maddox & co.)
controlling and equating for performance across blocks.
controlling and equating for performance across blocks.
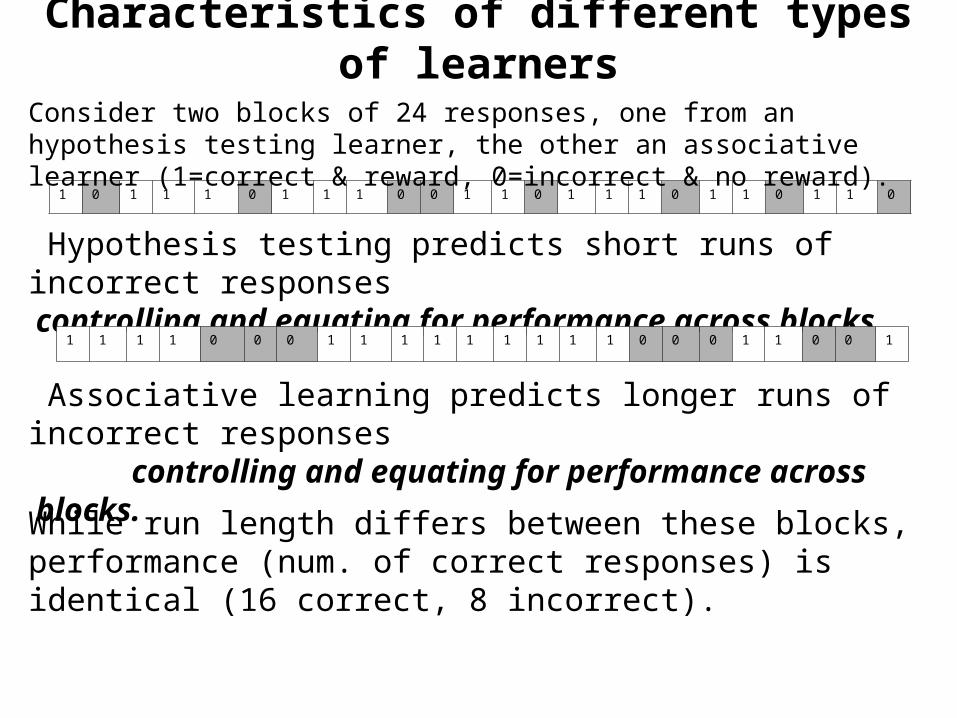
Characteristics of different types of learners
1 0 1 1 1 0 1 1 1 0 0 1 1 0 1 1 1 0 1 1 0 1 1 0
Consider two blocks of 24 responses, one from an hypothesis testing learner, the other an associative learner (1=correct & reward, 0=incorrect & no reward).
1 1 1 1 0 0 0 1 1 1 1 1 1 1 1 1 0 0 0 1 1 0 0 1
Hypothesis testing predicts short runs of incorrect responses
Associative learning predicts longer runs of incorrect responses
While run length differs between these blocks, performance (num. of correct responses) is identical (16 correct, 8 incorrect).
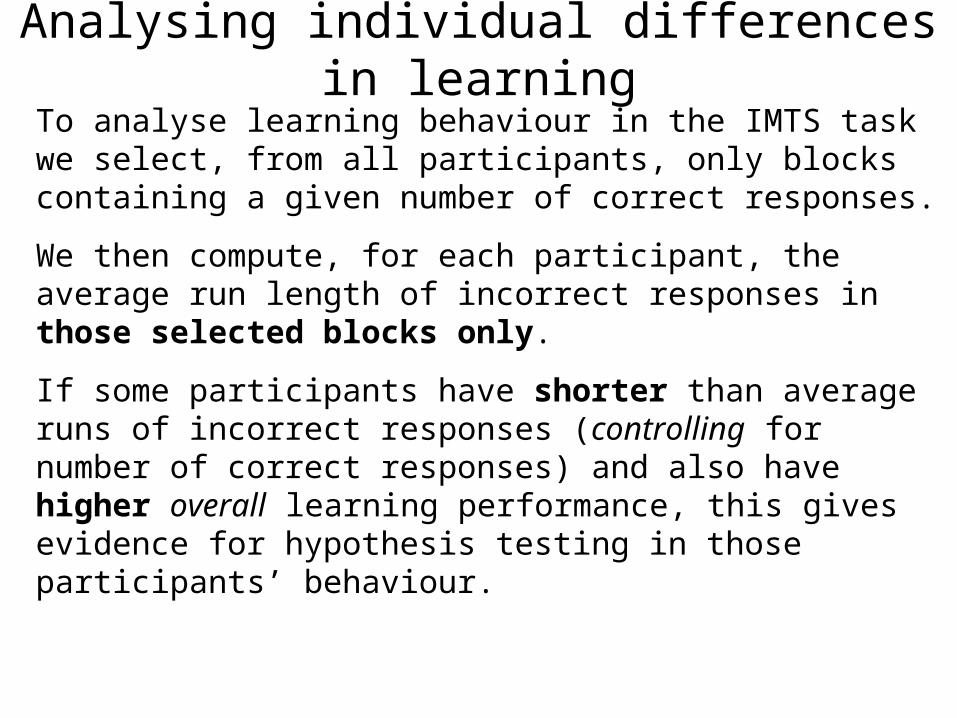
Analysing individual differences in learningTo analyse learning behaviour in the IMTS task we select, from all participants, only blocks containing a given number of correct responses.
We then compute, for each participant, the average run length of incorrect responses in those selected blocks only.
If some participants have shorter than average runs of incorrect responses (controlling for number of correct responses) and also have higher overall learning performance, this gives evidence for hypothesis testing in those participants’ behaviour.
1.2
1.3
1.4
1.5
1.6
1.7
1.8
1.9
2
12 13 14 15 16 17 18
Overall performance (average number of correct responses given by participant across all blocks)
Ave
rag
e le
ng
th o
f r
un
s o
f in
corr
ect
resp
on
ses
in
blo
cks
wit
h 1
4 co
rrec
t a
nd
10
inco
rrec
t re
spo
nse
s
roberta
robot
carlotta
sandoka
pippi
rubens
vispo
virginia
pepe
gal
Expected run length for 10 randomly distributed incorrect responses
(r = -0.34, p > 0.1)
1.2
1.3
1.4
1.5
1.6
1.7
1.8
1.9
2
12 13 14 15 16 17 18
Overall performance (average number of correct responses given by participant across all blocks)
Ave
rag
e le
ng
th o
f r
un
s o
f in
corr
ect
resp
on
ses
in
blo
cks
wit
h 1
5 co
rrec
t a
nd
9 i
nco
rrec
t re
spo
nse
s
roberta
robotcarlotta
sandokanpippi
rubens
vispovirginia
pepe
gal
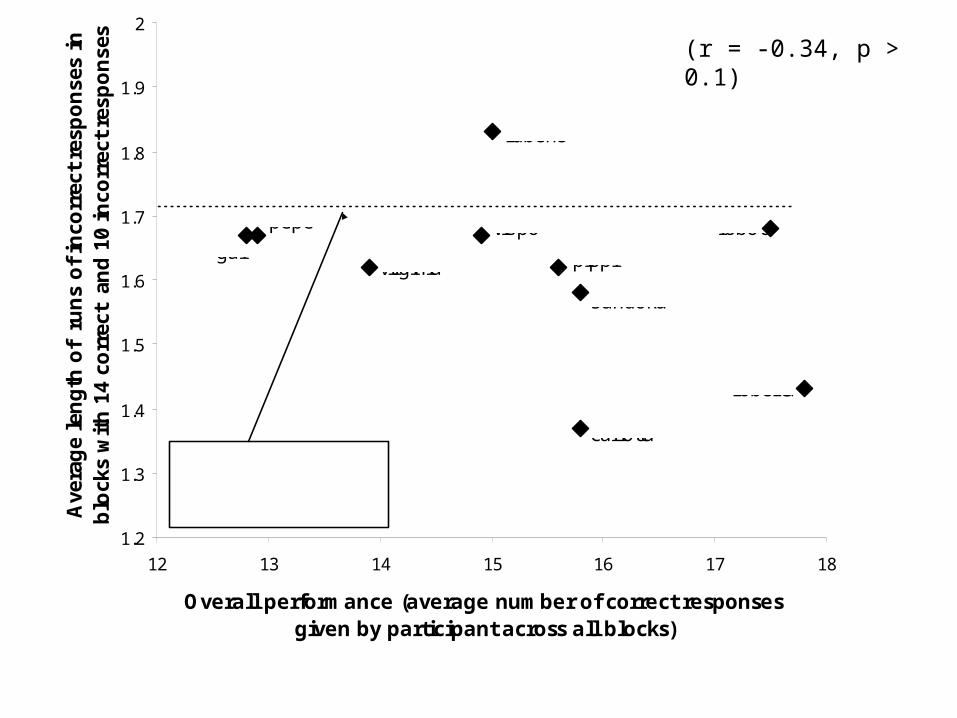
Expected run length for 9 randomly distributed incorrect responses
(r = -0.60, p < 0.05)
1.2
1.3
1.4
1.5
1.6
1.7
1.8
12 13 14 15 16 17 18
Overall performance (average number of correct responses given by participant across all blocks)
Ave
rag
e le
ng
th o
f r
un
s o
f in
corr
ect
resp
on
ses
in
blo
cks
wit
h 1
6 co
rrec
t a
nd
8 i
nco
rrec
t re
spo
nse
s
roberta
robot
carlotta
sandokan
pippi
rubens
vispovirginia
pepegal
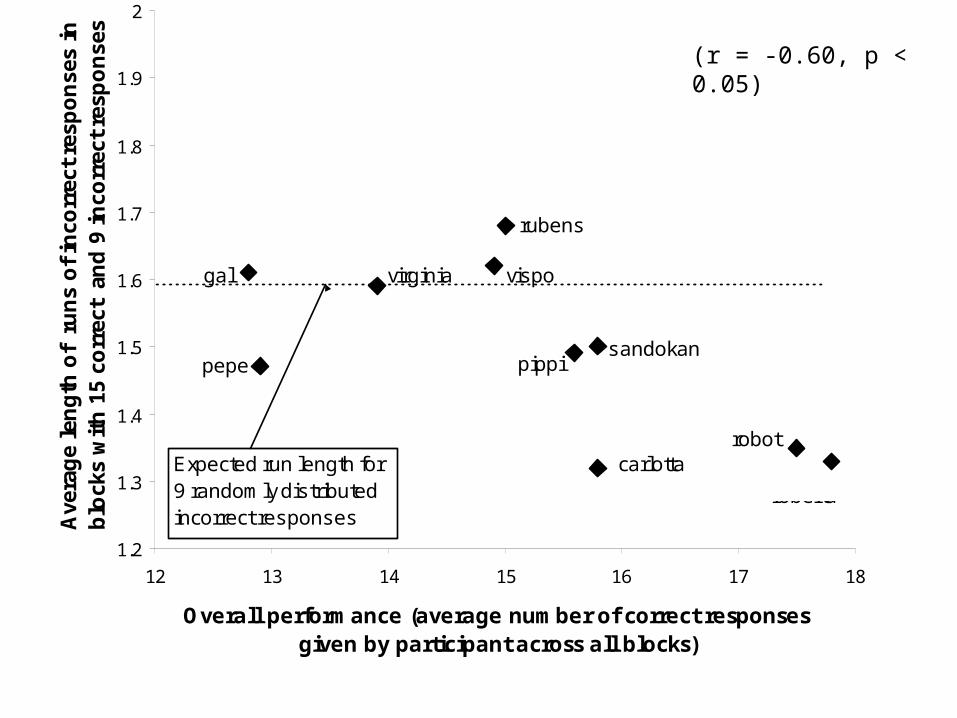
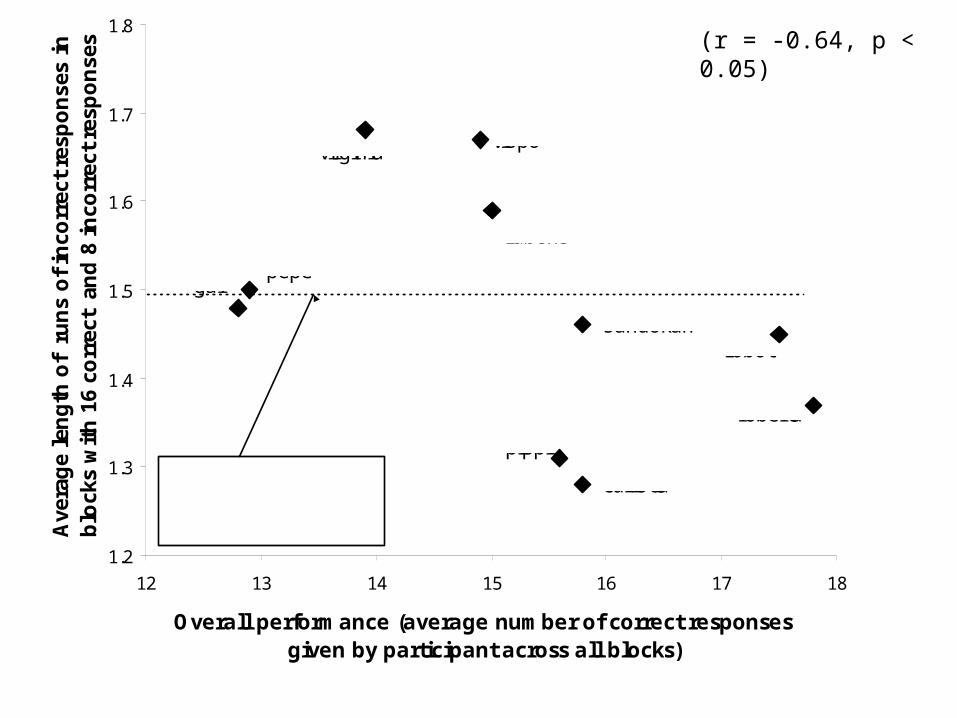
Expected run length for 8 randomly distributed incorrect responses
(r = -0.64, p < 0.05)
1.2
1.3
1.4
1.5
1.6
1.7
1.8
12 13 14 15 16 17 18
Overall performance (average number of correct responses given by participant across all blocks)
Ave
rag
e le
ng
th o
f r
un
s o
f in
corr
ect
resp
on
ses
in
blo
cks
wit
h 1
7 co
rrec
t a
nd
7 i
nco
rrec
t re
spo
nse
s
roberta
robotcarlotta
sandokan
pippi
rubens
vispovirginia
pepe
gal
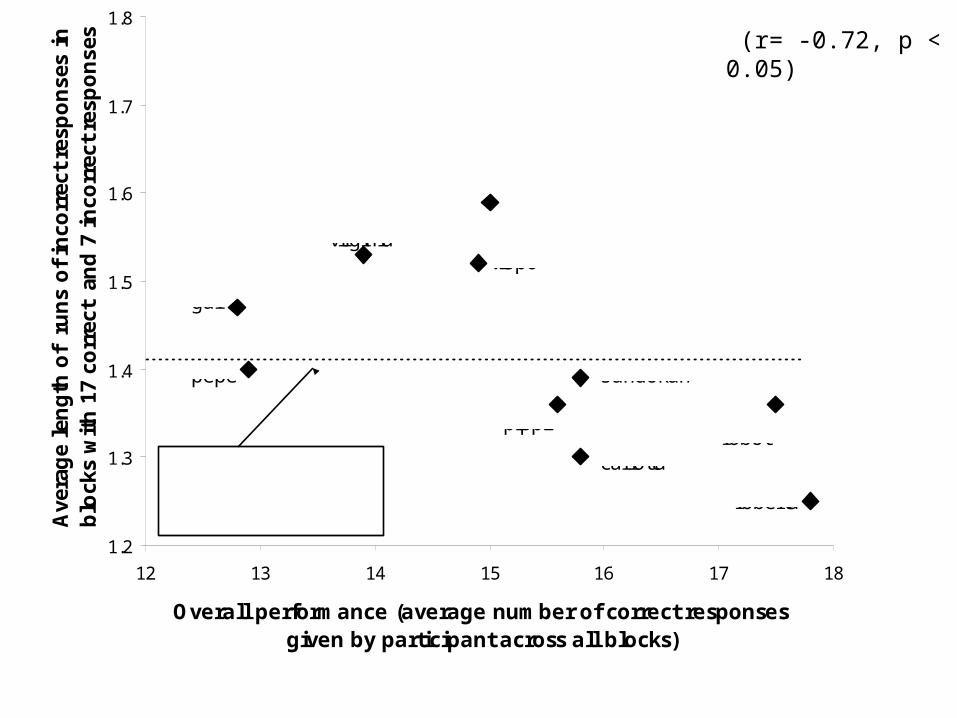
Expected run length for 7 randomly distributed incorrect responses
(r= -0.72, p < 0.05)
1.1
1.2
1.3
1.4
1.5
1.6
12 13 14 15 16 17 18
Overall performance (average number of correct responses given by participant across all blocks)
Ave
rag
e le
ng
th o
f r
un
s o
f in
corr
ect
resp
on
ses
in
blo
cks
wit
h 1
8 co
rrec
t a
nd
6 i
nco
rrec
t re
spo
nse
s
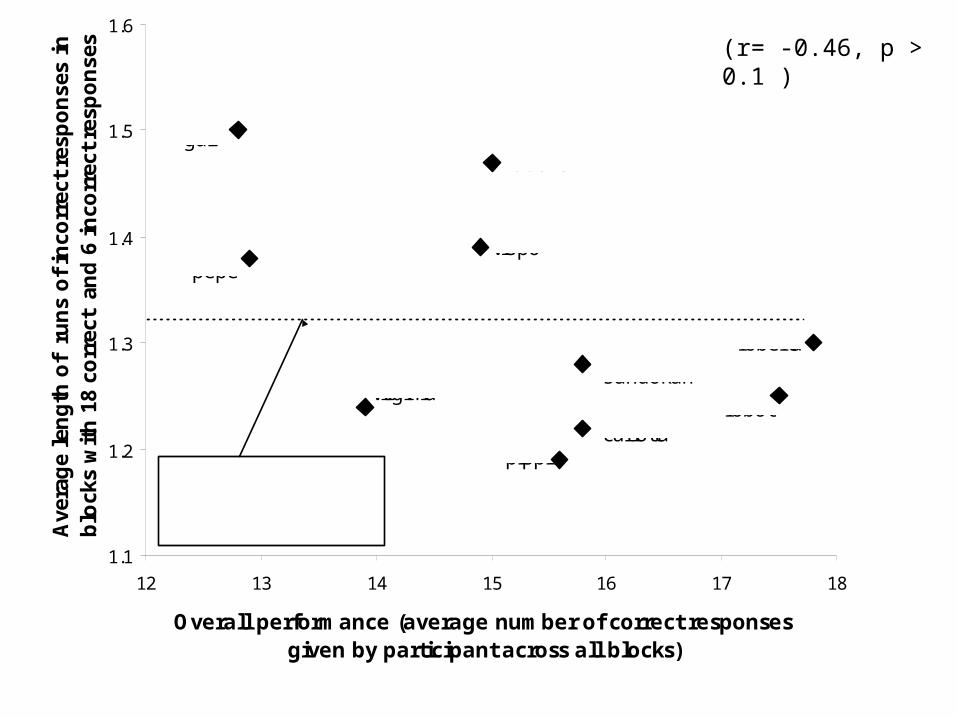
roberta
robotcarlotta
sandokan
pippi
rubens
vispo
virginia
pepe
gal
Expected run length for 6 randomly distributed incorrect responses
(r= -0.46, p > 0.1 )
1.2
1.3
1.4
1.5
1.6
1.7
12 13 14 15 16 17 18
Overall performance (average number of correct responses given by participant across all blocks)
Gra
nd
ave
rag
e o
f ru
ns
of
inco
rrec
t re
spo
nse
s in
b
lock
s fr
om
10
do
wn
to
6 i
nco
rrec
t re
spo
nse
s
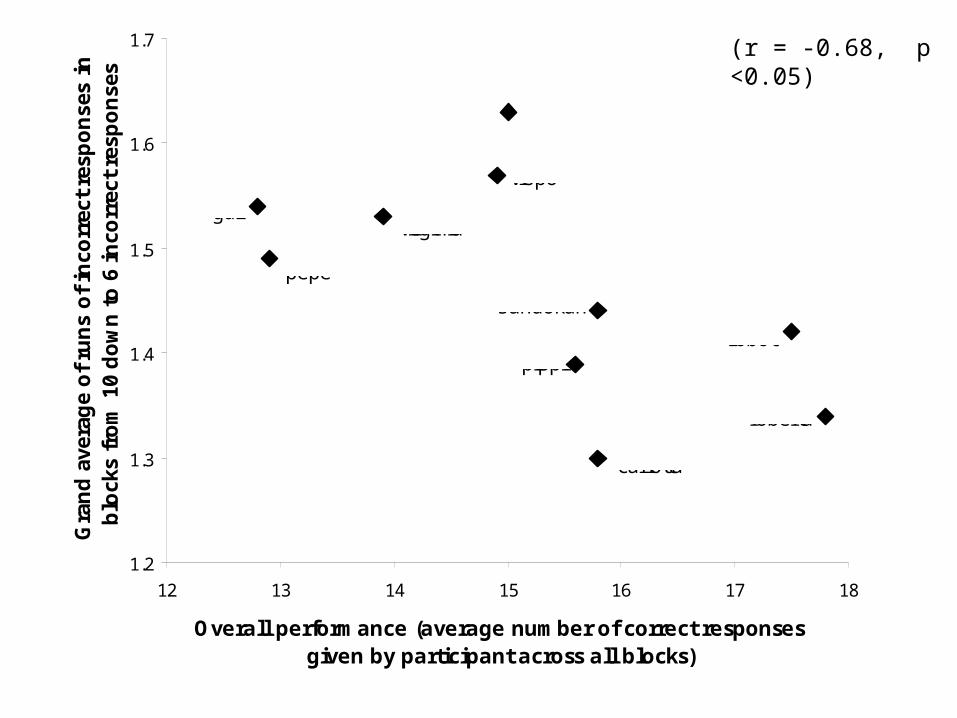
roberta
robot
carlotta
sandokan
pippi
rubens
vispo
virginia
pepe
gal
(r = -0.68, p <0.05)
Conclusions• The more high-performing a participant is in the task, the more
their behaviour (controlling for performance) looks like hypothesis testing.
• Are these capuchin monkeys framing hypotheses about the rules linking stimulus and reward, and rejecting those hypotheses when they fail?
• To give an unequivocal ‘yes’ to this would be extreme.
• However, it is difficult to see any alternative explanation for the reliable association between run length and performance.