Embed Size (px)
Citation preview
983
Journal of Oceanography, Vol. 63, pp. 983 to 994, 2007
Keywords:⋅⋅⋅⋅⋅ Iron-enrichment,⋅⋅⋅⋅⋅ copepod,⋅⋅⋅⋅⋅ grazing,⋅⋅⋅⋅⋅ diatom,⋅⋅⋅⋅⋅ carbon cycling,⋅⋅⋅⋅⋅ western subarcticPacific,
⋅⋅⋅⋅⋅ HNLC.
* Corresponding author. E-mail: [email protected]
Copyright©The Oceanographic Society of Japan/TERRAPUB/Springer
Evidence for the Grazing Hypothesis: Grazing ReducesPhytoplankton Responses of the HNLC Ecosystem to IronEnrichment in the Western Subarctic Pacific (SEEDS II)
ATSUSHI TSUDA1*, SHIGENOBU TAKEDA2, HIROAKI SAITO3, JUN NISHIOKA4, ISAO KUDO5,YUKIHIRO NOJIRI6, KOJI SUZUKI7, MITSUO UEMATSU1, MARK L. WELLS8, DAISUKE TSUMUNE9,TAKESHI YOSHIMURA9, TATSUO AONO10, TAKAFUMI ARAMAKI6, WILLIAM P. COCHLAN11,MAKI HAYAKAWA7, KEIRI IMAI1, TOMOSHI ISADA7, YOKO IWAMOTO1, WILLIAM K. JOHNSON12,SOHIKO KAMEYAMA13, SHUNGO KATO14, HIROSHI KIYOSAWA15, YOSHIKO KONDO2,MAURICE LEVASSEUR16, RYUJI J. MACHIDA1, IPPEI NAGAO17, FUMIKO NAKAGAWA13,TAKAHIRO NAKANISHI10, SEIJI NAKATSUKA18, AKIRA NARITA1, YOSHIFUMI NOIRI5, HAJIME OBATA1,HIROSHI OGAWA1, KENJI OGUMA1, TSUNEO ONO19, TOMOFUMI SAKURAGI10, MOTOKI SASAKAWA20,MITSUHIDE SATO2, AKIFUMI SHIMAMOTO21, HYOE TAKATA5, CHARLES G. TRICK22,YUTAKA W. WATANABE5, CHI SHING WONG12 and NAOKI YOSHIE3
1Ocean Research Institute, University of Tokyo, Nakano-ku, Tokyo 164-8639, Japan2Department of Aquatic Bioscience, University of Tokyo, Bunkyo-ku, Tokyo 113-8657, Japan3Tohoku National Fisheries Research Institute, Shiogama, Miyagi 985-0001, Japan4Institute of Low Temperature Science, Hokkaido University, Sapporo, Hokkaido 060-0819, Japan5Faculty of Fisheries Sciences, Hokkaido University, Sapporo, Hokkaido 060-0813, Japan6National Institute for Environmental Studies, Tsukuba, Ibaraki 305-8506, Japan7Faculty of Environmental Earth Science, Hokkaido University, Sapporo 060-0810, Japan8School of Marine Sciences, University of Maine, Libby Hall, Orono, ME 04469, U.S.A.9Central Research Institute of Electric Power Industry, Abiko, Chiba 270-1194, Japan10National Institute of Radiological Sciences, Hitachinaka, Ibaraki 311-1202, Japan11Romberg Tiburon Center for Environmental Studies, San Francisco State University, 3152 Paradise Drive, Tiburon, CA 94920, U.S.A.12Institute of Ocean Science, P.O. Box 6000, Sidney BC, V8L 4B2, Canada13Graduate School of Science, Hokkaido University, Sapporo, Hokkaido 060-0810, Japan14Faculty of Urban Environmental Sciences, Tokyo Metropolitan University, Tokyo 192-0397, Japan15Marine Biological Research Institute of Japan, Shinagawa-ku, Tokyo 142-0042, Japan16Department of Biology, University of Laval, Quebec, G1K 7P4, Canada17Graduate School of Environmental Studies, Nagoya University, Nagoya 464-8601, Japan18Institute for Chemical Research, Kyoto University, Uji, Kyoto 611-0011, Japan19Hokkaido National Fisheries Research Institute, Kushiro, Hokkaido 085-0802, Japan20Japan Society for the Promotion of Science, Chiyoda-ku, Tokyo 102-8471, Japan21The General Environmental Technos Co., Ltd., Chuo-ku, Osaka 541-0052, Japan22School of Medicine, University of Western Ontario, 1151 Richmond Street N, UWO, London, Ontario, N6A 5B7, Canada
(Received 14 April 2007; in revised form 4 July 2007; accepted 5 July 2007)
A mesoscale iron-enrichment study (SEEDS II) was carried out in the western subarcticPacific in the summer of 2004. The iron patch was traced for 26 days, which includedobservations of the development and the decline of the bloom by mapping with sulfurhexafluoride. The experiment was conducted at almost the same location and the sameseason as SEEDS (previous iron-enrichment experiment). However, the results werevery different between SEEDS and SEEDS II. A high accumulation of phytoplanktonbiomass (~18 mg chl m–3) was characteristic of SEEDS. In contrast, in SEEDS II, thesurface chlorophyll-a accumulation was lower, 0.8 to 2.48 mg m–3, with no prominent

984 A. Tsuda et al.
diatom bloom. Photosynthetic competence in terms of Fv/Fm for the totalphytoplankton community in the surface waters increased after the iron enrichmentsand returned to the ambient level by day 20. These results suggest that the photosyn-thetic physiology of the phytoplankton assemblage was improved by the ironenrichments and returned to an iron-stressed condition during the declining phase ofthe bloom. Pico-phytoplankton (<2 µµµµµm) became dominant in the chlorophyll-a sizedistribution after the bloom. We observed a nitrate drawdown of 3.8 µµµµµM in the patch(day 21), but there was no difference in silicic acid concentration between inside andoutside the patch. Mesozooplankton (copepod) biomass was three to five times higherduring the bloom-development phase in SEEDS II than in SEEDS. The copepodbiomass increased exponentially. The grazing rate estimation indicates that thecopepod grazing prevented the formation of an extensive diatom bloom, which wasobserved in SEEDS, and led to the change to a pico-phytoplankton dominated com-munity towards the end of the experiment.
mesoscale iron enrichment experiments (de Baar et al.,2005). de Baar et al. (2005) suggested that the surfacemixed layer depth play an important role in determiningthe magnitude of biological responses in the iron-enrich-ment experiments, and Yoshie et al. (2005) suggested thatthe presence of the rapidly growing neritic diatoms isimportant in reproducing the results of the modeling ex-periment.
The export flux in SEEDS from the surface mixedlayer between day 4 and 13 was 11% of the integratedprimary production, while 78% of the organic carbon re-mained in the surface mixed layer as particulate organiccarbon (Tsuda et al., 2003), which suggests that the 13-day observation period was not sufficient to examine thefate of carbon accumulated in the iron-induced bloom.Tsuda et al. (2003) suggested that a substantial diatomsinking event occurred after the observation period, judg-ing from the similarities in bloom intensity and speciescomposition between iron-induced bloom and springbloom in the coastal areas of the North Pacific. However,Saito et al. (2006a) suggested the possibility that the ac-cumulated diatom cells in the surface mixed layer mightbe grazed down by heterotrophic dinoflagellates and mostof the POC (particulate organic carbon) would be respiredin the mixed layer within a week after our observation. Alarge percentage of decomposition of the accumulatedorganic matter by micro-organisms in an iron-enrichmentexperiment was also observed in the eastern subarcticPacific (SERIES, Boyd et al., 2004).
We carried out a second iron-enrichment experimentin the western subarctic Pacific (SEEDS II) to examinethe decline and fate of the iron-induced phytoplanktonbloom in summer 2004. However, the phytoplankton re-sponses in SEED II were quite different from those ofSEEDS. Here we present the outline of the experimentalresults and discuss the causes of the differences.
1. IntroductionThe waters of the subarctic Pacific are characterized
by high nitrate and low chlorophyll-a concentration(HNLC) throughout the year (Banse and English, 1999).The main cause of HNLC in the subarctic Pacific wasoriginally considered to be the seasonal occurrence ofontogenetic vertical migrating copepods (Neocalanus spp.and Eucalanus bungii) before the onset of phytoplanktongrowth (Parsons and Lalli, 1988). However, Martin andFitztwater (1988) suggested iron deficiency as an alter-native cause of HNLC in the subarctic Pacific as well asthe Southern Ocean and the eastern equatorial Pacific.Subsequently, the grazing pressure by the ontogeneticvertical migrators has come to be considered as a rela-tively minor factor regulating phytoplankton dynamicsin the subarctic Pacific (Dagg, 1993a; Tsuda and Sugisaki,1994). After an intensive debate on the iron-limitationhypothesis (e.g. Banse, 1990; Martin et al., 1990), meso-scale iron-enrichment studies have confirmed the ironhypothesis in three regions with HNLC waters (Coale etal., 1996, 2004; Boyd et al., 2000, 2004; Tsuda et al.,2003).
SEEDS (Subarctic iron Enrichment for EcosystemDynamics Study) was the first meso-scale iron enrich-ment study in the subarctic Pacific to test the iron-limita-tion hypothesis (Takeda and Tsuda, 2005). A single en-richment of dissolved iron caused a large increase in thephytoplankton standing stock and decreases of macro-nutrients and CO2 fugacity in surface waters. The domi-nant phytoplankton species shifted after the iron-enrich-ment from open-ocean species to neritic diatoms (Tsudaet al., 2005a). The primary production in the iron patchincreased more than ten-fold and the chlorophyll-a con-centration increased from 0.8 to 20 mg m–3 (Kudo et al.,2005). SEEDS was characterized by the highest chloro-phyll-a concentration and the largest drawdown of macro-nutrients and dissolved carbon dioxide among the

Grazing Reduces Response to Fe-Enrichment 985
2. Materials and MethodsThe experiment was performed by two research ves-
sels: R.V. Hakuho Maru (HK) and R.V. Kiro Moana (KM).In a preliminary survey of the area, the iron-enrichmentand the observations for the first two weeks were carriedout by HK until day 14 and the observation period wascontinued by KM until day 22. HK then took over theobservation from day 23 to 26, leaving the site and re-turning to the area on day 31; unfortunately, we failed tofind the iron-enriched patch. The observation periods weretherefore 26 days for the iron-enriched patch and 32 daysoutside the patch from the first iron-enrichment.
The preliminary survey confirmed that an area aroundthe site had high nitrate (>18 µM), high silicic acid (>31µM) and low chlorophyll (<1 mg m–3) concentrations priorto the iron enrichment, although the area was relativelyheterogeneous compared to SEEDS (Tsuda et al., 2003).We then chose a location 93 km SE of the SEEDS site(Fig. 1), because we observed a relatively broad area ofHNLC water there. Dissolved iron concentrations in theambient surface seawater were extremely low (<0.02 nM),suggesting that phytoplankton growth in this area was lim-ited by iron bioavailability.
A GPS-navigated buoy attached to a drogue centeredat 10 m depth was launched at 48°N, 166°E on the daybefore the iron addition (Fig. 1). The first iron additionwas carried out from 0:50 GMT on 20 July to 0:00 GMTon 21 July (GMT). Day 1 was defined as 21 July (GMT).The ship started to inject iron and sulfur hexafluoride(SF6) as an inert tracer of the water mass, executing an 8km × 8 km grid pattern centered on the buoy with an in-terval of 400 m. The ship was navigated with a lagrangiancoordination system (Tsumune et al., 2005), and buoyposition was transmitted to the ship every 10 min to up-date the navigation frame of reference to account for sur-face water advection. The amount of iron added to thepatch was 332 kg Fe as FeSO4. During the iron fertiliza-tion, 4000 L of saturated SF6 solution was also simulta-neously injected. The saturated SF6 solution was madeonboard using the method previously detailed in Tsumuneet al. (2005). Note that the saturated SF6 concentration inseawater is about 0.2 mM (Ledwell and Watson, 1991). Asecond iron addition was performed on day 6 without SF6tracer, when an additional 159 kg of iron was added tothe patch, which was traced using the SF6 signal.
The observation consisted of a mapping survey andin- and out-patch hydrocasts. The mapping survey con-sist of underway sampling to determine the position andshape of the patch using the ship’s pumping system, whichhad an intake at 6 m below the surface for measurementsof pCO2 and SF6 (Upstill-Goddard et al., 1990; Law etal., 1998). The SF6 signal was mainly used for the map-ping survey from the beginning to day 12 and pCO2 sig-nals were used thereafter because the SF6 concentration
dropped to a very low value during this period. Samplingintervals during the underway sampling of chlorophyll-a, pCO2 and SF6 were, 5–10, 1 and 6 min, respectivelywith a ship speed of ca. 29.6 km h–1 for HK and 18.5 forKM. The in- and out-patch survey consisted of verticallystratified water sampling with a CTD-Carousel multi-sam-pling system and ultraclean sampling using Kevlar wireand acid-cleaned Niskin-X bottles, near the center of thepatch and outside the patch. The hydrocast stations in andoutside the patch were determined by the horizontal sur-vey of SF6 and pCO2 concentrations.
The pCO2 was continuously determined by a systemwith a bubbling equilibrator with an open air flow and anon-dispersive infrared analyzer (Nojiri et al., 1999). TheSF6 concentration was determined by a twin sparge-cryo-genic trap system coupled to an electron-capture detec-tor gas chromatograph (Upstill-Goddard et al., 1990). Theiron concentration was measured by filtering the seawatersamples through 0.22 µm Durapore filters (Millipak 100,Millipore Corp.) connected to the Niskin-X spigot undergravity pressure, and collected in acid-cleaned, 125-mlLDPE bottles (Nalgene Co., Ltd). Dissolved iron concen-trations in the seawater samples were determined with aflow analytical system using chelating resinpreconcentration and chemiluminescence detection(Obata et al., 1993, 1997). The maximum photochemicalquantum efficiencies of the algal photosystem II (Fv/Fm,where Fv is the difference between the maximum (Fm)and minimum (F0) chlorophyll fluorescence yield), weremeasured by collecting the water in amber plastic bottlesand acclimation in the dark for 30 min, followed by analy-sis with a fast repetition rate fluorometer (Chelsea Tech-
140 150 160 170
Longitude (degree E)L
atit
ude
(deg
ree
N)
SEEDS
SEEDS II
18035
40
45
50
55
60
65
Fig. 1. Location of the iron enrichment experiments, SEEDSII and SEEDS.
986 A. Tsuda et al.
nologies Group, FAST tracka I) according to the methodof Suzuki et al. (2002). For the chlorophyll-a concentra-tion, 115 ml of seawater was filtered with a glass-fiberfilter (GF/F), and the pigments on the filter were extractedwith 6 ml of N,N-dimethylformamide (DMF) for over 24h (Suzuki and Ishimaru, 1990), after which chlorophyll-a concentration was measured with a Turner Designsfluorometer using a non-acidification protocol(Welschmeyer, 1994). We also measured the size-fractionated chlorophyll-a concentration by sequentialfiltration of 500 ml seawater with Nuclepore filters (10,2, and 0.2 µm pore size).
Knauer-type sediment traps were attached to a drift-ing system at a depth of 40 m inside and outside the patch,retrieved at 3 day intervals in the patch, and 4 to 7 dayintervals outside the patch to collect sinking particles. Thetrap consisted of 8 plastic cylinders filled with hyper-sa-line seawater with sodium azide (10 mmol l–1). Part ofthe samples were filtered with a pre-combusted glass-fiberfilter (GF/F) after removing the swimmers using a mesh(1 mm mesh opening) and stored in a freezer (–20°C).The filters were placed in acid fumes to remove the inor-ganic carbon content and organic carbon and nitrogencontents were measured with an elemental analyzer (CEInstruments, EA1110).
A VMPS net (opening-closing multi-layer net: 50 ×50 cm mouth opening, 0.33 mm mesh opening, Terazakiand Tomatsu, 1997) was towed from 200-m depth to thesurface on HK, and a NORPAC net (45 cm mouth diam-eter, 0.33 mm mesh opening) from 20-m depth on KM toestimate the standing stock of mesozooplankton in theiron patch. The sampling layers of the VMPS net weredivided into 0–20, 20–50, 50–100, 100–200 m. The sam-ples were immediately preserved with 10% buffered for-malin seawater. In a laboratory, all individuals except forsmall copepods (mainly Oithona spp.) were sorted formeasurements of wet weight. Carbon biomass was esti-mated using the wet weight and a conversion factor of0.08 (Peters and Downing, 1984).
3. Results and Discussion
3.1 Patch characteristicsThe iron patch was successfully followed from day
1 to 26, by tracking the SF6 and pCO2 signals. The initialconditions in the patch were similar to those of SEEDS,except for the surface mixed layer depth and iron con-centration (Table 1). The initial dissolved iron concen-tration was lower in SEEDS II than in SEEDS becausethe bottom of the surface mixed layer was deeper inSEEDS II (Fig. 2). However, the initial iron concentra-tion was similar to SERIES, the iron-enrichment experi-ment in the eastern subarctic Pacific which was conductedat a similar surface mixed layer depth (Wong et al., 2006),
SEEDS SEEDS II
Enrichment date 18 July 2001 20 July 2004Enriched area (km2) 80 64Location 48.5°N, 165°E 48°N, 166°ETemperature (°C) 8.38 + 0.13 8.10 + 0.07
Surface mixed layerDepth (m) 8.5 28Chl.-a (mg m–3) 0.92 + 0.31 0.80 + 0.14Nitrate (µM) 17.86 + 0.16 18.42 + 0.11
Silicate (µM) 30.3 + 1.03 36.1 + 0.05
Dissolved iron (nM) 1.50 (2.89*) 0.17 + 0.06 (1.38**)
*Averaged value in the surface mixed layer.**Value at 5-m depth.
Table 1. Comparison of initial conditions between SEEDS andSEEDS II. Values are averages in the surface mixed layeron day 2. Values in parentheses are dissolved iron concen-trations just after enrichment.
and the dissolved iron concentrations were almost sameamong three experiments after day 10. Moreover, dis-solved iron half-life values did not differ significantlyamong the experiments (Nishioka, pers. com.). The ironpatch moved southwestward at around 7.6 km d–1 fromday 1 to day 4 along the contour of sea surface height inthe clockwise eddy, and moved southeastward at around14 km d–1 from day 4 to day 5 due to a strong wind. Afterthe strong wind the patch moved southward across thecontour of sea surface height at around 5 km d–1 up today 9 and moved along the sea surface height in the anti-clockwise eddy at a lower speed. The patch size increasedfrom 64 to 1000 km2 on day 15 and then the detectablepatch size decreased to 830 km2 on day 22. The iron con-centration in the patch decreased to the ambient level onday 16–17, even though the second iron addition wasmade on day 6 (Fig. 2).
3.2 Chl biomass and phytoplankton assemblageSurface chlorophyll-a concentration in the patch in-
creased from day 4, peaking between day 11 and 13 (Fig.3). After day 13, chlorophyll-a concentration graduallydecreased, returning to the initial level on day 20. Thelayer in which the chlorophyll-a level increased was thesame as the surface mixed layer. We did not observe sig-nificant changes in the chlorophyll-a concentration out-side the patch until day 18, when it decreased from 1 to0.2 mg m–3 in the surface mixed layer. These results sug-gest that the 26 days of the observation period coveredthe development and decline phases of the bloom inducedby the iron enrichment. However, the maximum chloro-phyll-a concentrations were much lower than those of

Grazing Reduces Response to Fe-Enrichment 987
SEEDS (Fig. 4). The initial concentration was almostidentical to that of SEEDS until at least day 5, but thechlorophyll-a concentration in SEEDS increasedexponentially after day 4 to over 15 mg m–3. The maxi-
0 5 10 15 20 25150
100
50
0
Days after Iron-enrichment
Dep
th (
m)
0 5 10 15 20 25 30150
100
50
0
IN
OUT
Fig. 2. Temporal changes in dissolved iron concentration in the patch at the surface mixed layer in SEEDS (solid triangles),SEEDS II (solid squares) and SERIES (open squares). SEEDS and SEEDS II data are values at 5 m (Tsuda et al., 2003), andSERIES data are values at 10 m (Wong et al., 2006). Arrows indicate the day of 2nd iron-enrichments in each experiment.
Fig. 3. Temporal changes in chlorophyll-a concentrations (mg m–3) in the upper 150-m inside and outside the iron patch inSEEDS II. Arrows indicate the day of 1st and 2nd iron-enrichment.
mum chlorophyll-a concentration (3.0 mg m–3) in SEEDSII was observed on day 12 at the surface and the averageconcentration between day 11 and 13 in the upper 20 mwater column was 2.48 ± 0.35 mg m–3. Therefore, the

988 A. Tsuda et al.
increase in chlorophyll-a concentration in SEEDS II wasabout 85% lower than that of SEEDS. The chlorophyll-aconcentration in SERIES also showed an almost identi-cal variation with SEEDS II until day 14, then it increasedto around 5 mg m–3 due to a bloom of micro-sized dia-toms (Marchetti et al., 2006a).
Micro, nano and pico-sized chlorophyll-a accountedfor 27, 43 and 30% of the total chlorophyll-a concentra-tion before the increase of phytoplankton (between days0 and 2). This ratio did not change during the develop-ment of the bloom (day 2 to 8), then the contribution ofpico-phytoplankton increased and that of micro-
phytoplankton gradually decreased (Fig. 5). On the finalobservation day (day 26), pico-phytoplankton accountedfor 67% of the total chlorophyll-a. In contrast to SEEDSII, 95% of the total chlorophyll-a was accounted for bymicro-sized phytoplankton on the day of the peak chlo-rophyll-a concentration in SEEDS (Tsuda et al., 2003),which is a similar trend to other iron-enrichment experi-ments in HNLC oceans (e.g. Boyd et al., 2000, 2004).Outside the patch, the size distributions of chlorophyll-awere rather variable compared to those in the patch, prob-ably due to local heterogeneity (Fig. 5).
The photosynthesis competence (Fv/Fm) closely fol-
Ch
loro
ph
yll-
a st
and
ing
sto
ck(m
g m
-2)
(mg
m-3
)
Days after Iron-enrichment
0
5
10
15
20
0 5 10 15 20 25 300
100
200
300Water column
5-m depthSEEDS
SEEDS IISERIES
Fig. 4. Temporal changes in chlorophyll-a concentration in the patch at 5-m depth (upper) and the water column integrated values(lower) in SEEDS (open squares and broken line), SEEDS II (solid squares and solid line) and SERIES (open triangles).
Fig. 5. Temporal changes in the relative composition of size-fractionated chlorophyll-a concentration inside (upper) and outside(lower) the patch in SEEDS II. Arrows indicate the day of 1st and 2nd iron-enrichment.
Grazing Reduces Response to Fe-Enrichment 989
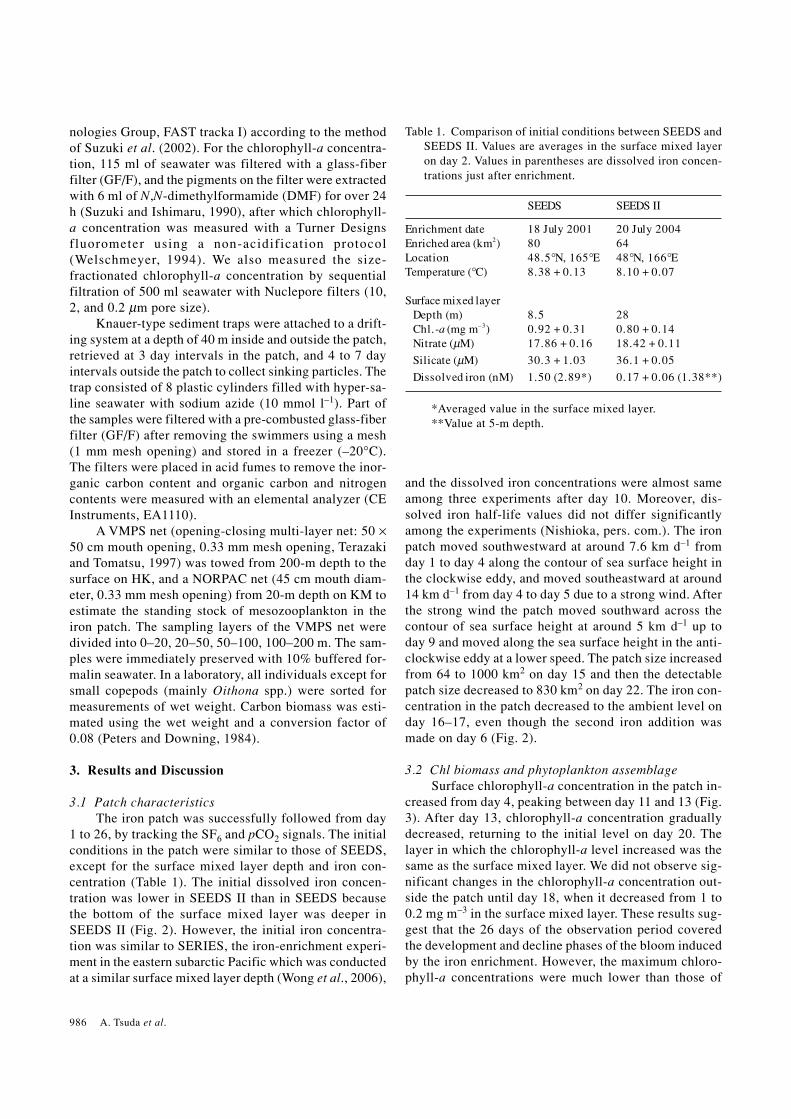
lowed the chlorophyll-a variation (Fig. 6). The initialvalue was 0.29 and the ratio increased to around 0.4 be-tween days 9 and 14 and returned to approximately theinitial level on day 17. The Fv/Fm decreased further to0.24 as the bloom entered the decline phase. Outside thepatch, Fv/Fm levels were relatively stable until day 11,whereafter they gradually decreased to 0.15. The observedinitial and the maximum values of Fv/Fm were identicalto those of SEEDS and SERIES (Tsuda et al., 2003; Boydet al., 2005). These variations in Fv/Fm suggest thatphytoplankton growth was initially stressed by iron, im-proved after the iron enrichments, and returned to an iron-stressed condition during the declining phase. Theeuphotic layer integrated primary production graduallyincreased by up to three times (day 12) the initial valuein the patch, but it was smaller than that in SEEDS (fivetimes) (Kudo, pers. com.).
3.3 NutrientsNitrate concentration in the patch decreased at a sig-
nificantly higher rate than that outside the patch (Fig. 7).The concentrations were relatively stable during the first5 days, decreased to 12.7 µM on day 21, and increasedsomewhat to the end of the observation period, whichmight be caused by the dilution of the patch water withits surrounding waters. The maximum difference in ni-trate concentrations at 5-m depth inside and outside thepatch was 3.80 µM on day 21 (outside concentration onday 21 was estimated from the linear regression betweendays 5 and 23). Silicic acid concentration also decreasedfrom day 5 to day 10, becoming relatively stable thereaf-ter both inside and outside the patch (Fig. 7). No signifi-cant difference in the silicic acid concentrations was ob-
served inside and outside the patch. These nutrient varia-tions are also in contrast to those of SEEDS and SERIES.SEEDS was characterized by a large drawdown of macro-nutrients (Tsuda et al., 2003; de Baar et al., 2005) andthe maximum differences in nitrate and silicic acid con-centrations inside and outside the patch were 13.4 and24.8 µM on day 13, respectively. Moreover, silicic acid
0
0.1
0.2
0.3
0.4
0.5
0 5 10 15 20 25 30 35
Days after Iron-enrichment
Fv
/Fm IN
OUT0
5
10
15
20
0
25
30
35
40
0 5 10 15 20 25 30
Days after Iron-enrichment
Nu
trie
nt
con
cen
trat
ion
(M
)
Nitrate
Silicic acid
OUT
IN
µ
Fig. 6. Temporal changes in photosynthetic competence (Fv/Fm) at 5-m depth inside (solid squares and solid line) andoutside (open squares and broken line) the patch in SEEDSII. Vertical bars indicate ±1 SD. Arrows indicate the day of1st and 2nd iron-enrichment.
Fig. 7. Temporal changes in nitrate (upper) and silicic acid(lower) concentrations at 5-m depth inside (solid squaresand solid line) and outside (open squares and broken line)the patch in SEEDS II. Arrows indicate the day of 1st and2nd iron-enrichment.
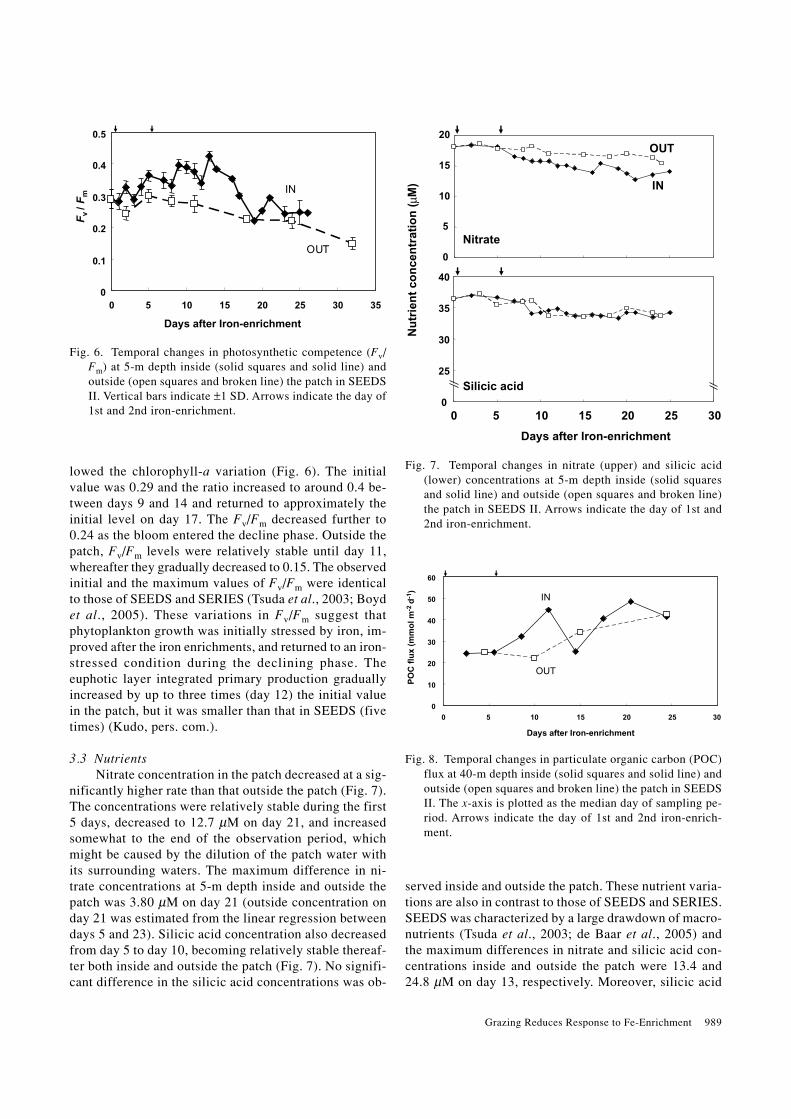
Fig. 8. Temporal changes in particulate organic carbon (POC)flux at 40-m depth inside (solid squares and solid line) andoutside (open squares and broken line) the patch in SEEDSII. The x-axis is plotted as the median day of sampling pe-riod. Arrows indicate the day of 1st and 2nd iron-enrich-ment.
0 5 10 15 20 25 30
Days after Iron-enrichment
PO
C f
lux
(mm
ol m
-2d
-1)
0
10
20
30
40
50
60
IN
OUT
990 A. Tsuda et al.
depletion together with the large drawdown of nitrate wasobserved during the diatom bloom period in SERIES(Marchetti et al., 2006b; Saito et al., 2006b). These re-sults suggest that diatoms were major contributors to thenutrient drawdown and accumulation of chlorophyll-a inSEEDS and SERIES, but non-diatom phytoplankton werethe major fraction of the phytoplankton that increased inSEEDS II. According to algal pigment signatures,phytoflagellates such as Cryptophytes, Prasinophytes,Chlorophytes, and Prymnesiophytes predominated in thephytoplankton community during SEEDS II (Suzuki, pers.com.).
POC flux at 40-m depth, just below the surface mixedlayer, was around 24 mmol m–2d–1 in the patch before thebloom, and a relatively high flux of over 40mmol C m–2d–1 was observed during the decline phase ofthe bloom (Fig. 8). A similar trend of POC flux was ob-served outside the patch, although the flux was somewhatlower than that inside the patch during the bloom period.The integrated flux of organic matter between day 1 and25 was 60.8% of the nitrate + nitrite drawdown of the0–30-m water column in the estimation of nitrogen budget(Saito, pers. com.).
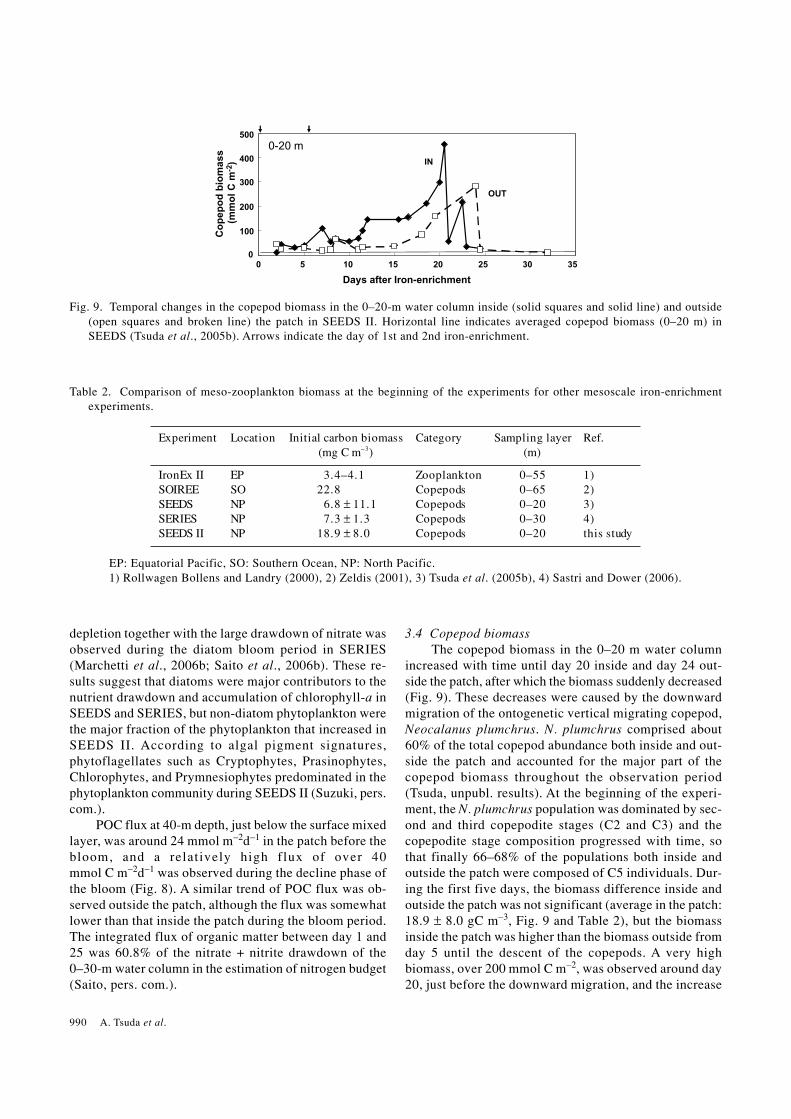
3.4 Copepod biomassThe copepod biomass in the 0–20 m water column
increased with time until day 20 inside and day 24 out-side the patch, after which the biomass suddenly decreased(Fig. 9). These decreases were caused by the downwardmigration of the ontogenetic vertical migrating copepod,Neocalanus plumchrus. N. plumchrus comprised about60% of the total copepod abundance both inside and out-side the patch and accounted for the major part of thecopepod biomass throughout the observation period(Tsuda, unpubl. results). At the beginning of the experi-ment, the N. plumchrus population was dominated by sec-ond and third copepodite stages (C2 and C3) and thecopepodite stage composition progressed with time, sothat finally 66–68% of the populations both inside andoutside the patch were composed of C5 individuals. Dur-ing the first five days, the biomass difference inside andoutside the patch was not significant (average in the patch:18.9 ± 8.0 gC m–3, Fig. 9 and Table 2), but the biomassinside the patch was higher than the biomass outside fromday 5 until the descent of the copepods. A very highbiomass, over 200 mmol C m–2, was observed around day20, just before the downward migration, and the increase
Days after Iron-enrichment
Co
pep
od
bio
mas
s(m
mo
l C m
-2) IN
OUT
0-20 m
0 5 10 15 20 25 30 350
100
200
300
400
500
Fig. 9. Temporal changes in the copepod biomass in the 0–20-m water column inside (solid squares and solid line) and outside(open squares and broken line) the patch in SEEDS II. Horizontal line indicates averaged copepod biomass (0–20 m) inSEEDS (Tsuda et al., 2005b). Arrows indicate the day of 1st and 2nd iron-enrichment.
Table 2. Comparison of meso-zooplankton biomass at the beginning of the experiments for other mesoscale iron-enrichmentexperiments.
EP: Equatorial Pacific, SO: Southern Ocean, NP: North Pacific.1) Rollwagen Bollens and Landry (2000), 2) Zeldis (2001), 3) Tsuda et al. (2005b), 4) Sastri and Dower (2006).
Experiment Location Initial carbon biomass(mg C m–3)
Category Sampling layer(m)
Ref.
IronEx II EP 3.4–4.1 Zooplankton 0–55 1)SOIREE SO 22.8 Copepods 0–65 2)SEEDS NP 6.8 ± 11.1 Copepods 0–20 3)SERIES NP 7.3 ± 1.3 Copepods 0–30 4)SEEDS II NP 18.9 ± 8.0 Copepods 0–20 this study

Grazing Reduces Response to Fe-Enrichment 991
in the biomass in the patch was well described by an ex-ponential growth curve, y = 0.22e0.145x (r2 = 0.83). Theexponential growth curve and the development throughthe copepodite stages of N. plumchrus suggest that theobserved increases in the copepod biomass are mainlyexplained by the growth of the copepod during this pe-riod. When we compare the initial biomass of copepodswith the other iron-enrichment experiments, the copepodbiomass in this experiment was the highest among theNorth Pacific experiments (SEEDS and SERIES) andcomparable to SOIREE in the Southern Ocean experiment(Table 2).
3.5 Comparison of SEEDS with SEEDS IISEEDS and SEEDS II were carried out at almost the
same location and season (Table 1), and the initial nutri-ent and chlorophyll-a concentrations as well as the algalsize distribution were quite similar between SEEDS andSEEDS II. Although the dissolved iron concentration waslower and the surface mixed layer depth was deeper inSEEDS II than in SEEDS, these conditions were similarto those of SERIES. The increase in photosynthesiscompetence (Fv/Fm) as observed in SEEDS and SERIESconfirmed that the photosynthetic physiological status ofthe phytoplankton assemblage improved after the ironenrichments (Fig. 6). In both SEEDS and SERIES, a 15to 20 fold increase in chlorophyll-a was observed andthese increases in phytoplankton biomass were mainlycaused by an increase in diatom species. In contrast, inSEEDS II, chlorophyll-a concentration only increasedfrom 0.8 to 2.48 mg m–3 (3.1 times) and the size distribu-tion did not change during the development of the bloom.
The two most plausible causes of the different re-sponse by the phytoplankton assemblages betweenSEEDS and SEEDS II are mesozooplankton grazing andthe absence of rapidly growing neritic diatom species in
SEEDS II. The importance of neritic diatoms was sug-gested in a numerical modeling study to reproduce theobserved rapid, intense increase of phytoplankton biomassin SEEDS (Yoshie et al., 2005). Microscopic examina-tion suggests that neritic diatom species such asChaetoceros debilis were not observed in the initial con-dition of SEEDS II, but we observed an increase in oce-anic diatoms such as Pseudo-nitzschia spp. andNeodenticula seminae (Kiyosawa, pers. com.) during thedevelopment of the bloom. In SERIES, the bloom wasmainly composed of oceanic diatoms such as Pseudo-nitzschia spp., N. seminae and Chaetoceros convolutus(Marchetti et al., 2006a), which were also the commondiatom species in SEEDS II. We thus might have expecteda diatom bloom of the same magnitude to SERIES inSEEDS II. Therefore, we consider that the absence ofneritic diatoms had some effect on the responses inSEEDS II, especially the magnitude and timing of thebloom, but this was not sufficient to explain the differ-ences between SERIES and SEEDS II.
The initial copepod biomass in SEEDS II was aboutthree times higher than that of SEEDS. When we com-pare the biomass during the first 13 days (total durationof SEEDS), the copepod biomass in SEEDS II was 5 timeshigher than that of SEEDS, and copepod biomass in-creased to 33 and 20 times of the average copepod biomassin SEEDS just before the copepod downward migration,inside and outside the patch, respectively. Primary pro-duction at the start of the experiment was estimated as43.9 mmol C m–2d–1 (Kudo, unpubl. results), and thecopepod grazing rate during the same period was esti-mated as 14.9 mmol C m–2d–1, assuming a homogeneousdistribution in the surface mixed layer and a daily ratioof 0.31 (Tsuda et al., 2005b). The copepod communitygrazing rate was 35% of the primary production, butNeocalanus spp. and Eucalanus bungii, both major com-
Fig. 10. Relationship between the copepod carbon biomass and POC flux at 40-m depth inside (solid squares) and outside (opensquares) the patch in SEEDS II. Solid line denotes the fitted curve. Copepod biomass was the average value of each sedimenttrap sampling period.
Copepod biomass (mmol m-2)
PO
C fl
ux (
mm
ol m
-2d-1
)y = 7.7228x 0.342
R2 = 0.7806
0
10
20
30
40
50
60
0 50 100 150 200 250 300

992 A. Tsuda et al.
ponents of the copepod community, are considered mainlyto graze on micro-sized organisms (Kobari et al., 2003)and micro-phytoplankton accounted for 27% of the totalchlorophyll-a concentration (Fig. 5). Thus, the primaryproduction of micro-phytoplankton and copepod grazingrate should be comparable and the copepod grazing mostlikely prevented the large scale development of the dia-tom bloom. In SERIES, the initial copepod biomass wassimilar to that of SEEDS II (Table 2) and chlorophyll-aconcentration was almost identical to SEEDS II and SE-RIES until day 14 (Fig. 4). A diatom bloom then formedaround day 14 to day 19 in SERIES (Saito et al., 2006b;Marchetti et al., 2006a). During this period, the copepodbiomass was much higher in SEEDS II than SERIES, inwhich the highest copepod biomass in the surface mixedlayer was 56 mmol C m–2 (Tsuda et al., 2006). In addi-tion, the copepod species compositions were differentbetween SEEDS II and SERIES, Eucalanus bungii beingthe most dominant species in SERIES (Sastri and Dower,2006; Tsuda et al., 2006), which was generally distrib-uted below the surface mixed layer and regarded as a sink-ing particle feeder (Mackas et al., 1993; Dagg, 1993b).In SERIES, E. bungii migrated up to the surface mixedlayer during the diatom bloom, but they were consideredto be present below the surface mixed layer before thebloom (Tsuda et al., 2006).
During the decline phase of the bloom (day 13 to24), the primary production returned to the initial leveland the estimated copepod grazing rate (>50mmol C m–2d–1) apparently exceeded the primary pro-duction. The dominance of pico-phytoplankton during thedecline phase of the bloom might be caused by the re-lease of top-down control of micro-sized heterotrophicorganisms, which are suggested to be major food sourcesfor Neocalanus copepods after the diatom bloom seasonin the Oyashio region (Kobari et al., 2003).
The POC flux was relatively high inside the patchcompare to outside (Fig. 8). It seems that the higherbiomass or production of primary producers inside thepatch caused the higher export flux of POC. However, ifwe plot the POC flux as a function of the average copepodbiomass in each sampling period, the relationship betweencopepod biomass and POC flux was well fitted by an ex-ponential curve with no difference inside and outside thepatch (Fig. 10). These observations suggest that the POCflux was a function of the copepod biomass, and the iron-enhanced growth of phytoplankton had a minor effect onthe export flux in SEEDS II.
The reason why the abundance of N. plumchrus wasmuch higher in SEEDS II than SEEDS is unknown. How-ever, Tadokoro et al. (2005) reported a decadal oscilla-tion of N. plumchrus abundance in the western NorthPacific with a factor of 13.7. Boyd et al. (1999) suggestedthat a five times higher biomass of mesozooplankton than
the in-situ mesozooplankton was needed to consume theiron-stimulated growth of diatoms. These observationssuggest that copepods could possibly graze down the iron-enhanced diatom growth even in the range of natural fluc-tuations observed in SEEDS II. Martin’s iron hypothesis(Martin and Fitzwater, 1988) appeared to be a more con-vincing explanation of the dynamics of HNLC waters thanthe grazing hypothesis. More recently, “the ecumenicaliron hypothesis” has become generally accepted whichsuggests that iron controls the growth of largephytoplankton while microzooplankton grazing controlsthe smaller phytoplankton which have a lower iron re-quirement and are less vulnerable to mesozooplanktongrazing (e.g. Cullen, 1995; Landry et al., 1997). How-ever, the results of SEEDS II suggest that copepod graz-ing is more crucial than we envisaged for shaping HNLCconditions in the subarctic North Pacific and the responseof phytoplankton to any natural iron inputs.
Acknowledgements and DedicationWe wish to thank the captains and crews of the RV
Hakuho Maru and Kilo Moana, and our colleaguesonboard during the cruises. We are also grateful to Drs.P. J. Harrison and E. Sakshaug for their helpful comments.This article is dedicated to our close friend and colleagueMr. Toshiaki Miura, who suddenly passed away on 14December 2005 due to a heart attack. He worked for usdevotedly in preparing, sampling and data managementof the HK cruise. Toshiaki’s convivial personality madethe cruise more pleasant and productive. He will bemissed. This study was supported by the Japan Societyfor the Promotion of Science (#16201003).
ReferencesBanse, K. (1990): Does iron really limit phytoplankton pro-
duction in the offshore subarctic Pacific? Limnol.Oceanogr., 35, 772–775.
Banse, K. and D. C. English (1999): Comparing phytoplanktonseasonality in the eastern and western subarctic Pacific andthe western Bering Sea. Prog. Oceanogr., 43, 235–288.
Boyd, P. W., R. H. Goldblatt and P. J. Harrison (1999):Mesozooplankton grazing manipulations during in vitro ironenrichment studies in the NE subarctic Pacific. Deep-SeaRes. Part II, 46, 2645–2668.
Boyd, P. W., A. J. Watson, C. S. Law, E. R. Abraham, T. Trull,R. Murdoch, D. C. E. Bakker, A. R. Bowie, K. O. Buesseler,H. Chang, M. Charette, P. Croot, K. Downing, R. Frew, M.Gall, M. Hadfield, J. Hall, M. Harvey, G. Jameson, J.LaRoche, M. Liddicoat, R. Ling, M. T. Maldonado, R. M.McKay, S. Nodder, S. Pickmere, R. Pridmore, S. Rintoul,K. Safi, P. Sutton, R. Trezepek, K. Tanneberger, S. Turner,A. Waite and J. Zeldis (2000): A mesoscale phytoplanktonbloom in the polar Southern Ocean stimulated by iron ferti-lization. Nature, 407, 695–702.
Boyd, P. W., C. S. Law, Y. Nojiri, C. S. Wong, Y. Nojiri, A.Tsuda, M. Levasseur, S. Takeda, R. Rivkin, P. J. Harrison,

Grazing Reduces Response to Fe-Enrichment 993
R. Strzepek, J. Gower, R. M. McKay, E. Abraham, M.Arychuk, J. Barwell-Clarke, W. Crawford, D. Crawford, M.Hale, K. Harada, K. Johnson, H. Kiyosawa, I. Kudo, A.Marchetti, W2. Miller, J. Needoba, J. Nishioka, H. Ogawa,J. Page, M. Robert, H. Saito, A. Sastri, N. Sherry, T. Soutar,N. Sutherland, Y. Taira, F. Whitney, S.-K. E. Wong and T.Yoshimura (2004): The decline and fate of an iron-inducedsubarctic phytoplankton bloom. Nature, 428, 549–553.
Boyd, P. W., R. Strzepek, S. Takeda, G. Jackson, R. M. McKay,C. Law, H. Kiyosawa, H. Saito, N. Sherry, K. Johnson, J.Gower and N. Ramaiah (2005): The evolution and termina-tion of an iron-induced mesoscale bloom in the northeastsubarctic Pacific. Limnol. Oceanogr., 50, 1872–1886.
Coale, K. H., K. S. Johnson, S. E. Fitzwater, R. M. Gordon, S.Tanner, F. P. Chavez, L. Ferioli, C. Sakamoto, P. Rogers, F.Millero, P. Steinberg, P. Nightingale, D. Cooper, W. P.Cochlan, M. R. Landry, J. Constantinou, G. Rollwagen, A.Trasvina and R. Kudela (1996): A massive phytoplanktonbloom induced by an ecosystem-scale iron fertilization ex-periment in the equatorial Pacific Ocean. Nature, 383, 495–501.
Coale, K. H., K. S. Johnson, F. P. Chavez, K. O. Buesseler, R.T. Barber, M. A. Brzezinski, W. P. Cochlan, F. J. Millero, P.G. Falkowski, J. E. Bauer, R. H. Wanninkhof, R. M. Kudela,M. A. Altabet, B. E. Hales, T. Takahashi, M. R. Landry, R.R. Bidigare, X. Wang, Z. Chase, P. G. Strutton, G. E.Friederich, M. Y. Gorbunov, V. P. Lance, A. K. Hilting, M.R. Hiscock, M. Demarest, W. T. Hiscock, K. F. Sullivan, S.J. Tanner, R. M. Gordon, C. N. Hunter, V. A. Elrod, S. E.Fitzwater, J. L. Jones, S. Tozzi, M. Koblizek, A. E. Roberts,J. Herndon, J. Brewster, N. Ladizinsky, G. Smith, D. Cooper,D. Timothy, S. L. Brown, K. E. Selph, C. C. Sheridan, B. S.Twining and Z. I. Johnson (2004): Southern Ocean ironenrichment experiment: Carbon cycling in high- and low-Si waters. Science, 304, 408–414.
Cullen, J. J. (1995): Status of the iron hypothesis after the open-ocean enrichment experiment. Limnol. Oceanogr., 40, 1336–1343.
Dagg, M. J. (1993a): Grazing by the copepod community doesnot control phytoplankton production in the subarctic Pa-cific Ocean. Prog. Oceanogr., 32, 163–183.
Dagg, M. J. (1993b): Sinking particles as a possible source ofnutrition for the calanoid copepod Neocalanus cristatus inthe subarctic Pacific Ocean. Deep-Sea Res., 40, 1431–1445.
de Baar, H., P. W. Boyd, K. Coale, M. R. Landry, A. Tsuda, P.Assmy, D. C. E. Bakker, Y. Bozec, R. T. Barber, M. A.Brzezinski, K. O. Buesseler, M. Boyé, P. L. Croot, F.Gervais, M. Y. Gorbunov, P. J. Harrison, W. T. Hiscock, P.Laan, C. Lancelot, C. S. Law, M. Levasseur, A. Marchetti,F. J. Milero, J. Nishioka, Y. Nojiri, T. van Oijen, U.Riebesell, M. J. A. Rijkenberg, H. Saito, S. Takeda, K. R.Timmermans, M. J. W. Veldhuis, A. M. Waite and C. S.Wong (2005): Synthesis of iron fertilization experiments:From the iron age in the age of enlightenment. J. Geophys.Res., 110, C09S16, doi:10.1029/2004JC002601.
Kobari, T., A. Shinada and A. Tsuda (2003): Functional rolesof interzonal migrating mesozooplankton in the westernsubarctic Pacific. Prog. Oceanogr., 57, 279–298.
Kudo, I., Y. Noiri, K. Imai, Y. Nojiri and A. Tsuda (2005): Pri-
mary production and nitrogenous nutrients assimilationdynamics during the Subarctic Pacific Iron Experiment forEcosystem Dynamics Study (SEEDS). Prog. Oceanogr., 64,207–221.
Landry, M. R., R. Barber, R. Bidigare, F. Chai, K. Coale, H.Dam, M. Lewis, S. Lindley, J. McCarthy, M. Roman, D.Stoecker, P. Verity and J. White (1997): Iron and grazingconstraints on primary production in the central equatorialPacific: an EqPac synthesis. Limnol. Oceanogr., 42, 405–418.
Law, C. S., A. J. Watson, M. I. Liddicoat and T. Stanton (1998):Sulphur hexafluoride as a tracer of biogeochemical andphysical processes in an open-ocean iron fertilization ex-periment. Deep-Sea Res. II, 45, 977–994.
Ledwell, J. R. and A. J. Watson (1991): The Santa Monica Ba-sin tracer experiment: a study of diapycnal and isopycnalmixing. J. Geophys. Res., 96, 8695–8718.
Mackas, D. L., H. Sefton, C. B. Miller and A. Raich (1993):Vertical habitat partitioning by large calanoid copepods inthe oceanic subarctic Pacific during spring. Prog.Oceanogr., 32, 259–294.
Marchetti, A., N. D. Sherry, H. Kiyosawa, A. Tsuda and P. J.Harrison (2006a): Phytoplankton processes during amesoscale iron enrichment in the NE subarctic Pacific: PartI—Biomass and assemblage. Deep-Sea Res. II, 53, 2095–2113.
Marchetti, A., P. Juneau, F. Whitney and P. J. Harrison (2006b):Phytoplankton processes during a mesoscale iron enrich-ment in the NE subarctic Pacific: Part II—Nutrient utiliza-tion. Deep-Sea Res. II, 53, 2114–2130.
Martin, J. H. and S. E. Fitzwater (1988): Iron deficiency limitsphytoplankton growth in the north-east Pacific subarctic.Nature, 331, 341–343.
Martin, J. H., W. W. Broenkow, S. E. Fitzwater and R. M.Gordon (1990): Yes, it does: A reply to comment by Banse.Limnol. Oceanogr., 35, 775–777.
Nojiri, Y., Y. Fujinuma, J. Zeng and C. S. Wong (1999): Moni-toring of pCO2 with complete seasonal coverage utilizing acargo ship M/S Skaugran between Japan and Canada. Proc.2nd Int. Symp. CO2 Ocean, CGER-I037-’99, 17–23.
Obata, H., H. Karatani and E. Nakayama (1993): Automateddetermination of iron in seawater by chelating resin con-centration and chemiluminescence detection. Anal. Chem.,65, 1524–1528.
Obata, H., H. Karatani, M. Matsui and E. Nakayama (1997):Fundamental studies for chemical speciation of iron inseawater with an improved analytical method. Mar. Chem.,56, 97–106.
Parsons, T. R. and C. R. Lalli (1988): Comparative oceanic ecol-ogy of plankton communities of the subarctic Atlantic andPacific Oceans. Oceanogr. Mar. Biol. A. Rev., 26, 317–359.
Peters, R. H. and J. A. Downing (1984): Empirical analysis ofzooplankton filtering and feeding rates. Limnol. Oceanogr.,29, 763–784.
Rollwagen Bollens, G. C. and M. R. Landry (2000): Biologicalresponse to iron fertilization in the eastern equatorial Pa-cific (IronEx II). II. Mesozooplankton abundance, biomass,depth distribution and grazing. Mar. Ecol. Prog. Ser., 201,43–56.
994 A. Tsuda et al.
Saito, H., T. Ota, K. Suzuki, J. Nishioka and A. Tsuda (2006a):Role of heterotrophic dinoflagellate Gyrodinium sp. in thefate of an iron-enrichment induced diatom bloom. Geophys.Res. Lett., 33, L09602, 10.1029/2005GL025366.
Saito, H., A. Tsuda, Y. Nojiri, J. Nishioka, S. Takeda, H.Kiyosawa, I. Kudo, Y. Noiri, T. Ono, Y. Taira, K. Suzuki, T.Yoshimura and P. W. Boyd (2006b): Nutrient andphytoplankton dynamics during the stationary and declin-ing phases of a phytoplankton bloom induced by iron-en-richment in the eastern subarctic Pacific. Deep-Sea Res. II,53, 2168–2181.
Sastri, A. R. and J. F. Dower (2006): Mesozooplankton com-munity response to a phytoplankton bloom in the subarcticNE Pacific. Deep-Sea Res. II, 53, 2268–2280.
Suzuki, K., H. Liu, T. Saino, H. Obata, M. Takano, K. Okamura,Y. Sohrin and Y. Fujishima (2002). East-west gradients inthe photosynthetic potential of phytoplankton and iron con-centration in the subarctic Pacific during early summer.Limnol. Oceanogr., 47, 1581–1594.
Suzuki, R. and T. Ishimaru (1990): An improved method forthe determination of phytoplankton chlorophyll using N,N-dimethylformamide. J. Oceanogr. Soc. Japan, 46, 190–194.
Tadokoro, K., S. Chiba, T. Ono, T. Midorikawa and T. Saino(2005): Interannual variation in Neocalanus biomass in theOyashio waters of the western North Pacific. Fish.Oceanogr., 14, 210–222.
Takeda, S. and A. Tsuda (2005): An in situ iron-enrichmentexperiment in the western subarctic Pacific (SEEDS): In-troduction and summary. Prog. Oceanogr., 64, 95–109.
Terazaki, M. and C. Tomatsu (1997): A vertical multiple open-ing and closing plankton sampler. J. Adv. Mar. Sci. Tech.Soc., 3, 127–132.
Tsuda, A. and H. Sugisaki (1994): In-situ grazing rate of thecopepod population in the western subarctic North Pacificduring spring. Mar. Biol., 120, 203–210.
Tsuda, A., S. Takeda, H. Saito, J. Nishioka, Y. Nojiri, I. Kudo,H. Kiyosawa, A. Shiomoto, K. Imai, T. Ono, A. Shimamoto,D. Tsumune, T. Yoshimura, T. Aono, A. Hinuma, M.Kinugasa, K. Suzuki, Y. Sohrin, Y. Noiri, H. Tani, Y.
Deguchi, N. Tsurushima, H. Ogawa, K. Fukami, K. Kumaand T. Saino (2003): A mesoscale iron enrichment in thewestern subarctic Pacific induces large centric diatombloom. Science, 300, 958–961.
Tsuda, A., H. Kiyosawa, A. Kuwata, M. Mochizuki, N. Shiga,H. Saito, S. Chiba, K. Imai, J. Nishioka and T. Ono (2005a):Responses of diatoms to iron-enrichment (SEEDS) in thewestern subarctic Pacific, temporal and spatial comparisons.Prog. Oceanogr., 64, 189–205.
Tsuda, A., H. Saito, J. Nishioka and T. Ono (2005b):Mesozooplankton responses to iron-fertilization in the west-ern subarctic Pacific (SEEDS2001). Prog. Oceanogr., 64,237–251.
Tsuda, A., H. Saito, J. Nishioka, T. Ono, Y. Noiri and I. Kudo(2006): Mesozooplankton response to iron enrichment dur-ing the diatom bloom and bloom decline in SERIES (NEPacific). Deep-Sea Res. II, 53, 2281–2296.
Tsumune, D., J. Nishioka, A. Shimamoto, S. Takeda and A.Tsuda (2005): Physical behavior of the iron fertilized patchby SF6 tracer release experiment. Prog. Oceanogr., 64, 111–127.
Upstill-Goddard, R. C., A. J. Watson, P. S. Liss and M. I.Liddicoat (1990): Gas transfer velocities in lakes measuredwith SF6. Tellus, 42B, 364–377.
Welschmeyer, N. A. (1994): Fluorometric analysis of chloro-phyll-a in the presence of chlorophyll-b and phaeopigments.Limnol. Oceanogr., 39, 1985–1992.
Wong, C. S., W. K. Johnson, N. Sutherland, J. Nishioka, D. A.Timothy, M. Robert and S. Takeda (2006): Iron speciationand dynamics during SERIES, a mesoscale iron enrichmentexperiment in the NE Pacific. Deep-Sea Res. II, 53, 2075–2094.
Yoshie, N., M. Fujii and Y. Yamanaka (2005): Ecosystemchanges after the SEEDS iron fertilization in the westernNorth Pacific simulated by a one-dimensional ecosystemmodel. Prog. Oceanogr., 64, 283–306.
Zeldis, J. (2001): Mesozooplankton community composition,feeding, and export production during SOIREE. Deep-SeaRes. II, 48, 2615–2634.