Embed Size (px)
Citation preview

ISSN: 1524-4539 Copyright © 2006 American Heart Association. All rights reserved. Print ISSN: 0009-7322. Online
72514Circulation is published by the American Heart Association. 7272 Greenville Avenue, Dallas, TX
DOI: 10.1161/CIRCULATIONAHA.105.603050 2006;113;1768-1778; originally published online Apr 3, 2006; Circulation
Kim H. Parker and Jamil Mayet Aguado-Sierra, Keith Willson, Rodney A. Foale, Iqbal S. Malik, Alun D. Hughes,
Justin E. Davies, Zachary I. Whinnett, Darrel P. Francis, Charlotte H. Manisty, Jazmin Hypertrophy
Diastolic Coronary Filling in Humans, Attenuated in Left Ventricular Evidence of a Dominant Backward-Propagating "Suction" Wave Responsible for
http://circ.ahajournals.org/cgi/content/full/113/14/1768located on the World Wide Web at:
The online version of this article, along with updated information and services, is
http://www.lww.com/static/html/reprints.htmlReprints: Information about reprints can be found online at
[email protected], Baltimore, MD 21202-2436. Phone 410-5280-4050. Fax: 410-528-8550. Email: Permissions: Permissions & Rights Desk, Lippincott Williams & Wilkins, 351 West Camden
http://circ.ahajournals.org/subsriptions/Subscriptions: Information about subscribing to Circulation is online at
at Imperial College London (icl) on July 16, 2006 circ.ahajournals.orgDownloaded from

Evidence of a Dominant Backward-Propagating “Suction”Wave Responsible for Diastolic Coronary Filling in Humans,
Attenuated in Left Ventricular Hypertrophy
Justin E. Davies, MRCP; Zachary I. Whinnett, MRCP; Darrel P. Francis, MRCP; Charlotte H. Manisty, MRCP;Jazmin Aguado-Sierra, BE; Keith Willson, MSc; Rodney A. Foale, FRCP; Iqbal S. Malik, MRCP;
Alun D. Hughes, PhD; Kim H. Parker, PhD; Jamil Mayet, FRCP
Background—Coronary blood flow peaks in diastole when aortic blood pressure has fallen. Current models fail tocompletely explain this phenomenon. We present a new approach—using wave intensity analysis—to explain thisphenomenon in normal subjects and to evaluate the effects of left ventricular hypertrophy (LVH).
Method and Results—We measured simultaneous pressure and Doppler velocity with intracoronary wires in the left mainstem, left anterior descending, and circumflex arteries of 20 subjects after a normal coronary arteriogram. Wave intensityanalysis was used to identify and quantify individual pressure and velocity waves within the coronary artery circulation.A consistent pattern of 6 predominating waves was identified. Ninety-four percent of wave energy, accelerating bloodforward along the coronary artery, came from 2 waves: first a pushing wave caused by left ventricular ejection—thedominant forward-traveling pushing wave; and later a suction wave caused by relief of myocardial microcirculatorycompression—the dominant backward-traveling suction wave. The dominant backward-traveling suction wave(18.2�13.7�103 W m�2 s�1, 30%) was larger than the dominant forward-traveling pushing wave (14.3�17.6�103 Wm�2 s�1, 22.3%, P �0.001) and was associated with a substantially larger increment in coronary blood flow velocity (0.51versus 0.14 m/s, P�0.001). In LVH, the dominant backward-traveling suction wave percentage was significantly decreased(33.1% versus 26.9%, P�0.01) and inversely correlated with left ventricular septal wall thickness (r��0.52, P�0.02).
Conclusions—Six waves predominantly drive human coronary blood flow. Coronary flow peaks in diastole because of thedominance of a “suction” wave generated by myocardial microcirculatory decompression. This is significantly reducedin LVH. (Circulation. 2006;113:1768-1778.)
Key Words: arteries � blood flow � coronary disease � hypertrophy � microcirculation
The physical forces responsible for the coronary flowprofile remain poorly understood despite intensive study.
As elsewhere in the arterial circulation, ultimately it ispressure difference between the aorta and the peripheralcapillaries that provides the driving force for coronary bloodflow. However, unlike most other systemic vascular beds,blood flow in coronary arteries peaks in diastole rather thansystole, when blood pressure in the aorta is substantiallylower than the peak systolic pressure.
The effects of cardiac contraction on coronary flow wasfirst considered by Scaramucci1 in 1696, and the phasicnature of coronary blood flow and its relation to the contractile cycle of the heart was originally described by Gregg and
Editorial p 1721Clinical Perspective p 1778
Sabiston2 in 1957. Since then, the “vascular waterfall”3 and “in-tramyocardial pump”4 models have considered the importance ofincreasing myocardial pressure in impeding coronary blood flow.The “time-varying elastance”5 model described the importance ofleft ventricular stiffness and contraction of fibers surroundingintramyocardial blood vessels on coronary blood flow.6
Of these, the model that is best able to incorporate thedynamics of the cardiac cycle is the intramyocardial pump,4
which attributes systolic-diastolic variations in coronary flowto an active intramyocardial pump and not resistances varying
Received August 15, 2005; de novo received November 21, 2005; accepted January 23, 2006.From the International Centre for Circulatory Health, St Mary’s Hospital and Imperial College (J.E.D., Z.I.W., D.P.F., C.H.M., R.A.F., I.S.M., A.D.H.,
J.M.); the Department of Bioengineering, Physiological Flow Unit, Imperial College (J.A.-S., K.H.P.); and the Department of Clinical Engineering, RoyalBrompton Hospital (K.W.), London, United Kingdom.
The online-only Data Supplement can be found at http://circ.ahajournals.org/cgi/content/full/CIRCULATIONAHA.105.603050/DC1.Correspondence to Dr Justin Davies, International Centre for Circulatory Health, St Mary’s Hospital and Imperial College, 59-61 North Wharf Road,
Paddington, London W2 1LA, UK. E-mail [email protected]© 2006 American Heart Association, Inc.
Circulation is available at http://www.circulationaha.org DOI: 10.1161/CIRCULATIONAHA.105.603050
1768
Heart Failure

over the cardiac cycle. Like the other experiments,1–3,5,6 theexperiments studying the intramyocardial pump4 theory werehighly invasive and suitable only for animal experiments.
We wanted to develop a technique with finer temporalresolution that would allow us to address these dynamicinteractions within the cardiac cycle between proximal anddistal influences on coronary flow. It was important that thetechnique could be readily applied to living human subjects,so that normal human physiology and human pathophysiol-ogy could be ethically studied.
The combination of new measurement technology and newanalysis methodology has now made this possible. Miniatur-ized pressure- and flow-sensing wires suitable for use incoronary arteries of the living human are now available andapproved for clinical use (Volcano Therapeutics, Inc, for-merly Jomed, Inc, Rancho Cordova, Calif). Analysis of waveintensity7–9 explains phasic flow in terms of a series ofwavefronts that underlie the changes in pressure and flow inarteries. By quantifying these wavefronts, it is possible todetermine the relative importance of aortic and microcircu-latory contributions to coronary blood flow. This approachhas proved valuable in understanding the patterns of flow,pressure, and wave reflection in systemic arteries7,10–13 andhas recently been applied to the coronary arteries of animalmodels.9
By applying this technique to identify the nature of thewaves in human coronary arteries, we can cast light on howthe complex interaction of ventricle, coronary artery, andmyocardial microcirculation produce the recognizable coro-nary flow profile. We can also study the effect of conditionsthat may affect these waves. Left ventricular hypertrophy(LVH) is a classic example of such a condition, wheredistortion of myocardial architecture causes myocardial cellhypertrophy and fibrosis as well as intramyocardial arteriolarwall thickening and increased perivascular fibrosis.14 Suchstructural changes lead to physiological alterations resultingin a change in the coronary blood flow profile. Althoughstudies have demonstrated altered coronary flow reserve15
and coronary vascular resistance,16 neither is able to providea mechanistic explanation for the cause of the altered flowprofile.
In this study, we have applied wave intensity analysis tohuman coronary arteries to (1) identify and quantify thewaves driving human coronary artery blood flow; (2) usedirect measurement of waves of proximal (aortic) and distalorigin (myocardial microcirculation) to explain why coronaryflow peaks in diastole, when aortic blood pressure has alreadyfallen; and (3) determine whether waves arising from coro-nary artery microcirculation are altered in LVH.
MethodsSubjectsTwenty volunteers (mean age, 54�10 years; 13 female) wererecruited from patients scheduled for coronary angiography, inwhom coronary artery disease was considered a relatively lowprobability. Exclusion criteria included previous coronary interven-tion, valvular pathology, regional wall motion abnormality, rhythmother than sinus, or the use of nitrates in the preceding 24 hours. Allsubjects gave written informed consent in accordance with theprotocol approved by the local ethics committee.
Risk factors included hypertension (n�12), smoking (n�9),family history of ischemic heart disease (n�4), and hyperlipidemia(n�13 with total cholesterol �5 mmol/L). None of the subjects haddiabetes mellitus. Pharmacological therapy included aspirin (n�10),statins (n�8), calcium channel antagonists (n�2), �-blockers (n�5),angiotensin II blockers (n�1), ACE inhibitors (n�1), and �-blockers(n�1). None of the subjects took nitrates or nicorandil.
Before CatheterizationAlthough structural composition is considered to be the principaldeterminate of arterial physiology, many nonstructural physiologicalparameters have important regulatory roles. These may be influencedby physical, psychological, and pharmacological factors.
Physical FactorsTo minimize the effects of physical exertion, all subjects rested inbed for 1 hour before angiography. Subjects who smoke were notexcluded from the study but asked to refrain from smoking for 24hours. Similarly, subjects were required to refrain from coffee andalcohol for at least 12 hours before study. Subjects were also notstudied within 9 hours of eating.
Psychological FactorsTo minimize psychological stress, all subjects had careful explana-tion of the procedure during the consent phase and ample opportunityfor further clarification and reassurance.
Pharmacological FactorsAll oral and sublingual nitrates were stopped 24 hours before theprocedure.
Cardiac CatheterizationCardiac catheterization was undertaken through the femoral ap-proach. After diagnostic angiography, studies were closely inspectedby 2 operators for the presence of visual coronary artery disease.Only subjects with angiographically normal coronary arteries pro-ceeded to hemodynamic recordings.
Hemodynamic RecordingPressure and velocity recordings from aorta and coronary arterieswere made by using 0.014-inch diameter Wavewire and Flowwire(Volcano Therapeutics, Inc), respectively. Analogue output feedswere taken from the Wavewire and Flowwire consoles and ECG intoa National Instruments DAQ-Card AI-16E-4 (National Instruments,Austin, Tex) and acquired at 1 kHz, using Labview. Considerablecare was taken to ensure accurate alignment of pressure and velocitywires within the vessel. Once in situ, small rotational movementswere made to the Flowwire to obtain the peak Doppler bloodvelocity. Data were analyzed off-line, using a custom softwarepackage designed with Matlab (Mathworks, Inc, Natick, Mass).
Study ProtocolIn all subjects, after a normal coronary angiogram, the left coronarycirculation was then intubated with a Judkins left diagnostic catheter.A pressure and Doppler flow wire was then passed into the proximalsegment of the left main stem, left anterior descending, and circum-flex artery in turn. Wires were carefully positioned to ensure that thesensor tip of each wire was aligned. Simultaneous recording ofpressure and velocity was made for 1 minute at each location.Because precise alignment in time of the pressure and velocitysignals is important for this analysis, we performed a series of timingcalibration tests. In an in vitro preparation, we rapidly injected asmall bolus of saline and measured the time delay in the raw voltagesignals between the foot of the Doppler signal and the foot of thepressure waveform. A total of 62 injections were performed, and themean delay was 5.1 ms (95% confidence interval [CI], 4.4 to 5.8 ms).To correct for the difference in processing times of the 2 signals, wetherefore advanced all velocity signals in the clinical study by 5 ms.
Davies et al Driving Waves of Coronary Blood Flow 1769

Analysis of Hemodynamic DataThe recorded data were analyzed with the use of customized Matlabsoftware. The blood pressure and Doppler velocity recordings werefiltered by using a Savitzky-Golay filter17 and ensembled by usingthe ECG for timing. Mean wave intensity was calculated from theleft main stem, left anterior descending, and circumflex artery ineach patient. This mean wave intensity was used in all analysis. Inthe present study, we have considered diastole to start with the onsetof ventricular relaxation, as described by Wiggers.18
Identifying the Origin and Nature of a WaveWaves are responsible for directing the flow of blood in the coronaryartery circulation. These waves can originate from both the upstreamaortic (proximal origin) and downstream microcirculatory (distalorigin) ends of the artery and can either accelerate or decelerate theflow of blood. When only pressure or velocity alone is known at asingle site of measurement, it is not possible to determine the originand nature of a wave. To identify the origin and nature of thesewaves, it is necessary to have simultaneous recordings of pressureand velocity.
Increases in pressure can result in either acceleration or deceler-ation of blood, depending on the origin of the pressure wave (Table1). An increase in pressure originating from the aortic end (proximalorigin) of the vessel will accelerate blood velocity (Figure 1A). Incontrast, if the increase in pressure originates from the downstreammicrocirculatory end (distal origin), blood velocity will decelerate(Figure 2A). In both cases, the rise in pressure is considered by waveintensity theory to be as a result of a compression wave, which hasa “pushing” effect.
The opposite pattern is found with decreasing pressure. A decreasein pressure originating from the proximal end will decelerate bloodflow (Figure 2B), and a decrease originating from the distal end willaccelerate flow (Figure 1B). Any decrease in pressure is consideredby wave intensity theory to be a result of expansion waves, whichhave a “suction” effect.
Separating Coincident Waves From Proximal andDistal OriginsThe simple principles described above will identify the origin andnature of waves in most parts of the arterial circulation. However, inthe coronary arteries, waves from opposite ends of the artery canoccur simultaneously. To identify the origin and nature of theseoverlapping waves, some additional mathematical steps are required.The change in pressure is separated into wave components originat-ing from the proximal end (dP�) and distal end (dP�), using thefollowing formulas, where � is the density of blood (taken as 1050 kgm�3), c is the wave speed calculated using the single-point equationdescribed below,19 dP is the incremental change in coronary arterypressure, and dU the incremental change in blood velocity:
dP��1
2(dP��cdU)
dP��1
2(dP��cdU)
The wave originating proximally is given by dP�: Positive valuesindicate an accelerating wave, and negative values indicate adecelerating wave. The wave originating distally is given by dP�,where conversely positive values indicate a decelerating wave, andnegative values indicate an accelerating wave.
Calculation of Wave Speed in the Coronary ArteriesTo calculate wave intensity requires local measurement of wavespeed. We have used the single-point technique, which uses simul-taneous measurement of pressure and flow to determine wave speedin the following equation, where the sums are taken over an integernumber of cardiac cycles.19
c�1
���dP2
�dU2
Calculation of Coronary Artery Wave IntensityUsing wave intensity analysis, it is possible to separate and quantifythe waves present in the coronary artery circulation into thoseoriginating from (1) the proximal end (WI�) and (2) the distal end(WI�) of the artery. WInet represents the net wave intensity, the sumof WI� and WI�. We have used a convention of defining waveintensity as the product of the first time derivatives of pressure andvelocity, so that the results are independent of the sampling fre-quency used.20
WI��1
4�c�dP
dt��c
dU
dt �2
WI���1
4�c�dP
dt��c
dU
dt �2
WInet�WI��WI���dP
dt��dU
dt �Quantification of WavesCumulative wave intensity was calculated for each wave by mea-suring the area under the curve. The proportion of cumulative waveintensity was calculated by expressing the cumulative wave intensityfrom an individual wave as a percentage of total cumulative waveintensity in the cardiac cycle. The contribution of each wave tocoronary artery blood flow was calculated by measuring the corre-sponding velocity for each wave.
Calculation of Wave AccelerationOnce the values of dP and WI have been calculated, the origin andnature of any given wave is known. From these values, it is possibleto determine if the waves act to accelerate or decelerate the flow ofblood. In each of our figures, waves responsible for the accelerationof blood are shaded (black), and those decelerating are not shaded(white).
Statistical AnalysisThe statistical package Statview 5.0 (SAS Institute Inc, Cary, NC)was used for analyses. Continuous variables are reported as
Figure 1. Acceleration of blood in the human coronary arterycan occur from either (A) compression waves originating fromthe aortic end or (B) expansion waves originating from themicrocirculatory end.
TABLE 1. Origin and Nature of Waves From SimultaneousMeasurements of Pressure and Flow
Pressure Velocity Wave Origin Wave Nature
m m Aortic end (proximal origin) Accelerating
b , Microcirculatory end (distal origin) Decelerating
n b Microcirculatory end (distal origin) Accelerating
, , Aortic end (proximal origin) Decelerating
Figure 2. Deceleration of blood in the human coronary arterycan occur from either (A) compression waves originating fromthe microcirculatory end or (B) expansion waves originating fromthe aortic end.
1770 Circulation April 11, 2006

mean�SD at each location. Comparisons were made by using theStudent t test. Reproducibility of hemodynamic measurements wasassessed by using the Bland-Altman method. A probability value of�0.05 was taken as statistically significant.
ReproducibilityReproducibility of hemodynamic measurements was calculatedby examining, for each patient, separate 30-second recordings ofblood pressure and velocity. The standard deviation of thedifference, between these replicate recordings, of systolic bloodpressure was 5.2 mm Hg (3% of mean value), of diastolic bloodpressure was 1.9 mm Hg (2.5% of mean value), and of peakDoppler velocity was 0.057 m/s (10% of mean value).
The authors had full access to the data and take full responsibilityfor its integrity. All authors have read and agree to the manuscript aswritten.
ResultsPatient CharacteristicsAll subjects had good left ventricular systolic function onechocardiography. No subjects had evidence of either re-gional wall motion abnormalities or valvular abnormalities.
Ten subjects had LVH (septal wall thickness �1.2 cm). Themean septal wall thickness was 0.94�0.2 cm in the non-LVHgroup and 1.4�0.1 cm in the LVH group. Mean systolicblood pressure was 146�23 mm Hg and mean diastolic bloodpressure was 81�13 mm Hg. The mean blood pressure in theLVH group (148/82�21/9 mm Hg) was not significantlydifferent from the non-LVH group (143/80�26/16 mm Hg).The mean coronary blood flow velocity in LVH group(0.43�0.52 m/s) was not significantly different from thenon-LVH group (0.42�0.35 m/s, P �0.95).
Consistent Sequence of Waves in the Coronary ArteryWe identified 6 predominating waves in the cardiac cycle(Figure 3). These waves occur in the same sequence duringeach cardiac cycle. The sequence was the same in eachsubject, although the intensity and timing of the individualwaves differed between subjects. The wave profile was verysimilar in each of the left coronary arteries (Figure 4). Threecharacteristic waves were identified during ventricular con-traction, and 3 were associated with ventricular relaxation.
Figure 3. Identification of waves in the human circumflex artery, waves originating proximally (WI�, upper panel), wave originating dis-tally (WI�, middle panel). Coronary artery flow velocity and pressure is shown in the lower panel. Dashed line shows the onset of eachwave.
Davies et al Driving Waves of Coronary Blood Flow 1771

Although cumulative wave intensity values varied betweensubjects, the proportions of individual waves were compara-ble between subjects. Waves were characterized by theirorigin and direction of travel (forward-traveling waves orig-inating proximally and backward-traveling waves originatingdistally), character (pushing or suction), and effect on coro-nary blood flow velocity (acceleration of deceleration wave).
Energies of Waves in the Coronary ArteryPeak wave intensity and cumulative wave intensity (areaunder wave intensity curve) were measured for each wave.The proportion of cumulative wave intensity (expressed asa percentage) was also calculated (Table 2). Most waveintensity (55%) occurred in association with ventricularrelaxation.
The largest wave in the cardiac cycle occurred duringventricular relaxation (Figure 3, labeled ⑤ ), which accountedfor 30% of the cumulative wave intensity. During ventricularcontraction, the largest wave (Figure 3, labeled ② ) accountedfor only 22.3% of cumulative wave intensity. The incremen-tal increase in coronary flow velocity was significantly largerduring the ventricular relaxation (0.51�0.45 m/s) than duringthe ventricular contraction (0.14�0.16 m/s, P�0.001).
Abnormal Wave Intensity in LeftVentricular HypertrophyIn subjects with LVH, the same 6 predominant waves wereidentified and occurred in the same order, but the relativesizes of the waves were abnormal (Figure 5). The dominantbackward-traveling suction wave decreased with increasingleft ventricular septal wall thickness (r��0.52, P�0.02,Figure 6). The other waves were independent of left ventric-ular septal wall thickness.
A strong positive correlation was found between theearly-forward traveling pushing wave and the dominantbackward-traveling suction wave (r�0.51, P�0.02). Subjectswith LVH (septal wall thickness �1.2 cm) had only onequarter the increase in dominant backward-traveling suctionwave for each unit increase in early-forward traveling push-ing wave (regression slope�0.53) when compared withnon-LVH subjects (regression slope�1.98). The earlybackward-traveling pushing wave was also decreased insubjects with LVH (2.8% versus 0.97%, P�0.04).
Effects of Age on Waves and Coronary Wave SpeedAge has a significant effect on the cumulative wave intensityof individual waves. With increasing age, there was aprogressive increase in the forward-traveling suction wavepercentage (r�0.64, P�0.002, Figure 7). This wave was notsignificantly related to wall thickness (r��0.15, P�0.08)but was related to coronary artery wave speed (r�0.64,P�0.002).
The late backward-traveling pushing wave was also foundto decrease with increasing age (r��0.61, P�0.005). Theother waves were not significantly affected by age. There wasno association between wave intensities and any class ofpharmacological therapy taken.
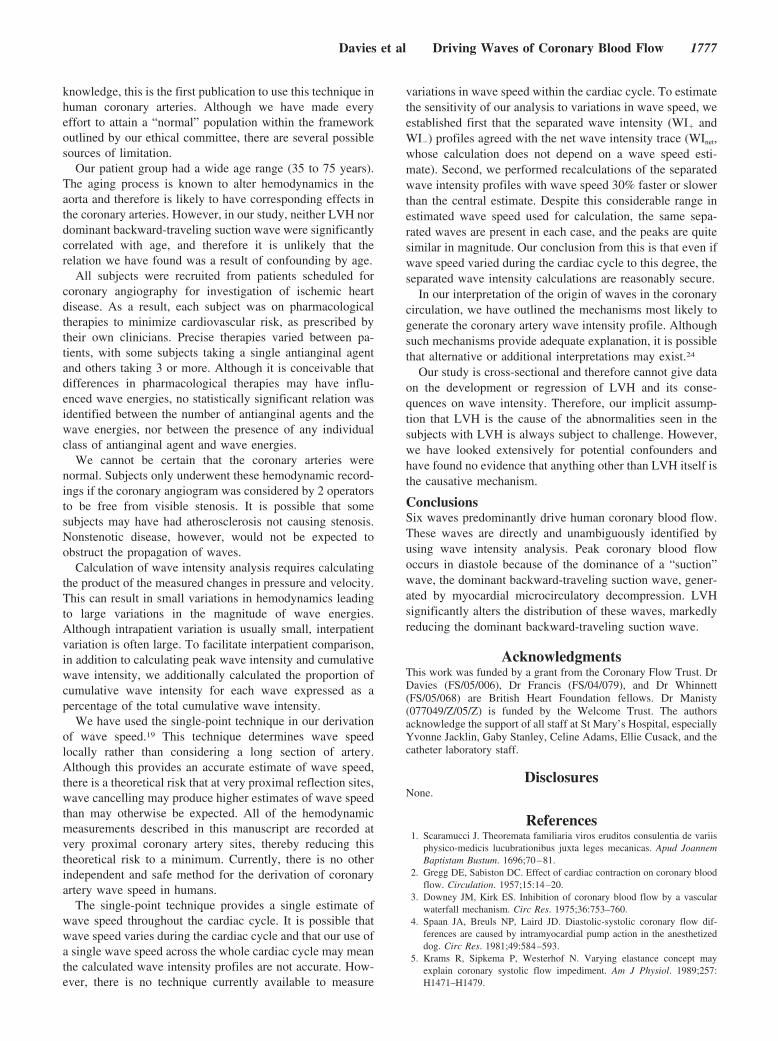
DiscussionIn this study, we have shown how wave intensity analysis canbe used to identify and quantify the pressure-velocity wavesin the human coronary artery. Second, we have found that the“suction” wave propagating backwards through the coronarytree during ventricular relaxation is the most important wavein the initiation of forward coronary blood flow. Third, thissuction wave is significantly reduced in subjects with LVH.
Figure 4. Identification of waves (WI� and WI�) in the humancircumflex artery (upper panel), left anterior descending (middlepanel), and left main stem (lower panel). Pressure and velocity isshown for each recording.
1772 Circulation April 11, 2006

Interpretation of the Origin of Waves in HumanCoronary ArteriesSimilar wave intensity patterns were identified in each subject’scoronary arteries. These occur as a result of interactions betweenthe aorta, coronary vasculature, and ventricle. Wave intensityanalysis identifies the origin and direction of travel (forward-
traveling waves originating proximally and backward-travelingwaves originating distally), character (pushing or suction), andeffect on coronary blood flow velocity (acceleration of deceler-ation wave). Thus, it is possible to quantify the contribution ofeach wave to the development of the recognizable coronary flowprofile during the cardiac cycle.
TABLE 2. Peak Wave Intensity, Cumulative Wave Intensity, and Cumulative Wave Intensity Percentage inthe Human Left Coronary Artery
Label onFigure 3 Wave Type
Peak Wave Intensity,�105 W m�2 s�2
Cumulative Wave Intensity,�103 W m�2 s�1
Proportion of CumulativeWave Intensity, %
➀ Early backward-traveling pushing wave �0.9�1 1.03�1.6 1.9�2.1
➁ Early forward-traveling pushing wave 6.1�19 14.3�17.6 22.3�7.9
➂ Late backward-traveling pushing wave �2.6�2.6 12.6�10.7 20.5�2.9
➃ Forward-traveling suction wave �2�1.4 11.2�8.7 18.9�4.0
➄ Backward-traveling suction wave 5.5�4.6 18.2�13.7 30�5.7
➅ Late forward-traveling pushing wave 2.3�2.4 4.0�4.0 6.1�2.4
Figure 5. Identification of waves in the human circumflex artery of a subject with left ventricular hypertrophy (septal wall thickness, 1.6cm), waves originating proximally (WI�, upper panel), waves originating distally (WI�, middle panel). Coronary artery flow velocity andpressure is shown in the lower panel.
Davies et al Driving Waves of Coronary Blood Flow 1773

Waves Occurring During Ventricular ContractionThe early backward-traveling pushing wave (labeled ① inFigures 3 and 8) originates from the microcirculation in earlysystole before opening of the aortic valve, when small vesselsthat permeate throughout the myocardial beds are compressedby the contracting ventricle, as described by Spaan et al4 inthe intramyocardial pump model. This pushing wave propa-gates backwards along the coronary artery toward the coro-nary ostium (illustrated in cartoon form in Movie I in theonline Data Supplement). Because of the severe impedancemismatch between the coronary artery and the aorta, a largeproportion of this wave is reflected back into the coronaryartery (as a suction wave, because this is an “open-ended”reflection). This reflection is seen almost simultaneouslybecause of the very short distance between the proximalcoronary artery (where the measurements are made) and thecoronary ostium. Both of these waves decelerate blood flowvelocity within the coronary artery.
The dominant forward-traveling pushing wave (labeled ②
in Figures 3 and 8) occurs early in systole and is caused byventricular ejection. The wave is transmitted from the lumenof the contracting ventricle into the aorta and thence into the
coronary artery. This wave continues along the coronaryartery until it meets a reflection site, such as a bifurcation ora microvascular bed, where a proportion of the wave isreflected back toward the coronary ostium, to contribute tothe late backward-traveling pushing wave (labeled ③ inFigures 3 and 8, and illustrated in Movie II in the online DataSupplement). The other contributor to this wave is compres-sion of the distal coronary microcirculation. Although both ofthese waves occur during ventricular contraction, the domi-nant forward-traveling pushing wave accelerates coronaryblood flow, whereas the late backward-traveling pushingwave acts to decelerate coronary blood flow velocity.
Waves Occurring During Ventricular RelaxationThe next wave in the coronary artery circulation begins as therate of contraction of the ventricular lumen is decreasing.21,22
This deceleration results in increasing “separation” tensionswithin the moving column of blood in the heart and aorta.Soon these tensions build sufficiently to form a detectablewave, which is transmitted along the aorta and into thecoronary artery. This forward-traveling suction wave (labeled④ in Figures 3 and 8, and illustrated in Movie III in the onlineData Supplement) has a suction action at the proximal end ofthe coronary artery and slows coronary artery blood flowvelocity.
Continuing ventricular relaxation eases the compressiveforces on the small vessels lying within the myocardium,which decreases the resistance of the microcirculation andlowers the pressure at the distal end of the coronary artery.This initiates a suction wave—the dominant backward-traveling suction wave (labeled ⑤ in Figures 3 and 8, andillustrated in Movie IV in the online Data Supplement)—causing blood to be accelerated forwards. There is a tug-of-war between these 2 competing suction waves originating fromopposite ends of the artery, overlapping in time. At first, theforward-traveling suction wave predominates, but later thedominant backward-traveling suction wave becomes dominantas the myocardium ceases to compress its small vessels.
The dominant backward-traveling suction wave continues asthe heart continues to relax, remaining the dominant wave untilit is briefly interrupted by the late forward-traveling pushingwave (labeled ⑥ in Figures 3 and 8). This wave originates fromthe proximal end of the artery, coinciding with closure of theaortic valve, when aortic pressure is briefly augmented. Thisproximal originating wave accelerates blood still further, aug-menting the actions of the distal acceleration wave in thecoronary artery. This wave is short-lived, as the dominantbackward-traveling suction wave once again becomes the dom-inant wave in the coronary artery.
Changes in Waves Occurring With AgeWave speed is well recognized to increase with age in theaorta through a process of vascular degeneration, but untilrecently, it has not been possible to measure wave speed inhuman coronary arteries. We have applied a recently de-scribed technique,19 using simultaneous measurements ofpressure and velocity, to derive coronary artery wave speed.We have found that with increasing age the forward-travelingsuction wave becomes more prominent. This may be ex-
Figure 6. Fall in backward-traveling suction wave percentagewith increasing left ventricular septal wall thickness.
Figure 7. Increase in the forward-traveling suction wave per-centage with increasing age.
1774 Circulation April 11, 2006

plained by increasing vascular stiffness (manifesting as in-creasing wave speed), which alters ventricular-arterial cou-pling, permitting a greater energy to be delivered into thecoronary artery. An alternative explanation could arise fromthe increased blood pressure augmentation in the aorta thatoccurs with age. Such changes would lead to a steeper declinein pressure (dP/dTmax) during ventricular relaxation and aconsequent increase in the magnitude of the forward-traveling suction wave.
In the coronary circulation, such increases in the forward-traveling suction wave would be deleterious to coronaryblood flow and could further enhance the tug-of-war betweenproximal and distal originating suction waves occurringduring ventricular relaxation. This could be further exacer-bated in subjects with LVH in whom the dominant backward-traveling suction wave is also reduced.
We have also found that the late backward-travelingpushing wave becomes smaller with increased age. This is the
Figure 8. Sequence of energy waves in the human coronary artery during the cardiac cycle. Arrows represent direction of wave motionrather than direction of blood flow.
Davies et al Driving Waves of Coronary Blood Flow 1775

opposite of what may be expected in other systemic arteries,in which increasing age leads to an increase in the magnitudeof wave reflection. However, the coronary circulation isunique as the late backward-traveling pushing wave is notsolely generated by passive reflection of the dominantforward-traveling pushing wave but also by compression ofthe intramyocardial vessels. These findings suggest thatcompression of the intramyocardial vessels may be of greatersignificance in the generation of the late backward-travelingpushing wave than wave reflection of the dominant forward-traveling pushing wave.
Wave Magnitude and Blood FlowThe timing of the wave may be as important as its magnitudein determining the effects of a wave on coronary bloodvelocity waveform. On first inspection, the dominantforward-traveling pushing wave appears to increase coronaryartery blood flow only modestly, whereas the dominantbackward-traveling suction wave (which is of a similarmagnitude) has a far greater effect. This paradox can beexplained by considering other waves that occur at the sametime in the cardiac cycle.
Let us start by considering the apparent reduction inefficacy of the dominant forward-traveling pushing wave.
The dominant forward-traveling pushing wave originatesproximally as the ventricle contracts, traveling along thecoronary artery and results in an increase in coronary flowvelocity. This wave is large, but it is rapidly opposed bywaves originating from the distal end of the vessel—the latebackward-traveling pushing wave—so that blood flow formsa plateau in early systole (Figure 3, at 140 ms in thevelocity trace). These distal-originating deceleration wavesoccur partly from wave reflection at bifurcation sites and themicrovascular beds and also as a result of continuing com-pression of the microcirculatory vessels as described by theintramyocardial pump model.4
The dominant backward-traveling suction wave occurs asthe ventricle continues to relax and myocardial compressionof small vessels wane. This wave has several advantages,allowing it to exert a large effect on coronary blood flowvelocity in comparison to the dominant forward-travelingpushing wave. First, the accelerating influence of this wave isnot opposed by its own reflections, because it is directedtoward an open end at the coronary ostium. Second, itsopposition (arising from suction generated by relaxation ofthe ventricular lumen) is much shorter-lived and thereforerelatively ineffectual in preventing a surge in flow. The surgecreated by the dominant backward-traveling suction wave isa well-recognized characteristic of coronary blood flowprofiles.
Thus, using magnitude and timings of these waves, it hasbeen possible to determine how the aorta, coronary artery,and ventricle interact to produce the characteristic coronaryflow profile. Application of this analytical technique maymake it possible to explain mechanisms by which patholog-ical processes such as LVH, lead to alterations in coronaryblood flow.
Left Ventricular Hypertrophy and Wave IntensitySubjects with LVH have the same 6 predominant waves asnormal subjects, but the distribution of energies is signifi-cantly altered. The most striking differences in subjects withLVH are (1) the dominant backward-traveling suction wavepercentage is decreased; and (2) the ratio between thedominant forward-traveling pushing wave and the dominantbackward-traveling suction waves are significantlydepressed.
Rather than considering each of these results in isolation,more insight can be gained by observing how these 2 wavesaffect each another. For any given increase in the dominantforward-traveling pushing wave, subjects with LVH had onlyone quarter the increase in dominant backward-travelingsuction wave that was seen in the subjects without LVH.
This is consistent with the suction wave arising fromenergy originally stored in the myocardium by ventricularsystole and consistent with severe disruption of this processin patients with LVH.
We speculate that in subjects with LVH, when diastolebecomes shortened such as occurs in exercise, the alreadyseverely attenuated dominant backward-traveling suctionwave may become critically impaired. Such a mechanism,afflicting the single wave responsible for the largest increasein coronary blood flow, may help explain why some subjectswith LVH and angiographically normal coronary arterieshave a reduction in coronary flow reserve15,16 and haveexertional angina.
Added Value From Arterial Wave Intensity AnalysisMeasurements of coronary flow reserve23 by previous inves-tigators have yielded extensive experience of coronary flowvelocity in healthy subjects and identified key differences indisease states, especially coronary stenosis.15 The coronaryflow profile is the effect and not the cause of the underlyingwaves, however. If the coronary system had only one possiblesite of origin of waves, the blood flow profile could be fullyinformative. Yet, in reality, coronary waves originate fromboth ends of the tree, and therefore the flow profile alonecannot identify the relative contributions of the aorta, coro-nary artery, and intramyocardial vessels.
Investigators studying abnormalities such as LVH haverealized that measuring blood flow alone cannot measure theeffects of coronary microcirculatory disease directly. This hasled to the use of vasodilating drugs to expose abnormalities inthe coronary microcirculation by preferentially reducing mi-crocirculatory resistance, thus indirectly measuring a conse-quence of the dominant backward-traveling suction wave.Wave intensity analysis allows this wave to be measureddirectly.
Wave intensity analysis could also be applied to studyother disease processes such as coronary stenosis, microcir-culatory disease, or abnormalities of ventricular function. Itmay even help resolve contention over mechanistic explana-tions, for example in the no-reflow phenomenon.
Study LimitationsThe present study offers a new technique for assessment ofthe waves responsible for coronary artery blood flow. To our
1776 Circulation April 11, 2006
knowledge, this is the first publication to use this technique inhuman coronary arteries. Although we have made everyeffort to attain a “normal” population within the frameworkoutlined by our ethical committee, there are several possiblesources of limitation.
Our patient group had a wide age range (35 to 75 years).The aging process is known to alter hemodynamics in theaorta and therefore is likely to have corresponding effects inthe coronary arteries. However, in our study, neither LVH nordominant backward-traveling suction wave were significantlycorrelated with age, and therefore it is unlikely that therelation we have found was a result of confounding by age.
All subjects were recruited from patients scheduled forcoronary angiography for investigation of ischemic heartdisease. As a result, each subject was on pharmacologicaltherapies to minimize cardiovascular risk, as prescribed bytheir own clinicians. Precise therapies varied between pa-tients, with some subjects taking a single antianginal agentand others taking 3 or more. Although it is conceivable thatdifferences in pharmacological therapies may have influ-enced wave energies, no statistically significant relation wasidentified between the number of antianginal agents and thewave energies, nor between the presence of any individualclass of antianginal agent and wave energies.
We cannot be certain that the coronary arteries werenormal. Subjects only underwent these hemodynamic record-ings if the coronary angiogram was considered by 2 operatorsto be free from visible stenosis. It is possible that somesubjects may have had atherosclerosis not causing stenosis.Nonstenotic disease, however, would not be expected toobstruct the propagation of waves.
Calculation of wave intensity analysis requires calculatingthe product of the measured changes in pressure and velocity.This can result in small variations in hemodynamics leadingto large variations in the magnitude of wave energies.Although intrapatient variation is usually small, interpatientvariation is often large. To facilitate interpatient comparison,in addition to calculating peak wave intensity and cumulativewave intensity, we additionally calculated the proportion ofcumulative wave intensity for each wave expressed as apercentage of the total cumulative wave intensity.
We have used the single-point technique in our derivationof wave speed.19 This technique determines wave speedlocally rather than considering a long section of artery.Although this provides an accurate estimate of wave speed,there is a theoretical risk that at very proximal reflection sites,wave cancelling may produce higher estimates of wave speedthan may otherwise be expected. All of the hemodynamicmeasurements described in this manuscript are recorded atvery proximal coronary artery sites, thereby reducing thistheoretical risk to a minimum. Currently, there is no otherindependent and safe method for the derivation of coronaryartery wave speed in humans.
The single-point technique provides a single estimate ofwave speed throughout the cardiac cycle. It is possible thatwave speed varies during the cardiac cycle and that our use ofa single wave speed across the whole cardiac cycle may meanthe calculated wave intensity profiles are not accurate. How-ever, there is no technique currently available to measure
variations in wave speed within the cardiac cycle. To estimatethe sensitivity of our analysis to variations in wave speed, weestablished first that the separated wave intensity (WI� andWI�) profiles agreed with the net wave intensity trace (WInet,whose calculation does not depend on a wave speed esti-mate). Second, we performed recalculations of the separatedwave intensity profiles with wave speed 30% faster or slowerthan the central estimate. Despite this considerable range inestimated wave speed used for calculation, the same sepa-rated waves are present in each case, and the peaks are quitesimilar in magnitude. Our conclusion from this is that even ifwave speed varied during the cardiac cycle to this degree, theseparated wave intensity calculations are reasonably secure.
In our interpretation of the origin of waves in the coronarycirculation, we have outlined the mechanisms most likely togenerate the coronary artery wave intensity profile. Althoughsuch mechanisms provide adequate explanation, it is possiblethat alternative or additional interpretations may exist.24
Our study is cross-sectional and therefore cannot give dataon the development or regression of LVH and its conse-quences on wave intensity. Therefore, our implicit assump-tion that LVH is the cause of the abnormalities seen in thesubjects with LVH is always subject to challenge. However,we have looked extensively for potential confounders andhave found no evidence that anything other than LVH itself isthe causative mechanism.
ConclusionsSix waves predominantly drive human coronary blood flow.These waves are directly and unambiguously identified byusing wave intensity analysis. Peak coronary blood flowoccurs in diastole because of the dominance of a “suction”wave, the dominant backward-traveling suction wave, gener-ated by myocardial microcirculatory decompression. LVHsignificantly alters the distribution of these waves, markedlyreducing the dominant backward-traveling suction wave.
AcknowledgmentsThis work was funded by a grant from the Coronary Flow Trust. DrDavies (FS/05/006), Dr Francis (FS/04/079), and Dr Whinnett(FS/05/068) are British Heart Foundation fellows. Dr Manisty(077049/Z/05/Z) is funded by the Welcome Trust. The authorsacknowledge the support of all staff at St Mary’s Hospital, especiallyYvonne Jacklin, Gaby Stanley, Celine Adams, Ellie Cusack, and thecatheter laboratory staff.
DisclosuresNone.
References1. Scaramucci J. Theoremata familiaria viros eruditos consulentia de variis
physico-medicis lucubrationibus juxta leges mecanicas. Apud JoannemBaptistam Bustum. 1696;70–81.
2. Gregg DE, Sabiston DC. Effect of cardiac contraction on coronary bloodflow. Circulation. 1957;15:14–20.
3. Downey JM, Kirk ES. Inhibition of coronary blood flow by a vascularwaterfall mechanism. Circ Res. 1975;36:753–760.
4. Spaan JA, Breuls NP, Laird JD. Diastolic-systolic coronary flow dif-ferences are caused by intramyocardial pump action in the anesthetizeddog. Circ Res. 1981;49:584–593.
5. Krams R, Sipkema P, Westerhof N. Varying elastance concept mayexplain coronary systolic flow impediment. Am J Physiol. 1989;257:H1471–H1479.
Davies et al Driving Waves of Coronary Blood Flow 1777

6. Downey JM, Downey HF, Kirk ES. Effects of myocardial strains oncoronary blood flow. Circ Res. 1974;34:286–292.
7. Jones CJ, Parker KH, Hughes R, Sheridan DJ. Nonlinearity of humanarterial pulse wave transmission. J Biomech Eng. 1992;114:10–14.
8. Parker KH, Jones CJ. Forward and backward running waves in thearteries: analysis using the method of characteristics. J Biomech Eng.1990;112:322–326.
9. Sun YH, Anderson TJ, Parker KH, Tyberg JV. Wave-intensity analysis: a newapproach to coronary hemodynamics. J Appl Physiol. 2000;89:1636–1644.
10. Jones CJ, Sugawara M. ‘Wavefronts’ in the aorta: implications for themechanisms of left ventricular ejection and aortic valve closure. Car-diovasc Res. 1993;27:1902–1905.
11. Jones CJ, Sugawara M, Kondoh Y, Uchida K, Parker KH. Compressionand expansion wavefront travel in canine ascending aortic flow: waveintensity analysis. Heart Vessels. 2002;16:91–98.
12. Khir AW, Henein MY, Koh T, Das SK, Parker KH, Gibson DG. Arterialwaves in humans during peripheral vascular surgery. Clin Sci (Lond).2001;101:749–757.
13. Ohte N, Narita H, Sugawara M, Niki K, Okada T, Harada A, Hayano J,Kimura G. Clinical usefulness of carotid arterial wave intensity inassessing left ventricular systolic and early diastolic performance. HeartVessels. 2003;18:107–111.
14. Schwartzkopff B, Frenzel H, Dieckerhoff J, Betz P, Flasshove M, SchulteHD, Mundhenke M, Motz W, Strauer BE. Morphometric investigation ofhuman myocardium in arterial hypertension and valvular aortic stenosis.Eur Heart J. 1992;13(suppl D):17–23.
15. Houghton JL, Frank MJ, Carr AA, von Dohlen TW, Prisant LM.Relations among impaired coronary flow reserve, left ventricular hyper-trophy and thallium perfusion defects in hypertensive patients withoutobstructive coronary artery disease. J Am Coll Cardiol. 1990;15:43–51.
16. Schwartzkopff B, Motz W, Frenzel H, Vogt M, Knauer S, Strauer BE.Structural and functional alterations of the intramyocardial coronary arte-rioles in patients with arterial hypertension. Circulation. 1993;88:993–1003.
17. Savitzky A, Golay MJE. Smoothing and differentiation of data by sim-plified least squares procedures. Anal Chem. 1964;36:1627–1639.
18. Wiggers CJ. Studies on the consecutive phases of the cardiac cycle: theduration of the consecutive phases of the cardiac cycle and the criteria fortheir precise determination. Am J Physiol. 1921;56:415–438.
19. Davies JE, Whinnett ZI, Francis DP, Willson K, Foale RA, Malik IS,Hughes AD, Parker KH, Mayet J. Use of simultaneous pressure andvelocity measurements to estimate arterial wave speed at a single site inhumans. Am J Physiol Heart Circ Physiol. 2006;290:H878–H885.
20. Niki K, Sugawara M, Chang D, Harada A, Okada T, Sakai R, Uchida K,Tanaka R, Mumford CE. A new noninvasive measurement system forwave intensity: evaluation of carotid arterial wave intensity and repro-ducibility. Heart Vessels. 2002;17:12–21.
21. Sugawara M, Uchida K, Kondoh Y, Magosaki N, Niki K, Jones CJ,Sugimachi M, Sunagawa K. Aortic blood momentum: the more the betterfor the ejecting heart in vivo? Cardiovasc Res. 1997;33:433–446.
22. Noble MI. The contribution of blood momentum to left ventricularejection in the dog. Circ Res. 1968;23:663–670.
23. Pijls NH, van Son JA, Kirkeeide RL, De Bruyne B, Gould KL. Experi-mental basis of determining maximum coronary, myocardial, and col-lateral blood flow by pressure measurements for assessing functionalstenosis severity before and after percutaneous transluminal coronaryangioplasty. Circulation. 1993;87:1354–1367.
24. Spaan JA. Mechanical determinants of myocardial perfusion. Basic ResCardiol. 1995;90:89–102.
CLINICAL PERSPECTIVECoronary blood flow profile is unique, generated by interactions between the coronary arteries, cardiac myocardium, andaorta. These vascular beds influence coronary blood flow through a series of waves. We present a new technique, waveintensity analysis, which enables the magnitude, direction, and effect of each of these waves to be measured directly. Byusing this technique, we have identified a series of 6 predominating waves that are responsible for coronary blood flow.Waves are classified according to their origin (either aortic or coronary microcirculation) and nature (either pushing orsucking). The majority of coronary blood flow occurs in diastole as a suction wave generated by the relaxing coronarymicrocirculation accelerates blood flow. This wave sucks blood into the coronary microcirculation. In subjects with leftventricular hypertrophy, this suction wave was significant decreased (33.1% versus 26.9%, P�0.01) and inverselycorrelated with left ventricular septal wall thickness (r��0.52, P�0.02). These differences illustrate how wave intensityanalysis can be used to identify differences in the waves responsible for coronary blood flow. This may be a sensitive toolfor investigation of cardiac disease pathology.
1778 Circulation April 11, 2006