Embed Size (px)
Citation preview
1
Evidence of Fraud in Conjunction with Use of Dominion BMD Machines
Data from Public Sources Compiled by DataScience
in Coordination with BASEDMedia
17 December 2020
Data Used: 2020 Votes by County, 2017 US Census demographics by county, 2018 and 2020
U.S. Election Assistance Committee voting machine information. All data is publicly available.
Overview
DataScience used multiple statistical tools and techniques to examine if the use of voting
machines manufactured by different companies affected 2020 US election results. Analysis
evidence suggests the use of the Dominion X/ICX BMD (Ballot Marking Device) machine,
manufactured by Dominion Voting Systems, and machines from HART InterCivic appear to
have abnormally influenced election results
Key Findings:
- In counties using Dominion BMD voting machines, candidate Biden appears to have
consistently received 5.6 % more votes than he should have received
- Biden over-performed predicted/expected values in 78 % of the counties that used
Dominion or Hart machines. In counties with other machines, Biden over-performed only
46% of the time (anything close to 50% is normal/expected)
Methodology
The research used a two-phased approach. Phase one developed a predictive model which
accurately predicts Biden’s expected 2020 election results in every U.S. county. Phase two used
the results from Phase One to investigate if results from counties using machines from Dominion
Voting Systems, or any other type of machine, were significantly different from results from
other counties.
2
Phase One
Our data included votes for each county in the United States and U.S. Census variables from
2017. We conducted multiple-regression analyses using U.S. Census data to develop a
model/equation to predict in any county what percentage of the vote could reasonably be
expected to go to candidate Biden. While naturally the percentage Biden actually achieved in
each county fluctuates from the predicted value, we found for most counties the model does a
good job in predicting what should be Biden’s percentage of votes won. (A few counties in
some States are outliers. See our analysis paper “Identification of Counties with Potential
Fraudulent Vote Counts”)
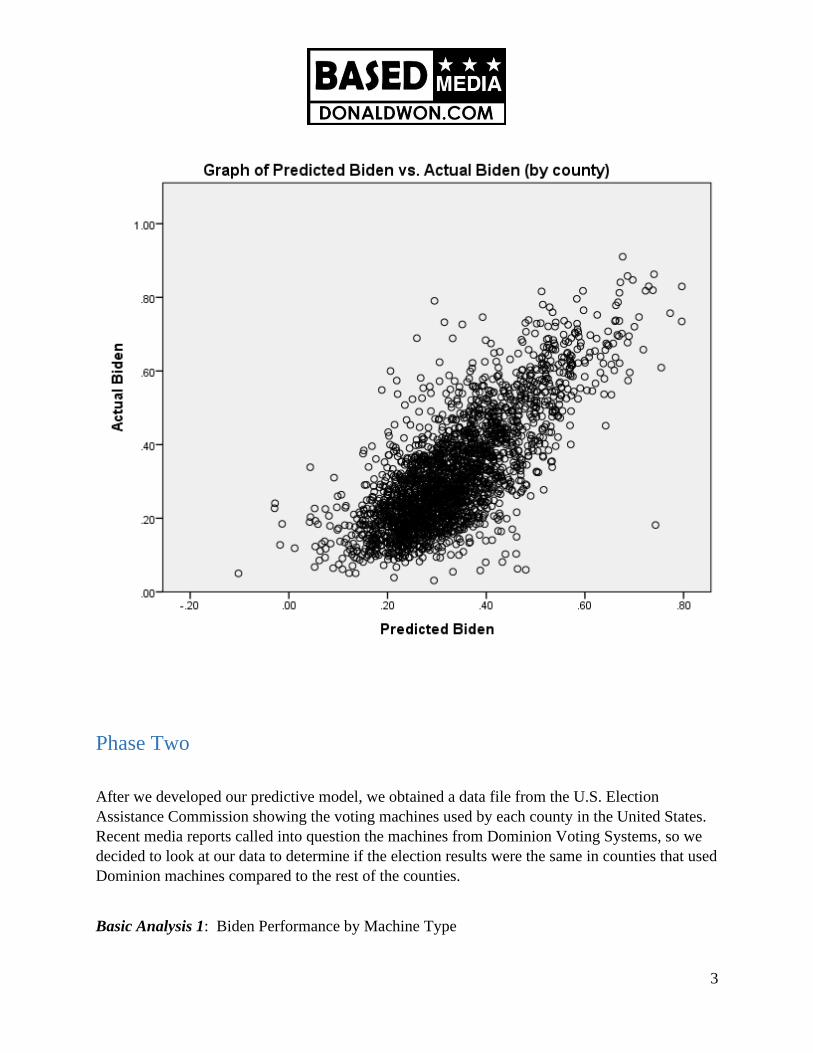
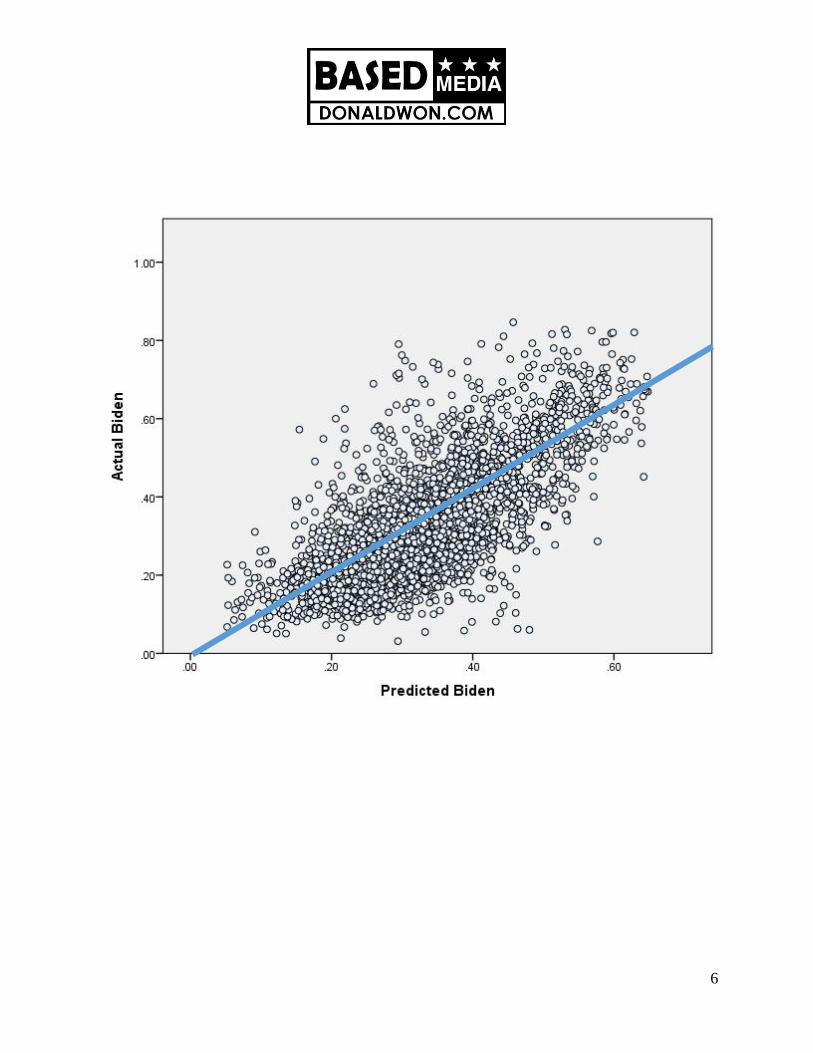
The graph below shows, for each county, our predicted values for Biden plotted against the
actual/final tally attributed to Biden. (Note the values go from .00 (0% for Biden) to 1 (100% for
Biden)). As evidenced in the graph, the predictive model does a good job of predicting actual
values for Biden – with the actual values for Biden being scattered seemingly “randomly” above
and below an unseen centerline. There are some data points that are outliers – which could
indicate fraudulent data in those counties. However, overall the model does a good job of
predicting actual Biden vote percentages.
3
Phase Two
After we developed our predictive model, we obtained a data file from the U.S. Election
Assistance Commission showing the voting machines used by each county in the United States.
Recent media reports called into question the machines from Dominion Voting Systems, so we
decided to look at our data to determine if the election results were the same in counties that used
Dominion machines compared to the rest of the counties.
Basic Analysis 1: Biden Performance by Machine Type
4
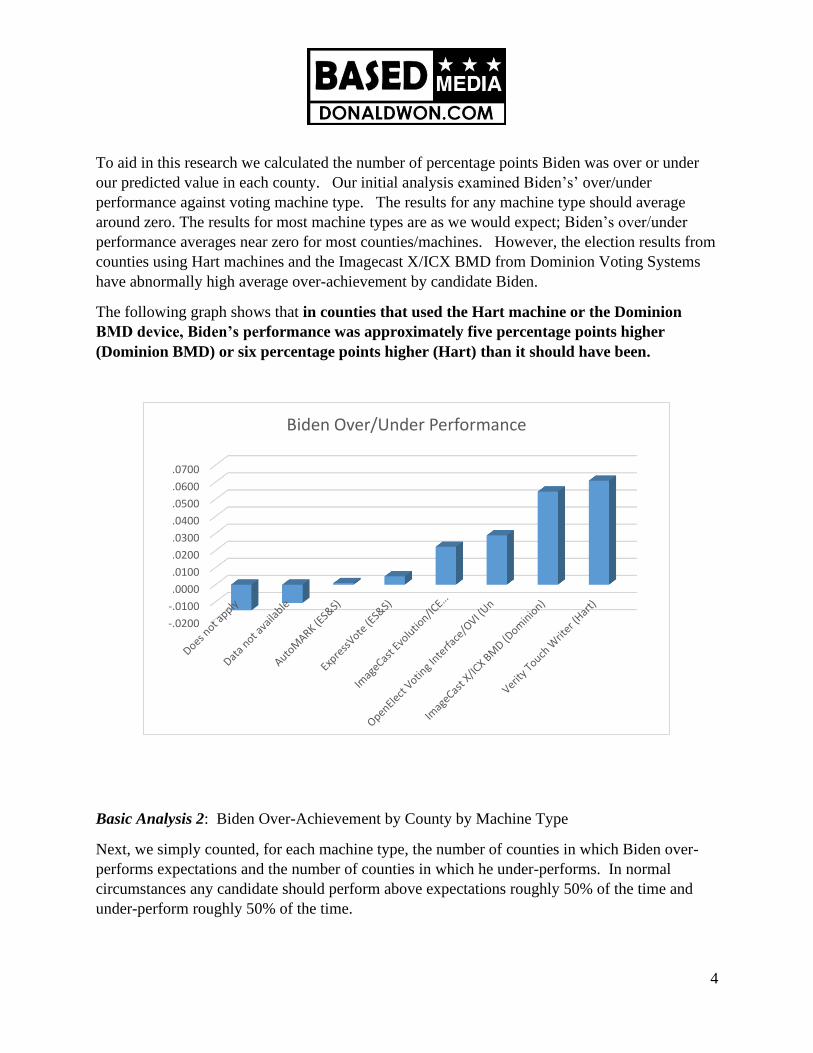
To aid in this research we calculated the number of percentage points Biden was over or under
our predicted value in each county. Our initial analysis examined Biden’s’ over/under
performance against voting machine type. The results for any machine type should average
around zero. The results for most machine types are as we would expect; Biden’s over/under
performance averages near zero for most counties/machines. However, the election results from
counties using Hart machines and the Imagecast X/ICX BMD from Dominion Voting Systems
have abnormally high average over-achievement by candidate Biden.
The following graph shows that in counties that used the Hart machine or the Dominion
BMD device, Biden’s performance was approximately five percentage points higher
(Dominion BMD) or six percentage points higher (Hart) than it should have been.
Basic Analysis 2: Biden Over-Achievement by County by Machine Type
Next, we simply counted, for each machine type, the number of counties in which Biden over-
performs expectations and the number of counties in which he under-performs. In normal
circumstances any candidate should perform above expectations roughly 50% of the time and
under-perform roughly 50% of the time.
-.0200
-.0100
.0000
.0100
.0200
.0300
.0400
.0500
.0600
.0700
Biden Over/Under Performance
5
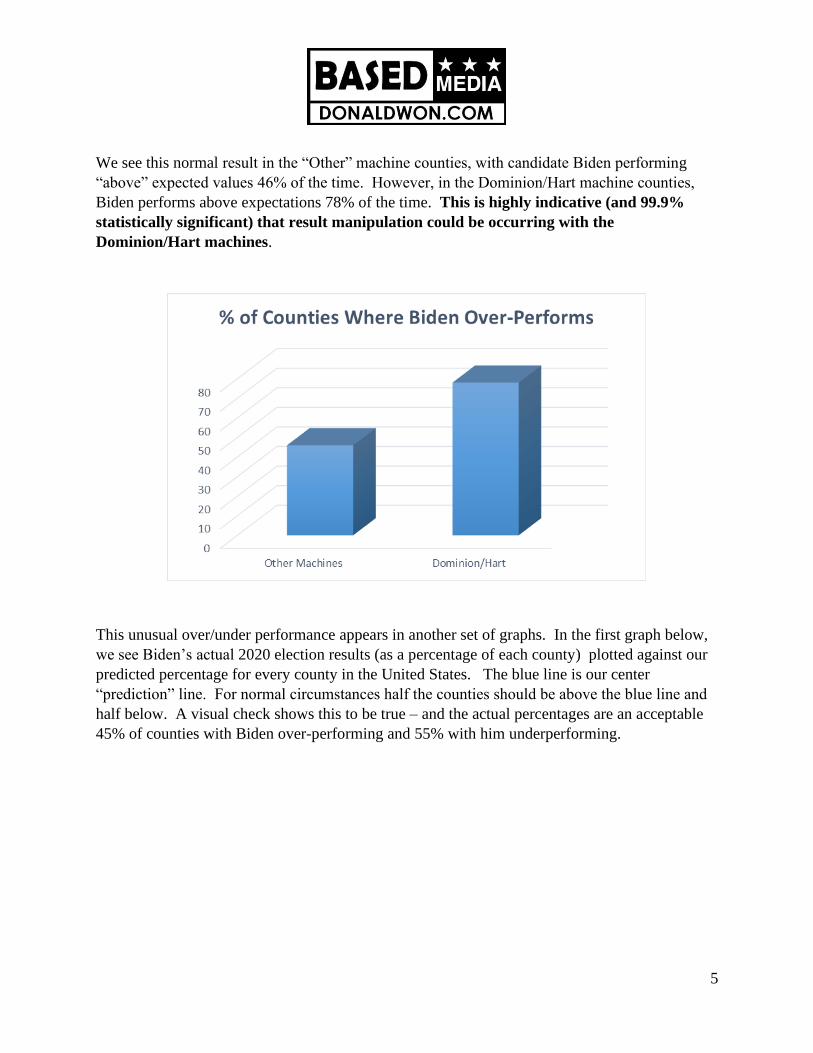
We see this normal result in the “Other” machine counties, with candidate Biden performing
“above” expected values 46% of the time. However, in the Dominion/Hart machine counties,
Biden performs above expectations 78% of the time. This is highly indicative (and 99.9%
statistically significant) that result manipulation could be occurring with the
Dominion/Hart machines.
This unusual over/under performance appears in another set of graphs. In the first graph below,
we see Biden’s actual 2020 election results (as a percentage of each county) plotted against our
predicted percentage for every county in the United States. The blue line is our center
“prediction” line. For normal circumstances half the counties should be above the blue line and
half below. A visual check shows this to be true – and the actual percentages are an acceptable
45% of counties with Biden over-performing and 55% with him underperforming.
6
7
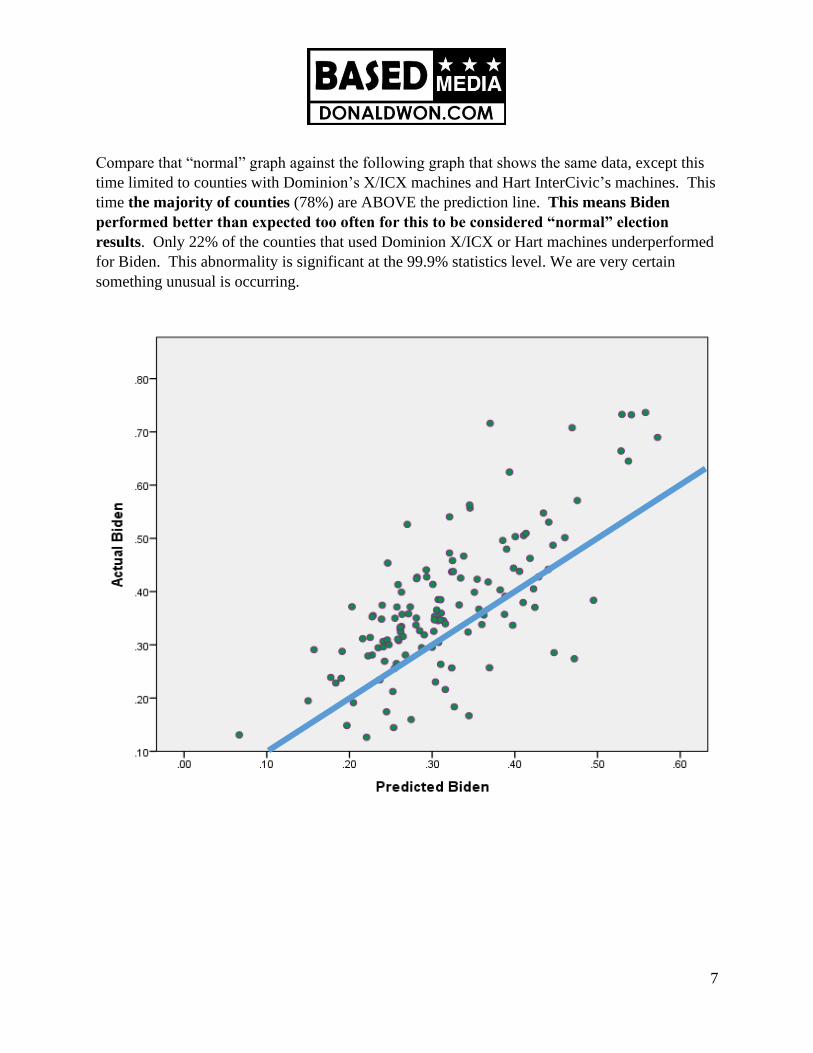
Compare that “normal” graph against the following graph that shows the same data, except this
time limited to counties with Dominion’s X/ICX machines and Hart InterCivic’s machines. This
time the majority of counties (78%) are ABOVE the prediction line. This means Biden
performed better than expected too often for this to be considered “normal” election
results. Only 22% of the counties that used Dominion X/ICX or Hart machines underperformed
for Biden. This abnormality is significant at the 99.9% statistics level. We are very certain
something unusual is occurring.
8
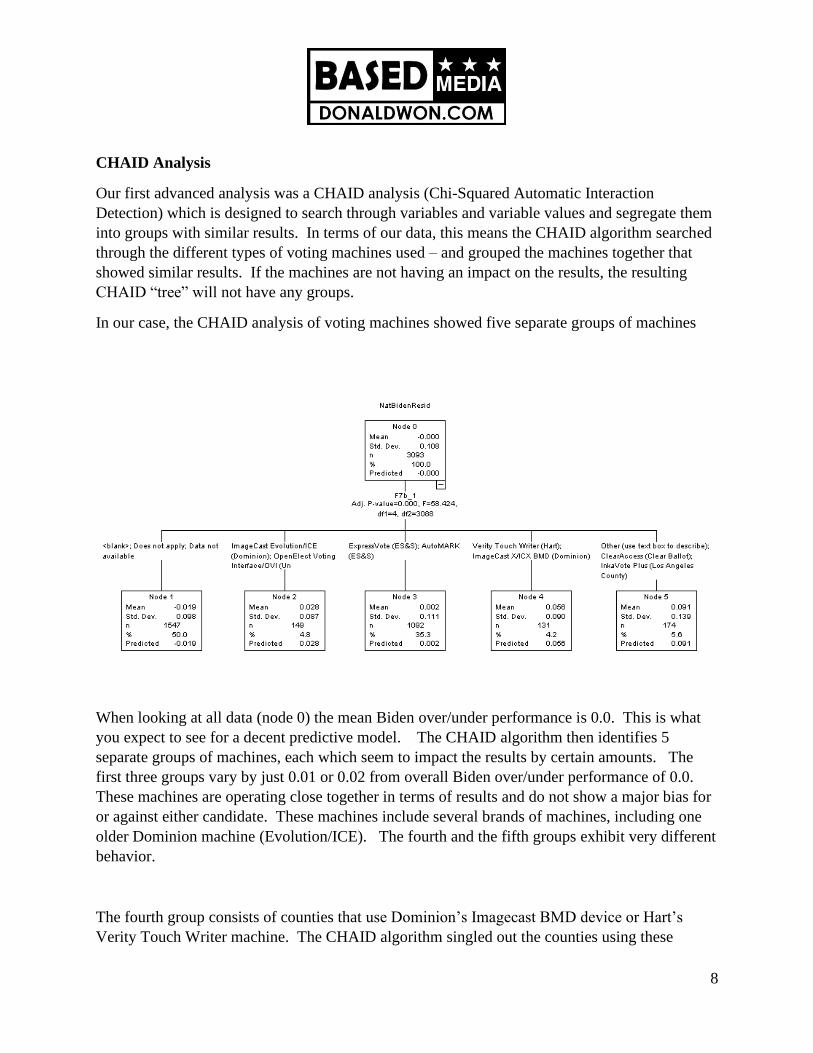
CHAID Analysis
Our first advanced analysis was a CHAID analysis (Chi-Squared Automatic Interaction
Detection) which is designed to search through variables and variable values and segregate them
into groups with similar results. In terms of our data, this means the CHAID algorithm searched
through the different types of voting machines used – and grouped the machines together that
showed similar results. If the machines are not having an impact on the results, the resulting
CHAID “tree” will not have any groups.
In our case, the CHAID analysis of voting machines showed five separate groups of machines
When looking at all data (node 0) the mean Biden over/under performance is 0.0. This is what
you expect to see for a decent predictive model. The CHAID algorithm then identifies 5
separate groups of machines, each which seem to impact the results by certain amounts. The
first three groups vary by just 0.01 or 0.02 from overall Biden over/under performance of 0.0.
These machines are operating close together in terms of results and do not show a major bias for
or against either candidate. These machines include several brands of machines, including one
older Dominion machine (Evolution/ICE). The fourth and the fifth groups exhibit very different
behavior.
The fourth group consists of counties that use Dominion’s Imagecast BMD device or Hart’s
Verity Touch Writer machine. The CHAID algorithm singled out the counties using these
9
machines. Results had an average of 5.5 percentage points above the overall Node 0 mean of -
0.012. This means in counties using the Dominion or Hart machines, Biden received 5.5
percentage points higher than he was expected to achieve – or likely would have achieved if
the counties used any other type of machine.
[The fifth group consists of machines specifically delineated in the U.S. Election Assistance
Commission data as “other”, InkaVote (LA County), or ClearBallot. While these
machines/counties may warrant additional investigation, they were used in relatively few
counties (InkaVote one county (LA county, CA), ClearBallot only eleven counties) so they were
dropped from further investigation.]
The above findings are statistically significant at the 99.9% level or higher
Graphical Analysis
The CHAID analysis indicated the Dominion and Hart machines produced results on average
5.6% higher than they should have been compared to counties with other machines. The next
question to answer was whether this average of 5.6% was from relatively few counties having
extraordinarily high results for Biden, or if several of the “Dominion” counties were showing
unusually high results.
A graph (shown next page) clearly shows that the votes from counties using Dominion machine
follows a distinct and unusual pattern, which is in fact a very predictable mathematical pattern.
If the Dominion counties were acting as they should – like all the other counties – then the green
dots (representing Biden’s results in counties with Dominion/Hart machines) in the graph below
would overlay the blue dots (Biden results in all other counties) in a similar, “mixed up”/random
fashion.
We do not see this.
Instead, we see the green dots centered higher than the center of the blue dots, meaning the
Dominion counties were, on average, performing continuously above the predicted values
for Biden had the counties used any other machines. This indicates the potential fraud was
widespread and impacted vote counts in a systematic method across many machines and
counties.
10
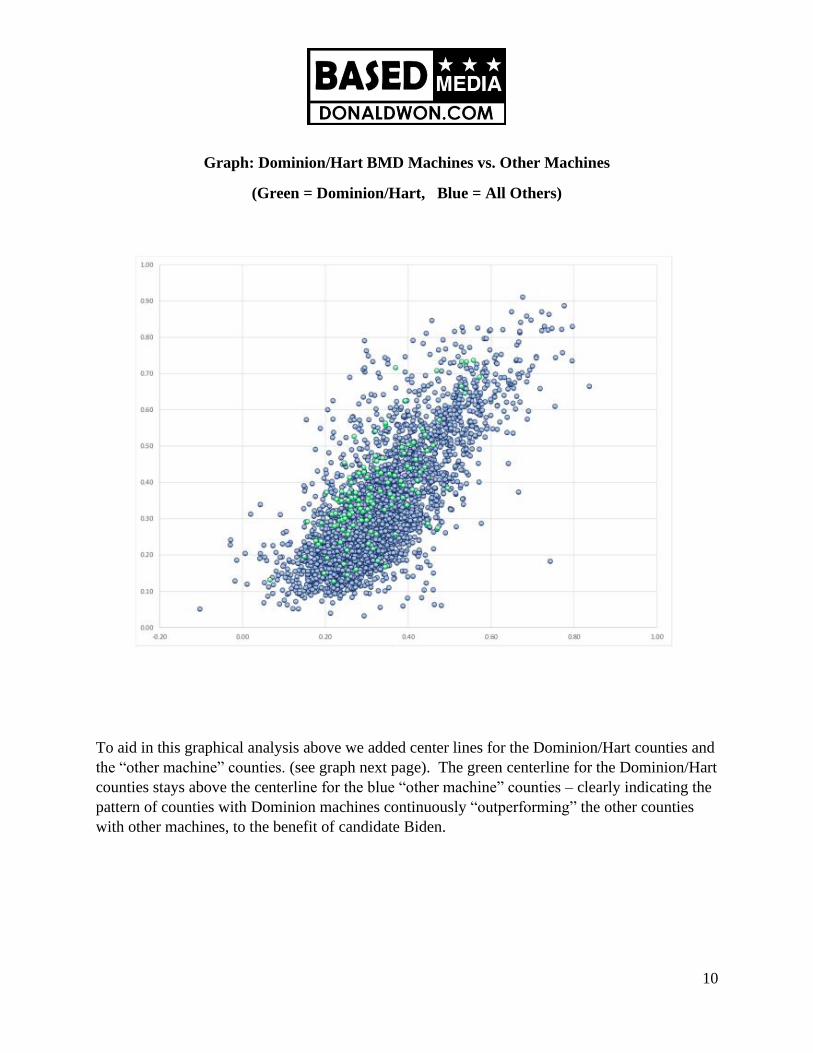
Graph: Dominion/Hart BMD Machines vs. Other Machines
(Green = Dominion/Hart, Blue = All Others)
To aid in this graphical analysis above we added center lines for the Dominion/Hart counties and
the “other machine” counties. (see graph next page). The green centerline for the Dominion/Hart
counties stays above the centerline for the blue “other machine” counties – clearly indicating the
pattern of counties with Dominion machines continuously “outperforming” the other counties
with other machines, to the benefit of candidate Biden.
11
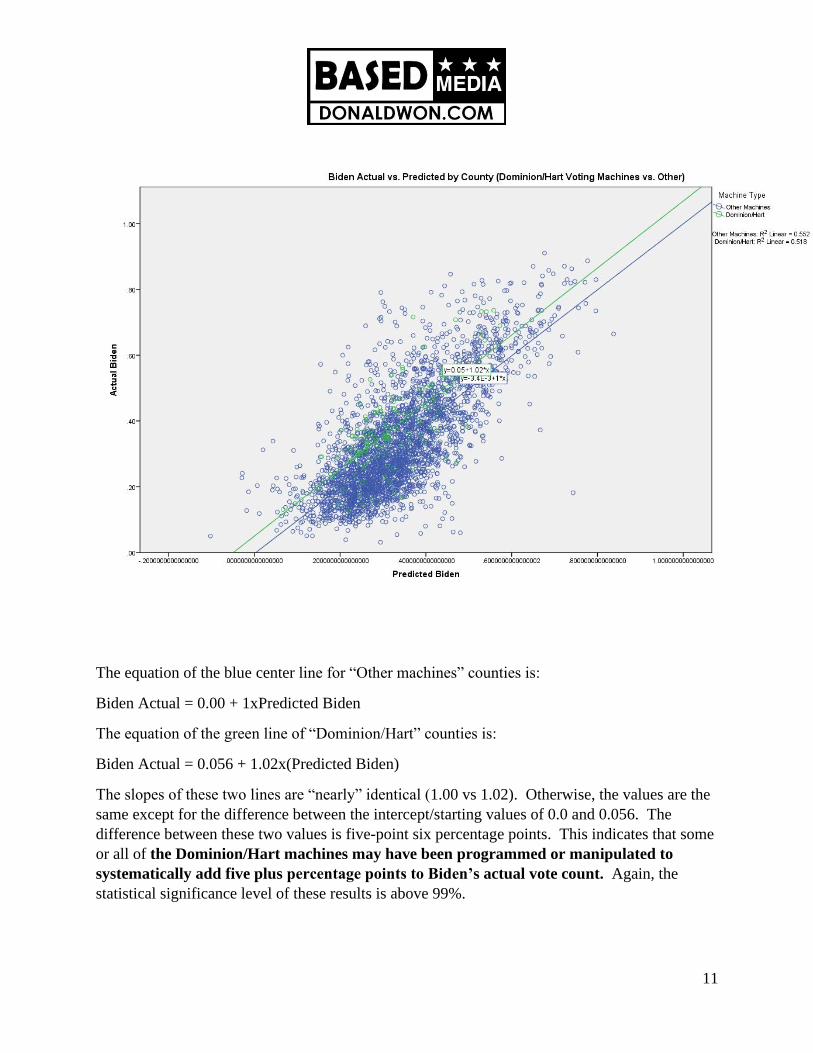
The equation of the blue center line for “Other machines” counties is:
Biden Actual = 0.00 + 1xPredicted Biden
The equation of the green line of “Dominion/Hart” counties is:
Biden Actual = 0.056 + 1.02x(Predicted Biden)
The slopes of these two lines are “nearly” identical (1.00 vs 1.02). Otherwise, the values are the
same except for the difference between the intercept/starting values of 0.0 and 0.056. The
difference between these two values is five-point six percentage points. This indicates that some
or all of the Dominion/Hart machines may have been programmed or manipulated to
systematically add five plus percentage points to Biden’s actual vote count. Again, the
statistical significance level of these results is above 99%.
12
Discussion
One natural reaction to this analysis is to ask, “But what if the Dominion machines are only in
Democratic strongholds and that is the cause of the pattern?” or “What if the votes for Biden
came to a high degree from urban areas?”
It is important to understand that the analysis above is not directed at a single or handful of
counties. If a single “dirty” county inflated vote totals for a candidate this analysis would not
pinpoint that occurrence. Instead, this information uses data from all counties in the United
States to see if there is a discernable widespread pattern involving type of voting machine and
vote totals.
Next, it is also simply not true that Dominion machines are only in strong Democratic counties.
In Minnesota, Wisconsin, and Michigan, for example – many rural counties that would be
considered “Trump” counties use Dominion machines. The pattern of candidate Biden being
“plus 5.6%” holds true across all Dominion-enabled counties, not just urban areas and Democrat
strongholds.
In addition, the prediction values we developed for candidate Biden incorporated variables from
the US census – including ethnicity, urban/rural indicators, and other economic indicators. All of
these correlates with “traditional democratic strongholds” and urban/rural areas. Our analysis
takes into account most, if not all, of these concerns. E.g., our predicted values already assign
higher likely percentage of vote total for Biden in urban areas. Candidate Biden over-performed
our estimates in these areas – by the same amount he over-performed in “Trump” counties.
Conclusion
Our analysis of publicly available data shows evidence of possible fraud involving Dominion
Voting System’s BMD machines and Hart Verity Touch machines. The analysis shows
Dominion machines may have been manipulated in multiple counties across the country. It
appears the fraud may have been some type of systematic programming resulting in the “over-
performance” of candidate Biden by approximately 5% in many of the counties in which the
machines were used. The increases in votes occurred in hundreds of counties in the U.S.
13
The election results from any county in the U.S. that used Dominion BMD machines or Hart
Intercivics machines are, in our opinion, not reliable. Federal, State and local officials should
take every possible action to investigate and correct the calculated tallies of their elections if they
used any of these machines in the vote counting.
In cases where this is not one hundred percent possible, authorities should nullify the vote from
their election due to lack of certainty in the results.
###