Embed Size (px)
Citation preview

Evidence on the relationship between education, skills and economic growth in low-income countries
by Denise Hawkes Mehmet Ugur
July 2012
Systematic review

i
The authors are part of the University of Greenwich and were supported by the Evidence for Policy and Practice Information and Co-ordinating Centre (EPPI-Centre). Hawkes, D and Ugur, M (2012) Evidence on the relationship between education, skills and economic growth in low-income countries: A systematic review. London: EPPI-Centre, Social Science Research Unit, Institute of Education, University of London. ISBN: 978-1-907345-32-6
© Copyright Authors of the systematic reviews on the EPPI-Centre website (http://eppi.ioe.ac.uk ) hold the copyright for the text of their reviews. The EPPI-Centre owns the copyright for all material on the website it has developed, including the contents of the databases, manuals, and keywording and data extraction systems. The centre and authors give permission for users of the site to display and print the contents of the site for their own non-commercial use, providing that the materials are not modified, copyright and other proprietary notices contained in the materials are retained, and the source of the material is cited clearly following the citation details provided. Otherwise users are not permitted to duplicate, reproduce, re-publish, distribute, or store material from this website without express written permission.

ii
Contents
List of abbreviations ........................................................................... v
Structured abstract ............................................................................ 1
Executive summary ............................................................................ 3
1. Background .................................................................................. 7
1.1 Aims and rationale for the review ................................................... 7
1.3 Policy and practice background .................................................... 21
1.4 Research background................................................................. 22
1.5 Objectives ............................................................................. 22
2. Methods used in the review ............................................................. 24
2.1 User involvement ..................................................................... 24
2.2 Identifying and describing studies .................................................. 24
2.3 Methods for synthesis ................................................................ 27
2.4 Deriving conclusions and implications ............................................. 30
3. Search results ............................................................................. 31
3.1 Studies included from searching and screening .................................. 31
3.2 Details of included studies .......................................................... 32
4. Synthesis results .......................................................................... 34
4.1 Outline of chapter .................................................................... 34
4.2 Synthesis of evidence ................................................................ 34
5. Strengths and limitations ................................................................ 53
6. Conclusions and implications ............................................................ 56
6.1 Synthesis results ...................................................................... 56
6.2 Conclusions and implications ....................................................... 56
7. References ................................................................................. 58
7.1 Studies included in review .......................................................... 58
7.2 Other references used in the text of review ..................................... 59
Appendices .................................................................................... 63
Appendix 1.1: Authorship of this report ............................................... 63
Appendix 2.1: List of databases used for search...................................... 64
Appendix 2.2: Keywords and synonyms used in searches ............................ 66
Appendix 2.3: Documentation of search results ...................................... 67
Appendix 2.4: Inclusion/exclusion criteria for theoretical/analytical (TA) studies at the critical evaluation stage ......................................................... 70

iii
Appendix 2.5: Inclusion/exclusion criteria for empirical (EM/EM2) studies at the critical evaluation stage .................................................................. 71
Appendix 2.6: Details of meta-analysis tools – fixed-effect estimates, random-effect estimates and precision-effect tests ........................................... 72
Appendix 3.1: List of codes used to code the extracted data ...................... 76

iv

v
List of abbreviations
2SLS Two-stage least-square (regression/estimation)
3SLS Three-stage least-square (regression/estimation)
CRD Centre for Reviews and Dissemination (University of York)
DFID Department for International Development (UK)
EM Empirical studies included in the review
EM2 Mixed (LIC and MIC countries) studies included in this review
FAT Funnel-asymmetry test
FEE Fixed-effect estimate
GDP Gross domestic product
GMM Generalised method of moments
IV Instrumental variables
LIC Low-income country (as defined by the World Bank)
MLPSE Maximum- likelihood publication selection estimator
MRPA Munich RePec Personal Archive
MST Meta-significance test
OECD Organisation for Economic Co-operation and Development
OLS Ordinary least- squares (regression/estimation)
PET Precision-effect test
PICOS Population – intervention – comparator – outcome – study design (framework/criteria)
PIOS Population – independent variable – outcome – study design (framework/criteria)
RCT Randomised control trial
REE Random-effect estimate
SSRN Social Science Research Network
TA Theoretical/analytical studies included in this review
TFP Total-factor productivity
VRA Validity – reliability – applicability (criteria)
WLS Weighted least-squares (regression/estimate)

What is the empirical evidence of the relationship between education, skills and economic growth in low-income countries? 1
Structured abstract
Background
Investing in education and skills has long been considered a key driver of economic growth both in the academic literature and by practitioners. Despite this widespread belief that the investment in human capital development is a key determinant of economic growth, the empirical estimates especially focusing on low-income countries (LICs) are less than conclusive. Together with the added complication that the measurement of the outcome of the investment in education and skills is not straightforward, causing researchers to use a range of proxies for human capital, it is not surprising that there is uncertainty in the policy arena as to the most effective type of education or skills within the LIC context. This systematic review aims to provide comparable, reliable and verifiable estimates of the effect of education on economic growth, controlling for study heterogeneity in terms of the measure of human capital used, growth measurement applied and country grouping.
Objectives
Our objective is to address the impact of education and skills on economic growth empirically with a view to providing a meta-synthesis of the empirical evidence on the direct effects of human capital investment on growth in LICs. The report also aims to highlight policy conclusions and point out potential avenues for further research. The review focuses on the growth impacts of education and skills in LICs, but we also provide evidence for a larger set of countries for comparative purposes.
Study search and evaluation
We used 22 key search terms and 43 LIC names to search in 19 electronic databases. The search yielded 3,842 unique studies, which were first screened on the basis of title and abstract. This initial screening generated 218 studies for the critical evaluation stage. The critical evaluation of the full text and the handsearch conducted at this stage using the PIOS (population–independent variable –outcome –study design) framework led to inclusion of 57 studies: 51 empirical papers and six theoretical papers. Rereading the 57 studies to focus on LICs reduced the sample to 39 papers: 33 empirical and 6 theoretical. The included studies have similar characteristics to the full-sample with respect to publication date and publication type.
Methods
The six theoretical papers identified were used to provide additional support to the theoretical framework developed. The 33 empirical papers were synthesised using a meta-analysis approach. The method of meta-analysis was utilised to derive verifiable estimates of the direct effects of human capital on growth by grouping (nesting) studies on the basis of coherent measurement of education and skills and growth. The meta-analysis results are presented as random-effect weighted averages. The statistical significance of the random-effect estimates (REEs) was verified through precision-effect tests (PETs) that detect ‘genuine’ effects beyond bias.

What is the empirical evidence of the relationship between education, skills and economic growth in low-income countries? 2
Synthesis results
We report that the investment in human capital does have a positive and genuine effect on growth in LICs. This aggregate result is obtained after controlling for growth measures, education and skills measurement, country type and estimation type. There was a positive direct effect of education and skills on growth in LICs between education and skills measurement types. Very few indirect effects are reported in the papers identified and therefore it was difficult to use the meta-analysis to draw any conclusions about the pathways proposed.
Conclusions
This systematic review suggests the widely held belief that investing in education and skills promotes economic growth in LICs is correct in general. It also identifies many gaps in the research field which, if filled, would enable a more effective policy response by international donors and governments in LICs. The most important issue is that of the education and skills measurements used. These are often chosen by academics in terms of data availability rather than usefulness as a measure for policy intervention. The human capital measures used tend to be measures of the inputs into the education process, for example enrolment rates as a measure of engagement, and educational expenditure as a measure of costs, rather than measures of learning. Therefore a discussion between academics and policy-makers as to what they mean by education and skills and how best to measure these may be a fruitful line of enquiry in terms of making the academic literature in this field more useful to policy-makers.

What is the empirical evidence of the relationship between education, skills and economic growth in low-income countries? 3
Executive summary
Background
Investing in education and skills has long been considered a key driver of economic growth both in the academic literature and by practitioners. As a consequence many resources have been allocated to the investment in human capital in the developing world with the hope of enhancing economic development. Many of the Millennium Development Goals have their foundations in the promotion of education and skills development, especially among women, leading to the expansion of policy focus and spending on providing education and skills development to their populations. Despite this widespread belief that the investment in human capital development is a key determinant of economic growth, the empirical estimates especially focusing on low-income countries are less than conclusive. A range of different size effects and levels of significance were found depending on a host of factors including data source used, estimation approach and selected sample countries.
An added complication comes in the form of the measurement of the outcome of the investment in education and skills, which is not at all straightforward. While a measure of learning is sought, often studies are forced to use the available sources. Researchers use a range of proxies for education and skills including the average years of education, enrolment rates and education expenditure. Within this systematic review nine groups of human capital measurement are identified and used to consider the effect of investing in education and skills on economic growth. This review provides an attempt to investigate what type of human capital investment is most effective within the LIC context and largely establishes that, however measured, the investment in education and skills has a positive effect on growth.
Overall this systematic review aims to provide comparable, reliable and verifiable estimates of the effect of education on economic growth controlling for study heterogeneity in terms of the measure of human capital used, growth measurement applied and country grouping. This is achieved by undertaking a meta-analysis of the empirical estimates on the relationship between education/skills and economic growth in LICs. Understanding this relationship is important to many national and trans-national organisations which have invested heavily in human capital development and hope to see a return on this investment in terms of economic development.
Objectives
This systematic review attempts to answer the following review question:
What is the empirical evidence of the relationship between education, skills and economic growth in low-income countries?
Our objective is to address the impact of education and skills on economic growth empirically with a view to providing a meta-synthesis of the empirical evidence on the direct effects of different types of human capital investment on growth. Indirect effects were also sought but they were rather lacking in the literature identified. The review focuses on the growth impacts of education and skills in LICs, but we also provide evidence for a larger set of countries for comparative purposes. The report also aims to highlight policy conclusions and point out potential avenues for further research.

What is the empirical evidence of the relationship between education, skills and economic growth in low-income countries? 4
Methods
This systematic review undertook the search of the literature as outlined in the protocol. The protocol was based on the systematic review methodology developed by the Centre for Reviews and Dissemination (CRD) of the University of York and the Cochrane and Campbell Collaborations. The methodology was adapted to account for issues commonly faced when undertaking a systematic review of applied econometric papers.
Thirty-three empirical papers were identified and synthesis was undertaken using a meta-analysis. The meta-analysis controlled for country type (low-income and mixed countries), education measure (consisting of nine groups including average years of education and enrolment rates), growth measure (per-capita GDP [gross domestic product], GDP and TFP [total-factor productivity]) and estimation method (instrumented and non-instrumented methods). This nested approach enables us not only to address the systematic review question (which focuses on LICs), but also to provide a wider empirical setting within which the impact of education and skills on LICs can be evaluated.
The meta-analysis was conducted first by calculating weighted means for direct effect of human capital investment on growth. The weighted mean was calculated as random-effect estimates (REEs) that take account of within-study and between-study variations. Then, we conducted precision-effect tests (PETs) to establish whether the empirical estimates and their weighted means represent genuine effect – beyond publication bias. All the analysis was conducted using STATA version 11. The analysis was concluded by undertaking a meta-regression which considered the effect of education and skills development on economic growth adjusting for within-study dependence. The meta-regression also enables the effect of each set of control variables to be considered while holding other factors constant.
Details of the included studies
We used 22 key search terms and 43 LIC names to search in 19 electronic databases. The search yielded 3,842 unique studies, which were first screened on the basis of title and abstract. This initial screening led to 218 studies for the critical evaluation stage. The critical evaluation of the full text and the handsearch conducted at this stage using the PIOS framework (population –independent variable –outcome –study design) led to the inclusion of 57 studies: 51 empirical papers and 6 theoretical papers. Rereading the 57 studies to focus on LIC reduced the sample to 39 papers: 33 empirical and 6 theoretical for narrative synthesis and meta-analysis. The included studies have similar characteristics to the full sample with respect to publication date and publication type suggesting that there may be a limited effect of bias due to the study selection process.
Synthesis results
The results indicate that largely human capital does have a positive and genuine effect on growth in LICs. The estimates of the effect of education and skills on economic growth give an increase varying between 0.4% and 24% per unit of education or skills investment. The magnitude of the impact of human capital on growth in LICs is very variable depending on the proxy for human capital used in the analysis with the largest effects found when the proportion of the population with a set level of education is used as the measure of education and skills while the smallest effect is found consistently when the studies use average years of schooling. This suggests that the investment in human capital in LICs is worthwhile in term of enhanced economic growth.

What is the empirical evidence of the relationship between education, skills and economic growth in low-income countries? 5
The largest problem faced in undertaking this systematic review was that the wide range of education and skills measures used provided very few observations to work with for individual nests of human capital–growth groupings at some points in the analysis. This is confirmed in the meta-regression results with only education expenditure measures and years of education measure producing significant results, interestingly two of the larger number of observations. This suggests that the limited number of observations for each type of education may have led to many of the insignificant results rather than a lack of evidence of an effect of human capital investment on economic development. Even taking account of the small sample sizes, there is evidence to suggest that education and skills help to promote economic growth in LICs.
The results for GMM (general methods of movements) estimates only are presented in order to look at the scale of the effect of education and skills investment on economic growth net of the effect of the differences in the econometric technique used. These results largely demonstrate a positive effect of education and skills investment on economic growth, but due to the limited sample sizes the results have included studies of countries not currently considered as LICs but still classed within the wider group of countries considered as developing countries. The results of the meta-regression also highlight the importance of estimation technique and data type in the scale of the positive effect of human capital investment on economic development in LICs.
This study highlights the need for further research to consider what these nine groups of education and skills actually measure. This suggests that a fruitful extension of this work would be for policy-makers and academics to have a discussion on how best to measure the investment in human capital in order that further commissioning of research could generate results that are better able to inform policy as to the most effective type of education and skills to invest in in LICs.
Conclusions
This systematic review suggests the widely held belief that investing in education and skills promotes economic growth in LICs is correct overall. The key finding is that there is a positive effect of education and skills on economic growth in LICs. The results presented here find a consistent positive effect of education and skills on economic growth in LICs from studies that controlled for education measure, growth measure and a range of control variables including data type used and estimation strategy employed. This suggests that investing in human capital development in LICs is likely to be a key determinant in economic growth and development. This review therefore provides evidence that funding education and skills development in the populations of LICs produces a positive return on the investment in the form of higher economic growth.
This paper also identifies many gaps in the research field which, if filled, would enable a more effective policy response by international donors and governments in LICs. The most important issue is that of the education and skills measurements used. These are often chosen by academics in terms of data availability rather than usefulness to the policy-maker as a measure of learning. Human capital measures used tend to be really measures of the inputs into the education process, for example enrolment rates as a measure of engagement and educational expenditure as a measure of costs, rather than measures of learning. Therefore a discussion between academics and policy-makers as to what is meant by education and skills and how best to measure these maybe a fruitful line of enquiry in terms of making the academic literature in this field more useful to policy-makers. At present the

What is the empirical evidence of the relationship between education, skills and economic growth in low-income countries? 6
results of the studies in this field tell us that improving education and skills inputs enhances economic growth, rather than being able to demonstrate an enhancement of the productivity of the workers within LICs through learning acquired through a greater investment in human capital.
Overall this systematic review provides comparable, reliable and verifiable estimates of the positive effect of education and skills on economic growth adjusting for a wide range of sources of study heterogeneity. The meta-analysis demonstrates a positive effect between education/skills and economic growth in LICs. This principle finding suggests that those national and trans-national organisations who have invested heavily in human capital development in LICs are likely to see a return on this investment in terms of economic development.

What is the empirical evidence of the relationship between education, skills and economic growth in low-income countries? 7
1. Background
1.1 Aims and rationale for the review
Investing in human capital is considered to have a wide range of benefits to the individual, society and the economy as a whole. Academics in many fields of social sciences point to the benefits of education in terms of personal health, crime rates and environmental protection. Education and skills are also considered to be one of the key determinants of economic growth and development. These widely held views and perceptions tie in with the focus of policy on the Millennium Development Goal of a full course of primary education for all. Achievement of this goal is regarded as key factor in sustained economic development (UN 2000).
Given this widely accepted belief that education and skills development is good for individual, society and the economy, the long-standing interest of academics and policy-makers in understanding the causes and consequences of education has acquired a new dynamism. The research effort across social sciences has led to a voluminous literature, using an array of quantitative and qualitative methods and leading to as many unanswered questions as those answered. Even focusing on the topic of this systematic review – the relationship between education, skills and economic growth – a wealth of material has been produced in economics, social policy, education and sociology with methods as diverse as cross-country regressions to individual cases studies of specific education interventions.
The empirical work on the relationship between education, skills and economic growth can be divided into three main approaches: (i) wage equations undertaken in labour economics that consider the rate of return to education using individual-level data; (ii) growth accounting where the attempt is to split the growth of an economy into the contributions of various inputs such as labour, capital, quality-adjusted labour, etc.; and (iii) growth regressions which use cross-country data to estimate the relationship between education and growth (Temple 2001). Regardless of the approach taken, the empirical evidence is mixed on the importance of education and skills in explaining economic growth – and this leads to an often unclear picture for evidence-based policy-making and implementation (Bosworth and Collins 2003, Krueger and Lindahl 2010, Patrinos and Psacharopoulos 2002, Pritchett 2001).
Over the past 20 years with the development of large databases of information, together with the development of computer power for analysis, growth regressions have become the cornerstone of the analysis of the macro-economic impact of education and skills on economic growth. Therefore the nature of this research question and the search strategy used has meant that all but one of the included papers have estimated growth regressions either across countries or within countries. Therefore the meta-analysis undertaken below is based on the results from these growth regressions to provide empirical evidence on the empirical link between education, skills and economic growth with a view to supporting evidence-based policy-making. We pay special attention to the synthesis of the empirical evidence on the education–growth relationship with respect to low-income countries (LICs).
Unlike healthcare, education or social policy research, where systematic reviews constitute a well-established method of synthesising micro-level research findings, systematic reviews on the macro-level outcomes of education are a new development. In addition, the issues here do not necessarily lend themselves to systematic review questions suitable for randomised control trials (RCTs) or cross-sectional studies in which the intervention and the reference criteria are performed on random and independent samples.

What is the empirical evidence of the relationship between education, skills and economic growth in low-income countries? 8
From a systematic review perspective, there are three major issues that arise from studies considering the relationship between education, skills and economic growth in the economics literature. First, there is the issue of differences in the measures used for the independent variable (education or skills) and the dependant variable (growth). We have identified three different measures of growth (including per-capita GDP [gross domestic product] growth as the most popular measure) and nine different measures of education (ranging from years of schooling through enrolment rates to education expenditures). These measures imply that there are potentially 27 nests within which studies must be placed in order to be able to provide reliable syntheses of the education–growth relationship or conduct meta-analysis to determine the significance of these estimates. Second, there are differences in the composition of countries included in the original studies. Some studies include LICs only and these pose few problems for this systematic review. However, the country samples in some other studies include both LIC and non-LIC countries. Therefore, calculations of aggregate estimates and their meta-analysis must be carried out within two country nests. Finally, original studies use different estimation methods that may yield different estimates. We have identified at least five different estimation methods (ranging from ordinary least-squares [OLS] through fixed/random-effect panel estimations to generalised method of moments [GMM] to instrumental variable estimations). These differences in estimation methods require a new level of nesting based on estimation methods.
The heterogeneity issues indicated above constitute additional challenges for systematic reviews on macro-level outcomes of education and skills in general and for the proposed systematic review in particular. We aim to address this challenge by nesting the included studies within a number of clusters that would allow for aggregation and meta-analysis of their estimates of the growth impact of education. This nesting enables us to provide three sets of evidence. First, we report the simple means, weighted means, confidence intervals and average precision estimates in each study. The studies are nested within clusters that pool together estimates of the relationship based on a specific measure of education (e.g. enrolment rates) and a specific measure of growth (e.g. per-capita GDP growth).
Second, we provide simple means of the estimates across relevant studies, controlling for the measures of education and growth. Because simple means do not account for heterogeneity within the estimates of each study (the within-study variation) and for heterogeneity between the estimates of different studies (between-study variation), we also provide weighted means of the reported estimates, controlling for measures of education and growth. The weighted means of the estimates are calculated as random-effect estimates (REEs), the weights and other properties of which are described in section 2.3 below. We draw on the evidence for simple and weighted means to derive observational conclusions about the magnitude and signs of the potential effects of education on growth across different measures of both variables. We also derive observational conclusions about the degree of convergence or divergence between mean effects, depending on the education and growth measures on which they are based.
Finally, we conduct meta-regressions to find out if the weighted means of the reported estimates can be taken as measures of genuine effects or not. The meta-regression method and its appropriateness are discussed in section 2.3 below. However, we must indicate here that the meta-regression we conduct is based on a weighted least-squares (WLS) method, which enables us to overcome the problem of heteroscedasticity and to test for genuine effect beyond publication bias (Stanley 2005, 2008). Furthermore, we limit the meta-regression to estimates reported by studies that use GMM estimation only. This is for two reasons. First,

What is the empirical evidence of the relationship between education, skills and economic growth in low-income countries? 9
GMM, like other instrumental variable estimation methods, controls for endogeneity (reverse causality) between the dependent variable (growth) and independent variable (education). In other words, GMM estimates are not biased upward by the feedback effect that runs from growth to education (see Figure 1.1). Second, GMM, unlike other instrumental variable estimation methods, uses a standard instrumental variable that is the same across studies using the same measures of education. The instrumental variable is the optimal lagged value of the independent variable (i.e. education measure) that is determined by two criteria: (i) the instrumental variable must be correlated with the independent variable it instruments for; and (ii) it must NOT be correlated with the error term of the regression in the original study. GMM is superior to other instrumental variable estimation methods because the instrumental variable is comparable across studies nested within the same set of education and growth measures. The instrumental variable in other instrumental variable estimation methods, however, may differ from one study to another even if the studies use the same education and growth measures. GMM is also superior to non-instrumental estimation methods (e.g. OLS, r fixed-effect estimations [FEEs] or REEs) because the latter do not take account of reverse causality between education and growth (i.e. the feedback effect from growth into education).
Based on this methodology, this systematic review aims to contribute to existing knowledge on the education–growth relationship in three ways. First, it provides REEs of the mean effect of education on growth – given the type of countries (LICs and mixed LICs and MICs) covered by original studies, the type of education and growth measures used in original studies, and the method of estimation. Second, it establishes whether the REEs of the mean effects of education growth can be taken as indicators of genuine effect– with a view to providing the research and policy-making community with a verifiable summary measure concerning the impact of education on growth. Finally, the systematic review enables us to identify the strengths and shortcomings of the existing research on the education–growth relationship and, on that basis, to identify new avenues for future research. In doing this, we pay special attention to the synthesis of the empirical evidence on the education–growth relationship in the context of LICs. However, we also provide findings on the education–growth relationship in a wider context, which consists of low-income and other countries pooled together.
1.2 Definitional and conceptual issues
1.2.1 Impact of education on growth: channels and causal mechanisms
The large majority of the empirical studies on the relationship between growth and education/skills (or human capital in general) estimate the latter’s direct effect on growth, i.e. the effect represented by the wide arrow in Figure 1.1. In these studies, human capital is considered as an input into the production process – and this specification is in accordance with both exogenous and endogenous models of growth. However, the theoretical/analytical studies on growth and studies that examine the cross-country or time-dependent determinants of the change in inputs such as labour, capital or technology tend to point out the indirect effects of human capital on growth. The indirect effects are due to either externalities of education/skills or the process by which human capital filters into the production process by the interaction of the latter with inputs such as labour, innovation, capital and technology. Figure 1.1 takes account of such interactions explicitly. Brief elaboration on the indirect effects of education/skills on growth and references to the relevant literature are given below.

What is the empirical evidence of the relationship between education, skills and economic growth in low-income countries? 10
The first key pathway to consider is the interaction between human capital and labour productivity (Bils and Klenow 2000, Hanushek and Kimko 2000, Oketch 2006, Temple 2001). This pathway grows from the rate of return literature in labour economics. The idea is that a worker is paid a wage equal to his/her marginal revenue product of labour. If this is the case, standard wage equations should establish a positive relationship between the level of education however it is measured and the level of earnings. This positive relationship between education and earnings implies that educated workers have a higher marginal revenue product of labour as they are more productive. When aggregated at the macro-economic level, it can be established that higher levels of education and skills (however they are measured) are conducive to higher productivity and the latter is conducive to higher output in the economy. Clearly the strength and weakness of this proposed pathway is whether education and skills actually do lead to a more productive workforce, or whether they are just a means of signalling prior ability. This is the old-standing debate in the theory of human capital. If education merely serves as a signalling device then the positive relationship between the level of education and skills and output growth will not hold. Therefore, theoretically, there is no a priori reason to assume that higher levels of education and skills are conducive to higher levels of growth: this relationship must be established empirically.
The second link is between human capital and labour market participation (Glewwe 2002, Klasen 2002). In this case, investment in human capital may increase the probability of the person actually finding a job and entering the labour market. Therefore an increase in the amount of the labour input will increase the output of the economy and therefore the economic growth. This link is likely to be especially important for females as a higher level of education may be associated with lower fertility rates that, in turn, may be conducive to higher levels of female participation in the labour market. Several econometric studies referred to by Barro (1991) report evidence that education is associated with lower fertility rates. In addition, more recent studies by Neira and Guisan (2002) and Guisan et al. (2001) have also reported evidence on a negative association between education and fertility rates.
The third link relates to the interaction of human capital with domestic and foreign investment (Engelbrecht 2003, Nelson and Phelps 1966, Oketch 2006). It can be argued that a more skilled workforce is better able to make effective use of the capital stock due to domestic and foreign investment. This interaction with physical capital may have a potentially powerful effect on the rate of growth of the economy.
The fourth link is through the income effect of human capital that fosters higher levels of product variety and product innovation. That higher-income countries tend to produce a wider set of products is a well-established correlation in the development literature (see Bils and Klenow 2001). However, there is also a reverse relationship that runs from higher product variety to higher levels of growth – the so-called supply-side effect of higher personal income levels on growth. In this approach, as higher income levels lead to higher levels of product variety, the latter leads to higher levels of growth because product variety is embedded within product and process innovation. Product and process innovation, in turn, is a reflection of technological progress, which is an essential but largely unobserved component of the growth functions. In fact, Romer (1990) has demonstrated that, in an endogenous growth model, the steady-state levels of per-capita income are a function of the product variety available in the economy.

What is the empirical evidence of the relationship between education, skills and economic growth in low-income countries? 11
Figure 1.1 Channels through which education and skills may affect economic
growth
Education and Skills
Channels (through which education and skills may
affect growth)
Labour productivity
Labour market
participation
Interaction
with capital
Enhanced individual income
(innovation)
Improved quality of the labour input therefore increasing output per worker (labour productivity
gain)
Previously inactive workers able to join the labour market (e.g. female labour due to lower fertility rates)
More skilled workers make better use of domestic and foreign investment (interacts with physical capital and innovation)
Higher demand for variety, leading to product and
process innovation
Intermediate effects of education and skills on:
Eventual effect on
GROWTH
Percolates through
Feedback effect

What is the empirical evidence of the relationship between education, skills and economic growth in low-income countries? 12
As stated above, and despite well-established theoretical foundations to the indirect effects of human capital on growth, empirical papers tend to focus largely on the direct effect of human capital on economic growth (large background arrow). The only exception in this context is the ‘labour productivity’ channel, the effect of which may be captured partly in the estimates of direct effects of human capital on growth. This tendency, in our opinion, is due to an orthodox adherence (in both exogenous and endogenous growth models) to the original Solow-Swan models of growth (see, for example, Barro and Sala-i-Martin 2004). In both varieties of growth modelling, the standard assumptions are that there are constant returns to scale and the contributions of the individual inputs (capital, labour and technology) to growth add up to one, i.e. these contributions exhaust the sources of growth. We think this restriction may be necessary to remain embedded within the theory of growth, but it is costly in terms of empirical innovation and capturing other sources of growth that are clearly identified in theoretical/analytical literature. In addition, we must also indicate here that the estimates of the direct effects of human capital on growth in growth regressions will tend to be biased downward in the absence of interaction terms that capture the indirect effects. There is the possibility that part of the estimated effects of investment or technology on growth may be mimicking direct effects of these inputs on growth even though they may actually be due to the interaction of these inputs with human capital input. This is a clear limitation in the human capital–
growth regression literature and an avenue for research in future work.1
A final point to clarify in this section relates to the relative merits of micro- and macro-level approaches to the economic consequences of education/skills. The micro-level approach aims to explain the variation in individual earnings by regressions, where the independent variables are usually years of schooling and a proxy for experience – such as years of experience or age. As Temple (2001) indicates, earnings are usually associated positively with schooling and this association is robust, but there are various difficulties faced by the micro-level approach. First, the association between education and private returns may reflect endogeneity between ability, earnings and education, such that more able people may secure higher earnings and invest more in their education. If this is the case, the estimated return on schooling overstates the contribution of education to productivity and ignores innate ability with which employees are endowed. Second, the regression may capture the private returns to schooling in terms of wages or earning potential, but it will not capture the social returns of education – either because of the so-called signalling problem or because of the externality problem that drives a wedge between private and social returns. This feature of the micro-level studies is also noted by Krueger and Lindahl (2001), who report that although the wage equation approach provides good evidence on the private benefits of education, it is less clear when looking at the social returns to education or the impact of education on economic growth.
Given that this systematic review aims to discover the effect of education and skills on economic growth, social returns on education and educational externalities are core issues. In addition, the micro-level approach is silent on the contribution of education relative to other sources of growth – such as investment
1 We can report here that the reluctance indicated by the literature on the human capital –
growth relationship to estimate the indirect effects was found to be less of a problem in the empirical literature on the corruption - growth relationship. This was found to be the case in another systematic review undertaken for DFID entitled ‘What is the empirical evidence around the economic growth impact of corruption in low-income countries?’

What is the empirical evidence of the relationship between education, skills and economic growth in low-income countries? 13
or initial levels of income. Therefore, this review does not analyse the findings of micro-level studies on the private returns to education.
1.2.2 Theoretical background and choice of estimates from growth regressions
Both the exogenous growth theory and endogenous growth theory highlight the importance of education in the growth of LICs. Barro and Sala-i-Martin (2004) provide a summary of the key models in the field. The Solow-Swan model (Solow 1956) acknowledges the contribution of education policy to income convergence between low-income and high-income economies. Endogenous growth models, as summarised in the key text in the field by Aghion and Howitt (1998), attempt to make human capital formation (education) endogenous in the growth process. In their study, Aghion and Howitt focus on two different models attempting to include education endogenously in the growth model. First the Nelson–Phelps approach that considers growth as associated with education through innovation and the adoption of technology (Nelson and Phelps 1966). Second the Lucas Approach (Lucas 1988) that considers the human capital as enhancing the labour input into the production process and is consistent with Mincer’s earnings function widely estimated in labour economics (Mincer 1974).
Model specification in the original studies follows a well-established method for cross-country estimation of growth introduced by Barro (1991). In this model, per-capita income is a function of investment, human capital, initial level of per-capita income and a number of other variables such as openness to trade, public finance (government tax-expenditure variables), etc. Soon thereafter Mankiw et al. (1992) extended the model to account for endogenous growth. Formally, the model can be stated as follows:
),,,,(/ 0 GOpYHLIFNY (1)
Where Y/N = per-capita income; I = investment; HL = human capital; Y0 = initial level of income, Op = openness to trade; and G = public finance variables. Taking logs and first difference of the log values, the model can be linearised for estimation as follows:
titiptititi govoyhlkgtiti
5403210 (2)
Where g = growth rate of per-capita income; k = investment arte; hl = change in the level of human capital; y0 = initial level of income; op = change in the level of openness; gov = change in public finance indicators; ε = the error term; and subscript ti = time and country indices. This model has been estimated by a large number of studies in the area of growth, including Levine and Renelt (1992, Mankiw et al. (1992), Sachs and Warner (1992) and Gyimah-Brempong and Traynon (1999). Almost all studies analysed in this review utilise a variant of this model. As such, they subscribe to a model specification that is studied extensively in the area of growth and convergence literature.
Models such as (2) have the advantage of controlling for the initial income level and/or for other economic variables in their estimation. However, variables other than human capital may include the transmission channels through which education/skills may affect growth indirectly. If this is the case, the reported direct effect of the human capital variable would be biased downward, i.e. it would be an underestimation of the genuine direct effect. This is because human capital may affects these variables which in turn affect growth, but human capital’s indirect effect transmitted through these variables are captured by the estimates of their coefficients – and not by the coefficient of human capital itself.

What is the empirical evidence of the relationship between education, skills and economic growth in low-income countries? 14
The second problem faced in estimating models such as (2) is that the explanatory variables (e.g. human capital) may itself be affected by the dependent variable (i.e. growth). This is the endogeneity problem we referred to above in section1.1. If endogeneity exists and is not addressed, reported estimates are likely to be biased upward due to reverse causality.
The studies included in this review address both problems. The GMM studies address the endogeneity problem by using standardised instrumental variables that are closely correlated with human capital but are not correlated with the residuals (error terms) of the regression. These standardised instrumental variables are the past (lagged) values of endogenous regressors (i.e. education variables). This method is suggested by Arellano and Bond (1991) and has been used extensively in the growth literature. GMM estimation exploits the linear moment restrictions of the model. It has been shown to be an efficient method of instrumentation when there are too few instrumentation data for the endogenous variables. Studies reviewed here using the GMM method to isolate the endogeneity problem include Chen and Gupta (2009), Dessus (2001), Lee and Kim (2009), Sandar and Macdonald (2009) and Tsai et al(2010).
Another method involves carrying out simultaneous estimation of more than one equation, where the number of equations depends on the number of endogenous variables. This method enables two-stage or three-stage least-squares (2SLS or 3SLS) estimations where reverse causality between endogenous variables is controlled for. Again several studies reviewed here use 2SLS or 3SLS methods of estimation to control for endogeneity (e.g. Baldacci et al 2004, Barro and Sala-i-Martin 2004, Landau 1983, Sandar and Macdonald 2009).
The third problem to be addressed here concerns which estimates of the original studies should be included in the systematic review. In this review, we include all estimates reported in empirical studies, irrespective of the econometric method through which the estimates are obtained. However, each estimate is coded systematically to indicate whether the underlying estimation is instrumented and what kind of estimation method (e.g. OLS or GMM) is used in the original study.
The alternative would have been to choose an aggregate statistic that summarises the study-specific estimates (e.g. the average or median of the reported estimates) or an estimate chosen randomly from the reported set on the basis of significance or sample size or degrees of freedom. However, reliance on aggregate statistics such as these has two major shortcomings. First, it prevents the use of all available information. Second, the selection criterion is highly likely to have a subjective dimension. Therefore, the use of all reported estimates has been preferred and this preference is justified when the reported estimates are weighted by a measure of within-study variation, e.g. the standard error associated with each estimate (de Dominicis et al 2008: .However, the case for including all reported estimates may be weakened by the so-called within-study dependence, i.e. correlation between the standard errors of the estimates that are used as weights for calculating within-study summary measures within each study. Although the reported estimates (and their standard errors) within each study may differ depending on model specification (i.e. the number of control variables used) or method of estimation (e.g. instrumented vs non-instrumented methods), there will still be a significant source of dependence due to the fact that the study uses the same data set. Systematic reviews in healthcare and education address this problem by using multilevel models to estimate the degree of within-study dependence. This method involves nesting patients or students/pupils within treatment groups or schools. Some economics reviews that have used nested models include de Dominicis et al (2008), Bijmolt and Pieters (2001) and Bateman and Jones (2003). Although the

What is the empirical evidence of the relationship between education, skills and economic growth in low-income countries? 15
preferred method, we have not used multilevel models here as in order to do so we would have needed to know each of the within-study correlations. Unfortunately it was not possible to create these as the effect sizes, which are different between and within studies, are not available and not possible to proxy as this is an economic study rather than a more consistent RCT medical study.
We have attempted to assess the potential extent of within-study dependence by grouping the studies within country types (specified as LICs and mixed countries), estimation methods (specified as OLS, 2SLS, 3SLS, GMM and instrumented), measures of education/skills (human capital), and measures of growth. We also present estimates from a meta-regression to consider the effect of education and skills on economic growth taking account of within-study dependence.
1.2.3 Issues in the empirics of growth debate: growth accounting, growth regressions and estimation methods
Temple (1999) provides an excellent overview of the issues/difficulties that the empirical growth literature has been grappling with over the last four decades. One issue is the relative strengths/weaknesses of case/historical studies vs empirical studies. We point out this issue here because this systematic review aims to synthesise the findings of empirical studies, using theoretical/analytical or historical studies as sources for understanding the wider context within which the education/skills–growth relationship can be understood and estimated. we acknowledge that historical case studies or detailed theoretical/analytical studies bring a deeper understanding of the social, institutional and technological sources of growth. However, as Gerschenkron (1962: 4) indicates, the contribution of historical case studies is limited to ‘pointing at potentially relevant factors and potentially significant contributions among them’. In addition, theoretical/analytical studies point out the complexity of the causal mechanisms and the underlying assumptions concerning economic behaviour as well as technical aspects of the production process. However, the applicability/generalisability of findings in both types of studies must be verified. Therefore, the corollary is that empirical studies are necessary to ‘quantify’ the importance of ‘potentially relevant’ factors and to test the validity of the hypotheses generated from theoretical/analytical studies. This systematic review builds on this recognition and attempts to provide a meta-analysis of the empirical findings (mainly estimates from growth regressions) on the magnitude and sign of the effect of human capital on growth – and relates the findings to insights from theoretical/analytical studies.
The second issue in the empirics of growth debate concerns the relative strengths/shortcomings of growth accounting vs growth regressions. The growth accounting approach estimates the contributions of inputs (capital, labour, human capital and technology) and the contribution of total-factor productivity (TFP) growth. As Temple (1999) indicates, however, the growth accounting approach has made progress only with respect to inputs – bringing us no closer to ‘an understanding of why TFP growth may differ across countries and over time’. This is because the growth accounting approach calculates the contribution of TFP to growth by imposing a restriction based on factor shares that, in turn, are calculated from micro-level data. However, imposing this restriction assumes constant returns to scale, perfect competition and absence of externalities associated with human capital. Yet all of these assumptions have been questioned by new growth theories. (Barro and Sala-i-Martin 2004)
On the other hand, the growth regressions approach still models the contributions of the inputs to growth as factor shares, but it estimates these contributions (i.e. the parameters of the growth equation) from variations in cross-country or dynamic

What is the empirical evidence of the relationship between education, skills and economic growth in low-income countries? 16
panel data. As such, the growth regressions approach may still be restricted in terms of growth determinants it includes as independent variables, but it is not restricted by the assumptions mentioned above – nor does it rely on micro-level evidence to derive macro-level evidence.
In this systematic review, we have excluded the purely growth accounting studies for two reasons. First, the growth accounting approach shares the assumption with the wage equations (micro-level) approach that variations in wages/earnings are due to variations in marginal productivities and the latter are due to variations in educations/skills. As indicated above, this assumption overlooks the possible signalling effect that education provides irrespective of the true ability/skills acquired through education. It also overlooks potential externalities associated with education/skills. Such externalities include positive impacts on institutional quality, health, female participation in the labour market, and product/process innovation induced by higher incomes associated with higher levels of education. There are also uncertain impacts through lower fertility rates, which may lead to higher female participation but lower population growth.
The second reason we have not included growth accounting estimates in our dataset for meta-analysis is that the estimates are accounting estimates and are usually reported without standard errors. As such, they are not suitable for consideration together with growth regression estimates even though they use the same definitions of growth.
As a result, this systematic review covers only the empirical studies that utilise growth regressions for estimating the impact of education on growth. Krueger and Lindahl (2001) indicate that the growth regression approach provides evidence of the importance of the stock of education and that of the change in education for growth, conditional on measurement error concerns in the education variable. The measurement issue is addressed in the next section, where we elaborate on definitional and measurement problems in the growth regressions approach to the education–growth relationship. The other issue that arises from the choice in favour of the growth regressions approach is the absence of macro-level data on skills as a separate independent variable. In macro-level studies, both education and skills are subsumed under the broad term ‘human capital’ which is measured either as a stock variable (e.g. years of schooling for the population of working age) or as a flow variable (change in stock) proxied by enrolment rates or government expenditures. Given this lack of disaggregated skills data, this systematic review is not able to address the empirical evidence on the skills–growth relationship. However, the lack of skills data is even more of a problem in studies on LICs – irrespective of whether the original studies follow a micro- or macro-level approach to education and economic performance. As Glewwe (2002) indicates, the lack of skills data is very acute for developing and LICs even in the micro-level studies that focus on the private returns to education. Therefore, all we can do in this review is to highlight this problem as a challenge for future research.
Mankiw et al. (1992) provide a good theoretical framework for growth regressions with human capital. Such regressions use the investment rate, initial income and measures of human capital such as school enrolment or proportions of the workforce with a particular (typically secondary) education qualification. The usefulness of growth regressions is debated at length between Bosworth and Collins (2003), and Temple (1999). What is clear from this discussion is that growth regressions (unlike growth accounting) allow for differences in productivity growth to be explained. Also, they can identify the relative contributions of different factors more precisely than historical studies.

What is the empirical evidence of the relationship between education, skills and economic growth in low-income countries? 17
However, this advantage does not imply that growth regressions are problem-free. In fact, there are a number of problems – estimation, measurement and robustness issues in growth regressions – and these issues pose serious challenges to systematic reviews of the literature within this tradition. The issues include cross-country heterogeneity, model uncertainty and endogeneity (Temple 2001). It is not possible to provide a detailed account of the issues; however we discuss their implications for the conduct of the meta-analysis pursued in this systematic review.
Inter-country heterogeneity poses a challenge for meta-analysis because, in the presence of heterogeneity, panel-data estimates of the growth impact of human capital may not be consistent even if the time dimension increases to infinity. Given that the large majority of growth regressions rely on panel data, a synthesis of reported estimates will inevitably suffer from inconsistency. However, the growth regression studies included in this review try to address the issue of heterogeneity through various techniques. Some studies focus only on LICs – the main focus of this review. This narrower country focus may not eliminate the heterogeneity problem altogether, but it minimises it. In addition, both LIC studies and studies with larger samples included in this review use dummy variables, sample splits and robust estimation; and a few studies use interaction terms (Chen and Gupta 2009, Engelbrecht 2002, Hanushek and Woessmann 2008, Sandar and Macdonald 2009). Given these innovations, the potential for inconsistency must be acknowledged, but it cannot be relied upon to rule against meta-analysis of evidence from growth regressions.
Model uncertainty in growth regressions with human capital has been recognised since the seminal contribution by Levine and Renelt (1992). Model uncertainty raises concerns about the reliability of the regression estimates, but does not invalidate the reported estimates. It may be due to multi-colinearity or serial correlations between the independent (explanatory) variables and can be detected as the loss of statistical significance when the set of right-hand-side variables in the regression is modified. Levine and Renelt (1992) address the issue of model uncertainty by identifying the small set of variables that remain robust to changes in model specification (i.e. changes in the number of variables on the right-hand side of the regression). However, as Temple (1999) indicates, demonstrating that a variable is robust to changes in model specification is not sufficient for valid inference. In addition, and as indicated above, robustness is not a necessary condition for useful information. Therefore, we are of the view that model uncertainty reflects a limitation but not a refutation of growth regression estimates. As such, it is not a sufficient condition for invalidating the meta-analysis of such estimates. In any case, if model uncertainty is a pervasive problem, this problem will be reflected in the meta-analysis results because we have included all estimates reported in included studies – whether they are statistically significant or not.
The third issue that arises in growth regressions relates to endogeneity – an issue we have referred to above. In growth regressions with human capital, the endogeneity problem can be stated as follows: education/skills may have a positive effect on growth, but the latter may also have a positive effect on the former. High growth rates over sustained periods lead to higher levels of per-capita income and this, in turn, may lead to higher levels of investment in human capital by individuals as well as by the government. In other words, there may be a ‘virtuous circle’ in place. To the extent that this is the case, the reported estimate of growth impact of education/skills will be biased upward.
This upwards bias is a source of valid concern for policy-makers and researchers alike. Therefore, the likelihood of endogeneity should be checked in original

What is the empirical evidence of the relationship between education, skills and economic growth in low-income countries? 18
studies but must be taken into account in meta-analysis. We have checked the original studies with respect to whether or not they have controlled for endogeneity. The majority of included studies control for endogeneity and attempt to insulate the reported estimates from its effects by various means. Some studies (for example Barro 1991) address the endogeneity problem by regressing growth over a certain period (e.g. 1960–75) on the education measure at the start of the period (i.e. 1960). Some others use 2SLS or 3SLS estimation methods to estimate the parameters for endogenous variables simultaneously (Baldacci et al 2004, Barro and Sala-i-Martin 2004, Landau 1983, Sandar and Macdonald 2009). Some others use GMM estimation, whereby the lagged value of the education variable is used as an instrument (Chen and Gupta 2009, Dessus 2001, Lee and Kim 2009, Sandar and Macdonald 2009, Tsai and Hung 2010). As Temple (1999) indicates, none of these methods of instrumentation provides a perfect solution to the endogeneity problem. For example, inclusion of additional variables as instruments may reduce the magnitude of the education/skills coefficient if the instrumental variable is exogenous to growth but correlated with the education/skills variable. Similar results may be obtained in the case of GMM estimation, which uses the lags of education/skills variables as instruments.
In this review, we try to minimise the impact of endogeneity on our synthesis in two ways. First, we nest all reported estimates within specific estimation methods that are coded as instrumented or non-instrumented. In this way, we are able to report unweighted and weighted means of the original estimates on the basis of instrumented and non-instrumented estimation methods. Second, we indicate (results not presented here) that the weighted and unweighted means of the original estimates are likely to be biased upward in the case of estimations without instrumentation, and downward in the case of instrumented estimations. Finally, we single out the GMM method of instrumentation as the least-problematic method because the instrument used in GMM studies is uniform – it is the optimally lagged value of the education/skills variable used in the original study. Given that we also nest the studies on the basis of growth and education measures used, the weighted means of estimates from GMM studies are comparable.
1.2.4 Definitional and measurement issues
Education and skills are very broad terms although the focus on macro-economic growth papers helps in their definition and measurement. In this context education and skills are seen as the way of measuring the stock of human capital in the economy and the change in that stock over time. Human capital is one of the inputs in an economy which together with physical capital and natural resources combine to create the output or national income of the economy, often measured by GDP.
In this context human capital is measured using aggregate measures such as average years of schooling (Krueger and Lindhal 2001), enrolment rates (Bils and Klenow 2000), education expenditures (Baldacci et al. 2008, Oketch 2006, Ranis et al. 2000), literacy and numeracy rates (Vinod and Kaushik 2007) and national test scores (Hanushek and Kimko 2000, Pritchett 2001). The first challenge for this systematic review was how to synthesise or compare the impacts of these various measures of human capital as it was highly likely that estimated coefficients for the relationship between education and economic growth will differ between studies mainly due to differences in the type of data used. The second challenge was to consider the potential for measurement error bias in these measures. It was likely that different measures will be liable to different measurement errors. For example it is possible that enrolment rates have more measurement error than education expenditure. To address such anomalies, we have used the type of

What is the empirical evidence of the relationship between education, skills and economic growth in low-income countries? 19
education measure as a criterion for clustering studies together for conducting meta-regression analysis and generating funnel plots.
The third issue is one of school quality. Work by Hanushek and Woessmann (2007) suggests that the lack of school quality data in many of the studies considering the relationship between education, skills and growth may be the single biggest challenge in this area of research. The key concern here is whether the use of an aggregate measure like average years of education really captures the human capital development that has been undertaken. That is: is a year of education the same for all people in all settings? This is especially a concern for cross-country studies where differences in educational experience are likely to be larger than a cross-sectional study within a country or within a region for example. This is a key concern in the literature at the moment. One solution would have been to focus on the educational and skills outcome measures such as literary rates or test scores rather than measures of the size of the education sector in the economy. However, such studies were in the minority of the papers identified and the most common measures used are those associated with average years of schooling and education expenditure. We have acknowledged this concern and have addressed it by having education measurement used as a common theme for clustering studies. By comparing the cluster-based meta-syntheses we are able to provide a better picture of the size and significance of the estimated parameters. This may be less ‘neat’ than the single meta-synthesis usually reported in healthcare studies, but it will be more objective and verifiable than the syntheses reported in conventional literature reviews. It also provides policy-makers and researchers alike with a clear view about the contingent nature of the evidence and about the need/scope for further research.
In this systematic review we identify nine groups of education measures.
i. Average years of education – this measure is based on the average years of total education in a country, including primary, secondary and higher education. While a more disaggregated measure would have been preferable, the limited number of studies per group identified makes this impossible.
ii. Rate of change in average years of education – this measure captures the rate of growth in the average years of education in a country over time. In the included studies, the rate of change in average years of education is measured either as percentage change or in natural logarithms. When the measure is given in percentage terms, the estimated parameter of the education variable represents the change in the growth measure in response to one percentage point increase in the average years of education. When it is given in natural logarithms, however, the estimated parameter represents the change in the growth measure in response to a one percent increase in the average years of education.
iii. Education expenditure – this measure consists of the total spending of a government on education. This is often thought as comparable across countries once converted into a common currency, such as US dollars.
iv. Rate of change in education expenditure – this measure captures the rate of growth in the average years of education in a country over time. In the included studies, the rate of change in education expenditures is measured either as percentage change or in natural logarithms. The interpretation of the coefficients estimated with this measure is the same as in (ii) above.
v. Proportion of population with a set level of education – this measure includes the proportion of the population who have completed primary or secondary school. This measure can be assumed to be comparable across

What is the empirical evidence of the relationship between education, skills and economic growth in low-income countries? 20
countries as long as the level of education or qualification considered is truly equivalent.
vi. Enrolment rates – this measure includes enrolment rates in compulsory education, depending on how compulsory education is defined in each country. This is the most common measure of education used due to the availability of data and the perceived comparability across countries.
vii. Rate of change of enrolment rates – this measure captures the rate of growth in enrolment rates in a country over time. In the included studies, the rate of change in education expenditures is measured either as percentage change or in natural logarithms. The interpretation of the coefficients estimated with this measure is the same as a (ii) above.
viii. Skills – this measure includes literacy rates, test scores and the Education Index. These measures attempt to consider education in terms of the skills developed rather than the attendance. This measure is used in relatively few studies – mainly due to limited data availability.
ix. Education quality – this measure includes a range of very different measures including teacher:pupil ratios and teacher qualifications. This is the smallest and most diverse group of measures. These measurements attempt to measure the quality rather than the quantity of education received by the population of interest.
In addition to the nine education groups identified, three growth groupings and five estimation groupings are identified. The growth groups found are: GDP growth, per-capita GDP growth and TFP growth. GDP growth per capita is the most frequently used measure.
These nine education groupings and three growth groupings suggest that there are potentially 27 nested groups to be used for the meta-analysis. However, the distribution of the reported estimates with respect to possible pairs of measures for education and growth is such that observations exist in only 19 nests (Table 1.1). The number of reported estimates within each nest (cell) is from the full dataset that includes both LICs and mixed countries. At the meta-analysis stage, we control for country type to provide evidence on LICs and mixed countries separately.
As can seen from Table 1.1, the measures of education most frequently used in included studies are enrolment rates (126 reported estimates) and average years of education (80). These are followed by the rate of change in education expenditures (52) and education expenditures (27). With respect to growth measures, the most frequently used growth measure is per-capita GDP growth (279 reported estimates). Given this distribution, six nests based on five measures of the education variable (average years of education, rate of change of average years of education, education expenditure, rate of change of education expenditure and enrolment rates) and two measures of the growth variable (per-capita GDP growth and GDP growth) are likely to be the nests that contain a sufficient number of reported estimates for meta-analysis when we control for country type (LICs and mixed countries). Therefore, these six nests are the most likely candidates to enable us to derive synthesised conclusions about the impact of education on growth.

What is the empirical evidence of the relationship between education, skills and economic growth in low-income countries? 21
Table 1.1 Matrix of nests based on growth measures and measures of education,
and number of reported estimates within each nest
Measures of education Growth measures Total
GDP
growth
(1)
Per-capita
GDP growth
(2)
TFP
growth
(3)
Average years of education (1) 4 61 15 80
Rate of change of average years of
education (2) 33 2 0 35
Education expenditure (3) 3 24 0 27
Rate of change of education
expenditure (4) 8 44 0 52
Proportion of population with a set
level of education (5) 1 10 0 11
Enrolment rates (6) 22 103 1 126
Rate of change of enrolment rates
(7) 0 17 5 22
Skills (8) 0 13 0 13
Education quality (9) 3 5 0 8
Total 74 279 21 374
1.3 Policy and practice background
The Millennium Development Goals have focused education policy in recent years on the universal provision of primary education and especially for girls. This focus on primary education in LICs is not without its critics (Bennell 1996) although it is also clear that primary education plays an important role in providing pupils with the basic skills required for further study and employment. The effectiveness of the focus on primary education is strongly linked to the view of how education impacts growth. While focuses on the labour market and human capital suggest primary education is important, studies that consider the interaction between education and innovation suggest that primary education is a necessary but not sufficient condition for economic growth.
A systematic review is policy-relevant for two reasons. First, it can address the need for reliable and verifiable evidence as an input into the policy-making process. Second, the large and increasing volume of the empirical literature, and the varied and sometimes conflict nature of the reported findings, complicate the task of policy-makers seeking reliable and verifiable evidence. This systematic review, the first on the topic of the human capital–growth relationship, squares the circle of needs and means by synthesising the empirical evidence and mapping this evidence with theoretical explanations. As such, it provides policy-makers with reliable and verifiable information on how education and skills may affect economic growth and by how much.
The intellectual relevance of the systematic review stems from the need to take a systematic stock of the literature as a basis for identifying gaps and further research avenues. The development of the empirical literature beyond the growth theories from where they originated may raise new findings which could add to policy-makers’ understanding of the human capital–growth relationship as well as benefit economic growth theorists who may be able to develop the theory further in light of these empirical results. The systematic review provides a comprehensive

What is the empirical evidence of the relationship between education, skills and economic growth in low-income countries? 22
summary of the progress made and the scope for new research avenues in the area of the human capital–growth relationship.
1.4 Research background
There do not appear to be any systematic reviews in this field – they are not very common in economics. Non-systematic reviews have not focused exclusively on LICs. Key reviews in this field include: Aghion (2009) which reviews the theoretical background to the education and growth literature but is largely focused on developed countries and higher education; Temple (2001) which reviews the empirical literature for the OECD (Organisation for Economic Co-operation and Development) countries; Griliches (1997) whose literature review focuses on the empirical work for the USA; and Krueger and Lindahl (2001) whose attempt to reconcile the labour and macro-economic literatures has some developing-country examples. Therefore, by paying special attention to literature on LICs, this systematic review makes a significant contribution to this area.
Exclusive reviews for the developing countries at the macro-level are few and far between. Brook-Utne (2002) reviews the work published in the International Review of Education from 1931 to 2001. This review focuses on the role of aid in the provision of education and some key aspects of the delivery of education, such as the language of instruction. Therefore the Brook-Utnesystematic review is well placed to be a good summary of the literature for links between education, skills and economic growth available at the time. It can also identify the gaps in the field.
To our knowledge, the fewer than a handful of reviews mentioned above are the only reviews of the empirical literature on the human capital–growth relationship. Of course, this does not mean to suggest that existing studies do not provide brief reviews of the existing work relevant to their research questions. However, such reviews are limited in scope/coverage and selective by design. Therefore, a systematic review of the empirical literature on the human capital–growth relationship is a timely exercise from a policy as well as intellectual perspective. The intellectual relevance of the systematic review stems from the need to take a systematic stock of the literature as a basis for identifying gaps and further research avenues. The systematic review provides a comprehensive summary of the progress made and the scope for new research avenues in the area of the human capital–growth relationship.
1.5 Objectives
The review question we address is
‘What is the empirical evidence of the relationship between education, skills and economic growth in low-income countries?’
Our objective is to address this question empirically with a view to providing a meta-synthesis of the empirical evidence on the direct effects of education and skills investment on growth with a view to deriving policy conclusions and pointing out potential avenues for further research.
The systematic review question requires us to focus on LICs as the main ‘population’ of interest. We have adopted the LIC definition of the World Bank, which classifies a country as an LIC if the per-capita GDP in that country is US$995 or less. At the time of conducting this review, the number of countries that met this criterion was 43 (see protocol for details). We report meta-analysis evidence on the growth effect of human capital for LICs separately. However, we supplement this evidence with further evidence on ‘mixed’ countries (samples that

What is the empirical evidence of the relationship between education, skills and economic growth in low-income countries? 23
include LICs and non-LICs). We report the meta-analysis for these two groups of countries in order to provide further evidence against which the LIC evidence can be evaluated. The other reason for this ‘multi-population’ presentation is that the number of countries (the sample size) and the number of reported estimates in the original studies increase as one moves from ‘LICs’ to ‘mixed’ countries. This increase in sample size and number of estimates enables us to verify if the precision effect-test (PET) results remain robust across country groups.
This systematic review is about the impact of human capital investment (education and skills) on economic performance (growth) in LICs. Here, education and skills are considered as a ‘state’ variable that affects economic growth as the ‘outcome’ variable. As indicated in above, original studies analysed in this review use nine measures of human capital – which include enrolment rates, education expenditure and average years of education. These measures of education and skills are based on surveys and, as such, they are subjective. However, their subjective nature does not preclude their use in empirical research as the latter has developed various methods of controlling for endogeneity, reverse causality or the so-called ‘halo effect’ associated with perceptions-based data.
In this systematic review, we have addressed the problems that may arise from the heterogeneity of education and skills measures by nesting (clustering) the studies. We nested the studies on the basis of the human capital measure used. The studies use nine different measures of education and skills. This breakdown enabled us to calculate the REEs (weighted means) and conduct PETs at the most disaggregate level of human capital measures.
The outcome variable in this systematic review is ‘growth’, which is measured as per-capita GDP growth rates, GDP growth rates and TFP growth in the original studies. Given this heterogeneity in the measure of growth, we nested (cluster) the original studies within three different growth nests when we analysed the direct effect of education and skills on growth. We maintained this level of disaggregation when we controlled for either human capital measures or country groups.

What is the empirical evidence of the relationship between education, skills and economic growth in low-income countries? 24
2. Methods used in the review
2.1 User involvement
Our starting point in the process of identifying potential users of the review has been the review specifications drafted by the Department for International Development (DFID) of the UK Government. DFID is a major actor with strong interest in international development in general and international aid in particular. The Department considers the production and dissemination of systematic reviews as an important means for strengthening the international community’s capacity for evidence-based policy-making. DFID is also of the view that better-informed decisions increase the impact of and provide better returns on policy interventions (www.dfid.gov.uk/R4D//SystematicReviewFeature.asp).
This systematic review has been conducted in response to the objectives identified by DFID in its programme for systematic reviews, one of which is to support the ‘... creation and dissemination of systematic reviews as public goods’. To develop a better understanding of DFID’s goals and benefit from the insights of policy-makers in the field, we have also consulted with the lead persons of the relevant policy units at DFID. These consultations have led to formulation of three specific goals for the review: (i) providing an evidence base for policy development; (ii) identifying possible gaps in the theoretical and empirical literature; and (iii) identifying new research questions that may inform both new research and new systematic reviews of the existing research.
We aim to expand the scope for user involvement by following a two-pronged strategy. On the one hand, we will draw on the University of Greenwich’s research and publicity infrastructure to disseminate the review findings through press releases, Greenwich-based workshop presentations, and web presence on the University of Greenwich website. On the other hand, we will liaise with the University of Greenwich Director for International Partnerships, who works closely with higher education institutions in developing countries, including Bangladesh and Ethiopia. The aim here is to present the findings of the review and elicit debate through workshops open to the faculty of partner institutions, civil society organisations, and local/national policy-makers in the UK. We aim to organise two overseas workshops – one in Bangladesh and one in Ethiopia. The systematic review will be revised, if necessary, in the light of comments and feedback we receive in the workshops or thorough other means.
We also aim to make the review accessible to the research community. To this end, we will deposit the review with the EPPI-Centre and with online research repositories such as MRPA (Munich RePec Personal Archive) and SSRN (Social Science Research Network) that are used heavily by researchers in economics and social sciences. Finally, we will revise and update the review in the light of the feedback we receive and submit it to economics journals that recently began to publish systematic reviews (e.g. Journal of Economic Surveys, Journal of Economic Perspectives, Journal of Economic Literature). We expect the eventual publication in a journal to instigate scholarly interest in and debate on how systematic reviews can add value to the conventional literature reviews that are the dominant form of review in economics in general and development economics in particular.
2.2 Identifying and describing studies
2.2.1 Identification of potential studies: search strategy
Our search strategy consisted of three components:

What is the empirical evidence of the relationship between education, skills and economic growth in low-income countries? 25
i. Database selection;
ii. Concept/keyword specification, searching, and storing/documenting the
search results; and
iii. Manual search.
We have searched 19 databases, selected on the basis of our research experience and referee comments/recommendations received on the draft protocol. The databases are grouped under three categories, reflecting three publication types: published studies, working papers and reports, and theses. A list of databases is given in Appendix 2.1.
We have used three main categories of concepts/keywords for our search:
i. Concepts/keywords for the independent variable – education and skills: six
ii. Concepts/keywords for the outcome variable – growth: eight
iii. Keywords for population – LICs: eight keywords and 43 LIC names
A list of keywords is given in Appendix 2.2.
Initially, we searched in ‘title’, ‘abstract’ and ‘keyword’ for concepts/keywords in (i) and (ii). Then, we searched in ‘keyword’ and ‘full text’ for population keywords in (iii). Finally, we combined the search results, to obtain all studies that have all specified concepts/keywords and their synonyms in the ‘title’, ‘abstract’, ‘keyword’ or ‘text’ of the studies
The search was conducted by research assistants and supervised by the reviewers as indicated in the protocol. Carrying out the search in all databases, we obtained 4,542 studies, 700 of which were identified as duplicates during initial screening. We uploaded the net set of 3,842 studies on to EPPI-Reviewer, which was our main platform for document storage, management and coding.
In addition, we conducted a manual search after completing the evaluation/critical appraisal of the selected studies. The aim of the manual search was to locate studies not captured by electronic search and grey literature not indexed on commercial databases. Our manual search was guided by the recommendations of JBI (2008) and CRD (2009).
2.2.2 Screening studies: inclusion and exclusion criteria at title/abstract level
We conducted initial screening on the 3,842 studies, using the title and abstract information. We interrogated the studies with two relevance criteria, as specified in the protocol. The two reviewers, M. Ugur and D. Hawkes, piloted ten articles and compared their decisions for consistency. Of the 3,842 articles, 218 were considered relevant for evaluation on the basis of population – independent variable – outcome – study design (PIOS) criteria. A total of 166 of these were coded as empirical (EM) or Both (EM2) studies – as specified in the protocol. Fifty-two studies were coded as theoretical/analytical (TA) studies – again in accordance with the specification in the protocol. The decision tree depicting this process is presented in section 3.1 below.
We have used the relevance criteria by interrogating each search result with the following two questions:
i. Does the study analyse the relationship between education, skills and growth?
Yes or No?

What is the empirical evidence of the relationship between education, skills and economic growth in low-income countries? 26
ii. Does the study estimate the relationship between education, skills and growth?
Yes or No?
Studies that score ‘yes’ for (i) were selected for the next stage, i.e. for the critical evaluation and inclusion/exclusion stage.
If the selected study analyses the education, skills and growth relationship, it was coded as TA.
If the selected study estimates the education, skills and growth relationship, it was coded as EM.
If the selected study analyses and estimates the education, skills and growth relationship, it was coded as EM2.
2.2.3 Evaluating studies: VRA and PIOS criteria at full-text stage
We carried out a critical evaluation of the 218 studies using the PIOS (population – independent variable – outcome – study design) framework. The PIOS criteria draw on the PICOS (population – intervention – comparator – outcome – study design) framework recommended by the Centre for Reviews and Dissemination (CRD) of the University of York (CRD 2009). The critical appraisal of the full-text studies was carried out by interrogating each study with a consistent and reproducible set of questions. These questions were derived by merging the validity – reliability – applicability (VRA) requirements with the PIOS framework. The TA studies were interrogated with four questions, and the EM and EM2 studies were interrogated with five questions. The questions and their association with the PIOS and VRA criteria are presented in Appendices 2.4 and 2.5.
The critical evaluation enabled us to asses each study with respect to:
Population: the cases in the study should include ‘low-income countries’ or its synonyms as defined above in the search strategy.
Independent variable: the study should be examining ‘education’ or its synonyms as an ‘intervention’ or as a ‘state variable’ that differs between countries and/or over time.
Outcome: the study should be examining the change in ‘growth’ or its synonyms, as defined in the search criteria above.
Study design for theoretical/analytical (TA studies: the study should be based on an explicit theoretical/analytical model, constructed and brought to a conclusion verbally or mathematically, with a view to analysing the impact of education or its synonyms on growth or its synonyms. OR Study design for purely empirical (EM) or mixed (EM2) studies: the study should be based on a clearly specified regression model and an estimation methodology appropriate for estimating the impact of education or its synonyms on growth or its synonyms.
Applying these criteria and coding accordingly, the screening process yielded the following results.

What is the empirical evidence of the relationship between education, skills and economic growth in low-income countries? 27
Table 2.1: Results of critical evaluation
We read the 57 studies once more with a view to ensuring that the country sample in each study contained at least one LIC – as defined by the World Bank and as indicated in the protocol. This second reading revealed that 18 studies did not include at least one LIC covered by the World Bank list. These studies either had their own definitions of LICs (e.g. countries in the bottom 30 percent or 25 percent of a country list based on the level of per-capita GDP), or they did not report the list of countries included in the sample. Therefore, the final set of studies included for data extraction and analysis dropped from 57 to 39 – of which 33 are empirical studies (EM/EM2) and six theoretical/analytical (TA) studies. The decision tree for this process is given in section 3.1. This total includes two handsearched studies (Barro and Sala-i-Martin 2004, Mankiw et al. 1992).
2.3 Methods for synthesis
In this systematic review, we used three meta-analysis tools to synthesise the evidence reported in original studies. The tools consist of: (i) fixed-effect weighted means of the estimates reported by each study; (ii) random-effect weighted means of the estimates reported by a group of studies nested/clustered within consistent measures of education/skills and economic growth; and (iii) PETs for testing whether the random-effect weighted means can be considered as reliable measures of a statistically significant relationship between education/skills and growth.
FEE has been shown to be efficient if the estimates reported in original studies are drawn from the same population with a common mean, Stanley et al 2009). REE, on the other hand, is efficient when the original estimates are drawn from different populations.
Although FEE and REE are efficient estimates, they cannot be taken as measures of genuine effects – i.e. as statistically significant measures of education’s or skills’ effect on growth. This is due to the risk of study selection bias or the small number of original estimates from which they are derived. Therefore, we also provided confidence intervals and precision levels for FEE and conducted PETs for each REE we report.
Criteria Studies satisfying the criteria
Population 169
Independent variable 169
Outcome variable 140
Study design TA 10
Study design EM/EM2 76
Decision Select if 4 criteria satisfied
Select for next stage 57 = 51 EM/EM2 + 6TA
De-select 161
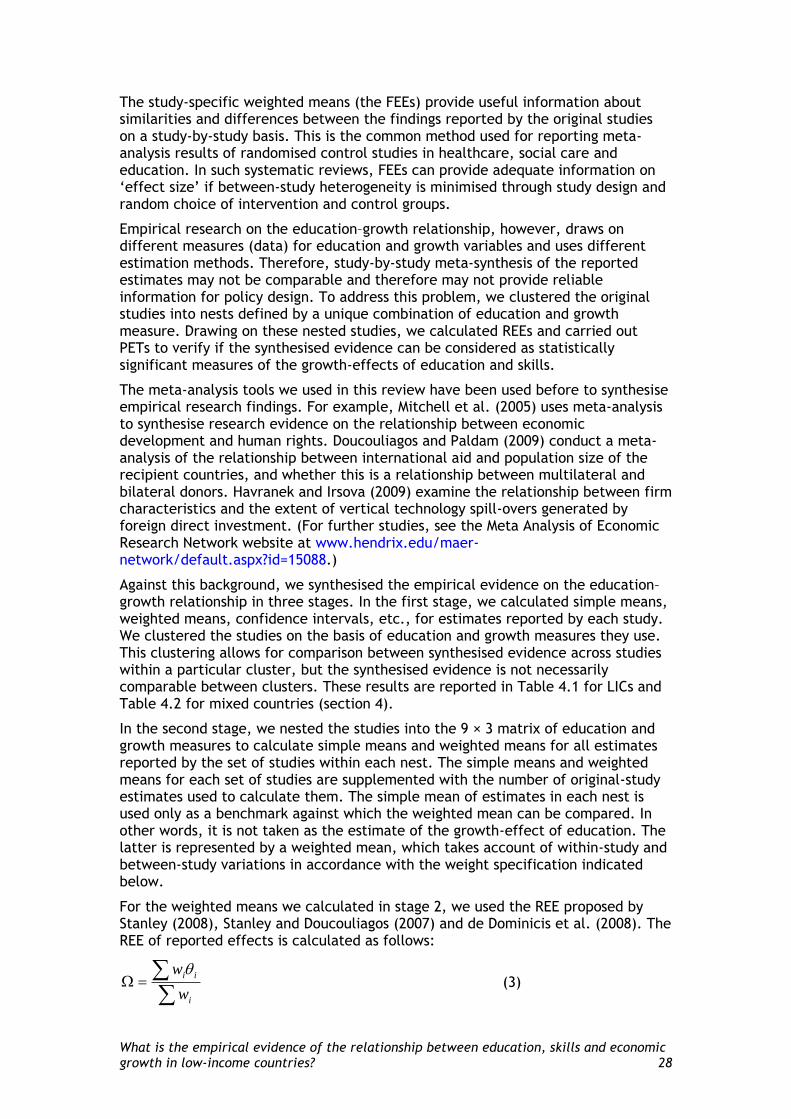
What is the empirical evidence of the relationship between education, skills and economic growth in low-income countries? 28
The study-specific weighted means (the FEEs) provide useful information about similarities and differences between the findings reported by the original studies on a study-by-study basis. This is the common method used for reporting meta-analysis results of randomised control studies in healthcare, social care and education. In such systematic reviews, FEEs can provide adequate information on ‘effect size’ if between-study heterogeneity is minimised through study design and random choice of intervention and control groups.
Empirical research on the education–growth relationship, however, draws on different measures (data) for education and growth variables and uses different estimation methods. Therefore, study-by-study meta-synthesis of the reported estimates may not be comparable and therefore may not provide reliable information for policy design. To address this problem, we clustered the original studies into nests defined by a unique combination of education and growth measure. Drawing on these nested studies, we calculated REEs and carried out PETs to verify if the synthesised evidence can be considered as statistically significant measures of the growth-effects of education and skills.
The meta-analysis tools we used in this review have been used before to synthesise empirical research findings. For example, Mitchell et al. (2005) uses meta-analysis to synthesise research evidence on the relationship between economic development and human rights. Doucouliagos and Paldam (2009) conduct a meta-analysis of the relationship between international aid and population size of the recipient countries, and whether this is a relationship between multilateral and bilateral donors. Havranek and Irsova (2009) examine the relationship between firm characteristics and the extent of vertical technology spill-overs generated by foreign direct investment. (For further studies, see the Meta Analysis of Economic Research Network website at www.hendrix.edu/maer-network/default.aspx?id=15088.)
Against this background, we synthesised the empirical evidence on the education–growth relationship in three stages. In the first stage, we calculated simple means, weighted means, confidence intervals, etc., for estimates reported by each study. We clustered the studies on the basis of education and growth measures they use. This clustering allows for comparison between synthesised evidence across studies within a particular cluster, but the synthesised evidence is not necessarily comparable between clusters. These results are reported in Table 4.1 for LICs and Table 4.2 for mixed countries (section 4).
In the second stage, we nested the studies into the 9 × 3 matrix of education and growth measures to calculate simple means and weighted means for all estimates reported by the set of studies within each nest. The simple means and weighted means for each set of studies are supplemented with the number of original-study estimates used to calculate them. The simple mean of estimates in each nest is used only as a benchmark against which the weighted mean can be compared. In other words, it is not taken as the estimate of the growth-effect of education. The latter is represented by a weighted mean, which takes account of within-study and between-study variations in accordance with the weight specification indicated below.
For the weighted means we calculated in stage 2, we used the REE proposed by Stanley (2008), Stanley and Doucouliagos (2007) and de Dominicis et al. (2008). The REE of reported effects is calculated as follows:
i
ii
w
w (3)

What is the empirical evidence of the relationship between education, skills and economic growth in low-income countries? 29
Where is the weighted mean of the reported effects; i is the series of reported
regression coefficient estimates by studies within each nest, for the meta-
regression raw correlations are also extracted; and iw is the weight. The weight,
in turn, is the inverse of the square of the standard error (1/SEi2) associated with
each of the reported estimates. The REE weighted mean can be expected to be smaller the lower the precision (i.e. the higher the standard error) of the original estimates. (For further elaboration on FEEs, see Appendix 2.6).
In the third stage, we calculated REEs for the weighted means of original estimates nested within a specific combination of education/skills and growth measures. Formally, it can be stated as:
)]/(1[
)]/(1[
2
2
2
2
i
ii
SE
SE (4)
The REE accounts not only for within-study variation (as the FEE does) but also for between-study variation. It is calculated using [(1/(SEi
2 + σ2)] as weight, where SEi is the standard error of each original estimate and σ2 is the variance of the distribution of the estimates reported by a group of studies within a specific nest/cluster. (For further elaboration on the random-effect estimates, see Appendix 2.6).
Also in the third stage we carried out PETs by estimating a WLS regression model and testing for statistical significance of the slope coefficient. The model can be stated as follows:
iSEt ii 01 )/1( (5)
Here it )is the t-statistic and iSE/1 is the precision of the estimates reported in
original studies; i is the error term. This model can be estimated by OLS and provides a basis to test for both funnel asymmetry (funnel-asymmetry test – FAT) and also for genuine effect beyond publication selection (PET) (Stanley 2008). (For further elaboration on the PET and properties of the WLS model, see Appendix 2.6).
Finally in this third stage results are presented of a meta-regression which enables us to assess the extent of within-study dependence. To achieve this, we clustered effect sizes by the study from which they originated to estimate the size of the standard errors. We compared the results of the PET using clustered effect sizes with results from the PET using effect sizes that had not been clustered, to see if there was a difference in the significance of the precision effect. A difference in the significance of the observed precision effect would indicate that the multiple effect sizes per study might bias the results of analyses; that is, it would indicate within-study dependencies. In addition this approach enables the consideration of the effects of the independent variables conditional on the other control variables. This meta-regression is undertaken twice, once with the regression coefficient and once with the partial correlation as the dependent variable as part of the sensitivity analysis.
In all of the three stages summarised above, we divided the studies into two categories: studies reporting estimates on LICs, and studies reporting estimates on ‘mixed’ countries, which consist of LICs and non-LICs. In addition, in stage three, we also divided the studies in to two types, defined by estimation methods. One estimation method is GMM, which uses the past (lagged) values of the endogenous variables as weights. The other method group consists of all of the studies.

What is the empirical evidence of the relationship between education, skills and economic growth in low-income countries? 30
2.4 Deriving conclusions and implications
Our review demonstrates that there is a rich literature on the relationship between education/skills and economic growth. The critical evaluation and data extraction process provided us with an overview of the empirical findings that we can synthesise after taking due account of the variation that exists between studies with respect to country type, estimation method, model specification, and education/skills measurement. Drawing on this overview, the review team met and discussed the relevance of the theoretical/analytical framework presented above. The six TA papers identified have been used to provide additional support and evidence for this theoretical/analytical framework.
With respect to meta-analysis of empirical evidence, on the other hand, we decided to provide synthesised evidence at a disaggregated level first before we proceed to the aggregate level for LICs and mixed countries. This decision was informed by the need to account for the observational nature of the empirical studies and for between-study heterogeneity. This decision required conducting PETs at different levels of aggregation, comparing the results with respect to consistency, and proceeding to derive aggregate-level synthesis after the findings indicated that: (i) the majority of the test results indicate the existence of genuine effect at different levels of aggregation/disaggregation; and (ii) the sign of the FEEs and REEs we calculated remain consistent as we move up in the aggregation process.
Before drafting the report, the review team discussed the implications of the synthesised evidence for policy, practice and research. In that discussion, we established that the weight of the theoretical/analytical and empirical evidence points to a positive effect from education/skills on growth. However, this synthesised evidence differs between studies, study clusters, estimation methods, and country types. Therefore, we decided that the policy and practice conclusions should be stated with explicit reference to the type of human capital measurement as this was the clear difference between the studies and an area which merits further research in terms of how best to measure the human capital to inform international development policy. We also decided that it is necessary and appropriate to qualify our policy recommendations with statements on the strengths and limitation of systematic reviews based on observational studies.
With respect to research implications, we established that both theoretical/analytical and empirical work on the relationship between education/skills and economic growth has made significant progress in terms of quantity and quality. However, we also established that there is significant scope for innovation/development with respect to model specification, measurement of human capital and robustness tests.

What is the empirical evidence of the relationship between education, skills and economic growth in low-income countries? 31
3. Search results
3.1 Studies included from searching and screening
The decision tree summarising the decisions at the title/abstract screening and critical evaluation stages is presented below.
Figure 3.1: Decision tree for screening and critical evaluation stages
EM: study estimates the education, skills and growth relationship; EM2: study analyses and estimates the education, skills and growth relationship; TA: study analyses the education, skills and growth relationship.
Two-stage screening Papers identified where there is not immediate screening, e.g. electronic searching
Studies identified by handsearch and through consultation
4,542 citations identified
Title and abstract screening
Studies excluded for failing to satisfy one of the validity, applicability and reliability criteria
TOTAL excluded: 3,624
2 218 citations
220 citations
Full text of 220 studies uploaded to EPPI-Reviewer
Full-text critical evaluation
Citations excluded due to failure to satisfy one PIOS criterion: Population Independent variable Outcome Study design
TOTAL excluded: 181
39 studies included
33 EM/EM2 and 6 TA
Review of XX studies (in XX
reports)
700 duplicates excluded

What is the empirical evidence of the relationship between education, skills and economic growth in low-income countries? 32
3.2 Details of included studies
We have included 39 studies: 33 empirical and six theoretical studies. One characteristic of included studies is that their frequency distribution over time is congruent with that of all studies captured our search. The distribution over time reflects an increasing frequency for all studies as well as included studies (both empirical and theoretical/analytical studies).
The second characteristics relates to distribution of studies with respect to publication type. Among theoretical/analytical studies, we have one book and five journal articles. The distribution of empirical studies is similar, with one book, four working papers and 28 journal articles.
The empirical studies using regressions to estimate the impact of human capital on growth utilise a wide range of estimation methods – ranging from OLS through 2SLS and 3SLS to GMM. Most studies in this category also use multiple model specifications. In fact, it is generally the case that studies with the most recent papers first report OLS estimation results as upper-bound estimates followed by 2SLS or 3SLS estimates and eventually GMM estimates to check the robustness of the results to estimation method and instrumentation.
Despite this variation, however, all empirical studies estimate a growth model that is compatible with growth regressions discussed and tested in the empirics of growth literature (Barro, 1991, Gyimah-Brempong and Taylor 1999, Mankiw et al. 1992, Renelt 1991, Sachs and Warner 1997).
Finally, the empirical studies use different types of measurement for education and skills – and some studies use more than one measure of human capital. We control for variation in data sources by calculating REEs for groups of studies that use the comparable education and skills measures. The REE is a point estimate of the weighted mean of the original estimates, where the weights are the inverse of within-study and between-study variation [(1/(SEi
2 + σ2)]. Tables 4.3 and 4.4 (section 4) indicate that the REEs of the weighted means differ in magnitude between education and skill measurement adopted. However, the REEs remain positive in most studies when human capital measurements are disaggregated into nine categories.
We entered the 33 empirical EM/EM2 studies into an Microsoft Excel sheet, where each row contains one observation (i.e. reported estimate) from a given study. If the study reports a number of estimates, N, the study name [in author(s), date format] appears in N rows. Then we have identified a set of codes including: publication type (journal article, book, working paper), type of estimation method (OLS, IV [instrumental variables FEE GMM, other), type of education and skill measure (nine groups as set out in section 1.2.4), and type of countries in the sample (LICs and mixed). A summary of the code categories and the number of code headings in each category is presented in the Appendix 3.1.
Each reported estimate was entered in the column coded ‘direct effect’ if the estimate refers to the direct effect of human capital on the outcome variable (i.e. growth). If the reported ‘direct effect’ refers to the direct effect of education and skills on per-capita GDP growth, the cell corresponding to per-capita GDP growth was coded with ‘1’ and all other cells corresponding to growth measure were coded with ‘0’. We controlled for human capital measure, estimation method, publication type, etc. in the same manner. When all codes are entered for a given reported estimate all relevant code headings will be coded with ‘1’ and all others will be coded with ‘0’. When this procedures was repeated for all reported effects in the included studies, we obtained a data matrix consisting of 374 rows × 38 columns =
XX citations identified
Title and abstract screening
Citations excluded Criterion 1 – XX Criterion 2 – XX (etc.) TOTAL - XX
XX citations identified
XX citations
XX citations
XX duplicates excluded
XX citations identified in total
XX reports obtained
Acquisition of reports
Full-document screening
XX reports not obtained
Reports excluded Criterion 1 – XX Criterion 2 – XX (etc.) TOTAL - XX
XX studies in XX reports included
Review of XX studies (in XX
reports)

What is the empirical evidence of the relationship between education, skills and economic growth in low-income countries? 33
14,212 data entries. We used this data set to conduct meta-analysis for different groups of studies (LIC, mixed, GMM only). This hierarchical approach has enabled us to control for relevant factors and to pool studies together on the basis of explicitly defined criteria derived from the control code categories specified in Appendix 3.1. We have conducted repeated quality checks to ensure that all data entries are correct.

What is the empirical evidence of the relationship between education, skills and economic growth in low-income countries? 34
4. Synthesis results
4.1 Outline of chapter
This chapter focuses on the results of the meta-analysis of the 33 empirical studies identified. It focuses of evaluating the effect of education and skills on economic growth. The chapter proceeds as follows: with a summary of the results presented and then the results of the meta-analysis.
4.2 Synthesis of evidence
4.2.1 Meta-analysis – summary
In this section, we present the meta-analysis results for 374 estimates reported in the set of empirical studies (EM/EM2). We begin with a summary of how the presentation is organised.
First, we provide summary statistics for individual studies, consisting of simple mean, weighted mean, weighted confidence interval and average precision measurement for each study for the LIC studies only and then for a broader set of studies containing mixed countries with data from at least one LIC. As indicated above, the sample mean of reported estimates is not a reliable measure of the true effect due to within-study dependence. Therefore, we calculated the weighted means and confidence intervals for original individual studies as a control variable to consider within-study dependence. We report the study-specific summary measures mainly to provide a quick overview of their distribution between studies and to highlight the degree of between-study heterogeneity.
Second, after the study-based summary of the estimates, we present the meta-analysis results for LICs – the country group that the systematic review question specifies. These results include unweighted means and coefficients of variation, weighted means calculated as REEs and coefficients of variation, and PET results for establishing the existence or absence of genuine effect. Because of the relatively small number of LIC-specific estimates (62 out of 374), the meta-analysis results for LICs will be nested only for education measure and the type of growth measure for which data exist.
Third, we present the same sets of meta-analysis results for mixed studies that include both LICs and other countries. Again here the meta-analysis results are nested within different education measures and the type of growth measure used. For this larger group of studies we also consider the results for just those studies that correct for endogeneity by using the GMM method. This is not reported for the LIC countries-only given the very small number of observations available.
4.2.2 Meta-analysis of individual studies
Table 4.1 presents the summary statistics per study by nests of education and growth measures for LICs only. The number of studies that estimate the education–growth relationship in LICs is 13 and the number of reported estimates in these studies is 62. The simple mean estimates per study are all positive, with the exception of Nketiah-Amponsah (2009) who reports a negative estimate of –0.3. However, the mean of estimates reported by studies differs significantly. This heterogeneity remains evident even when the studies are nested within the same pair of education and growth measures. For example, in the nest of ‘average years of schooling’ and ‘GDP growth’, the estimate reported by Barro and Sala-i-Martin (2004) is one-tenth of the mean of estimates reported by Gyimah-Brempong et al (2006). Given this heterogeneity, and the fact simple means based on individual

What is the empirical evidence of the relationship between education, skills and economic growth in low-income countries? 35
studies may suffer from within-study dependence, Table 4.1 simple mean results can only enable us to indicate that various measures of education tend to have a positive effect on various measures of growth. This conclusion can draw further support from the minimum values of the reported estimates – which include only three negative estimates out of 12 studies: Nketiah-Amponsah (2009), Chen and Gupta (2009) and Lee and Kim (2009). The weighted mean has a similar pattern to the sample mean except that two studies have a negative result. Of the studies where a weighted confidence interval can be calculated, half of them report a weighted mean that is not significantly different from zero. This weighted mean confirms that the effect of education and skills on economic growth is likely to be small and positive, if we are happy to accept that the measures of human capital are appropriate.
Table 4.2 expands the selected studies to include papers that have at least one LIC in the sample. The total number of studies is 33 and the total number of reported estimates is 374. The averages of reported estimates by each study reflect a similar degree of heterogeneity as was observed for LICs. Another similarity with LICs is that the majority of the average estimates (29 estimates) have a positive sign, and around one-third (ten) have a negative sign. Therefore, one observation can be made with respect to mixed countries is similar to that made for LICs: various measures of education tend to have a positive association with various measures of growth. Another observation that can be made is that the majority of studies as well as reported estimates tend to cluster within two nests that are defined by two measures of education (enrolment rates and average year of schooling) and one measure of growth (per-capita GDP growth). These two nests are likely to be the most important in the meta-analysis below given the larger sample sizes. The total number of studies clustered within these two nests is 13 and the total number of reported estimates is 164.

What is the empirical evidence of the relationship between education, skills and economic growth in low-income countries? 36
Table 4.1: Summary of estimates by study: nested by education and growth measures, low-income countries (LICs) only
Education/growth measure for nesting Reference Simple mean Weighted mean Weighted C.I. N
Average
precision
Average years of schooling and GDP growth per
capita
Noe
Barro (2004) 0.0056 0.0056 1 222.22
Gyimah-Brempong
(2006)
0.0539 0.0111 –0.002 0.02 10 86.19
Hanushek (2008) 0.0060 0.006 1 8.33
Education expenditure and GDP growth Musila (2004) 0.3285 0.0647 –1.54 1.67 2 30.36
Education expenditure and GDP growth per
capita
Landau (1983) 0.0275 0.0280 –0.01 0.07 2 187.72
Rate of change of education expenditure and
GDP growth
Nketiah-Amponsah
(2009)
–0.3000 –0.3000 1 3.07
Rate of change of education expenditure and
GDP growth per capita
Okpala (2007) 0.2203 0.2214 0.03 0.41 2 13.53
Proportion of population with a set level of
education and GDP growth per capita
Bolt (2009) 25.0573 24.0442 7.49 40.60 3 0.09
Enrolment rate and GDP growth
Appiah(2002) 0.0010 0.0003 –0.001 0.001 2 525
Chen (2009) 1.6321 –0.0047 –0.03 0.02 12 47.23
Enrolment rate and GDP growth per capita Lee (2009) 0.0074 0.0047 0.002 0.007 7 438.94
Sandar (2009) 0.0032 0.0005 0.0002 0.0007 7 3602.79
Rate of change of enrolment rate and GDP
growth per capita
Seetanah (2009) 0.1488 0.0314 –0.02 0.08 8 45.54
Skills and GDP growth per capita Hanushek (2008) 2.1710 2.1743 0.71 3.63 2 3.01
Okpala (2007) 0.1160 0.1161 0.07 0.16 2 12.53
Total number of studies: 13 Total reported estimates: 62
Note: where N is the number of regression coefficient estimates identified.

What is the empirical evidence of the relationship between education, skills and economic growth in low-income countries? 37
Table 4.2: Summary of estimates by study: nested by education and growth measures, mixed countries only
Education/growth measure for nesting Reference Simple mean Weighted mean Weighted C.I. N
Average
precision
Average years of education and GDP growth Temple (1999) 0.1115 0.1289 0.06 0.20 4 17.32
Average years of schooling and GDP growth per
capita
Barro (2004) 0.0031 0.0025 0.001 0.004 11 388.05
Bosworth (2003) 0.0920 0.1008 0.07 0.13 5 23.56
Collins (1996) 0.1150 0.0613 –0.006 0.13 4 1.34
Gyimah-Brempong
(2006)
0.0539 0.0111 –0.002 0.02 10 86.19
Hanushek (2008) 0.0051 0.0323 –0.04 0.11 9 5.50
Knowles (2002) 0.1414 0.2002 0.10 0.30 20 7.27
Odit (2010) 0.8766 0.1887 –4.43 4.81 2 5.43
Average years of schooling and TFP growth Engelbrecht
(2002)
0.0983 0.0070 –0.004 0.02 15 50.55
Rate of change of average years of education
and GDP growth
Dessus (2001) –0.0568 –0.1064 –0.18 –0.04 9 –21.73
Islam (1995) 0.0401 –0.0003 –0.12 0.12 3 36.88
Siddiqui (2006) –0.0157 0.0501 0.004 0.10 21 12.18
Rate of hange of average years of education
and GDP growth per capita
Bloom (1998) 0.2285 0.1824 –1.52 1.88 2 5.81
Education expenditure and GDP growth Dessus (2001) 0.1110 0.1110 1 18.74
Musila (2004) 0.3285 0.0647 –1.54 1.67 2 30.37
Education expenditure and GDP growth per
capita
Baldacci (2008) 0.0885 0.0686 0.03 0.11 6 46.18
Bose (2007) 1.5112 1.1764 0.41 1.95 5 2.62
Landau (1983) 0.0248 0.0248 0.02 0.03 13 241.81
Rate of change of education expenditure and
GDP growth
Dessus (2001) –0.0170 –0.0170 1 –24.12
Nketiah-Amponsah
(2009)
–0.3000 –0.3000 1 3.07
Temple (1999) 0.0392 0.0569 –0.001 0.12 6 28.29

What is the empirical evidence of the relationship between education, skills and economic growth in low-income countries? 38
Education/growth measure for nesting Reference Simple mean Weighted mean Weighted C.I. N
Average
precision
Rate of change of education expenditure and
GDP growth per capita
Baldacci (2008) 0.1212 0.0858 0.06 0.11 6 33.95
Keller (2006) –0.3837 –0.0078 –0.03 0.01 36 –20.73
Okpala (2007) 0.2203 0.2214 0.03 0.41 2 13.53
Proportion of population with a certain level of
education and GDP growth
Dessus (2001) –0.005 –0.0050 1 –370
Proportion of population with a certain level of
education and GDP growth per capita
Bolt (2009) 25.0573 24.0442 7.49 40.60 3 0.09
Durlauf (1995) 0.1749 0.1875 0.02 0.35 7 10.10
Enrolment rate and GDP growth Appiah(2002) 0.0010 0.0003 –0.001 0.001 2 525
Brist (1999) 6.1238 –0.0032 –0.02 0.01 6 88.58
Chen (2009) 1.6321 –0.0047 –0.03 0.02 12 47.23
Musila (2004) –0.0056 0.0067 –0.17 0.18 2 98.98
Enrolment rate and GDP growth per capita Barro (1991) 0.0239 0.0238 0.02 0.03 32 129.34
Keller (2006) 0.0251 0.0217 0.002 0.04 18 12.04
Lee (2009) 0.0093 0.0059 0.004 0.007 11 667.53
Levine (1992) 1.8610 1.7171 0.98 2.45 10 0.85
Sandar (2009) 0.0016 0.0002 0.0001 0.0004 16 4530.01
Tsai (2010) 0.0241 0.0007 –0.0001 0.002 16 1453.96
Enrolment rate and TFP growth Engelbrecht
(2002)
–0.0231 –0.0231 1 8.55
Rate of change of enrolment rate and GDP
growth per capita
Lee (2009) 0.0162 0.0160 0.01 0.02 6 165.02
Mankiw (1992) 0.5227 0.4921 –0.15 1.13 3 15.08
Seetanah (2009) 0.1488 0.0314 –0.02 0.08 8 45.54
Rate of change of enrolment rate and TFP
growth
Engelbrecht
(2002)
1.3718 0.3513 0.08 0.62 5 4.45
Skills and GDP growth per capita
Barro (1991) –0.0171 –0.0171 1 114.94
Barro (2004) 0.1210 0.1210 1 41.67
Hanushek (2008) 3.0203 1.7681 1.28 2.25 9 2.68

What is the empirical evidence of the relationship between education, skills and economic growth in low-income countries? 39
Education/growth measure for nesting Reference Simple mean Weighted mean Weighted C.I. N
Average
precision
Okpala (2007) 0.1160 0.1161 0.07 0.16 2 12.53
Education quality and GDP growth Dessus (2001) –0.0153 –0.0135 –0.05 0.02 3 –35.89
Education quality and GDP growth per capita Barro (1991) 0.0018 0.0017 –0.005 0.008 3 4696.97
Bosworth (2003) 0.0150 0.0171 –0.04 0.07 2 90
Total number of studies: 33 Total reported estimates: 374
Note: where N is the number of regression coefficient estimates identified.
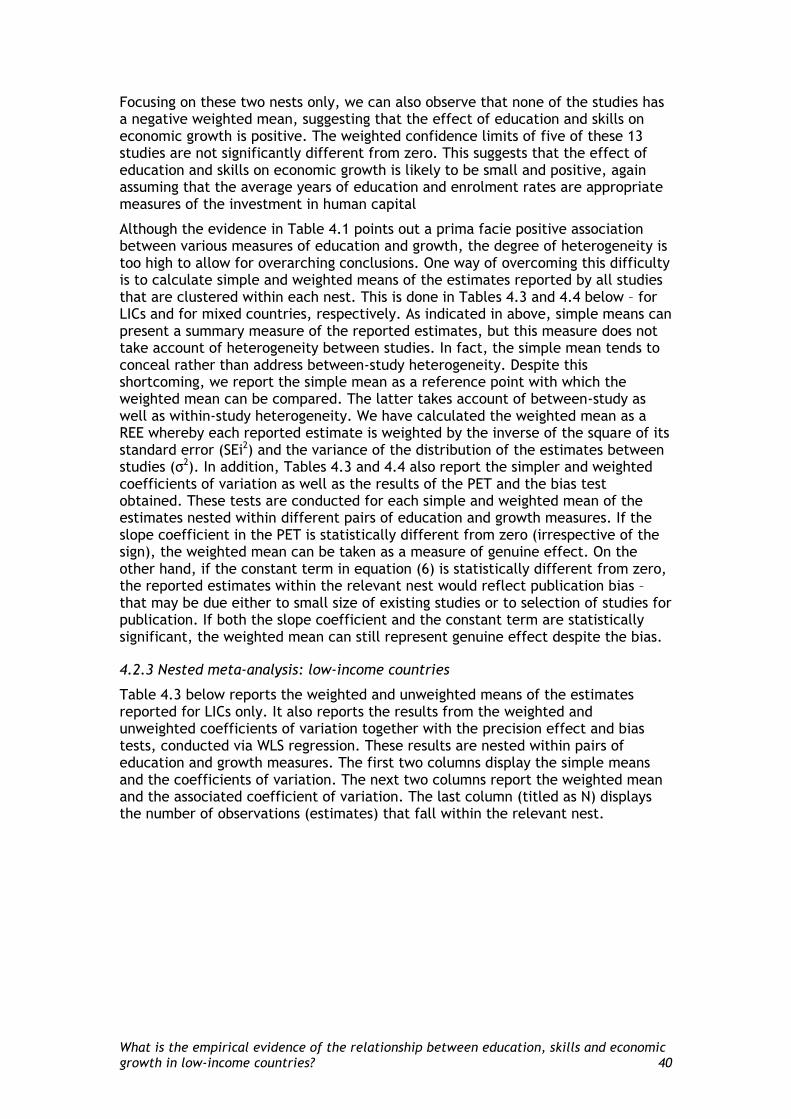
What is the empirical evidence of the relationship between education, skills and economic growth in low-income countries? 40
Focusing on these two nests only, we can also observe that none of the studies has a negative weighted mean, suggesting that the effect of education and skills on economic growth is positive. The weighted confidence limits of five of these 13 studies are not significantly different from zero. This suggests that the effect of education and skills on economic growth is likely to be small and positive, again assuming that the average years of education and enrolment rates are appropriate measures of the investment in human capital
Although the evidence in Table 4.1 points out a prima facie positive association between various measures of education and growth, the degree of heterogeneity is too high to allow for overarching conclusions. One way of overcoming this difficulty is to calculate simple and weighted means of the estimates reported by all studies that are clustered within each nest. This is done in Tables 4.3 and 4.4 below – for LICs and for mixed countries, respectively. As indicated in above, simple means can present a summary measure of the reported estimates, but this measure does not take account of heterogeneity between studies. In fact, the simple mean tends to conceal rather than address between-study heterogeneity. Despite this shortcoming, we report the simple mean as a reference point with which the weighted mean can be compared. The latter takes account of between-study as well as within-study heterogeneity. We have calculated the weighted mean as a REE whereby each reported estimate is weighted by the inverse of the square of its standard error (SEi2) and the variance of the distribution of the estimates between studies (σ2). In addition, Tables 4.3 and 4.4 also report the simpler and weighted coefficients of variation as well as the results of the PET and the bias test obtained. These tests are conducted for each simple and weighted mean of the estimates nested within different pairs of education and growth measures. If the slope coefficient in the PET is statistically different from zero (irrespective of the sign), the weighted mean can be taken as a measure of genuine effect. On the other hand, if the constant term in equation (6) is statistically different from zero, the reported estimates within the relevant nest would reflect publication bias – that may be due either to small size of existing studies or to selection of studies for publication. If both the slope coefficient and the constant term are statistically significant, the weighted mean can still represent genuine effect despite the bias.
4.2.3 Nested meta-analysis: low-income countries
Table 4.3 below reports the weighted and unweighted means of the estimates reported for LICs only. It also reports the results from the weighted and unweighted coefficients of variation together with the precision effect and bias tests, conducted via WLS regression. These results are nested within pairs of education and growth measures. The first two columns display the simple means and the coefficients of variation. The next two columns report the weighted mean and the associated coefficient of variation. The last column (titled as N) displays the number of observations (estimates) that fall within the relevant nest.

What is the empirical evidence of the relationship between education, skills and economic growth in low-income countries? 41
Table 4.3: Simple and weighted means of reported estimates, precision effect and bias test results: nested by education and growth
measures, low-income countries (LIC) only
Education/growth measure for
nesting
Mean values
Precision effect test
Genuine effect test Publication bias test
N
Simple
mean C.V.
Weighted
mean (REE) C.V. Coeff. Std. Err. Signf. Coeff. Std. Err. Signf.
Education expenditure and GDP
growth 0.329 1.259 0.318 1.300 2
Rate of change of education
Expenditure and GDP growth –0.300 1
Enrolment rate and GDP growth 1.399 1.617 1.376 1.635 –0.003 0.003 2.257 0.795 ** 14
Average years of schooling and
GDP growth per capita 0.046 1.102 0.046 1.096 –0.0009 0.003 2.413 0.465 *** 12
Education expenditure and GDP
growth per capita 0.028 0.180 0.028 0.180 2
Rate of change of education
expenditure and GDP growth per
capita 0.220 0.096 0.220 0.096 2
Proportion with set level of
education and GDP per capita 25.057 0.255 24.653 0.266 –5.977 28.099 2.732 2.534 3
Enrolment rate and GDP growth
per capita 0.005 1.459 0.005 1.460 0.00009 0.0002 1.957 0.532 14
Rate of change in enrolment rates
and GDP per capita 0.149 0.523 0.142 0.530 –0.005 0.019 4.051 1.354 ** 8
Skills and GDP growth per capita 1.143 1.041 1.139 1.045 –0.532 0.549 *** 8.132 0.500 *** 4
Note: where N = number of regression coefficient estimates identified; C.V. = coefficient of variation, * 10%, ** 5% and *** 1% significance;
publication bias test = PET.

What is the empirical evidence of the relationship between education, skills and economic growth in low-income countries? 42
One observation to be made here is that the number of reported estimates within each nest is small due to the small number of studies dedicated to LICs only. In fact, there are four nests within which the number of estimates (N) is one or two – and no precision effect or bias tests can be conducted for these nests.
Another observation to be made is that the sign of all unweighted and weighted means of the estimates within each nest is positive (with the exception of the unweighted mean for the ‘rate of change of education expenditures’ and ‘GDP growth’). The unweighted mean conceals between-study heterogeneity, but the weighted mean takes account of that. Given this property, the weighted mean enables us to derive conclusions that were not feasible due to excessive heterogeneity between simple means of individual studies. On that basis, we can state that measures of education are associated positively with measures of growth in six nests for which there are more than two observations. True, there is still some degree of variation in the magnitude of the weighted means – depending on the measure of education and growth nests. However, this variation is likely to be due to differences in measurement rather than a symptom of incoherence between the original estimates. On that basis, we can conclude that an increase in ‘education’ in an LIC is likely to increase growth after taking account of within-study and between-study heterogeneity. For three nests with more than ten observations we can show that the likely increase in GDP growth rate is 1.376 percentage points in response to a one-unit increase in enrolment rates. Similarly, the likely increase in per-capita GDP is 0.005 percentage points in response to a one-unit increase in enrolment rates. The likely increase in per-capita GDP is 0.046 percentage points for a one-unit increase in average years of education.
The third observation that can be made on the basis of the evidence in Table 4.3 relates to the relative magnitudes of the unweighted and weighted means. The weighted mean is always smaller or equal to the unweighted mean when the number of reported estimates (N) is greater than two. This is due to the fact that the weighted mean takes account of between-study heterogeneity and the number of studies and that of reported estimates, thus the weighted mean is corrected to account for heterogeneity and thereby to enhance reliability of the weighted mean.
Now we can examine the right-hand panel of Table 4.3, which reports the results of the precision effect and bias tests. Note that test results are available only for nests that contain at least three observations/estimates. The columns headed
‘Coefficient’ in this panel are the estimated values of 1 (the slope coefficient) and
0 (the constant) in the regression, whereas those columns headed ‘Standard
error’ are the standard errors of 1 and 0 . Only one result indicates that the weighted mean can be taken as a measure of a genuine effect and that is for ‘Skills and GDP growth per capita’. This is because the slope coefficient of the WLS regression is statistically significant. With respect to the ‘Skills and GDP growth per capita’ nest, we can conclude that a one-unit increase in skills levels is associated with an increase of 1.143% in per-capita GDP growth. This conclusion holds even though the bias test points out the presence of bias in the ‘Skills and per-capita GDP’ nests.
Finally, we must also indicate that studies in four out of six nests show some evidence of publication bias. The incidence of publication bias does not invalidate a genuine effect established under the PET, but the prevalence of publication bias is a concern that must be taken into account. The bias test indicates the existence or absence of bias, but does not provide any explanation about its cause – which can be due to small sample size, publication selection or measurement errors in

What is the empirical evidence of the relationship between education, skills and economic growth in low-income countries? 43
the underlying data used by original studies. In this specific case, the small sample size is likely to be the most important source of bias.
4.2.4 Nested meta-analysis: mixed countries
Table 4.4 below repeats the analysis presented in Table 4.3 for the large mixed country sample. It reports the weighted and unweighted means of the estimates in all studies containing at least one LIC. It also reports the weighted and unweighted coefficients of variation as well as the results from the precision effect and bias tests, conducted via the WLS regression. These results are, once again, nested within pairs of education and growth measures. The first two columns display the simple means and the coefficients of variation of the estimates. The next two columns report the weighted mean and the associated coefficients of variation. The last column (headed ‘N’) displays the number of observations (estimates) that fall within the relevant nest.
One observation to be made here is that the number of reported estimates within each nest is still small in some cases with two nests out of 19 still having only one or two estimates – and no precision effect or bias tests can be conducted for these nests. However we can also observe some sizeable gains in observations in some cases, most notably for the ‘Enrolment rate and GDP growth per capita’ nest which has 103 estimates compared to 14 estimates for LICs only. This increase in sample size has the benefit of supplying more data with which to estimate results although it also has the limitation of introducing a more diverse set of countries to the sample and therefore provides less of a focus on LICs.
The second observation is that although more nests have become available due to the increase in the number of estimates, the introduction of the more variable group of studies has introduced more variability in the sign of the unweighted and weighted means of the estimates within each nest. Six of the 19 nests indicate negative effects of education on economic growth for the simple means. As more between-study heterogeneity is likely to be introduced in this more diverse sample of studies we present the weighted mean to take account of that. However, after taking account of the between-study heterogeneity, three of the 17 nests show a negative effect of education on economic growth (these nests are ‘Rate of change of education expenditure and GDP growth per capita’, Rate of change of average years of schooling and GDP growth’ and ‘Education quality and GDP per capita’). However the majority of nests still show a positive effect of education on economic growth. Overall an increase in education is largely likely to increase growth after taking account of within-study and between-study heterogeneity.
The third observation that can be made on the basis of the evidence in Table 4.4 relates to the relative magnitudes of the unweighted and weighted means. As with Table 4.3 the weighted mean is usually smaller than the unweighted mean when the number of reported estimates (N) is greater than two. However, compared to Table 4.3 these differences tend to be larger and some weighted means are larger than their paired sample means. This is due to the fact the weighted mean takes account of between-study heterogeneity and as these studies are more heterogeneous to start with there is more for the weighted mean to control for.
Now we can examine the right-hand panel of Table 4.4, which reports the results of the precision effect and bias tests. Once again the test results are available only for nests that contain at least three observations/estimates and the columns
headed ‘Coefficient’ in this panel are the estimated values of 1 (the slope
coefficient) and 0 (the constant), whereas those columns headed ‘Standard error’

What is the empirical evidence of the relationship between education, skills and economic growth in low-income countries? 44
are the standard errors of 1 and 0 . We can see that five of the 16 nests tested show a genuine effect, demonstrated by the slope coefficient of the WLS regression being statistically significant for these groups. In three of the five cases the corresponding reported weighted mean is positive. This provides some evidence therefore that the effect of education on economic growth in LICs is positive if we are happy to accept these measures of education and skills.
Finally, we must also indicate that studies in ten out of 16 nests show some evidence of publication bias. The incidence of publication bias does not invalidate a genuine effect established under the PET, but the prevalence of publication bias is a concern that must be taken into account. The bias test indicates the existence or absence of bias, but does not provide any explanation about its cause. It should be noted that the increase in the sample sizes has not eliminated the evidence of publication bias and this suggests that the cause is likely to be more than merely sample size.

What is the empirical evidence of the relationship between education, skills and economic growth in low-income countries? 45
Table 4.4: Simple means, weighted means and precision effect test results: nested by education and growth measures, mixed countries
only
Education/growth
measure for nesting
Mean estimates
Precision effect test
Genuine effect test Publication bias test
Simple
mean C.V.
Weighted
mean
(REE) C.V. Coeff. Std. Err. Signific. Coeff. Std. Err. Signific. N
Average years of education
and GDP growth 0.112 0.375 0.122 0.345 0.270 0.027 *** –2.589 0.478 ** 4
Rate of change in average
years of education and GDP
growth –0.022
–
12.553 –0.004
–
58.919 –0.048 0.017 *** 1.394 0.460 *** 33
Education expenditure and
GDP growth 0.256 1.243 0.249 1.269 –0.099 0.104 6.241 3.256 3
Rate of change of
education expenditure and
GDP growth –0.010
–
13.135 0.024 3.706 0.051 0.029 –0.043 0.840 8
Proportion of population
with a set level of
education and GDP growth –0.005 1
Enrolment rates and GDP
growth 2.560 2.193 1.549 2.630 –0.004 0.002 1.708 0.587 *** 22
Education quality and GDP
growth –0.015 –1.767 –0.009 –2.670 –0.009 0.004 1.159 0.388 3
Average years of education
and GDP growth per capita 0.107 2.619 0.086 2.498 0.000001 0.001 1.402 0.237 61
Rate of change in average
years of education and GDP
growth per capita 0.229 0.876 0.208 0.952 2
Education expenditure and 0.350 1.844 0.266 2.116 0.013 0.003 *** 2.916 0.533 *** 24

What is the empirical evidence of the relationship between education, skills and economic growth in low-income countries? 46
Education/growth
measure for nesting
Mean estimates
Precision effect test
Genuine effect test Publication bias test
Simple
mean C.V.
Weighted
mean
(REE) C.V. Coeff. Std. Err. Signific. Coeff. Std. Err. Signific. N
GDP growth per capita
Rate of change of
education expenditure and
GDP growth per capita –0.287 –6.796 –0.210 –8.930 0.009 0.004 ** 3.258 0.278 *** 44
Proportion of population
with a set level of
education and GDP growth
per capita 7.640 1.622 4.816 2.161 0.043 0.104 1.663 0.940 10
Enrolment rates and GDP
growth per capita 0.197 3.191 0.059 5.150 0.00002 0.00009 2.435 0.234 *** 103
Rate of change of
enrolment rates and GDP
growth per capita 0.168 1.230 0.159 1.283 –0.012 0.009 5.097 0.967 *** 17
Skills and GDP per capita 2.117 1.588 1.740 1.547 –0.055 0.021 ** 4.867 0.710 *** 13
Education quality and GDP
growth per capita 0.007 1.161 0.005 1.552 0.001 0.002 1.664 7.175 5
Average years of Education
and TFP growth 0.098 1.256 0.074 1.446 –0.004 0.005 1.352 0.396 *** 15
Enrolment rates and TFP
growth –0.023 1
Rate of change in
enrolment rates and TFP
growth 1.372 0.709 0.951 1.045 0.191 0.084 1.451 0.536 * 5
Note: where N = number of regression coefficient estimates identified; C.V. = coefficient of variation, * 10%, ** 5% and *** 1% significance; publication bias test = PET.

What is the empirical evidence of the relationship between education, skills and economic growth in low-income countries? 47
4.2.5 Meta-analysis for GMM estimates only: mixed countries
Table 4.5 repeats the analysis using the sample of papers with at least one LIC country but restricts the sample to estimates in papers that explicitly control for endogeneity by using GMM estimation. As set out in section 1.2.3 attempts to compare estimates across different estimation techniques is likely to be problematic. Therefore the analysis of table 4.4 is repeated using just this one technique (GMM) which explicitly controls for endogeneity in Table 4.5 for those estimates that are considered more comparable. This analysis is reported for the mixed countries sample as the LIC-only sample had insufficient observations to produce any reliable estimates.
One observation to be made here is that the number of reported estimates within each nest is still small in many cases, with five nests out of 11 still having only one or two estimates – and no precision effect or bias tests can be conducted for these nests. However although there are many fewer estimates than in Table 4.4 these estimates are likely to be more comparable as they use GMM estimation to control for endogeneity. This improvement in comparability between studies may compensate for the loss of some of the studies that do not control explicitly for endogeneity.
The second observation is that there is still some variability in the sign of the unweighted and weighted means of the estimates within each nest is positive. Four of the 11 nests report negative effects of education on economic growth for the simple means, although two of these have only one observation each. As the restriction to the studies with a more comparable estimation approach has been put in place, less between-study heterogeneity is likely to be introduced here than in Table 4.4, and we present the weighted means to take account of any remaining between-study heterogeneity. After taking account of the between-study heterogeneity two of the six nests where weighted means are calculated show a negative effect of education on economic growth. However the majority of nests still indicate a positive effect of education on economic growth. Overall an increase in education is largely likely to increase growth after taking account of within-study and between-study heterogeneity again assuming we are happy to accept these proxies as suitable proxies for human capital investment.
The third observation that can be made on the basis of the evidence in Table 4.5 relates to the relative magnitudes of the unweighted and weighted means. Unlike Tables 4.3 and 4.4 the weighted mean is usually very close to the unweighted mean when the number of reported estimates (N) is greater than two. This is due to the fact the weighted mean takes account of between-study heterogeneity and these studies are less heterogeneous to start with as they use more comparable estimation techniques.
Now we can examine the right-hand panel of Table 4.5, which reports the results of the precision effect and bias tests. Once again the test results are available only for nests that contain at least three observations/estimates. We can see that one of the six nests tested shows a genuine positive effect, demonstrated by the slope coefficient of the WLS regression being statistically significant for these groups. This provides evidence therefore that the effect of education on economic growth in LICs is positive given that ‘Rate of change in enrolment rate’ is an acceptable measure of human capital investment. This is reassuring as the Millennium Development Goals have focused on improving enrolment rates by expecting all children to have access to a free primary school education.
Finally, we must also indicate that studies in three out of six nests show some evidence of publication bias. Once again, the incidence of publication bias does not invalidate a genuine effect established under PET, but the prevalence of publication bias is a concern that must be taken into account. The bias test indicates the existence or absence of bias, but does not provide any explanation about its cause. It should be noted that the increase in the sample sizes has not eliminated the evidence of publication bias and this suggests that the cause is likely to be more than merely sample size.

What is the empirical evidence of the relationship between education, skills and economic growth in low-income countries? 48
4.2.6 Meta-regression results for mixed countries
Table 4.6 presents PET results for the partial correlation coefficient (r). The first column shows the PET result when controlling for the clustering of the results by the paper of origin. The second column presents the PET result when not controlling for the clustering of the results by the paper of origin. We can see that the significance of the precision effect is reduced from 1% to 10% significance once clustering by paper of origin is controlled for. This suggests that within-study dependence is an important factor to consider and therefore motivates the meta-regressions below.
Table 4.7 presents the meta-regression results for both the regression coefficient (r)and the partial r. The first column presents the regression coefficient results which adjust for within-study dependence by using a cluster by study but the size of the effect is not uniform as it depends on the type of education and growth measure used. The second column presents the partial r results which adjust for within-study dependence by clustering by study and the effect is uniform as it varies for all studies between -1 and +1. The first row of the table shows why the two sets of results are presented, as the effect for LICs is not significant when using the regression coefficient but is significant when the magnitude of the measures used is removed. This result shows that the results for LICs indicate a larger positive effect of education on growth than found for mixed countries. This suggests that in LICs there may be a larger effect of human capital investment than in other developing countries.
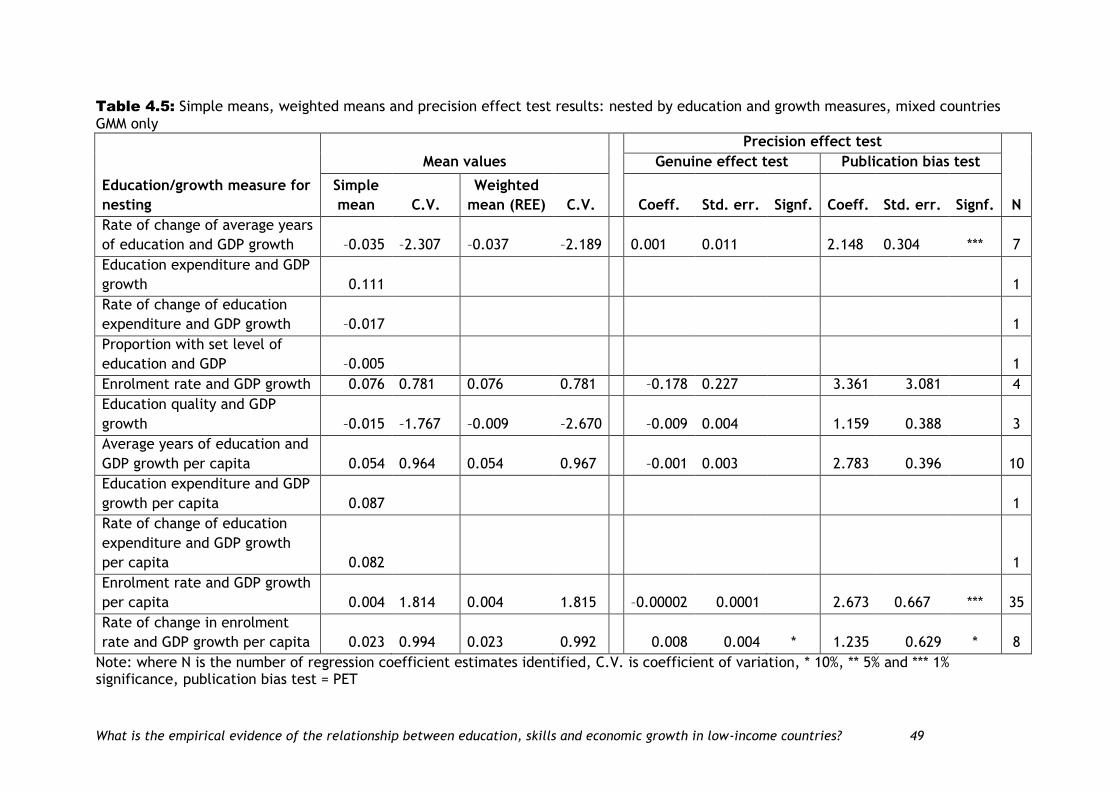
What is the empirical evidence of the relationship between education, skills and economic growth in low-income countries? 49
Table 4.5: Simple means, weighted means and precision effect test results: nested by education and growth measures, mixed countries
GMM only
Education/growth measure for
nesting
Mean values
Precision effect test
Genuine effect test Publication bias test
Simple
mean C.V.
Weighted
mean (REE) C.V. Coeff. Std. err. Signf. Coeff. Std. err. Signf. N
Rate of change of average years
of education and GDP growth –0.035 –2.307 –0.037 –2.189 0.001 0.011 2.148 0.304 *** 7
Education expenditure and GDP
growth 0.111 1
Rate of change of education
expenditure and GDP growth –0.017 1
Proportion with set level of
education and GDP –0.005 1
Enrolment rate and GDP growth 0.076 0.781 0.076 0.781 –0.178 0.227 3.361 3.081 4
Education quality and GDP
growth –0.015 –1.767 –0.009 –2.670 –0.009 0.004 1.159 0.388 3
Average years of education and
GDP growth per capita 0.054 0.964 0.054 0.967 –0.001 0.003 2.783 0.396 10
Education expenditure and GDP
growth per capita 0.087 1
Rate of change of education
expenditure and GDP growth
per capita 0.082 1
Enrolment rate and GDP growth
per capita 0.004 1.814 0.004 1.815 –0.00002 0.0001 2.673 0.667 *** 35
Rate of change in enrolment
rate and GDP growth per capita 0.023 0.994 0.023 0.992 0.008 0.004 * 1.235 0.629 * 8
Note: where N is the number of regression coefficient estimates identified, C.V. is coefficient of variation, * 10%, ** 5% and *** 1% significance, publication bias test = PET

What is the empirical evidence of the relationship between education, skills and economic growth in low-income countries? 50
Table 4.6: Precision effect test (PET) for partial correlation coefficient, r
Clustering by study Without clustering
Precision 0.109 0.109
(1.84) (3.88)**
Constant 1.166 1.166
(2.14)* (3.47)**
Observations 374 374
r-squared 0.04 0.04
Robust t statistics in parentheses
t statistics in parentheses
* significant at 5%; ** significant at 1%. Dependent variable t-statistic for the partial r.
Table 4.7: Meta-regression results for regression coefficient, r, and partial r
Regression coefficient
Partial r
Low-income country 0.042 1.231
(1.29) (2.84)**
Education measure: reference category ‘Rate of change of average years of education’
Average years of education –0.093 0.510
(1.79) (0.70)
Education expenditure 0.230 0.095
(3.99)** (0.12)
Rate of change of education expenditure 0.135 0.259
(2.76)** (0.37)
Proportion of population with a set level of education
–0.006 7.448
(0.07) (6.97)**
Enrolment rates –0.059 1.264
(1.26) (1.90)
Rate of change of enrolment rates 0.098 1.054
(1.53) (1.17)
Skills 0.187 2.395
(2.42)* (2.31)*
Education quality 0.026 1.105
(0.35) (1.02)
Growth measures: reference category TFP

What is the empirical evidence of the relationship between education, skills and economic growth in low-income countries? 51
GDP growth –0.103 0.752
(1.68) (0.85)
GDP growth per capita 0.032 0.015
(0.56) (0.02)
Estimation approach: reference category OLS
IV –0.040 1.243
(1.27) (2.81)**
Fixed Effect 0.044 0.123
(1.17) (0.24)
GMM –0.070 –1.293
(2.55)* (3.28)**
Other –0.103 0.474
(2.62)** (0.85)
Data type: reference category cross-ectional data
Time series 0.114 –0.271
(0.96) (0.21)
Panel data –0.080 0.424
(2.54)* (1.00)
Constant 0.315 –1.177
(3.62)** (0.95)
Absolute value of z statistics in parentheses: * significant at 5%; ** significant at 1%.
The second set of results shows the effect of the type of education measure on the size of the effect of education on economic growth. It can be seen that only the skills measure is significant across both regressions suggesting that skills development is the only measure that has an effect on economic growth that is not affected by within-study dependence and the units of measurement of this skills measure. Overall this set of results suggests that education and skills investments have a positive effect on economic growth regardless of education measure. The third set of results show the effect of the type of growth measure, which is not found to be significantly important.
The fourth set of results shows the effects of the estimation approach used. Only IV and GMM estimation approaches are found to have an effect relative to the OLS studies that is resistant to controls for within-study dependence and scale of measurements. Interestingly studies using IV approaches are found to indicate a significantly larger effect than OLS while GMM studies are found to give significantly smaller estimates. GMM is the only estimation strategy whose significance is resistant to the scale of measurements used. The final set of results considers the types of data used, and these are not found to be significantly different to cross-sectional studies when controlling for both within-study dependence and scale of measurements.

What is the empirical evidence of the relationship between education, skills and economic growth in low-income countries? 52
Overall the results of this section on WLS estimation suggest that education has a genuine positive effect on economic growth for LICs. The results are robust for LIC-only studies and the restriction to studies that use only GMM estimation approaches to correct for endogeneity. There is also clear evidence of publication bias. Finally this positive effect is also maintained when controlling for within-study dependence and the magnitude of the education and growth measure used.

What is the empirical evidence of the relationship between education, skills and economic growth in low-income countries? 53
5. Strengths and limitations
The potential returns to investing in education and skills in terms of enhanced economic growth are widely accepted by academics, policy-makers and practitioners who work in the field of international development. The foundation of many of the Millennium Development Goals is based on this widely accepted idea with many of the goals focused on human capital development, especially of women. This belief has produced a large body of research, although not necessarily focused on LICs, examining the effect of education and skills on economic growth. However, the more limited subset of studies using data on LICs is very heterogeneous in terms of methodology, measurement of education and country groupings. This heterogeneity in studies together with an ever-expanding volume of work makes it difficult to derive reliable and verifiable estimates of the effect of human capital on economic growth for LICs.
This systematic review aims to contribute to evidence-based policy-making that considers the appropriate policy intervention to most effectively improve the human capital stock in LICs and to academic research on the education/skills–growth relationship by (i) providing a meta-synthesis of the empirical evidence on the human capital–growth relationship, (ii) identifying potential avenues for further research, and (iii) pointing to policy implications of the synthesised evidence. In doing this, it pays special attention to the synthesis of the empirical evidence on the human capital–growth relationship in the context of LICs. It also provides findings on the human capital–growth relationship in a wider context, including low-income and other countries pooled together.
The original studies reviewed here draw on different observational measurements of education and skills, use different estimation methods, and cover different country groups and different time periods. This heterogeneity poses a serious challenge for systematic reviews. We addressed this challenge by: (i) calculating REEs that take account of within- and between-study heterogeneity at different levels of nesting/aggregation and (ii) conducting PETs to verify if the REEs can be taken as genuine (statistically significant) effects. This systematic review provides verifiable evidence on the growth impacts of human capital in LICs and in wider sets of countries that include but are not limited to the latter. As such, it is the first systematic review that synthesises empirical evidence on economic return to investing in human capital in LICs.
The evidence synthesised in this review indicates that education and skills, as a state variable reflecting small positive and statistically significant effects on economic growth in both LICs and other countries. This conclusion is based on a comprehensive set of empirical studies that have been identified from a systematic search of the literature as set out in the protocol. It is also derived through a coherent methodology that is known to be efficient in detecting genuine effects which has helped to identify a strong publication bias likely to exist in this area. Therefore, we believe that the findings of this review are relevant for evidence-based policy-making by national governments, international organisations and international donors of aid. This systematic review can also support evidence-based policy with respect to activities informed by the Millennium Development Goals which focus on educational and skills development. The evidence presented in this review indicates that there is an economic case for investing in human capital in LICs.
Nevertheless, no systematic review using meta-analysis is better than the body of empirical research on which it is based. In the past 20 years the increased quality

What is the empirical evidence of the relationship between education, skills and economic growth in low-income countries? 54
of the data sources available in terms of measuring the key variables considered here as well as the increase in computer power has led to an increase in the volume of empirical work in this field as well as an improvement in the quality of this work. The improvement in quality is evident with respect to: (i) estimation methodology that controls for endogeneity (or reverse causality) between human capital and growth with many of the recent papers focusing on the use of panel data and GMM estimation methods and (ii) the measurement of education and skills to include test scores and measures of education quality which have previously been unavailable on large-scale cross-country datasets.
Against these strengths, however, the existing literature poses some serious challenges for systematic reviews and reflects some idiosyncrasies that make evidence synthesis difficult. The major challenge for systematic reviews of empirical evidence stems from the observational nature of the research and the risk of sample dependence between studies or between different samples used in the same study. In addition, researchers in the area of the human capital–growth relationship, like other scholars working with observational data, are aware that a lot of data mining takes place in the research process. Therefore, samples used in empirical studies may not be independent or random.
Given this state of affairs, we are faced with two options: ruling out systematic reviews of observational studies or striking a balance between precision and relevance. In this review, we exercised the second option and tried to balance precision with relevance of the synthesis. This is done by nesting studies within different nests and at different levels of aggregation. This approach does not resolve the issue of sample dependence, but it can minimise its adverse consequences by changing the composition of the study sets being analysed.
Following this method, we have established that the sign of the estimates for education and skills’ effect on growth tended to remain positive although small despite different levels of nesting and the changes in study composition this entails. This finding suggests that the weighted means (REEs) obtained from different nests can be taken as reliable indicators of the direction of human capital’s effect on growth.
However, the REEs are not necessarily precise indicators. REEs are efficient in controlling for heterogeneity as a source of imprecision, and as such they help in minimising the risk of imprecision. However, REEs are not efficient in controlling for within- and between-study dependence. This is especially the case if between-study variation (heterogeneity) is low and this is due to between-study dependence. However, if between-study variation is low for other reasons (e.g. similarity in estimation methods or model specification), the REEs remain efficient.
Given the underlying uncertainty about the true cause of between-study variation/dependence, the REEs can be considered only as weakly efficient in ensuring precision. Therefore, the findings of this systematic review should be qualified as follows: the findings can be relied upon to conclude that human capital investment has a positive impact on growth, but the magnitude of this impact may not be necessarily precise.
The second limitation that must be indicated relates to measurement and instrumentation issues associated with various proxies used in the field for education and skills. Often the measurements used for education and skills in these studies are based on the availability of data rather than the appropriateness for policy formulation. This is shown by the fact that the enrolment rates and the average years of education are the most frequently used measures of human

What is the empirical evidence of the relationship between education, skills and economic growth in low-income countries? 55
capital in the empirical studies identified but these measures are clearly relatively useless in designing policy to improve human capital in LICs.
The existing literature reviewed in section 1 (Background) indicates the wide range of measures of education and skills likely to be present in the literature. This large number of potential measures has led to the need for a large number of nests largely due to the nine groups of education measures identified. These nine groups are also quite wide in themselves which was necessary to ensure sufficient sample sizes within each nest for analysis.
Finally, the survey-based nature of the education/skills data requires instrumentation and the choice of instruments must satisfy two conditions to ensure that the estimates in the original studies are fully comparable. First, the instrument must be correlated with the education/skills measure, but uncorrelated with the error term of the regressions. Second, it must be the same or comparable across studies.
The instrumentation techniques used in the empirical studies satisfy the first condition, i.e. they are used in the regression only after testing for that condition. However, they satisfy the second condition only partially. Instruments used in GMM estimations are fairly comparable as they consist of the lagged value of the dependent variable, i.e. growth. Instruments used in other methods of estimation may not be comparable across studies. Therefore we have chosen to focus on the GMM results although this has come at the cost of small sizes within each nest – hence the limited significant results found when focusing on the GMM results only.
The remaining risk with respect to instrumentation stems from the small number of OLS estimation results that are not based on instruments. This review does not exclude the OLS estimation results and as such its findings may be influenced by relatively higher estimate magnitudes reported by such studies. However, this small risk of upward bias is mitigated in two ways. First, the inclusion of OLS estimates increases between-study variation and as such is conducive to lower REEs when OLS studies are pooled together with other studies. Second, the absence of estimates for indirect effects of human capital in the large majority of studies implies that the direct-effect estimates in the original studies are actually biased downwards. This downward bias is significant enough to mitigate the upward bias introduced by OLS estimates.

What is the empirical evidence of the relationship between education, skills and economic growth in low-income countries? 56
6. Conclusions and implications
6.1 Synthesis results
The meta-analysis synthesis results from the empirical literature can be listed as follows: (i) education and skills have a positive but small impact on economic growth in LICs; (ii) the relationship between human capital and growth is not uniform between countries and across measurements of education and skills; and (iii) this is a genuine effect but also suffers from a publication bias effect.
Our meta-analysis of education and skills’ impact on growth controls for a wide range of education and growth measures as well as for country type (low-income and mixed) and estimation method (GMM-IV). This nested approach enables us not only to address the systematic review question (which focuses on LICs), but also to provide a wider empirical setting within which the impact of education and skills on growth in LICs can be evaluated.
The meta-analysis consisted of first calculating REEs of the weighted mean effect of education and skills on per-capita GDP growth rates and GDP growth rates. We calculated the weighted mean by nesting the original estimates within education and growth groupings and then different country groupings and different methods of estimation used in the original studies. Then, we estimated a WLS model to test if the original estimates and their weighted averages represent a genuine effect or whether they are due to publication bias. Here again we nested the estimation within education and group groupings, country groups and estimation methods. Overall, the PET results suggest that a handful of the original estimates and their weighted averages can be considered as measures of genuine effect.
The PET results indicate some evidence that education and skills have on average a positive and genuine effect on growth in LICs, across a range of education and growth measures. However, the magnitude of this impact of education and skills on economic growth varies greatly depending on the measures of education and skills and economic growth used and whether these measures represented a level or a rate of change.
6.2 Conclusions and implications
The main conclusions concerning policy implications and future research can be summarised as follows.
The evidence we synthesise in this review indicates that human capital investment has a small positive and statistically significant effects on growth in LICs. Therefore, there is a prima facie case for policy interventions aimed at increasing the level of the human capital stock in both low-income and mixed countries. However, the findings also indicate that the small effects found are likely to be subject to the use of proxies for the level of human capital and more appropriate measures of education and skills may lead to the discovery of larger effects as suggested in the economic theory.
Two measures of education have sufficient observations throughout this study: average years of education and enrolment rates. The second policy conclusion could be therefore that the Millennium Development Goal of free primary education for all children is well focused, if we believe these are accurate measures of the outcome of education and skills investment, as education and skills development are associated with economic development in LICs. The lack of observations on skills development means that it is difficult to find support for a policy focused on skills development. It is clear however that the current measures

What is the empirical evidence of the relationship between education, skills and economic growth in low-income countries? 57
of education and skills are not really measures of learning, rather measures of the scale of education provision within the LIC.
We derive two main conclusions about the implications of this review for future research. First, education and skills measures in this field are at best proxies for human capital investment and are often chosen based on the availability of data rather than for designing policy. In order to be able to design effective policies in this arena the measures of education and skills need to be reconsidered by academics, policy-makers and data collection agencies. An investment in a scheme of work to consider the measures of education and skills would enable the results of future empirical analysis to be of greater use to policy-makers in this field.
Our second conclusion concerns the need for greater attention to the indirect effects of human capital on growth by including interaction terms in the regressions. Very few of the studies identified included interaction terms, making it impossible to test the route by which an investment in education and skills has an effect on economic growth in LICs. This is important as for effective policy-making in this field policies need to be designed to enhance the human capital stock and to make use of it in the economy. Many graduates in LICs often take employment in non-graduate jobs due to limits in their ability to be able to exploit the fruits of their studies. By including these interaction terms in the regression analysis it would be possible to identify other policy instruments that could make use of the enhanced human capital in the economy, i.e. to ensure the return on the investment made.
Overall this systematic review finds evidence of a positive effect of human capital investment on economic growth in LICs. Therefore investments by national and trans-national organisations are likely to be rewarded by enhanced economic development in LICs.
What is the empirical evidence of the relationship between education, skills and economic growth in low-income countries? 58
7. References
7.1 Studies included in review
Appiah EN, McMahon WW (2002) The social outcomes of education and feedbacks on growth in Africa. Journal of Development Studies 38(4): 27–68.
Baldacci E, Clements B, Gupta S, Cui Q (2008) Social spending, human capital, and growth in developing countries. World Development 36(8): 1317–1341.
Barro RJ (1991) Economic growth in a cross section of countries. Quarterly Journal of Economics 106(2): 407–443.
Barro RJ, Sala-i-Martin X (2004) Economic growth, second edition. Cambridge, Massachusetts: MIT.
Bloom DE, Sachs JD, Collier P, Udry C (1998) Geography, demography, and economic growth in Africa. Brookings Papers on Economic Activity 1998(2): 207–295.
Bolt J, Bezemer D (2009) Understanding long-run African growth: colonial institutions or colonial education? Journal of Development Studies 45(1): 24–54.
Bose N, Haque ME, Osborn DR (2007) Public expenditure and economic growth: a disaggregated analysis for developing countries. Manchester School 75(5): 533–556.
Bosworth BP, Collins SM (2003) The empirics of growth: an update. Brookings Papers on Economic Activity 2003(2): 113–179.
Brist LE, Caplan AJ (1999) More evidence on the role of secondary education in the development of lower-income countries: wishful thinking or useful knowledge? Economic Development and Cultural Change 48(1): 155–176.
Chen PP, Gupta R (2009) An investigation of openness and economic growth using panel estimation. Indian Journal of Economics. LXXXIX(355): 483–506.
Collins SM, Bosworth BP, Rodrih D (1996) Economic growth in East Asia: accumulation versus assimilation. Brookings Papers on Economic Activity (2): 135–203.
Dessus S (2001) Human capital and growth: the recovered role of education systems. Washington DC: World Bank, Middle East and North Africa Region, Social and Economic Development Group and Social Development Group.
Durlauf SN, Johnson PA (1995) Multiple regimes and cross-country growth behaviour. Journal of Applied Econometrics 10(4): 365–384.
Engelbrecht HJ (2002) Human capital and international knowledge spillovers in TFP growth of a sample of developing countries: an exploration of alternative approaches. Applied Economics 34(7): 831–841.
Gyimah-Brempong K, Paddison O, Mitiku W (2006) Higher education and economic growth in Africa. Journal of Development Studies 42(3): 509–529.
Hanushek EA, Woessmann L (2008) The role of cognitive skills in economic development. Journal of Economic Literature XLVI(3): 607–668.
Islam N (1995) Growth empirics: a panel data approach. Quarterly Journal of Economics 110(4): 1127–1170.
Keller KRI (2006) Education expansion, expenditures per student and the effects on growth in Asia. Global Economic Review 35(1): 21–42.

What is the empirical evidence of the relationship between education, skills and economic growth in low-income countries? 59
Knowles S, Lorgelly PK, Owen PD (2002) Are educational gender gaps a brake on economic development? Some cross-country empirical evidence. Oxford Economic Papers 54(1): 118–149.
Landau D (1983) Government expenditure and economic growth: a cross-country study. Southern Economic Journal 49(3): 783–792.
Lee K, Kim BY (2009) Both institutions and policies matter but differently for different income groups of countries: determinants of long-run economic growth revisited. World Development 37(3): 533–549.
Levine R, Renelt D (1992) A sensitivity analysis of cross-country growth regressions. American Economic Review 82(4): 942–963.
Mankiw NG, Romer D, Weil DN (1992) A contribution to the empirics of economic growth. Quarterly Journal of Economics 107(2): 407–437.
Musila JW, Belassi W (2004) The impact of education expenditures on economic growth in Uganda: evidence from time series data. Journal of Developing Areas 38(1): 123–133.
Nketiah-Amponsah E (2009) Public spending and economic growth: evidence from Ghana (1970–2004). Development Southern Africa 26(3): 477–497.
Odit MP, Dookhan K, Fauzel S (2010) The impact of education on economic growth: the case of Mauritius. International Business and Economics Research Journal 9(8): 141–152.
Okpala AO (2007) Knowledge infrastructure, service sector, and economic growth in Africa. International Business and Economics Research Journal 6(7): 81–88.
Sandar KK, Macdonald R (2009) Capital flows and growth in developing countries: a dynamic panel data analysis. Oxford Development Studies 37(2): 101–122.
Seetanah B (2009) The economic importance of education: evidence from Africa using dynamic panel data analysis. Journal of Applied Economics XII(1): 137–157.
Siddiqui A (2006) Macroeconomic returns to education in South Asia. Journal of Economic Cooperation among Islamic Countries 27(4): 25–44.
Temple J (1999) A positive effect of human capital on growth. Economics Letters 65(1): 131–134.
Tsai CL, Hung MC, Harriott K (2010) Human capital composition and economic growth. Social Indicators Research 99(1): 41–59.
7.2 Other references used in the text of review
Abreu M, de Groot HLF, Florax RJGM (2005) A meta-analysis of beta convergence. Tinbergen Institute Discussion Papers, No. TI 2005-001/3.
Aghion P (2009) Growth and education. Commission on Growth and Development, USA, Working Paper No. 56.
Aghion P, Howitt P (1998) Endogenous growth theory. Cambridge, Massachusetts: MIT Press.
Arellano, M. and S. Bond (1991): Some Tests of Specifcation for Panel Data: Monte Carlo Evidence and an Application to Employment Equations," Review of Economic Studies, 58, 277-297.

What is the empirical evidence of the relationship between education, skills and economic growth in low-income countries? 60
Bateman IJ, Jones AP (2003) Contrasting conventional with multi-level modelling approaches to meta-analysis: expectation consistency in U.K. woodland recreation values. Land Economics 79(2): 235–58.
Bennell P (1996) Rates of return to education: does the conventional pattern prevail in sub-Saharan Africa? World Development 24(1): 183–199.
Bijmolt THA, Pieters RGM (2001) Meta-analysis in marketing when studies contain multiple measurements. Marketing Letters 12(2): 157–169.
Bils M, Klenow PJ (2000) Does schooling cause growth? American Economic Review 90(5): 1160–1183.
Bils M, Klenow P (2001) The acceleration in variety growth. American Economic Review 91(2): 274–280.
Brook–Utne B (2002) Education and development: a developing theme. International Review of Education 48(1/2): 45–65.
Cooper, H. M., & Hedges, L. V. (Eds.). (1994). The handbook of research synthesis. New York: Russell Sage Foundation.
CRD – Centre for Reviews and Dissemination (2009) Systematic reviews: CRD’s guide for undertaking reviews in health care. York, UK: York Publishing Services.
Dalhuisen J, Florax RJGM, de Groot HLF, Nijkamp P (2003) Price and income elasticities of residential water demand: a meta-analysis. Land Economics 79: 292–308.
de Dominicis L, Florax RJGM, de Groot HLF (2008) A meta-analysis on the relationship between income inequality and economic growth. Scottish Journal of Political Economy 55(5): 654–682.
Doucouliagos C, Laroche P (2003) What do unions do to productivity: a meta-analysis. Industrial Relations 42: 650–691.
Doucouliagos H, Paldam M (2009) A meta-analysis of development aid allocation: the effects of income level and population size. http://mit.econ.au.dk/vip_htm/MPaldam/Papers/Size-to-aid.pdf
Egger M, Smith GD, Schnieder M, Minder C (1997) Bias in meta-analysis detected by a simple, graphical test. British Medical Journal 315: 629–634.
Engelbrecht HJ, (2003) Human capital and economic growth: cross-sectional evidence for OECD countries. Economic Record 79(Special Issue): S40–S51.
Florax RJGM (2002) Methodological pitfalls in meta-analysis: publication bias. In: Florax R, Nijkamp P, Willis K (eds), Comparative environmental economic assessment. Cheltenham, UK: Edward Elgar.
Gerschenkron A (1962) Economic backwardness in historical perspective. New York:
Glewwe P (2002) Schools and skills in developing countries: education policies and socioeconomic outcomes. Journal of Economic Literature 40(2): 436–482.
Griliches Z (1997) Education, human capital, and growth: a personal perspective. Journal of Labor Economics 15(1) Part 2: Essays in honor of Yoram Ben-Porath S330–S344.
Guisan MC, Aguayo E, Exposito P (2001) Economic growth and cycles: cross-country models of education, industry and fertility and international comparisons. Applied Econometrics and International Development 1(1): 9–38.

What is the empirical evidence of the relationship between education, skills and economic growth in low-income countries? 61
Gyimah-Brempong, K. and Traynon, T. 1999. Political instability investment, and economic growth in Africa. Journal of African Economics, 8(1): 52–86
Hanushek EA, Kimko DD (2000) Schooling, labor-force quality, and the growth of nations. American Economic Review 90(5): 1184–1208.
Hanushek EA, Woessmann L (2007) The role of education quality in economic growth. World Bank Policy Research Working Paper No. 4122, February 2007.
Havranek T, Irsova Z (2009) Which foreigners are worth wooing? A meta-analysis of vertical spillovers from FDI. www.hendrix.edu/maer-network/default.aspx?id=15206
Hedges LV (1992) Modelling publication selection effects in meta-analysis. Statistical Science 7: 246–255.
JBI - Joanna Briggs Institute (2008) Reviewers’ manual. Adelaide, Australia: The Joanna Briggs Institute.
Klasen S, (2002) Low schooling for girls, slower growth for all? Cross-country evidence on the effect of gender inequality in education on economic development. World Bank Economic Review 16(3): 345–373.
Krueger AB, Lindahl M (2001) Education for growth: why and for whom?’ Journal of Economic Literature 39(4): 1101–1136.
Lucas, Robert E. (1988): “On the Mechanics of Economic Development,” Journal of Monetary Economics, 22, 3–42.
Jacob Mincer and Solomon Polachek (1974) "Family Investments in Human Capital," Journal of Political Economy 82:S76-108.
Macaskill P, Walter SD, Irwig L. A comparison of methods to detect publication bias in meta-analysis. Statistics in Medicine 2001; 20: 641-654.
Mitchell NJ, Gluch T, Bohara AK (2005) A meta-analysis of economic development and human rights performance. Paper presented at the Annual Meeting of the International Studies Association, Honolulu, Hawaii. www.allacademic.com/meta/p70199_index.html
Neira I, Guisan MC (2001) Educación y crecimiento: una perspectiva mundial 1960–99. Estudios Económicos de Desarrollo Internacional 1(1): 9–35.
Nelson R, Phelps E (1966) Investment in humans, technological diffusion, and economic growth. American Economic Review, Papers and Proceedings 51: 69–75.
Oketch MO (2006) Determinants of human capital formation and economic growth of African countries. Economics of Education Review 25(5): 554–564.
Patrinos HA, Psacharopoulos G (2002) Returns to investment in education: a further update. World Bank Policy Research Working Paper Series
Pritchett L (2001) Where has all the education gone?’ World Bank Review 15(3): 367–391.
Ranis G, Stewart F, Ramirez A (2000) Economic growth and human development. World Development 28(2): 197–219.
Renelt, D (1991), “Economic growth: A review of the theoretical and empirical literature”, World Bank Policy Research Working Paper, no. 678 [Washington, D.C.: World Bank].
Romer P (1990) Endogenous technological change. Journal of Political Economy 98(5): S71–S102.

What is the empirical evidence of the relationship between education, skills and economic growth in low-income countries? 62
Rosenthal R (1991) Meta-analytic procedures for social research, revised edition. Newbury, UK:
Rutter CM, Gatsonis CA (2001) A hierarchical regression approach to meta-analysis of diagnostic test accuracy evaluations. Statistics in Medicine 20: 2865–2884.
Sachs, Jeffrey D., and Andrew M. Warner (1997a), Natural resource abundance and economic growth. Center for International Development and Harvard Institute for International Development, November.
Solow RM (1956) Contribution to the theory of economic growth. Quarterly Journal of Economics 70(1): 65–94.
Stanley TD (2005) Beyond publication bias. Journal of Economic Surveys 19: 309–345.
Stanley TD (2008) Meta-regression methods for detecting and estimating empirical effects in the presence of publication selection. Oxford Bulletin of Economics and Statistics 70(2): 103–127.
Stanley T, Doucouliagos H (2007) Identifying and correcting publication selection bias in the efficiency-wage literature: Heckman meta-regression. Deakin University, Working Papers 2007–11.
Stanley T, Jarell SB (1989) Meta-regression analysis: a quantitative method of literature surveys. Journal of Economic Surveys 3: 161–170.
Stanley TD, Jarrell SB, Doucouliagos H (2009) Could it be better to discard 90% of the data? A statistical paradox. Deakin University, Economics Working Papers No. SWP 2009/13.
Temple J (1999) The new growth evidence. Journal of Economic Literature 37(1): 112–156.
Temple J (2001) Growth effects of education and social capital in the OECD countries. OECD Economic Studies 33: 58–101.
UN (2000) Millennium Development Goals. www.un.org/millenniumgoals/ (accessed 29 March 2010).
Vinod HD, Kaushik SK (2007) Human capital and economic growth: evidence from developing countries. American Economist 51(1): 29–41.

What is the empirical evidence of the relationship between education, skills and economic growth in low-income countries? 63
Appendices
Appendix 1.1: Authorship of this report
Authors Denise Hawkes, International Business and Economics, University of Greenwich Mehmet Ugur, International Business and Economics, University of Greenwich Review group membership Denise Hawkes - University of Greenwich (principal investigator) Mehmet Ugur - University of Greenwich (co-investigator) Research assistants Cyril Anyanwu, Nawar Hashem, Sefa Awaworyi, University of Greenwich Advisory group The Evidence for Policy and Practice Information and Co-ordinating Centre (EPPI-Centre), Institute of Education, University of London. Contact details
Dr Denise Hawkes,
Business School, University of Greenwich,
Old Royal Naval College, Park Row, London SE10 9LS
Tel: 020 8331 9877
Email: [email protected] Conflict of interest None. Acknowledgements We would like to thank the Department for International Development (DFID) for financial support and the EPPI-Centre for methodological advice and technical support. We would also like to thank the reviewers of the Protocol and the Review Report for their valuable and helpful comments. Finally, we would like to thank our research assistants, who have worked diligently and complied with quality assurance requirements in a professional manner. We have spared no effort to ensure that this Report is free of errors or omissions, but we take full responsibility for any that may have escaped our attention.

Appendix
What is the empirical evidence of the relationship between education, skills and economic growth in low-income countries? 64
Appendix 2.1: List of databases used for search
(i) Databases for published studies
We searched for journal articles, books and book chapters in the following
databases:
1. EBSCO: International Bibliography of the Social Sciences (IBSS) – economics,
politics, sociology, anthropology
www.csa.com/htbin/dbrng.cgi?username=greenwichuni&access=welcome
2. EBSCO: business and economics databases
http://search.ebscohost.com/Community.aspx?authtype=ip&ugt=723731563C86354
73786350632853E8223E365D36013609369E328E336133503&return=y&IsMobile=N
3. ScienceDirect: all sciences and humanities
www.sciencedirect.com/science?_ob=HomePageURL&_method=userHomePage&_bt
n=Y&_acct=C000027518&_version=1&_urlVersion=0&_userid=634187&md5=0afa2901
3cc300e420d26fa98ae36c3c
4. Web of Knowledge: all sciences and humanities
http://apps.isiknowledge.com/UA_GeneralSearch_input.do?product=UA&search_m
ode=GeneralSearch&SID=T2e6Bncg9ABckBdGfdc&preferencesSaved=
5. JSTOR: social sciences
www.jstor.org/action/showBasicSearch
6. EconLit
Available on ScienceDirect.
7. ISI – Web of Knowledge
http://apps.isiknowledge.com/UA_GeneralSearch_input.do?product=UA&search_m
ode=GeneralSearch&SID=R1Be7P8B6KIJ2O@OONg&preferencesSaved=
(ii) Databases for working papers, reports, etc.
For scholarly working papers, reports, and forthcoming papers, we searched in
the following databases:
8. Social Science Research Network (SSRN)
http://papers.ssrn.com/sol3/DisplayAbstractSearch.cfm
9. NBER (National Bureau of Economic Research) Working Papers
www.nber.org/papers
10. Research Papers in Economics (REPEC)
http://econpapers.repec.org/scripts/search/search.asp?pg=-1

Appendix
What is the empirical evidence of the relationship between education, skills and economic growth in low-income countries? 65
11. Centre for International Development, Harvard University
www.hks.harvard.edu/centers/cid/publications
12. World Bank: working papers, reports
http://publications.worldbank.org/ecommerce/
13. IMF (International Monetary Fund): working papers, reports
www.imf.org/external/pubind.htm
14. UNDP (United Nations Development Programme): research papers, reports
www.twnside.org.sg/pos.htm
15. UNESCO (United Nations Educational, Scientific and Cultural Organization):
research papers, reports
http://cms01.unesco.org/en/literacy/resources/papers-and-reports/
16. ILO (International Labour Organization): working papers, reports
www.ilo.org/public/english/dialogue/sector/papers/index.htm
(iii) Databases for theses
For PhD theses, we searched in the following databases:
17 EconLit: contains indexes of PhD thesis submitted worldwide
Available on ScienceDirect.
18. Index to These: contains all theses submitted in universities in UK and
Ireland.
http://www.theses.com/
(iv) Google Scholar search
19. Google Scholar
http://scholar.google.co.uk/
In addition to the databases listed above, we searched in Google Scholar, using the
same search criteria.

Appendix
What is the empirical evidence of the relationship between education, skills and economic growth in low-income countries? 66
Appendix 2.2: Keywords and synonyms used in searches
Keyword 1: education Synonyms: schooling, training, qualifications, skills, human capital (For ‘title’ ‘abstract’ and ‘keyword’ search)
Keyword 2: growth Synonyms: development, economic performance, investment, labour productivity, capital, innovation, labour market participation (For ‘title’ ‘abstract’ and ‘keyword’ search)
Keyword 3: Low-income countries Synonyms: less developed countries, LDC, developing countries, Africa, Asia, Latin America, Middle East. The World Bank list of low-income countries was searched country by country (For ‘keyword’ and text’ search)

Appendix
What is the empirical evidence of the relationship between education, skills and economic growth in low-income countries? 67
Appendix 2.3: Documentation of search results
The search results for each database and the combined search results were documented through the search report generated by the database. A sample is given below.
Database/platform Date String Hits
EBSCO –
business/economic
s databases
30
August
2010
(TX Low-income countries OR Less developed
countries OR LDC OR developing countries OR
Africa OR Asia OR Latin America OR Middle East OR
Afghanistan OR Bangladesh OR Benin OR Burkina
Faso OR Burundi OR Cambodia OR Central African
Republic OR Chad OR Comoros OR Congo OR Eritrea
OR Gambia OR Ghana OR Guinea OR Guinea Bisau
OR Haiti OR Kenya OR Korea OR Kyrgyz Republic OR
Lao OR Liberia OR Madagascar OR Mali OR
Mauritania OR Mozambique OR Myanmar OR Nepal
OR Niger OR Rwanda OR Senegal OR Sierra Leone
OR Somalia OR Tajikistan OR Tanzania OR Togo OR
Uganda OR Uzbekistan OR Vietnam OR Yemen OR
Zambia OR Zimbabwe OR KW Low-income countries
OR Less developed countries OR LDC OR developing
countries OR Africa OR Asia OR Latin America OR
Middle East OR Afghanistan OR Bangladesh OR
Benin OR Burkina Faso OR Burundi OR Cambodia OR
Central African Republic OR Chad OR Comoros OR
Congo OR Eritrea OR Gambia OR Ghana OR Guinea
OR Guinea Bisau OR Haiti OR Kenya OR Korea OR
Kyrgyz Republic OR Lao OR Liberia OR Madagascar
OR Mali OR Mauritania OR Mozambique OR Myanmar
OR Nepal OR Niger OR Rwanda OR Senegal OR
Sierra Leone OR Somalia OR Tajikistan OR Tanzania
OR Togo OR Uganda OR Uzbekistan OR Vietnam OR
Yemen OR Zambia OR Zimbabwe) and (S2 and S3
and S4) Published Date from: 19800101-20100831;
Document Type: Article, Book Entry, Report,
Working Paper; Publication Type: Academic
Journal, Periodical, Book, Country Report
3506
ScienceDirect 2
Septem
ber
2010
(pub-date > 1979 and pub-date < 2011 and TITLE-
ABSTR-KEY(Growth OR development OR economic
performance OR investment OR labour productivity
OR capital OR innovation OR labour market
participation ) and TITLE-ABSTR-KEY(Education OR
Schooling OR Training OR Qualifications OR Skills
OR Human capital )) AND (pub-date > 1979 and
pub-date < 2011 and KEYWORDS(Low-income
countries OR Less developed countries OR LDC OR
developing countries OR Africa OR Asia OR Latin
America OR Middle East OR World Bank list of low-
income countries OR Afghanistan OR Bangladesh OR
Benin OR Burkina Faso OR Burundi OR Cambodia OR
Central African Republic OR Chad OR Comoros OR
97

Appendix
What is the empirical evidence of the relationship between education, skills and economic growth in low-income countries? 68
Congo OR Eritrea OR Gambia OR Ghana OR Guinea
OR Guinea Bisau OR Haiti OR Kenya OR Korea OR
Kyrgyz Republic OR Lao OR Liberia OR Madagascar
OR Mali OR Mauritania OR Mozambique OR Myanmar
OR Nepal OR Niger OR Rwanda OR Senegal OR
Sierra Leone OR Somalia OR Tajikistan OR Tanzania
OR Togo OR Uganda OR Uzbekistan OR Vietnam OR
Yemen OR Zambia OR Zimbabwe) or FULL-
TEXT(Low-income countries OR Less developed
countries OR LDC OR developing countries OR
Africa OR Asia OR Latin America OR Middle East OR
World Bank list of low-income countries OR
Afghanistan OR Bangladesh OR Benin OR Burkina
Faso OR Burundi OR Cambodia OR Central African
Republic OR Chad OR Comoros OR Congo OR Eritrea
OR Gambia OR Ghana OR Guinea OR Guinea Bisau
OR Haiti OR Kenya OR Korea OR Kyrgyz Republic OR
Lao OR Liberia OR Madagascar OR Mali OR
Mauritania OR Mozambique OR Myanmar OR Nepal
OR Niger OR Rwanda OR Senegal OR Sierra Leone
OR Somalia OR Tajikistan OR Tanzania OR Togo OR
Uganda OR Uzbekistan OR Vietnam OR Yemen OR
Zambia OR Zimbabwe))
JSTOR 2
Septem
ber
2011
((((Low-income countries OR Less developed
countries OR LDC OR developing countries OR
Africa OR Asia OR Latin America OR Middle East OR
Afghanistan OR Bangladesh OR Benin OR Burkina
Faso OR Burundi OR Cambodia OR Central African
Republic OR Chad OR Comoros OR Congo OR Eritrea
OR Gambia OR Ghana OR Guinea OR Guinea Bisau
OR Haiti OR Kenya OR Korea OR Kyrgyz Republic OR
Lao OR Liberia OR Madagascar OR Mali OR
Mauritania OR Mozambique OR Myanmar OR Nepal
OR Niger OR Rwanda OR Senegal OR Sierra Leone
OR Somalia OR Tajikistan OR Tanzania OR Togo OR
Uganda OR Uzbekistan OR Vietnam OR Yemen OR
Zambia OR Zimbabwe) OR ca:(Low-income
countries OR Less developed countries OR LDC OR
developing countries OR Africa OR Asia OR Latin
America OR Middle East OR Afghanistan OR
Bangladesh OR Benin OR Burkina Faso OR Burundi
OR Cambodia OR Central African Republic OR Chad
OR Comoros OR Congo OR Eritrea OR Gambia OR
Ghana OR Guinea OR Guinea Bisau OR Haiti OR
Kenya OR Korea OR Kyrgyz Republic OR Lao OR
Liberia OR Madagascar OR Mali OR Mauritania OR
Mozambique OR Myanmar OR Nepal OR Niger OR
Rwanda OR Senegal OR Sierra Leone OR Somalia OR
Tajikistan OR Tanzania OR Togo OR Uganda OR
Uzbekistan OR Vietnam OR Yemen OR Zambia OR
Zimbabwe)) AND (year:[1980 TO 2010])) AND
((ti:(Growth OR development OR economic
868

Appendix
What is the empirical evidence of the relationship between education, skills and economic growth in low-income countries? 69
performance OR investment OR labour productivity
OR capital OR innovation OR labour market
participation) OR ab:(Growth OR development OR
economic performance OR investment OR labour
productivity OR capital OR innovation OR labour
market participation)) OR ca:(Growth OR
development OR economic performance OR
investment OR labour productivity OR capital OR
innovation OR labour market participation)) AND
((ti:( Education OR Schooling OR Training OR
Qualifications OR Skills OR Human capital) OR ab:(
Education OR Schooling OR Training OR
Qualifications OR Skills OR Human capital)) OR ca:(
Education OR Schooling OR Training OR
Qualifications OR Skills OR Human capital))

Appendix
What is the empirical evidence of the relationship between education, skills and economic growth in low-income countries? 70
Appendix 2.4: Inclusion/exclusion criteria for theoretical/analytical (TA) studies at the critical evaluation stage
PIOS
heading
Inclusion/exclusion
criteria
Question Decision
Population 1. Model/analysis is
of universal
applicability
1. Is the analysis applicable in
a low-income country context?
Yes –
include
No –
exclude
Independent
Variable
2.Education and
skills are essential
concepts/variables
in the analysis
2. Is education/skills a central
state factor/variable in the
analysis of the study?
Yes –
include
No –
exclude
Outcome 3. Change in
growth
performance is
central to the
analysis
3. Does the study relate the
change in growth
performance to
education/skills directly or
indirectly?
Yes –
include
No –
exclude
Study
Design
4.
Substantial/original
analysis
4. Does the study go beyond
background/review
information by providing a
substantial analysis of the
human capital–growth
relationship?
Yes– include
No –
exclude
Decision rule: include if TA study scores four ‘yes’, exclude otherwise. If excluded, indicate the number of the criteria that study had failed (one to four).

Appendix
What is the empirical evidence of the relationship between education, skills and economic growth in low-income countries? 71
Appendix 2.5: Inclusion/exclusion criteria for empirical (EM/EM2) studies at the critical evaluation stage
PIOS
heading
Inclusion/
exclusion
criteria
Question Decision
Population 1. Data
including low-
income
countries
1. Does the study use data
including ‘low-income
countries’ or its synonyms?
Yes – include
No – exclude
Independent
Variable
2. Is an
appropriate
measure of
education/skills
used?
2. Does the study use a
recognised measure of
education/skills for example
educational attainment,
educational qualifications,
educational expenditure,
completion rates?
Yes – include
No – exclude
Outcome 3. Originality of
findings on the
education–
growth
relationship
3. Does the study report
original findings – and NOT
report, summarise or interpret
existing findings only?
Yes – include
No – exclude
Study Design 4. Valid study
design
4. Does the study use a valid
design using time-series data,
cross-section data, panel data
OR simulation?
Yes– include
and code
No – exclude
5. Robustness
check for
causality
5. Does the study conduct
causality tests or use
instrumental variables to
address endogeneity and/or
reverse causality?
Yes– include
No – exclude
Decision rule: Include if EM and EM2 studies score five ‘yes’, exclude otherwise. If excluded, indicate the number of the criteria that the study had failed (one to five).

Appendix
What is the empirical evidence of the relationship between education, skills and economic growth in low-income countries? 72
Appendix 2.6: Details of meta-analysis tools – fixed-effect estimates, random-effect estimates and precision-effect tests
For the weighted means we calculated in stage 2, we used the random-effect estimator (REE) proposed by Stanley (2008), Stanley and Doucouliagos (2007), and de Dominicis et al. (2008). The REE of reported effects is calculated as follows:
i
ii
w
w (A1)
Where = weighted mean of the reported effects; i = series of reported effects
ranging from 1 to N; and iw = weight. The weight, in turn, is the inverse of the
sum of two variances: the square of the standard error (SEi2) associated with the
reported effect (i.e. the measure of within-study heterogeneity) and the variance (σ2) for the set of reported studies (i.e. the measure of between-study
heterogeneity). Stated formally, )/(1 22
iSEwi .
With the weight thus specified, (1) can be rewritten as follows:
)]/(1[
)]/(1[
2
2
2
2
i
ii
SE
SE (A2)
Then, the REE is distributed normally around the population mean, subject to random disturbance from two sources: within-study variations (SEi
2) and between-study variations (σ2). Stated formally:
iiii u (A3)
Where i = population mean; i = disturbance due to within-study variation; and
iu = disturbance due to between-study variation. The disturbance terms, in turn,
are distributed normally as follows.
),0(~2
ii SEN and ),0(~ 2Nui (A4)
This weight specification is more complex than the weight used for calculating the weighted mean as a fixed-effect estimate (FEE). For FEE, only the inverse of the
precision squared )/1(2
iSE is used as weight. This estimate accounts for within-
study heterogeneity, but not for between-study heterogeneity. Therefore, as Stanley et al. (2009) have indicated, REE is the appropriate estimator when between-study heterogeneity exists. Because the REE gives greater weight to more precise estimates and accounts for between-study heterogeneity at the same time, it is less biased than the simple mean or the FEE when there is publication selection bias or small-study effect (de Dominicis 2008, Stanley et al. 2009).
In addition, the REE has also a heuristic value in systematic reviews where the population is of significant interest. In this review, the target population is low-income countries (LICs), which score high in terms of the perceived value of education and skills but low in terms research output. In such situations, the REE enables reviewers to contextualise the impact of human capital in LICs by drawing on REEs derived from studies investigating both low-income and other countries together (i.e. mixed-country studies). This is because the REE assumes that every study estimates a different effect size, which is distributed randomly around a

Appendix
What is the empirical evidence of the relationship between education, skills and economic growth in low-income countries? 73
fixed mean and variance for the larger population (de Dominicis 2008: 664). Under this assumption, similarity or differences between REEs for LICs and mixed countries can be taken as additional evidence on the existence or absence of genuine growth effect of human capital. This is because the REE for both sets of countries accounts not only for random variation due to population effect but also due to sampling variation.
Nevertheless, the REE suffers from dependence between reported estimates within each study. Although reported estimates within a study may differ depending on model specification (i.e. the number of control variables used) or method of estimation (e.g. instrumented vs non-instrumented methods), there will still be a significant source of dependence due to the fact that the study draws on the same dataset. Therefore, the within-study variance (SEi
2) will be small – leading to an inflated REE. Systematic reviews in healthcare and education tend to address this problem by nesting studies within treatment groups or schools. (Beacon et al. 1999, Goldstein 1991, Goldstein et al. 2000, Rosenthal 1991, Rutter and Gatsonis 2001).
In this review, we address the problem of within-study dependence by nesting studies within country groups (LICs, mixed countries), within estimation methods (GMM vs), and within pairs of education/growth measures. Once nested in this way, the within-study dependence will be reduced and the risk of assigning higher weights to studies reporting similar estimates will be addressed. That is why we did not use the REE estimator specified in (2) to generate the weighted mean effect for individual studies in stage 1.
The last stage in this systematic review addresses the precision-effect test (PET) requirement. Here we draw on the meta-regression method proposed by Egger et al. (1997) and used widely in work by Stanley (2008), Stanley and Doucouliagos (2007), Abreu et al. (2005), Dalhuisen et al. (2003) and Doucouliagos and Laroche (2003). The method consists of a weighted-least square (WLS) estimation of the t-value of the reported estimates on precision of the estimate. This method is built on the original model proposed by Egger et al. (1997).
Egger et al. (1997) proposed the following model to test for publication bias:
iii uSE )(01 (A5)
Here i = reported effect estimate; )( iSE = standard error of the reported
estimate; and 01, = the intercept and slope coefficients to be estimated.
Egger et al. (1997) demonstrated that there is evidence for publication bias if the
coefficient 0 is significantly different to zero. This was an important finding that
provided a formal test for funnel asymmetry. In addition, the model implies that
the reported effect ( i ) will vary randomly around the ‘true’ effect 1 in the
absence of bias – i.e. if 0 is not significantly different to zero. However, model
(A5) is not suitable for testing whether or not the reported effect is genuine because it is inherently heteroskedastic. In other words, the reported estimates do not have constant variance.
Therefore, it is recommended to convert model (A5) into a weighted least-squares
(WLS) model by dividing across with the standard error - iSE . This yields:
iSEtSE
ii
i
i
01 )/1( (A6)

Appendix
What is the empirical evidence of the relationship between education, skills and economic growth in low-income countries? 74
Now we have the t-value ( it ) as the dependent and the precision ( iSE/1 ) as the
independent variable, the slope and intercept coefficients have switched places,
and a new error term ( i ) defined. Equation (A6) can be estimated by ordinary least-squares (OLS) and provides a basis to test for both funnel asymmetry (funnel-asymmetry test - FAT) and also for genuine effect beyond publication selection PET’ (Stanley 2008).
Testing for funnel asymmetry requires the following test specification:
0:
0:
01
00
H
H (A7)
On the other hand, testing for genuine effect requires:
0:
0:
11
10
H
H (A8)
If the null hypothesis in (7) is rejected, asymmetry exists and the sign of the
estimate of 0 indicates the direction of the bias. This test yields the same results
as the test for 0 in model (8). Yet, this test is known to have low power, i.e. the
test has low probability of rejecting the null hypothesis when the latter is actually false. This increases the probability of committing a type II error and as such implies higher risk of not detecting bias when the latter exists.
Against this weakness, the model defined by equation (6) has the added advantage of identifying genuine empirical effect regardless of bias. In other words, it allows
testing for 1 separately. If the test for 1 rejects the null hypothesis, it implies
that there is genuine effect beyond publication bias or small-study effect. (Stanley 2008: 108).
Despite this advantage, the model in (6) has been criticised on three grounds. First, the standard errors (SEi) are themselves estimates and therefore the regression results may be biased. (Macaskill et al. 2001). Second, if the systematic review is conducted only with statistically significant estimates from original studies, the sampling errors come from a truncated distribution and as such may be biased. Finally, the growth equation (equation 2 above) might mis-specify the relationship between observed t-values and standard errors when some studies are contaminated with publication selection bias while others are not. Therefore, it is necessary to compare the performance of the model in terms of detecting publication bias and genuine effect with the performance of other models such as Hedges’ (1992) maximum likelihood publication selection estimator (MLPSE) or meta-significance tests (MST).
Hedges (1992) argues that the probability of publication is an increasing function of the complement of a study’s p-value. In other words, the lower the p-value (i.e. the higher the significance level of rejecting the null hypothesis), the higher the probability of publication. To address this publication bias, Hedges proposes the MLPSE for identifying the cut-off points for inclusion or exclusion of studies. However, Florax (2002), in his systematic review of the literature of the price elasticity of water demand, reports that the probability of publishing an insignificant elasticity is higher than the probability of publishing a statistically significant one. Similarly, Abreu et al. (2005), in their meta-analysis of the convergence literature, report that studies with insignificant p-values between 0.05 and 0.10 are more likely to be published than statistically significant ones. Therefore Hedges’ MLPSE method may improve the accuracy of the systematic

Appendix
What is the empirical evidence of the relationship between education, skills and economic growth in low-income countries? 75
review findings, but only by truncating the set of included studies in a manner that is not always justified by the statistical properties of the reported estimates in original studies.
Another meta-analysis method for identifying genuine effect is the MST, which exploits the statistical power of the test for reported estimates. Statistical power causes the magnitude (absolute value) of the test statistic (t-value) to be correlated positively with the degrees of freedom, i.e. N-k, where N is sample size and k is the number of independent variables. More precisely, it can be shown that the t-value is related to the square root of the degrees of freedom (Stanley 2005). Then the model to be estimated can be written as follows:
iii dfogtE )(1/)(log/ 10 (A9)
The test for the MST model is the following:
0:
0:
11
10
H
H (A10).
If the null hypothesis cannot be rejected (i.e. if 01 ), the meta-analysis of the
reported estimates enables us to decide that there is no genuine effect. The additional advantage of model (A9/ A10) is that it also provides a cut-off point of (
5.01 ) when the null hypothesis can be proven to be false. In other words, the
power of the test can be traced from estimated values of ( )1 and the power is
100% when ( 5.01 ).
Although the MST model possesses high power in detecting publication bias, it is affected by large-sample bias. This bias has been reported by Stanley (2005), who runs 10,000 Monte Carlo simulation exercises to compare the size and power of the FATs and PETs, using models (6) and (9). His work demonstrates that both PET (model 6) and MST (model 9) have high power and possess similar type I error rates within nominal levels – irrespective of the incidence of publication selection. However, the MST tends to identify a genuine effect much too often (i.e. it has a relatively higher rates of type II errors) when the original studies are contaminated with large-sample bias. This is to be expected because the model treats the degrees of freedom as its explanatory variable – and this is an increasing function of the sample size (N).
Therefore we have decided to use model (6) and the PET facility it provides. One reason for this decision is that the existing evidence examined above suggests that the model’s performance in capturing genuine effect is at least as good as other alternatives (such as MLPSE or MST). Second, the model identifies genuine effect (if it exists) even if the original studies are contaminated with publication bias. Stated differently, it is effective in separating the ‘wheat’ from the ‘chaff’ (Stanley
2001). Third, the model is based on precision ( iSE/1 ) rather than sample size or
degrees of freedom. As such, the genuine effect it identifies is more congruent with the way in which statistical significance is established or rejected in original studies. Finally, the model, in itself, does not account for within-study dependence caused by the level of correlation between standard errors reported by individual studies. However, this is not likely to be a serious handicap for this systematic review because the pooled estimates we evaluate are nested not within individual studies per se, but within a collection of different studies pooled together on the basis of a clearly specified criterion reflecting country type or education and skills measurement or method of estimation.
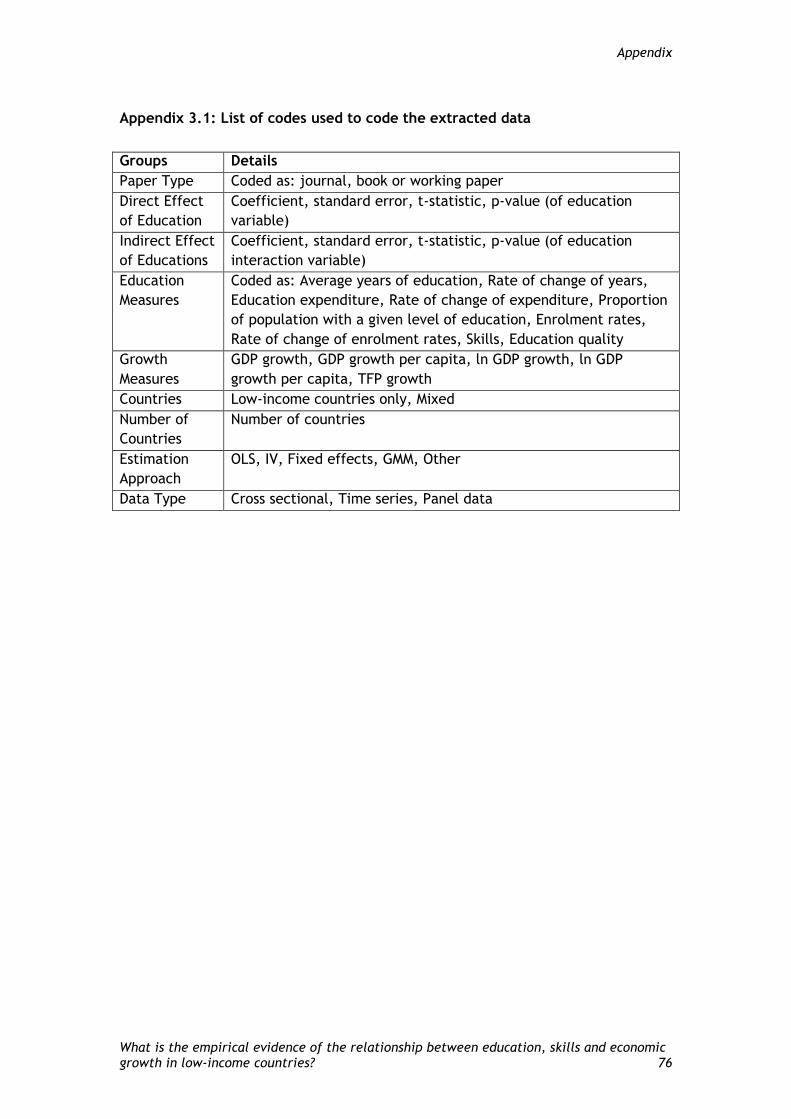
Appendix
What is the empirical evidence of the relationship between education, skills and economic growth in low-income countries? 76
Appendix 3.1: List of codes used to code the extracted data
Groups Details
Paper Type Coded as: journal, book or working paper
Direct Effect
of Education
Coefficient, standard error, t-statistic, p-value (of education
variable)
Indirect Effect
of Educations
Coefficient, standard error, t-statistic, p-value (of education
interaction variable)
Education
Measures
Coded as: Average years of education, Rate of change of years,
Education expenditure, Rate of change of expenditure, Proportion
of population with a given level of education, Enrolment rates,
Rate of change of enrolment rates, Skills, Education quality
Growth
Measures
GDP growth, GDP growth per capita, ln GDP growth, ln GDP
growth per capita, TFP growth
Countries Low-income countries only, Mixed
Number of
Countries
Number of countries
Estimation
Approach
OLS, IV, Fixed effects, GMM, Other
Data Type Cross sectional, Time series, Panel data

This material has been funded by the Department for International Development. However the views expressed do not necessarily reflect the department’s official policies. The report was first published in 2012 by:
Evidence for Policy and Practice Information and Co-ordinating Centre (EPPI-Centre) Social Science Research Unit Institute of Education, University of London18 Woburn SquareLondon WC1H 0NR
Tel: +44 (0)20 7612 6397 http://eppi.ioe.ac.uk http://www.ioe.ac.uk/ssru
ISBN: 978-1-907345-32-6Cover image ©IFAD/Nancy McGirr
The views expressed in this work are those of the authors and do not necessarily reflect the views of the EPPI-Centre or the funder. All errors and omissions remain those of the authors.
This document is available in a range of accessible formats including large print. Please contact the Institute of Education for assistance: telephone: +44 (0)20 7947 9556 email: [email protected]
The authors of this report were supported by the Evidence for Policy and Practice Information and Co-ordinating Centre (EPPI-Centre).
The Evidence for Policy and Practice Information and Co-ordinating Centre (EPPI-Centre) is part of the Social Science Research Unit (SSRU), Institute of Education, University of London.
Since 1993, we have been at the forefront of carrying out systematic reviews and developing review methods in social science and public policy. We are dedicated to making reliable research findings accessible to the people who need them, whether they are making policy, practice or personal decisions. We engage health and education policy makers, practitioners and service users in discussions about how researchers can make their work more relevant and how to use research findings.
Founded in 1990, the Social Science Research Unit (SSRU) is based at the Institute of Education, University of London. Our mission is to engage in and otherwise promote rigorous, ethical and participative social research as well as to support evidence-informed public policy and practice across a range of domains including education, health and welfare, guided by a concern for human rights, social justice and the development of human potential.