Embed Size (px)
DESCRIPTION
A short introduction to the use of E-Views interface for Time Series Forecasting
Citation preview

1
Introduction to the use of
Statistical and
Econometric Software
School of Statistics
University of the Philippines Diliman
What is EViews?
EViews provides sophisticated data analysis, regression, and forecasting tools on Windows-based computers.
Areas where EViews can be useful: Scientific data analysis and evaluation;
Financial analysis;
Macroeconomic forecasting;
Simulation;
Sales forecasting; and,
Cost analysis.
2

2
The EViews window
Title bar
•When you launch the program, you will see the EViews window.
3
The EViews window
Main
menu
Drop-
down
menu
•Selecting an item from
the menu will open a
drop-down menu
containing additional
commands.
•A grayed-out
command means the
command is not
currently available.
•An ellipse (…)
following the command
means that a dialog
box (prompting you for
additional input) will
appear before the
command is executed. 4

3
The EViews window
Main
menu
Drop-
down
menu
•A right-triangle (►)
means that additional
(cascading) menus will
appear if you select this
item.
•A check mark ()
indicates that the
option listed in the
menu is currently in
effect.
•Most menu items
contain underlined
characters representing
keyboard shortcuts
5
The EViews window
Command
window
•EViews commands
may be typed in the
command window.
•The command is
executed as soon as
you hit enter.
6

4
The EViews window
Work
area
•The area in the middle
of the window is the
work area where
EViews will display the
various object windows
that it creates.
•Only the active
window has a darkened
titlebar.
7
The EViews window
Status line
•The status line
contains messages
sent to you by EViews,
the default directory,
name of the default
database, and name of
the active workfile.
8

5
EViews 2. Workfile Basics
What is a workfile?
Most of the work in EViews will involve
objects that are contained in a workfile, so
the first step in any project will be to create
a new workfile or to load an existing
workfile into memory.
Workfiles hold a variety of EViews objects,
such as equations, graphs, and matrices.
10
6
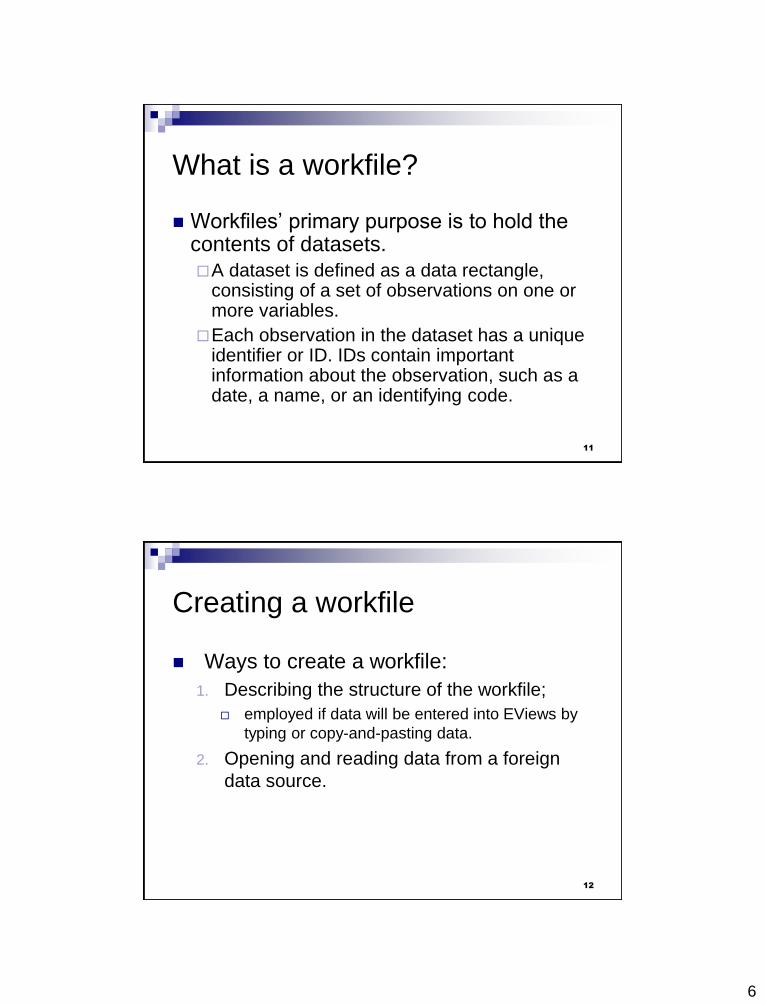
What is a workfile?
Workfiles’ primary purpose is to hold the contents of datasets.
A dataset is defined as a data rectangle, consisting of a set of observations on one or more variables.
Each observation in the dataset has a unique identifier or ID. IDs contain important information about the observation, such as a date, a name, or an identifying code.
11
Creating a workfile
Ways to create a workfile:
1. Describing the structure of the workfile;
employed if data will be entered into EViews by
typing or copy-and-pasting data.
2. Opening and reading data from a foreign
data source.
12

7
Creating a workfile by describing its
structure
To create a new
workfile,
STEP 1: Select
File/New/Workfile…
from the main menu
to open the Workfile
Create dialog.
13
Creating a workfile by describing its
structure
STEP 2: Select the appropriate workfile structure type:
1. Unstructured/ Undated: For cross section data
Prompt: number of observations
2. Dated-regular frequency: For time series data
Prompts: 1. Frequency (Annual, Semi-annual, Quarterly, Monthly, Weekly,
Daily-5 day week, Daily-7 day week)
2. Start date
3. End date
14
8
Creating a workfile by describing its
structure
3. Balanced Panel:
For panel data
Prompts:
1. Frequency (Annual, Semi-annual, Quarterly, Monthly,
Weekly, Daily-5 day week, Daily-7 day week)
2. Start date
3. End date
4. Number of cross sections
15
Creating a workfile by describing its
structure
STEP 3: Click OK. The Workfile window
containing c and resid will pop up.
16
9
Creating a workfile by reading from
a foreign data source
STEP 1: Select File/Open/Foreign Data as Workfile… to bring up the standard file Open dialog.
STEP 2: Click the Files of type combo box and select from the list of the file types that EViews supports (Excel, SAS, SPSS, Stata, Text, etc…)
STEP 3: Select your file and click OPEN.
Note: A simple alternative to opening the file from the menu is to drag-and-drop your foreign file into the EViews window.
17
Importing data
Entering data
For small datasets in printed form, you may wish
to enter the data by typing at the keyboard.
STEP 1: To open a temporary spreadsheet
window in which you will enter the data, choose
Quick/Empty Group (Edit Series) from the main
menu.
STEP 2: Do the following steps:
18
10
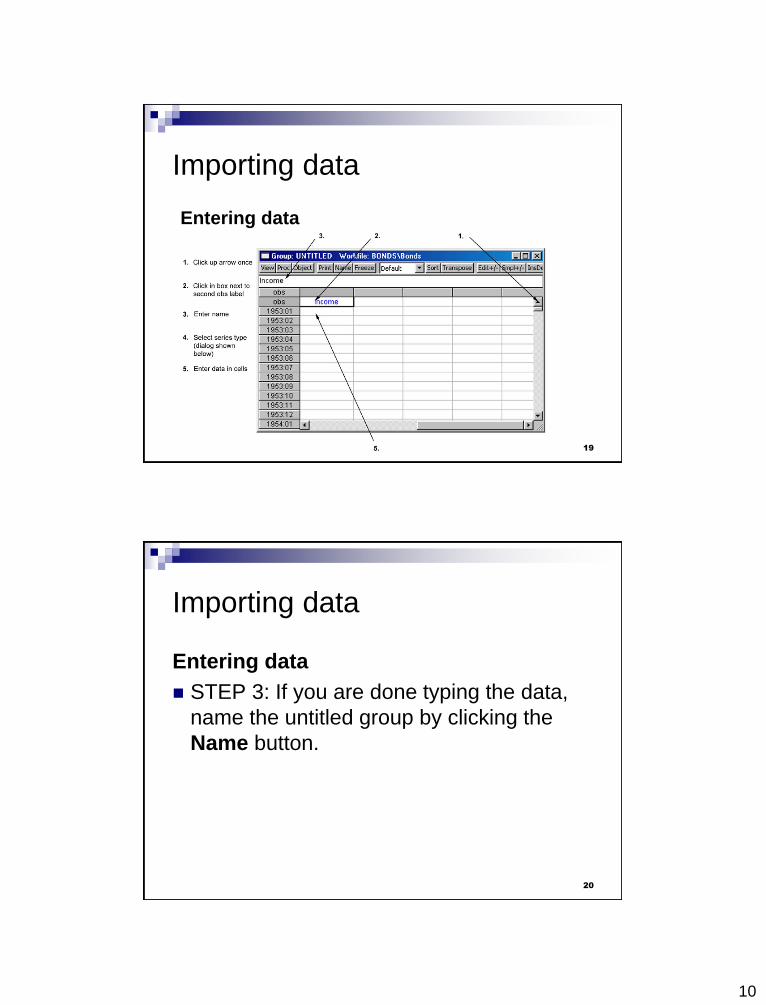
Importing data
Entering data
19
Importing data
Entering data
STEP 3: If you are done typing the data,
name the untitled group by clicking the
Name button.
20
11
Importing data
Copy-and-pasting
Useful for small datasets and other software applications (ex. Excel)
STEP 1: Highlight and copy the cells (including the variable headings/names) to be imported into EViews.
STEP 2: In EViews, create or load a workfile and choose Quick/Empty Group (Edit Series) from the main menu.
STEP 3: Place the cursor and click the upper-left cell just to the right of the second obs label.
STEP 4: Select Edit/Paste from the main menu (or simply use the right mouse click to paste).
21
Importing data
Importing data from a spreadsheet or text file
STEP 1: Make sure you have an open workfile and that the workfile window is active.
STEP 2: Click on Proc/Import/Read Text-Lotus-Excel… You will see a standard File Open dialog box. Select a file type and file name.
STEP 3: Click OK. EViews fill open a dialog prompting you for additional information about the import procedure.
22

12
Importing data
Importing data from a spreadsheet or text file
(spreadsheet import)
23
Importing data
Importing data from a spreadsheet or text file
(ASCII text files import)
24
13
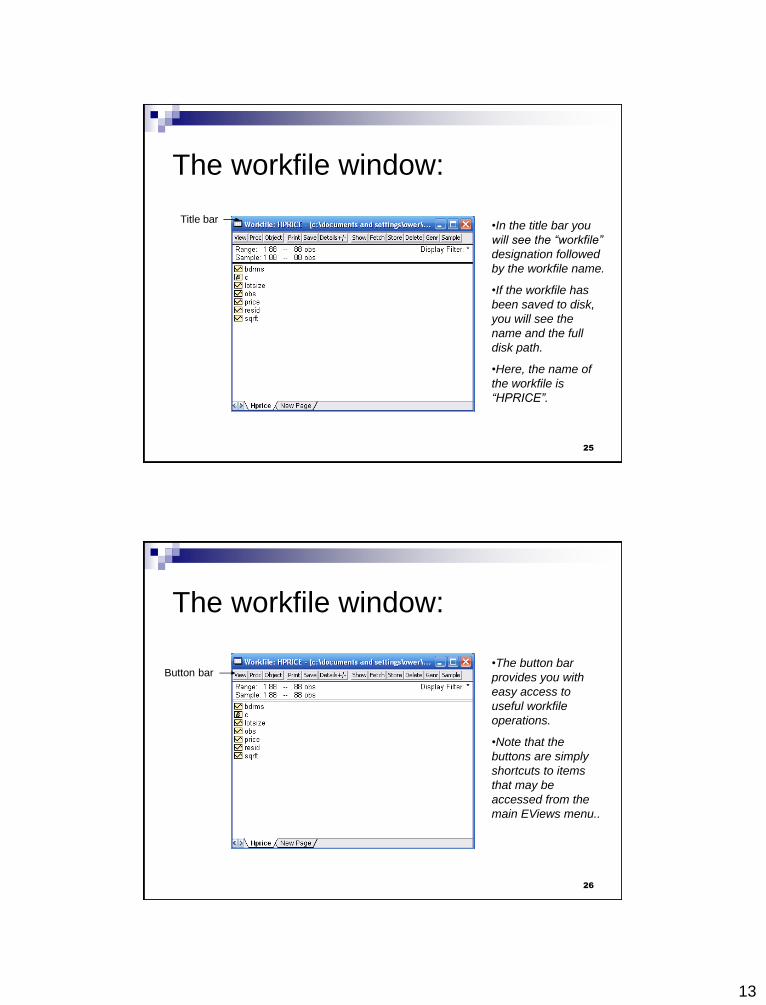
The workfile window:
Title bar •In the title bar you
will see the “workfile”
designation followed
by the workfile name.
•If the workfile has
been saved to disk,
you will see the
name and the full
disk path.
•Here, the name of
the workfile is
“HPRICE”.
25
The workfile window:
Button bar •The button bar
provides you with
easy access to
useful workfile
operations.
•Note that the
buttons are simply
shortcuts to items
that may be
accessed from the
main EViews menu..
26

14
The workfile window:
Workfile range
and structure
•Just click “range” to
structure or resize
your workfile.
27
The workfile window:
Current
sample
•The “sample”
displays the range of
observations that are
to be used in
calculations and
statistical operations.
•Just click “sample”
to change the range
of observations you
want to use.
28

15
The workfile window:
Workfile
directory
Click to scroll
page tabs
•The main portion of
the window is the
workfile directory
where you will see
the contents (which
are called “objects”)
of your workfile page.
Click here to create a
new workfile page Workfile page tabs (click to
set active page) 29
The workfile window:
Current filter
(click to
change)
•When working with
workfiles containing
a large number of
objects, you may use
“filter” to instruct
EViews to display
only a subset of
objects in the
workfile window.
•Just click “filter” to
choose which objects
to display.
30

16
Saving a workfile
To save your workfile, push the SAVE
button on the workfile toolbar.
You can also save a file using the
File/Save As… or File/Save… choices
from the main menu.
31
Workfile save options
When you click on the SAVE button, EViews will display a dialog showing the current global default options for storing data in your workfile.
Single vs. Double precision
Single precision will create smaller files on disk, but saves the data with fewer digits of accuracy (7 versus 16).
32
17
Workfile save options
Use compression
Choosing this option will reduce the size of the workfile on the disk.
A compressed workfile, however, will not be readable by versions of EViews prior to 5.0.
Prompt on each save
Unchecking this option instructs EViews to hide this dialog on subsequent saves.
33
Example on Creating a Workfile
Create an Eviews workfile from the Excel
file WAGE.XLS (cross section data)
Create an Eviews workfile from the Excel
file EXPORT.XLS (time series data)
34

18
EViews 3. Object Basics
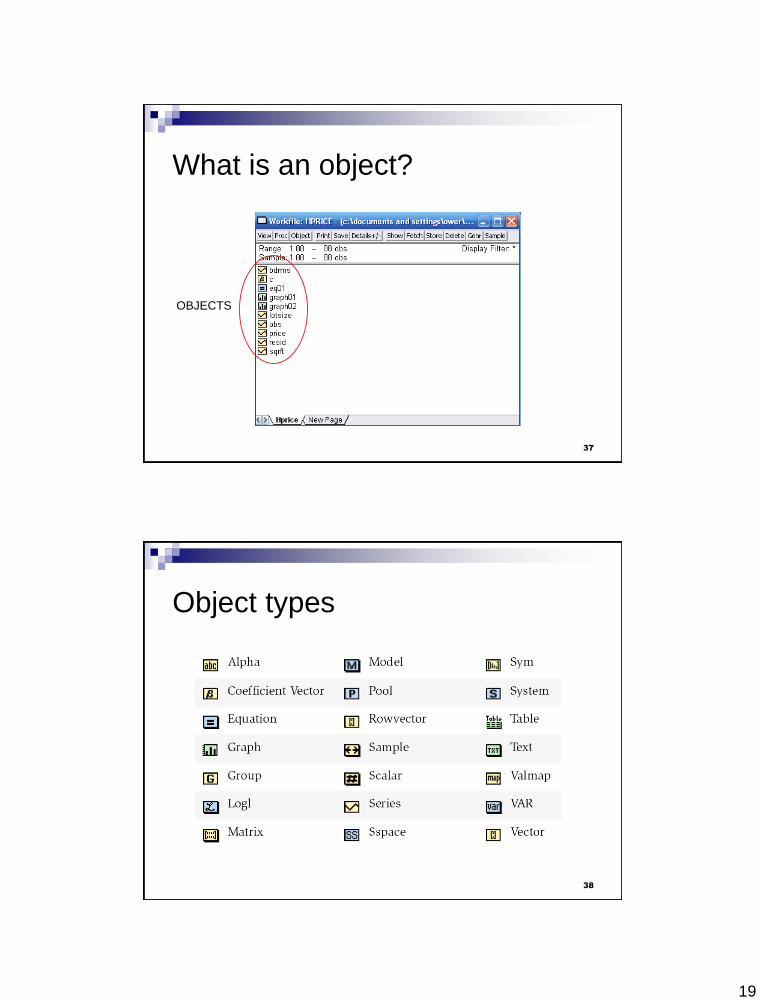
What is an object?
Information in EViews is stored in objects.
Each object consists of a collection of information related to a particular area of analysis.
Associated with each type of object is a set of views and procedures which can be used with the information contained in the object.
36
19
What is an object?
OBJECTS
37
Object types
38

20
Most common object types
SERIES
A collection of information related to a set of observations on a particular variable;
Contain mostly numeric information;
Has a spreadsheet view, which shows the raw data, a line graph view, distributional plots, etc…;
It also allows you to compute simple hypothesis tests and statistics for various subgroups.
39
Most common object types
EQUATION
A collection of information related to the
relationship between a collection of variables;
Contain complete information about the
specification of the equation, the estimation
results, as well as references to the underlying
data used to construct the estimates;
Has a representation view showing he
equation specification, an actual-fitted-residual
view containing plots of fitted values and
residuals, etc…
40
21
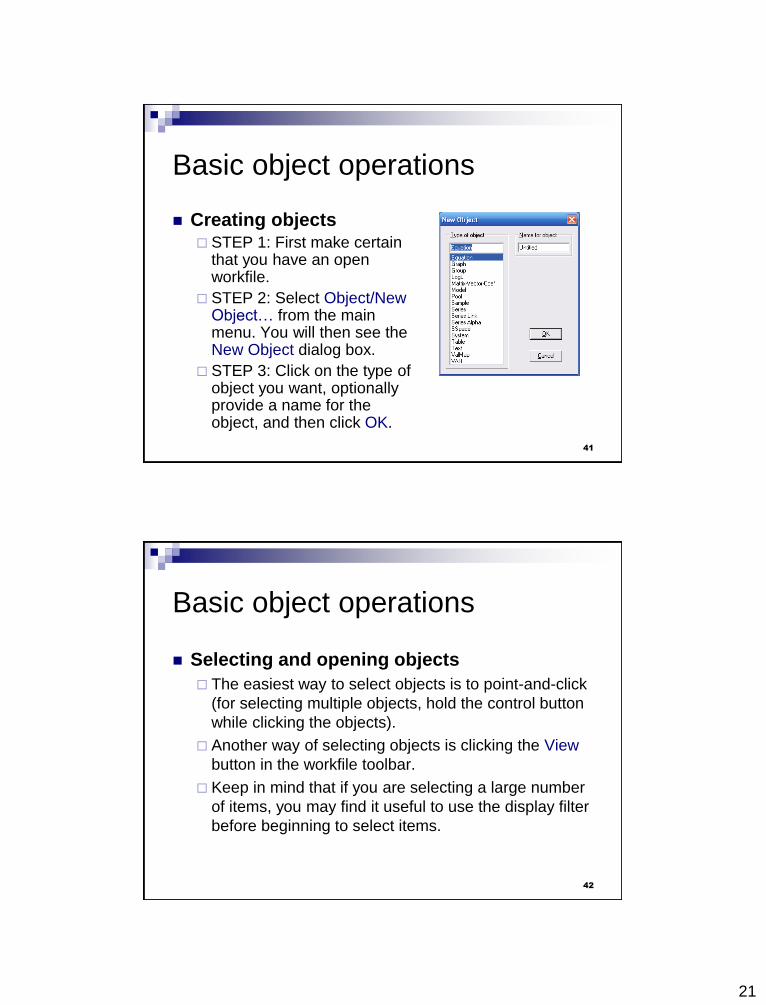
Basic object operations
Creating objects STEP 1: First make certain
that you have an open workfile.
STEP 2: Select Object/New Object… from the main menu. You will then see the New Object dialog box.
STEP 3: Click on the type of object you want, optionally provide a name for the object, and then click OK.
41
Basic object operations
Selecting and opening objects
The easiest way to select objects is to point-and-click
(for selecting multiple objects, hold the control button
while clicking the objects).
Another way of selecting objects is clicking the View
button in the workfile toolbar.
Keep in mind that if you are selecting a large number
of items, you may find it useful to use the display filter
before beginning to select items.
42
22
Basic object operations
Selecting and opening objects
To open an object window, double click on the
selected object.
If you select multiple graphs or series and
double click, a pop-up menu appears giving
you an option of opening new objects (group,
equation, VAR, graph) or displaying each of
the selected objects in its own window.
43
The object window
Object windows are the windows that are
displayed when you open an object or object
container.
An object’s window will contain either a view of
the object, or the results of an object procedure.
One of the more important features of EViews is
that you can display object windows for a
number of items at the same time.
44

23
The object window example: the equation window
Main menu
Workfile titlebar
(inactive)
Workfile
window
Equation titlebar
(active)
Equation
window toolbar
Equation
window
45
The object window Buttons found on all object toolbars
View Lets you change the view that is displayed in the
object window; the available choices will differ, depending upon the object type.
Proc Provides access to a menu of procedures that are
available for the object.
Object Lets you manage your objects; you can store the
object on disk, name, delete, copy, or print the object.
46
24
The object window Buttons found on all object toolbars
Lets you print the current view of the object (the window contents).
Name
Allows you to name or rename the object.
Freeze
Creates a new object graph, table, or text object out of the current view.
47
Working with objects
Naming objects You must name an object if you wish to keep its results.
If you do not name an object, it will be called “UNTITLED”. Unnamed objects are not saved with the workfile, so they are deleted when the workfile is closed and removed from memory.
When you give an object a name, the name will appear in the directory of the workfile, and the object will be saved as part of the workfile when the workfile is saved.
The following names are reserved and cannot be used as object names: ABS, ACOS, AND, AR, ASIN, C, CON, CNORM, COEF, COS, D, DLOG, DNORM, ELSE, ENDIF, EXP, LOG, LOGIT, LPT1, LPT2, MA, NA, NOT, NRND, OR, PDL, RESID, RND, SAR, SIN, SMA, SQR, and THEN.
48
25
Working with objects
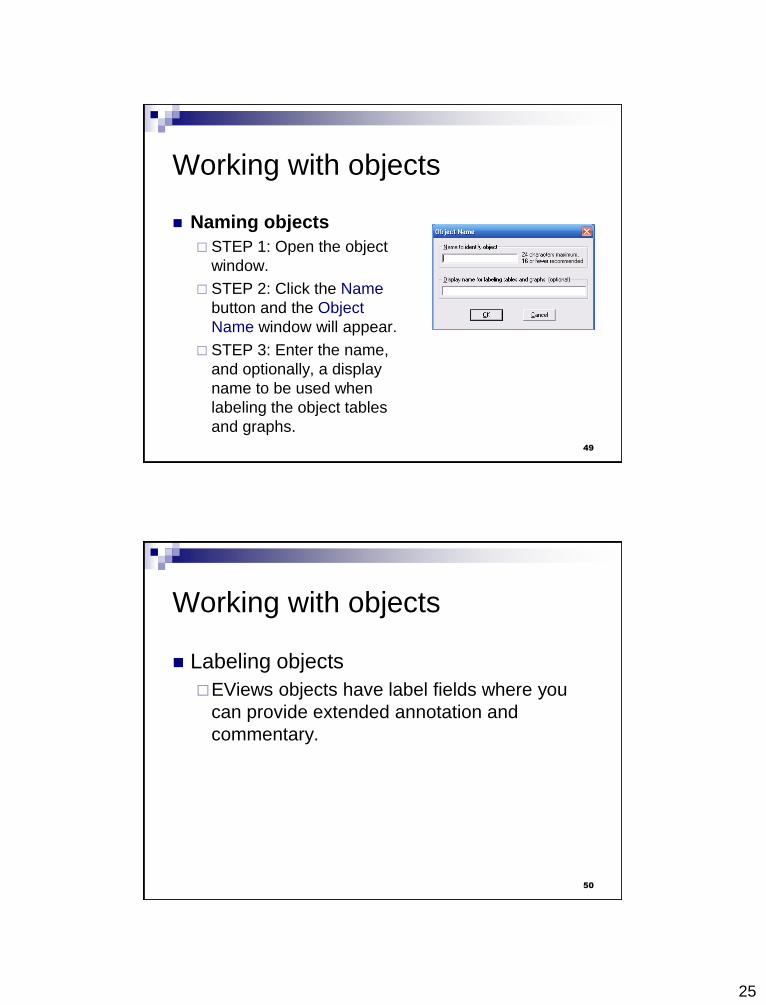
Naming objects
STEP 1: Open the object
window.
STEP 2: Click the Name
button and the Object
Name window will appear.
STEP 3: Enter the name,
and optionally, a display
name to be used when
labeling the object tables
and graphs.
49
Working with objects
Labeling objects
EViews objects have label fields where you
can provide extended annotation and
commentary.
50

26
Working with objects
Labeling objects
STEP 1: Open the object
window.
STEP 2: Click the View
button and the click Label.
STEP 3: You can edit any
of the fields, except the Last
Update field. Simply click in
the field cell that you want
to edit.
51
Working with objects
Copy-and-pasting objects
Copying an object means EViews will create a new untitled object containing an exact copy of the original object.
The new object duplicates all features of the original except for the name.
When two workfiles are in memory at the same time, you may copy objects between them using copy-and-paste.
52

27
Working with objects
Copy-and-pasting objects STEP 1: Highlight the objects you want to copy in the
source workfile.
STEP 2: Select Edit/Copy from the main menu (right clicking the object also works).
STEP 3: Select the destination workfile by clicking on its titlebar.
STEp 4: Select either Edit/Paste or Edit/Paste Special… from the main menu (or simply Paste or Paste Special… following a right mouse click).
53
Working with objects
Freezing objects The second method of copying information from an
object is to freeze a view of the object.
If you click Object/Freeze Output or press the Freeze button on the object’s toolbar, a table or graph object is created that duplicates the current view of the original object.
The primary feature of freezing an object is that the tables and graphs created by freezing may be edited for presentations or reports.
Frozen views do not change when the workfile sample or data change.
54

28
Working with objects
Deleting objects
STEP 1: To delete an object or objects from
your workfile, select the object/s in the
workfile directory.
STEP 2: Click Delete or Object/Delete
Selected on the workfile toolbar.
EViews will prompt you to make certain that
you wish to delete the objects.
55
Working with objects
Printing objects
To print the currently displayed
view of an object, push the
Print button on the object
window toolbar.
You can also choose File/Print
or Object/Print on the main
EViews menu bar.
EViews will open a Print dialog
containing the default print
settings for the type of output
you are printing.
56

29
EViews 4. Basic Data Handling
Basic data handling
The process of entering, reading, editing, manipulating, and generating data forms the foundation of most data analyses.
EViews provides you with a sophisticated set of data manipulation tools that make the task as simple and straightforward as possible.
There are three cornerstones of data handling in EViews: the two most common data objects, series and groups, and the use of samples which define the set of observations in the workfile that we wish to use in analysis.
58

30
Data objects
The actual numeric values that make up your data will generally be held in one or more of EViews’ data objects.
For most users, series and groups will by far be the most important objects, so they will be the primary focus of our discussion.
59
Series
An EViews series contains a set of observations on a
numeric variable.
For series in dated workfiles, the observations are
presumed to be observed regularly over time.
For undated data, the observations are not assumed to
follow any particular frequency.
Note that series object may only be used to hold
numeric data. If you wish to work with alphanumeric
data, you should employ alpha series.
60
31
Series
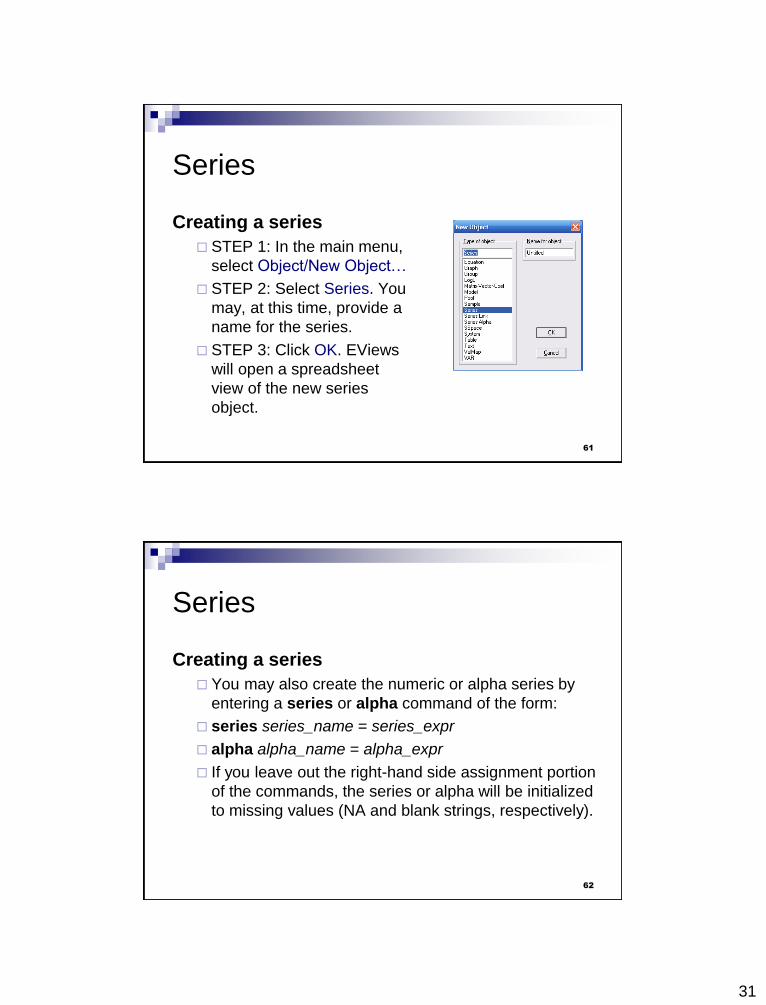
Creating a series
STEP 1: In the main menu,
select Object/New Object…
STEP 2: Select Series. You
may, at this time, provide a
name for the series.
STEP 3: Click OK. EViews
will open a spreadsheet
view of the new series
object.
61
Series
Creating a series
You may also create the numeric or alpha series by
entering a series or alpha command of the form:
series series_name = series_expr
alpha alpha_name = alpha_expr
If you leave out the right-hand side assignment portion
of the commands, the series or alpha will be initialized
to missing values (NA and blank strings, respectively).
62

32
Series
Changing the spreadsheet display
Column widths
To resize the width of a column, simply move
your mouse over the column separator until
the icon changes, then drag the column to its
desired width.
63
Series
Changing the spreadsheet
display
Display type
The series display type, which is
listed in the combo box in the
series toolbar, determines how the
series spreadsheet window shows
your data.
Changing the display of your series
values does not alter the underlying
values in the series, it only modifies
the values shown in the
spreadsheet.
64

33
Series
Changing the spreadsheet
display
Display formats
You may customize the way
that numbers or characters in
your series are displayed in the
spreadsheet by setting the
series display properties.
To display the dialog, click on
Properties in the series toolbar.
65
Series
Changing the spreadsheet display
Narrow versus Wide
The narrow display displays the observations for the
series in a single column, with date labels in the
margin. The typical series spreadsheet display will
use this display format.
The wide display arranges the observations from left
to right and top to bottom, with the label for the first
observation in the row displayed in the margin.
66
34
Series
Changing the spreadsheet display
Narrow versus Wide
Wide display
For dated workfiles, EViews will, if possible,
arrange the data in a form which matches the
frequency of the data. (Semi-annual data will be
displayed with 2 observations per row, quarterly
data will contain 4 observations per row, etc…)
67
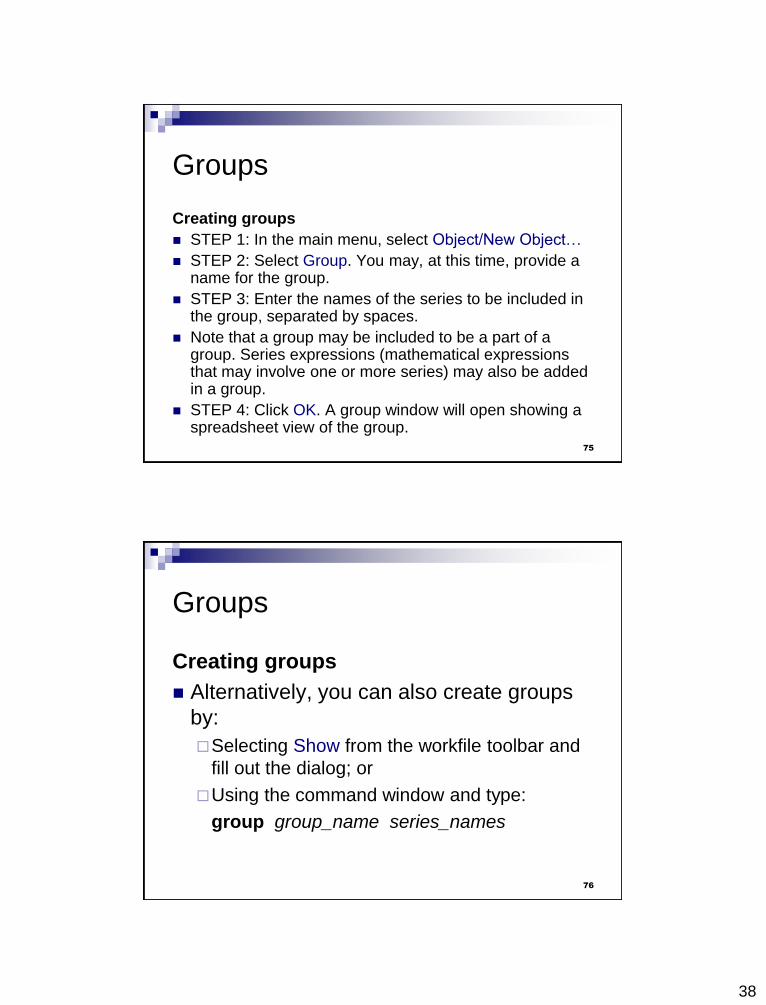
Series
Changing the
spreadsheet display
Narrow versus Wide
To change the display
to show the
observations in your
series in multiple
columns by clicking on
the Wide +/- button on
the spreadsheet view
toolbar. 68

35
Series
Changing the spreadsheet display
Sample subset display By default, all observations in the workfile are
displayed, even those observations not in the current sample.
By pressing Smpl +/- you can toggle between showing all observation in the workfile, and showing only those observation included in the current sample.
Note that if you switch to wide display, EViews automatically turns off the display filter so that all observations in the workfile are displayed.
69
Series
Editing a series
STEP 1: Open the spreadsheet view of the series.
STEP 2: Make certain that the spreadsheet window is in edit mode. Use the Edit +/- button on the toolbar to toggle between edit mode and protected mode.
STEP 3: To change a value for an observation, select the cell, type in the value, and press ENTER.
Note: When editing series values, you should pay particular attention to the series display format, which tells you the units in which your series are displayed.
70

36
Series
Editing a series
STEP 4: When you have finished editing,
you should protect yourself from
inadvertently changing values of your data
by clicking on Edit +/- to turn off edit mode.
71
Series
Inserting and deleting observations in a series
STEP 1: Open the spreadsheet view of the series and make certain that the spreadsheet window is in edit mode.
STEP 2: Click on the cell where you want the new observation to appear.
STEP 3: Right click and select InsDel. You will see a dialog asking how many observations you wish to insert or delete at the current position and whether you wish to insert observations in the selected series or in all of the series in the group.
72

37
Series
Sorting a series
From the spreadsheet view of a series,
you can sort by pressing the Sort button
on the button bar or by pressing the right-
mouse button and selecting Sort.
73
Groups
When working with multiple series, you will often want to create a group object to help you manage your data.
A group is a list of series names that provides simultaneous access to all of the elements in the list.
A set of variables may be analyzed, graphed, or printed using the group object, rather than each one of the individual series.
Once a group is defined, you can use the group name in many places to refer to all of the series contained in the group.
74
38
Groups
Creating groups
STEP 1: In the main menu, select Object/New Object…
STEP 2: Select Group. You may, at this time, provide a name for the group.
STEP 3: Enter the names of the series to be included in the group, separated by spaces.
Note that a group may be included to be a part of a group. Series expressions (mathematical expressions that may involve one or more series) may also be added in a group.
STEP 4: Click OK. A group window will open showing a spreadsheet view of the group.
75
Groups
Creating groups
Alternatively, you can also create groups
by:
Selecting Show from the workfile toolbar and
fill out the dialog; or
Using the command window and type:
group group_name series_names
76

39
Groups
Editing in a group
STEP 1: Open the group window and make certain that the group spreadsheet is in protected mode.
STEP 2: To change a value for an observation, select the cell, type in the value, and press ENTER.
Note: Since groups are simply references to series, editing the series within a group changes the values in the original series.
Note: As with series spreadsheet views, you may click Smpl +/- to toggle between showing all the observations in the workfile and showing only those observations in the current sample.
77
Samples
The sample is the set (often a subset) of observations in the workfile to be included in the data display and in performing statistical procedures.
Samples may be specified using ranges of observations (usually for time series) and “if conditions” that observations must satisfy to be included.
78

40
Samples
The workfile sample
When you create a workfile, the workfile sample or global sample is set initially to be the entire range of the workfile.
It tells EViews what set of observations you wish to use for subsequent operations.
You can always determine the current workfile sample of observations by looking at the top of your workfile window.
79
Samples
Changing the sample
There are 4 ways to set the workfile sample:
Clicking the Sample button in the workfile toolbar;
Double-clicking the sample string display in the
workfile window;
Selecting Proc/Set Sample… from the main workfile
menu;
Entering a smpl command.
80
41
Samples
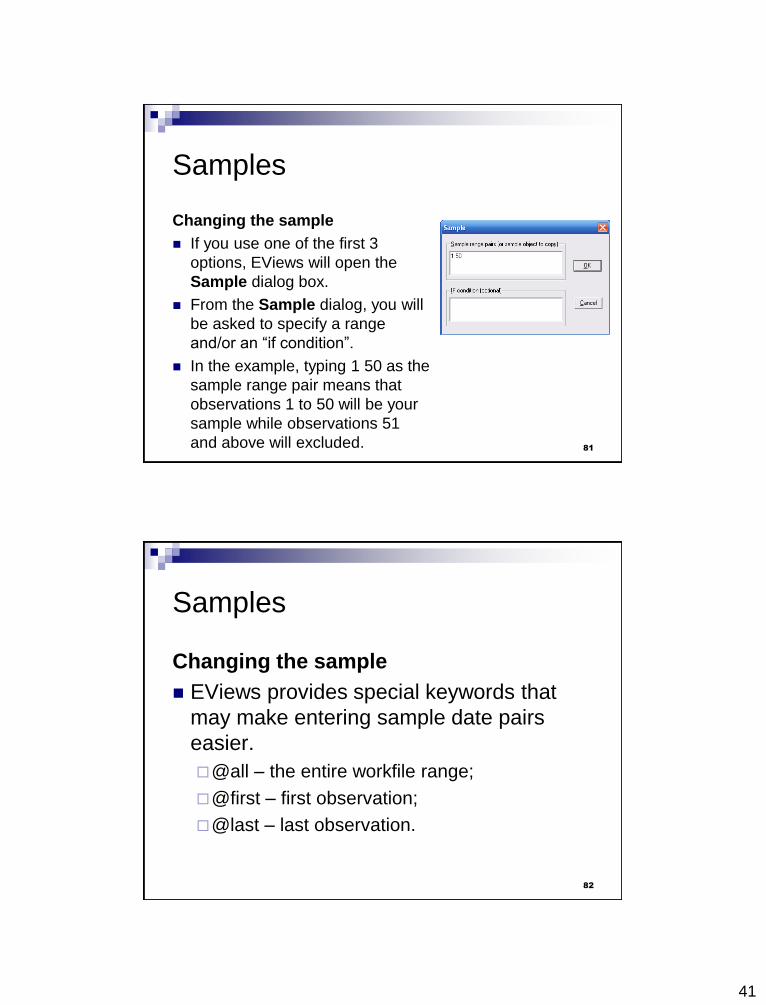
Changing the sample
If you use one of the first 3
options, EViews will open the
Sample dialog box.
From the Sample dialog, you will
be asked to specify a range
and/or an “if condition”.
In the example, typing 1 50 as the
sample range pair means that
observations 1 to 50 will be your
sample while observations 51
and above will excluded. 81
Samples
Changing the sample
EViews provides special keywords that
may make entering sample date pairs
easier.
@all – the entire workfile range;
@first – first observation;
@last – last observation.
82

42
Samples
Changing the sample
In the box for specifying the “if conditions”, operators may be used to allow for the construction of more complex expressions.
Operators include (but are not limited to): Expression Operator
+ add
- subtract
* multiply
/ divide
^ raise to the power
> greater than
< less than
= equal to
<> not equal to
<= less than or equal to
>= greater than or equal to
and logical and
or logical or 83
Samples
Changing the sample
You may find it easier to set your workfile sample from the command window using the smpl command.
STEP 1:In the command window just type:
Smpl start_obs end_obs if if_command
STEP 2: Press enter.
84

43
Samples
Changing the sample
Sample offsets (examples)
smpl 1953m1 1953m1+11
Sample that includes 12 observations in the
calendar year beginning in 1953m1.
smpl @first+1 @last
Sample where the first observation is dropped.
85
Sample Objects
It can become quite cumbersome and
time-consuming to re-enter sample
selection rules if you change samples
frequently.
EViews provides a method of saving
sample information in an object which can
then be referred to by name.
86
44
Sample objects
Creating a sample object
STEP 1:In the main menu, select Object/New Object…
STEP 2: Select Sample. You may, at this time, provide a name for the group. If you do not provide a name, EViews will automatically assign one for you.
STEP 3: Click OK. EViews will open the sample object specification dialog.
Note: In the dialog, there is a check box for setting the workfile sample equal to the sample object. This means that defining a sample object does not automatically apply the sampling procedure in the workfile.
87
Sample objects
Creating a sample object
using a command:
sample sample_name start_obs end_obs
if if_command
88

45
Sample objects
Using a sample object
To use a previously defined sample object to set
the workfile sample,
STEP 1: Open a sample object by double
clicking on the name or icon.
STEP 2: Click the Set workfile sample check
box.
STEP 3: Click OK.
89
Sample objects
Using a sample object
Using a command: smpl sample_name
For many purposes, you may also use a named sample object as though it were an ordinary EViews series containing values 1 and 0, for observations that are and are not included, respectively.
This means that sample objects can be used in EViews expressions and in the construction of other sample objects.
90

46
Importing data
Entering data
For small datasets in printed form, you may wish
to enter the data by typing at the keyboard.
STEP 1: To open a temporary spreadsheet
window in which you will enter the data, choose
Quick/Empty Group (Edit Series) from the main
menu.
STEP 2: Do the following steps:
91
Importing data
Entering data
92

47
Importing data
Entering data
STEP 3: If you are done typing the data,
name the untitled group by clicking the
Name button.
93
Importing data
Copy-and-pasting
Useful for small datasets and other software applications (ex. Excel)
STEP 1: Highlight and copy the cells (including the variable headings/names) to be imported into EViews.
STEP 2: In EViews, create or load a workfile and choose Quick/Empty Group (Edit Series) from the main menu.
STEP 3: Place the cursor and click the upper-left cell just to the right of the second obs label.
STEP 4: Select Edit/Paste from the main menu (or simply use the right mouse click to paste).
94

48
Importing data
Importing data from a spreadsheet or text file
STEP 1: Make sure you have an open workfile and that the workfile window is active.
STEP 2: Click on Proc/Import/Read Text-Lotus-Excel… You will see a standard File Open dialog box. Select a file type and file name.
STEP 3: Click OK. EViews fill open a dialog prompting you for additional information about the import procedure.
95
Importing data
Importing data from a spreadsheet or text file
(spreadsheet import)
96

49
Importing data
Importing data from a spreadsheet or text file
(ASCII text files import)
97
Exporting data
Exporting to a spreadsheet or text file
STEP 1: Make sure you have an open workfile
and that the workfile window is active.
STEP 2: Click on Proc/Export/Read Text-Lotus-
Excel… You will see a standard SaveAs dialog
box. Select file name and the type of the output
file.
STEP 3: Click OK.
98

50
EViews 5. Working with Data
Numeric expressions
An EViews expression is a combination of numbers, series names, functions, and mathematical and relational operators.
You can use these expressions to:
Calculate a new series from existing series;
Describe a sample of observations;
Describe an equation for estimation or forecasting.
100
51
Numeric expressions: operators
Eviews follows the usual order in evaluating expressions with operator precedence order as follows (from highest precedence to lowest): Unary minus/negation (-), unary plus (+);
Exponentiation (^);
Multiplication (*), division (/);
Addition (+), subtraction (-);
Comparison (<, >, <=, >=, =);
and, or.
To enforce a particular order of evaluation, you can use parentheses.
101
Numeric expressions:
lags and leads
Lags are specified as negative numbers
example: x(-4) is the fourth lag of x.
Leads are specified as positive numbers
example: y(2) is the second lead of y.
102

52
Numeric expressions: differences
EViews has several built-in functions for working with difference data in either levels or in logs.
Examples: d(x) x – x(-1)
dlog(x) log(x) – log(x(-1))
d(x,4) fourth order difference of x
d(x,1,4) first order difference of x with a seasonal difference at lag 4
d(x,0,4) x with a seasonal difference at lag 4
103
Series
One of the primary uses of expressions is
to generate new series from existing data
or to modify the values in an existing
series.
104
53
Series
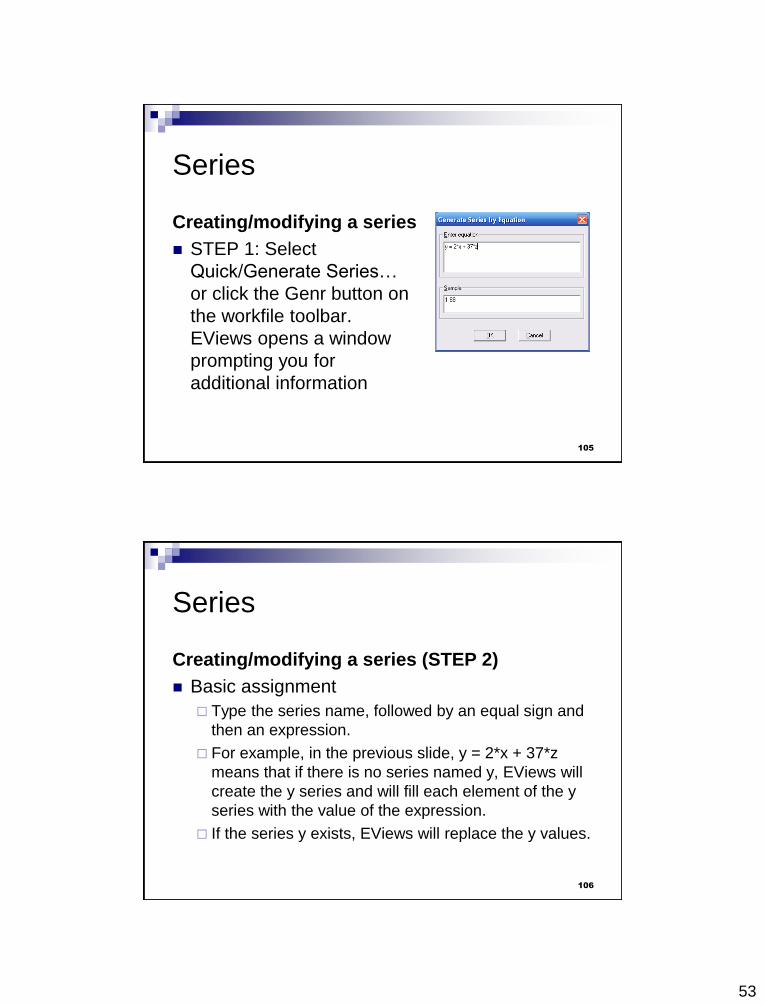
Creating/modifying a series
STEP 1: Select
Quick/Generate Series…
or click the Genr button on
the workfile toolbar.
EViews opens a window
prompting you for
additional information
105
Series
Creating/modifying a series (STEP 2)
Basic assignment
Type the series name, followed by an equal sign and
then an expression.
For example, in the previous slide, y = 2*x + 37*z
means that if there is no series named y, EViews will
create the y series and will fill each element of the y
series with the value of the expression.
If the series y exists, EViews will replace the y values.
106

54
Series
Creating/modifying a series (STEP 2)
Dynamic assignment
You can also perform dynamic assignment by using lagged values of the destination series on the right side of the equality.
Example: y = y +y(-1)
This creates a y series with the cumulative sum of y.
107
Scalars
Scalar objects are different from series in that they hold a single number instead of data for each observation in the sample.
Scalars are created by the commands of the form:
Scalar scalar_name = number
Scalar objects have no window views, to see the value of the scalar, double click on the scalar name in the workfile window and the value will be displayed in the status line.
108

55
Alpha series
An alpha series object contains a set of
observations on alphanumeric string
values.
If this type of data was entered into an
ordinary series, EViews will replace the
string with the numeric missing value, NA.
109
Alpha series
Creating an alpha series
STEP 1: In the main menu, select
Object/New Object…
STEP 2: Select Series Alpha. You may,
at this time, provide a name for the
series.
STEP 3: Click OK. EViews will open a
spreadsheet view of the new series
object.
STEP 4: To modify truncation length,
from the main menu select
Options/Alpha Truncation…. And enter
the desired length.
110

56
Alpha series
Editing an alpha series
There is no difference between editing an
ordinary numeric series and editing an
alpha series.
Issues on working with strings shall be
addressed in later lectures.
111
EViews 6. Basic Data Analysis

57
Basic data analysis
EViews provides various statistical graphs, descriptive statistics, and procedures as “views” and “procedures” of a numeric series.
Series views compute various statistics for single series and display these statistics in various forms such as spreadsheets, tables, and graphs.
Series procedures create new series from the data in existing series. These procedures include various seasonal adjustment methods, exponential smoothing methods, and the Hodrick-Prescott filter.
113
Series
To access the views and procedures for
series, open the series window by double
clicking on the series name in the workfile,
or by typing show followed by the name of
the series in the command window.
114
58
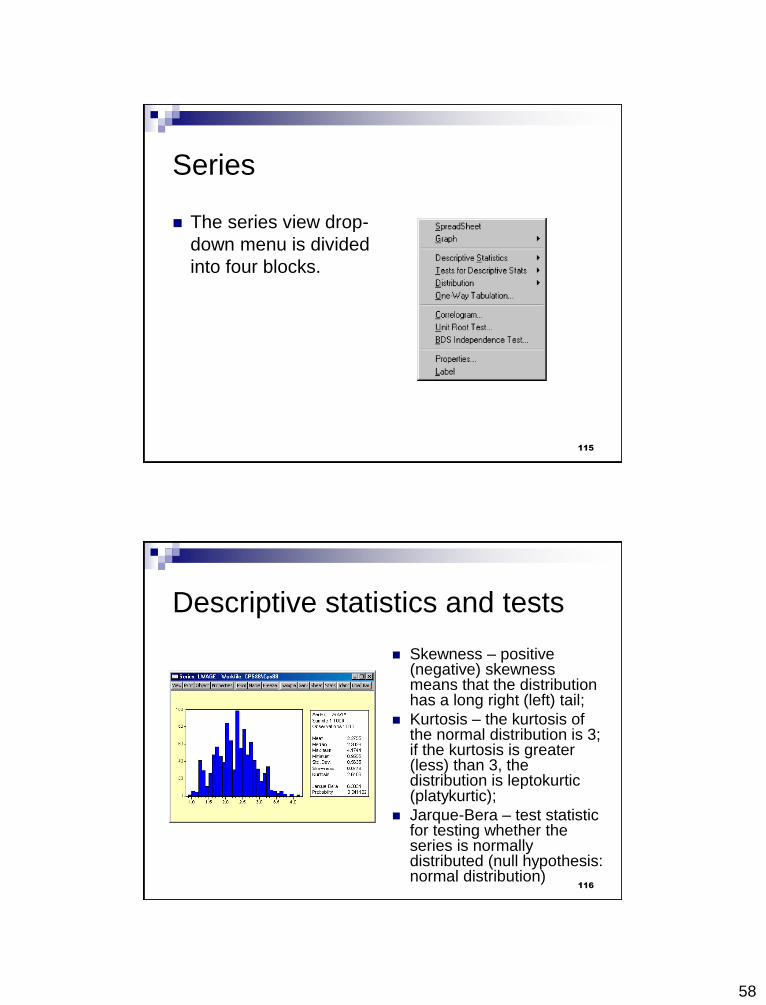
Series
The series view drop-
down menu is divided
into four blocks.
115
Descriptive statistics and tests
Skewness – positive (negative) skewness means that the distribution has a long right (left) tail;
Kurtosis – the kurtosis of the normal distribution is 3; if the kurtosis is greater (less) than 3, the distribution is leptokurtic (platykurtic);
Jarque-Bera – test statistic for testing whether the series is normally distributed (null hypothesis: normal distribution)
116

59
Simple hypothesis tests
Mean test – Ho: mean of the series is equal to the specified value;
Variance test - Ho: variance of the series is equal to the specified value;
Median test - Ho: median of the series is equal to the specified value
Ha: mean/variance/median is not equal to the specified value
117
Equality tests by classification
This view allows you to test equality of the
means, medians, and variances across
subsamples (or subgroups) of a single series.
For example, you can test whether mean income
is the same for males and females, or whether
the variance of education is related to race.
The tests assume that the subsamples are
independent.
118
60
Equality tests by classification
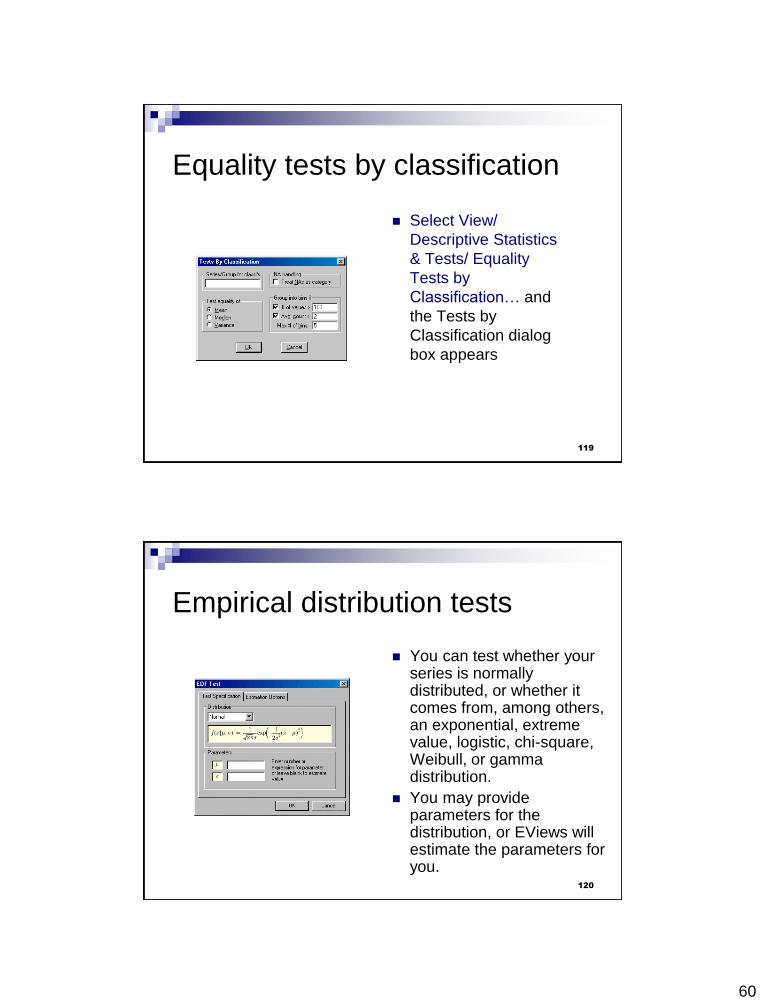
Select View/
Descriptive Statistics
& Tests/ Equality
Tests by
Classification… and
the Tests by
Classification dialog
box appears
119
Empirical distribution tests
You can test whether your series is normally distributed, or whether it comes from, among others, an exponential, extreme value, logistic, chi-square, Weibull, or gamma distribution.
You may provide parameters for the distribution, or EViews will estimate the parameters for you.
120
61
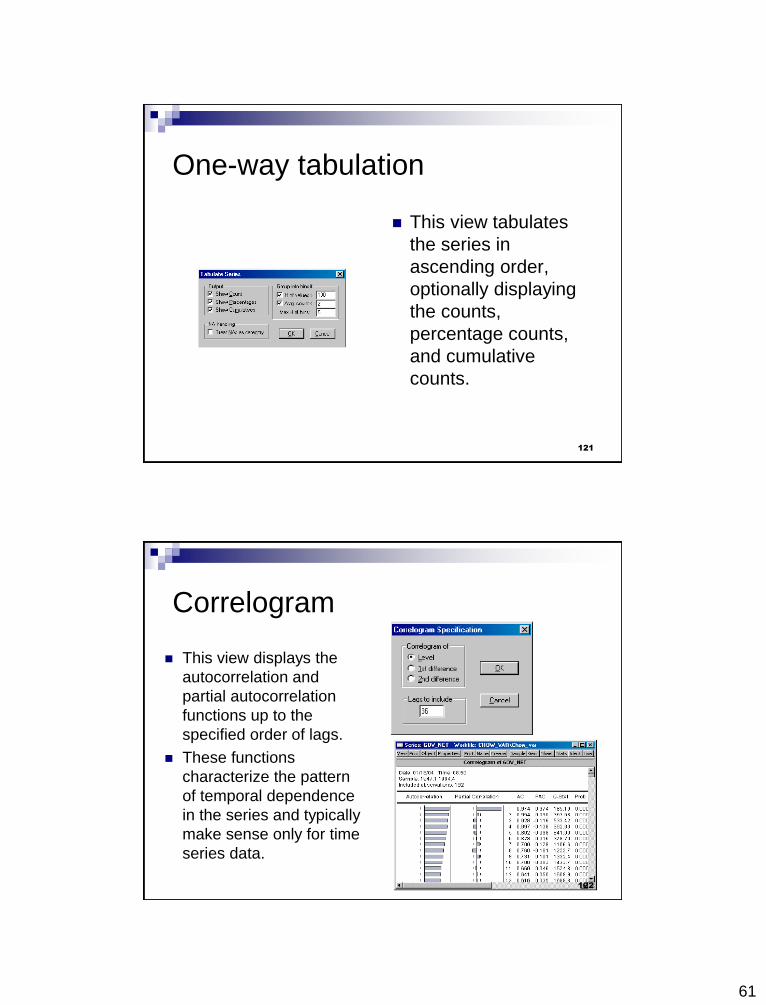
One-way tabulation
This view tabulates
the series in
ascending order,
optionally displaying
the counts,
percentage counts,
and cumulative
counts.
121
Correlogram
This view displays the
autocorrelation and
partial autocorrelation
functions up to the
specified order of lags.
These functions
characterize the pattern
of temporal dependence
in the series and typically
make sense only for time
series data.
122

62
Unit Root test
This view carries out the Augmented
Dickey-Fuller (ADF), GLS transformed
Dickey-Fuller (DFGLS), Phillips-Perron
(PP), etc… unit root tests for whether the
series (or it’s first or second difference) is
stationary.
123
Series procs overview
Series procedures may be used to generate new series that are based upon the data in the original series.
You may also use series procs to resample from the orginal series, to perofrm seasonal adjustment or exponential smoothing.
124

63
Graphing data
Constructing graphs from data is an
important part of the process of data
analysis and presentation.
The last part of this section shall focus on
describing the basics of graphing data in
series using the View/Graph… menu item.
125
Graphing data
Another way of graphing data is to select Quick/Graph…
You will then be required to enter the list of series, groups, and/or series expressions you want to graph.
126

64
Graphing data
After you click OK, the Graph Options dialog will appear.
The Graph Options dialog has multiple pages that specify various settings for the graph view.
The Type page is of central importance since it controls the graph you wish to display.
127
EViews 7. Basic Single-Equation
Analysis

65
Single-equation regression
Single-equation regression is one of the most versatile and widely used statistical techniques.
Basic regression techniques in EViews:
specifying and estimating a regression model,
performing simple diagnostic analysis, and
using the estimation results in further analysis.
129
Specifying an equation in EViews
Click Quick/Estimate
equation… to open
the Equation
Estimation dialog.
You then have to
specify:
Equation specification
Estimation settings
130

66
Sample estimation output
131