Embed Size (px)
Citation preview
Evolution Mining
20 April 2015
Combination with La Mancha Australia to create a
leading mid-tier gold producer
2
These materials have been prepared by Evolution Mining Limited (or “the Company”) and La Mancha International BV (or “La Mancha”).
However, no representation or warranty expressed or implied is made as to the fairness, accuracy, correctness, completeness or
adequacy of any statements, estimates, opinions or other information contained in these materials. To the maximum extent permitted by
law, the Company and La Mancha, their directors, officers, employees and agents disclaim liability for any loss or damage which may be
suffered by any person (including because of negligence or otherwise) through the use (directly or indirectly) or reliance on anything
contained in or omitted from these materials. The Company is responsible for the information relating to the Company and its assets and
La Mancha is responsible for the information relating to La Mancha’s Australian assets (or “La Mancha Australia”).
The materials may include forward looking statements about the Company or La Mancha Australia. Often, but not always, forward
looking statements can generally be identified by the use of forward looking words such as “may”, “will”, “expect”, “intend”, “plan”,
“estimate”, “anticipate”, “continue”, and “guidance”, or other similar words and may include, without limitation, statements regarding
plans, strategies and objectives of management, anticipated production or construction commencement dates and expected costs or
production outputs. To the extent that these materials contain forward looking information, the forward looking information is subject to a
number of risk factors, including those generally associated with the gold industry. Any such forward looking statement also inherently
involves known and unknown risks, uncertainties and other factors that may cause actual results, performance and achievements to be
materially greater or less than estimated. These factors may include, but are not limited to, changes in commodity prices, foreign
exchange fluctuations and general economic conditions, increased costs and demand for production inputs, the speculative nature of
exploration and project development, including the risks of obtaining necessary licenses and permits and diminishing quantities or
grades of reserves, political and social risks, changes to the regulatory framework within which the Company and La Mancha Australia
operate or may in the future operate, environmental conditions including extreme weather conditions, recruitment and retention of
personnel, industrial relations issues and litigation. Any such forward looking statements are also based on current assumptions which
may ultimately prove to be materially incorrect. Readers should not rely on these materials as a forecast by the Company or La Mancha.
3
Combination with
La Mancha Australia
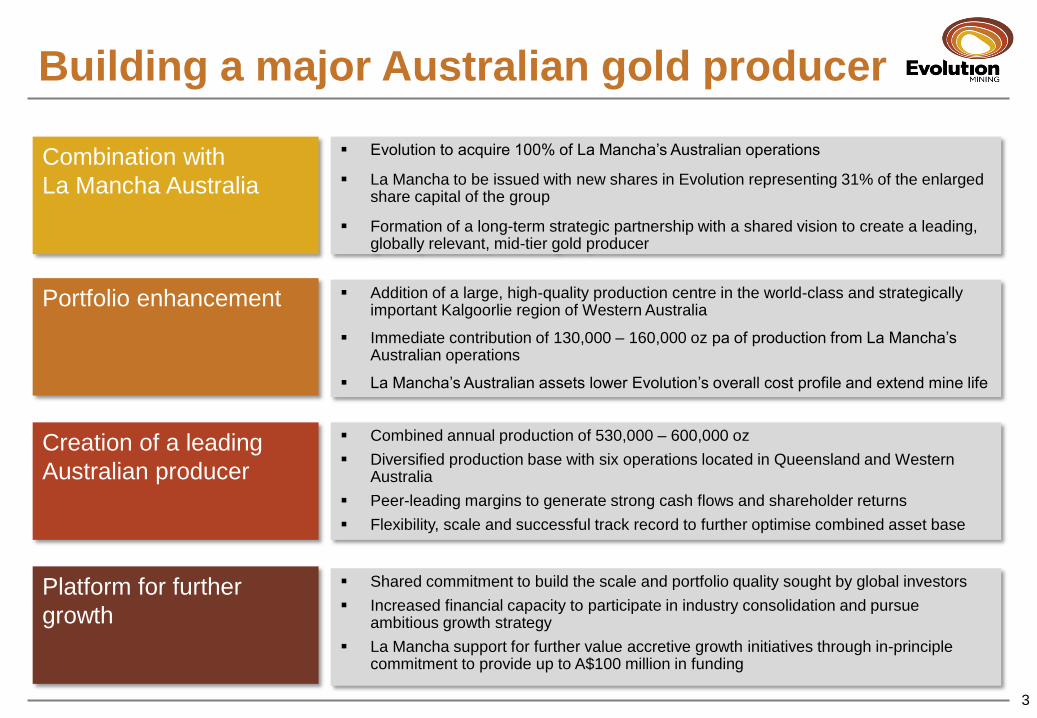
Portfolio enhancement Addition of a large, high-quality production centre in the world-class and strategically important Kalgoorlie region of Western Australia
Immediate contribution of 130,000 – 160,000 oz pa of production from La Mancha’s Australian operations
La Mancha’s Australian assets lower Evolution’s overall cost profile and extend mine life
Creation of a leading
Australian producer
Combined annual production of 530,000 – 600,000 oz
Diversified production base with six operations located in Queensland and Western Australia
Peer-leading margins to generate strong cash flows and shareholder returns
Flexibility, scale and successful track record to further optimise combined asset base
Platform for further
growth
Shared commitment to build the scale and portfolio quality sought by global investors
Increased financial capacity to participate in industry consolidation and pursue ambitious growth strategy
La Mancha support for further value accretive growth initiatives through in-principle commitment to provide up to A$100 million in funding
Evolution to acquire 100% of La Mancha’s Australian operations
La Mancha to be issued with new shares in Evolution representing 31% of the enlarged share capital of the group
Formation of a long-term strategic partnership with a shared vision to create a leading, globally relevant, mid-tier gold producer
Building a major Australian gold producer
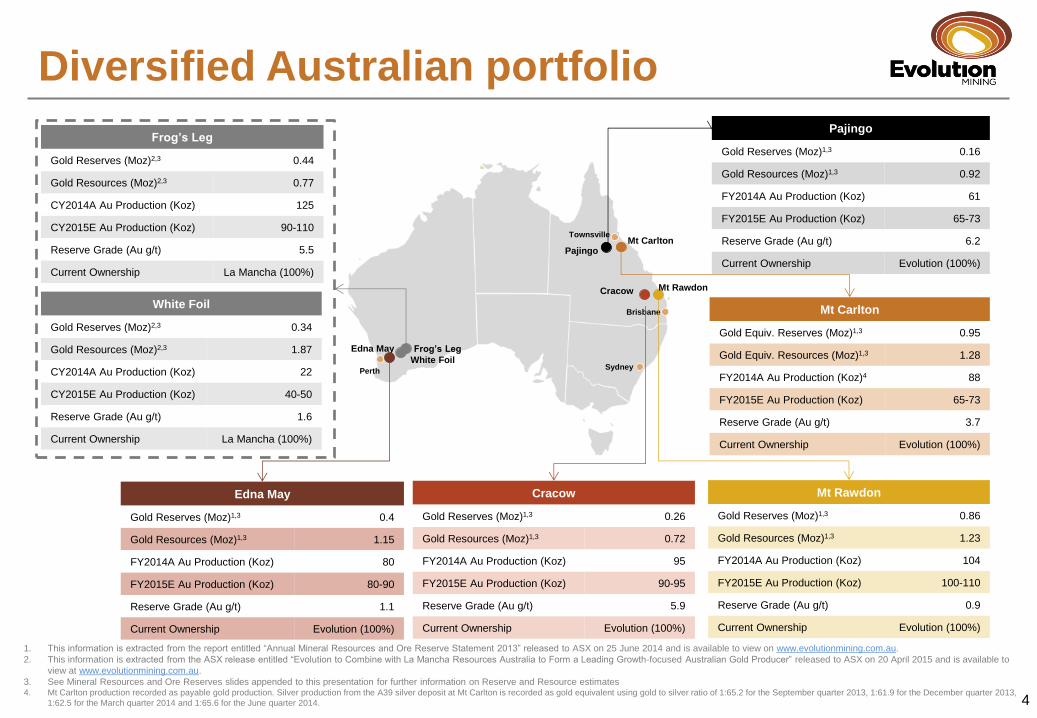
Diversified Australian portfolio
4
Mt Carlton
Gold Equiv. Reserves (Moz)1,3 0.95
Gold Equiv. Resources (Moz)1,3 1.28
FY2014A Au Production (Koz)4 88
FY2015E Au Production (Koz) 65-73
Reserve Grade (Au g/t) 3.7
Current Ownership Evolution (100%)
Mt Rawdon
Gold Reserves (Moz)1,3 0.86
Gold Resources (Moz)1,3 1.23
FY2014A Au Production (Koz) 104
FY2015E Au Production (Koz) 100-110
Reserve Grade (Au g/t) 0.9
Current Ownership Evolution (100%)
Edna May
Gold Reserves (Moz)1,3 0.4
Gold Resources (Moz)1,3 1.15
FY2014A Au Production (Koz) 80
FY2015E Au Production (Koz) 80-90
Reserve Grade (Au g/t) 1.1
Current Ownership Evolution (100%)
Cracow
Gold Reserves (Moz)1,3 0.26
Gold Resources (Moz)1,3 0.72
FY2014A Au Production (Koz) 95
FY2015E Au Production (Koz) 90-95
Reserve Grade (Au g/t) 5.9
Current Ownership Evolution (100%)
Frog’s Leg
Gold Reserves (Moz)2,3 0.44
Gold Resources (Moz)2,3 0.77
CY2014A Au Production (Koz) 125
CY2015E Au Production (Koz) 90-110
Reserve Grade (Au g/t) 5.5
Current Ownership La Mancha (100%)
White Foil
Gold Reserves (Moz)2,3 0.34
Gold Resources (Moz)2,3 1.87
CY2014A Au Production (Koz) 22
CY2015E Au Production (Koz) 40-50
Reserve Grade (Au g/t) 1.6
Current Ownership La Mancha (100%)
Pajingo
Gold Reserves (Moz)1,3 0.16
Gold Resources (Moz)1,3 0.92
FY2014A Au Production (Koz) 61
FY2015E Au Production (Koz) 65-73
Reserve Grade (Au g/t) 6.2
Current Ownership Evolution (100%)
Edna May
Perth
Brisbane
Sydney
Townsville
Frog’s Leg
White Foil
Mt Carlton Pajingo
Mt Rawdon Cracow
1. This information is extracted from the report entitled “Annual Mineral Resources and Ore Reserve Statement 2013” released to ASX on 25 June 2014 and is available to view on www.evolutionmining.com.au.
2. This information is extracted from the ASX release entitled “Evolution to Combine with La Mancha Resources Australia to Form a Leading Growth-focused Australian Gold Producer” released to ASX on 20 April 2015 and is available to
view at www.evolutionmining.com.au.
3. See Mineral Resources and Ore Reserves slides appended to this presentation for further information on Reserve and Resource estimates 4. Mt Carlton production recorded as payable gold production. Silver production from the A39 silver deposit at Mt Carlton is recorded as gold equivalent using gold to silver ratio of 1:65.2 for the September quarter 2013, 1:61.9 for the December quarter 2013,
1:62.5 for the March quarter 2014 and 1:65.6 for the June quarter 2014.
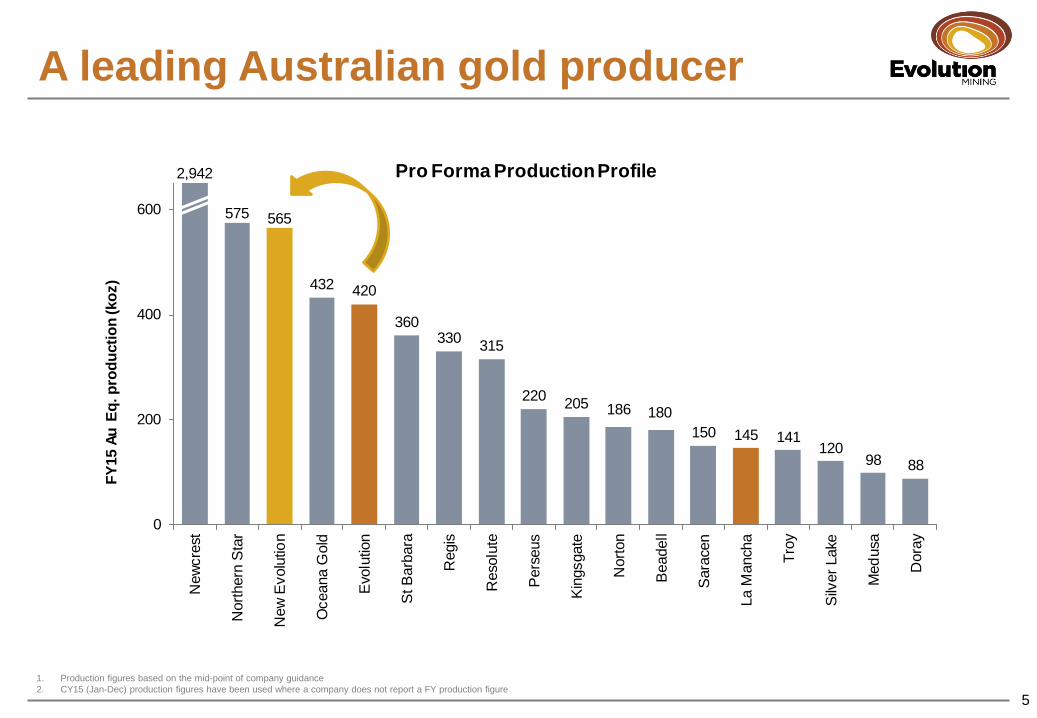
A leading Australian gold producer
5
1. Production figures based on the mid-point of company guidance
2. CY15 (Jan-Dec) production figures have been used where a company does not report a FY production figure
575 565
432 420
360330
315
220205 186 180
150 145 141120
98 88
0
200
400
600N
ew
cre
st
Nort
hern
Sta
r
New
Evolu
tion
Oceana G
old
Evo
lutio
n
St B
arb
ara
Regis
Reso
lute
Pers
eus
Kin
gsgate
Nort
on
Beadell
Sara
cen
La M
anch
a
Tro
y
Silv
er
Lake
Med
usa
Dora
y
FY
15 A
u E
q. p
rod
ucti
on
(ko
z)
Pro Forma Production Profile2,942
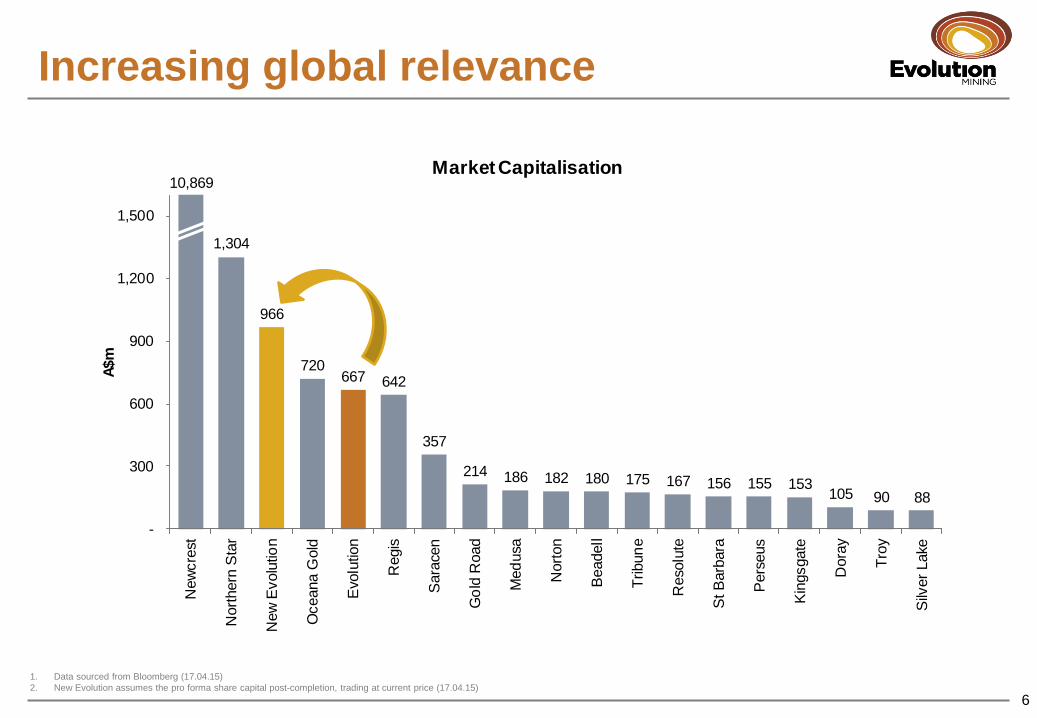
10,869
1,304
966
720667 642
357
214 186 182 180 175 167 156 155 153105 90 88
-
300
600
900
1,200
1,500
New
cre
st
Nort
hern
Sta
r
New
Evolu
tion
Oceana G
old
Evolu
tion
Regis
Sara
cen
Go
ld R
oad
Med
usa
Nort
on
Beadell
Tribun
e
Reso
lute
St B
arb
ara
Pers
eus
Kin
gsgate
Dora
y
Tro
y
Silv
er
Lake
A$m
Market Capitalisation
Increasing global relevance
6
1. Data sourced from Bloomberg (17.04.15)
2. New Evolution assumes the pro forma share capital post-completion, trading at current price (17.04.15)
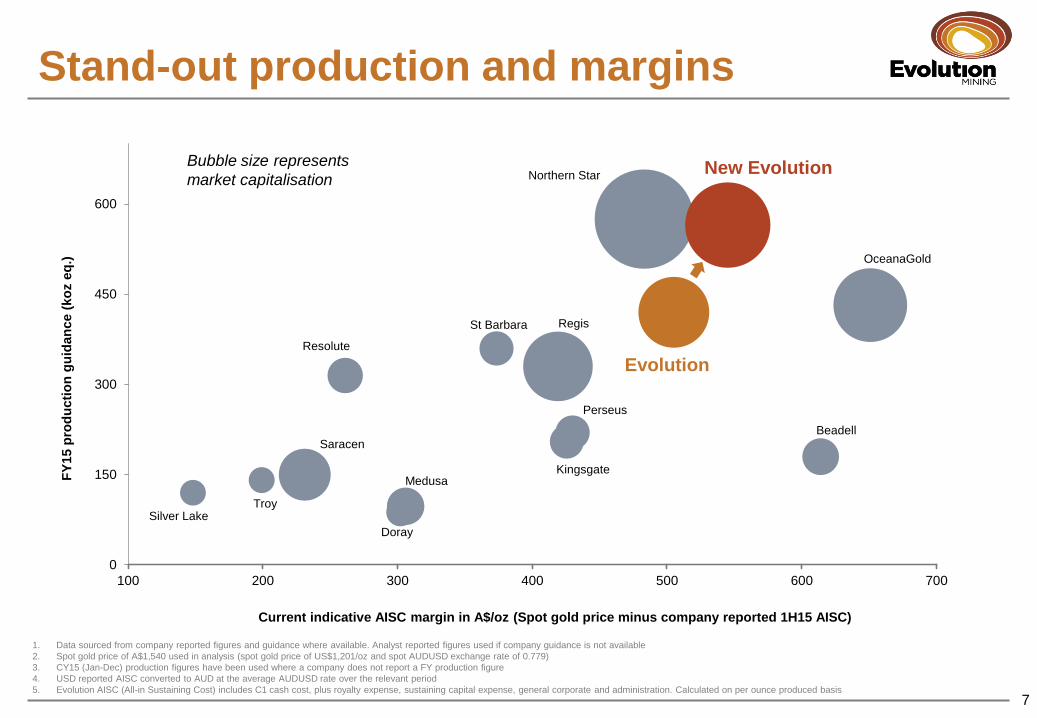
Stand-out production and margins
7
1. Data sourced from company reported figures and guidance where available. Analyst reported figures used if company guidance is not available
2. Spot gold price of A$1,540 used in analysis (spot gold price of US$1,201/oz and spot AUDUSD exchange rate of 0.779)
3. CY15 (Jan-Dec) production figures have been used where a company does not report a FY production figure
4. USD reported AISC converted to AUD at the average AUDUSD rate over the relevant period
5. Evolution AISC (All-in Sustaining Cost) includes C1 cash cost, plus royalty expense, sustaining capital expense, general corporate and administration. Calculated on per ounce produced basis
Northern Star
Regis
OceanaGold
Saracen
Resolute
Beadell
Perseus
Kingsgate Medusa
Silver Lake Troy
Doray
St Barbara
0
150
300
450
600
100 200 300 400 500 600 700
FY
15 p
rod
ucti
on
gu
idan
ce (
ko
z e
q.)
Current indicative AISC margin in A$/oz (Spot gold price minus company reported 1H15 AISC)
Bubble size represents
market capitalisation
Evolution
New Evolution
Transaction summary
8
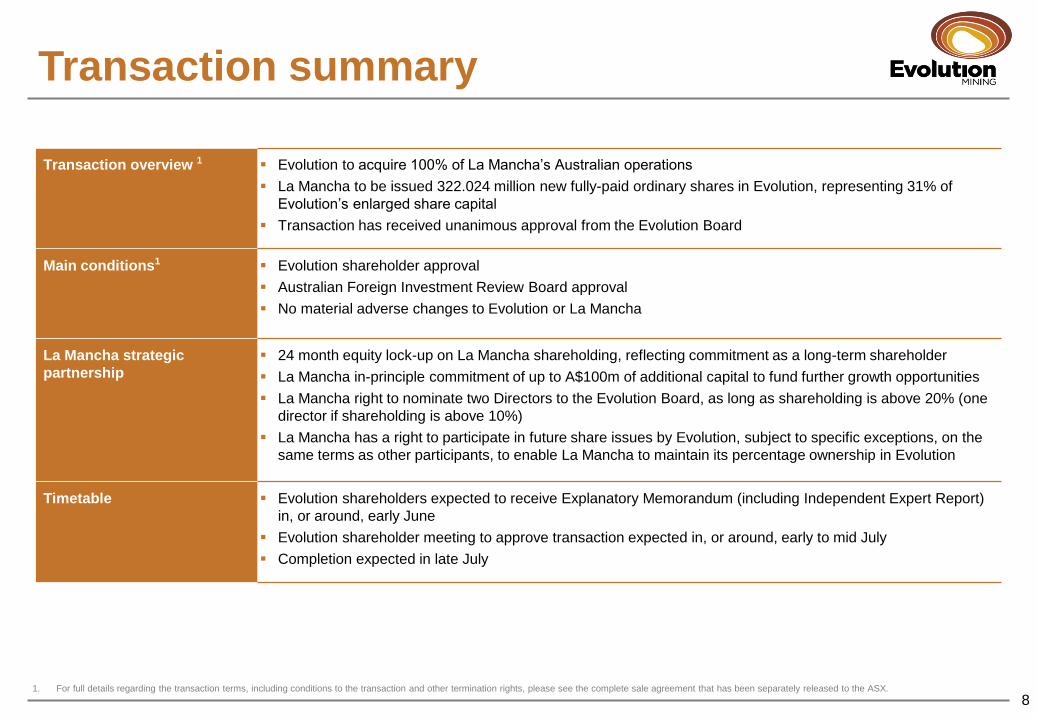
Transaction overview 1 Evolution to acquire 100% of La Mancha’s Australian operations
La Mancha to be issued 322.024 million new fully-paid ordinary shares in Evolution, representing 31% of
Evolution’s enlarged share capital
Transaction has received unanimous approval from the Evolution Board
Main conditions1 Evolution shareholder approval
Australian Foreign Investment Review Board approval
No material adverse changes to Evolution or La Mancha
La Mancha strategic
partnership
24 month equity lock-up on La Mancha shareholding, reflecting commitment as a long-term shareholder
La Mancha in-principle commitment of up to A$100m of additional capital to fund further growth opportunities
La Mancha right to nominate two Directors to the Evolution Board, as long as shareholding is above 20% (one
director if shareholding is above 10%)
La Mancha has a right to participate in future share issues by Evolution, subject to specific exceptions, on the
same terms as other participants, to enable La Mancha to maintain its percentage ownership in Evolution
Timetable
Evolution shareholders expected to receive Explanatory Memorandum (including Independent Expert Report)
in, or around, early June
Evolution shareholder meeting to approve transaction expected in, or around, early to mid July
Completion expected in late July
1. For full details regarding the transaction terms, including conditions to the transaction and other termination rights, please see the complete sale agreement that has been separately released to the ASX.
Benefits to Evolution shareholders
9
Creating shareholder value
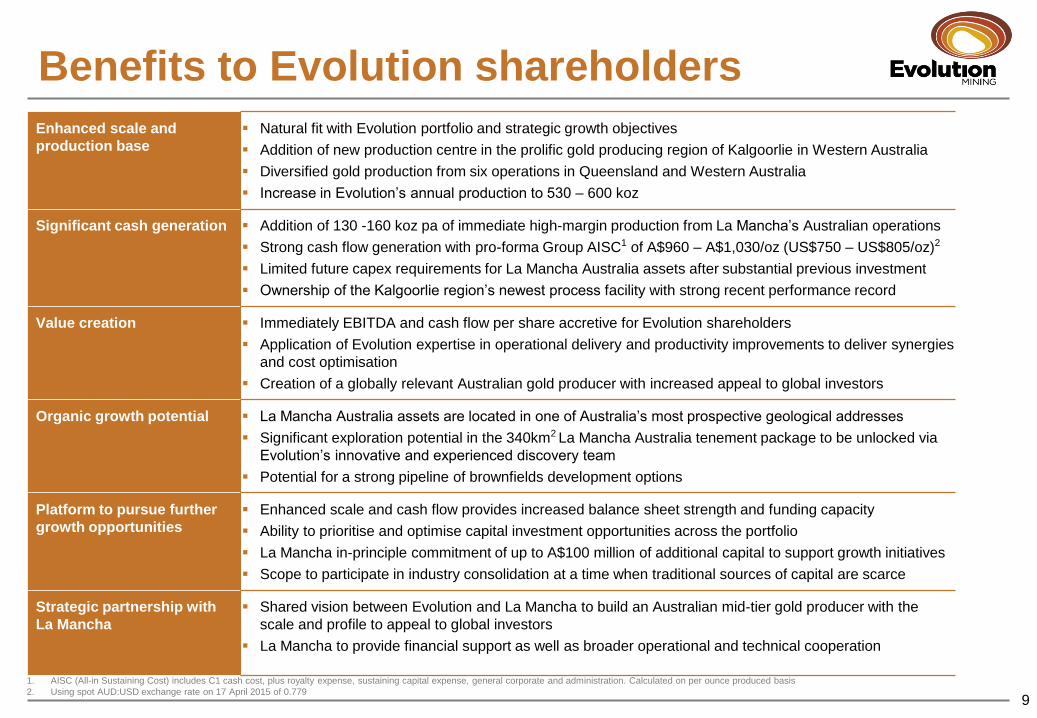
Enhanced scale and
production base
Natural fit with Evolution portfolio and strategic growth objectives
Addition of new production centre in the prolific gold producing region of Kalgoorlie in Western Australia
Diversified gold production from six operations in Queensland and Western Australia
Increase in Evolution’s annual production to 530 – 600 koz
Significant cash generation Addition of 130 -160 koz pa of immediate high-margin production from La Mancha’s Australian operations
Strong cash flow generation with pro-forma Group AISC1 of A$960 – A$1,030/oz (US$750 – US$805/oz)2
Limited future capex requirements for La Mancha Australia assets after substantial previous investment
Ownership of the Kalgoorlie region’s newest process facility with strong recent performance record
Value creation Immediately EBITDA and cash flow per share accretive for Evolution shareholders
Application of Evolution expertise in operational delivery and productivity improvements to deliver synergies
and cost optimisation
Creation of a globally relevant Australian gold producer with increased appeal to global investors
Organic growth potential La Mancha Australia assets are located in one of Australia’s most prospective geological addresses
Significant exploration potential in the 340km2 La Mancha Australia tenement package to be unlocked via
Evolution’s innovative and experienced discovery team
Potential for a strong pipeline of brownfields development options
Platform to pursue further
growth opportunities
Enhanced scale and cash flow provides increased balance sheet strength and funding capacity
Ability to prioritise and optimise capital investment opportunities across the portfolio
La Mancha in-principle commitment of up to A$100 million of additional capital to support growth initiatives
Scope to participate in industry consolidation at a time when traditional sources of capital are scarce
Strategic partnership with
La Mancha
Shared vision between Evolution and La Mancha to build an Australian mid-tier gold producer with the
scale and profile to appeal to global investors
La Mancha to provide financial support as well as broader operational and technical cooperation
1. AISC (All-in Sustaining Cost) includes C1 cash cost, plus royalty expense, sustaining capital expense, general corporate and administration. Calculated on per ounce produced basis
2. Using spot AUD:USD exchange rate on 17 April 2015 of 0.779
Overview of La Mancha
10
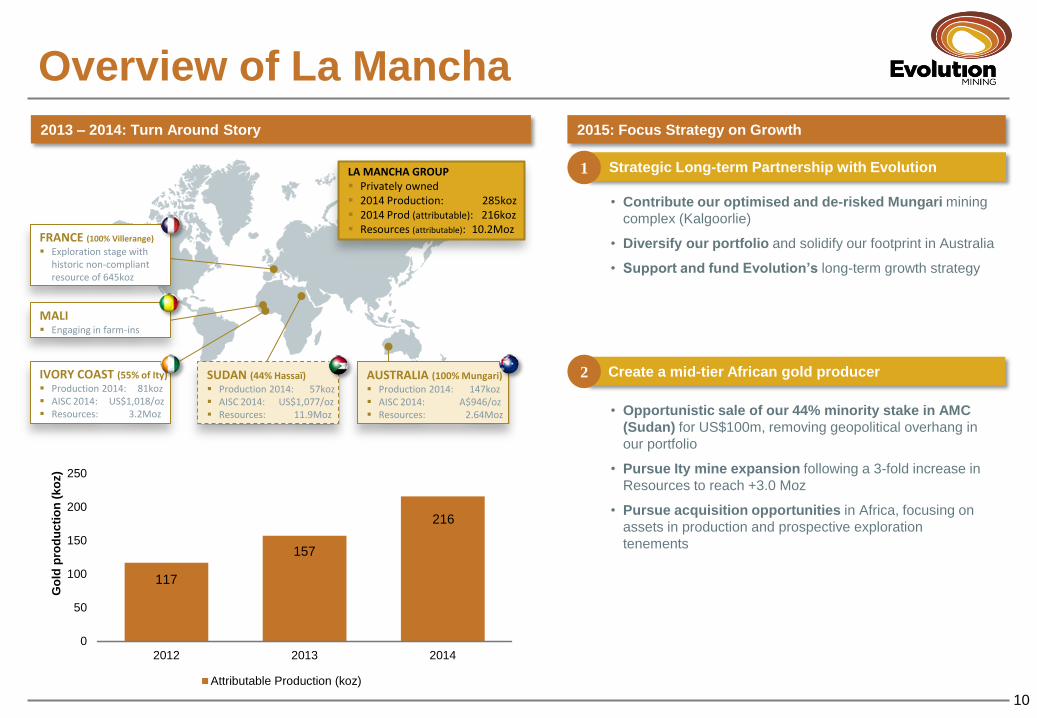
LA MANCHA GROUP Privately owned 2014 Production: 285koz 2014 Prod (attributable): 216koz Resources (attributable): 10.2Moz
AUSTRALIA (100% Mungari)
Production 2014: 147koz AISC 2014: A$946/oz Resources: 2.64Moz
SUDAN (44% Hassaï)
Production 2014: 57koz AISC 2014: US$1,077/oz Resources: 11.9Moz
IVORY COAST (55% of Ity)
Production 2014: 81koz AISC 2014: US$1,018/oz Resources: 3.2Moz
MALI Engaging in farm-ins
FRANCE (100% Villerange)
Exploration stage with historic non-compliant resource of 645koz
• Contribute our optimised and de-risked Mungari mining
complex (Kalgoorlie)
• Diversify our portfolio and solidify our footprint in Australia
• Support and fund Evolution’s long-term growth strategy
• Opportunistic sale of our 44% minority stake in AMC
(Sudan) for US$100m, removing geopolitical overhang in
our portfolio
• Pursue Ity mine expansion following a 3-fold increase in
Resources to reach +3.0 Moz
• Pursue acquisition opportunities in Africa, focusing on
assets in production and prospective exploration
tenements
Strategic Long-term Partnership with Evolution
2013 – 2014: Turn Around Story 2015: Focus Strategy on Growth
1
Create a mid-tier African gold producer 2
117
157
216
0
50
100
150
200
250
2012 2013 2014
Go
ld p
rod
uc
tio
n (
ko
z)
Attributable Production (koz)
Development of the LMA portfolio
11
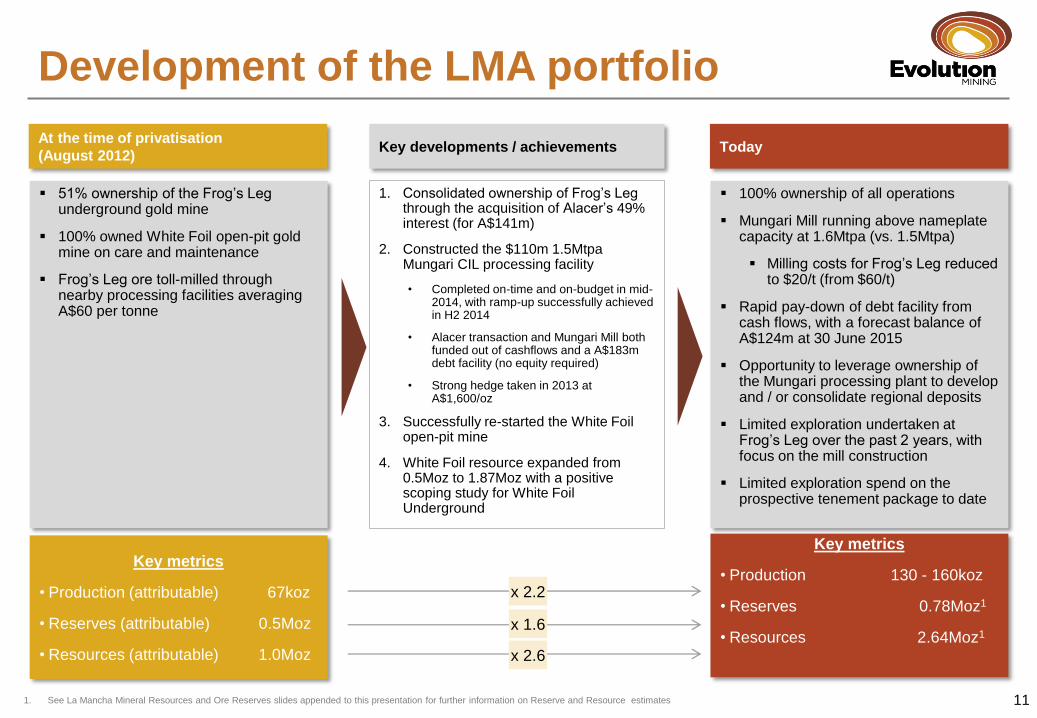
At the time of privatisation
(August 2012)
51% ownership of the Frog’s Leg underground gold mine
100% owned White Foil open-pit gold mine on care and maintenance
Frog’s Leg ore toll-milled through nearby processing facilities averaging A$60 per tonne
Key developments / achievements Today
1. Consolidated ownership of Frog’s Leg through the acquisition of Alacer’s 49% interest (for A$141m)
2. Constructed the $110m 1.5Mtpa Mungari CIL processing facility
• Completed on-time and on-budget in mid-2014, with ramp-up successfully achieved in H2 2014
• Alacer transaction and Mungari Mill both funded out of cashflows and a A$183m debt facility (no equity required)
• Strong hedge taken in 2013 at A$1,600/oz
3. Successfully re-started the White Foil open-pit mine
4. White Foil resource expanded from 0.5Moz to 1.87Moz with a positive scoping study for White Foil Underground
100% ownership of all operations
Mungari Mill running above nameplate capacity at 1.6Mtpa (vs. 1.5Mtpa)
Milling costs for Frog’s Leg reduced to $20/t (from $60/t)
Rapid pay-down of debt facility from cash flows, with a forecast balance of A$124m at 30 June 2015
Opportunity to leverage ownership of the Mungari processing plant to develop and / or consolidate regional deposits
Limited exploration undertaken at Frog’s Leg over the past 2 years, with focus on the mill construction
Limited exploration spend on the prospective tenement package to date
Key metrics
• Production (attributable) 67koz
• Reserves (attributable) 0.5Moz
• Resources (attributable) 1.0Moz
Key metrics
• Production 130 - 160koz
• Reserves 0.78Moz1
• Resources 2.64Moz1
x 1.6
x 2.6
x 2.2
1. See La Mancha Mineral Resources and Ore Reserves slides appended to this presentation for further information on Reserve and Resource estimates
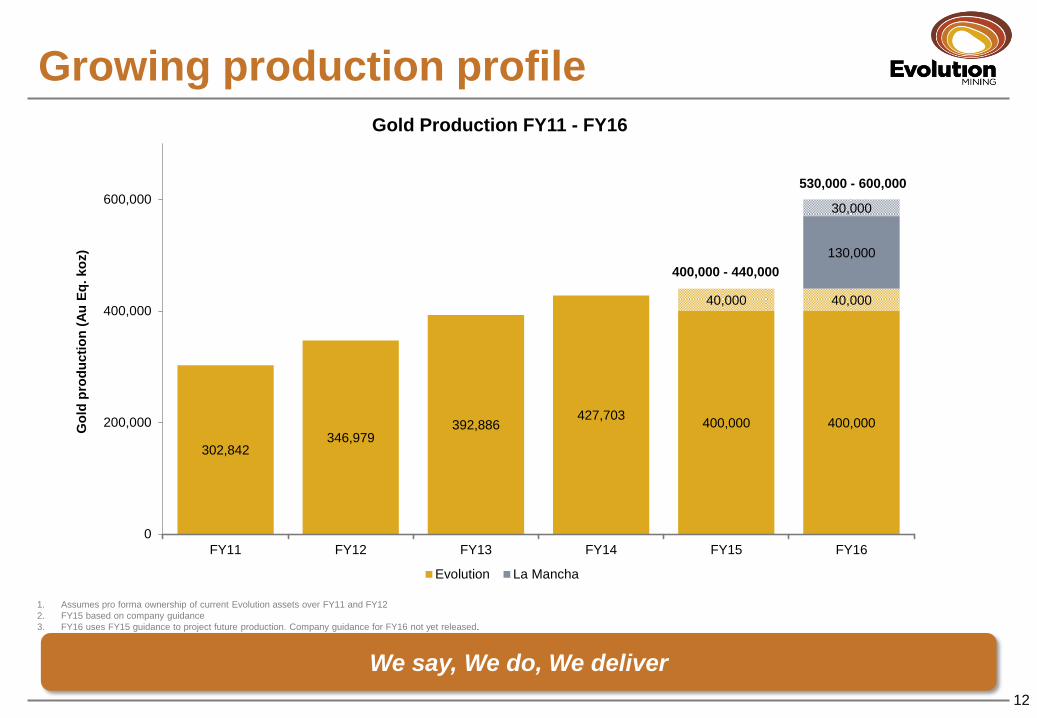
Growing production profile
12
We say, We do, We deliver
1. Assumes pro forma ownership of current Evolution assets over FY11 and FY12
2. FY15 based on company guidance
3. FY16 uses FY15 guidance to project future production. Company guidance for FY16 not yet released.
302,842 346,979
392,886 427,703
400,000 400,000
40,000 40,000
130,000
30,000
0
200,000
400,000
600,000
FY11 FY12 FY13 FY14 FY15 FY16
Go
ld p
rod
ucti
on
(A
u E
q.
ko
z)
Gold Production FY11 - FY16
Evolution La Mancha
400,000 - 440,000
530,000 - 600,000
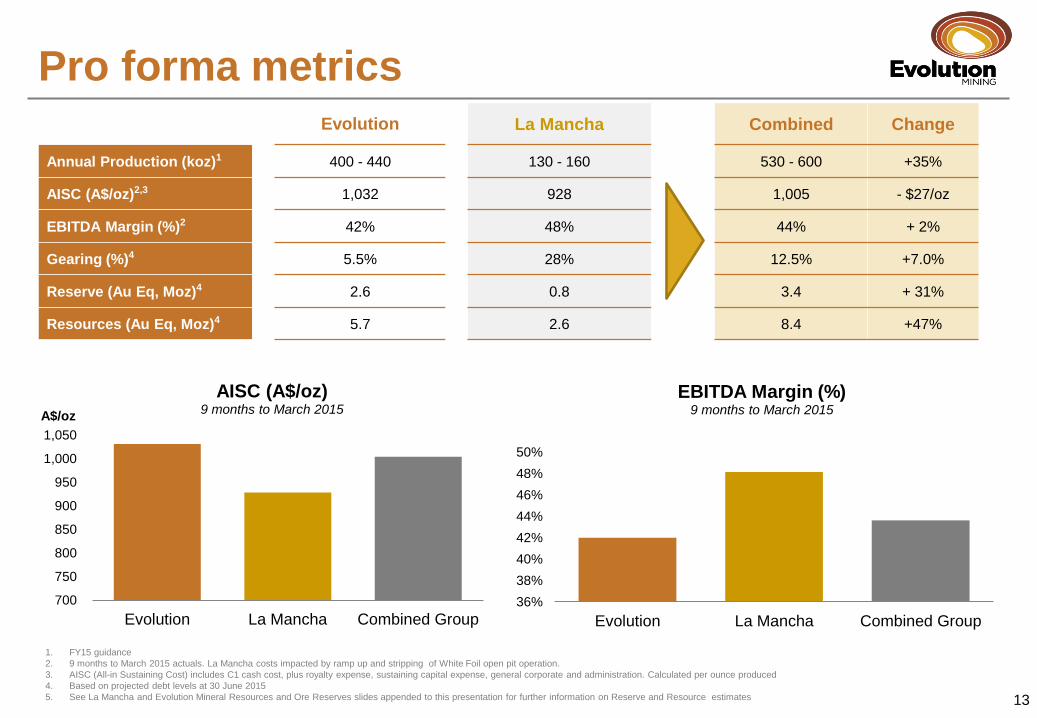
Pro forma metrics
13
Evolution La Mancha Combined Change
Annual Production (koz)1 400 - 440 130 - 160 530 - 600 +35%
AISC (A$/oz)2,3 1,032 928 1,005 - $27/oz
EBITDA Margin (%)2 42% 48% 44% + 2%
Gearing (%)4 5.5% 28% 12.5% +7.0%
Reserve (Au Eq, Moz)4 2.6 0.8 3.4 + 31%
Resources (Au Eq, Moz)4 5.7 2.6 8.4 +47%
1. FY15 guidance
2. 9 months to March 2015 actuals. La Mancha costs impacted by ramp up and stripping of White Foil open pit operation.
3. AISC (All-in Sustaining Cost) includes C1 cash cost, plus royalty expense, sustaining capital expense, general corporate and administration. Calculated per ounce produced
4. Based on projected debt levels at 30 June 2015
5. See La Mancha and Evolution Mineral Resources and Ore Reserves slides appended to this presentation for further information on Reserve and Resource estimates
700
750
800
850
900
950
1,000
1,050
Evolution La Mancha Combined Group
A$/oz
AISC (A$/oz) 9 months to March 2015
36%
38%
40%
42%
44%
46%
48%
50%
Evolution La Mancha Combined Group
EBITDA Margin (%) 9 months to March 2015
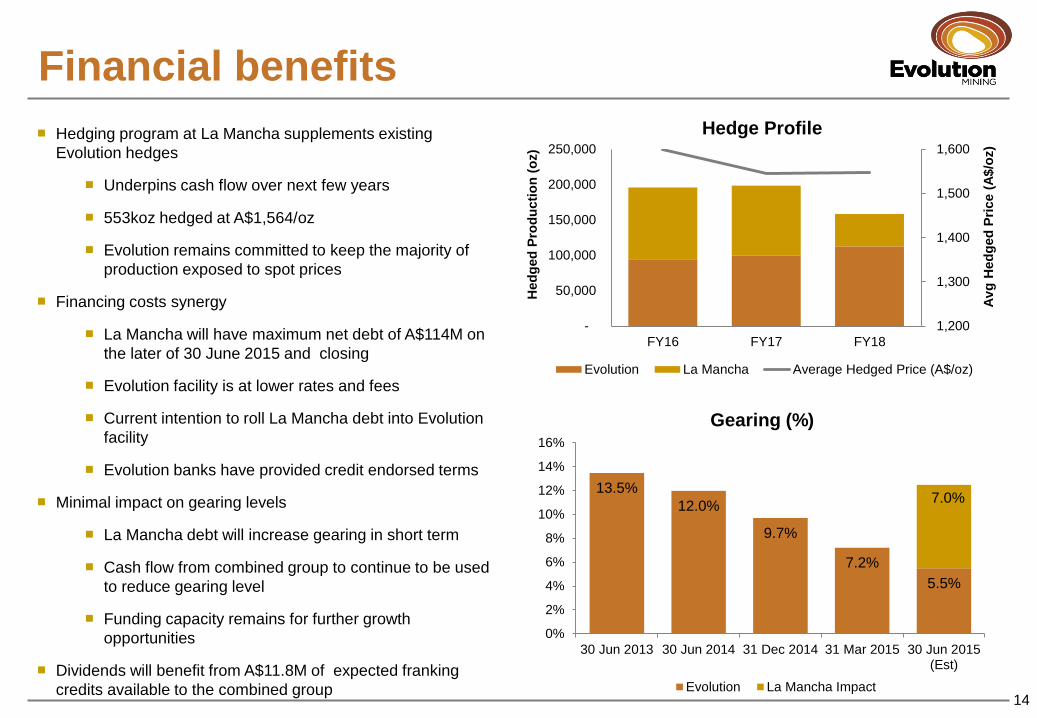
Financial benefits
14
Hedging program at La Mancha supplements existing
Evolution hedges
Underpins cash flow over next few years
553koz hedged at A$1,564/oz
Evolution remains committed to keep the majority of
production exposed to spot prices
Financing costs synergy
La Mancha will have maximum net debt of A$114M on
the later of 30 June 2015 and closing
Evolution facility is at lower rates and fees
Current intention to roll La Mancha debt into Evolution
facility
Evolution banks have provided credit endorsed terms
Minimal impact on gearing levels
La Mancha debt will increase gearing in short term
Cash flow from combined group to continue to be used
to reduce gearing level
Funding capacity remains for further growth
opportunities
Dividends will benefit from A$11.8M of expected franking
credits available to the combined group
1,200
1,300
1,400
1,500
1,600
-
50,000
100,000
150,000
200,000
250,000
FY16 FY17 FY18
Av
g H
ed
ged
Pri
ce (
A$/o
z)
Hed
ged
Pro
du
cti
on
(o
z)
Hedge Profile
Evolution La Mancha Average Hedged Price (A$/oz)
13.5%
12.0%
9.7%
7.2%
5.5%
7.0%
0%
2%
4%
6%
8%
10%
12%
14%
16%
30 Jun 2013 30 Jun 2014 31 Dec 2014 31 Mar 2015 30 Jun 2015(Est)
Gearing (%)
Evolution La Mancha Impact
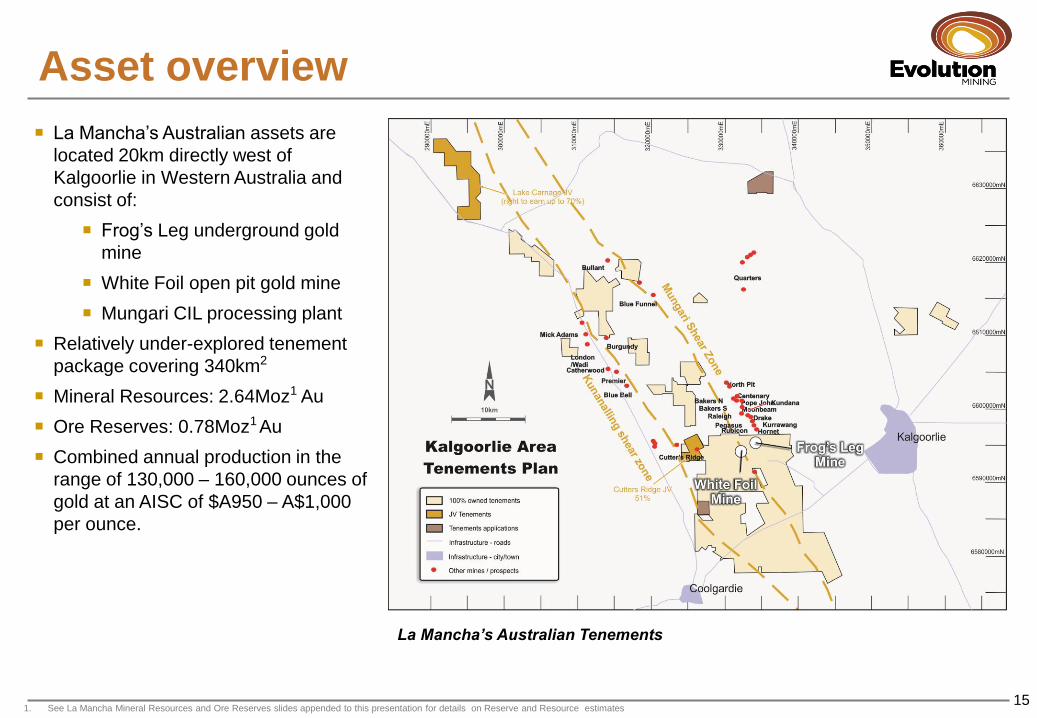
Asset overview
15
La Mancha’s Australian assets are
located 20km directly west of
Kalgoorlie in Western Australia and
consist of:
Frog’s Leg underground gold
mine
White Foil open pit gold mine
Mungari CIL processing plant
Relatively under-explored tenement
package covering 340km2
Mineral Resources: 2.64Moz1 Au
Ore Reserves: 0.78Moz1 Au
Combined annual production in the
range of 130,000 – 160,000 ounces of
gold at an AISC of $A950 – A$1,000
per ounce.
La Mancha’s Australian Tenements
1. See La Mancha Mineral Resources and Ore Reserves slides appended to this presentation for details on Reserve and Resource estimates
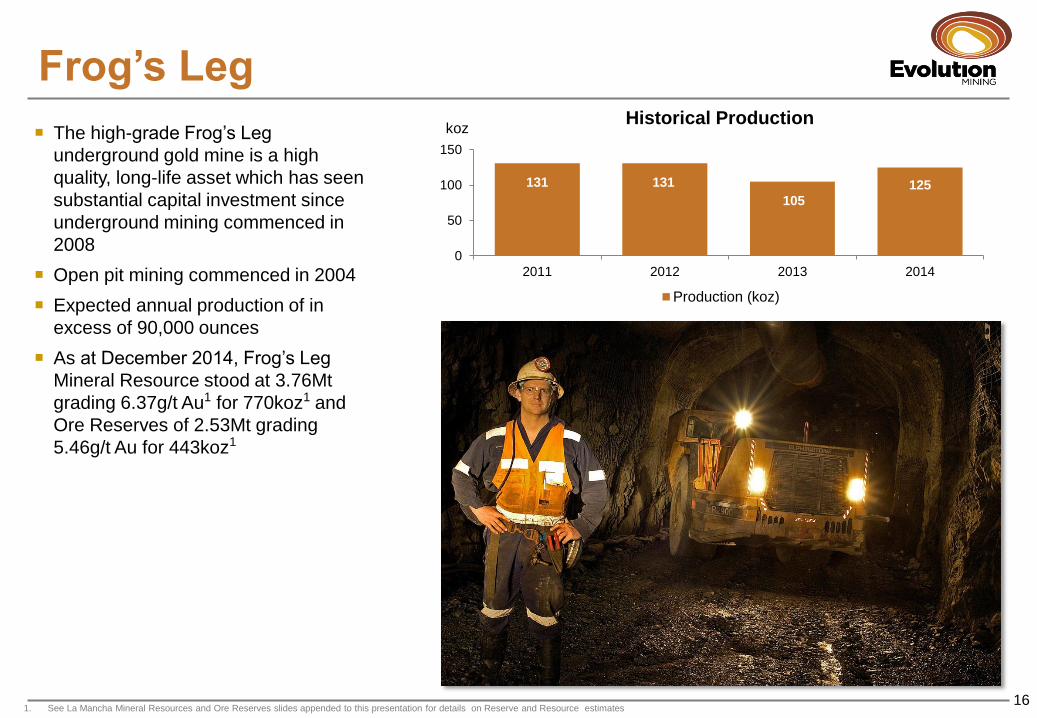
Frog’s Leg
16
The high-grade Frog’s Leg
underground gold mine is a high
quality, long-life asset which has seen
substantial capital investment since
underground mining commenced in
2008
Open pit mining commenced in 2004
Expected annual production of in
excess of 90,000 ounces
As at December 2014, Frog’s Leg
Mineral Resource stood at 3.76Mt
grading 6.37g/t Au1 for 770koz1 and
Ore Reserves of 2.53Mt grading
5.46g/t Au for 443koz1
131 131
105
125
0
50
100
150
2011 2012 2013 2014
koz Historical Production
Production (koz)
1. See La Mancha Mineral Resources and Ore Reserves slides appended to this presentation for details on Reserve and Resource estimates
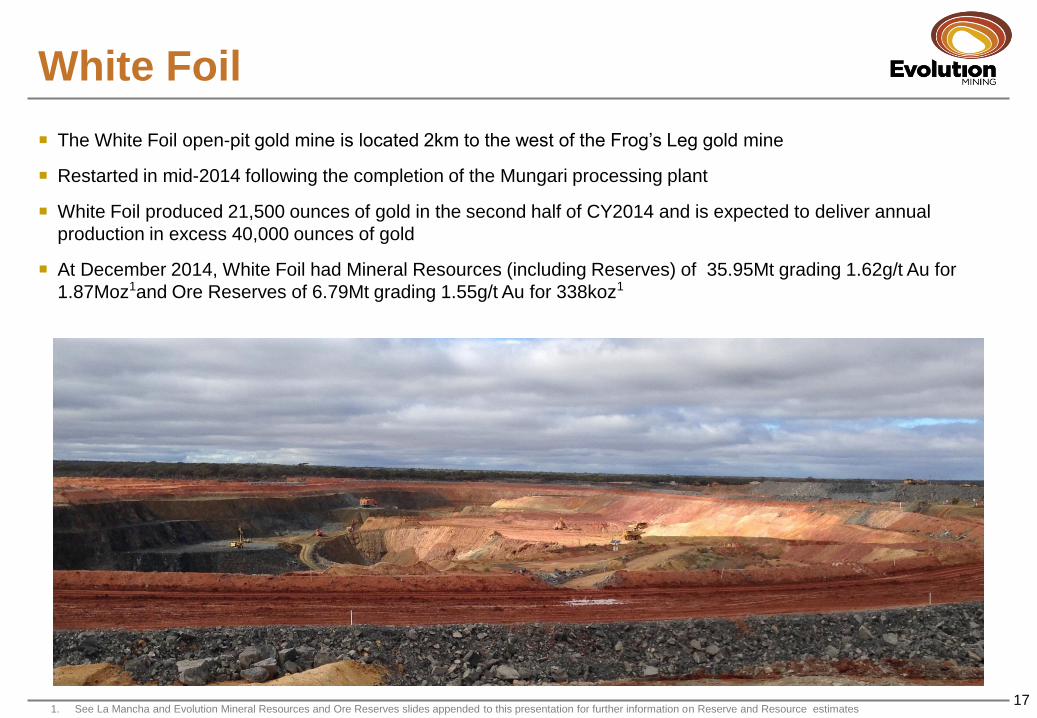
White Foil
17
The White Foil open-pit gold mine is located 2km to the west of the Frog’s Leg gold mine
Restarted in mid-2014 following the completion of the Mungari processing plant
White Foil produced 21,500 ounces of gold in the second half of CY2014 and is expected to deliver annual
production in excess 40,000 ounces of gold
At December 2014, White Foil had Mineral Resources (including Reserves) of 35.95Mt grading 1.62g/t Au for
1.87Moz1and Ore Reserves of 6.79Mt grading 1.55g/t Au for 338koz1
1. See La Mancha and Evolution Mineral Resources and Ore Reserves slides appended to this presentation for further information on Reserve and Resource estimates
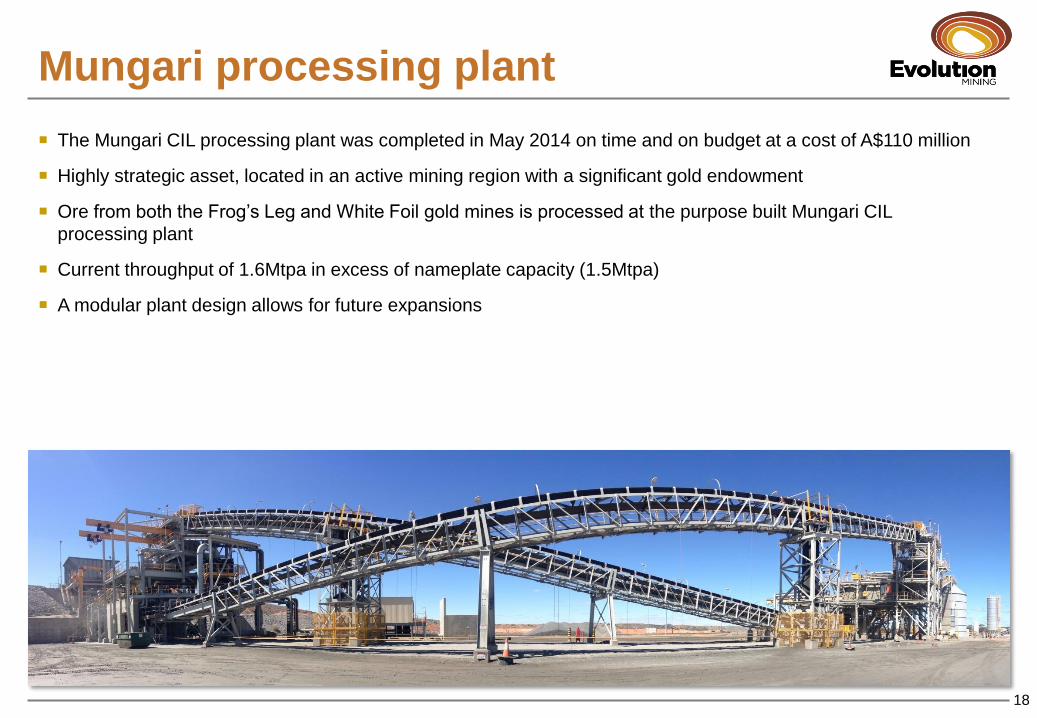
Mungari processing plant
18
The Mungari CIL processing plant was completed in May 2014 on time and on budget at a cost of A$110 million
Highly strategic asset, located in an active mining region with a significant gold endowment
Ore from both the Frog’s Leg and White Foil gold mines is processed at the purpose built Mungari CIL
processing plant
Current throughput of 1.6Mtpa in excess of nameplate capacity (1.5Mtpa)
A modular plant design allows for future expansions
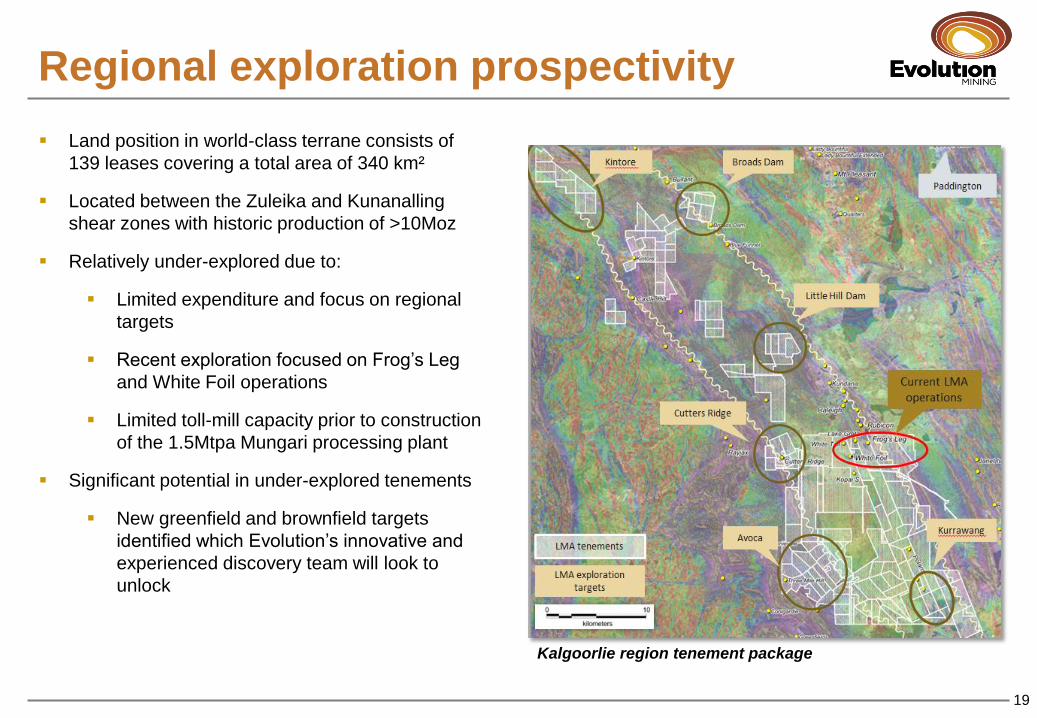
Regional exploration prospectivity
19
Land position in world-class terrane consists of
139 leases covering a total area of 340 km²
Located between the Zuleika and Kunanalling
shear zones with historic production of >10Moz
Relatively under-explored due to:
Limited expenditure and focus on regional
targets
Recent exploration focused on Frog’s Leg
and White Foil operations
Limited toll-mill capacity prior to construction
of the 1.5Mtpa Mungari processing plant
Significant potential in under-explored tenements
New greenfield and brownfield targets
identified which Evolution’s innovative and
experienced discovery team will look to
unlock
Kalgoorlie region tenement package
The Evolution value proposition
20
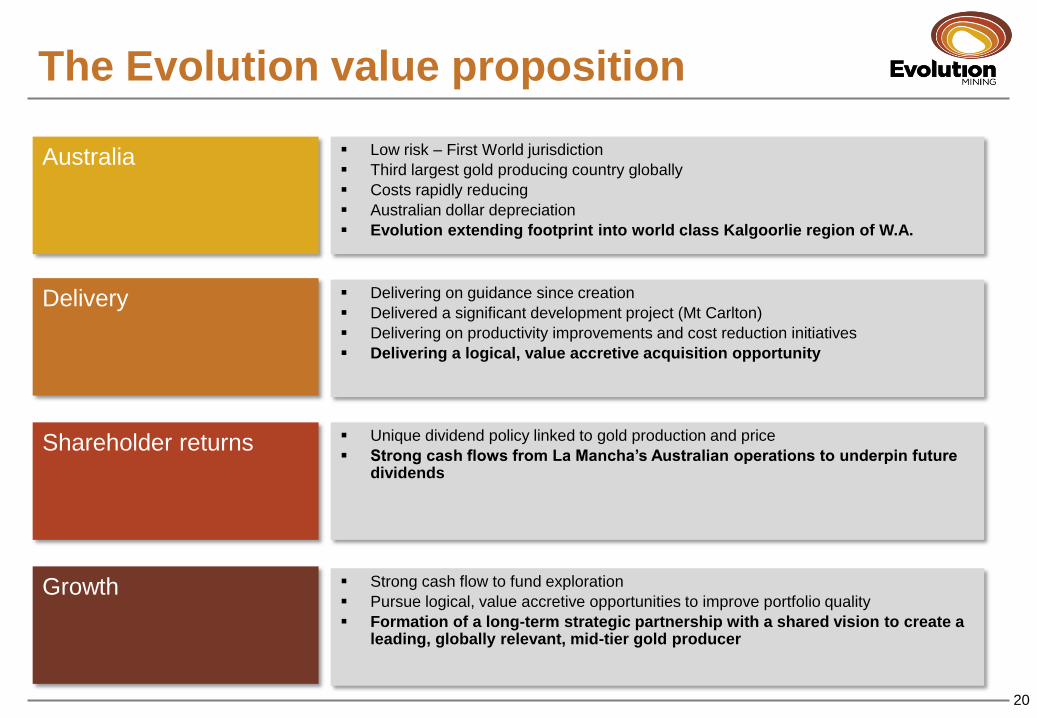
Australia
Delivery Delivering on guidance since creation
Delivered a significant development project (Mt Carlton)
Delivering on productivity improvements and cost reduction initiatives
Delivering a logical, value accretive acquisition opportunity
Shareholder returns Unique dividend policy linked to gold production and price
Strong cash flows from La Mancha’s Australian operations to underpin future dividends
Growth Strong cash flow to fund exploration
Pursue logical, value accretive opportunities to improve portfolio quality
Formation of a long-term strategic partnership with a shared vision to create a leading, globally relevant, mid-tier gold producer
Low risk – First World jurisdiction
Third largest gold producing country globally
Costs rapidly reducing
Australian dollar depreciation
Evolution extending footprint into world class Kalgoorlie region of W.A.
Evolution Mining ASX Code: EVN
www.evolutionmining.com.au
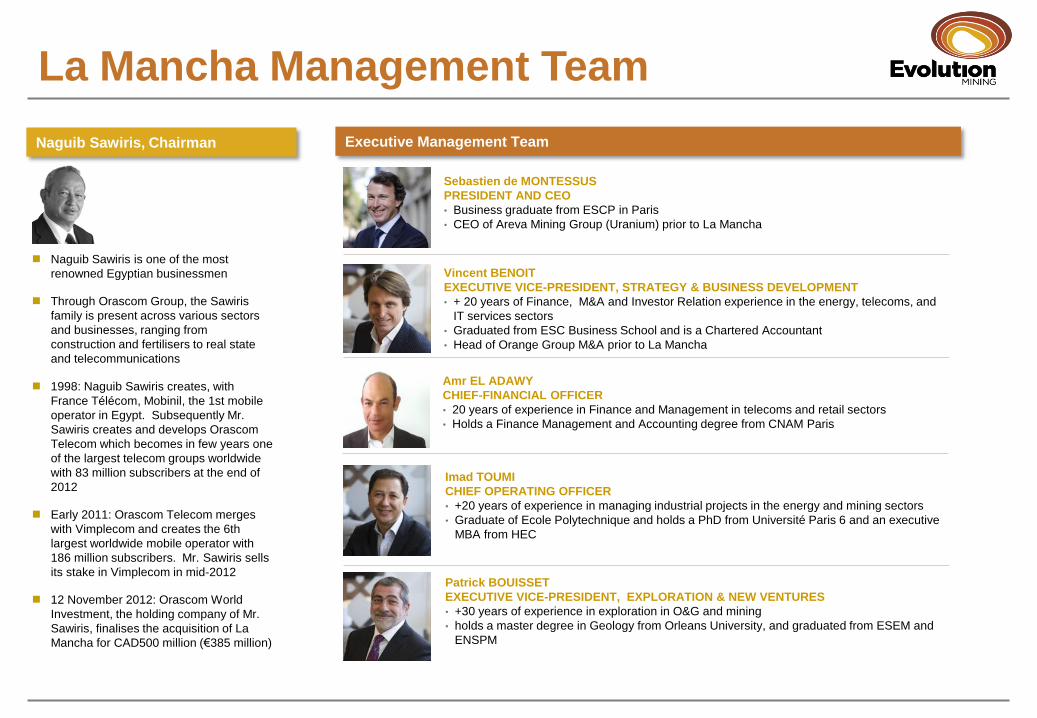
La Mancha Management Team
Executive Management Team
Naguib Sawiris is one of the most
renowned Egyptian businessmen
Through Orascom Group, the Sawiris
family is present across various sectors
and businesses, ranging from
construction and fertilisers to real state
and telecommunications
1998: Naguib Sawiris creates, with
France Télécom, Mobinil, the 1st mobile
operator in Egypt. Subsequently Mr.
Sawiris creates and develops Orascom
Telecom which becomes in few years one
of the largest telecom groups worldwide
with 83 million subscribers at the end of
2012
Early 2011: Orascom Telecom merges
with Vimplecom and creates the 6th
largest worldwide mobile operator with
186 million subscribers. Mr. Sawiris sells
its stake in Vimplecom in mid-2012
12 November 2012: Orascom World
Investment, the holding company of Mr.
Sawiris, finalises the acquisition of La
Mancha for CAD500 million (€385 million)
Vincent BENOIT
EXECUTIVE VICE-PRESIDENT, STRATEGY & BUSINESS DEVELOPMENT
• + 20 years of Finance, M&A and Investor Relation experience in the energy, telecoms, and
IT services sectors
• Graduated from ESC Business School and is a Chartered Accountant
• Head of Orange Group M&A prior to La Mancha
Patrick BOUISSET
EXECUTIVE VICE-PRESIDENT, EXPLORATION & NEW VENTURES
• +30 years of experience in exploration in O&G and mining
• holds a master degree in Geology from Orleans University, and graduated from ESEM and
ENSPM
Sebastien de MONTESSUS
PRESIDENT AND CEO
• Business graduate from ESCP in Paris
• CEO of Areva Mining Group (Uranium) prior to La Mancha
Imad TOUMI
CHIEF OPERATING OFFICER
• +20 years of experience in managing industrial projects in the energy and mining sectors
• Graduate of Ecole Polytechnique and holds a PhD from Université Paris 6 and an executive
MBA from HEC
Amr EL ADAWY
CHIEF-FINANCIAL OFFICER
• 20 years of experience in Finance and Management in telecoms and retail sectors
• Holds a Finance Management and Accounting degree from CNAM Paris
Naguib Sawiris, Chairman
Competent person statements
The information in this announcement that relates to Evolution’s Mineral Resources and Ore Reserves is extracted from the report
entitled “Annual Mineral Resources and Ore Reserves Statement” created on 25 June 2014 and is available to view at
www.evolutionmining.com.au. The Company confirms that it is not aware of any new information or data that materially affects the
information included in the original market announcement and that all material assumptions and technical parameters underpinning
the estimates in the relevant market announcement continue to apply and have not materially changed. The Company confirms that
the form and context in which the Competent Persons’ findings are presented have not been materially modified from the original
market announcement
Evolution is currently in the process of completing the estimation of its Mineral Resources and Ore Reserves as at December 2014
and expects to be able to release an updated MROR Statement in early May 2014
The information in this announcement that relates to La Mancha Australia’s Mineral Resources and Ore Reserves is extracted from
the release entitled “Evolution to Combine with La Mancha Resources Australia to Form a Leading Growth Focused Australian Gold
Producer” created on 20 April 2015 and is available to view at www.evolutionmining.com.au. The Company confirms that it is not
aware of any new information or data that materially affects the information included in the original market announcement and that all
material assumptions and technical parameters underpinning the estimates in the relevant market announcement continue to apply
and have not materially changed. The Company confirms that the form and context in which the Competent Persons’ findings are
presented have not been materially modified from the original market announcement
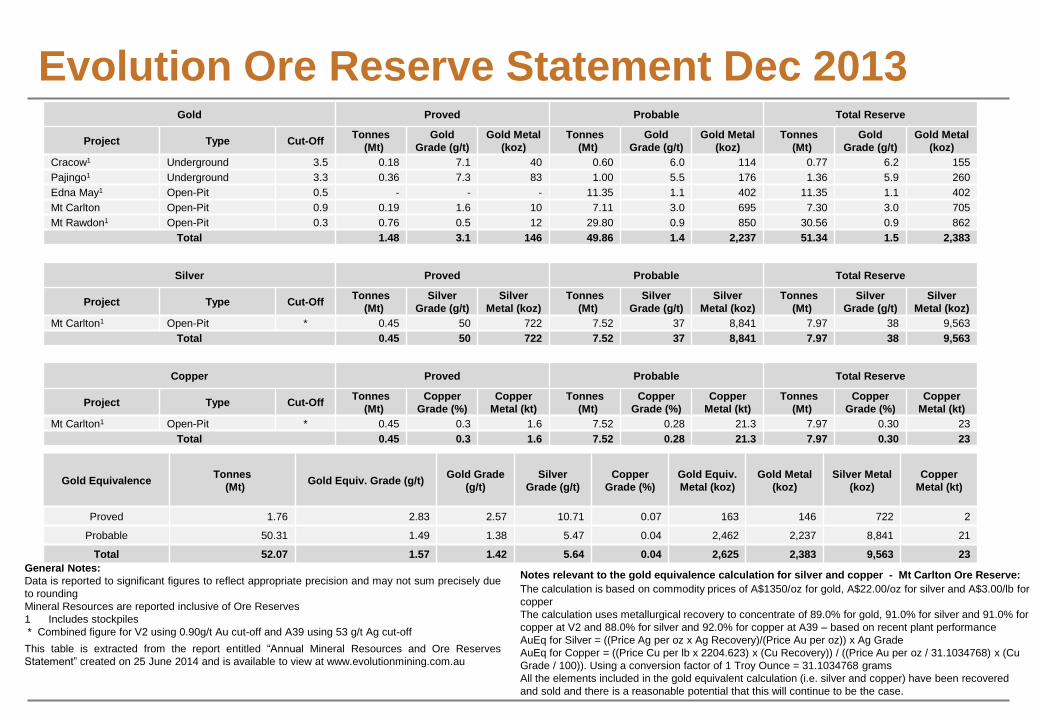
Notes relevant to the gold equivalence calculation for silver and copper - Mt Carlton Ore Reserve:
The calculation is based on commodity prices of A$1350/oz for gold, A$22.00/oz for silver and A$3.00/lb for
copper The calculation uses metallurgical recovery to concentrate of 89.0% for gold, 91.0% for silver and 91.0% for
copper at V2 and 88.0% for silver and 92.0% for copper at A39 – based on recent plant performance AuEq for Silver = ((Price Ag per oz x Ag Recovery)/(Price Au per oz)) x Ag Grade AuEq for Copper = ((Price Cu per lb x 2204.623) x (Cu Recovery)) / ((Price Au per oz / 31.1034768) x (Cu
Grade / 100)). Using a conversion factor of 1 Troy Ounce = 31.1034768 grams All the elements included in the gold equivalent calculation (i.e. silver and copper) have been recovered
and sold and there is a reasonable potential that this will continue to be the case.
Evolution Ore Reserve Statement Dec 2013
General Notes: Data is reported to significant figures to reflect appropriate precision and may not sum precisely due
to rounding
Mineral Resources are reported inclusive of Ore Reserves
1 Includes stockpiles
* Combined figure for V2 using 0.90g/t Au cut-off and A39 using 53 g/t Ag cut-off
This table is extracted from the report entitled “Annual Mineral Resources and Ore Reserves
Statement” created on 25 June 2014 and is available to view at www.evolutionmining.com.au
Gold Proved Probable Total Reserve
Project Type Cut-Off Tonnes
(Mt) Gold
Grade (g/t) Gold Metal
(koz) Tonnes
(Mt) Gold
Grade (g/t) Gold Metal
(koz) Tonnes
(Mt) Gold
Grade (g/t) Gold Metal
(koz)
Cracow1 Underground 3.5 0.18 7.1 40 0.60 6.0 114 0.77 6.2 155
Pajingo1 Underground 3.3 0.36 7.3 83 1.00 5.5 176 1.36 5.9 260
Edna May1 Open-Pit 0.5 - - - 11.35 1.1 402 11.35 1.1 402
Mt Carlton Open-Pit 0.9 0.19 1.6 10 7.11 3.0 695 7.30 3.0 705
Mt Rawdon1 Open-Pit 0.3 0.76 0.5 12 29.80 0.9 850 30.56 0.9 862
Total 1.48 3.1 146 49.86 1.4 2,237 51.34 1.5 2,383
Silver Proved Probable Total Reserve
Project Type Cut-Off Tonnes
(Mt) Silver
Grade (g/t) Silver
Metal (koz) Tonnes
(Mt) Silver
Grade (g/t) Silver
Metal (koz) Tonnes
(Mt) Silver
Grade (g/t) Silver
Metal (koz)
Mt Carlton1 Open-Pit * 0.45 50 722 7.52 37 8,841 7.97 38 9,563
Total 0.45 50 722 7.52 37 8,841 7.97 38 9,563
Copper Proved Probable Total Reserve
Project Type Cut-Off Tonnes
(Mt) Copper
Grade (%) Copper
Metal (kt) Tonnes
(Mt) Copper
Grade (%) Copper
Metal (kt) Tonnes
(Mt) Copper
Grade (%) Copper
Metal (kt)
Mt Carlton1 Open-Pit * 0.45 0.3 1.6 7.52 0.28 21.3 7.97 0.30 23
Total 0.45 0.3 1.6 7.52 0.28 21.3 7.97 0.30 23
Gold Equivalence Tonnes
(Mt) Gold Equiv. Grade (g/t)
Gold Grade
(g/t) Silver
Grade (g/t) Copper
Grade (%) Gold Equiv.
Metal (koz) Gold Metal
(koz) Silver Metal
(koz) Copper
Metal (kt)
Proved 1.76 2.83 2.57 10.71 0.07 163 146 722 2
Probable 50.31 1.49 1.38 5.47 0.04 2,462 2,237 8,841 21
Total 52.07 1.57 1.42 5.64 0.04 2,625 2,383 9,563 23
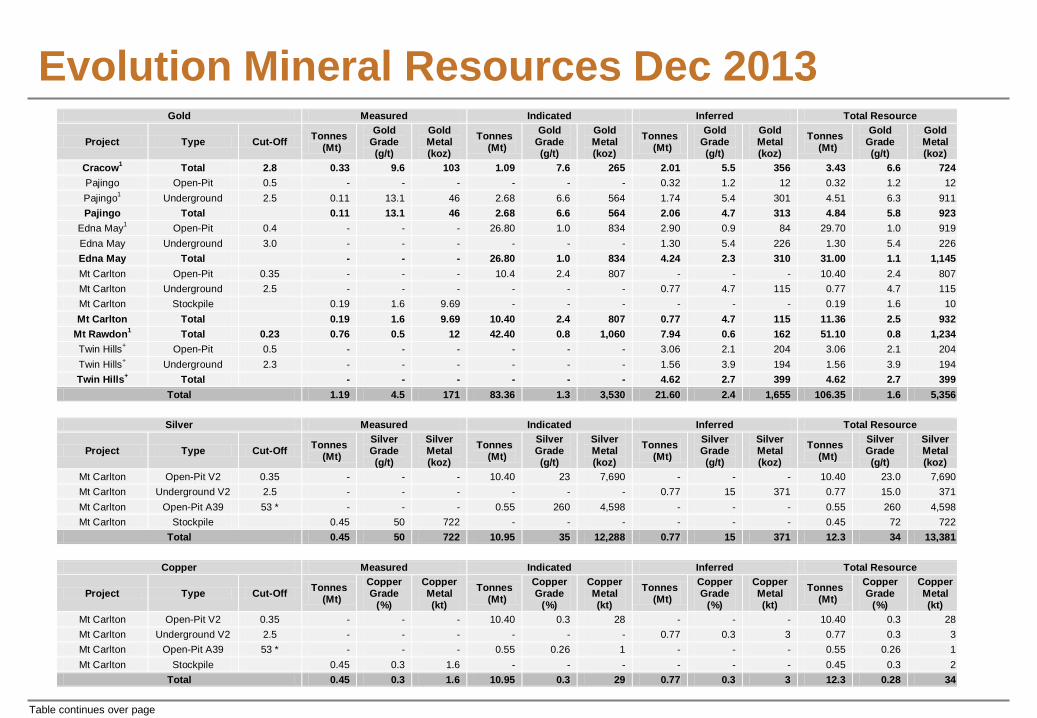
Evolution Mineral Resources Dec 2013
Table continues over page
Gold Measured Indicated Inferred Total Resource
Project Type Cut-Off Tonnes
(Mt)
Gold Grade (g/t)
Gold Metal (koz)
Tonnes (Mt)
Gold Grade (g/t)
Gold Metal (koz)
Tonnes (Mt)
Gold Grade (g/t)
Gold Metal (koz)
Tonnes (Mt)
Gold Grade (g/t)
Gold Metal (koz)
Cracow1 Total 2.8 0.33 9.6 103 1.09 7.6 265 2.01 5.5 356 3.43 6.6 724
Pajingo Open-Pit 0.5 - - - - - - 0.32 1.2 12 0.32 1.2 12
Pajingo1 Underground 2.5 0.11 13.1 46 2.68 6.6 564 1.74 5.4 301 4.51 6.3 911
Pajingo Total 0.11 13.1 46 2.68 6.6 564 2.06 4.7 313 4.84 5.8 923
Edna May1 Open-Pit 0.4 - - - 26.80 1.0 834 2.90 0.9 84 29.70 1.0 919
Edna May Underground 3.0 - - - - - - 1.30 5.4 226 1.30 5.4 226
Edna May Total - - - 26.80 1.0 834 4.24 2.3 310 31.00 1.1 1,145
Mt Carlton Open-Pit 0.35 - - - 10.4 2.4 807 - - - 10.40 2.4 807
Mt Carlton Underground 2.5 - - - - - - 0.77 4.7 115 0.77 4.7 115
Mt Carlton Stockpile 0.19 1.6 9.69 - - - - - - 0.19 1.6 10
Mt Carlton Total 0.19 1.6 9.69 10.40 2.4 807 0.77 4.7 115 11.36 2.5 932
Mt Rawdon1 Total 0.23 0.76 0.5 12 42.40 0.8 1,060 7.94 0.6 162 51.10 0.8 1,234
Twin Hills+ Open-Pit 0.5 - - - - - - 3.06 2.1 204 3.06 2.1 204
Twin Hills+
Underground 2.3 - - - - - - 1.56 3.9 194 1.56 3.9 194
Twin Hills+
Total - - - - - - 4.62 2.7 399 4.62 2.7 399
Total 1.19 4.5 171 83.36 1.3 3,530 21.60 2.4 1,655 106.35 1.6 5,356
Silver Measured Indicated Inferred Total Resource
Project Type Cut-Off Tonnes
(Mt)
Silver Grade (g/t)
Silver Metal (koz)
Tonnes (Mt)
Silver Grade (g/t)
Silver Metal (koz)
Tonnes (Mt)
Silver Grade (g/t)
Silver Metal (koz)
Tonnes (Mt)
Silver Grade (g/t)
Silver Metal (koz)
Mt Carlton Open-Pit V2 0.35 - - - 10.40 23 7,690 - - - 10.40 23.0 7,690
Mt Carlton Underground V2 2.5 - - - - - - 0.77 15 371 0.77 15.0 371
Mt Carlton Open-Pit A39 53 * - - - 0.55 260 4,598 - - - 0.55 260 4,598
Mt Carlton Stockpile 0.45 50 722 - - - - - - 0.45 72 722
Total 0.45 50 722 10.95 35 12,288 0.77 15 371 12.3 34 13,381
Copper Measured Indicated Inferred Total Resource
Project Type Cut-Off Tonnes
(Mt)
Copper Grade
(%)
Copper Metal (kt)
Tonnes (Mt)
Copper Grade
(%)
Copper Metal (kt)
Tonnes (Mt)
Copper Grade
(%)
Copper Metal (kt)
Tonnes (Mt)
Copper Grade
(%)
Copper Metal (kt)
Mt Carlton Open-Pit V2 0.35 - - - 10.40 0.3 28 - - - 10.40 0.3 28
Mt Carlton Underground V2 2.5 - - - - - - 0.77 0.3 3 0.77 0.3 3
Mt Carlton Open-Pit A39 53 * - - - 0.55 0.26 1 - - - 0.55 0.26 1
Mt Carlton Stockpile 0.45 0.3 1.6 - - - - - - 0.45 0.3 2
Total 0.45 0.3 1.6 10.95 0.3 29 0.77 0.3 3 12.3 0.28 34

Evolution Mineral Resources Dec 2013
General Notes:
Data is reported to significant figures to reflect appropriate precision and may not sum precisely due to rounding Mineral Resources are reported inclusive of Ore Reserves 1 Includes stockpiles * Ag cut-off for A39 + Twin Hills has not changed as it is being reported as 2004 JORC Code
Notes relevant to the gold equivalence calculation for silver and copper in the Mt Carlton Mineral Resource:
The calculation is based on commodity prices of A$1350/oz for gold, A$22.00/oz for silver and A$3.00/lb for copper The calculation uses metallurgical recovery to concentrate of 89.0% for gold, 91.0% for silver and 91.0% for copper at V2 and 88.0% for silver and 92.0% for copper at A39 – based on recent plant
performance AuEq for Silver = ((Price Ag per oz x Ag Recovery)/(Price Au per oz)) x Ag Grade AuEq for Copper = ((Price Cu per lb x 2204.623) x (Cu Recovery)) / ((Price Au per oz / 31.1034768) x (Cu Grade / 100)). Using a conversion factor of 1 Troy Ounce = 31.1034768 grams All the elements included in the gold equivalent calculation (i.e. silver and copper) have been recovered and sold and there is a reasonable potential that this will continue to be the case
This table is extracted from the report entitled “Annual Mineral Resources and Ore Reserves Statement” created on 25 June 2014 and is available to view at www.evolutionmining.com.au
Continued from pervious slide
Gold Equivalence Tonnes
(Mt) Gold Equiv.
Grade (g/t) Gold Grade
(g/t) Silver Grade
(g/t) Copper Grade
(%)
Gold Equiv.
Metal (koz)
Gold Metal (koz)
Silver Metal
(koz) Copper Metal
(kt)
Measured 1.45 3.97 3.66 13.00 0.09 185 171 722 2
Indicated 83.91 1.40 1.31 4.55 0.04 3,843 3,530 12,288 29
Inferred 21.60 2.41 2.38 0.53 0.01 1,672 1,655 371 3
Total 106.96 1.66 1.56 3.86 0.03 5,700 5,356 13,381 35
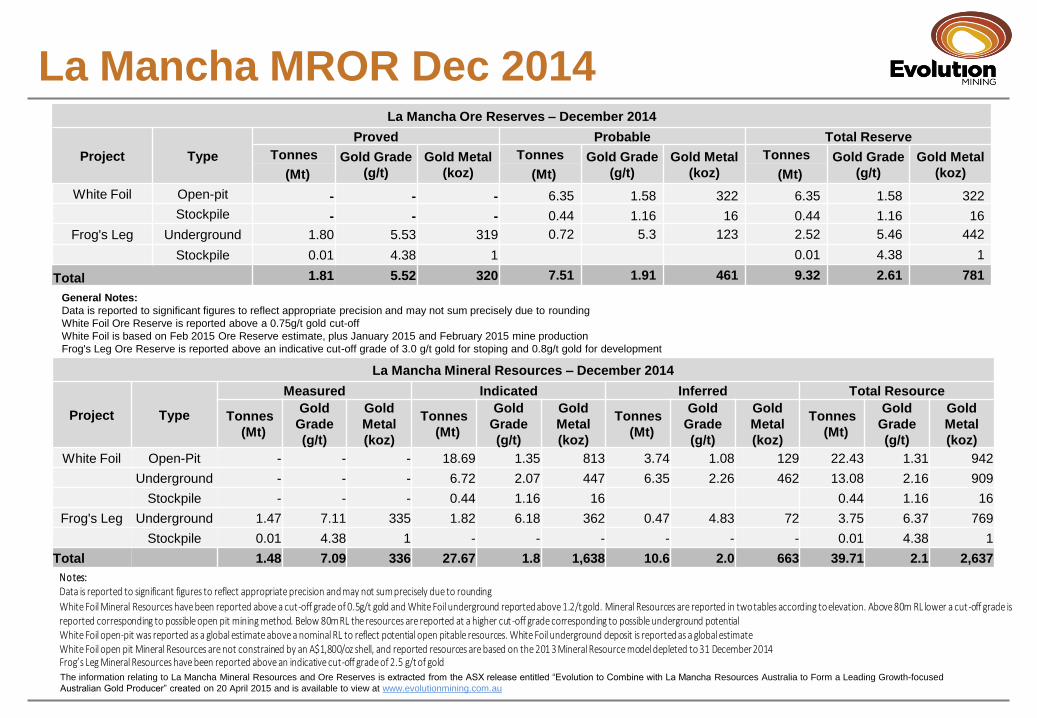
La Mancha MROR Dec 2014 La Mancha Ore Reserves – December 2014
Project Type
Proved Probable Total Reserve
Tonnes Gold Grade
(g/t)
Gold Metal
(koz)
Tonnes Gold Grade
(g/t)
Gold Metal
(koz)
Tonnes Gold Grade
(g/t)
Gold Metal
(koz) (Mt) (Mt) (Mt)
White Foil Open-pit - - - 6.35 1.58 322 6.35 1.58 322
Stockpile - - - 0.44 1.16 16 0.44 1.16 16
Frog's Leg Underground 1.80 5.53 319 0.72 5.3 123 2.52 5.46 442
Stockpile 0.01 4.38 1 0.01 4.38 1
Total 1.81 5.52 320 7.51 1.91 461 9.32 2.61 781
General Notes:
Data is reported to significant figures to reflect appropriate precision and may not sum precisely due to rounding
White Foil Ore Reserve is reported above a 0.75g/t gold cut-off
White Foil is based on Feb 2015 Ore Reserve estimate, plus January 2015 and February 2015 mine production
Frog's Leg Ore Reserve is reported above an indicative cut-off grade of 3.0 g/t gold for stoping and 0.8g/t gold for development
La Mancha Mineral Resources – December 2014
Project Type
Measured Indicated Inferred Total Resource
Tonnes
(Mt)
Gold
Grade
(g/t)
Gold
Metal
(koz)
Tonnes
(Mt)
Gold
Grade
(g/t)
Gold
Metal
(koz)
Tonnes
(Mt)
Gold
Grade
(g/t)
Gold
Metal
(koz)
Tonnes
(Mt)
Gold
Grade
(g/t)
Gold
Metal
(koz)
White Foil Open-Pit - - - 18.69 1.35 813 3.74 1.08 129 22.43 1.31 942
Underground - - - 6.72 2.07 447 6.35 2.26 462 13.08 2.16 909
Stockpile - - - 0.44 1.16 16 0.44 1.16 16
Frog's Leg Underground 1.47 7.11 335 1.82 6.18 362 0.47 4.83 72 3.75 6.37 769
Stockpile 0.01 4.38 1 - - - - - - 0.01 4.38 1
Total 1.48 7.09 336 27.67 1.8 1,638 10.6 2.0 663 39.71 2.1 2,637
The information relating to La Mancha Mineral Resources and Ore Reserves is extracted from the ASX release entitled “Evolution to Combine with La Mancha Resources Australia to Form a Leading Growth-focused
Australian Gold Producer” created on 20 April 2015 and is available to view at www.evolutionmining.com.au
Notes: Data is reported to significant figures to reflect appropriate precision and may not sum precisely due to rounding White Foil Mineral Resources have been reported above a cut-off grade of 0.5g/t gold and White Foil underground reported above 1.2/t gold. Mineral Resources are reported in two tables according to elevation. Above 80m RL lower a cut-off grade is reported corresponding to possible open pit mining method. Below 80m RL the resources are reported at a higher cut -off grade corresponding to possible underground potential White Foil open-pit was reported as a global estimate above a nominal RL to reflect potential open pitable resources. White Foil underground deposit is reported as a global estimate White Foil open pit Mineral Resources are not constrained by an A$1,800/oz shell, and reported resources are based on the 201 3 Mineral Resource model depleted to 31 December 2014 Frog’s Leg Mineral Resources have been reported above an indicative cut-off grade of 2.5 g/t of gold