Embed Size (px)
Citation preview
1
Evolution of FMDV during persistence in African buffalo (Syncerus caffer) Martí Cortey1, Francois Maree2, Lin-Mari de Klerk-Lorist3, Eva Pérez1, Fuquan Zhang1, Louis van Schalkwyk3, Dave Cooper4, Roy Bengis4, Bryan Charleston1, Nick Juleff1
1Viral Immunology Group, The Pirbright Institute, UK 2Onderstepoort Veterinary Institute-Transboundary Animal Diseases Programme, Onderstepoort, South Africa 3State Veterinary Services, Skukuza, South Africa 4Ezemvelo KZN Wildlife, St Lucia, South Africa

2
Previous knowledge (Juleff et al. 2008, 2012)
• FMDV is maintained in the light zone of GCs
• Likely in association with FDCs
• Non-replicating state (viral capsid and genome, no NSP)
• This finding could explain FMDV persistence despite the high level
of neutralising antibody
Is this a mechanism for FMDV persistence? Immune complexed FMDV is able to infect FcR expressing cells ex vivo and in vitro. Potential for low-level replication (macrophages, B cells, DCs?)

3
African buffalo study

4
Virus isolation and real-time qRT-PCR

5
VNT: homologous and heterologous neutralization
All animals are protected (from day 14 to day 400 pi) against all virus isolates, Ab titers > 45 (log2= 5.5).[ No immune escape]
6
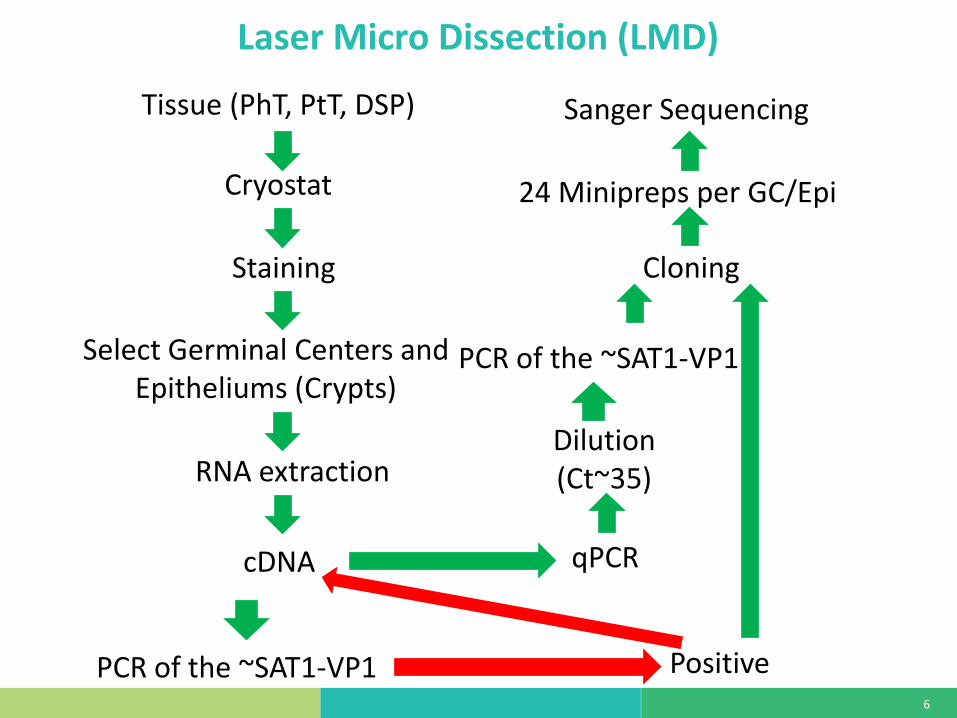
Laser Micro Dissection (LMD)
Tissue (PhT, PtT, DSP)
Cryostat
Staining
Select Germinal Centers and Epitheliums (Crypts)
PCR of the ~SAT1-VP1
cDNA
Positive
qPCR
Dilution (Ct~35) RNA extraction
PCR of the ~SAT1-VP1
24 Minipreps per GC/Epi
Cloning
Sanger Sequencing
7
Nucleotide Diversity (π)
π: average number of nucleotide differences per site between any two DNA sequences chosen randomly from the sample population
8
Nucleotide Diversity (π)
π: average number of nucleotide differences per site between any two DNA sequences chosen randomly from the sample population
9
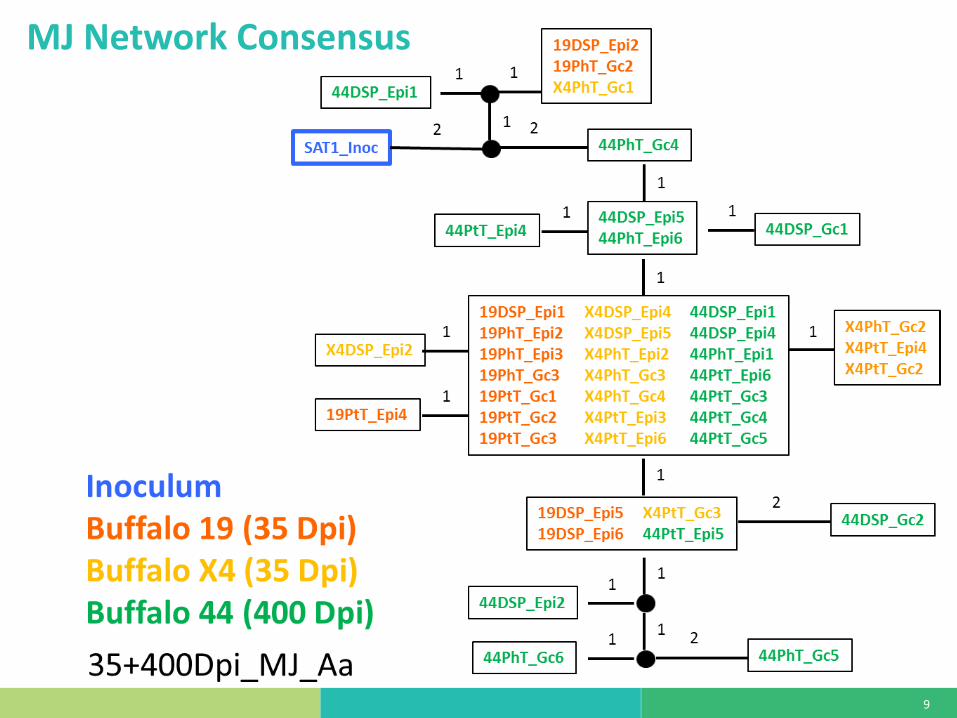
MJ Network Consensus
10
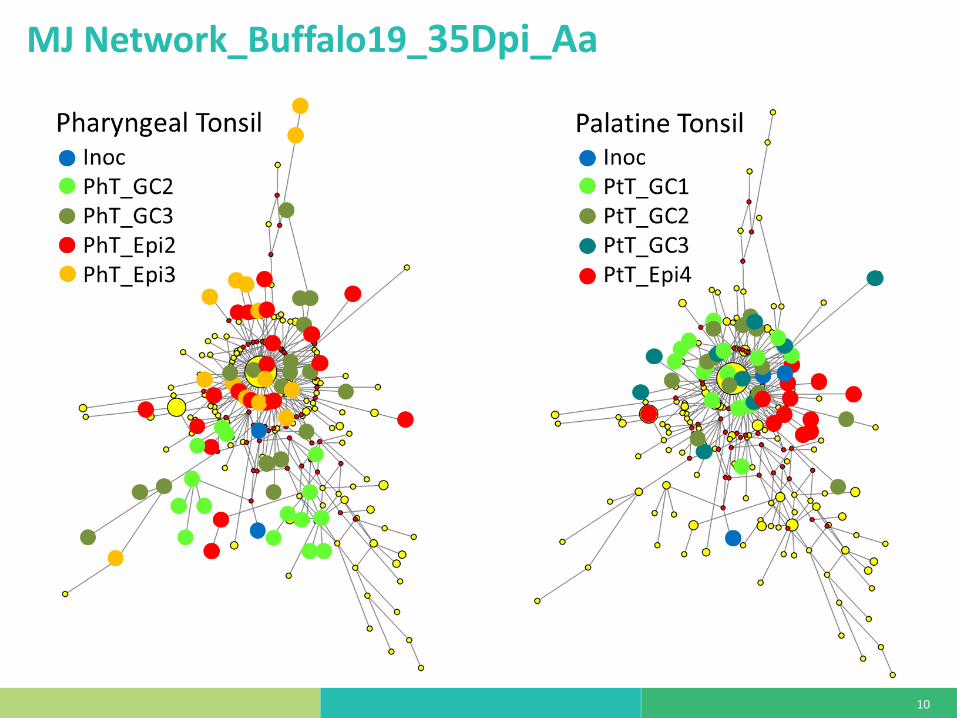
MJ Network_Buffalo19_35Dpi_Aa

11
MJ Network_Buffalo44_400Dpi_Aa
12
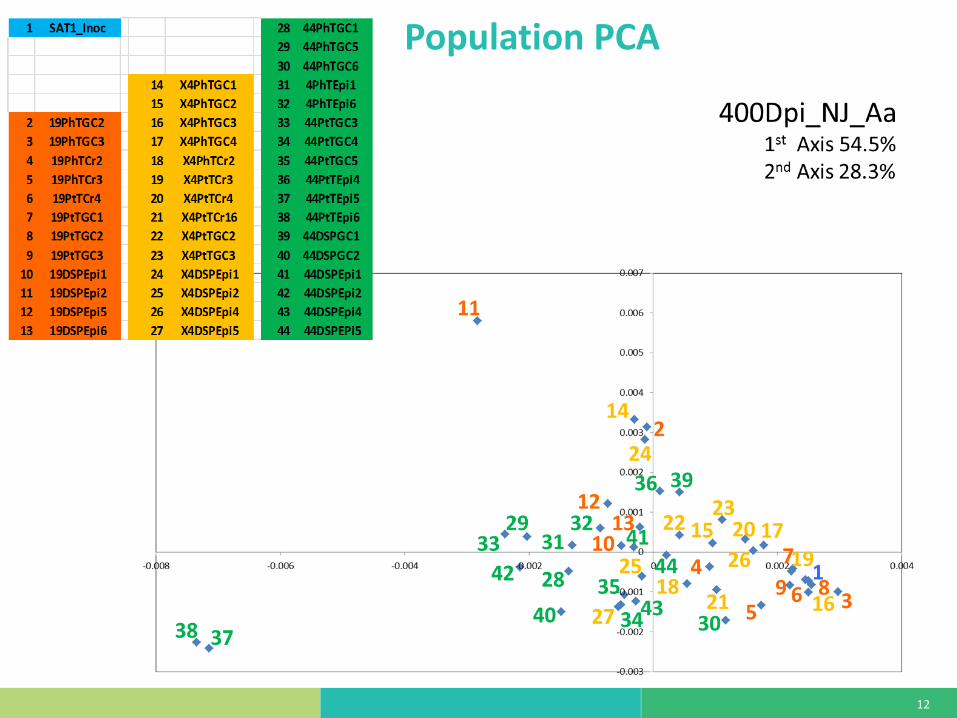
Population PCA

13
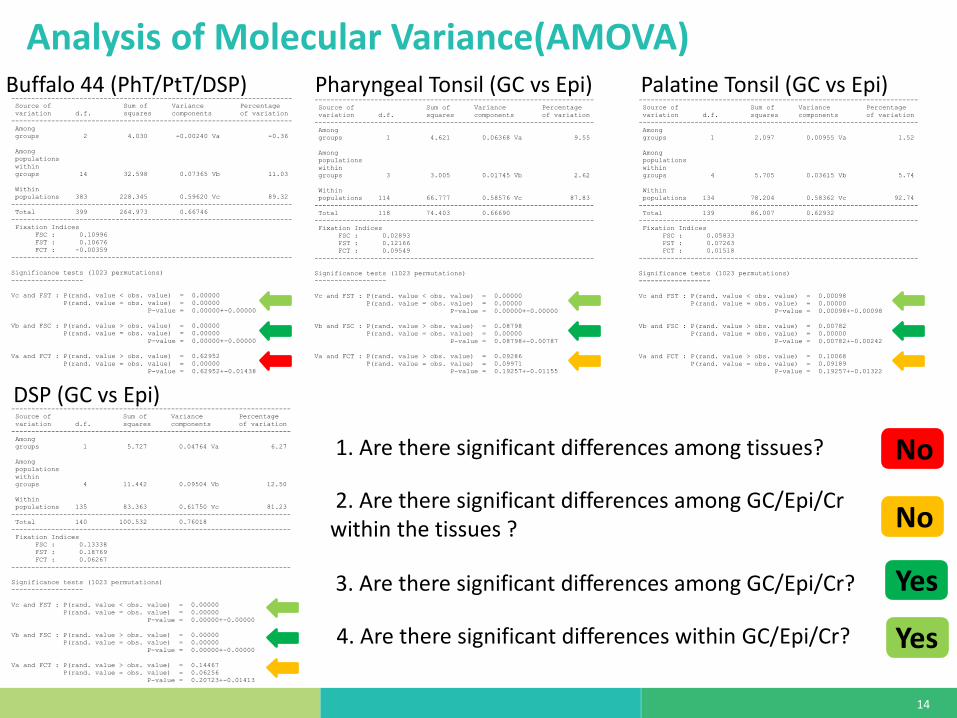
Analysis of Molecular Variance(AMOVA)
Buffalo 19 (PhT/PtT/DSP)
1. Are there significant differences among tissues?
Pharyngeal Tonsil (GC vs Epi) Palatine Tonsil (GC vs Epi)
2. Are there significant differences among GC/Epi/Cr within the tissues ?
3. Are there significant differences among GC/Epi/Cr
No
Yes
Yes 4. Are there significant differences within GC/Epi/Cr?
No
14
Analysis of Molecular Variance(AMOVA)
----------------------------------------------------------------------
Source of Sum of Variance Percentage
variation d.f. squares components of variation
----------------------------------------------------------------------
Among
groups 1 2.097 0.00955 Va 1.52
Among
populations
within
groups 4 5.705 0.03615 Vb 5.74
Within
populations 134 78.204 0.58362 Vc 92.74
----------------------------------------------------------------------
Total 139 86.007 0.62932
----------------------------------------------------------------------
Fixation Indices
FSC : 0.05833
FST : 0.07263
FCT : 0.01518
----------------------------------------------------------------------
Significance tests (1023 permutations)
------------------
Vc and FST : P(rand. value < obs. value) = 0.00098
P(rand. value = obs. value) = 0.00000
P-value = 0.00098+-0.00098
Vb and FSC : P(rand. value > obs. value) = 0.00782
P(rand. value = obs. value) = 0.00000
P-value = 0.00782+-0.00242
Va and FCT : P(rand. value > obs. value) = 0.10068
P(rand. value = obs. value) = 0.09189
P-value = 0.19257+-0.01322
----------------------------------------------------------------------
Source of Sum of Variance Percentage
variation d.f. squares components of variation
----------------------------------------------------------------------
Among
groups 2 4.030 -0.00240 Va -0.36
Among
populations
within
groups 14 32.598 0.07365 Vb 11.03
Within
populations 383 228.345 0.59620 Vc 89.32
----------------------------------------------------------------------
Total 399 264.973 0.66746
----------------------------------------------------------------------
Fixation Indices
FSC : 0.10996
FST : 0.10676
FCT : -0.00359
----------------------------------------------------------------------
Significance tests (1023 permutations)
------------------
Vc and FST : P(rand. value < obs. value) = 0.00000
P(rand. value = obs. value) = 0.00000
P-value = 0.00000+-0.00000
Vb and FSC : P(rand. value > obs. value) = 0.00000
P(rand. value = obs. value) = 0.00000
P-value = 0.00000+-0.00000
Va and FCT : P(rand. value > obs. value) = 0.62952
P(rand. value = obs. value) = 0.00000
P-value = 0.62952+-0.01438
----------------------------------------------------------------------
Source of Sum of Variance Percentage
variation d.f. squares components of variation
----------------------------------------------------------------------
Among
groups 1 4.621 0.06368 Va 9.55
Among
populations
within
groups 3 3.005 0.01745 Vb 2.62
Within
populations 114 66.777 0.58576 Vc 87.83
----------------------------------------------------------------------
Total 118 74.403 0.66690
----------------------------------------------------------------------
Fixation Indices
FSC : 0.02893
FST : 0.12166
FCT : 0.09549
----------------------------------------------------------------------
Significance tests (1023 permutations)
------------------
Vc and FST : P(rand. value < obs. value) = 0.00000
P(rand. value = obs. value) = 0.00000
P-value = 0.00000+-0.00000
Vb and FSC : P(rand. value > obs. value) = 0.08798
P(rand. value = obs. value) = 0.00000
P-value = 0.08798+-0.00787
Va and FCT : P(rand. value > obs. value) = 0.09286
P(rand. value = obs. value) = 0.09971
P-value = 0.19257+-0.01155
Buffalo 44 (PhT/PtT/DSP)
Pharyngeal Tonsil (GC vs Epi) Palatine Tonsil (GC vs Epi)
1. Are there significant differences among tissues?
2. Are there significant differences among GC/Epi/Cr within the tissues ?
3. Are there significant differences among GC/Epi/Cr?
No
4. Are there significant differences within GC/Epi/Cr?
----------------------------------------------------------------------
Source of Sum of Variance Percentage
variation d.f. squares components of variation
----------------------------------------------------------------------
Among
groups 1 5.727 0.04764 Va 6.27
Among
populations
within
groups 4 11.442 0.09504 Vb 12.50
Within
populations 135 83.363 0.61750 Vc 81.23
----------------------------------------------------------------------
Total 140 100.532 0.76018
----------------------------------------------------------------------
Fixation Indices
FSC : 0.13338
FST : 0.18769
FCT : 0.06267
----------------------------------------------------------------------
Significance tests (1023 permutations)
------------------
Vc and FST : P(rand. value < obs. value) = 0.00000
P(rand. value = obs. value) = 0.00000
P-value = 0.00000+-0.00000
Vb and FSC : P(rand. value > obs. value) = 0.00000
P(rand. value = obs. value) = 0.00000
P-value = 0.00000+-0.00000
Va and FCT : P(rand. value > obs. value) = 0.14467
P(rand. value = obs. value) = 0.06256
P-value = 0.20723+-0.01413
DSP (GC vs Epi)
Yes
Yes
No
15
Implications

16
Thank you very much for your attention!!!
Acknowledgements
The Pirbright Institute Don King
Nick Knowles Graham Fermianis