Embed Size (px)
Citation preview

1
Evolution of hemoglobin loci and their regulatory elements
Sjaak Philipsen1 and Ross C. Hardison2
1 Department of Cell Biology Ee1071b, Erasmus MC, P.O. Box 2040, 3000 CA Rotterdam, The
Netherlands. Email [email protected] Tel. +31-10-7044282 2 Department of Biochemistry and Molecular Biology, Huck Institute for Comparative Genomics
and Bioinformatics, The Pennsylvania State University, University Park, PA 16802, USA. Email
[email protected] Tel. +1-814-8630113
Key words: transcriptional regulation; globin genes; locus control regions; super-enhancers;
evolution
Word count
Abstract: 178
Review: 5793
This article was accepted to Blood Cells, Molecules and Diseases in August 2017. The DOI is doi.org/10.1016/j.bcmd.2017.08.001 The link to the article at BCMD is https://doi.org/10.1016/j.bcmd.2017.08.001
2
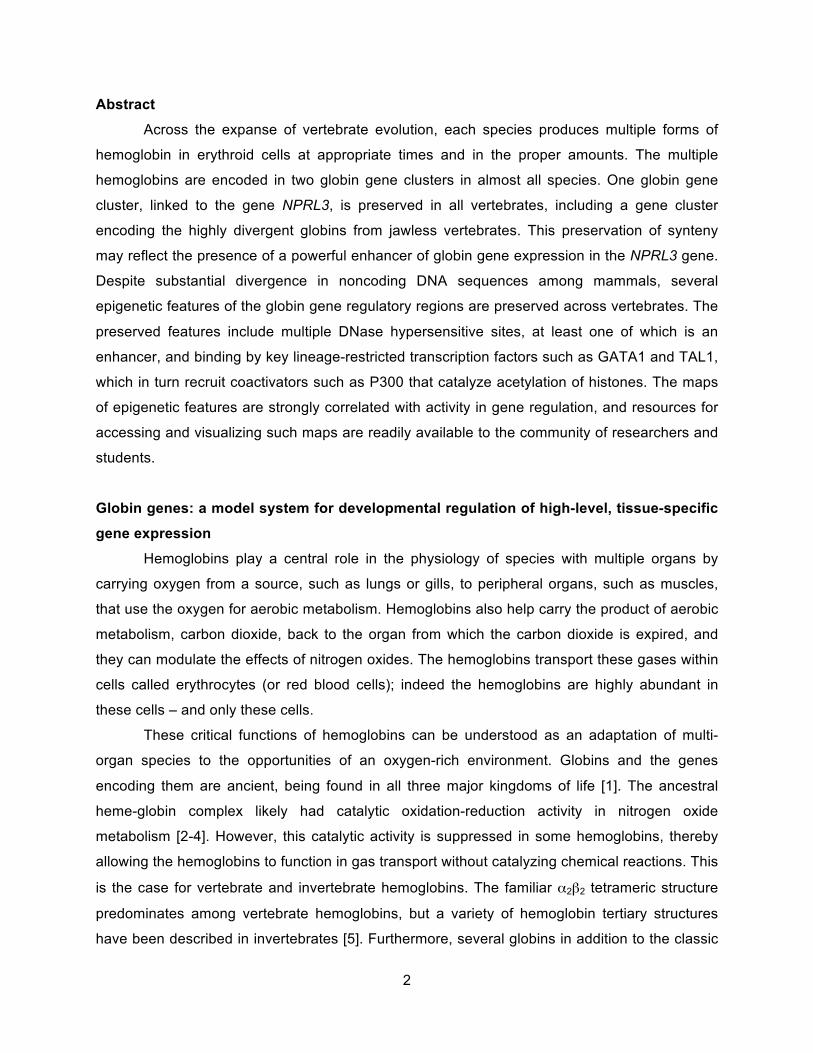
Abstract
Across the expanse of vertebrate evolution, each species produces multiple forms of
hemoglobin in erythroid cells at appropriate times and in the proper amounts. The multiple
hemoglobins are encoded in two globin gene clusters in almost all species. One globin gene
cluster, linked to the gene NPRL3, is preserved in all vertebrates, including a gene cluster
encoding the highly divergent globins from jawless vertebrates. This preservation of synteny
may reflect the presence of a powerful enhancer of globin gene expression in the NPRL3 gene.
Despite substantial divergence in noncoding DNA sequences among mammals, several
epigenetic features of the globin gene regulatory regions are preserved across vertebrates. The
preserved features include multiple DNase hypersensitive sites, at least one of which is an
enhancer, and binding by key lineage-restricted transcription factors such as GATA1 and TAL1,
which in turn recruit coactivators such as P300 that catalyze acetylation of histones. The maps
of epigenetic features are strongly correlated with activity in gene regulation, and resources for
accessing and visualizing such maps are readily available to the community of researchers and
students.
Globin genes: a model system for developmental regulation of high-level, tissue-specific
gene expression
Hemoglobins play a central role in the physiology of species with multiple organs by
carrying oxygen from a source, such as lungs or gills, to peripheral organs, such as muscles,
that use the oxygen for aerobic metabolism. Hemoglobins also help carry the product of aerobic
metabolism, carbon dioxide, back to the organ from which the carbon dioxide is expired, and
they can modulate the effects of nitrogen oxides. The hemoglobins transport these gases within
cells called erythrocytes (or red blood cells); indeed the hemoglobins are highly abundant in
these cells – and only these cells.
These critical functions of hemoglobins can be understood as an adaptation of multi-
organ species to the opportunities of an oxygen-rich environment. Globins and the genes
encoding them are ancient, being found in all three major kingdoms of life [1]. The ancestral
heme-globin complex likely had catalytic oxidation-reduction activity in nitrogen oxide
metabolism [2-4]. However, this catalytic activity is suppressed in some hemoglobins, thereby
allowing the hemoglobins to function in gas transport without catalyzing chemical reactions. This
is the case for vertebrate and invertebrate hemoglobins. The familiar α2β2 tetrameric structure
predominates among vertebrate hemoglobins, but a variety of hemoglobin tertiary structures
have been described in invertebrates [5]. Furthermore, several globins in addition to the classic

3
tetrameric erythroid hemoglobins have been discovered in vertebrates. These include
myoglobins, cytoglobins, and neuroglobins [6]. Thus the globin superfamily is large and
pervasive across the biosphere, and members of the superfamily are responsible for a wide
range of activities [4]. In this review, we will focus on the vertebrate hemoglobins (and their
genes) responsible for gas transport in the blood.
A remarkable feature of vertebrate hemoglobins is that multiple forms of this protein are
used for oxygen transport at different stages of development. In placental mammals
(eutherians), one form of hemoglobin is dominant in erythrocytes circulating in embryos
(primitive erythrocytes) while a different form is used in adult erythrocytes, and in some cases a
distinct fetal form is also produced. The different hemoglobins may be adaptive for the
differences in oxygen tension at the source organs, e.g. needing a higher oxygen affinity
hemoglobin at the fetal placenta than at the adult lung. However, this production of different
hemoglobins at progressive developmental stages is not limited to eutherians. To our
knowledge, every vertebrate organism examined makes different forms of hemoglobin, and
when they have been studied in a developmental context, distinct forms are made at different
stages of development. While the full physiological significance of the developmental diversity of
hemoglobins is not yet understood, it is clear that the multiplicity of hemoglobins produced in a
developmentally controlled manner is a strongly conserved feature across vertebrates, including
the jawless vertebrates (agnathans), which are the most distantly related extant vertebrate
relatives to humans.
The production of different hemoglobins at progressive stages of development has
particular importance for human health. Hemoglobinopathies such as sickle cell disease and
thalassemias are the most common forms of inherited disease world-wide [7]. The
pathophysiology of each of these diseases almost always involves the hemoglobins produced
during adult life. Thus an enduring hope for potential therapies has been the strategy of re-
activating the production of hemoglobins that were previously made in fetal life. Recent progress
in this strategy is based on our understanding of the mechanisms of gene regulation in the
families of genes encoding the globins.
This review will cover the general themes emerging about regulation of globin gene
families from an evolutionary and mechanistic perspective. The evolutionary studies are
revealing common features of hemoglobin gene regulation, which can be understood best by
combining the DNA sequence comparisons of evolutionary approaches with comparisons of
additional biochemical features, such as chromatin accessibility, histone modifications, and
transcription factor (TF) occupancy. These latter features are referred to as epigenomic,

4
meaning that they are proteins (e.g. TFs) or biochemical modifications (e.g. DNA methylation or
histone acetylation) that lie on top of (epi-) the genetic material (DNA), but do not alter the DNA
sequence as such. This review will illustrate how comparisons of genomes and epigenomes
lead to insights about regulation and human disease. We also will point readers to resources for
examination of epigenomic data for any gene in human or mouse erythroid or related cell types,
so that the approaches discussed here can be applied to other genes and gene families.
Globin genes are located in multi-gene loci containing embryonic/fetal and adult genes
Vertebrates have diversified remarkably since they arose about 550 million years ago
(MYA) in the early Paleozoic era (Figure 1). An early divergence separated the jawless
vertebrates (agnathans such as lamprey and hagfish) from those with jaws (gnathostomes). The
latter large group contains many of the animals familiar to us, including fish (cartilaginous and
ray-finned), amphibians, reptiles and birds, and mammals. Each major group had separated
from the others by around 250 MYA, in the early Mesozoic era. Diversification of the eutherian
mammals is thought to have occurred primarily in the past 65 MY.
Despite the long evolutionary time and striking differences between species, some
aspects of the arrangements of globin genes have been preserved. Such strong conservation of
gene arrangement is indicative of a function, such as regulation, that requires the observed
arrangement. When we observe less change than expected, either in DNA sequence or gene
arrangement, we infer that changes are disadvantageous and therefore removed from the
relevant populations; i.e. we infer that the feature was under purifying or negative selection.
Thus mapping the arrangements of globin genes and their neighbors has been of considerable
interest for decades. As we will see, the inference that gene arrangement is important has been
borne out by the discovery that major regulatory elements are located in genes or intergenic
regions distal to the globin genes.
The first preserved feature of vertebrate hemoglobin genes is their presence in multi-
gene clusters. The genes encoding hemoglobins have now been mapped across the wide
diversity of vertebrates [8-19]. In all cases, multiple hemoglobin genes are found together
(Figure 2). For reptiles, birds, and mammals, the genes encoding α-like globins are clustered
together on one chromosome, while the genes encoding the β-like globins are clustered on a
different chromosome. We refer to the former locus as the α-like globin gene cluster or HBA
cluster, and the latter as the β-like globin gene cluster or HBB cluster. In all cases that have
been investigated thoroughly, genes at the left side of HBA and HBB clusters (as diagrammed
in Figure 2) are expressed in embryonic erythrocytes, while genes on the right side of the

5
clusters display a broader developmental expression pattern and include the globins expressed
in adult erythrocytes. While many of the globin genes encode polypeptide components of
hemoglobin, no protein product has been discovered from the genes labeled µ and θ in Figure
2, despite the presence of orthologous genes in multiple species [6]. Thus a role for these
genes, if any, remains to be determined.
In fish and amphibians, the genes encoding α-like globins are clustered together with the
β-like globin genes, frequently appearing as pairs of an α-like and a β-like globin gene. In
zebrafish, the set of α-βgene pairs expressed in early developmental stages is at one end of the
gene cluster, while those expressed at later stages are at the other end [10]. A similar pattern is
observed in frogs; the globin genes expressed in tadpoles are separated from those expressed
in adult frogs [12, 14, 20]. The genome assembly of the frog Xenopus tropicalis is not sufficiently
complete to address the gene arrangements unambiguously. One possibility inferred from the
current assembly is shown in the model in Figure 2. The current genome assembly of the
genome of the elephant shark, representing cartilaginous fish, shows at least one cluster with
genes encoding α-globin, β-globin, and cytoglobin.
The most distant vertebrate with a genome sequence assembly is the lamprey, an
agnathan. The globins of lampreys are monomeric and appear to be more closely related to
vertebrate cytoglobins than to vertebrate hemoglobins, leading to the inference that the gas-
transporting activity of erythrocyte hemoglobins has arisen twice by convergent evolution [11].
Notably, the agnathan hemoglobin genes are arranged as clusters in two different loci (Figure 2,
[18]).
The second preserved feature of vertebrate globin gene clusters is the presence of more
than one multi-gene cluster. In almost all species, two multi-gene clusters have been identified.
For shark and frog, no clear evidence is available for a second multi-gene cluster, but this could
reflect the incompleteness of the genome assemblies and correlated work.
The genes flanking the globin multi-gene clusters are conserved across vertebrates
Examination of the genes flanking the globin gene clusters reveals three distinct loci, two
of which are used in each species. In almost all mammals and birds, the HBA cluster is located
between the NPRL3 and LUC7L genes. The mouse HBA cluster no longer has LUC7L
downstream of the globin genes (to the right in Figure 2) because of a chromosomal
rearrangement, but NPRL3 has been retained upstream [8, 13]. The HBB cluster in birds and
mammals is embedded in a large cluster of OR genes encoding olfactory receptors. Single-copy
genes can be far away from the HBB cluster, but in all cases with sufficient contiguity to the

6
genome assembly, the DCHS1 gene is located upstream and the RRM1 and STIM1 genes are
located downstream of the HBB cluster in birds and mammals. A similar arrangement appears
to be present for the HBA and HBB clusters in turtle, except for an inversion downstream of the
HBA cluster that may obscure the presence of LUC7L.
The linkage to NPRL3 is also observed for an amphibian (frog) and every species of ray-
finned fish examined (three are shown in Figure 2). These cases can be viewed as a combined
cluster of HBA and HBB genes adjacent to NPRL3. A second globin gene cluster is found on a
different chromosome in the ray-finned fish. This cluster is smaller, sometimes with three genes,
but both α-like and β-like globin genes are found in the smaller cluster [10, 21]. This second
cluster is adjacent to the genes ARHGAP17 and LCMT1 on one side, and frequently the gene
RHBDF1 is on the other side. A paralogous copy of RHBDF1 (i.e. a related gene generated by
duplication) is also frequently close to the first gene cluster containing NPRL3. This second
locus is clearly distinct from the OR cluster harboring the HBB complex in mammals. The
annotation and assembly of the shark genome is less complete than for the genomes of ray-
finned fish, and while NPRL3 has not been mapped unequivocally to the globin gene cluster, the
genes RHBDF1 and LUC7L flank the cluster. Thus it is possible that the shark globin gene
cluster has an arrangement of flanking genes similar to that in other vertebrates.
Remarkably, one cluster of agnathan globin genes is also flanked by NPRL3, and the
other is flanked by RHBDF1 [18]. Therefore even in these distantly related species, two different
loci harboring globin genes are present, and those loci show similar flanking genes to those in
the jawed vertebrates.
Examination of globin gene clusters across the full span of vertebrates consistently
shows that the NPRL3 gene is adjacent to one of the hemoglobin multi-gene clusters. In almost
every species examined, NPRL3 is located adjacent to the HBA complex or to a combined
HBA-HBB complex. Current apparent exceptions such as the shark may simply reflect
incomplete assembly and annotation. Furthermore, NPRL3 is adjacent to a globin gene cluster
in agnathans [18], despite the substantial divergence of these monomeric hemoglobins from the
tetrameric hemoglobins in gnathostomes [11].
In summary, a striking picture is emerging of conservation of synteny, clustering, and
gene order around globin gene loci. Two or more genes present on the same chromosome are
syntenic, and when such genes are retained in the same order (and often the same orientation)
in different species, we can be confident in concluding that an ancestral arrangement of genes
has been preserved over evolution. However, over a large enough span of evolutionary
distance, chromosomal rearrangements will break synteny. In fact, for comparisons across

7
major groups of vertebrates (e.g. mammals and birds), the conservation of synteny does not
extend much further than the regions shown in Figure 2 [8, 13]. Importantly, the phylogenetic
span over which synteny and gene order surrounding globin gene clusters is conserved appears
to be greater than for many other loci. We infer from this strong conservation that the
surrounding genes are important, and as we will examine later, one important function attributed
to this arrangement is regulation of globin gene expression.
The HBB cluster in birds and mammals arose by a transposition
The linkage of a globin gene cluster to NPRL3 is found in all vertebrates, and thus we
infer that this is a characteristic derived from the same arrangement in the ancestral vertebrate.
The evolutionary history of the other globin gene clusters is more complex. The HBB cluster in
birds and mammals is in a different locus from the non-NPRL3-linked cluster in fish, and thus
they do not share a common ancestral arrangement. It is therefore likely that the HBB cluster
transposed into the DCHS1-OR-RRM1-STIM1 locus in the last common ancestor to reptiles,
birds, and mammals (Figures 1 and 2, [6, 17]). The source of those globin genes is unclear. It
could be the genes that were linked to LCMT1. In mammals, no globin genes are present
around ARHGAP17-LCMT1, and thus one could propose movement from that locus to the OR
locus. However, it is also possible that one or more HBB genes from the HBA-HBB combined
locus, linked to NPRL3, was the source. In either scenario, genes were lost from one or more of
the globin gene loci now seen in contemporary fish, and the transposed HBB genes underwent
a series of duplications and divergences to form the contemporary HBB gene cluster with
developmentally regulated genes.
The evolutionary rationale for having separate HBA and HBB gene clusters is thought to
be that this precludes gene conversion events between HBA and HBB genes, thus promoting
fine-tuning of the developmental expression patterns and protein sequences of the α-like and β-
like globins. An instructive example is provided by the two γ-globin genes, encoding fetal β-like
globins, which have been recently acquired through duplication events in Old World monkeys
including humans.
Proximal and distal regulation in the multi-gene clusters
The globin genes are expressed exclusively in erythroid cells, they are expressed at
extremely high abundance when activated, and different genes are expressed at different
developmental stages. All three aspects of regulation, viz. tissue-specificity, high abundance,
and developmental control, have been studied intensively, often using groundbreaking

8
biochemical, genetic, and genomic approaches. For this review, we will discuss some aspects
of globin gene regulation that correlate with the evolutionary analyses.
Globin genes have a canonical promoter structure that directs transcription to start at the
appropriate location. The sequences conferring this promoter-proximal regulation are found in
common for many globin genes, and include a TATAA box at -30bp from the transcription
initiation site [22], a CCAAT box at -50bp [23], and a CACCC box at -80bp [24]. The TATAA box
is a landing platform for the general transcription factor complex TFIID, and is considered a
hallmark of strong tissue-specific promoters. The CCAAT box is a potential binding site for an
array of transcription factors, such as the ubiquitously expressed hetero-trimeric NF-Y
transcription factor [25] and α-CP1 [26]. The CACCC box element is recognized by members of
the specificity protein / Krüppel-like factor (SP/KLF) transcription factor family [27]. This element
confers tissue-specificity as it is bound by KLF1, the only erythroid-specific member of the 26-
strong mammalian SP/KLF family [28, 29]. The importance of these motifs for high-level globin
expression is illustrated by promoter variants leading to thalassemic phenotypes in patients [24,
30, 31], and by systematic analysis of transgene expression in cultured cells and transgenic
mice [9].
By themselves the promoters are insufficient to drive high-level transcription of the globin
genes in all erythroid cells [32-34]. To achieve this, a series of erythroid-specific enhancer
elements is typically required. These enhancer elements are also clustered and located distally
from the globin genes. The globin gene loci provided the earliest evidence for long-distance
regulation in addition to proximal control [35-37]. A series of DNaseI hypersensitive sites (DHS)
upstream of the human embryonic ε-globin gene (HBE, Figure 3) [37] was shown to confer
position-independent, high-level expression to a linked globin gene in transgenic mice [35]. This
region was termed the Locus Control Region (LCR) and is a defining feature of all mammalian
HBB clusters studied to date (orange dots in Figure 2). For the human HBA locus, a major
regulatory element was identified located in intron 5 of the NPRL3 gene [36], which is now
referred to as Multispecies Conserved Sequence R2 (MCS-R2) [13, 38]. Similar to the LCR, the
MCS-R2 is also part of a series of erythroid-specific DHS (Figure 3) [8, 39]. Genetic dissection
of the distal regulatory elements has shown that both MCS-R1 and MCS-R2 are major
regulatory elements [39, 40]. This arrangement of multiple DHS is typical for mammalian HBA
clusters (Figure 3).
Interestingly, it was found that the importance of the NPRL3 intron 5 MCS-R2 element
for high-level activation of the globin genes differs between species. Deletion of the homologous
element in mice resulted in only a modest reduction in α-globin expression [40]. We now know

9
that the clustered DHS work together in an additive fashion [39, 41, 42]; the NPRL3 intron 5
MCS-R2 element appears to have a more dominant role in α-globin gene activation in humans
than it does in mice.
The origin of the HBB LCR remains obscure. It could have been derived from the HBA
MCS-R2, if that part of NPRL3 were included in the transposition. Regulation of the fish globin
clusters flanked by the ARHGAP and RHBDF genes has not been studied in detail yet [10, 21].
One or more DHS have been mapped in this globin gene locus in both Fugu and in zebrafish
[10, 21], and it is possible that this could be an important regulatory element (orange dots in
Figure 2). Thus the LCR could also have been be derived from this element. Alternatively, the
HBB LCR could have arisen de novo, in which case it acquired binding sites for an array of
transcription factors very similar to those seen in the globin loci linked to NPRL3 (Figure 3).
Epigenomic features across mammalian HBA and HBB loci
Despite the different evolutionary paths of the HBA and HBB loci, many aspects of their
regulation are conserved. Indeed, not only are the genes in both clusters subject to control of
tissue-specificity, high abundance, and developmental switches, but the production of proteins
from each locus must be balanced to make the globin polypeptides for the α2β2 hemoglobin
tetramer. Maps of epigenetic features associated with gene regulation have been produced
across the genomes of erythroid-related cell types in mouse and human, both from individual
labs and from large consortia. Examination of these maps reveals substantial similarities
between the HBB and HBA loci, and strong conservation between mouse and human (Figure
3). These similarities in maps suggest similarities in regulatory mechanisms.
A cluster of regulatory elements, marked by DHS, is distal to the globin genes in both
loci (Figure 3). This cluster is referred to as the locus control region, or LCR, for the HBB locus.
At least one of the DHS in each distal regulatory region is a strong enhancer as assayed by
gain-of-function reporter gene assays or by deletional analysis. In humans, such strong
enhancer activity is associated with MCS-R1 and MCS-R2 in the HBA locus and 5’HS2 in the
HBB LCR. Activated globin genes are marked by a DHS at the promoter and often broader,
proximal nuclease cleavage sensitivity.
The regulatory elements marked by distal and proximal DHS are occupied by the co-
activator P300 (Figure 3). This enzyme catalyzes the acetylation of lysine 27 of histone H3,
leading to a strong signal for H3K27ac, spreading from the positions occupied by P300. Co-
activators are recruited by transcription factors bound to specific sequences. The maps show
binding by key transcription factors such as GATA2 and GATA1 (at different stages of erythroid
10
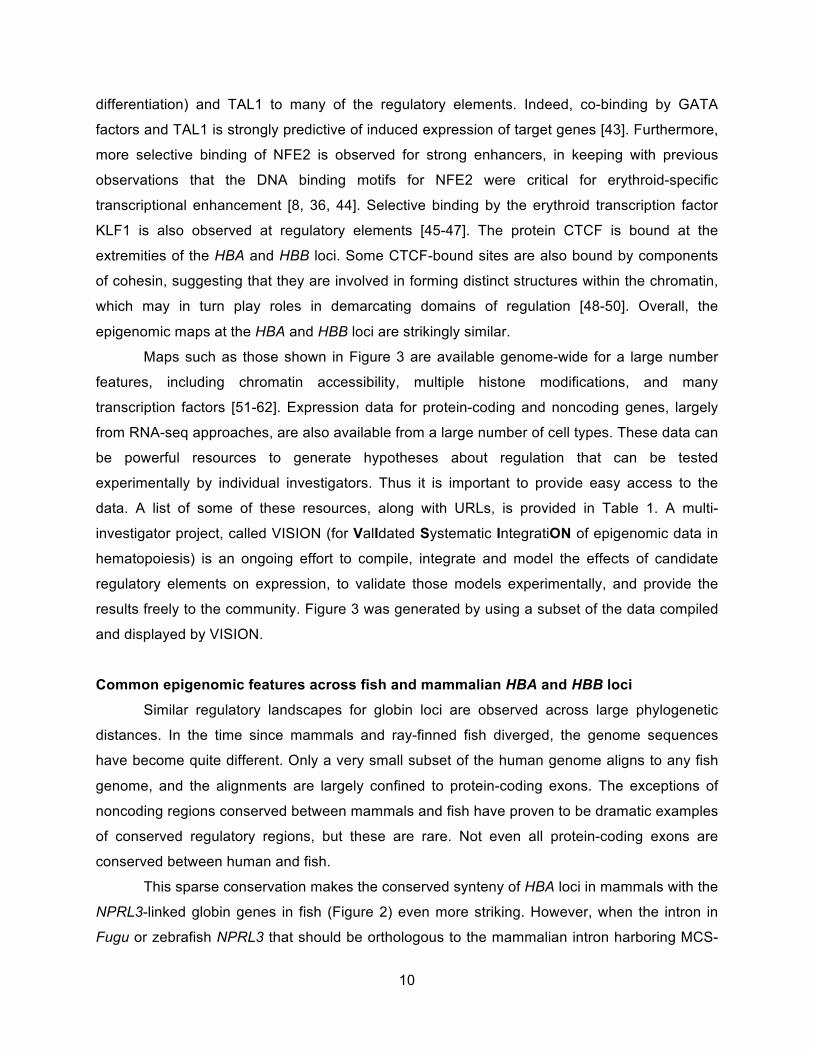
differentiation) and TAL1 to many of the regulatory elements. Indeed, co-binding by GATA
factors and TAL1 is strongly predictive of induced expression of target genes [43]. Furthermore,
more selective binding of NFE2 is observed for strong enhancers, in keeping with previous
observations that the DNA binding motifs for NFE2 were critical for erythroid-specific
transcriptional enhancement [8, 36, 44]. Selective binding by the erythroid transcription factor
KLF1 is also observed at regulatory elements [45-47]. The protein CTCF is bound at the
extremities of the HBA and HBB loci. Some CTCF-bound sites are also bound by components
of cohesin, suggesting that they are involved in forming distinct structures within the chromatin,
which may in turn play roles in demarcating domains of regulation [48-50]. Overall, the
epigenomic maps at the HBA and HBB loci are strikingly similar.
Maps such as those shown in Figure 3 are available genome-wide for a large number
features, including chromatin accessibility, multiple histone modifications, and many
transcription factors [51-62]. Expression data for protein-coding and noncoding genes, largely
from RNA-seq approaches, are also available from a large number of cell types. These data can
be powerful resources to generate hypotheses about regulation that can be tested
experimentally by individual investigators. Thus it is important to provide easy access to the
data. A list of some of these resources, along with URLs, is provided in Table 1. A multi-
investigator project, called VISION (for ValIdated Systematic IntegratiON of epigenomic data in
hematopoiesis) is an ongoing effort to compile, integrate and model the effects of candidate
regulatory elements on expression, to validate those models experimentally, and provide the
results freely to the community. Figure 3 was generated by using a subset of the data compiled
and displayed by VISION.
Common epigenomic features across fish and mammalian HBA and HBB loci
Similar regulatory landscapes for globin loci are observed across large phylogenetic
distances. In the time since mammals and ray-finned fish diverged, the genome sequences
have become quite different. Only a very small subset of the human genome aligns to any fish
genome, and the alignments are largely confined to protein-coding exons. The exceptions of
noncoding regions conserved between mammals and fish have proven to be dramatic examples
of conserved regulatory regions, but these are rare. Not even all protein-coding exons are
conserved between human and fish.
This sparse conservation makes the conserved synteny of HBA loci in mammals with the
NPRL3-linked globin genes in fish (Figure 2) even more striking. However, when the intron in
Fugu or zebrafish NPRL3 that should be orthologous to the mammalian intron harboring MCS-

11
R2 was searched for alignments with human NPRL3, no meaningful matches were detected
above the background of random matches [8]. Reasoning that short matches such as the
binding site motifs for transcription factors may not be detected by large-scale alignments, the
relevant introns from Fugu and zebrafish NPRL3 were tested experimentally and shown to be
active erythroid enhancers [8, 10] (Figure 4). Furthermore, these introns have matches to
binding sites for the battery of erythroid transcription factors found in mammalian globin gene
regulatory elements, and ChIP-seq experiments confirm binding. This inability to find regulatory
elements by interspecies sequence alignments even applies within the clade of ray-finned fish.
The Fugu Nprl3 intron 5 harboring MCS-R2 aligns with the orthologous sequence from several
fish, but not zebrafish. Despite the lack of alignment, both the Fugu and zebrafish introns have
enhancer activity and appear to bind a similar set of transcription factors [8, 10, 21]. These
examples illustrate the power of epigenomic analysis for deep interrogation of regulatory
mechanisms. Indeed, conservation of epigenomic features may be a particularly effective
means of finding active regulatory elements.
The collection of transcription factors binding to MCS-R2 in ray-finned fish is strikingly
similar to those observed at distal regulatory elements in mammals (Figure 4, C and D). High
resolution DNase sensitivity maps show footprints, i.e. regions of protection (presumably from
transcription factor binding) separated by regions of higher cutting [63, 64]. Those footprints
correspond well to the binding site motifs for transcription factors, each of which has been
shown by ChIP-seq or other assays to be bound. While the exact number and pattern of binding
sites differs among the regulatory elements, the transcription factors bound at the active
elements tend to be the same.
Distal regulatory elements are required for high-level expression of the globin genes
The mechanism by which the promoters of the globin genes are activated by the distal
regulatory elements was the subject of fierce scientific debates during the 90s of the previous
century. A fairly bewildering variety of models were proposed, and while some models were
more credible than others, most were not mutually exclusive. Even to date, a detailed time-
resolved description of the molecular mechanism is lacking; this will require further development
of advanced high-resolution microscopy to follow the dynamic changes in three-dimensional
organization of the globin loci in living cells. One model proposed release of RNA polymerase II
from the LCR, which would then track along the DNA and start transcription at the first available
promoter it encountered [65]. For the chicken HBA locus, a full locus transcript including all the
globin genes was reported [66]. Linking of the LCR to the globin promoters via extended protein

12
bridges was another model for transcriptional activation [67]; local repression of embryonic/fetal
promoters would prevent activation of these genes in adult erythroid cells. An alternative model,
not necessarily excluding a role for most of the other proposed mechanisms, was derived from
observations made in bacterial systems in which the formation of DNA loops was observed to
accommodate protein-protein interactions between DNA-bound transcriptional regulators [68].
Indirect support for the looping model was obtained from transgenesis experiments in which the
position and/or order of genes and regulatory elements was changed [69-72]. The first direct
support was obtained using RNA-fishtrap, a method that tags and recovers chromatin in the
immediate vicinity of an actively transcribed gene. This revealed that 5’HS2 of the LCR is in
close physical proximity to the actively transcribed β-globin gene [73]. Development of
Chromosome Conformation Capture (3C) enabled investigation of the three-dimensional
structure of loci inside the nucleus independent of transcriptional status [74]. Initially developed
in vitro [75], then in yeast [74], adaptation of 3C to analysis of mammalian cells showed that, in
adult erythroid cells, the DHS of the LCR come in close spatial proximity with the promoter of
the β-globin gene, with the intervening DNA looping out [76]. No such interactions were
observed in non-erythroid cells. The LCR-promoter interactions were developmentally
regulated, leading to the proposal that the DHS form a holo-complex which facilitates activating
interactions preferentially with the nearest accessible globin promoter [77]. Binding of
repressors to embryonic/fetal globin promoters in adult erythroid cells would exclude
participation in this structure, which was termed the active chromatin hub (ACH). Key erythroid
transcription factors KLF1 [78] and GATA1 [79] were found to be required for ACH formation in
adult erythroid cells. Remarkably, tethering the self-association domain of the GATA1 cofactor
LDB1 to the γ-globin promoter forced LCR looping to the γ-globin promoter and resulted in
significant reactivation of the fetal gene in adult erythroid cells [80]. For the HBA locus, similar
mechanisms are operational [39]. Of note, a single nucleotide polymorphism (SNP), located
between the upstream DHS and the α-globin genes, was shown to create a decoy promoter
interfering with normal activation of the downstream α-globin genes. This single SNP is the
cause of α-thalassemia in individuals from Melanesia, illustrating that altered chromatin loop
formation can be the underlying cause of human disease [81].
How loop formation is achieved remains to be elucidated. Looping requires that
regulatory elements sample the nuclear space in order to come in close proximity to each other.
We know that the likelihood of in cis enhancer – promoter interactions decreases with distance
[69, 70, 82]. Recent investigations of the three-dimensional organization of the genome have
revealed that chromatin is compartmentalized by several mechanisms, such as association with

13
the nuclear lamina [83, 84] and division in topologically associated domains [85]. In addition, the
high local densities of proteins and nucleic acids at enhancers and promoters may result in the
formation of membraneless organelles, called cellular bodies, which are formed by a process
termed phase separation. It has been proposed that the formation of such phase-separated
multi-molecular assemblies are an essential feature for the function of super-enhancers [86],
clusters of DHS such as those found in the HBA and HBB loci.
Super-enhancers for robust regulation
Recently, clusters of hypersensitive sites such as those found in the HBA and HBB loci
have been re-branded as super-enhancers [87]. The multiple DHS and extensive histone
modifications in the super-enhancers have been interpreted as indicating a large, interacting
complex of regulatory elements that together produce a stronger regulatory effect than the
individual elements acting separately. Such a model predicts that the regulatory elements in a
super-enhancer would act synergistically. However, a recent study examining the effects of
deleting each of the five DHS of the HBA locus super-enhancer, singly and in combination,
demonstrated that individual DHS act independently of the other four elements. The DHS
operated in an additive fashion with respect to hematological phenotype, gene expression,
chromatin structure, and chromosome conformation [39]. These results are entirely consistent
with earlier studies on the HBB LCR [41, 42, 88-94]. The magnitude of the effects of the
deletions of individual elements differed widely. In the HBA complex, deletion of each of two of
the candidate regulatory elements with all the hallmarks of enhancers (DNase hypersensitivity,
histone modifications indicative of active chromatin, binding by key transcription factors,
enhancer RNAs, interactions with promoters, interspecies sequence conservation) had almost
no impact on expression [39]. This result shows that these candidate regulatory elements are
dispensable for globin gene expression in a laboratory setting, but it does not preclude a role
under other conditions.
We suggest that, rather than facilitating synergistic interactions or higher-order effects on
the 3D structure of the hemoglobin loci, the super-enhancer architecture in the HBA and HBB
loci provides robustness to the system. Such robustness may be the main force driving
evolutionary selection on the complex enhancers of the globin loci. Multiple regulatory elements
acting independently ensure that expression of the globin genes is fully activated in the vast
majority of red cells being produced [95]. Given that an adult human needs to produce over 2
million new erythrocytes every second to replenish worn-out erythrocytes, this is not a trivial
consideration.

14
Developmental regulation of globin gene expression: hemoglobin switching
The recent insights in molecular control of hemoglobin switching elegantly combine the
concept of activation of the individual globin genes by the distal regulatory elements via
interactions with the globin promoters. The appearance of specific repressor proteins during
development renders the promoters of the embryonic/fetal globin genes inaccessible for
activation, shifting the DHS-promoter interactions to the adult globin genes. Notably, in the vast
majority of cases the embryonic/fetal globin genes are located closer to the DHS along the
genomic DNA, with the adult genes located more distally in the locus. Experimentally, the
importance of gene order, direction, and distance to the DHS has also been demonstrated using
a variety of transgenic approaches in mice [69-72]. The essential role of repressor proteins in
orchestrating the switch from embryonic/fetal to adult globin gene expression has now been
firmly established with the identification of a regulatory circuit involving MYB [96], KLF1 [97, 98],
BCL11A [99] and LRF (also called Pokemon or ZBTB7A) [100]. In adult erythroid cells, MYB
activates expression of KLF1, a major activator of terminal erythroid differentiation [101]. KLF1
is a positive regulator of BCL11A [97, 98] and LRF [102] expression, two transcription factors
which act as direct repressors of the embryonic/fetal globin genes. Since KLF1 preferentially
activates adult globin genes [103, 104], this MYB-KLF1-BCL11A-LRF regulatory circuit results in
high-level expression of adult globin genes and very efficient repression of the embryonic/fetal
genes in adult erythroid cells. Clinically, this regulatory circuit provides rational targets for
directed genome editing in somatic cells or development of novel drugs aimed at reactivation of
the fetal β-like globin genes in patients with β-thalassemia and sickle cell disease. A promising
recent study showed that removal of a repressor binding site upstream of the γ-globin genes led
to substantial increase in fetal hemoglobin and reduced sickling in cells derived from sickle cell
patients [105]. While classical transcription factors lack domains with catalytic activity and are
therefore as such not very attractive drug targets, they are known to require a host of co-factors
in order to exert their functions. These co-factors include histone- and DNA modification
enzymes and chromatin remodelers, for which an arsenal of pharmacologic inhibitors is
available. Thus, targeting (a combination of) these co-factors is currently a very active area of
research. An early example is provided by treatment of a β-thalassemia patient with the DNA
methyltransferase inhibitor 5-azacytidine, which resulted in increased fetal hemoglobin
expression [106, 107]. This experimental treatment was stopped because of concerns about
toxicity, and it remains controversial whether the effects of 5-azacytidine are directly related to
inhibition of DNA methylation or due to other metabolic changes in the erythroid cells [108].

15
Mixed results have been reported on the fetal hemoglobin inducing activities of inhibitors of
histone deacetylases [109, 110] and the histone demethylase LSD1 [111, 112]. It is
nevertheless encouraging that the increasingly detailed knowledge of the developmental
regulation of globin gene expression provides guidance to the development of desperately
needed novel pharmacological regimes for the treatment of β-hemoglobinopathy patients. In
addition, successful gene therapy of β-hemoglobinopathy patients has been reported for a small
number of cases [113, 114]. The gene therapy vectors are based on what could be viewed as
an ultra-condensed version of the HBB locus, depending entirely on the inclusion of core
regulatory elements of the LCR and the β-globin gene to drive high-level erythroid-specific
expression of the therapeutic globin gene [115].
In conclusion, the study of globin loci across the vertebrate kingdom has yielded a
wealth of information about developmental regulation of multigene loci and provided a paradigm
for understanding spatio-temporal transcriptional control of more complex gene clusters such as
the HOX loci [116]. Furthermore, the detailed studies on evolution of the globin gene clusters
have helped to reveal the molecular mechanisms underlying gene regulation in higher
eukaryotes. This has profoundly contributed to our understanding of human genetic disease in
general, and paved the way for development of novel treatments of the hemoglobinopathies, the
most common monogenic disorders in the human population.
Acknowledgements
This work was supported by the Landsteiner Foundation for Blood Transfusion Research (LSBR
1627), Netherlands Organization for Scientific Research (NWO/ZonMw TOP 40-00812-98-
12128) and EU fp7 Specific Cooperation Research Project THALAMOSS (306201) to SP, and
by grants R24DK106766, R01DK054937, and 1R01CA178393 from the National Institutes of
Health to RCH. We thank Dr. Doug Vernimmen for his help in the generation of Figure 1.
Figure Legends
Figure 1. Major events in globin gene clusters during vertebrate evolution.
The branching pattern for major vertebrate groups is shown along with a time scale for
divergences (millions of years ago, MYA). The labels indicate the inferred times and
phylogenetic spans of the presence or movement of specific globin gene clusters.

16
Figure 2. Globin gene clusters across a wide span of vertebrate species.
The arrangement of globin genes and their flanking genes are shown for contemporary species
ranging from the jawless vertebrate lamprey to humans. Each gene is shown as a rectangle;
those positioned above the lines are transcribed from left to right, those positioned below the
lines are transcribed from right to left. Orthologous genes are indicated by rectangles of the
same color; boxes for α-like globin genes are yellow and those for β-like globin genes are red.
Genes flanking the globin genes are named at their first appearance from the top of the
diagram, and names of genes diagnostic for the types of clusters are repeated at the bottom.
Almost all species have two of three major clusters. The cluster containing NPRL3 is found in all
species, and is indicated by flanking genes in shades of purple and orange. The cluster
containing LCMT1 is found in ray-finned fish, and is indicated by flanking genes in shades of
green. The cluster containing DCHS1 and RRM1 is found in reptiles, birds, and mammals, and it
is indicated by flanking genes in shades of blue. The latter clusters contain what can be a large
number of olfactory receptor (OR) genes, and thus only representative OR genes are shown in
the figure. An orange dot indicates the major distal enhancer for globin gene clusters in species
for which experimental evidence has been obtained for such activity. The figure summarizes
maps presented in publications (see references in text) or gleaned from annotations of genome
sequences.
Figure 3. Epigenetic features in HBA and HBB clusters in mouse and human.
For each gene cluster, the first row shows the positions of genes, followed by tracks for known
cis-regulatory modules (CRMs, red boxes), accessible chromatin measured by ATAC-seq or
DNase-seq, occupancy by the co-activator P300, modification of chromatin at histone H3
acetylated on lysine 27 (H3K27ac), and occupancy by GATA2, GATA1, TAL1, NFE2, KLF1, and
CTCF. Numbers to the left of each signal track give the maximum value for the signal shown;
only peak positions are shown for KLF1 binding in human HUDEP-2 cells [102]. The values
were obtained from different programs and thus are not comparable between tracks, but the
signal values along each track are meaningful. The orange dots indicate major distal enhancers.
The transcriptional orientation of globin genes is from left to right. Maintaining consistency in
orientation of the globin genes required a reversal of orientation from the reference genome
sequence for the HBB clusters; this is indicated by showing the direction to the nearest telomere
as TEL>. The epigenetic features were determined either in primary erythroid cells and tissues
or in cell lines with erythroid character. Abbreviations for cell types are: ERY=erythroblast from
mouse bone marrow, FL=fetal liver (mouse or human), G1E=immortalized erythroid-

17
differentiated mouse ES cells with a knockout of the Gata1 gene, K1ER=immortalized erythroid-
differentiated mouse ES cells with a knockout of the Klf1 gene that have KLF1 restored as a
fusion with an estrogen receptor domain, K562 or K56=transformed human cell line that has
some erythroid properties, HUDEP-2=immortalized human erythroid progenitor cell line, and
PBDE=peripheral blood derived erythroblasts from humans. The data are from many sources
(see references in text), and can be viewed and downloaded from resources of the VISION
project (URL is in Table 1).
Figure 4. Conservation of epigenetic signals versus genome sequences in distal regulatory
regions of globin gene clusters.
(A) Binding of GATA1 and DNase accessibility at the major regulatory element (MCS-R2) for the
globin gene cluster on chromosome 3 of zebrafish. The signal tracks are from Figure 4 of Ganis
et al. [10]; they are aligned with a gene map from the genome assembly. The proteins inferred
to be bound at MCS-R2 are shown as colored icons in the zoomed-in view. (B) Genome
sequence conservation and divergence at MCS-R2 in other fish. The HBA cluster from Fugu on
chromosome 5 is shown, highlighting the MCS-R2 by showing the inferred proteins bound.
Underneath the gene map is a track showing the likelihood that DNA segments are under
purifying selection. That PhyloP Cons score is estimated from sequence alignments of multiple
species, which are shown as dark rectangles indicating aligned sequences. Note that the intron
containing the Fugu MCS-R2 aligns with sequences from three other fish, but not to zebrafish.
(C) DNase footprints for the HBA MCS-R2 in humans. The high density DNase-seq analysis
[63, 64] was done on highly erythroid human fetal liver (FL) tissues and in K562 cells. Regions
of frequent cleavage (greater accessibility in chromatin) have a high signal on the tracks.
Positions of bound transcription factors, determined from other studies, are shown as colored
icons. (D) DNase footprints for the HBB LCR 5’HS2 in humans.

18
Table 1. Resources for obtaining and visualizing epigenetic data Project Description or goal URL VISION Generate and compile epigenomic
data: integrate, model, and validate. Focus on erythro-myeloid lineages
http://www.bx.psu.edu/~giardine/vision/
CODEX Curated collection of epigenomic data in hematopoietic cells and stem cells
http://codex.stemcells.cam.ac.uk
ENCODE Generate and integrate epigenomic data across a wide variety of cell types
https://www.encodeproject.org
BLUEPRINT Generate epigenomic in human hematopoietic cells
http://www.blueprint-epigenome.eu/

19
References
[1] S.N. Vinogradov, D. Hoogewijs, X. Bailly, K. Mizuguchi, S. Dewilde, L. Moens, J.R. Vanfleteren, A model of globin evolution, Gene, 398 (2007) 132-142. [2] R. Hardison, Hemoglobins from bacteria to man: evolution of different patterns of gene expression, J. Experimental Biology, 201 (1998) 1099-1117. [3] R.K. Poole, M.N. Hughes, New functions for the ancient globin family: bacterial responses to nitric oxide and nitrosative stress, Mol Microbiol, 36 (2000) 775-783. [4] D. Gell, Structure, stability, and function of haemoglobins, Blood Cells, Molecules, and Diseases, (2017). [5] D. Gel, Structure, stability, and function of haemoglobins, Biomolecules, (2017). [6] R.C. Hardison, Evolution of hemoglobin and its genes, Cold Spring Harb Perspect Med, 2 (2012) a011627. [7] T.N. Williams, D.J. Weatherall, World distribution, population genetics, and health burden of the hemoglobinopathies, Cold Spring Harb Perspect Med, 2 (2012) a011692. [8] J. Flint, C. Tufarelli, J. Peden, K. Clark, R.J. Daniels, R. Hardison, W. Miller, S. Philipsen, K.C. Tan-Un, T. McMorrow, J. Frampton, B.P. Alter, A.M. Frischauf, D.R. Higgs, Comparative genome analysis delimits a chromosomal domain and identifies key regulatory elements in the alpha globin cluster, Hum Mol Genet, 10 (2001) 371-382. [9] B.G. Forget, R.C. Hardison, The normal structure and regulation of human globin gene clusters, in: M.H. Steinberg, B.G. Forget, D.R. Higgs, D.J. Weatherall (Eds.) Disorders of Hemoglobins: Genetics, Pathophysiology and Clinical Management, Cambridge University Press, Cambridge, U.K., 2009, pp. 46-61. [10] J.J. Ganis, N. Hsia, E. Trompouki, J.L. de Jong, A. DiBiase, J.S. Lambert, Z. Jia, P.J. Sabo, M. Weaver, R. Sandstrom, J.A. Stamatoyannopoulos, Y. Zhou, L.I. Zon, Zebrafish globin switching occurs in two developmental stages and is controlled by the LCR, Dev Biol, 366 (2012) 185-194. [11] F.G. Hoffmann, J.C. Opazo, J.F. Storz, Gene cooption and convergent evolution of oxygen transport hemoglobins in jawed and jawless vertebrates, Proc Natl Acad Sci U S A, 107 (2010) 14274-14279. [12] H.A. Hosbach, T. Wyler, R. Weber, The Xenopus laevis globin gene family: Chromosomal arrangement and gene structure, Cell, 32 (1983) 45-53. [13] J.R. Hughes, J.F. Cheng, N. Ventress, S. Prabhakar, K. Clark, E. Anguita, M. De Gobbi, P. de Jong, E. Rubin, D.R. Higgs, Annotation of cis-regulatory elements by identification, subclassification, and functional assessment of multispecies conserved sequences, Proc Natl Acad Sci U S A, 102 (2005) 9830-9835. [14] A.J. Jeffreys, V. Wilson, D. Wood, J.P. Simons, R.M. Kay, J.G. Williams, Linkage of adult alpha- and beta-globin genes in X. laevis and gene duplication by tetraploidization, Cell, 21 (1980) 555-564. [15] J.C. Opazo, A.P. Lee, F.G. Hoffmann, J. Toloza-Villalobos, T. Burmester, B. Venkatesh, J.F. Storz, Ancient Duplications and Expression Divergence in the Globin Gene Superfamily of Vertebrates: Insights from the Elephant Shark Genome and Transcriptome, Mol Biol Evol, 32 (2015) 1684-1694. [16] V.S. Patel, S.J. Cooper, J.E. Deakin, B. Fulton, T. Graves, W.C. Warren, R.K. Wilson, J.A. Graves, Platypus globin genes and flanking loci suggest a new insertional model for beta-globin evolution in birds and mammals, BMC Biol, 6 (2008) 34. [17] V.S. Patel, T. Ezaz, J.E. Deakin, J.A. Graves, Globin gene structure in a reptile supports the transpositional model for amniote alpha- and beta-globin gene evolution, Chromosome Res, 18 (2010) 897-907. [18] K. Schwarze, K.L. Campbell, T. Hankeln, J.F. Storz, F.G. Hoffmann, T. Burmester, The globin gene repertoire of lampreys: convergent evolution of hemoglobin and myoglobin in jawed and jawless vertebrates, Mol Biol Evol, 31 (2014) 2708-2721. [19] K. Schwarze, A. Singh, T. Burmester, The Full Globin Repertoire of Turtles Provides Insights into Vertebrate Globin Evolution and Functions, Genome Biol Evol, 7 (2015) 1896-1913. [20] R.K. Patient, J.A. Elkington, R.M. Kay, J.G. Williams, Internal organization of the major adult alpha- and beta-globin genes of X. laevis, Cell, 21 (1980) 565-573. [21] N. Gillemans, T. McMorrow, R. Tewari, A.W. Wai, C. Burgtorf, D. Drabek, N. Ventress, A. Langeveld, D. Higgs, K. Tan-Un, F. Grosveld, S. Philipsen, Functional and comparative analysis of globin loci in pufferfish and humans, Blood, 101 (2003) 2842-2849.

20
[22] S.E. Antonarakis, S.H. Irkin, T.C. Cheng, A.F. Scott, J.P. Sexton, S.P. Trusko, S. Charache, H.H. Kazazian, Jr., beta-Thalassemia in American Blacks: novel mutations in the "TATA" box and an acceptor splice site, Proc Natl Acad Sci U S A, 81 (1984) 1154-1158. [23] P. Dierks, A. van Ooyen, M.D. Cochran, C. Dobkin, J. Reiser, C. Weissmann, Three regions upstream from the cap site are required for efficient and accurate transcription of the rabbit beta-globin gene in mouse 3T6 cells, Cell, 32 (1983) 695-706. [24] S.H. Orkin, S.E. Antonarakis, H.H. Kazazian, Jr., Base substitution at position -88 in a beta-thalassemic globin gene. Further evidence for the role of distal promoter element ACACCC, J Biol Chem, 259 (1984) 8679-8681. [25] A.E. Ronchi, S. Bottardi, C. Mazzucchelli, S. Ottolenghi, C. Santoro, Differential binding of the NFE3 and CP1/NFY transcription factors to the human gamma- and epsilon-globin CCAAT boxes, J Biol Chem, 270 (1995) 21934-21941. [26] C. Kim, M. Sheffery, Physical characterization of the purified CCAAT transcription factor a-CP1, J. Biol. Chem., 265 (1990) 13362-13369. [27] G. Suske, E. Bruford, S. Philipsen, Mammalian SP/KLF transcription factors: bring in the family, Genomics, 85 (2005) 551-556. [28] W.C. Feng, C.M. Southwood, J.J. Bieker, Analyses of beta-thalassemia mutant DNA interactions with erythroid Kruppel-like factor (EKLF), an erythroid cell-specific transcription factor, J Biol Chem, 269 (1994) 1493-1500. [29] I.J. Miller, J.J. Bieker, A novel, erythroid cell-specific murine transcription factor that binds to the CACCC element and is related to the Kruppel family of nuclear proteins, Mol Cell Biol, 13 (1993) 2776-2786. [30] S. Orkin, Disorders of hemoglobin synthesis: the thalassemias, in: G. Stamatoyannopoulos, A. Nienhuis, P. Leder, P. Majerus (Eds.) The Molecular Basis of Blood Diseases, W. B. Saunders Co., Philadelphia, 1987, pp. 106-126. [31] B. Giardine, J. Borg, D.R. Higgs, K.R. Peterson, S. Philipsen, D. Maglott, B.K. Singleton, D.J. Anstee, A.N. Basak, B. Clark, F.C. Costa, P. Faustino, H. Fedosyuk, A.E. Felice, A. Francina, R. Galanello, M.V. Gallivan, M. Georgitsi, R.J. Gibbons, P.C. Giordano, C.L. Harteveld, J.D. Hoyer, M. Jarvis, P. Joly, E. Kanavakis, P. Kollia, S. Menzel, W. Miller, K. Moradkhani, J. Old, A. Papachatzopoulou, M.N. Papadakis, P. Papadopoulos, S. Pavlovic, L. Perseu, M. Radmilovic, C. Riemer, S. Satta, I. Schrijver, M. Stojiljkovic, S.L. Thein, J. Traeger-Synodinos, R. Tully, T. Wada, J.S. Waye, C. Wiemann, B. Zukic, D.H. Chui, H. Wajcman, R.C. Hardison, G.P. Patrinos, Systematic documentation and analysis of human genetic variation in hemoglobinopathies using the microattribution approach, Nat Genet, 43 (2011) 295-301. [32] K. Chada, J. Magram, K. Raphael, G. Radice, E. Lacy, F. Costantini, Specific expression of a foreign beta-globin gene in erythroid cells of transgenic mice, Nature, 314 (1985) 377-380. [33] G. Kollias, N. Wrighton, J. Hurst, F. Grosveld, Regulated expression of human A gamma-, beta-, and hybrid gamma beta-globin genes in transgenic mice: manipulation of the developmental expression patterns, Cell, 46 (1986) 89-94. [34] T.M. Townes, J.B. Lingrel, H.Y. Chen, R.L. Brinster, R.D. Palmiter, Erythroid-specific expression of human beta-globin genes in transgenic mice, EMBO J, 4 (1985) 1715-1723. [35] F. Grosveld, G.B. van Assendelft, D.R. Greaves, G. Kollias, Position-independent, high-level expression of the human beta-globin gene in transgenic mice, Cell, 51 (1987) 975-985. [36] D.R. Higgs, W.G. Wood, A.P. Jarman, J. Sharpe, J. Lida, I.M. Pretorius, H. Ayyub, A major positive regulatory region located far upstream of the human alpha-globin gene locus, Genes Dev, 4 (1990) 1588-1601. [37] D. Tuan, I.M. London, Mapping of DNase I-hypersensitive sites in the upstream DNA of human embryonic epsilon-globin gene in K562 leukemia cells, Proc Natl Acad Sci U S A, 81 (1984) 2718-2722. [38] D.R. Higgs, W.G. Wood, Long-range regulation of alpha globin gene expression during erythropoiesis, Curr Opin Hematol, 15 (2008) 176-183. [39] D. Hay, J.R. Hughes, C. Babbs, J.O. Davies, B.J. Graham, L.L. Hanssen, M.T. Kassouf, A.M. Oudelaar, J.A. Sharpe, M.C. Suciu, J. Telenius, R. Williams, C. Rode, P.S. Li, L.A. Pennacchio, J.A. Sloane-Stanley, H. Ayyub, S. Butler, T. Sauka-Spengler, R.J. Gibbons, A.J. Smith, W.G. Wood, D.R. Higgs, Genetic dissection of the alpha-globin super-enhancer in vivo, Nat Genet, 48 (2016) 895-903. [40] E. Anguita, J.A. Sharpe, J.A. Sloane-Stanley, C. Tufarelli, D.R. Higgs, W.G. Wood, Deletion of the mouse alpha-globin regulatory element (HS -26) has an unexpectedly mild phenotype, Blood, 100 (2002) 3450-3456.

21
[41] S. Fiering, E. Epner, K. Robinson, Y. Zhuang, A. Telling, M. Hu, D.I. Martin, T. Enver, T.J. Ley, M. Groudine, Targeted deletion of 5'HS2 of the murine beta-globin LCR reveals that it is not essential for proper regulation of the beta-globin locus, Genes Dev, 9 (1995) 2203-2213. [42] T.J. Ley, B. Hug, S. Fiering, E. Epner, M.A. Bender, M. Groudine, Reduced beta-globin gene expression in adult mice containing deletions of locus control region 5' HS-2 or 5' HS-3, Ann N Y Acad Sci, 850 (1998) 45-53. [43] E. Soler, C. Andrieu-Soler, E. de Boer, J.C. Bryne, S. Thongjuea, R. Stadhouders, R.J. Palstra, M. Stevens, C. Kockx, W. van Ijcken, J. Hou, C. Steinhoff, E. Rijkers, B. Lenhard, F. Grosveld, The genome-wide dynamics of the binding of Ldb1 complexes during erythroid differentiation, Genes Dev, 24 (2010) 277-289. [44] D.Y. Tuan, W.B. Solomon, I.M. London, D.P. Lee, An erythroid-specific, developmental-stage-independent enhancer far upstream of the human "beta-like globin" genes, Proc Natl Acad Sci U S A, 86 (1989) 2554-2558. [45] A.M. Pilon, S.S. Ajay, S.A. Kumar, L.A. Steiner, P.F. Cherukuri, S. Wincovitch, S.M. Anderson, N.C.S. Center, J.C. Mullikin, P.G. Gallagher, R.C. Hardison, E.H. Margulies, D.M. Bodine, Genome-wide ChIP-Seq reveals a dramatic shift in the binding of the transcription factor erythroid Kruppel-like factor during erythrocyte differentiation, Blood, 118 (2011) e139-148. [46] M.Y. Su, L.A. Steiner, H. Bogardus, T. Mishra, V.P. Schulz, R.C. Hardison, P.G. Gallagher, Identification of biologically relevant enhancers in human erythroid cells, J Biol Chem, 288 (2013) 8433-8444. [47] M.R. Tallack, T. Whitington, W.S. Yuen, E.N. Wainwright, J.R. Keys, B.B. Gardiner, E. Nourbakhsh, N. Cloonan, S.M. Grimmond, T.L. Bailey, A.C. Perkins, A global role for KLF1 in erythropoiesis revealed by ChIP-seq in primary erythroid cells, Genome Res, 20 (2010) 1052-1063. [48] I. Junier, R.K. Dale, C. Hou, F. Kepes, A. Dean, CTCF-mediated transcriptional regulation through cell type-specific chromosome organization in the beta-globin locus, Nucleic Acids Res, 40 (2012) 7718-7727. [49] N. Saitoh, A.C. Bell, F. Recillas-Targa, A.G. West, M. Simpson, M. Pikaart, G. Felsenfeld, Structural and functional conservation at the boundaries of the chicken beta-globin domain, EMBO J, 19 (2000) 2315-2322. [50] C. Valdes-Quezada, C. Arriaga-Canon, Y. Fonseca-Guzman, G. Guerrero, F. Recillas-Targa, CTCF demarcates chicken embryonic alpha-globin gene autonomous silencing and contributes to adult stage-specific gene expression, Epigenetics, 8 (2013) 827-838. [51] N.K. Wilson, S. Schoenfelder, R. Hannah, M.S. Castillo, J. Schutte, V. Ladopoulos, J. Mitchelmore, D.K. Goode, F.J. Calero-Nieto, V. Moignard, A.C. Wilkenson, I. Jimenez-Madrid, S. Kinston, M. Spivakov, P. Fraser, B. Göttgens, Integrated genome-scale analysis of the transcriptional regulatory landscape in a blood stem/progenitor cell model., Blood, (2016) in press. [52] N.K. Wilson, S.D. Foster, X. Wang, K. Knezevic, J. Schutte, P. Kaimakis, P.M. Chilarska, S. Kinston, W.H. Ouwehand, E. Dzierzak, J.E. Pimanda, M.F. de Bruijn, B. Gottgens, Combinatorial transcriptional control in blood stem/progenitor cells: genome-wide analysis of ten major transcriptional regulators, Cell Stem Cell, 7 (2010) 532-544. [53] F. Yue, Y. Cheng, A. Breschi, J. Vierstra, W. Wu, T. Ryba, R. Sandstrom, Z. Ma, C. Davis, B.D. Pope, Y. Shen, D.D. Pervouchine, S. Djebali, R.E. Thurman, R. Kaul, E. Rynes, A. Kirilusha, G.K. Marinov, B.A. Williams, D. Trout, H. Amrhein, K. Fisher-Aylor, I. Antoshechkin, G. DeSalvo, L.H. See, M. Fastuca, J. Drenkow, C. Zaleski, A. Dobin, P. Prieto, J. Lagarde, G. Bussotti, A. Tanzer, O. Denas, K. Li, M.A. Bender, M. Zhang, R. Byron, M.T. Groudine, D. McCleary, L. Pham, Z. Ye, S. Kuan, L. Edsall, Y.C. Wu, M.D. Rasmussen, M.S. Bansal, M. Kellis, C.A. Keller, C.S. Morrissey, T. Mishra, D. Jain, N. Dogan, R.S. Harris, P. Cayting, T. Kawli, A.P. Boyle, G. Euskirchen, A. Kundaje, S. Lin, Y. Lin, C. Jansen, V.S. Malladi, M.S. Cline, D.T. Erickson, V.M. Kirkup, K. Learned, C.A. Sloan, K.R. Rosenbloom, B. Lacerda de Sousa, K. Beal, M. Pignatelli, P. Flicek, J. Lian, T. Kahveci, D. Lee, W.J. Kent, M. Ramalho Santos, J. Herrero, C. Notredame, A. Johnson, S. Vong, K. Lee, D. Bates, F. Neri, M. Diegel, T. Canfield, P.J. Sabo, M.S. Wilken, T.A. Reh, E. Giste, A. Shafer, T. Kutyavin, E. Haugen, D. Dunn, A.P. Reynolds, S. Neph, R. Humbert, R.S. Hansen, M. De Bruijn, L. Selleri, A. Rudensky, S. Josefowicz, R. Samstein, E.E. Eichler, S.H. Orkin, D. Levasseur, T. Papayannopoulou, K.H. Chang, A. Skoultchi, S. Gosh, C. Disteche, P. Treuting, Y. Wang, M.J. Weiss, G.A. Blobel, X. Cao, S. Zhong, T. Wang, P.J. Good, R.F. Lowdon, L.B. Adams, X.Q. Zhou, M.J. Pazin, E.A. Feingold, B. Wold, J. Taylor, A. Mortazavi, S.M. Weissman, J.A. Stamatoyannopoulos, M.P. Snyder, R. Guigo, T.R. Gingeras, D.M. Gilbert, R.C. Hardison, M.A. Beer, B.

22
Ren, E.C. Mouse, A comparative encyclopedia of DNA elements in the mouse genome, Nature, 515 (2014) 355-364. [54] M. Yu, L. Riva, H. Xie, Y. Schindler, T.B. Moran, Y. Cheng, D. Yu, R. Hardison, M.J. Weiss, S.H. Orkin, B.E. Bernstein, E. Fraenkel, A.B. Cantor, Insights into GATA-1-mediated gene activation versus repression via genome-wide chromatin occupancy analysis, Mol Cell, 36 (2009) 682-695. [55] W. Wu, Y. Cheng, C.A. Keller, J. Ernst, S.A. Kumar, T. Mishra, C. Morrissey, C.M. Dorman, K.B. Chen, D. Drautz, B. Giardine, Y. Shibata, L. Song, M. Pimkin, G.E. Crawford, T.S. Furey, M. Kellis, W. Miller, J. Taylor, S.C. Schuster, Y. Zhang, F. Chiaromonte, G.A. Blobel, M.J. Weiss, R.C. Hardison, Dynamics of the epigenetic landscape during erythroid differentiation after GATA1 restoration, Genome Res, 21 (2011) 1659-1671. [56] E. Trompouki, T.V. Bowman, L.N. Lawton, Z.P. Fan, D.C. Wu, A. DiBiase, C.S. Martin, J.N. Cech, A.K. Sessa, J.L. Leblanc, P. Li, E.M. Durand, C. Mosimann, G.C. Heffner, G.Q. Daley, R.F. Paulson, R.A. Young, L.I. Zon, Lineage regulators direct BMP and Wnt pathways to cell-specific programs during differentiation and regeneration, Cell, 147 (2011) 577-589. [57] The_ENCODE_Project_Consortium, An integrated encyclopedia of DNA elements in the human genome, Nature, 489 (2012) 57-74. [58] M. Pimkin, A.V. Kossenkov, T. Mishra, C.S. Morrissey, W. Wu, C.A. Keller, G.A. Blobel, D. Lee, M.A. Beer, R.C. Hardison, M.J. Weiss, Divergent functions of hematopoietic transcription factors in lineage priming and differentiation during erythro-megakaryopoiesis, Genome Res, 24 (2014) 1932-1944. [59] M.S. Kowalczyk, J.R. Hughes, D. Garrick, M.D. Lynch, J.A. Sharpe, J.A. Sloane-Stanley, S.J. McGowan, M. De Gobbi, M. Hosseini, D. Vernimmen, J.M. Brown, N.E. Gray, L. Collavin, R.J. Gibbons, J. Flint, S. Taylor, V.J. Buckle, T.A. Milne, W.G. Wood, D.R. Higgs, Intragenic enhancers act as alternative promoters, Mol Cell, 45 (2012) 447-458. [60] M.T. Kassouf, J.R. Hughes, S. Taylor, S.J. McGowan, S. Soneji, A.L. Green, P. Vyas, C. Porcher, Genome-wide identification of TAL1's functional targets: insights into its mechanisms of action in primary erythroid cells, Genome Res, 20 (2010) 1064-1083. [61] Y. Cheng, W. Wu, S.A. Kumar, D. Yu, W. Deng, T. Tripic, D.C. King, K.B. Chen, Y. Zhang, D. Drautz, B. Giardine, S.C. Schuster, W. Miller, F. Chiaromonte, Y. Zhang, G.A. Blobel, M.J. Weiss, R.C. Hardison, Erythroid GATA1 function revealed by genome-wide analysis of transcription factor occupancy, histone modifications, and mRNA expression, Genome Res, 19 (2009) 2172-2184. [62] Y. Cheng, Z. Ma, B.H. Kim, W. Wu, P. Cayting, A.P. Boyle, V. Sundaram, X. Xing, N. Dogan, J. Li, G. Euskirchen, S. Lin, Y. Lin, A. Visel, T. Kawli, X. Yang, D. Patacsil, C.A. Keller, B. Giardine, E.C. Mouse, A. Kundaje, T. Wang, L.A. Pennacchio, Z. Weng, R.C. Hardison, M.P. Snyder, Principles of regulatory information conservation between mouse and human, Nature, 515 (2014) 371-375. [63] S. Neph, J. Vierstra, A.B. Stergachis, A.P. Reynolds, E. Haugen, B. Vernot, R.E. Thurman, S. John, R. Sandstrom, A.K. Johnson, M.T. Maurano, R. Humbert, E. Rynes, H. Wang, S. Vong, K. Lee, D. Bates, M. Diegel, V. Roach, D. Dunn, J. Neri, A. Schafer, R.S. Hansen, T. Kutyavin, E. Giste, M. Weaver, T. Canfield, P. Sabo, M. Zhang, G. Balasundaram, R. Byron, M.J. MacCoss, J.M. Akey, M.A. Bender, M. Groudine, R. Kaul, J.A. Stamatoyannopoulos, An expansive human regulatory lexicon encoded in transcription factor footprints, Nature, 489 (2012) 83-90. [64] J. Vierstra, A. Reik, K.H. Chang, S. Stehling-Sun, Y. Zhou, S.J. Hinkley, D.E. Paschon, L. Zhang, N. Psatha, Y.R. Bendana, C.M. O'Neil, A.H. Song, A.K. Mich, P.Q. Liu, G. Lee, D.E. Bauer, M.C. Holmes, S.H. Orkin, T. Papayannopoulou, G. Stamatoyannopoulos, E.J. Rebar, P.D. Gregory, F.D. Urnov, J.A. Stamatoyannopoulos, Functional footprinting of regulatory DNA, Nat Methods, 12 (2015) 927-930. [65] J. Ling, L. Ainol, L. Zhang, X. Yu, W. Pi, D. Tuan, HS2 enhancer function is blocked by a transcriptional terminator inserted between the enhancer and the promoter, J Biol Chem, 279 (2004) 51704-51713. [66] F. Broders, A. Zahraoui, K. Scherrer, The chicken alpha-globin gene domain is transcribed into a 17-kilobase polycistronic RNA, Proc Natl Acad Sci U S A, 87 (1990) 503-507. [67] M. Bulger, M. Groudine, Looping versus linking: toward a model for long-distance gene activation, Genes Dev, 13 (1999) 2465-2477. [68] J. Griffith, A. Hochschild, M. Ptashne, DNA loops induced by cooperative binding of lambda repressor, Nature, 322 (1986) 750-752. [69] N. Dillon, T. Trimborn, J. Strouboulis, P. Fraser, F. Grosveld, The effect of distance on long-range chromatin interactions, Mol Cell, 1 (1997) 131-139.

23
[70] O. Hanscombe, D. Whyatt, P. Fraser, N. Yannoutsos, D. Greaves, N. Dillon, F. Grosveld, Importance of globin gene order for correct developmental expression, Genes Dev, 5 (1991) 1387-1394. [71] K.R. Peterson, G. Stamatoyannopoulos, Role of gene order in developmental control of human gamma- and beta-globin gene expression, Mol Cell Biol, 13 (1993) 4836-4843. [72] K. Tanimoto, Q. Liu, J. Bungert, J.D. Engel, Effects of altered gene order or orientation of the locus control region on human beta-globin gene expression in mice, Nature, 398 (1999) 344-348. [73] D. Carter, L. Chakalova, C.S. Osborne, Y.F. Dai, P. Fraser, Long-range chromatin regulatory interactions in vivo, Nat Genet, 32 (2002) 623-626. [74] J. Dekker, K. Rippe, M. Dekker, N. Kleckner, Capturing chromosome conformation, Science, 295 (2002) 1306-1311. [75] K.E. Cullen, M.P. Kladde, M.A. Seyfred, Interaction between transcription regulatory regions of prolactin chromatin, Science, 261 (1993) 203-206. [76] B. Tolhuis, R.J. Palstra, E. Splinter, F. Grosveld, W. de Laat, Looping and interaction between hypersensitive sites in the active beta-globin locus, Mol Cell, 10 (2002) 1453-1465. [77] R.J. Palstra, B. Tolhuis, E. Splinter, R. Nijmeijer, F. Grosveld, W. de Laat, The beta-globin nuclear compartment in development and erythroid differentiation, Nat Genet, 35 (2003) 190-194. [78] R. Drissen, R.J. Palstra, N. Gillemans, E. Splinter, F. Grosveld, S. Philipsen, W. de Laat, The active spatial organization of the beta-globin locus requires the transcription factor EKLF, Genes Dev, 18 (2004) 2485-2490. [79] C.R. Vakoc, D.L. Letting, N. Gheldof, T. Sawado, M.A. Bender, M. Groudine, M.J. Weiss, J. Dekker, G.A. Blobel, Proximity among distant regulatory elements at the beta-globin locus requires GATA-1 and FOG-1, Mol Cell, 17 (2005) 453-462. [80] W. Deng, J.W. Rupon, I. Krivega, L. Breda, I. Motta, K.S. Jahn, A. Reik, P.D. Gregory, S. Rivella, A. Dean, G.A. Blobel, Reactivation of developmentally silenced globin genes by forced chromatin looping, Cell, 158 (2014) 849-860. [81] M. De Gobbi, V. Viprakasit, J.R. Hughes, C. Fisher, V.J. Buckle, H. Ayyub, R.J. Gibbons, D. Vernimmen, Y. Yoshinaga, P. de Jong, J.F. Cheng, E.M. Rubin, W.G. Wood, D. Bowden, D.R. Higgs, A regulatory SNP causes a human genetic disease by creating a new transcriptional promoter, Science, 312 (2006) 1215-1217. [82] J.R. Hughes, N. Roberts, S. McGowan, D. Hay, E. Giannoulatou, M. Lynch, M. De Gobbi, S. Taylor, R. Gibbons, D.R. Higgs, Analysis of hundreds of cis-regulatory landscapes at high resolution in a single, high-throughput experiment, Nat Genet, 46 (2014) 205-212. [83] L. Guelen, L. Pagie, E. Brasset, W. Meuleman, M.B. Faza, W. Talhout, B.H. Eussen, A. de Klein, L. Wessels, W. de Laat, B. van Steensel, Domain organization of human chromosomes revealed by mapping of nuclear lamina interactions, Nature, 453 (2008) 948-951. [84] H. Pickersgill, B. Kalverda, E. de Wit, W. Talhout, M. Fornerod, B. van Steensel, Characterization of the Drosophila melanogaster genome at the nuclear lamina, Nat Genet, 38 (2006) 1005-1014. [85] J.R. Dixon, S. Selvaraj, F. Yue, A. Kim, Y. Li, Y. Shen, M. Hu, J.S. Liu, B. Ren, Topological domains in mammalian genomes identified by analysis of chromatin interactions, Nature, 485 (2012) 376-380. [86] D. Hnisz, K. Shrinivas, R.A. Young, A.K. Chakraborty, P.A. Sharp, A Phase Separation Model for Transcriptional Control, Cell, 169 (2017) 13-23. [87] W.A. Whyte, D.A. Orlando, D. Hnisz, B.J. Abraham, C.Y. Lin, M.H. Kagey, P.B. Rahl, T.I. Lee, R.A. Young, Master transcription factors and mediator establish super-enhancers at key cell identity genes, Cell, 153 (2013) 307-319. [88] M.A. Bender, M.G. Mehaffey, A. Telling, B. Hug, T.J. Ley, M. Groudine, S. Fiering, Independent formation of DnaseI hypersensitive sites in the murine beta-globin locus control region, Blood, 95 (2000) 3600-3604. [89] M.A. Bender, J.N. Roach, J. Halow, J. Close, R. Alami, E.E. Bouhassira, M. Groudine, S.N. Fiering, Targeted deletion of 5'HS1 and 5'HS4 of the beta-globin locus control region reveals additive activity of the DNaseI hypersensitive sites, Blood, 98 (2001) 2022-2027. [90] M.A. Bender, T. Ragoczy, J. Lee, R. Byron, A. Telling, A. Dean, M. Groudine, The hypersensitive sites of the murine beta-globin locus control region act independently to affect nuclear localization and transcriptional elongation, Blood, 119 (2012) 3820-3827. [91] J. Ellis, K.C. Tan-Un, A. Harper, D. Michalovich, N. Yannoutsos, S. Philipsen, F. Grosveld, A dominant chromatin-opening activity in 5' hypersensitive site 3 of the human beta-globin locus control region, EMBO J, 15 (1996) 562-568.

24
[92] B.A. Hug, R.L. Wesselschmidt, S. Fiering, M.A. Bender, E. Epner, M. Groudine, T.J. Ley, Analysis of mice containing a targeted deletion of beta-globin locus control region 5' hypersensitive site 3, Mol Cell Biol, 16 (1996) 2906-2912. [93] C.G. Kim, E.M. Epner, W.C. Forrester, M. Groudine, Inactivation of the human beta-globin gene by targeted insertion into the beta-globin locus control region, Genes Dev, 6 (1992) 928-938. [94] S. Pruzina, O. Hanscombe, D. Whyatt, F. Grosveld, S. Philipsen, Hypersensitive site 4 of the human beta globin locus control region, Nucleic Acids Res, 19 (1991) 1413-1419. [95] M. de Krom, M. van de Corput, M. von Lindern, F. Grosveld, J. Strouboulis, Stochastic patterns in globin gene expression are established prior to transcriptional activation and are clonally inherited, Mol Cell, 9 (2002) 1319-1326. [96] J.E. Craig, J. Rochette, C.A. Fisher, D.J. Weatherall, S. Marc, G.M. Lathrop, F. Demenais, S. Thein, Dissecting the loci controlling fetal haemoglobin production on chromosomes 11p and 6q by the regressive approach, Nat Genet, 12 (1996) 58-64. [97] J. Borg, P. Papadopoulos, M. Georgitsi, L. Gutierrez, G. Grech, P. Fanis, M. Phylactides, A.J. Verkerk, P.J. van der Spek, C.A. Scerri, W. Cassar, R. Galdies, W. van Ijcken, Z. Ozgur, N. Gillemans, J. Hou, M. Bugeja, F.G. Grosveld, M. von Lindern, A.E. Felice, G.P. Patrinos, S. Philipsen, Haploinsufficiency for the erythroid transcription factor KLF1 causes hereditary persistence of fetal hemoglobin, Nat Genet, 42 (2010) 801-805. [98] D. Zhou, K. Liu, C.W. Sun, K.M. Pawlik, T.M. Townes, KLF1 regulates BCL11A expression and gamma- to beta-globin gene switching, Nat Genet, 42 (2010) 742-744. [99] V.G. Sankaran, T.F. Menne, J. Xu, T.E. Akie, G. Lettre, B. Van Handel, H.K. Mikkola, J.N. Hirschhorn, A.B. Cantor, S.H. Orkin, Human fetal hemoglobin expression is regulated by the developmental stage-specific repressor BCL11A, Science, 322 (2008) 1839-1842. [100] T. Masuda, X. Wang, M. Maeda, M.C. Canver, F. Sher, A.P. Funnell, C. Fisher, M. Suciu, G.E. Martyn, L.J. Norton, C. Zhu, R. Kurita, Y. Nakamura, J. Xu, D.R. Higgs, M. Crossley, D.E. Bauer, S.H. Orkin, P.V. Kharchenko, T. Maeda, Transcription factors LRF and BCL11A independently repress expression of fetal hemoglobin, Science, 351 (2016) 285-289. [101] E. Bianchi, R. Zini, S. Salati, E. Tenedini, R. Norfo, E. Tagliafico, R. Manfredini, S. Ferrari, c-myb supports erythropoiesis through the transactivation of KLF1 and LMO2 expression, Blood, 116 (2010) e99-110. [102] L.J. Norton, A.P.W. Funnell, J. Burdach, B. Wienert, R. Kurita, Y. Nakamura, S. Philipsen, R.C.M. Pearson, K.G.R. Quinlan, M. Crossley, KLF1 directly activates expression of the novel fetal globin repressor, ZBTB7A, in erythroid cells, Blood Advances, in press (2017). [103] B. Nuez, D. Michalovich, A. Bygrave, R. Ploemacher, F. Grosveld, Defective haematopoiesis in fetal liver resulting from inactivation of the EKLF gene, Nature, 375 (1995) 316-318. [104] A.C. Perkins, A.H. Sharpe, S.H. Orkin, Lethal beta-thalassaemia in mice lacking the erythroid CACCC-transcription factor EKLF, Nature, 375 (1995) 318-322. [105] E.A. Traxler, Y. Yao, Y.D. Wang, K.J. Woodard, R. Kurita, Y. Nakamura, J.R. Hughes, R.C. Hardison, G.A. Blobel, C. Li, M.J. Weiss, A genome-editing strategy to treat beta-hemoglobinopathies that recapitulates a mutation associated with a benign genetic condition, Nat Med, 22 (2016) 987-990. [106] T.J. Ley, J. DeSimone, N.P. Anagnou, G.H. Keller, R.K. Humphries, P.H. Turner, N.S. Young, P. Keller, A.W. Nienhuis, 5-azacytidine selectively increases gamma-globin synthesis in a patient with beta+ thalassemia, N Engl J Med, 307 (1982) 1469-1475. [107] T.J. Ley, J. DeSimone, C.T. Noguchi, P.H. Turner, A.N. Schechter, P. Heller, A.W. Nienhuis, 5-Azacytidine increases gamma-globin synthesis and reduces the proportion of dense cells in patients with sickle cell anemia, Blood, 62 (1983) 370-380. [108] R. Mabaera, M.R. Greene, C.A. Richardson, S.J. Conine, C.D. Kozul, C.H. Lowrey, Neither DNA hypomethylation nor changes in the kinetics of erythroid differentiation explain 5-azacytidine's ability to induce human fetal hemoglobin, Blood, 111 (2008) 411-420. [109] A. Inati, M. Kahale, S.P. Perrine, D.H. Chui, A.T. Taher, S. Koussa, T. Abi Nasr, H.A. Abbas, R.G. Ghalie, A phase 2 study of HQK-1001, an oral fetal haemoglobin inducer, in beta-thalassaemia intermedia, Br J Haematol, 164 (2014) 456-458. [110] P. Patthamalai, S. Fuchareon, N. Chaneiam, R.G. Ghalie, D.H. Chui, M.S. Boosalis, S.P. Perrine, A phase 2 trial of HQK-1001 in HbE-beta thalassemia demonstrates HbF induction and reduced anemia, Blood, 123 (2014) 1956-1957.

25
[111] L. Shi, S. Cui, J.D. Engel, O. Tanabe, Lysine-specific demethylase 1 is a therapeutic target for fetal hemoglobin induction, Nat Med, 19 (2013) 291-294. [112] J. Xu, D.E. Bauer, M.A. Kerenyi, T.D. Vo, S. Hou, Y.J. Hsu, H. Yao, J.J. Trowbridge, G. Mandel, S.H. Orkin, Corepressor-dependent silencing of fetal hemoglobin expression by BCL11A, Proc Natl Acad Sci U S A, 110 (2013) 6518-6523. [113] M. Cavazzana-Calvo, E. Payen, O. Negre, G. Wang, K. Hehir, F. Fusil, J. Down, M. Denaro, T. Brady, K. Westerman, R. Cavallesco, B. Gillet-Legrand, L. Caccavelli, R. Sgarra, L. Maouche-Chretien, F. Bernaudin, R. Girot, R. Dorazio, G.J. Mulder, A. Polack, A. Bank, J. Soulier, J. Larghero, N. Kabbara, B. Dalle, B. Gourmel, G. Socie, S. Chretien, N. Cartier, P. Aubourg, A. Fischer, K. Cornetta, F. Galacteros, Y. Beuzard, E. Gluckman, F. Bushman, S. Hacein-Bey-Abina, P. Leboulch, Transfusion independence and HMGA2 activation after gene therapy of human beta-thalassaemia, Nature, 467 (2010) 318-322. [114] J.A. Ribeil, S. Hacein-Bey-Abina, E. Payen, A. Magnani, M. Semeraro, E. Magrin, L. Caccavelli, B. Neven, P. Bourget, W. El Nemer, P. Bartolucci, L. Weber, H. Puy, J.F. Meritet, D. Grevent, Y. Beuzard, S. Chretien, T. Lefebvre, R.W. Ross, O. Negre, G. Veres, L. Sandler, S. Soni, M. de Montalembert, S. Blanche, P. Leboulch, M. Cavazzana, Gene Therapy in a Patient with Sickle Cell Disease, N Engl J Med, 376 (2017) 848-855. [115] E. de Dreuzy, K. Bhukhai, P. Leboulch, E. Payen, Current and future alternative therapies for beta-thalassemia major, Biomed J, 39 (2016) 24-38. [116] D. Noordermeer, D. Duboule, Chromatin architectures and Hox gene collinearity, Curr Top Dev Biol, 104 (2013) 113-148.

Figure 1.

μζ αα θαζ
αα
β
μζ αα ω
ω
αζ
Hbb- ybh1
bh2b1
b2Sh3pxd2b
LUC7L
LUC7L
ααπ D A
γε ηγ βδ
AHεβ βρ
FOLR1β β
Human
Platypus
Opossum
Mouse
Turtle
Fish: Fugu
Fish: Zebrafish
Chicken
Frog
Fish: Medakaα
α
αα
β β β
β β
α
β
ε β
α θθ αζ
β β β β β
GBY
HBA
HbA
Hb genes
HbB Cygb
HBKHBZ
TMEM8AMPRL28 Hb: B1 B2 G
...
...
...
...
αα
βα α
αα
β βα
α
αα
β β β
β β
α α α
β
α βαα α
POLR3K
KANK2
RHBDF1
RHBDF1
LCMT1
ARHGAP17
AQP8
RHBDF1
RRM1 STIM1
DCHS1 OR genes
RRM1 STIM1DCHS1 OR genes
αα θζ ζ...
...
... ...
MPG
NPRL3
SharkRHBDF1
LampreyHb genes
UBE2L NPRL3
LUC7LNPRL3
MCS-R1, R2
LCR
translocation to form HBB cluster
...
MCS-R1, R2
Figure 2.

98 kb
106 kb 104 kb
96 kbNprl3MCS-R1 R2
MCS-R1 R2
HS2
HS2
Hba-xHba-a1
Hbq1bHba-a2
Hbq1a
225
10030020050020015050
Olfr67Hbb-b2Hbb-b1Hbb-bh2Hbb-bh1
Hbb-yOlfr66
<TEL HBA HBBMouse
Human
known CRMsGenes
Genes
Distal regulatory elements Locus Control Region
known CRMs
ATAC ERYP300 FL
H3K27ac FLGATA2 G1EGATA1 ERY
TAL1 ERYNFE2 ERY
KLF1 K1ERCTCF FL
DNase FLP300 K562
H3K27ac K56GATA2 K562GATA1 PBDE
TAL1 K562NFE2 K562
KLF1 HUDEP pkCTCF K562
TEL>
NPRL3HBZ HBM
HBA2HBA1
HBQ1LUC7L
1000400150100400400400
400
OR51V1HBBHBDHBBP1
BGLT3HBG1
HBG2HBE1OR51B4
Figure 3.

MCS-R2NPRL3
ae3ba2hb: aa2ba1
aa1ba1
aa1 be1ae1
be1ae1 ae1
be1
NFE2
Zebrafishchr3
Fuguchr5
PhyloP Cons
GATA1 NFE2 GATA1 GATA1 KLF1
KLF1
KLF1
KLF1
NFE2200 bp
NFE2 NFE2 GATA1 GATA1
NFE2 NFE2
NFE2NFE2
GATA1GATA1
GATA1
GATA1GATA1
200 bp
13kb
103 kb
TetraodonStickleback
Atlantic codMedaka
Zebrafish
MCS-R2KANK2HBAHBA
NPRL3
1000 -
1000 -
100 -
TAL1-E47
TAL1-E47 USF1
DN
ase
Human chr16
Human chr11
HBA MCS-R2
HBB HS2
FL365 bp
300 bp
FL
K562
DN
ase FL
FL
K562
A
B
C
D
- 1000
- 1000
- 100
KLF1
Figure 4.